Zip Codes with the Highest Percentage of Population Employed in Food Preparation & Serving in Owensboro, KY
RELATED REPORTS & OPTIONS
Food Preparation & Serving
Owensboro
Compare Zip Codes
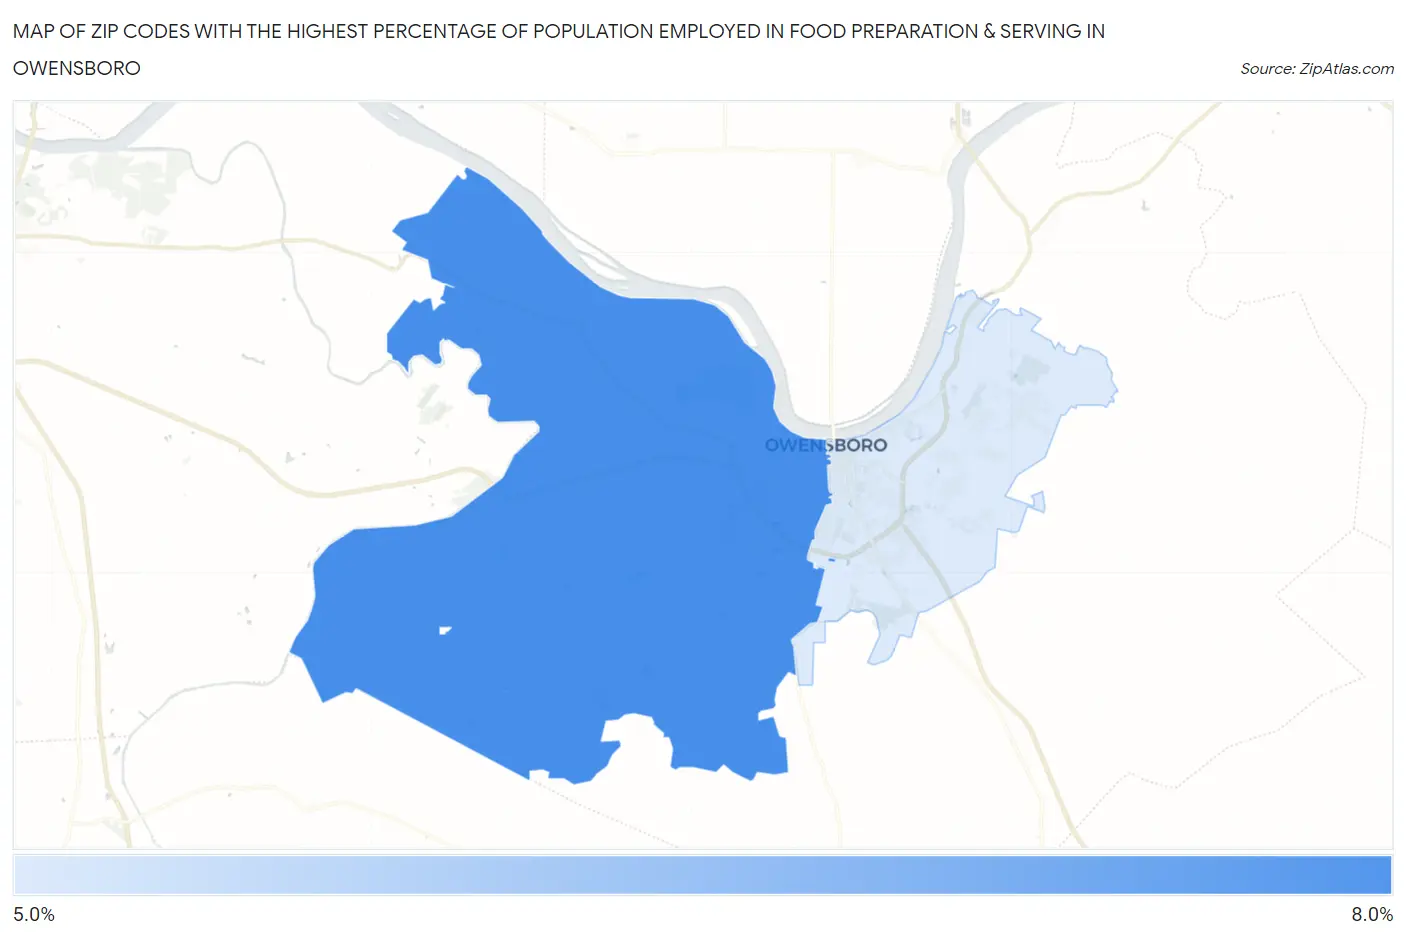
Map of Zip Codes with the Highest Percentage of Population Employed in Food Preparation & Serving in Owensboro
5.3%
6.9%
Zip Codes with the Highest Percentage of Population Employed in Food Preparation & Serving in Owensboro, KY
| Zip Code | % Employed | vs State | vs National | |
| 1. | 42301 | 6.9% | 5.1%(+1.77)#153 | 5.3%(+1.57)#6,928 |
| 2. | 42303 | 5.3% | 5.1%(+0.221)#229 | 5.3%(+0.019)#11,742 |
1
Common Questions
What are the Top Zip Codes with the Highest Percentage of Population Employed in Food Preparation & Serving in Owensboro, KY?
Top Zip Codes with the Highest Percentage of Population Employed in Food Preparation & Serving in Owensboro, KY are:
What zip code has the Highest Percentage of Population Employed in Food Preparation & Serving in Owensboro, KY?
42301 has the Highest Percentage of Population Employed in Food Preparation & Serving in Owensboro, KY with 6.9%.
What is the Percentage of Population Employed in Food Preparation & Serving in Owensboro, KY?
Percentage of Population Employed in Food Preparation & Serving in Owensboro is 6.8%.
What is the Percentage of Population Employed in Food Preparation & Serving in Kentucky?
Percentage of Population Employed in Food Preparation & Serving in Kentucky is 5.1%.
What is the Percentage of Population Employed in Food Preparation & Serving in the United States?
Percentage of Population Employed in Food Preparation & Serving in the United States is 5.3%.