Earlington, KY Map & Demographics
Earlington Map
Earlington Overview
$17,699
PER CAPITA INCOME
$42,917
AVG FAMILY INCOME
$38,971
AVG HOUSEHOLD INCOME
22.0%
WAGE / INCOME GAP [ % ]
78.0¢/ $1
WAGE / INCOME GAP [ $ ]
0.46
INEQUALITY / GINI INDEX
1,219
TOTAL POPULATION
527
MALE POPULATION
692
FEMALE POPULATION
76.16
MALES / 100 FEMALES
131.31
FEMALES / 100 MALES
35.3
MEDIAN AGE
3.1
AVG FAMILY SIZE
2.8
AVG HOUSEHOLD SIZE
544
LABOR FORCE [ PEOPLE ]
58.5%
PERCENT IN LABOR FORCE
9.0%
UNEMPLOYMENT RATE
Earlington Zip Codes
Earlington Area Codes
Income in Earlington
Income Overview in Earlington
Per Capita Income in Earlington is $17,699, while median incomes of families and households are $42,917 and $38,971 respectively.
| Characteristic | Number | Measure |
| Per Capita Income | 1,219 | $17,699 |
| Median Family Income | 346 | $42,917 |
| Mean Family Income | 346 | $51,002 |
| Median Household Income | 438 | $38,971 |
| Mean Household Income | 438 | $48,587 |
| Income Deficit | 346 | $0 |
| Wage / Income Gap (%) | 1,219 | 21.98% |
| Wage / Income Gap ($) | 1,219 | 78.02¢ per $1 |
| Gini / Inequality Index | 1,219 | 0.46 |
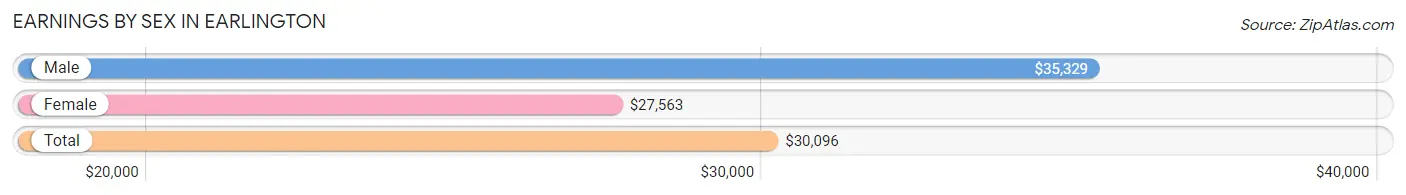
Earnings by Sex in Earlington
Average Earnings in Earlington are $30,096, $35,329 for men and $27,563 for women, a difference of 22.0%.
| Sex | Number | Average Earnings |
| Male | 257 (50.6%) | $35,329 |
| Female | 251 (49.4%) | $27,563 |
| Total | 508 (100.0%) | $30,096 |
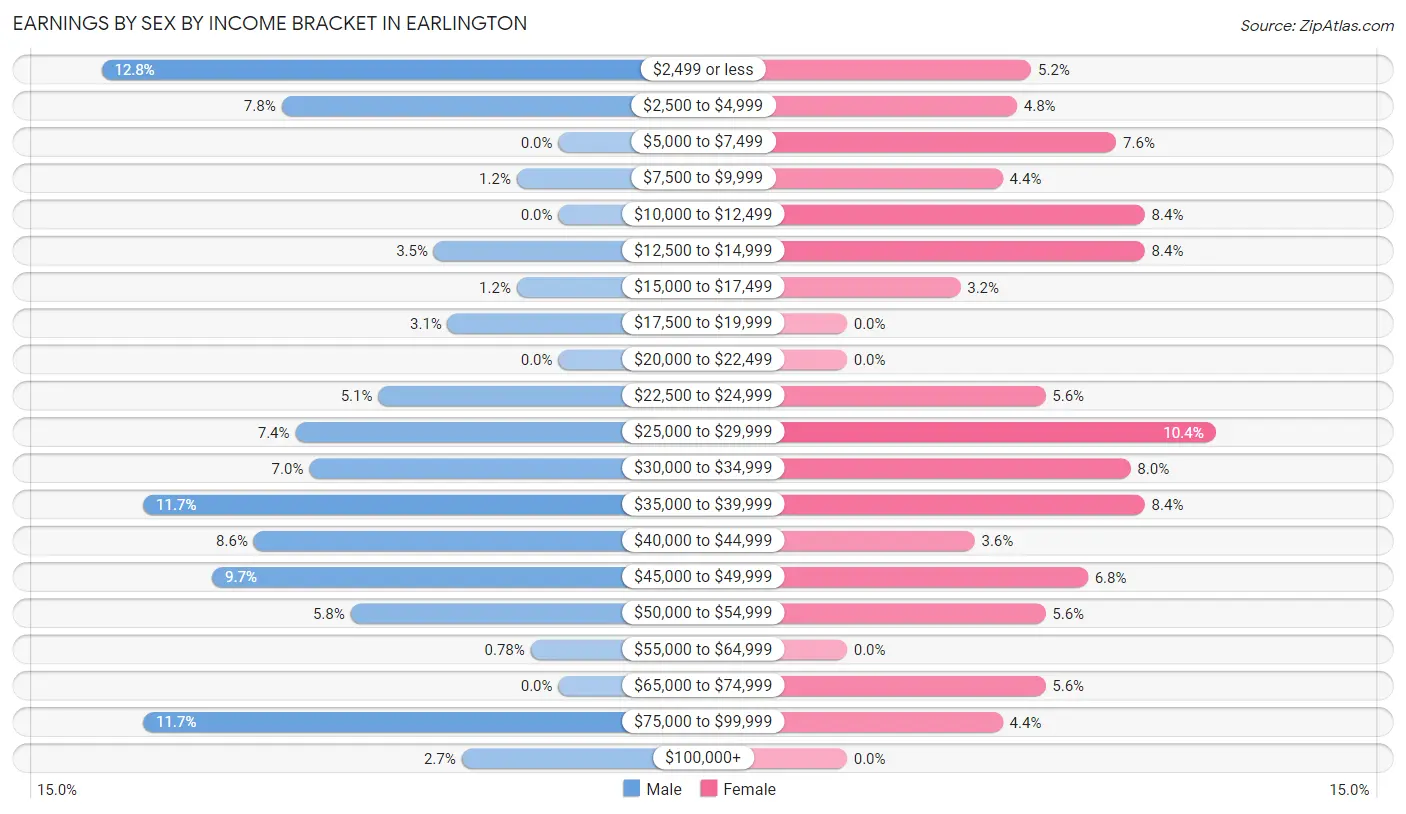
Earnings by Sex by Income Bracket in Earlington
The most common earnings brackets in Earlington are $2,499 or less for men (33 | 12.8%) and $25,000 to $29,999 for women (26 | 10.4%).
| Income | Male | Female |
| $2,499 or less | 33 (12.8%) | 13 (5.2%) |
| $2,500 to $4,999 | 20 (7.8%) | 12 (4.8%) |
| $5,000 to $7,499 | 0 (0.0%) | 19 (7.6%) |
| $7,500 to $9,999 | 3 (1.2%) | 11 (4.4%) |
| $10,000 to $12,499 | 0 (0.0%) | 21 (8.4%) |
| $12,500 to $14,999 | 9 (3.5%) | 21 (8.4%) |
| $15,000 to $17,499 | 3 (1.2%) | 8 (3.2%) |
| $17,500 to $19,999 | 8 (3.1%) | 0 (0.0%) |
| $20,000 to $22,499 | 0 (0.0%) | 0 (0.0%) |
| $22,500 to $24,999 | 13 (5.1%) | 14 (5.6%) |
| $25,000 to $29,999 | 19 (7.4%) | 26 (10.4%) |
| $30,000 to $34,999 | 18 (7.0%) | 20 (8.0%) |
| $35,000 to $39,999 | 30 (11.7%) | 21 (8.4%) |
| $40,000 to $44,999 | 22 (8.6%) | 9 (3.6%) |
| $45,000 to $49,999 | 25 (9.7%) | 17 (6.8%) |
| $50,000 to $54,999 | 15 (5.8%) | 14 (5.6%) |
| $55,000 to $64,999 | 2 (0.8%) | 0 (0.0%) |
| $65,000 to $74,999 | 0 (0.0%) | 14 (5.6%) |
| $75,000 to $99,999 | 30 (11.7%) | 11 (4.4%) |
| $100,000+ | 7 (2.7%) | 0 (0.0%) |
| Total | 257 (100.0%) | 251 (100.0%) |
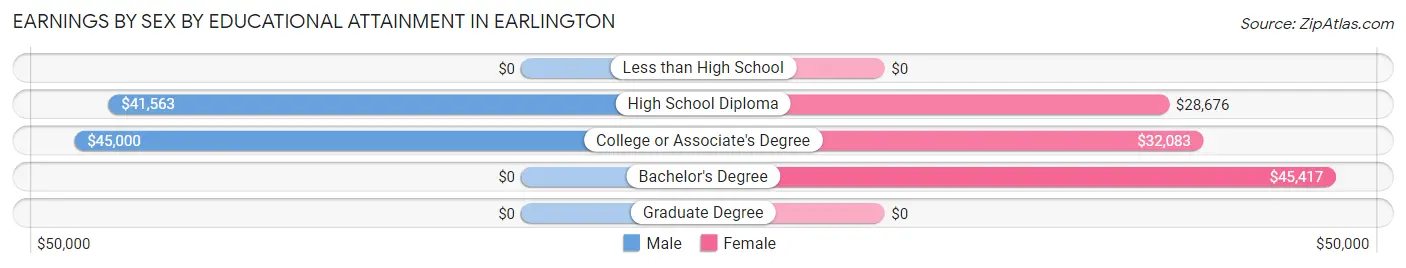
Earnings by Sex by Educational Attainment in Earlington
Average earnings in Earlington are $40,313 for men and $29,188 for women, a difference of 27.6%. Men with an educational attainment of college or associate's degree enjoy the highest average annual earnings of $45,000, while those with high school diploma education earn the least with $41,563. Women with an educational attainment of bachelor's degree earn the most with the average annual earnings of $45,417, while those with high school diploma education have the smallest earnings of $28,676.
| Educational Attainment | Male Income | Female Income |
| Less than High School | - | - |
| High School Diploma | $41,563 | $28,676 |
| College or Associate's Degree | $45,000 | $32,083 |
| Bachelor's Degree | - | - |
| Graduate Degree | - | - |
| Total | $40,313 | $29,188 |
Family Income in Earlington
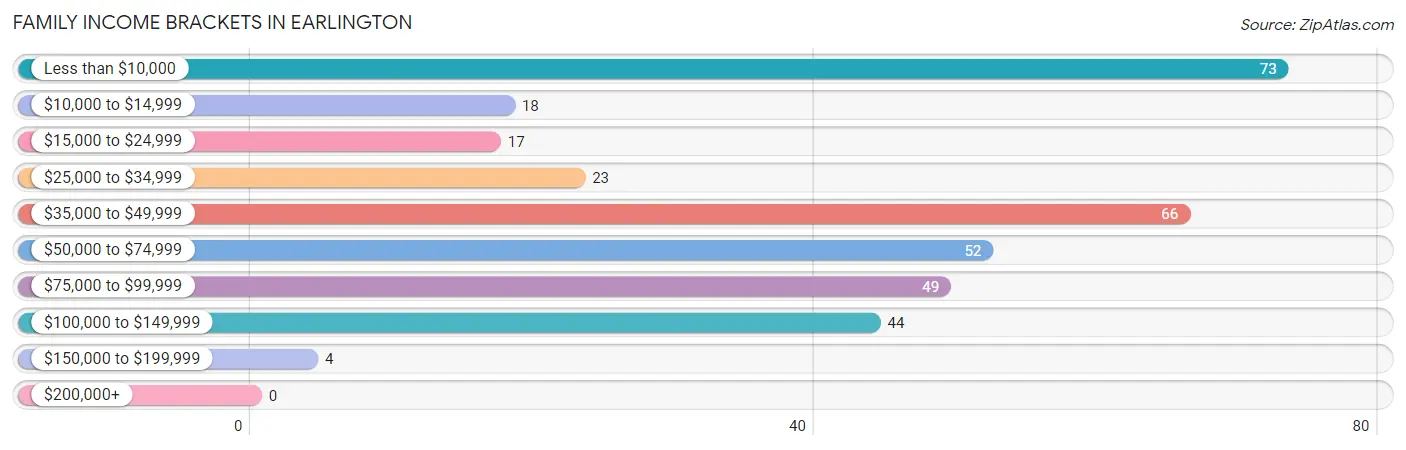
Family Income Brackets in Earlington
According to the Earlington family income data, there are 73 families falling into the less than $10,000 income range, which is the most common income bracket and makes up 21.1% of all families.
| Income Bracket | # Families | % Families |
| Less than $10,000 | 73 | 21.1% |
| $10,000 to $14,999 | 18 | 5.2% |
| $15,000 to $24,999 | 17 | 4.9% |
| $25,000 to $34,999 | 23 | 6.6% |
| $35,000 to $49,999 | 66 | 19.1% |
| $50,000 to $74,999 | 52 | 15.0% |
| $75,000 to $99,999 | 49 | 14.2% |
| $100,000 to $149,999 | 44 | 12.7% |
| $150,000 to $199,999 | 4 | 1.2% |
| $200,000+ | 0 | 0.0% |
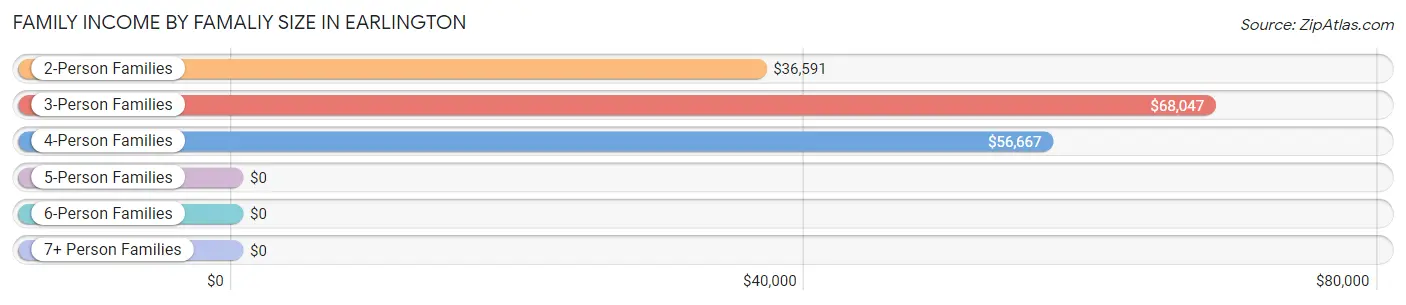
Family Income by Famaliy Size in Earlington
3-person families (95 | 27.5%) account for the highest median family income in Earlington with $68,047 per family, while 3-person families (95 | 27.5%) have the highest median income of $22,682 per family member.
| Income Bracket | # Families | Median Income |
| 2-Person Families | 148 (42.8%) | $36,591 |
| 3-Person Families | 95 (27.5%) | $68,047 |
| 4-Person Families | 52 (15.0%) | $56,667 |
| 5-Person Families | 44 (12.7%) | $0 |
| 6-Person Families | 0 (0.0%) | $0 |
| 7+ Person Families | 7 (2.0%) | $0 |
| Total | 346 (100.0%) | $42,917 |
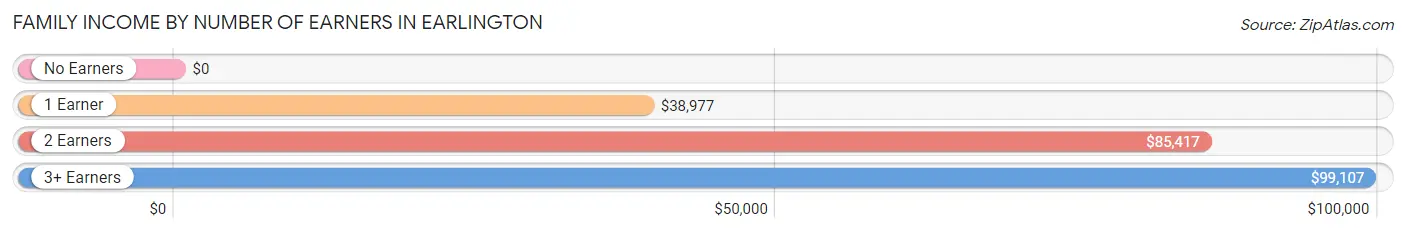
Family Income by Number of Earners in Earlington
| Number of Earners | # Families | Median Income |
| No Earners | 85 (24.6%) | $0 |
| 1 Earner | 141 (40.7%) | $38,977 |
| 2 Earners | 97 (28.0%) | $85,417 |
| 3+ Earners | 23 (6.7%) | $99,107 |
| Total | 346 (100.0%) | $42,917 |
Household Income in Earlington
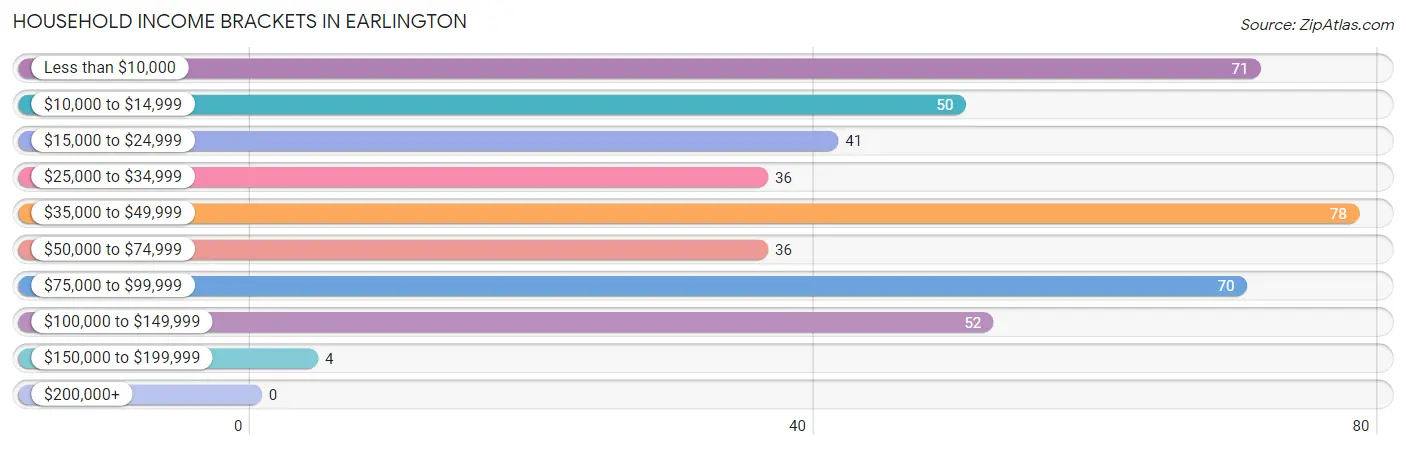
Household Income Brackets in Earlington
With 78 households falling in the category, the $35,000 to $49,999 income range is the most frequent in Earlington, accounting for 17.8% of all households.
| Income Bracket | # Households | % Households |
| Less than $10,000 | 71 | 16.2% |
| $10,000 to $14,999 | 50 | 11.4% |
| $15,000 to $24,999 | 41 | 9.4% |
| $25,000 to $34,999 | 36 | 8.2% |
| $35,000 to $49,999 | 78 | 17.8% |
| $50,000 to $74,999 | 36 | 8.2% |
| $75,000 to $99,999 | 70 | 16.0% |
| $100,000 to $149,999 | 52 | 11.9% |
| $150,000 to $199,999 | 4 | 0.9% |
| $200,000+ | 0 | 0.0% |
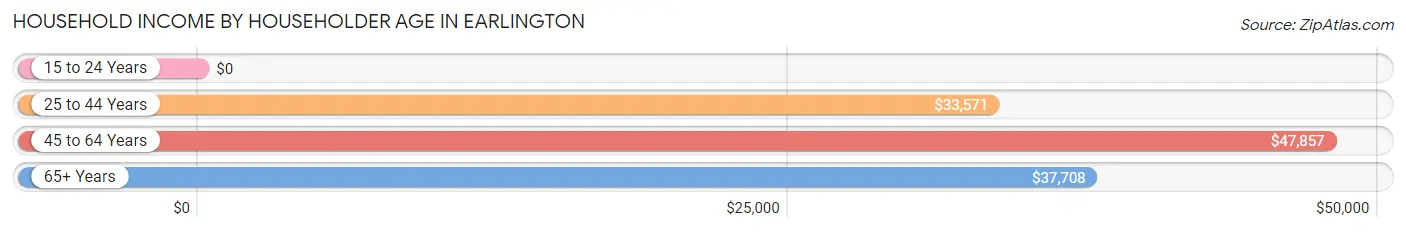
Household Income by Householder Age in Earlington
The median household income in Earlington is $38,971, with the highest median household income of $47,857 found in the 45 to 64 years age bracket for the primary householder. A total of 180 households (41.1%) fall into this category. Meanwhile, the 15 to 24 years age bracket for the primary householder has the lowest median household income of $0, with 9 households (2.1%) in this group.
| Income Bracket | # Households | Median Income |
| 15 to 24 Years | 9 (2.1%) | $0 |
| 25 to 44 Years | 174 (39.7%) | $33,571 |
| 45 to 64 Years | 180 (41.1%) | $47,857 |
| 65+ Years | 75 (17.1%) | $37,708 |
| Total | 438 (100.0%) | $38,971 |
Poverty in Earlington
Income Below Poverty by Sex and Age in Earlington
With 24.3% poverty level for males and 35.3% for females among the residents of Earlington, under 5 year old males and 5 year old females are the most vulnerable to poverty, with 8 males (72.7%) and 22 females (88.0%) in their respective age groups living below the poverty level.
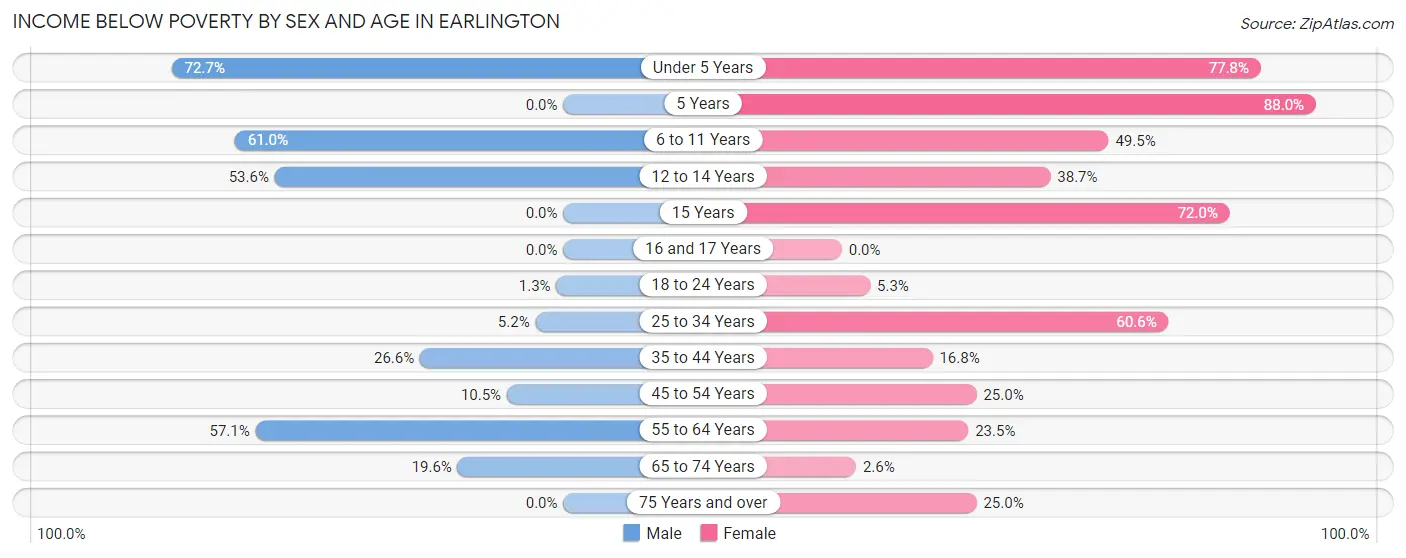
| Age Bracket | Male | Female |
| Under 5 Years | 8 (72.7%) | 21 (77.8%) |
| 5 Years | 0 (0.0%) | 22 (88.0%) |
| 6 to 11 Years | 25 (61.0%) | 50 (49.5%) |
| 12 to 14 Years | 15 (53.6%) | 12 (38.7%) |
| 15 Years | 0 (0.0%) | 18 (72.0%) |
| 16 and 17 Years | 0 (0.0%) | 0 (0.0%) |
| 18 to 24 Years | 1 (1.3%) | 2 (5.3%) |
| 25 to 34 Years | 3 (5.2%) | 57 (60.6%) |
| 35 to 44 Years | 25 (26.6%) | 17 (16.8%) |
| 45 to 54 Years | 9 (10.5%) | 18 (25.0%) |
| 55 to 64 Years | 32 (57.1%) | 23 (23.5%) |
| 65 to 74 Years | 10 (19.6%) | 1 (2.6%) |
| 75 Years and over | 0 (0.0%) | 3 (25.0%) |
| Total | 128 (24.3%) | 244 (35.3%) |
Income Above Poverty by Sex and Age in Earlington
According to the poverty statistics in Earlington, males aged 16 and 17 years and females aged 16 and 17 years are the age groups that are most secure financially, with 100.0% of males and 100.0% of females in these age groups living above the poverty line.
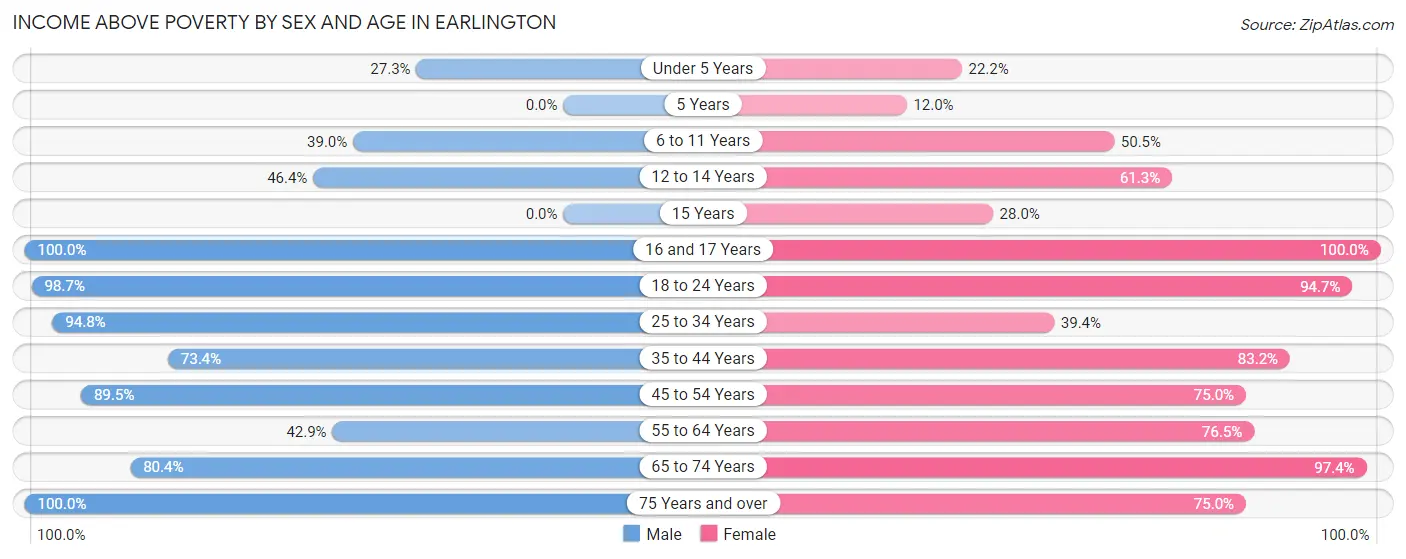
| Age Bracket | Male | Female |
| Under 5 Years | 3 (27.3%) | 6 (22.2%) |
| 5 Years | 0 (0.0%) | 3 (12.0%) |
| 6 to 11 Years | 16 (39.0%) | 51 (50.5%) |
| 12 to 14 Years | 13 (46.4%) | 19 (61.3%) |
| 15 Years | 0 (0.0%) | 7 (28.0%) |
| 16 and 17 Years | 12 (100.0%) | 30 (100.0%) |
| 18 to 24 Years | 77 (98.7%) | 36 (94.7%) |
| 25 to 34 Years | 55 (94.8%) | 37 (39.4%) |
| 35 to 44 Years | 69 (73.4%) | 84 (83.2%) |
| 45 to 54 Years | 77 (89.5%) | 54 (75.0%) |
| 55 to 64 Years | 24 (42.9%) | 75 (76.5%) |
| 65 to 74 Years | 41 (80.4%) | 37 (97.4%) |
| 75 Years and over | 12 (100.0%) | 9 (75.0%) |
| Total | 399 (75.7%) | 448 (64.7%) |
Income Below Poverty Among Married-Couple Families in Earlington
The poverty statistics for married-couple families in Earlington show that 23.8% or 44 of the total 185 families live below the poverty line. Families with 3 or 4 children have the highest poverty rate of 57.1%, comprising of 20 families. On the other hand, families with 1 or 2 children have the lowest poverty rate of 6.7%, which includes 3 families.
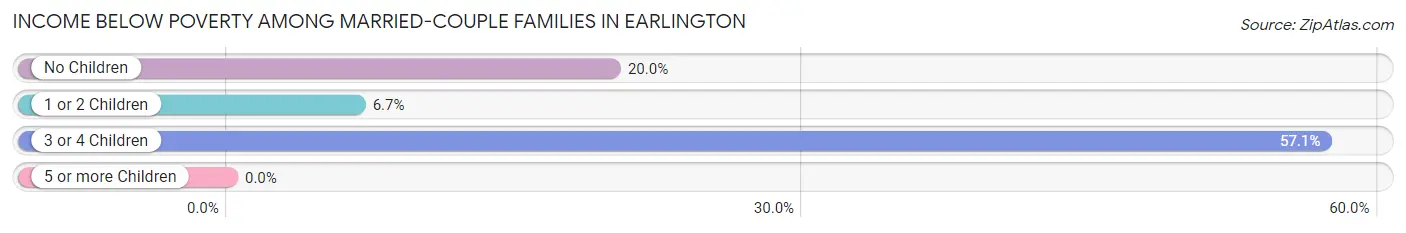
| Children | Above Poverty | Below Poverty |
| No Children | 84 (80.0%) | 21 (20.0%) |
| 1 or 2 Children | 42 (93.3%) | 3 (6.7%) |
| 3 or 4 Children | 15 (42.9%) | 20 (57.1%) |
| 5 or more Children | 0 (0.0%) | 0 (0.0%) |
| Total | 141 (76.2%) | 44 (23.8%) |
Income Below Poverty Among Single-Parent Households in Earlington
According to the poverty data in Earlington, 13.0% or 3 single-father households and 37.7% or 52 single-mother households are living below the poverty line. Among single-father households, those with 1 or 2 children have the highest poverty rate, with 3 households (100.0%) experiencing poverty. Likewise, among single-mother households, those with 3 or 4 children have the highest poverty rate, with 22 households (75.9%) falling below the poverty line.
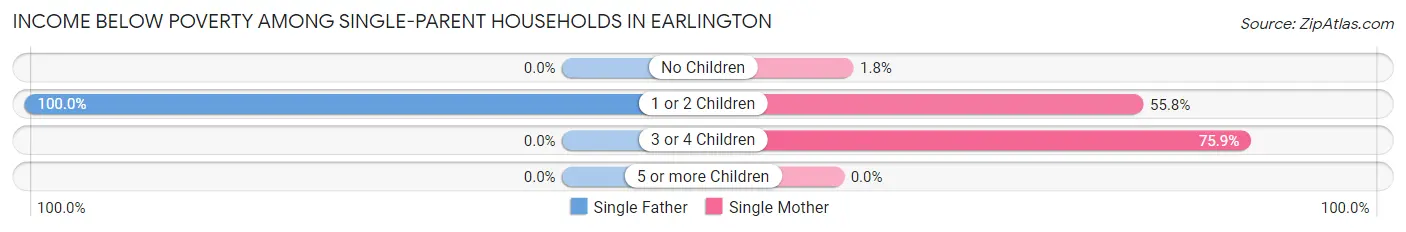
| Children | Single Father | Single Mother |
| No Children | 0 (0.0%) | 1 (1.8%) |
| 1 or 2 Children | 3 (100.0%) | 29 (55.8%) |
| 3 or 4 Children | 0 (0.0%) | 22 (75.9%) |
| 5 or more Children | 0 (0.0%) | 0 (0.0%) |
| Total | 3 (13.0%) | 52 (37.7%) |
Income Below Poverty Among Married-Couple vs Single-Parent Households in Earlington
The poverty data for Earlington shows that 44 of the married-couple family households (23.8%) and 55 of the single-parent households (34.2%) are living below the poverty level. Within the married-couple family households, those with 3 or 4 children have the highest poverty rate, with 20 households (57.1%) falling below the poverty line. Among the single-parent households, those with 3 or 4 children have the highest poverty rate, with 22 household (75.9%) living below poverty.
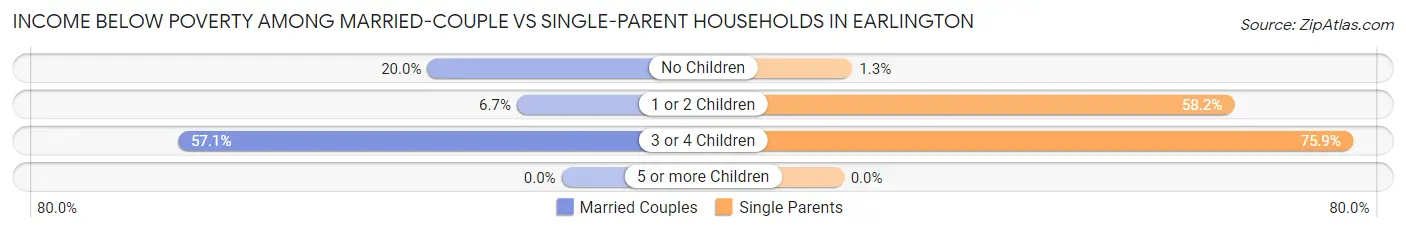
| Children | Married-Couple Families | Single-Parent Households |
| No Children | 21 (20.0%) | 1 (1.3%) |
| 1 or 2 Children | 3 (6.7%) | 32 (58.2%) |
| 3 or 4 Children | 20 (57.1%) | 22 (75.9%) |
| 5 or more Children | 0 (0.0%) | 0 (0.0%) |
| Total | 44 (23.8%) | 55 (34.2%) |
Race in Earlington
The most populous races in Earlington are White / Caucasian (1,027 | 84.3%), Black / African American (177 | 14.5%), and Two or more Races (12 | 1.0%).
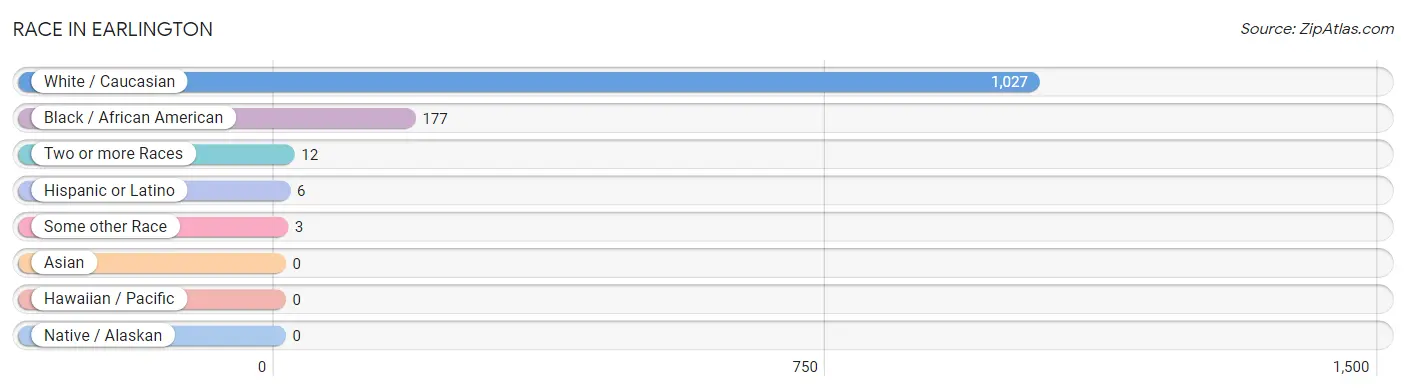
| Race | # Population | % Population |
| Asian | 0 | 0.0% |
| Black / African American | 177 | 14.5% |
| Hawaiian / Pacific | 0 | 0.0% |
| Hispanic or Latino | 6 | 0.5% |
| Native / Alaskan | 0 | 0.0% |
| White / Caucasian | 1,027 | 84.3% |
| Two or more Races | 12 | 1.0% |
| Some other Race | 3 | 0.3% |
| Total | 1,219 | 100.0% |
Ancestry in Earlington
The most populous ancestries reported in Earlington are European (132 | 10.8%), English (124 | 10.2%), Irish (121 | 9.9%), American (117 | 9.6%), and German (92 | 7.5%), together accounting for 48.1% of all Earlington residents.
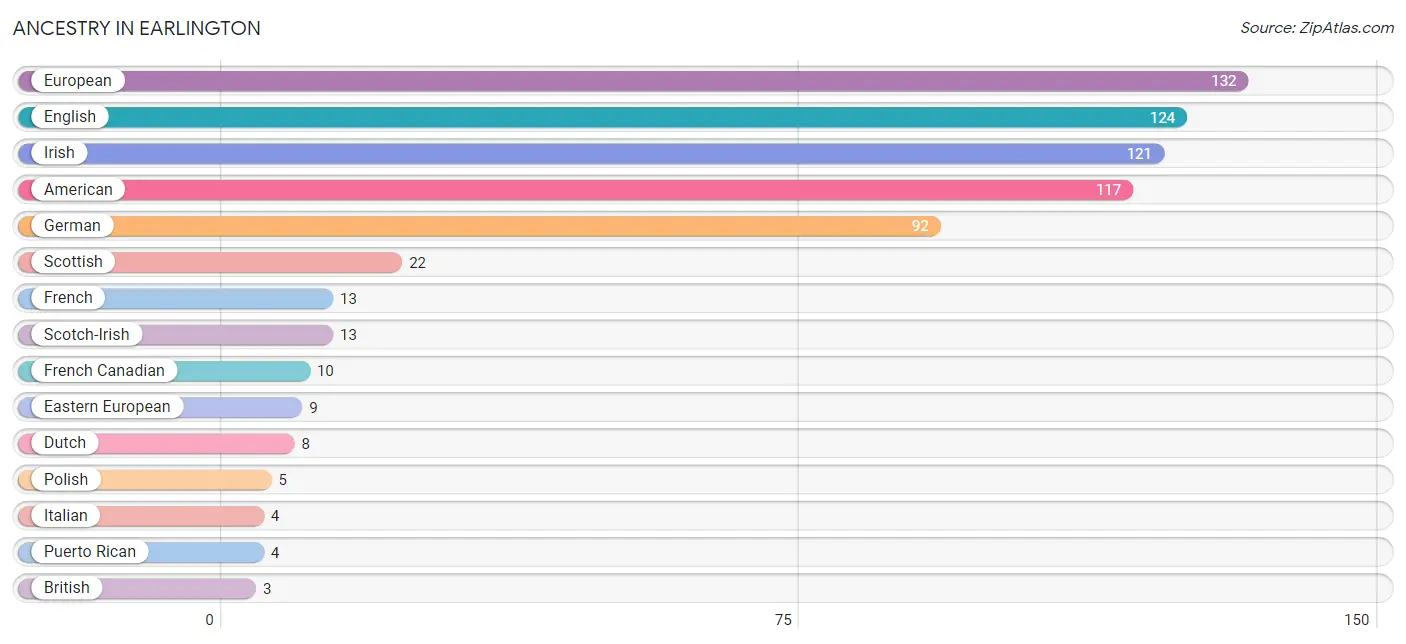
| Ancestry | # Population | % Population |
| African | 2 | 0.2% |
| American | 117 | 9.6% |
| British | 3 | 0.3% |
| Cherokee | 1 | 0.1% |
| Dutch | 8 | 0.7% |
| Eastern European | 9 | 0.7% |
| English | 124 | 10.2% |
| European | 132 | 10.8% |
| French | 13 | 1.1% |
| French Canadian | 10 | 0.8% |
| German | 92 | 7.5% |
| Irish | 121 | 9.9% |
| Italian | 4 | 0.3% |
| Mexican | 1 | 0.1% |
| Polish | 5 | 0.4% |
| Puerto Rican | 4 | 0.3% |
| Scotch-Irish | 13 | 1.1% |
| Scottish | 22 | 1.8% |
| Spanish | 1 | 0.1% |
| Subsaharan African | 2 | 0.2% |
| Swedish | 3 | 0.3% | View All 21 Rows |
Immigrants in Earlington
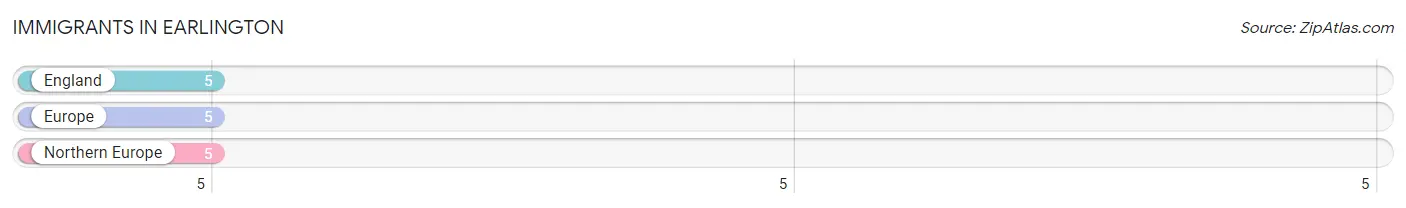
The most numerous immigrant groups reported in Earlington came from England (5 | 0.4%), Europe (5 | 0.4%), and Northern Europe (5 | 0.4%), together accounting for 1.2% of all Earlington residents.
| Immigration Origin | # Population | % Population |
| England | 5 | 0.4% |
| Europe | 5 | 0.4% |
| Northern Europe | 5 | 0.4% | View All 3 Rows |
Sex and Age in Earlington
Sex and Age in Earlington
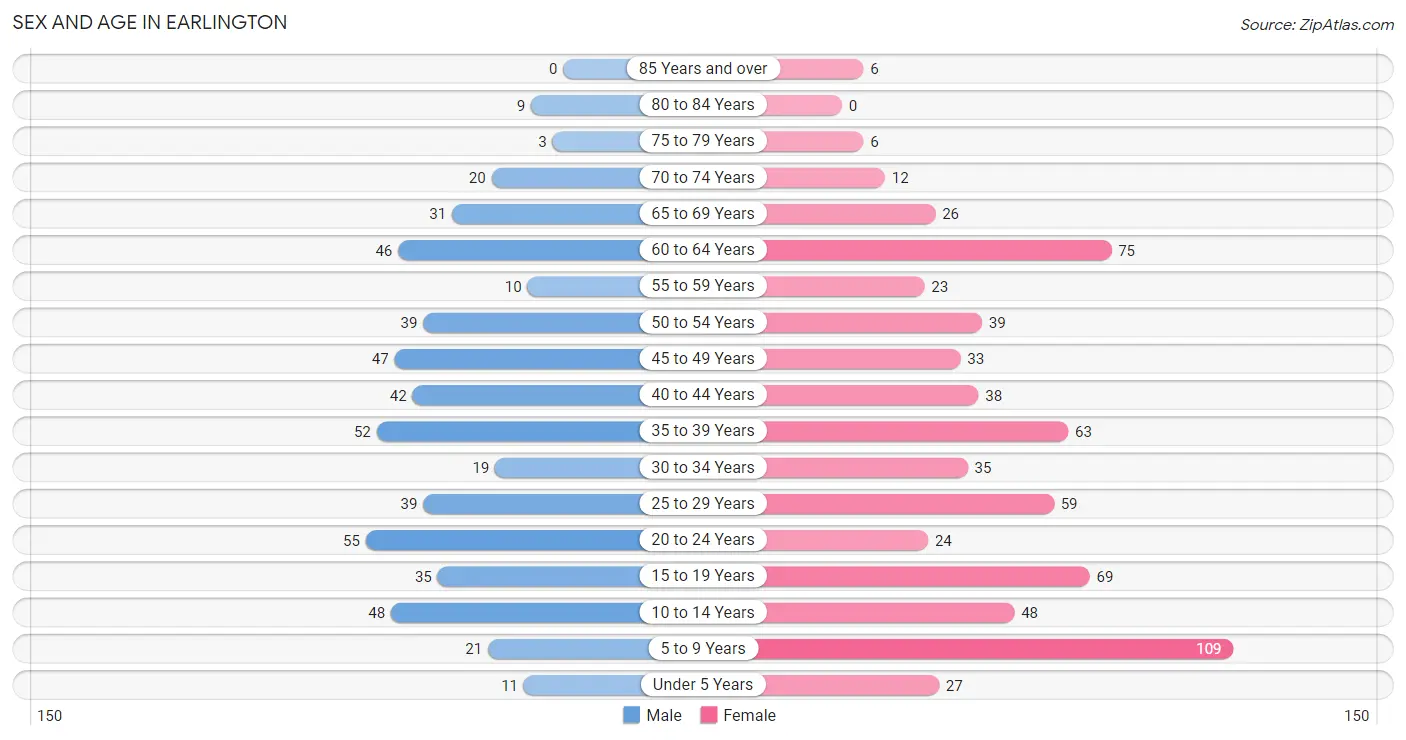
The most populous age groups in Earlington are 20 to 24 Years (55 | 10.4%) for men and 5 to 9 Years (109 | 15.8%) for women.
| Age Bracket | Male | Female |
| Under 5 Years | 11 (2.1%) | 27 (3.9%) |
| 5 to 9 Years | 21 (4.0%) | 109 (15.8%) |
| 10 to 14 Years | 48 (9.1%) | 48 (6.9%) |
| 15 to 19 Years | 35 (6.6%) | 69 (10.0%) |
| 20 to 24 Years | 55 (10.4%) | 24 (3.5%) |
| 25 to 29 Years | 39 (7.4%) | 59 (8.5%) |
| 30 to 34 Years | 19 (3.6%) | 35 (5.1%) |
| 35 to 39 Years | 52 (9.9%) | 63 (9.1%) |
| 40 to 44 Years | 42 (8.0%) | 38 (5.5%) |
| 45 to 49 Years | 47 (8.9%) | 33 (4.8%) |
| 50 to 54 Years | 39 (7.4%) | 39 (5.6%) |
| 55 to 59 Years | 10 (1.9%) | 23 (3.3%) |
| 60 to 64 Years | 46 (8.7%) | 75 (10.8%) |
| 65 to 69 Years | 31 (5.9%) | 26 (3.8%) |
| 70 to 74 Years | 20 (3.8%) | 12 (1.7%) |
| 75 to 79 Years | 3 (0.6%) | 6 (0.9%) |
| 80 to 84 Years | 9 (1.7%) | 0 (0.0%) |
| 85 Years and over | 0 (0.0%) | 6 (0.9%) |
| Total | 527 (100.0%) | 692 (100.0%) |
Families and Households in Earlington
Median Family Size in Earlington
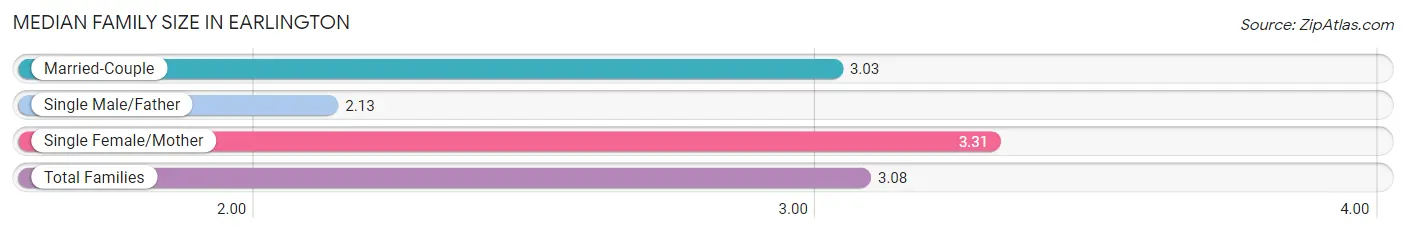
The median family size in Earlington is 3.08 persons per family, with single female/mother families (138 | 39.9%) accounting for the largest median family size of 3.31 persons per family. On the other hand, single male/father families (23 | 6.7%) represent the smallest median family size with 2.13 persons per family.
| Family Type | # Families | Family Size |
| Married-Couple | 185 (53.5%) | 3.03 |
| Single Male/Father | 23 (6.7%) | 2.13 |
| Single Female/Mother | 138 (39.9%) | 3.31 |
| Total Families | 346 (100.0%) | 3.08 |
Median Household Size in Earlington
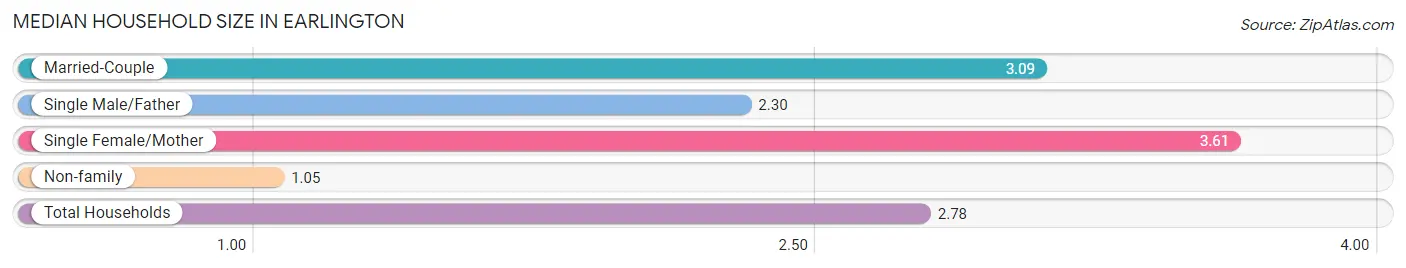
The median household size in Earlington is 2.78 persons per household, with single female/mother households (138 | 31.5%) accounting for the largest median household size of 3.61 persons per household. non-family households (92 | 21.0%) represent the smallest median household size with 1.05 persons per household.
| Household Type | # Households | Household Size |
| Married-Couple | 185 (42.2%) | 3.09 |
| Single Male/Father | 23 (5.2%) | 2.30 |
| Single Female/Mother | 138 (31.5%) | 3.61 |
| Non-family | 92 (21.0%) | 1.05 |
| Total Households | 438 (100.0%) | 2.78 |
Household Size by Marriage Status in Earlington
Out of a total of 438 households in Earlington, 346 (79.0%) are family households, while 92 (21.0%) are nonfamily households. The most numerous type of family households are 2-person households, comprising 145, and the most common type of nonfamily households are 1-person households, comprising 88.
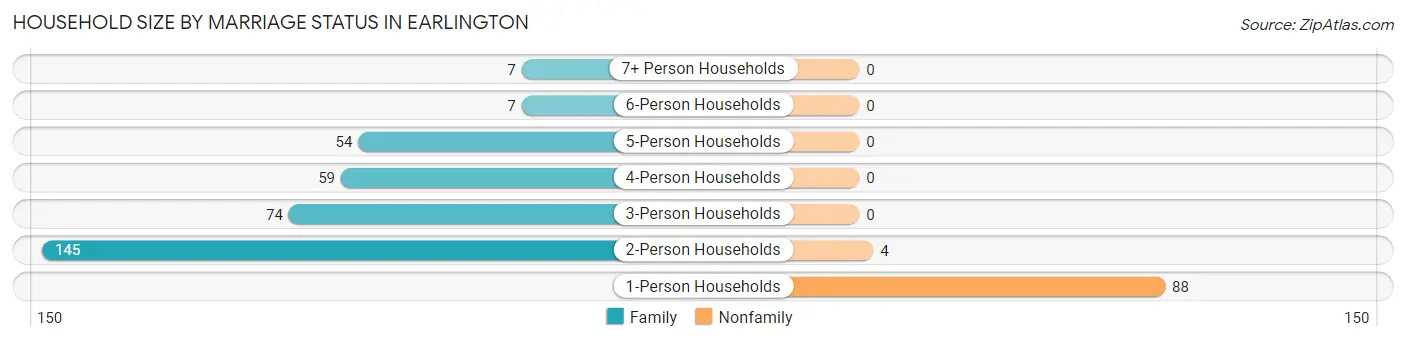
| Household Size | Family Households | Nonfamily Households |
| 1-Person Households | - | 88 (20.1%) |
| 2-Person Households | 145 (33.1%) | 4 (0.9%) |
| 3-Person Households | 74 (16.9%) | 0 (0.0%) |
| 4-Person Households | 59 (13.5%) | 0 (0.0%) |
| 5-Person Households | 54 (12.3%) | 0 (0.0%) |
| 6-Person Households | 7 (1.6%) | 0 (0.0%) |
| 7+ Person Households | 7 (1.6%) | 0 (0.0%) |
| Total | 346 (79.0%) | 92 (21.0%) |
Female Fertility in Earlington
Fertility by Age in Earlington
Average fertility rate in Earlington is 33.0 births per 1,000 women. Women in the age bracket of 20 to 34 years have the highest fertility rate with 93.0 births per 1,000 women. Women in the age bracket of 20 to 34 years acount for 100.0% of all women with births.
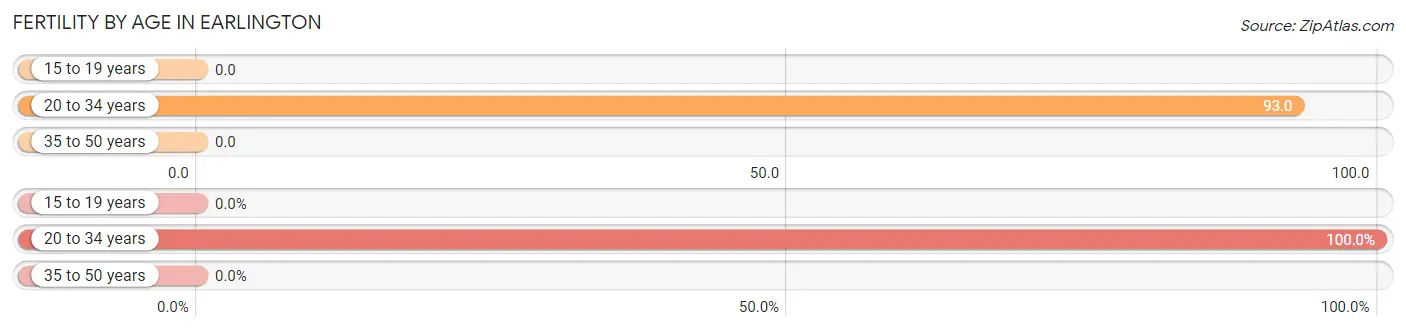
| Age Bracket | Women with Births | Births / 1,000 Women |
| 15 to 19 years | 0 (0.0%) | 0.0 |
| 20 to 34 years | 11 (100.0%) | 93.0 |
| 35 to 50 years | 0 (0.0%) | 0.0 |
| Total | 11 (100.0%) | 33.0 |
Fertility by Age by Marriage Status in Earlington
63.6% of women with births (11) in Earlington are married. The highest percentage of unmarried women with births falls into 20 to 34 years age bracket with 36.4% of them unmarried at the time of birth, while the lowest percentage of unmarried women with births belong to 20 to 34 years age bracket with 36.4% of them unmarried.
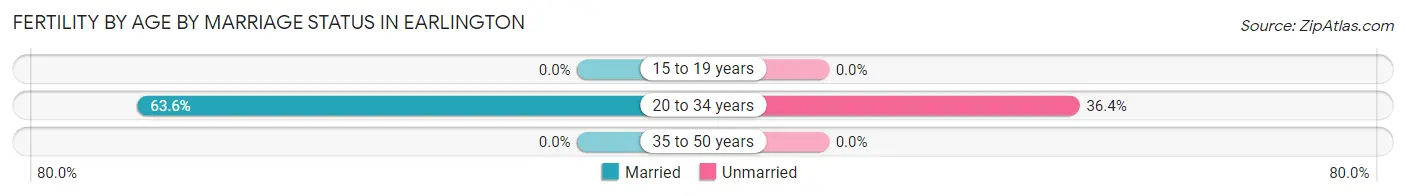
| Age Bracket | Married | Unmarried |
| 15 to 19 years | 0 (0.0%) | 0 (0.0%) |
| 20 to 34 years | 7 (63.6%) | 4 (36.4%) |
| 35 to 50 years | 0 (0.0%) | 0 (0.0%) |
| Total | 7 (63.6%) | 4 (36.4%) |
Fertility by Education in Earlington
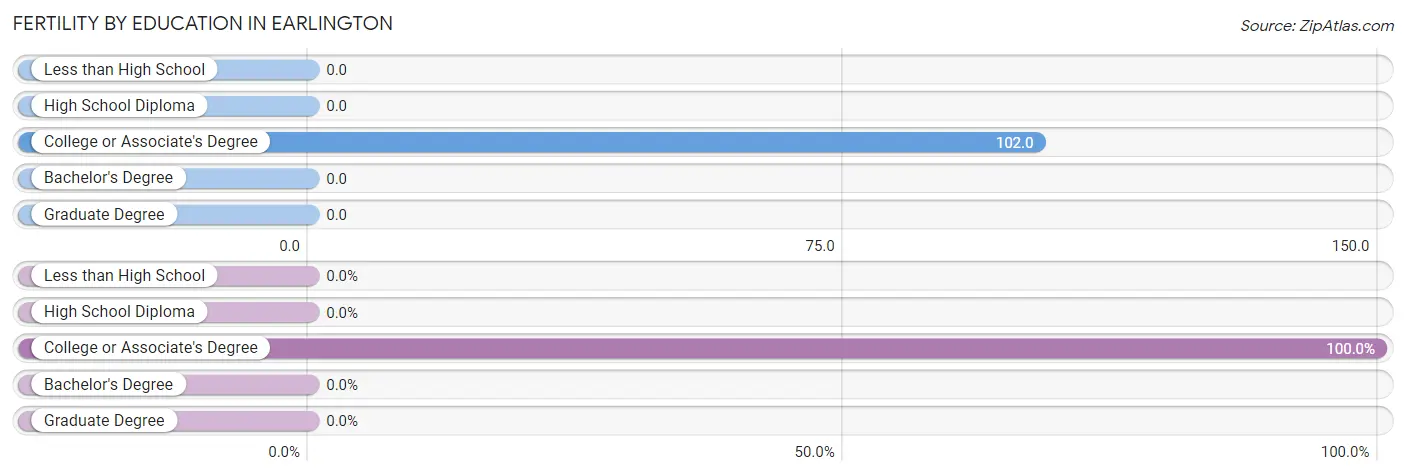
| Educational Attainment | Women with Births | Births / 1,000 Women |
| Less than High School | 0 (0.0%) | 0.0 |
| High School Diploma | 0 (0.0%) | 0.0 |
| College or Associate's Degree | 11 (100.0%) | 102.0 |
| Bachelor's Degree | 0 (0.0%) | 0.0 |
| Graduate Degree | 0 (0.0%) | 0.0 |
| Total | 11 (100.0%) | 33.0 |
Fertility by Education by Marriage Status in Earlington
36.4% of women with births in Earlington are unmarried. Women with the educational attainment of college or associate's degree are most likely to be married with 63.6% of them married at childbirth, while women with the educational attainment of college or associate's degree are least likely to be married with 36.4% of them unmarried at childbirth.
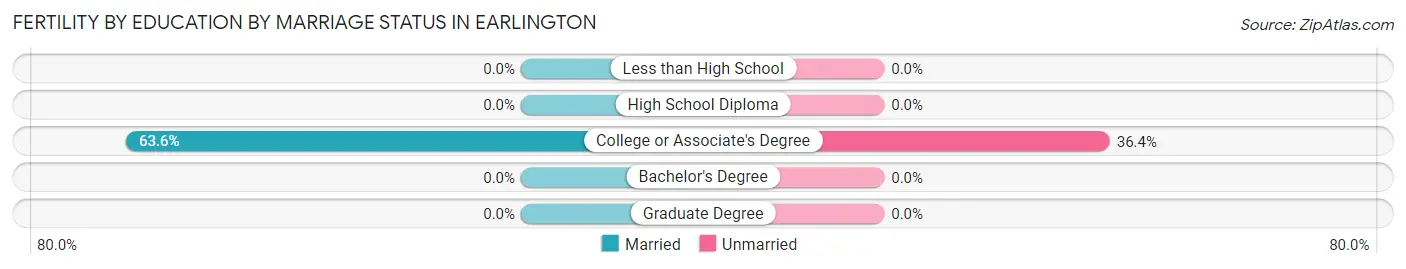
| Educational Attainment | Married | Unmarried |
| Less than High School | 0 (0.0%) | 0 (0.0%) |
| High School Diploma | 0 (0.0%) | 0 (0.0%) |
| College or Associate's Degree | 7 (63.6%) | 4 (36.4%) |
| Bachelor's Degree | 0 (0.0%) | 0 (0.0%) |
| Graduate Degree | 0 (0.0%) | 0 (0.0%) |
| Total | 7 (63.6%) | 4 (36.4%) |
Employment Characteristics in Earlington
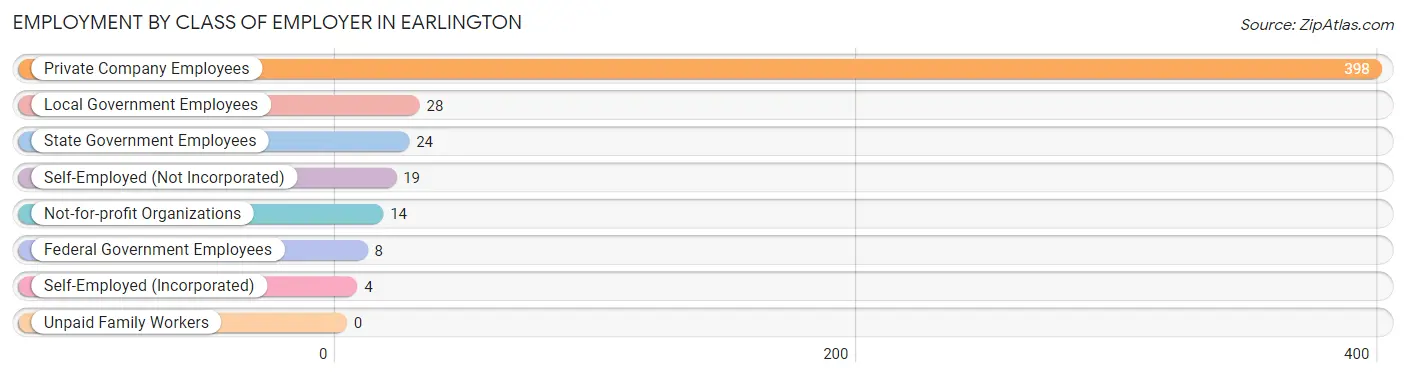
Employment by Class of Employer in Earlington
Among the 495 employed individuals in Earlington, private company employees (398 | 80.4%), local government employees (28 | 5.7%), and state government employees (24 | 4.9%) make up the most common classes of employment.
| Employer Class | # Employees | % Employees |
| Private Company Employees | 398 | 80.4% |
| Self-Employed (Incorporated) | 4 | 0.8% |
| Self-Employed (Not Incorporated) | 19 | 3.8% |
| Not-for-profit Organizations | 14 | 2.8% |
| Local Government Employees | 28 | 5.7% |
| State Government Employees | 24 | 4.9% |
| Federal Government Employees | 8 | 1.6% |
| Unpaid Family Workers | 0 | 0.0% |
| Total | 495 | 100.0% |
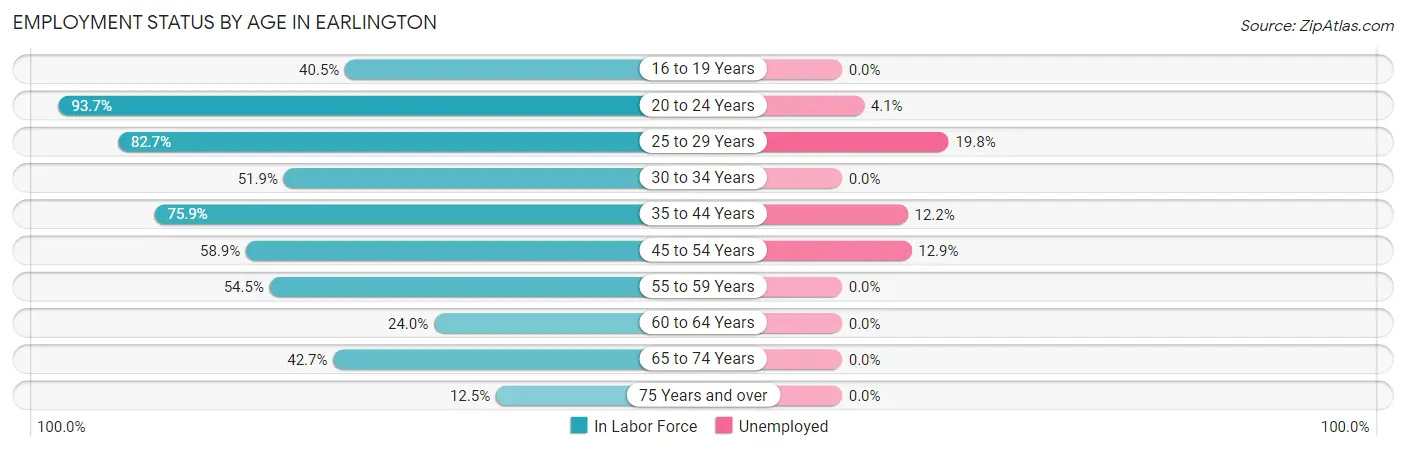
Employment Status by Age in Earlington
According to the labor force statistics for Earlington, out of the total population over 16 years of age (930), 58.5% or 544 individuals are in the labor force, with 9.0% or 49 of them unemployed. The age group with the highest labor force participation rate is 20 to 24 years, with 93.7% or 74 individuals in the labor force. Within the labor force, the 25 to 29 years age range has the highest percentage of unemployed individuals, with 19.8% or 16 of them being unemployed.
| Age Bracket | In Labor Force | Unemployed |
| 16 to 19 Years | 32 (40.5%) | 0 (0.0%) |
| 20 to 24 Years | 74 (93.7%) | 3 (4.1%) |
| 25 to 29 Years | 81 (82.7%) | 16 (19.8%) |
| 30 to 34 Years | 28 (51.9%) | 0 (0.0%) |
| 35 to 44 Years | 148 (75.9%) | 18 (12.2%) |
| 45 to 54 Years | 93 (58.9%) | 12 (12.9%) |
| 55 to 59 Years | 18 (54.5%) | 0 (0.0%) |
| 60 to 64 Years | 29 (24.0%) | 0 (0.0%) |
| 65 to 74 Years | 38 (42.7%) | 0 (0.0%) |
| 75 Years and over | 3 (12.5%) | 0 (0.0%) |
| Total | 544 (58.5%) | 49 (9.0%) |
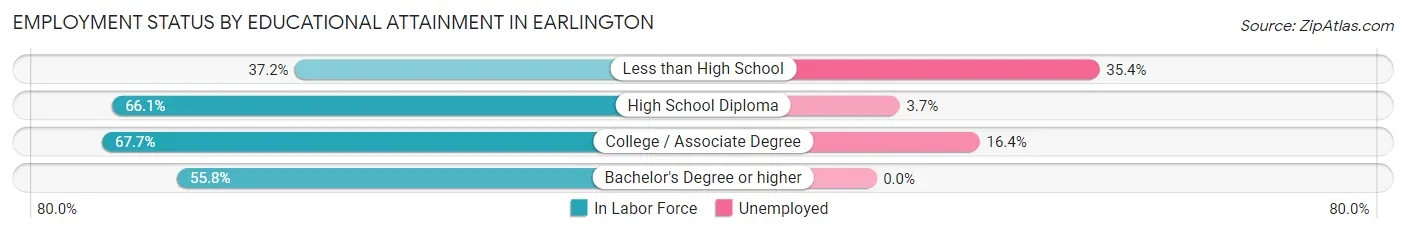
Employment Status by Educational Attainment in Earlington
According to labor force statistics for Earlington, 60.2% of individuals (397) out of the total population between 25 and 64 years of age (659) are in the labor force, with 11.6% or 46 of them being unemployed. The group with the highest labor force participation rate are those with the educational attainment of college / associate degree, with 67.7% or 134 individuals in the labor force. Within the labor force, individuals with less than high school education have the highest percentage of unemployment, with 35.4% or 17 of them being unemployed.
| Educational Attainment | In Labor Force | Unemployed |
| Less than High School | 48 (37.2%) | 46 (35.4%) |
| High School Diploma | 191 (66.1%) | 11 (3.7%) |
| College / Associate Degree | 134 (67.7%) | 32 (16.4%) |
| Bachelor's Degree or higher | 24 (55.8%) | 0 (0.0%) |
| Total | 397 (60.2%) | 76 (11.6%) |
Employment Occupations by Sex in Earlington
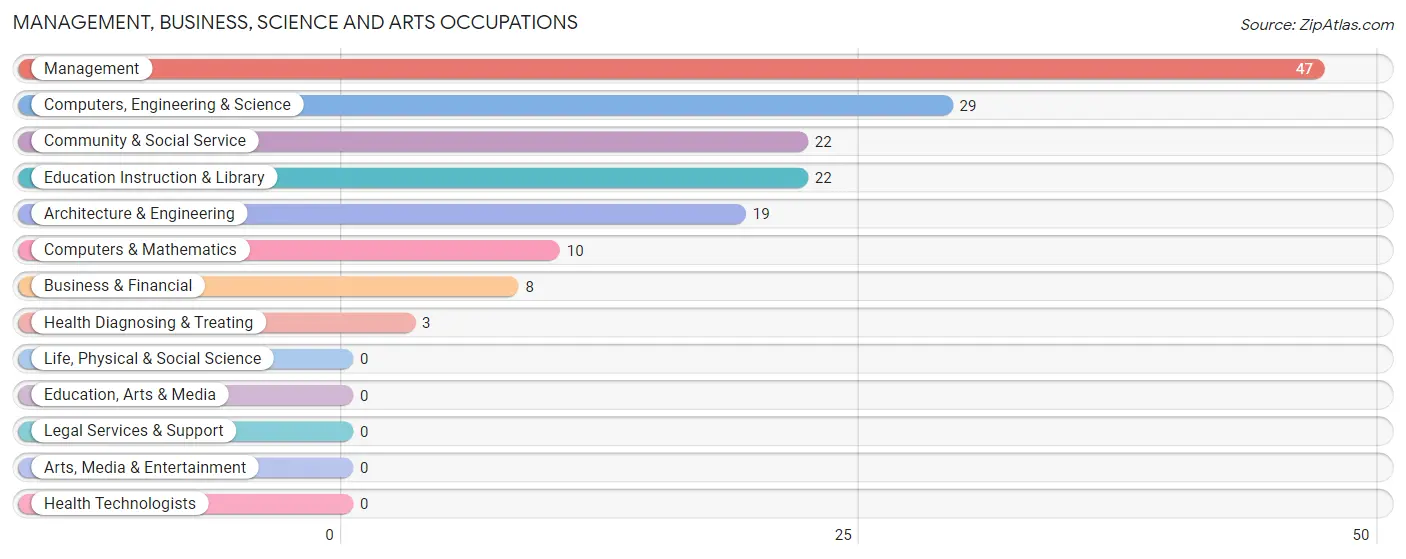
Management, Business, Science and Arts Occupations
The most common Management, Business, Science and Arts occupations in Earlington are Management (47 | 9.5%), Computers, Engineering & Science (29 | 5.9%), Community & Social Service (22 | 4.4%), Education Instruction & Library (22 | 4.4%), and Architecture & Engineering (19 | 3.8%).
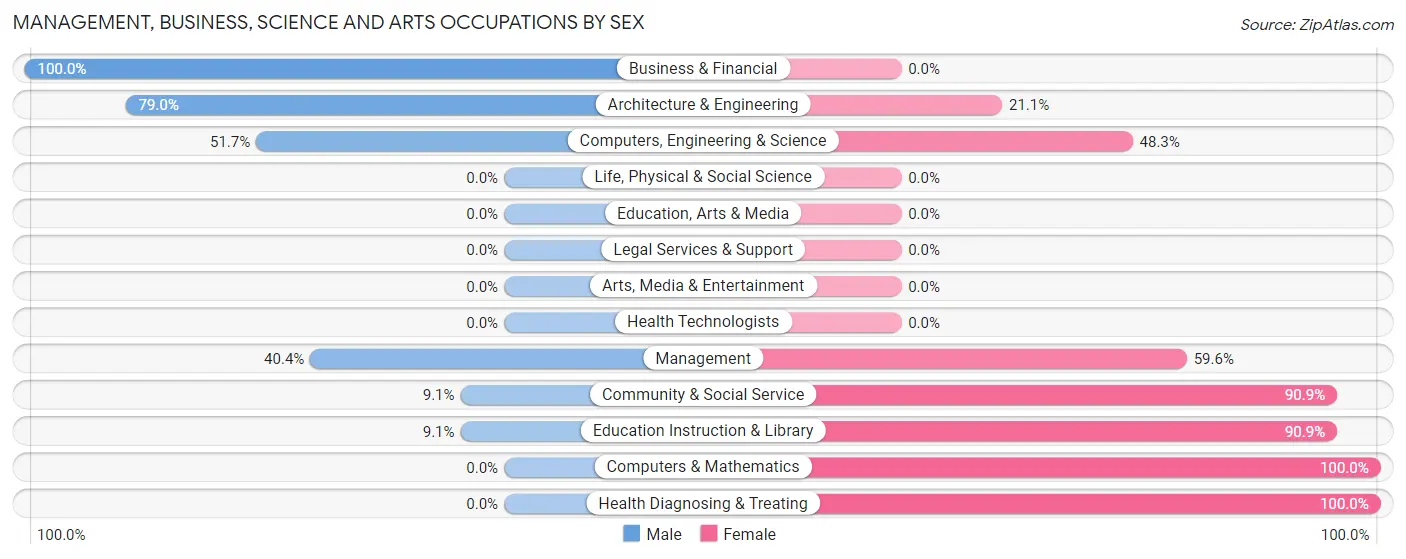
Management, Business, Science and Arts Occupations by Sex
Within the Management, Business, Science and Arts occupations in Earlington, the most male-oriented occupations are Business & Financial (100.0%), Architecture & Engineering (78.9%), and Computers, Engineering & Science (51.7%), while the most female-oriented occupations are Computers & Mathematics (100.0%), Health Diagnosing & Treating (100.0%), and Community & Social Service (90.9%).
| Occupation | Male | Female |
| Management | 19 (40.4%) | 28 (59.6%) |
| Business & Financial | 8 (100.0%) | 0 (0.0%) |
| Computers, Engineering & Science | 15 (51.7%) | 14 (48.3%) |
| Computers & Mathematics | 0 (0.0%) | 10 (100.0%) |
| Architecture & Engineering | 15 (78.9%) | 4 (21.0%) |
| Life, Physical & Social Science | 0 (0.0%) | 0 (0.0%) |
| Community & Social Service | 2 (9.1%) | 20 (90.9%) |
| Education, Arts & Media | 0 (0.0%) | 0 (0.0%) |
| Legal Services & Support | 0 (0.0%) | 0 (0.0%) |
| Education Instruction & Library | 2 (9.1%) | 20 (90.9%) |
| Arts, Media & Entertainment | 0 (0.0%) | 0 (0.0%) |
| Health Diagnosing & Treating | 0 (0.0%) | 3 (100.0%) |
| Health Technologists | 0 (0.0%) | 0 (0.0%) |
| Total (Category) | 44 (40.4%) | 65 (59.6%) |
| Total (Overall) | 257 (51.9%) | 238 (48.1%) |
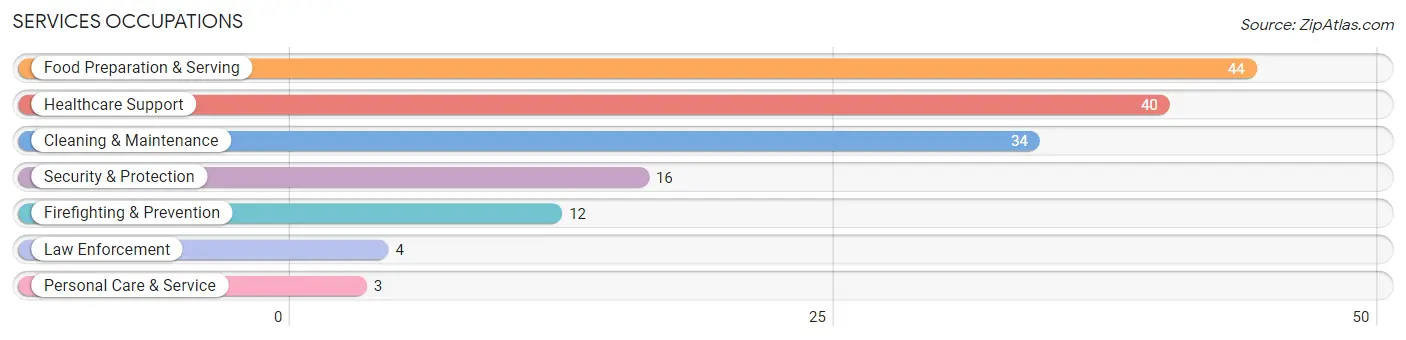
Services Occupations
The most common Services occupations in Earlington are Food Preparation & Serving (44 | 8.9%), Healthcare Support (40 | 8.1%), Cleaning & Maintenance (34 | 6.9%), Security & Protection (16 | 3.2%), and Firefighting & Prevention (12 | 2.4%).
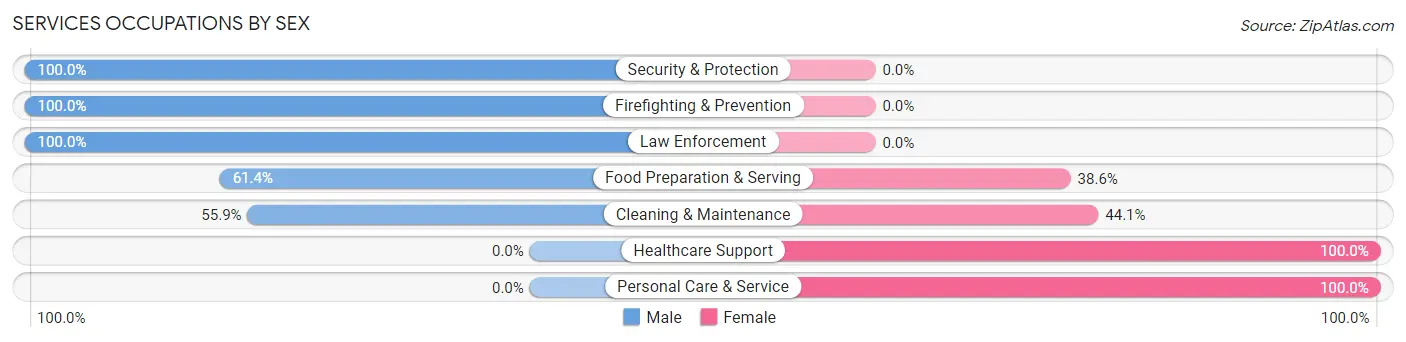
Services Occupations by Sex
Within the Services occupations in Earlington, the most male-oriented occupations are Security & Protection (100.0%), Firefighting & Prevention (100.0%), and Law Enforcement (100.0%), while the most female-oriented occupations are Healthcare Support (100.0%), Personal Care & Service (100.0%), and Cleaning & Maintenance (44.1%).
| Occupation | Male | Female |
| Healthcare Support | 0 (0.0%) | 40 (100.0%) |
| Security & Protection | 16 (100.0%) | 0 (0.0%) |
| Firefighting & Prevention | 12 (100.0%) | 0 (0.0%) |
| Law Enforcement | 4 (100.0%) | 0 (0.0%) |
| Food Preparation & Serving | 27 (61.4%) | 17 (38.6%) |
| Cleaning & Maintenance | 19 (55.9%) | 15 (44.1%) |
| Personal Care & Service | 0 (0.0%) | 3 (100.0%) |
| Total (Category) | 62 (45.3%) | 75 (54.7%) |
| Total (Overall) | 257 (51.9%) | 238 (48.1%) |
Sales and Office Occupations
The most common Sales and Office occupations in Earlington are Office & Administration (52 | 10.5%), and Sales & Related (45 | 9.1%).
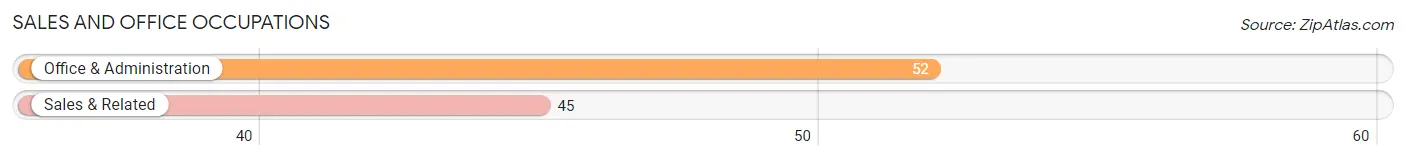
Sales and Office Occupations by Sex
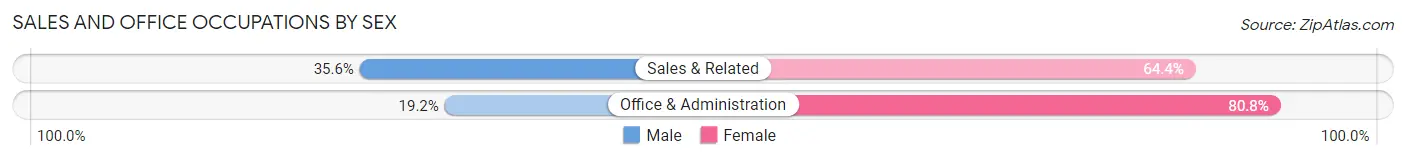
| Occupation | Male | Female |
| Sales & Related | 16 (35.6%) | 29 (64.4%) |
| Office & Administration | 10 (19.2%) | 42 (80.8%) |
| Total (Category) | 26 (26.8%) | 71 (73.2%) |
| Total (Overall) | 257 (51.9%) | 238 (48.1%) |
Natural Resources, Construction and Maintenance Occupations
The most common Natural Resources, Construction and Maintenance occupations in Earlington are Construction & Extraction (38 | 7.7%), and Installation, Maintenance & Repair (11 | 2.2%).
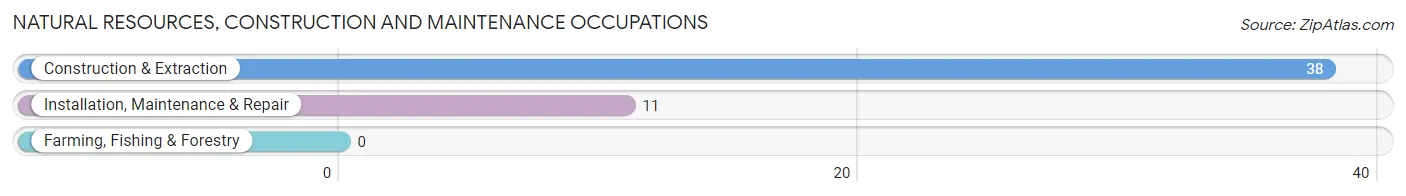
Natural Resources, Construction and Maintenance Occupations by Sex
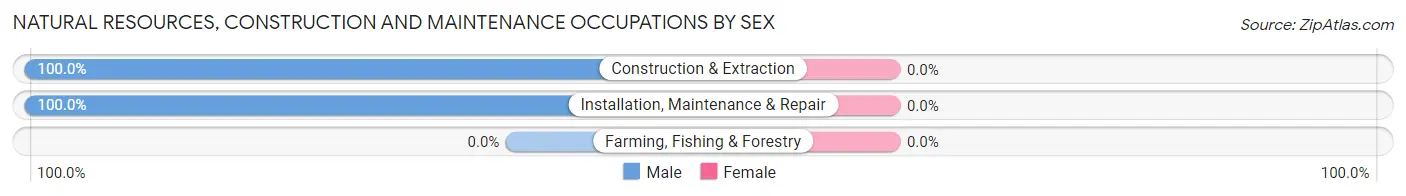
| Occupation | Male | Female |
| Farming, Fishing & Forestry | 0 (0.0%) | 0 (0.0%) |
| Construction & Extraction | 38 (100.0%) | 0 (0.0%) |
| Installation, Maintenance & Repair | 11 (100.0%) | 0 (0.0%) |
| Total (Category) | 49 (100.0%) | 0 (0.0%) |
| Total (Overall) | 257 (51.9%) | 238 (48.1%) |
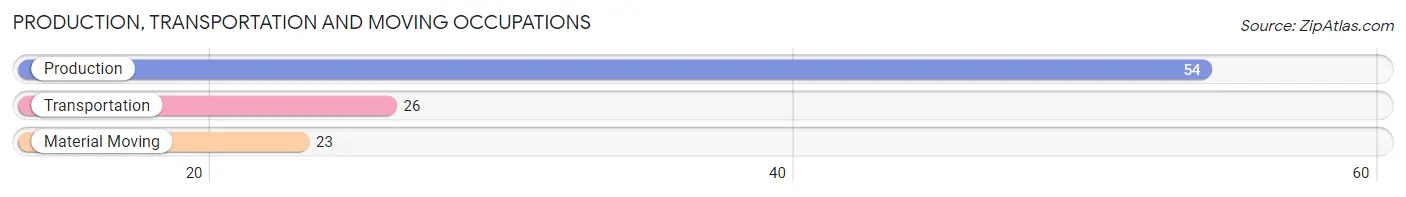
Production, Transportation and Moving Occupations
The most common Production, Transportation and Moving occupations in Earlington are Production (54 | 10.9%), Transportation (26 | 5.2%), and Material Moving (23 | 4.6%).
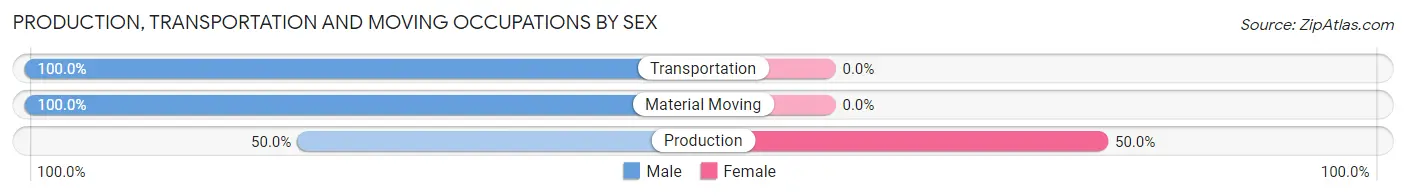
Production, Transportation and Moving Occupations by Sex
| Occupation | Male | Female |
| Production | 27 (50.0%) | 27 (50.0%) |
| Transportation | 26 (100.0%) | 0 (0.0%) |
| Material Moving | 23 (100.0%) | 0 (0.0%) |
| Total (Category) | 76 (73.8%) | 27 (26.2%) |
| Total (Overall) | 257 (51.9%) | 238 (48.1%) |
Employment Industries by Sex in Earlington
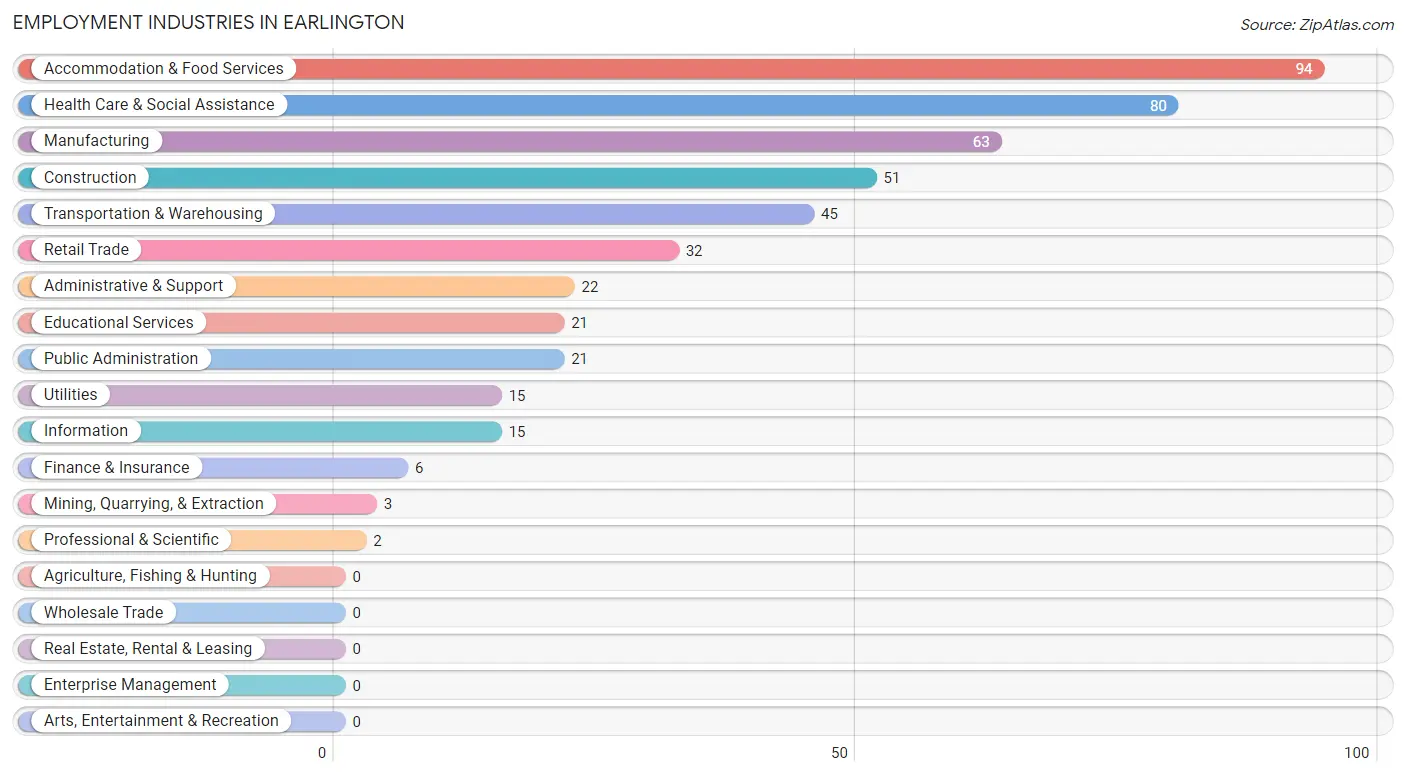
Employment Industries in Earlington
The major employment industries in Earlington include Accommodation & Food Services (94 | 19.0%), Health Care & Social Assistance (80 | 16.2%), Manufacturing (63 | 12.7%), Construction (51 | 10.3%), and Transportation & Warehousing (45 | 9.1%).
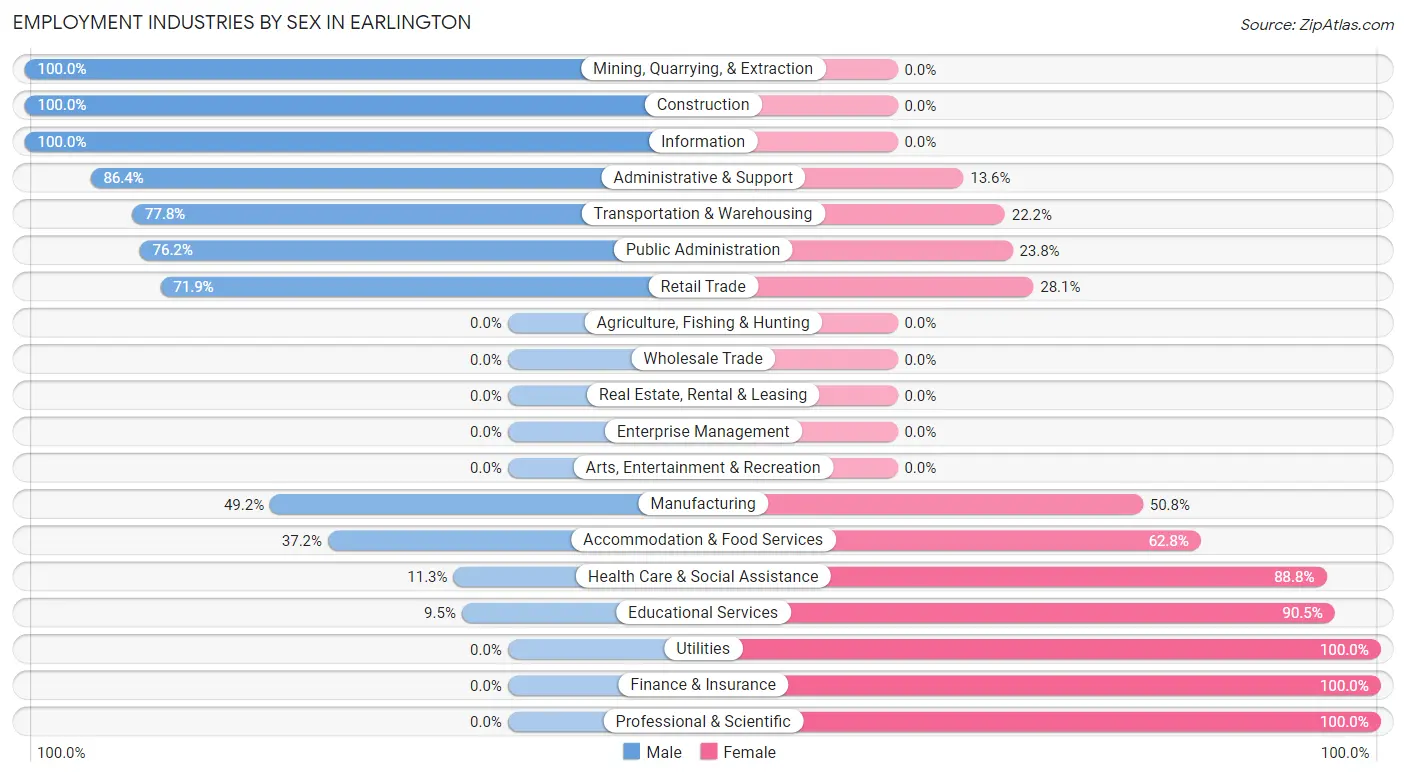
Employment Industries by Sex in Earlington
The Earlington industries that see more men than women are Mining, Quarrying, & Extraction (100.0%), Construction (100.0%), and Information (100.0%), whereas the industries that tend to have a higher number of women are Utilities (100.0%), Finance & Insurance (100.0%), and Professional & Scientific (100.0%).
| Industry | Male | Female |
| Agriculture, Fishing & Hunting | 0 (0.0%) | 0 (0.0%) |
| Mining, Quarrying, & Extraction | 3 (100.0%) | 0 (0.0%) |
| Construction | 51 (100.0%) | 0 (0.0%) |
| Manufacturing | 31 (49.2%) | 32 (50.8%) |
| Wholesale Trade | 0 (0.0%) | 0 (0.0%) |
| Retail Trade | 23 (71.9%) | 9 (28.1%) |
| Transportation & Warehousing | 35 (77.8%) | 10 (22.2%) |
| Utilities | 0 (0.0%) | 15 (100.0%) |
| Information | 15 (100.0%) | 0 (0.0%) |
| Finance & Insurance | 0 (0.0%) | 6 (100.0%) |
| Real Estate, Rental & Leasing | 0 (0.0%) | 0 (0.0%) |
| Professional & Scientific | 0 (0.0%) | 2 (100.0%) |
| Enterprise Management | 0 (0.0%) | 0 (0.0%) |
| Administrative & Support | 19 (86.4%) | 3 (13.6%) |
| Educational Services | 2 (9.5%) | 19 (90.5%) |
| Health Care & Social Assistance | 9 (11.3%) | 71 (88.7%) |
| Arts, Entertainment & Recreation | 0 (0.0%) | 0 (0.0%) |
| Accommodation & Food Services | 35 (37.2%) | 59 (62.8%) |
| Public Administration | 16 (76.2%) | 5 (23.8%) |
| Total | 257 (51.9%) | 238 (48.1%) |
Education in Earlington
School Enrollment in Earlington
The most common levels of schooling among the 340 students in Earlington are elementary school (108 | 31.8%), middle school (95 | 27.9%), and high school (77 | 22.7%).
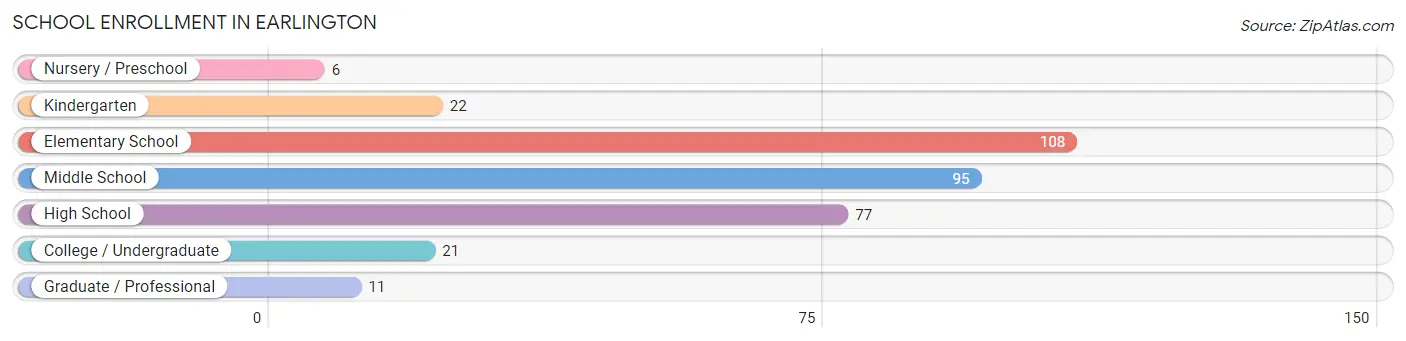
| School Level | # Students | % Students |
| Nursery / Preschool | 6 | 1.8% |
| Kindergarten | 22 | 6.5% |
| Elementary School | 108 | 31.8% |
| Middle School | 95 | 27.9% |
| High School | 77 | 22.7% |
| College / Undergraduate | 21 | 6.2% |
| Graduate / Professional | 11 | 3.2% |
| Total | 340 | 100.0% |
School Enrollment by Age by Funding Source in Earlington
Out of a total of 340 students who are enrolled in schools in Earlington, 18 (5.3%) attend a private institution, while the remaining 322 (94.7%) are enrolled in public schools. The age group of 25 to 34 year olds has the highest likelihood of being enrolled in private schools, with 14 (82.4% in the age bracket) enrolled. Conversely, the age group of 3 to 4 year olds has the lowest likelihood of being enrolled in a private school, with 6 (100.0% in the age bracket) attending a public institution.
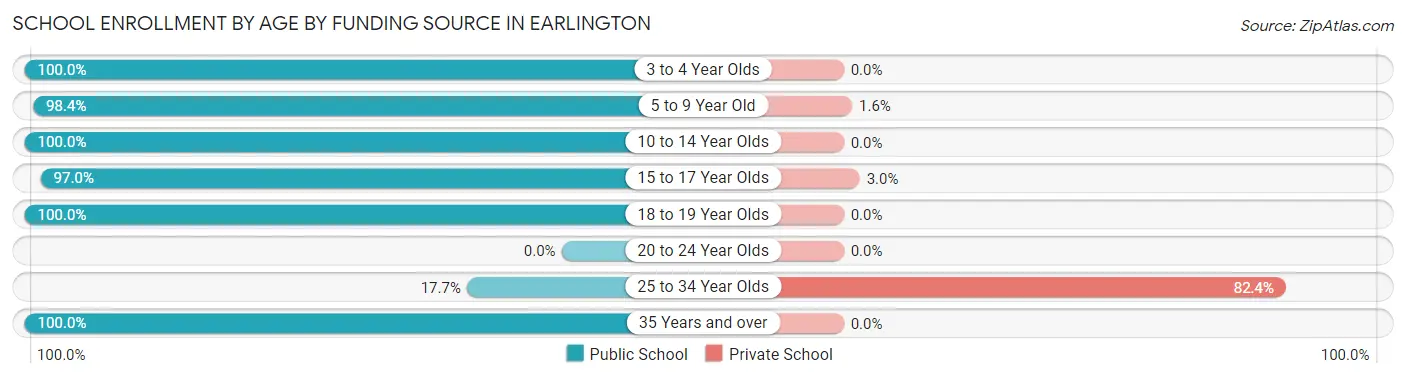
| Age Bracket | Public School | Private School |
| 3 to 4 Year Olds | 6 (100.0%) | 0 (0.0%) |
| 5 to 9 Year Old | 125 (98.4%) | 2 (1.6%) |
| 10 to 14 Year Olds | 94 (100.0%) | 0 (0.0%) |
| 15 to 17 Year Olds | 65 (97.0%) | 2 (3.0%) |
| 18 to 19 Year Olds | 14 (100.0%) | 0 (0.0%) |
| 20 to 24 Year Olds | 0 (0.0%) | 0 (0.0%) |
| 25 to 34 Year Olds | 3 (17.6%) | 14 (82.4%) |
| 35 Years and over | 15 (100.0%) | 0 (0.0%) |
| Total | 322 (94.7%) | 18 (5.3%) |
Educational Attainment by Field of Study in Earlington
Business (15 | 22.7%), education (15 | 22.7%), computers & mathematics (11 | 16.7%), engineering (9 | 13.6%), and liberal arts & history (6 | 9.1%) are the most common fields of study among 66 individuals in Earlington who have obtained a bachelor's degree or higher.
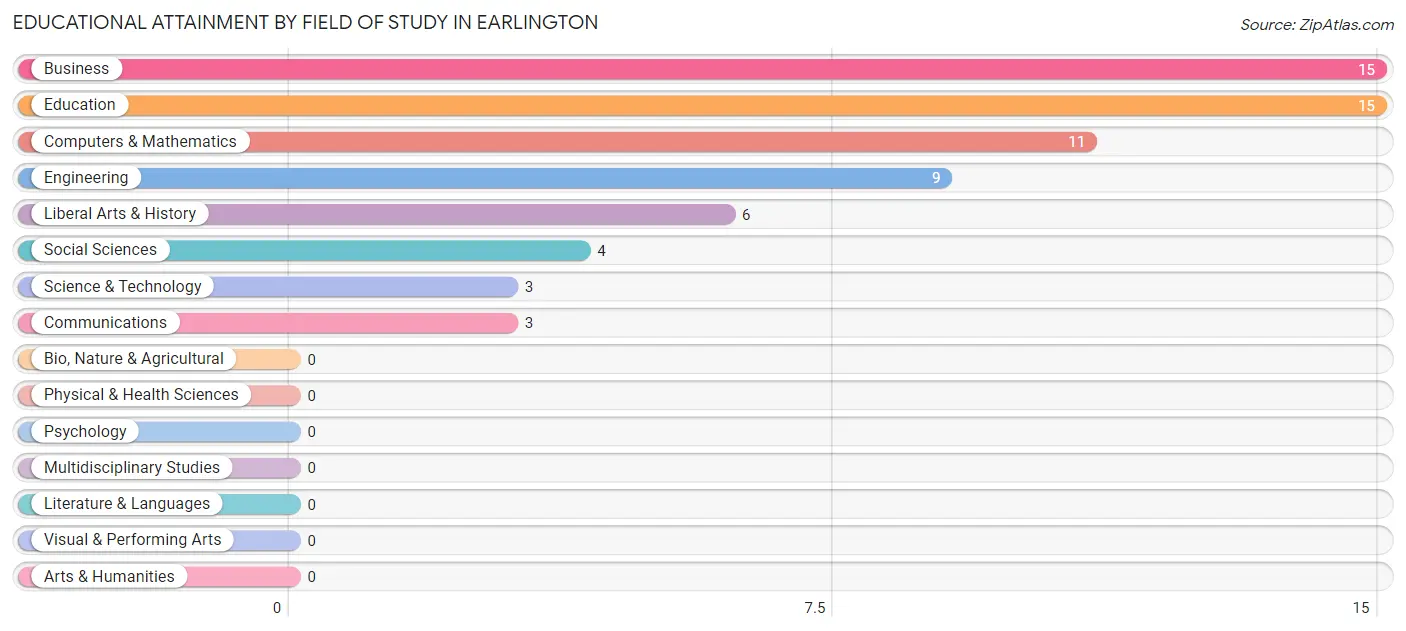
| Field of Study | # Graduates | % Graduates |
| Computers & Mathematics | 11 | 16.7% |
| Bio, Nature & Agricultural | 0 | 0.0% |
| Physical & Health Sciences | 0 | 0.0% |
| Psychology | 0 | 0.0% |
| Social Sciences | 4 | 6.1% |
| Engineering | 9 | 13.6% |
| Multidisciplinary Studies | 0 | 0.0% |
| Science & Technology | 3 | 4.5% |
| Business | 15 | 22.7% |
| Education | 15 | 22.7% |
| Literature & Languages | 0 | 0.0% |
| Liberal Arts & History | 6 | 9.1% |
| Visual & Performing Arts | 0 | 0.0% |
| Communications | 3 | 4.5% |
| Arts & Humanities | 0 | 0.0% |
| Total | 66 | 100.0% |
Transportation & Commute in Earlington
Vehicle Availability by Sex in Earlington
The most prevalent vehicle ownership categories in Earlington are males with 2 vehicles (103, accounting for 40.1%) and females with 2 vehicles (102, making up 43.3%).
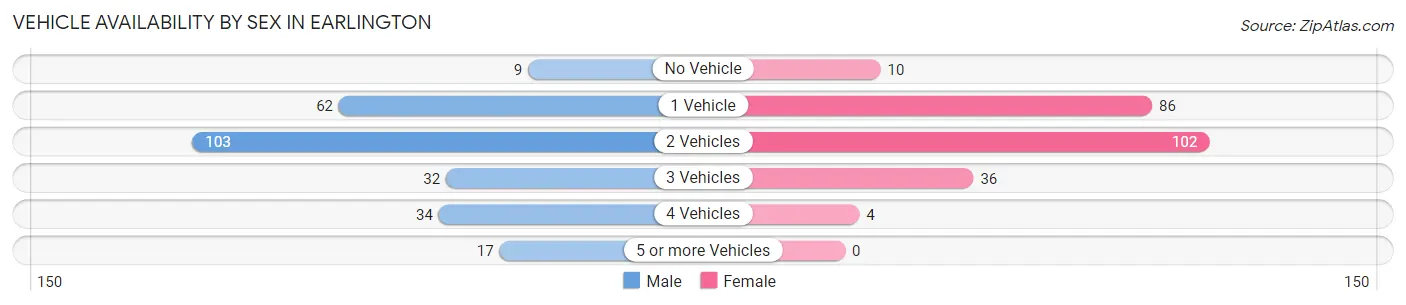
| Vehicles Available | Male | Female |
| No Vehicle | 9 (3.5%) | 10 (4.2%) |
| 1 Vehicle | 62 (24.1%) | 86 (36.1%) |
| 2 Vehicles | 103 (40.1%) | 102 (42.9%) |
| 3 Vehicles | 32 (12.4%) | 36 (15.1%) |
| 4 Vehicles | 34 (13.2%) | 4 (1.7%) |
| 5 or more Vehicles | 17 (6.6%) | 0 (0.0%) |
| Total | 257 (100.0%) | 238 (100.0%) |
Commute Time in Earlington
The most frequently occuring commute durations in Earlington are 15 to 19 minutes (151 commuters, 32.1%), 10 to 14 minutes (120 commuters, 25.5%), and 20 to 24 minutes (43 commuters, 9.1%).
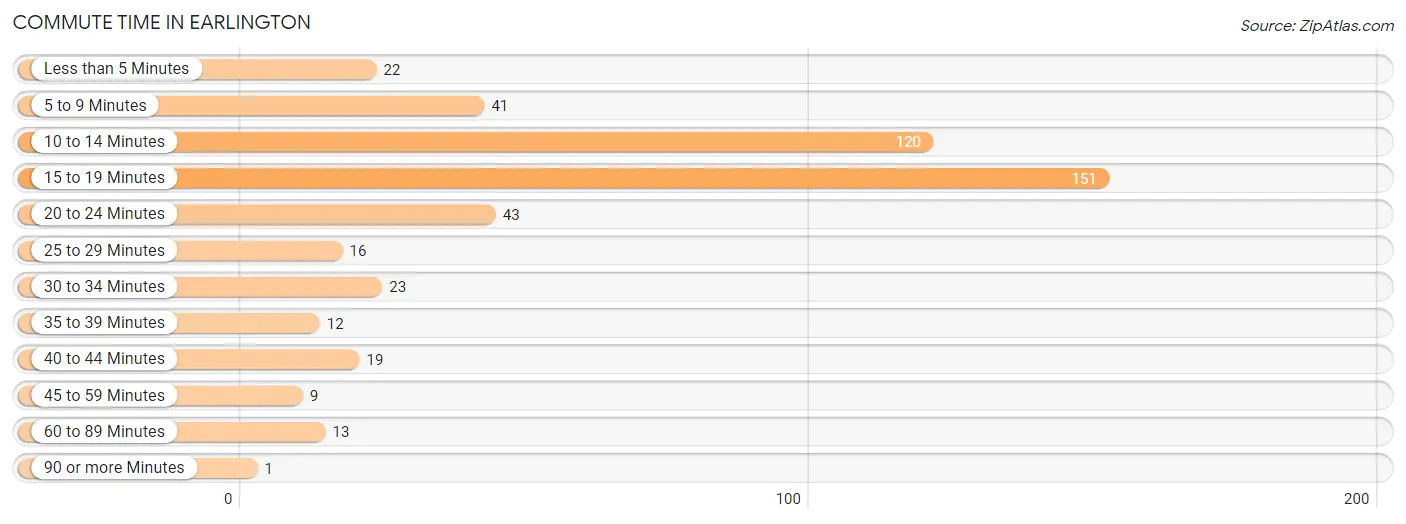
| Commute Time | # Commuters | % Commuters |
| Less than 5 Minutes | 22 | 4.7% |
| 5 to 9 Minutes | 41 | 8.7% |
| 10 to 14 Minutes | 120 | 25.5% |
| 15 to 19 Minutes | 151 | 32.1% |
| 20 to 24 Minutes | 43 | 9.1% |
| 25 to 29 Minutes | 16 | 3.4% |
| 30 to 34 Minutes | 23 | 4.9% |
| 35 to 39 Minutes | 12 | 2.5% |
| 40 to 44 Minutes | 19 | 4.0% |
| 45 to 59 Minutes | 9 | 1.9% |
| 60 to 89 Minutes | 13 | 2.8% |
| 90 or more Minutes | 1 | 0.2% |
Commute Time by Sex in Earlington
The most common commute times in Earlington are 15 to 19 minutes (91 commuters, 38.7%) for males and 10 to 14 minutes (73 commuters, 31.1%) for females.
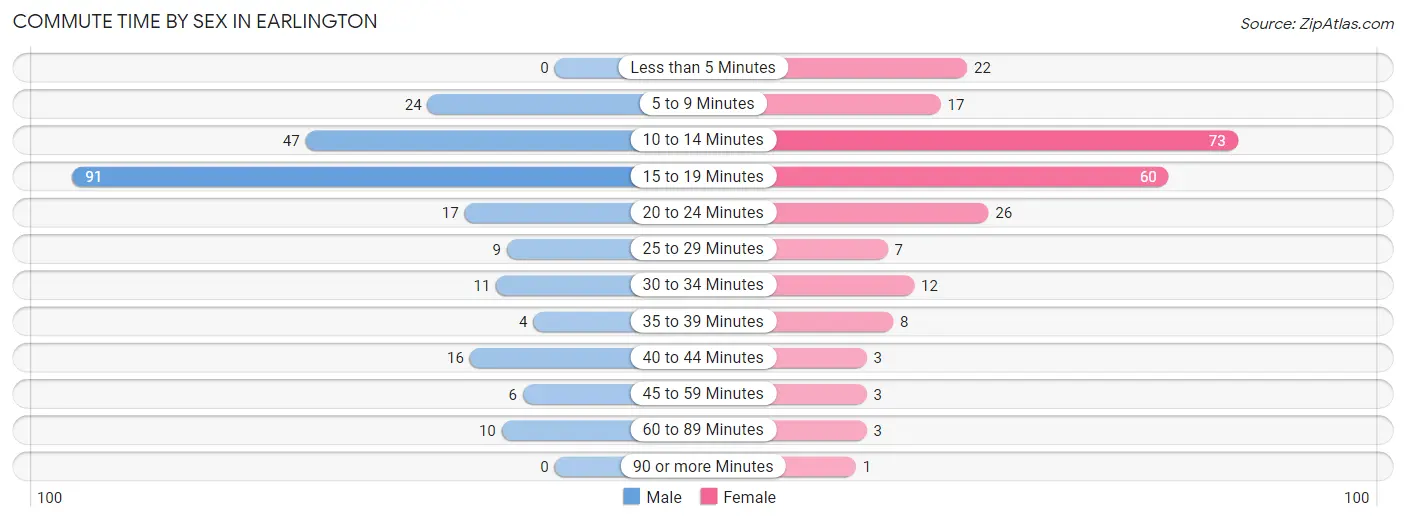
| Commute Time | Male | Female |
| Less than 5 Minutes | 0 (0.0%) | 22 (9.4%) |
| 5 to 9 Minutes | 24 (10.2%) | 17 (7.2%) |
| 10 to 14 Minutes | 47 (20.0%) | 73 (31.1%) |
| 15 to 19 Minutes | 91 (38.7%) | 60 (25.5%) |
| 20 to 24 Minutes | 17 (7.2%) | 26 (11.1%) |
| 25 to 29 Minutes | 9 (3.8%) | 7 (3.0%) |
| 30 to 34 Minutes | 11 (4.7%) | 12 (5.1%) |
| 35 to 39 Minutes | 4 (1.7%) | 8 (3.4%) |
| 40 to 44 Minutes | 16 (6.8%) | 3 (1.3%) |
| 45 to 59 Minutes | 6 (2.5%) | 3 (1.3%) |
| 60 to 89 Minutes | 10 (4.3%) | 3 (1.3%) |
| 90 or more Minutes | 0 (0.0%) | 1 (0.4%) |
Time of Departure to Work by Sex in Earlington
The most frequent times of departure to work in Earlington are 6:30 AM to 6:59 AM (40, 17.0%) for males and 5:00 AM to 5:29 AM (31, 13.2%) for females.
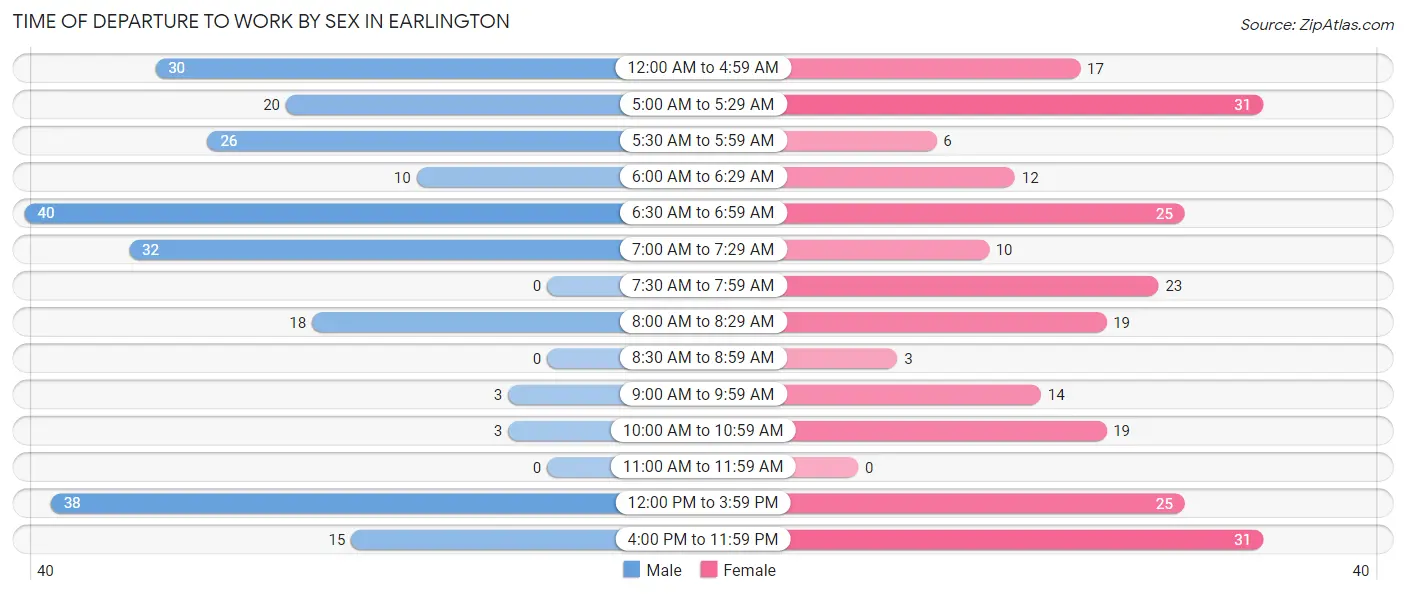
| Time of Departure | Male | Female |
| 12:00 AM to 4:59 AM | 30 (12.8%) | 17 (7.2%) |
| 5:00 AM to 5:29 AM | 20 (8.5%) | 31 (13.2%) |
| 5:30 AM to 5:59 AM | 26 (11.1%) | 6 (2.5%) |
| 6:00 AM to 6:29 AM | 10 (4.3%) | 12 (5.1%) |
| 6:30 AM to 6:59 AM | 40 (17.0%) | 25 (10.6%) |
| 7:00 AM to 7:29 AM | 32 (13.6%) | 10 (4.3%) |
| 7:30 AM to 7:59 AM | 0 (0.0%) | 23 (9.8%) |
| 8:00 AM to 8:29 AM | 18 (7.7%) | 19 (8.1%) |
| 8:30 AM to 8:59 AM | 0 (0.0%) | 3 (1.3%) |
| 9:00 AM to 9:59 AM | 3 (1.3%) | 14 (6.0%) |
| 10:00 AM to 10:59 AM | 3 (1.3%) | 19 (8.1%) |
| 11:00 AM to 11:59 AM | 0 (0.0%) | 0 (0.0%) |
| 12:00 PM to 3:59 PM | 38 (16.2%) | 25 (10.6%) |
| 4:00 PM to 11:59 PM | 15 (6.4%) | 31 (13.2%) |
| Total | 235 (100.0%) | 235 (100.0%) |
Housing Occupancy in Earlington
Occupancy by Ownership in Earlington
Of the total 438 dwellings in Earlington, owner-occupied units account for 292 (66.7%), while renter-occupied units make up 146 (33.3%).
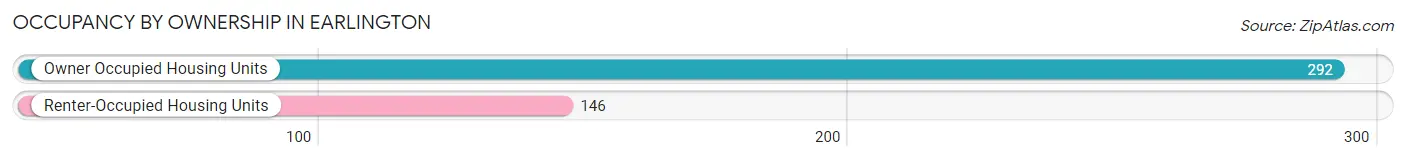
| Occupancy | # Housing Units | % Housing Units |
| Owner Occupied Housing Units | 292 | 66.7% |
| Renter-Occupied Housing Units | 146 | 33.3% |
| Total Occupied Housing Units | 438 | 100.0% |
Occupancy by Household Size in Earlington
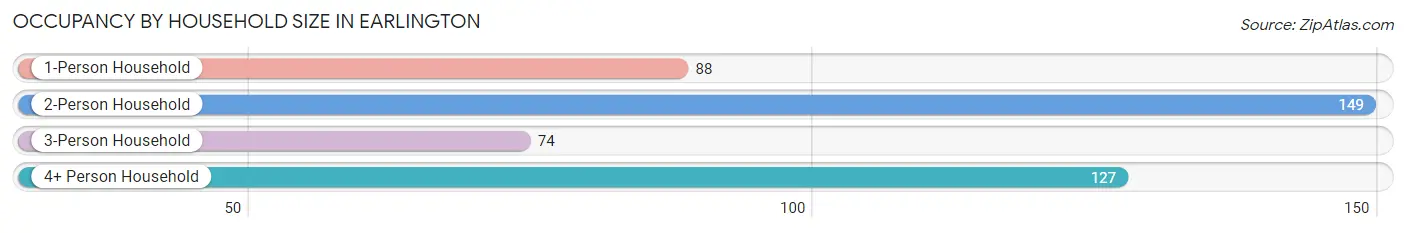
| Household Size | # Housing Units | % Housing Units |
| 1-Person Household | 88 | 20.1% |
| 2-Person Household | 149 | 34.0% |
| 3-Person Household | 74 | 16.9% |
| 4+ Person Household | 127 | 29.0% |
| Total Housing Units | 438 | 100.0% |
Occupancy by Ownership by Household Size in Earlington
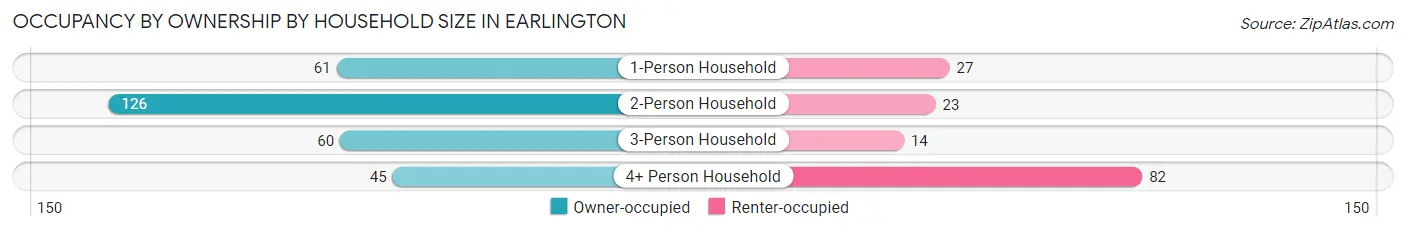
| Household Size | Owner-occupied | Renter-occupied |
| 1-Person Household | 61 (69.3%) | 27 (30.7%) |
| 2-Person Household | 126 (84.6%) | 23 (15.4%) |
| 3-Person Household | 60 (81.1%) | 14 (18.9%) |
| 4+ Person Household | 45 (35.4%) | 82 (64.6%) |
| Total Housing Units | 292 (66.7%) | 146 (33.3%) |
Occupancy by Educational Attainment in Earlington
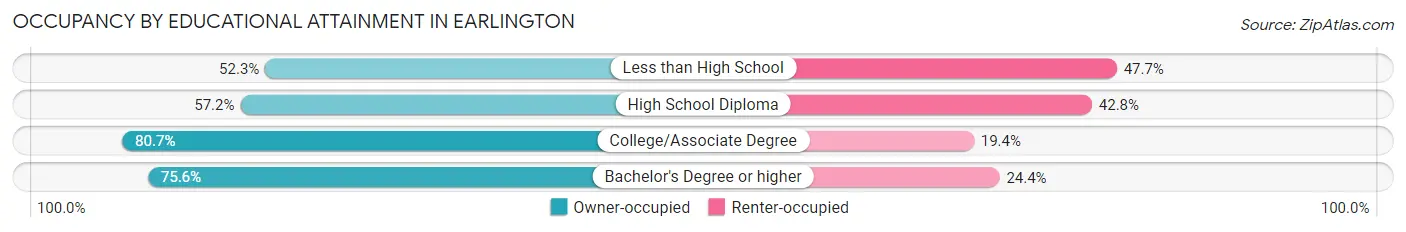
| Household Size | Owner-occupied | Renter-occupied |
| Less than High School | 34 (52.3%) | 31 (47.7%) |
| High School Diploma | 99 (57.2%) | 74 (42.8%) |
| College/Associate Degree | 125 (80.6%) | 30 (19.4%) |
| Bachelor's Degree or higher | 34 (75.6%) | 11 (24.4%) |
Occupancy by Age of Householder in Earlington
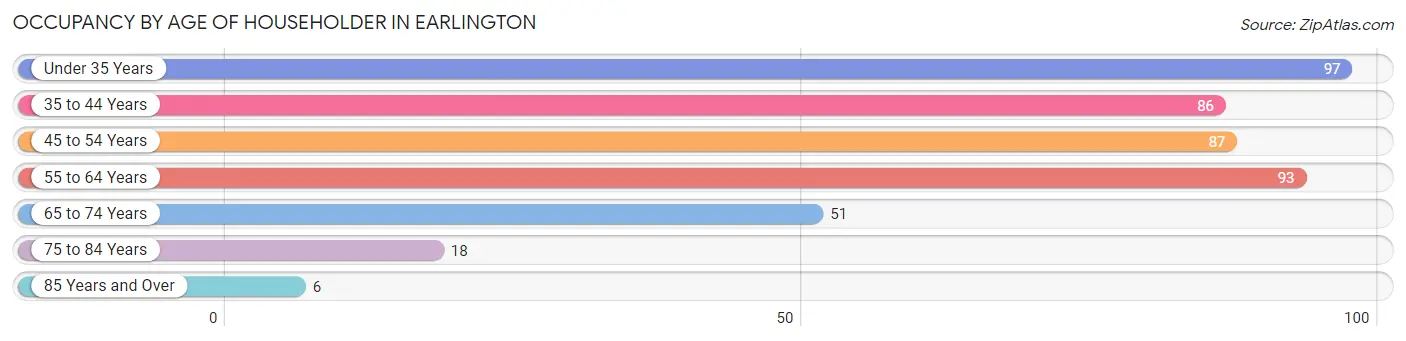
| Age Bracket | # Households | % Households |
| Under 35 Years | 97 | 22.2% |
| 35 to 44 Years | 86 | 19.6% |
| 45 to 54 Years | 87 | 19.9% |
| 55 to 64 Years | 93 | 21.2% |
| 65 to 74 Years | 51 | 11.6% |
| 75 to 84 Years | 18 | 4.1% |
| 85 Years and Over | 6 | 1.4% |
| Total | 438 | 100.0% |
Housing Finances in Earlington
Median Income by Occupancy in Earlington
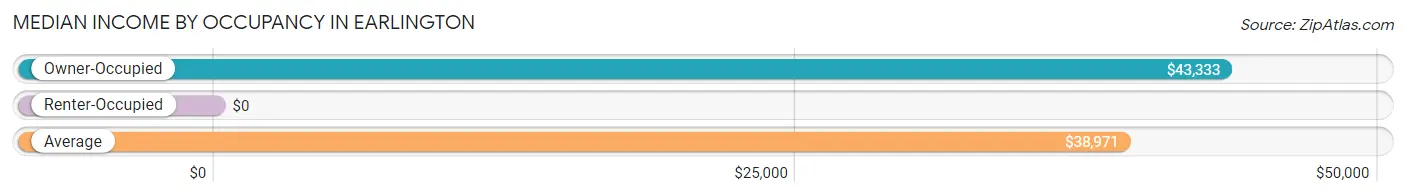
| Occupancy Type | # Households | Median Income |
| Owner-Occupied | 292 (66.7%) | $43,333 |
| Renter-Occupied | 146 (33.3%) | $0 |
| Average | 438 (100.0%) | $38,971 |
Occupancy by Householder Income Bracket in Earlington
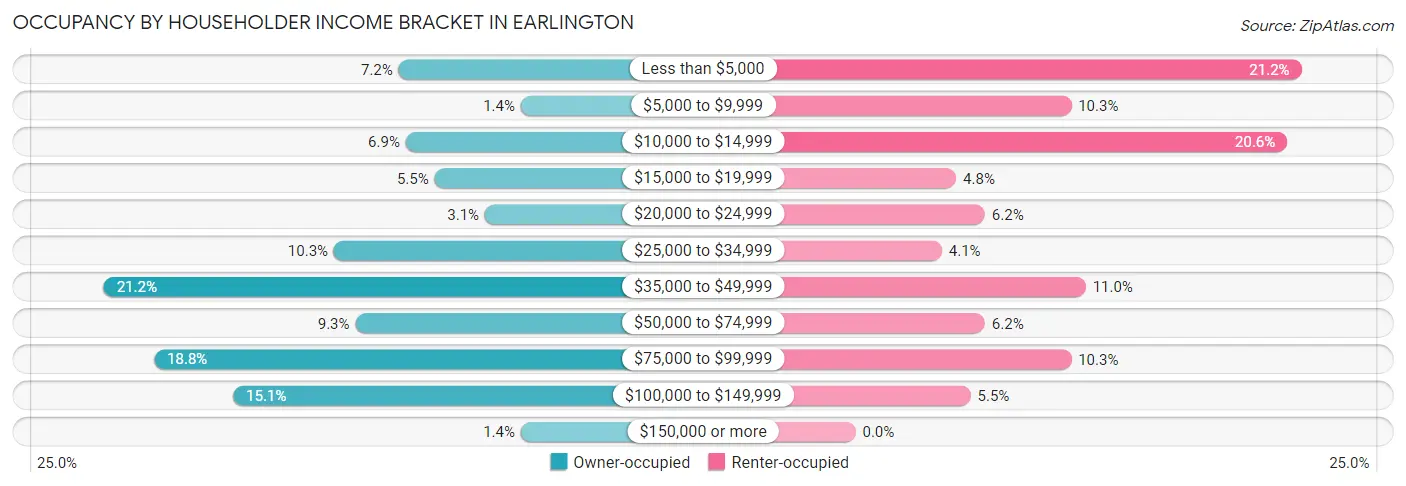
| Income Bracket | Owner-occupied | Renter-occupied |
| Less than $5,000 | 21 (7.2%) | 31 (21.2%) |
| $5,000 to $9,999 | 4 (1.4%) | 15 (10.3%) |
| $10,000 to $14,999 | 20 (6.9%) | 30 (20.5%) |
| $15,000 to $19,999 | 16 (5.5%) | 7 (4.8%) |
| $20,000 to $24,999 | 9 (3.1%) | 9 (6.2%) |
| $25,000 to $34,999 | 30 (10.3%) | 6 (4.1%) |
| $35,000 to $49,999 | 62 (21.2%) | 16 (11.0%) |
| $50,000 to $74,999 | 27 (9.2%) | 9 (6.2%) |
| $75,000 to $99,999 | 55 (18.8%) | 15 (10.3%) |
| $100,000 to $149,999 | 44 (15.1%) | 8 (5.5%) |
| $150,000 or more | 4 (1.4%) | 0 (0.0%) |
| Total | 292 (100.0%) | 146 (100.0%) |
Monthly Housing Cost Tiers in Earlington
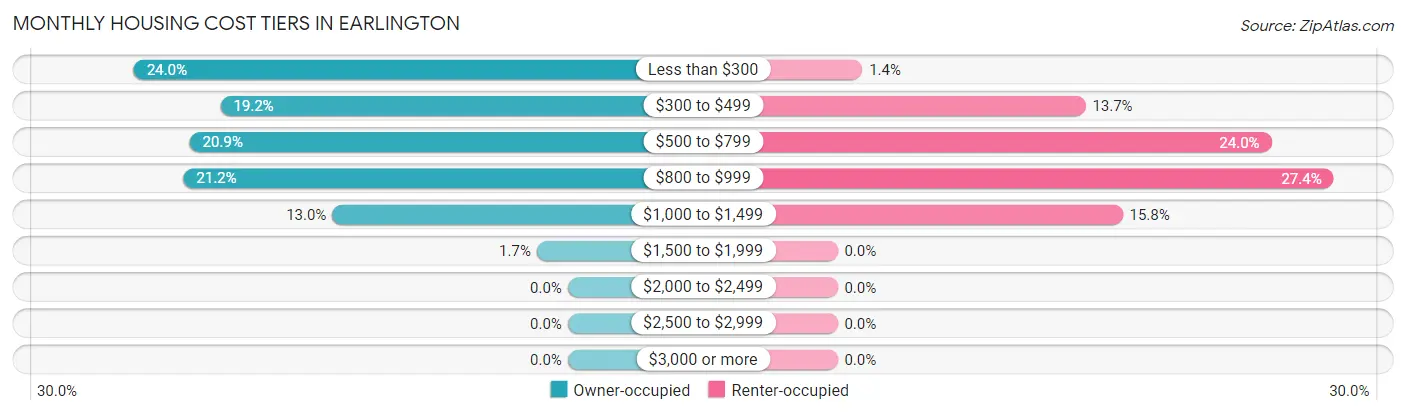
| Monthly Cost | Owner-occupied | Renter-occupied |
| Less than $300 | 70 (24.0%) | 2 (1.4%) |
| $300 to $499 | 56 (19.2%) | 20 (13.7%) |
| $500 to $799 | 61 (20.9%) | 35 (24.0%) |
| $800 to $999 | 62 (21.2%) | 40 (27.4%) |
| $1,000 to $1,499 | 38 (13.0%) | 23 (15.8%) |
| $1,500 to $1,999 | 5 (1.7%) | 0 (0.0%) |
| $2,000 to $2,499 | 0 (0.0%) | 0 (0.0%) |
| $2,500 to $2,999 | 0 (0.0%) | 0 (0.0%) |
| $3,000 or more | 0 (0.0%) | 0 (0.0%) |
| Total | 292 (100.0%) | 146 (100.0%) |
Physical Housing Characteristics in Earlington
Housing Structures in Earlington
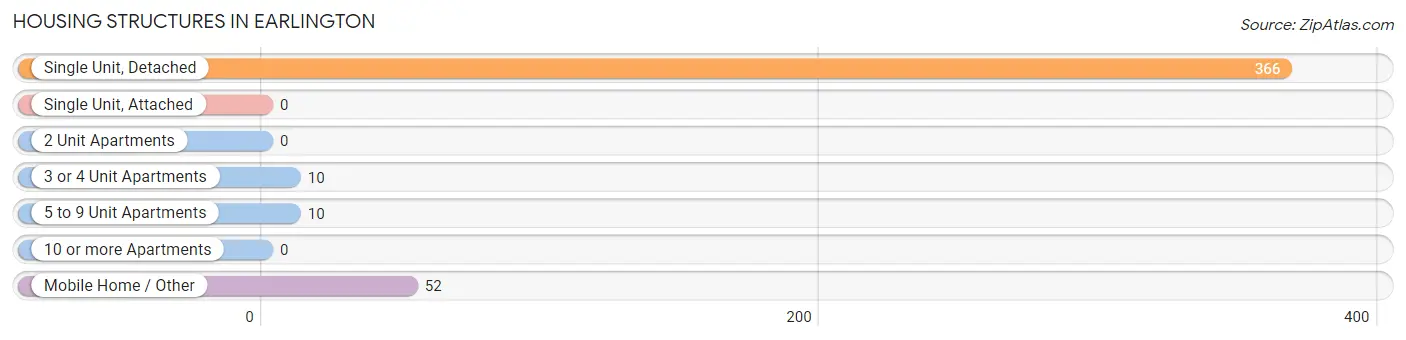
| Structure Type | # Housing Units | % Housing Units |
| Single Unit, Detached | 366 | 83.6% |
| Single Unit, Attached | 0 | 0.0% |
| 2 Unit Apartments | 0 | 0.0% |
| 3 or 4 Unit Apartments | 10 | 2.3% |
| 5 to 9 Unit Apartments | 10 | 2.3% |
| 10 or more Apartments | 0 | 0.0% |
| Mobile Home / Other | 52 | 11.9% |
| Total | 438 | 100.0% |
Housing Structures by Occupancy in Earlington
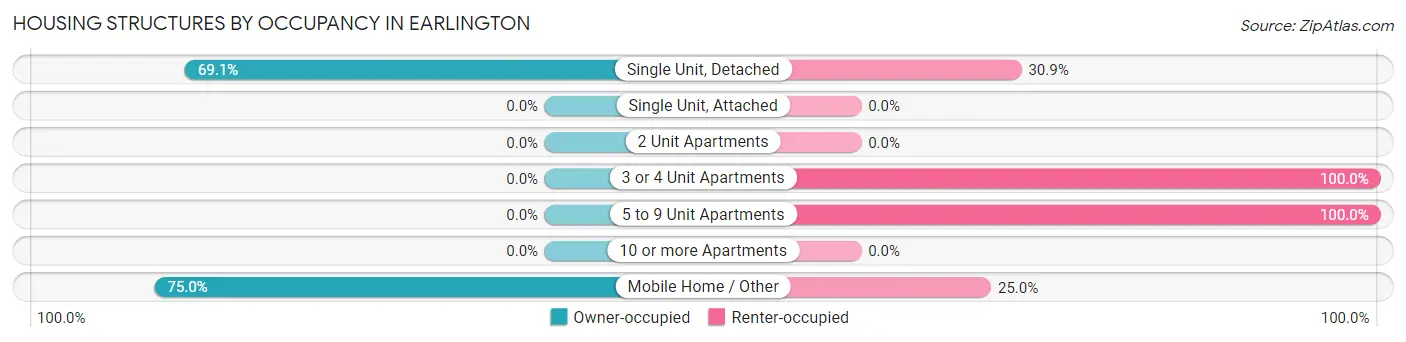
| Structure Type | Owner-occupied | Renter-occupied |
| Single Unit, Detached | 253 (69.1%) | 113 (30.9%) |
| Single Unit, Attached | 0 (0.0%) | 0 (0.0%) |
| 2 Unit Apartments | 0 (0.0%) | 0 (0.0%) |
| 3 or 4 Unit Apartments | 0 (0.0%) | 10 (100.0%) |
| 5 to 9 Unit Apartments | 0 (0.0%) | 10 (100.0%) |
| 10 or more Apartments | 0 (0.0%) | 0 (0.0%) |
| Mobile Home / Other | 39 (75.0%) | 13 (25.0%) |
| Total | 292 (66.7%) | 146 (33.3%) |
Housing Structures by Number of Rooms in Earlington
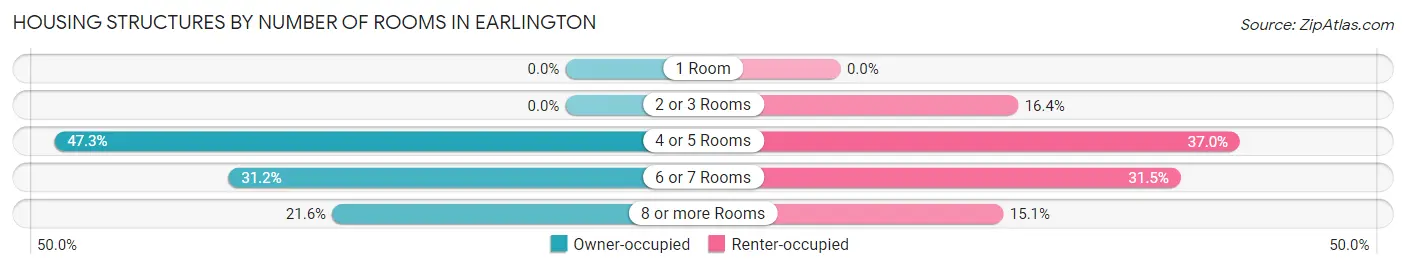
| Number of Rooms | Owner-occupied | Renter-occupied |
| 1 Room | 0 (0.0%) | 0 (0.0%) |
| 2 or 3 Rooms | 0 (0.0%) | 24 (16.4%) |
| 4 or 5 Rooms | 138 (47.3%) | 54 (37.0%) |
| 6 or 7 Rooms | 91 (31.2%) | 46 (31.5%) |
| 8 or more Rooms | 63 (21.6%) | 22 (15.1%) |
| Total | 292 (100.0%) | 146 (100.0%) |
Housing Structure by Heating Type in Earlington
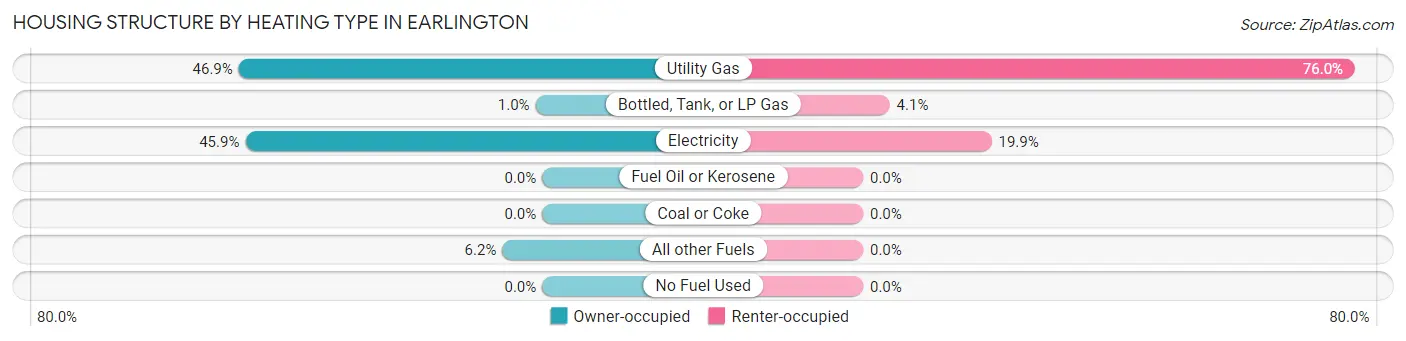
| Heating Type | Owner-occupied | Renter-occupied |
| Utility Gas | 137 (46.9%) | 111 (76.0%) |
| Bottled, Tank, or LP Gas | 3 (1.0%) | 6 (4.1%) |
| Electricity | 134 (45.9%) | 29 (19.9%) |
| Fuel Oil or Kerosene | 0 (0.0%) | 0 (0.0%) |
| Coal or Coke | 0 (0.0%) | 0 (0.0%) |
| All other Fuels | 18 (6.2%) | 0 (0.0%) |
| No Fuel Used | 0 (0.0%) | 0 (0.0%) |
| Total | 292 (100.0%) | 146 (100.0%) |
Household Vehicle Usage in Earlington
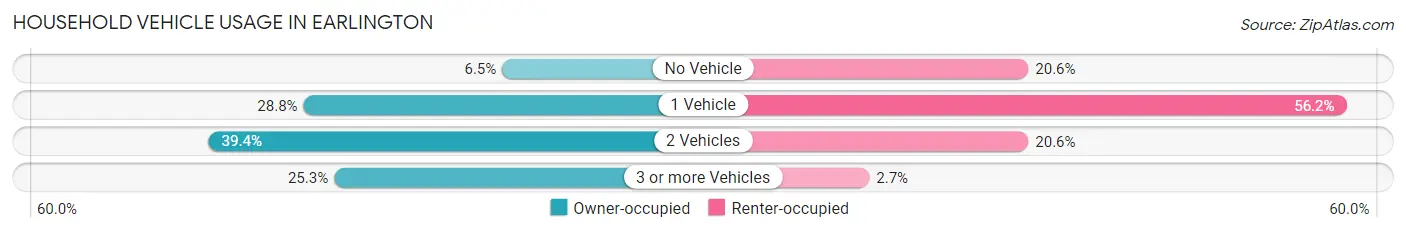
| Vehicles per Household | Owner-occupied | Renter-occupied |
| No Vehicle | 19 (6.5%) | 30 (20.5%) |
| 1 Vehicle | 84 (28.8%) | 82 (56.2%) |
| 2 Vehicles | 115 (39.4%) | 30 (20.5%) |
| 3 or more Vehicles | 74 (25.3%) | 4 (2.7%) |
| Total | 292 (100.0%) | 146 (100.0%) |
Real Estate & Mortgages in Earlington
Real Estate and Mortgage Overview in Earlington
| Characteristic | Without Mortgage | With Mortgage |
| Housing Units | 170 | 122 |
| Median Property Value | $34,800 | $78,600 |
| Median Household Income | $38,409 | $4 |
| Monthly Housing Costs | $426 | $0 |
| Real Estate Taxes | $348 | $16 |
Property Value by Mortgage Status in Earlington
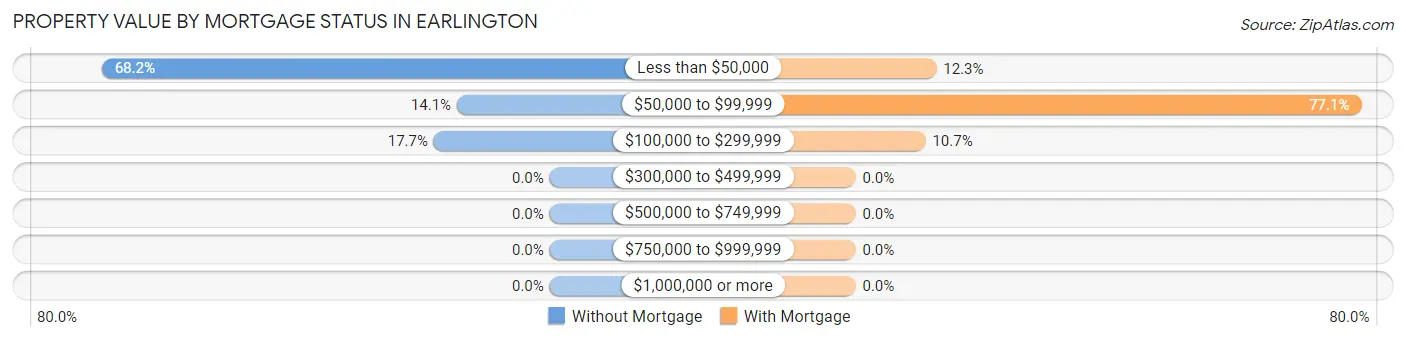
| Property Value | Without Mortgage | With Mortgage |
| Less than $50,000 | 116 (68.2%) | 15 (12.3%) |
| $50,000 to $99,999 | 24 (14.1%) | 94 (77.0%) |
| $100,000 to $299,999 | 30 (17.6%) | 13 (10.7%) |
| $300,000 to $499,999 | 0 (0.0%) | 0 (0.0%) |
| $500,000 to $749,999 | 0 (0.0%) | 0 (0.0%) |
| $750,000 to $999,999 | 0 (0.0%) | 0 (0.0%) |
| $1,000,000 or more | 0 (0.0%) | 0 (0.0%) |
| Total | 170 (100.0%) | 122 (100.0%) |
Household Income by Mortgage Status in Earlington
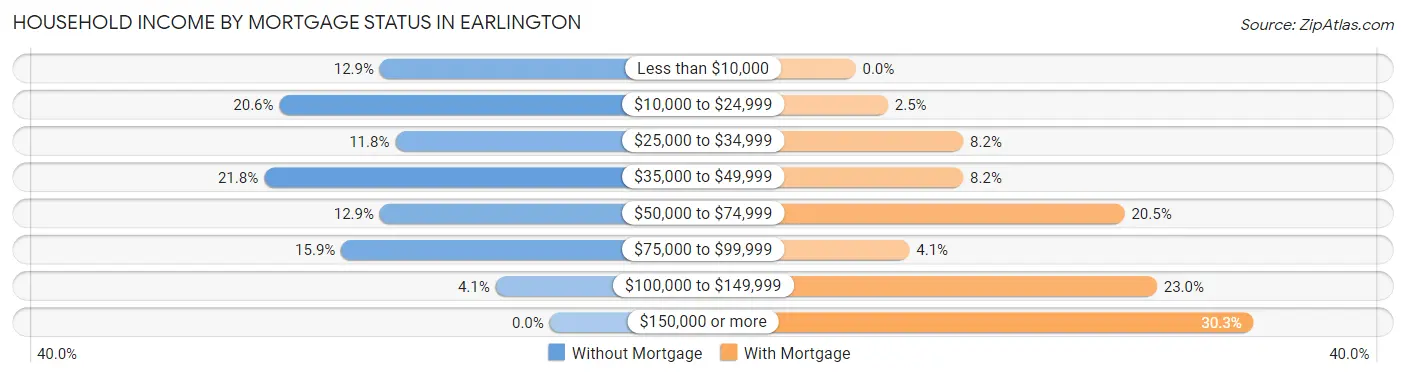
| Household Income | Without Mortgage | With Mortgage |
| Less than $10,000 | 22 (12.9%) | 0 (0.0%) |
| $10,000 to $24,999 | 35 (20.6%) | 3 (2.5%) |
| $25,000 to $34,999 | 20 (11.8%) | 10 (8.2%) |
| $35,000 to $49,999 | 37 (21.8%) | 10 (8.2%) |
| $50,000 to $74,999 | 22 (12.9%) | 25 (20.5%) |
| $75,000 to $99,999 | 27 (15.9%) | 5 (4.1%) |
| $100,000 to $149,999 | 7 (4.1%) | 28 (23.0%) |
| $150,000 or more | 0 (0.0%) | 37 (30.3%) |
| Total | 170 (100.0%) | 122 (100.0%) |
Property Value to Household Income Ratio in Earlington
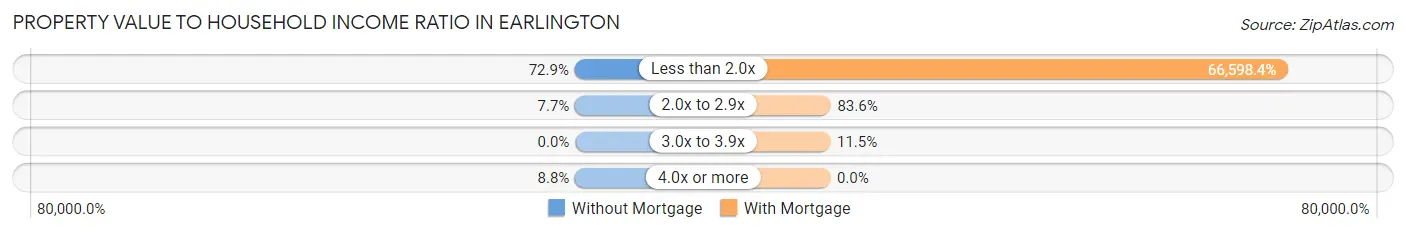
| Value-to-Income Ratio | Without Mortgage | With Mortgage |
| Less than 2.0x | 124 (72.9%) | 81,250 (66,598.4%) |
| 2.0x to 2.9x | 13 (7.6%) | 102 (83.6%) |
| 3.0x to 3.9x | 0 (0.0%) | 14 (11.5%) |
| 4.0x or more | 15 (8.8%) | 0 (0.0%) |
| Total | 170 (100.0%) | 122 (100.0%) |
Real Estate Taxes by Mortgage Status in Earlington
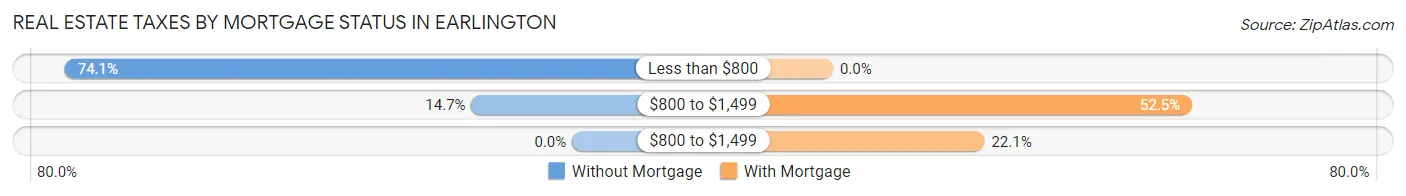
| Property Taxes | Without Mortgage | With Mortgage |
| Less than $800 | 126 (74.1%) | 0 (0.0%) |
| $800 to $1,499 | 25 (14.7%) | 64 (52.5%) |
| $800 to $1,499 | 0 (0.0%) | 27 (22.1%) |
| Total | 170 (100.0%) | 122 (100.0%) |
Health & Disability in Earlington
Health Insurance Coverage by Age in Earlington
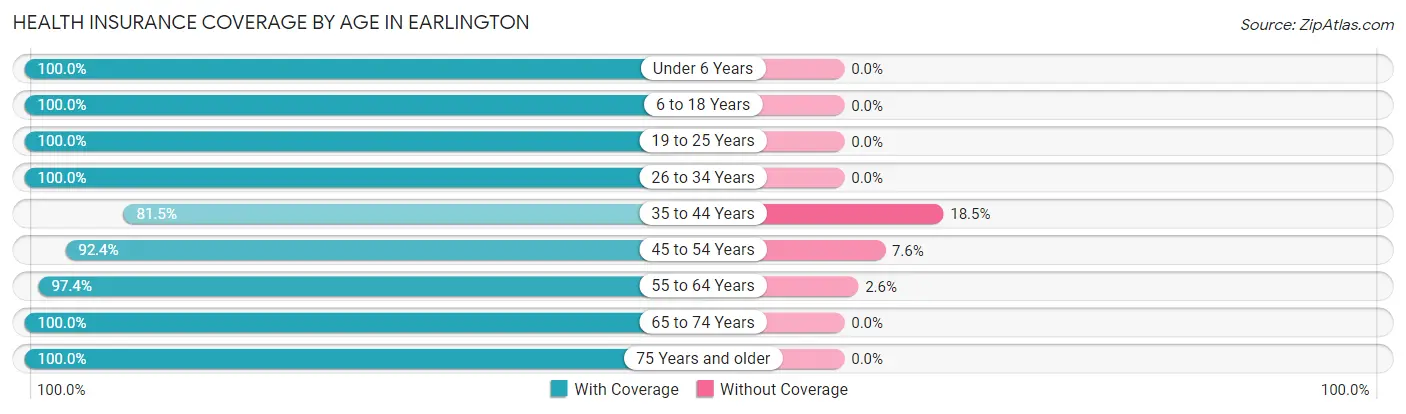
| Age Bracket | With Coverage | Without Coverage |
| Under 6 Years | 63 (100.0%) | 0 (0.0%) |
| 6 to 18 Years | 291 (100.0%) | 0 (0.0%) |
| 19 to 25 Years | 130 (100.0%) | 0 (0.0%) |
| 26 to 34 Years | 115 (100.0%) | 0 (0.0%) |
| 35 to 44 Years | 159 (81.5%) | 36 (18.5%) |
| 45 to 54 Years | 146 (92.4%) | 12 (7.6%) |
| 55 to 64 Years | 150 (97.4%) | 4 (2.6%) |
| 65 to 74 Years | 89 (100.0%) | 0 (0.0%) |
| 75 Years and older | 24 (100.0%) | 0 (0.0%) |
| Total | 1,167 (95.7%) | 52 (4.3%) |
Health Insurance Coverage by Citizenship Status in Earlington
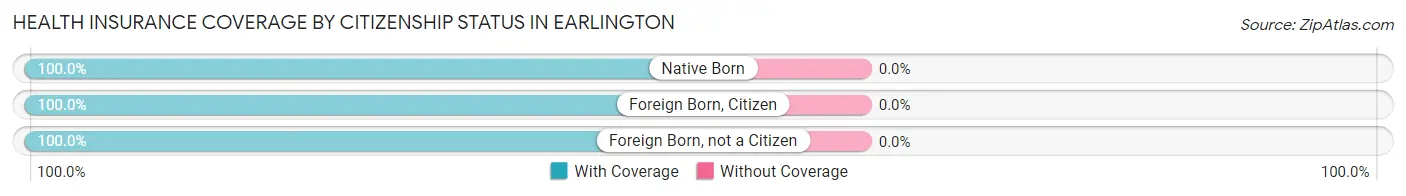
| Citizenship Status | With Coverage | Without Coverage |
| Native Born | 63 (100.0%) | 0 (0.0%) |
| Foreign Born, Citizen | 291 (100.0%) | 0 (0.0%) |
| Foreign Born, not a Citizen | 130 (100.0%) | 0 (0.0%) |
Health Insurance Coverage by Household Income in Earlington
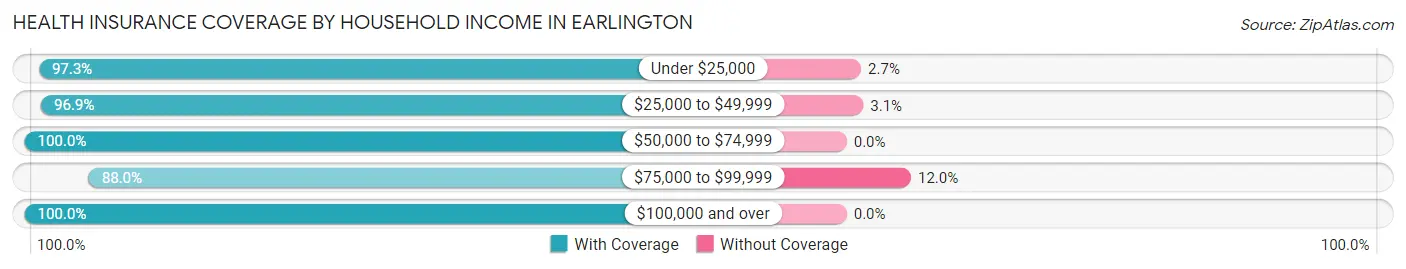
| Household Income | With Coverage | Without Coverage |
| Under $25,000 | 398 (97.3%) | 11 (2.7%) |
| $25,000 to $49,999 | 250 (96.9%) | 8 (3.1%) |
| $50,000 to $74,999 | 95 (100.0%) | 0 (0.0%) |
| $75,000 to $99,999 | 241 (88.0%) | 33 (12.0%) |
| $100,000 and over | 183 (100.0%) | 0 (0.0%) |
Public vs Private Health Insurance Coverage by Age in Earlington
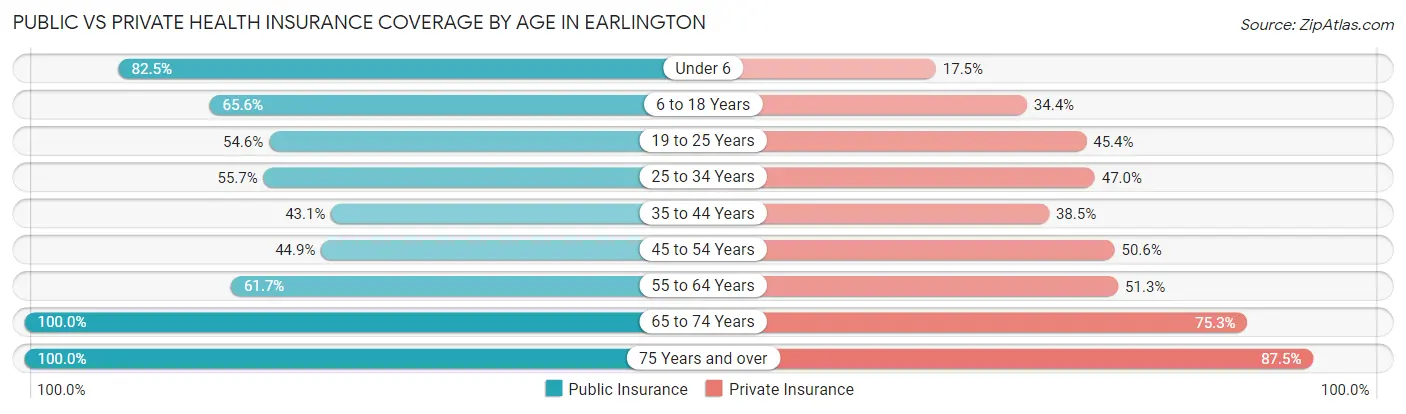
| Age Bracket | Public Insurance | Private Insurance |
| Under 6 | 52 (82.5%) | 11 (17.5%) |
| 6 to 18 Years | 191 (65.6%) | 100 (34.4%) |
| 19 to 25 Years | 71 (54.6%) | 59 (45.4%) |
| 25 to 34 Years | 64 (55.6%) | 54 (47.0%) |
| 35 to 44 Years | 84 (43.1%) | 75 (38.5%) |
| 45 to 54 Years | 71 (44.9%) | 80 (50.6%) |
| 55 to 64 Years | 95 (61.7%) | 79 (51.3%) |
| 65 to 74 Years | 89 (100.0%) | 67 (75.3%) |
| 75 Years and over | 24 (100.0%) | 21 (87.5%) |
| Total | 741 (60.8%) | 546 (44.8%) |
Disability Status by Sex by Age in Earlington
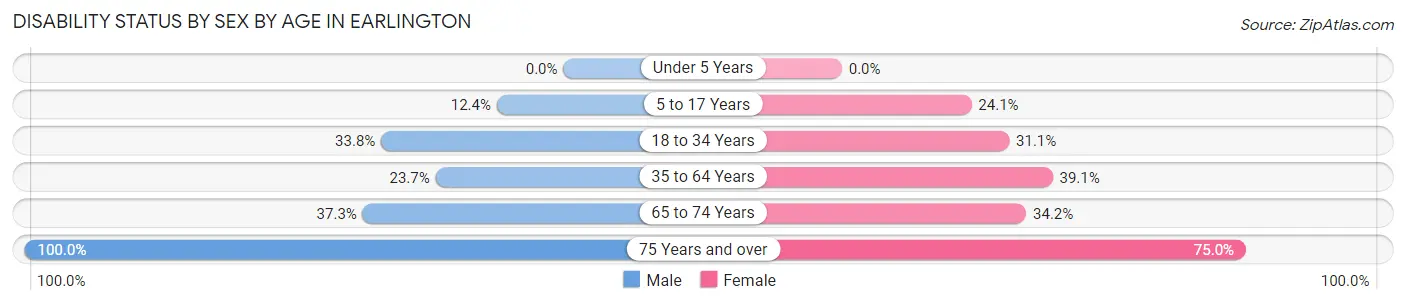
| Age Bracket | Male | Female |
| Under 5 Years | 0 (0.0%) | 0 (0.0%) |
| 5 to 17 Years | 10 (12.3%) | 51 (24.1%) |
| 18 to 34 Years | 46 (33.8%) | 41 (31.1%) |
| 35 to 64 Years | 56 (23.7%) | 106 (39.1%) |
| 65 to 74 Years | 19 (37.2%) | 13 (34.2%) |
| 75 Years and over | 12 (100.0%) | 9 (75.0%) |
Disability Class by Sex by Age in Earlington
Disability Class: Hearing Difficulty
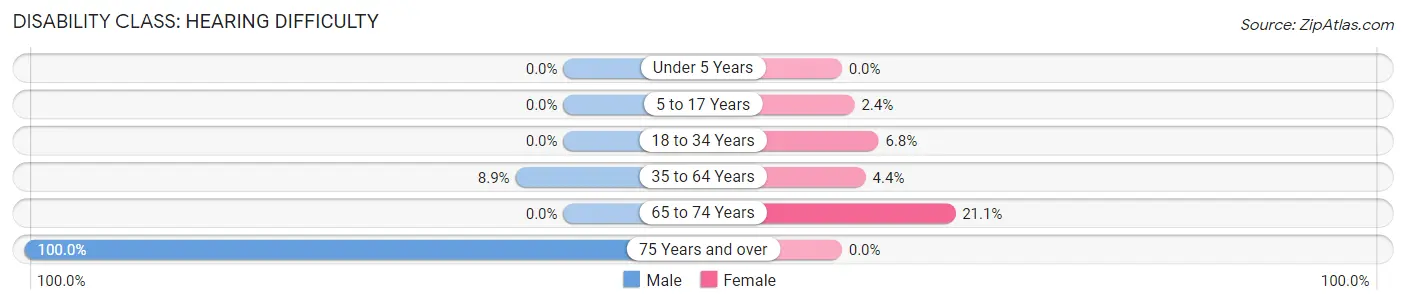
| Age Bracket | Male | Female |
| Under 5 Years | 0 (0.0%) | 0 (0.0%) |
| 5 to 17 Years | 0 (0.0%) | 5 (2.4%) |
| 18 to 34 Years | 0 (0.0%) | 9 (6.8%) |
| 35 to 64 Years | 21 (8.9%) | 12 (4.4%) |
| 65 to 74 Years | 0 (0.0%) | 8 (21.0%) |
| 75 Years and over | 12 (100.0%) | 0 (0.0%) |
Disability Class: Vision Difficulty
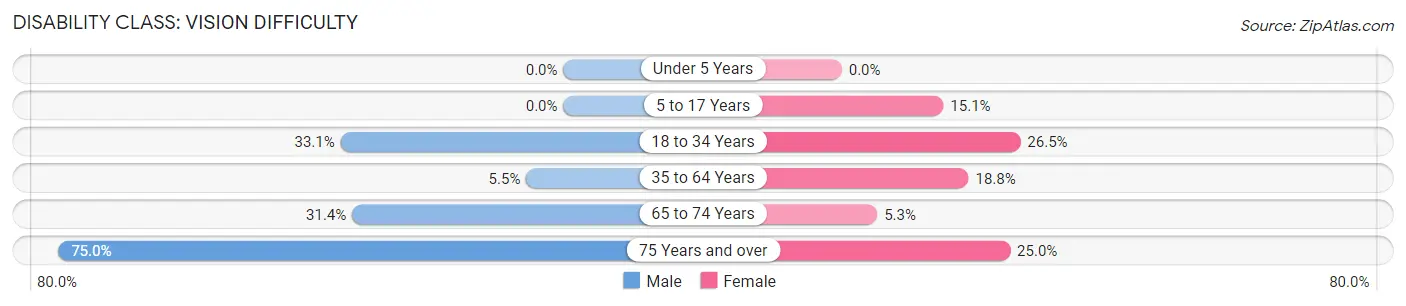
| Age Bracket | Male | Female |
| Under 5 Years | 0 (0.0%) | 0 (0.0%) |
| 5 to 17 Years | 0 (0.0%) | 32 (15.1%) |
| 18 to 34 Years | 45 (33.1%) | 35 (26.5%) |
| 35 to 64 Years | 13 (5.5%) | 51 (18.8%) |
| 65 to 74 Years | 16 (31.4%) | 2 (5.3%) |
| 75 Years and over | 9 (75.0%) | 3 (25.0%) |
Disability Class: Cognitive Difficulty
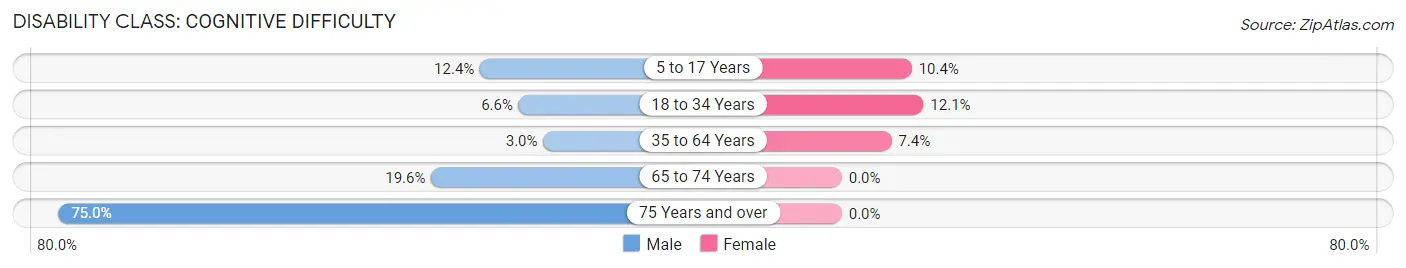
| Age Bracket | Male | Female |
| 5 to 17 Years | 10 (12.3%) | 22 (10.4%) |
| 18 to 34 Years | 9 (6.6%) | 16 (12.1%) |
| 35 to 64 Years | 7 (3.0%) | 20 (7.4%) |
| 65 to 74 Years | 10 (19.6%) | 0 (0.0%) |
| 75 Years and over | 9 (75.0%) | 0 (0.0%) |
Disability Class: Ambulatory Difficulty
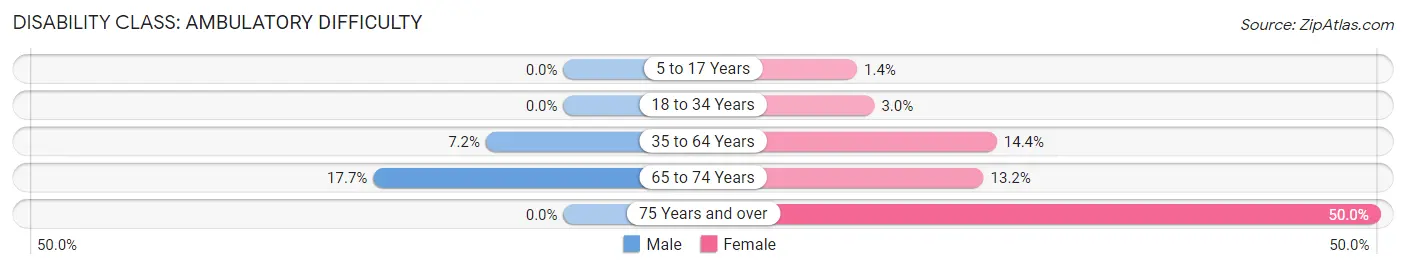
| Age Bracket | Male | Female |
| 5 to 17 Years | 0 (0.0%) | 3 (1.4%) |
| 18 to 34 Years | 0 (0.0%) | 4 (3.0%) |
| 35 to 64 Years | 17 (7.2%) | 39 (14.4%) |
| 65 to 74 Years | 9 (17.6%) | 5 (13.2%) |
| 75 Years and over | 0 (0.0%) | 6 (50.0%) |
Disability Class: Self-Care Difficulty
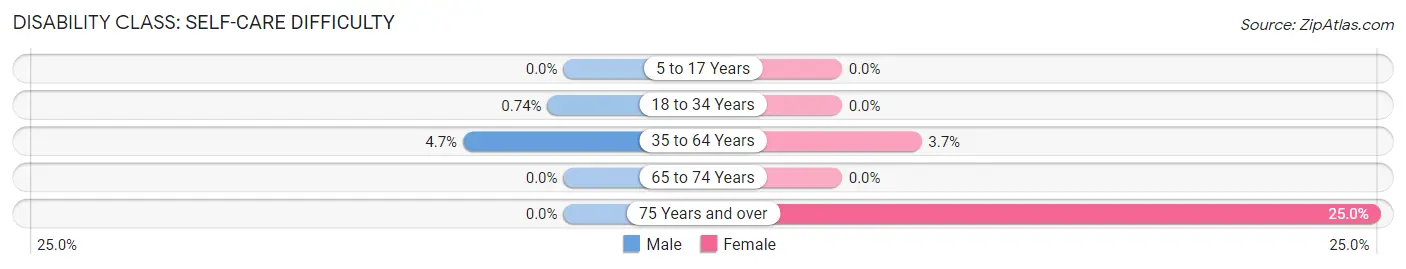
| Age Bracket | Male | Female |
| 5 to 17 Years | 0 (0.0%) | 0 (0.0%) |
| 18 to 34 Years | 1 (0.7%) | 0 (0.0%) |
| 35 to 64 Years | 11 (4.7%) | 10 (3.7%) |
| 65 to 74 Years | 0 (0.0%) | 0 (0.0%) |
| 75 Years and over | 0 (0.0%) | 3 (25.0%) |
Technology Access in Earlington
Computing Device Access in Earlington
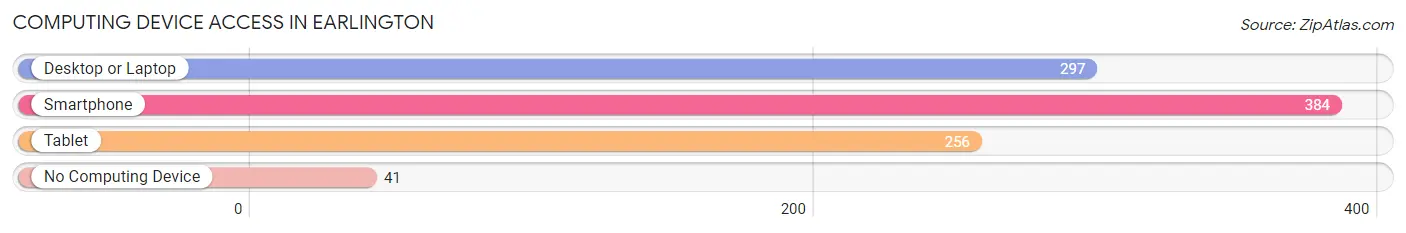
| Device Type | # Households | % Households |
| Desktop or Laptop | 297 | 67.8% |
| Smartphone | 384 | 87.7% |
| Tablet | 256 | 58.5% |
| No Computing Device | 41 | 9.4% |
| Total | 438 | 100.0% |
Internet Access in Earlington
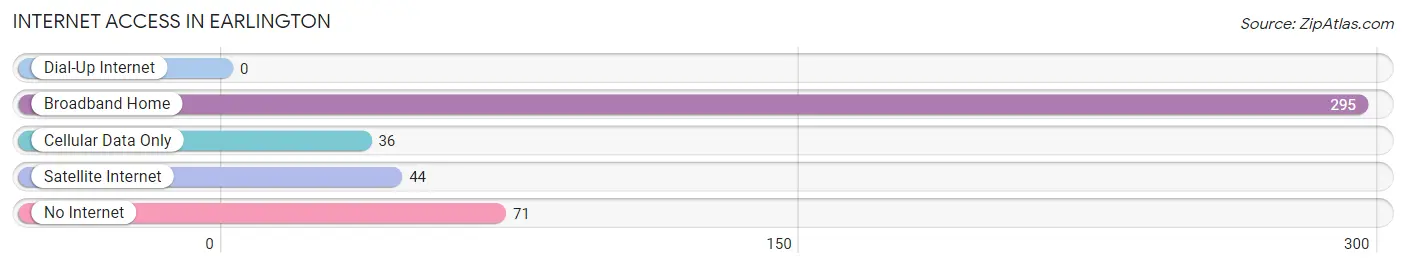
| Internet Type | # Households | % Households |
| Dial-Up Internet | 0 | 0.0% |
| Broadband Home | 295 | 67.3% |
| Cellular Data Only | 36 | 8.2% |
| Satellite Internet | 44 | 10.1% |
| No Internet | 71 | 16.2% |
| Total | 438 | 100.0% |
Earlington Summary
Earlington, Kentucky is a small city located in Hopkins County, Kentucky. It is situated on the banks of the Green River and is part of the Madisonville-Hopkins County Metropolitan Statistical Area. The city has a population of 1,845 as of the 2010 census.
History
Earlington was founded in 1883 by the Louisville and Nashville Railroad. The city was named after William Earlington, a railroad official. The city was incorporated in 1891 and was a major coal mining center in the early 20th century. The city was also home to the Earlington Coal Mine, which was the largest coal mine in the world at the time. The mine closed in the 1950s and the city has since shifted to a more service-oriented economy.
Geography
Earlington is located at 37°20'25"N 87°20'45"W (37.340278, -87.345833). The city has a total area of 1.2 square miles, all of which is land. The city is located on the banks of the Green River and is part of the Madisonville-Hopkins County Metropolitan Statistical Area.
Economy
Earlington’s economy is largely service-oriented. The city is home to several small businesses, including restaurants, retail stores, and professional services. The city is also home to a number of manufacturing companies, including a paper mill and a plastics factory. The city is also home to a number of healthcare facilities, including a hospital and several nursing homes.
Demographics
As of the 2010 census, Earlington had a population of 1,845. The racial makeup of the city was 95.2% White, 2.2% African American, 0.3% Native American, 0.2% Asian, 0.1% Pacific Islander, 0.7% from other races, and 1.3% from two or more races. Hispanic or Latino of any race were 1.7% of the population.
The median income for a household in the city was $30,938, and the median income for a family was $37,917. The per capita income for the city was $17,845. About 17.2% of families and 20.2% of the population were below the poverty line, including 28.3% of those under age 18 and 16.2% of those age 65 or over.
Earlington is served by the Hopkins County School District. The city is home to two elementary schools, one middle school, and one high school. The city also has a public library and a number of parks and recreational facilities.
Earlington is a small city with a rich history and a diverse economy. The city is home to a number of small businesses and manufacturing companies, as well as a number of healthcare facilities. The city is also served by the Hopkins County School District and has a number of parks and recreational facilities. The city has a population of 1,845 as of the 2010 census and has a median income of $30,938.
Common Questions
What is Per Capita Income in Earlington?
Per Capita income in Earlington is $17,699.
What is the Median Family Income in Earlington?
Median Family Income in Earlington is $42,917.
What is the Median Household income in Earlington?
Median Household Income in Earlington is $38,971.
What is Income or Wage Gap in Earlington?
Income or Wage Gap in Earlington is 22.0%.
Women in Earlington earn 78.0 cents for every dollar earned by a man.
What is Inequality or Gini Index in Earlington?
Inequality or Gini Index in Earlington is 0.46.
What is the Total Population of Earlington?
Total Population of Earlington is 1,219.
What is the Total Male Population of Earlington?
Total Male Population of Earlington is 527.
What is the Total Female Population of Earlington?
Total Female Population of Earlington is 692.
What is the Ratio of Males per 100 Females in Earlington?
There are 76.16 Males per 100 Females in Earlington.
What is the Ratio of Females per 100 Males in Earlington?
There are 131.31 Females per 100 Males in Earlington.
What is the Median Population Age in Earlington?
Median Population Age in Earlington is 35.3 Years.
What is the Average Family Size in Earlington
Average Family Size in Earlington is 3.1 People.
What is the Average Household Size in Earlington
Average Household Size in Earlington is 2.8 People.
How Large is the Labor Force in Earlington?
There are 544 People in the Labor Forcein in Earlington.
What is the Percentage of People in the Labor Force in Earlington?
58.5% of People are in the Labor Force in Earlington.
What is the Unemployment Rate in Earlington?
Unemployment Rate in Earlington is 9.0%.