Arlington, KY Map & Demographics
Arlington Map
Arlington Overview
$20,864
PER CAPITA INCOME
$44,583
AVG FAMILY INCOME
$37,639
AVG HOUSEHOLD INCOME
0.42
INEQUALITY / GINI INDEX
266
TOTAL POPULATION
117
MALE POPULATION
149
FEMALE POPULATION
78.52
MALES / 100 FEMALES
127.35
FEMALES / 100 MALES
43.4
MEDIAN AGE
2.6
AVG FAMILY SIZE
2.1
AVG HOUSEHOLD SIZE
96
LABOR FORCE [ PEOPLE ]
45.5%
PERCENT IN LABOR FORCE
4.2%
UNEMPLOYMENT RATE
Arlington Zip Codes
Arlington Area Codes
Income in Arlington
Income Overview in Arlington
Per Capita Income in Arlington is $20,864, while median incomes of families and households are $44,583 and $37,639 respectively.
| Characteristic | Number | Measure |
| Per Capita Income | 266 | $20,864 |
| Median Family Income | 81 | $44,583 |
| Mean Family Income | 81 | $55,152 |
| Median Household Income | 125 | $37,639 |
| Mean Household Income | 125 | $46,835 |
| Income Deficit | 81 | $0 |
| Wage / Income Gap (%) | 266 | 0.00% |
| Wage / Income Gap ($) | 266 | 100.00¢ per $1 |
| Gini / Inequality Index | 266 | 0.42 |
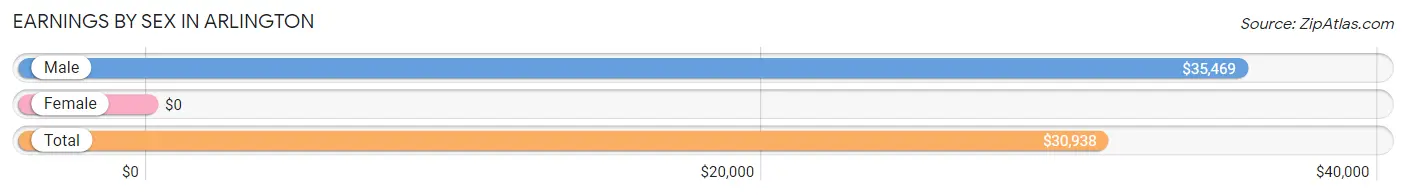
Earnings by Sex in Arlington
| Sex | Number | Average Earnings |
| Male | 35 (36.1%) | $35,469 |
| Female | 62 (63.9%) | $0 |
| Total | 97 (100.0%) | $30,938 |
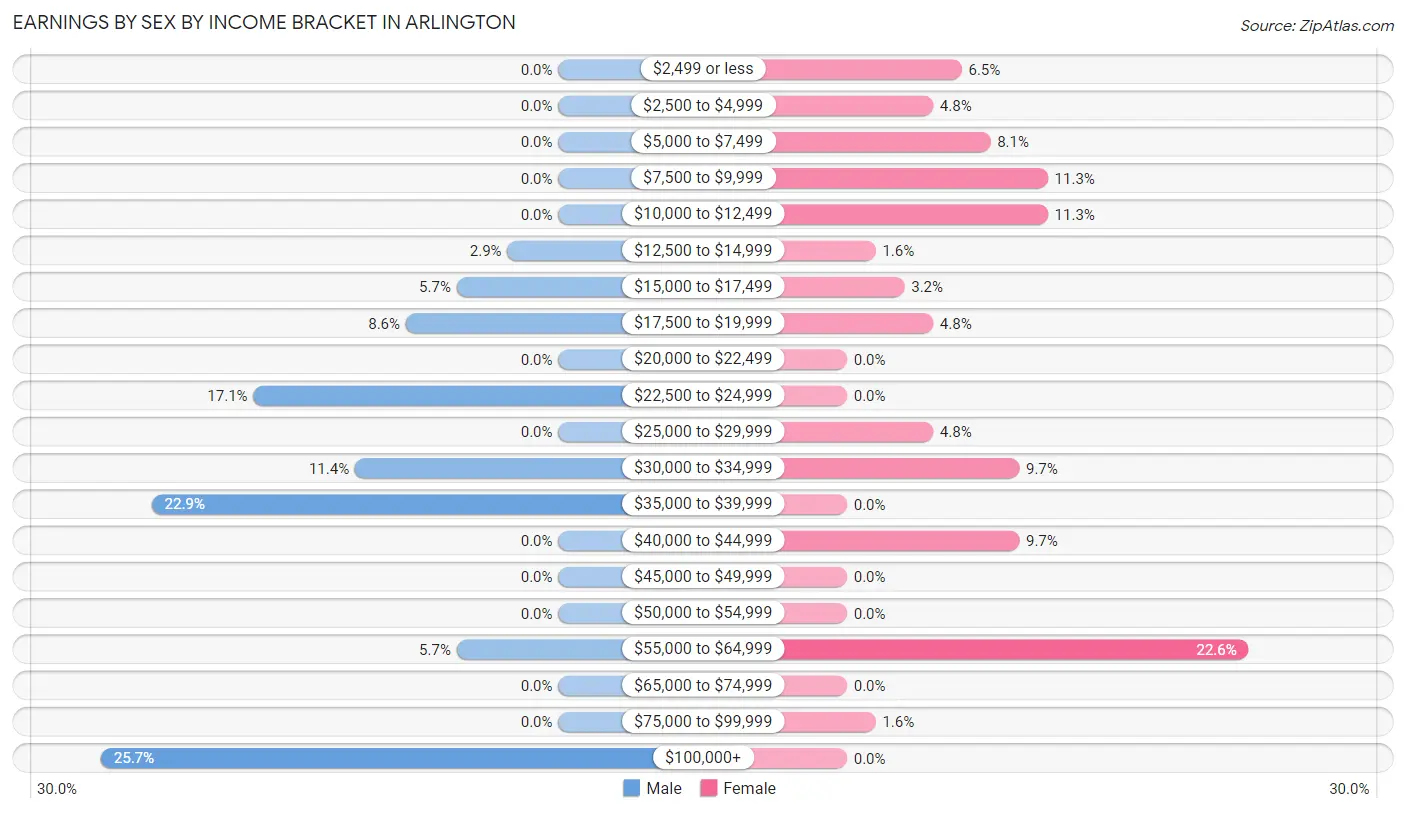
Earnings by Sex by Income Bracket in Arlington
The most common earnings brackets in Arlington are $100,000+ for men (9 | 25.7%) and $55,000 to $64,999 for women (14 | 22.6%).
| Income | Male | Female |
| $2,499 or less | 0 (0.0%) | 4 (6.5%) |
| $2,500 to $4,999 | 0 (0.0%) | 3 (4.8%) |
| $5,000 to $7,499 | 0 (0.0%) | 5 (8.1%) |
| $7,500 to $9,999 | 0 (0.0%) | 7 (11.3%) |
| $10,000 to $12,499 | 0 (0.0%) | 7 (11.3%) |
| $12,500 to $14,999 | 1 (2.9%) | 1 (1.6%) |
| $15,000 to $17,499 | 2 (5.7%) | 2 (3.2%) |
| $17,500 to $19,999 | 3 (8.6%) | 3 (4.8%) |
| $20,000 to $22,499 | 0 (0.0%) | 0 (0.0%) |
| $22,500 to $24,999 | 6 (17.1%) | 0 (0.0%) |
| $25,000 to $29,999 | 0 (0.0%) | 3 (4.8%) |
| $30,000 to $34,999 | 4 (11.4%) | 6 (9.7%) |
| $35,000 to $39,999 | 8 (22.9%) | 0 (0.0%) |
| $40,000 to $44,999 | 0 (0.0%) | 6 (9.7%) |
| $45,000 to $49,999 | 0 (0.0%) | 0 (0.0%) |
| $50,000 to $54,999 | 0 (0.0%) | 0 (0.0%) |
| $55,000 to $64,999 | 2 (5.7%) | 14 (22.6%) |
| $65,000 to $74,999 | 0 (0.0%) | 0 (0.0%) |
| $75,000 to $99,999 | 0 (0.0%) | 1 (1.6%) |
| $100,000+ | 9 (25.7%) | 0 (0.0%) |
| Total | 35 (100.0%) | 62 (100.0%) |
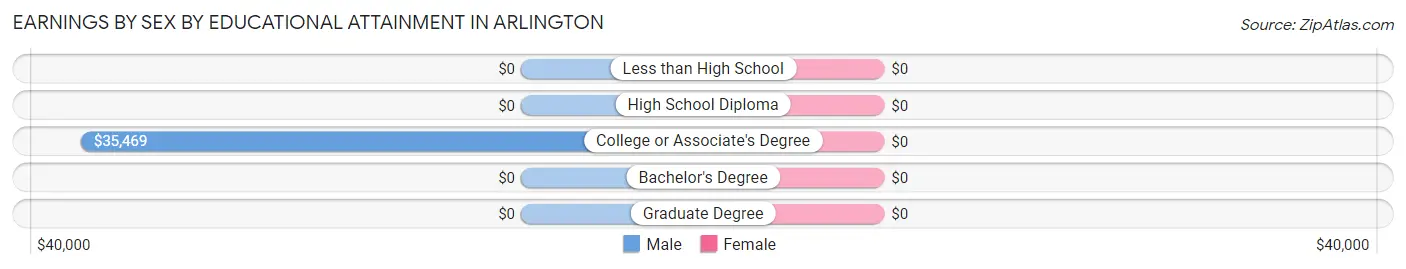
Earnings by Sex by Educational Attainment in Arlington
| Educational Attainment | Male Income | Female Income |
| Less than High School | - | - |
| High School Diploma | - | - |
| College or Associate's Degree | $35,469 | $0 |
| Bachelor's Degree | - | - |
| Graduate Degree | - | - |
| Total | $35,938 | $32,750 |
Family Income in Arlington
Family Income Brackets in Arlington
According to the Arlington family income data, there are 21 families falling into the $75,000 to $99,999 income range, which is the most common income bracket and makes up 25.9% of all families.
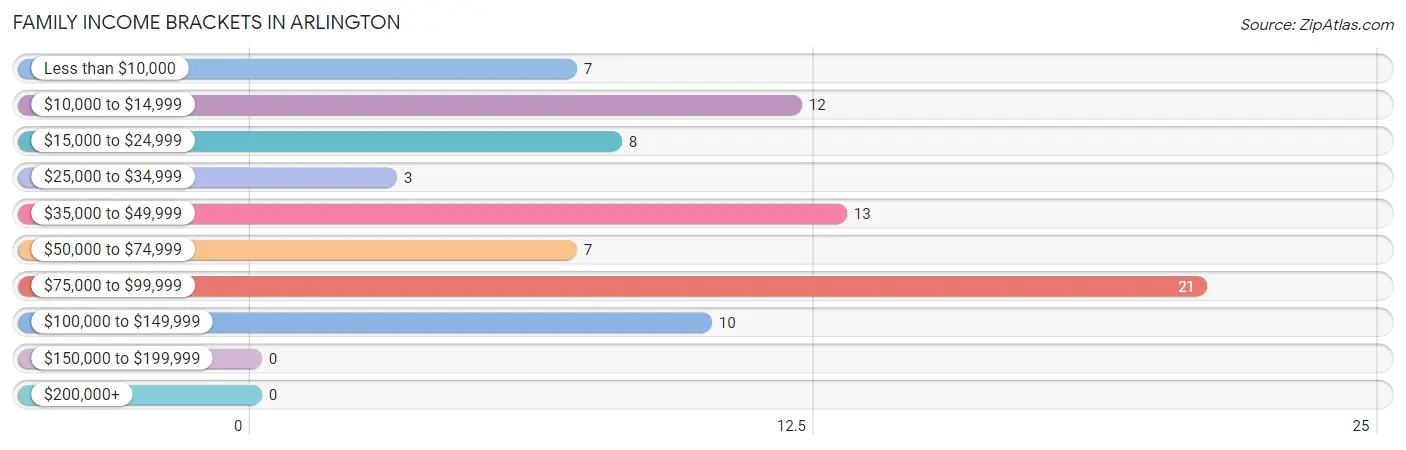
| Income Bracket | # Families | % Families |
| Less than $10,000 | 7 | 8.6% |
| $10,000 to $14,999 | 12 | 14.8% |
| $15,000 to $24,999 | 8 | 9.9% |
| $25,000 to $34,999 | 3 | 3.7% |
| $35,000 to $49,999 | 13 | 16.0% |
| $50,000 to $74,999 | 7 | 8.6% |
| $75,000 to $99,999 | 21 | 25.9% |
| $100,000 to $149,999 | 10 | 12.3% |
| $150,000 to $199,999 | 0 | 0.0% |
| $200,000+ | 0 | 0.0% |
Family Income by Famaliy Size in Arlington
3-person families (37 | 45.7%) account for the highest median family income in Arlington with $81,875 per family, while 3-person families (37 | 45.7%) have the highest median income of $27,292 per family member.
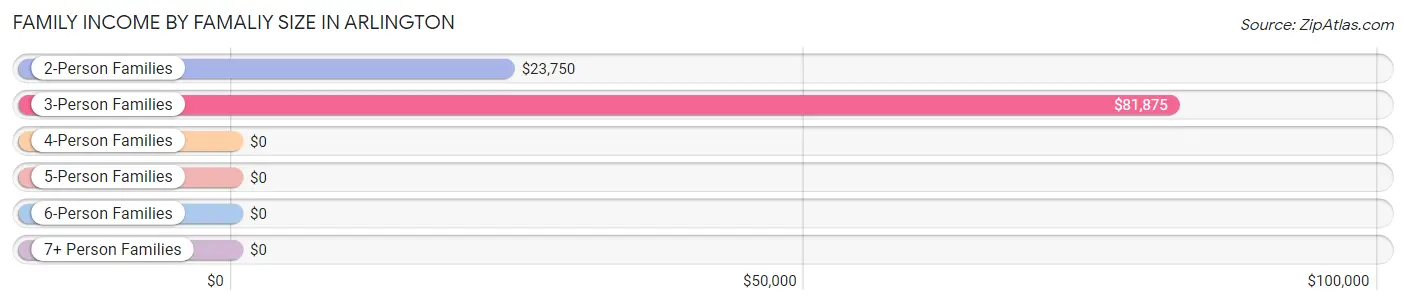
| Income Bracket | # Families | Median Income |
| 2-Person Families | 37 (45.7%) | $23,750 |
| 3-Person Families | 37 (45.7%) | $81,875 |
| 4-Person Families | 0 (0.0%) | $0 |
| 5-Person Families | 6 (7.4%) | $0 |
| 6-Person Families | 1 (1.2%) | $0 |
| 7+ Person Families | 0 (0.0%) | $0 |
| Total | 81 (100.0%) | $44,583 |
Family Income by Number of Earners in Arlington
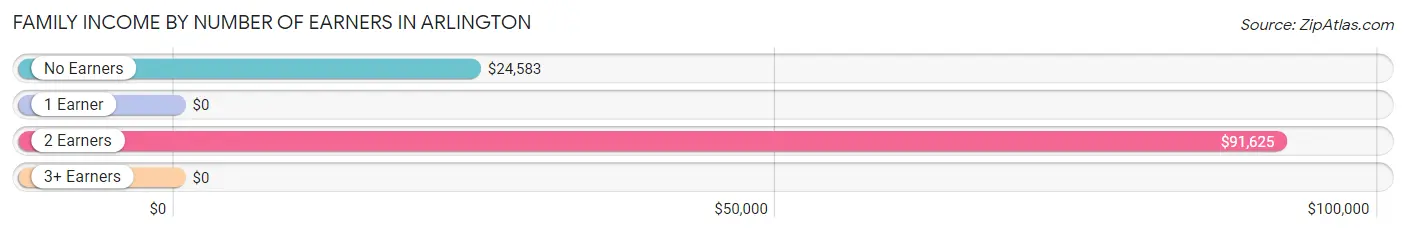
| Number of Earners | # Families | Median Income |
| No Earners | 17 (21.0%) | $24,583 |
| 1 Earner | 35 (43.2%) | $0 |
| 2 Earners | 23 (28.4%) | $91,625 |
| 3+ Earners | 6 (7.4%) | $0 |
| Total | 81 (100.0%) | $44,583 |
Household Income in Arlington
Household Income Brackets in Arlington
With 25 households falling in the category, the $15,000 to $24,999 income range is the most frequent in Arlington, accounting for 20.0% of all households.
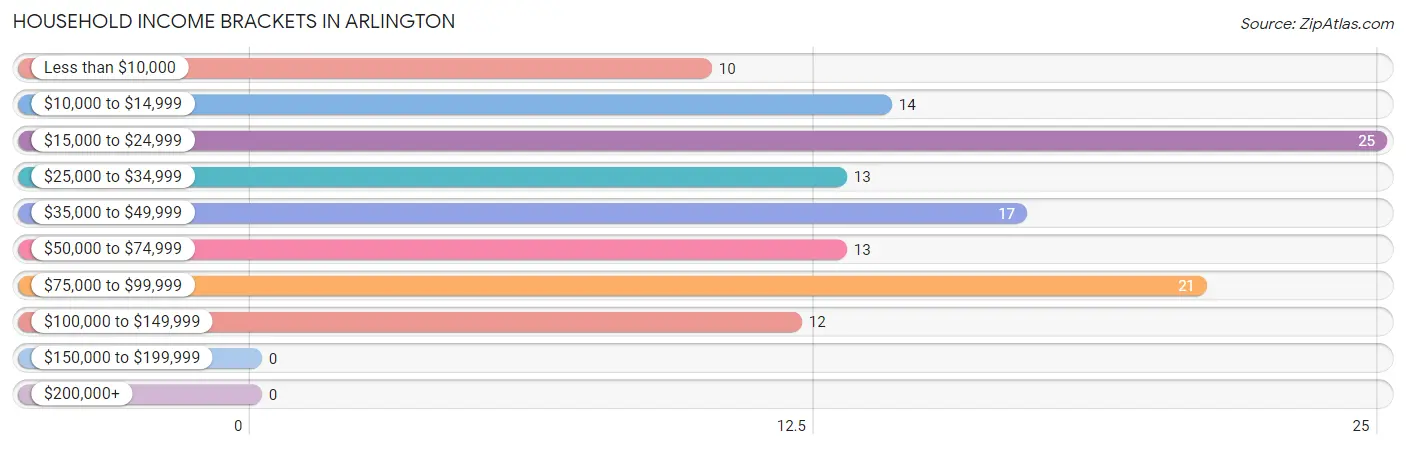
| Income Bracket | # Households | % Households |
| Less than $10,000 | 10 | 8.0% |
| $10,000 to $14,999 | 14 | 11.2% |
| $15,000 to $24,999 | 25 | 20.0% |
| $25,000 to $34,999 | 13 | 10.4% |
| $35,000 to $49,999 | 17 | 13.6% |
| $50,000 to $74,999 | 13 | 10.4% |
| $75,000 to $99,999 | 21 | 16.8% |
| $100,000 to $149,999 | 12 | 9.6% |
| $150,000 to $199,999 | 0 | 0.0% |
| $200,000+ | 0 | 0.0% |
Household Income by Householder Age in Arlington
The median household income in Arlington is $37,639, with the highest median household income of $39,583 found in the 45 to 64 years age bracket for the primary householder. A total of 36 households (28.8%) fall into this category. Meanwhile, the 15 to 24 years age bracket for the primary householder has the lowest median household income of $0, with 6 households (4.8%) in this group.
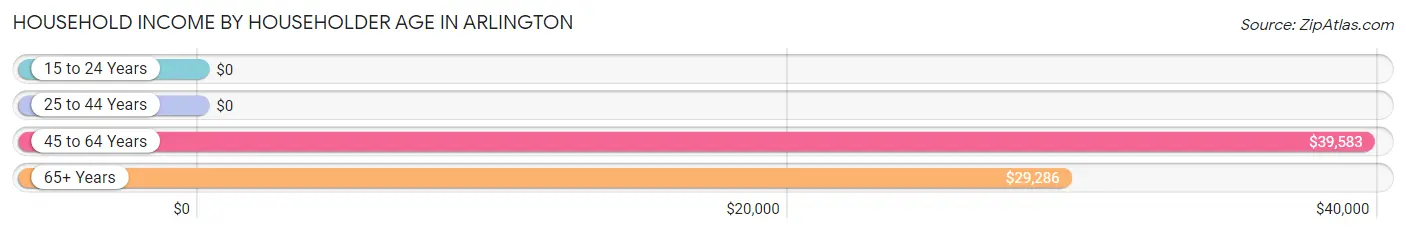
| Income Bracket | # Households | Median Income |
| 15 to 24 Years | 6 (4.8%) | $0 |
| 25 to 44 Years | 31 (24.8%) | $0 |
| 45 to 64 Years | 36 (28.8%) | $39,583 |
| 65+ Years | 52 (41.6%) | $29,286 |
| Total | 125 (100.0%) | $37,639 |
Poverty in Arlington
Income Below Poverty by Sex and Age in Arlington
With 39.3% poverty level for males and 36.2% for females among the residents of Arlington, 16 and 17 year old males and under 5 year old females are the most vulnerable to poverty, with 3 males (100.0%) and 14 females (100.0%) in their respective age groups living below the poverty level.
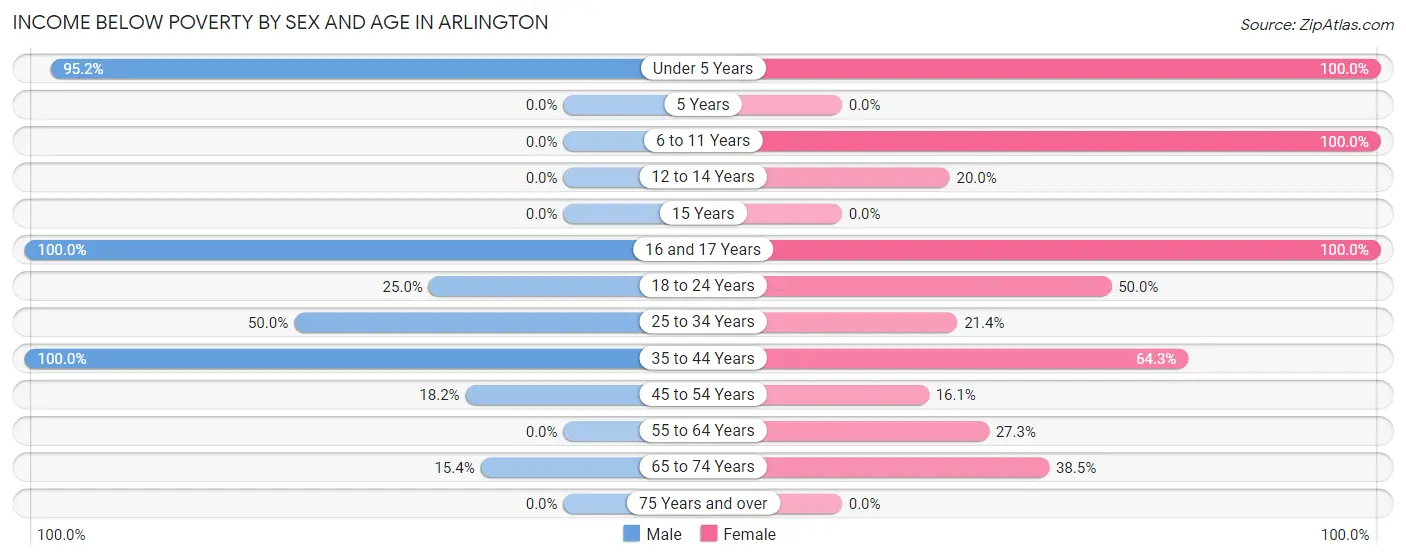
| Age Bracket | Male | Female |
| Under 5 Years | 20 (95.2%) | 14 (100.0%) |
| 5 Years | 0 (0.0%) | 0 (0.0%) |
| 6 to 11 Years | 0 (0.0%) | 7 (100.0%) |
| 12 to 14 Years | 0 (0.0%) | 1 (20.0%) |
| 15 Years | 0 (0.0%) | 0 (0.0%) |
| 16 and 17 Years | 3 (100.0%) | 1 (100.0%) |
| 18 to 24 Years | 1 (25.0%) | 6 (50.0%) |
| 25 to 34 Years | 15 (50.0%) | 3 (21.4%) |
| 35 to 44 Years | 3 (100.0%) | 9 (64.3%) |
| 45 to 54 Years | 2 (18.2%) | 5 (16.1%) |
| 55 to 64 Years | 0 (0.0%) | 3 (27.3%) |
| 65 to 74 Years | 2 (15.4%) | 5 (38.5%) |
| 75 Years and over | 0 (0.0%) | 0 (0.0%) |
| Total | 46 (39.3%) | 54 (36.2%) |
Income Above Poverty by Sex and Age in Arlington
According to the poverty statistics in Arlington, males aged 6 to 11 years and females aged 5 years are the age groups that are most secure financially, with 100.0% of males and 100.0% of females in these age groups living above the poverty line.
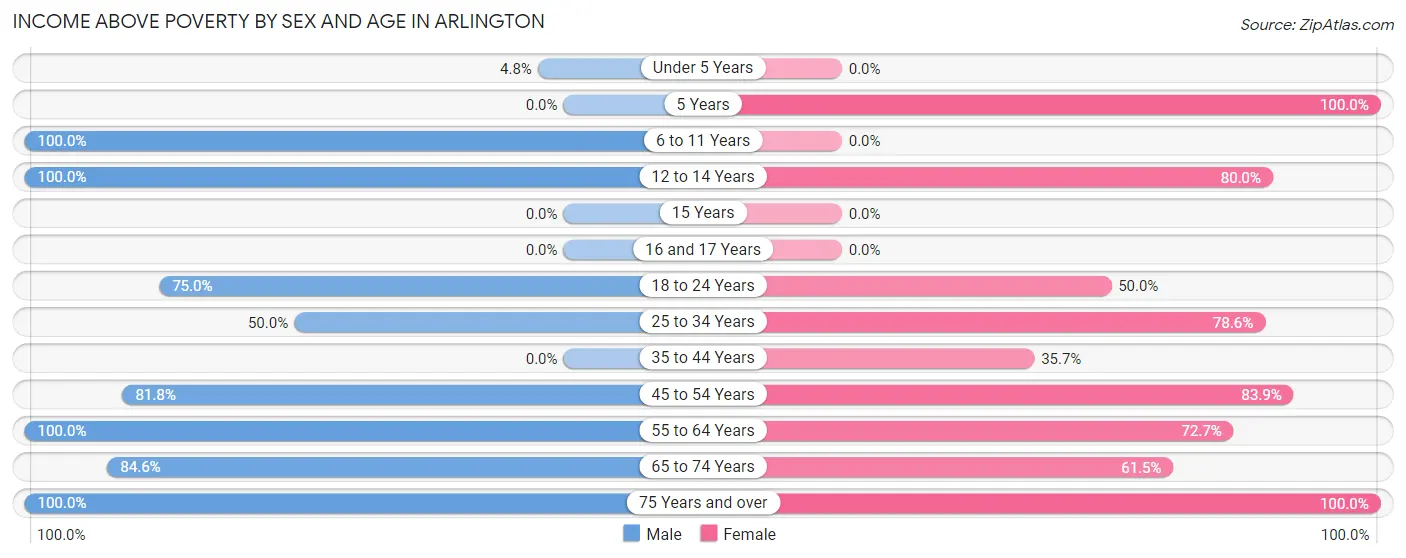
| Age Bracket | Male | Female |
| Under 5 Years | 1 (4.8%) | 0 (0.0%) |
| 5 Years | 0 (0.0%) | 1 (100.0%) |
| 6 to 11 Years | 5 (100.0%) | 0 (0.0%) |
| 12 to 14 Years | 2 (100.0%) | 4 (80.0%) |
| 15 Years | 0 (0.0%) | 0 (0.0%) |
| 16 and 17 Years | 0 (0.0%) | 0 (0.0%) |
| 18 to 24 Years | 3 (75.0%) | 6 (50.0%) |
| 25 to 34 Years | 15 (50.0%) | 11 (78.6%) |
| 35 to 44 Years | 0 (0.0%) | 5 (35.7%) |
| 45 to 54 Years | 9 (81.8%) | 26 (83.9%) |
| 55 to 64 Years | 10 (100.0%) | 8 (72.7%) |
| 65 to 74 Years | 11 (84.6%) | 8 (61.5%) |
| 75 Years and over | 15 (100.0%) | 26 (100.0%) |
| Total | 71 (60.7%) | 95 (63.8%) |
Income Below Poverty Among Married-Couple Families in Arlington
The poverty statistics for married-couple families in Arlington show that 8.2% or 4 of the total 49 families live below the poverty line. Families with 1 or 2 children have the highest poverty rate of 9.5%, comprising of 2 families. On the other hand, families with 3 or 4 children have the lowest poverty rate of 0.0%, which includes 0 families.
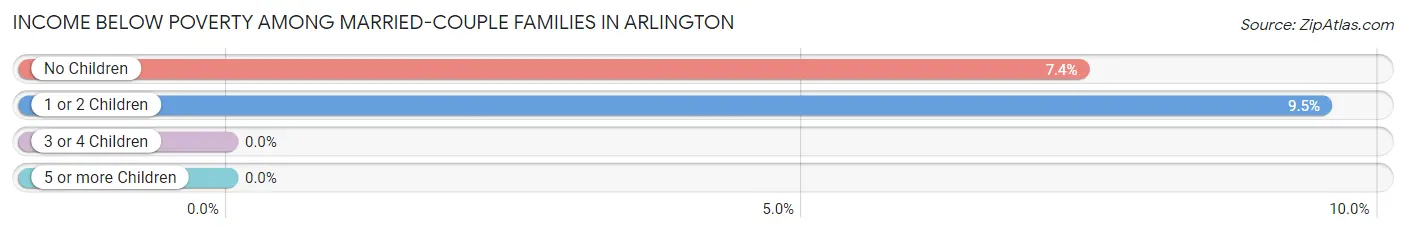
| Children | Above Poverty | Below Poverty |
| No Children | 25 (92.6%) | 2 (7.4%) |
| 1 or 2 Children | 19 (90.5%) | 2 (9.5%) |
| 3 or 4 Children | 1 (100.0%) | 0 (0.0%) |
| 5 or more Children | 0 (0.0%) | 0 (0.0%) |
| Total | 45 (91.8%) | 4 (8.2%) |
Income Below Poverty Among Single-Parent Households in Arlington
According to the poverty data in Arlington, 100.0% or 3 single-father households and 62.1% or 18 single-mother households are living below the poverty line. Among single-father households, those with 1 or 2 children have the highest poverty rate, with 3 households (100.0%) experiencing poverty. Likewise, among single-mother households, those with 1 or 2 children have the highest poverty rate, with 9 households (100.0%) falling below the poverty line.
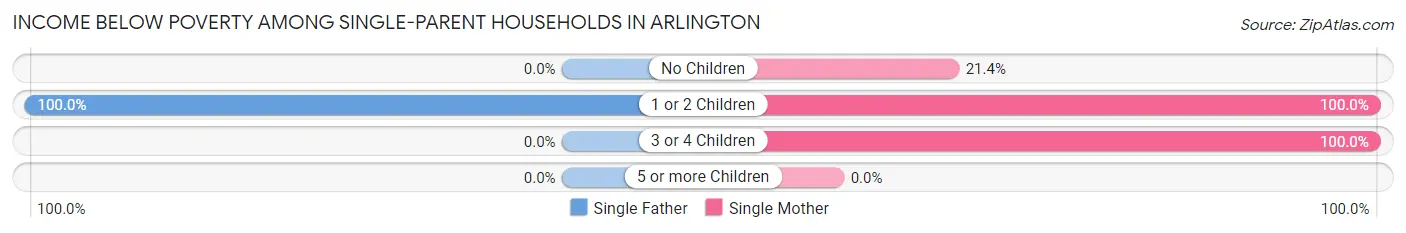
| Children | Single Father | Single Mother |
| No Children | 0 (0.0%) | 3 (21.4%) |
| 1 or 2 Children | 3 (100.0%) | 9 (100.0%) |
| 3 or 4 Children | 0 (0.0%) | 6 (100.0%) |
| 5 or more Children | 0 (0.0%) | 0 (0.0%) |
| Total | 3 (100.0%) | 18 (62.1%) |
Income Below Poverty Among Married-Couple vs Single-Parent Households in Arlington
The poverty data for Arlington shows that 4 of the married-couple family households (8.2%) and 21 of the single-parent households (65.6%) are living below the poverty level. Within the married-couple family households, those with 1 or 2 children have the highest poverty rate, with 2 households (9.5%) falling below the poverty line. Among the single-parent households, those with 1 or 2 children have the highest poverty rate, with 12 household (100.0%) living below poverty.
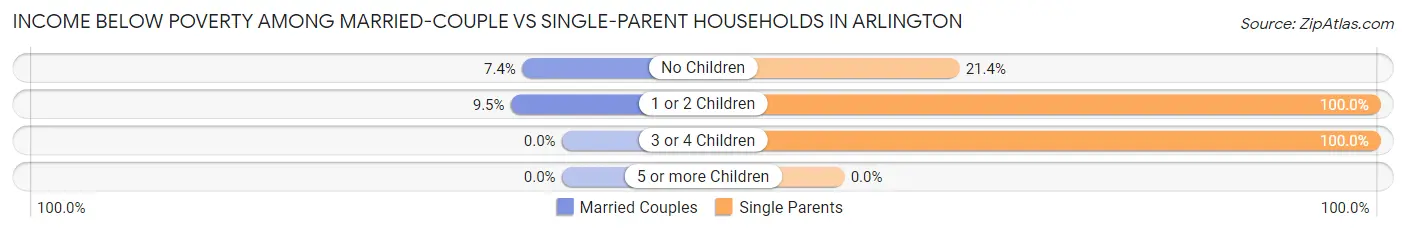
| Children | Married-Couple Families | Single-Parent Households |
| No Children | 2 (7.4%) | 3 (21.4%) |
| 1 or 2 Children | 2 (9.5%) | 12 (100.0%) |
| 3 or 4 Children | 0 (0.0%) | 6 (100.0%) |
| 5 or more Children | 0 (0.0%) | 0 (0.0%) |
| Total | 4 (8.2%) | 21 (65.6%) |
Race in Arlington
The most populous races in Arlington are White / Caucasian (209 | 78.6%), Black / African American (25 | 9.4%), and Two or more Races (24 | 9.0%).
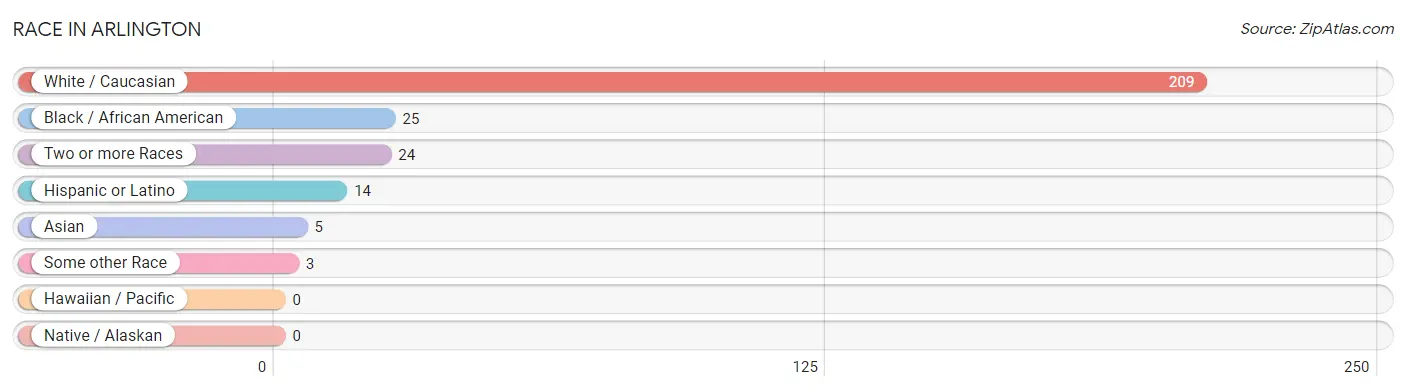
| Race | # Population | % Population |
| Asian | 5 | 1.9% |
| Black / African American | 25 | 9.4% |
| Hawaiian / Pacific | 0 | 0.0% |
| Hispanic or Latino | 14 | 5.3% |
| Native / Alaskan | 0 | 0.0% |
| White / Caucasian | 209 | 78.6% |
| Two or more Races | 24 | 9.0% |
| Some other Race | 3 | 1.1% |
| Total | 266 | 100.0% |
Ancestry in Arlington
The most populous ancestries reported in Arlington are English (112 | 42.1%), German (12 | 4.5%), American (10 | 3.8%), Arab (7 | 2.6%), and Mexican (7 | 2.6%), together accounting for 55.6% of all Arlington residents.
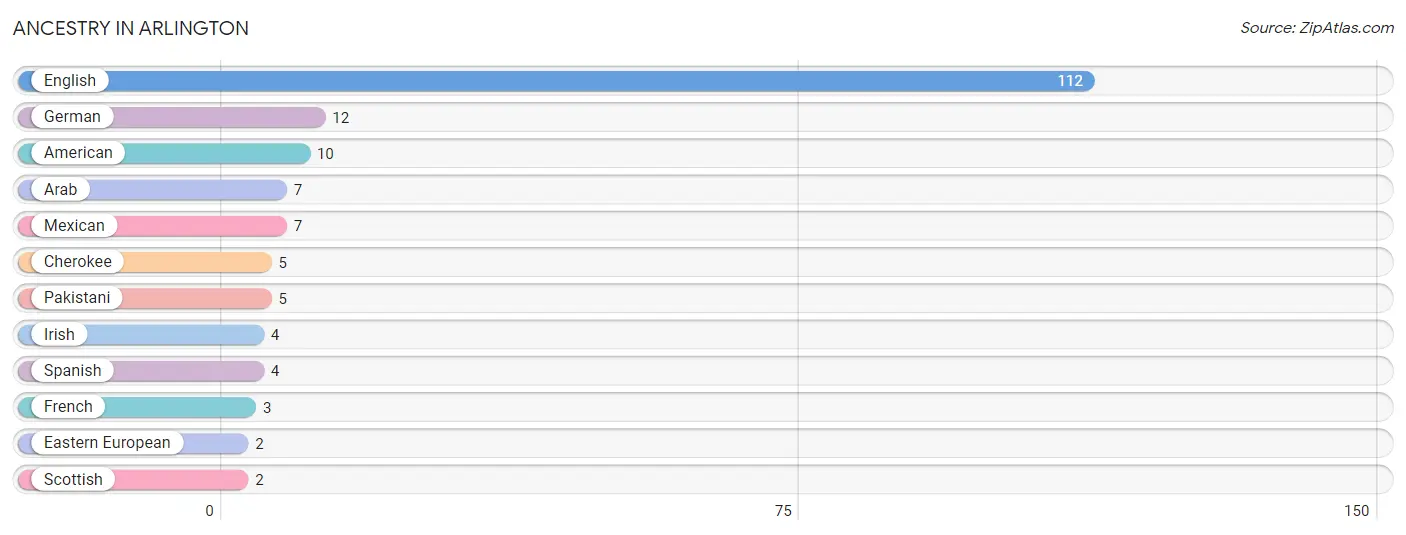
| Ancestry | # Population | % Population |
| American | 10 | 3.8% |
| Arab | 7 | 2.6% |
| Cherokee | 5 | 1.9% |
| Eastern European | 2 | 0.7% |
| English | 112 | 42.1% |
| French | 3 | 1.1% |
| German | 12 | 4.5% |
| Irish | 4 | 1.5% |
| Mexican | 7 | 2.6% |
| Pakistani | 5 | 1.9% |
| Scottish | 2 | 0.7% |
| Spanish | 4 | 1.5% | View All 12 Rows |
Immigrants in Arlington
The most numerous immigrant groups reported in Arlington came from Asia (12 | 4.5%), Saudi Arabia (7 | 2.6%), Western Asia (7 | 2.6%), South Eastern Asia (5 | 1.9%), and Thailand (5 | 1.9%), together accounting for 13.5% of all Arlington residents.
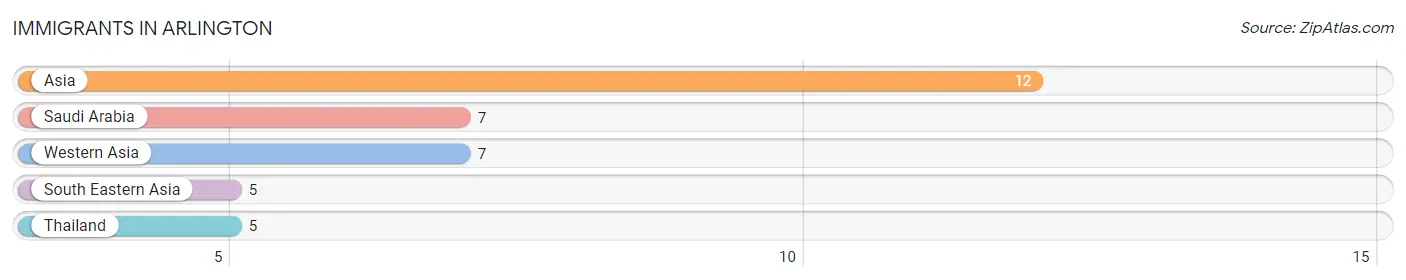
| Immigration Origin | # Population | % Population |
| Asia | 12 | 4.5% |
| Saudi Arabia | 7 | 2.6% |
| South Eastern Asia | 5 | 1.9% |
| Thailand | 5 | 1.9% |
| Western Asia | 7 | 2.6% | View All 5 Rows |
Sex and Age in Arlington
Sex and Age in Arlington
The most populous age groups in Arlington are Under 5 Years (21 | 17.9%) for men and 75 to 79 Years (18 | 12.1%) for women.
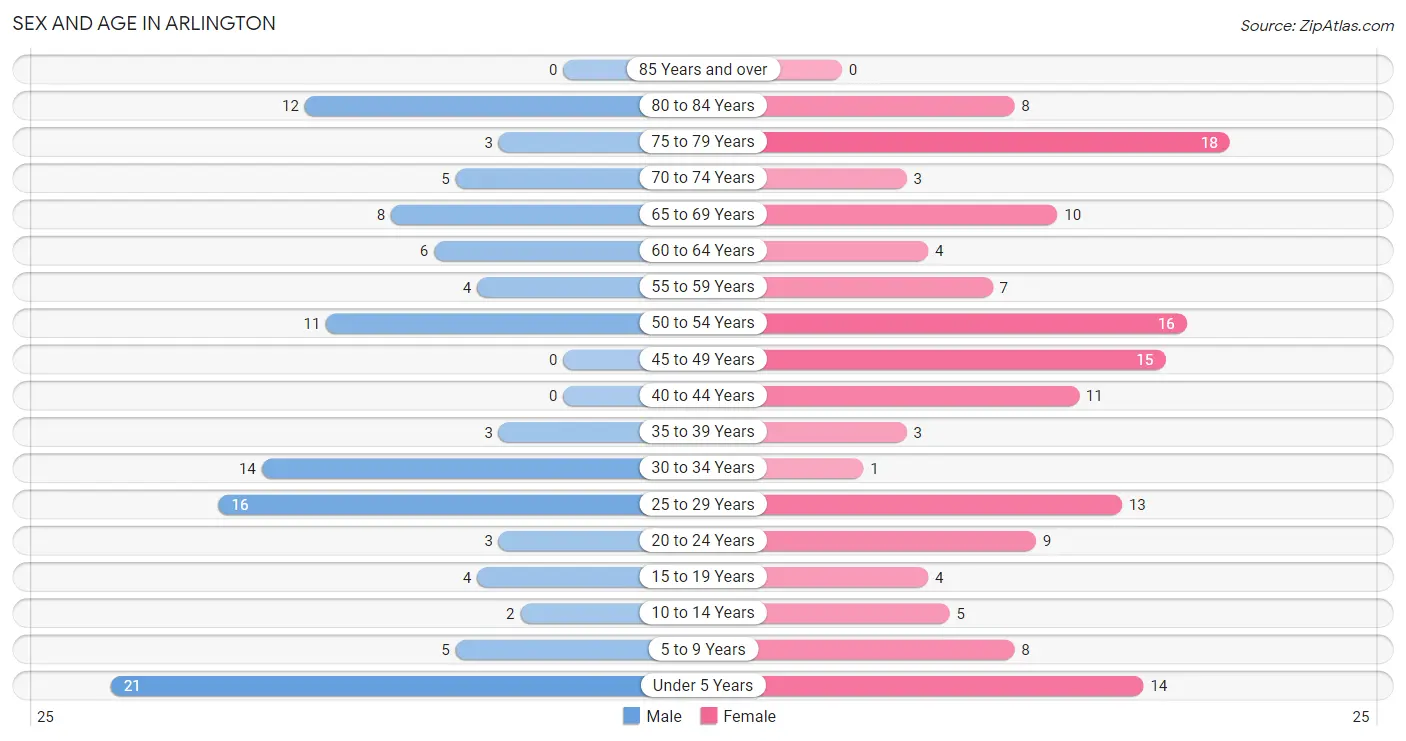
| Age Bracket | Male | Female |
| Under 5 Years | 21 (17.9%) | 14 (9.4%) |
| 5 to 9 Years | 5 (4.3%) | 8 (5.4%) |
| 10 to 14 Years | 2 (1.7%) | 5 (3.4%) |
| 15 to 19 Years | 4 (3.4%) | 4 (2.7%) |
| 20 to 24 Years | 3 (2.6%) | 9 (6.0%) |
| 25 to 29 Years | 16 (13.7%) | 13 (8.7%) |
| 30 to 34 Years | 14 (12.0%) | 1 (0.7%) |
| 35 to 39 Years | 3 (2.6%) | 3 (2.0%) |
| 40 to 44 Years | 0 (0.0%) | 11 (7.4%) |
| 45 to 49 Years | 0 (0.0%) | 15 (10.1%) |
| 50 to 54 Years | 11 (9.4%) | 16 (10.7%) |
| 55 to 59 Years | 4 (3.4%) | 7 (4.7%) |
| 60 to 64 Years | 6 (5.1%) | 4 (2.7%) |
| 65 to 69 Years | 8 (6.8%) | 10 (6.7%) |
| 70 to 74 Years | 5 (4.3%) | 3 (2.0%) |
| 75 to 79 Years | 3 (2.6%) | 18 (12.1%) |
| 80 to 84 Years | 12 (10.3%) | 8 (5.4%) |
| 85 Years and over | 0 (0.0%) | 0 (0.0%) |
| Total | 117 (100.0%) | 149 (100.0%) |
Families and Households in Arlington
Median Family Size in Arlington
The median family size in Arlington is 2.58 persons per family, with single male/father families (3 | 3.7%) accounting for the largest median family size of 3 persons per family. On the other hand, married-couple families (49 | 60.5%) represent the smallest median family size with 2.43 persons per family.
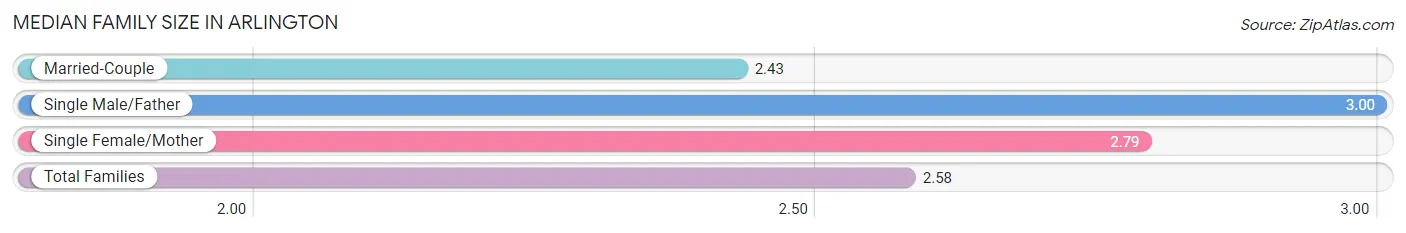
| Family Type | # Families | Family Size |
| Married-Couple | 49 (60.5%) | 2.43 |
| Single Male/Father | 3 (3.7%) | 3.00 |
| Single Female/Mother | 29 (35.8%) | 2.79 |
| Total Families | 81 (100.0%) | 2.58 |
Median Household Size in Arlington
The median household size in Arlington is 2.13 persons per household, with single female/mother households (29 | 23.2%) accounting for the largest median household size of 3.21 persons per household. non-family households (44 | 35.2%) represent the smallest median household size with 1.02 persons per household.
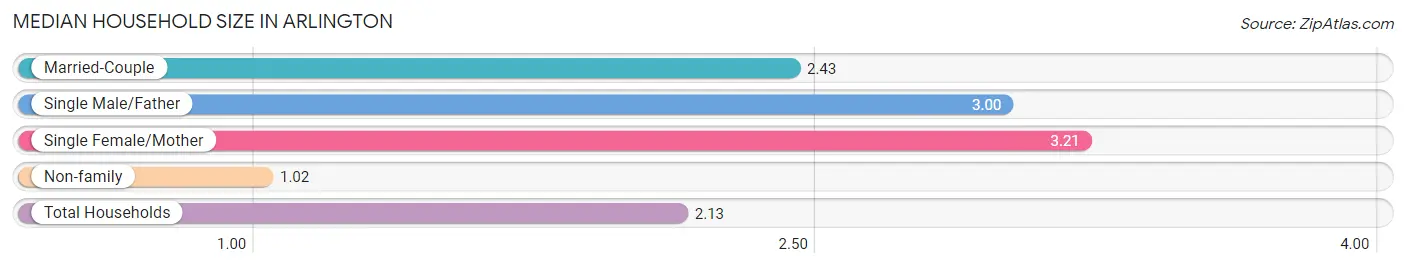
| Household Type | # Households | Household Size |
| Married-Couple | 49 (39.2%) | 2.43 |
| Single Male/Father | 3 (2.4%) | 3.00 |
| Single Female/Mother | 29 (23.2%) | 3.21 |
| Non-family | 44 (35.2%) | 1.02 |
| Total Households | 125 (100.0%) | 2.13 |
Household Size by Marriage Status in Arlington
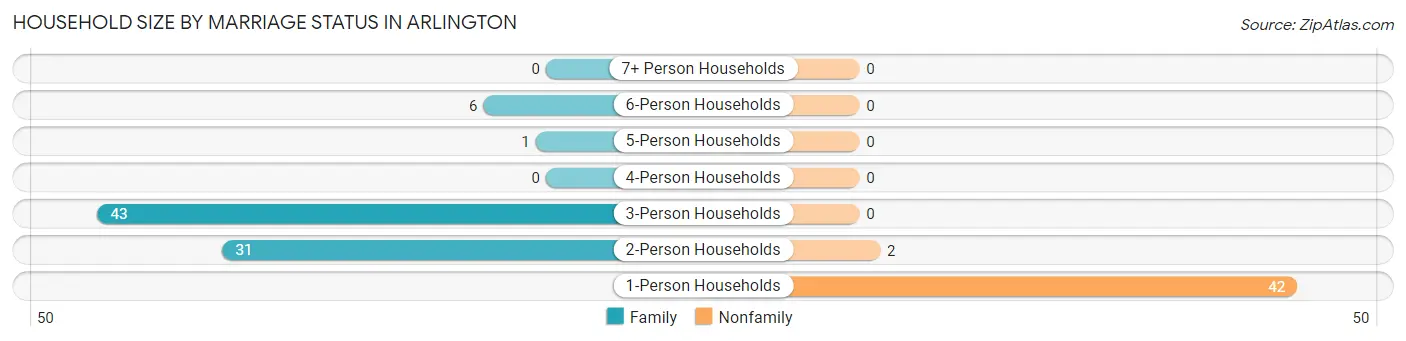
Out of a total of 125 households in Arlington, 81 (64.8%) are family households, while 44 (35.2%) are nonfamily households. The most numerous type of family households are 3-person households, comprising 43, and the most common type of nonfamily households are 1-person households, comprising 42.
| Household Size | Family Households | Nonfamily Households |
| 1-Person Households | - | 42 (33.6%) |
| 2-Person Households | 31 (24.8%) | 2 (1.6%) |
| 3-Person Households | 43 (34.4%) | 0 (0.0%) |
| 4-Person Households | 0 (0.0%) | 0 (0.0%) |
| 5-Person Households | 1 (0.8%) | 0 (0.0%) |
| 6-Person Households | 6 (4.8%) | 0 (0.0%) |
| 7+ Person Households | 0 (0.0%) | 0 (0.0%) |
| Total | 81 (64.8%) | 44 (35.2%) |
Female Fertility in Arlington
Fertility by Age in Arlington
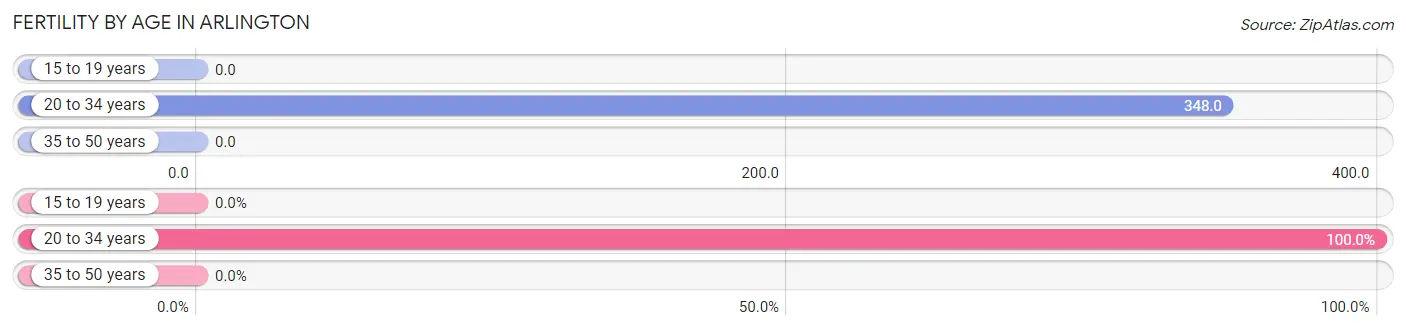
Average fertility rate in Arlington is 138.0 births per 1,000 women. Women in the age bracket of 20 to 34 years have the highest fertility rate with 348.0 births per 1,000 women. Women in the age bracket of 20 to 34 years acount for 100.0% of all women with births.
| Age Bracket | Women with Births | Births / 1,000 Women |
| 15 to 19 years | 0 (0.0%) | 0.0 |
| 20 to 34 years | 8 (100.0%) | 348.0 |
| 35 to 50 years | 0 (0.0%) | 0.0 |
| Total | 8 (100.0%) | 138.0 |
Fertility by Age by Marriage Status in Arlington
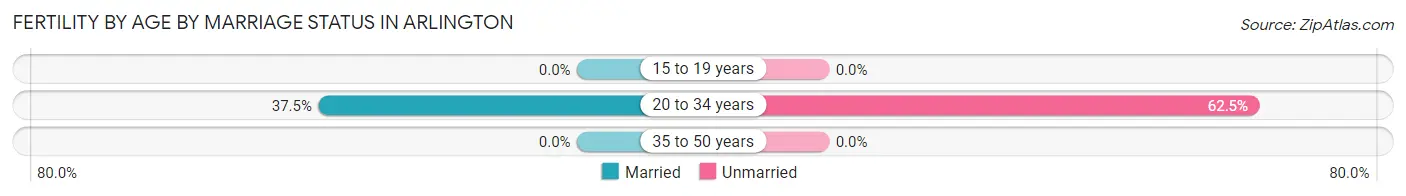
37.5% of women with births (8) in Arlington are married. The highest percentage of unmarried women with births falls into 20 to 34 years age bracket with 62.5% of them unmarried at the time of birth, while the lowest percentage of unmarried women with births belong to 20 to 34 years age bracket with 62.5% of them unmarried.
| Age Bracket | Married | Unmarried |
| 15 to 19 years | 0 (0.0%) | 0 (0.0%) |
| 20 to 34 years | 3 (37.5%) | 5 (62.5%) |
| 35 to 50 years | 0 (0.0%) | 0 (0.0%) |
| Total | 3 (37.5%) | 5 (62.5%) |
Fertility by Education in Arlington
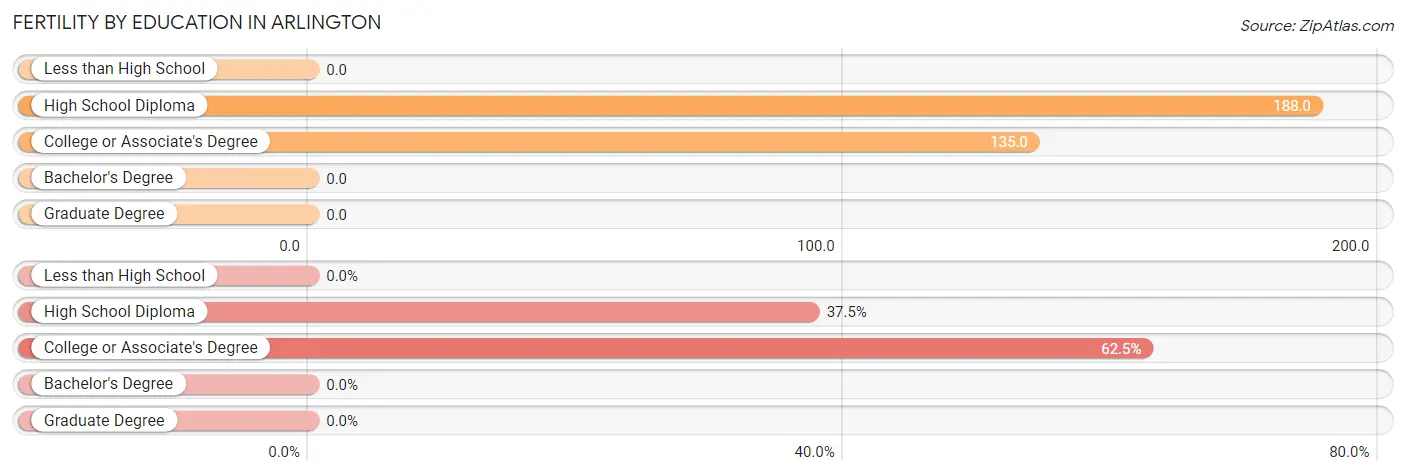
| Educational Attainment | Women with Births | Births / 1,000 Women |
| Less than High School | 0 (0.0%) | 0.0 |
| High School Diploma | 3 (37.5%) | 188.0 |
| College or Associate's Degree | 5 (62.5%) | 135.0 |
| Bachelor's Degree | 0 (0.0%) | 0.0 |
| Graduate Degree | 0 (0.0%) | 0.0 |
| Total | 8 (100.0%) | 138.0 |
Fertility by Education by Marriage Status in Arlington
62.5% of women with births in Arlington are unmarried. Women with the educational attainment of high school diploma are most likely to be married with 100.0% of them married at childbirth, while women with the educational attainment of college or associate's degree are least likely to be married with 100.0% of them unmarried at childbirth.
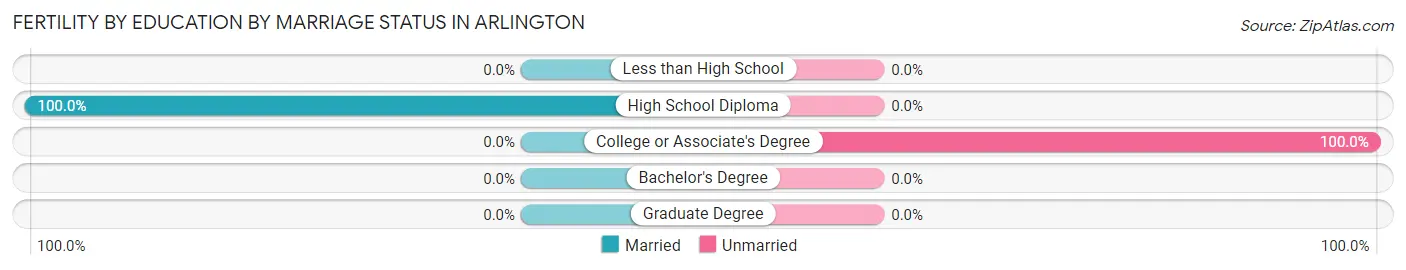
| Educational Attainment | Married | Unmarried |
| Less than High School | 0 (0.0%) | 0 (0.0%) |
| High School Diploma | 3 (100.0%) | 0 (0.0%) |
| College or Associate's Degree | 0 (0.0%) | 5 (100.0%) |
| Bachelor's Degree | 0 (0.0%) | 0 (0.0%) |
| Graduate Degree | 0 (0.0%) | 0 (0.0%) |
| Total | 3 (37.5%) | 5 (62.5%) |
Employment Characteristics in Arlington
Employment by Class of Employer in Arlington
Among the 92 employed individuals in Arlington, private company employees (66 | 71.7%), federal government employees (10 | 10.9%), and state government employees (9 | 9.8%) make up the most common classes of employment.
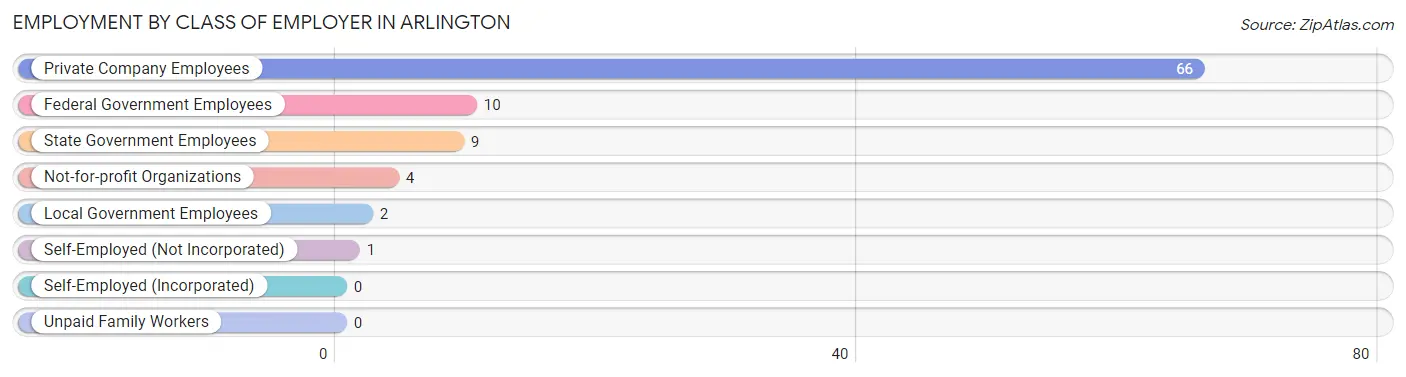
| Employer Class | # Employees | % Employees |
| Private Company Employees | 66 | 71.7% |
| Self-Employed (Incorporated) | 0 | 0.0% |
| Self-Employed (Not Incorporated) | 1 | 1.1% |
| Not-for-profit Organizations | 4 | 4.3% |
| Local Government Employees | 2 | 2.2% |
| State Government Employees | 9 | 9.8% |
| Federal Government Employees | 10 | 10.9% |
| Unpaid Family Workers | 0 | 0.0% |
| Total | 92 | 100.0% |
Employment Status by Age in Arlington
According to the labor force statistics for Arlington, out of the total population over 16 years of age (211), 45.5% or 96 individuals are in the labor force, with 4.2% or 4 of them unemployed. The age group with the highest labor force participation rate is 20 to 24 years, with 91.7% or 11 individuals in the labor force. Within the labor force, the 60 to 64 years age range has the highest percentage of unemployed individuals, with 60.0% or 3 of them being unemployed.
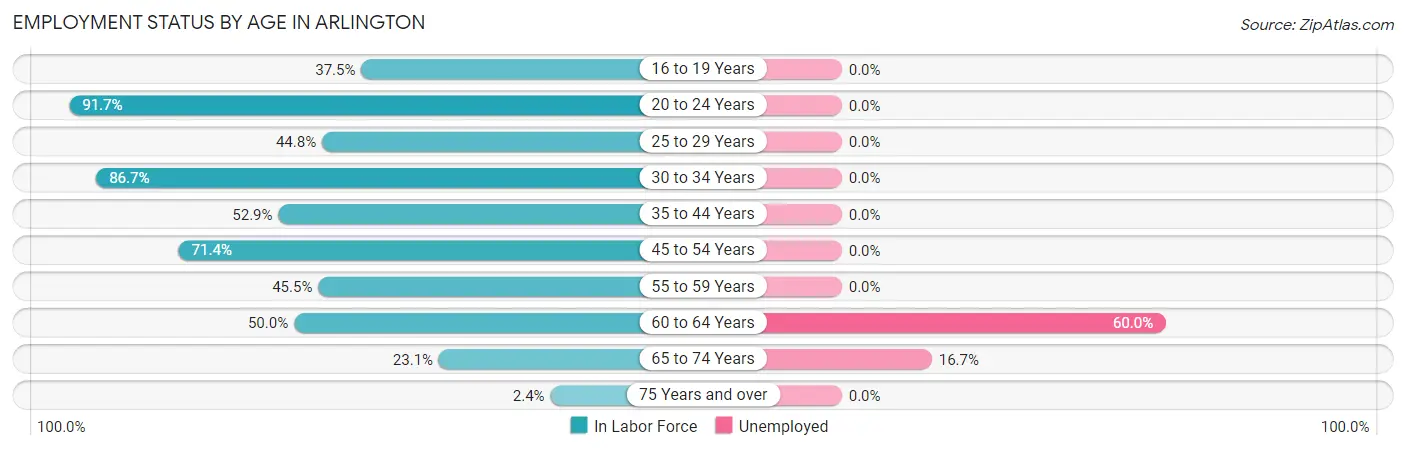
| Age Bracket | In Labor Force | Unemployed |
| 16 to 19 Years | 3 (37.5%) | 0 (0.0%) |
| 20 to 24 Years | 11 (91.7%) | 0 (0.0%) |
| 25 to 29 Years | 13 (44.8%) | 0 (0.0%) |
| 30 to 34 Years | 13 (86.7%) | 0 (0.0%) |
| 35 to 44 Years | 9 (52.9%) | 0 (0.0%) |
| 45 to 54 Years | 30 (71.4%) | 0 (0.0%) |
| 55 to 59 Years | 5 (45.5%) | 0 (0.0%) |
| 60 to 64 Years | 5 (50.0%) | 3 (60.0%) |
| 65 to 74 Years | 6 (23.1%) | 1 (16.7%) |
| 75 Years and over | 1 (2.4%) | 0 (0.0%) |
| Total | 96 (45.5%) | 4 (4.2%) |
Employment Status by Educational Attainment in Arlington
According to labor force statistics for Arlington, 60.5% of individuals (75) out of the total population between 25 and 64 years of age (124) are in the labor force, with 4.0% or 3 of them being unemployed. The group with the highest labor force participation rate are those with the educational attainment of college / associate degree, with 85.2% or 52 individuals in the labor force. Within the labor force, individuals with high school diploma education have the highest percentage of unemployment, with 25.0% or 3 of them being unemployed.
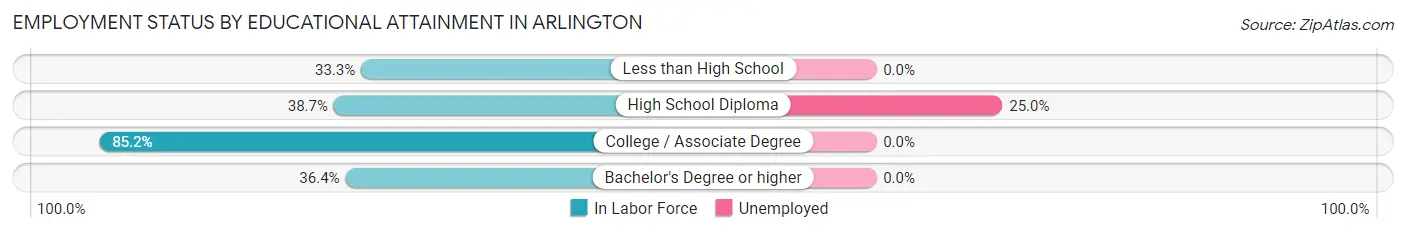
| Educational Attainment | In Labor Force | Unemployed |
| Less than High School | 7 (33.3%) | 0 (0.0%) |
| High School Diploma | 12 (38.7%) | 8 (25.0%) |
| College / Associate Degree | 52 (85.2%) | 0 (0.0%) |
| Bachelor's Degree or higher | 4 (36.4%) | 0 (0.0%) |
| Total | 75 (60.5%) | 5 (4.0%) |
Employment Occupations by Sex in Arlington
Management, Business, Science and Arts Occupations
The most common Management, Business, Science and Arts occupations in Arlington are Community & Social Service (11 | 12.0%), Education, Arts & Media (6 | 6.5%), Education Instruction & Library (5 | 5.4%), and Management (3 | 3.3%).
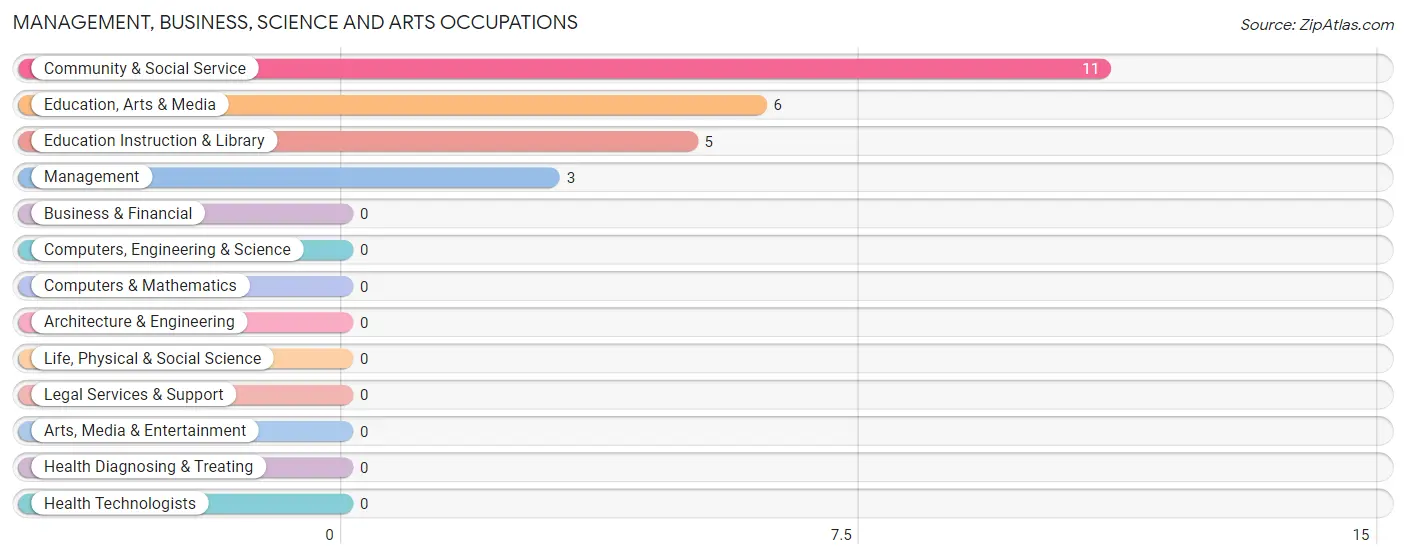
Management, Business, Science and Arts Occupations by Sex
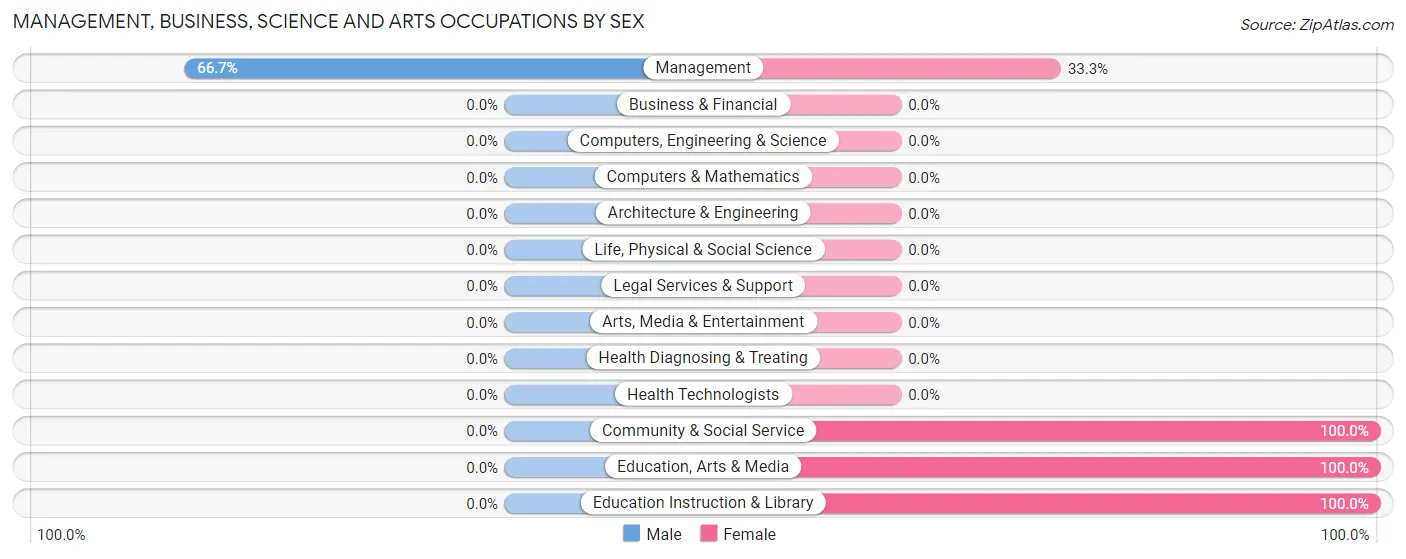
| Occupation | Male | Female |
| Management | 2 (66.7%) | 1 (33.3%) |
| Business & Financial | 0 (0.0%) | 0 (0.0%) |
| Computers, Engineering & Science | 0 (0.0%) | 0 (0.0%) |
| Computers & Mathematics | 0 (0.0%) | 0 (0.0%) |
| Architecture & Engineering | 0 (0.0%) | 0 (0.0%) |
| Life, Physical & Social Science | 0 (0.0%) | 0 (0.0%) |
| Community & Social Service | 0 (0.0%) | 11 (100.0%) |
| Education, Arts & Media | 0 (0.0%) | 6 (100.0%) |
| Legal Services & Support | 0 (0.0%) | 0 (0.0%) |
| Education Instruction & Library | 0 (0.0%) | 5 (100.0%) |
| Arts, Media & Entertainment | 0 (0.0%) | 0 (0.0%) |
| Health Diagnosing & Treating | 0 (0.0%) | 0 (0.0%) |
| Health Technologists | 0 (0.0%) | 0 (0.0%) |
| Total (Category) | 2 (14.3%) | 12 (85.7%) |
| Total (Overall) | 31 (33.7%) | 61 (66.3%) |
Services Occupations
The most common Services occupations in Arlington are Food Preparation & Serving (15 | 16.3%), Personal Care & Service (5 | 5.4%), and Healthcare Support (2 | 2.2%).
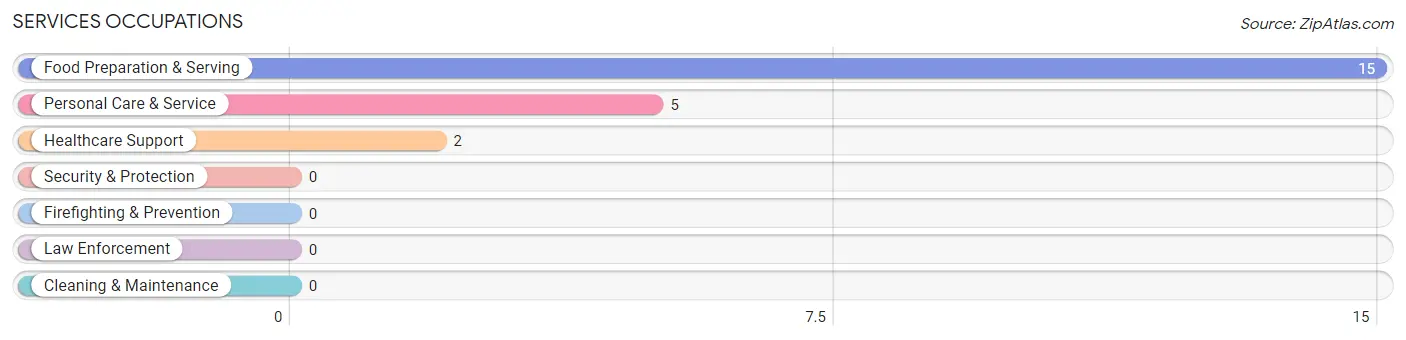
Services Occupations by Sex
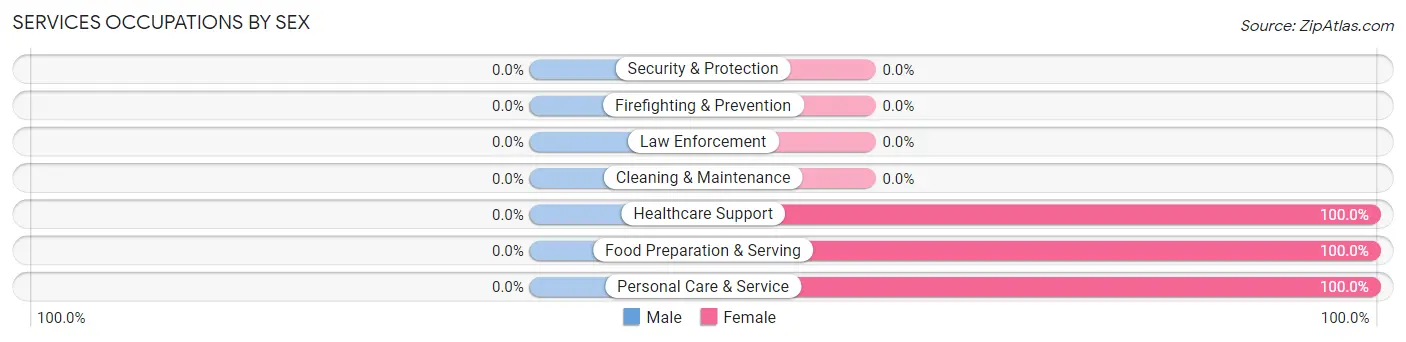
| Occupation | Male | Female |
| Healthcare Support | 0 (0.0%) | 2 (100.0%) |
| Security & Protection | 0 (0.0%) | 0 (0.0%) |
| Firefighting & Prevention | 0 (0.0%) | 0 (0.0%) |
| Law Enforcement | 0 (0.0%) | 0 (0.0%) |
| Food Preparation & Serving | 0 (0.0%) | 15 (100.0%) |
| Cleaning & Maintenance | 0 (0.0%) | 0 (0.0%) |
| Personal Care & Service | 0 (0.0%) | 5 (100.0%) |
| Total (Category) | 0 (0.0%) | 22 (100.0%) |
| Total (Overall) | 31 (33.7%) | 61 (66.3%) |
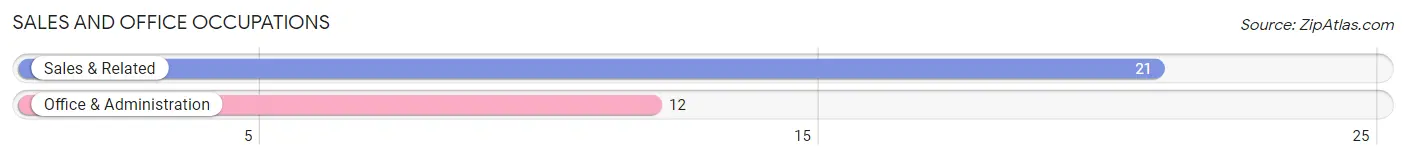
Sales and Office Occupations
The most common Sales and Office occupations in Arlington are Sales & Related (21 | 22.8%), and Office & Administration (12 | 13.0%).
Sales and Office Occupations by Sex

| Occupation | Male | Female |
| Sales & Related | 9 (42.9%) | 12 (57.1%) |
| Office & Administration | 0 (0.0%) | 12 (100.0%) |
| Total (Category) | 9 (27.3%) | 24 (72.7%) |
| Total (Overall) | 31 (33.7%) | 61 (66.3%) |
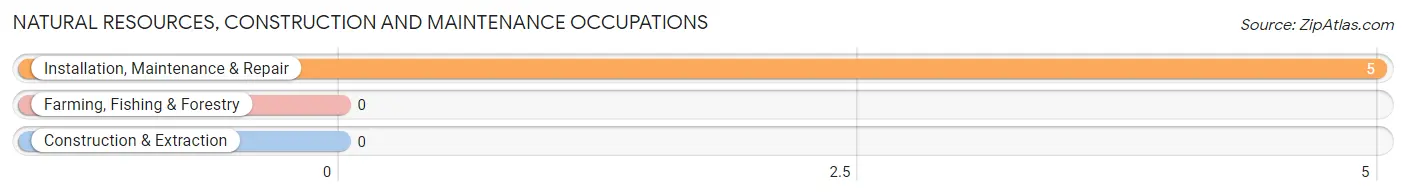
Natural Resources, Construction and Maintenance Occupations
The most common Natural Resources, Construction and Maintenance occupations in Arlington are , and Installation, Maintenance & Repair (5 | 5.4%).
Natural Resources, Construction and Maintenance Occupations by Sex
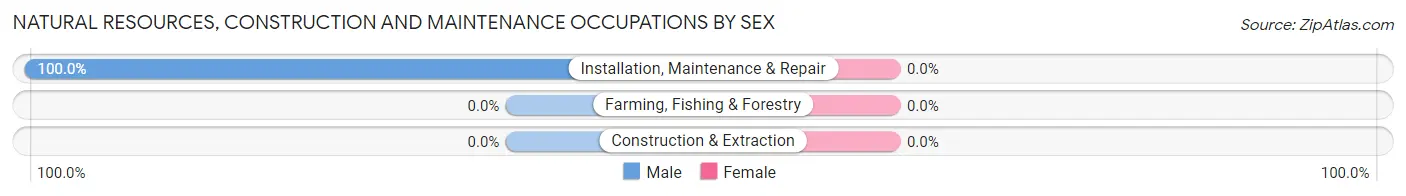
| Occupation | Male | Female |
| Farming, Fishing & Forestry | 0 (0.0%) | 0 (0.0%) |
| Construction & Extraction | 0 (0.0%) | 0 (0.0%) |
| Installation, Maintenance & Repair | 5 (100.0%) | 0 (0.0%) |
| Total (Category) | 5 (100.0%) | 0 (0.0%) |
| Total (Overall) | 31 (33.7%) | 61 (66.3%) |
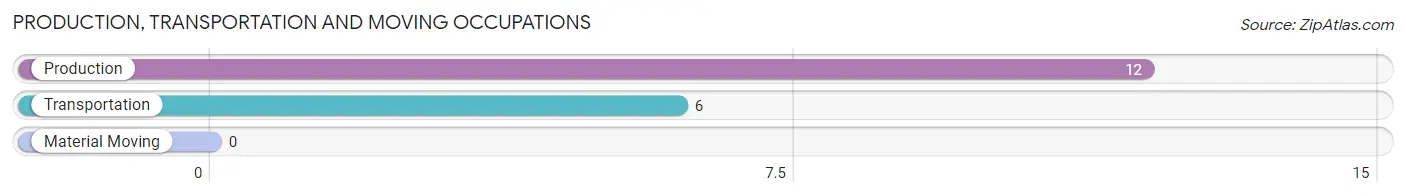
Production, Transportation and Moving Occupations
The most common Production, Transportation and Moving occupations in Arlington are Production (12 | 13.0%), and Transportation (6 | 6.5%).
Production, Transportation and Moving Occupations by Sex
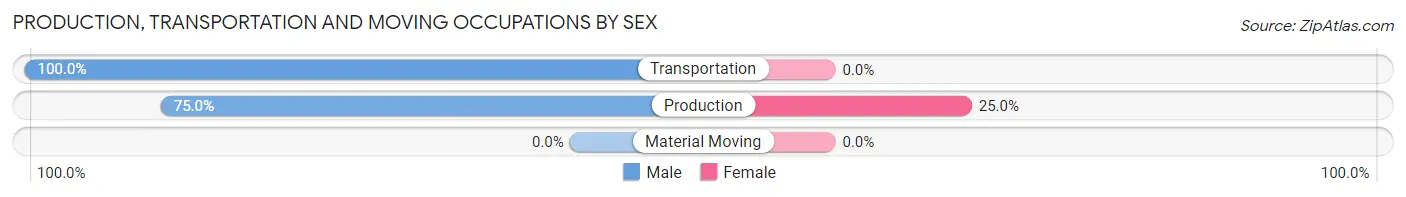
| Occupation | Male | Female |
| Production | 9 (75.0%) | 3 (25.0%) |
| Transportation | 6 (100.0%) | 0 (0.0%) |
| Material Moving | 0 (0.0%) | 0 (0.0%) |
| Total (Category) | 15 (83.3%) | 3 (16.7%) |
| Total (Overall) | 31 (33.7%) | 61 (66.3%) |
Employment Industries by Sex in Arlington
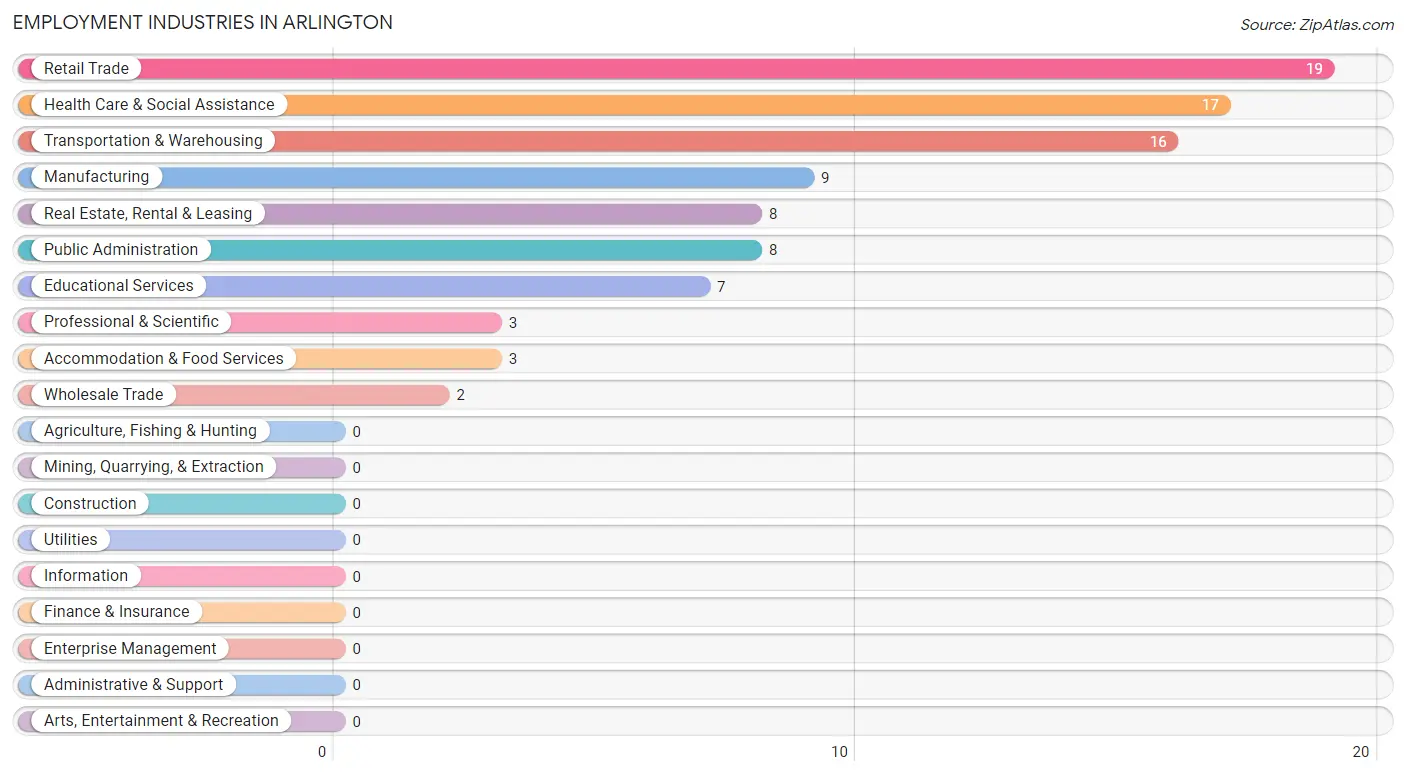
Employment Industries in Arlington
The major employment industries in Arlington include Retail Trade (19 | 20.6%), Health Care & Social Assistance (17 | 18.5%), Transportation & Warehousing (16 | 17.4%), Manufacturing (9 | 9.8%), and Real Estate, Rental & Leasing (8 | 8.7%).
Employment Industries by Sex in Arlington
The Arlington industries that see more men than women are Wholesale Trade (100.0%), Public Administration (100.0%), and Retail Trade (63.2%), whereas the industries that tend to have a higher number of women are Real Estate, Rental & Leasing (100.0%), Professional & Scientific (100.0%), and Health Care & Social Assistance (100.0%).
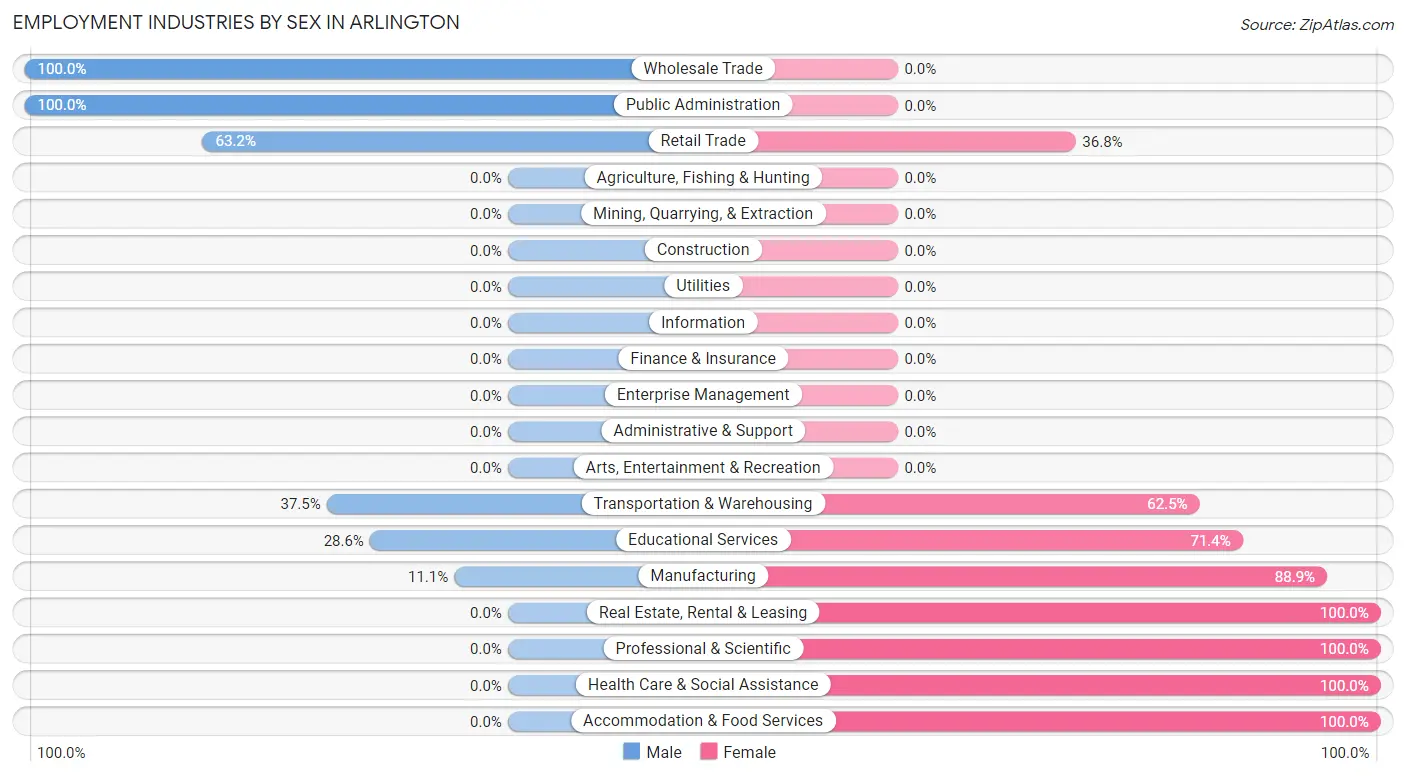
| Industry | Male | Female |
| Agriculture, Fishing & Hunting | 0 (0.0%) | 0 (0.0%) |
| Mining, Quarrying, & Extraction | 0 (0.0%) | 0 (0.0%) |
| Construction | 0 (0.0%) | 0 (0.0%) |
| Manufacturing | 1 (11.1%) | 8 (88.9%) |
| Wholesale Trade | 2 (100.0%) | 0 (0.0%) |
| Retail Trade | 12 (63.2%) | 7 (36.8%) |
| Transportation & Warehousing | 6 (37.5%) | 10 (62.5%) |
| Utilities | 0 (0.0%) | 0 (0.0%) |
| Information | 0 (0.0%) | 0 (0.0%) |
| Finance & Insurance | 0 (0.0%) | 0 (0.0%) |
| Real Estate, Rental & Leasing | 0 (0.0%) | 8 (100.0%) |
| Professional & Scientific | 0 (0.0%) | 3 (100.0%) |
| Enterprise Management | 0 (0.0%) | 0 (0.0%) |
| Administrative & Support | 0 (0.0%) | 0 (0.0%) |
| Educational Services | 2 (28.6%) | 5 (71.4%) |
| Health Care & Social Assistance | 0 (0.0%) | 17 (100.0%) |
| Arts, Entertainment & Recreation | 0 (0.0%) | 0 (0.0%) |
| Accommodation & Food Services | 0 (0.0%) | 3 (100.0%) |
| Public Administration | 8 (100.0%) | 0 (0.0%) |
| Total | 31 (33.7%) | 61 (66.3%) |
Education in Arlington
School Enrollment in Arlington
The most common levels of schooling among the 28 students in Arlington are nursery / preschool (10 | 35.7%), middle school (7 | 25.0%), and kindergarten (6 | 21.4%).
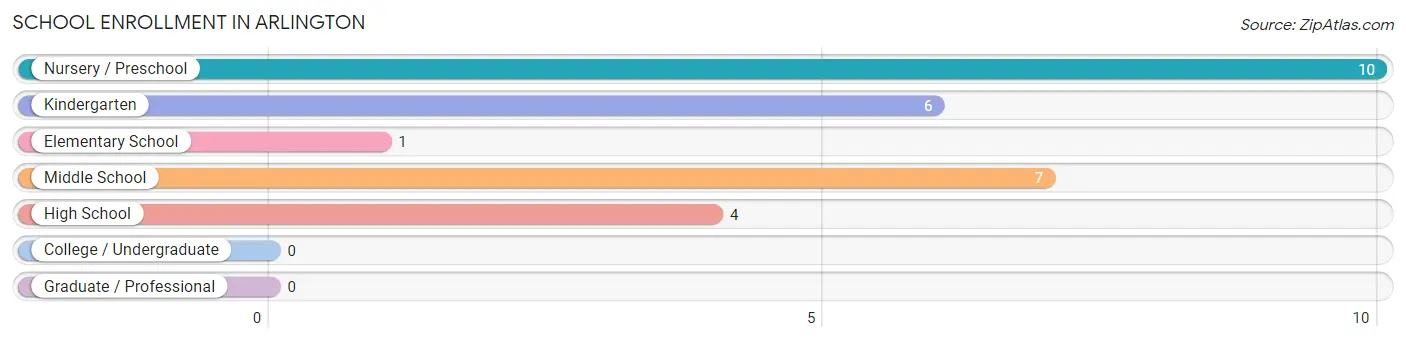
| School Level | # Students | % Students |
| Nursery / Preschool | 10 | 35.7% |
| Kindergarten | 6 | 21.4% |
| Elementary School | 1 | 3.6% |
| Middle School | 7 | 25.0% |
| High School | 4 | 14.3% |
| College / Undergraduate | 0 | 0.0% |
| Graduate / Professional | 0 | 0.0% |
| Total | 28 | 100.0% |
School Enrollment by Age by Funding Source in Arlington
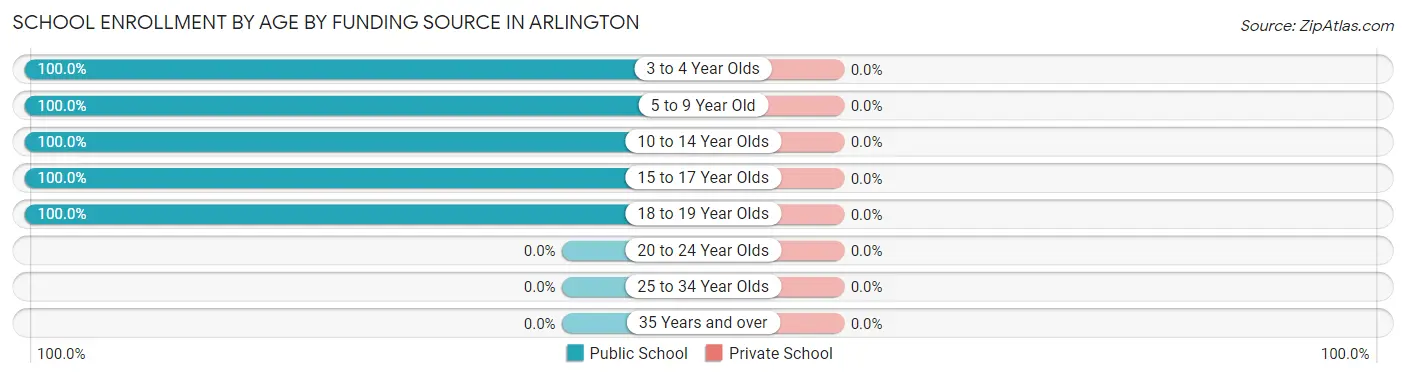
| Age Bracket | Public School | Private School |
| 3 to 4 Year Olds | 9 (100.0%) | 0 (0.0%) |
| 5 to 9 Year Old | 8 (100.0%) | 0 (0.0%) |
| 10 to 14 Year Olds | 7 (100.0%) | 0 (0.0%) |
| 15 to 17 Year Olds | 3 (100.0%) | 0 (0.0%) |
| 18 to 19 Year Olds | 1 (100.0%) | 0 (0.0%) |
| 20 to 24 Year Olds | 0 (0.0%) | 0 (0.0%) |
| 25 to 34 Year Olds | 0 (0.0%) | 0 (0.0%) |
| 35 Years and over | 0 (0.0%) | 0 (0.0%) |
| Total | 28 (100.0%) | 0 (0.0%) |
Educational Attainment by Field of Study in Arlington
Education (7 | 53.8%), engineering (4 | 30.8%), and psychology (2 | 15.4%) are the most common fields of study among 13 individuals in Arlington who have obtained a bachelor's degree or higher.
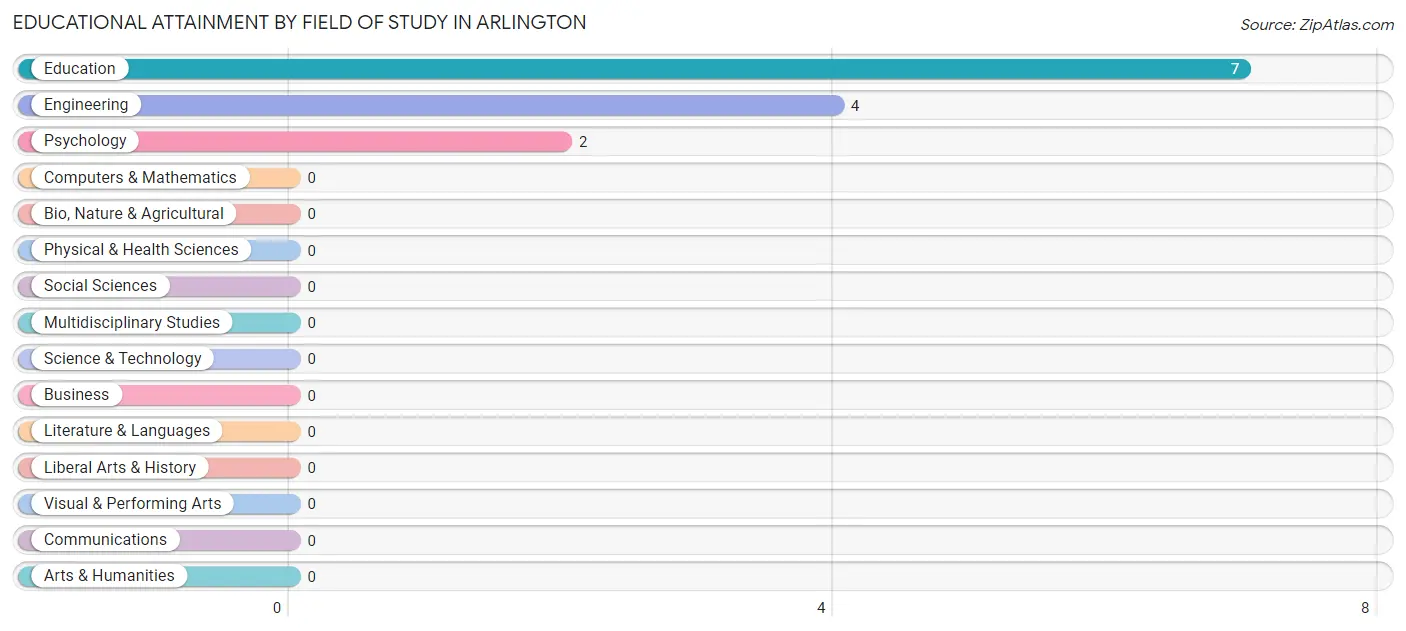
| Field of Study | # Graduates | % Graduates |
| Computers & Mathematics | 0 | 0.0% |
| Bio, Nature & Agricultural | 0 | 0.0% |
| Physical & Health Sciences | 0 | 0.0% |
| Psychology | 2 | 15.4% |
| Social Sciences | 0 | 0.0% |
| Engineering | 4 | 30.8% |
| Multidisciplinary Studies | 0 | 0.0% |
| Science & Technology | 0 | 0.0% |
| Business | 0 | 0.0% |
| Education | 7 | 53.8% |
| Literature & Languages | 0 | 0.0% |
| Liberal Arts & History | 0 | 0.0% |
| Visual & Performing Arts | 0 | 0.0% |
| Communications | 0 | 0.0% |
| Arts & Humanities | 0 | 0.0% |
| Total | 13 | 100.0% |
Transportation & Commute in Arlington
Vehicle Availability by Sex in Arlington
The most prevalent vehicle ownership categories in Arlington are males with 2 vehicles (16, accounting for 51.6%) and females with 2 vehicles (23, making up 26.2%).
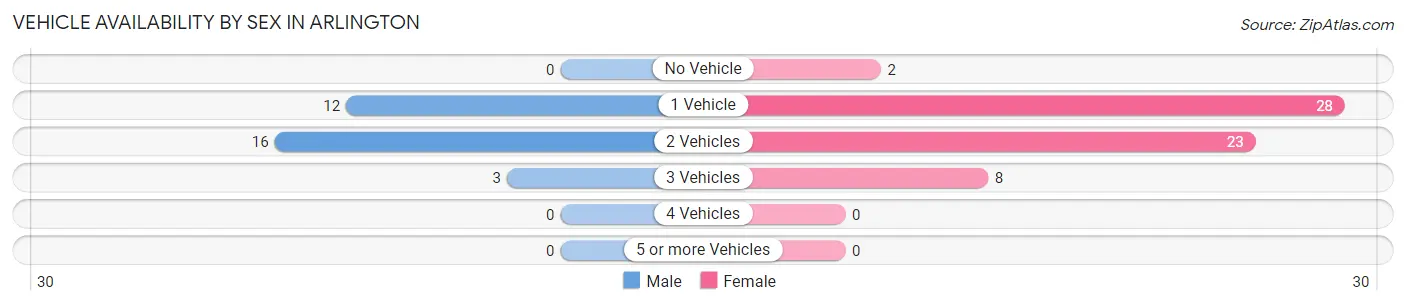
| Vehicles Available | Male | Female |
| No Vehicle | 0 (0.0%) | 2 (3.3%) |
| 1 Vehicle | 12 (38.7%) | 28 (45.9%) |
| 2 Vehicles | 16 (51.6%) | 23 (37.7%) |
| 3 Vehicles | 3 (9.7%) | 8 (13.1%) |
| 4 Vehicles | 0 (0.0%) | 0 (0.0%) |
| 5 or more Vehicles | 0 (0.0%) | 0 (0.0%) |
| Total | 31 (100.0%) | 61 (100.0%) |
Commute Time in Arlington
The most frequently occuring commute durations in Arlington are 30 to 34 minutes (25 commuters, 28.4%), 10 to 14 minutes (14 commuters, 15.9%), and 5 to 9 minutes (13 commuters, 14.8%).
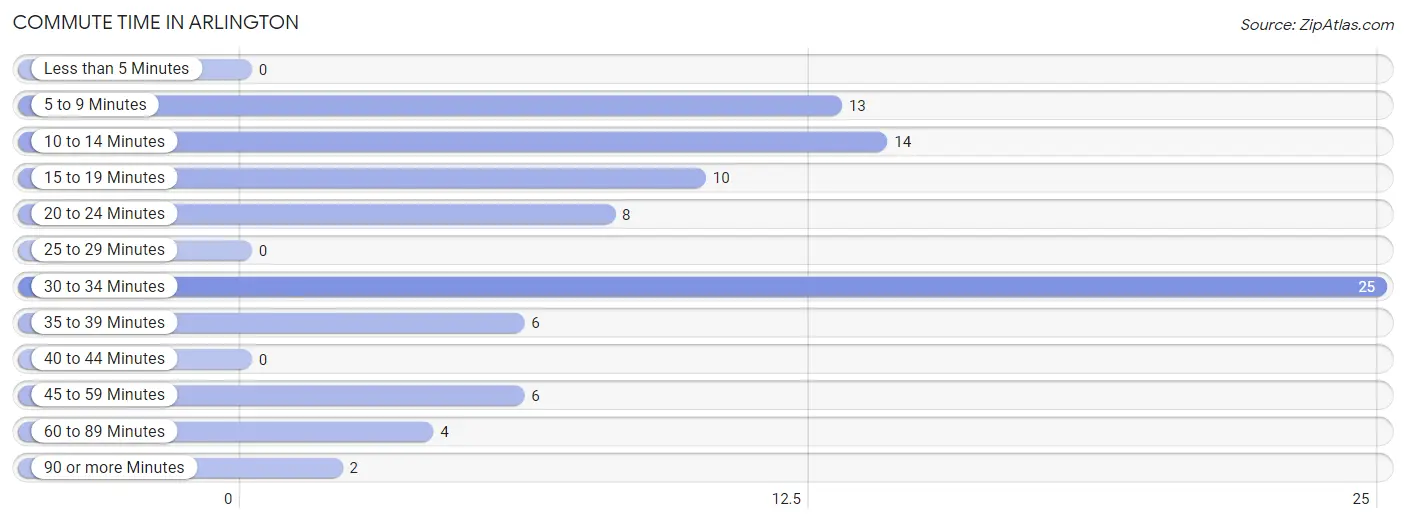
| Commute Time | # Commuters | % Commuters |
| Less than 5 Minutes | 0 | 0.0% |
| 5 to 9 Minutes | 13 | 14.8% |
| 10 to 14 Minutes | 14 | 15.9% |
| 15 to 19 Minutes | 10 | 11.4% |
| 20 to 24 Minutes | 8 | 9.1% |
| 25 to 29 Minutes | 0 | 0.0% |
| 30 to 34 Minutes | 25 | 28.4% |
| 35 to 39 Minutes | 6 | 6.8% |
| 40 to 44 Minutes | 0 | 0.0% |
| 45 to 59 Minutes | 6 | 6.8% |
| 60 to 89 Minutes | 4 | 4.5% |
| 90 or more Minutes | 2 | 2.3% |
Commute Time by Sex in Arlington
The most common commute times in Arlington are 30 to 34 minutes (11 commuters, 35.5%) for males and 10 to 14 minutes (14 commuters, 24.6%) for females.
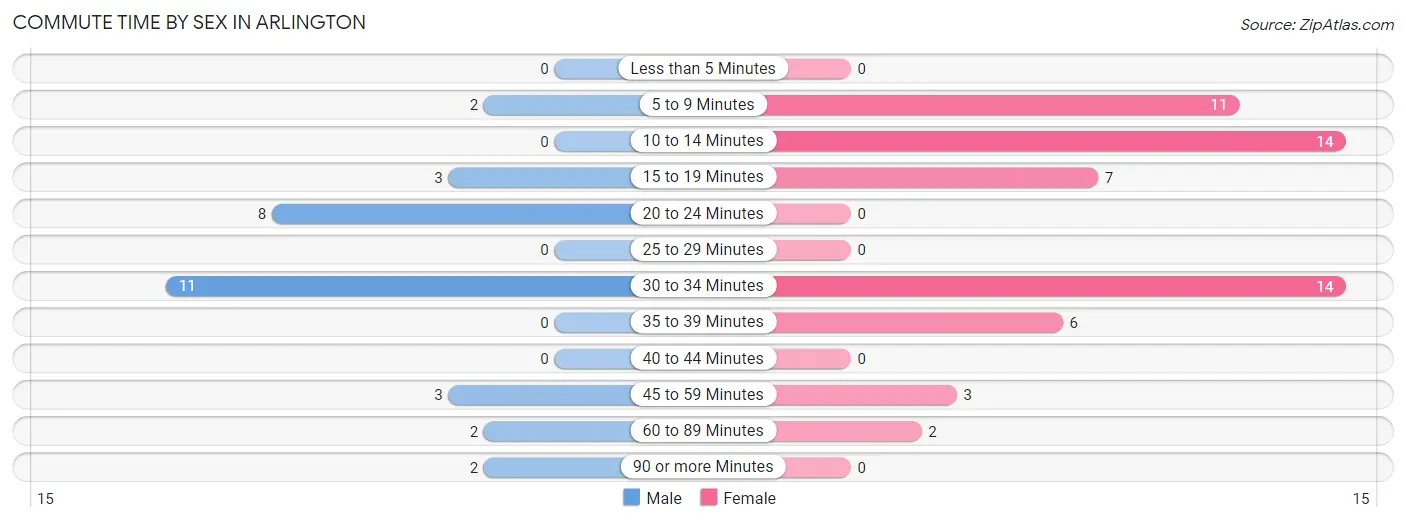
| Commute Time | Male | Female |
| Less than 5 Minutes | 0 (0.0%) | 0 (0.0%) |
| 5 to 9 Minutes | 2 (6.5%) | 11 (19.3%) |
| 10 to 14 Minutes | 0 (0.0%) | 14 (24.6%) |
| 15 to 19 Minutes | 3 (9.7%) | 7 (12.3%) |
| 20 to 24 Minutes | 8 (25.8%) | 0 (0.0%) |
| 25 to 29 Minutes | 0 (0.0%) | 0 (0.0%) |
| 30 to 34 Minutes | 11 (35.5%) | 14 (24.6%) |
| 35 to 39 Minutes | 0 (0.0%) | 6 (10.5%) |
| 40 to 44 Minutes | 0 (0.0%) | 0 (0.0%) |
| 45 to 59 Minutes | 3 (9.7%) | 3 (5.3%) |
| 60 to 89 Minutes | 2 (6.5%) | 2 (3.5%) |
| 90 or more Minutes | 2 (6.5%) | 0 (0.0%) |
Time of Departure to Work by Sex in Arlington
The most frequent times of departure to work in Arlington are 6:30 AM to 6:59 AM (8, 25.8%) for males and 12:00 PM to 3:59 PM (15, 26.3%) for females.
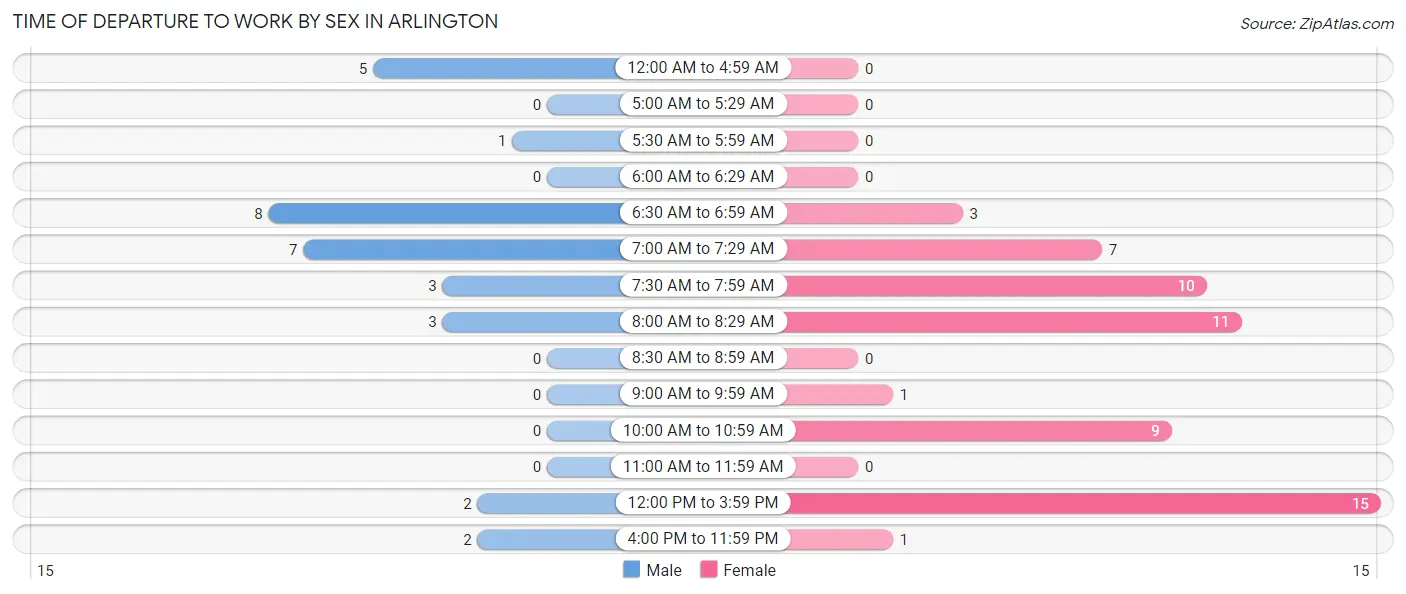
| Time of Departure | Male | Female |
| 12:00 AM to 4:59 AM | 5 (16.1%) | 0 (0.0%) |
| 5:00 AM to 5:29 AM | 0 (0.0%) | 0 (0.0%) |
| 5:30 AM to 5:59 AM | 1 (3.2%) | 0 (0.0%) |
| 6:00 AM to 6:29 AM | 0 (0.0%) | 0 (0.0%) |
| 6:30 AM to 6:59 AM | 8 (25.8%) | 3 (5.3%) |
| 7:00 AM to 7:29 AM | 7 (22.6%) | 7 (12.3%) |
| 7:30 AM to 7:59 AM | 3 (9.7%) | 10 (17.5%) |
| 8:00 AM to 8:29 AM | 3 (9.7%) | 11 (19.3%) |
| 8:30 AM to 8:59 AM | 0 (0.0%) | 0 (0.0%) |
| 9:00 AM to 9:59 AM | 0 (0.0%) | 1 (1.8%) |
| 10:00 AM to 10:59 AM | 0 (0.0%) | 9 (15.8%) |
| 11:00 AM to 11:59 AM | 0 (0.0%) | 0 (0.0%) |
| 12:00 PM to 3:59 PM | 2 (6.5%) | 15 (26.3%) |
| 4:00 PM to 11:59 PM | 2 (6.5%) | 1 (1.8%) |
| Total | 31 (100.0%) | 57 (100.0%) |
Housing Occupancy in Arlington
Occupancy by Ownership in Arlington
Of the total 125 dwellings in Arlington, owner-occupied units account for 77 (61.6%), while renter-occupied units make up 48 (38.4%).
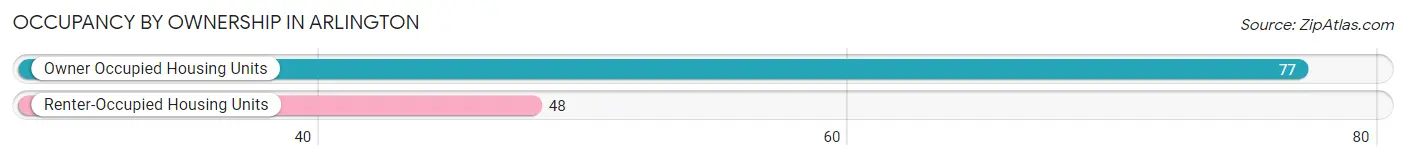
| Occupancy | # Housing Units | % Housing Units |
| Owner Occupied Housing Units | 77 | 61.6% |
| Renter-Occupied Housing Units | 48 | 38.4% |
| Total Occupied Housing Units | 125 | 100.0% |
Occupancy by Household Size in Arlington
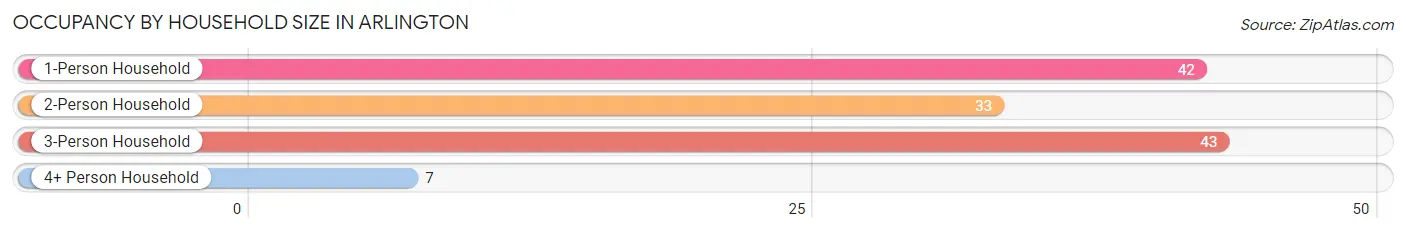
| Household Size | # Housing Units | % Housing Units |
| 1-Person Household | 42 | 33.6% |
| 2-Person Household | 33 | 26.4% |
| 3-Person Household | 43 | 34.4% |
| 4+ Person Household | 7 | 5.6% |
| Total Housing Units | 125 | 100.0% |
Occupancy by Ownership by Household Size in Arlington
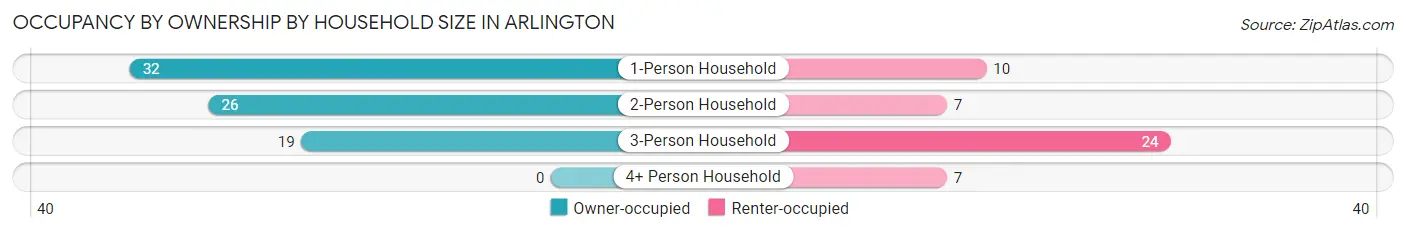
| Household Size | Owner-occupied | Renter-occupied |
| 1-Person Household | 32 (76.2%) | 10 (23.8%) |
| 2-Person Household | 26 (78.8%) | 7 (21.2%) |
| 3-Person Household | 19 (44.2%) | 24 (55.8%) |
| 4+ Person Household | 0 (0.0%) | 7 (100.0%) |
| Total Housing Units | 77 (61.6%) | 48 (38.4%) |
Occupancy by Educational Attainment in Arlington
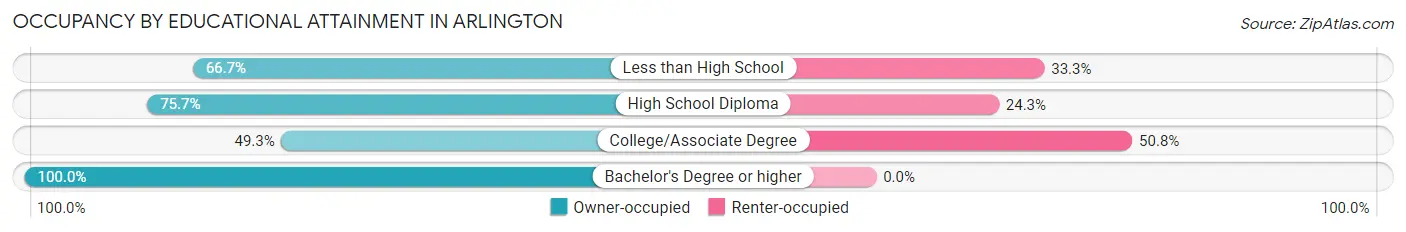
| Household Size | Owner-occupied | Renter-occupied |
| Less than High School | 10 (66.7%) | 5 (33.3%) |
| High School Diploma | 28 (75.7%) | 9 (24.3%) |
| College/Associate Degree | 33 (49.2%) | 34 (50.7%) |
| Bachelor's Degree or higher | 6 (100.0%) | 0 (0.0%) |
Occupancy by Age of Householder in Arlington
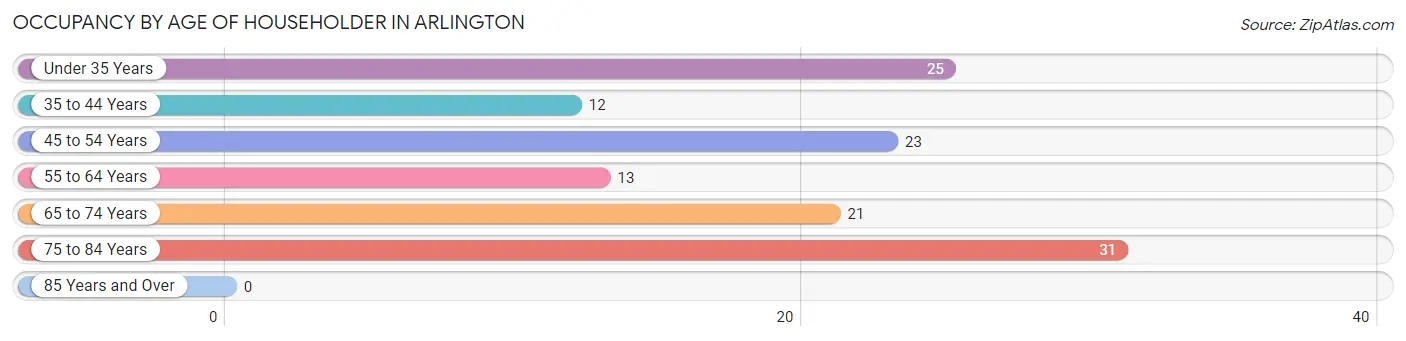
| Age Bracket | # Households | % Households |
| Under 35 Years | 25 | 20.0% |
| 35 to 44 Years | 12 | 9.6% |
| 45 to 54 Years | 23 | 18.4% |
| 55 to 64 Years | 13 | 10.4% |
| 65 to 74 Years | 21 | 16.8% |
| 75 to 84 Years | 31 | 24.8% |
| 85 Years and Over | 0 | 0.0% |
| Total | 125 | 100.0% |
Housing Finances in Arlington
Median Income by Occupancy in Arlington
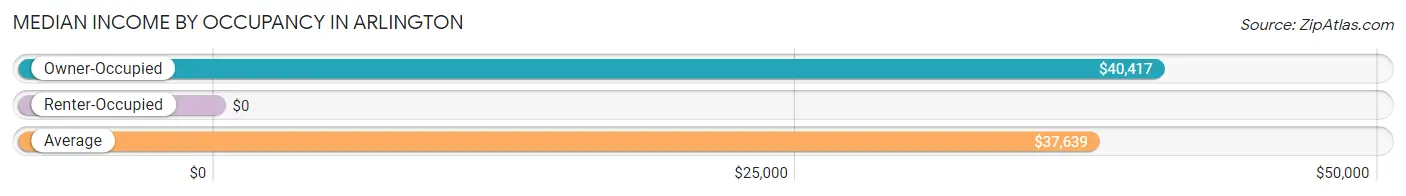
| Occupancy Type | # Households | Median Income |
| Owner-Occupied | 77 (61.6%) | $40,417 |
| Renter-Occupied | 48 (38.4%) | $0 |
| Average | 125 (100.0%) | $37,639 |
Occupancy by Householder Income Bracket in Arlington
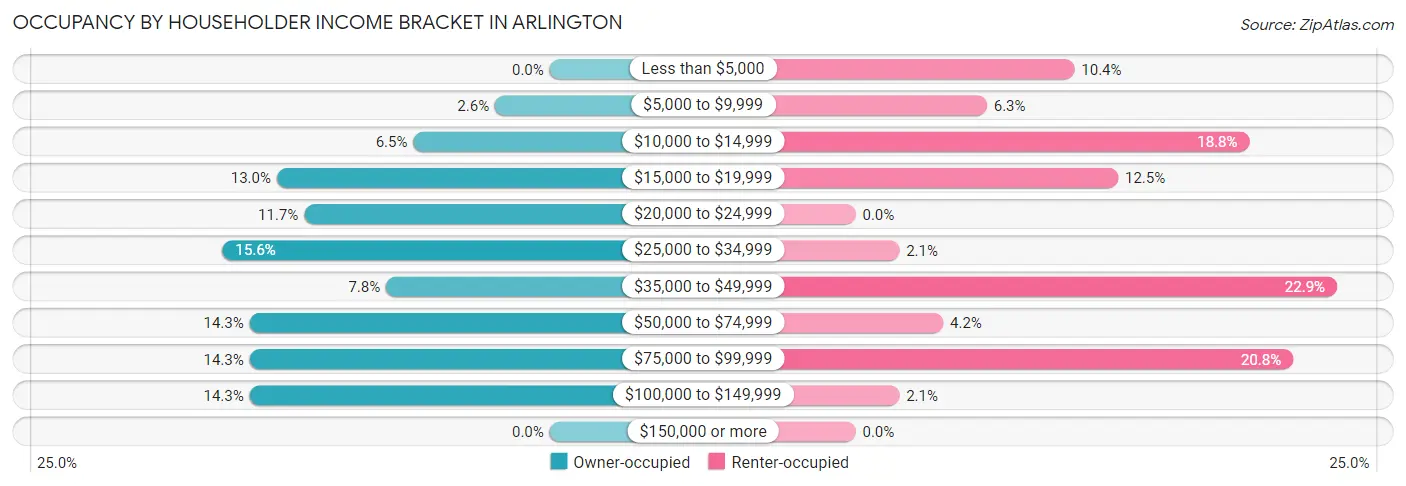
| Income Bracket | Owner-occupied | Renter-occupied |
| Less than $5,000 | 0 (0.0%) | 5 (10.4%) |
| $5,000 to $9,999 | 2 (2.6%) | 3 (6.2%) |
| $10,000 to $14,999 | 5 (6.5%) | 9 (18.8%) |
| $15,000 to $19,999 | 10 (13.0%) | 6 (12.5%) |
| $20,000 to $24,999 | 9 (11.7%) | 0 (0.0%) |
| $25,000 to $34,999 | 12 (15.6%) | 1 (2.1%) |
| $35,000 to $49,999 | 6 (7.8%) | 11 (22.9%) |
| $50,000 to $74,999 | 11 (14.3%) | 2 (4.2%) |
| $75,000 to $99,999 | 11 (14.3%) | 10 (20.8%) |
| $100,000 to $149,999 | 11 (14.3%) | 1 (2.1%) |
| $150,000 or more | 0 (0.0%) | 0 (0.0%) |
| Total | 77 (100.0%) | 48 (100.0%) |
Monthly Housing Cost Tiers in Arlington
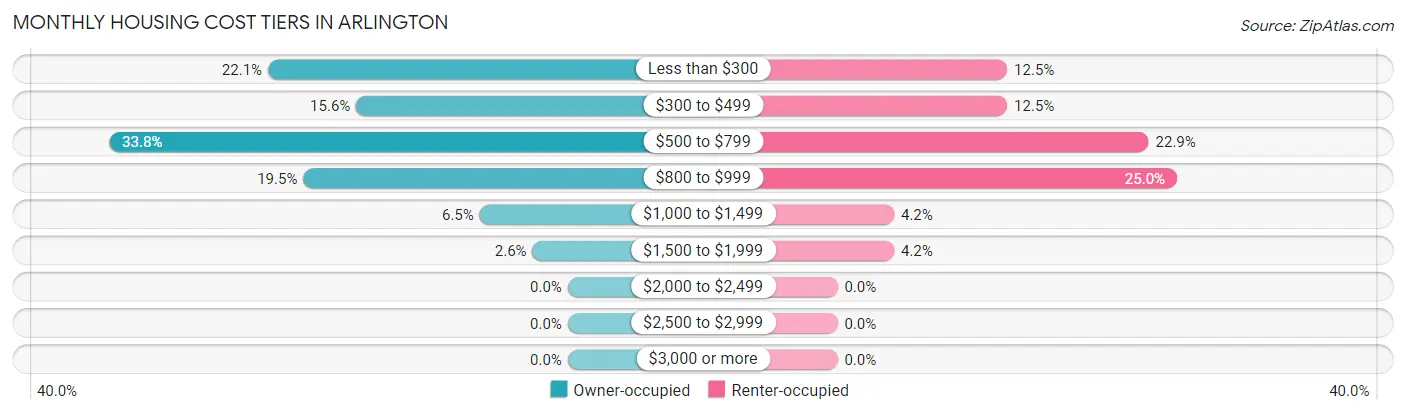
| Monthly Cost | Owner-occupied | Renter-occupied |
| Less than $300 | 17 (22.1%) | 6 (12.5%) |
| $300 to $499 | 12 (15.6%) | 6 (12.5%) |
| $500 to $799 | 26 (33.8%) | 11 (22.9%) |
| $800 to $999 | 15 (19.5%) | 12 (25.0%) |
| $1,000 to $1,499 | 5 (6.5%) | 2 (4.2%) |
| $1,500 to $1,999 | 2 (2.6%) | 2 (4.2%) |
| $2,000 to $2,499 | 0 (0.0%) | 0 (0.0%) |
| $2,500 to $2,999 | 0 (0.0%) | 0 (0.0%) |
| $3,000 or more | 0 (0.0%) | 0 (0.0%) |
| Total | 77 (100.0%) | 48 (100.0%) |
Physical Housing Characteristics in Arlington
Housing Structures in Arlington
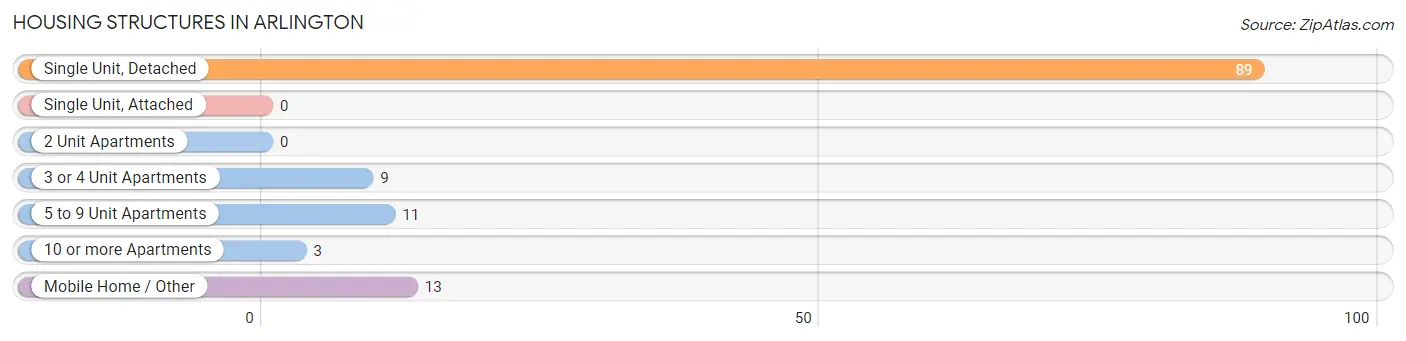
| Structure Type | # Housing Units | % Housing Units |
| Single Unit, Detached | 89 | 71.2% |
| Single Unit, Attached | 0 | 0.0% |
| 2 Unit Apartments | 0 | 0.0% |
| 3 or 4 Unit Apartments | 9 | 7.2% |
| 5 to 9 Unit Apartments | 11 | 8.8% |
| 10 or more Apartments | 3 | 2.4% |
| Mobile Home / Other | 13 | 10.4% |
| Total | 125 | 100.0% |
Housing Structures by Occupancy in Arlington
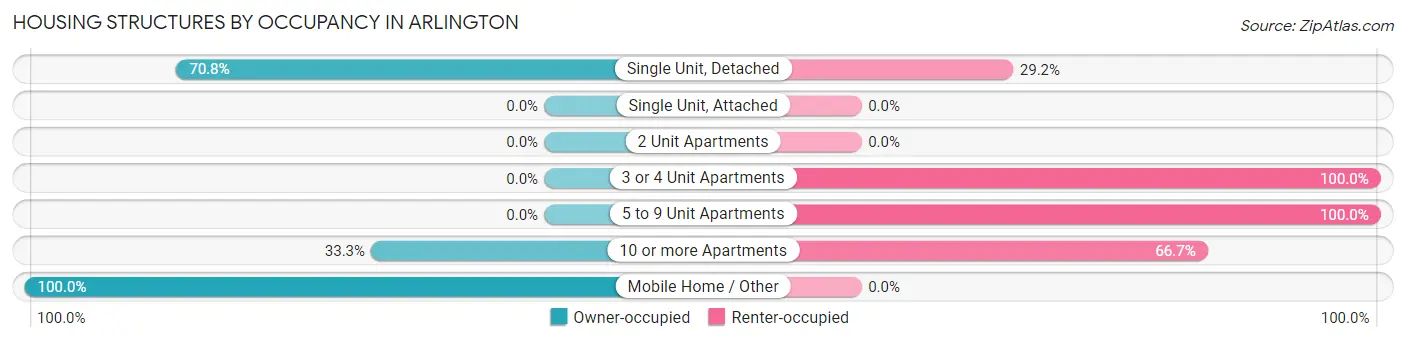
| Structure Type | Owner-occupied | Renter-occupied |
| Single Unit, Detached | 63 (70.8%) | 26 (29.2%) |
| Single Unit, Attached | 0 (0.0%) | 0 (0.0%) |
| 2 Unit Apartments | 0 (0.0%) | 0 (0.0%) |
| 3 or 4 Unit Apartments | 0 (0.0%) | 9 (100.0%) |
| 5 to 9 Unit Apartments | 0 (0.0%) | 11 (100.0%) |
| 10 or more Apartments | 1 (33.3%) | 2 (66.7%) |
| Mobile Home / Other | 13 (100.0%) | 0 (0.0%) |
| Total | 77 (61.6%) | 48 (38.4%) |
Housing Structures by Number of Rooms in Arlington
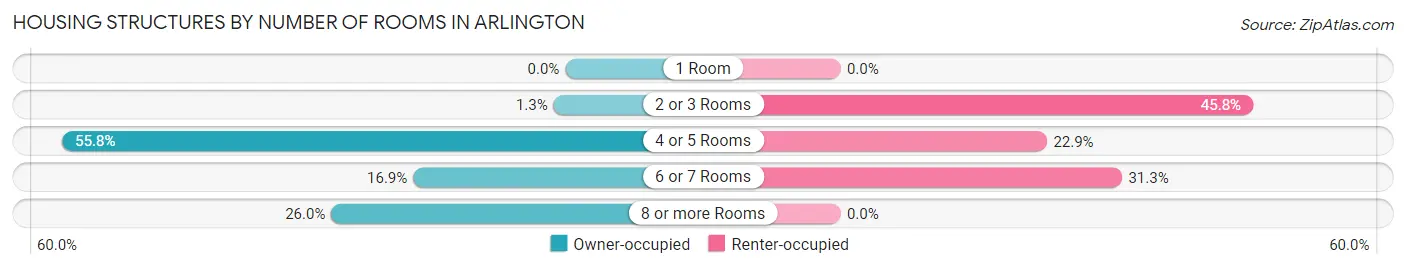
| Number of Rooms | Owner-occupied | Renter-occupied |
| 1 Room | 0 (0.0%) | 0 (0.0%) |
| 2 or 3 Rooms | 1 (1.3%) | 22 (45.8%) |
| 4 or 5 Rooms | 43 (55.8%) | 11 (22.9%) |
| 6 or 7 Rooms | 13 (16.9%) | 15 (31.2%) |
| 8 or more Rooms | 20 (26.0%) | 0 (0.0%) |
| Total | 77 (100.0%) | 48 (100.0%) |
Housing Structure by Heating Type in Arlington
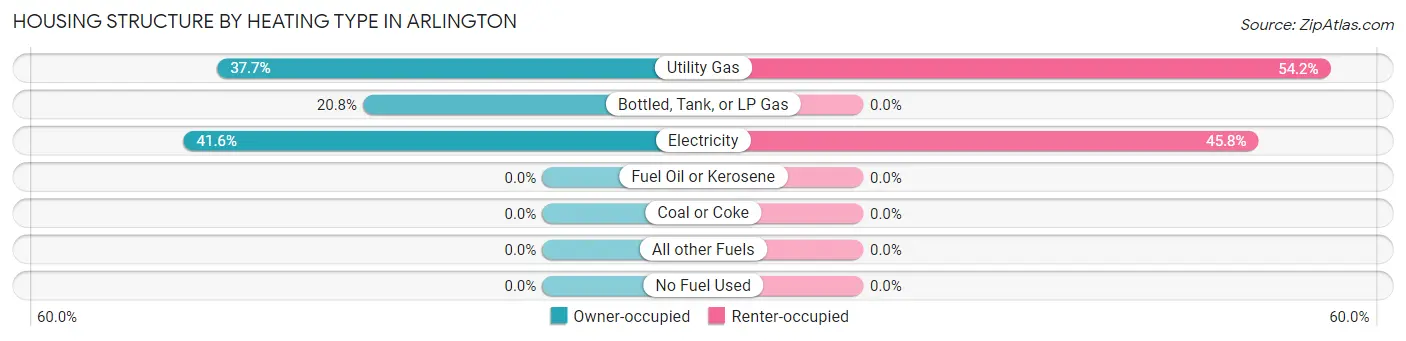
| Heating Type | Owner-occupied | Renter-occupied |
| Utility Gas | 29 (37.7%) | 26 (54.2%) |
| Bottled, Tank, or LP Gas | 16 (20.8%) | 0 (0.0%) |
| Electricity | 32 (41.6%) | 22 (45.8%) |
| Fuel Oil or Kerosene | 0 (0.0%) | 0 (0.0%) |
| Coal or Coke | 0 (0.0%) | 0 (0.0%) |
| All other Fuels | 0 (0.0%) | 0 (0.0%) |
| No Fuel Used | 0 (0.0%) | 0 (0.0%) |
| Total | 77 (100.0%) | 48 (100.0%) |
Household Vehicle Usage in Arlington
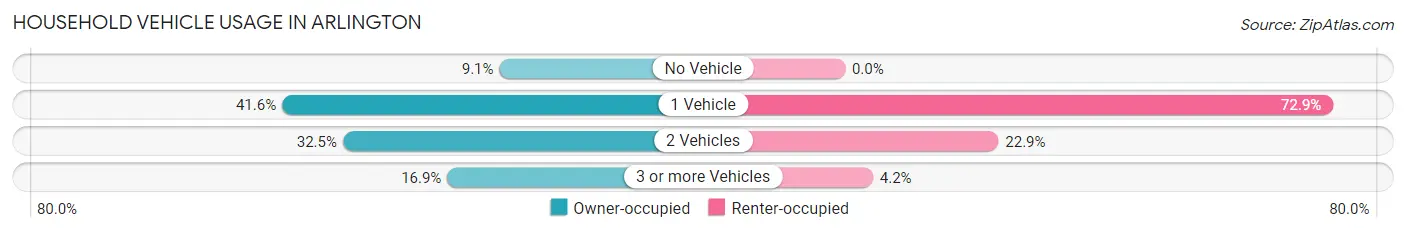
| Vehicles per Household | Owner-occupied | Renter-occupied |
| No Vehicle | 7 (9.1%) | 0 (0.0%) |
| 1 Vehicle | 32 (41.6%) | 35 (72.9%) |
| 2 Vehicles | 25 (32.5%) | 11 (22.9%) |
| 3 or more Vehicles | 13 (16.9%) | 2 (4.2%) |
| Total | 77 (100.0%) | 48 (100.0%) |
Real Estate & Mortgages in Arlington
Real Estate and Mortgage Overview in Arlington
| Characteristic | Without Mortgage | With Mortgage |
| Housing Units | 54 | 23 |
| Median Property Value | $94,000 | $71,700 |
| Median Household Income | $28,056 | $0 |
| Monthly Housing Costs | $475 | $0 |
| Real Estate Taxes | - | - |
Property Value by Mortgage Status in Arlington
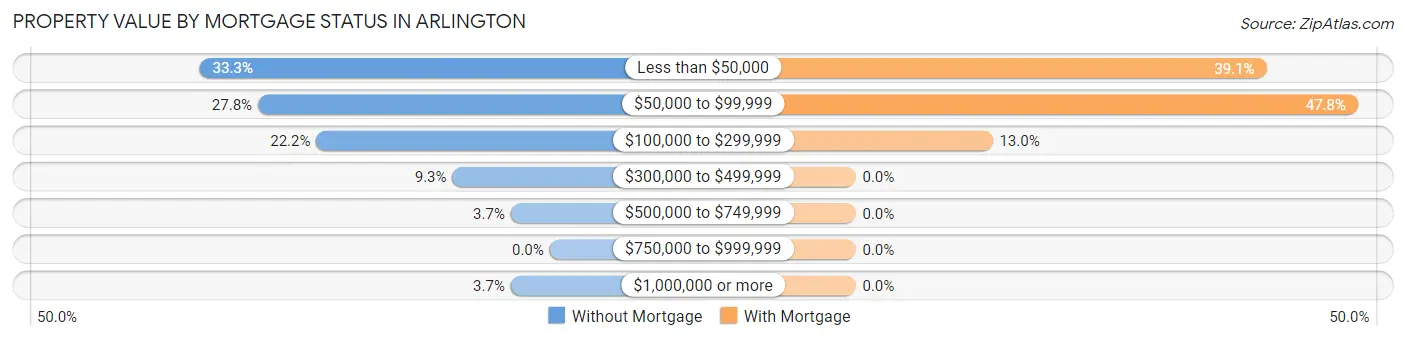
| Property Value | Without Mortgage | With Mortgage |
| Less than $50,000 | 18 (33.3%) | 9 (39.1%) |
| $50,000 to $99,999 | 15 (27.8%) | 11 (47.8%) |
| $100,000 to $299,999 | 12 (22.2%) | 3 (13.0%) |
| $300,000 to $499,999 | 5 (9.3%) | 0 (0.0%) |
| $500,000 to $749,999 | 2 (3.7%) | 0 (0.0%) |
| $750,000 to $999,999 | 0 (0.0%) | 0 (0.0%) |
| $1,000,000 or more | 2 (3.7%) | 0 (0.0%) |
| Total | 54 (100.0%) | 23 (100.0%) |
Household Income by Mortgage Status in Arlington
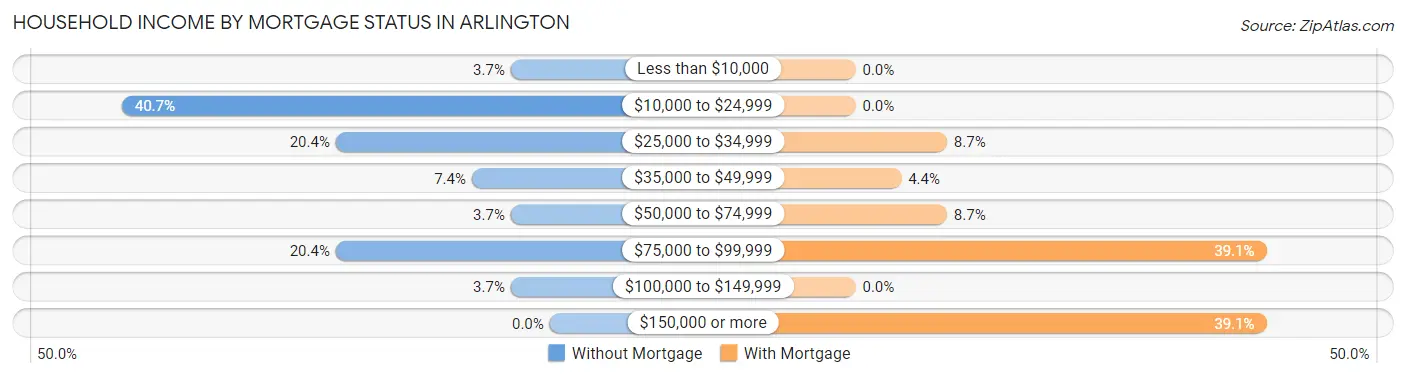
| Household Income | Without Mortgage | With Mortgage |
| Less than $10,000 | 2 (3.7%) | 0 (0.0%) |
| $10,000 to $24,999 | 22 (40.7%) | 0 (0.0%) |
| $25,000 to $34,999 | 11 (20.4%) | 2 (8.7%) |
| $35,000 to $49,999 | 4 (7.4%) | 1 (4.3%) |
| $50,000 to $74,999 | 2 (3.7%) | 2 (8.7%) |
| $75,000 to $99,999 | 11 (20.4%) | 9 (39.1%) |
| $100,000 to $149,999 | 2 (3.7%) | 0 (0.0%) |
| $150,000 or more | 0 (0.0%) | 9 (39.1%) |
| Total | 54 (100.0%) | 23 (100.0%) |
Property Value to Household Income Ratio in Arlington
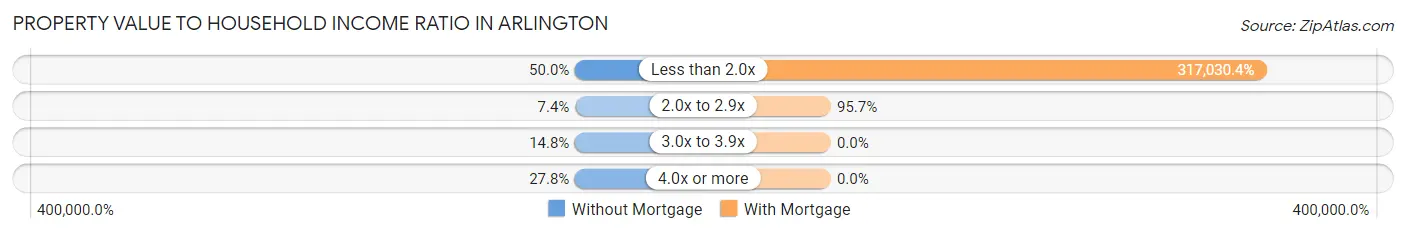
| Value-to-Income Ratio | Without Mortgage | With Mortgage |
| Less than 2.0x | 27 (50.0%) | 72,917 (317,030.4%) |
| 2.0x to 2.9x | 4 (7.4%) | 22 (95.7%) |
| 3.0x to 3.9x | 8 (14.8%) | 0 (0.0%) |
| 4.0x or more | 15 (27.8%) | 0 (0.0%) |
| Total | 54 (100.0%) | 23 (100.0%) |
Real Estate Taxes by Mortgage Status in Arlington
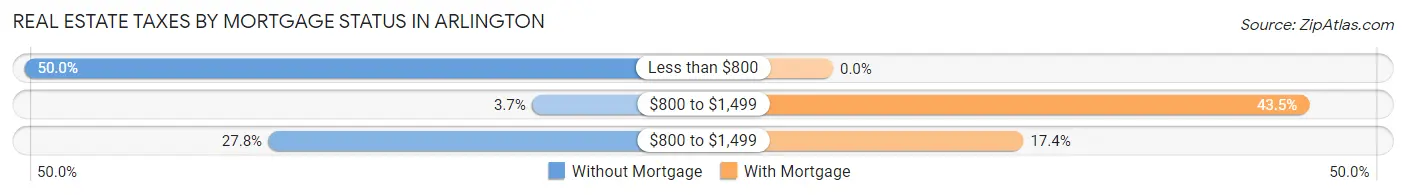
| Property Taxes | Without Mortgage | With Mortgage |
| Less than $800 | 27 (50.0%) | 0 (0.0%) |
| $800 to $1,499 | 2 (3.7%) | 10 (43.5%) |
| $800 to $1,499 | 15 (27.8%) | 4 (17.4%) |
| Total | 54 (100.0%) | 23 (100.0%) |
Health & Disability in Arlington
Health Insurance Coverage by Age in Arlington
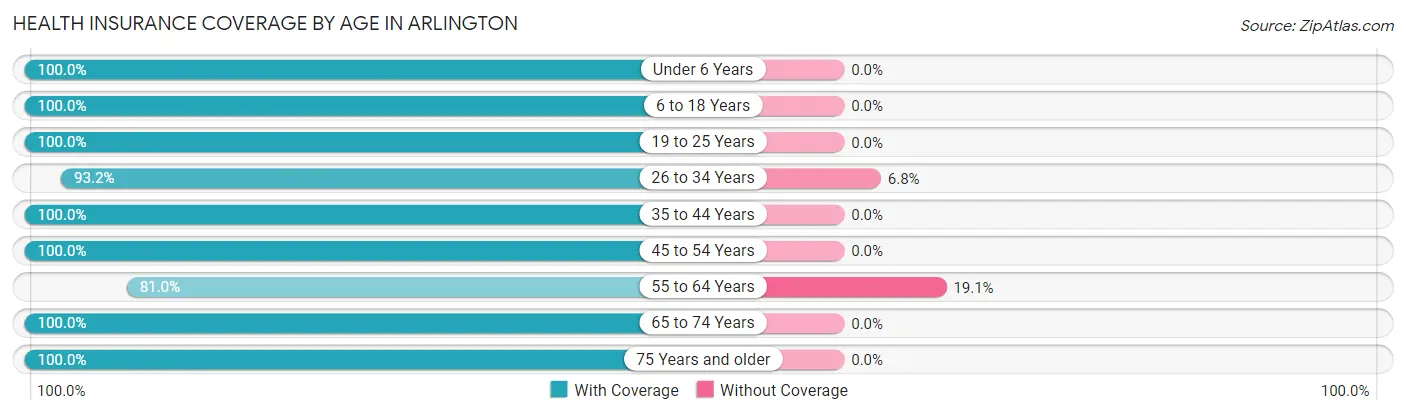
| Age Bracket | With Coverage | Without Coverage |
| Under 6 Years | 36 (100.0%) | 0 (0.0%) |
| 6 to 18 Years | 27 (100.0%) | 0 (0.0%) |
| 19 to 25 Years | 12 (100.0%) | 0 (0.0%) |
| 26 to 34 Years | 41 (93.2%) | 3 (6.8%) |
| 35 to 44 Years | 17 (100.0%) | 0 (0.0%) |
| 45 to 54 Years | 42 (100.0%) | 0 (0.0%) |
| 55 to 64 Years | 17 (80.9%) | 4 (19.1%) |
| 65 to 74 Years | 26 (100.0%) | 0 (0.0%) |
| 75 Years and older | 41 (100.0%) | 0 (0.0%) |
| Total | 259 (97.4%) | 7 (2.6%) |
Health Insurance Coverage by Citizenship Status in Arlington
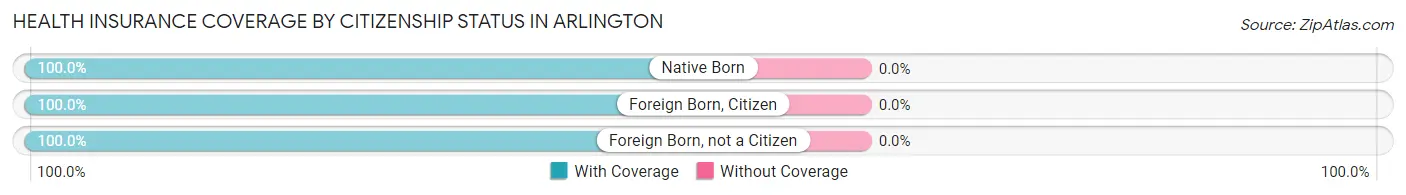
| Citizenship Status | With Coverage | Without Coverage |
| Native Born | 36 (100.0%) | 0 (0.0%) |
| Foreign Born, Citizen | 27 (100.0%) | 0 (0.0%) |
| Foreign Born, not a Citizen | 12 (100.0%) | 0 (0.0%) |
Health Insurance Coverage by Household Income in Arlington
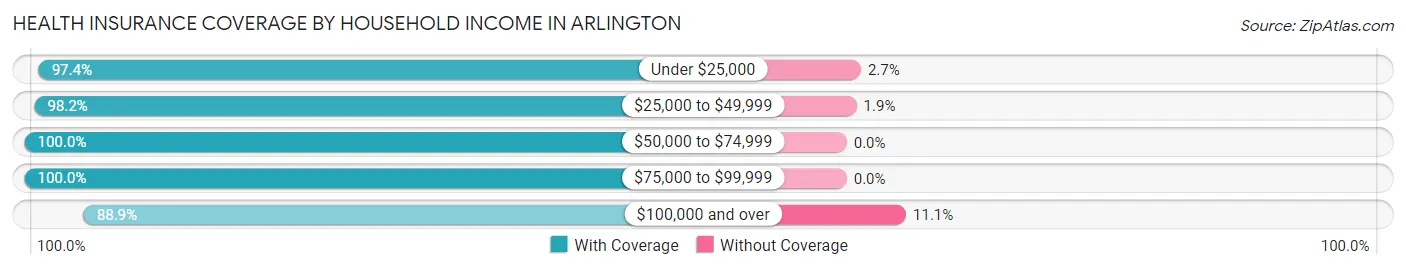
| Household Income | With Coverage | Without Coverage |
| Under $25,000 | 110 (97.4%) | 3 (2.6%) |
| $25,000 to $49,999 | 53 (98.2%) | 1 (1.8%) |
| $50,000 to $74,999 | 22 (100.0%) | 0 (0.0%) |
| $75,000 to $99,999 | 50 (100.0%) | 0 (0.0%) |
| $100,000 and over | 24 (88.9%) | 3 (11.1%) |
Public vs Private Health Insurance Coverage by Age in Arlington
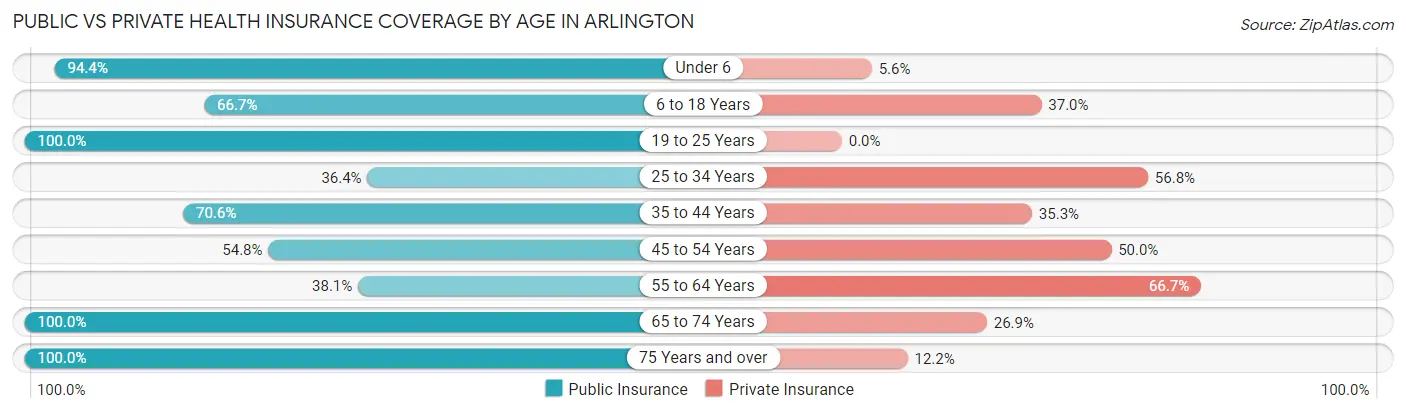
| Age Bracket | Public Insurance | Private Insurance |
| Under 6 | 34 (94.4%) | 2 (5.6%) |
| 6 to 18 Years | 18 (66.7%) | 10 (37.0%) |
| 19 to 25 Years | 12 (100.0%) | 0 (0.0%) |
| 25 to 34 Years | 16 (36.4%) | 25 (56.8%) |
| 35 to 44 Years | 12 (70.6%) | 6 (35.3%) |
| 45 to 54 Years | 23 (54.8%) | 21 (50.0%) |
| 55 to 64 Years | 8 (38.1%) | 14 (66.7%) |
| 65 to 74 Years | 26 (100.0%) | 7 (26.9%) |
| 75 Years and over | 41 (100.0%) | 5 (12.2%) |
| Total | 190 (71.4%) | 90 (33.8%) |
Disability Status by Sex by Age in Arlington
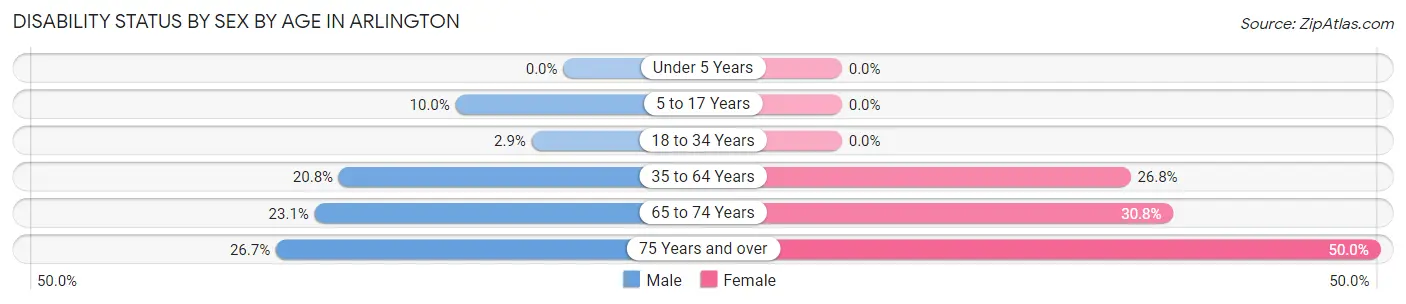
| Age Bracket | Male | Female |
| Under 5 Years | 0 (0.0%) | 0 (0.0%) |
| 5 to 17 Years | 1 (10.0%) | 0 (0.0%) |
| 18 to 34 Years | 1 (2.9%) | 0 (0.0%) |
| 35 to 64 Years | 5 (20.8%) | 15 (26.8%) |
| 65 to 74 Years | 3 (23.1%) | 4 (30.8%) |
| 75 Years and over | 4 (26.7%) | 13 (50.0%) |
Disability Class by Sex by Age in Arlington
Disability Class: Hearing Difficulty
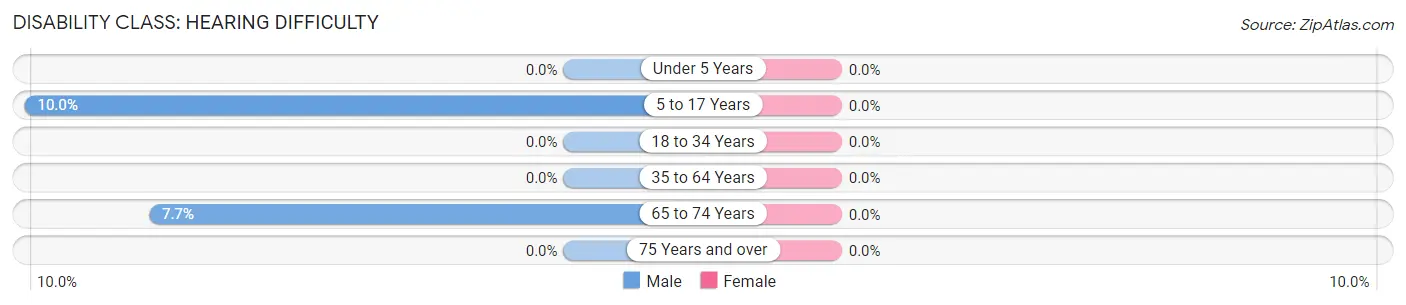
| Age Bracket | Male | Female |
| Under 5 Years | 0 (0.0%) | 0 (0.0%) |
| 5 to 17 Years | 1 (10.0%) | 0 (0.0%) |
| 18 to 34 Years | 0 (0.0%) | 0 (0.0%) |
| 35 to 64 Years | 0 (0.0%) | 0 (0.0%) |
| 65 to 74 Years | 1 (7.7%) | 0 (0.0%) |
| 75 Years and over | 0 (0.0%) | 0 (0.0%) |
Disability Class: Vision Difficulty
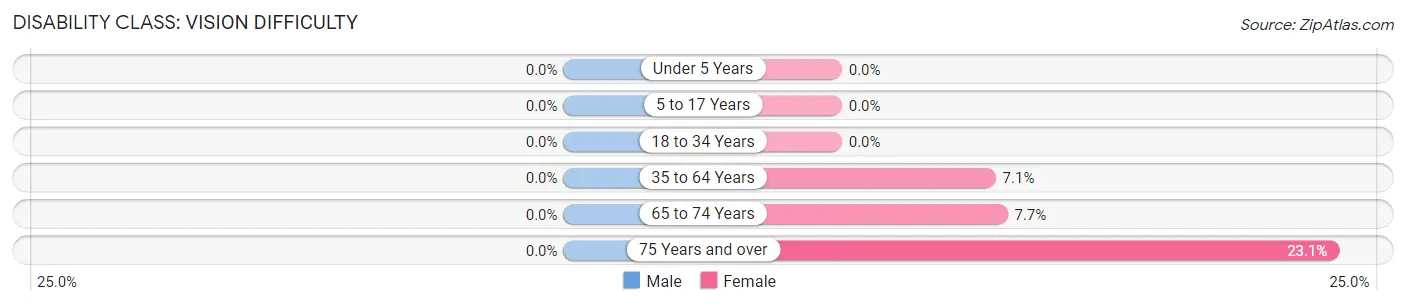
| Age Bracket | Male | Female |
| Under 5 Years | 0 (0.0%) | 0 (0.0%) |
| 5 to 17 Years | 0 (0.0%) | 0 (0.0%) |
| 18 to 34 Years | 0 (0.0%) | 0 (0.0%) |
| 35 to 64 Years | 0 (0.0%) | 4 (7.1%) |
| 65 to 74 Years | 0 (0.0%) | 1 (7.7%) |
| 75 Years and over | 0 (0.0%) | 6 (23.1%) |
Disability Class: Cognitive Difficulty
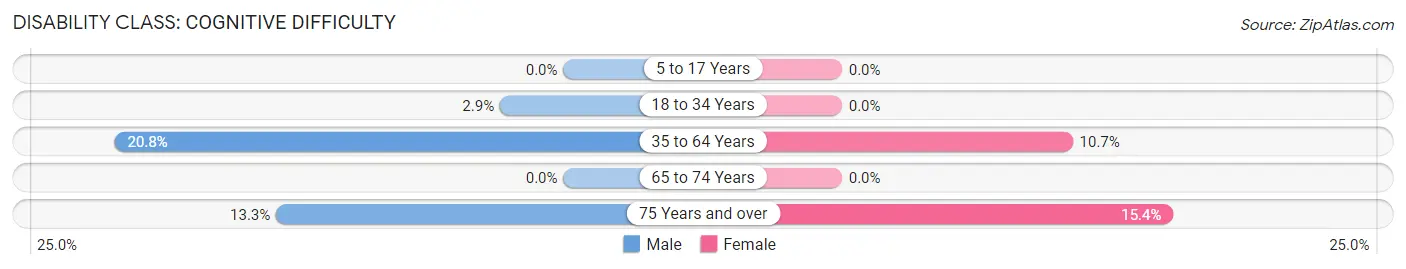
| Age Bracket | Male | Female |
| 5 to 17 Years | 0 (0.0%) | 0 (0.0%) |
| 18 to 34 Years | 1 (2.9%) | 0 (0.0%) |
| 35 to 64 Years | 5 (20.8%) | 6 (10.7%) |
| 65 to 74 Years | 0 (0.0%) | 0 (0.0%) |
| 75 Years and over | 2 (13.3%) | 4 (15.4%) |
Disability Class: Ambulatory Difficulty
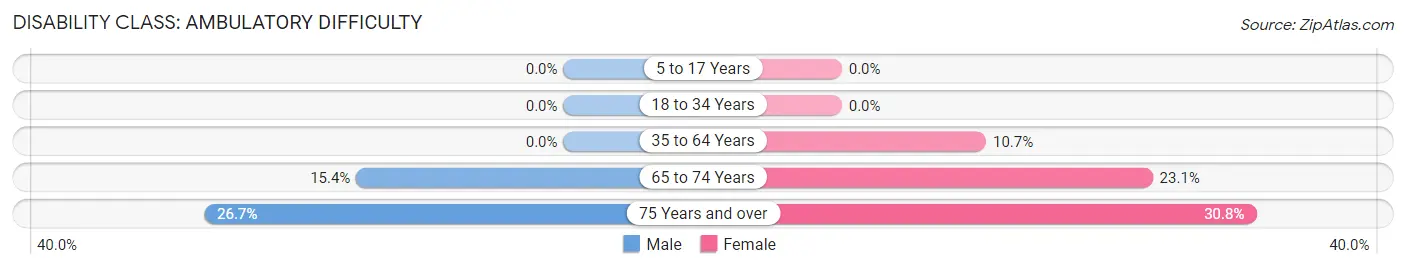
| Age Bracket | Male | Female |
| 5 to 17 Years | 0 (0.0%) | 0 (0.0%) |
| 18 to 34 Years | 0 (0.0%) | 0 (0.0%) |
| 35 to 64 Years | 0 (0.0%) | 6 (10.7%) |
| 65 to 74 Years | 2 (15.4%) | 3 (23.1%) |
| 75 Years and over | 4 (26.7%) | 8 (30.8%) |
Disability Class: Self-Care Difficulty
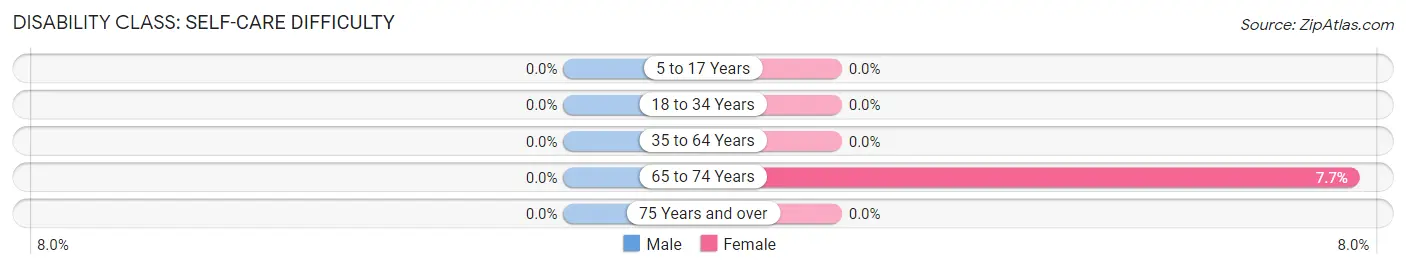
| Age Bracket | Male | Female |
| 5 to 17 Years | 0 (0.0%) | 0 (0.0%) |
| 18 to 34 Years | 0 (0.0%) | 0 (0.0%) |
| 35 to 64 Years | 0 (0.0%) | 0 (0.0%) |
| 65 to 74 Years | 0 (0.0%) | 1 (7.7%) |
| 75 Years and over | 0 (0.0%) | 0 (0.0%) |
Technology Access in Arlington
Computing Device Access in Arlington
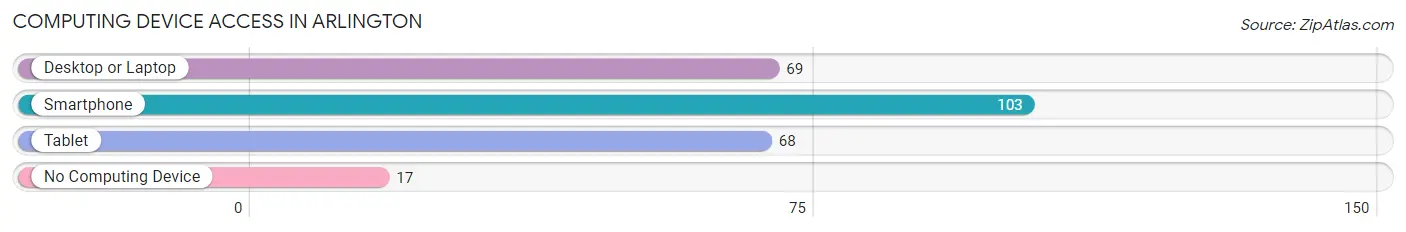
| Device Type | # Households | % Households |
| Desktop or Laptop | 69 | 55.2% |
| Smartphone | 103 | 82.4% |
| Tablet | 68 | 54.4% |
| No Computing Device | 17 | 13.6% |
| Total | 125 | 100.0% |
Internet Access in Arlington
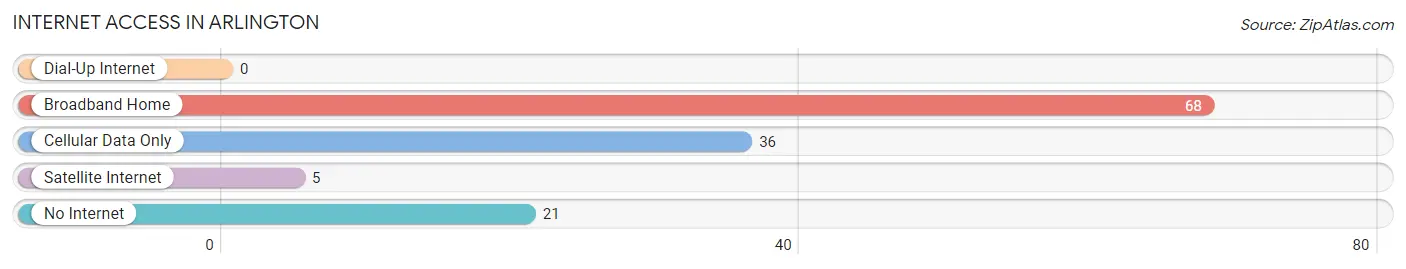
| Internet Type | # Households | % Households |
| Dial-Up Internet | 0 | 0.0% |
| Broadband Home | 68 | 54.4% |
| Cellular Data Only | 36 | 28.8% |
| Satellite Internet | 5 | 4.0% |
| No Internet | 21 | 16.8% |
| Total | 125 | 100.0% |
Arlington Summary
Arlington is a small city located in the northern part of Kentucky, in the United States. It is situated in the county of Boone, and is part of the Cincinnati metropolitan area. The city has a population of approximately 2,000 people, and is known for its rural charm and small-town atmosphere.
History
Arlington was first settled in the early 1800s by a group of German immigrants. The town was originally known as “German Town”, and was later renamed to Arlington in 1845. The name was chosen in honor of General Robert E. Lee’s hometown of Arlington, Virginia.
The town was incorporated in 1867, and the first mayor was elected in 1868. During the late 1800s and early 1900s, Arlington experienced a period of growth and prosperity. The town was home to several businesses, including a flour mill, a sawmill, a brickyard, and a furniture factory.
Geography
Arlington is located in the northern part of Kentucky, in the county of Boone. It is situated on the banks of the Ohio River, and is part of the Cincinnati metropolitan area. The city has a total area of 1.3 square miles, all of which is land.
The climate in Arlington is classified as humid subtropical, with hot, humid summers and cold, wet winters. The average annual temperature is around 57 degrees Fahrenheit, and the average annual precipitation is around 43 inches.
Economy
The economy of Arlington is largely based on agriculture and manufacturing. The city is home to several farms, which produce a variety of crops, including corn, soybeans, and wheat. The city is also home to several manufacturing companies, which produce a variety of products, including furniture, clothing, and automotive parts.
The city is also home to several small businesses, including restaurants, retail stores, and professional services. The city is also home to several educational institutions, including a community college and a vocational school.
Demographics
As of the 2010 census, the population of Arlington was 2,000 people. The racial makeup of the city was 95.2% White, 1.7% African American, 0.3% Native American, 0.3% Asian, 0.1% Pacific Islander, 0.7% from other races, and 1.9% from two or more races. Hispanic or Latino of any race were 2.2% of the population.
The median income for a household in the city was $41,250, and the median income for a family was $50,000. The per capita income for the city was $20,845. About 11.2% of families and 14.2% of the population were below the poverty line, including 18.2% of those under age 18 and 8.3% of those age 65 or over.
Common Questions
What is Per Capita Income in Arlington?
Per Capita income in Arlington is $20,864.
What is the Median Family Income in Arlington?
Median Family Income in Arlington is $44,583.
What is the Median Household income in Arlington?
Median Household Income in Arlington is $37,639.
What is Inequality or Gini Index in Arlington?
Inequality or Gini Index in Arlington is 0.42.
What is the Total Population of Arlington?
Total Population of Arlington is 266.
What is the Total Male Population of Arlington?
Total Male Population of Arlington is 117.
What is the Total Female Population of Arlington?
Total Female Population of Arlington is 149.
What is the Ratio of Males per 100 Females in Arlington?
There are 78.52 Males per 100 Females in Arlington.
What is the Ratio of Females per 100 Males in Arlington?
There are 127.35 Females per 100 Males in Arlington.
What is the Median Population Age in Arlington?
Median Population Age in Arlington is 43.4 Years.
What is the Average Family Size in Arlington
Average Family Size in Arlington is 2.6 People.
What is the Average Household Size in Arlington
Average Household Size in Arlington is 2.1 People.
How Large is the Labor Force in Arlington?
There are 96 People in the Labor Forcein in Arlington.
What is the Percentage of People in the Labor Force in Arlington?
45.5% of People are in the Labor Force in Arlington.
What is the Unemployment Rate in Arlington?
Unemployment Rate in Arlington is 4.2%.