East Bernstadt, KY Map & Demographics
East Bernstadt Map
East Bernstadt Overview
$18,944
PER CAPITA INCOME
$35,750
AVG FAMILY INCOME
$34,632
AVG HOUSEHOLD INCOME
7.8%
WAGE / INCOME GAP [ % ]
92.2¢/ $1
WAGE / INCOME GAP [ $ ]
$12,185
FAMILY INCOME DEFICIT
0.43
INEQUALITY / GINI INDEX
850
TOTAL POPULATION
358
MALE POPULATION
492
FEMALE POPULATION
72.76
MALES / 100 FEMALES
137.43
FEMALES / 100 MALES
37.0
MEDIAN AGE
3.4
AVG FAMILY SIZE
2.9
AVG HOUSEHOLD SIZE
308
LABOR FORCE [ PEOPLE ]
46.1%
PERCENT IN LABOR FORCE
10.7%
UNEMPLOYMENT RATE
East Bernstadt Zip Codes
East Bernstadt Area Codes
Income in East Bernstadt
Income Overview in East Bernstadt
Per Capita Income in East Bernstadt is $18,944, while median incomes of families and households are $35,750 and $34,632 respectively.
| Characteristic | Number | Measure |
| Per Capita Income | 850 | $18,944 |
| Median Family Income | 224 | $35,750 |
| Mean Family Income | 224 | $46,813 |
| Median Household Income | 297 | $34,632 |
| Mean Household Income | 297 | $47,316 |
| Income Deficit | 224 | $12,185 |
| Wage / Income Gap (%) | 850 | 7.81% |
| Wage / Income Gap ($) | 850 | 92.19¢ per $1 |
| Gini / Inequality Index | 850 | 0.43 |
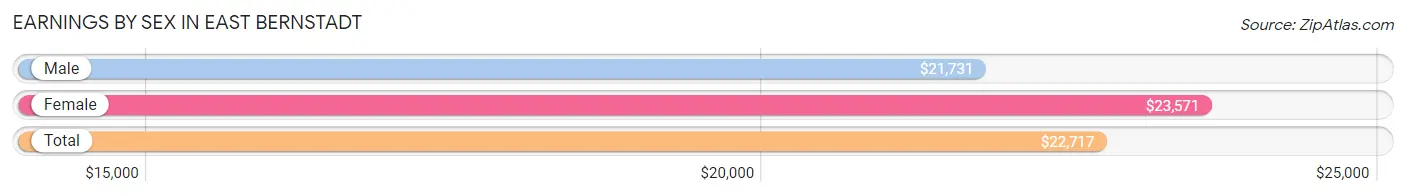
Earnings by Sex in East Bernstadt
Average Earnings in East Bernstadt are $22,717, $21,731 for men and $23,571 for women, a difference of 7.8%.
| Sex | Number | Average Earnings |
| Male | 152 (46.1%) | $21,731 |
| Female | 178 (53.9%) | $23,571 |
| Total | 330 (100.0%) | $22,717 |
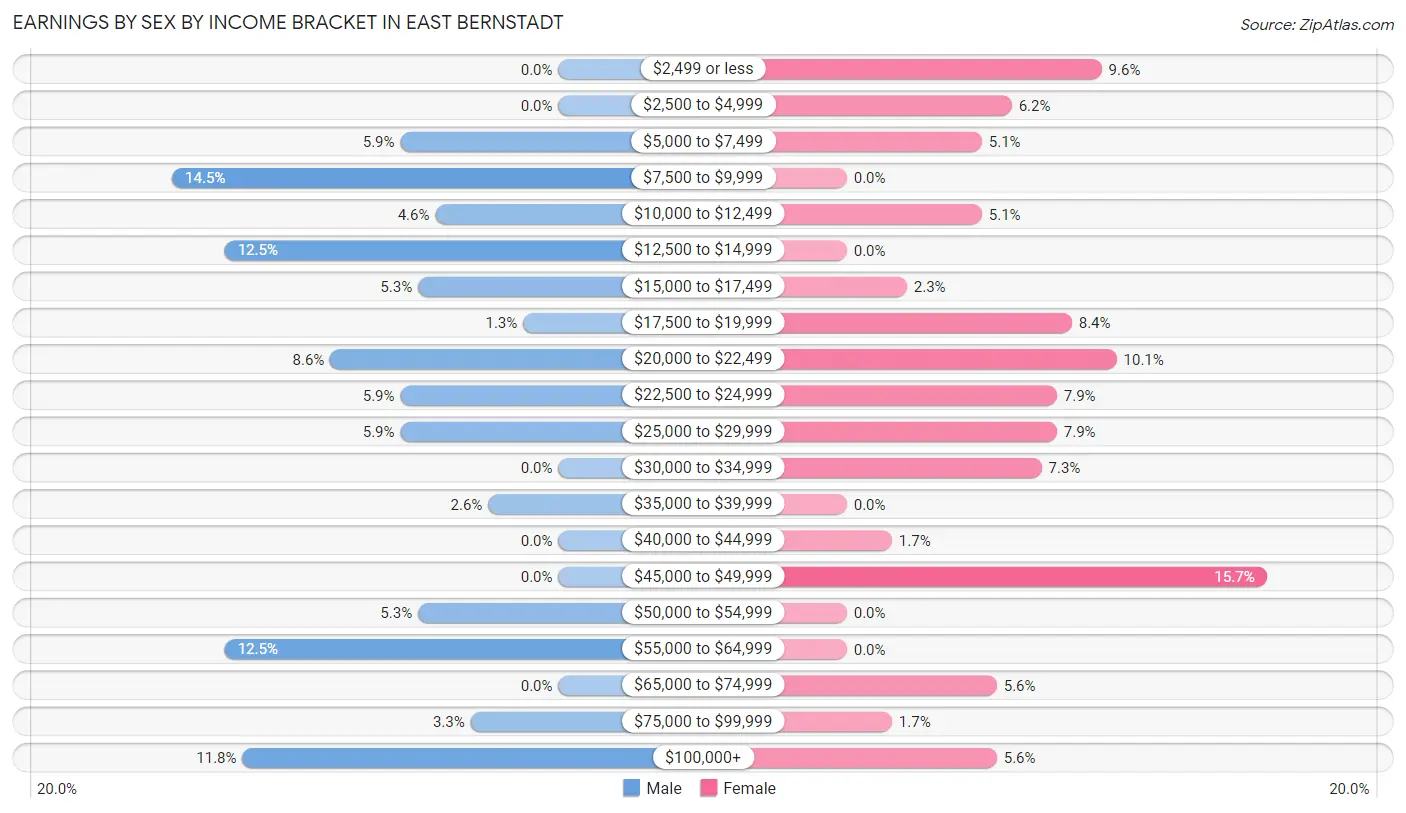
Earnings by Sex by Income Bracket in East Bernstadt
The most common earnings brackets in East Bernstadt are $7,500 to $9,999 for men (22 | 14.5%) and $45,000 to $49,999 for women (28 | 15.7%).
| Income | Male | Female |
| $2,499 or less | 0 (0.0%) | 17 (9.6%) |
| $2,500 to $4,999 | 0 (0.0%) | 11 (6.2%) |
| $5,000 to $7,499 | 9 (5.9%) | 9 (5.1%) |
| $7,500 to $9,999 | 22 (14.5%) | 0 (0.0%) |
| $10,000 to $12,499 | 7 (4.6%) | 9 (5.1%) |
| $12,500 to $14,999 | 19 (12.5%) | 0 (0.0%) |
| $15,000 to $17,499 | 8 (5.3%) | 4 (2.2%) |
| $17,500 to $19,999 | 2 (1.3%) | 15 (8.4%) |
| $20,000 to $22,499 | 13 (8.6%) | 18 (10.1%) |
| $22,500 to $24,999 | 9 (5.9%) | 14 (7.9%) |
| $25,000 to $29,999 | 9 (5.9%) | 14 (7.9%) |
| $30,000 to $34,999 | 0 (0.0%) | 13 (7.3%) |
| $35,000 to $39,999 | 4 (2.6%) | 0 (0.0%) |
| $40,000 to $44,999 | 0 (0.0%) | 3 (1.7%) |
| $45,000 to $49,999 | 0 (0.0%) | 28 (15.7%) |
| $50,000 to $54,999 | 8 (5.3%) | 0 (0.0%) |
| $55,000 to $64,999 | 19 (12.5%) | 0 (0.0%) |
| $65,000 to $74,999 | 0 (0.0%) | 10 (5.6%) |
| $75,000 to $99,999 | 5 (3.3%) | 3 (1.7%) |
| $100,000+ | 18 (11.8%) | 10 (5.6%) |
| Total | 152 (100.0%) | 178 (100.0%) |
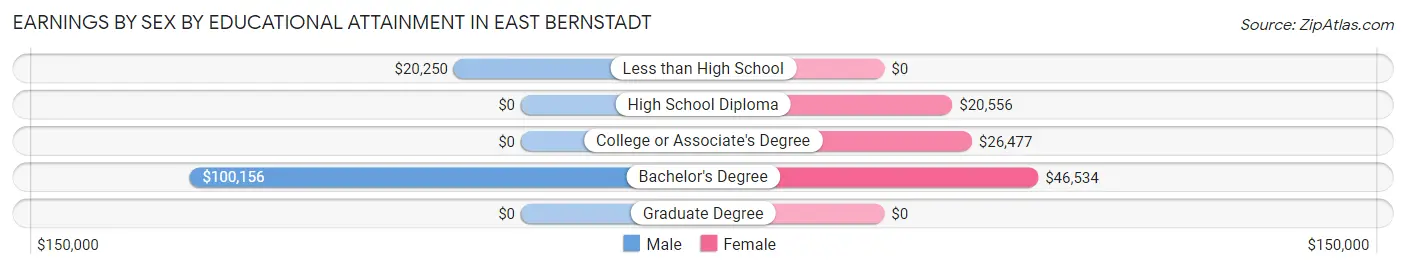
Earnings by Sex by Educational Attainment in East Bernstadt
| Educational Attainment | Male Income | Female Income |
| Less than High School | $20,250 | $0 |
| High School Diploma | - | - |
| College or Associate's Degree | - | - |
| Bachelor's Degree | $100,156 | $46,534 |
| Graduate Degree | - | - |
| Total | - | - |
Family Income in East Bernstadt
Family Income Brackets in East Bernstadt
According to the East Bernstadt family income data, there are 42 families falling into the $35,000 to $49,999 income range, which is the most common income bracket and makes up 18.8% of all families.
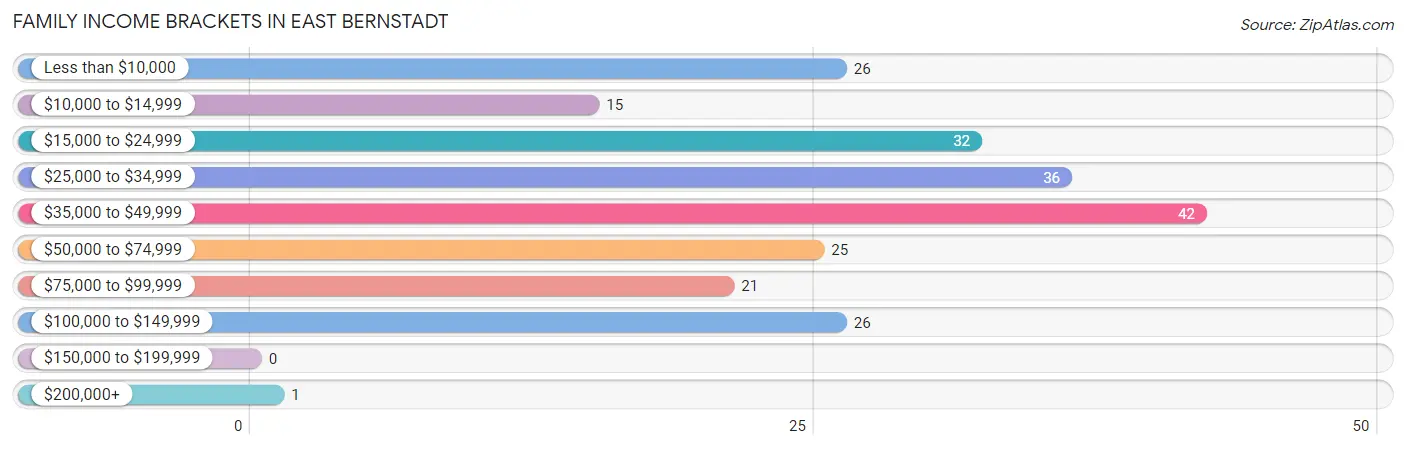
| Income Bracket | # Families | % Families |
| Less than $10,000 | 26 | 11.6% |
| $10,000 to $14,999 | 15 | 6.7% |
| $15,000 to $24,999 | 32 | 14.3% |
| $25,000 to $34,999 | 36 | 16.1% |
| $35,000 to $49,999 | 42 | 18.8% |
| $50,000 to $74,999 | 25 | 11.2% |
| $75,000 to $99,999 | 21 | 9.4% |
| $100,000 to $149,999 | 26 | 11.6% |
| $150,000 to $199,999 | 0 | 0.0% |
| $200,000+ | 1 | 0.4% |
Family Income by Famaliy Size in East Bernstadt
5-person families (52 | 23.2%) account for the highest median family income in East Bernstadt with $48,393 per family, while 2-person families (96 | 42.9%) have the highest median income of $17,212 per family member.
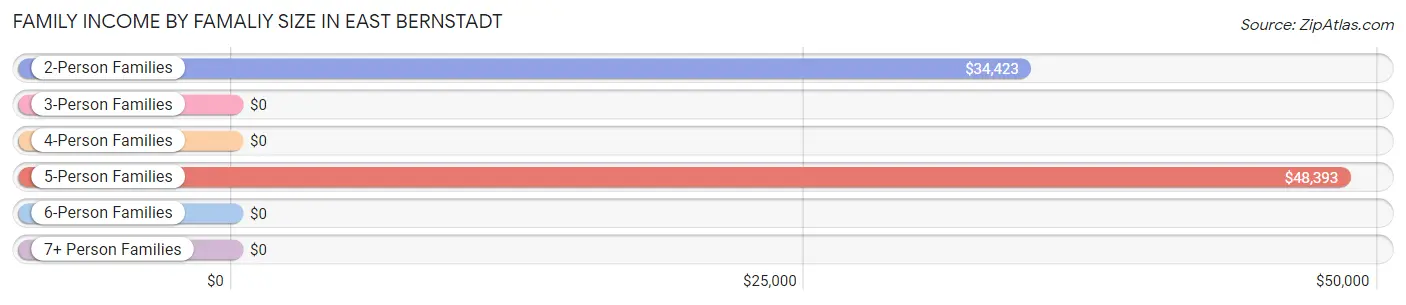
| Income Bracket | # Families | Median Income |
| 2-Person Families | 96 (42.9%) | $34,423 |
| 3-Person Families | 47 (21.0%) | $0 |
| 4-Person Families | 27 (12.0%) | $0 |
| 5-Person Families | 52 (23.2%) | $48,393 |
| 6-Person Families | 2 (0.9%) | $0 |
| 7+ Person Families | 0 (0.0%) | $0 |
| Total | 224 (100.0%) | $35,750 |
Family Income by Number of Earners in East Bernstadt
The median family income in East Bernstadt is $35,750, with families comprising 2 earners (61) having the highest median family income of $90,250, while families with 1 earner (81) have the lowest median family income of $22,750, accounting for 27.2% and 36.2% of families, respectively.
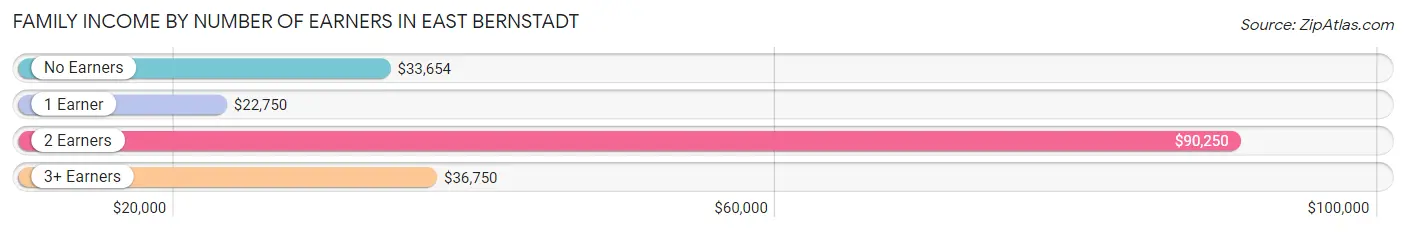
| Number of Earners | # Families | Median Income |
| No Earners | 68 (30.4%) | $33,654 |
| 1 Earner | 81 (36.2%) | $22,750 |
| 2 Earners | 61 (27.2%) | $90,250 |
| 3+ Earners | 14 (6.2%) | $36,750 |
| Total | 224 (100.0%) | $35,750 |
Household Income in East Bernstadt
Household Income Brackets in East Bernstadt
With 57 households falling in the category, the $15,000 to $24,999 income range is the most frequent in East Bernstadt, accounting for 19.2% of all households.
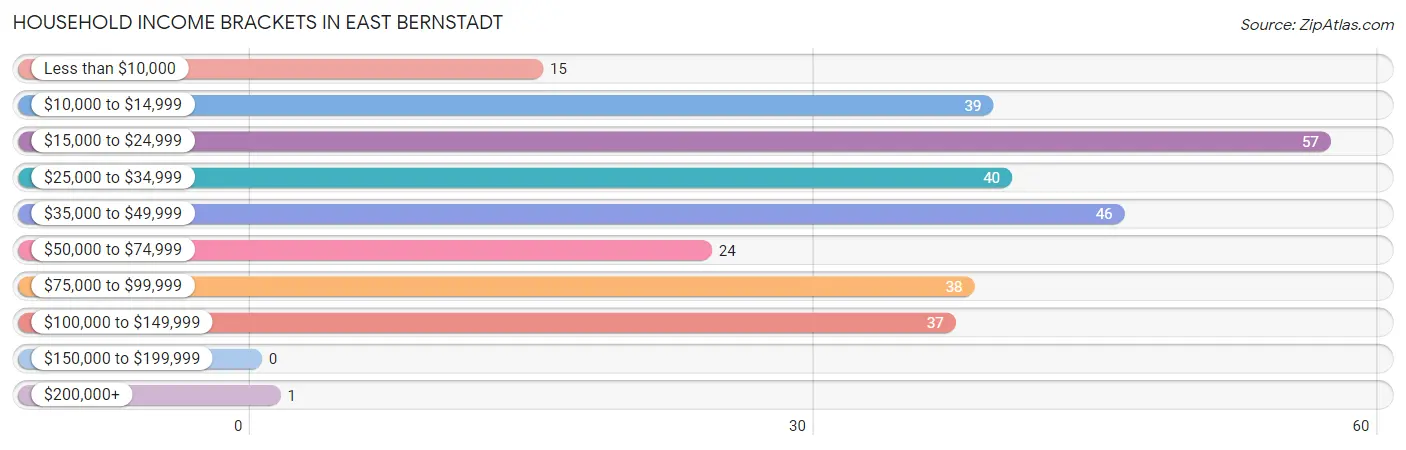
| Income Bracket | # Households | % Households |
| Less than $10,000 | 15 | 5.1% |
| $10,000 to $14,999 | 39 | 13.1% |
| $15,000 to $24,999 | 57 | 19.2% |
| $25,000 to $34,999 | 40 | 13.5% |
| $35,000 to $49,999 | 46 | 15.5% |
| $50,000 to $74,999 | 24 | 8.1% |
| $75,000 to $99,999 | 38 | 12.8% |
| $100,000 to $149,999 | 37 | 12.5% |
| $150,000 to $199,999 | 0 | 0.0% |
| $200,000+ | 1 | 0.3% |
Household Income by Householder Age in East Bernstadt
The median household income in East Bernstadt is $34,632, with the highest median household income of $47,679 found in the 65+ years age bracket for the primary householder. A total of 97 households (32.7%) fall into this category. Meanwhile, the 15 to 24 years age bracket for the primary householder has the lowest median household income of $0, with 11 households (3.7%) in this group.
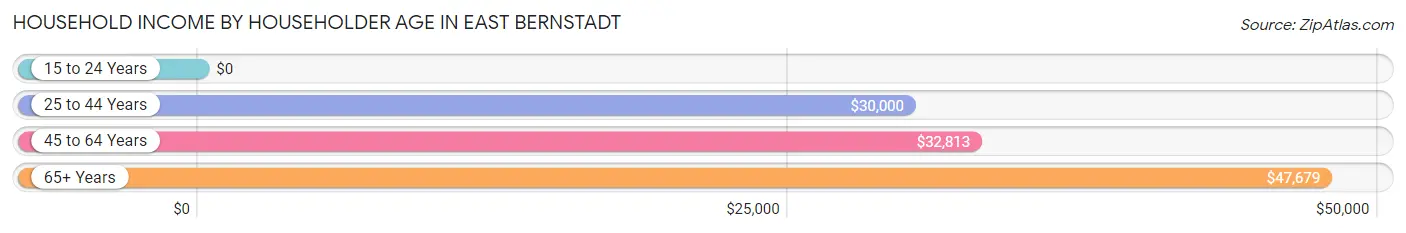
| Income Bracket | # Households | Median Income |
| 15 to 24 Years | 11 (3.7%) | $0 |
| 25 to 44 Years | 102 (34.3%) | $30,000 |
| 45 to 64 Years | 87 (29.3%) | $32,813 |
| 65+ Years | 97 (32.7%) | $47,679 |
| Total | 297 (100.0%) | $34,632 |
Poverty in East Bernstadt
Income Below Poverty by Sex and Age in East Bernstadt
With 23.7% poverty level for males and 30.9% for females among the residents of East Bernstadt, 25 to 34 year old males and 6 to 11 year old females are the most vulnerable to poverty, with 14 males (56.0%) and 40 females (75.5%) in their respective age groups living below the poverty level.
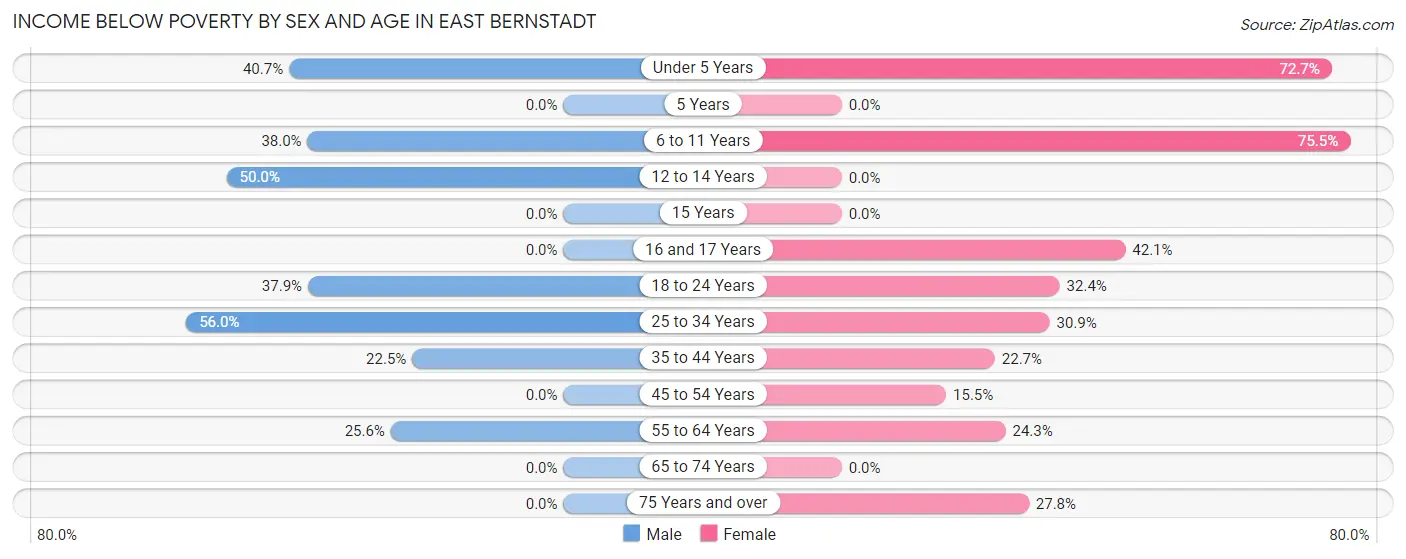
| Age Bracket | Male | Female |
| Under 5 Years | 11 (40.7%) | 16 (72.7%) |
| 5 Years | 0 (0.0%) | 0 (0.0%) |
| 6 to 11 Years | 19 (38.0%) | 40 (75.5%) |
| 12 to 14 Years | 9 (50.0%) | 0 (0.0%) |
| 15 Years | 0 (0.0%) | 0 (0.0%) |
| 16 and 17 Years | 0 (0.0%) | 16 (42.1%) |
| 18 to 24 Years | 11 (37.9%) | 11 (32.4%) |
| 25 to 34 Years | 14 (56.0%) | 29 (30.8%) |
| 35 to 44 Years | 11 (22.5%) | 10 (22.7%) |
| 45 to 54 Years | 0 (0.0%) | 11 (15.5%) |
| 55 to 64 Years | 10 (25.6%) | 9 (24.3%) |
| 65 to 74 Years | 0 (0.0%) | 0 (0.0%) |
| 75 Years and over | 0 (0.0%) | 10 (27.8%) |
| Total | 85 (23.7%) | 152 (30.9%) |
Income Above Poverty by Sex and Age in East Bernstadt
According to the poverty statistics in East Bernstadt, males aged 15 years and females aged 12 to 14 years are the age groups that are most secure financially, with 100.0% of males and 100.0% of females in these age groups living above the poverty line.
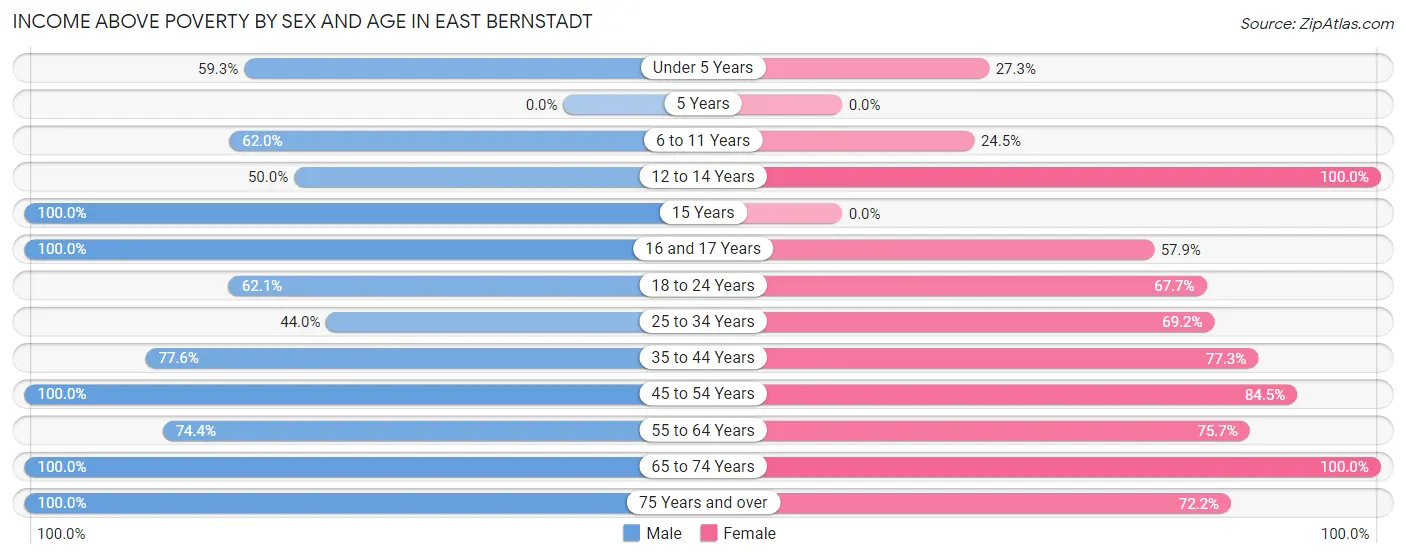
| Age Bracket | Male | Female |
| Under 5 Years | 16 (59.3%) | 6 (27.3%) |
| 5 Years | 0 (0.0%) | 0 (0.0%) |
| 6 to 11 Years | 31 (62.0%) | 13 (24.5%) |
| 12 to 14 Years | 9 (50.0%) | 9 (100.0%) |
| 15 Years | 3 (100.0%) | 0 (0.0%) |
| 16 and 17 Years | 7 (100.0%) | 22 (57.9%) |
| 18 to 24 Years | 18 (62.1%) | 23 (67.6%) |
| 25 to 34 Years | 11 (44.0%) | 65 (69.2%) |
| 35 to 44 Years | 38 (77.5%) | 34 (77.3%) |
| 45 to 54 Years | 53 (100.0%) | 60 (84.5%) |
| 55 to 64 Years | 29 (74.4%) | 28 (75.7%) |
| 65 to 74 Years | 42 (100.0%) | 54 (100.0%) |
| 75 Years and over | 16 (100.0%) | 26 (72.2%) |
| Total | 273 (76.3%) | 340 (69.1%) |
Income Below Poverty Among Married-Couple Families in East Bernstadt
The poverty statistics for married-couple families in East Bernstadt show that 20.3% or 31 of the total 153 families live below the poverty line. Families with 3 or 4 children have the highest poverty rate of 68.8%, comprising of 11 families. On the other hand, families with no children have the lowest poverty rate of 7.1%, which includes 6 families.
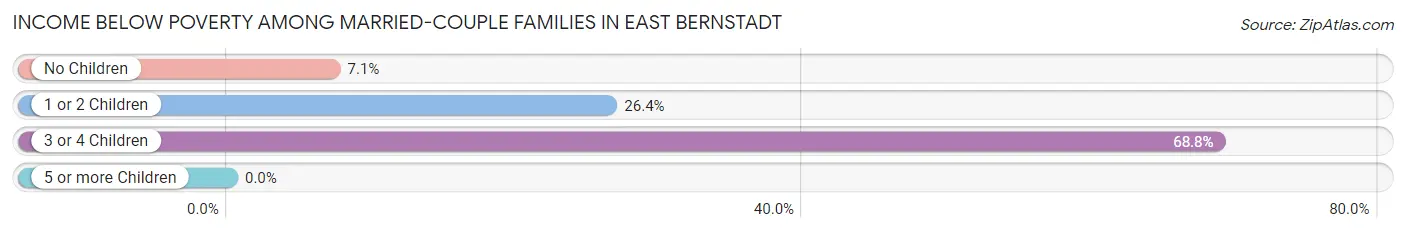
| Children | Above Poverty | Below Poverty |
| No Children | 78 (92.9%) | 6 (7.1%) |
| 1 or 2 Children | 39 (73.6%) | 14 (26.4%) |
| 3 or 4 Children | 5 (31.2%) | 11 (68.8%) |
| 5 or more Children | 0 (0.0%) | 0 (0.0%) |
| Total | 122 (79.7%) | 31 (20.3%) |
Income Below Poverty Among Single-Parent Households in East Bernstadt
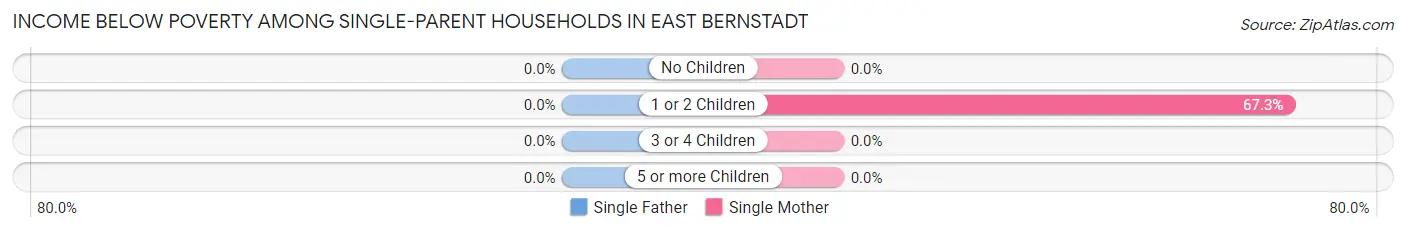
| Children | Single Father | Single Mother |
| No Children | 0 (0.0%) | 0 (0.0%) |
| 1 or 2 Children | 0 (0.0%) | 37 (67.3%) |
| 3 or 4 Children | 0 (0.0%) | 0 (0.0%) |
| 5 or more Children | 0 (0.0%) | 0 (0.0%) |
| Total | 0 (0.0%) | 37 (61.7%) |
Income Below Poverty Among Married-Couple vs Single-Parent Households in East Bernstadt
The poverty data for East Bernstadt shows that 31 of the married-couple family households (20.3%) and 37 of the single-parent households (52.1%) are living below the poverty level. Within the married-couple family households, those with 3 or 4 children have the highest poverty rate, with 11 households (68.8%) falling below the poverty line. Among the single-parent households, those with 1 or 2 children have the highest poverty rate, with 37 household (64.9%) living below poverty.
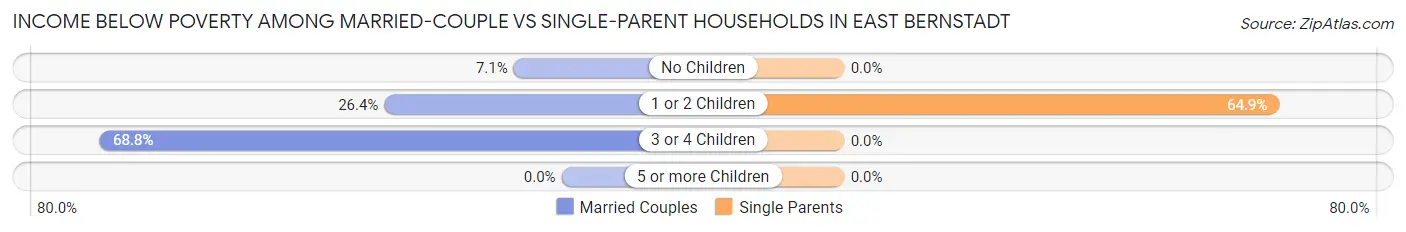
| Children | Married-Couple Families | Single-Parent Households |
| No Children | 6 (7.1%) | 0 (0.0%) |
| 1 or 2 Children | 14 (26.4%) | 37 (64.9%) |
| 3 or 4 Children | 11 (68.8%) | 0 (0.0%) |
| 5 or more Children | 0 (0.0%) | 0 (0.0%) |
| Total | 31 (20.3%) | 37 (52.1%) |
Race in East Bernstadt
The most populous races in East Bernstadt are White / Caucasian (807 | 94.9%), Two or more Races (27 | 3.2%), and Black / African American (16 | 1.9%).
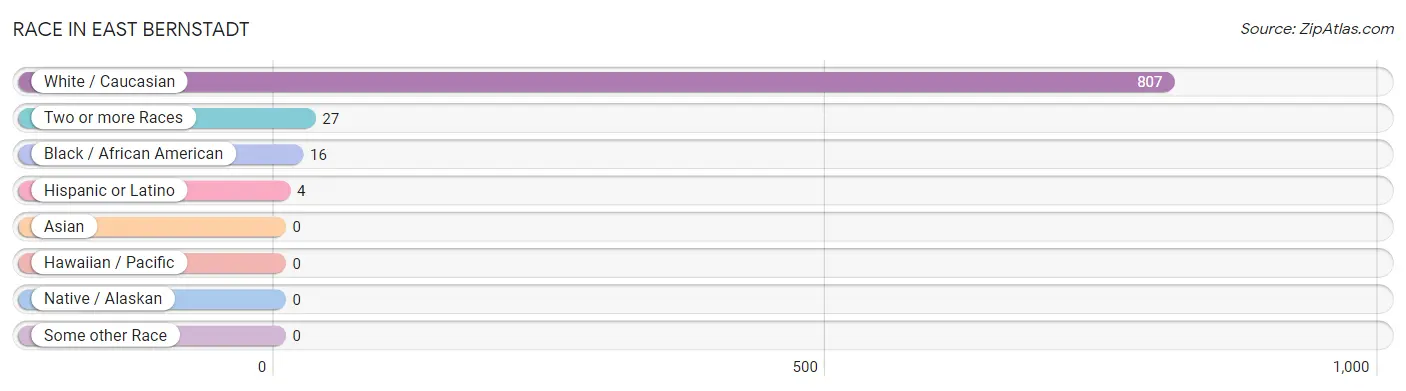
| Race | # Population | % Population |
| Asian | 0 | 0.0% |
| Black / African American | 16 | 1.9% |
| Hawaiian / Pacific | 0 | 0.0% |
| Hispanic or Latino | 4 | 0.5% |
| Native / Alaskan | 0 | 0.0% |
| White / Caucasian | 807 | 94.9% |
| Two or more Races | 27 | 3.2% |
| Some other Race | 0 | 0.0% |
| Total | 850 | 100.0% |
Ancestry in East Bernstadt
The most populous ancestries reported in East Bernstadt are American (85 | 10.0%), German (66 | 7.8%), Irish (41 | 4.8%), English (32 | 3.8%), and British (15 | 1.8%), together accounting for 28.1% of all East Bernstadt residents.
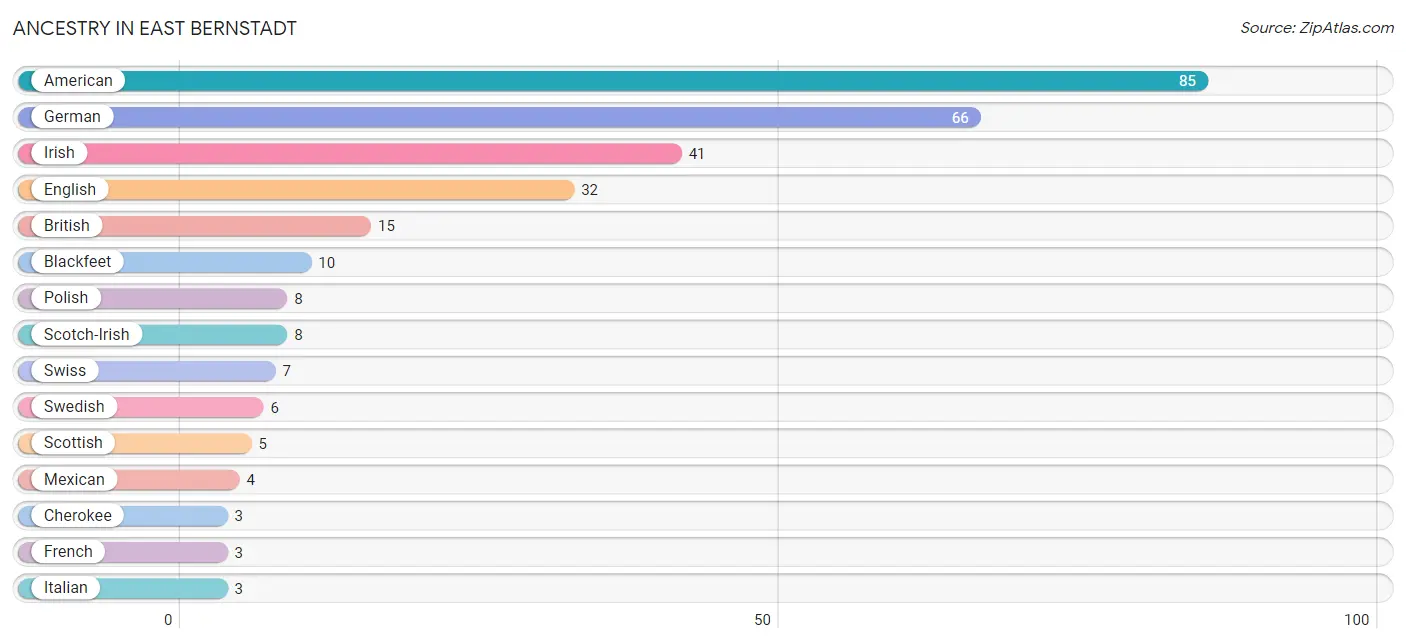
| Ancestry | # Population | % Population |
| American | 85 | 10.0% |
| Blackfeet | 10 | 1.2% |
| British | 15 | 1.8% |
| Cherokee | 3 | 0.4% |
| English | 32 | 3.8% |
| European | 2 | 0.2% |
| French | 3 | 0.4% |
| German | 66 | 7.8% |
| Irish | 41 | 4.8% |
| Italian | 3 | 0.4% |
| Mexican | 4 | 0.5% |
| Polish | 8 | 0.9% |
| Scotch-Irish | 8 | 0.9% |
| Scottish | 5 | 0.6% |
| Swedish | 6 | 0.7% |
| Swiss | 7 | 0.8% | View All 16 Rows |
Immigrants in East Bernstadt

| Immigration Origin | # Population | % Population | View All 0 Rows |
Sex and Age in East Bernstadt
Sex and Age in East Bernstadt
The most populous age groups in East Bernstadt are 10 to 14 Years (42 | 11.7%) for men and 30 to 34 Years (57 | 11.6%) for women.
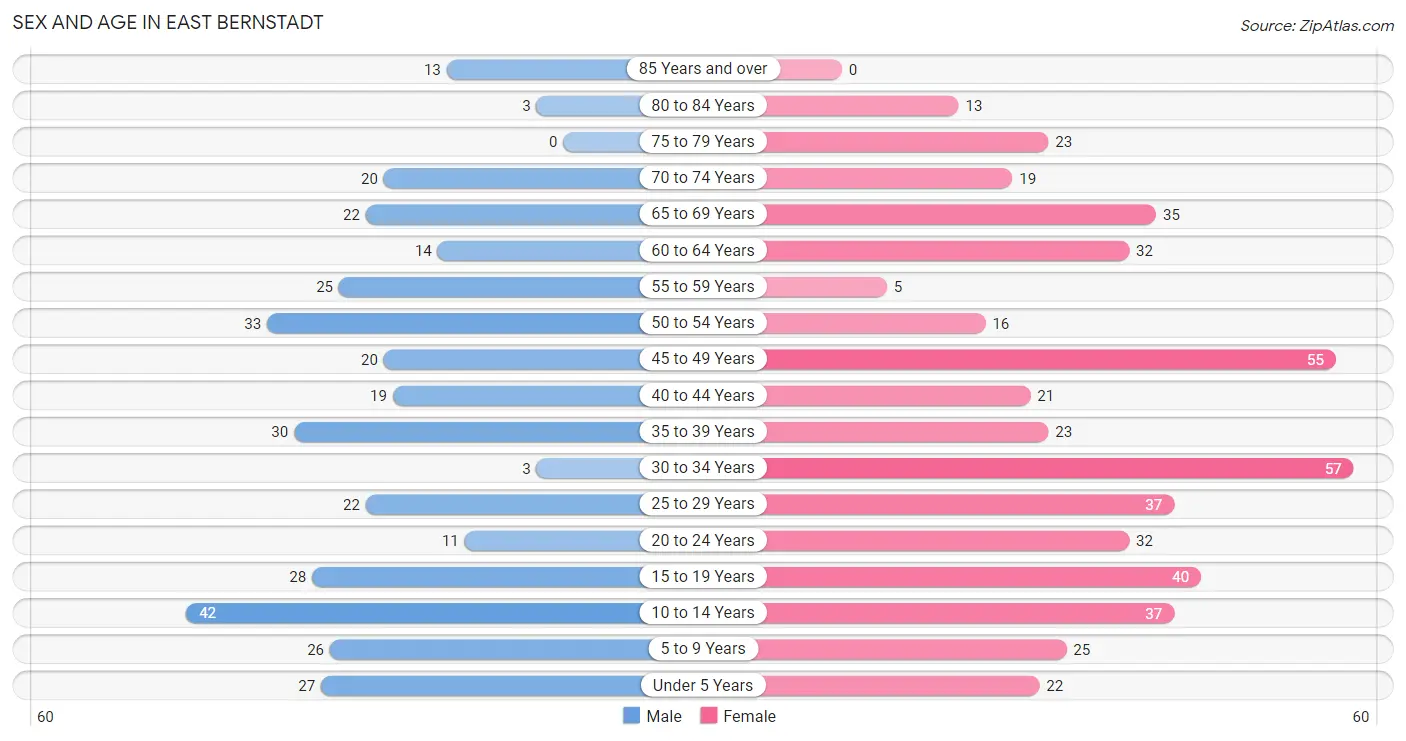
| Age Bracket | Male | Female |
| Under 5 Years | 27 (7.5%) | 22 (4.5%) |
| 5 to 9 Years | 26 (7.3%) | 25 (5.1%) |
| 10 to 14 Years | 42 (11.7%) | 37 (7.5%) |
| 15 to 19 Years | 28 (7.8%) | 40 (8.1%) |
| 20 to 24 Years | 11 (3.1%) | 32 (6.5%) |
| 25 to 29 Years | 22 (6.1%) | 37 (7.5%) |
| 30 to 34 Years | 3 (0.8%) | 57 (11.6%) |
| 35 to 39 Years | 30 (8.4%) | 23 (4.7%) |
| 40 to 44 Years | 19 (5.3%) | 21 (4.3%) |
| 45 to 49 Years | 20 (5.6%) | 55 (11.2%) |
| 50 to 54 Years | 33 (9.2%) | 16 (3.3%) |
| 55 to 59 Years | 25 (7.0%) | 5 (1.0%) |
| 60 to 64 Years | 14 (3.9%) | 32 (6.5%) |
| 65 to 69 Years | 22 (6.1%) | 35 (7.1%) |
| 70 to 74 Years | 20 (5.6%) | 19 (3.9%) |
| 75 to 79 Years | 0 (0.0%) | 23 (4.7%) |
| 80 to 84 Years | 3 (0.8%) | 13 (2.6%) |
| 85 Years and over | 13 (3.6%) | 0 (0.0%) |
| Total | 358 (100.0%) | 492 (100.0%) |
Families and Households in East Bernstadt
Median Family Size in East Bernstadt
The median family size in East Bernstadt is 3.36 persons per family, with single female/mother families (60 | 26.8%) accounting for the largest median family size of 3.77 persons per family. On the other hand, single male/father families (11 | 4.9%) represent the smallest median family size with 3.09 persons per family.
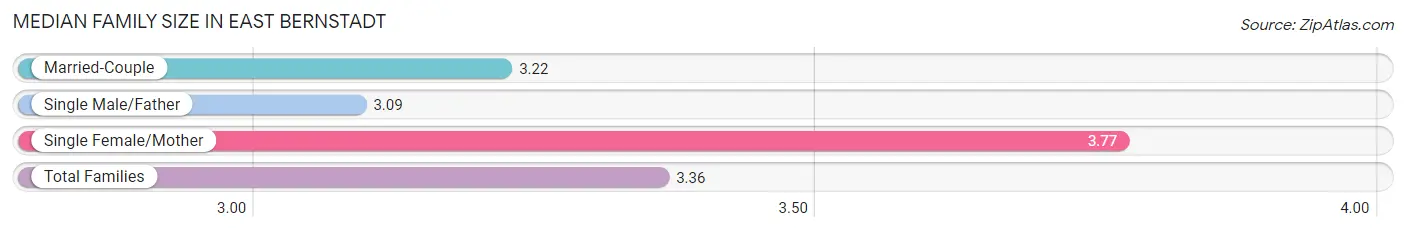
| Family Type | # Families | Family Size |
| Married-Couple | 153 (68.3%) | 3.22 |
| Single Male/Father | 11 (4.9%) | 3.09 |
| Single Female/Mother | 60 (26.8%) | 3.77 |
| Total Families | 224 (100.0%) | 3.36 |
Median Household Size in East Bernstadt
The median household size in East Bernstadt is 2.86 persons per household, with single female/mother households (60 | 20.2%) accounting for the largest median household size of 4.13 persons per household. non-family households (73 | 24.6%) represent the smallest median household size with 1.04 persons per household.
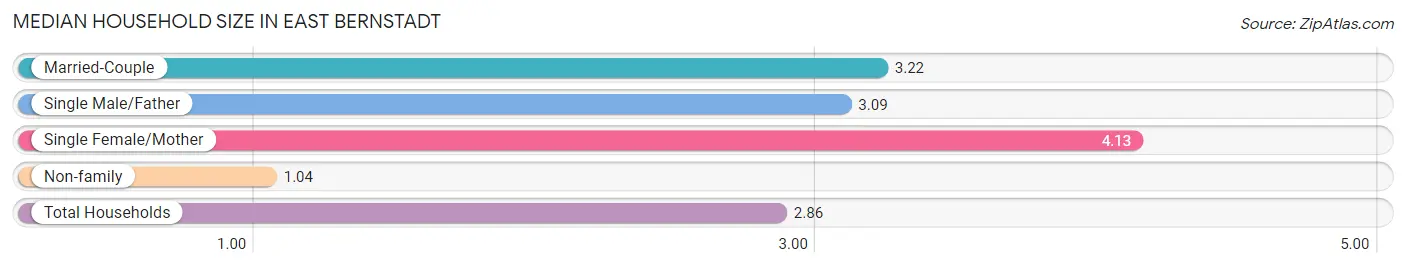
| Household Type | # Households | Household Size |
| Married-Couple | 153 (51.5%) | 3.22 |
| Single Male/Father | 11 (3.7%) | 3.09 |
| Single Female/Mother | 60 (20.2%) | 4.13 |
| Non-family | 73 (24.6%) | 1.04 |
| Total Households | 297 (100.0%) | 2.86 |
Household Size by Marriage Status in East Bernstadt
Out of a total of 297 households in East Bernstadt, 224 (75.4%) are family households, while 73 (24.6%) are nonfamily households. The most numerous type of family households are 2-person households, comprising 96, and the most common type of nonfamily households are 1-person households, comprising 70.
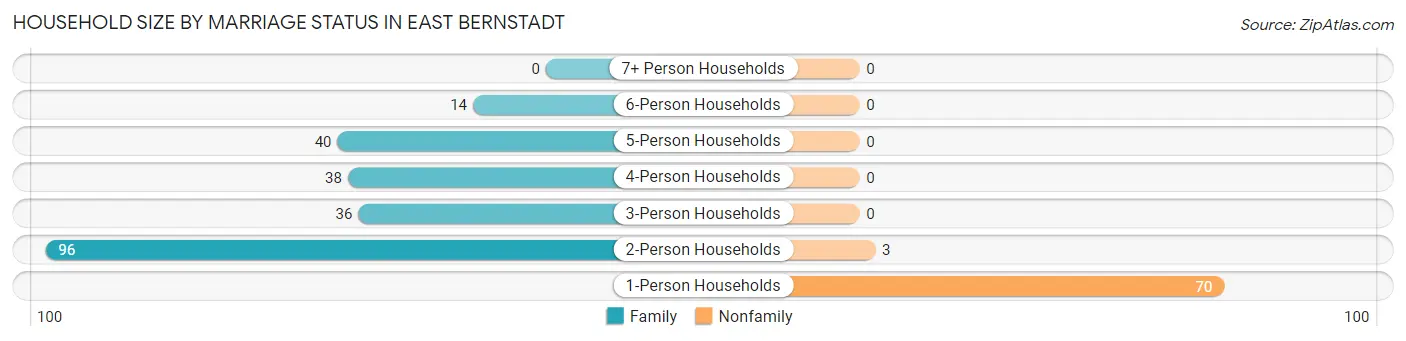
| Household Size | Family Households | Nonfamily Households |
| 1-Person Households | - | 70 (23.6%) |
| 2-Person Households | 96 (32.3%) | 3 (1.0%) |
| 3-Person Households | 36 (12.1%) | 0 (0.0%) |
| 4-Person Households | 38 (12.8%) | 0 (0.0%) |
| 5-Person Households | 40 (13.5%) | 0 (0.0%) |
| 6-Person Households | 14 (4.7%) | 0 (0.0%) |
| 7+ Person Households | 0 (0.0%) | 0 (0.0%) |
| Total | 224 (75.4%) | 73 (24.6%) |
Female Fertility in East Bernstadt
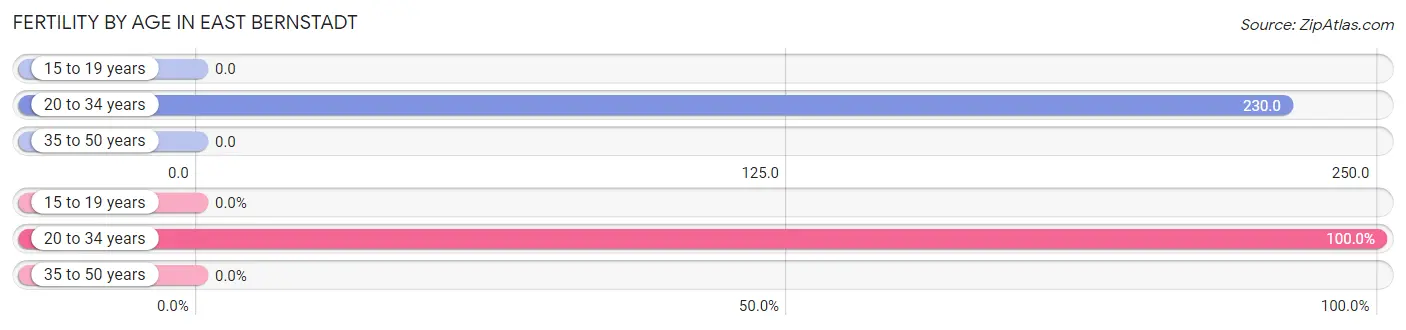
Fertility by Age in East Bernstadt
Average fertility rate in East Bernstadt is 109.0 births per 1,000 women. Women in the age bracket of 20 to 34 years have the highest fertility rate with 230.0 births per 1,000 women. Women in the age bracket of 20 to 34 years acount for 100.0% of all women with births.
| Age Bracket | Women with Births | Births / 1,000 Women |
| 15 to 19 years | 0 (0.0%) | 0.0 |
| 20 to 34 years | 29 (100.0%) | 230.0 |
| 35 to 50 years | 0 (0.0%) | 0.0 |
| Total | 29 (100.0%) | 109.0 |
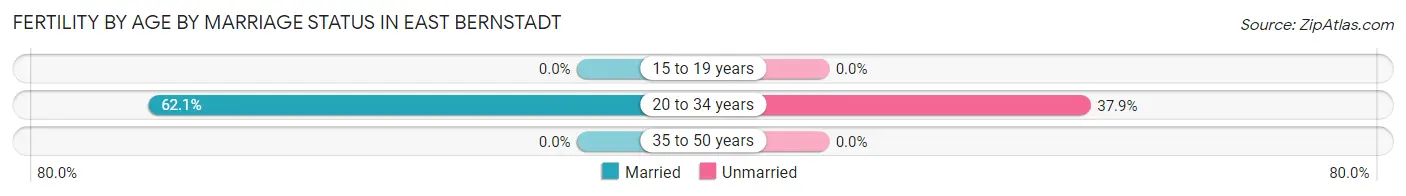
Fertility by Age by Marriage Status in East Bernstadt
62.1% of women with births (29) in East Bernstadt are married. The highest percentage of unmarried women with births falls into 20 to 34 years age bracket with 37.9% of them unmarried at the time of birth, while the lowest percentage of unmarried women with births belong to 20 to 34 years age bracket with 37.9% of them unmarried.
| Age Bracket | Married | Unmarried |
| 15 to 19 years | 0 (0.0%) | 0 (0.0%) |
| 20 to 34 years | 18 (62.1%) | 11 (37.9%) |
| 35 to 50 years | 0 (0.0%) | 0 (0.0%) |
| Total | 18 (62.1%) | 11 (37.9%) |
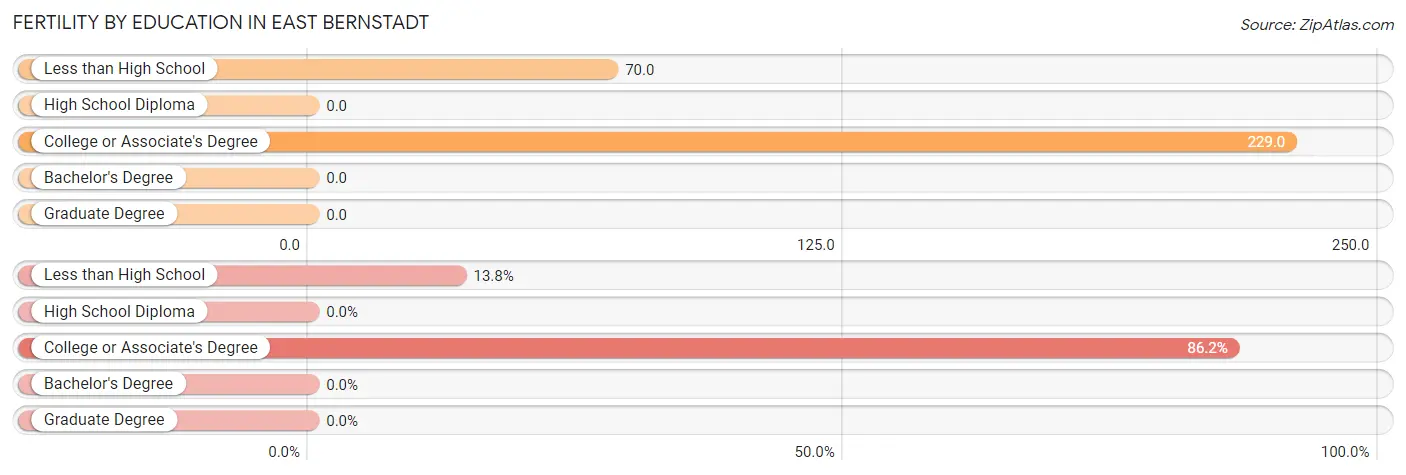
Fertility by Education in East Bernstadt
| Educational Attainment | Women with Births | Births / 1,000 Women |
| Less than High School | 4 (13.8%) | 70.0 |
| High School Diploma | 0 (0.0%) | 0.0 |
| College or Associate's Degree | 25 (86.2%) | 229.0 |
| Bachelor's Degree | 0 (0.0%) | 0.0 |
| Graduate Degree | 0 (0.0%) | 0.0 |
| Total | 29 (100.0%) | 109.0 |
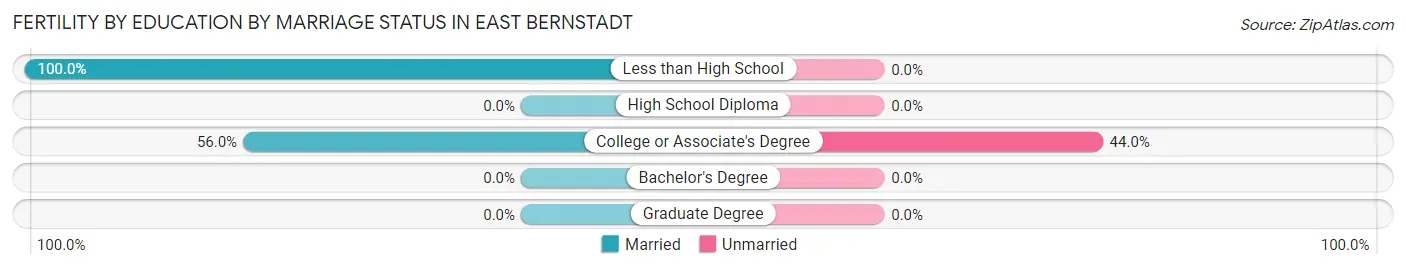
Fertility by Education by Marriage Status in East Bernstadt
37.9% of women with births in East Bernstadt are unmarried. Women with the educational attainment of less than high school are most likely to be married with 100.0% of them married at childbirth, while women with the educational attainment of college or associate's degree are least likely to be married with 44.0% of them unmarried at childbirth.
| Educational Attainment | Married | Unmarried |
| Less than High School | 4 (100.0%) | 0 (0.0%) |
| High School Diploma | 0 (0.0%) | 0 (0.0%) |
| College or Associate's Degree | 14 (56.0%) | 11 (44.0%) |
| Bachelor's Degree | 0 (0.0%) | 0 (0.0%) |
| Graduate Degree | 0 (0.0%) | 0 (0.0%) |
| Total | 18 (62.1%) | 11 (37.9%) |
Employment Characteristics in East Bernstadt
Employment by Class of Employer in East Bernstadt
Among the 273 employed individuals in East Bernstadt, private company employees (219 | 80.2%), not-for-profit organizations (17 | 6.2%), and self-employed (not incorporated) (14 | 5.1%) make up the most common classes of employment.
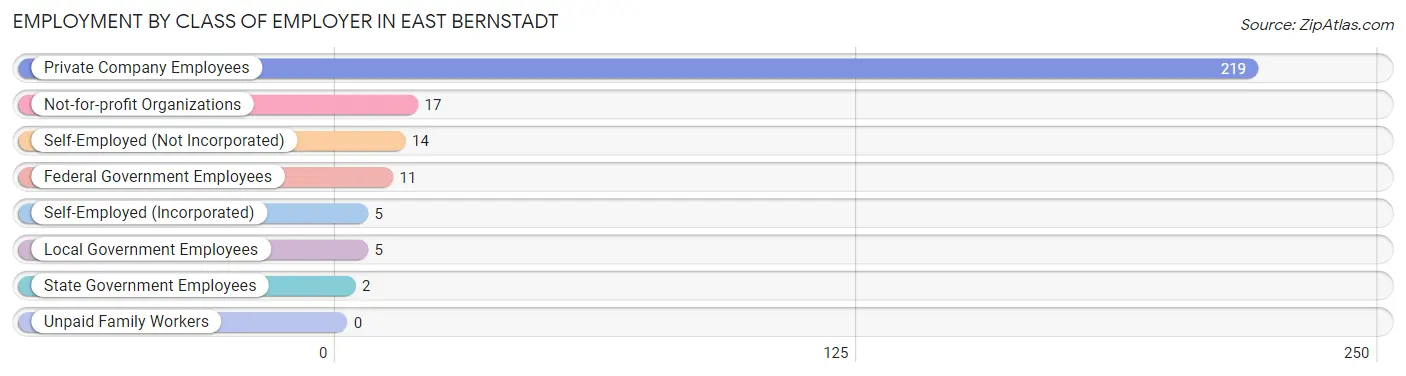
| Employer Class | # Employees | % Employees |
| Private Company Employees | 219 | 80.2% |
| Self-Employed (Incorporated) | 5 | 1.8% |
| Self-Employed (Not Incorporated) | 14 | 5.1% |
| Not-for-profit Organizations | 17 | 6.2% |
| Local Government Employees | 5 | 1.8% |
| State Government Employees | 2 | 0.7% |
| Federal Government Employees | 11 | 4.0% |
| Unpaid Family Workers | 0 | 0.0% |
| Total | 273 | 100.0% |
Employment Status by Age in East Bernstadt
According to the labor force statistics for East Bernstadt, out of the total population over 16 years of age (668), 46.1% or 308 individuals are in the labor force, with 10.7% or 33 of them unemployed. The age group with the highest labor force participation rate is 55 to 59 years, with 70.0% or 21 individuals in the labor force. Within the labor force, the 35 to 44 years age range has the highest percentage of unemployed individuals, with 43.8% or 28 of them being unemployed.
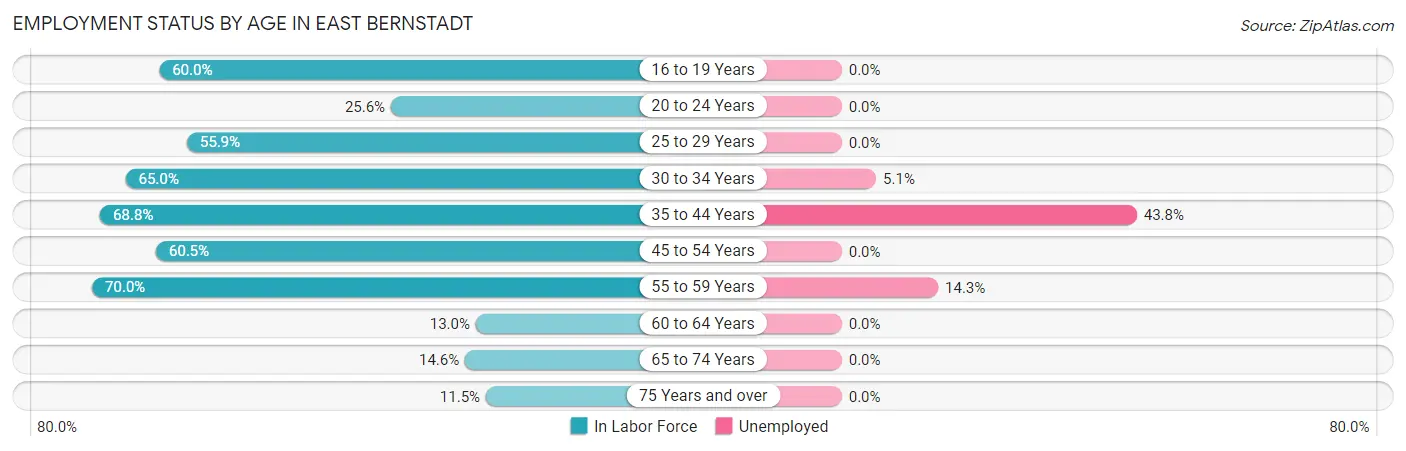
| Age Bracket | In Labor Force | Unemployed |
| 16 to 19 Years | 39 (60.0%) | 0 (0.0%) |
| 20 to 24 Years | 11 (25.6%) | 0 (0.0%) |
| 25 to 29 Years | 33 (55.9%) | 0 (0.0%) |
| 30 to 34 Years | 39 (65.0%) | 2 (5.1%) |
| 35 to 44 Years | 64 (68.8%) | 28 (43.8%) |
| 45 to 54 Years | 75 (60.5%) | 0 (0.0%) |
| 55 to 59 Years | 21 (70.0%) | 3 (14.3%) |
| 60 to 64 Years | 6 (13.0%) | 0 (0.0%) |
| 65 to 74 Years | 14 (14.6%) | 0 (0.0%) |
| 75 Years and over | 6 (11.5%) | 0 (0.0%) |
| Total | 308 (46.1%) | 33 (10.7%) |
Employment Status by Educational Attainment in East Bernstadt
According to labor force statistics for East Bernstadt, 57.8% of individuals (238) out of the total population between 25 and 64 years of age (412) are in the labor force, with 13.9% or 33 of them being unemployed. The group with the highest labor force participation rate are those with the educational attainment of bachelor's degree or higher, with 94.4% or 51 individuals in the labor force. Within the labor force, individuals with high school diploma education have the highest percentage of unemployment, with 17.1% or 14 of them being unemployed.
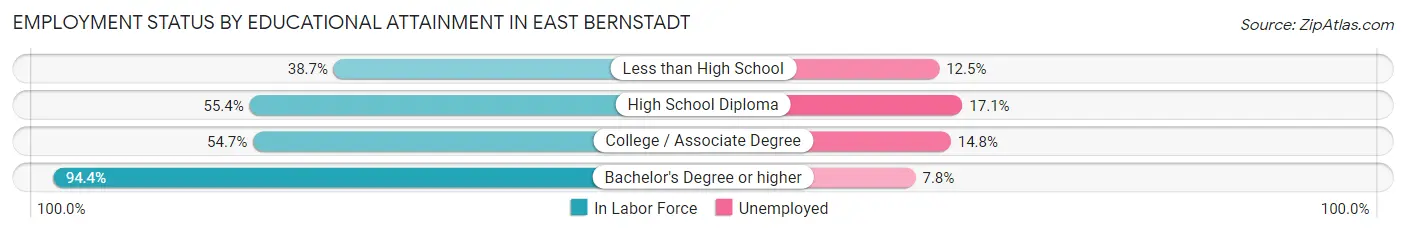
| Educational Attainment | In Labor Force | Unemployed |
| Less than High School | 24 (38.7%) | 8 (12.5%) |
| High School Diploma | 82 (55.4%) | 25 (17.1%) |
| College / Associate Degree | 81 (54.7%) | 22 (14.8%) |
| Bachelor's Degree or higher | 51 (94.4%) | 4 (7.8%) |
| Total | 238 (57.8%) | 57 (13.9%) |
Employment Occupations by Sex in East Bernstadt
Management, Business, Science and Arts Occupations
The most common Management, Business, Science and Arts occupations in East Bernstadt are Management (26 | 9.5%), Community & Social Service (22 | 8.0%), Education Instruction & Library (13 | 4.7%), Health Diagnosing & Treating (12 | 4.4%), and Health Technologists (12 | 4.4%).
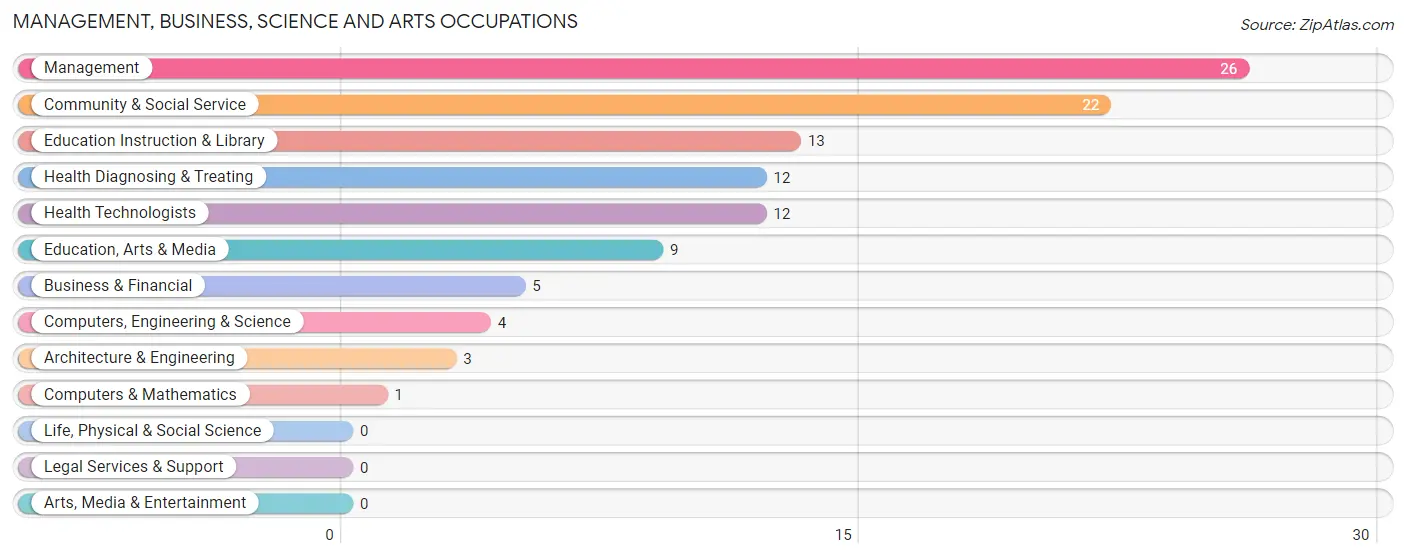
Management, Business, Science and Arts Occupations by Sex
Within the Management, Business, Science and Arts occupations in East Bernstadt, the most male-oriented occupations are Business & Financial (100.0%), Architecture & Engineering (100.0%), and Education, Arts & Media (100.0%), while the most female-oriented occupations are Computers & Mathematics (100.0%), Education Instruction & Library (100.0%), and Health Diagnosing & Treating (100.0%).
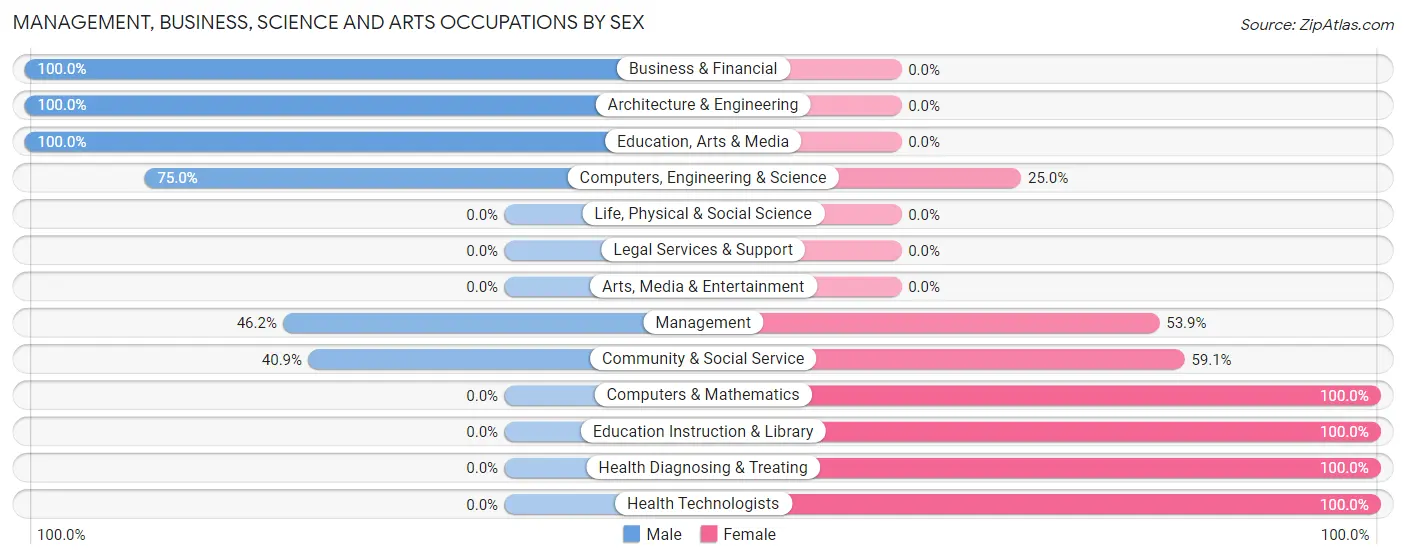
| Occupation | Male | Female |
| Management | 12 (46.2%) | 14 (53.8%) |
| Business & Financial | 5 (100.0%) | 0 (0.0%) |
| Computers, Engineering & Science | 3 (75.0%) | 1 (25.0%) |
| Computers & Mathematics | 0 (0.0%) | 1 (100.0%) |
| Architecture & Engineering | 3 (100.0%) | 0 (0.0%) |
| Life, Physical & Social Science | 0 (0.0%) | 0 (0.0%) |
| Community & Social Service | 9 (40.9%) | 13 (59.1%) |
| Education, Arts & Media | 9 (100.0%) | 0 (0.0%) |
| Legal Services & Support | 0 (0.0%) | 0 (0.0%) |
| Education Instruction & Library | 0 (0.0%) | 13 (100.0%) |
| Arts, Media & Entertainment | 0 (0.0%) | 0 (0.0%) |
| Health Diagnosing & Treating | 0 (0.0%) | 12 (100.0%) |
| Health Technologists | 0 (0.0%) | 12 (100.0%) |
| Total (Category) | 29 (42.0%) | 40 (58.0%) |
| Total (Overall) | 117 (42.5%) | 158 (57.5%) |
Services Occupations
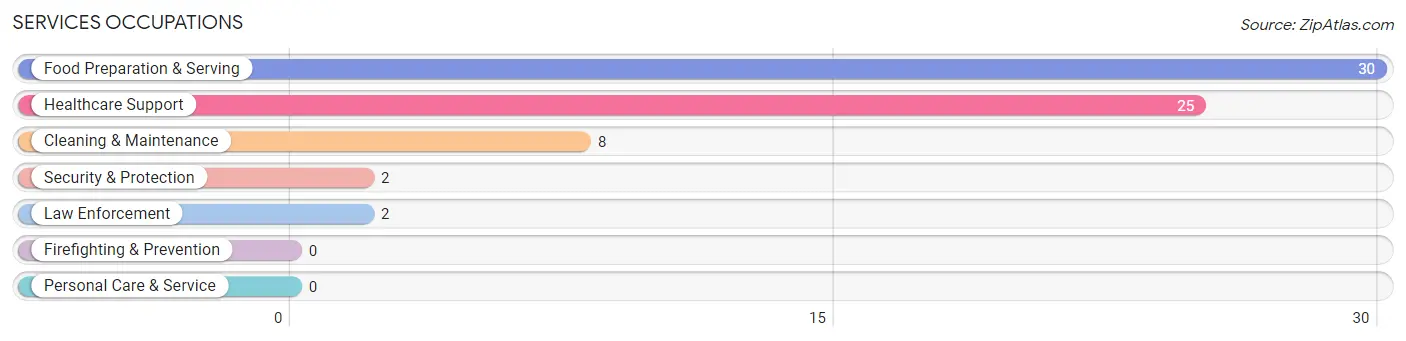
The most common Services occupations in East Bernstadt are Food Preparation & Serving (30 | 10.9%), Healthcare Support (25 | 9.1%), Cleaning & Maintenance (8 | 2.9%), Security & Protection (2 | 0.7%), and Law Enforcement (2 | 0.7%).
Services Occupations by Sex
Within the Services occupations in East Bernstadt, the most male-oriented occupations are Security & Protection (100.0%), Law Enforcement (100.0%), and Cleaning & Maintenance (100.0%), while the most female-oriented occupations are Healthcare Support (100.0%), and Food Preparation & Serving (30.0%).
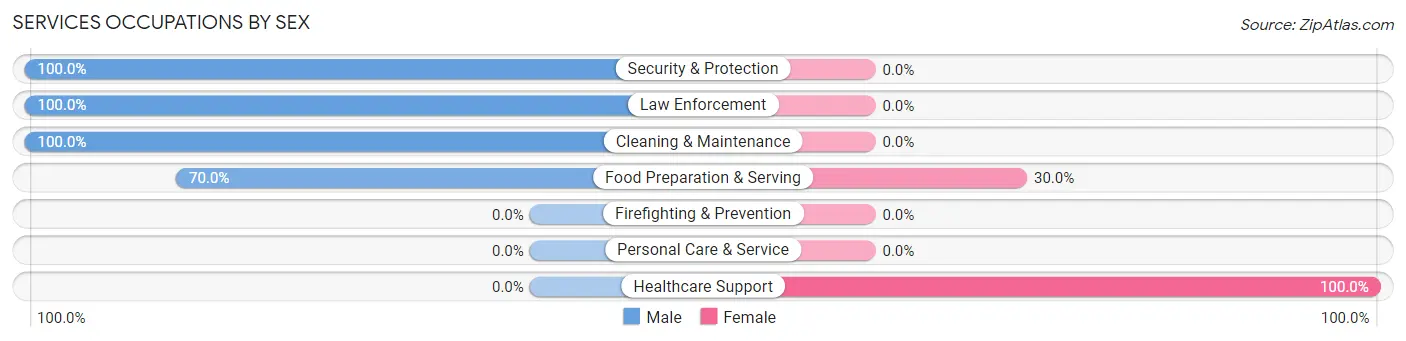
| Occupation | Male | Female |
| Healthcare Support | 0 (0.0%) | 25 (100.0%) |
| Security & Protection | 2 (100.0%) | 0 (0.0%) |
| Firefighting & Prevention | 0 (0.0%) | 0 (0.0%) |
| Law Enforcement | 2 (100.0%) | 0 (0.0%) |
| Food Preparation & Serving | 21 (70.0%) | 9 (30.0%) |
| Cleaning & Maintenance | 8 (100.0%) | 0 (0.0%) |
| Personal Care & Service | 0 (0.0%) | 0 (0.0%) |
| Total (Category) | 31 (47.7%) | 34 (52.3%) |
| Total (Overall) | 117 (42.5%) | 158 (57.5%) |
Sales and Office Occupations
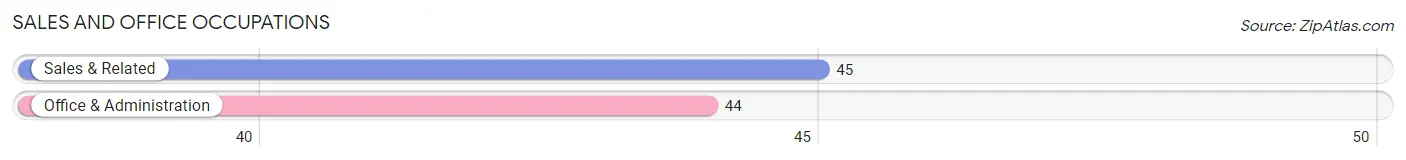
The most common Sales and Office occupations in East Bernstadt are Sales & Related (45 | 16.4%), and Office & Administration (44 | 16.0%).
Sales and Office Occupations by Sex
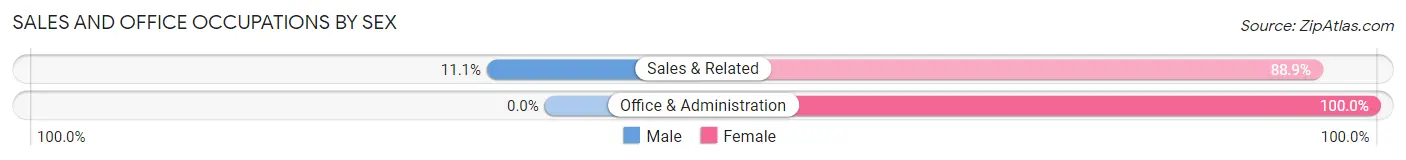
| Occupation | Male | Female |
| Sales & Related | 5 (11.1%) | 40 (88.9%) |
| Office & Administration | 0 (0.0%) | 44 (100.0%) |
| Total (Category) | 5 (5.6%) | 84 (94.4%) |
| Total (Overall) | 117 (42.5%) | 158 (57.5%) |
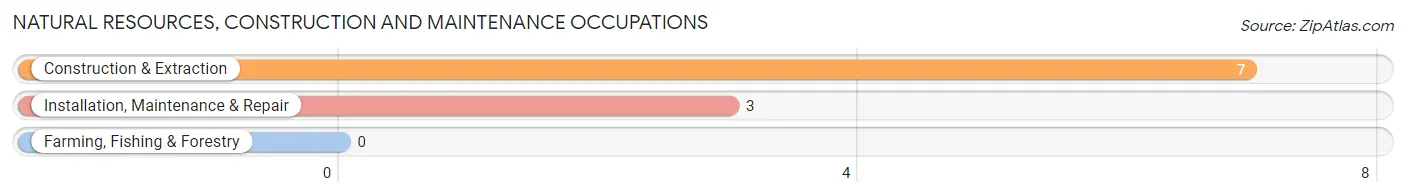
Natural Resources, Construction and Maintenance Occupations
The most common Natural Resources, Construction and Maintenance occupations in East Bernstadt are Construction & Extraction (7 | 2.5%), and Installation, Maintenance & Repair (3 | 1.1%).
Natural Resources, Construction and Maintenance Occupations by Sex
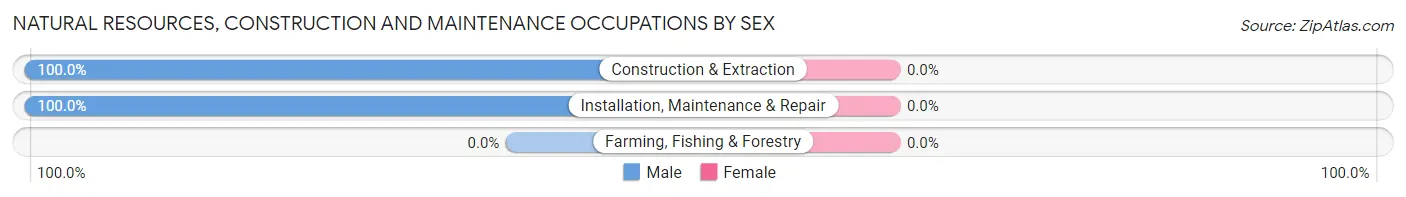
| Occupation | Male | Female |
| Farming, Fishing & Forestry | 0 (0.0%) | 0 (0.0%) |
| Construction & Extraction | 7 (100.0%) | 0 (0.0%) |
| Installation, Maintenance & Repair | 3 (100.0%) | 0 (0.0%) |
| Total (Category) | 10 (100.0%) | 0 (0.0%) |
| Total (Overall) | 117 (42.5%) | 158 (57.5%) |
Production, Transportation and Moving Occupations
The most common Production, Transportation and Moving occupations in East Bernstadt are Production (28 | 10.2%), Material Moving (9 | 3.3%), and Transportation (5 | 1.8%).
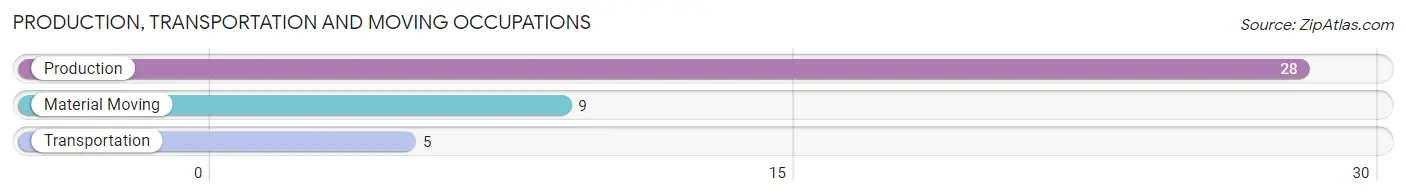
Production, Transportation and Moving Occupations by Sex
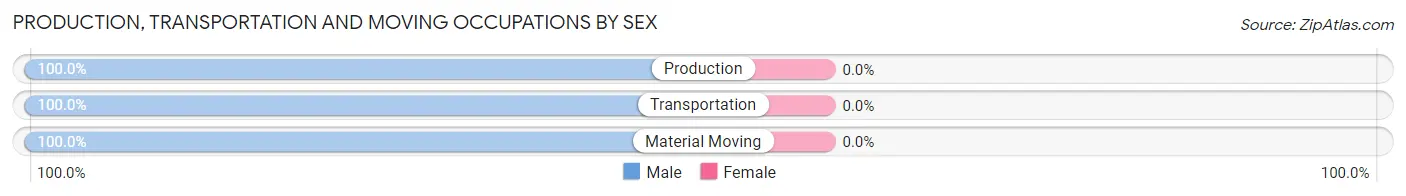
| Occupation | Male | Female |
| Production | 28 (100.0%) | 0 (0.0%) |
| Transportation | 5 (100.0%) | 0 (0.0%) |
| Material Moving | 9 (100.0%) | 0 (0.0%) |
| Total (Category) | 42 (100.0%) | 0 (0.0%) |
| Total (Overall) | 117 (42.5%) | 158 (57.5%) |
Employment Industries by Sex in East Bernstadt
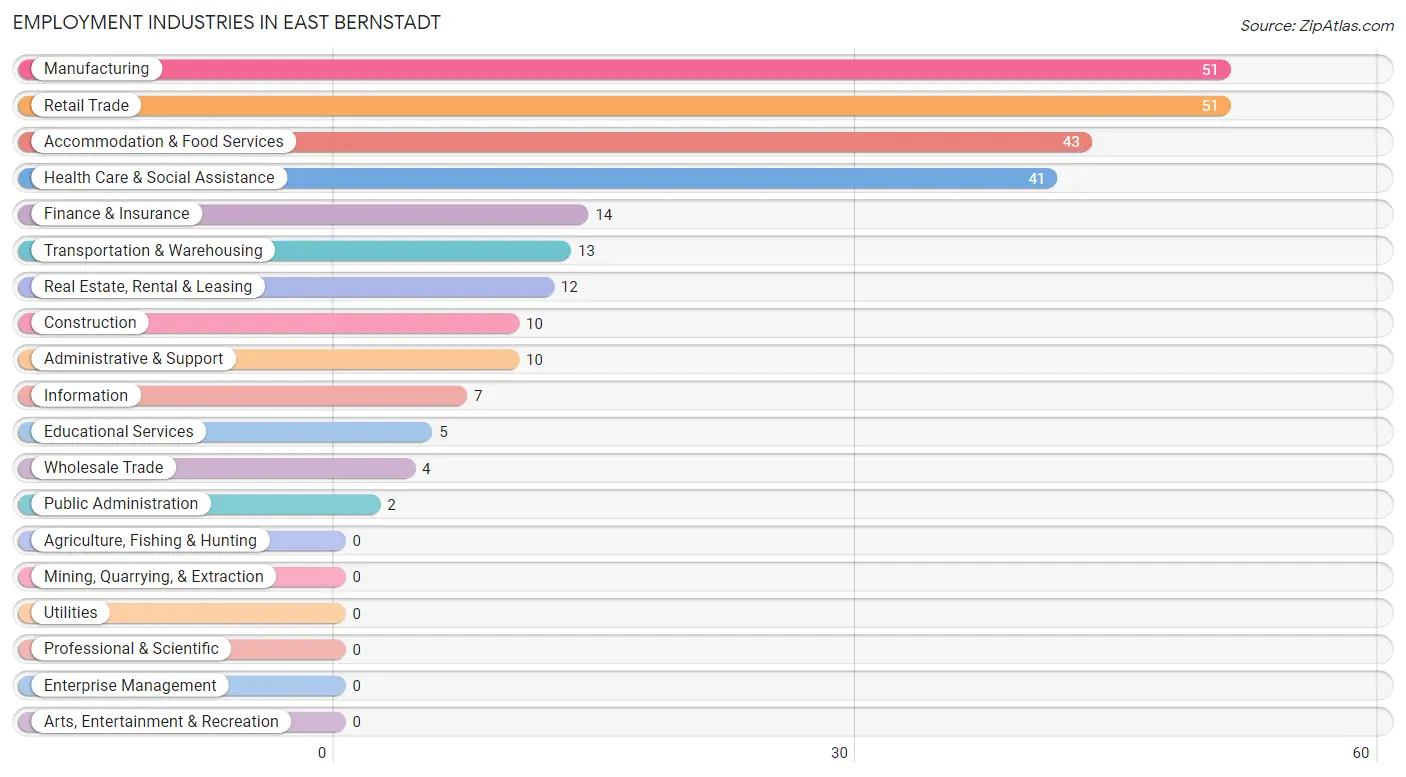
Employment Industries in East Bernstadt
The major employment industries in East Bernstadt include Manufacturing (51 | 18.5%), Retail Trade (51 | 18.5%), Accommodation & Food Services (43 | 15.6%), Health Care & Social Assistance (41 | 14.9%), and Finance & Insurance (14 | 5.1%).
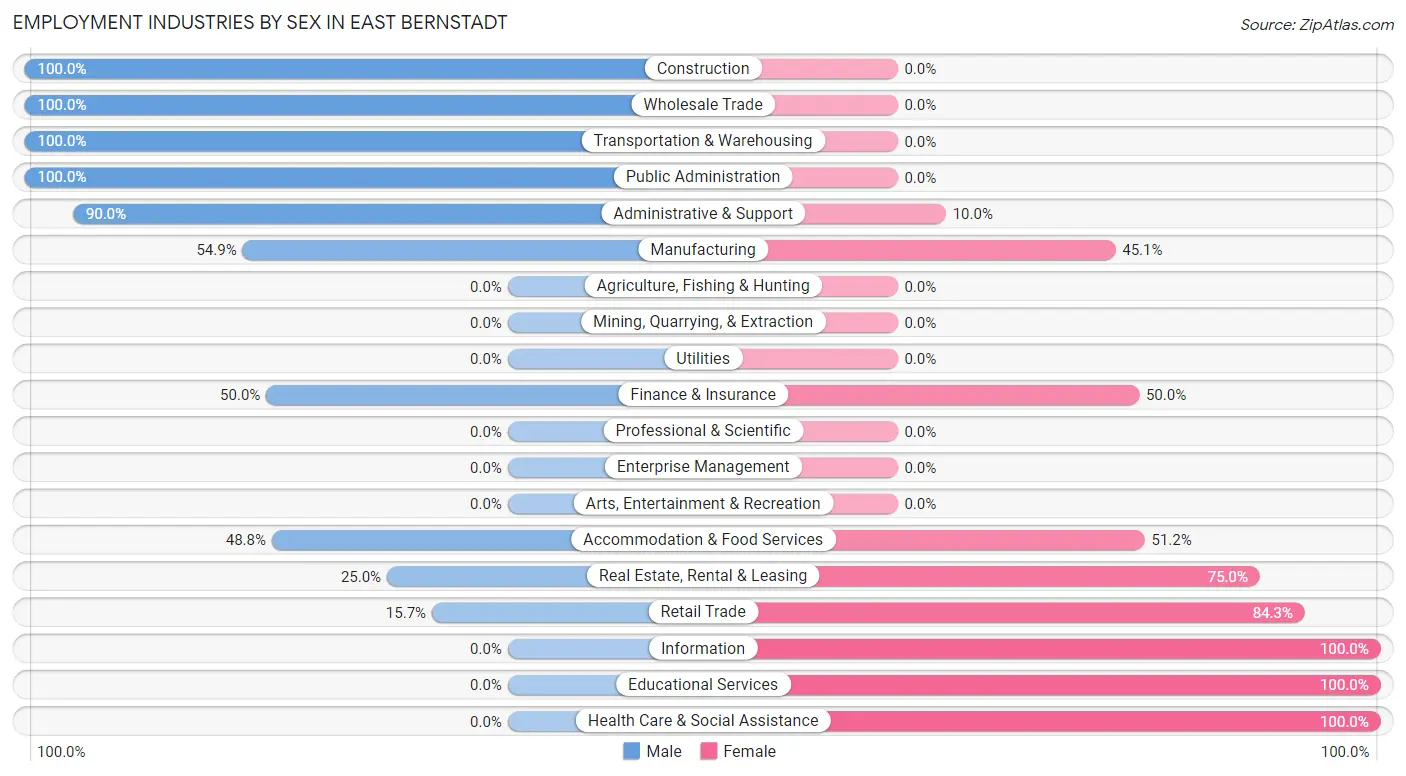
Employment Industries by Sex in East Bernstadt
The East Bernstadt industries that see more men than women are Construction (100.0%), Wholesale Trade (100.0%), and Transportation & Warehousing (100.0%), whereas the industries that tend to have a higher number of women are Information (100.0%), Educational Services (100.0%), and Health Care & Social Assistance (100.0%).
| Industry | Male | Female |
| Agriculture, Fishing & Hunting | 0 (0.0%) | 0 (0.0%) |
| Mining, Quarrying, & Extraction | 0 (0.0%) | 0 (0.0%) |
| Construction | 10 (100.0%) | 0 (0.0%) |
| Manufacturing | 28 (54.9%) | 23 (45.1%) |
| Wholesale Trade | 4 (100.0%) | 0 (0.0%) |
| Retail Trade | 8 (15.7%) | 43 (84.3%) |
| Transportation & Warehousing | 13 (100.0%) | 0 (0.0%) |
| Utilities | 0 (0.0%) | 0 (0.0%) |
| Information | 0 (0.0%) | 7 (100.0%) |
| Finance & Insurance | 7 (50.0%) | 7 (50.0%) |
| Real Estate, Rental & Leasing | 3 (25.0%) | 9 (75.0%) |
| Professional & Scientific | 0 (0.0%) | 0 (0.0%) |
| Enterprise Management | 0 (0.0%) | 0 (0.0%) |
| Administrative & Support | 9 (90.0%) | 1 (10.0%) |
| Educational Services | 0 (0.0%) | 5 (100.0%) |
| Health Care & Social Assistance | 0 (0.0%) | 41 (100.0%) |
| Arts, Entertainment & Recreation | 0 (0.0%) | 0 (0.0%) |
| Accommodation & Food Services | 21 (48.8%) | 22 (51.2%) |
| Public Administration | 2 (100.0%) | 0 (0.0%) |
| Total | 117 (42.5%) | 158 (57.5%) |
Education in East Bernstadt
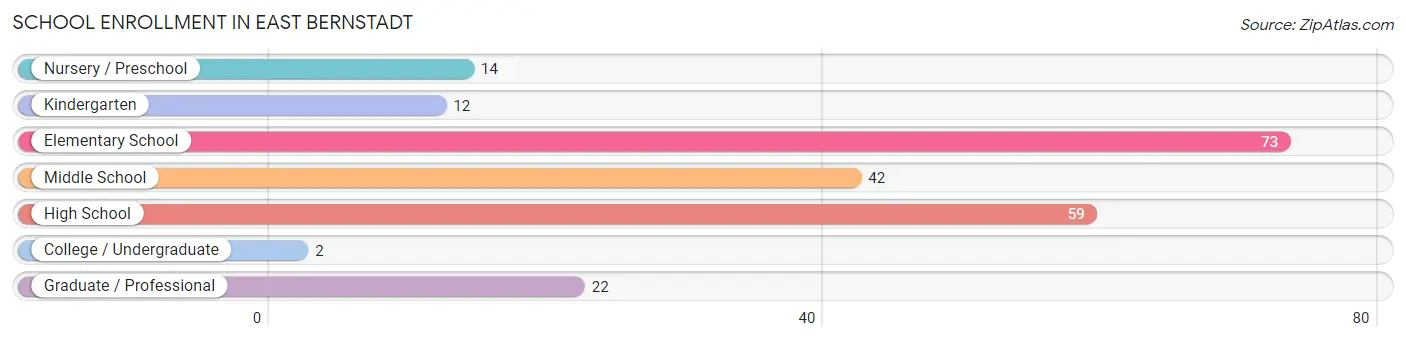
School Enrollment in East Bernstadt
The most common levels of schooling among the 224 students in East Bernstadt are elementary school (73 | 32.6%), high school (59 | 26.3%), and middle school (42 | 18.8%).
| School Level | # Students | % Students |
| Nursery / Preschool | 14 | 6.2% |
| Kindergarten | 12 | 5.4% |
| Elementary School | 73 | 32.6% |
| Middle School | 42 | 18.8% |
| High School | 59 | 26.3% |
| College / Undergraduate | 2 | 0.9% |
| Graduate / Professional | 22 | 9.8% |
| Total | 224 | 100.0% |
School Enrollment by Age by Funding Source in East Bernstadt
Out of a total of 224 students who are enrolled in schools in East Bernstadt, 18 (8.0%) attend a private institution, while the remaining 206 (92.0%) are enrolled in public schools. The age group of 10 to 14 year olds has the highest likelihood of being enrolled in private schools, with 15 (19.7% in the age bracket) enrolled. Conversely, the age group of 3 to 4 year olds has the lowest likelihood of being enrolled in a private school, with 14 (100.0% in the age bracket) attending a public institution.
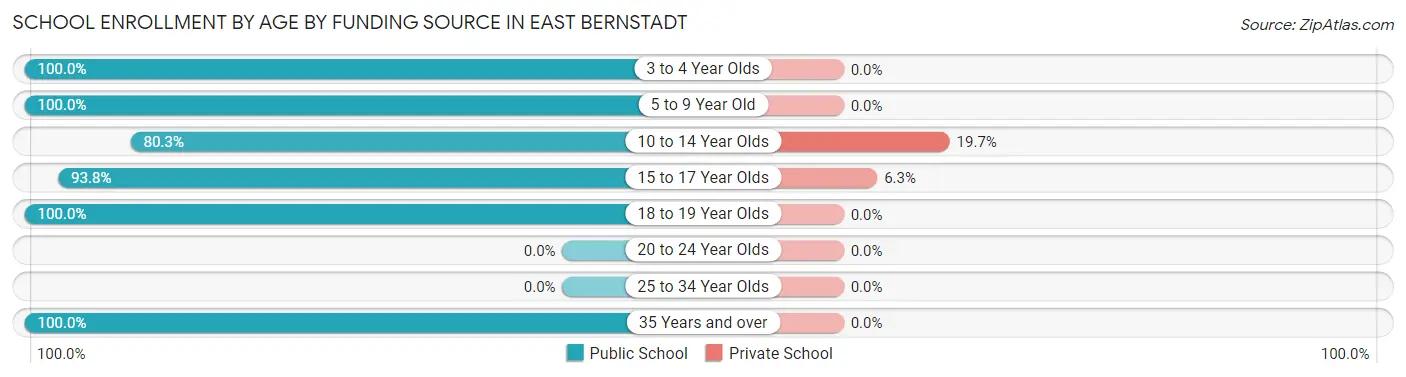
| Age Bracket | Public School | Private School |
| 3 to 4 Year Olds | 14 (100.0%) | 0 (0.0%) |
| 5 to 9 Year Old | 51 (100.0%) | 0 (0.0%) |
| 10 to 14 Year Olds | 61 (80.3%) | 15 (19.7%) |
| 15 to 17 Year Olds | 45 (93.8%) | 3 (6.2%) |
| 18 to 19 Year Olds | 7 (100.0%) | 0 (0.0%) |
| 20 to 24 Year Olds | 0 (0.0%) | 0 (0.0%) |
| 25 to 34 Year Olds | 0 (0.0%) | 0 (0.0%) |
| 35 Years and over | 28 (100.0%) | 0 (0.0%) |
| Total | 206 (92.0%) | 18 (8.0%) |
Educational Attainment by Field of Study in East Bernstadt
Visual & performing arts (22 | 33.3%), education (16 | 24.2%), business (11 | 16.7%), science & technology (7 | 10.6%), and computers & mathematics (5 | 7.6%) are the most common fields of study among 66 individuals in East Bernstadt who have obtained a bachelor's degree or higher.
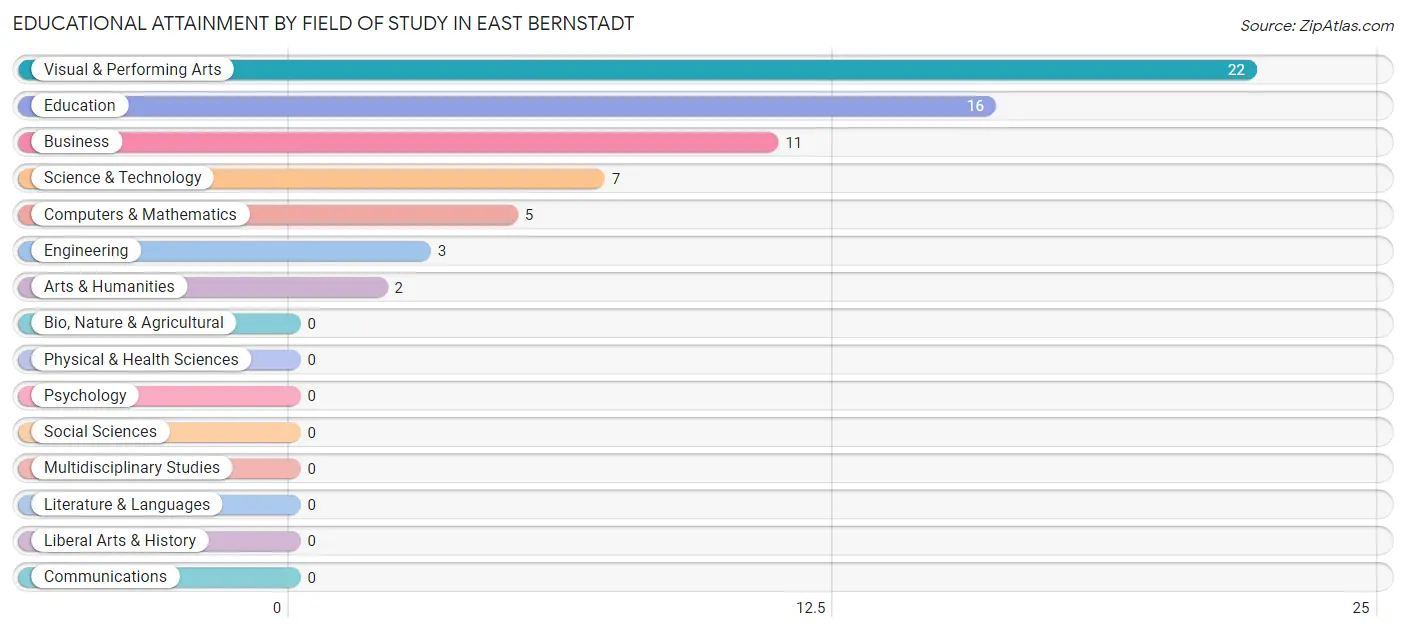
| Field of Study | # Graduates | % Graduates |
| Computers & Mathematics | 5 | 7.6% |
| Bio, Nature & Agricultural | 0 | 0.0% |
| Physical & Health Sciences | 0 | 0.0% |
| Psychology | 0 | 0.0% |
| Social Sciences | 0 | 0.0% |
| Engineering | 3 | 4.5% |
| Multidisciplinary Studies | 0 | 0.0% |
| Science & Technology | 7 | 10.6% |
| Business | 11 | 16.7% |
| Education | 16 | 24.2% |
| Literature & Languages | 0 | 0.0% |
| Liberal Arts & History | 0 | 0.0% |
| Visual & Performing Arts | 22 | 33.3% |
| Communications | 0 | 0.0% |
| Arts & Humanities | 2 | 3.0% |
| Total | 66 | 100.0% |
Transportation & Commute in East Bernstadt
Vehicle Availability by Sex in East Bernstadt
The most prevalent vehicle ownership categories in East Bernstadt are males with 1 vehicle (43, accounting for 36.7%) and females with 1 vehicle (66, making up 27.6%).
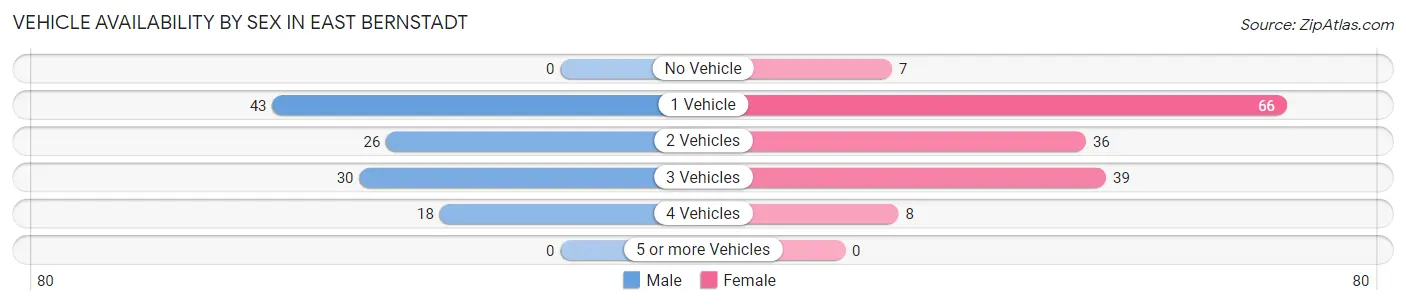
| Vehicles Available | Male | Female |
| No Vehicle | 0 (0.0%) | 7 (4.5%) |
| 1 Vehicle | 43 (36.7%) | 66 (42.3%) |
| 2 Vehicles | 26 (22.2%) | 36 (23.1%) |
| 3 Vehicles | 30 (25.6%) | 39 (25.0%) |
| 4 Vehicles | 18 (15.4%) | 8 (5.1%) |
| 5 or more Vehicles | 0 (0.0%) | 0 (0.0%) |
| Total | 117 (100.0%) | 156 (100.0%) |
Commute Time in East Bernstadt
The most frequently occuring commute durations in East Bernstadt are 10 to 14 minutes (55 commuters, 22.7%), 20 to 24 minutes (51 commuters, 21.1%), and 15 to 19 minutes (37 commuters, 15.3%).
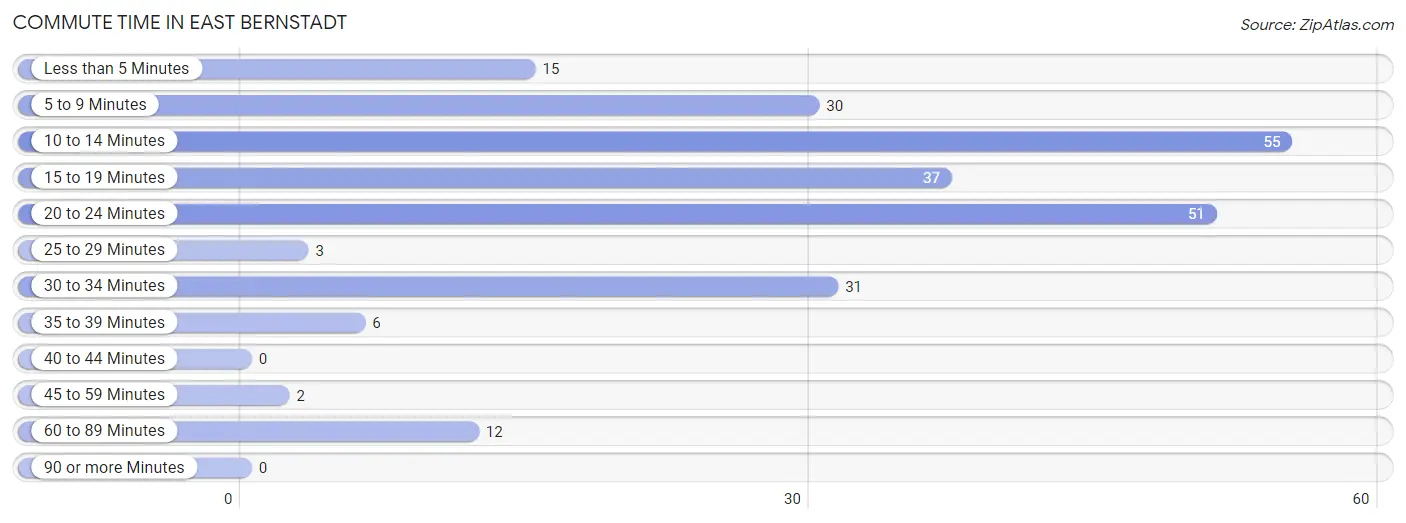
| Commute Time | # Commuters | % Commuters |
| Less than 5 Minutes | 15 | 6.2% |
| 5 to 9 Minutes | 30 | 12.4% |
| 10 to 14 Minutes | 55 | 22.7% |
| 15 to 19 Minutes | 37 | 15.3% |
| 20 to 24 Minutes | 51 | 21.1% |
| 25 to 29 Minutes | 3 | 1.2% |
| 30 to 34 Minutes | 31 | 12.8% |
| 35 to 39 Minutes | 6 | 2.5% |
| 40 to 44 Minutes | 0 | 0.0% |
| 45 to 59 Minutes | 2 | 0.8% |
| 60 to 89 Minutes | 12 | 5.0% |
| 90 or more Minutes | 0 | 0.0% |
Commute Time by Sex in East Bernstadt
The most common commute times in East Bernstadt are 15 to 19 minutes (24 commuters, 22.2%) for males and 10 to 14 minutes (38 commuters, 28.4%) for females.
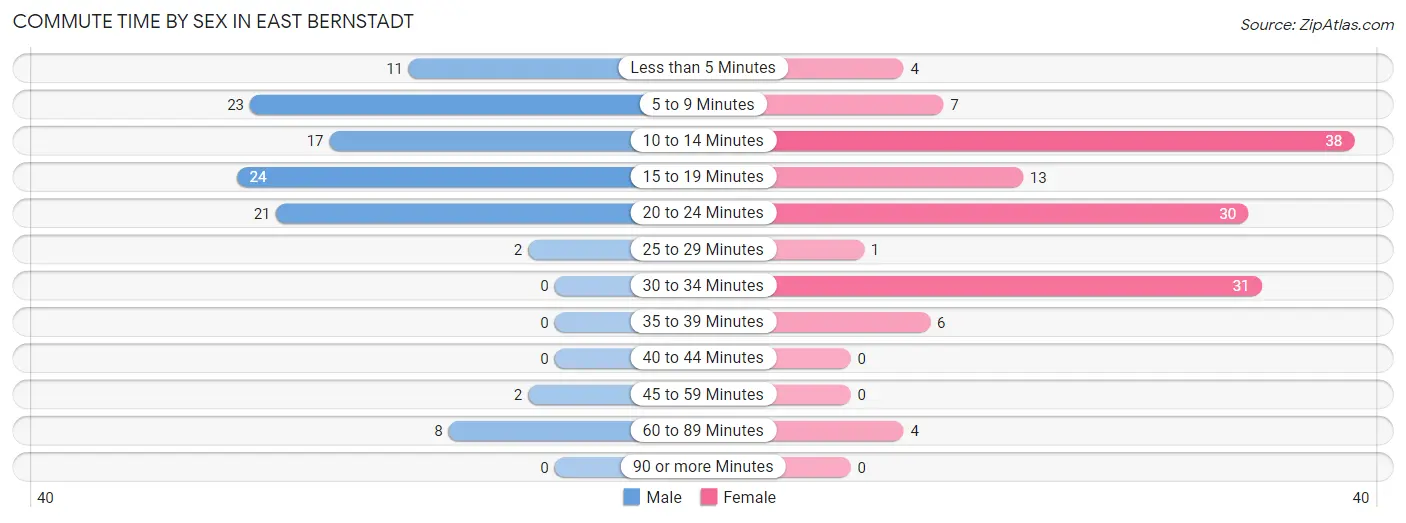
| Commute Time | Male | Female |
| Less than 5 Minutes | 11 (10.2%) | 4 (3.0%) |
| 5 to 9 Minutes | 23 (21.3%) | 7 (5.2%) |
| 10 to 14 Minutes | 17 (15.7%) | 38 (28.4%) |
| 15 to 19 Minutes | 24 (22.2%) | 13 (9.7%) |
| 20 to 24 Minutes | 21 (19.4%) | 30 (22.4%) |
| 25 to 29 Minutes | 2 (1.8%) | 1 (0.7%) |
| 30 to 34 Minutes | 0 (0.0%) | 31 (23.1%) |
| 35 to 39 Minutes | 0 (0.0%) | 6 (4.5%) |
| 40 to 44 Minutes | 0 (0.0%) | 0 (0.0%) |
| 45 to 59 Minutes | 2 (1.8%) | 0 (0.0%) |
| 60 to 89 Minutes | 8 (7.4%) | 4 (3.0%) |
| 90 or more Minutes | 0 (0.0%) | 0 (0.0%) |
Time of Departure to Work by Sex in East Bernstadt
The most frequent times of departure to work in East Bernstadt are 12:00 PM to 3:59 PM (32, 29.6%) for males and 7:00 AM to 7:29 AM (50, 37.3%) for females.
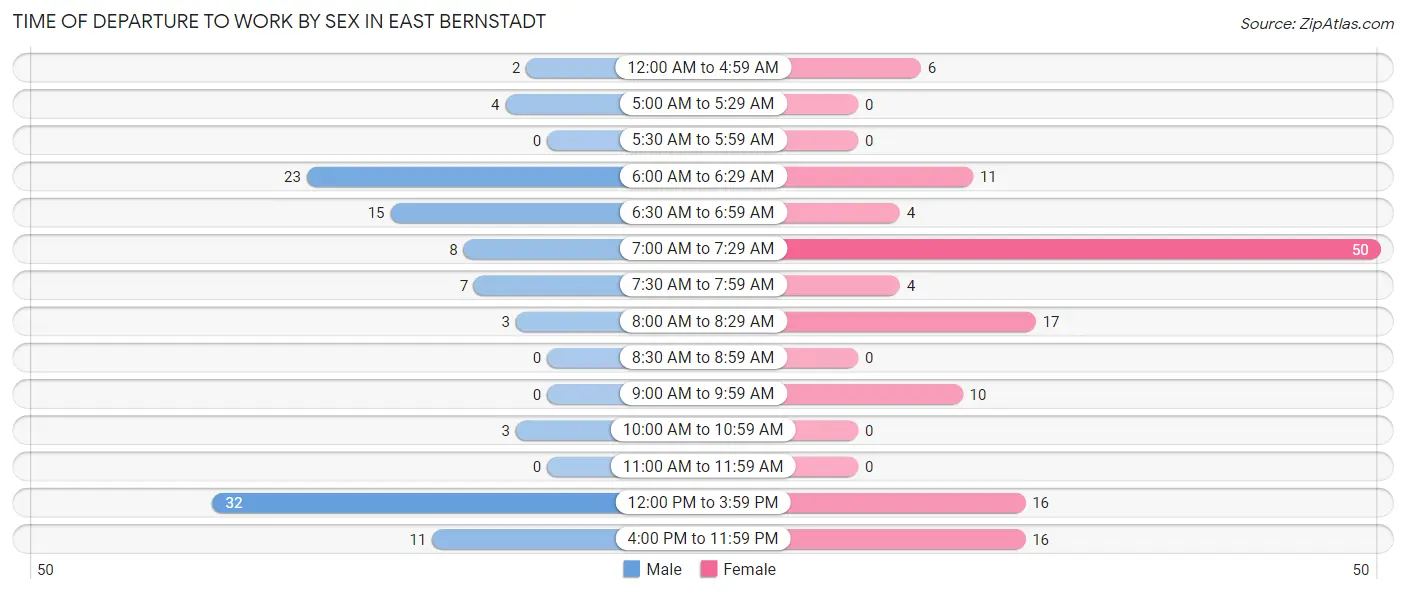
| Time of Departure | Male | Female |
| 12:00 AM to 4:59 AM | 2 (1.8%) | 6 (4.5%) |
| 5:00 AM to 5:29 AM | 4 (3.7%) | 0 (0.0%) |
| 5:30 AM to 5:59 AM | 0 (0.0%) | 0 (0.0%) |
| 6:00 AM to 6:29 AM | 23 (21.3%) | 11 (8.2%) |
| 6:30 AM to 6:59 AM | 15 (13.9%) | 4 (3.0%) |
| 7:00 AM to 7:29 AM | 8 (7.4%) | 50 (37.3%) |
| 7:30 AM to 7:59 AM | 7 (6.5%) | 4 (3.0%) |
| 8:00 AM to 8:29 AM | 3 (2.8%) | 17 (12.7%) |
| 8:30 AM to 8:59 AM | 0 (0.0%) | 0 (0.0%) |
| 9:00 AM to 9:59 AM | 0 (0.0%) | 10 (7.5%) |
| 10:00 AM to 10:59 AM | 3 (2.8%) | 0 (0.0%) |
| 11:00 AM to 11:59 AM | 0 (0.0%) | 0 (0.0%) |
| 12:00 PM to 3:59 PM | 32 (29.6%) | 16 (11.9%) |
| 4:00 PM to 11:59 PM | 11 (10.2%) | 16 (11.9%) |
| Total | 108 (100.0%) | 134 (100.0%) |
Housing Occupancy in East Bernstadt
Occupancy by Ownership in East Bernstadt
Of the total 297 dwellings in East Bernstadt, owner-occupied units account for 220 (74.1%), while renter-occupied units make up 77 (25.9%).
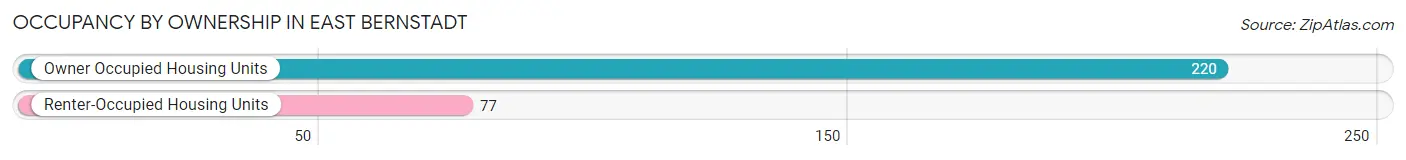
| Occupancy | # Housing Units | % Housing Units |
| Owner Occupied Housing Units | 220 | 74.1% |
| Renter-Occupied Housing Units | 77 | 25.9% |
| Total Occupied Housing Units | 297 | 100.0% |
Occupancy by Household Size in East Bernstadt
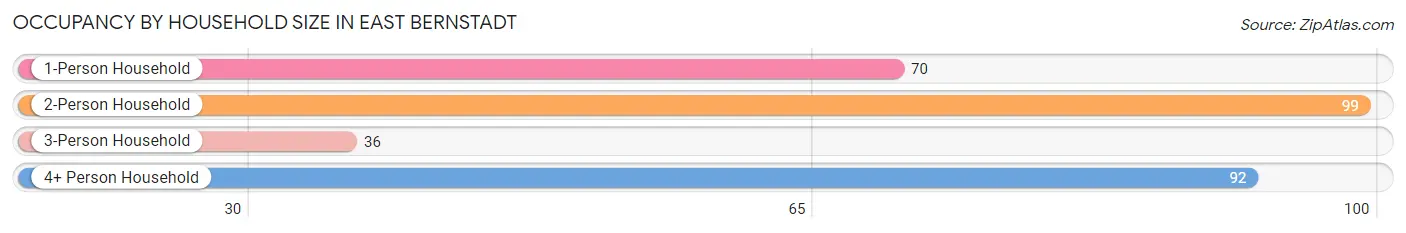
| Household Size | # Housing Units | % Housing Units |
| 1-Person Household | 70 | 23.6% |
| 2-Person Household | 99 | 33.3% |
| 3-Person Household | 36 | 12.1% |
| 4+ Person Household | 92 | 31.0% |
| Total Housing Units | 297 | 100.0% |
Occupancy by Ownership by Household Size in East Bernstadt
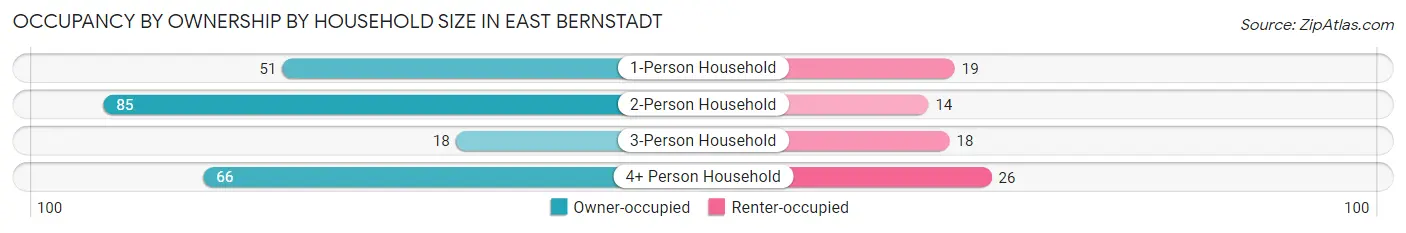
| Household Size | Owner-occupied | Renter-occupied |
| 1-Person Household | 51 (72.9%) | 19 (27.1%) |
| 2-Person Household | 85 (85.9%) | 14 (14.1%) |
| 3-Person Household | 18 (50.0%) | 18 (50.0%) |
| 4+ Person Household | 66 (71.7%) | 26 (28.3%) |
| Total Housing Units | 220 (74.1%) | 77 (25.9%) |
Occupancy by Educational Attainment in East Bernstadt
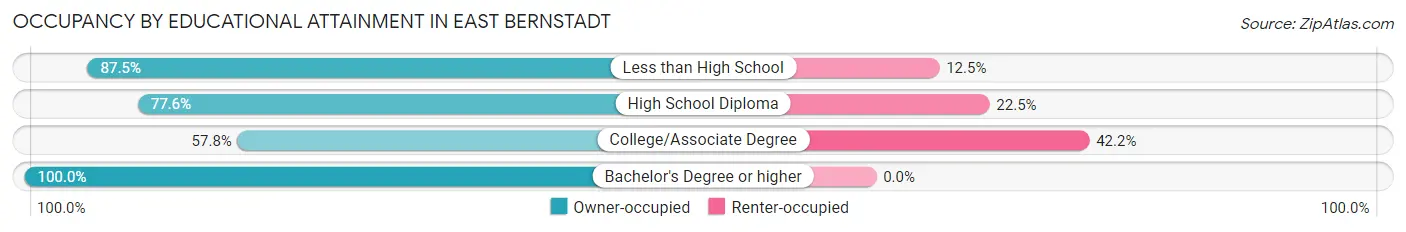
| Household Size | Owner-occupied | Renter-occupied |
| Less than High School | 42 (87.5%) | 6 (12.5%) |
| High School Diploma | 76 (77.5%) | 22 (22.5%) |
| College/Associate Degree | 67 (57.8%) | 49 (42.2%) |
| Bachelor's Degree or higher | 35 (100.0%) | 0 (0.0%) |
Occupancy by Age of Householder in East Bernstadt
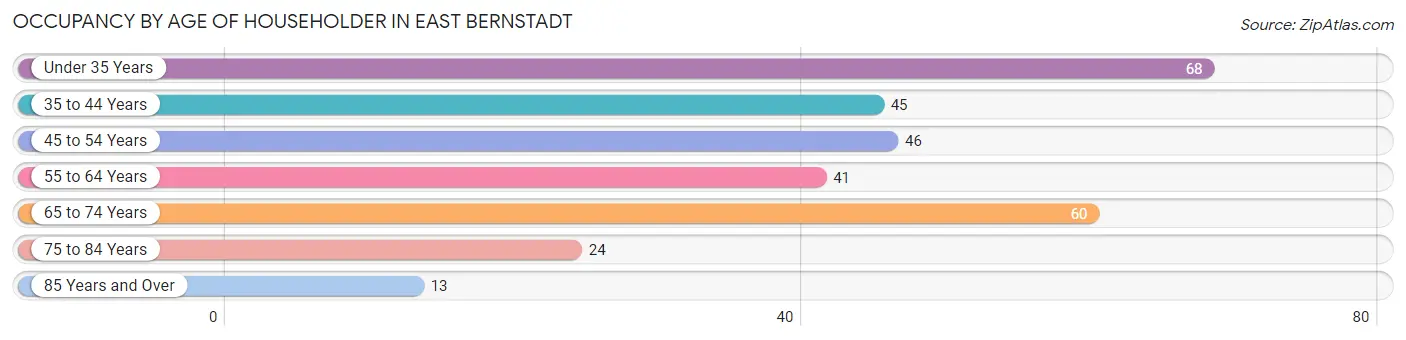
| Age Bracket | # Households | % Households |
| Under 35 Years | 68 | 22.9% |
| 35 to 44 Years | 45 | 15.1% |
| 45 to 54 Years | 46 | 15.5% |
| 55 to 64 Years | 41 | 13.8% |
| 65 to 74 Years | 60 | 20.2% |
| 75 to 84 Years | 24 | 8.1% |
| 85 Years and Over | 13 | 4.4% |
| Total | 297 | 100.0% |
Housing Finances in East Bernstadt
Median Income by Occupancy in East Bernstadt
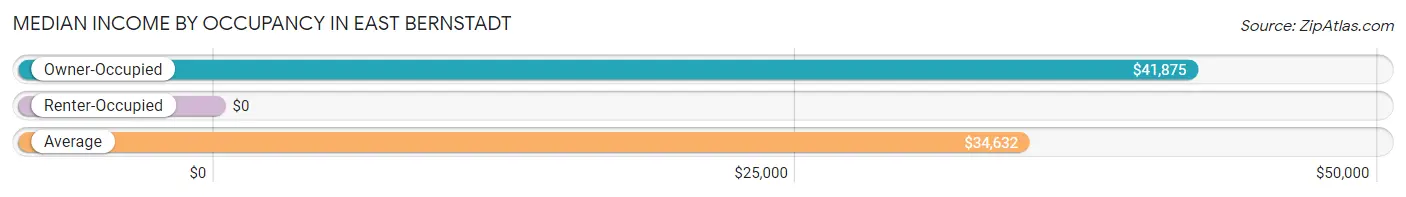
| Occupancy Type | # Households | Median Income |
| Owner-Occupied | 220 (74.1%) | $41,875 |
| Renter-Occupied | 77 (25.9%) | $0 |
| Average | 297 (100.0%) | $34,632 |
Occupancy by Householder Income Bracket in East Bernstadt
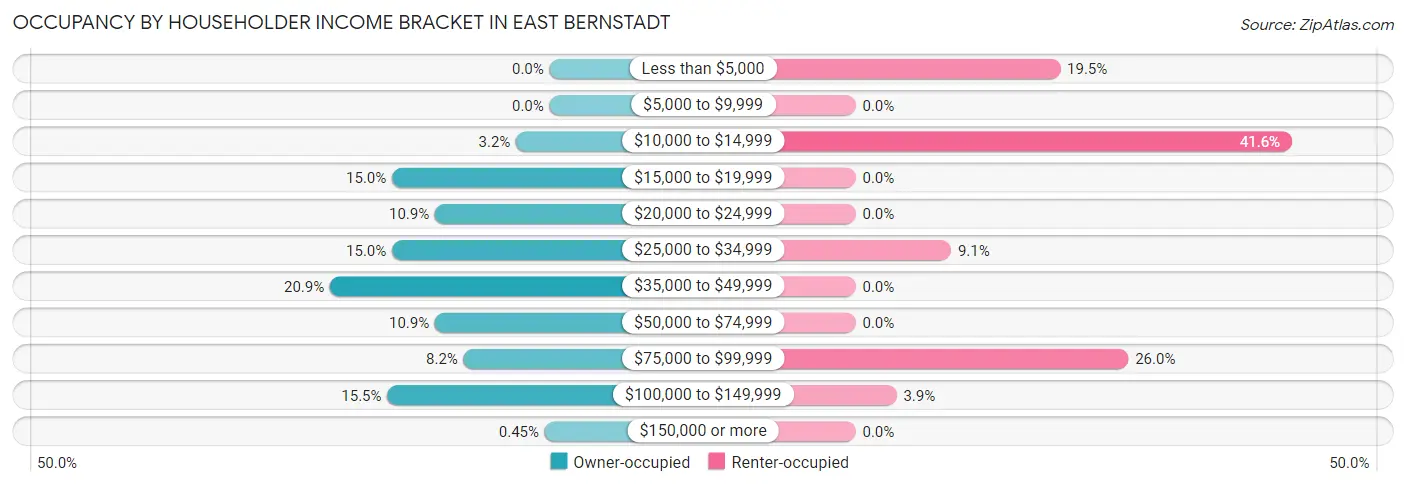
| Income Bracket | Owner-occupied | Renter-occupied |
| Less than $5,000 | 0 (0.0%) | 15 (19.5%) |
| $5,000 to $9,999 | 0 (0.0%) | 0 (0.0%) |
| $10,000 to $14,999 | 7 (3.2%) | 32 (41.6%) |
| $15,000 to $19,999 | 33 (15.0%) | 0 (0.0%) |
| $20,000 to $24,999 | 24 (10.9%) | 0 (0.0%) |
| $25,000 to $34,999 | 33 (15.0%) | 7 (9.1%) |
| $35,000 to $49,999 | 46 (20.9%) | 0 (0.0%) |
| $50,000 to $74,999 | 24 (10.9%) | 0 (0.0%) |
| $75,000 to $99,999 | 18 (8.2%) | 20 (26.0%) |
| $100,000 to $149,999 | 34 (15.4%) | 3 (3.9%) |
| $150,000 or more | 1 (0.4%) | 0 (0.0%) |
| Total | 220 (100.0%) | 77 (100.0%) |
Monthly Housing Cost Tiers in East Bernstadt
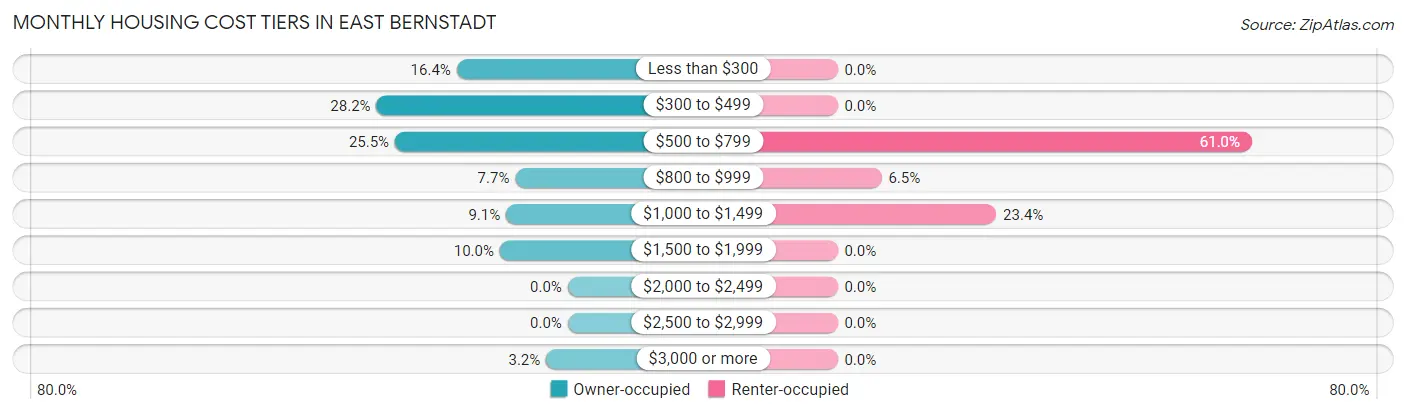
| Monthly Cost | Owner-occupied | Renter-occupied |
| Less than $300 | 36 (16.4%) | 0 (0.0%) |
| $300 to $499 | 62 (28.2%) | 0 (0.0%) |
| $500 to $799 | 56 (25.5%) | 47 (61.0%) |
| $800 to $999 | 17 (7.7%) | 5 (6.5%) |
| $1,000 to $1,499 | 20 (9.1%) | 18 (23.4%) |
| $1,500 to $1,999 | 22 (10.0%) | 0 (0.0%) |
| $2,000 to $2,499 | 0 (0.0%) | 0 (0.0%) |
| $2,500 to $2,999 | 0 (0.0%) | 0 (0.0%) |
| $3,000 or more | 7 (3.2%) | 0 (0.0%) |
| Total | 220 (100.0%) | 77 (100.0%) |
Physical Housing Characteristics in East Bernstadt
Housing Structures in East Bernstadt
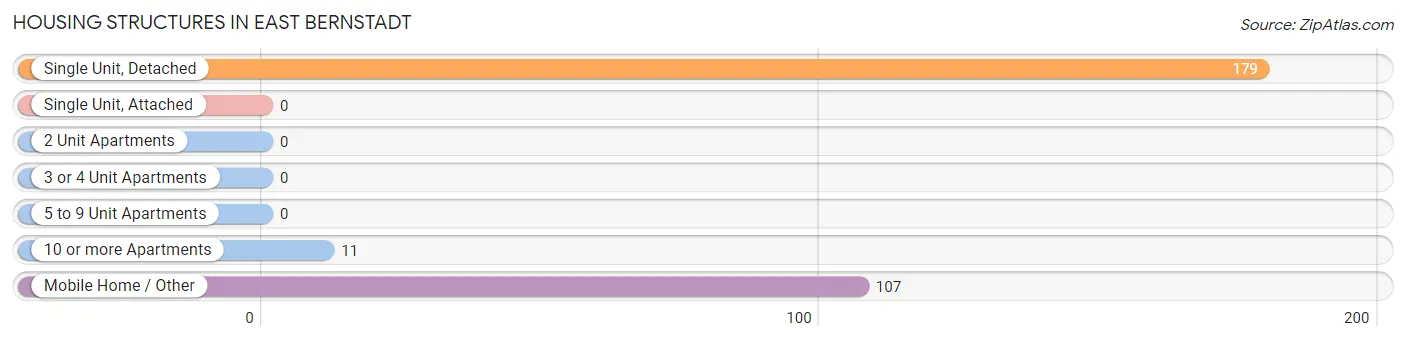
| Structure Type | # Housing Units | % Housing Units |
| Single Unit, Detached | 179 | 60.3% |
| Single Unit, Attached | 0 | 0.0% |
| 2 Unit Apartments | 0 | 0.0% |
| 3 or 4 Unit Apartments | 0 | 0.0% |
| 5 to 9 Unit Apartments | 0 | 0.0% |
| 10 or more Apartments | 11 | 3.7% |
| Mobile Home / Other | 107 | 36.0% |
| Total | 297 | 100.0% |
Housing Structures by Occupancy in East Bernstadt
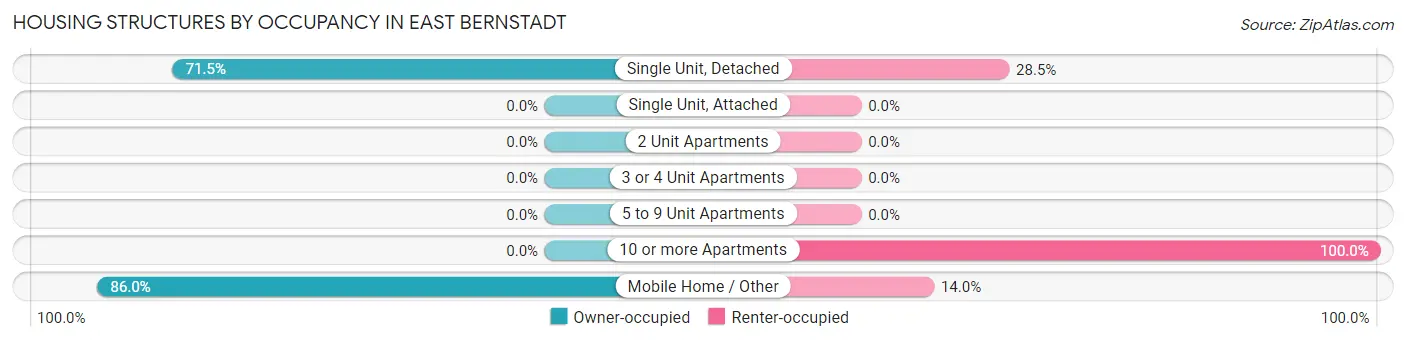
| Structure Type | Owner-occupied | Renter-occupied |
| Single Unit, Detached | 128 (71.5%) | 51 (28.5%) |
| Single Unit, Attached | 0 (0.0%) | 0 (0.0%) |
| 2 Unit Apartments | 0 (0.0%) | 0 (0.0%) |
| 3 or 4 Unit Apartments | 0 (0.0%) | 0 (0.0%) |
| 5 to 9 Unit Apartments | 0 (0.0%) | 0 (0.0%) |
| 10 or more Apartments | 0 (0.0%) | 11 (100.0%) |
| Mobile Home / Other | 92 (86.0%) | 15 (14.0%) |
| Total | 220 (74.1%) | 77 (25.9%) |
Housing Structures by Number of Rooms in East Bernstadt
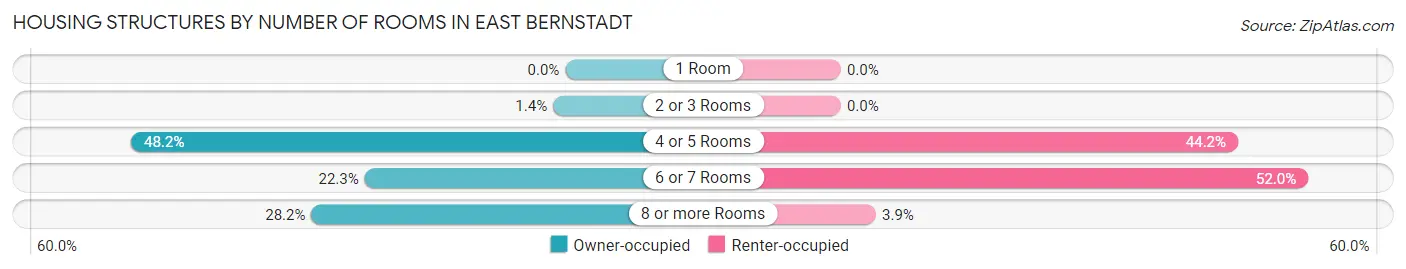
| Number of Rooms | Owner-occupied | Renter-occupied |
| 1 Room | 0 (0.0%) | 0 (0.0%) |
| 2 or 3 Rooms | 3 (1.4%) | 0 (0.0%) |
| 4 or 5 Rooms | 106 (48.2%) | 34 (44.2%) |
| 6 or 7 Rooms | 49 (22.3%) | 40 (51.9%) |
| 8 or more Rooms | 62 (28.2%) | 3 (3.9%) |
| Total | 220 (100.0%) | 77 (100.0%) |
Housing Structure by Heating Type in East Bernstadt
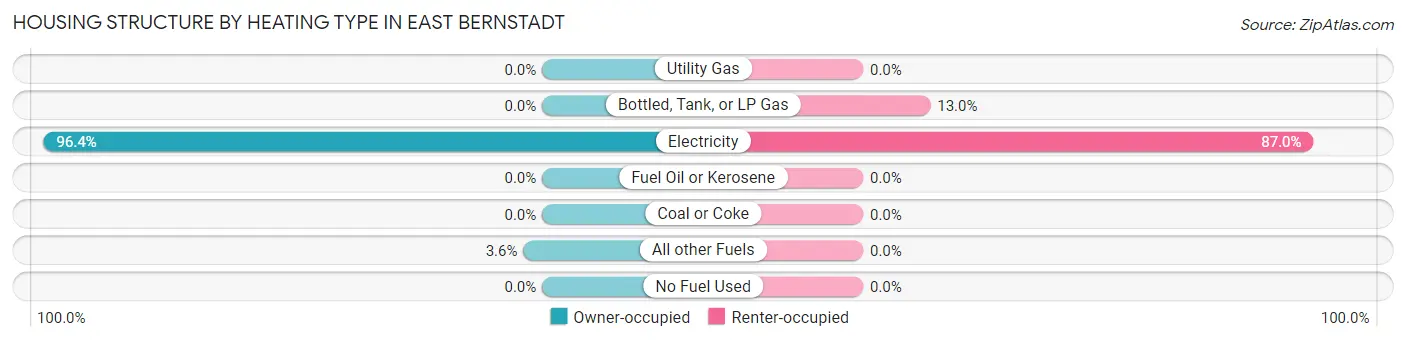
| Heating Type | Owner-occupied | Renter-occupied |
| Utility Gas | 0 (0.0%) | 0 (0.0%) |
| Bottled, Tank, or LP Gas | 0 (0.0%) | 10 (13.0%) |
| Electricity | 212 (96.4%) | 67 (87.0%) |
| Fuel Oil or Kerosene | 0 (0.0%) | 0 (0.0%) |
| Coal or Coke | 0 (0.0%) | 0 (0.0%) |
| All other Fuels | 8 (3.6%) | 0 (0.0%) |
| No Fuel Used | 0 (0.0%) | 0 (0.0%) |
| Total | 220 (100.0%) | 77 (100.0%) |
Household Vehicle Usage in East Bernstadt
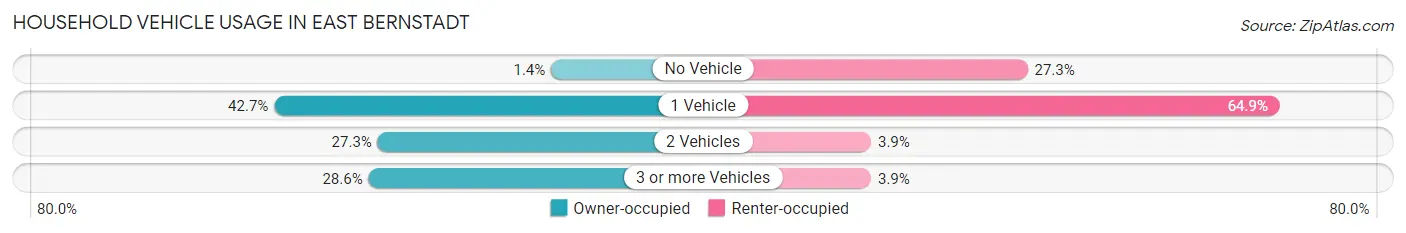
| Vehicles per Household | Owner-occupied | Renter-occupied |
| No Vehicle | 3 (1.4%) | 21 (27.3%) |
| 1 Vehicle | 94 (42.7%) | 50 (64.9%) |
| 2 Vehicles | 60 (27.3%) | 3 (3.9%) |
| 3 or more Vehicles | 63 (28.6%) | 3 (3.9%) |
| Total | 220 (100.0%) | 77 (100.0%) |
Real Estate & Mortgages in East Bernstadt
Real Estate and Mortgage Overview in East Bernstadt
| Characteristic | Without Mortgage | With Mortgage |
| Housing Units | 125 | 95 |
| Median Property Value | $60,600 | $0 |
| Median Household Income | $42,188 | $0 |
| Monthly Housing Costs | $333 | $7 |
| Real Estate Taxes | $390 | $3 |
Property Value by Mortgage Status in East Bernstadt
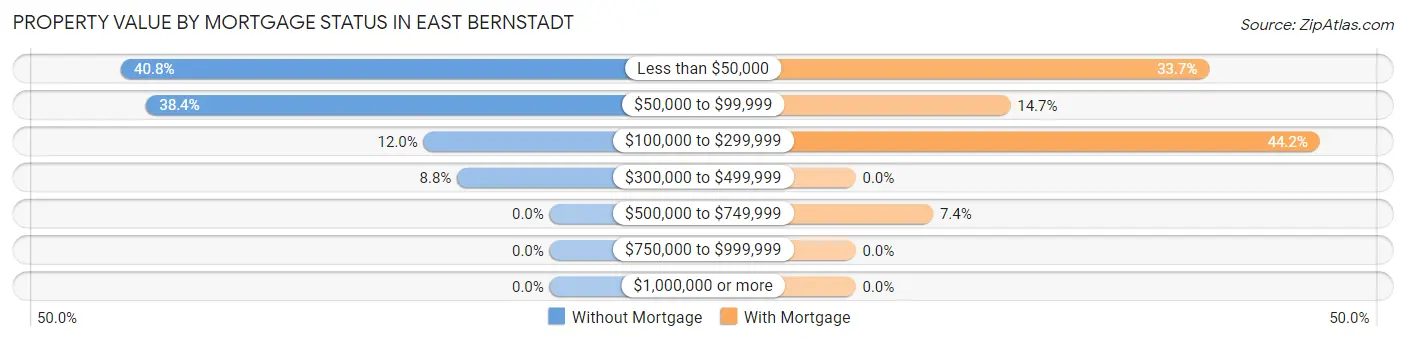
| Property Value | Without Mortgage | With Mortgage |
| Less than $50,000 | 51 (40.8%) | 32 (33.7%) |
| $50,000 to $99,999 | 48 (38.4%) | 14 (14.7%) |
| $100,000 to $299,999 | 15 (12.0%) | 42 (44.2%) |
| $300,000 to $499,999 | 11 (8.8%) | 0 (0.0%) |
| $500,000 to $749,999 | 0 (0.0%) | 7 (7.4%) |
| $750,000 to $999,999 | 0 (0.0%) | 0 (0.0%) |
| $1,000,000 or more | 0 (0.0%) | 0 (0.0%) |
| Total | 125 (100.0%) | 95 (100.0%) |
Household Income by Mortgage Status in East Bernstadt
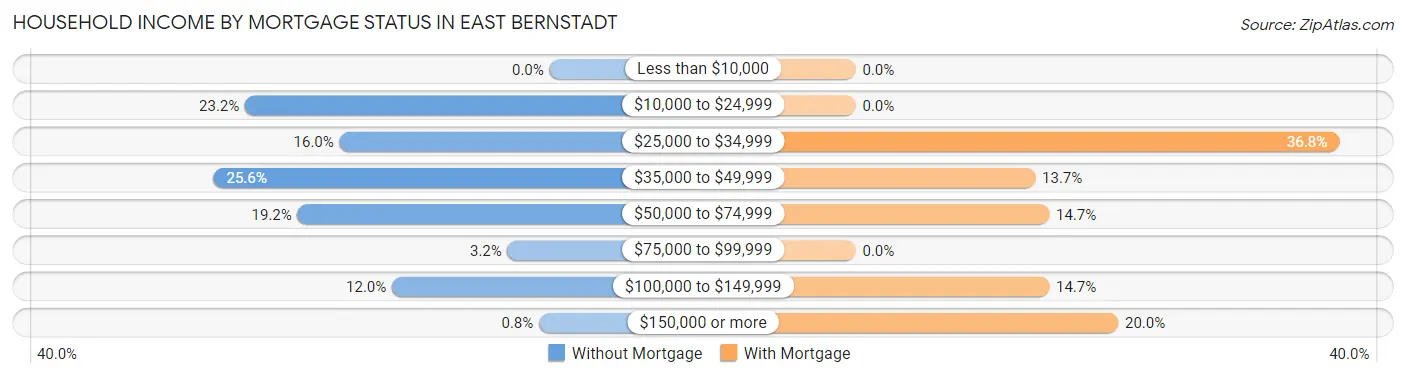
| Household Income | Without Mortgage | With Mortgage |
| Less than $10,000 | 0 (0.0%) | 0 (0.0%) |
| $10,000 to $24,999 | 29 (23.2%) | 0 (0.0%) |
| $25,000 to $34,999 | 20 (16.0%) | 35 (36.8%) |
| $35,000 to $49,999 | 32 (25.6%) | 13 (13.7%) |
| $50,000 to $74,999 | 24 (19.2%) | 14 (14.7%) |
| $75,000 to $99,999 | 4 (3.2%) | 0 (0.0%) |
| $100,000 to $149,999 | 15 (12.0%) | 14 (14.7%) |
| $150,000 or more | 1 (0.8%) | 19 (20.0%) |
| Total | 125 (100.0%) | 95 (100.0%) |
Property Value to Household Income Ratio in East Bernstadt
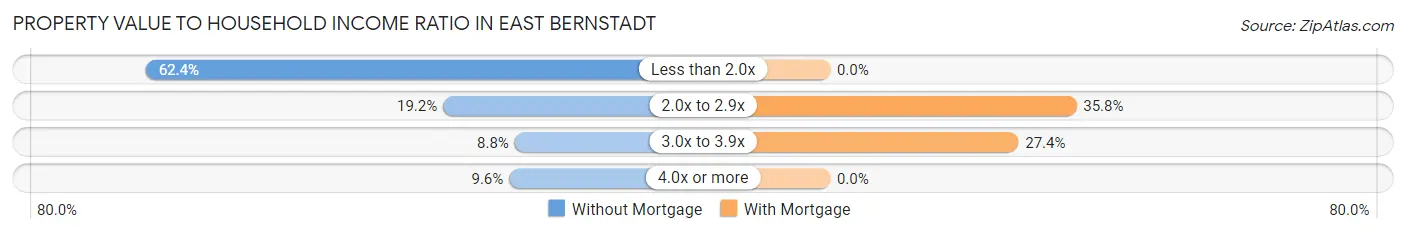
| Value-to-Income Ratio | Without Mortgage | With Mortgage |
| Less than 2.0x | 78 (62.4%) | 0 (0.0%) |
| 2.0x to 2.9x | 24 (19.2%) | 34 (35.8%) |
| 3.0x to 3.9x | 11 (8.8%) | 26 (27.4%) |
| 4.0x or more | 12 (9.6%) | 0 (0.0%) |
| Total | 125 (100.0%) | 95 (100.0%) |
Real Estate Taxes by Mortgage Status in East Bernstadt
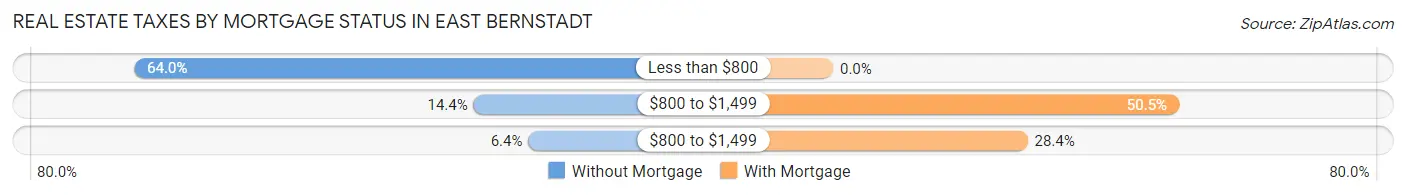
| Property Taxes | Without Mortgage | With Mortgage |
| Less than $800 | 80 (64.0%) | 0 (0.0%) |
| $800 to $1,499 | 18 (14.4%) | 48 (50.5%) |
| $800 to $1,499 | 8 (6.4%) | 27 (28.4%) |
| Total | 125 (100.0%) | 95 (100.0%) |
Health & Disability in East Bernstadt
Health Insurance Coverage by Age in East Bernstadt
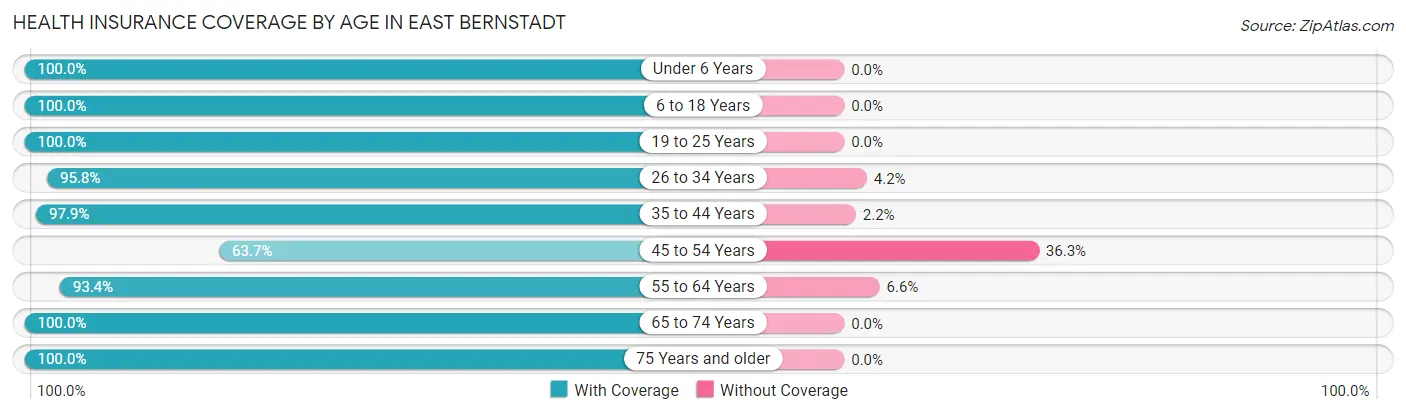
| Age Bracket | With Coverage | Without Coverage |
| Under 6 Years | 49 (100.0%) | 0 (0.0%) |
| 6 to 18 Years | 191 (100.0%) | 0 (0.0%) |
| 19 to 25 Years | 50 (100.0%) | 0 (0.0%) |
| 26 to 34 Years | 114 (95.8%) | 5 (4.2%) |
| 35 to 44 Years | 91 (97.9%) | 2 (2.1%) |
| 45 to 54 Years | 79 (63.7%) | 45 (36.3%) |
| 55 to 64 Years | 71 (93.4%) | 5 (6.6%) |
| 65 to 74 Years | 96 (100.0%) | 0 (0.0%) |
| 75 Years and older | 52 (100.0%) | 0 (0.0%) |
| Total | 793 (93.3%) | 57 (6.7%) |
Health Insurance Coverage by Citizenship Status in East Bernstadt
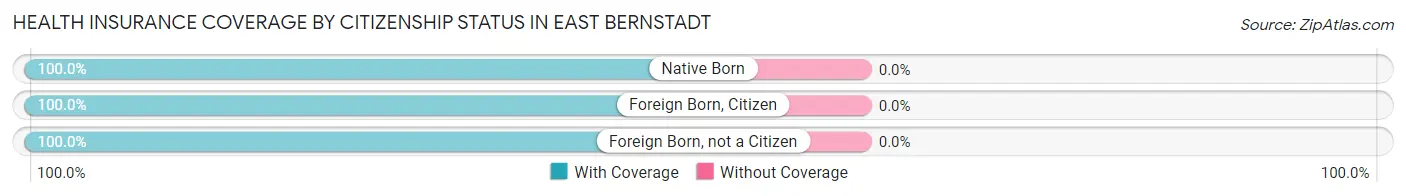
| Citizenship Status | With Coverage | Without Coverage |
| Native Born | 49 (100.0%) | 0 (0.0%) |
| Foreign Born, Citizen | 191 (100.0%) | 0 (0.0%) |
| Foreign Born, not a Citizen | 50 (100.0%) | 0 (0.0%) |
Health Insurance Coverage by Household Income in East Bernstadt
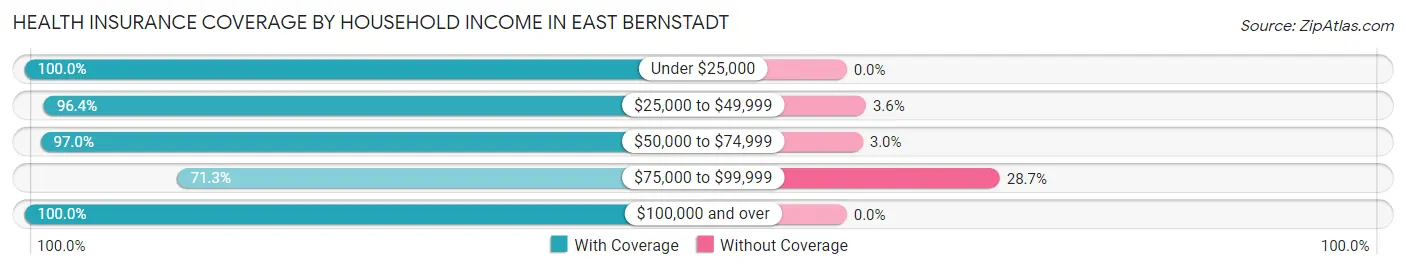
| Household Income | With Coverage | Without Coverage |
| Under $25,000 | 242 (100.0%) | 0 (0.0%) |
| $25,000 to $49,999 | 268 (96.4%) | 10 (3.6%) |
| $50,000 to $74,999 | 65 (97.0%) | 2 (3.0%) |
| $75,000 to $99,999 | 112 (71.3%) | 45 (28.7%) |
| $100,000 and over | 106 (100.0%) | 0 (0.0%) |
Public vs Private Health Insurance Coverage by Age in East Bernstadt
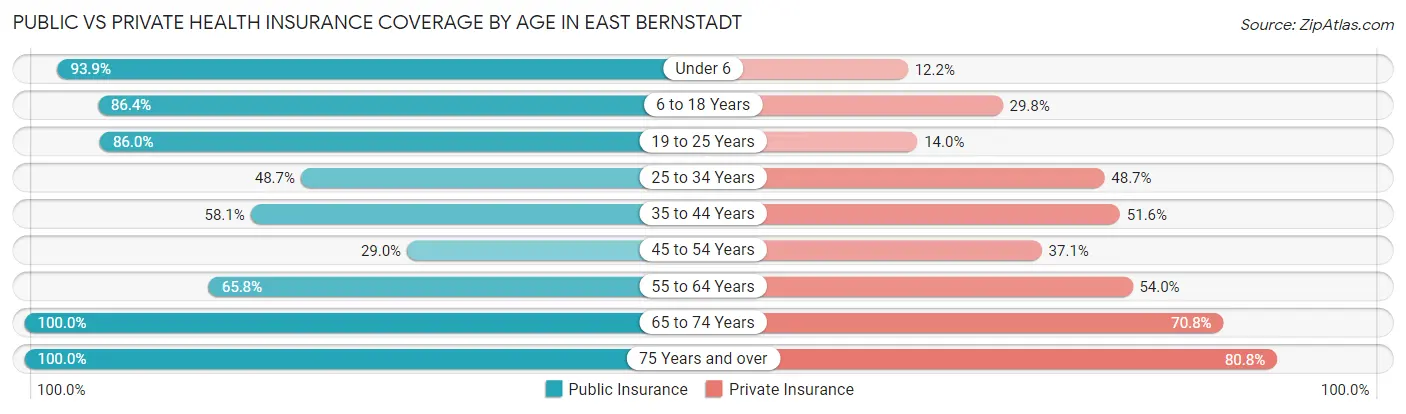
| Age Bracket | Public Insurance | Private Insurance |
| Under 6 | 46 (93.9%) | 6 (12.2%) |
| 6 to 18 Years | 165 (86.4%) | 57 (29.8%) |
| 19 to 25 Years | 43 (86.0%) | 7 (14.0%) |
| 25 to 34 Years | 58 (48.7%) | 58 (48.7%) |
| 35 to 44 Years | 54 (58.1%) | 48 (51.6%) |
| 45 to 54 Years | 36 (29.0%) | 46 (37.1%) |
| 55 to 64 Years | 50 (65.8%) | 41 (53.9%) |
| 65 to 74 Years | 96 (100.0%) | 68 (70.8%) |
| 75 Years and over | 52 (100.0%) | 42 (80.8%) |
| Total | 600 (70.6%) | 373 (43.9%) |
Disability Status by Sex by Age in East Bernstadt
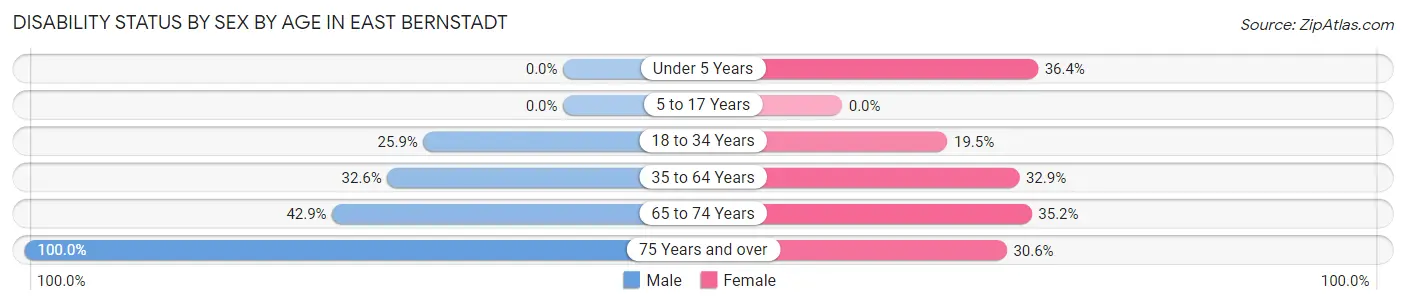
| Age Bracket | Male | Female |
| Under 5 Years | 0 (0.0%) | 8 (36.4%) |
| 5 to 17 Years | 0 (0.0%) | 0 (0.0%) |
| 18 to 34 Years | 14 (25.9%) | 25 (19.5%) |
| 35 to 64 Years | 46 (32.6%) | 50 (32.9%) |
| 65 to 74 Years | 18 (42.9%) | 19 (35.2%) |
| 75 Years and over | 16 (100.0%) | 11 (30.6%) |
Disability Class by Sex by Age in East Bernstadt
Disability Class: Hearing Difficulty
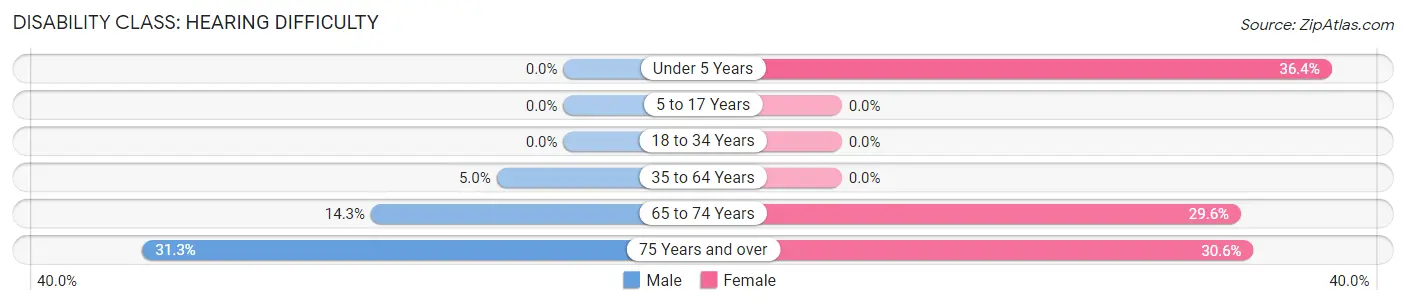
| Age Bracket | Male | Female |
| Under 5 Years | 0 (0.0%) | 8 (36.4%) |
| 5 to 17 Years | 0 (0.0%) | 0 (0.0%) |
| 18 to 34 Years | 0 (0.0%) | 0 (0.0%) |
| 35 to 64 Years | 7 (5.0%) | 0 (0.0%) |
| 65 to 74 Years | 6 (14.3%) | 16 (29.6%) |
| 75 Years and over | 5 (31.2%) | 11 (30.6%) |
Disability Class: Vision Difficulty
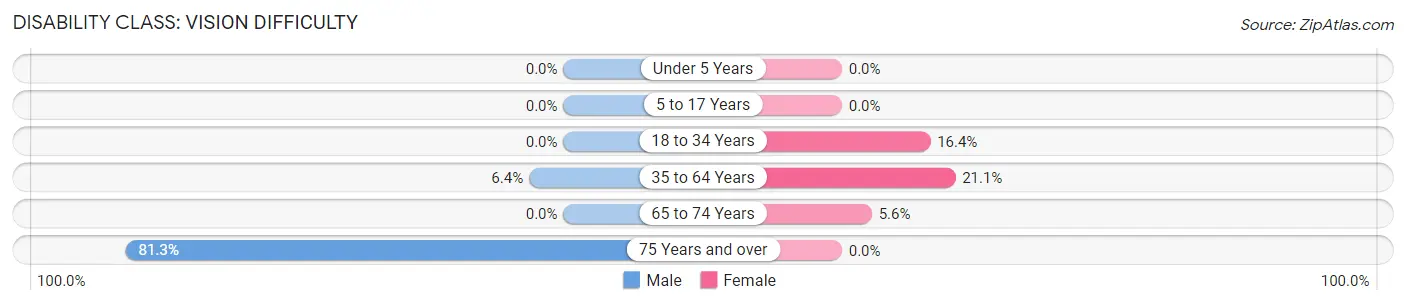
| Age Bracket | Male | Female |
| Under 5 Years | 0 (0.0%) | 0 (0.0%) |
| 5 to 17 Years | 0 (0.0%) | 0 (0.0%) |
| 18 to 34 Years | 0 (0.0%) | 21 (16.4%) |
| 35 to 64 Years | 9 (6.4%) | 32 (21.0%) |
| 65 to 74 Years | 0 (0.0%) | 3 (5.6%) |
| 75 Years and over | 13 (81.2%) | 0 (0.0%) |
Disability Class: Cognitive Difficulty
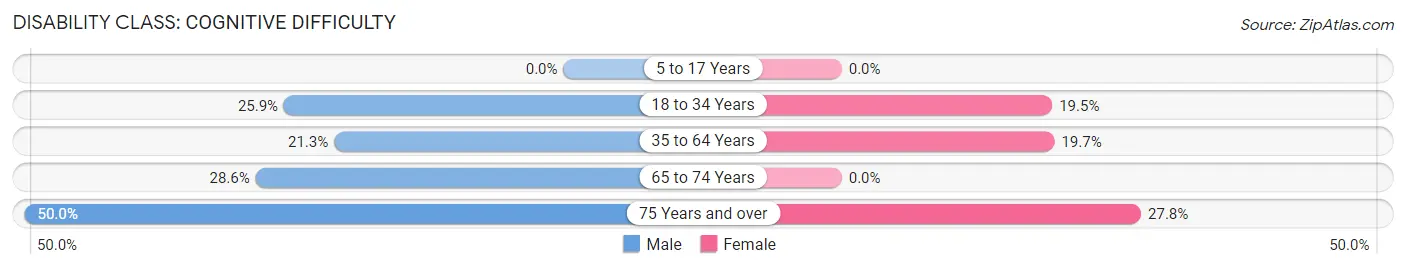
| Age Bracket | Male | Female |
| 5 to 17 Years | 0 (0.0%) | 0 (0.0%) |
| 18 to 34 Years | 14 (25.9%) | 25 (19.5%) |
| 35 to 64 Years | 30 (21.3%) | 30 (19.7%) |
| 65 to 74 Years | 12 (28.6%) | 0 (0.0%) |
| 75 Years and over | 8 (50.0%) | 10 (27.8%) |
Disability Class: Ambulatory Difficulty
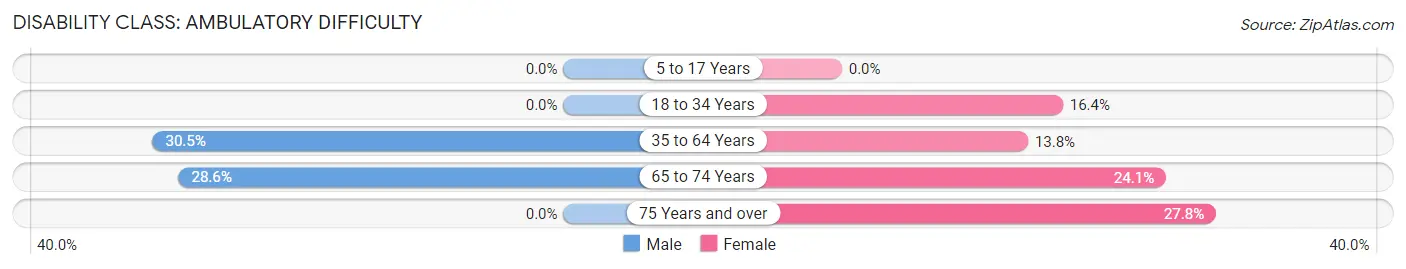
| Age Bracket | Male | Female |
| 5 to 17 Years | 0 (0.0%) | 0 (0.0%) |
| 18 to 34 Years | 0 (0.0%) | 21 (16.4%) |
| 35 to 64 Years | 43 (30.5%) | 21 (13.8%) |
| 65 to 74 Years | 12 (28.6%) | 13 (24.1%) |
| 75 Years and over | 0 (0.0%) | 10 (27.8%) |
Disability Class: Self-Care Difficulty
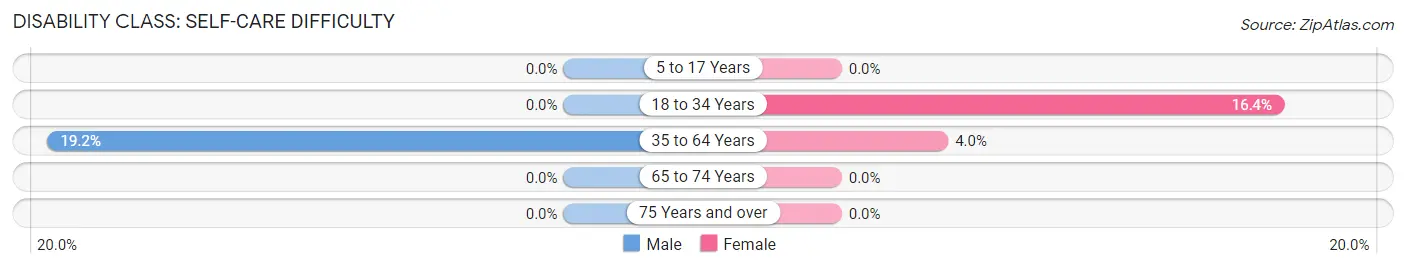
| Age Bracket | Male | Female |
| 5 to 17 Years | 0 (0.0%) | 0 (0.0%) |
| 18 to 34 Years | 0 (0.0%) | 21 (16.4%) |
| 35 to 64 Years | 27 (19.2%) | 6 (4.0%) |
| 65 to 74 Years | 0 (0.0%) | 0 (0.0%) |
| 75 Years and over | 0 (0.0%) | 0 (0.0%) |
Technology Access in East Bernstadt
Computing Device Access in East Bernstadt
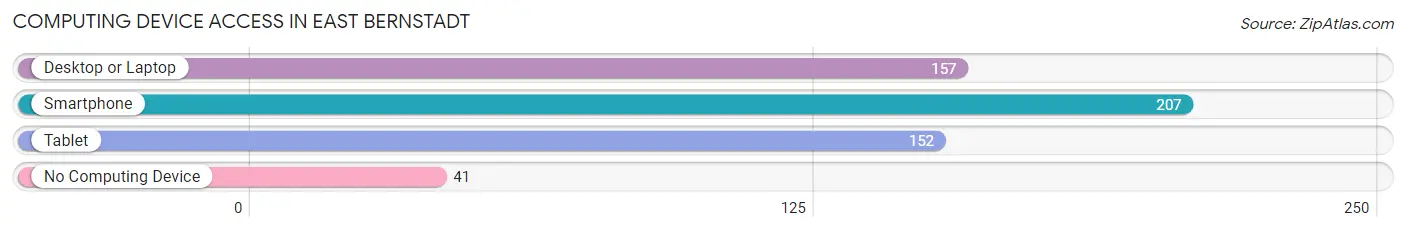
| Device Type | # Households | % Households |
| Desktop or Laptop | 157 | 52.9% |
| Smartphone | 207 | 69.7% |
| Tablet | 152 | 51.2% |
| No Computing Device | 41 | 13.8% |
| Total | 297 | 100.0% |
Internet Access in East Bernstadt
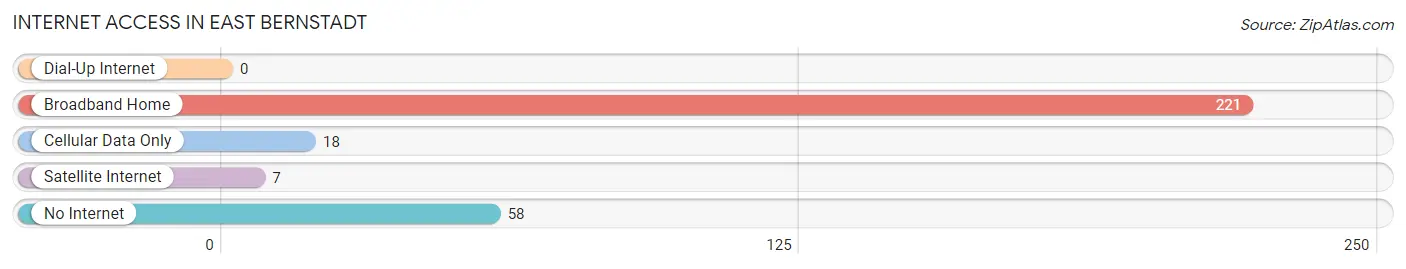
| Internet Type | # Households | % Households |
| Dial-Up Internet | 0 | 0.0% |
| Broadband Home | 221 | 74.4% |
| Cellular Data Only | 18 | 6.1% |
| Satellite Internet | 7 | 2.4% |
| No Internet | 58 | 19.5% |
| Total | 297 | 100.0% |
East Bernstadt Summary
History
East Bernstadt is a small unincorporated community located in Laurel County, Kentucky. It is situated in the foothills of the Appalachian Mountains, approximately 15 miles south of London, the county seat. The community was first settled in the early 1800s by German immigrants who were attracted to the area by its abundant natural resources. The town was originally known as “Berlin”, but was later changed to “East Bernstadt” to avoid confusion with the city of Berlin, Germany.
The town was officially incorporated in 1883 and quickly became a thriving community. The town was home to several businesses, including a sawmill, a gristmill, a blacksmith shop, and a general store. The town also had a post office, a school, and a church.
East Bernstadt was a major stop on the Louisville & Nashville Railroad, which ran through the town from 1883 to the late 1950s. The railroad brought many new people to the area, and the town’s population grew steadily throughout the late 19th and early 20th centuries.
Geography
East Bernstadt is located in the foothills of the Appalachian Mountains in southeastern Kentucky. The town is situated in Laurel County, approximately 15 miles south of London, the county seat. The town is located at the intersection of US Highway 25 and KY Highway 30.
The town is situated in a hilly region, with elevations ranging from 800 to 1,000 feet above sea level. The town is surrounded by forests and rolling hills, and is home to several creeks and streams. The town is located near the Daniel Boone National Forest, which provides a variety of recreational activities.
Economy
East Bernstadt is a small, rural community with a population of approximately 1,000 people. The town’s economy is largely based on agriculture and forestry. The town is home to several farms, which produce a variety of crops, including corn, soybeans, and tobacco. The town is also home to several sawmills and lumber companies, which provide employment for many of the town’s residents.
The town is also home to several small businesses, including a grocery store, a hardware store, and a restaurant. The town is also home to a post office and a bank.
Demographics
As of the 2010 census, the population of East Bernstadt was 1,039. The town is predominantly white, with 95.3% of the population identifying as white. The town is also home to a small African American population (2.2%), as well as a small Hispanic population (1.2%).
The median household income in East Bernstadt is $30,938, and the median home value is $77,400. The town has a poverty rate of 22.3%, which is higher than the national average. The town also has a high unemployment rate of 8.2%.
Common Questions
What is Per Capita Income in East Bernstadt?
Per Capita income in East Bernstadt is $18,944.
What is the Median Family Income in East Bernstadt?
Median Family Income in East Bernstadt is $35,750.
What is the Median Household income in East Bernstadt?
Median Household Income in East Bernstadt is $34,632.
What is Income or Wage Gap in East Bernstadt?
Income or Wage Gap in East Bernstadt is 7.8%.
Women in East Bernstadt earn 92.2 cents for every dollar earned by a man.
What is Family Income Deficit in East Bernstadt?
Family Income Deficit in East Bernstadt is $12,185.
Families that are below poverty line in East Bernstadt earn $12,185 less on average than the poverty threshold level.
What is Inequality or Gini Index in East Bernstadt?
Inequality or Gini Index in East Bernstadt is 0.43.
What is the Total Population of East Bernstadt?
Total Population of East Bernstadt is 850.
What is the Total Male Population of East Bernstadt?
Total Male Population of East Bernstadt is 358.
What is the Total Female Population of East Bernstadt?
Total Female Population of East Bernstadt is 492.
What is the Ratio of Males per 100 Females in East Bernstadt?
There are 72.76 Males per 100 Females in East Bernstadt.
What is the Ratio of Females per 100 Males in East Bernstadt?
There are 137.43 Females per 100 Males in East Bernstadt.
What is the Median Population Age in East Bernstadt?
Median Population Age in East Bernstadt is 37.0 Years.
What is the Average Family Size in East Bernstadt
Average Family Size in East Bernstadt is 3.4 People.
What is the Average Household Size in East Bernstadt
Average Household Size in East Bernstadt is 2.9 People.
How Large is the Labor Force in East Bernstadt?
There are 308 People in the Labor Forcein in East Bernstadt.
What is the Percentage of People in the Labor Force in East Bernstadt?
46.1% of People are in the Labor Force in East Bernstadt.
What is the Unemployment Rate in East Bernstadt?
Unemployment Rate in East Bernstadt is 10.7%.