Zip Codes with the Highest Percentage of Population Employed in Food Preparation & Serving in Covington, KY
RELATED REPORTS & OPTIONS
Food Preparation & Serving
Covington
Compare Zip Codes
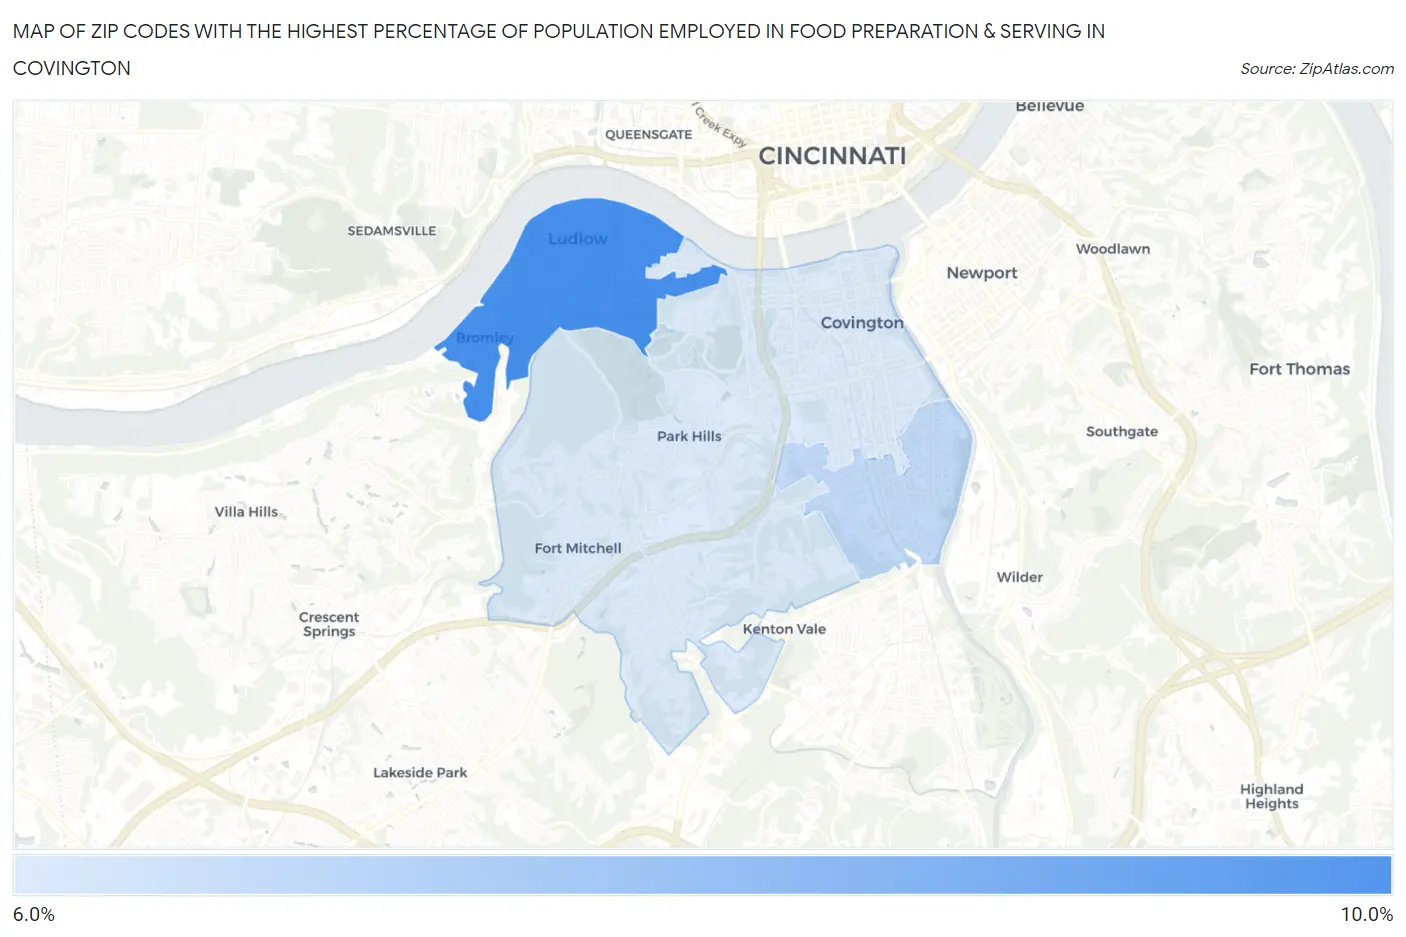
Map of Zip Codes with the Highest Percentage of Population Employed in Food Preparation & Serving in Covington
6.3%
8.7%
Zip Codes with the Highest Percentage of Population Employed in Food Preparation & Serving in Covington, KY
| Zip Code | % Employed | vs State | vs National | |
| 1. | 41016 | 8.7% | 5.1%(+3.61)#96 | 5.3%(+3.40)#3,865 |
| 2. | 41014 | 6.7% | 5.1%(+1.65)#158 | 5.3%(+1.45)#7,243 |
| 3. | 41011 | 6.3% | 5.1%(+1.20)#180 | 5.3%(+1.00)#8,473 |
1
Common Questions
What are the Top Zip Codes with the Highest Percentage of Population Employed in Food Preparation & Serving in Covington, KY?
Top Zip Codes with the Highest Percentage of Population Employed in Food Preparation & Serving in Covington, KY are:
What zip code has the Highest Percentage of Population Employed in Food Preparation & Serving in Covington, KY?
41016 has the Highest Percentage of Population Employed in Food Preparation & Serving in Covington, KY with 8.7%.
What is the Percentage of Population Employed in Food Preparation & Serving in Covington, KY?
Percentage of Population Employed in Food Preparation & Serving in Covington is 6.4%.
What is the Percentage of Population Employed in Food Preparation & Serving in Kentucky?
Percentage of Population Employed in Food Preparation & Serving in Kentucky is 5.1%.
What is the Percentage of Population Employed in Food Preparation & Serving in the United States?
Percentage of Population Employed in Food Preparation & Serving in the United States is 5.3%.