Prestonville, KY Map & Demographics
Prestonville Map
Prestonville Overview
$17,237
PER CAPITA INCOME
$17,391
AVG FAMILY INCOME
$20,313
AVG HOUSEHOLD INCOME
0.38
INEQUALITY / GINI INDEX
115
TOTAL POPULATION
72
MALE POPULATION
43
FEMALE POPULATION
167.44
MALES / 100 FEMALES
59.72
FEMALES / 100 MALES
54.9
MEDIAN AGE
2.0
AVG FAMILY SIZE
1.8
AVG HOUSEHOLD SIZE
55
LABOR FORCE [ PEOPLE ]
52.4%
PERCENT IN LABOR FORCE
21.8%
UNEMPLOYMENT RATE
Income in Prestonville
Income Overview in Prestonville
Per Capita Income in Prestonville is $17,237, while median incomes of families and households are $17,391 and $20,313 respectively.
| Characteristic | Number | Measure |
| Per Capita Income | 115 | $17,237 |
| Median Family Income | 46 | $17,391 |
| Mean Family Income | 46 | $29,485 |
| Median Household Income | 63 | $20,313 |
| Mean Household Income | 63 | $31,211 |
| Income Deficit | 46 | $0 |
| Wage / Income Gap (%) | 115 | 0.00% |
| Wage / Income Gap ($) | 115 | 100.00¢ per $1 |
| Gini / Inequality Index | 115 | 0.38 |
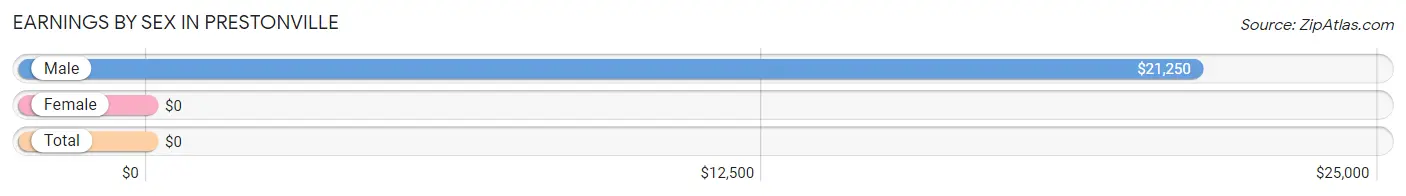
Earnings by Sex in Prestonville
| Sex | Number | Average Earnings |
| Male | 32 (55.2%) | $21,250 |
| Female | 26 (44.8%) | $0 |
| Total | 58 (100.0%) | $0 |
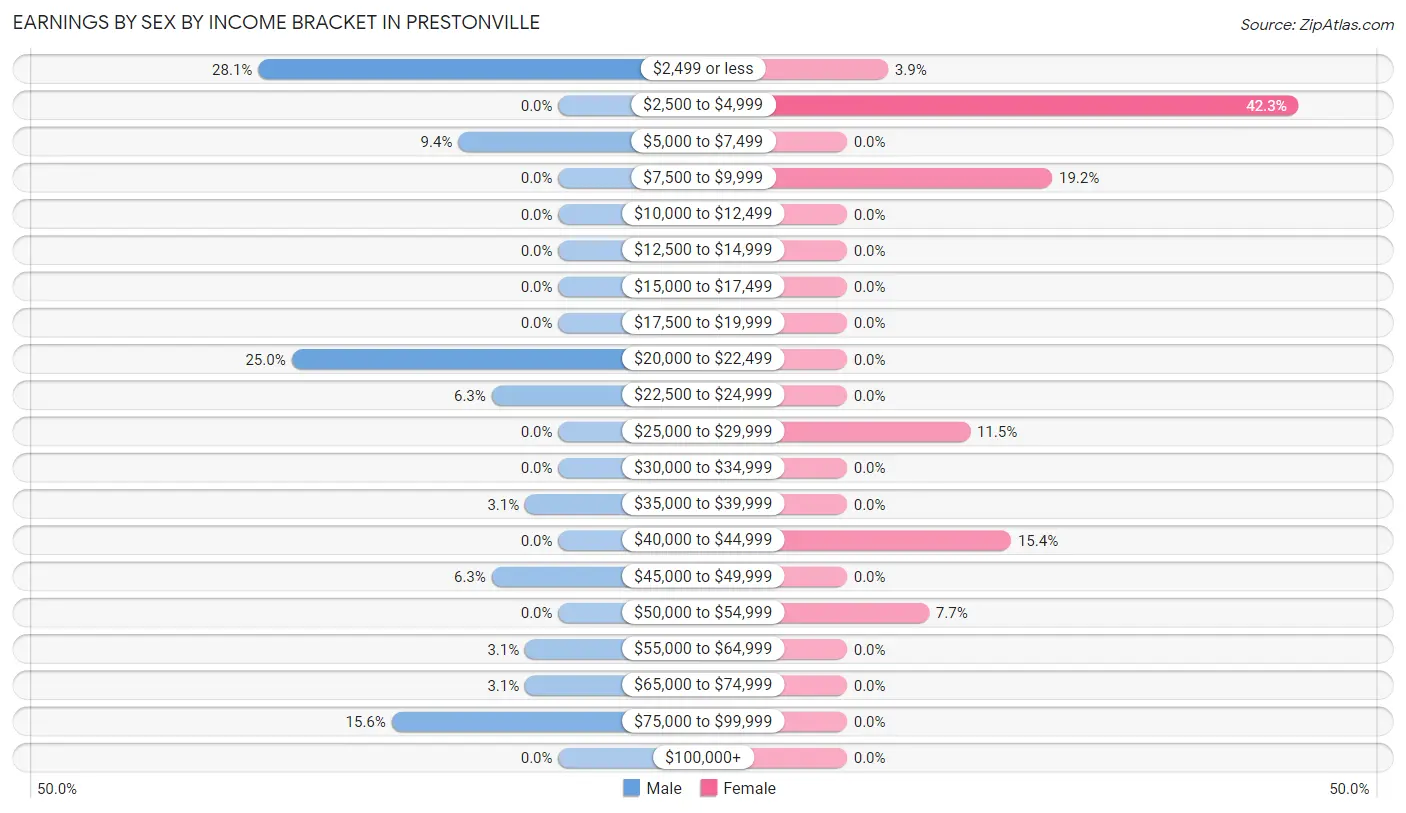
Earnings by Sex by Income Bracket in Prestonville
The most common earnings brackets in Prestonville are $2,499 or less for men (9 | 28.1%) and $2,500 to $4,999 for women (11 | 42.3%).
| Income | Male | Female |
| $2,499 or less | 9 (28.1%) | 1 (3.8%) |
| $2,500 to $4,999 | 0 (0.0%) | 11 (42.3%) |
| $5,000 to $7,499 | 3 (9.4%) | 0 (0.0%) |
| $7,500 to $9,999 | 0 (0.0%) | 5 (19.2%) |
| $10,000 to $12,499 | 0 (0.0%) | 0 (0.0%) |
| $12,500 to $14,999 | 0 (0.0%) | 0 (0.0%) |
| $15,000 to $17,499 | 0 (0.0%) | 0 (0.0%) |
| $17,500 to $19,999 | 0 (0.0%) | 0 (0.0%) |
| $20,000 to $22,499 | 8 (25.0%) | 0 (0.0%) |
| $22,500 to $24,999 | 2 (6.2%) | 0 (0.0%) |
| $25,000 to $29,999 | 0 (0.0%) | 3 (11.5%) |
| $30,000 to $34,999 | 0 (0.0%) | 0 (0.0%) |
| $35,000 to $39,999 | 1 (3.1%) | 0 (0.0%) |
| $40,000 to $44,999 | 0 (0.0%) | 4 (15.4%) |
| $45,000 to $49,999 | 2 (6.2%) | 0 (0.0%) |
| $50,000 to $54,999 | 0 (0.0%) | 2 (7.7%) |
| $55,000 to $64,999 | 1 (3.1%) | 0 (0.0%) |
| $65,000 to $74,999 | 1 (3.1%) | 0 (0.0%) |
| $75,000 to $99,999 | 5 (15.6%) | 0 (0.0%) |
| $100,000+ | 0 (0.0%) | 0 (0.0%) |
| Total | 32 (100.0%) | 26 (100.0%) |
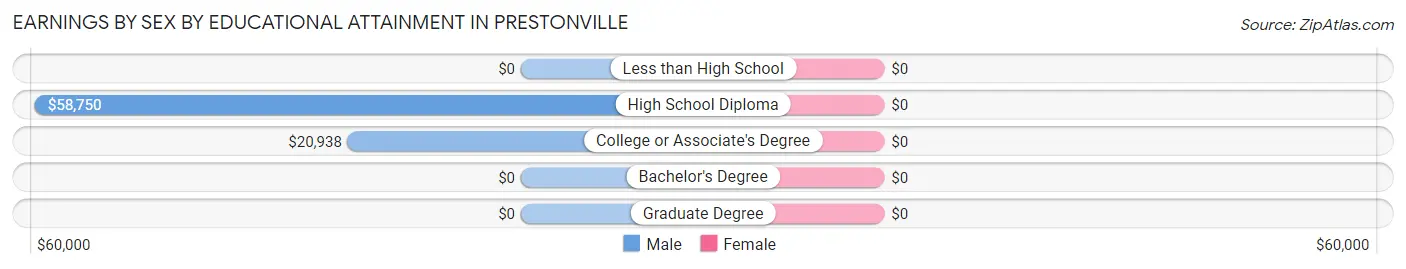
Earnings by Sex by Educational Attainment in Prestonville
| Educational Attainment | Male Income | Female Income |
| Less than High School | - | - |
| High School Diploma | $58,750 | $0 |
| College or Associate's Degree | $20,938 | $0 |
| Bachelor's Degree | - | - |
| Graduate Degree | - | - |
| Total | - | - |
Family Income in Prestonville
Family Income Brackets in Prestonville
According to the Prestonville family income data, there are 32 families falling into the $15,000 to $24,999 income range, which is the most common income bracket and makes up 69.6% of all families.
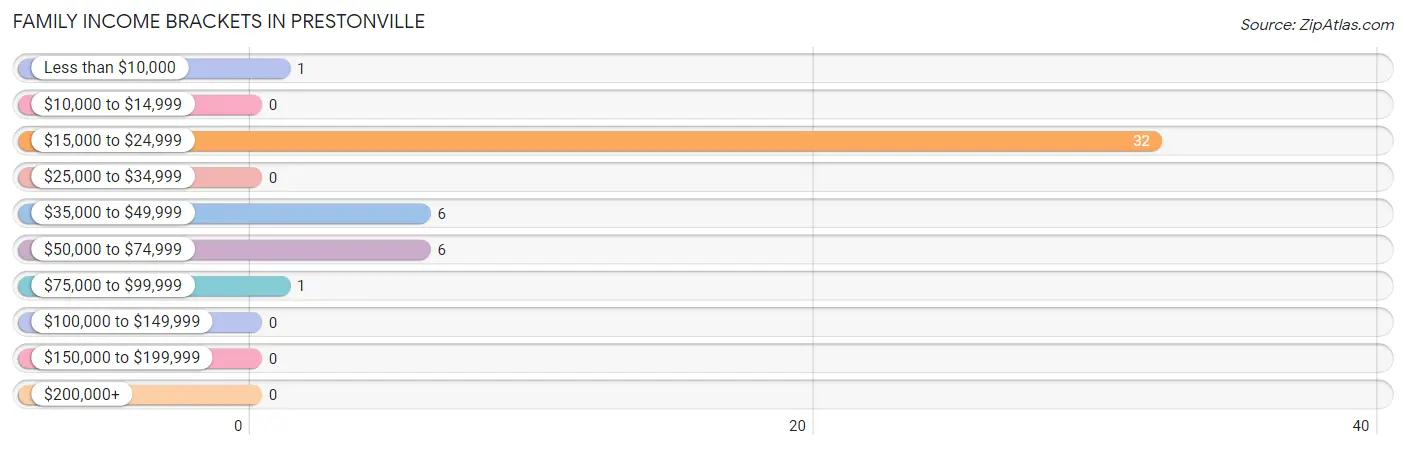
| Income Bracket | # Families | % Families |
| Less than $10,000 | 1 | 2.2% |
| $10,000 to $14,999 | 0 | 0.0% |
| $15,000 to $24,999 | 32 | 69.6% |
| $25,000 to $34,999 | 0 | 0.0% |
| $35,000 to $49,999 | 6 | 13.0% |
| $50,000 to $74,999 | 6 | 13.0% |
| $75,000 to $99,999 | 1 | 2.2% |
| $100,000 to $149,999 | 0 | 0.0% |
| $150,000 to $199,999 | 0 | 0.0% |
| $200,000+ | 0 | 0.0% |
Family Income by Famaliy Size in Prestonville
3-person families (6 | 13.0%) account for the highest median family income in Prestonville with $46,875 per family, while 3-person families (6 | 13.0%) have the highest median income of $15,625 per family member.
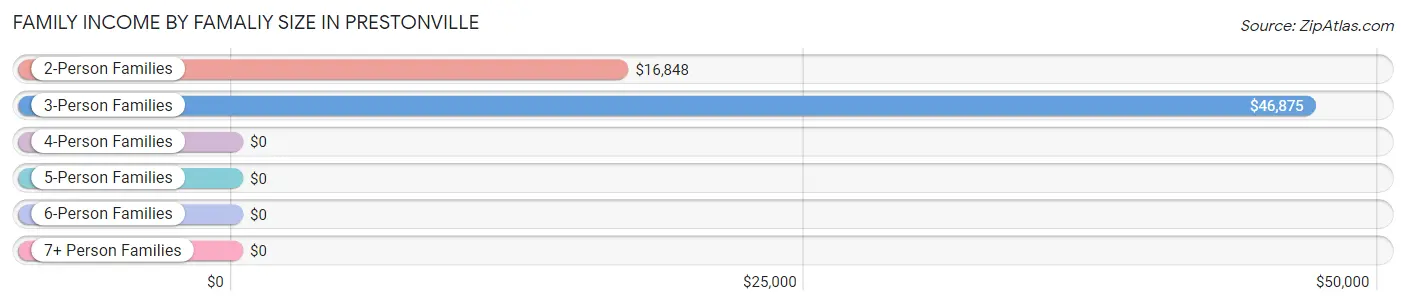
| Income Bracket | # Families | Median Income |
| 2-Person Families | 36 (78.3%) | $16,848 |
| 3-Person Families | 6 (13.0%) | $46,875 |
| 4-Person Families | 2 (4.3%) | $0 |
| 5-Person Families | 2 (4.3%) | $0 |
| 6-Person Families | 0 (0.0%) | $0 |
| 7+ Person Families | 0 (0.0%) | $0 |
| Total | 46 (100.0%) | $17,391 |
Family Income by Number of Earners in Prestonville
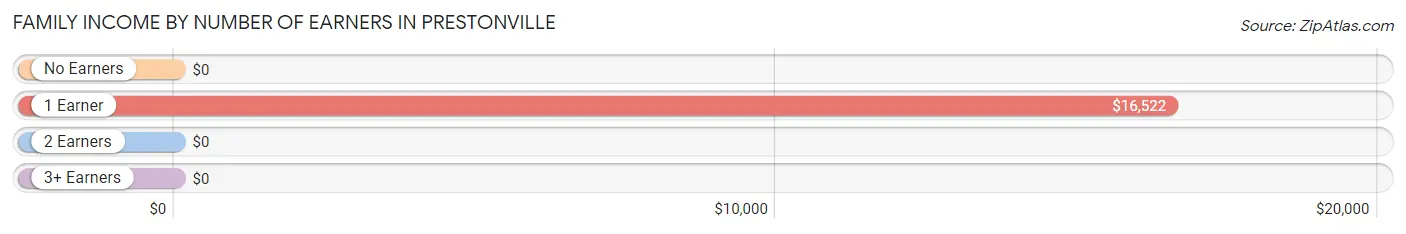
| Number of Earners | # Families | Median Income |
| No Earners | 3 (6.5%) | $0 |
| 1 Earner | 30 (65.2%) | $16,522 |
| 2 Earners | 13 (28.3%) | $0 |
| 3+ Earners | 0 (0.0%) | $0 |
| Total | 46 (100.0%) | $17,391 |
Household Income in Prestonville
Household Income Brackets in Prestonville
With 36 households falling in the category, the $15,000 to $24,999 income range is the most frequent in Prestonville, accounting for 57.1% of all households.
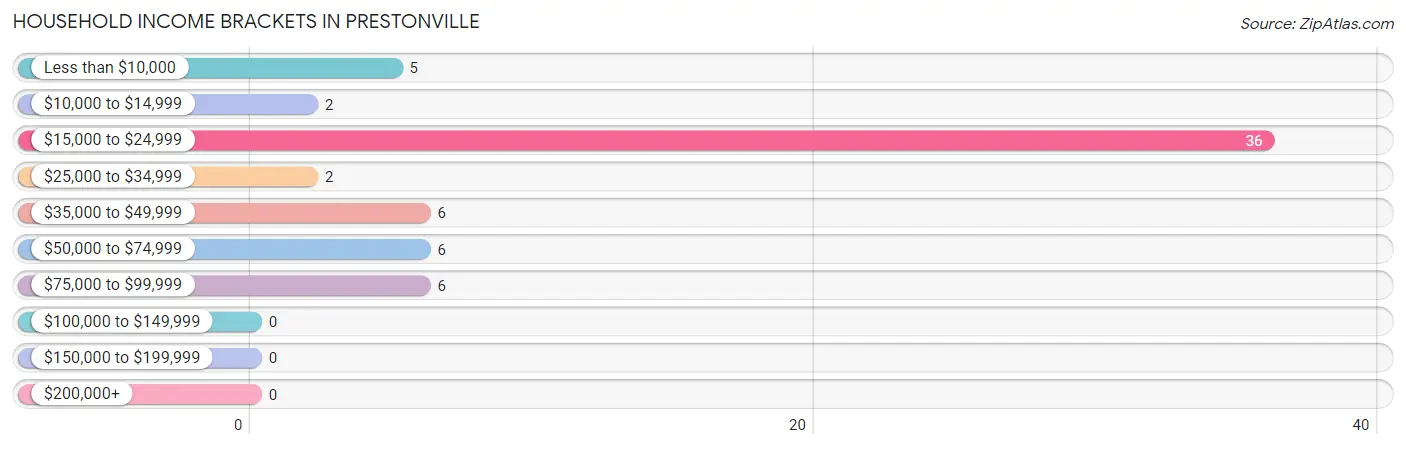
| Income Bracket | # Households | % Households |
| Less than $10,000 | 5 | 7.9% |
| $10,000 to $14,999 | 2 | 3.2% |
| $15,000 to $24,999 | 36 | 57.1% |
| $25,000 to $34,999 | 2 | 3.2% |
| $35,000 to $49,999 | 6 | 9.5% |
| $50,000 to $74,999 | 6 | 9.5% |
| $75,000 to $99,999 | 6 | 9.5% |
| $100,000 to $149,999 | 0 | 0.0% |
| $150,000 to $199,999 | 0 | 0.0% |
| $200,000+ | 0 | 0.0% |
Household Income by Householder Age in Prestonville
The median household income in Prestonville is $20,313, with the highest median household income of $24,375 found in the 45 to 64 years age bracket for the primary householder. A total of 28 households (44.4%) fall into this category.
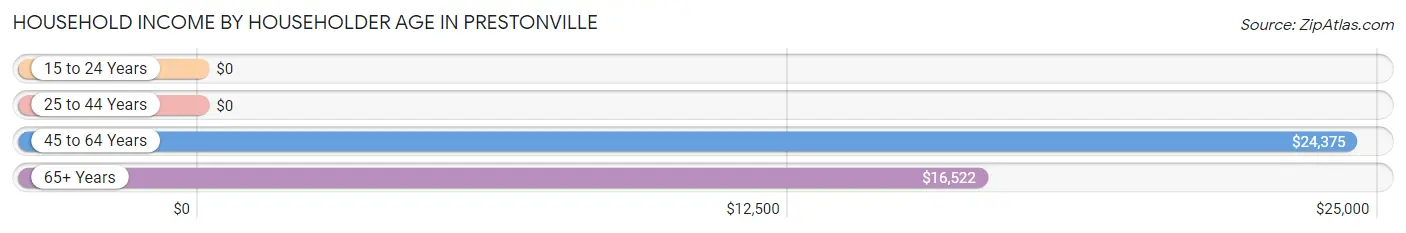
| Income Bracket | # Households | Median Income |
| 15 to 24 Years | 0 (0.0%) | $0 |
| 25 to 44 Years | 5 (7.9%) | $0 |
| 45 to 64 Years | 28 (44.4%) | $24,375 |
| 65+ Years | 30 (47.6%) | $16,522 |
| Total | 63 (100.0%) | $20,313 |
Poverty in Prestonville
Income Below Poverty by Sex and Age in Prestonville
With 50.0% poverty level for males and 18.6% for females among the residents of Prestonville, 18 to 24 year old males and 45 to 54 year old females are the most vulnerable to poverty, with 10 males (100.0%) and 5 females (41.7%) in their respective age groups living below the poverty level.
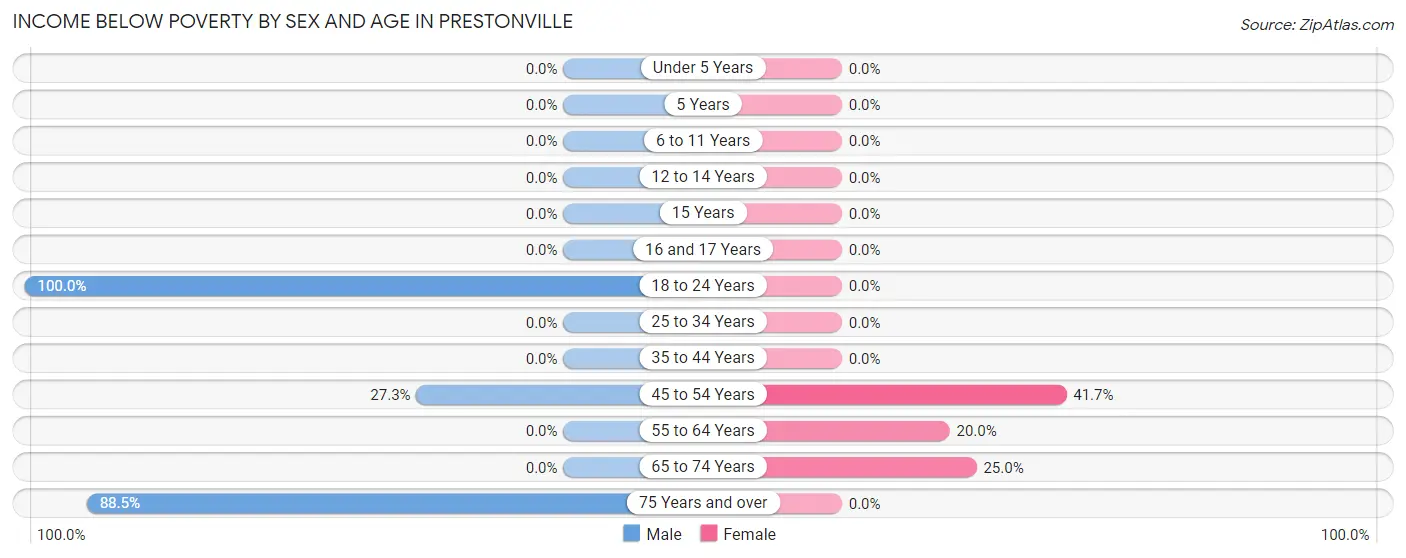
| Age Bracket | Male | Female |
| Under 5 Years | 0 (0.0%) | 0 (0.0%) |
| 5 Years | 0 (0.0%) | 0 (0.0%) |
| 6 to 11 Years | 0 (0.0%) | 0 (0.0%) |
| 12 to 14 Years | 0 (0.0%) | 0 (0.0%) |
| 15 Years | 0 (0.0%) | 0 (0.0%) |
| 16 and 17 Years | 0 (0.0%) | 0 (0.0%) |
| 18 to 24 Years | 10 (100.0%) | 0 (0.0%) |
| 25 to 34 Years | 0 (0.0%) | 0 (0.0%) |
| 35 to 44 Years | 0 (0.0%) | 0 (0.0%) |
| 45 to 54 Years | 3 (27.3%) | 5 (41.7%) |
| 55 to 64 Years | 0 (0.0%) | 2 (20.0%) |
| 65 to 74 Years | 0 (0.0%) | 1 (25.0%) |
| 75 Years and over | 23 (88.5%) | 0 (0.0%) |
| Total | 36 (50.0%) | 8 (18.6%) |
Income Above Poverty by Sex and Age in Prestonville
According to the poverty statistics in Prestonville, males aged under 5 years and females aged 16 and 17 years are the age groups that are most secure financially, with 100.0% of males and 100.0% of females in these age groups living above the poverty line.
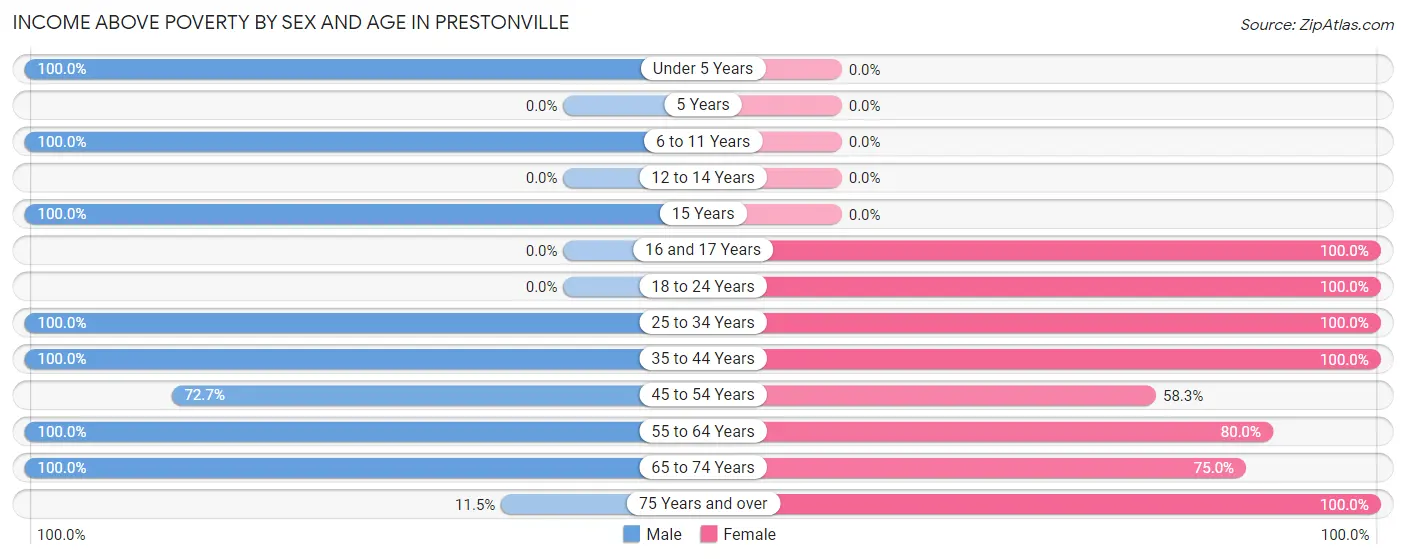
| Age Bracket | Male | Female |
| Under 5 Years | 2 (100.0%) | 0 (0.0%) |
| 5 Years | 0 (0.0%) | 0 (0.0%) |
| 6 to 11 Years | 5 (100.0%) | 0 (0.0%) |
| 12 to 14 Years | 0 (0.0%) | 0 (0.0%) |
| 15 Years | 3 (100.0%) | 0 (0.0%) |
| 16 and 17 Years | 0 (0.0%) | 1 (100.0%) |
| 18 to 24 Years | 0 (0.0%) | 4 (100.0%) |
| 25 to 34 Years | 1 (100.0%) | 2 (100.0%) |
| 35 to 44 Years | 1 (100.0%) | 6 (100.0%) |
| 45 to 54 Years | 8 (72.7%) | 7 (58.3%) |
| 55 to 64 Years | 10 (100.0%) | 8 (80.0%) |
| 65 to 74 Years | 3 (100.0%) | 3 (75.0%) |
| 75 Years and over | 3 (11.5%) | 4 (100.0%) |
| Total | 36 (50.0%) | 35 (81.4%) |
Income Below Poverty Among Married-Couple Families in Prestonville
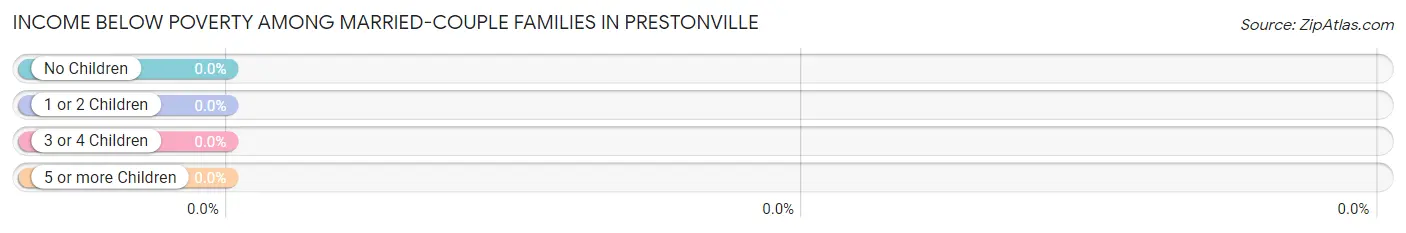
| Children | Above Poverty | Below Poverty |
| No Children | 13 (100.0%) | 0 (0.0%) |
| 1 or 2 Children | 5 (100.0%) | 0 (0.0%) |
| 3 or 4 Children | 0 (0.0%) | 0 (0.0%) |
| 5 or more Children | 0 (0.0%) | 0 (0.0%) |
| Total | 18 (100.0%) | 0 (0.0%) |
Income Below Poverty Among Single-Parent Households in Prestonville
According to the poverty data in Prestonville, 100.0% or 23 single-father households and 20.0% or 1 single-mother households are living below the poverty line. Among single-father households, those with no children have the highest poverty rate, with 23 households (100.0%) experiencing poverty. Likewise, among single-mother households, those with no children have the highest poverty rate, with 1 households (100.0%) falling below the poverty line.
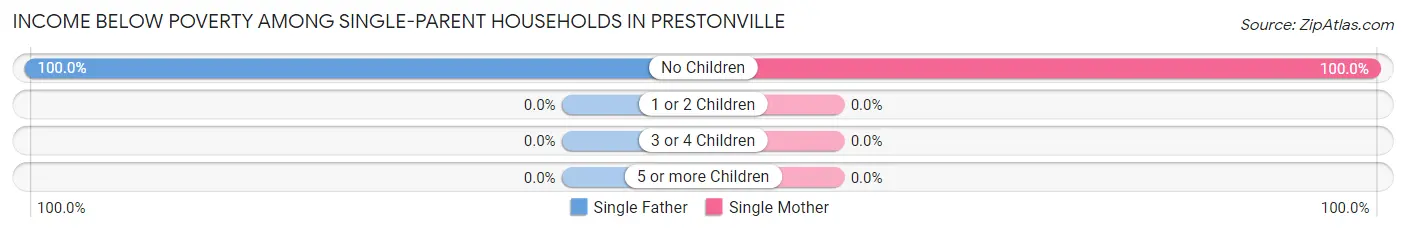
| Children | Single Father | Single Mother |
| No Children | 23 (100.0%) | 1 (100.0%) |
| 1 or 2 Children | 0 (0.0%) | 0 (0.0%) |
| 3 or 4 Children | 0 (0.0%) | 0 (0.0%) |
| 5 or more Children | 0 (0.0%) | 0 (0.0%) |
| Total | 23 (100.0%) | 1 (20.0%) |
Income Below Poverty Among Married-Couple vs Single-Parent Households in Prestonville
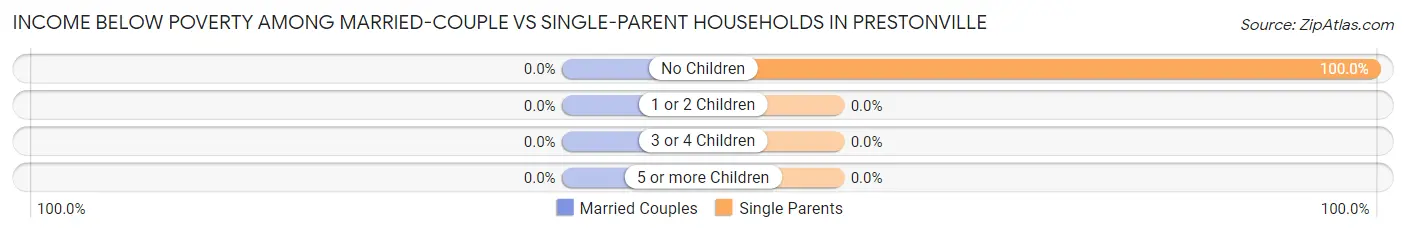
| Children | Married-Couple Families | Single-Parent Households |
| No Children | 0 (0.0%) | 24 (100.0%) |
| 1 or 2 Children | 0 (0.0%) | 0 (0.0%) |
| 3 or 4 Children | 0 (0.0%) | 0 (0.0%) |
| 5 or more Children | 0 (0.0%) | 0 (0.0%) |
| Total | 0 (0.0%) | 24 (85.7%) |
Race in Prestonville
The most populous races in Prestonville are White / Caucasian (91 | 79.1%), Black / African American (18 | 15.7%), and Some other Race (4 | 3.5%).
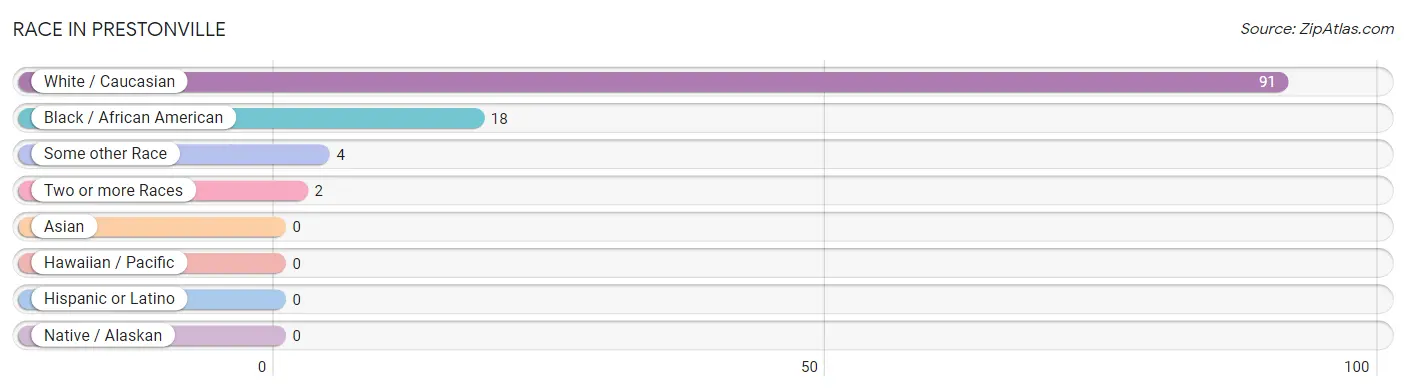
| Race | # Population | % Population |
| Asian | 0 | 0.0% |
| Black / African American | 18 | 15.7% |
| Hawaiian / Pacific | 0 | 0.0% |
| Hispanic or Latino | 0 | 0.0% |
| Native / Alaskan | 0 | 0.0% |
| White / Caucasian | 91 | 79.1% |
| Two or more Races | 2 | 1.7% |
| Some other Race | 4 | 3.5% |
| Total | 115 | 100.0% |
Ancestry in Prestonville
The most populous ancestries reported in Prestonville are German (38 | 33.0%), Irish (37 | 32.2%), English (16 | 13.9%), African (11 | 9.6%), and Subsaharan African (11 | 9.6%), together accounting for 98.3% of all Prestonville residents.
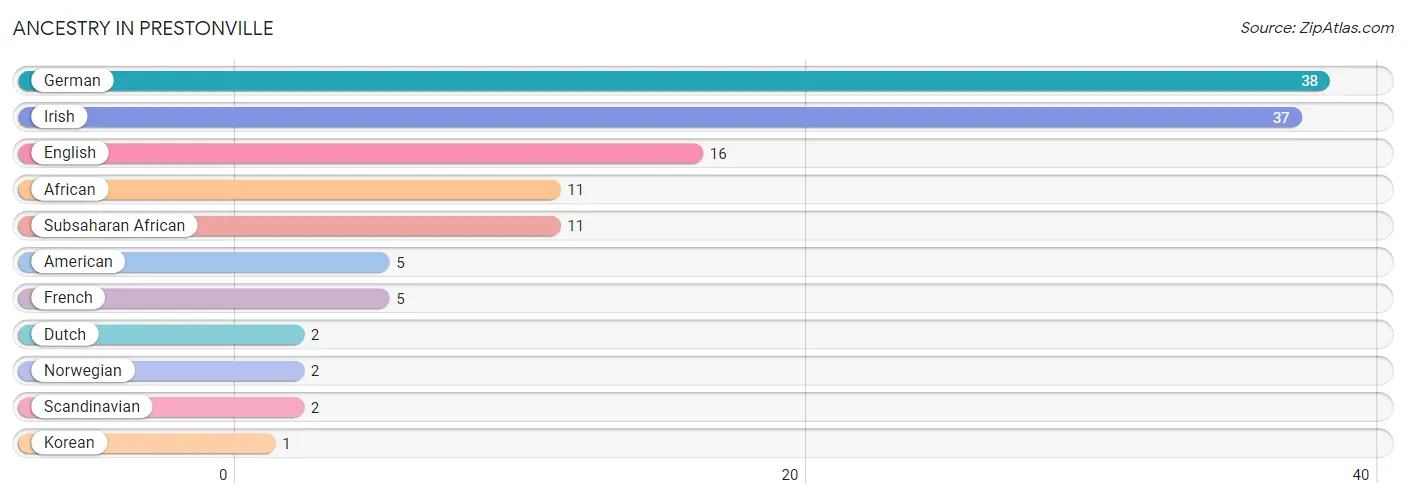
| Ancestry | # Population | % Population |
| African | 11 | 9.6% |
| American | 5 | 4.3% |
| Dutch | 2 | 1.7% |
| English | 16 | 13.9% |
| French | 5 | 4.3% |
| German | 38 | 33.0% |
| Irish | 37 | 32.2% |
| Korean | 1 | 0.9% |
| Norwegian | 2 | 1.7% |
| Scandinavian | 2 | 1.7% |
| Subsaharan African | 11 | 9.6% | View All 11 Rows |
Immigrants in Prestonville

| Immigration Origin | # Population | % Population | View All 0 Rows |
Sex and Age in Prestonville
Sex and Age in Prestonville
The most populous age groups in Prestonville are 80 to 84 Years (25 | 34.7%) for men and 45 to 49 Years (7 | 16.3%) for women.
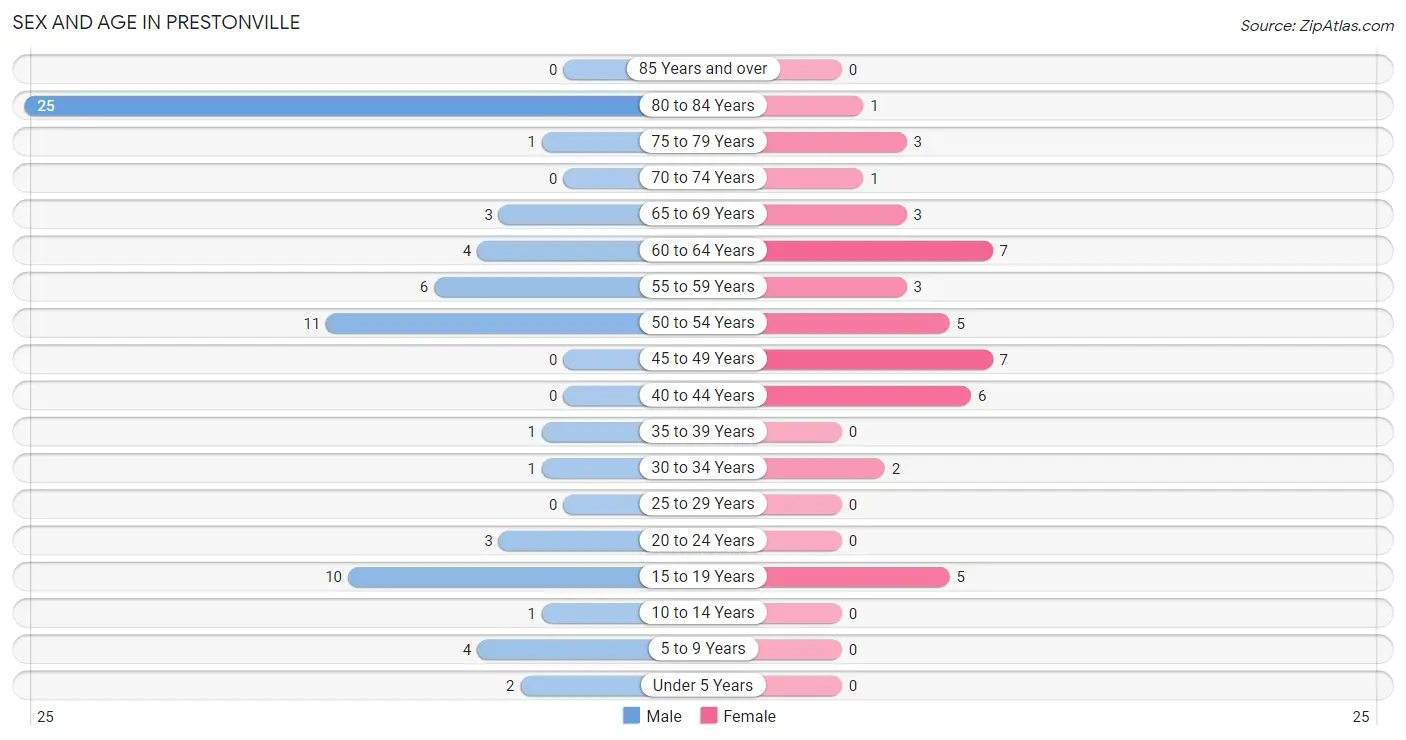
| Age Bracket | Male | Female |
| Under 5 Years | 2 (2.8%) | 0 (0.0%) |
| 5 to 9 Years | 4 (5.6%) | 0 (0.0%) |
| 10 to 14 Years | 1 (1.4%) | 0 (0.0%) |
| 15 to 19 Years | 10 (13.9%) | 5 (11.6%) |
| 20 to 24 Years | 3 (4.2%) | 0 (0.0%) |
| 25 to 29 Years | 0 (0.0%) | 0 (0.0%) |
| 30 to 34 Years | 1 (1.4%) | 2 (4.6%) |
| 35 to 39 Years | 1 (1.4%) | 0 (0.0%) |
| 40 to 44 Years | 0 (0.0%) | 6 (14.0%) |
| 45 to 49 Years | 0 (0.0%) | 7 (16.3%) |
| 50 to 54 Years | 11 (15.3%) | 5 (11.6%) |
| 55 to 59 Years | 6 (8.3%) | 3 (7.0%) |
| 60 to 64 Years | 4 (5.6%) | 7 (16.3%) |
| 65 to 69 Years | 3 (4.2%) | 3 (7.0%) |
| 70 to 74 Years | 0 (0.0%) | 1 (2.3%) |
| 75 to 79 Years | 1 (1.4%) | 3 (7.0%) |
| 80 to 84 Years | 25 (34.7%) | 1 (2.3%) |
| 85 Years and over | 0 (0.0%) | 0 (0.0%) |
| Total | 72 (100.0%) | 43 (100.0%) |
Families and Households in Prestonville
Median Family Size in Prestonville
The median family size in Prestonville is 2.00 persons per family, with married-couple families (18 | 39.1%) accounting for the largest median family size of 2.61 persons per family. On the other hand, single male/father families (23 | 50.0%) represent the smallest median family size with 1.39 persons per family.
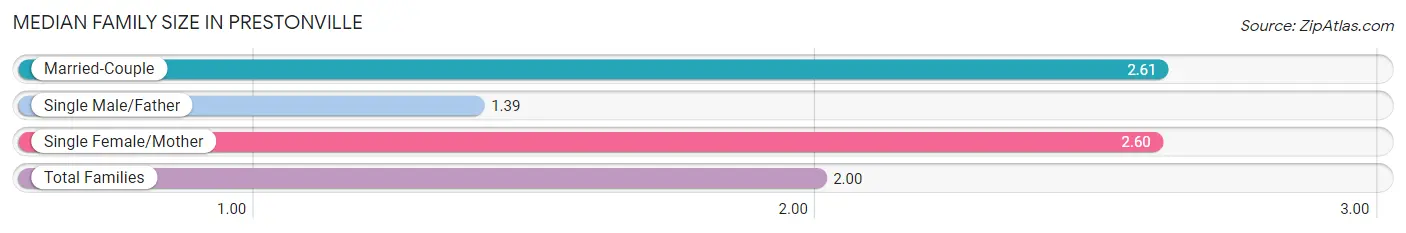
| Family Type | # Families | Family Size |
| Married-Couple | 18 (39.1%) | 2.61 |
| Single Male/Father | 23 (50.0%) | 1.39 |
| Single Female/Mother | 5 (10.9%) | 2.60 |
| Total Families | 46 (100.0%) | 2.00 |
Median Household Size in Prestonville
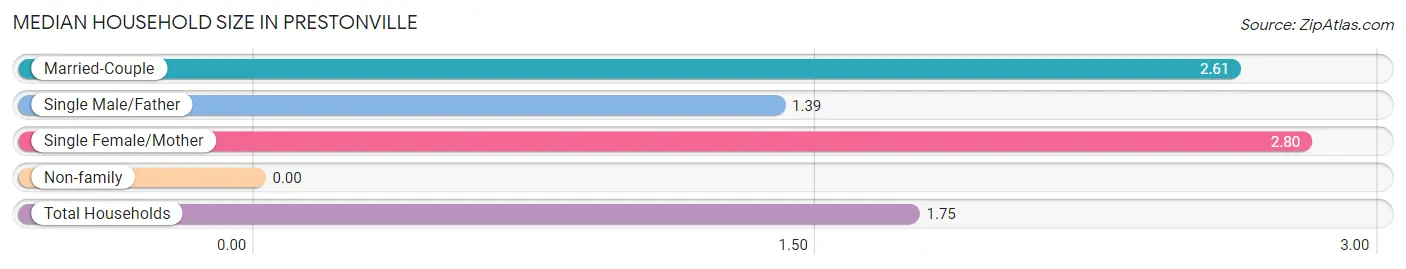
| Household Type | # Households | Household Size |
| Married-Couple | 18 (28.6%) | 2.61 |
| Single Male/Father | 23 (36.5%) | 1.39 |
| Single Female/Mother | 5 (7.9%) | 2.80 |
| Non-family | 17 (27.0%) | - |
| Total Households | 63 (100.0%) | 1.75 |
Household Size by Marriage Status in Prestonville
Out of a total of 63 households in Prestonville, 46 (73.0%) are family households, while 17 (27.0%) are nonfamily households. The most numerous type of family households are 2-person households, comprising 35, and the most common type of nonfamily households are 1-person households, comprising 17.
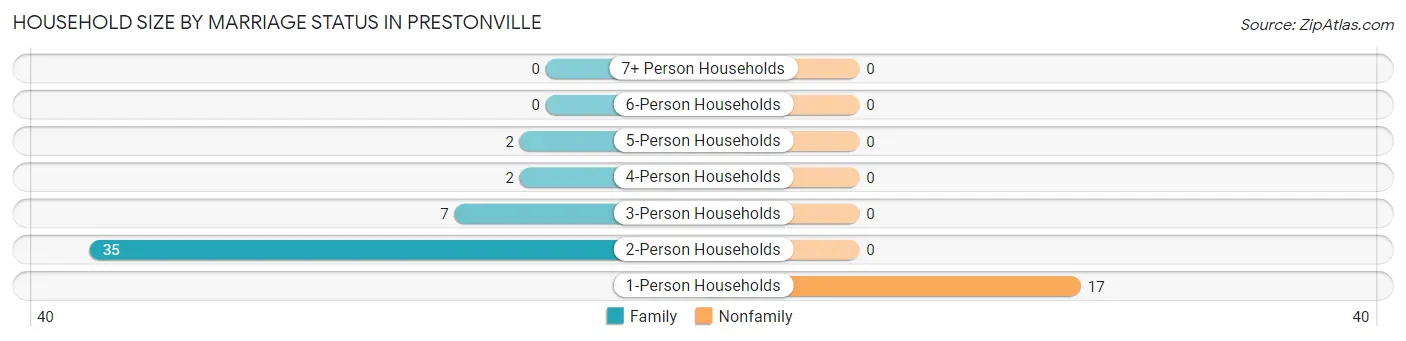
| Household Size | Family Households | Nonfamily Households |
| 1-Person Households | - | 17 (27.0%) |
| 2-Person Households | 35 (55.6%) | 0 (0.0%) |
| 3-Person Households | 7 (11.1%) | 0 (0.0%) |
| 4-Person Households | 2 (3.2%) | 0 (0.0%) |
| 5-Person Households | 2 (3.2%) | 0 (0.0%) |
| 6-Person Households | 0 (0.0%) | 0 (0.0%) |
| 7+ Person Households | 0 (0.0%) | 0 (0.0%) |
| Total | 46 (73.0%) | 17 (27.0%) |
Female Fertility in Prestonville
Fertility by Age in Prestonville
| Age Bracket | Women with Births | Births / 1,000 Women |
| 15 to 19 years | 0 (0.0%) | 0.0 |
| 20 to 34 years | 0 (0.0%) | 0.0 |
| 35 to 50 years | 0 (0.0%) | 0.0 |
| Total | 0 (0.0%) | 0.0 |
Fertility by Age by Marriage Status in Prestonville
| Age Bracket | Married | Unmarried |
| 15 to 19 years | 0 (0.0%) | 0 (0.0%) |
| 20 to 34 years | 0 (0.0%) | 0 (0.0%) |
| 35 to 50 years | 0 (0.0%) | 0 (0.0%) |
| Total | 0 (0.0%) | 0 (0.0%) |
Fertility by Education in Prestonville
| Educational Attainment | Women with Births | Births / 1,000 Women |
| Less than High School | 0 (0.0%) | 0.0 |
| High School Diploma | 0 (0.0%) | 0.0 |
| College or Associate's Degree | 0 (0.0%) | 0.0 |
| Bachelor's Degree | 0 (0.0%) | 0.0 |
| Graduate Degree | 0 (0.0%) | 0.0 |
| Total | 0 (0.0%) | 0.0 |
Fertility by Education by Marriage Status in Prestonville
| Educational Attainment | Married | Unmarried |
| Less than High School | 0 (0.0%) | 0 (0.0%) |
| High School Diploma | 0 (0.0%) | 0 (0.0%) |
| College or Associate's Degree | 0 (0.0%) | 0 (0.0%) |
| Bachelor's Degree | 0 (0.0%) | 0 (0.0%) |
| Graduate Degree | 0 (0.0%) | 0 (0.0%) |
| Total | 0 (0.0%) | 0 (0.0%) |
Employment Characteristics in Prestonville
Employment by Class of Employer in Prestonville
Among the 37 employed individuals in Prestonville, private company employees (36 | 97.3%), and not-for-profit organizations (1 | 2.7%) make up the most common classes of employment.
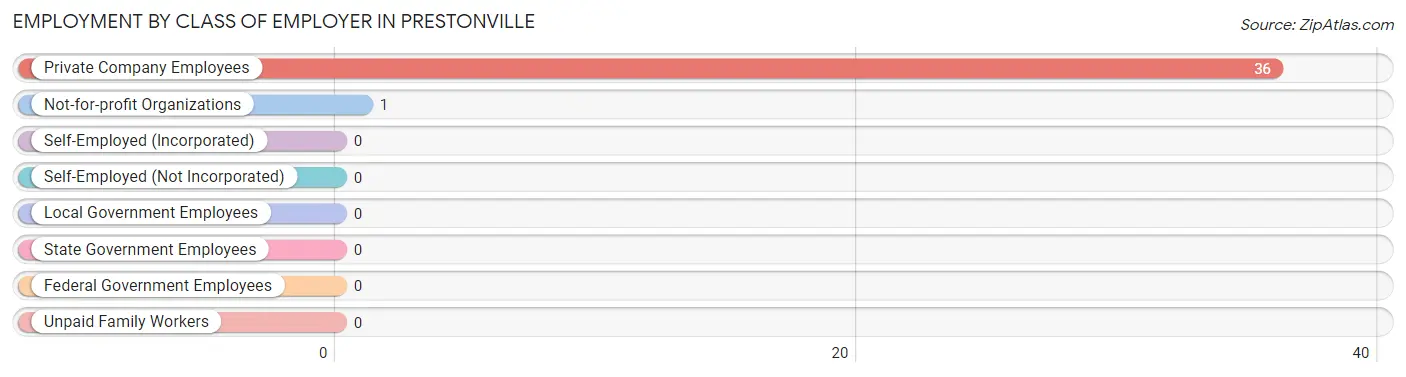
| Employer Class | # Employees | % Employees |
| Private Company Employees | 36 | 97.3% |
| Self-Employed (Incorporated) | 0 | 0.0% |
| Self-Employed (Not Incorporated) | 0 | 0.0% |
| Not-for-profit Organizations | 1 | 2.7% |
| Local Government Employees | 0 | 0.0% |
| State Government Employees | 0 | 0.0% |
| Federal Government Employees | 0 | 0.0% |
| Unpaid Family Workers | 0 | 0.0% |
| Total | 37 | 100.0% |
Employment Status by Age in Prestonville
According to the labor force statistics for Prestonville, out of the total population over 16 years of age (105), 52.4% or 55 individuals are in the labor force, with 21.8% or 12 of them unemployed. The age group with the highest labor force participation rate is 20 to 24 years, with 100.0% or 3 individuals in the labor force. Within the labor force, the 16 to 19 years age range has the highest percentage of unemployed individuals, with 40.0% or 4 of them being unemployed.
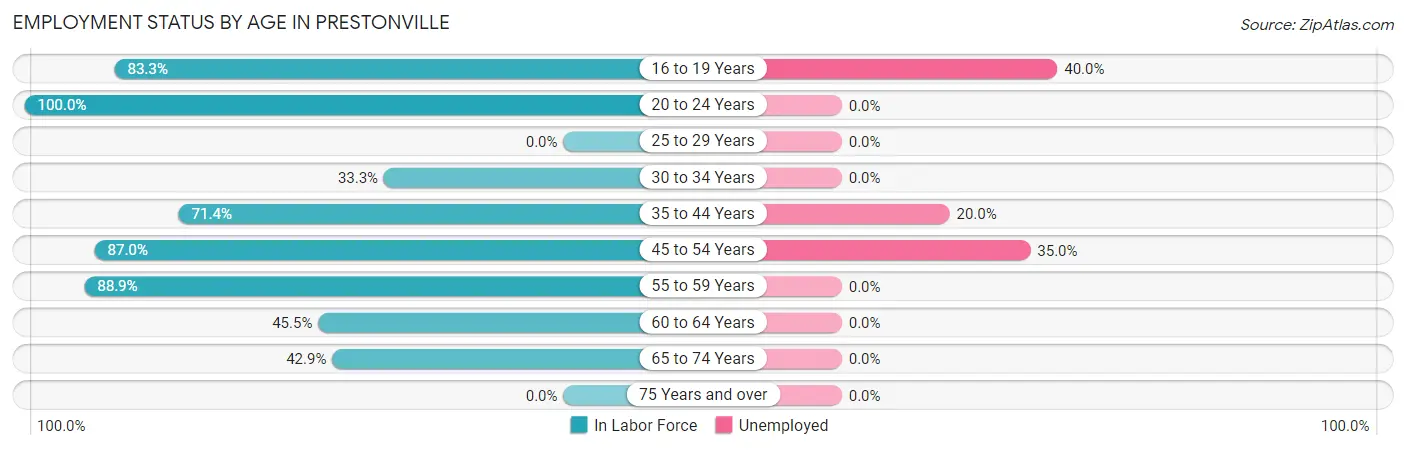
| Age Bracket | In Labor Force | Unemployed |
| 16 to 19 Years | 10 (83.3%) | 4 (40.0%) |
| 20 to 24 Years | 3 (100.0%) | 0 (0.0%) |
| 25 to 29 Years | 0 (0.0%) | 0 (0.0%) |
| 30 to 34 Years | 1 (33.3%) | 0 (0.0%) |
| 35 to 44 Years | 5 (71.4%) | 1 (20.0%) |
| 45 to 54 Years | 20 (87.0%) | 7 (35.0%) |
| 55 to 59 Years | 8 (88.9%) | 0 (0.0%) |
| 60 to 64 Years | 5 (45.5%) | 0 (0.0%) |
| 65 to 74 Years | 3 (42.9%) | 0 (0.0%) |
| 75 Years and over | 0 (0.0%) | 0 (0.0%) |
| Total | 55 (52.4%) | 12 (21.8%) |
Employment Status by Educational Attainment in Prestonville
According to labor force statistics for Prestonville, 73.6% of individuals (39) out of the total population between 25 and 64 years of age (53) are in the labor force, with 20.5% or 8 of them being unemployed. The group with the highest labor force participation rate are those with the educational attainment of high school diploma, with 81.0% or 17 individuals in the labor force. Within the labor force, individuals with high school diploma education have the highest percentage of unemployment, with 47.1% or 8 of them being unemployed.
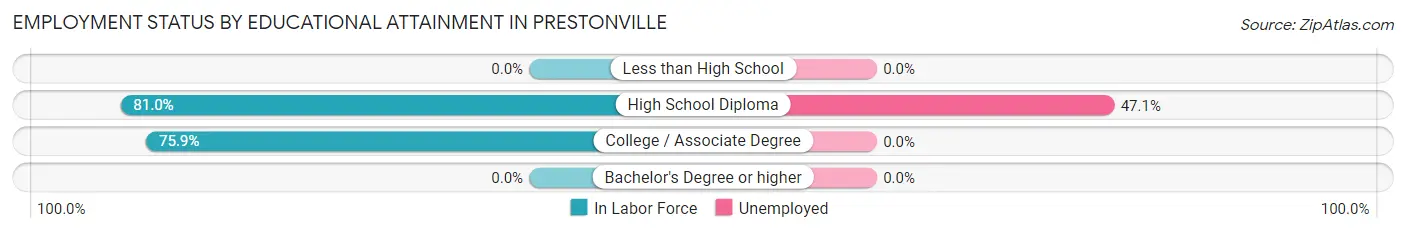
| Educational Attainment | In Labor Force | Unemployed |
| Less than High School | 0 (0.0%) | 0 (0.0%) |
| High School Diploma | 17 (81.0%) | 10 (47.1%) |
| College / Associate Degree | 22 (75.9%) | 0 (0.0%) |
| Bachelor's Degree or higher | 0 (0.0%) | 0 (0.0%) |
| Total | 39 (73.6%) | 11 (20.5%) |
Employment Occupations by Sex in Prestonville
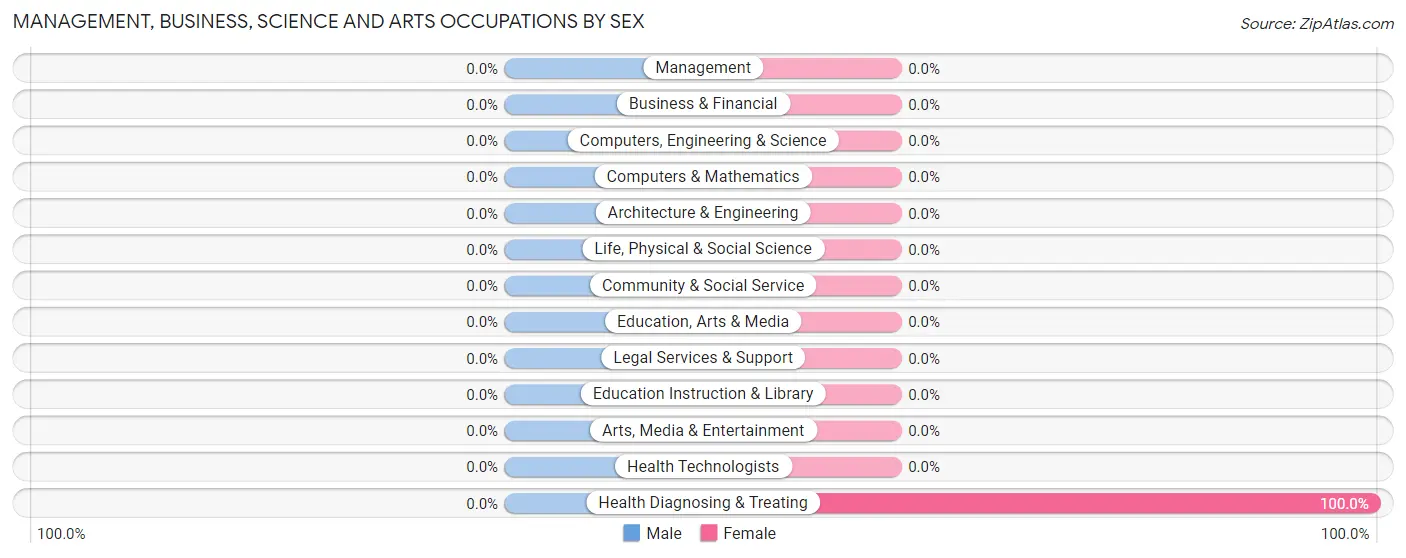
Management, Business, Science and Arts Occupations
The most common Management, Business, Science and Arts occupations in Prestonville are , and Health Diagnosing & Treating (2 | 4.6%).
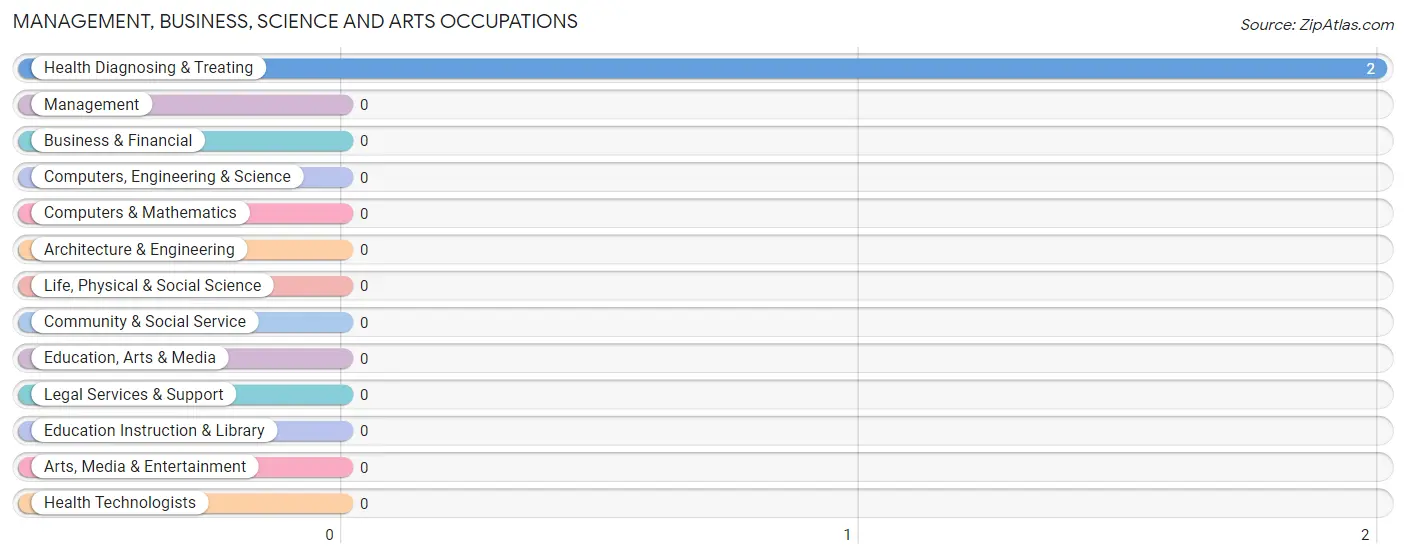
Management, Business, Science and Arts Occupations by Sex
| Occupation | Male | Female |
| Management | 0 (0.0%) | 0 (0.0%) |
| Business & Financial | 0 (0.0%) | 0 (0.0%) |
| Computers, Engineering & Science | 0 (0.0%) | 0 (0.0%) |
| Computers & Mathematics | 0 (0.0%) | 0 (0.0%) |
| Architecture & Engineering | 0 (0.0%) | 0 (0.0%) |
| Life, Physical & Social Science | 0 (0.0%) | 0 (0.0%) |
| Community & Social Service | 0 (0.0%) | 0 (0.0%) |
| Education, Arts & Media | 0 (0.0%) | 0 (0.0%) |
| Legal Services & Support | 0 (0.0%) | 0 (0.0%) |
| Education Instruction & Library | 0 (0.0%) | 0 (0.0%) |
| Arts, Media & Entertainment | 0 (0.0%) | 0 (0.0%) |
| Health Diagnosing & Treating | 0 (0.0%) | 2 (100.0%) |
| Health Technologists | 0 (0.0%) | 0 (0.0%) |
| Total (Category) | 0 (0.0%) | 2 (100.0%) |
| Total (Overall) | 28 (65.1%) | 15 (34.9%) |
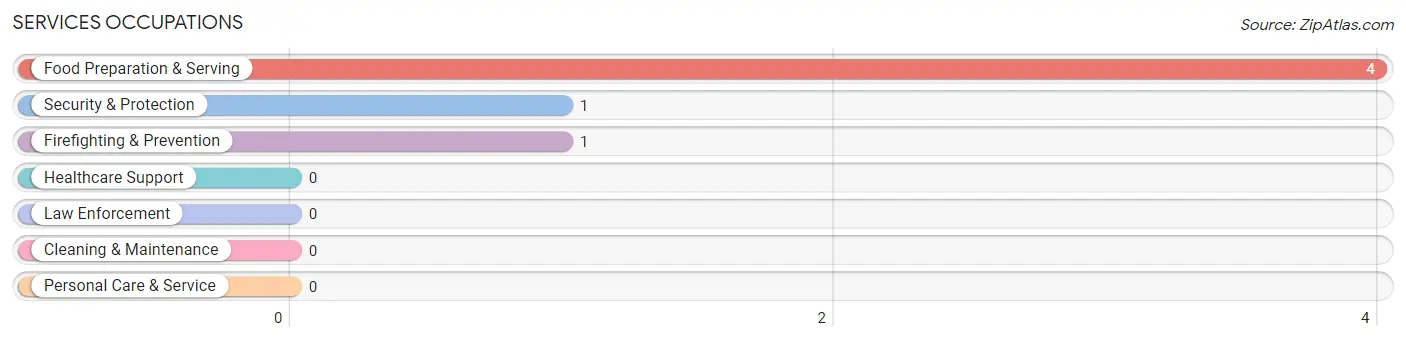
Services Occupations
The most common Services occupations in Prestonville are Food Preparation & Serving (4 | 9.3%), Security & Protection (1 | 2.3%), and Firefighting & Prevention (1 | 2.3%).
Services Occupations by Sex
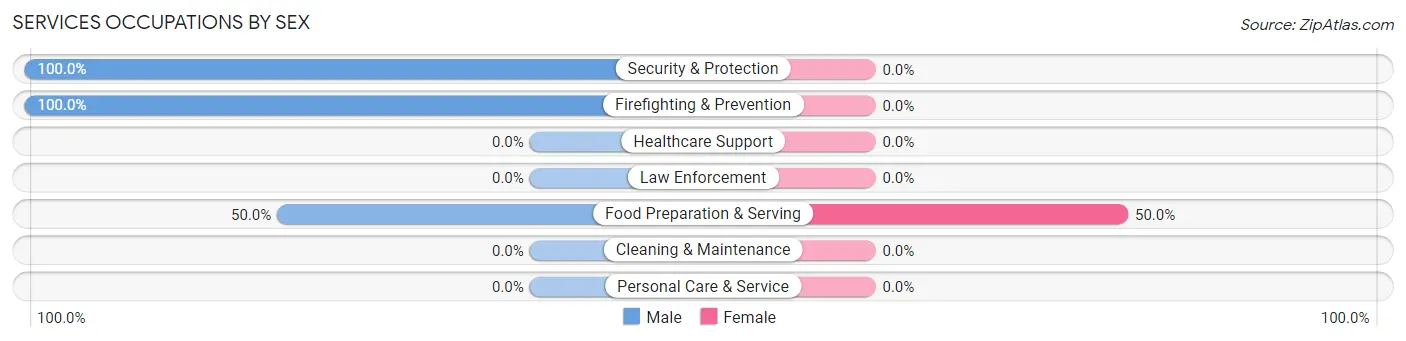
| Occupation | Male | Female |
| Healthcare Support | 0 (0.0%) | 0 (0.0%) |
| Security & Protection | 1 (100.0%) | 0 (0.0%) |
| Firefighting & Prevention | 1 (100.0%) | 0 (0.0%) |
| Law Enforcement | 0 (0.0%) | 0 (0.0%) |
| Food Preparation & Serving | 2 (50.0%) | 2 (50.0%) |
| Cleaning & Maintenance | 0 (0.0%) | 0 (0.0%) |
| Personal Care & Service | 0 (0.0%) | 0 (0.0%) |
| Total (Category) | 3 (60.0%) | 2 (40.0%) |
| Total (Overall) | 28 (65.1%) | 15 (34.9%) |
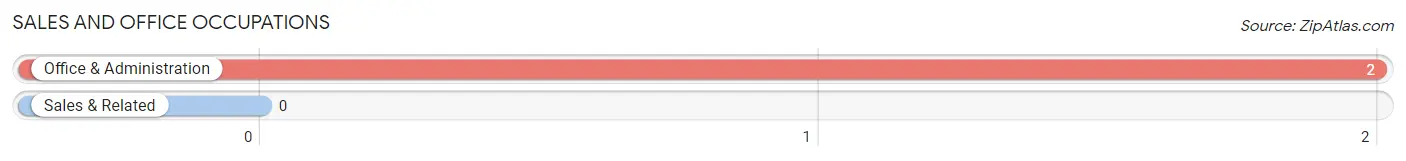
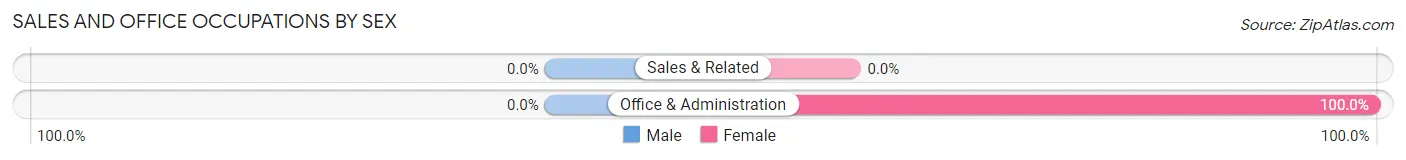
Sales and Office Occupations
The most common Sales and Office occupations in Prestonville are , and Office & Administration (2 | 4.6%).
Sales and Office Occupations by Sex
| Occupation | Male | Female |
| Sales & Related | 0 (0.0%) | 0 (0.0%) |
| Office & Administration | 0 (0.0%) | 2 (100.0%) |
| Total (Category) | 0 (0.0%) | 2 (100.0%) |
| Total (Overall) | 28 (65.1%) | 15 (34.9%) |
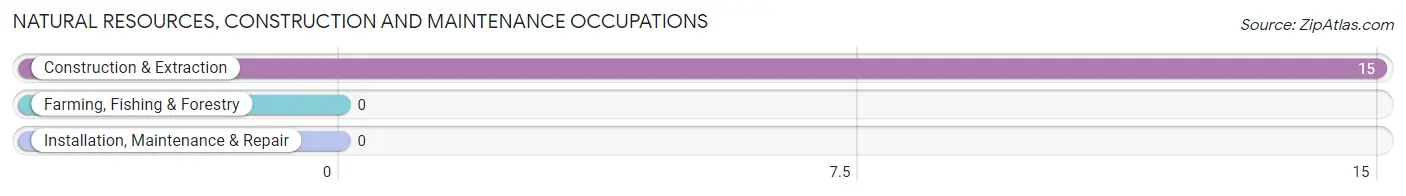
Natural Resources, Construction and Maintenance Occupations
The most common Natural Resources, Construction and Maintenance occupations in Prestonville are , and Construction & Extraction (15 | 34.9%).
Natural Resources, Construction and Maintenance Occupations by Sex
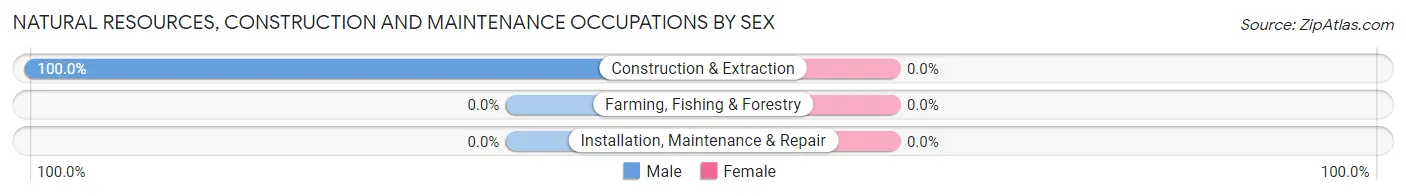
| Occupation | Male | Female |
| Farming, Fishing & Forestry | 0 (0.0%) | 0 (0.0%) |
| Construction & Extraction | 15 (100.0%) | 0 (0.0%) |
| Installation, Maintenance & Repair | 0 (0.0%) | 0 (0.0%) |
| Total (Category) | 15 (100.0%) | 0 (0.0%) |
| Total (Overall) | 28 (65.1%) | 15 (34.9%) |
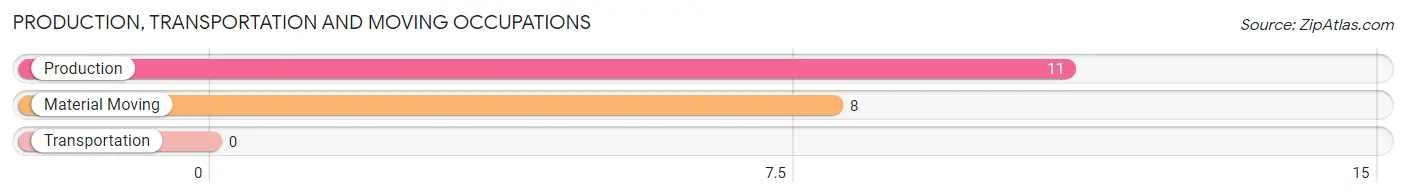
Production, Transportation and Moving Occupations
The most common Production, Transportation and Moving occupations in Prestonville are Production (11 | 25.6%), and Material Moving (8 | 18.6%).
Production, Transportation and Moving Occupations by Sex
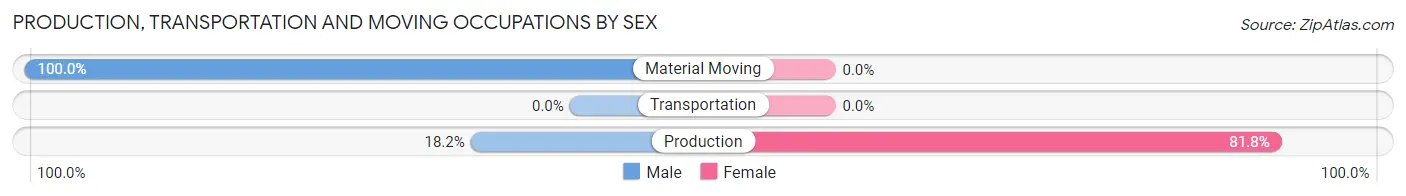
| Occupation | Male | Female |
| Production | 2 (18.2%) | 9 (81.8%) |
| Transportation | 0 (0.0%) | 0 (0.0%) |
| Material Moving | 8 (100.0%) | 0 (0.0%) |
| Total (Category) | 10 (52.6%) | 9 (47.4%) |
| Total (Overall) | 28 (65.1%) | 15 (34.9%) |
Employment Industries by Sex in Prestonville
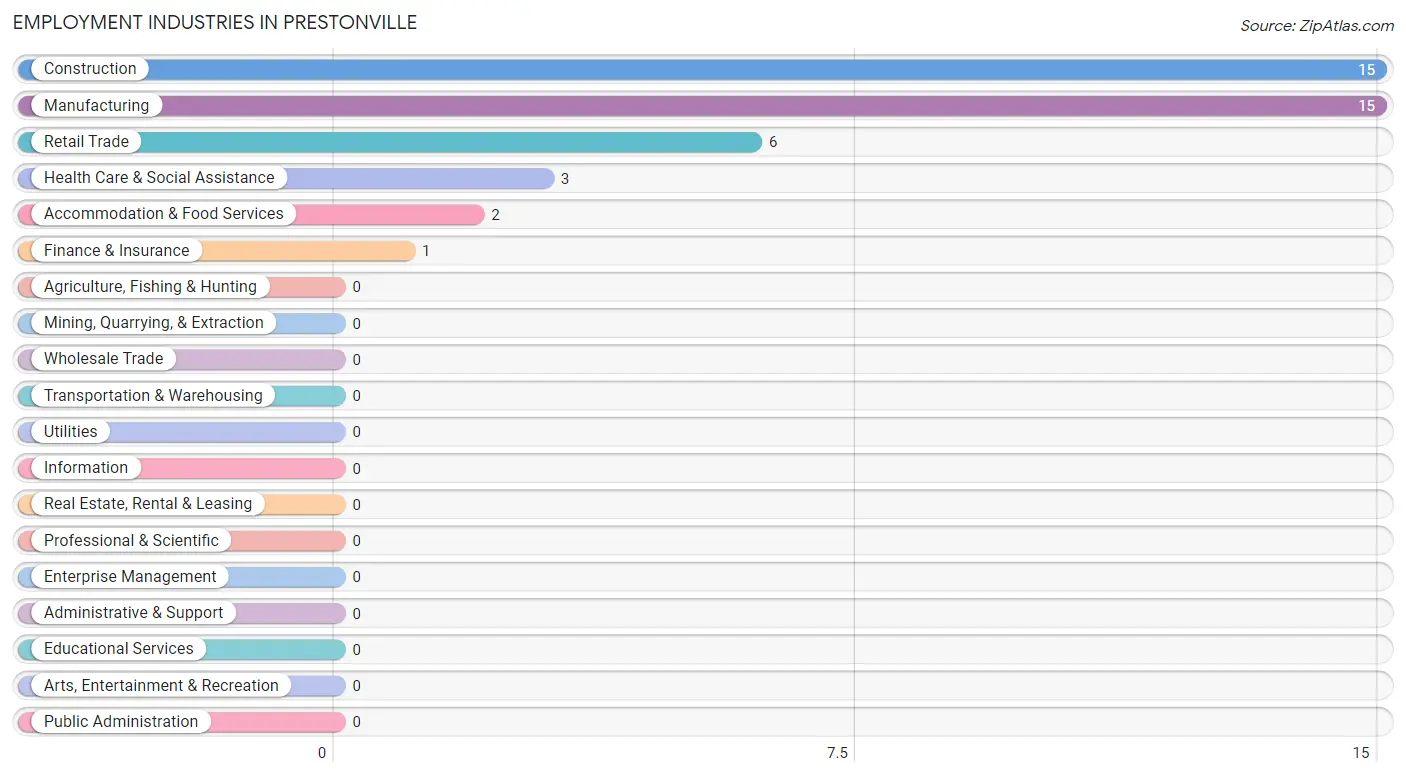
Employment Industries in Prestonville
The major employment industries in Prestonville include Construction (15 | 34.9%), Manufacturing (15 | 34.9%), Retail Trade (6 | 14.0%), Health Care & Social Assistance (3 | 7.0%), and Accommodation & Food Services (2 | 4.6%).
Employment Industries by Sex in Prestonville
The Prestonville industries that see more men than women are Construction (100.0%), Accommodation & Food Services (100.0%), and Manufacturing (66.7%), whereas the industries that tend to have a higher number of women are Retail Trade (100.0%), Finance & Insurance (100.0%), and Health Care & Social Assistance (66.7%).
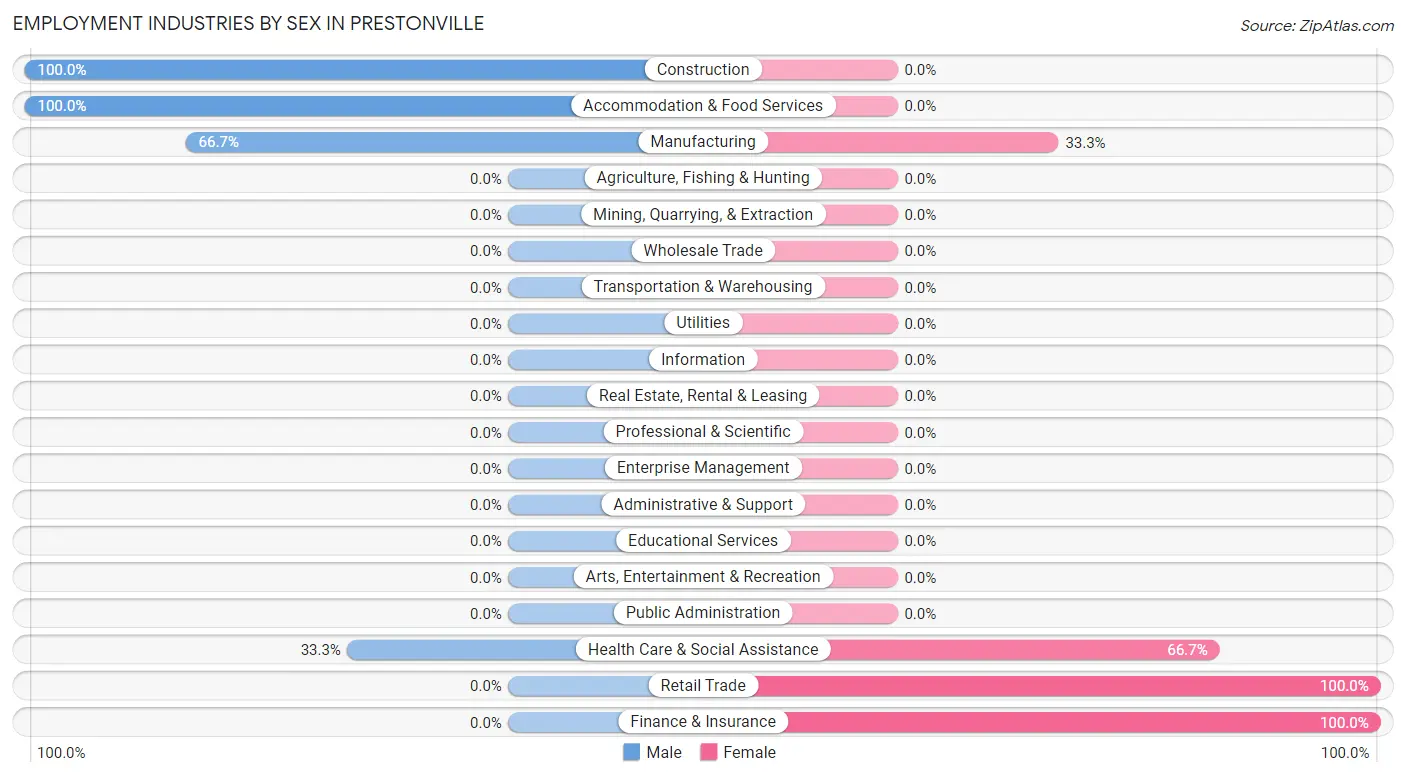
| Industry | Male | Female |
| Agriculture, Fishing & Hunting | 0 (0.0%) | 0 (0.0%) |
| Mining, Quarrying, & Extraction | 0 (0.0%) | 0 (0.0%) |
| Construction | 15 (100.0%) | 0 (0.0%) |
| Manufacturing | 10 (66.7%) | 5 (33.3%) |
| Wholesale Trade | 0 (0.0%) | 0 (0.0%) |
| Retail Trade | 0 (0.0%) | 6 (100.0%) |
| Transportation & Warehousing | 0 (0.0%) | 0 (0.0%) |
| Utilities | 0 (0.0%) | 0 (0.0%) |
| Information | 0 (0.0%) | 0 (0.0%) |
| Finance & Insurance | 0 (0.0%) | 1 (100.0%) |
| Real Estate, Rental & Leasing | 0 (0.0%) | 0 (0.0%) |
| Professional & Scientific | 0 (0.0%) | 0 (0.0%) |
| Enterprise Management | 0 (0.0%) | 0 (0.0%) |
| Administrative & Support | 0 (0.0%) | 0 (0.0%) |
| Educational Services | 0 (0.0%) | 0 (0.0%) |
| Health Care & Social Assistance | 1 (33.3%) | 2 (66.7%) |
| Arts, Entertainment & Recreation | 0 (0.0%) | 0 (0.0%) |
| Accommodation & Food Services | 2 (100.0%) | 0 (0.0%) |
| Public Administration | 0 (0.0%) | 0 (0.0%) |
| Total | 28 (65.1%) | 15 (34.9%) |
Education in Prestonville
School Enrollment in Prestonville
The most common levels of schooling among the 10 students in Prestonville are high school (5 | 50.0%), kindergarten (2 | 20.0%), and elementary school (2 | 20.0%).
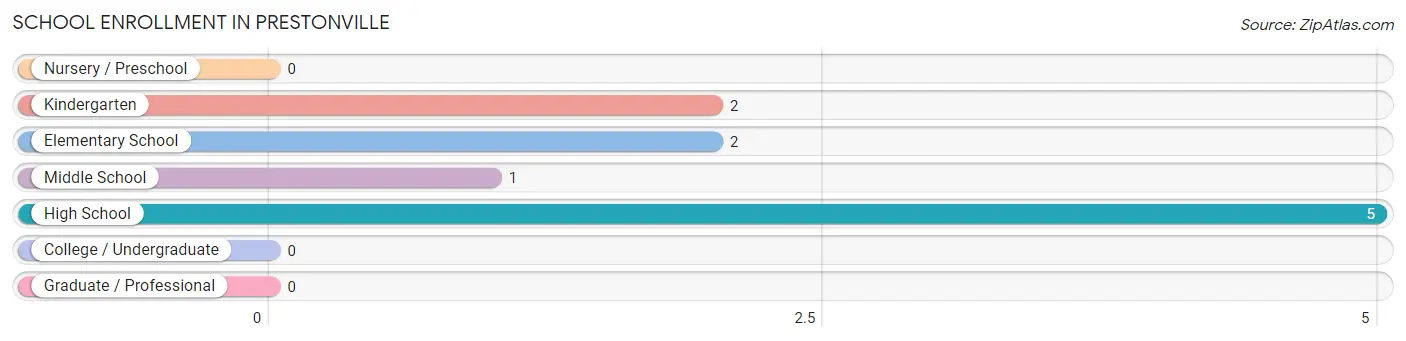
| School Level | # Students | % Students |
| Nursery / Preschool | 0 | 0.0% |
| Kindergarten | 2 | 20.0% |
| Elementary School | 2 | 20.0% |
| Middle School | 1 | 10.0% |
| High School | 5 | 50.0% |
| College / Undergraduate | 0 | 0.0% |
| Graduate / Professional | 0 | 0.0% |
| Total | 10 | 100.0% |
School Enrollment by Age by Funding Source in Prestonville
Out of a total of 10 students who are enrolled in schools in Prestonville, 3 (30.0%) attend a private institution, while the remaining 7 (70.0%) are enrolled in public schools. The age group of 18 to 19 year olds has the highest likelihood of being enrolled in private schools, with 1 (100.0% in the age bracket) enrolled. Conversely, the age group of 10 to 14 year olds has the lowest likelihood of being enrolled in a private school, with 1 (100.0% in the age bracket) attending a public institution.
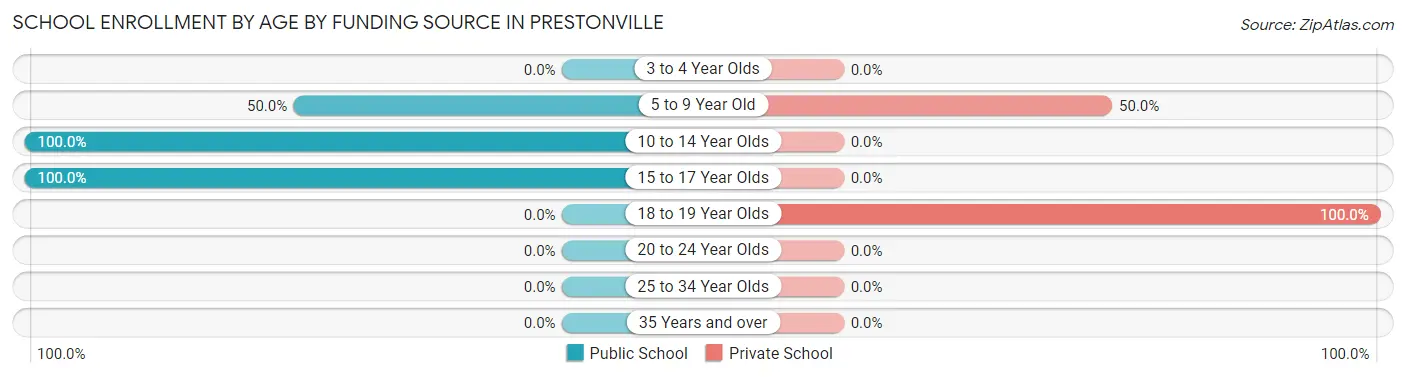
| Age Bracket | Public School | Private School |
| 3 to 4 Year Olds | 0 (0.0%) | 0 (0.0%) |
| 5 to 9 Year Old | 2 (50.0%) | 2 (50.0%) |
| 10 to 14 Year Olds | 1 (100.0%) | 0 (0.0%) |
| 15 to 17 Year Olds | 4 (100.0%) | 0 (0.0%) |
| 18 to 19 Year Olds | 0 (0.0%) | 1 (100.0%) |
| 20 to 24 Year Olds | 0 (0.0%) | 0 (0.0%) |
| 25 to 34 Year Olds | 0 (0.0%) | 0 (0.0%) |
| 35 Years and over | 0 (0.0%) | 0 (0.0%) |
| Total | 7 (70.0%) | 3 (30.0%) |
Educational Attainment by Field of Study in Prestonville
| Field of Study | # Graduates | % Graduates |
| Computers & Mathematics | 0 | 0.0% |
| Bio, Nature & Agricultural | 0 | 0.0% |
| Physical & Health Sciences | 0 | 0.0% |
| Psychology | 0 | 0.0% |
| Social Sciences | 0 | 0.0% |
| Engineering | 0 | 0.0% |
| Multidisciplinary Studies | 0 | 0.0% |
| Science & Technology | 0 | 0.0% |
| Business | 0 | 0.0% |
| Education | 0 | 0.0% |
| Literature & Languages | 0 | 0.0% |
| Liberal Arts & History | 0 | 0.0% |
| Visual & Performing Arts | 0 | 0.0% |
| Communications | 0 | 0.0% |
| Arts & Humanities | 0 | 0.0% |
| Total | 0 | 0.0% |
Transportation & Commute in Prestonville
Vehicle Availability by Sex in Prestonville
The most prevalent vehicle ownership categories in Prestonville are males with 1 vehicle (10, accounting for 47.6%) and females with 1 vehicle (5, making up 71.4%).
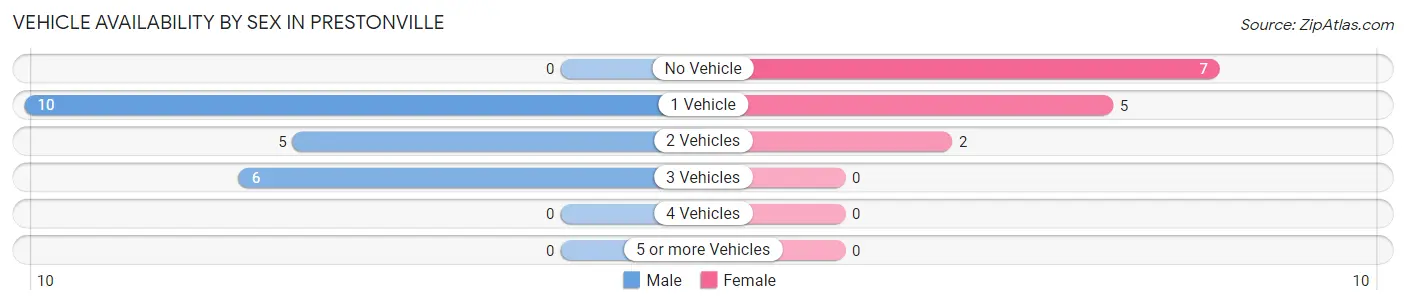
| Vehicles Available | Male | Female |
| No Vehicle | 0 (0.0%) | 7 (50.0%) |
| 1 Vehicle | 10 (47.6%) | 5 (35.7%) |
| 2 Vehicles | 5 (23.8%) | 2 (14.3%) |
| 3 Vehicles | 6 (28.6%) | 0 (0.0%) |
| 4 Vehicles | 0 (0.0%) | 0 (0.0%) |
| 5 or more Vehicles | 0 (0.0%) | 0 (0.0%) |
| Total | 21 (100.0%) | 14 (100.0%) |
Commute Time in Prestonville
The most frequently occuring commute durations in Prestonville are 15 to 19 minutes (11 commuters, 32.4%), 10 to 14 minutes (6 commuters, 17.6%), and 20 to 24 minutes (6 commuters, 17.6%).
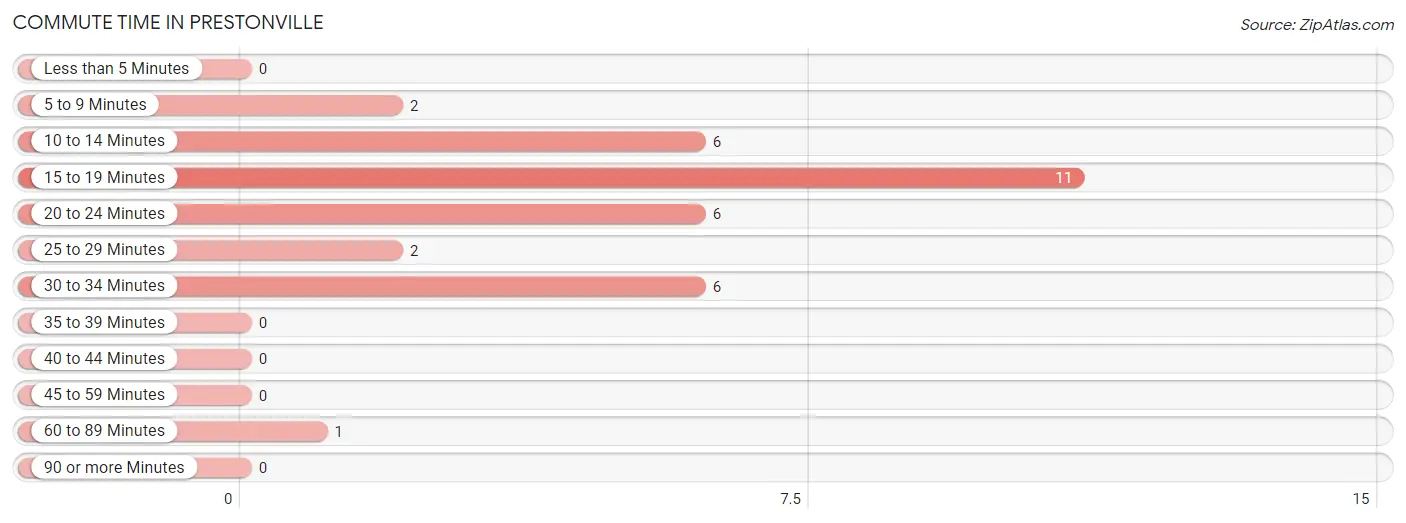
| Commute Time | # Commuters | % Commuters |
| Less than 5 Minutes | 0 | 0.0% |
| 5 to 9 Minutes | 2 | 5.9% |
| 10 to 14 Minutes | 6 | 17.6% |
| 15 to 19 Minutes | 11 | 32.4% |
| 20 to 24 Minutes | 6 | 17.6% |
| 25 to 29 Minutes | 2 | 5.9% |
| 30 to 34 Minutes | 6 | 17.6% |
| 35 to 39 Minutes | 0 | 0.0% |
| 40 to 44 Minutes | 0 | 0.0% |
| 45 to 59 Minutes | 0 | 0.0% |
| 60 to 89 Minutes | 1 | 2.9% |
| 90 or more Minutes | 0 | 0.0% |
Commute Time by Sex in Prestonville
The most common commute times in Prestonville are 15 to 19 minutes (11 commuters, 52.4%) for males and 30 to 34 minutes (6 commuters, 46.2%) for females.
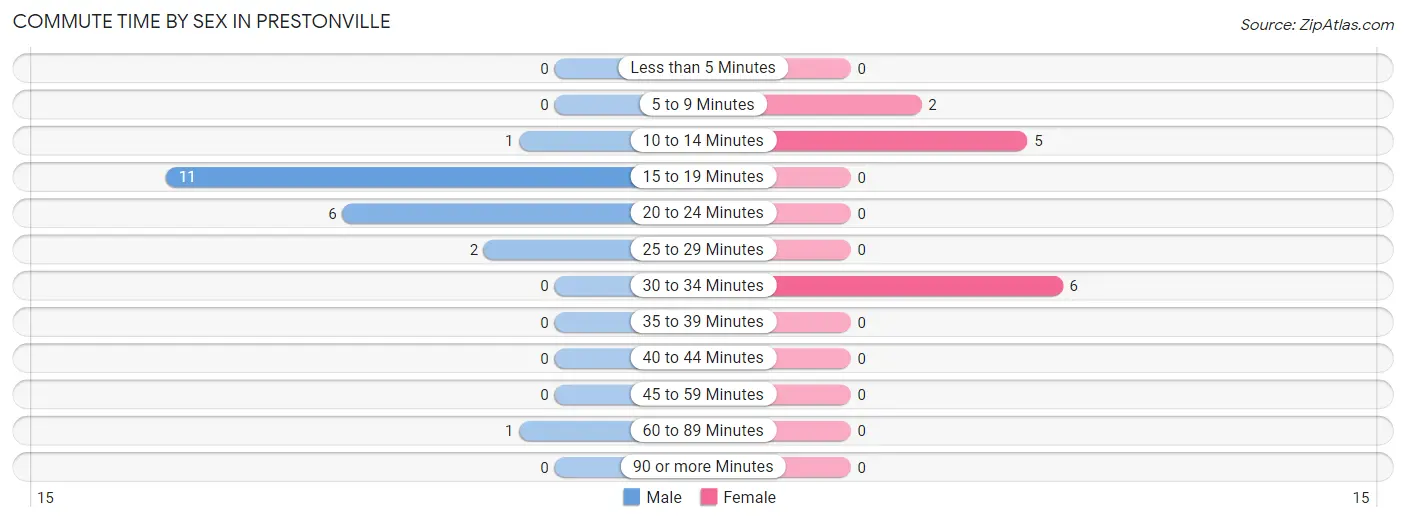
| Commute Time | Male | Female |
| Less than 5 Minutes | 0 (0.0%) | 0 (0.0%) |
| 5 to 9 Minutes | 0 (0.0%) | 2 (15.4%) |
| 10 to 14 Minutes | 1 (4.8%) | 5 (38.5%) |
| 15 to 19 Minutes | 11 (52.4%) | 0 (0.0%) |
| 20 to 24 Minutes | 6 (28.6%) | 0 (0.0%) |
| 25 to 29 Minutes | 2 (9.5%) | 0 (0.0%) |
| 30 to 34 Minutes | 0 (0.0%) | 6 (46.2%) |
| 35 to 39 Minutes | 0 (0.0%) | 0 (0.0%) |
| 40 to 44 Minutes | 0 (0.0%) | 0 (0.0%) |
| 45 to 59 Minutes | 0 (0.0%) | 0 (0.0%) |
| 60 to 89 Minutes | 1 (4.8%) | 0 (0.0%) |
| 90 or more Minutes | 0 (0.0%) | 0 (0.0%) |
Time of Departure to Work by Sex in Prestonville
The most frequent times of departure to work in Prestonville are 7:30 AM to 7:59 AM (9, 42.9%) for males and 4:00 PM to 11:59 PM (5, 38.5%) for females.
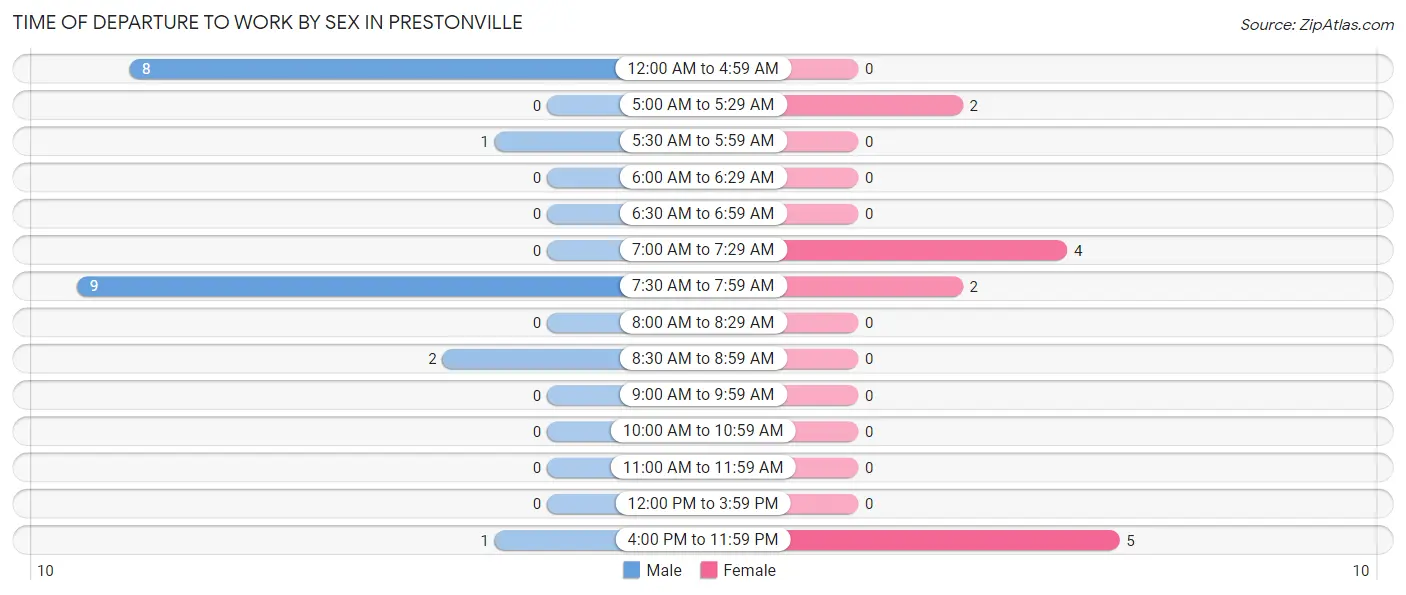
| Time of Departure | Male | Female |
| 12:00 AM to 4:59 AM | 8 (38.1%) | 0 (0.0%) |
| 5:00 AM to 5:29 AM | 0 (0.0%) | 2 (15.4%) |
| 5:30 AM to 5:59 AM | 1 (4.8%) | 0 (0.0%) |
| 6:00 AM to 6:29 AM | 0 (0.0%) | 0 (0.0%) |
| 6:30 AM to 6:59 AM | 0 (0.0%) | 0 (0.0%) |
| 7:00 AM to 7:29 AM | 0 (0.0%) | 4 (30.8%) |
| 7:30 AM to 7:59 AM | 9 (42.9%) | 2 (15.4%) |
| 8:00 AM to 8:29 AM | 0 (0.0%) | 0 (0.0%) |
| 8:30 AM to 8:59 AM | 2 (9.5%) | 0 (0.0%) |
| 9:00 AM to 9:59 AM | 0 (0.0%) | 0 (0.0%) |
| 10:00 AM to 10:59 AM | 0 (0.0%) | 0 (0.0%) |
| 11:00 AM to 11:59 AM | 0 (0.0%) | 0 (0.0%) |
| 12:00 PM to 3:59 PM | 0 (0.0%) | 0 (0.0%) |
| 4:00 PM to 11:59 PM | 1 (4.8%) | 5 (38.5%) |
| Total | 21 (100.0%) | 13 (100.0%) |
Housing Occupancy in Prestonville
Occupancy by Ownership in Prestonville
Of the total 63 dwellings in Prestonville, owner-occupied units account for 46 (73.0%), while renter-occupied units make up 17 (27.0%).
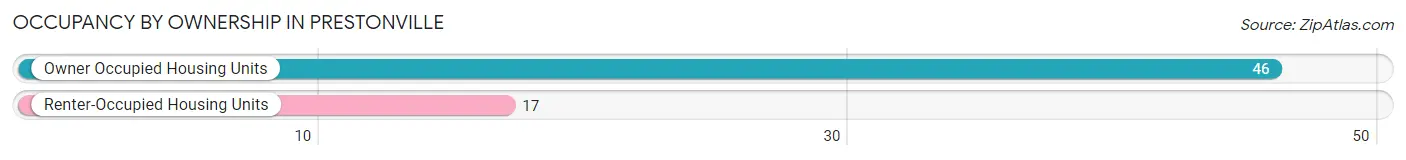
| Occupancy | # Housing Units | % Housing Units |
| Owner Occupied Housing Units | 46 | 73.0% |
| Renter-Occupied Housing Units | 17 | 27.0% |
| Total Occupied Housing Units | 63 | 100.0% |
Occupancy by Household Size in Prestonville
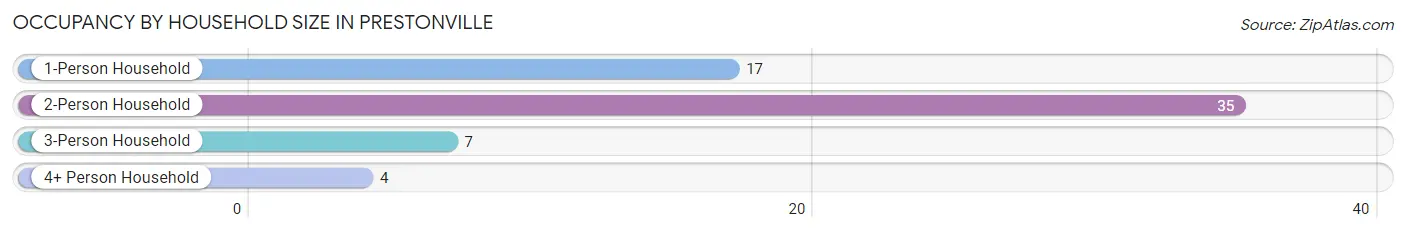
| Household Size | # Housing Units | % Housing Units |
| 1-Person Household | 17 | 27.0% |
| 2-Person Household | 35 | 55.6% |
| 3-Person Household | 7 | 11.1% |
| 4+ Person Household | 4 | 6.4% |
| Total Housing Units | 63 | 100.0% |
Occupancy by Ownership by Household Size in Prestonville
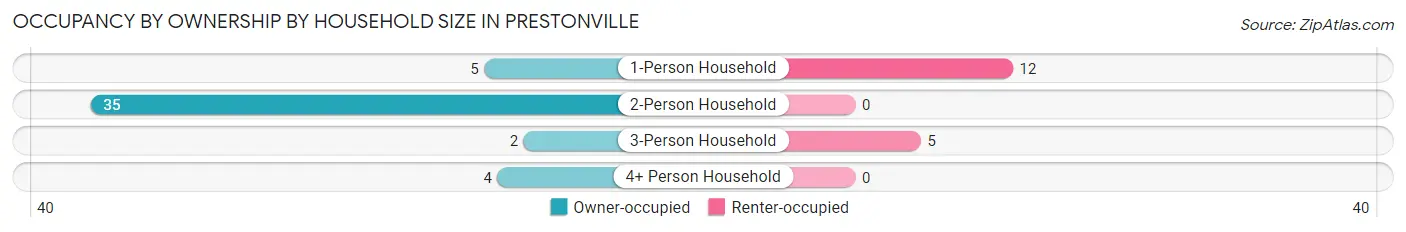
| Household Size | Owner-occupied | Renter-occupied |
| 1-Person Household | 5 (29.4%) | 12 (70.6%) |
| 2-Person Household | 35 (100.0%) | 0 (0.0%) |
| 3-Person Household | 2 (28.6%) | 5 (71.4%) |
| 4+ Person Household | 4 (100.0%) | 0 (0.0%) |
| Total Housing Units | 46 (73.0%) | 17 (27.0%) |
Occupancy by Educational Attainment in Prestonville
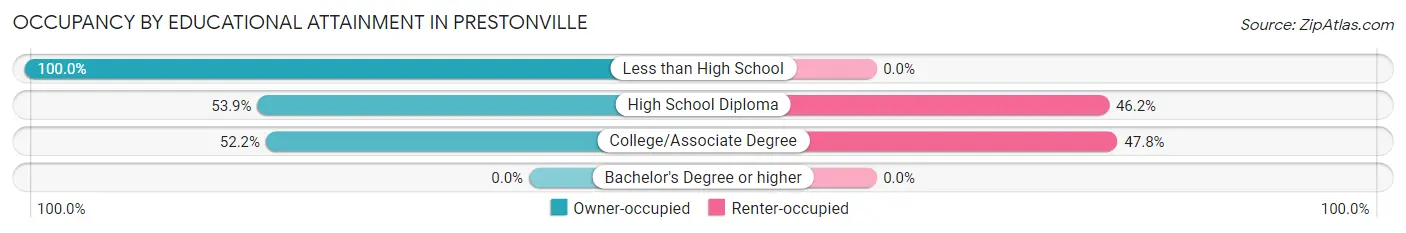
| Household Size | Owner-occupied | Renter-occupied |
| Less than High School | 27 (100.0%) | 0 (0.0%) |
| High School Diploma | 7 (53.8%) | 6 (46.2%) |
| College/Associate Degree | 12 (52.2%) | 11 (47.8%) |
| Bachelor's Degree or higher | 0 (0.0%) | 0 (0.0%) |
Occupancy by Age of Householder in Prestonville
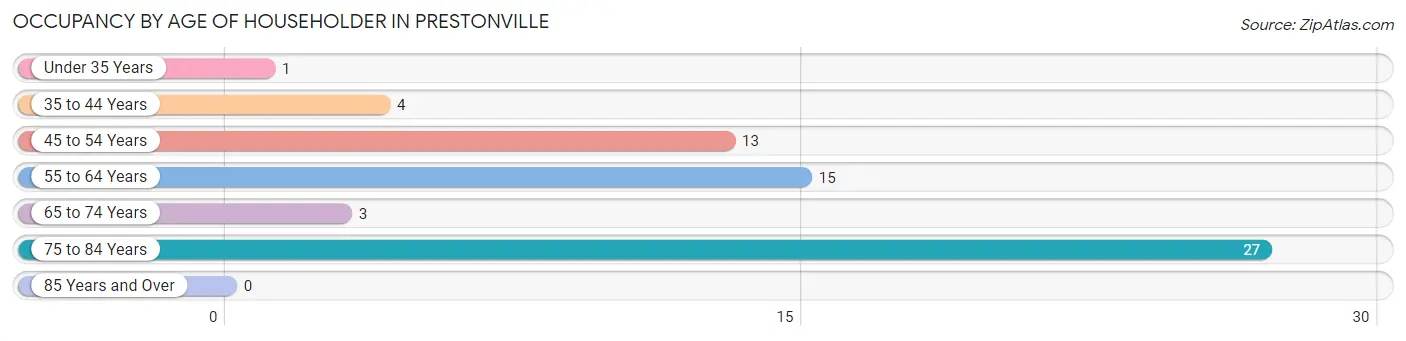
| Age Bracket | # Households | % Households |
| Under 35 Years | 1 | 1.6% |
| 35 to 44 Years | 4 | 6.4% |
| 45 to 54 Years | 13 | 20.6% |
| 55 to 64 Years | 15 | 23.8% |
| 65 to 74 Years | 3 | 4.8% |
| 75 to 84 Years | 27 | 42.9% |
| 85 Years and Over | 0 | 0.0% |
| Total | 63 | 100.0% |
Housing Finances in Prestonville
Median Income by Occupancy in Prestonville
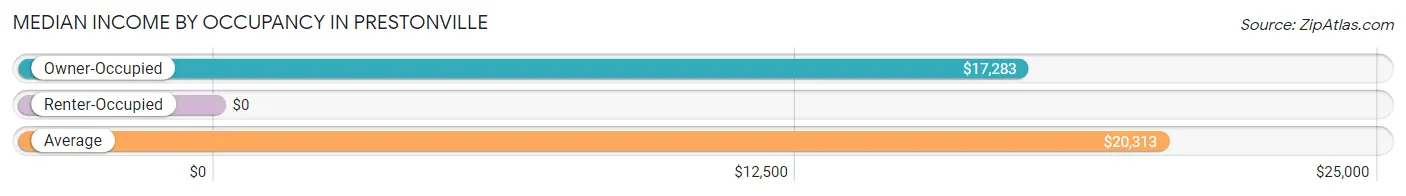
| Occupancy Type | # Households | Median Income |
| Owner-Occupied | 46 (73.0%) | $17,283 |
| Renter-Occupied | 17 (27.0%) | $0 |
| Average | 63 (100.0%) | $20,313 |
Occupancy by Householder Income Bracket in Prestonville
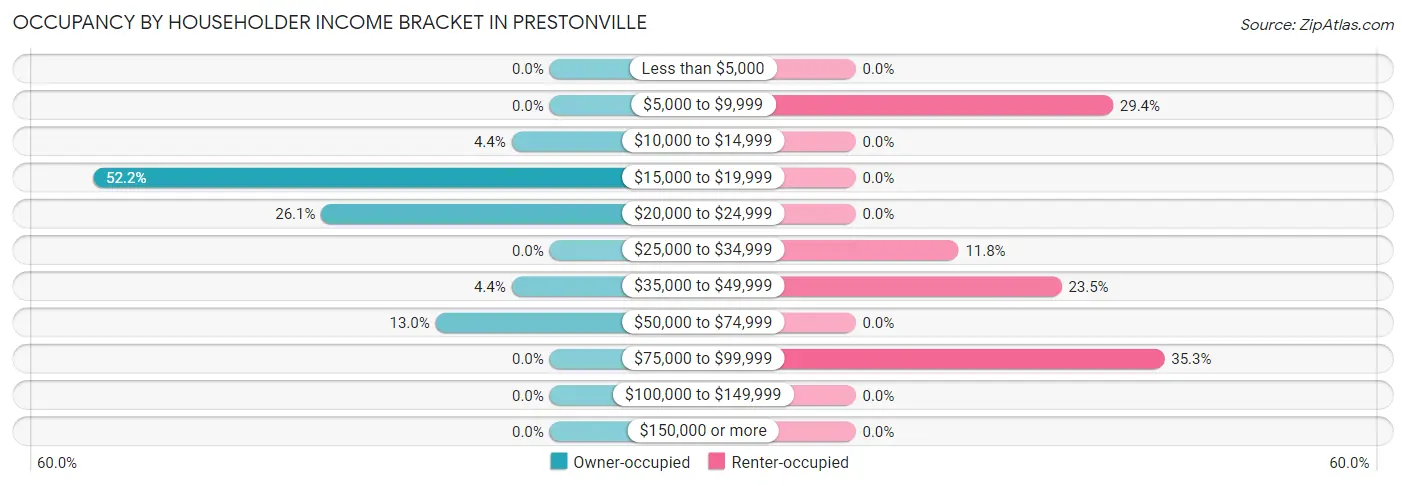
| Income Bracket | Owner-occupied | Renter-occupied |
| Less than $5,000 | 0 (0.0%) | 0 (0.0%) |
| $5,000 to $9,999 | 0 (0.0%) | 5 (29.4%) |
| $10,000 to $14,999 | 2 (4.3%) | 0 (0.0%) |
| $15,000 to $19,999 | 24 (52.2%) | 0 (0.0%) |
| $20,000 to $24,999 | 12 (26.1%) | 0 (0.0%) |
| $25,000 to $34,999 | 0 (0.0%) | 2 (11.8%) |
| $35,000 to $49,999 | 2 (4.3%) | 4 (23.5%) |
| $50,000 to $74,999 | 6 (13.0%) | 0 (0.0%) |
| $75,000 to $99,999 | 0 (0.0%) | 6 (35.3%) |
| $100,000 to $149,999 | 0 (0.0%) | 0 (0.0%) |
| $150,000 or more | 0 (0.0%) | 0 (0.0%) |
| Total | 46 (100.0%) | 17 (100.0%) |
Monthly Housing Cost Tiers in Prestonville
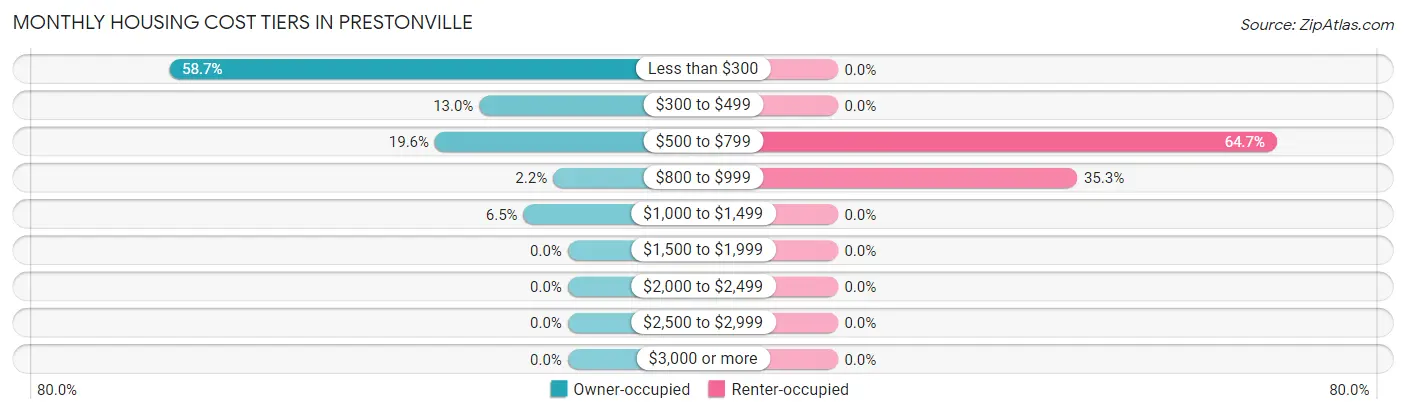
| Monthly Cost | Owner-occupied | Renter-occupied |
| Less than $300 | 27 (58.7%) | 0 (0.0%) |
| $300 to $499 | 6 (13.0%) | 0 (0.0%) |
| $500 to $799 | 9 (19.6%) | 11 (64.7%) |
| $800 to $999 | 1 (2.2%) | 6 (35.3%) |
| $1,000 to $1,499 | 3 (6.5%) | 0 (0.0%) |
| $1,500 to $1,999 | 0 (0.0%) | 0 (0.0%) |
| $2,000 to $2,499 | 0 (0.0%) | 0 (0.0%) |
| $2,500 to $2,999 | 0 (0.0%) | 0 (0.0%) |
| $3,000 or more | 0 (0.0%) | 0 (0.0%) |
| Total | 46 (100.0%) | 17 (100.0%) |
Physical Housing Characteristics in Prestonville
Housing Structures in Prestonville
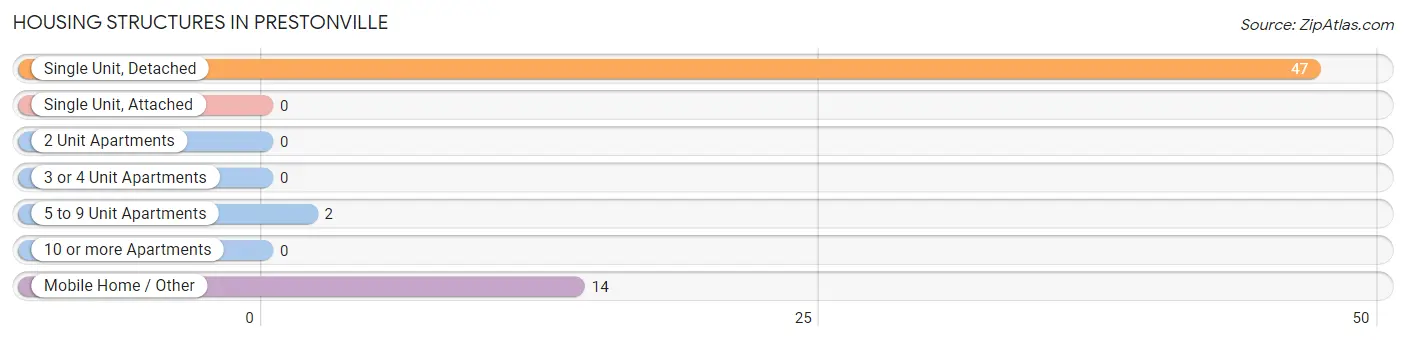
| Structure Type | # Housing Units | % Housing Units |
| Single Unit, Detached | 47 | 74.6% |
| Single Unit, Attached | 0 | 0.0% |
| 2 Unit Apartments | 0 | 0.0% |
| 3 or 4 Unit Apartments | 0 | 0.0% |
| 5 to 9 Unit Apartments | 2 | 3.2% |
| 10 or more Apartments | 0 | 0.0% |
| Mobile Home / Other | 14 | 22.2% |
| Total | 63 | 100.0% |
Housing Structures by Occupancy in Prestonville
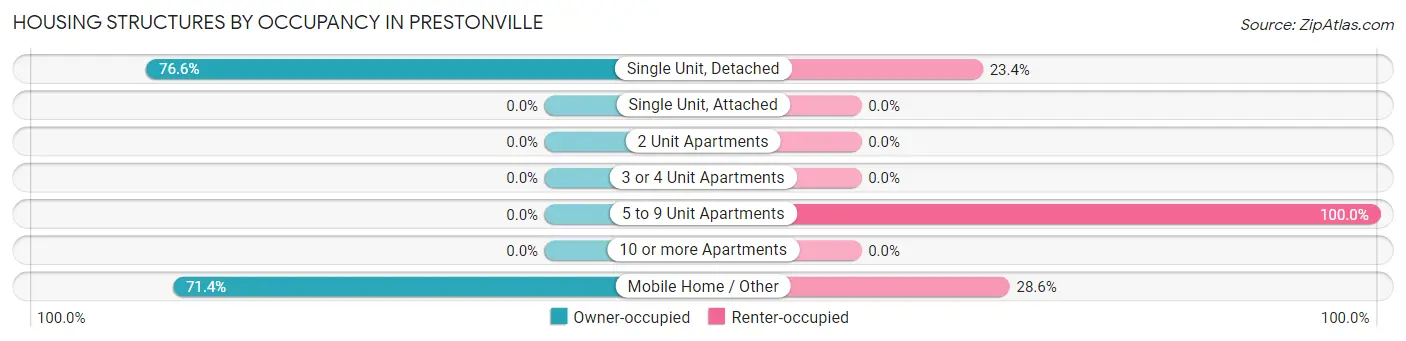
| Structure Type | Owner-occupied | Renter-occupied |
| Single Unit, Detached | 36 (76.6%) | 11 (23.4%) |
| Single Unit, Attached | 0 (0.0%) | 0 (0.0%) |
| 2 Unit Apartments | 0 (0.0%) | 0 (0.0%) |
| 3 or 4 Unit Apartments | 0 (0.0%) | 0 (0.0%) |
| 5 to 9 Unit Apartments | 0 (0.0%) | 2 (100.0%) |
| 10 or more Apartments | 0 (0.0%) | 0 (0.0%) |
| Mobile Home / Other | 10 (71.4%) | 4 (28.6%) |
| Total | 46 (73.0%) | 17 (27.0%) |
Housing Structures by Number of Rooms in Prestonville
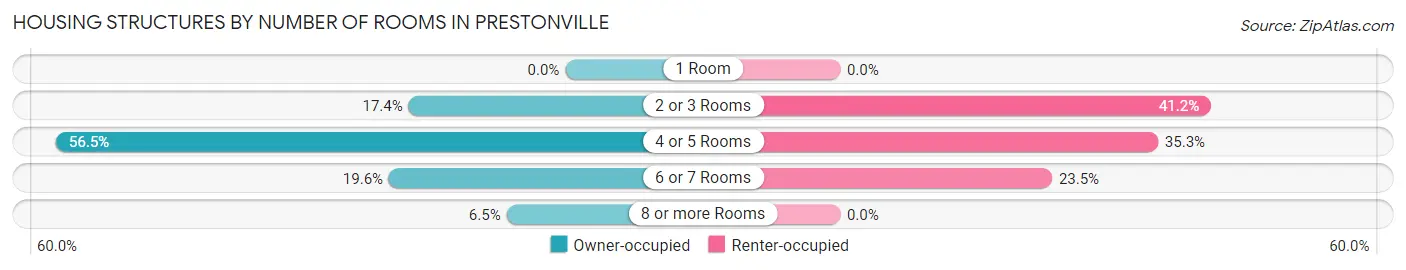
| Number of Rooms | Owner-occupied | Renter-occupied |
| 1 Room | 0 (0.0%) | 0 (0.0%) |
| 2 or 3 Rooms | 8 (17.4%) | 7 (41.2%) |
| 4 or 5 Rooms | 26 (56.5%) | 6 (35.3%) |
| 6 or 7 Rooms | 9 (19.6%) | 4 (23.5%) |
| 8 or more Rooms | 3 (6.5%) | 0 (0.0%) |
| Total | 46 (100.0%) | 17 (100.0%) |
Housing Structure by Heating Type in Prestonville
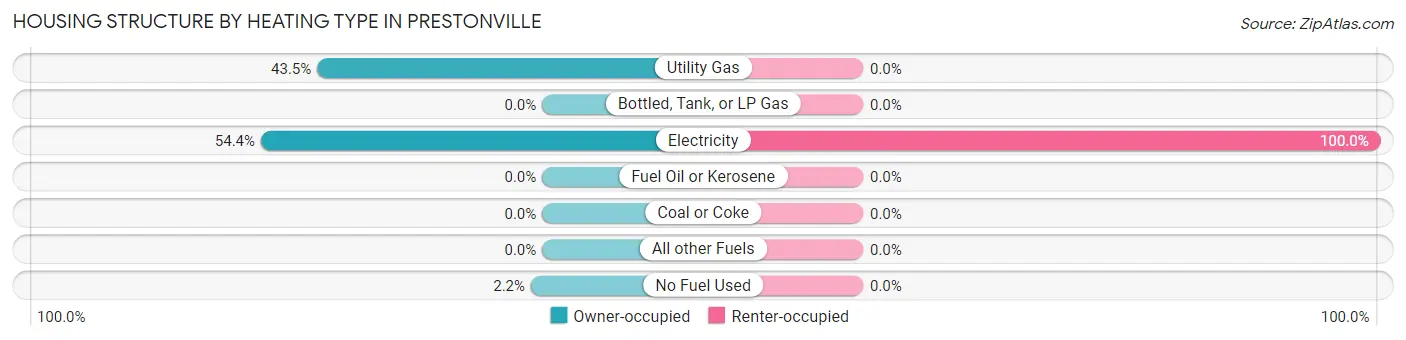
| Heating Type | Owner-occupied | Renter-occupied |
| Utility Gas | 20 (43.5%) | 0 (0.0%) |
| Bottled, Tank, or LP Gas | 0 (0.0%) | 0 (0.0%) |
| Electricity | 25 (54.3%) | 17 (100.0%) |
| Fuel Oil or Kerosene | 0 (0.0%) | 0 (0.0%) |
| Coal or Coke | 0 (0.0%) | 0 (0.0%) |
| All other Fuels | 0 (0.0%) | 0 (0.0%) |
| No Fuel Used | 1 (2.2%) | 0 (0.0%) |
| Total | 46 (100.0%) | 17 (100.0%) |
Household Vehicle Usage in Prestonville
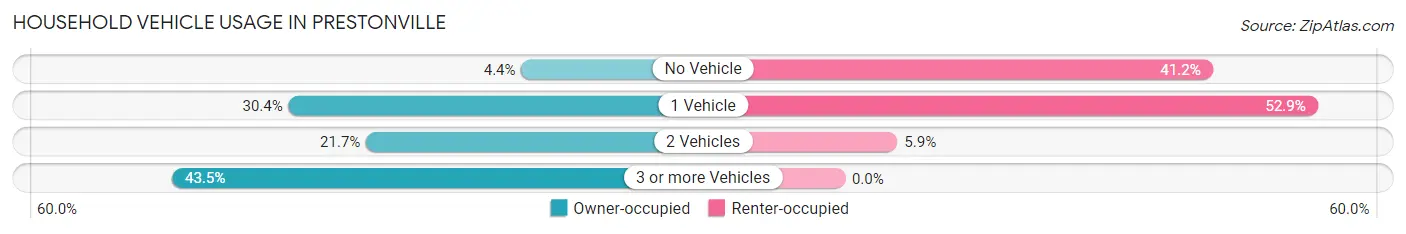
| Vehicles per Household | Owner-occupied | Renter-occupied |
| No Vehicle | 2 (4.3%) | 7 (41.2%) |
| 1 Vehicle | 14 (30.4%) | 9 (52.9%) |
| 2 Vehicles | 10 (21.7%) | 1 (5.9%) |
| 3 or more Vehicles | 20 (43.5%) | 0 (0.0%) |
| Total | 46 (100.0%) | 17 (100.0%) |
Real Estate & Mortgages in Prestonville
Real Estate and Mortgage Overview in Prestonville
| Characteristic | Without Mortgage | With Mortgage |
| Housing Units | 34 | 12 |
| Median Property Value | $66,200 | $9,999 |
| Median Household Income | $16,630 | $0 |
| Monthly Housing Costs | $275 | $0 |
| Real Estate Taxes | $336 | $9 |
Property Value by Mortgage Status in Prestonville
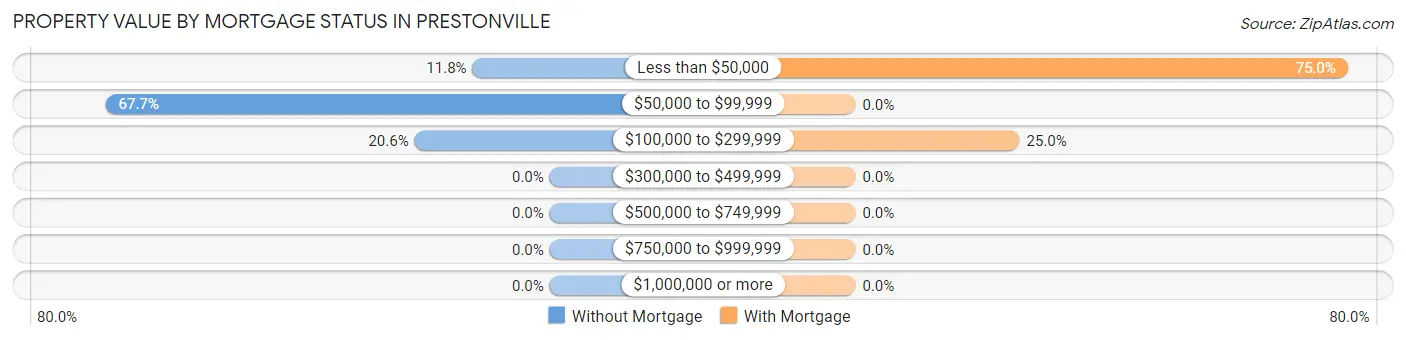
| Property Value | Without Mortgage | With Mortgage |
| Less than $50,000 | 4 (11.8%) | 9 (75.0%) |
| $50,000 to $99,999 | 23 (67.6%) | 0 (0.0%) |
| $100,000 to $299,999 | 7 (20.6%) | 3 (25.0%) |
| $300,000 to $499,999 | 0 (0.0%) | 0 (0.0%) |
| $500,000 to $749,999 | 0 (0.0%) | 0 (0.0%) |
| $750,000 to $999,999 | 0 (0.0%) | 0 (0.0%) |
| $1,000,000 or more | 0 (0.0%) | 0 (0.0%) |
| Total | 34 (100.0%) | 12 (100.0%) |
Household Income by Mortgage Status in Prestonville
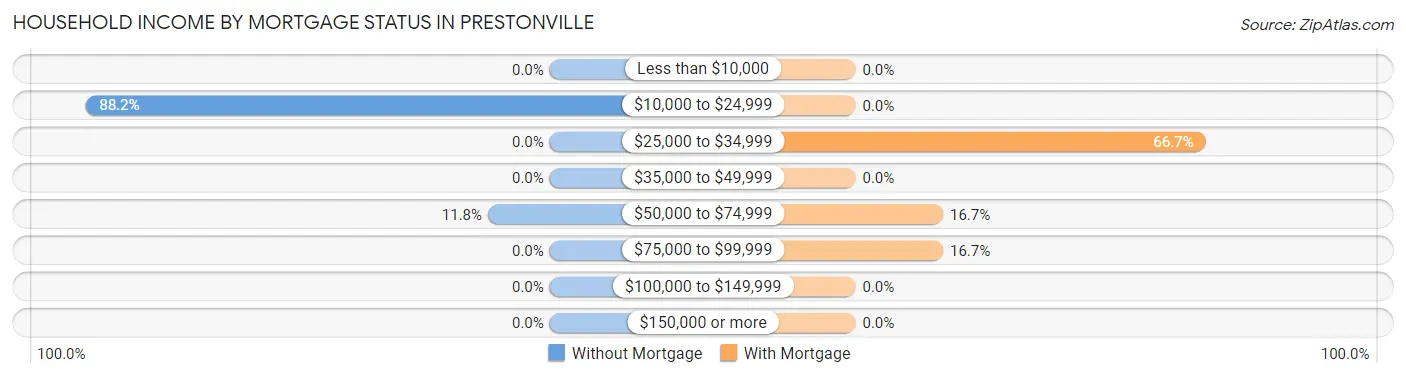
| Household Income | Without Mortgage | With Mortgage |
| Less than $10,000 | 0 (0.0%) | 0 (0.0%) |
| $10,000 to $24,999 | 30 (88.2%) | 0 (0.0%) |
| $25,000 to $34,999 | 0 (0.0%) | 8 (66.7%) |
| $35,000 to $49,999 | 0 (0.0%) | 0 (0.0%) |
| $50,000 to $74,999 | 4 (11.8%) | 2 (16.7%) |
| $75,000 to $99,999 | 0 (0.0%) | 2 (16.7%) |
| $100,000 to $149,999 | 0 (0.0%) | 0 (0.0%) |
| $150,000 or more | 0 (0.0%) | 0 (0.0%) |
| Total | 34 (100.0%) | 12 (100.0%) |
Property Value to Household Income Ratio in Prestonville
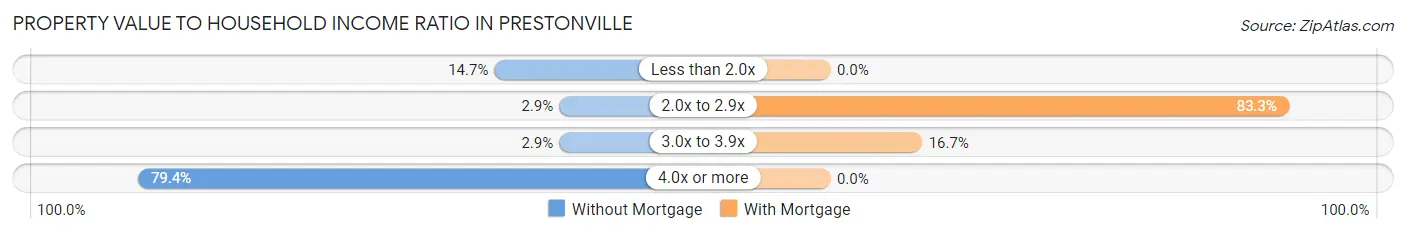
| Value-to-Income Ratio | Without Mortgage | With Mortgage |
| Less than 2.0x | 5 (14.7%) | 0 (0.0%) |
| 2.0x to 2.9x | 1 (2.9%) | 10 (83.3%) |
| 3.0x to 3.9x | 1 (2.9%) | 2 (16.7%) |
| 4.0x or more | 27 (79.4%) | 0 (0.0%) |
| Total | 34 (100.0%) | 12 (100.0%) |
Real Estate Taxes by Mortgage Status in Prestonville
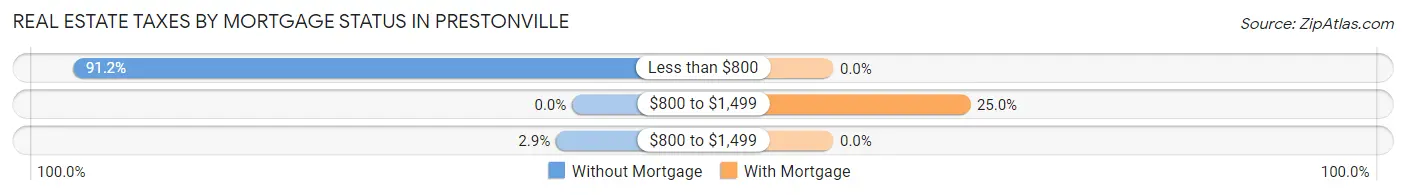
| Property Taxes | Without Mortgage | With Mortgage |
| Less than $800 | 31 (91.2%) | 0 (0.0%) |
| $800 to $1,499 | 0 (0.0%) | 3 (25.0%) |
| $800 to $1,499 | 1 (2.9%) | 0 (0.0%) |
| Total | 34 (100.0%) | 12 (100.0%) |
Health & Disability in Prestonville
Health Insurance Coverage by Age in Prestonville
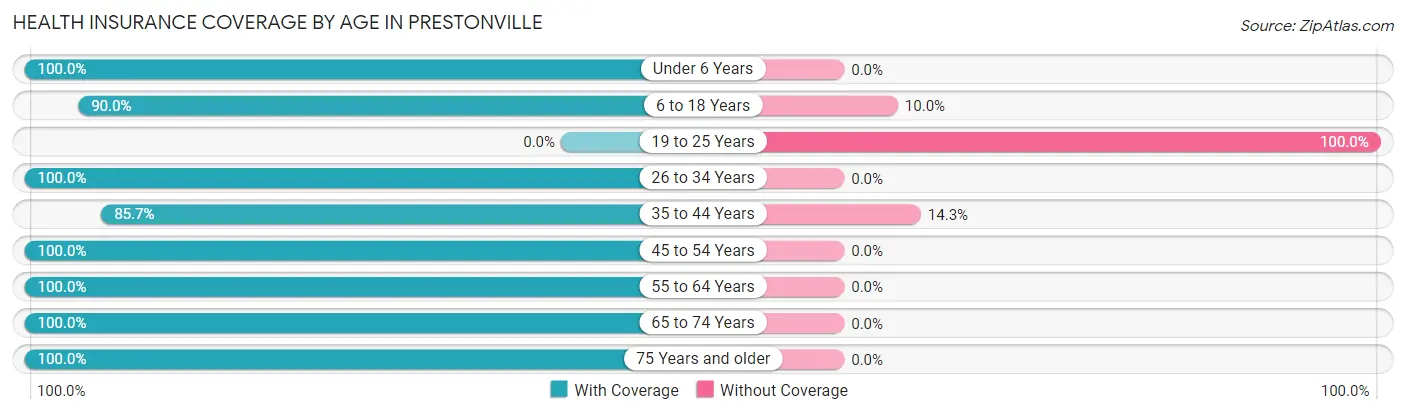
| Age Bracket | With Coverage | Without Coverage |
| Under 6 Years | 2 (100.0%) | 0 (0.0%) |
| 6 to 18 Years | 9 (90.0%) | 1 (10.0%) |
| 19 to 25 Years | 0 (0.0%) | 13 (100.0%) |
| 26 to 34 Years | 3 (100.0%) | 0 (0.0%) |
| 35 to 44 Years | 6 (85.7%) | 1 (14.3%) |
| 45 to 54 Years | 23 (100.0%) | 0 (0.0%) |
| 55 to 64 Years | 20 (100.0%) | 0 (0.0%) |
| 65 to 74 Years | 7 (100.0%) | 0 (0.0%) |
| 75 Years and older | 30 (100.0%) | 0 (0.0%) |
| Total | 100 (87.0%) | 15 (13.0%) |
Health Insurance Coverage by Citizenship Status in Prestonville
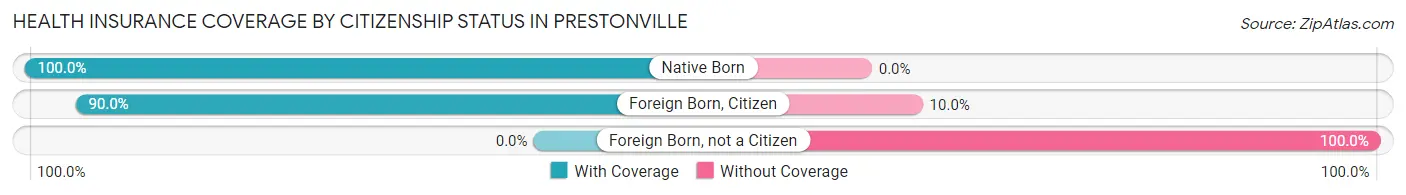
| Citizenship Status | With Coverage | Without Coverage |
| Native Born | 2 (100.0%) | 0 (0.0%) |
| Foreign Born, Citizen | 9 (90.0%) | 1 (10.0%) |
| Foreign Born, not a Citizen | 0 (0.0%) | 13 (100.0%) |
Health Insurance Coverage by Household Income in Prestonville
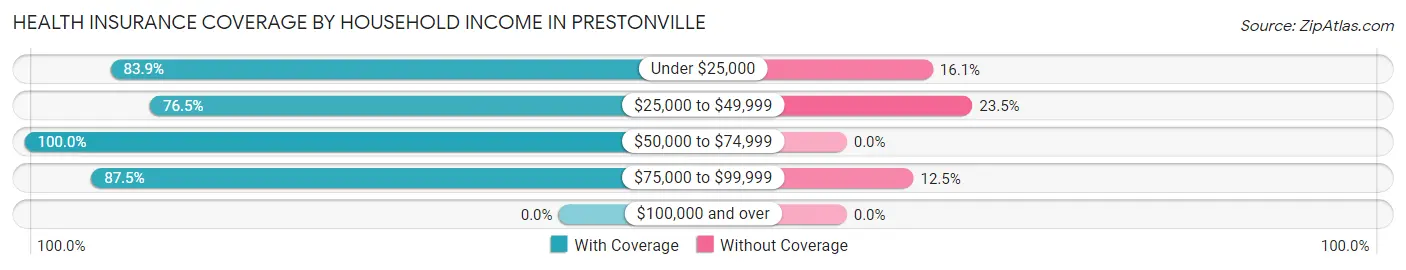
| Household Income | With Coverage | Without Coverage |
| Under $25,000 | 52 (83.9%) | 10 (16.1%) |
| $25,000 to $49,999 | 13 (76.5%) | 4 (23.5%) |
| $50,000 to $74,999 | 23 (100.0%) | 0 (0.0%) |
| $75,000 to $99,999 | 7 (87.5%) | 1 (12.5%) |
| $100,000 and over | 0 (0.0%) | 0 (0.0%) |
Public vs Private Health Insurance Coverage by Age in Prestonville
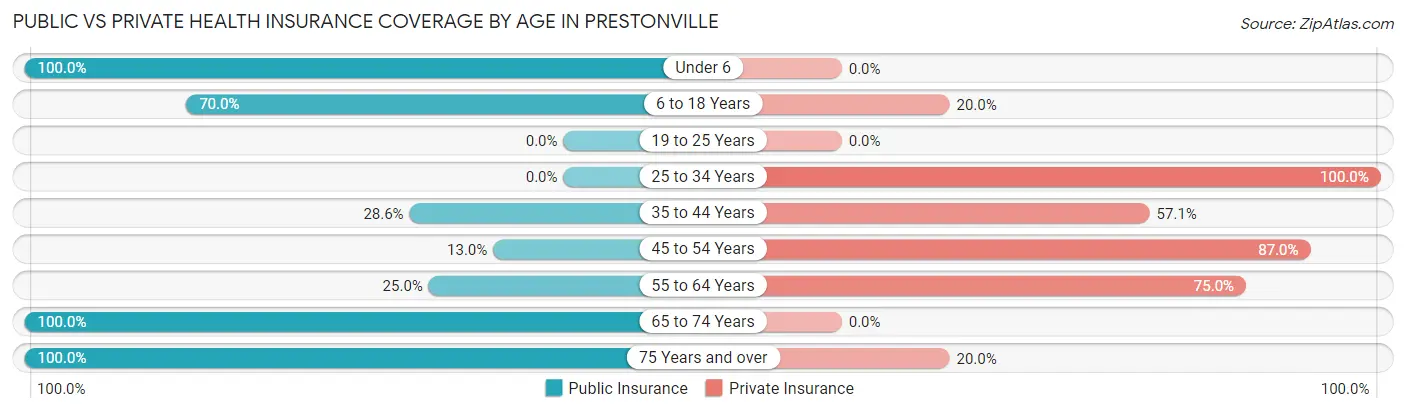
| Age Bracket | Public Insurance | Private Insurance |
| Under 6 | 2 (100.0%) | 0 (0.0%) |
| 6 to 18 Years | 7 (70.0%) | 2 (20.0%) |
| 19 to 25 Years | 0 (0.0%) | 0 (0.0%) |
| 25 to 34 Years | 0 (0.0%) | 3 (100.0%) |
| 35 to 44 Years | 2 (28.6%) | 4 (57.1%) |
| 45 to 54 Years | 3 (13.0%) | 20 (87.0%) |
| 55 to 64 Years | 5 (25.0%) | 15 (75.0%) |
| 65 to 74 Years | 7 (100.0%) | 0 (0.0%) |
| 75 Years and over | 30 (100.0%) | 6 (20.0%) |
| Total | 56 (48.7%) | 50 (43.5%) |
Disability Status by Sex by Age in Prestonville
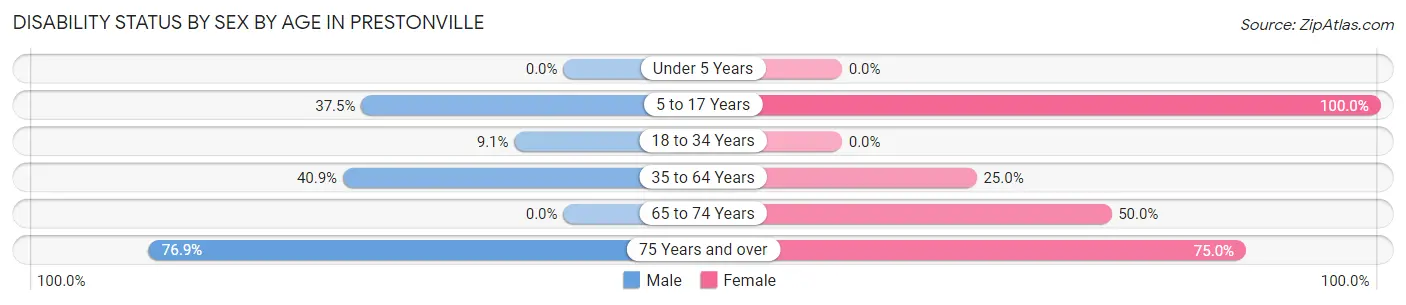
| Age Bracket | Male | Female |
| Under 5 Years | 0 (0.0%) | 0 (0.0%) |
| 5 to 17 Years | 3 (37.5%) | 1 (100.0%) |
| 18 to 34 Years | 1 (9.1%) | 0 (0.0%) |
| 35 to 64 Years | 9 (40.9%) | 7 (25.0%) |
| 65 to 74 Years | 0 (0.0%) | 2 (50.0%) |
| 75 Years and over | 20 (76.9%) | 3 (75.0%) |
Disability Class by Sex by Age in Prestonville
Disability Class: Hearing Difficulty
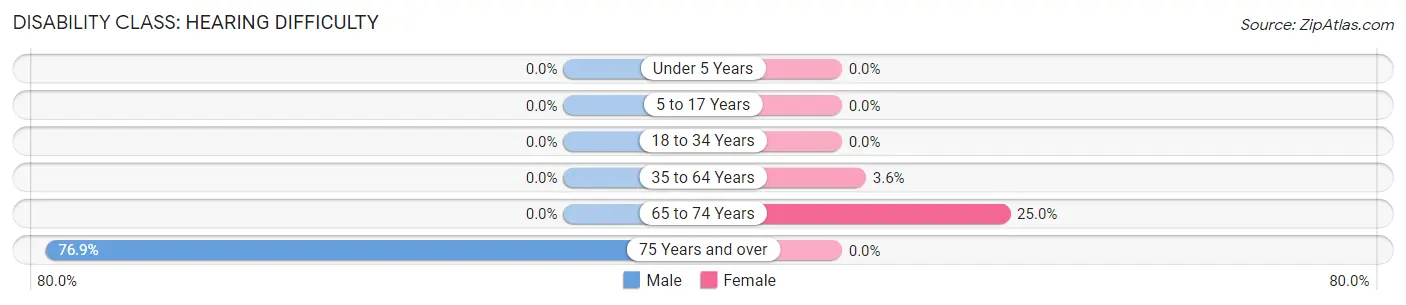
| Age Bracket | Male | Female |
| Under 5 Years | 0 (0.0%) | 0 (0.0%) |
| 5 to 17 Years | 0 (0.0%) | 0 (0.0%) |
| 18 to 34 Years | 0 (0.0%) | 0 (0.0%) |
| 35 to 64 Years | 0 (0.0%) | 1 (3.6%) |
| 65 to 74 Years | 0 (0.0%) | 1 (25.0%) |
| 75 Years and over | 20 (76.9%) | 0 (0.0%) |
Disability Class: Vision Difficulty
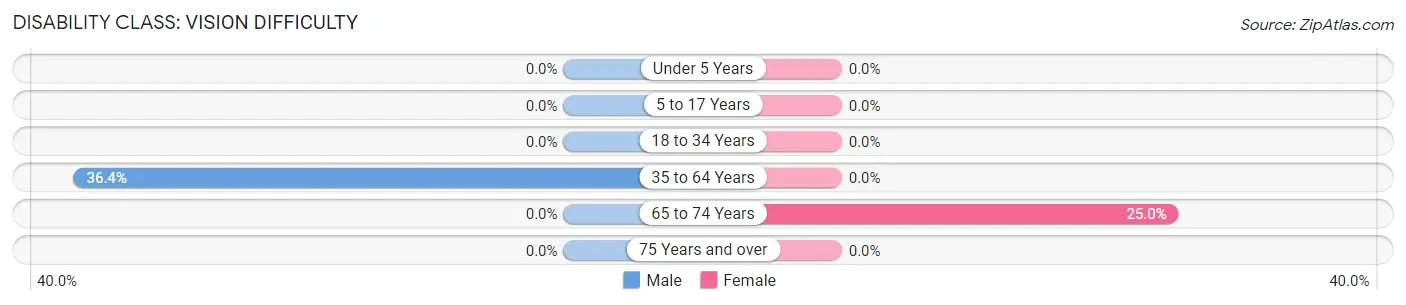
| Age Bracket | Male | Female |
| Under 5 Years | 0 (0.0%) | 0 (0.0%) |
| 5 to 17 Years | 0 (0.0%) | 0 (0.0%) |
| 18 to 34 Years | 0 (0.0%) | 0 (0.0%) |
| 35 to 64 Years | 8 (36.4%) | 0 (0.0%) |
| 65 to 74 Years | 0 (0.0%) | 1 (25.0%) |
| 75 Years and over | 0 (0.0%) | 0 (0.0%) |
Disability Class: Cognitive Difficulty
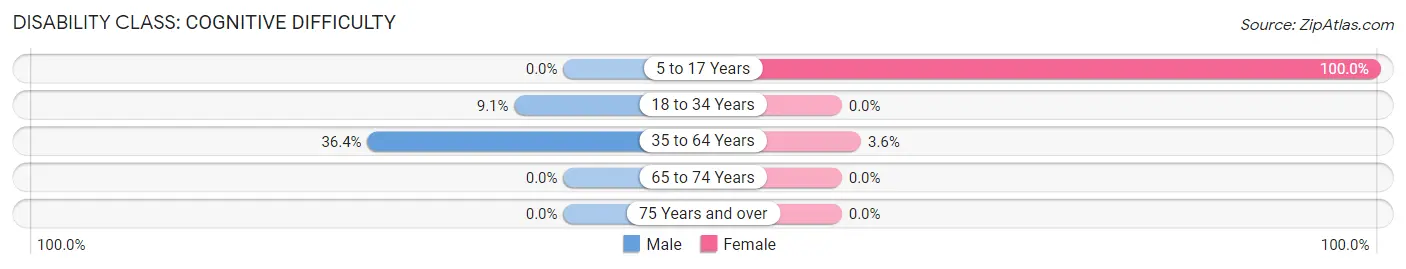
| Age Bracket | Male | Female |
| 5 to 17 Years | 0 (0.0%) | 1 (100.0%) |
| 18 to 34 Years | 1 (9.1%) | 0 (0.0%) |
| 35 to 64 Years | 8 (36.4%) | 1 (3.6%) |
| 65 to 74 Years | 0 (0.0%) | 0 (0.0%) |
| 75 Years and over | 0 (0.0%) | 0 (0.0%) |
Disability Class: Ambulatory Difficulty
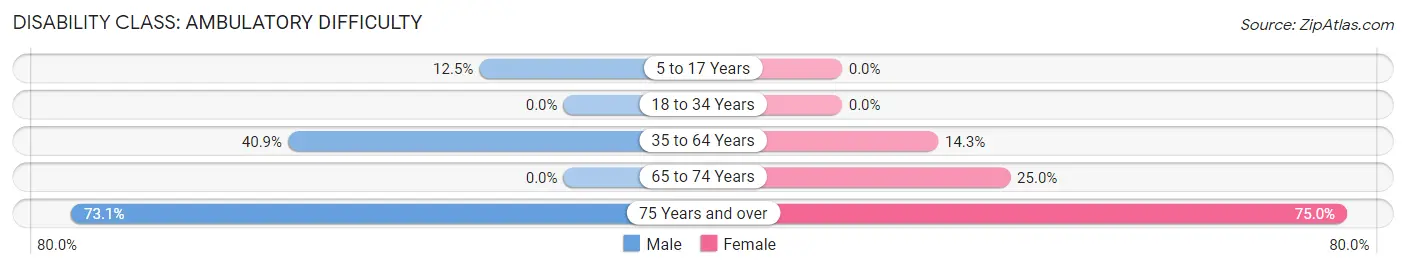
| Age Bracket | Male | Female |
| 5 to 17 Years | 1 (12.5%) | 0 (0.0%) |
| 18 to 34 Years | 0 (0.0%) | 0 (0.0%) |
| 35 to 64 Years | 9 (40.9%) | 4 (14.3%) |
| 65 to 74 Years | 0 (0.0%) | 1 (25.0%) |
| 75 Years and over | 19 (73.1%) | 3 (75.0%) |
Disability Class: Self-Care Difficulty
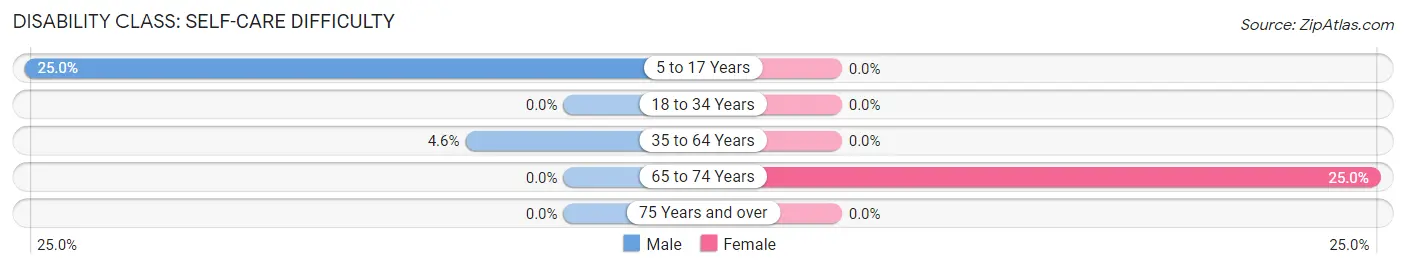
| Age Bracket | Male | Female |
| 5 to 17 Years | 2 (25.0%) | 0 (0.0%) |
| 18 to 34 Years | 0 (0.0%) | 0 (0.0%) |
| 35 to 64 Years | 1 (4.5%) | 0 (0.0%) |
| 65 to 74 Years | 0 (0.0%) | 1 (25.0%) |
| 75 Years and over | 0 (0.0%) | 0 (0.0%) |
Technology Access in Prestonville
Computing Device Access in Prestonville
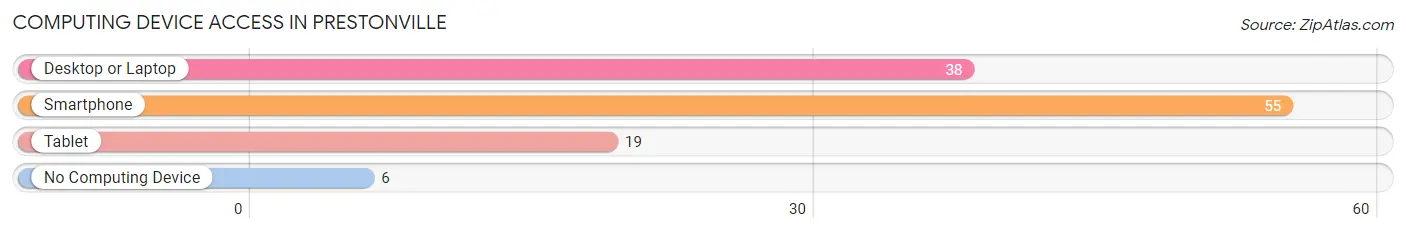
| Device Type | # Households | % Households |
| Desktop or Laptop | 38 | 60.3% |
| Smartphone | 55 | 87.3% |
| Tablet | 19 | 30.2% |
| No Computing Device | 6 | 9.5% |
| Total | 63 | 100.0% |
Internet Access in Prestonville
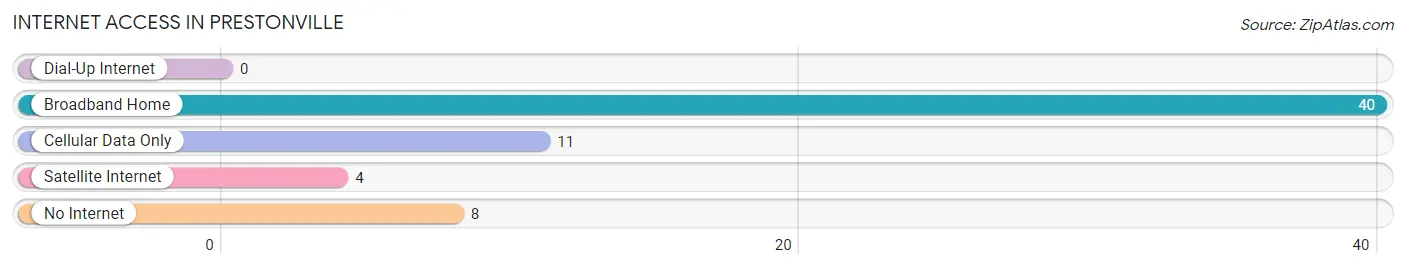
| Internet Type | # Households | % Households |
| Dial-Up Internet | 0 | 0.0% |
| Broadband Home | 40 | 63.5% |
| Cellular Data Only | 11 | 17.5% |
| Satellite Internet | 4 | 6.4% |
| No Internet | 8 | 12.7% |
| Total | 63 | 100.0% |
Prestonville Summary
Prestonville is a small unincorporated community located in the northern part of Kentucky’s Christian County. It is situated along the banks of the Green River, approximately 10 miles south of Hopkinsville. The population of Prestonville was estimated to be around 1,000 in 2020.
History
Prestonville was founded in 1820 by William Preston, a Revolutionary War veteran and one of the first settlers in the area. The town was named after him and was originally known as Preston’s Crossroads. The town was incorporated in 1837 and was the first town in Christian County to be incorporated.
In the early days, Prestonville was a bustling river port town. It was a major stop on the Louisville and Nashville Railroad and was a popular destination for steamboats. The town was also home to several businesses, including a grist mill, a sawmill, a blacksmith shop, and a general store.
In the late 19th century, Prestonville was a popular destination for tourists. The town was known for its mineral springs, which were believed to have healing properties. The town also had several hotels and resorts, which attracted visitors from all over the country.
Geography
Prestonville is located in the northern part of Christian County, approximately 10 miles south of Hopkinsville. The town is situated along the banks of the Green River, which is a tributary of the Ohio River. The town is surrounded by rolling hills and farmland.
The climate in Prestonville is humid subtropical, with hot summers and mild winters. The average annual temperature is around 60 degrees Fahrenheit. The average annual precipitation is around 45 inches.
Economy
The economy of Prestonville is largely based on agriculture. The town is home to several farms, which produce a variety of crops, including corn, soybeans, wheat, and hay. The town is also home to several small businesses, including a grocery store, a hardware store, and a gas station.
Demographics
The population of Prestonville was estimated to be around 1,000 in 2020. The town is predominantly white, with around 95% of the population identifying as such. The median household income is around $35,000, and the median home value is around $90,000.
The town is served by the Christian County Public Schools system. The town is home to one elementary school, one middle school, and one high school. The town is also home to several churches, including the First Baptist Church of Prestonville.
Conclusion
Prestonville is a small unincorporated community located in the northern part of Kentucky’s Christian County. It is situated along the banks of the Green River, approximately 10 miles south of Hopkinsville. The population of Prestonville was estimated to be around 1,000 in 2020. The town is predominantly white, with around 95% of the population identifying as such. The economy of Prestonville is largely based on agriculture, and the town is served by the Christian County Public Schools system. Prestonville is a popular destination for tourists due to its mineral springs and its proximity to the Green River.
Common Questions
What is Per Capita Income in Prestonville?
Per Capita income in Prestonville is $17,237.
What is the Median Family Income in Prestonville?
Median Family Income in Prestonville is $17,391.
What is the Median Household income in Prestonville?
Median Household Income in Prestonville is $20,313.
What is Inequality or Gini Index in Prestonville?
Inequality or Gini Index in Prestonville is 0.38.
What is the Total Population of Prestonville?
Total Population of Prestonville is 115.
What is the Total Male Population of Prestonville?
Total Male Population of Prestonville is 72.
What is the Total Female Population of Prestonville?
Total Female Population of Prestonville is 43.
What is the Ratio of Males per 100 Females in Prestonville?
There are 167.44 Males per 100 Females in Prestonville.
What is the Ratio of Females per 100 Males in Prestonville?
There are 59.72 Females per 100 Males in Prestonville.
What is the Median Population Age in Prestonville?
Median Population Age in Prestonville is 54.9 Years.
What is the Average Family Size in Prestonville
Average Family Size in Prestonville is 2.0 People.
What is the Average Household Size in Prestonville
Average Household Size in Prestonville is 1.8 People.
How Large is the Labor Force in Prestonville?
There are 55 People in the Labor Forcein in Prestonville.
What is the Percentage of People in the Labor Force in Prestonville?
52.4% of People are in the Labor Force in Prestonville.
What is the Unemployment Rate in Prestonville?
Unemployment Rate in Prestonville is 21.8%.