Carrollton, KY Map & Demographics
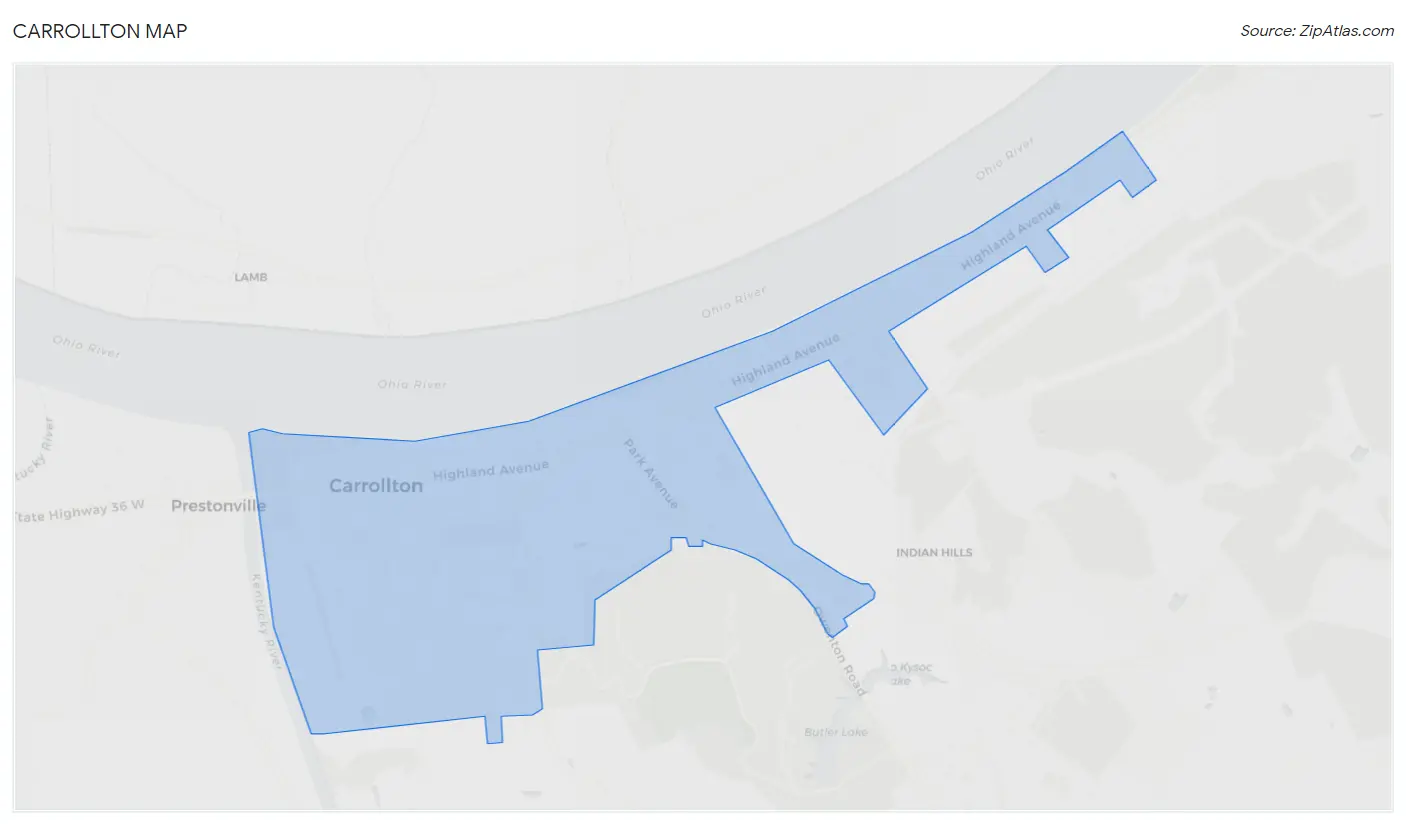
Carrollton Map
Carrollton Overview
$23,062
PER CAPITA INCOME
$56,091
AVG FAMILY INCOME
$48,333
AVG HOUSEHOLD INCOME
32.9%
WAGE / INCOME GAP [ % ]
67.1¢/ $1
WAGE / INCOME GAP [ $ ]
0.41
INEQUALITY / GINI INDEX
3,889
TOTAL POPULATION
2,045
MALE POPULATION
1,844
FEMALE POPULATION
110.90
MALES / 100 FEMALES
90.17
FEMALES / 100 MALES
32.7
MEDIAN AGE
3.7
AVG FAMILY SIZE
2.6
AVG HOUSEHOLD SIZE
1,469
LABOR FORCE [ PEOPLE ]
56.7%
PERCENT IN LABOR FORCE
8.0%
UNEMPLOYMENT RATE
Carrollton Zip Codes
Carrollton Area Codes
Income in Carrollton
Income Overview in Carrollton
Per Capita Income in Carrollton is $23,062, while median incomes of families and households are $56,091 and $48,333 respectively.
| Characteristic | Number | Measure |
| Per Capita Income | 3,889 | $23,062 |
| Median Family Income | 796 | $56,091 |
| Mean Family Income | 796 | $71,131 |
| Median Household Income | 1,414 | $48,333 |
| Mean Household Income | 1,414 | $62,955 |
| Income Deficit | 796 | $0 |
| Wage / Income Gap (%) | 3,889 | 32.89% |
| Wage / Income Gap ($) | 3,889 | 67.11¢ per $1 |
| Gini / Inequality Index | 3,889 | 0.41 |
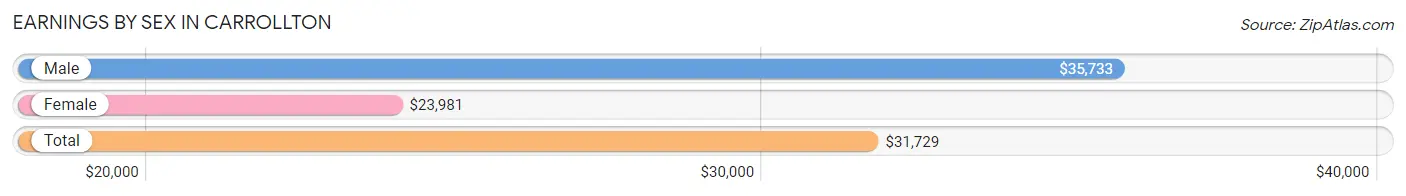
Earnings by Sex in Carrollton
Average Earnings in Carrollton are $31,729, $35,733 for men and $23,981 for women, a difference of 32.9%.
| Sex | Number | Average Earnings |
| Male | 917 (55.7%) | $35,733 |
| Female | 730 (44.3%) | $23,981 |
| Total | 1,647 (100.0%) | $31,729 |
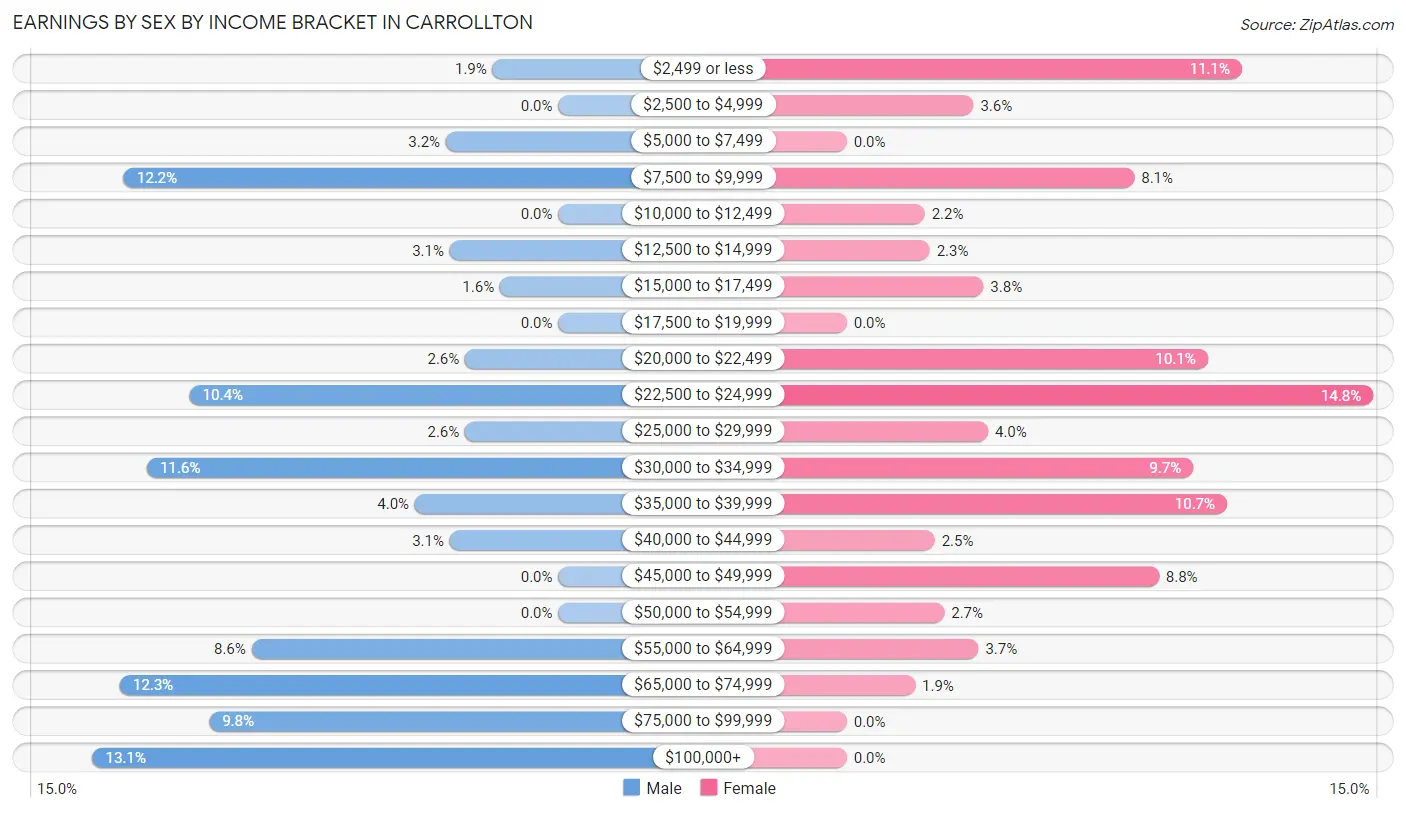
Earnings by Sex by Income Bracket in Carrollton
The most common earnings brackets in Carrollton are $100,000+ for men (120 | 13.1%) and $22,500 to $24,999 for women (108 | 14.8%).
| Income | Male | Female |
| $2,499 or less | 17 (1.8%) | 81 (11.1%) |
| $2,500 to $4,999 | 0 (0.0%) | 26 (3.6%) |
| $5,000 to $7,499 | 29 (3.2%) | 0 (0.0%) |
| $7,500 to $9,999 | 112 (12.2%) | 59 (8.1%) |
| $10,000 to $12,499 | 0 (0.0%) | 16 (2.2%) |
| $12,500 to $14,999 | 28 (3.0%) | 17 (2.3%) |
| $15,000 to $17,499 | 15 (1.6%) | 28 (3.8%) |
| $17,500 to $19,999 | 0 (0.0%) | 0 (0.0%) |
| $20,000 to $22,499 | 24 (2.6%) | 74 (10.1%) |
| $22,500 to $24,999 | 95 (10.4%) | 108 (14.8%) |
| $25,000 to $29,999 | 24 (2.6%) | 29 (4.0%) |
| $30,000 to $34,999 | 106 (11.6%) | 71 (9.7%) |
| $35,000 to $39,999 | 37 (4.0%) | 78 (10.7%) |
| $40,000 to $44,999 | 28 (3.0%) | 18 (2.5%) |
| $45,000 to $49,999 | 0 (0.0%) | 64 (8.8%) |
| $50,000 to $54,999 | 0 (0.0%) | 20 (2.7%) |
| $55,000 to $64,999 | 79 (8.6%) | 27 (3.7%) |
| $65,000 to $74,999 | 113 (12.3%) | 14 (1.9%) |
| $75,000 to $99,999 | 90 (9.8%) | 0 (0.0%) |
| $100,000+ | 120 (13.1%) | 0 (0.0%) |
| Total | 917 (100.0%) | 730 (100.0%) |
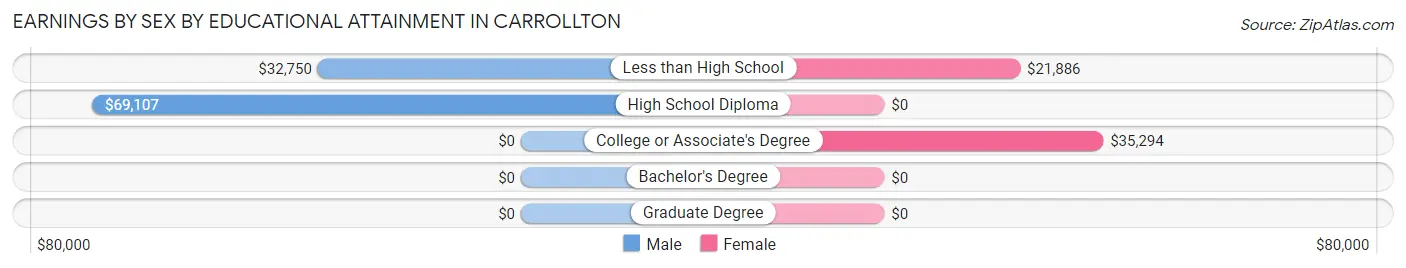
Earnings by Sex by Educational Attainment in Carrollton
| Educational Attainment | Male Income | Female Income |
| Less than High School | $32,750 | $21,886 |
| High School Diploma | $69,107 | $0 |
| College or Associate's Degree | - | - |
| Bachelor's Degree | - | - |
| Graduate Degree | - | - |
| Total | - | - |
Family Income in Carrollton
Family Income Brackets in Carrollton
According to the Carrollton family income data, there are 205 families falling into the $35,000 to $49,999 income range, which is the most common income bracket and makes up 25.8% of all families.
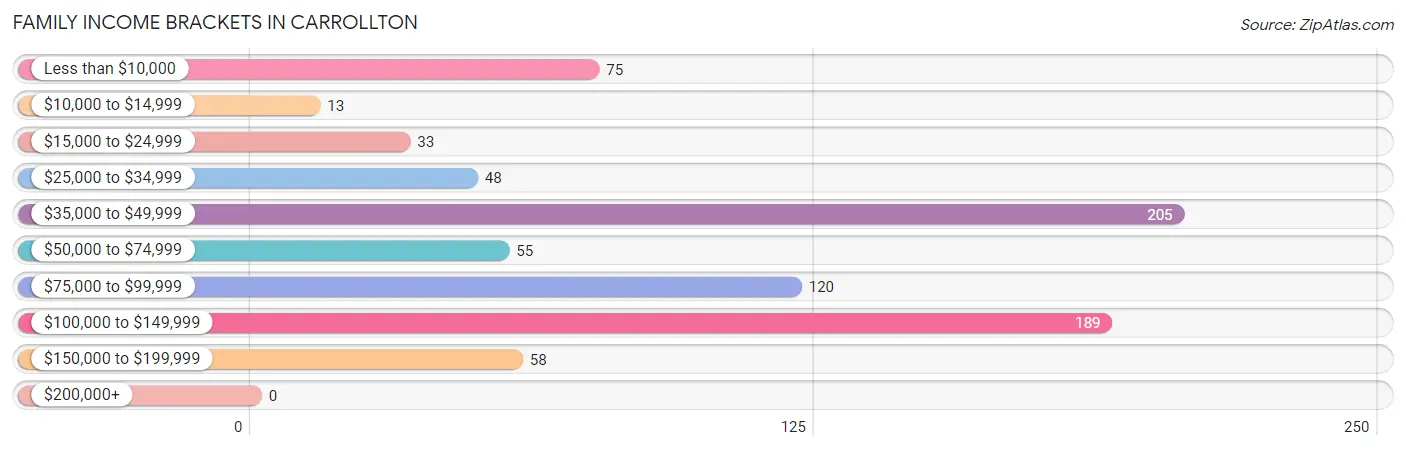
| Income Bracket | # Families | % Families |
| Less than $10,000 | 75 | 9.4% |
| $10,000 to $14,999 | 13 | 1.6% |
| $15,000 to $24,999 | 33 | 4.1% |
| $25,000 to $34,999 | 48 | 6.0% |
| $35,000 to $49,999 | 205 | 25.8% |
| $50,000 to $74,999 | 55 | 6.9% |
| $75,000 to $99,999 | 120 | 15.1% |
| $100,000 to $149,999 | 189 | 23.7% |
| $150,000 to $199,999 | 58 | 7.3% |
| $200,000+ | 0 | 0.0% |
Family Income by Famaliy Size in Carrollton
4-person families (195 | 24.5%) account for the highest median family income in Carrollton with $96,354 per family, while 4-person families (195 | 24.5%) have the highest median income of $24,088 per family member.
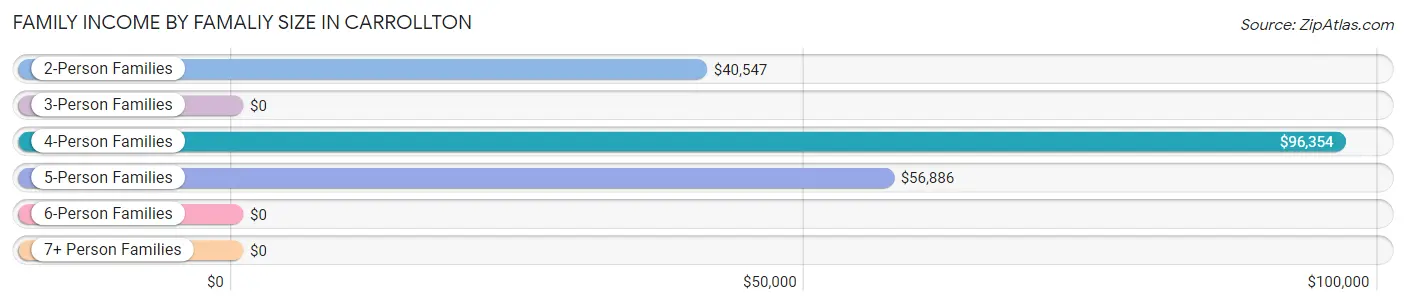
| Income Bracket | # Families | Median Income |
| 2-Person Families | 278 (34.9%) | $40,547 |
| 3-Person Families | 190 (23.9%) | $0 |
| 4-Person Families | 195 (24.5%) | $96,354 |
| 5-Person Families | 119 (14.9%) | $56,886 |
| 6-Person Families | 14 (1.8%) | $0 |
| 7+ Person Families | 0 (0.0%) | $0 |
| Total | 796 (100.0%) | $56,091 |
Family Income by Number of Earners in Carrollton
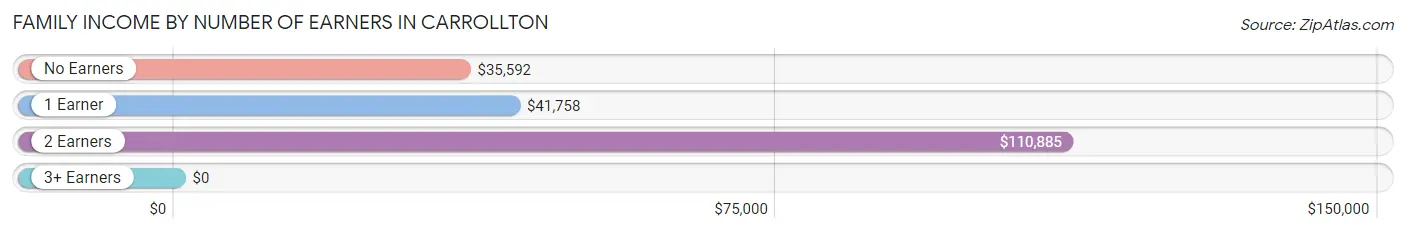
| Number of Earners | # Families | Median Income |
| No Earners | 97 (12.2%) | $35,592 |
| 1 Earner | 340 (42.7%) | $41,758 |
| 2 Earners | 261 (32.8%) | $110,885 |
| 3+ Earners | 98 (12.3%) | $0 |
| Total | 796 (100.0%) | $56,091 |
Household Income in Carrollton
Household Income Brackets in Carrollton
With 245 households falling in the category, the $35,000 to $49,999 income range is the most frequent in Carrollton, accounting for 17.3% of all households.
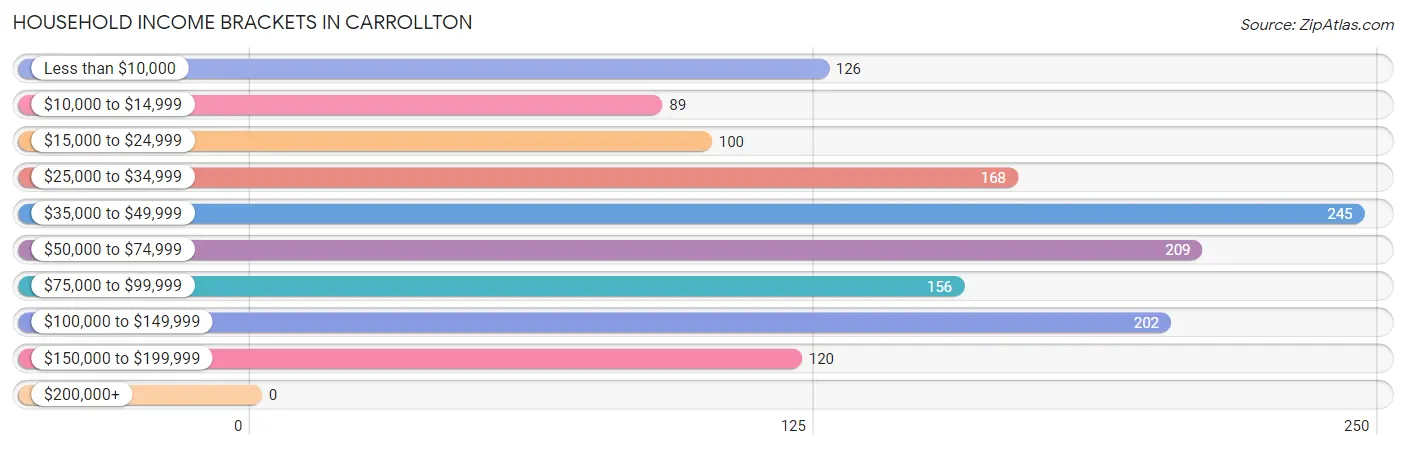
| Income Bracket | # Households | % Households |
| Less than $10,000 | 126 | 8.9% |
| $10,000 to $14,999 | 89 | 6.3% |
| $15,000 to $24,999 | 100 | 7.1% |
| $25,000 to $34,999 | 168 | 11.9% |
| $35,000 to $49,999 | 245 | 17.3% |
| $50,000 to $74,999 | 209 | 14.8% |
| $75,000 to $99,999 | 156 | 11.0% |
| $100,000 to $149,999 | 202 | 14.3% |
| $150,000 to $199,999 | 120 | 8.5% |
| $200,000+ | 0 | 0.0% |
Household Income by Householder Age in Carrollton
The median household income in Carrollton is $48,333, with the highest median household income of $95,556 found in the 45 to 64 years age bracket for the primary householder. A total of 496 households (35.1%) fall into this category. Meanwhile, the 15 to 24 years age bracket for the primary householder has the lowest median household income of $0, with 27 households (1.9%) in this group.
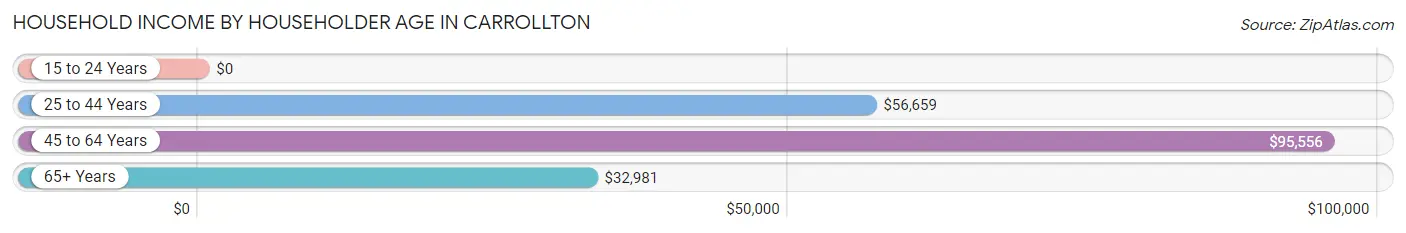
| Income Bracket | # Households | Median Income |
| 15 to 24 Years | 27 (1.9%) | $0 |
| 25 to 44 Years | 485 (34.3%) | $56,659 |
| 45 to 64 Years | 496 (35.1%) | $95,556 |
| 65+ Years | 406 (28.7%) | $32,981 |
| Total | 1,414 (100.0%) | $48,333 |
Poverty in Carrollton
Income Below Poverty by Sex and Age in Carrollton
With 10.8% poverty level for males and 14.4% for females among the residents of Carrollton, under 5 year old males and 45 to 54 year old females are the most vulnerable to poverty, with 67 males (75.3%) and 65 females (36.7%) in their respective age groups living below the poverty level.
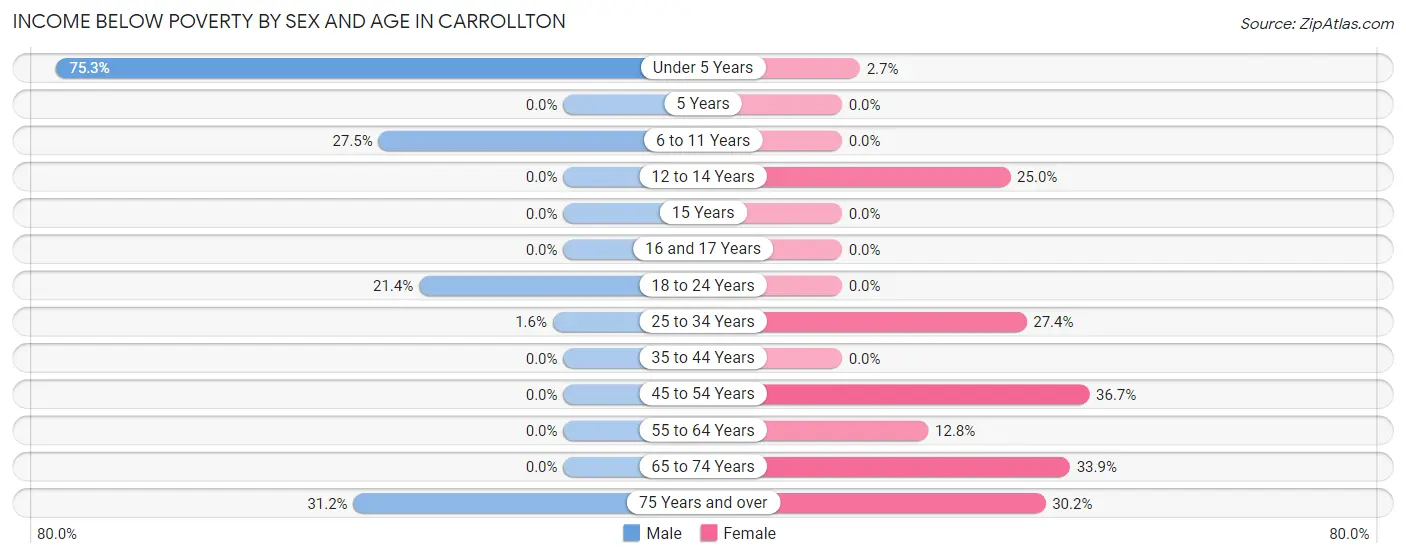
| Age Bracket | Male | Female |
| Under 5 Years | 67 (75.3%) | 7 (2.7%) |
| 5 Years | 0 (0.0%) | 0 (0.0%) |
| 6 to 11 Years | 98 (27.5%) | 0 (0.0%) |
| 12 to 14 Years | 0 (0.0%) | 18 (25.0%) |
| 15 Years | 0 (0.0%) | 0 (0.0%) |
| 16 and 17 Years | 0 (0.0%) | 0 (0.0%) |
| 18 to 24 Years | 15 (21.4%) | 0 (0.0%) |
| 25 to 34 Years | 5 (1.6%) | 43 (27.4%) |
| 35 to 44 Years | 0 (0.0%) | 0 (0.0%) |
| 45 to 54 Years | 0 (0.0%) | 65 (36.7%) |
| 55 to 64 Years | 0 (0.0%) | 30 (12.8%) |
| 65 to 74 Years | 0 (0.0%) | 65 (33.9%) |
| 75 Years and over | 24 (31.2%) | 29 (30.2%) |
| Total | 209 (10.8%) | 257 (14.4%) |
Income Above Poverty by Sex and Age in Carrollton
According to the poverty statistics in Carrollton, males aged 5 years and females aged 6 to 11 years are the age groups that are most secure financially, with 100.0% of males and 100.0% of females in these age groups living above the poverty line.
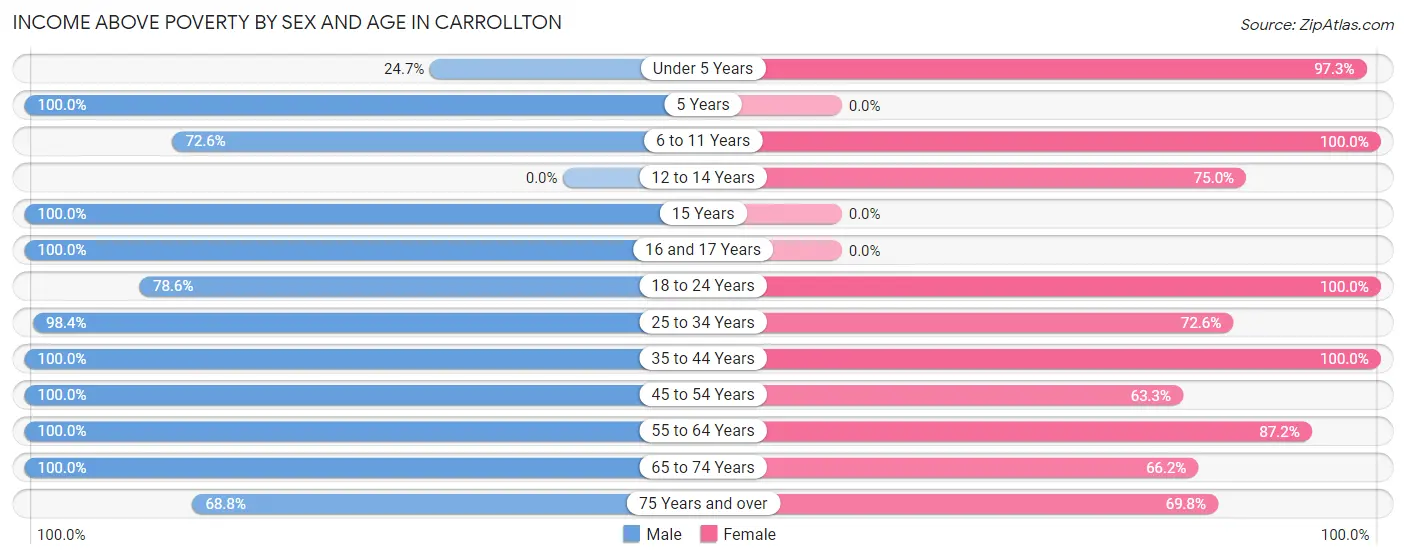
| Age Bracket | Male | Female |
| Under 5 Years | 22 (24.7%) | 256 (97.3%) |
| 5 Years | 88 (100.0%) | 0 (0.0%) |
| 6 to 11 Years | 259 (72.6%) | 262 (100.0%) |
| 12 to 14 Years | 0 (0.0%) | 54 (75.0%) |
| 15 Years | 167 (100.0%) | 0 (0.0%) |
| 16 and 17 Years | 52 (100.0%) | 0 (0.0%) |
| 18 to 24 Years | 55 (78.6%) | 88 (100.0%) |
| 25 to 34 Years | 313 (98.4%) | 114 (72.6%) |
| 35 to 44 Years | 232 (100.0%) | 245 (100.0%) |
| 45 to 54 Years | 106 (100.0%) | 112 (63.3%) |
| 55 to 64 Years | 240 (100.0%) | 204 (87.2%) |
| 65 to 74 Years | 145 (100.0%) | 127 (66.1%) |
| 75 Years and over | 53 (68.8%) | 67 (69.8%) |
| Total | 1,732 (89.2%) | 1,529 (85.6%) |
Income Below Poverty Among Married-Couple Families in Carrollton
The poverty statistics for married-couple families in Carrollton show that 1.5% or 7 of the total 467 families live below the poverty line. Families with no children have the highest poverty rate of 3.1%, comprising of 7 families. On the other hand, families with 1 or 2 children have the lowest poverty rate of 0.0%, which includes 0 families.
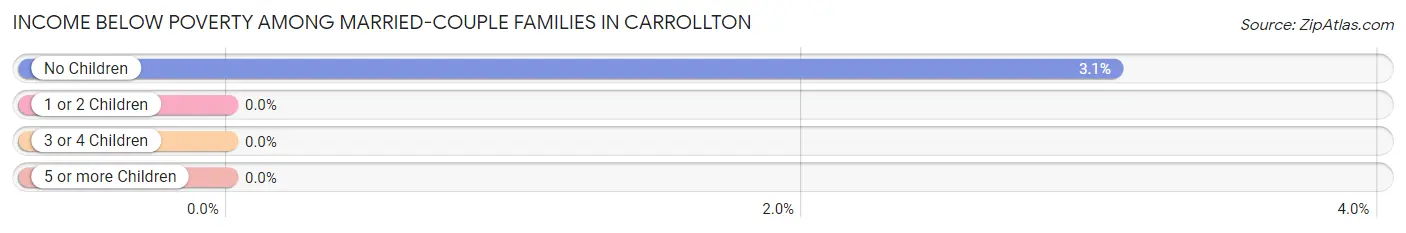
| Children | Above Poverty | Below Poverty |
| No Children | 220 (96.9%) | 7 (3.1%) |
| 1 or 2 Children | 107 (100.0%) | 0 (0.0%) |
| 3 or 4 Children | 133 (100.0%) | 0 (0.0%) |
| 5 or more Children | 0 (0.0%) | 0 (0.0%) |
| Total | 460 (98.5%) | 7 (1.5%) |
Income Below Poverty Among Single-Parent Households in Carrollton
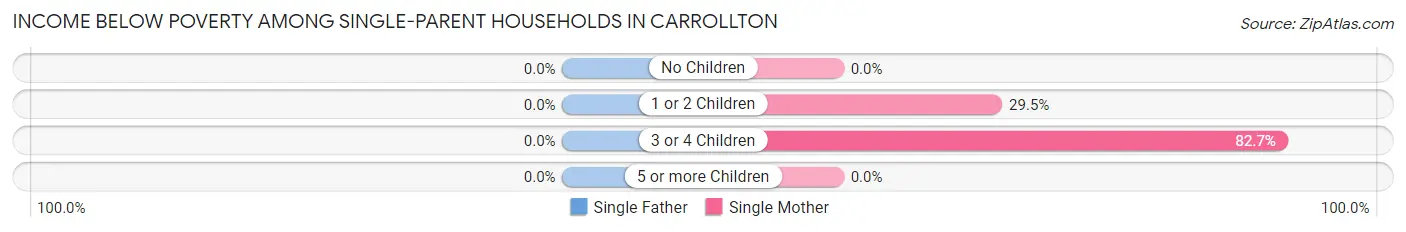
| Children | Single Father | Single Mother |
| No Children | 0 (0.0%) | 0 (0.0%) |
| 1 or 2 Children | 0 (0.0%) | 49 (29.5%) |
| 3 or 4 Children | 0 (0.0%) | 43 (82.7%) |
| 5 or more Children | 0 (0.0%) | 0 (0.0%) |
| Total | 0 (0.0%) | 92 (36.2%) |
Income Below Poverty Among Married-Couple vs Single-Parent Households in Carrollton
The poverty data for Carrollton shows that 7 of the married-couple family households (1.5%) and 92 of the single-parent households (28.0%) are living below the poverty level. Within the married-couple family households, those with no children have the highest poverty rate, with 7 households (3.1%) falling below the poverty line. Among the single-parent households, those with 3 or 4 children have the highest poverty rate, with 43 household (82.7%) living below poverty.
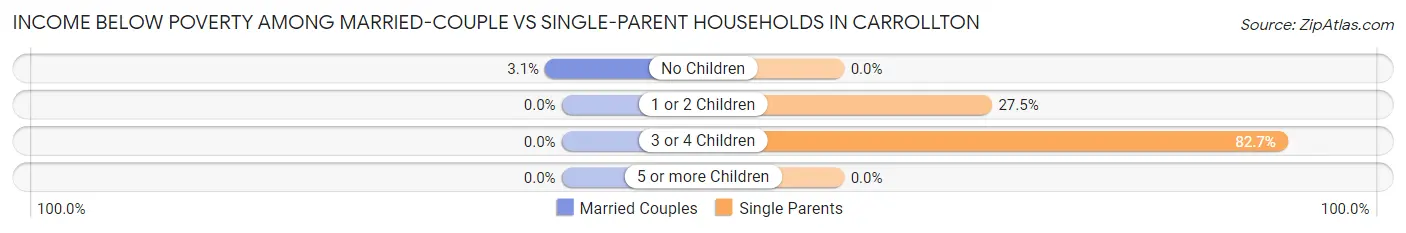
| Children | Married-Couple Families | Single-Parent Households |
| No Children | 7 (3.1%) | 0 (0.0%) |
| 1 or 2 Children | 0 (0.0%) | 49 (27.5%) |
| 3 or 4 Children | 0 (0.0%) | 43 (82.7%) |
| 5 or more Children | 0 (0.0%) | 0 (0.0%) |
| Total | 7 (1.5%) | 92 (28.0%) |
Race in Carrollton
The most populous races in Carrollton are White / Caucasian (3,274 | 84.2%), Hispanic or Latino (450 | 11.6%), and Some other Race (313 | 8.1%).
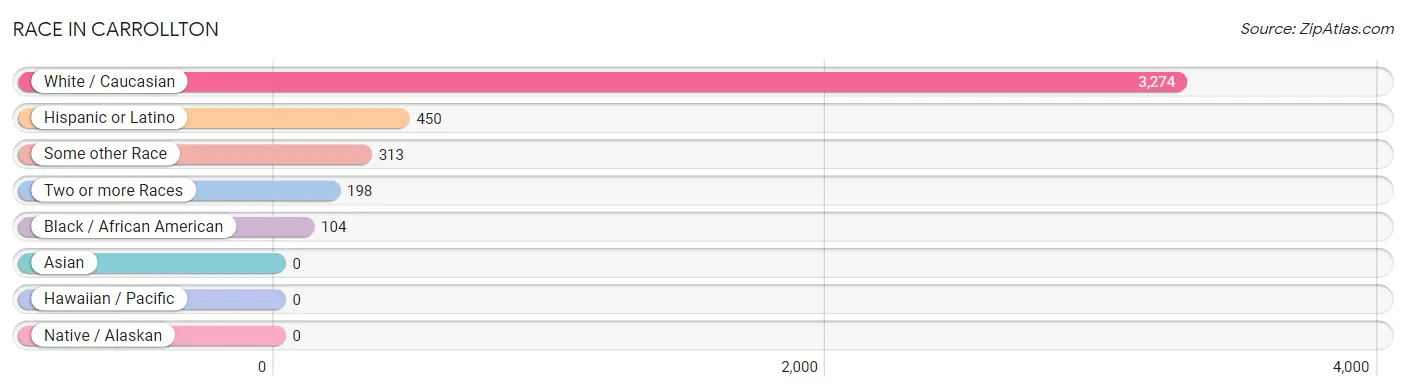
| Race | # Population | % Population |
| Asian | 0 | 0.0% |
| Black / African American | 104 | 2.7% |
| Hawaiian / Pacific | 0 | 0.0% |
| Hispanic or Latino | 450 | 11.6% |
| Native / Alaskan | 0 | 0.0% |
| White / Caucasian | 3,274 | 84.2% |
| Two or more Races | 198 | 5.1% |
| Some other Race | 313 | 8.1% |
| Total | 3,889 | 100.0% |
Ancestry in Carrollton
The most populous ancestries reported in Carrollton are American (580 | 14.9%), Mexican (450 | 11.6%), Irish (405 | 10.4%), German (378 | 9.7%), and English (319 | 8.2%), together accounting for 54.8% of all Carrollton residents.
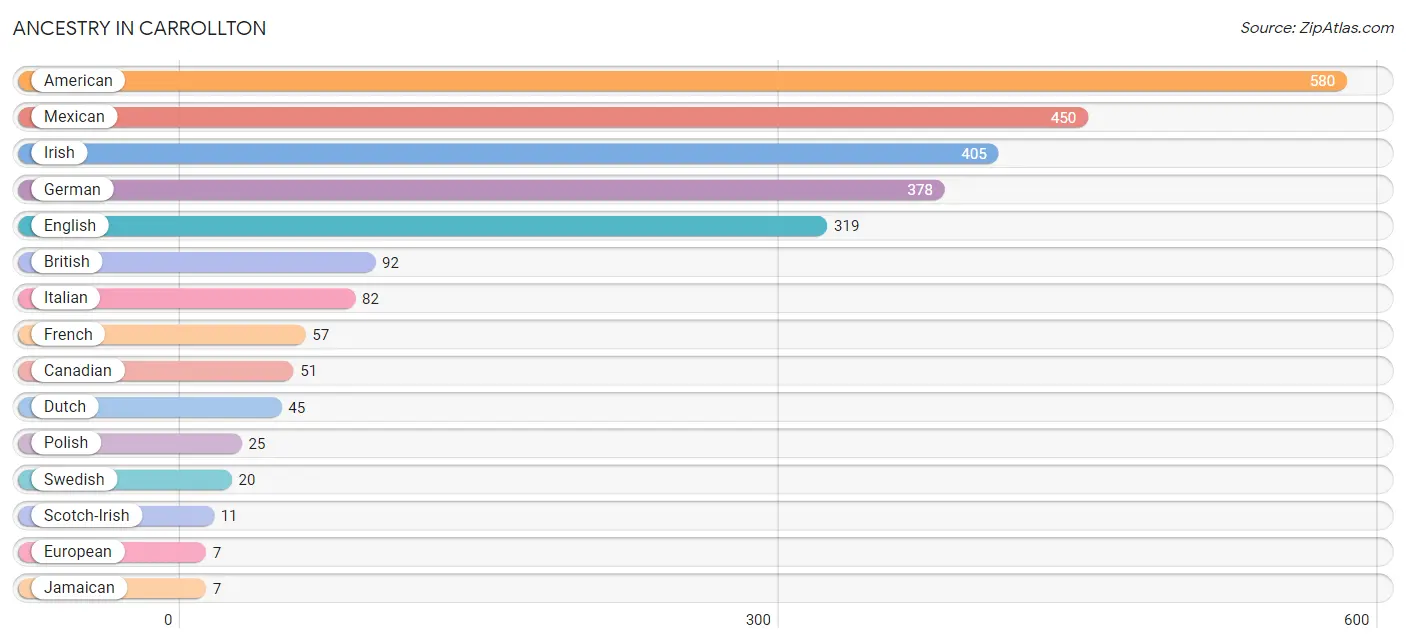
| Ancestry | # Population | % Population |
| American | 580 | 14.9% |
| British | 92 | 2.4% |
| Canadian | 51 | 1.3% |
| Dutch | 45 | 1.2% |
| English | 319 | 8.2% |
| European | 7 | 0.2% |
| French | 57 | 1.5% |
| German | 378 | 9.7% |
| Irish | 405 | 10.4% |
| Italian | 82 | 2.1% |
| Jamaican | 7 | 0.2% |
| Mexican | 450 | 11.6% |
| Polish | 25 | 0.6% |
| Scotch-Irish | 11 | 0.3% |
| Subsaharan African | 5 | 0.1% |
| Swedish | 20 | 0.5% | View All 16 Rows |
Immigrants in Carrollton
The most numerous immigrant groups reported in Carrollton came from Latin America (119 | 3.1%), Central America (112 | 2.9%), Mexico (112 | 2.9%), Caribbean (7 | 0.2%), and Jamaica (7 | 0.2%), together accounting for 9.2% of all Carrollton residents.
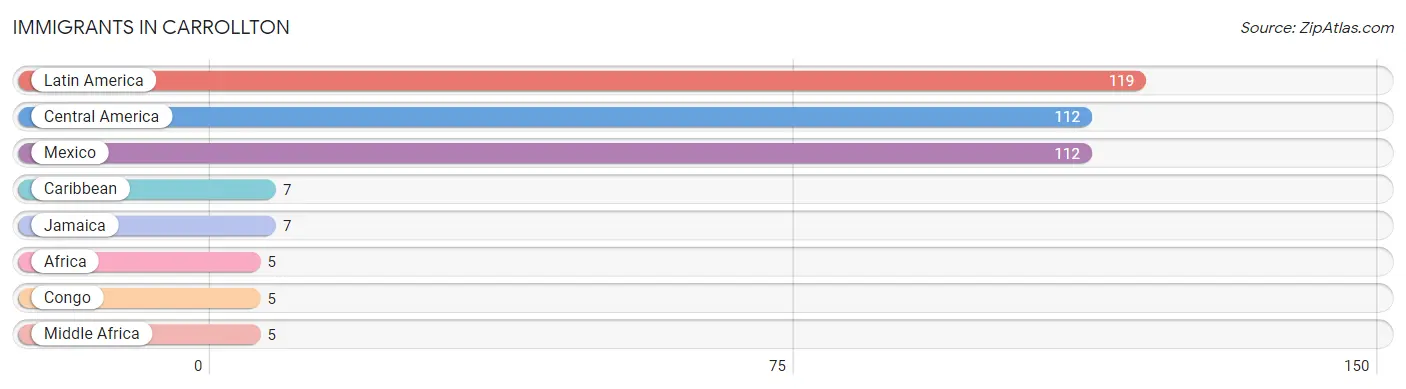
| Immigration Origin | # Population | % Population |
| Africa | 5 | 0.1% |
| Caribbean | 7 | 0.2% |
| Central America | 112 | 2.9% |
| Congo | 5 | 0.1% |
| Jamaica | 7 | 0.2% |
| Latin America | 119 | 3.1% |
| Mexico | 112 | 2.9% |
| Middle Africa | 5 | 0.1% | View All 8 Rows |
Sex and Age in Carrollton
Sex and Age in Carrollton
The most populous age groups in Carrollton are 5 to 9 Years (385 | 18.8%) for men and Under 5 Years (263 | 14.3%) for women.
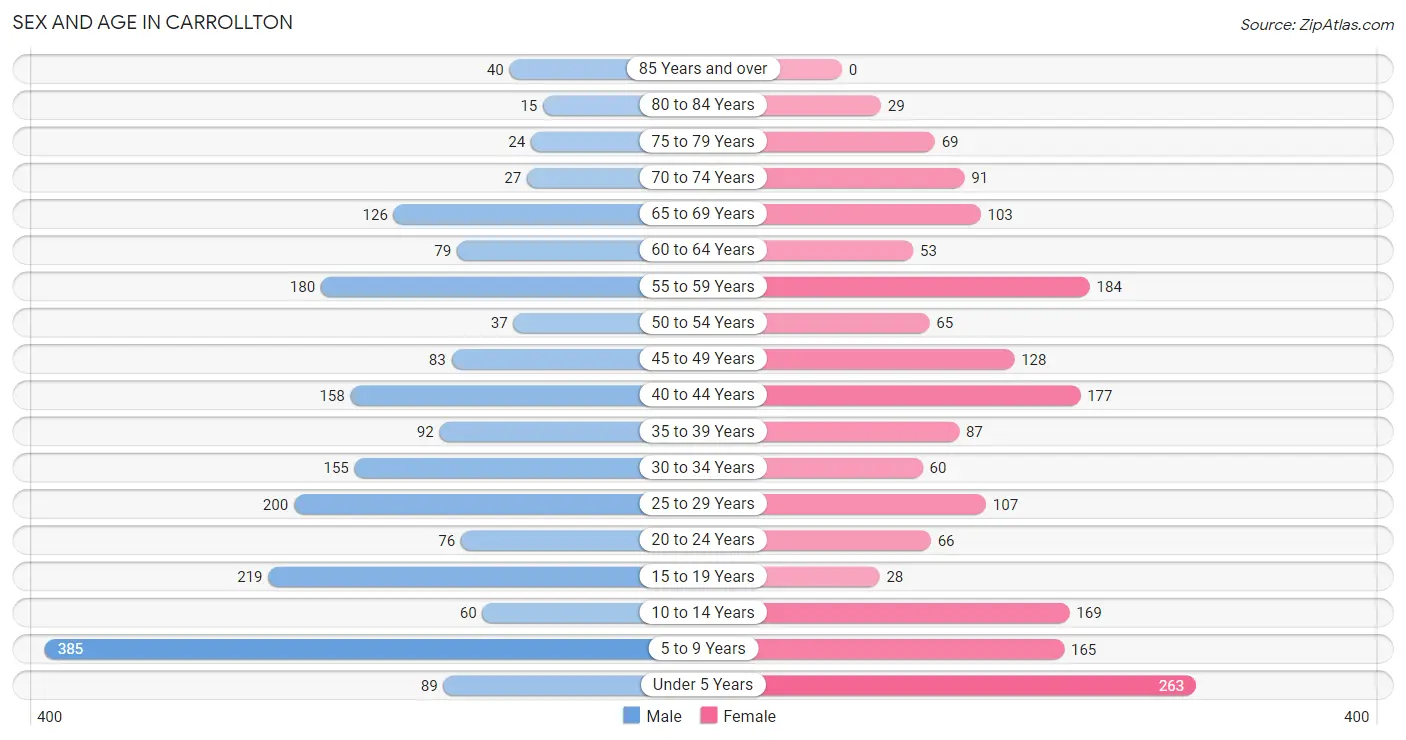
| Age Bracket | Male | Female |
| Under 5 Years | 89 (4.3%) | 263 (14.3%) |
| 5 to 9 Years | 385 (18.8%) | 165 (8.9%) |
| 10 to 14 Years | 60 (2.9%) | 169 (9.2%) |
| 15 to 19 Years | 219 (10.7%) | 28 (1.5%) |
| 20 to 24 Years | 76 (3.7%) | 66 (3.6%) |
| 25 to 29 Years | 200 (9.8%) | 107 (5.8%) |
| 30 to 34 Years | 155 (7.6%) | 60 (3.3%) |
| 35 to 39 Years | 92 (4.5%) | 87 (4.7%) |
| 40 to 44 Years | 158 (7.7%) | 177 (9.6%) |
| 45 to 49 Years | 83 (4.1%) | 128 (6.9%) |
| 50 to 54 Years | 37 (1.8%) | 65 (3.5%) |
| 55 to 59 Years | 180 (8.8%) | 184 (10.0%) |
| 60 to 64 Years | 79 (3.9%) | 53 (2.9%) |
| 65 to 69 Years | 126 (6.2%) | 103 (5.6%) |
| 70 to 74 Years | 27 (1.3%) | 91 (4.9%) |
| 75 to 79 Years | 24 (1.2%) | 69 (3.7%) |
| 80 to 84 Years | 15 (0.7%) | 29 (1.6%) |
| 85 Years and over | 40 (2.0%) | 0 (0.0%) |
| Total | 2,045 (100.0%) | 1,844 (100.0%) |
Families and Households in Carrollton
Median Family Size in Carrollton
The median family size in Carrollton is 3.73 persons per family, with married-couple families (467 | 58.7%) accounting for the largest median family size of 4.37 persons per family. On the other hand, single male/father families (75 | 9.4%) represent the smallest median family size with 2.05 persons per family.
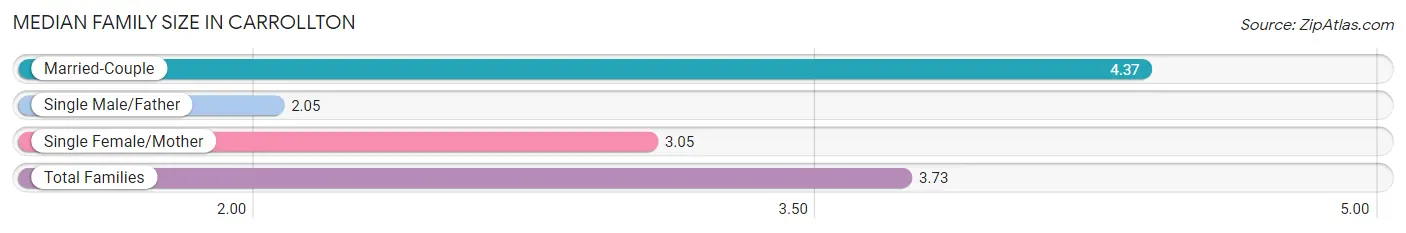
| Family Type | # Families | Family Size |
| Married-Couple | 467 (58.7%) | 4.37 |
| Single Male/Father | 75 (9.4%) | 2.05 |
| Single Female/Mother | 254 (31.9%) | 3.05 |
| Total Families | 796 (100.0%) | 3.73 |
Median Household Size in Carrollton
The median household size in Carrollton is 2.63 persons per household, with married-couple households (467 | 33.0%) accounting for the largest median household size of 4.37 persons per household. non-family households (618 | 43.7%) represent the smallest median household size with 1.21 persons per household.
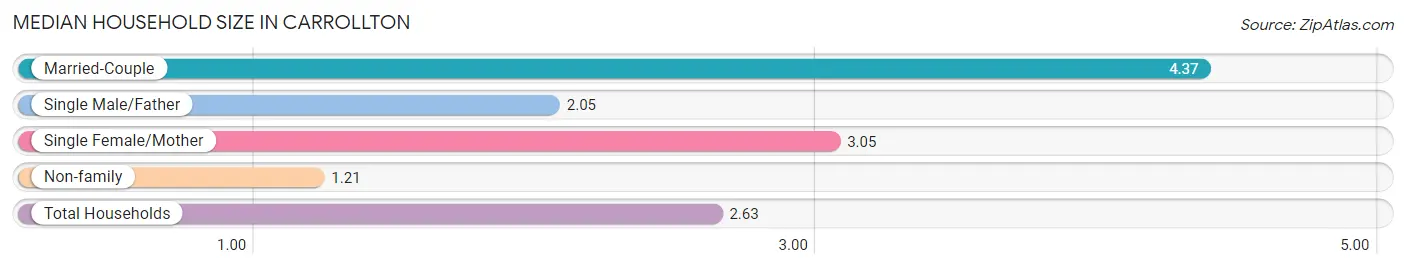
| Household Type | # Households | Household Size |
| Married-Couple | 467 (33.0%) | 4.37 |
| Single Male/Father | 75 (5.3%) | 2.05 |
| Single Female/Mother | 254 (18.0%) | 3.05 |
| Non-family | 618 (43.7%) | 1.21 |
| Total Households | 1,414 (100.0%) | 2.63 |
Household Size by Marriage Status in Carrollton
Out of a total of 1,414 households in Carrollton, 796 (56.3%) are family households, while 618 (43.7%) are nonfamily households. The most numerous type of family households are 2-person households, comprising 278, and the most common type of nonfamily households are 1-person households, comprising 451.
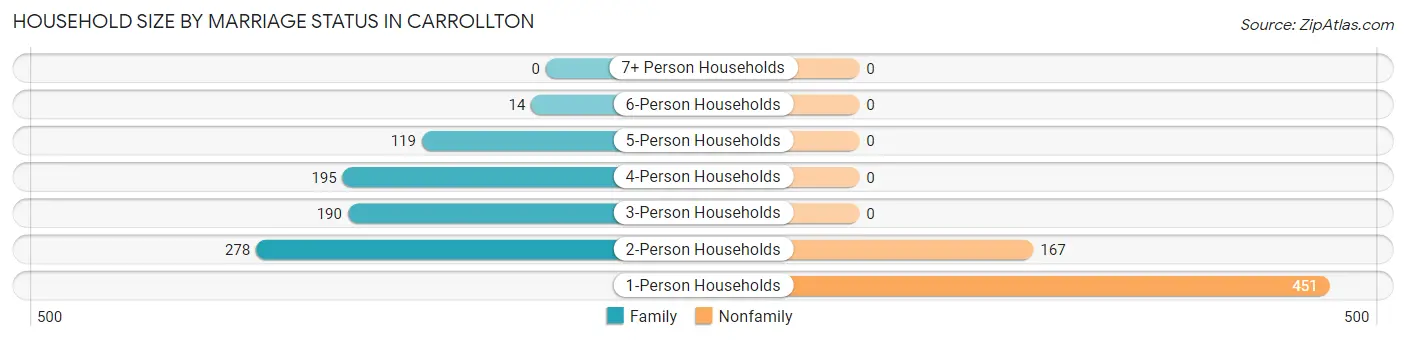
| Household Size | Family Households | Nonfamily Households |
| 1-Person Households | - | 451 (31.9%) |
| 2-Person Households | 278 (19.7%) | 167 (11.8%) |
| 3-Person Households | 190 (13.4%) | 0 (0.0%) |
| 4-Person Households | 195 (13.8%) | 0 (0.0%) |
| 5-Person Households | 119 (8.4%) | 0 (0.0%) |
| 6-Person Households | 14 (1.0%) | 0 (0.0%) |
| 7+ Person Households | 0 (0.0%) | 0 (0.0%) |
| Total | 796 (56.3%) | 618 (43.7%) |
Female Fertility in Carrollton
Fertility by Age in Carrollton
Average fertility rate in Carrollton is 29.0 births per 1,000 women. Women in the age bracket of 20 to 34 years have the highest fertility rate with 86.0 births per 1,000 women. Women in the age bracket of 20 to 34 years acount for 100.0% of all women with births.
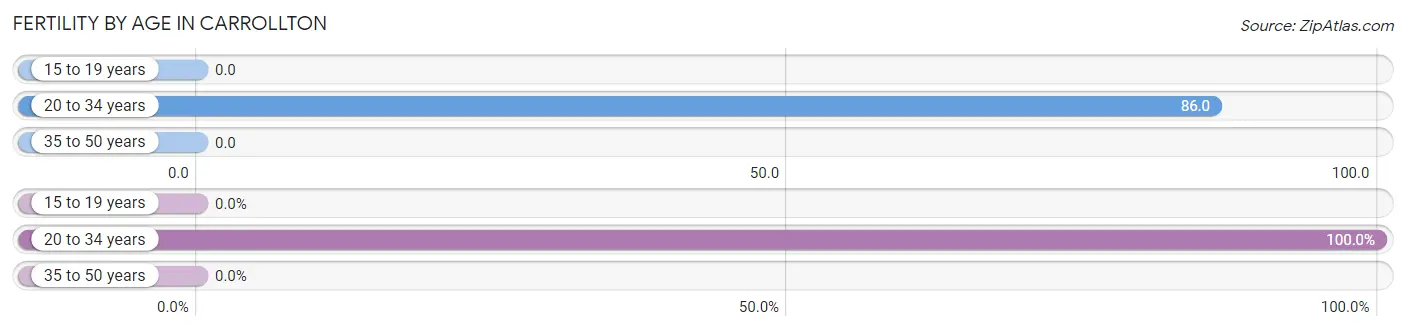
| Age Bracket | Women with Births | Births / 1,000 Women |
| 15 to 19 years | 0 (0.0%) | 0.0 |
| 20 to 34 years | 20 (100.0%) | 86.0 |
| 35 to 50 years | 0 (0.0%) | 0.0 |
| Total | 20 (100.0%) | 29.0 |
Fertility by Age by Marriage Status in Carrollton
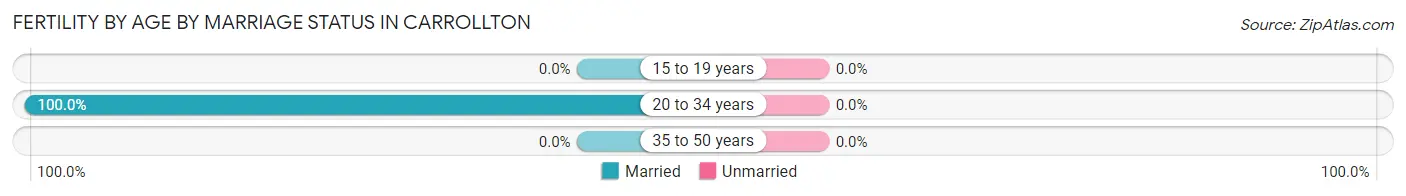
| Age Bracket | Married | Unmarried |
| 15 to 19 years | 0 (0.0%) | 0 (0.0%) |
| 20 to 34 years | 20 (100.0%) | 0 (0.0%) |
| 35 to 50 years | 0 (0.0%) | 0 (0.0%) |
| Total | 20 (100.0%) | 0 (0.0%) |
Fertility by Education in Carrollton
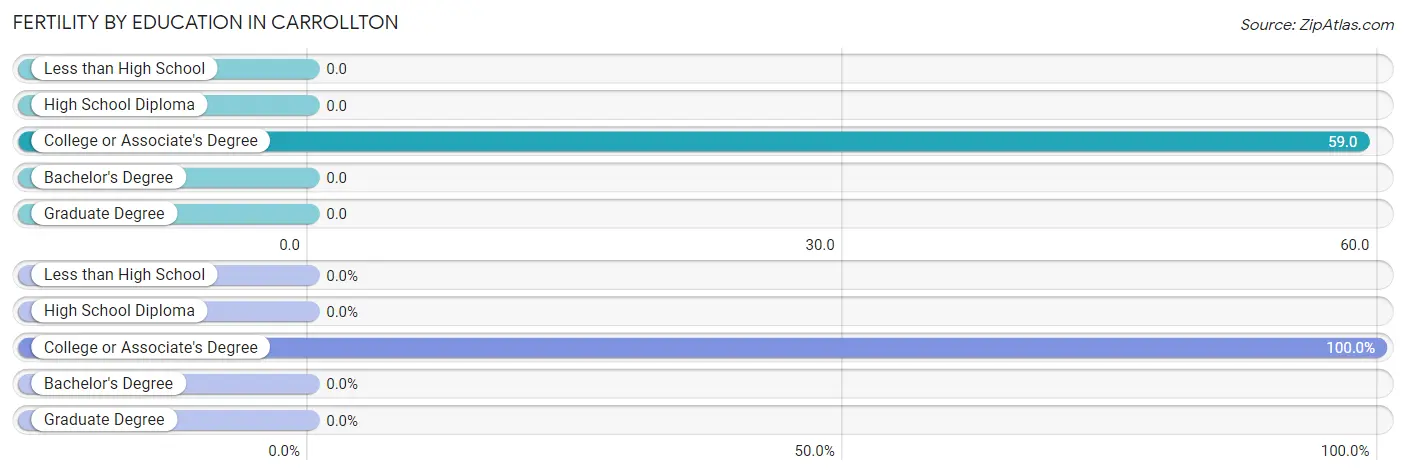
| Educational Attainment | Women with Births | Births / 1,000 Women |
| Less than High School | 0 (0.0%) | 0.0 |
| High School Diploma | 0 (0.0%) | 0.0 |
| College or Associate's Degree | 20 (100.0%) | 59.0 |
| Bachelor's Degree | 0 (0.0%) | 0.0 |
| Graduate Degree | 0 (0.0%) | 0.0 |
| Total | 20 (100.0%) | 29.0 |
Fertility by Education by Marriage Status in Carrollton
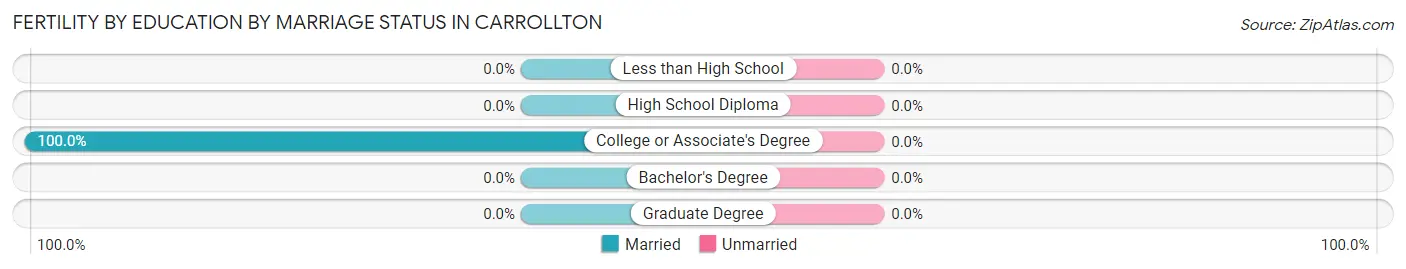
| Educational Attainment | Married | Unmarried |
| Less than High School | 0 (0.0%) | 0 (0.0%) |
| High School Diploma | 0 (0.0%) | 0 (0.0%) |
| College or Associate's Degree | 20 (100.0%) | 0 (0.0%) |
| Bachelor's Degree | 0 (0.0%) | 0 (0.0%) |
| Graduate Degree | 0 (0.0%) | 0 (0.0%) |
| Total | 20 (100.0%) | 0 (0.0%) |
Employment Characteristics in Carrollton
Employment by Class of Employer in Carrollton
Among the 1,352 employed individuals in Carrollton, private company employees (996 | 73.7%), local government employees (127 | 9.4%), and not-for-profit organizations (91 | 6.7%) make up the most common classes of employment.
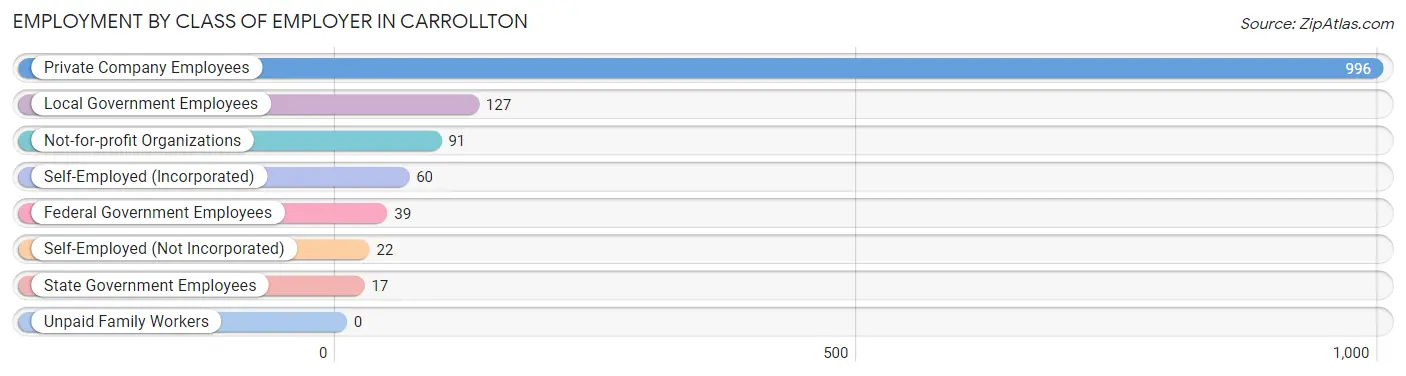
| Employer Class | # Employees | % Employees |
| Private Company Employees | 996 | 73.7% |
| Self-Employed (Incorporated) | 60 | 4.4% |
| Self-Employed (Not Incorporated) | 22 | 1.6% |
| Not-for-profit Organizations | 91 | 6.7% |
| Local Government Employees | 127 | 9.4% |
| State Government Employees | 17 | 1.3% |
| Federal Government Employees | 39 | 2.9% |
| Unpaid Family Workers | 0 | 0.0% |
| Total | 1,352 | 100.0% |
Employment Status by Age in Carrollton
According to the labor force statistics for Carrollton, out of the total population over 16 years of age (2,591), 56.7% or 1,469 individuals are in the labor force, with 8.0% or 118 of them unemployed. The age group with the highest labor force participation rate is 30 to 34 years, with 86.5% or 186 individuals in the labor force. Within the labor force, the 25 to 29 years age range has the highest percentage of unemployed individuals, with 50.0% or 112 of them being unemployed.
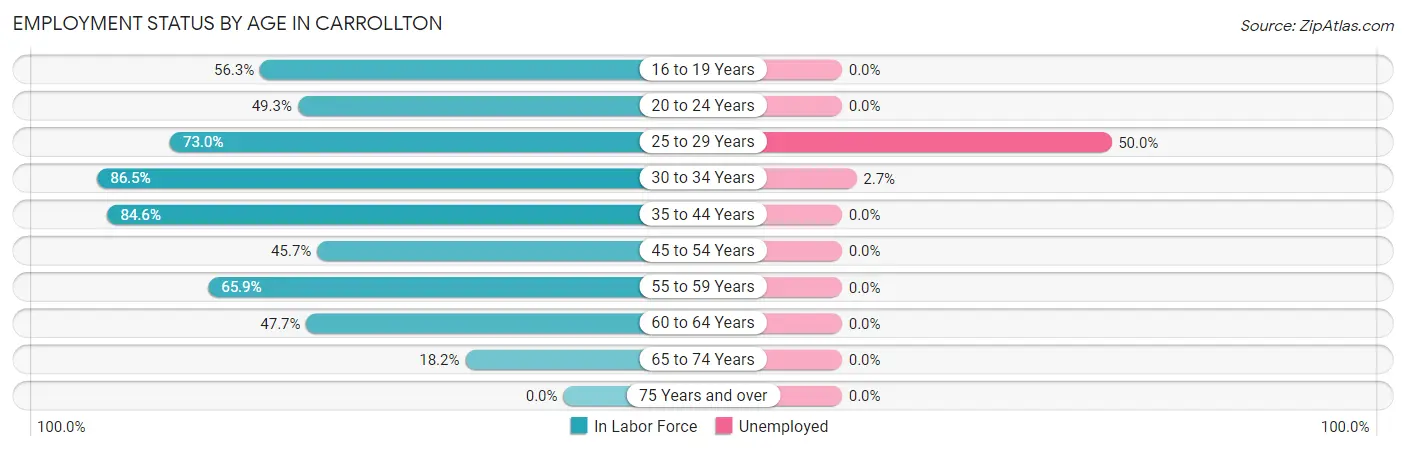
| Age Bracket | In Labor Force | Unemployed |
| 16 to 19 Years | 45 (56.3%) | 0 (0.0%) |
| 20 to 24 Years | 70 (49.3%) | 0 (0.0%) |
| 25 to 29 Years | 224 (73.0%) | 112 (50.0%) |
| 30 to 34 Years | 186 (86.5%) | 5 (2.7%) |
| 35 to 44 Years | 435 (84.6%) | 0 (0.0%) |
| 45 to 54 Years | 143 (45.7%) | 0 (0.0%) |
| 55 to 59 Years | 240 (65.9%) | 0 (0.0%) |
| 60 to 64 Years | 63 (47.7%) | 0 (0.0%) |
| 65 to 74 Years | 63 (18.2%) | 0 (0.0%) |
| 75 Years and over | 0 (0.0%) | 0 (0.0%) |
| Total | 1,469 (56.7%) | 118 (8.0%) |
Employment Status by Educational Attainment in Carrollton
According to labor force statistics for Carrollton, 70.0% of individuals (1,292) out of the total population between 25 and 64 years of age (1,845) are in the labor force, with 9.1% or 118 of them being unemployed. The group with the highest labor force participation rate are those with the educational attainment of bachelor's degree or higher, with 100.0% or 29 individuals in the labor force. Within the labor force, individuals with college / associate degree education have the highest percentage of unemployment, with 17.7% or 112 of them being unemployed.
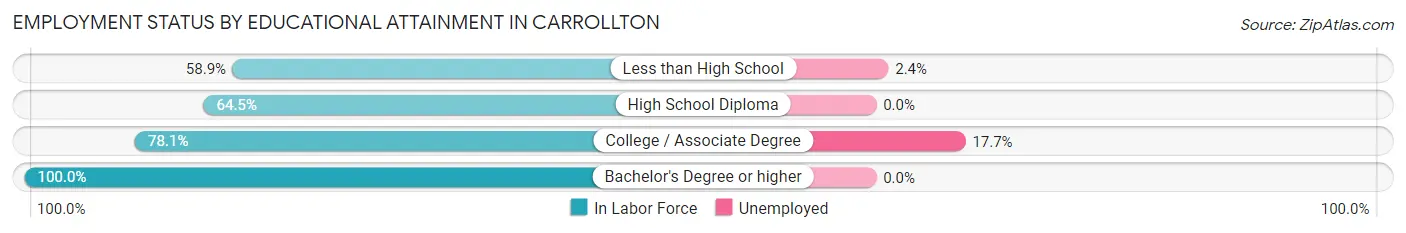
| Educational Attainment | In Labor Force | Unemployed |
| Less than High School | 205 (58.9%) | 8 (2.4%) |
| High School Diploma | 426 (64.5%) | 0 (0.0%) |
| College / Associate Degree | 631 (78.1%) | 143 (17.7%) |
| Bachelor's Degree or higher | 29 (100.0%) | 0 (0.0%) |
| Total | 1,292 (70.0%) | 168 (9.1%) |
Employment Occupations by Sex in Carrollton
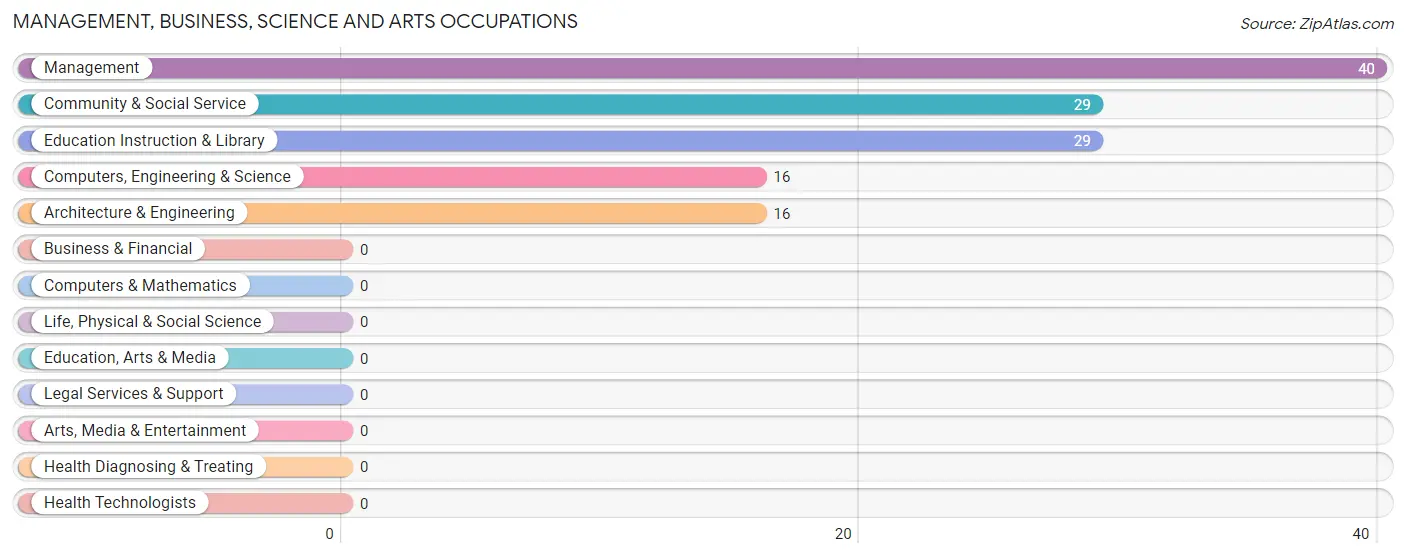
Management, Business, Science and Arts Occupations
The most common Management, Business, Science and Arts occupations in Carrollton are Management (40 | 3.0%), Community & Social Service (29 | 2.1%), Education Instruction & Library (29 | 2.1%), Computers, Engineering & Science (16 | 1.2%), and Architecture & Engineering (16 | 1.2%).
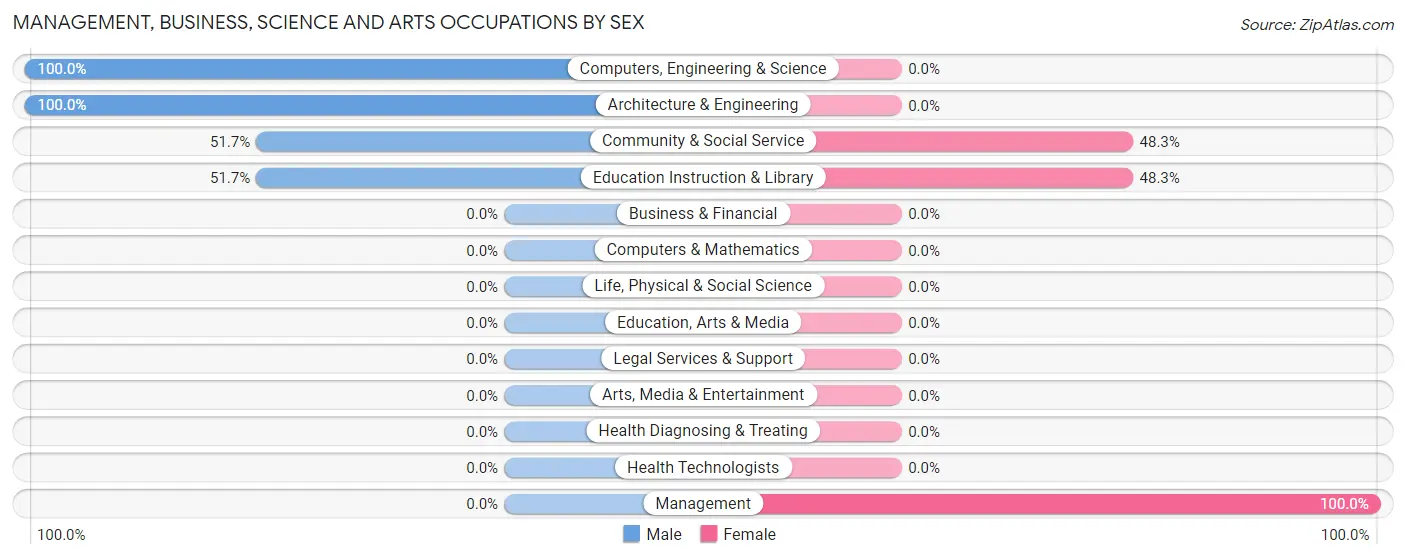
Management, Business, Science and Arts Occupations by Sex
Within the Management, Business, Science and Arts occupations in Carrollton, the most male-oriented occupations are Computers, Engineering & Science (100.0%), Architecture & Engineering (100.0%), and Community & Social Service (51.7%), while the most female-oriented occupations are Management (100.0%), Community & Social Service (48.3%), and Education Instruction & Library (48.3%).
| Occupation | Male | Female |
| Management | 0 (0.0%) | 40 (100.0%) |
| Business & Financial | 0 (0.0%) | 0 (0.0%) |
| Computers, Engineering & Science | 16 (100.0%) | 0 (0.0%) |
| Computers & Mathematics | 0 (0.0%) | 0 (0.0%) |
| Architecture & Engineering | 16 (100.0%) | 0 (0.0%) |
| Life, Physical & Social Science | 0 (0.0%) | 0 (0.0%) |
| Community & Social Service | 15 (51.7%) | 14 (48.3%) |
| Education, Arts & Media | 0 (0.0%) | 0 (0.0%) |
| Legal Services & Support | 0 (0.0%) | 0 (0.0%) |
| Education Instruction & Library | 15 (51.7%) | 14 (48.3%) |
| Arts, Media & Entertainment | 0 (0.0%) | 0 (0.0%) |
| Health Diagnosing & Treating | 0 (0.0%) | 0 (0.0%) |
| Health Technologists | 0 (0.0%) | 0 (0.0%) |
| Total (Category) | 31 (36.5%) | 54 (63.5%) |
| Total (Overall) | 757 (56.0%) | 595 (44.0%) |
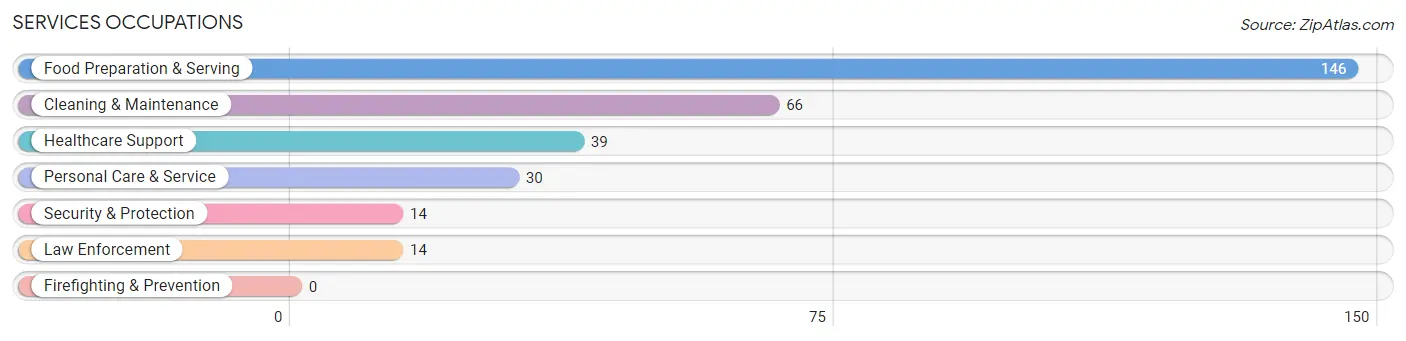
Services Occupations
The most common Services occupations in Carrollton are Food Preparation & Serving (146 | 10.8%), Cleaning & Maintenance (66 | 4.9%), Healthcare Support (39 | 2.9%), Personal Care & Service (30 | 2.2%), and Security & Protection (14 | 1.0%).
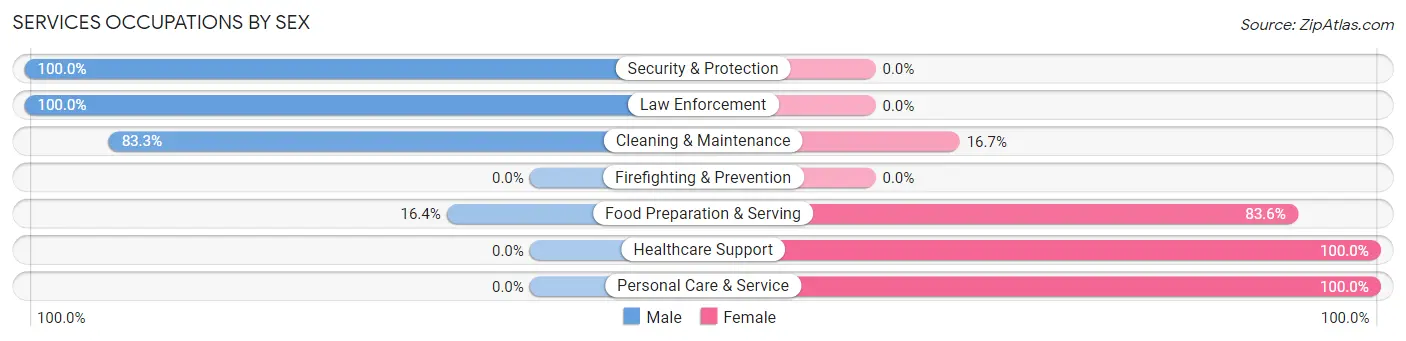
Services Occupations by Sex
Within the Services occupations in Carrollton, the most male-oriented occupations are Security & Protection (100.0%), Law Enforcement (100.0%), and Cleaning & Maintenance (83.3%), while the most female-oriented occupations are Healthcare Support (100.0%), Personal Care & Service (100.0%), and Food Preparation & Serving (83.6%).
| Occupation | Male | Female |
| Healthcare Support | 0 (0.0%) | 39 (100.0%) |
| Security & Protection | 14 (100.0%) | 0 (0.0%) |
| Firefighting & Prevention | 0 (0.0%) | 0 (0.0%) |
| Law Enforcement | 14 (100.0%) | 0 (0.0%) |
| Food Preparation & Serving | 24 (16.4%) | 122 (83.6%) |
| Cleaning & Maintenance | 55 (83.3%) | 11 (16.7%) |
| Personal Care & Service | 0 (0.0%) | 30 (100.0%) |
| Total (Category) | 93 (31.5%) | 202 (68.5%) |
| Total (Overall) | 757 (56.0%) | 595 (44.0%) |
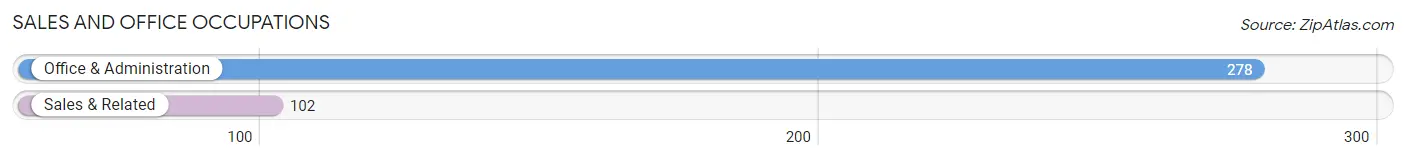
Sales and Office Occupations
The most common Sales and Office occupations in Carrollton are Office & Administration (278 | 20.6%), and Sales & Related (102 | 7.5%).
Sales and Office Occupations by Sex
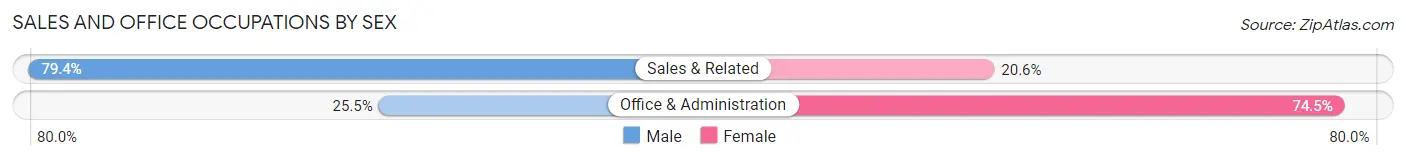
| Occupation | Male | Female |
| Sales & Related | 81 (79.4%) | 21 (20.6%) |
| Office & Administration | 71 (25.5%) | 207 (74.5%) |
| Total (Category) | 152 (40.0%) | 228 (60.0%) |
| Total (Overall) | 757 (56.0%) | 595 (44.0%) |
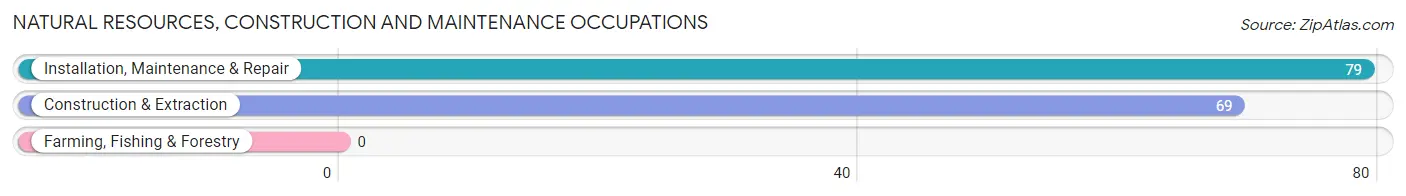
Natural Resources, Construction and Maintenance Occupations
The most common Natural Resources, Construction and Maintenance occupations in Carrollton are Installation, Maintenance & Repair (79 | 5.8%), and Construction & Extraction (69 | 5.1%).
Natural Resources, Construction and Maintenance Occupations by Sex
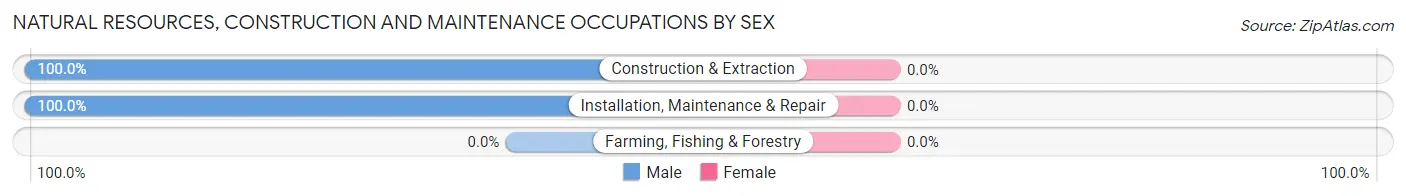
| Occupation | Male | Female |
| Farming, Fishing & Forestry | 0 (0.0%) | 0 (0.0%) |
| Construction & Extraction | 69 (100.0%) | 0 (0.0%) |
| Installation, Maintenance & Repair | 79 (100.0%) | 0 (0.0%) |
| Total (Category) | 148 (100.0%) | 0 (0.0%) |
| Total (Overall) | 757 (56.0%) | 595 (44.0%) |
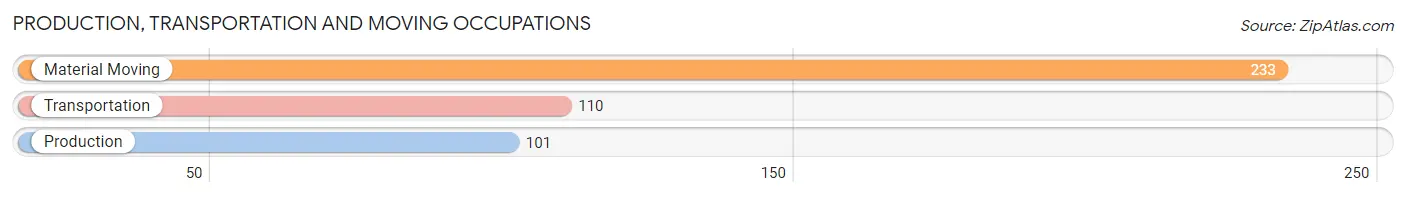
Production, Transportation and Moving Occupations
The most common Production, Transportation and Moving occupations in Carrollton are Material Moving (233 | 17.2%), Transportation (110 | 8.1%), and Production (101 | 7.5%).
Production, Transportation and Moving Occupations by Sex
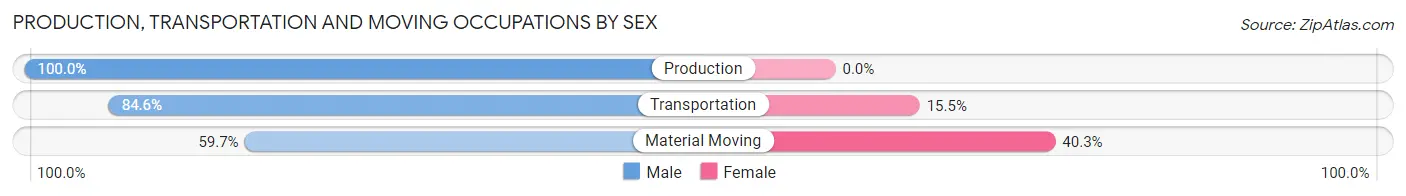
| Occupation | Male | Female |
| Production | 101 (100.0%) | 0 (0.0%) |
| Transportation | 93 (84.6%) | 17 (15.4%) |
| Material Moving | 139 (59.7%) | 94 (40.3%) |
| Total (Category) | 333 (75.0%) | 111 (25.0%) |
| Total (Overall) | 757 (56.0%) | 595 (44.0%) |
Employment Industries by Sex in Carrollton
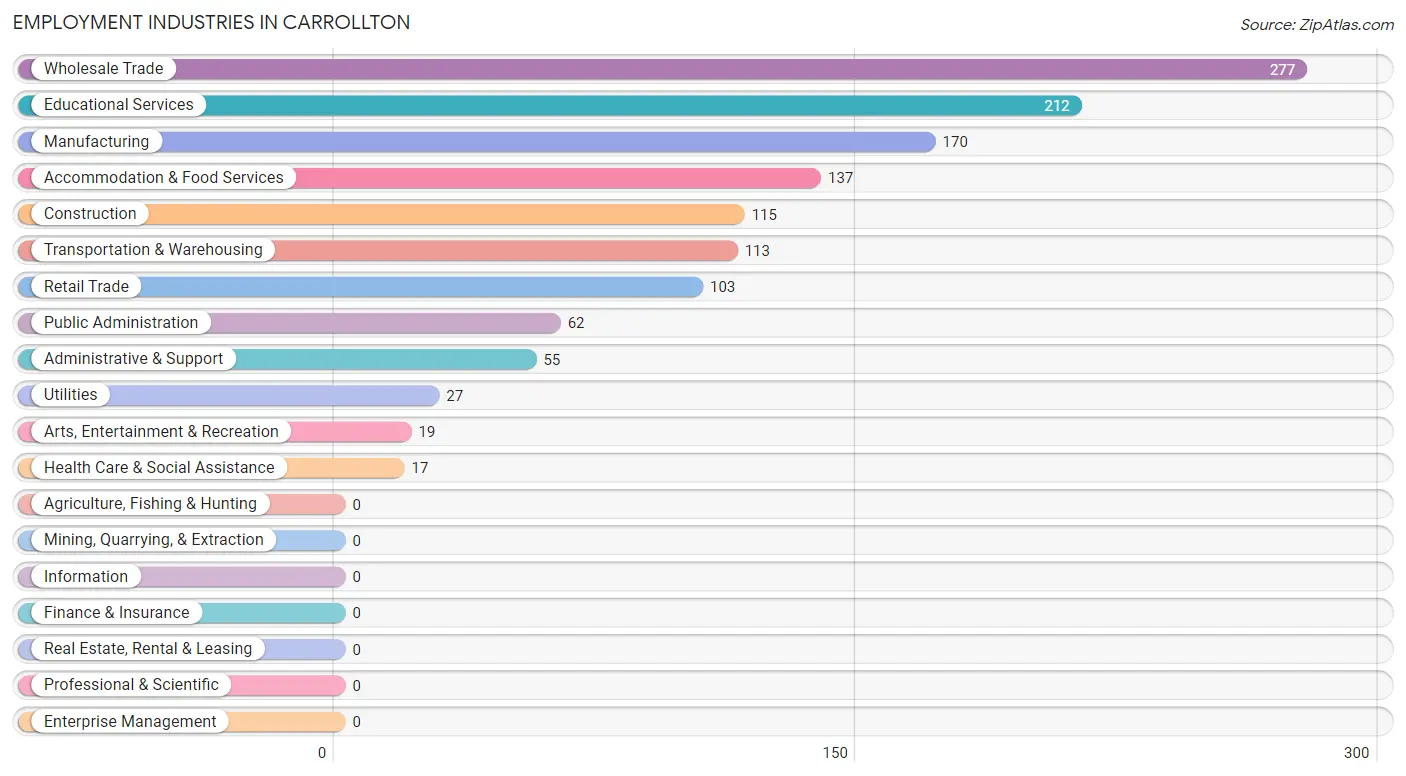
Employment Industries in Carrollton
The major employment industries in Carrollton include Wholesale Trade (277 | 20.5%), Educational Services (212 | 15.7%), Manufacturing (170 | 12.6%), Accommodation & Food Services (137 | 10.1%), and Construction (115 | 8.5%).
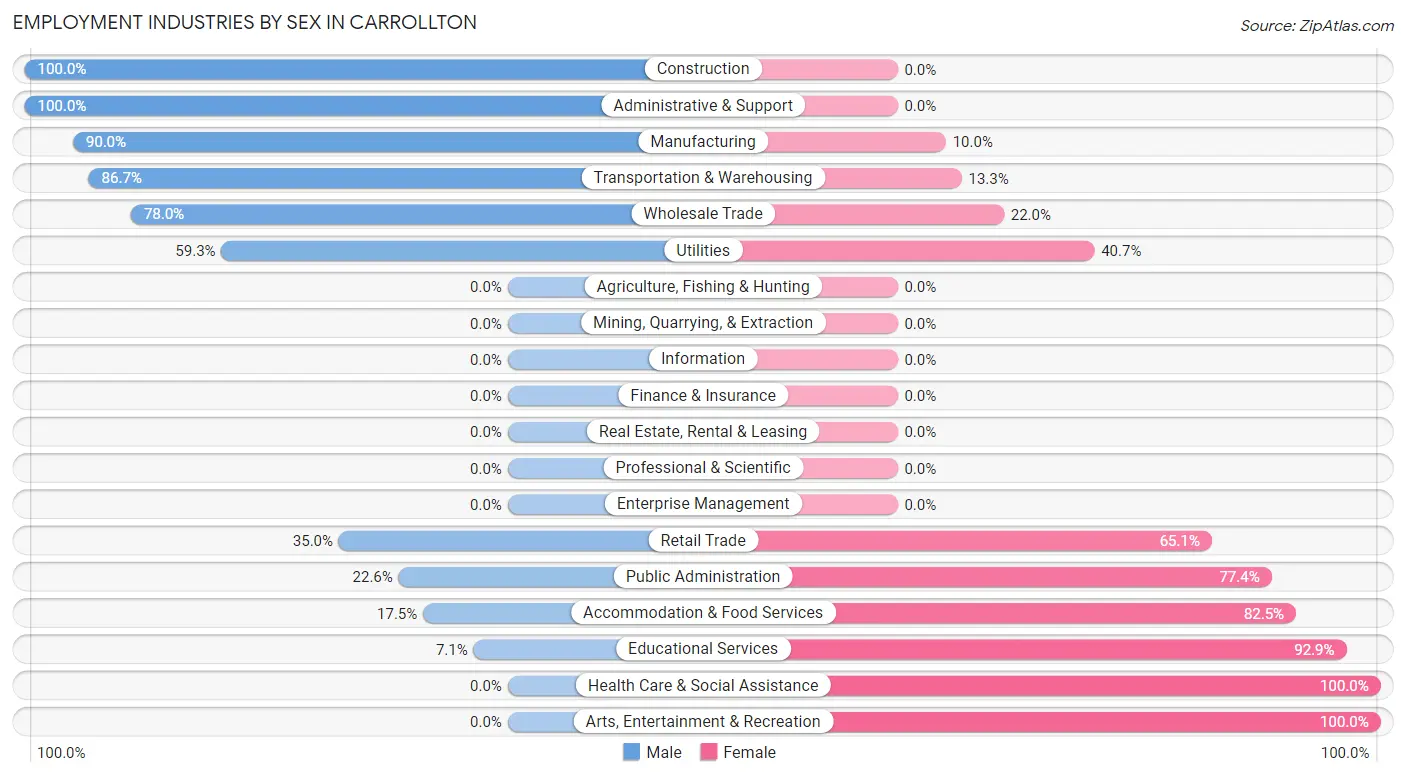
Employment Industries by Sex in Carrollton
The Carrollton industries that see more men than women are Construction (100.0%), Administrative & Support (100.0%), and Manufacturing (90.0%), whereas the industries that tend to have a higher number of women are Health Care & Social Assistance (100.0%), Arts, Entertainment & Recreation (100.0%), and Educational Services (92.9%).
| Industry | Male | Female |
| Agriculture, Fishing & Hunting | 0 (0.0%) | 0 (0.0%) |
| Mining, Quarrying, & Extraction | 0 (0.0%) | 0 (0.0%) |
| Construction | 115 (100.0%) | 0 (0.0%) |
| Manufacturing | 153 (90.0%) | 17 (10.0%) |
| Wholesale Trade | 216 (78.0%) | 61 (22.0%) |
| Retail Trade | 36 (34.9%) | 67 (65.0%) |
| Transportation & Warehousing | 98 (86.7%) | 15 (13.3%) |
| Utilities | 16 (59.3%) | 11 (40.7%) |
| Information | 0 (0.0%) | 0 (0.0%) |
| Finance & Insurance | 0 (0.0%) | 0 (0.0%) |
| Real Estate, Rental & Leasing | 0 (0.0%) | 0 (0.0%) |
| Professional & Scientific | 0 (0.0%) | 0 (0.0%) |
| Enterprise Management | 0 (0.0%) | 0 (0.0%) |
| Administrative & Support | 55 (100.0%) | 0 (0.0%) |
| Educational Services | 15 (7.1%) | 197 (92.9%) |
| Health Care & Social Assistance | 0 (0.0%) | 17 (100.0%) |
| Arts, Entertainment & Recreation | 0 (0.0%) | 19 (100.0%) |
| Accommodation & Food Services | 24 (17.5%) | 113 (82.5%) |
| Public Administration | 14 (22.6%) | 48 (77.4%) |
| Total | 757 (56.0%) | 595 (44.0%) |
Education in Carrollton
School Enrollment in Carrollton
The most common levels of schooling among the 1,264 students in Carrollton are elementary school (439 | 34.7%), high school (230 | 18.2%), and middle school (182 | 14.4%).
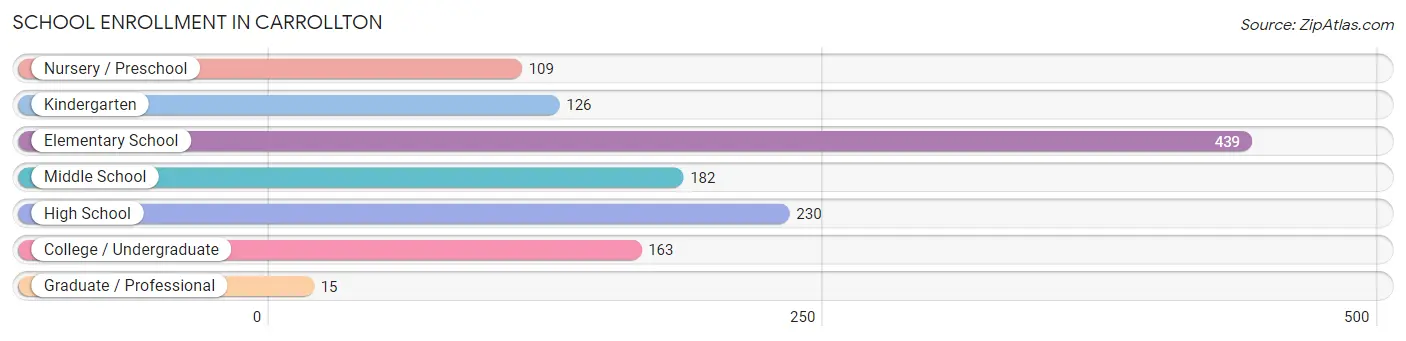
| School Level | # Students | % Students |
| Nursery / Preschool | 109 | 8.6% |
| Kindergarten | 126 | 10.0% |
| Elementary School | 439 | 34.7% |
| Middle School | 182 | 14.4% |
| High School | 230 | 18.2% |
| College / Undergraduate | 163 | 12.9% |
| Graduate / Professional | 15 | 1.2% |
| Total | 1,264 | 100.0% |
School Enrollment by Age by Funding Source in Carrollton
Out of a total of 1,264 students who are enrolled in schools in Carrollton, 70 (5.5%) attend a private institution, while the remaining 1,194 (94.5%) are enrolled in public schools. The age group of 25 to 34 year olds has the highest likelihood of being enrolled in private schools, with 15 (11.8% in the age bracket) enrolled. Conversely, the age group of 3 to 4 year olds has the lowest likelihood of being enrolled in a private school, with 109 (100.0% in the age bracket) attending a public institution.
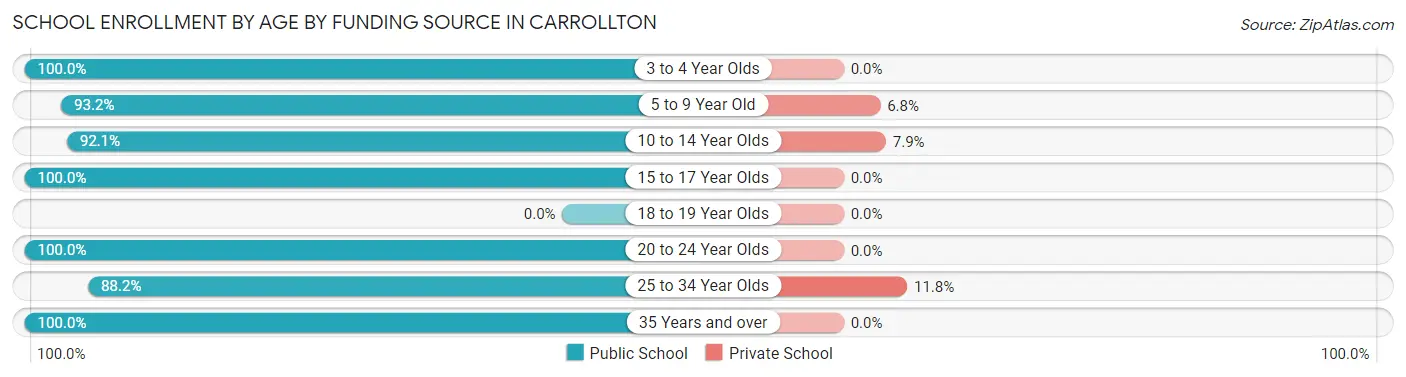
| Age Bracket | Public School | Private School |
| 3 to 4 Year Olds | 109 (100.0%) | 0 (0.0%) |
| 5 to 9 Year Old | 493 (93.2%) | 36 (6.8%) |
| 10 to 14 Year Olds | 211 (92.1%) | 18 (7.9%) |
| 15 to 17 Year Olds | 219 (100.0%) | 0 (0.0%) |
| 18 to 19 Year Olds | 0 (0.0%) | 0 (0.0%) |
| 20 to 24 Year Olds | 15 (100.0%) | 0 (0.0%) |
| 25 to 34 Year Olds | 112 (88.2%) | 15 (11.8%) |
| 35 Years and over | 36 (100.0%) | 0 (0.0%) |
| Total | 1,194 (94.5%) | 70 (5.5%) |
Educational Attainment by Field of Study in Carrollton
Education (29 | 69.1%), and bio, nature & agricultural (13 | 30.9%) are the most common fields of study among 42 individuals in Carrollton who have obtained a bachelor's degree or higher.
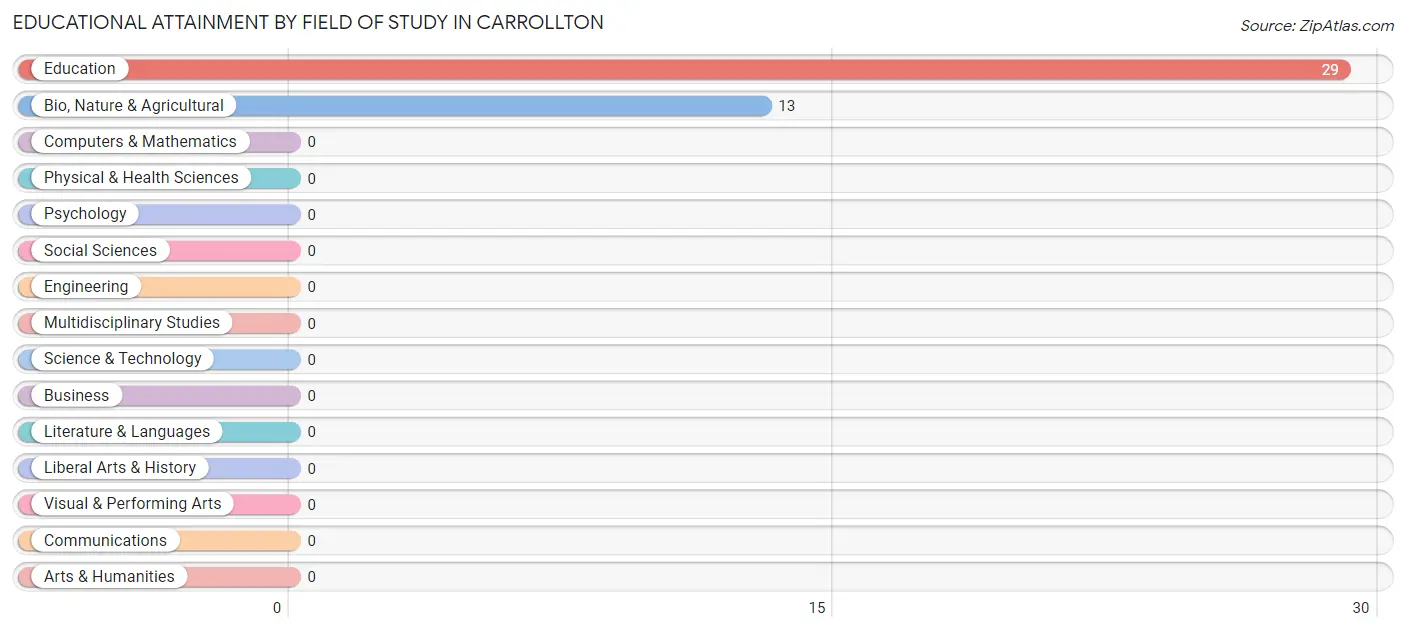
| Field of Study | # Graduates | % Graduates |
| Computers & Mathematics | 0 | 0.0% |
| Bio, Nature & Agricultural | 13 | 30.9% |
| Physical & Health Sciences | 0 | 0.0% |
| Psychology | 0 | 0.0% |
| Social Sciences | 0 | 0.0% |
| Engineering | 0 | 0.0% |
| Multidisciplinary Studies | 0 | 0.0% |
| Science & Technology | 0 | 0.0% |
| Business | 0 | 0.0% |
| Education | 29 | 69.1% |
| Literature & Languages | 0 | 0.0% |
| Liberal Arts & History | 0 | 0.0% |
| Visual & Performing Arts | 0 | 0.0% |
| Communications | 0 | 0.0% |
| Arts & Humanities | 0 | 0.0% |
| Total | 42 | 100.0% |
Transportation & Commute in Carrollton
Vehicle Availability by Sex in Carrollton
The most prevalent vehicle ownership categories in Carrollton are males with 2 vehicles (479, accounting for 63.3%) and females with 2 vehicles (238, making up 80.5%).
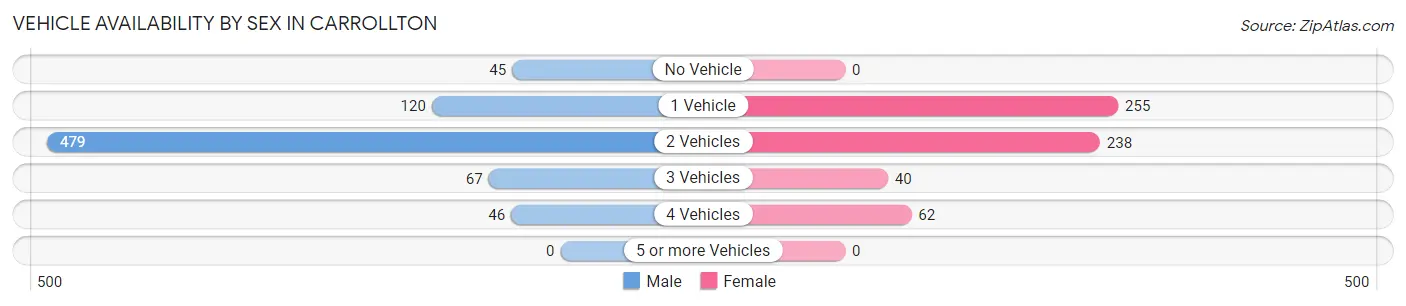
| Vehicles Available | Male | Female |
| No Vehicle | 45 (5.9%) | 0 (0.0%) |
| 1 Vehicle | 120 (15.9%) | 255 (42.9%) |
| 2 Vehicles | 479 (63.3%) | 238 (40.0%) |
| 3 Vehicles | 67 (8.8%) | 40 (6.7%) |
| 4 Vehicles | 46 (6.1%) | 62 (10.4%) |
| 5 or more Vehicles | 0 (0.0%) | 0 (0.0%) |
| Total | 757 (100.0%) | 595 (100.0%) |
Commute Time in Carrollton
The most frequently occuring commute durations in Carrollton are 30 to 34 minutes (339 commuters, 25.3%), 10 to 14 minutes (260 commuters, 19.4%), and 5 to 9 minutes (255 commuters, 19.0%).
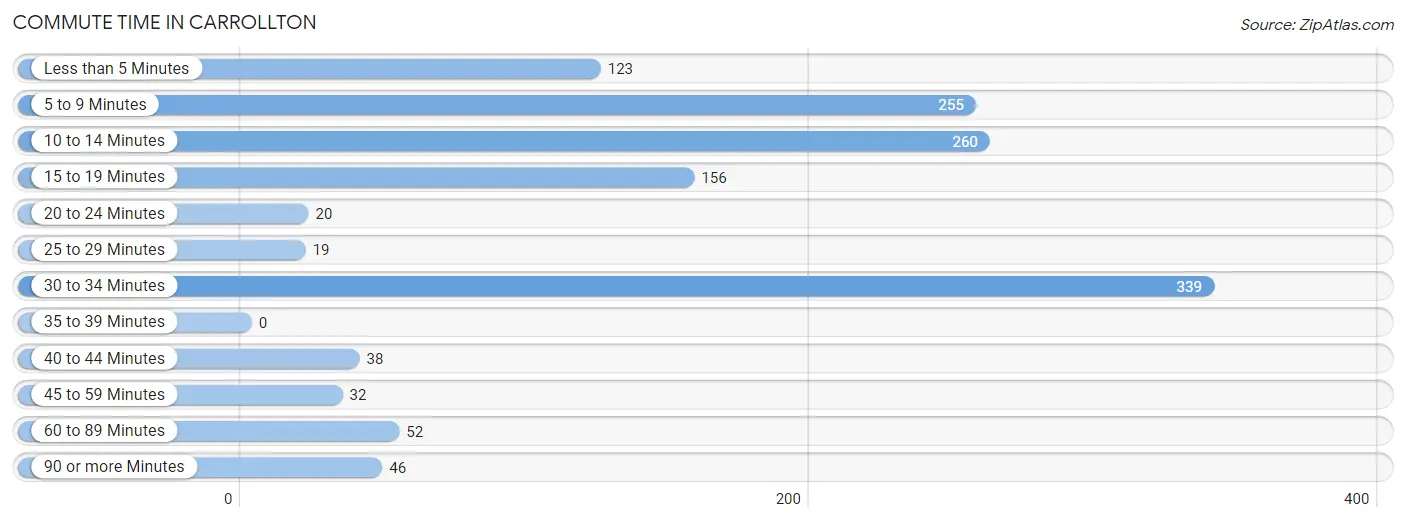
| Commute Time | # Commuters | % Commuters |
| Less than 5 Minutes | 123 | 9.2% |
| 5 to 9 Minutes | 255 | 19.0% |
| 10 to 14 Minutes | 260 | 19.4% |
| 15 to 19 Minutes | 156 | 11.6% |
| 20 to 24 Minutes | 20 | 1.5% |
| 25 to 29 Minutes | 19 | 1.4% |
| 30 to 34 Minutes | 339 | 25.3% |
| 35 to 39 Minutes | 0 | 0.0% |
| 40 to 44 Minutes | 38 | 2.8% |
| 45 to 59 Minutes | 32 | 2.4% |
| 60 to 89 Minutes | 52 | 3.9% |
| 90 or more Minutes | 46 | 3.4% |
Commute Time by Sex in Carrollton
The most common commute times in Carrollton are 30 to 34 minutes (201 commuters, 26.6%) for males and 5 to 9 minutes (152 commuters, 26.1%) for females.
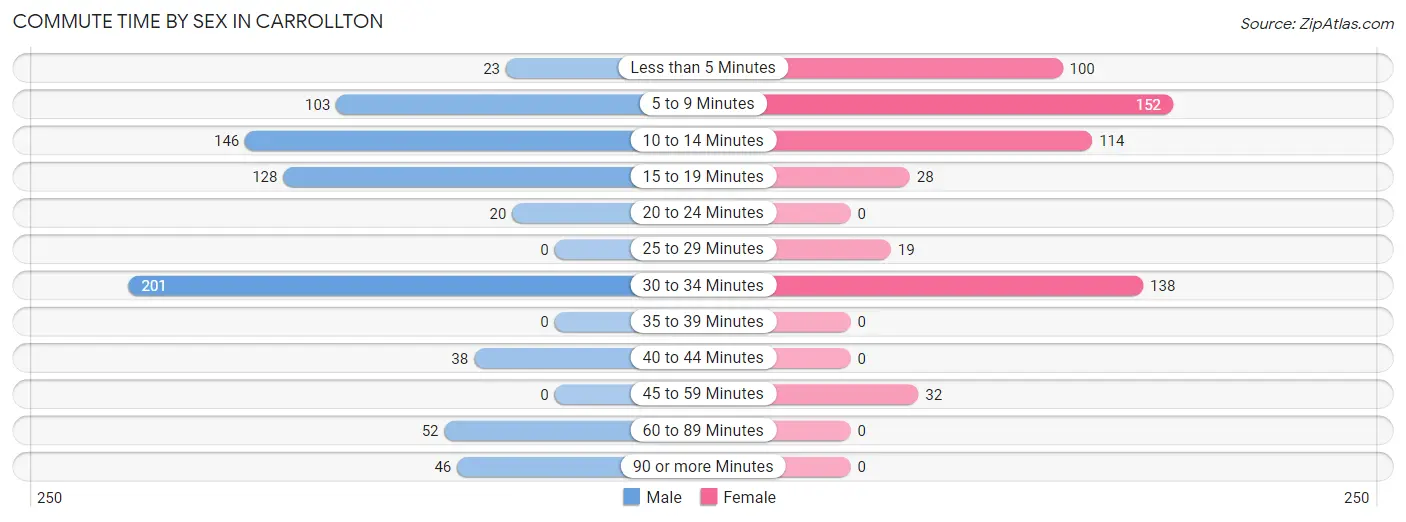
| Commute Time | Male | Female |
| Less than 5 Minutes | 23 (3.0%) | 100 (17.2%) |
| 5 to 9 Minutes | 103 (13.6%) | 152 (26.1%) |
| 10 to 14 Minutes | 146 (19.3%) | 114 (19.6%) |
| 15 to 19 Minutes | 128 (16.9%) | 28 (4.8%) |
| 20 to 24 Minutes | 20 (2.6%) | 0 (0.0%) |
| 25 to 29 Minutes | 0 (0.0%) | 19 (3.3%) |
| 30 to 34 Minutes | 201 (26.6%) | 138 (23.7%) |
| 35 to 39 Minutes | 0 (0.0%) | 0 (0.0%) |
| 40 to 44 Minutes | 38 (5.0%) | 0 (0.0%) |
| 45 to 59 Minutes | 0 (0.0%) | 32 (5.5%) |
| 60 to 89 Minutes | 52 (6.9%) | 0 (0.0%) |
| 90 or more Minutes | 46 (6.1%) | 0 (0.0%) |
Time of Departure to Work by Sex in Carrollton
The most frequent times of departure to work in Carrollton are 7:00 AM to 7:29 AM (107, 14.1%) for males and 12:00 PM to 3:59 PM (103, 17.7%) for females.
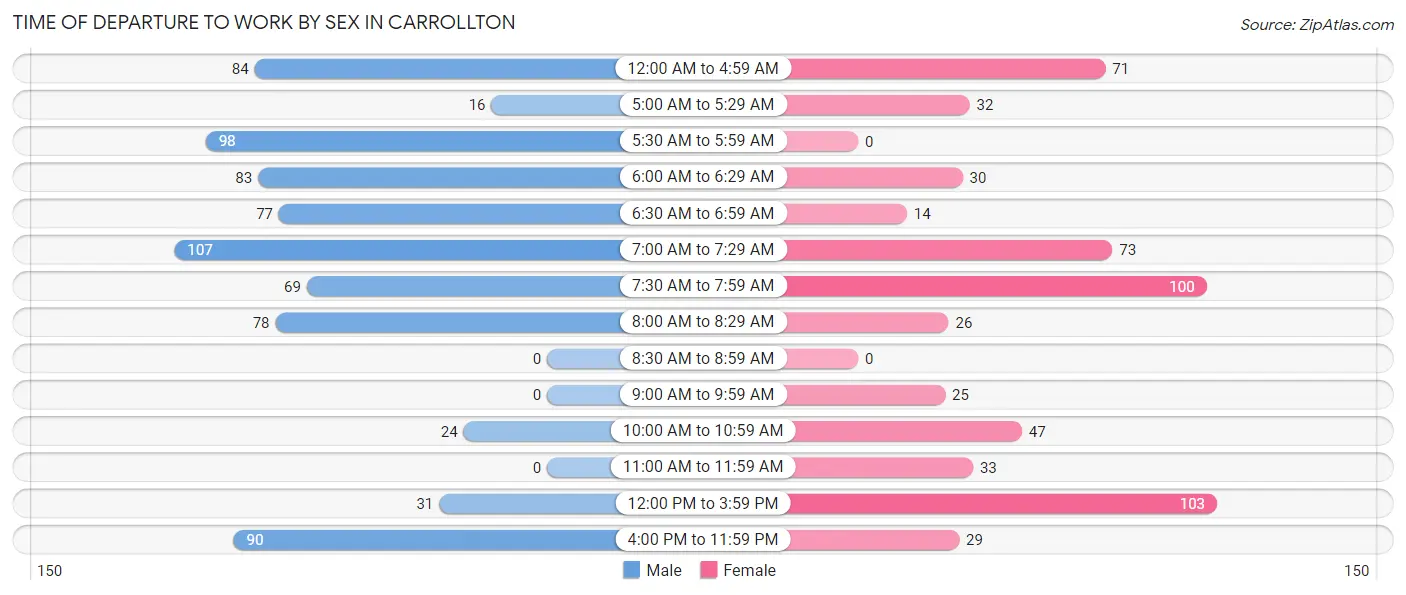
| Time of Departure | Male | Female |
| 12:00 AM to 4:59 AM | 84 (11.1%) | 71 (12.2%) |
| 5:00 AM to 5:29 AM | 16 (2.1%) | 32 (5.5%) |
| 5:30 AM to 5:59 AM | 98 (13.0%) | 0 (0.0%) |
| 6:00 AM to 6:29 AM | 83 (11.0%) | 30 (5.1%) |
| 6:30 AM to 6:59 AM | 77 (10.2%) | 14 (2.4%) |
| 7:00 AM to 7:29 AM | 107 (14.1%) | 73 (12.5%) |
| 7:30 AM to 7:59 AM | 69 (9.1%) | 100 (17.2%) |
| 8:00 AM to 8:29 AM | 78 (10.3%) | 26 (4.5%) |
| 8:30 AM to 8:59 AM | 0 (0.0%) | 0 (0.0%) |
| 9:00 AM to 9:59 AM | 0 (0.0%) | 25 (4.3%) |
| 10:00 AM to 10:59 AM | 24 (3.2%) | 47 (8.1%) |
| 11:00 AM to 11:59 AM | 0 (0.0%) | 33 (5.7%) |
| 12:00 PM to 3:59 PM | 31 (4.1%) | 103 (17.7%) |
| 4:00 PM to 11:59 PM | 90 (11.9%) | 29 (5.0%) |
| Total | 757 (100.0%) | 583 (100.0%) |
Housing Occupancy in Carrollton
Occupancy by Ownership in Carrollton
Of the total 1,414 dwellings in Carrollton, owner-occupied units account for 690 (48.8%), while renter-occupied units make up 724 (51.2%).
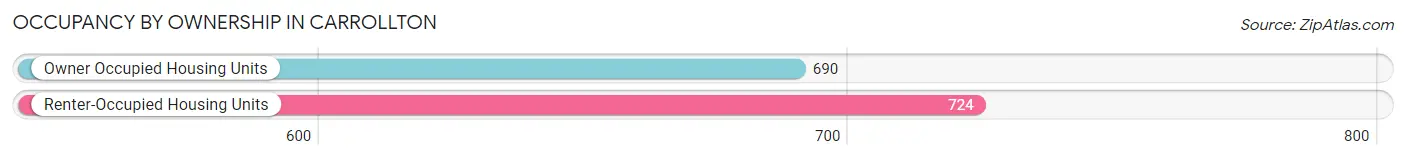
| Occupancy | # Housing Units | % Housing Units |
| Owner Occupied Housing Units | 690 | 48.8% |
| Renter-Occupied Housing Units | 724 | 51.2% |
| Total Occupied Housing Units | 1,414 | 100.0% |
Occupancy by Household Size in Carrollton
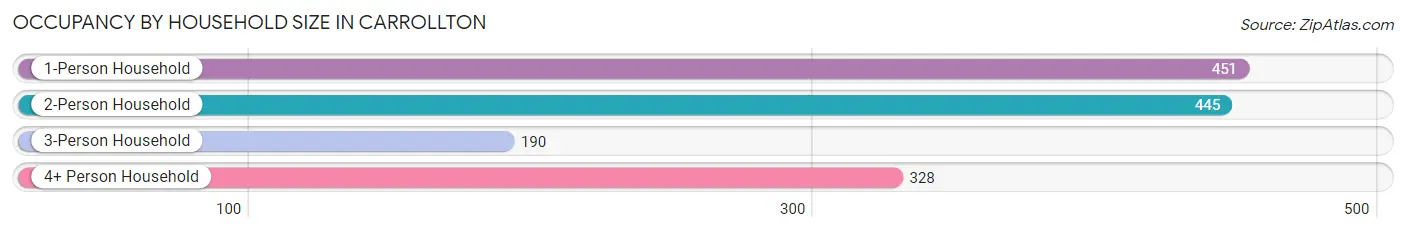
| Household Size | # Housing Units | % Housing Units |
| 1-Person Household | 451 | 31.9% |
| 2-Person Household | 445 | 31.5% |
| 3-Person Household | 190 | 13.4% |
| 4+ Person Household | 328 | 23.2% |
| Total Housing Units | 1,414 | 100.0% |
Occupancy by Ownership by Household Size in Carrollton
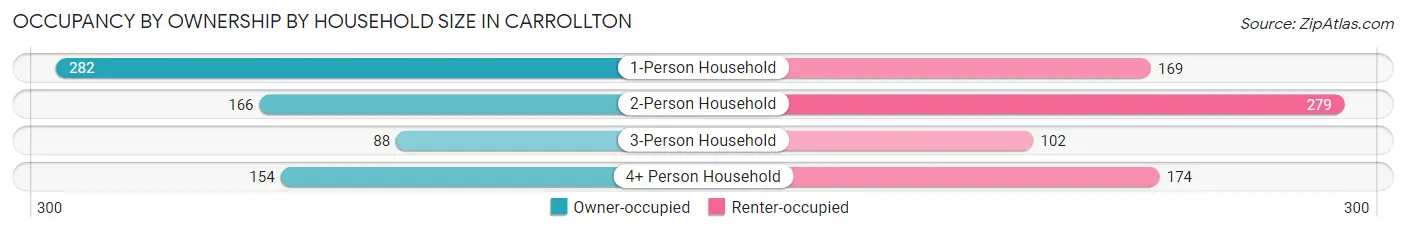
| Household Size | Owner-occupied | Renter-occupied |
| 1-Person Household | 282 (62.5%) | 169 (37.5%) |
| 2-Person Household | 166 (37.3%) | 279 (62.7%) |
| 3-Person Household | 88 (46.3%) | 102 (53.7%) |
| 4+ Person Household | 154 (46.9%) | 174 (53.0%) |
| Total Housing Units | 690 (48.8%) | 724 (51.2%) |
Occupancy by Educational Attainment in Carrollton
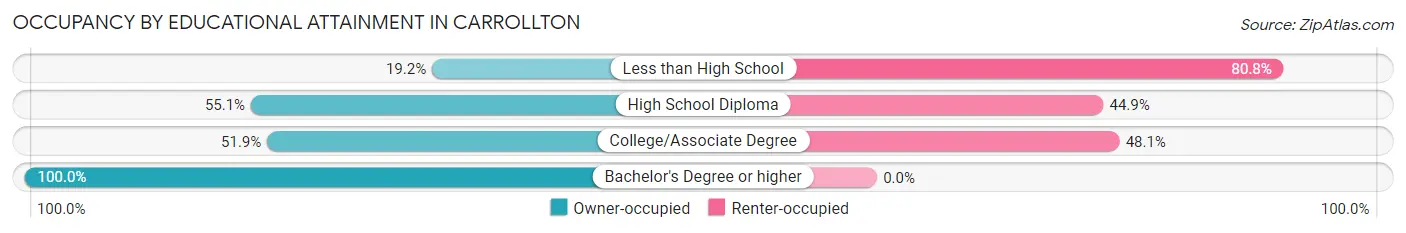
| Household Size | Owner-occupied | Renter-occupied |
| Less than High School | 45 (19.2%) | 189 (80.8%) |
| High School Diploma | 334 (55.1%) | 272 (44.9%) |
| College/Associate Degree | 284 (51.9%) | 263 (48.1%) |
| Bachelor's Degree or higher | 27 (100.0%) | 0 (0.0%) |
Occupancy by Age of Householder in Carrollton
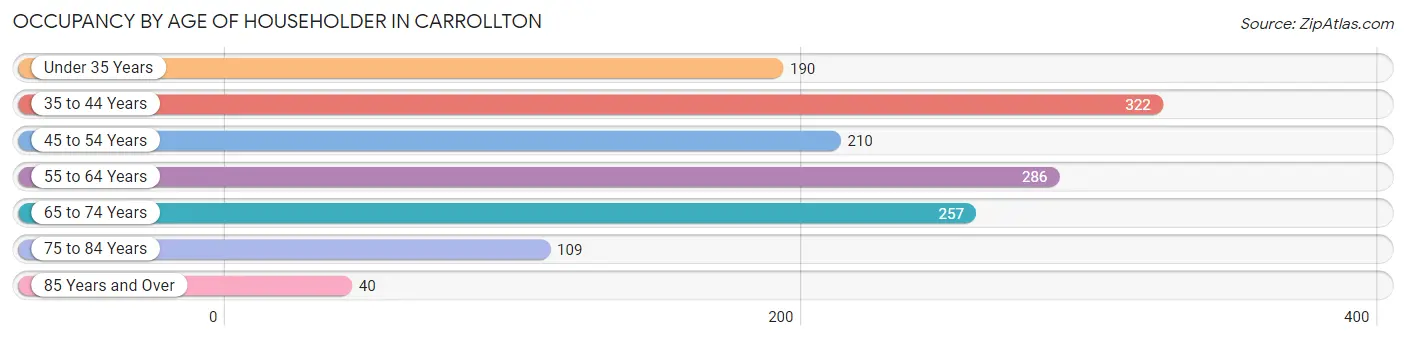
| Age Bracket | # Households | % Households |
| Under 35 Years | 190 | 13.4% |
| 35 to 44 Years | 322 | 22.8% |
| 45 to 54 Years | 210 | 14.8% |
| 55 to 64 Years | 286 | 20.2% |
| 65 to 74 Years | 257 | 18.2% |
| 75 to 84 Years | 109 | 7.7% |
| 85 Years and Over | 40 | 2.8% |
| Total | 1,414 | 100.0% |
Housing Finances in Carrollton
Median Income by Occupancy in Carrollton
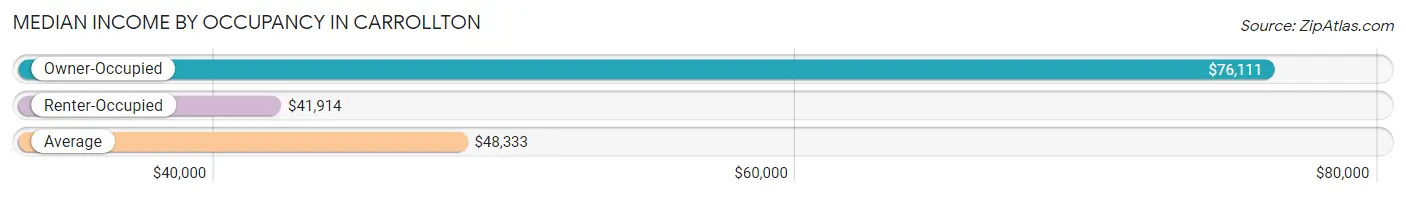
| Occupancy Type | # Households | Median Income |
| Owner-Occupied | 690 (48.8%) | $76,111 |
| Renter-Occupied | 724 (51.2%) | $41,914 |
| Average | 1,414 (100.0%) | $48,333 |
Occupancy by Householder Income Bracket in Carrollton
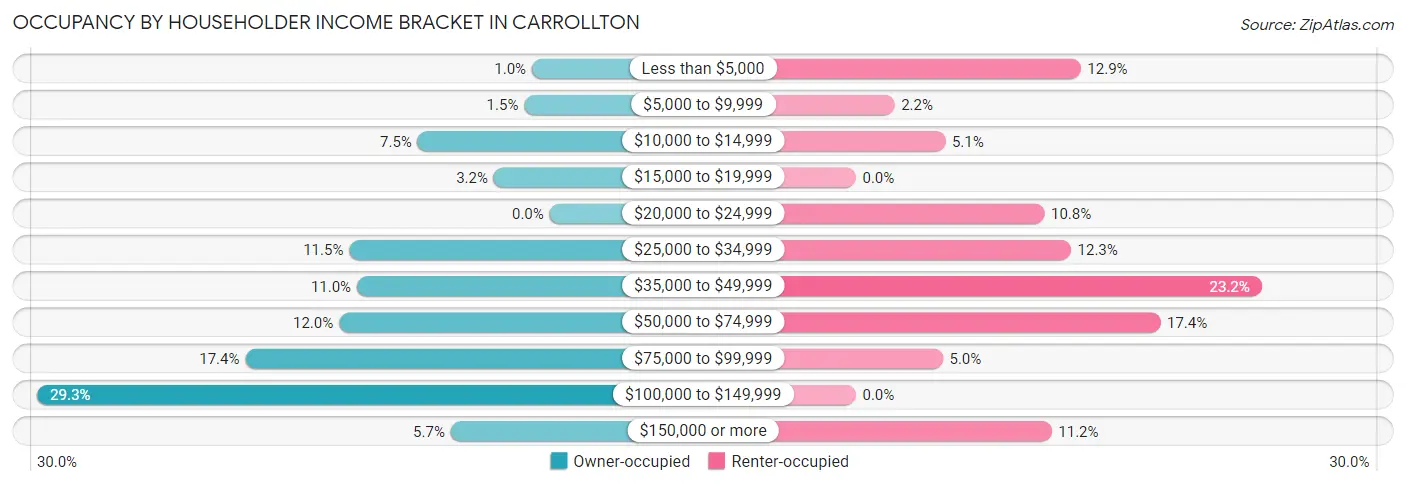
| Income Bracket | Owner-occupied | Renter-occupied |
| Less than $5,000 | 7 (1.0%) | 93 (12.9%) |
| $5,000 to $9,999 | 10 (1.5%) | 16 (2.2%) |
| $10,000 to $14,999 | 52 (7.5%) | 37 (5.1%) |
| $15,000 to $19,999 | 22 (3.2%) | 0 (0.0%) |
| $20,000 to $24,999 | 0 (0.0%) | 78 (10.8%) |
| $25,000 to $34,999 | 79 (11.5%) | 89 (12.3%) |
| $35,000 to $49,999 | 76 (11.0%) | 168 (23.2%) |
| $50,000 to $74,999 | 83 (12.0%) | 126 (17.4%) |
| $75,000 to $99,999 | 120 (17.4%) | 36 (5.0%) |
| $100,000 to $149,999 | 202 (29.3%) | 0 (0.0%) |
| $150,000 or more | 39 (5.7%) | 81 (11.2%) |
| Total | 690 (100.0%) | 724 (100.0%) |
Monthly Housing Cost Tiers in Carrollton
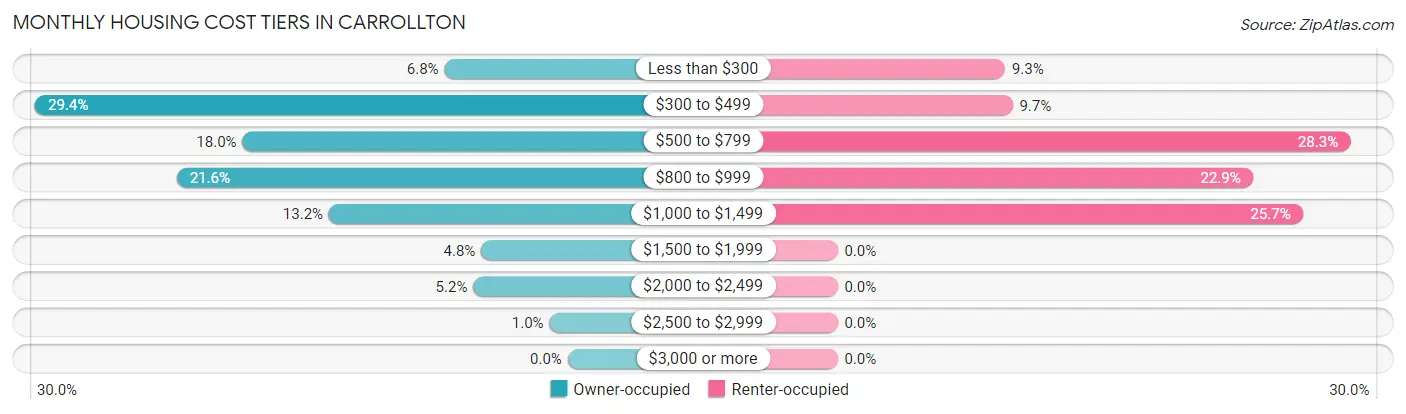
| Monthly Cost | Owner-occupied | Renter-occupied |
| Less than $300 | 47 (6.8%) | 67 (9.2%) |
| $300 to $499 | 203 (29.4%) | 70 (9.7%) |
| $500 to $799 | 124 (18.0%) | 205 (28.3%) |
| $800 to $999 | 149 (21.6%) | 166 (22.9%) |
| $1,000 to $1,499 | 91 (13.2%) | 186 (25.7%) |
| $1,500 to $1,999 | 33 (4.8%) | 0 (0.0%) |
| $2,000 to $2,499 | 36 (5.2%) | 0 (0.0%) |
| $2,500 to $2,999 | 7 (1.0%) | 0 (0.0%) |
| $3,000 or more | 0 (0.0%) | 0 (0.0%) |
| Total | 690 (100.0%) | 724 (100.0%) |
Physical Housing Characteristics in Carrollton
Housing Structures in Carrollton
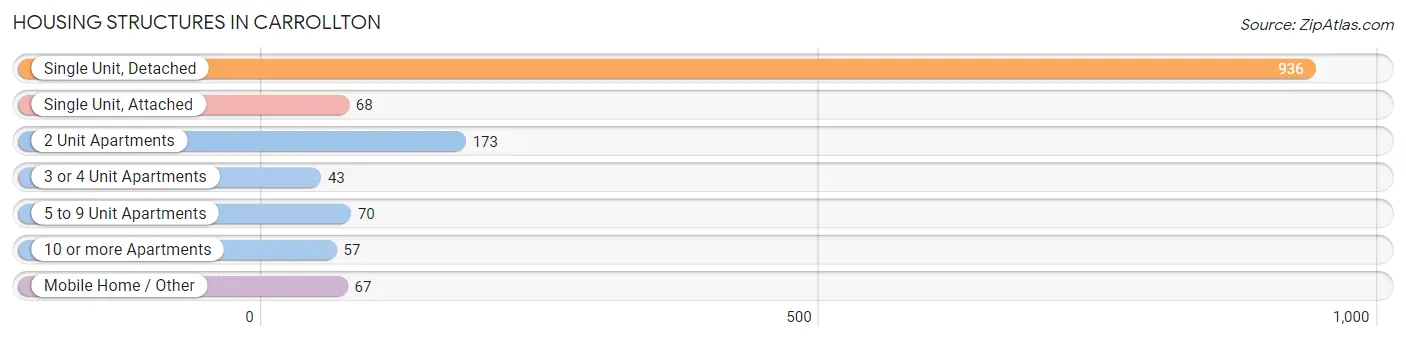
| Structure Type | # Housing Units | % Housing Units |
| Single Unit, Detached | 936 | 66.2% |
| Single Unit, Attached | 68 | 4.8% |
| 2 Unit Apartments | 173 | 12.2% |
| 3 or 4 Unit Apartments | 43 | 3.0% |
| 5 to 9 Unit Apartments | 70 | 5.0% |
| 10 or more Apartments | 57 | 4.0% |
| Mobile Home / Other | 67 | 4.7% |
| Total | 1,414 | 100.0% |
Housing Structures by Occupancy in Carrollton
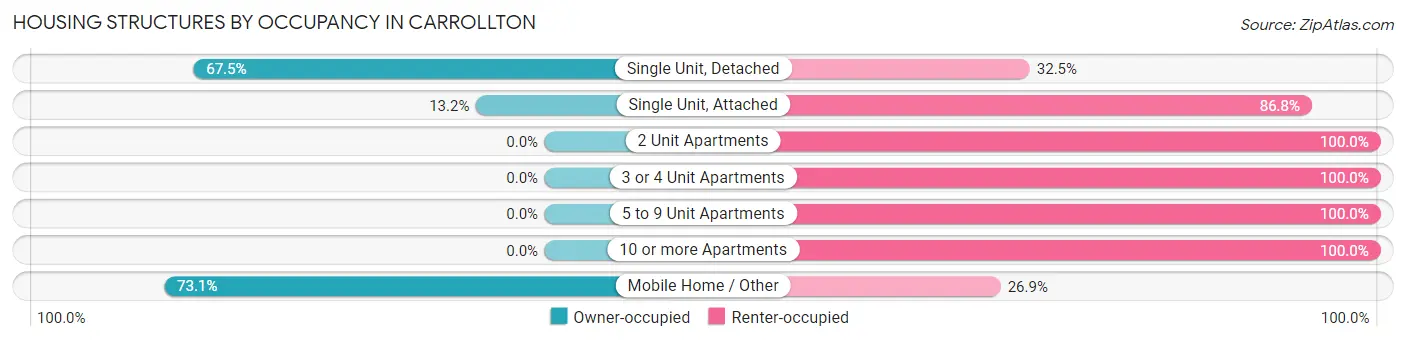
| Structure Type | Owner-occupied | Renter-occupied |
| Single Unit, Detached | 632 (67.5%) | 304 (32.5%) |
| Single Unit, Attached | 9 (13.2%) | 59 (86.8%) |
| 2 Unit Apartments | 0 (0.0%) | 173 (100.0%) |
| 3 or 4 Unit Apartments | 0 (0.0%) | 43 (100.0%) |
| 5 to 9 Unit Apartments | 0 (0.0%) | 70 (100.0%) |
| 10 or more Apartments | 0 (0.0%) | 57 (100.0%) |
| Mobile Home / Other | 49 (73.1%) | 18 (26.9%) |
| Total | 690 (48.8%) | 724 (51.2%) |
Housing Structures by Number of Rooms in Carrollton
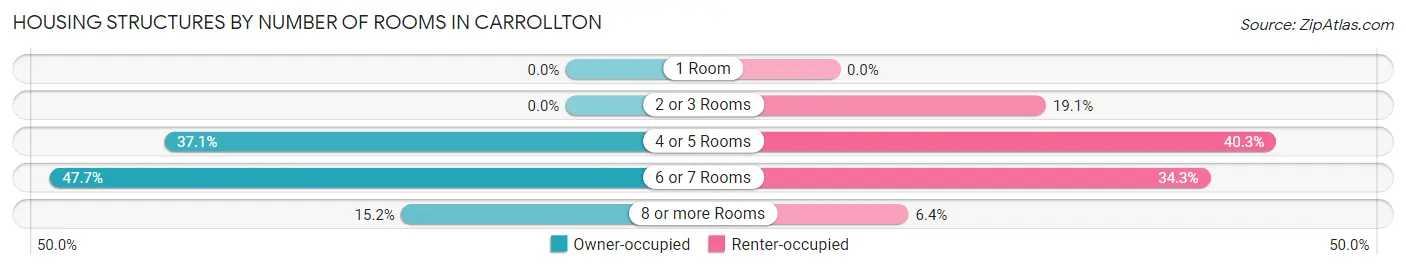
| Number of Rooms | Owner-occupied | Renter-occupied |
| 1 Room | 0 (0.0%) | 0 (0.0%) |
| 2 or 3 Rooms | 0 (0.0%) | 138 (19.1%) |
| 4 or 5 Rooms | 256 (37.1%) | 292 (40.3%) |
| 6 or 7 Rooms | 329 (47.7%) | 248 (34.3%) |
| 8 or more Rooms | 105 (15.2%) | 46 (6.4%) |
| Total | 690 (100.0%) | 724 (100.0%) |
Housing Structure by Heating Type in Carrollton
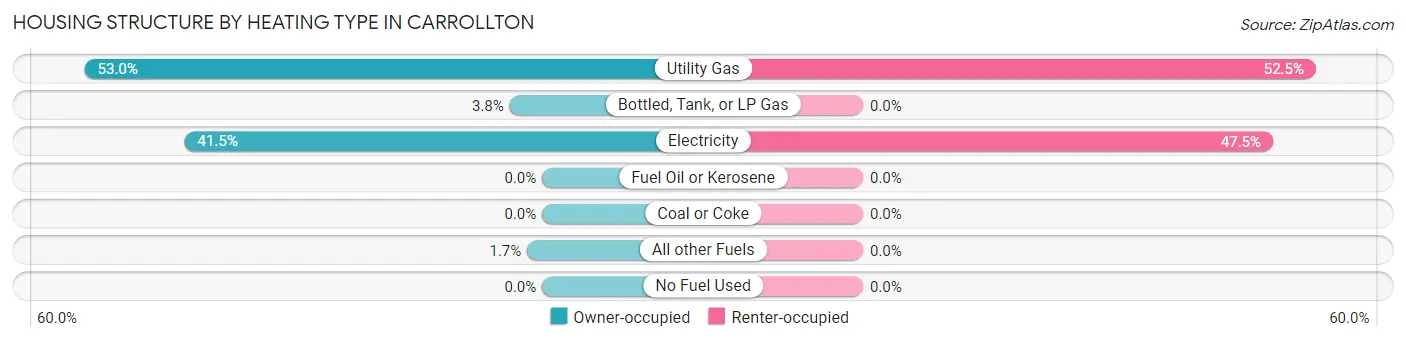
| Heating Type | Owner-occupied | Renter-occupied |
| Utility Gas | 366 (53.0%) | 380 (52.5%) |
| Bottled, Tank, or LP Gas | 26 (3.8%) | 0 (0.0%) |
| Electricity | 286 (41.4%) | 344 (47.5%) |
| Fuel Oil or Kerosene | 0 (0.0%) | 0 (0.0%) |
| Coal or Coke | 0 (0.0%) | 0 (0.0%) |
| All other Fuels | 12 (1.7%) | 0 (0.0%) |
| No Fuel Used | 0 (0.0%) | 0 (0.0%) |
| Total | 690 (100.0%) | 724 (100.0%) |
Household Vehicle Usage in Carrollton
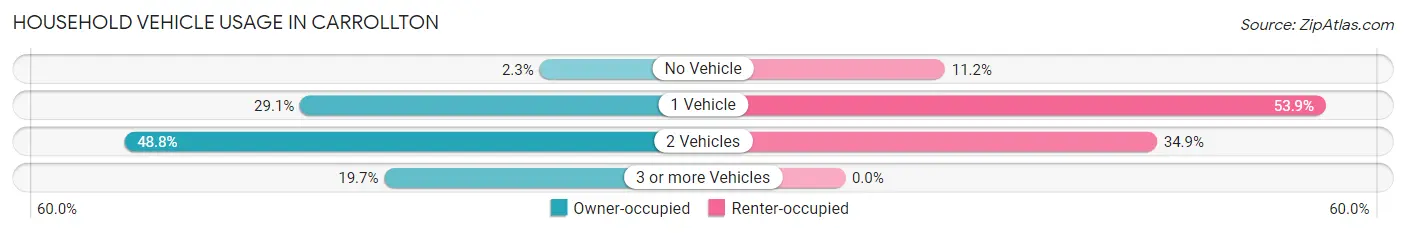
| Vehicles per Household | Owner-occupied | Renter-occupied |
| No Vehicle | 16 (2.3%) | 81 (11.2%) |
| 1 Vehicle | 201 (29.1%) | 390 (53.9%) |
| 2 Vehicles | 337 (48.8%) | 253 (34.9%) |
| 3 or more Vehicles | 136 (19.7%) | 0 (0.0%) |
| Total | 690 (100.0%) | 724 (100.0%) |
Real Estate & Mortgages in Carrollton
Real Estate and Mortgage Overview in Carrollton
| Characteristic | Without Mortgage | With Mortgage |
| Housing Units | 329 | 361 |
| Median Property Value | $135,400 | $115,400 |
| Median Household Income | $48,875 | $39 |
| Monthly Housing Costs | $461 | $0 |
| Real Estate Taxes | $1,108 | $16 |
Property Value by Mortgage Status in Carrollton
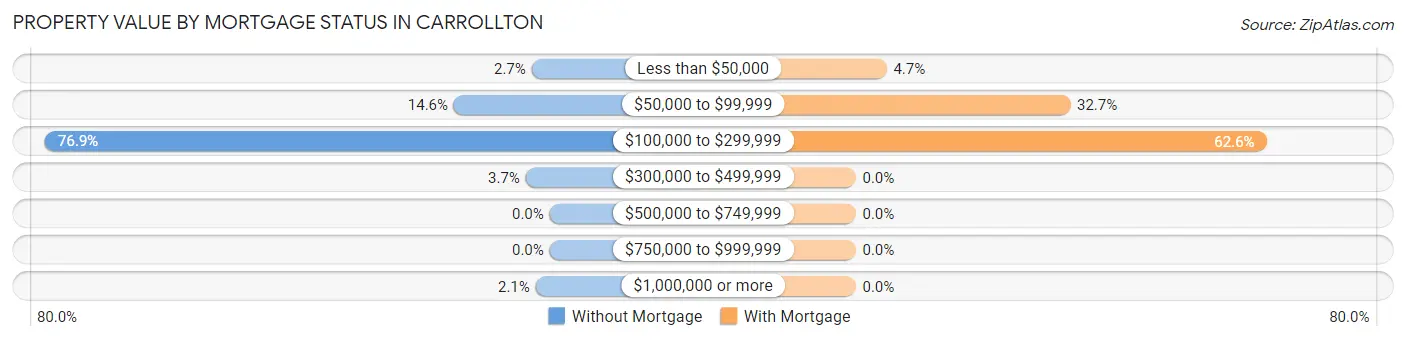
| Property Value | Without Mortgage | With Mortgage |
| Less than $50,000 | 9 (2.7%) | 17 (4.7%) |
| $50,000 to $99,999 | 48 (14.6%) | 118 (32.7%) |
| $100,000 to $299,999 | 253 (76.9%) | 226 (62.6%) |
| $300,000 to $499,999 | 12 (3.6%) | 0 (0.0%) |
| $500,000 to $749,999 | 0 (0.0%) | 0 (0.0%) |
| $750,000 to $999,999 | 0 (0.0%) | 0 (0.0%) |
| $1,000,000 or more | 7 (2.1%) | 0 (0.0%) |
| Total | 329 (100.0%) | 361 (100.0%) |
Household Income by Mortgage Status in Carrollton
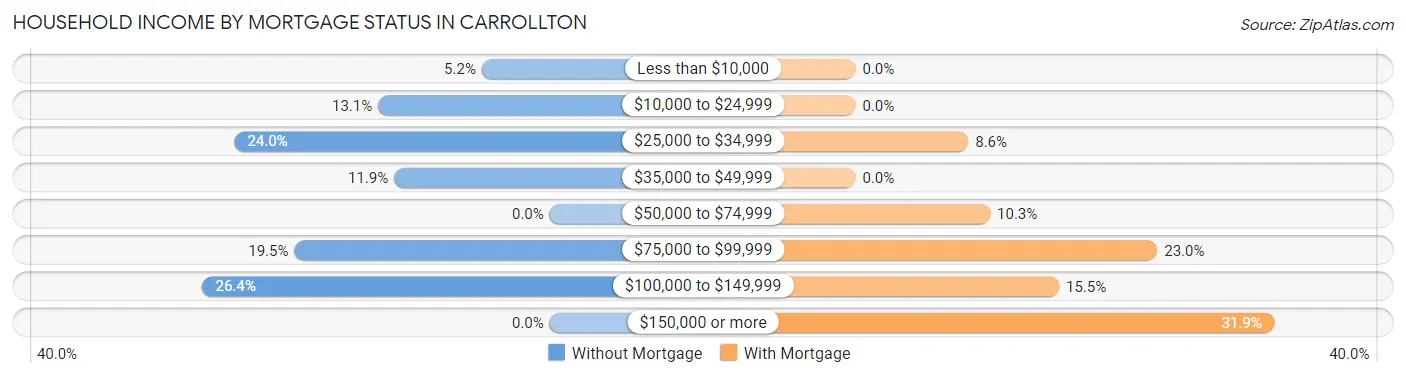
| Household Income | Without Mortgage | With Mortgage |
| Less than $10,000 | 17 (5.2%) | 0 (0.0%) |
| $10,000 to $24,999 | 43 (13.1%) | 0 (0.0%) |
| $25,000 to $34,999 | 79 (24.0%) | 31 (8.6%) |
| $35,000 to $49,999 | 39 (11.8%) | 0 (0.0%) |
| $50,000 to $74,999 | 0 (0.0%) | 37 (10.2%) |
| $75,000 to $99,999 | 64 (19.5%) | 83 (23.0%) |
| $100,000 to $149,999 | 87 (26.4%) | 56 (15.5%) |
| $150,000 or more | 0 (0.0%) | 115 (31.9%) |
| Total | 329 (100.0%) | 361 (100.0%) |
Property Value to Household Income Ratio in Carrollton
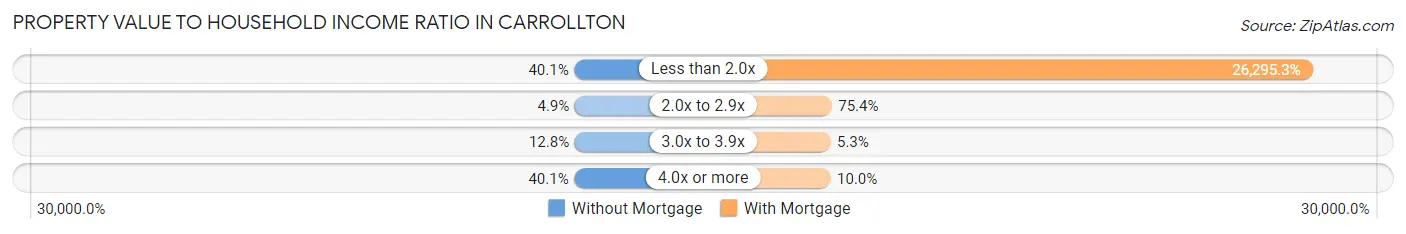
| Value-to-Income Ratio | Without Mortgage | With Mortgage |
| Less than 2.0x | 132 (40.1%) | 94,926 (26,295.3%) |
| 2.0x to 2.9x | 16 (4.9%) | 272 (75.3%) |
| 3.0x to 3.9x | 42 (12.8%) | 19 (5.3%) |
| 4.0x or more | 132 (40.1%) | 36 (10.0%) |
| Total | 329 (100.0%) | 361 (100.0%) |
Real Estate Taxes by Mortgage Status in Carrollton
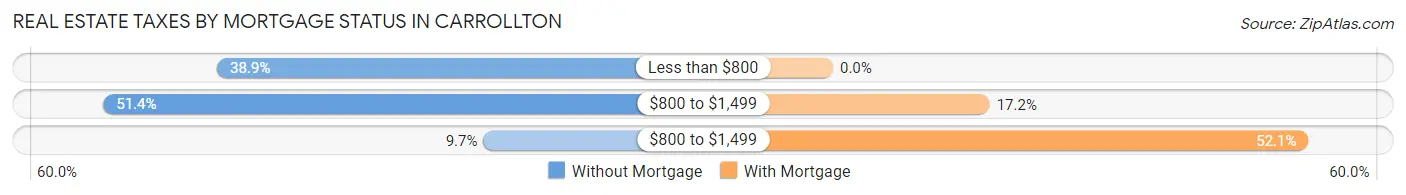
| Property Taxes | Without Mortgage | With Mortgage |
| Less than $800 | 128 (38.9%) | 0 (0.0%) |
| $800 to $1,499 | 169 (51.4%) | 62 (17.2%) |
| $800 to $1,499 | 32 (9.7%) | 188 (52.1%) |
| Total | 329 (100.0%) | 361 (100.0%) |
Health & Disability in Carrollton
Health Insurance Coverage by Age in Carrollton
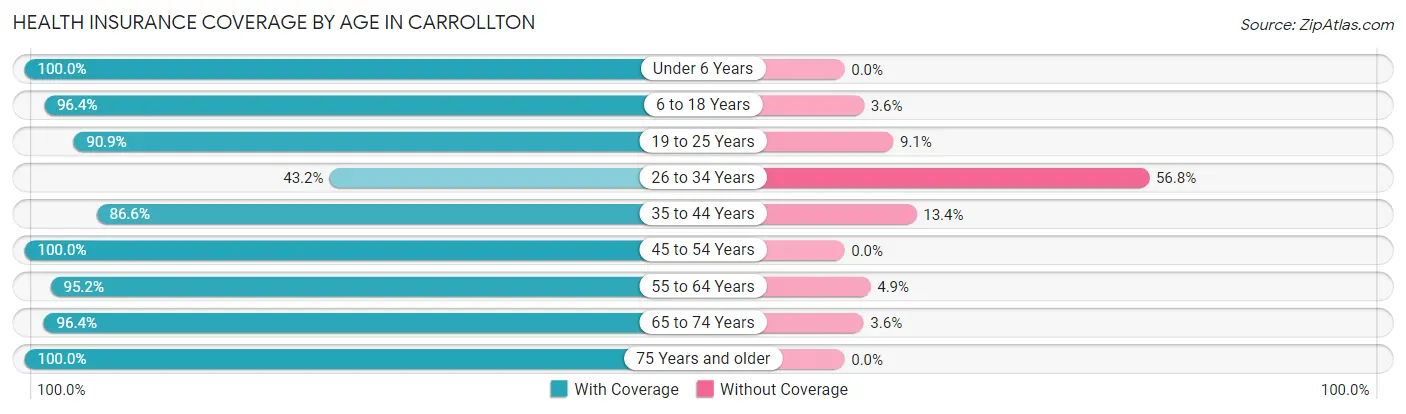
| Age Bracket | With Coverage | Without Coverage |
| Under 6 Years | 440 (100.0%) | 0 (0.0%) |
| 6 to 18 Years | 904 (96.4%) | 34 (3.6%) |
| 19 to 25 Years | 190 (90.9%) | 19 (9.1%) |
| 26 to 34 Years | 171 (43.2%) | 225 (56.8%) |
| 35 to 44 Years | 413 (86.6%) | 64 (13.4%) |
| 45 to 54 Years | 283 (100.0%) | 0 (0.0%) |
| 55 to 64 Years | 451 (95.2%) | 23 (4.9%) |
| 65 to 74 Years | 325 (96.4%) | 12 (3.6%) |
| 75 Years and older | 173 (100.0%) | 0 (0.0%) |
| Total | 3,350 (89.9%) | 377 (10.1%) |
Health Insurance Coverage by Citizenship Status in Carrollton
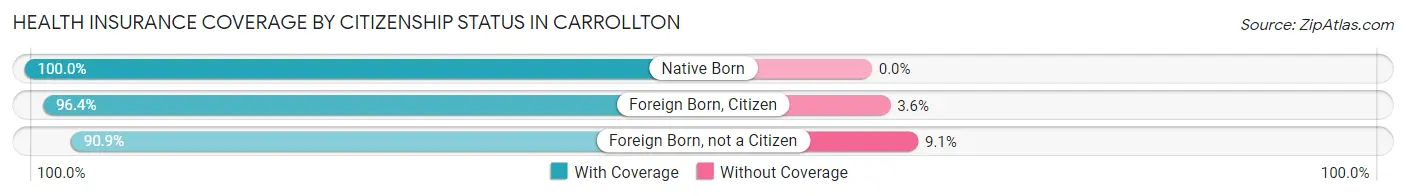
| Citizenship Status | With Coverage | Without Coverage |
| Native Born | 440 (100.0%) | 0 (0.0%) |
| Foreign Born, Citizen | 904 (96.4%) | 34 (3.6%) |
| Foreign Born, not a Citizen | 190 (90.9%) | 19 (9.1%) |
Health Insurance Coverage by Household Income in Carrollton
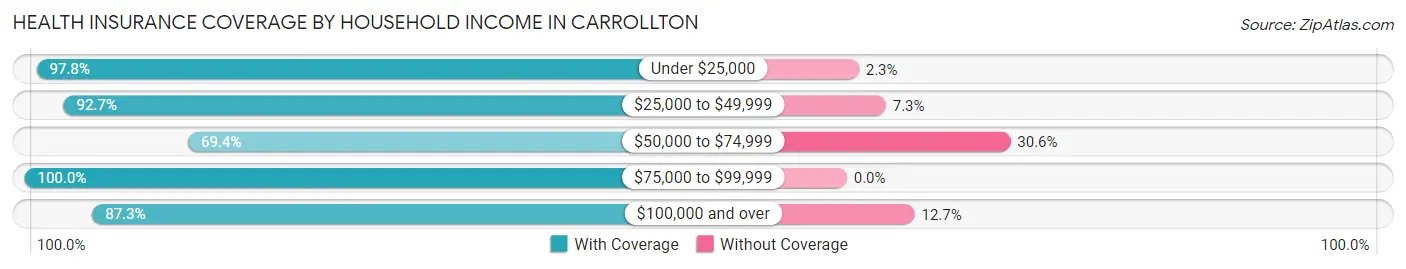
| Household Income | With Coverage | Without Coverage |
| Under $25,000 | 521 (97.8%) | 12 (2.2%) |
| $25,000 to $49,999 | 837 (92.7%) | 66 (7.3%) |
| $50,000 to $74,999 | 369 (69.4%) | 163 (30.6%) |
| $75,000 to $99,999 | 715 (100.0%) | 0 (0.0%) |
| $100,000 and over | 901 (87.3%) | 131 (12.7%) |
Public vs Private Health Insurance Coverage by Age in Carrollton
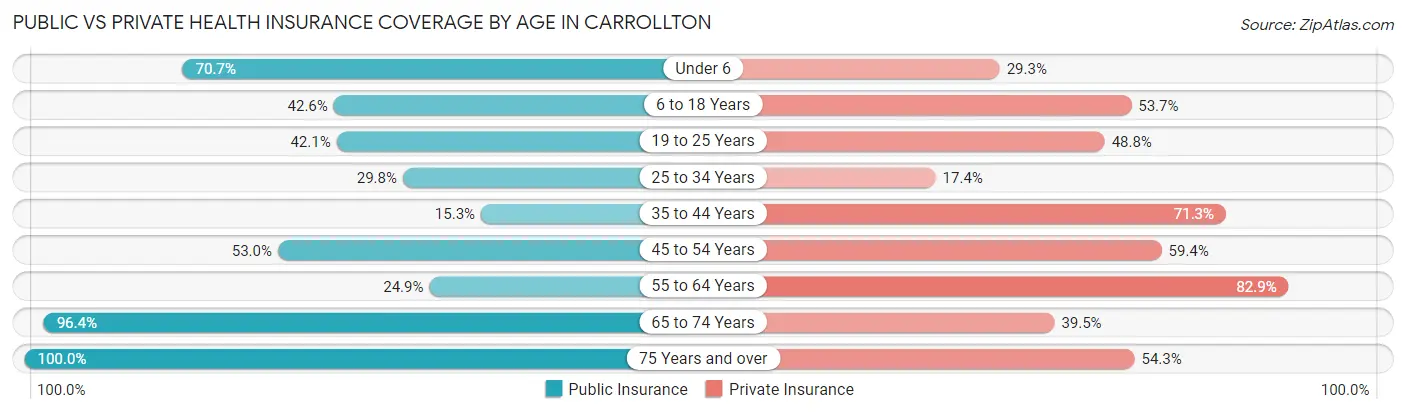
| Age Bracket | Public Insurance | Private Insurance |
| Under 6 | 311 (70.7%) | 129 (29.3%) |
| 6 to 18 Years | 400 (42.6%) | 504 (53.7%) |
| 19 to 25 Years | 88 (42.1%) | 102 (48.8%) |
| 25 to 34 Years | 118 (29.8%) | 69 (17.4%) |
| 35 to 44 Years | 73 (15.3%) | 340 (71.3%) |
| 45 to 54 Years | 150 (53.0%) | 168 (59.4%) |
| 55 to 64 Years | 118 (24.9%) | 393 (82.9%) |
| 65 to 74 Years | 325 (96.4%) | 133 (39.5%) |
| 75 Years and over | 173 (100.0%) | 94 (54.3%) |
| Total | 1,756 (47.1%) | 1,932 (51.8%) |
Disability Status by Sex by Age in Carrollton
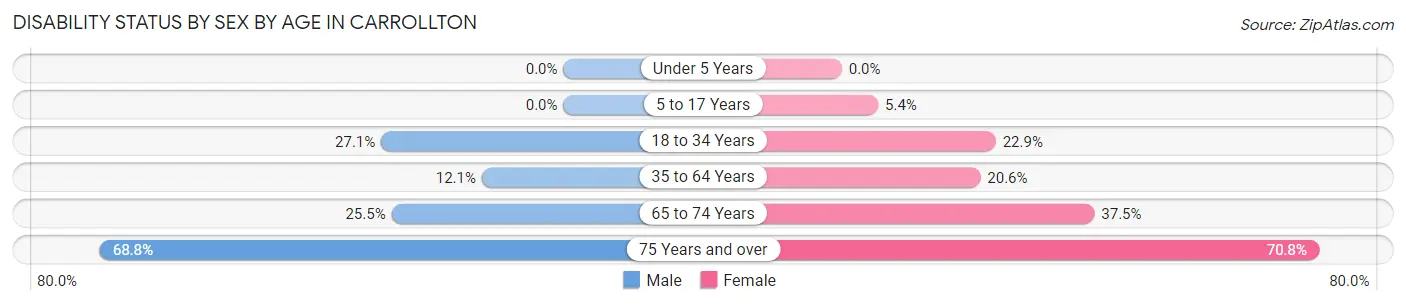
| Age Bracket | Male | Female |
| Under 5 Years | 0 (0.0%) | 0 (0.0%) |
| 5 to 17 Years | 0 (0.0%) | 18 (5.4%) |
| 18 to 34 Years | 105 (27.1%) | 56 (22.9%) |
| 35 to 64 Years | 70 (12.1%) | 135 (20.6%) |
| 65 to 74 Years | 37 (25.5%) | 72 (37.5%) |
| 75 Years and over | 53 (68.8%) | 68 (70.8%) |
Disability Class by Sex by Age in Carrollton
Disability Class: Hearing Difficulty
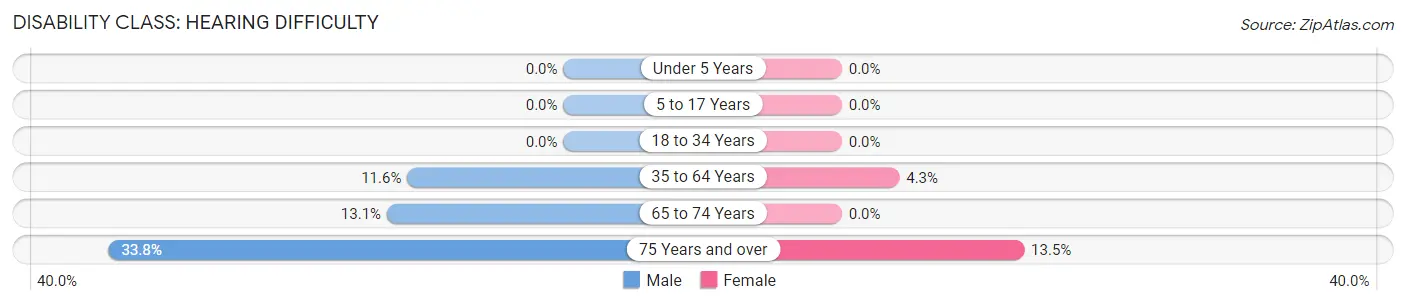
| Age Bracket | Male | Female |
| Under 5 Years | 0 (0.0%) | 0 (0.0%) |
| 5 to 17 Years | 0 (0.0%) | 0 (0.0%) |
| 18 to 34 Years | 0 (0.0%) | 0 (0.0%) |
| 35 to 64 Years | 67 (11.6%) | 28 (4.3%) |
| 65 to 74 Years | 19 (13.1%) | 0 (0.0%) |
| 75 Years and over | 26 (33.8%) | 13 (13.5%) |
Disability Class: Vision Difficulty
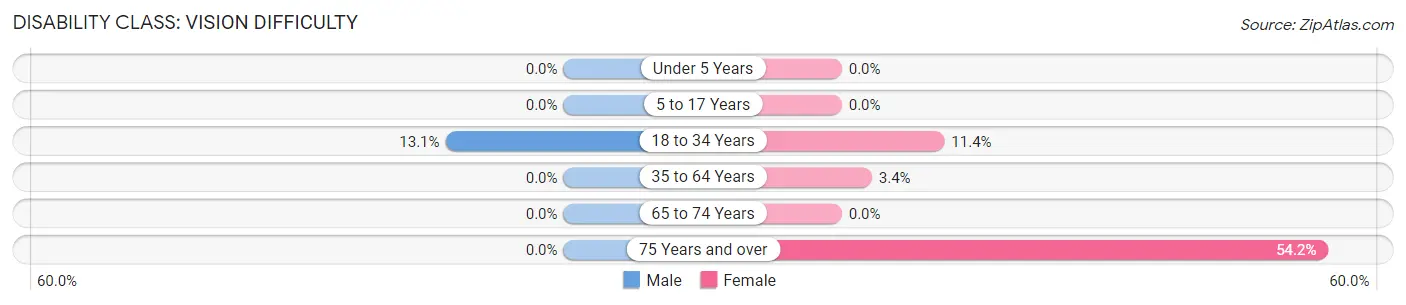
| Age Bracket | Male | Female |
| Under 5 Years | 0 (0.0%) | 0 (0.0%) |
| 5 to 17 Years | 0 (0.0%) | 0 (0.0%) |
| 18 to 34 Years | 51 (13.1%) | 28 (11.4%) |
| 35 to 64 Years | 0 (0.0%) | 22 (3.4%) |
| 65 to 74 Years | 0 (0.0%) | 0 (0.0%) |
| 75 Years and over | 0 (0.0%) | 52 (54.2%) |
Disability Class: Cognitive Difficulty

| Age Bracket | Male | Female |
| 5 to 17 Years | 0 (0.0%) | 18 (5.4%) |
| 18 to 34 Years | 54 (13.9%) | 56 (22.9%) |
| 35 to 64 Years | 0 (0.0%) | 95 (14.5%) |
| 65 to 74 Years | 0 (0.0%) | 0 (0.0%) |
| 75 Years and over | 0 (0.0%) | 26 (27.1%) |
Disability Class: Ambulatory Difficulty
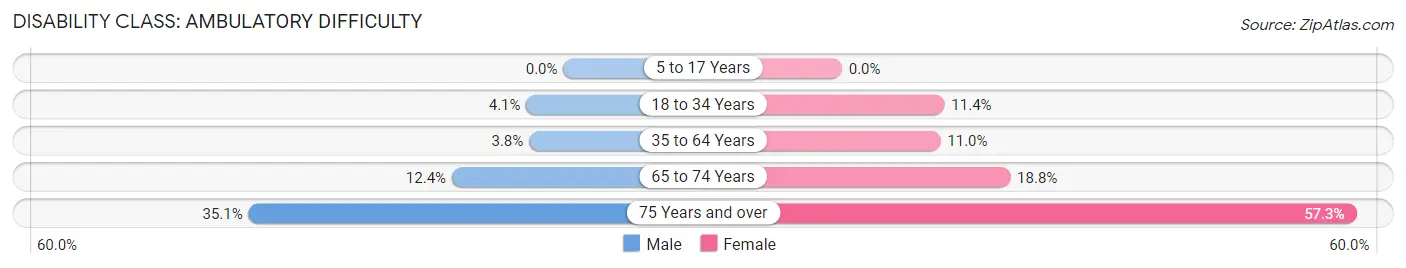
| Age Bracket | Male | Female |
| 5 to 17 Years | 0 (0.0%) | 0 (0.0%) |
| 18 to 34 Years | 16 (4.1%) | 28 (11.4%) |
| 35 to 64 Years | 22 (3.8%) | 72 (11.0%) |
| 65 to 74 Years | 18 (12.4%) | 36 (18.8%) |
| 75 Years and over | 27 (35.1%) | 55 (57.3%) |
Disability Class: Self-Care Difficulty
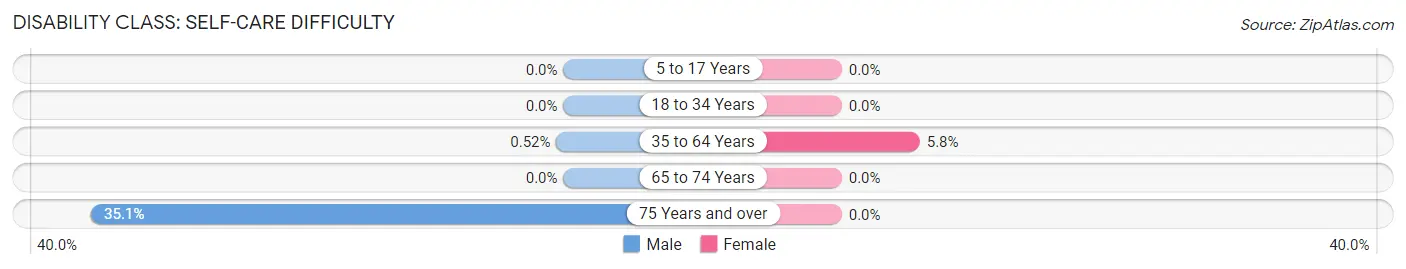
| Age Bracket | Male | Female |
| 5 to 17 Years | 0 (0.0%) | 0 (0.0%) |
| 18 to 34 Years | 0 (0.0%) | 0 (0.0%) |
| 35 to 64 Years | 3 (0.5%) | 38 (5.8%) |
| 65 to 74 Years | 0 (0.0%) | 0 (0.0%) |
| 75 Years and over | 27 (35.1%) | 0 (0.0%) |
Technology Access in Carrollton
Computing Device Access in Carrollton
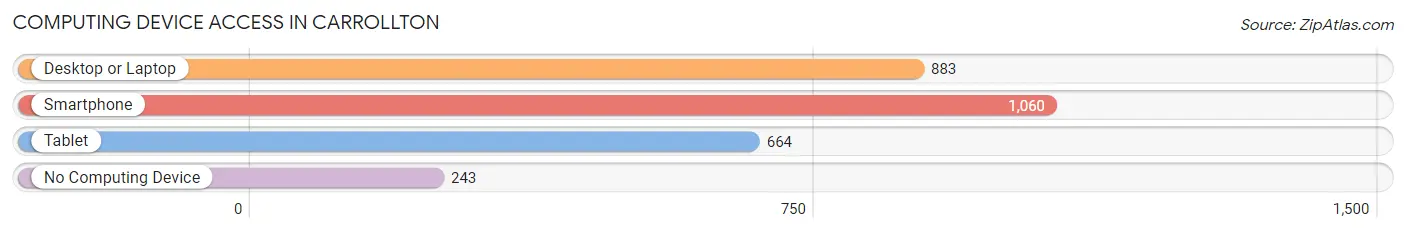
| Device Type | # Households | % Households |
| Desktop or Laptop | 883 | 62.5% |
| Smartphone | 1,060 | 75.0% |
| Tablet | 664 | 47.0% |
| No Computing Device | 243 | 17.2% |
| Total | 1,414 | 100.0% |
Internet Access in Carrollton
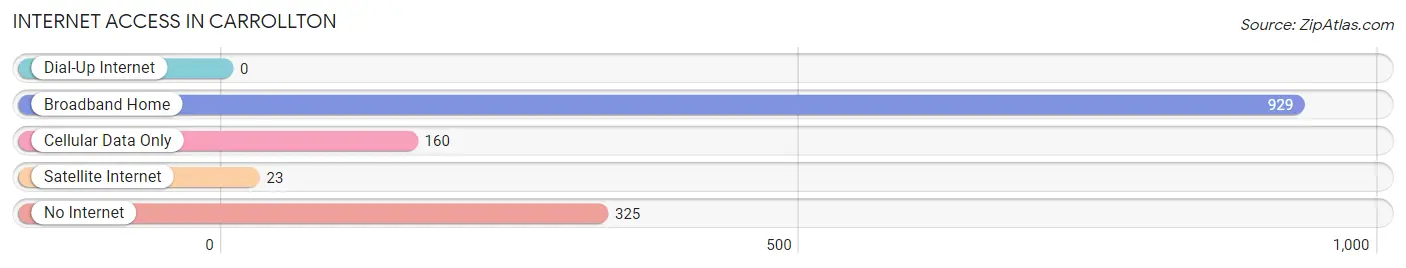
| Internet Type | # Households | % Households |
| Dial-Up Internet | 0 | 0.0% |
| Broadband Home | 929 | 65.7% |
| Cellular Data Only | 160 | 11.3% |
| Satellite Internet | 23 | 1.6% |
| No Internet | 325 | 23.0% |
| Total | 1,414 | 100.0% |
Carrollton Summary
Carrollton, Kentucky is a small city located in the northern part of the state, in the heart of Carroll County. It is situated on the banks of the Ohio River, and is the county seat of Carroll County. The city has a population of approximately 4,000 people, and is part of the Greater Cincinnati metropolitan area.
History
Carrollton was founded in 1815 by William Carroll, a Revolutionary War veteran. The city was named after him, and was originally part of Gallatin County. In 1838, Carroll County was formed, and Carrollton was chosen as the county seat. The city was incorporated in 1842, and has remained the county seat ever since.
The city was an important stop on the Underground Railroad, and was home to several prominent abolitionists. During the Civil War, the city was occupied by Confederate forces, and was the site of several skirmishes. After the war, the city experienced a period of growth and prosperity, and many of its historic buildings were constructed during this time.
Geography
Carrollton is located in the northern part of Kentucky, in the heart of Carroll County. It is situated on the banks of the Ohio River, and is part of the Greater Cincinnati metropolitan area. The city has a total area of 4.2 square miles, all of which is land. The terrain is mostly flat, with some rolling hills in the surrounding area.
The climate in Carrollton is humid subtropical, with hot, humid summers and cold, wet winters. The average annual temperature is around 57 degrees Fahrenheit, and the average annual precipitation is around 43 inches.
Economy
The economy of Carrollton is largely based on agriculture and manufacturing. The city is home to several large manufacturing plants, including a paper mill, a steel mill, and a plastics plant. Agriculture is also an important part of the local economy, with corn, soybeans, and wheat being the main crops.
The city is also home to several small businesses, including restaurants, retail stores, and professional services. Tourism is also an important part of the local economy, with many visitors coming to the city to visit its historic sites and attractions.
Demographics
As of the 2010 census, the population of Carrollton was 4,092. The racial makeup of the city was 95.3% White, 1.7% African American, 0.3% Native American, 0.4% Asian, 0.1% Pacific Islander, 0.7% from other races, and 1.5% from two or more races. Hispanic or Latino of any race were 2.2% of the population.
The median household income in Carrollton was $37,917, and the median family income was $45,938. The per capita income was $19,945. About 15.3% of the population was below the poverty line.
Carrollton is a small city with a rich history and a diverse economy. It is home to many historic sites and attractions, and is an important part of the Greater Cincinnati metropolitan area. The city has a population of approximately 4,000 people, and is a great place to live and work.
Common Questions
What is Per Capita Income in Carrollton?
Per Capita income in Carrollton is $23,062.
What is the Median Family Income in Carrollton?
Median Family Income in Carrollton is $56,091.
What is the Median Household income in Carrollton?
Median Household Income in Carrollton is $48,333.
What is Income or Wage Gap in Carrollton?
Income or Wage Gap in Carrollton is 32.9%.
Women in Carrollton earn 67.1 cents for every dollar earned by a man.
What is Inequality or Gini Index in Carrollton?
Inequality or Gini Index in Carrollton is 0.41.
What is the Total Population of Carrollton?
Total Population of Carrollton is 3,889.
What is the Total Male Population of Carrollton?
Total Male Population of Carrollton is 2,045.
What is the Total Female Population of Carrollton?
Total Female Population of Carrollton is 1,844.
What is the Ratio of Males per 100 Females in Carrollton?
There are 110.90 Males per 100 Females in Carrollton.
What is the Ratio of Females per 100 Males in Carrollton?
There are 90.17 Females per 100 Males in Carrollton.
What is the Median Population Age in Carrollton?
Median Population Age in Carrollton is 32.7 Years.
What is the Average Family Size in Carrollton
Average Family Size in Carrollton is 3.7 People.
What is the Average Household Size in Carrollton
Average Household Size in Carrollton is 2.6 People.
How Large is the Labor Force in Carrollton?
There are 1,469 People in the Labor Forcein in Carrollton.
What is the Percentage of People in the Labor Force in Carrollton?
56.7% of People are in the Labor Force in Carrollton.
What is the Unemployment Rate in Carrollton?
Unemployment Rate in Carrollton is 8.0%.