Zip Codes with the Highest Percentage of Population Employed in Food Preparation & Serving in Somerset, KY
RELATED REPORTS & OPTIONS
Food Preparation & Serving
Somerset
Compare Zip Codes
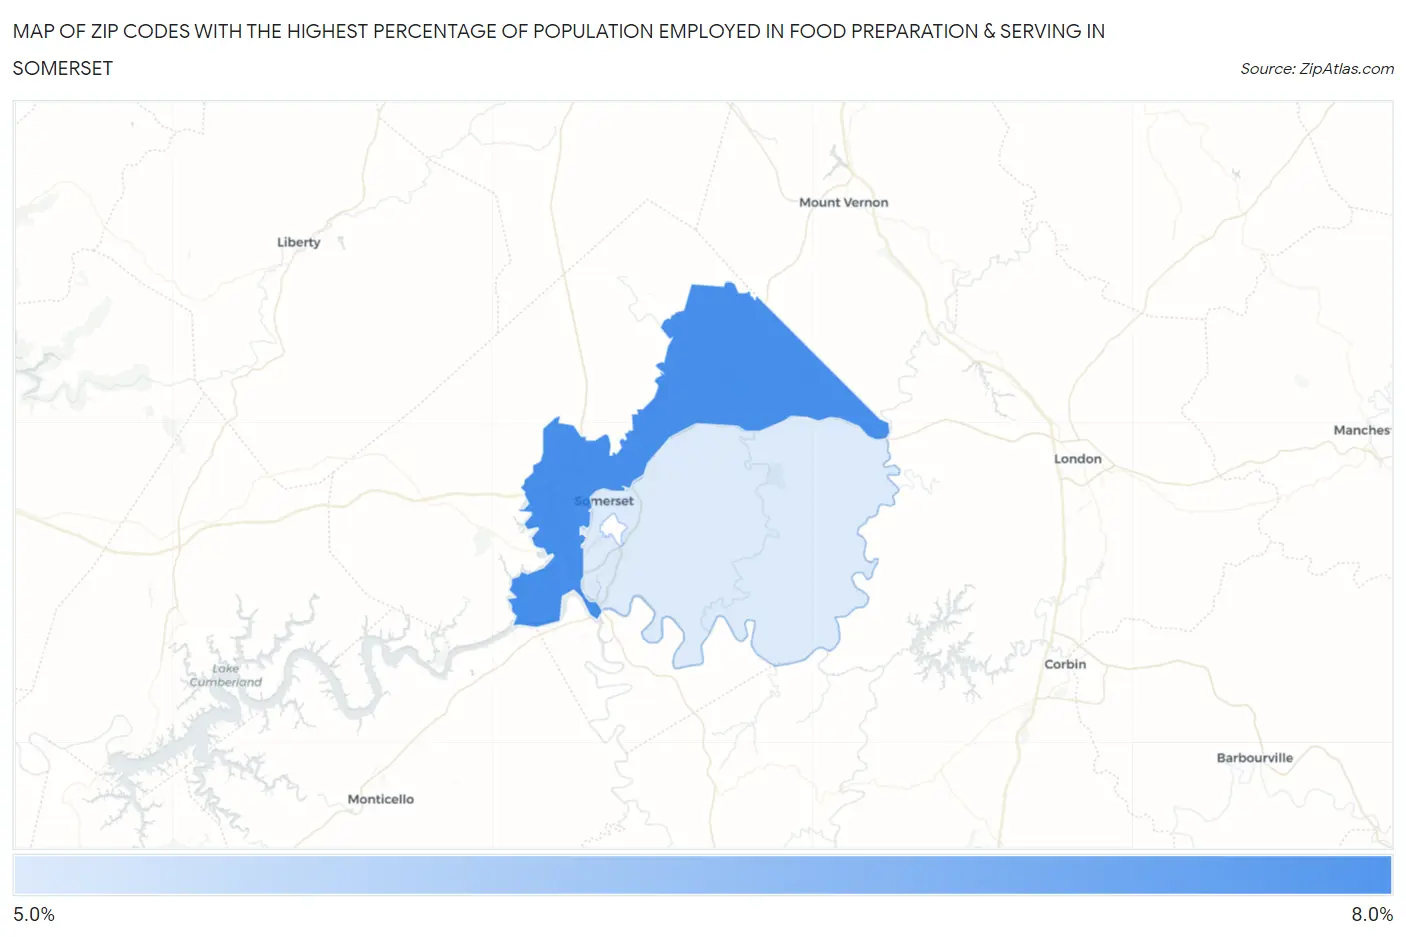
Map of Zip Codes with the Highest Percentage of Population Employed in Food Preparation & Serving in Somerset
5.5%
6.5%
Zip Codes with the Highest Percentage of Population Employed in Food Preparation & Serving in Somerset, KY
| Zip Code | % Employed | vs State | vs National | |
| 1. | 42503 | 6.5% | 5.1%(+1.39)#171 | 5.3%(+1.19)#7,943 |
| 2. | 42501 | 5.5% | 5.1%(+0.415)#216 | 5.3%(+0.214)#11,065 |
1
Common Questions
What are the Top Zip Codes with the Highest Percentage of Population Employed in Food Preparation & Serving in Somerset, KY?
Top Zip Codes with the Highest Percentage of Population Employed in Food Preparation & Serving in Somerset, KY are:
What zip code has the Highest Percentage of Population Employed in Food Preparation & Serving in Somerset, KY?
42503 has the Highest Percentage of Population Employed in Food Preparation & Serving in Somerset, KY with 6.5%.
What is the Percentage of Population Employed in Food Preparation & Serving in Somerset, KY?
Percentage of Population Employed in Food Preparation & Serving in Somerset is 10.0%.
What is the Percentage of Population Employed in Food Preparation & Serving in Kentucky?
Percentage of Population Employed in Food Preparation & Serving in Kentucky is 5.1%.
What is the Percentage of Population Employed in Food Preparation & Serving in the United States?
Percentage of Population Employed in Food Preparation & Serving in the United States is 5.3%.