Collier County, FL Map & Demographics
Collier County Map
Collier County Overview
$56,666
PER CAPITA INCOME
$98,919
AVG FAMILY INCOME
$82,011
AVG HOUSEHOLD INCOME
22.3%
WAGE / INCOME GAP [ % ]
77.7¢/ $1
WAGE / INCOME GAP [ $ ]
$10,430
FAMILY INCOME DEFICIT
0.53
INEQUALITY / GINI INDEX
380,221
TOTAL POPULATION
188,078
MALE POPULATION
192,143
FEMALE POPULATION
97.88
MALES / 100 FEMALES
102.16
FEMALES / 100 MALES
52.2
MEDIAN AGE
2.9
AVG FAMILY SIZE
2.4
AVG HOUSEHOLD SIZE
169,010
LABOR FORCE [ PEOPLE ]
52.1%
PERCENT IN LABOR FORCE
4.3%
UNEMPLOYMENT RATE
Collier County Area Codes
Income in Collier County
Income Overview in Collier County
Per Capita Income in Collier County is $56,666, while median incomes of families and households are $98,919 and $82,011 respectively.
| Characteristic | Number | Measure |
| Per Capita Income | 380,221 | $56,666 |
| Median Family Income | 105,416 | $98,919 |
| Mean Family Income | 105,416 | $153,048 |
| Median Household Income | 156,768 | $82,011 |
| Mean Household Income | 156,768 | $133,140 |
| Income Deficit | 105,416 | $10,430 |
| Wage / Income Gap (%) | 380,221 | 22.27% |
| Wage / Income Gap ($) | 380,221 | 77.73¢ per $1 |
| Gini / Inequality Index | 380,221 | 0.53 |
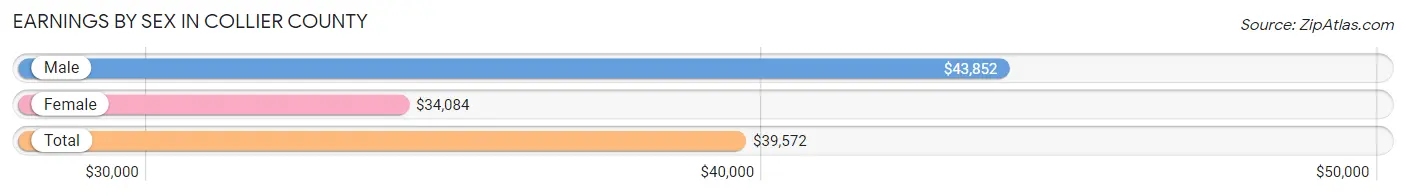
Earnings by Sex in Collier County
Average Earnings in Collier County are $39,572, $43,852 for men and $34,084 for women, a difference of 22.3%.
| Sex | Number | Average Earnings |
| Male | 96,830 (55.1%) | $43,852 |
| Female | 79,020 (44.9%) | $34,084 |
| Total | 175,850 (100.0%) | $39,572 |
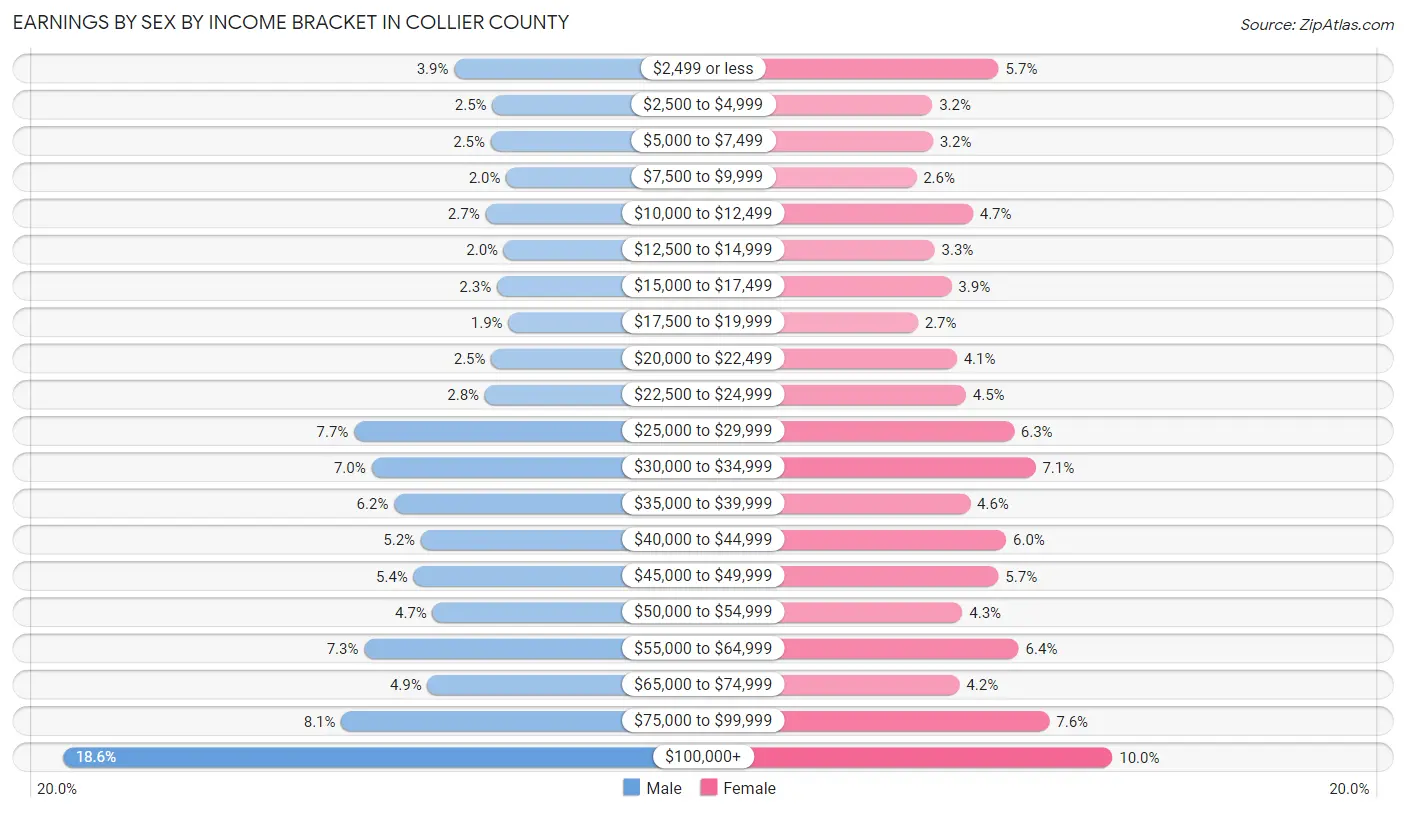
Earnings by Sex by Income Bracket in Collier County
The most common earnings brackets in Collier County are $100,000+ for men (17,986 | 18.6%) and $100,000+ for women (7,859 | 10.0%).
| Income | Male | Female |
| $2,499 or less | 3,772 (3.9%) | 4,494 (5.7%) |
| $2,500 to $4,999 | 2,390 (2.5%) | 2,525 (3.2%) |
| $5,000 to $7,499 | 2,450 (2.5%) | 2,547 (3.2%) |
| $7,500 to $9,999 | 1,888 (1.9%) | 2,051 (2.6%) |
| $10,000 to $12,499 | 2,642 (2.7%) | 3,731 (4.7%) |
| $12,500 to $14,999 | 1,973 (2.0%) | 2,599 (3.3%) |
| $15,000 to $17,499 | 2,224 (2.3%) | 3,100 (3.9%) |
| $17,500 to $19,999 | 1,814 (1.9%) | 2,099 (2.7%) |
| $20,000 to $22,499 | 2,430 (2.5%) | 3,259 (4.1%) |
| $22,500 to $24,999 | 2,662 (2.8%) | 3,526 (4.5%) |
| $25,000 to $29,999 | 7,407 (7.6%) | 4,946 (6.3%) |
| $30,000 to $34,999 | 6,781 (7.0%) | 5,586 (7.1%) |
| $35,000 to $39,999 | 5,957 (6.1%) | 3,650 (4.6%) |
| $40,000 to $44,999 | 4,986 (5.1%) | 4,714 (6.0%) |
| $45,000 to $49,999 | 5,251 (5.4%) | 4,490 (5.7%) |
| $50,000 to $54,999 | 4,560 (4.7%) | 3,419 (4.3%) |
| $55,000 to $64,999 | 7,043 (7.3%) | 5,089 (6.4%) |
| $65,000 to $74,999 | 4,741 (4.9%) | 3,337 (4.2%) |
| $75,000 to $99,999 | 7,873 (8.1%) | 5,999 (7.6%) |
| $100,000+ | 17,986 (18.6%) | 7,859 (10.0%) |
| Total | 96,830 (100.0%) | 79,020 (100.0%) |
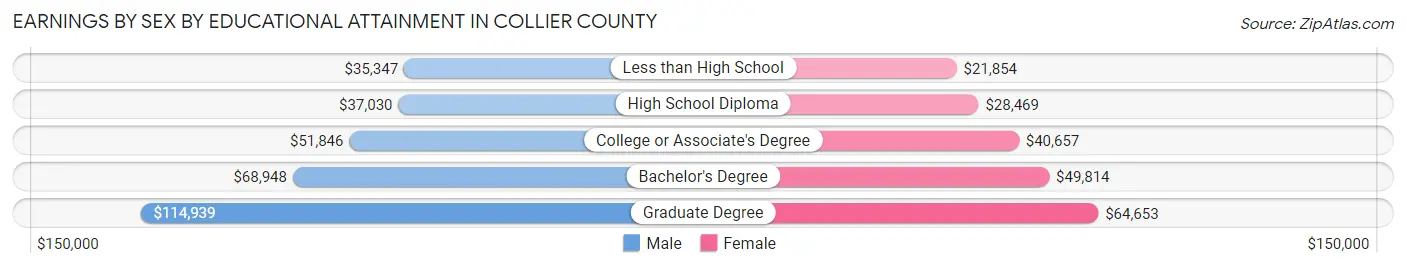
Earnings by Sex by Educational Attainment in Collier County
Average earnings in Collier County are $47,492 for men and $38,318 for women, a difference of 19.3%. Men with an educational attainment of graduate degree enjoy the highest average annual earnings of $114,939, while those with less than high school education earn the least with $35,347. Women with an educational attainment of graduate degree earn the most with the average annual earnings of $64,653, while those with less than high school education have the smallest earnings of $21,854.
| Educational Attainment | Male Income | Female Income |
| Less than High School | $35,347 | $21,854 |
| High School Diploma | $37,030 | $28,469 |
| College or Associate's Degree | $51,846 | $40,657 |
| Bachelor's Degree | $68,948 | $49,814 |
| Graduate Degree | $114,939 | $64,653 |
| Total | $47,492 | $38,318 |
Family Income in Collier County
Family Income Brackets in Collier County
According to the Collier County family income data, there are 20,451 families falling into the $100,000 to $149,999 income range, which is the most common income bracket and makes up 19.4% of all families. Conversely, the $10,000 to $14,999 income bracket is the least frequent group with only 1,687 families (1.6%) belonging to this category.
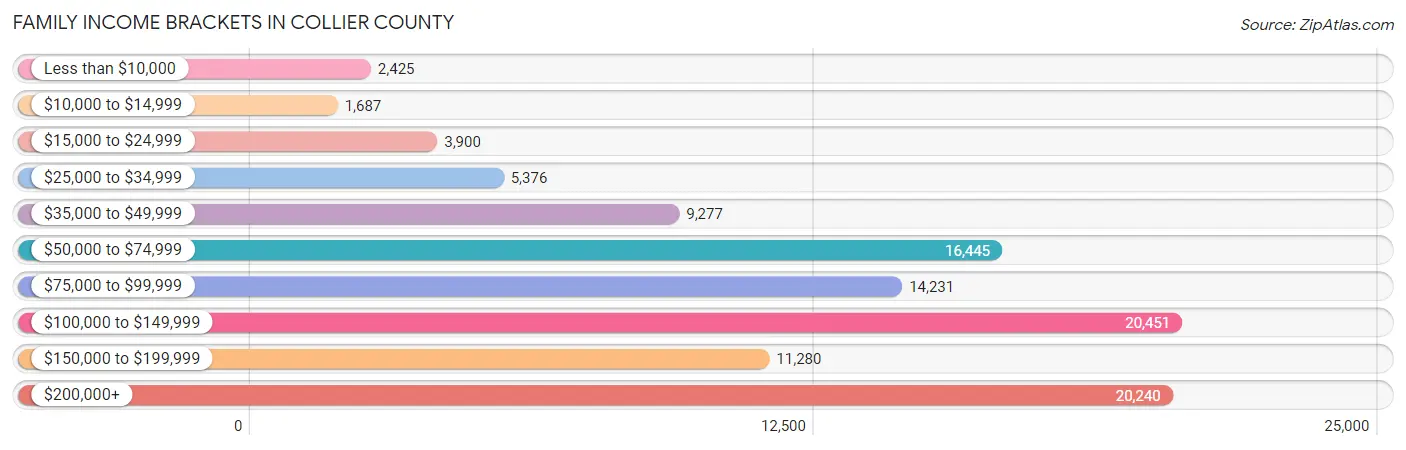
| Income Bracket | # Families | % Families |
| Less than $10,000 | 2,425 | 2.3% |
| $10,000 to $14,999 | 1,687 | 1.6% |
| $15,000 to $24,999 | 3,900 | 3.7% |
| $25,000 to $34,999 | 5,376 | 5.1% |
| $35,000 to $49,999 | 9,277 | 8.8% |
| $50,000 to $74,999 | 16,445 | 15.6% |
| $75,000 to $99,999 | 14,231 | 13.5% |
| $100,000 to $149,999 | 20,451 | 19.4% |
| $150,000 to $199,999 | 11,280 | 10.7% |
| $200,000+ | 20,240 | 19.2% |
Family Income by Famaliy Size in Collier County
7+ person families (1,124 | 1.1%) account for the highest median family income in Collier County with $111,207 per family, while 2-person families (66,424 | 63.0%) have the highest median income of $50,979 per family member.
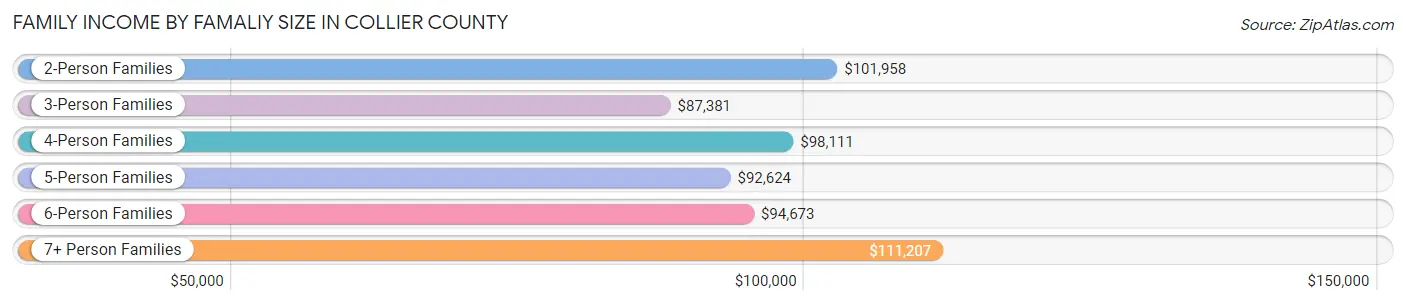
| Income Bracket | # Families | Median Income |
| 2-Person Families | 66,424 (63.0%) | $101,958 |
| 3-Person Families | 17,678 (16.8%) | $87,381 |
| 4-Person Families | 11,980 (11.4%) | $98,111 |
| 5-Person Families | 5,613 (5.3%) | $92,624 |
| 6-Person Families | 2,597 (2.5%) | $94,673 |
| 7+ Person Families | 1,124 (1.1%) | $111,207 |
| Total | 105,416 (100.0%) | $98,919 |
Family Income by Number of Earners in Collier County
The median family income in Collier County is $98,919, with families comprising 3+ earners (9,047) having the highest median family income of $117,325, while families with 1 earner (30,592) have the lowest median family income of $75,226, accounting for 8.6% and 29.0% of families, respectively.
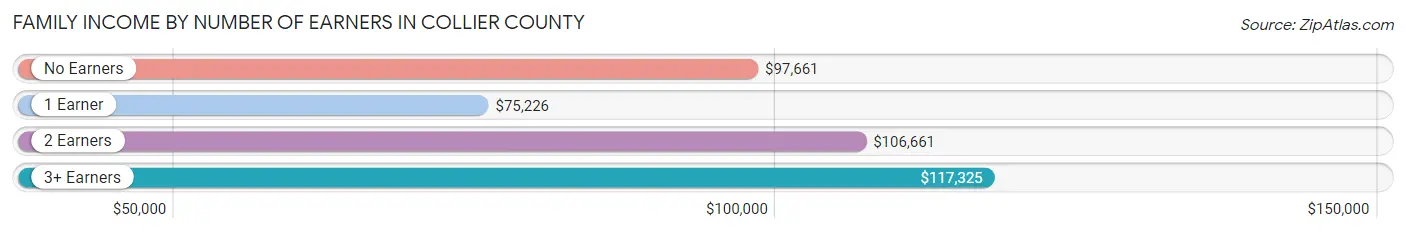
| Number of Earners | # Families | Median Income |
| No Earners | 32,241 (30.6%) | $97,661 |
| 1 Earner | 30,592 (29.0%) | $75,226 |
| 2 Earners | 33,536 (31.8%) | $106,661 |
| 3+ Earners | 9,047 (8.6%) | $117,325 |
| Total | 105,416 (100.0%) | $98,919 |
Household Income in Collier County
Household Income Brackets in Collier County
With 26,023 households falling in the category, the $100,000 to $149,999 income range is the most frequent in Collier County, accounting for 16.6% of all households. In contrast, only 4,076 households (2.6%) fall into the $10,000 to $14,999 income bracket, making it the least populous group.
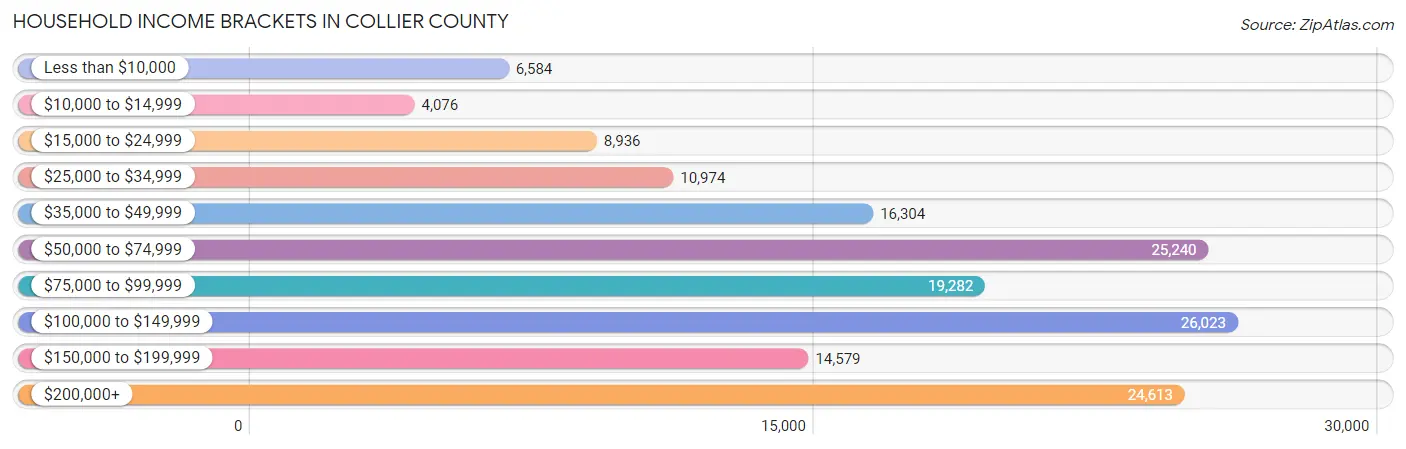
| Income Bracket | # Households | % Households |
| Less than $10,000 | 6,584 | 4.2% |
| $10,000 to $14,999 | 4,076 | 2.6% |
| $15,000 to $24,999 | 8,936 | 5.7% |
| $25,000 to $34,999 | 10,974 | 7.0% |
| $35,000 to $49,999 | 16,304 | 10.4% |
| $50,000 to $74,999 | 25,240 | 16.1% |
| $75,000 to $99,999 | 19,282 | 12.3% |
| $100,000 to $149,999 | 26,023 | 16.6% |
| $150,000 to $199,999 | 14,579 | 9.3% |
| $200,000+ | 24,613 | 15.7% |
Household Income by Householder Age in Collier County
The median household income in Collier County is $82,011, with the highest median household income of $93,460 found in the 45 to 64 years age bracket for the primary householder. A total of 49,588 households (31.6%) fall into this category. Meanwhile, the 15 to 24 years age bracket for the primary householder has the lowest median household income of $41,989, with 2,292 households (1.5%) in this group.
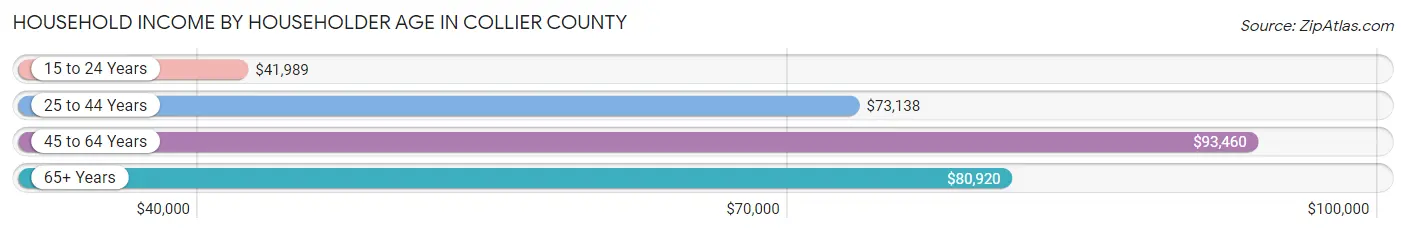
| Income Bracket | # Households | Median Income |
| 15 to 24 Years | 2,292 (1.5%) | $41,989 |
| 25 to 44 Years | 30,399 (19.4%) | $73,138 |
| 45 to 64 Years | 49,588 (31.6%) | $93,460 |
| 65+ Years | 74,489 (47.5%) | $80,920 |
| Total | 156,768 (100.0%) | $82,011 |
Poverty in Collier County
Income Below Poverty by Sex and Age in Collier County
With 10.0% poverty level for males and 10.8% for females among the residents of Collier County, 6 to 11 year old males and 15 year old females are the most vulnerable to poverty, with 2,120 males (20.7%) and 318 females (17.6%) in their respective age groups living below the poverty level.
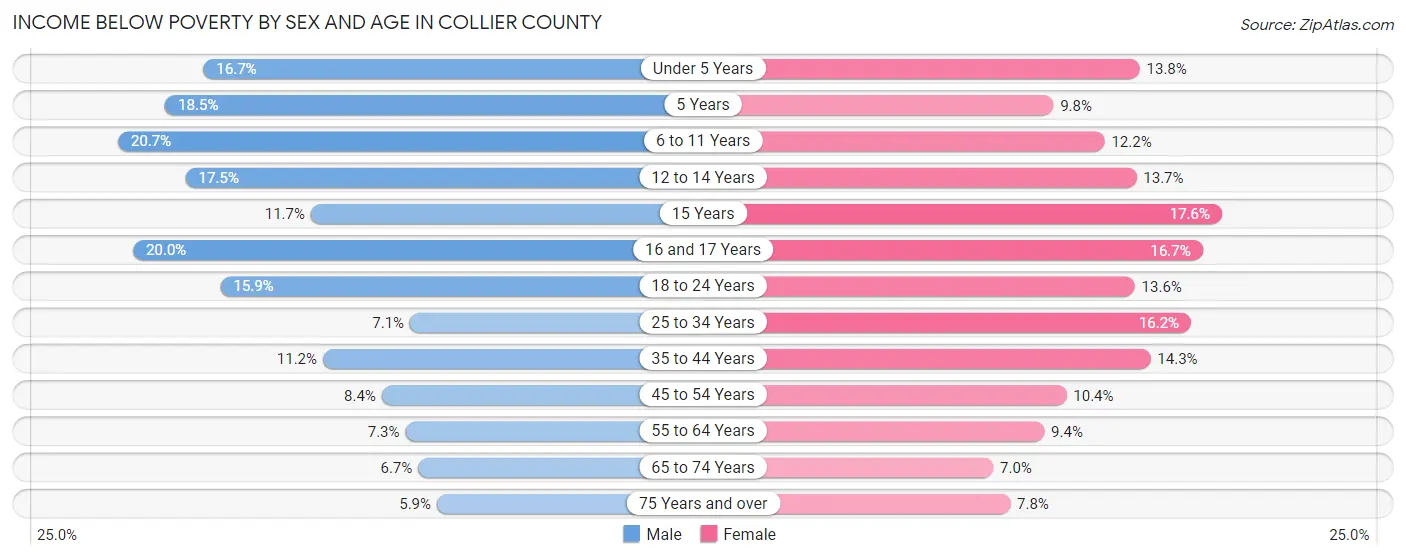
| Age Bracket | Male | Female |
| Under 5 Years | 1,324 (16.7%) | 1,063 (13.8%) |
| 5 Years | 285 (18.5%) | 148 (9.8%) |
| 6 to 11 Years | 2,120 (20.7%) | 1,251 (12.2%) |
| 12 to 14 Years | 1,094 (17.5%) | 728 (13.7%) |
| 15 Years | 283 (11.7%) | 318 (17.6%) |
| 16 and 17 Years | 711 (20.0%) | 659 (16.7%) |
| 18 to 24 Years | 2,038 (15.9%) | 1,529 (13.6%) |
| 25 to 34 Years | 1,308 (7.1%) | 2,691 (16.2%) |
| 35 to 44 Years | 2,108 (11.2%) | 2,583 (14.3%) |
| 45 to 54 Years | 1,744 (8.4%) | 2,229 (10.4%) |
| 55 to 64 Years | 1,828 (7.3%) | 2,567 (9.4%) |
| 65 to 74 Years | 1,887 (6.7%) | 2,234 (7.0%) |
| 75 Years and over | 1,793 (5.9%) | 2,608 (7.8%) |
| Total | 18,523 (10.0%) | 20,608 (10.8%) |
Income Above Poverty by Sex and Age in Collier County
According to the poverty statistics in Collier County, males aged 75 years and over and females aged 65 to 74 years are the age groups that are most secure financially, with 94.1% of males and 93.0% of females in these age groups living above the poverty line.
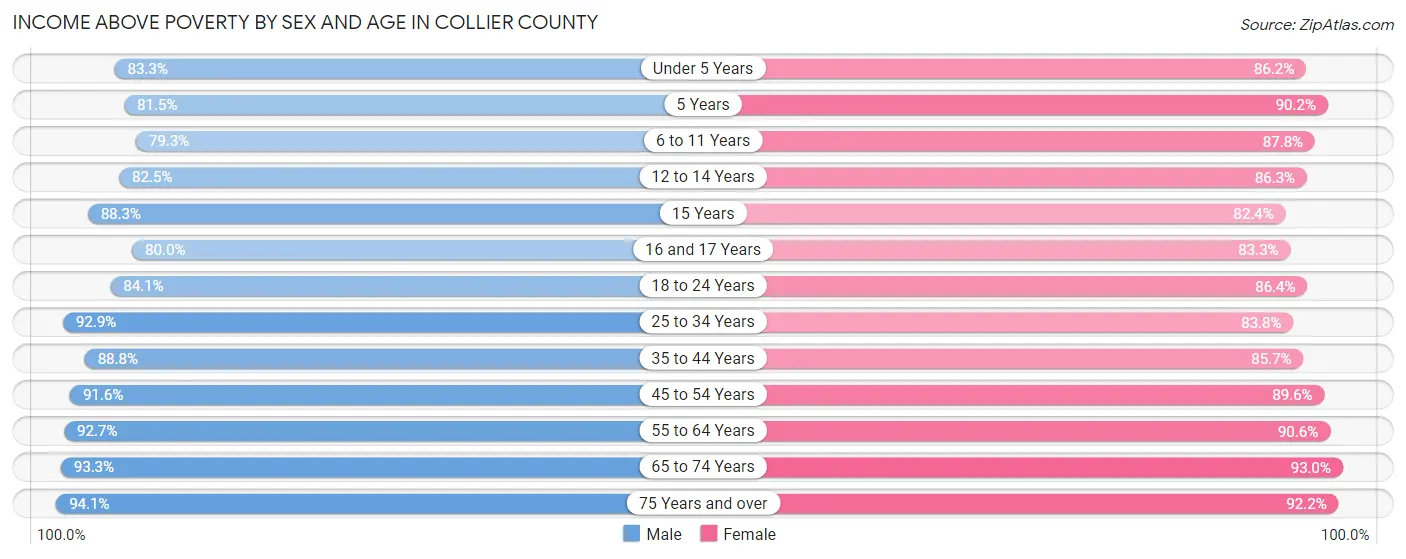
| Age Bracket | Male | Female |
| Under 5 Years | 6,605 (83.3%) | 6,631 (86.2%) |
| 5 Years | 1,257 (81.5%) | 1,361 (90.2%) |
| 6 to 11 Years | 8,135 (79.3%) | 9,011 (87.8%) |
| 12 to 14 Years | 5,146 (82.5%) | 4,598 (86.3%) |
| 15 Years | 2,132 (88.3%) | 1,486 (82.4%) |
| 16 and 17 Years | 2,850 (80.0%) | 3,277 (83.3%) |
| 18 to 24 Years | 10,773 (84.1%) | 9,724 (86.4%) |
| 25 to 34 Years | 17,050 (92.9%) | 13,924 (83.8%) |
| 35 to 44 Years | 16,788 (88.8%) | 15,452 (85.7%) |
| 45 to 54 Years | 18,943 (91.6%) | 19,161 (89.6%) |
| 55 to 64 Years | 23,098 (92.7%) | 24,774 (90.6%) |
| 65 to 74 Years | 26,093 (93.3%) | 29,593 (93.0%) |
| 75 Years and over | 28,750 (94.1%) | 30,806 (92.2%) |
| Total | 167,620 (90.0%) | 169,798 (89.2%) |
Income Below Poverty Among Married-Couple Families in Collier County
The poverty statistics for married-couple families in Collier County show that 4.8% or 4,110 of the total 86,134 families live below the poverty line. Families with 5 or more children have the highest poverty rate of 23.2%, comprising of 35 families. On the other hand, families with no children have the lowest poverty rate of 3.9%, which includes 2,536 families.
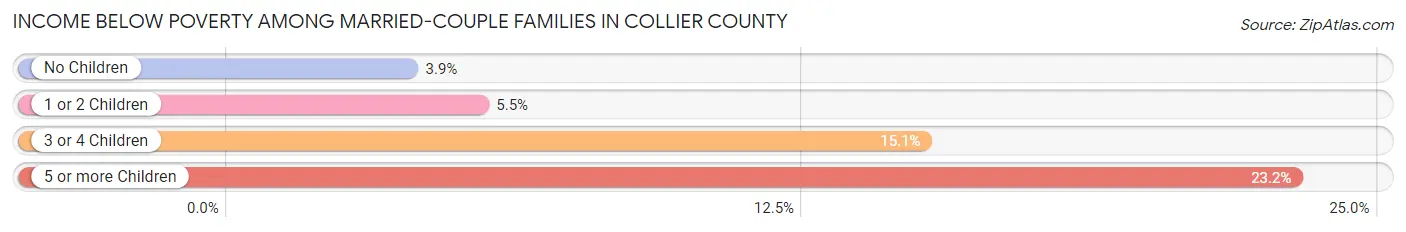
| Children | Above Poverty | Below Poverty |
| No Children | 61,969 (96.1%) | 2,536 (3.9%) |
| 1 or 2 Children | 16,731 (94.5%) | 968 (5.5%) |
| 3 or 4 Children | 3,208 (84.9%) | 571 (15.1%) |
| 5 or more Children | 116 (76.8%) | 35 (23.2%) |
| Total | 82,024 (95.2%) | 4,110 (4.8%) |
Income Below Poverty Among Single-Parent Households in Collier County
According to the poverty data in Collier County, 10.5% or 661 single-father households and 17.5% or 2,272 single-mother households are living below the poverty line. Among single-father households, those with 3 or 4 children have the highest poverty rate, with 73 households (26.6%) experiencing poverty. Likewise, among single-mother households, those with 5 or more children have the highest poverty rate, with 81 households (76.4%) falling below the poverty line.
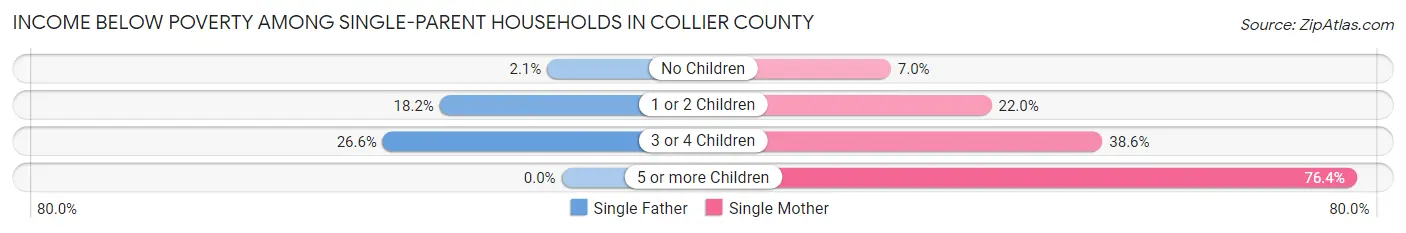
| Children | Single Father | Single Mother |
| No Children | 68 (2.1%) | 385 (7.0%) |
| 1 or 2 Children | 520 (18.1%) | 1,387 (22.0%) |
| 3 or 4 Children | 73 (26.6%) | 419 (38.6%) |
| 5 or more Children | 0 (0.0%) | 81 (76.4%) |
| Total | 661 (10.5%) | 2,272 (17.5%) |
Income Below Poverty Among Married-Couple vs Single-Parent Households in Collier County
The poverty data for Collier County shows that 4,110 of the married-couple family households (4.8%) and 2,933 of the single-parent households (15.2%) are living below the poverty level. Within the married-couple family households, those with 5 or more children have the highest poverty rate, with 35 households (23.2%) falling below the poverty line. Among the single-parent households, those with 5 or more children have the highest poverty rate, with 81 household (76.4%) living below poverty.
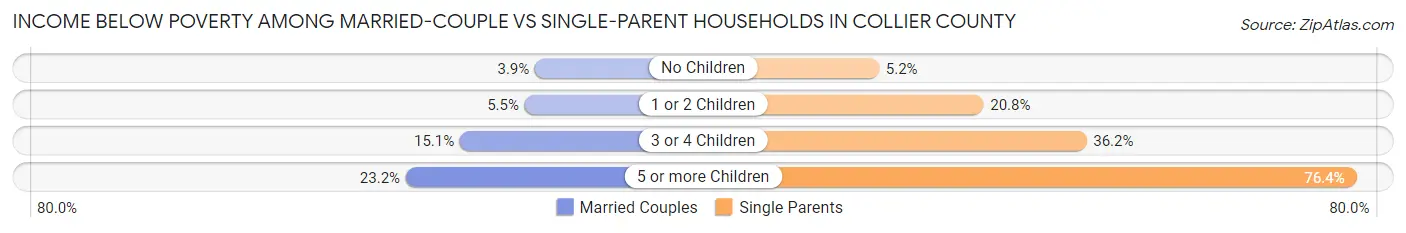
| Children | Married-Couple Families | Single-Parent Households |
| No Children | 2,536 (3.9%) | 453 (5.2%) |
| 1 or 2 Children | 968 (5.5%) | 1,907 (20.8%) |
| 3 or 4 Children | 571 (15.1%) | 492 (36.1%) |
| 5 or more Children | 35 (23.2%) | 81 (76.4%) |
| Total | 4,110 (4.8%) | 2,933 (15.2%) |
Race in Collier County
The most populous races in Collier County are White / Caucasian (278,439 | 73.2%), Hispanic or Latino (108,822 | 28.6%), and Two or more Races (55,539 | 14.6%).
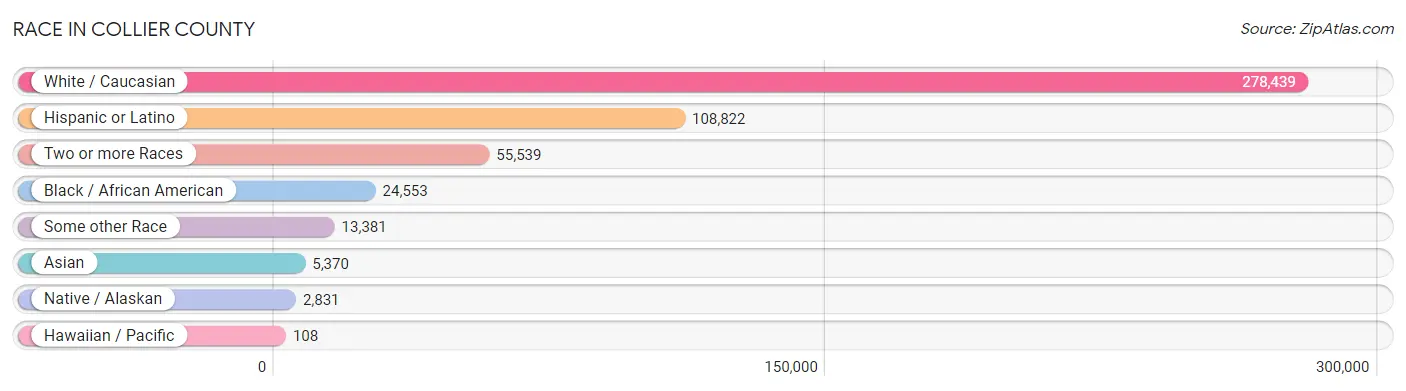
| Race | # Population | % Population |
| Asian | 5,370 | 1.4% |
| Black / African American | 24,553 | 6.5% |
| Hawaiian / Pacific | 108 | 0.0% |
| Hispanic or Latino | 108,822 | 28.6% |
| Native / Alaskan | 2,831 | 0.7% |
| White / Caucasian | 278,439 | 73.2% |
| Two or more Races | 55,539 | 14.6% |
| Some other Race | 13,381 | 3.5% |
| Total | 380,221 | 100.0% |
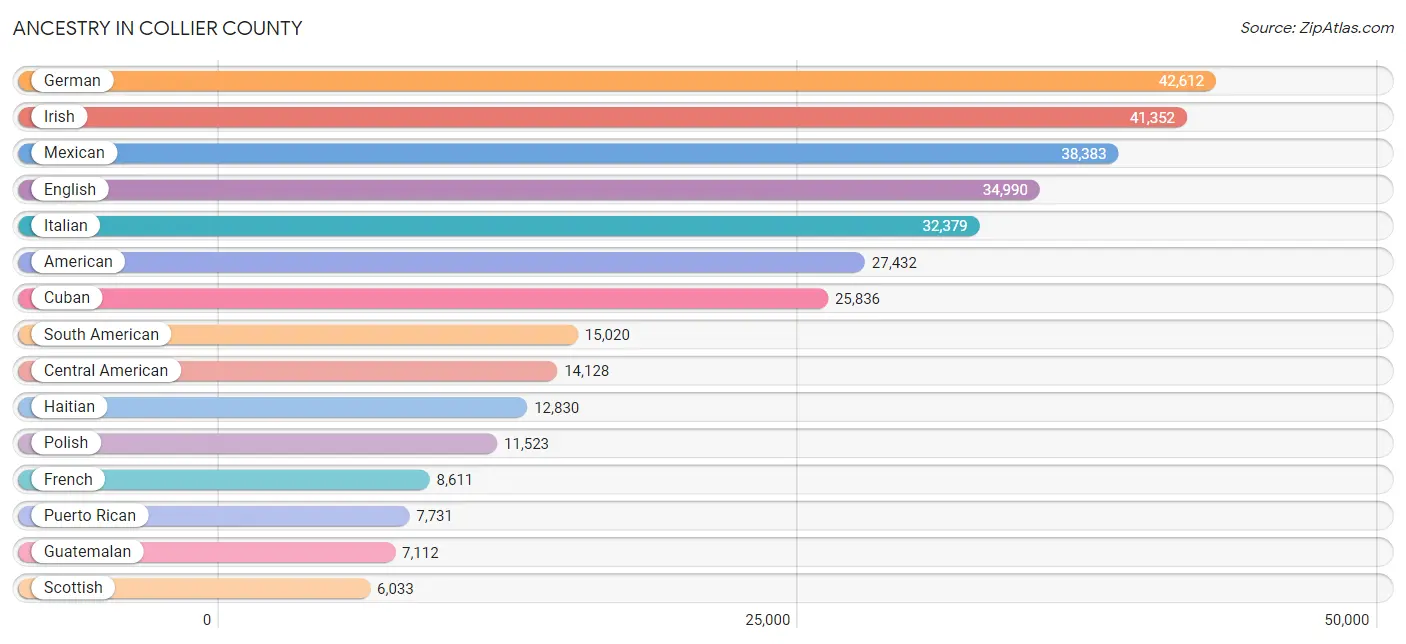
Ancestry in Collier County
The most populous ancestries reported in Collier County are German (42,612 | 11.2%), Irish (41,352 | 10.9%), Mexican (38,383 | 10.1%), English (34,990 | 9.2%), and Italian (32,379 | 8.5%), together accounting for 49.9% of all Collier County residents.
| Ancestry | # Population | % Population |
| African | 533 | 0.1% |
| Alaska Native | 26 | 0.0% |
| Albanian | 1,490 | 0.4% |
| American | 27,432 | 7.2% |
| Apache | 38 | 0.0% |
| Arab | 1,702 | 0.4% |
| Argentinean | 1,434 | 0.4% |
| Armenian | 547 | 0.1% |
| Australian | 18 | 0.0% |
| Austrian | 1,156 | 0.3% |
| Bahamian | 133 | 0.0% |
| Barbadian | 10 | 0.0% |
| Basque | 120 | 0.0% |
| Belgian | 510 | 0.1% |
| Belizean | 101 | 0.0% |
| Bhutanese | 335 | 0.1% |
| Blackfeet | 63 | 0.0% |
| Bolivian | 1,205 | 0.3% |
| Brazilian | 536 | 0.1% |
| British | 2,083 | 0.5% |
| British West Indian | 68 | 0.0% |
| Bulgarian | 208 | 0.1% |
| Burmese | 547 | 0.1% |
| Cajun | 72 | 0.0% |
| Canadian | 1,730 | 0.4% |
| Celtic | 227 | 0.1% |
| Central American | 14,128 | 3.7% |
| Central American Indian | 1,757 | 0.5% |
| Cherokee | 346 | 0.1% |
| Chickasaw | 11 | 0.0% |
| Chilean | 234 | 0.1% |
| Chinese | 17 | 0.0% |
| Chippewa | 30 | 0.0% |
| Choctaw | 37 | 0.0% |
| Colombian | 5,449 | 1.4% |
| Costa Rican | 373 | 0.1% |
| Creek | 64 | 0.0% |
| Croatian | 747 | 0.2% |
| Crow | 22 | 0.0% |
| Cuban | 25,836 | 6.8% |
| Czech | 1,354 | 0.4% |
| Czechoslovakian | 705 | 0.2% |
| Danish | 1,062 | 0.3% |
| Delaware | 5 | 0.0% |
| Dominican | 3,059 | 0.8% |
| Dutch | 3,606 | 0.9% |
| Eastern European | 1,362 | 0.4% |
| Ecuadorian | 1,102 | 0.3% |
| Egyptian | 81 | 0.0% |
| English | 34,990 | 9.2% |
| Estonian | 89 | 0.0% |
| European | 5,436 | 1.4% |
| Filipino | 27 | 0.0% |
| Finnish | 506 | 0.1% |
| French | 8,611 | 2.3% |
| French American Indian | 20 | 0.0% |
| French Canadian | 2,954 | 0.8% |
| German | 42,612 | 11.2% |
| Ghanaian | 30 | 0.0% |
| Greek | 1,819 | 0.5% |
| Guamanian / Chamorro | 24 | 0.0% |
| Guatemalan | 7,112 | 1.9% |
| Guyanese | 79 | 0.0% |
| Haitian | 12,830 | 3.4% |
| Honduran | 3,449 | 0.9% |
| Hungarian | 2,453 | 0.6% |
| Icelander | 14 | 0.0% |
| Indian (Asian) | 1,386 | 0.4% |
| Indonesian | 56 | 0.0% |
| Inupiat | 8 | 0.0% |
| Iranian | 53 | 0.0% |
| Iraqi | 40 | 0.0% |
| Irish | 41,352 | 10.9% |
| Iroquois | 13 | 0.0% |
| Israeli | 79 | 0.0% |
| Italian | 32,379 | 8.5% |
| Jamaican | 1,244 | 0.3% |
| Japanese | 18 | 0.0% |
| Jordanian | 19 | 0.0% |
| Korean | 2,196 | 0.6% |
| Laotian | 28 | 0.0% |
| Latvian | 86 | 0.0% |
| Lebanese | 1,043 | 0.3% |
| Lithuanian | 1,234 | 0.3% |
| Luxembourger | 69 | 0.0% |
| Macedonian | 74 | 0.0% |
| Maltese | 40 | 0.0% |
| Mexican | 38,383 | 10.1% |
| Mexican American Indian | 848 | 0.2% |
| Mongolian | 9 | 0.0% |
| Moroccan | 15 | 0.0% |
| Native Hawaiian | 130 | 0.0% |
| Navajo | 85 | 0.0% |
| New Zealander | 16 | 0.0% |
| Nicaraguan | 1,339 | 0.4% |
| Northern European | 993 | 0.3% |
| Norwegian | 3,599 | 0.9% |
| Pakistani | 154 | 0.0% |
| Palestinian | 42 | 0.0% |
| Panamanian | 367 | 0.1% |
| Paraguayan | 88 | 0.0% |
| Pennsylvania German | 397 | 0.1% |
| Peruvian | 1,678 | 0.4% |
| Polish | 11,523 | 3.0% |
| Portuguese | 1,315 | 0.4% |
| Puerto Rican | 7,731 | 2.0% |
| Romanian | 1,659 | 0.4% |
| Russian | 3,518 | 0.9% |
| Salvadoran | 1,488 | 0.4% |
| Samoan | 84 | 0.0% |
| Scandinavian | 615 | 0.2% |
| Scotch-Irish | 1,923 | 0.5% |
| Scottish | 6,033 | 1.6% |
| Seminole | 338 | 0.1% |
| Serbian | 295 | 0.1% |
| Shoshone | 8 | 0.0% |
| Sioux | 9 | 0.0% |
| Slavic | 344 | 0.1% |
| Slovak | 991 | 0.3% |
| Slovene | 219 | 0.1% |
| South African | 285 | 0.1% |
| South American | 15,020 | 4.0% |
| South American Indian | 206 | 0.1% |
| Spaniard | 1,216 | 0.3% |
| Spanish | 912 | 0.2% |
| Sri Lankan | 935 | 0.3% |
| Subsaharan African | 873 | 0.2% |
| Swedish | 4,582 | 1.2% |
| Swiss | 1,255 | 0.3% |
| Syrian | 298 | 0.1% |
| Thai | 1,823 | 0.5% |
| Trinidadian and Tobagonian | 140 | 0.0% |
| Turkish | 307 | 0.1% |
| U.S. Virgin Islander | 64 | 0.0% |
| Ukrainian | 1,524 | 0.4% |
| Uruguayan | 370 | 0.1% |
| Venezuelan | 3,446 | 0.9% |
| Welsh | 1,852 | 0.5% |
| West Indian | 180 | 0.1% |
| Yaqui | 8 | 0.0% |
| Yugoslavian | 151 | 0.0% | View All 141 Rows |
Immigrants in Collier County
The most numerous immigrant groups reported in Collier County came from Latin America (69,313 | 18.2%), Caribbean (32,502 | 8.6%), Central America (23,539 | 6.2%), Cuba (18,677 | 4.9%), and Europe (15,566 | 4.1%), together accounting for 42.0% of all Collier County residents.
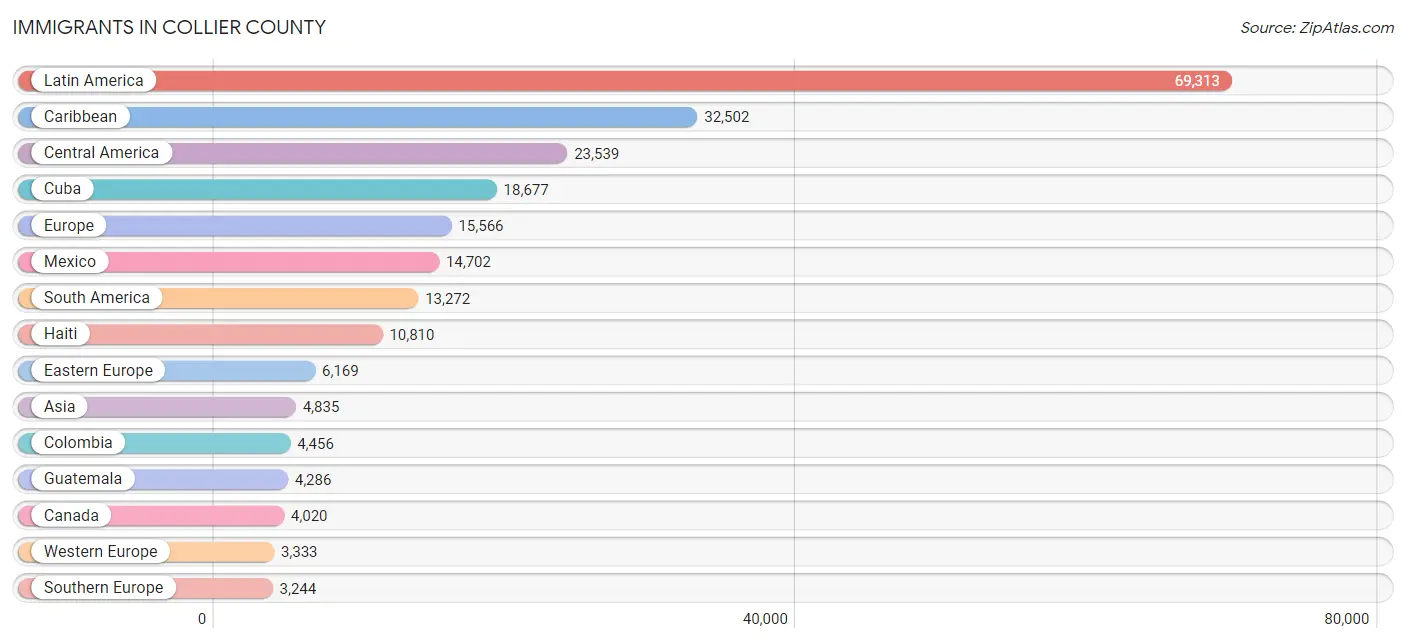
| Immigration Origin | # Population | % Population |
| Africa | 727 | 0.2% |
| Albania | 986 | 0.3% |
| Argentina | 992 | 0.3% |
| Asia | 4,835 | 1.3% |
| Australia | 43 | 0.0% |
| Austria | 112 | 0.0% |
| Azores | 47 | 0.0% |
| Bahamas | 241 | 0.1% |
| Bangladesh | 12 | 0.0% |
| Barbados | 21 | 0.0% |
| Belarus | 243 | 0.1% |
| Belgium | 80 | 0.0% |
| Belize | 138 | 0.0% |
| Bolivia | 1,010 | 0.3% |
| Bosnia and Herzegovina | 94 | 0.0% |
| Brazil | 783 | 0.2% |
| Bulgaria | 325 | 0.1% |
| Cambodia | 13 | 0.0% |
| Cameroon | 61 | 0.0% |
| Canada | 4,020 | 1.1% |
| Caribbean | 32,502 | 8.6% |
| Central America | 23,539 | 6.2% |
| Chile | 170 | 0.0% |
| China | 576 | 0.2% |
| Colombia | 4,456 | 1.2% |
| Congo | 5 | 0.0% |
| Costa Rica | 248 | 0.1% |
| Croatia | 105 | 0.0% |
| Cuba | 18,677 | 4.9% |
| Czechoslovakia | 497 | 0.1% |
| Denmark | 59 | 0.0% |
| Dominica | 60 | 0.0% |
| Dominican Republic | 1,659 | 0.4% |
| Eastern Africa | 72 | 0.0% |
| Eastern Asia | 912 | 0.2% |
| Eastern Europe | 6,169 | 1.6% |
| Ecuador | 964 | 0.3% |
| Egypt | 106 | 0.0% |
| El Salvador | 978 | 0.3% |
| England | 955 | 0.3% |
| Europe | 15,566 | 4.1% |
| France | 627 | 0.2% |
| Germany | 1,935 | 0.5% |
| Ghana | 30 | 0.0% |
| Greece | 300 | 0.1% |
| Guatemala | 4,286 | 1.1% |
| Guyana | 246 | 0.1% |
| Haiti | 10,810 | 2.8% |
| Honduras | 1,998 | 0.5% |
| Hong Kong | 63 | 0.0% |
| Hungary | 189 | 0.1% |
| India | 1,086 | 0.3% |
| Indonesia | 10 | 0.0% |
| Iran | 23 | 0.0% |
| Iraq | 15 | 0.0% |
| Ireland | 301 | 0.1% |
| Israel | 61 | 0.0% |
| Italy | 2,049 | 0.5% |
| Jamaica | 863 | 0.2% |
| Japan | 53 | 0.0% |
| Jordan | 22 | 0.0% |
| Kazakhstan | 21 | 0.0% |
| Korea | 283 | 0.1% |
| Latin America | 69,313 | 18.2% |
| Latvia | 30 | 0.0% |
| Lebanon | 116 | 0.0% |
| Lithuania | 103 | 0.0% |
| Malaysia | 184 | 0.1% |
| Mexico | 14,702 | 3.9% |
| Middle Africa | 66 | 0.0% |
| Moldova | 136 | 0.0% |
| Nepal | 12 | 0.0% |
| Netherlands | 305 | 0.1% |
| Nicaragua | 953 | 0.3% |
| Nigeria | 8 | 0.0% |
| North Macedonia | 60 | 0.0% |
| Northern Africa | 119 | 0.0% |
| Northern Europe | 2,748 | 0.7% |
| Norway | 73 | 0.0% |
| Oceania | 61 | 0.0% |
| Pakistan | 38 | 0.0% |
| Panama | 236 | 0.1% |
| Peru | 1,424 | 0.4% |
| Philippines | 953 | 0.3% |
| Poland | 1,028 | 0.3% |
| Portugal | 172 | 0.1% |
| Romania | 974 | 0.3% |
| Russia | 595 | 0.2% |
| Saudi Arabia | 58 | 0.0% |
| Scotland | 163 | 0.0% |
| Serbia | 137 | 0.0% |
| South Africa | 386 | 0.1% |
| South America | 13,272 | 3.5% |
| South Central Asia | 1,375 | 0.4% |
| South Eastern Asia | 1,977 | 0.5% |
| Southern Europe | 3,244 | 0.9% |
| Spain | 708 | 0.2% |
| Sri Lanka | 49 | 0.0% |
| Sweden | 147 | 0.0% |
| Switzerland | 264 | 0.1% |
| Syria | 56 | 0.0% |
| Taiwan | 84 | 0.0% |
| Thailand | 81 | 0.0% |
| Trinidad and Tobago | 141 | 0.0% |
| Turkey | 183 | 0.1% |
| Uganda | 15 | 0.0% |
| Ukraine | 330 | 0.1% |
| Uruguay | 205 | 0.1% |
| Uzbekistan | 79 | 0.0% |
| Venezuela | 2,951 | 0.8% |
| Vietnam | 700 | 0.2% |
| Western Africa | 38 | 0.0% |
| Western Asia | 539 | 0.1% |
| Western Europe | 3,333 | 0.9% |
| Zimbabwe | 7 | 0.0% | View All 115 Rows |
Sex and Age in Collier County
Sex and Age in Collier County
The most populous age groups in Collier County are 65 to 69 Years (14,741 | 7.8%) for men and 65 to 69 Years (16,512 | 8.6%) for women.
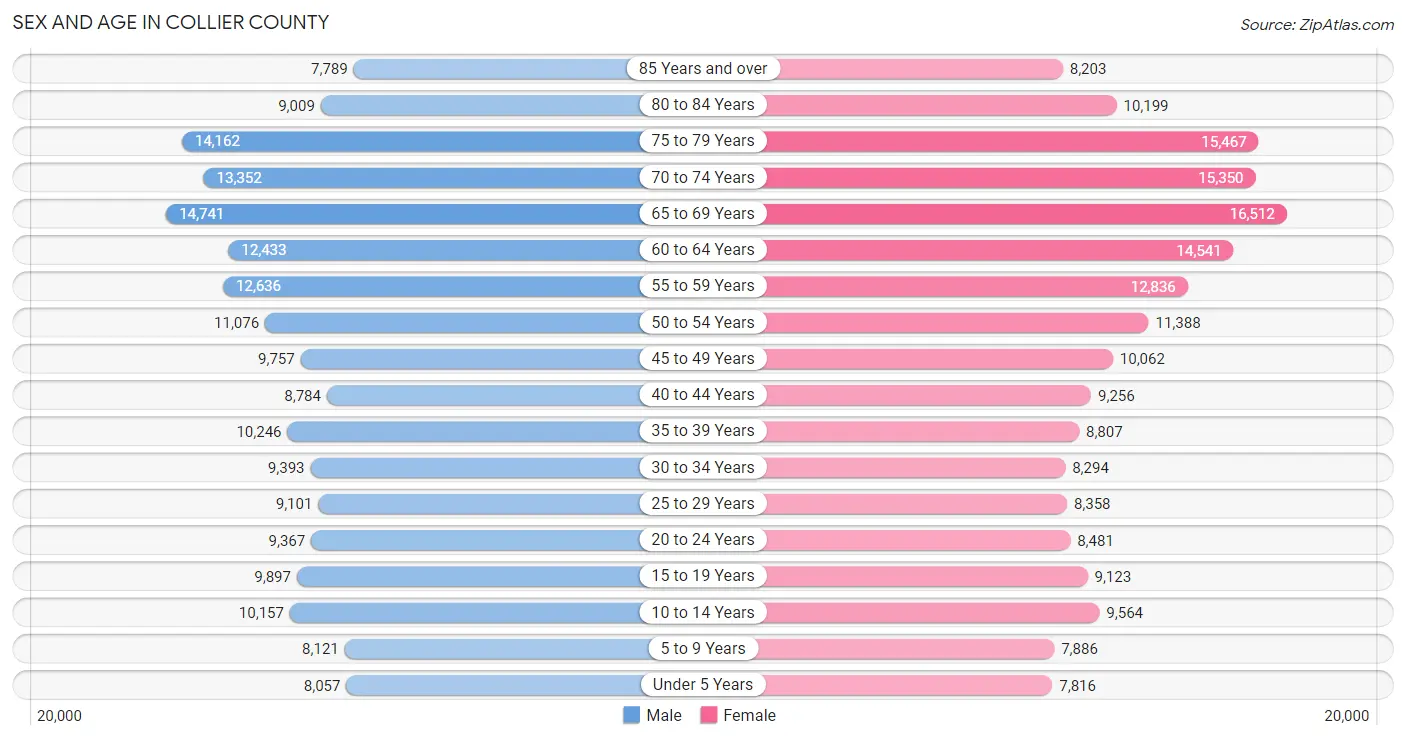
| Age Bracket | Male | Female |
| Under 5 Years | 8,057 (4.3%) | 7,816 (4.1%) |
| 5 to 9 Years | 8,121 (4.3%) | 7,886 (4.1%) |
| 10 to 14 Years | 10,157 (5.4%) | 9,564 (5.0%) |
| 15 to 19 Years | 9,897 (5.3%) | 9,123 (4.8%) |
| 20 to 24 Years | 9,367 (5.0%) | 8,481 (4.4%) |
| 25 to 29 Years | 9,101 (4.8%) | 8,358 (4.3%) |
| 30 to 34 Years | 9,393 (5.0%) | 8,294 (4.3%) |
| 35 to 39 Years | 10,246 (5.4%) | 8,807 (4.6%) |
| 40 to 44 Years | 8,784 (4.7%) | 9,256 (4.8%) |
| 45 to 49 Years | 9,757 (5.2%) | 10,062 (5.2%) |
| 50 to 54 Years | 11,076 (5.9%) | 11,388 (5.9%) |
| 55 to 59 Years | 12,636 (6.7%) | 12,836 (6.7%) |
| 60 to 64 Years | 12,433 (6.6%) | 14,541 (7.6%) |
| 65 to 69 Years | 14,741 (7.8%) | 16,512 (8.6%) |
| 70 to 74 Years | 13,352 (7.1%) | 15,350 (8.0%) |
| 75 to 79 Years | 14,162 (7.5%) | 15,467 (8.1%) |
| 80 to 84 Years | 9,009 (4.8%) | 10,199 (5.3%) |
| 85 Years and over | 7,789 (4.1%) | 8,203 (4.3%) |
| Total | 188,078 (100.0%) | 192,143 (100.0%) |
Families and Households in Collier County
Median Family Size in Collier County
The median family size in Collier County is 2.89 persons per family, with single female/mother families (12,965 | 12.3%) accounting for the largest median family size of 3.5 persons per family. On the other hand, married-couple families (86,134 | 81.7%) represent the smallest median family size with 2.78 persons per family.
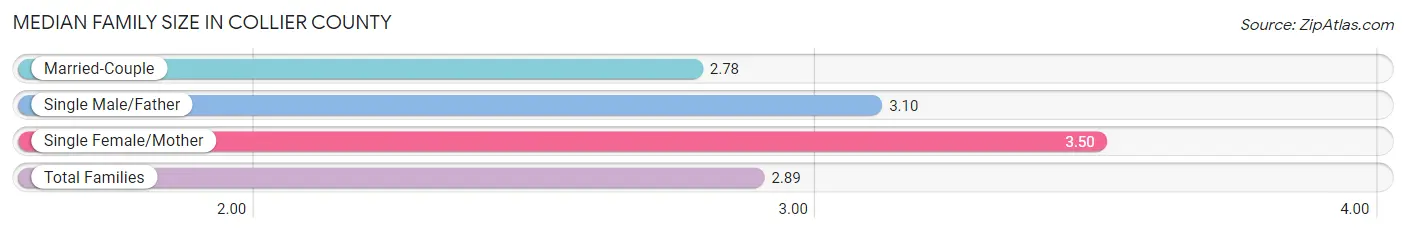
| Family Type | # Families | Family Size |
| Married-Couple | 86,134 (81.7%) | 2.78 |
| Single Male/Father | 6,317 (6.0%) | 3.10 |
| Single Female/Mother | 12,965 (12.3%) | 3.50 |
| Total Families | 105,416 (100.0%) | 2.89 |
Median Household Size in Collier County
The median household size in Collier County is 2.40 persons per household, with single female/mother households (12,965 | 8.3%) accounting for the largest median household size of 3.78 persons per household. non-family households (51,352 | 32.8%) represent the smallest median household size with 1.22 persons per household.
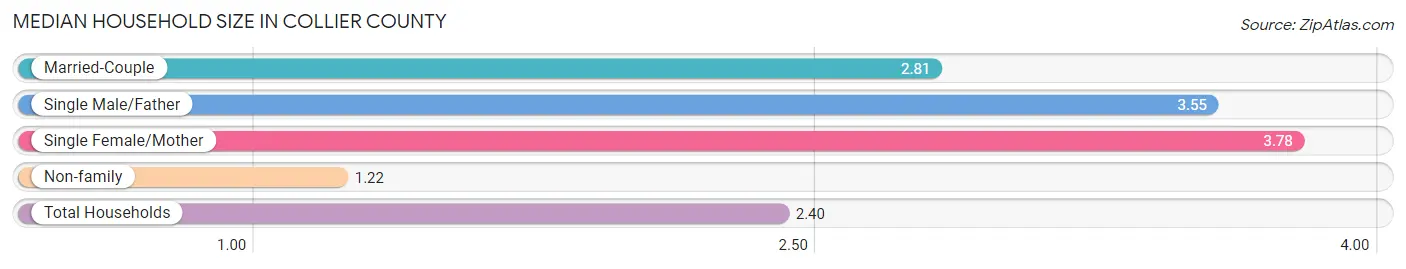
| Household Type | # Households | Household Size |
| Married-Couple | 86,134 (54.9%) | 2.81 |
| Single Male/Father | 6,317 (4.0%) | 3.55 |
| Single Female/Mother | 12,965 (8.3%) | 3.78 |
| Non-family | 51,352 (32.8%) | 1.22 |
| Total Households | 156,768 (100.0%) | 2.40 |
Household Size by Marriage Status in Collier County
Out of a total of 156,768 households in Collier County, 105,416 (67.2%) are family households, while 51,352 (32.8%) are nonfamily households. The most numerous type of family households are 2-person households, comprising 63,537, and the most common type of nonfamily households are 1-person households, comprising 43,843.

| Household Size | Family Households | Nonfamily Households |
| 1-Person Households | - | 43,843 (28.0%) |
| 2-Person Households | 63,537 (40.5%) | 6,349 (4.1%) |
| 3-Person Households | 18,148 (11.6%) | 669 (0.4%) |
| 4-Person Households | 13,503 (8.6%) | 121 (0.1%) |
| 5-Person Households | 5,879 (3.7%) | 223 (0.1%) |
| 6-Person Households | 3,003 (1.9%) | 27 (0.0%) |
| 7+ Person Households | 1,346 (0.9%) | 120 (0.1%) |
| Total | 105,416 (67.2%) | 51,352 (32.8%) |
Female Fertility in Collier County
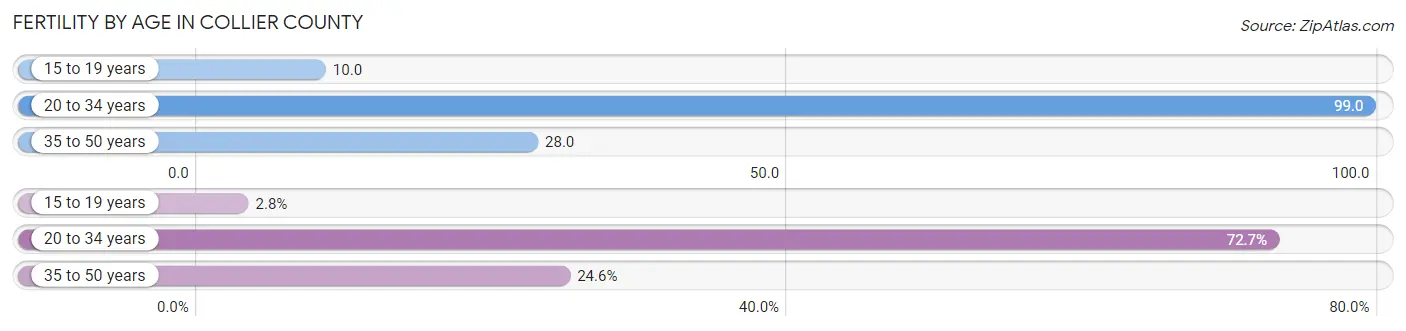
Fertility by Age in Collier County
Average fertility rate in Collier County is 53.0 births per 1,000 women. Women in the age bracket of 20 to 34 years have the highest fertility rate with 99.0 births per 1,000 women. Women in the age bracket of 20 to 34 years acount for 72.7% of all women with births.
| Age Bracket | Women with Births | Births / 1,000 Women |
| 15 to 19 years | 94 (2.8%) | 10.0 |
| 20 to 34 years | 2,483 (72.7%) | 99.0 |
| 35 to 50 years | 840 (24.6%) | 28.0 |
| Total | 3,417 (100.0%) | 53.0 |
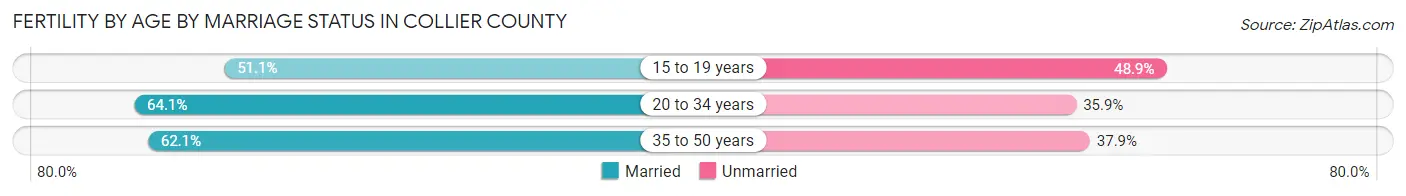
Fertility by Age by Marriage Status in Collier County
63.2% of women with births (3,417) in Collier County are married. The highest percentage of unmarried women with births falls into 15 to 19 years age bracket with 48.9% of them unmarried at the time of birth, while the lowest percentage of unmarried women with births belong to 20 to 34 years age bracket with 35.9% of them unmarried.
| Age Bracket | Married | Unmarried |
| 15 to 19 years | 48 (51.1%) | 46 (48.9%) |
| 20 to 34 years | 1,592 (64.1%) | 891 (35.9%) |
| 35 to 50 years | 522 (62.1%) | 318 (37.9%) |
| Total | 2,160 (63.2%) | 1,257 (36.8%) |
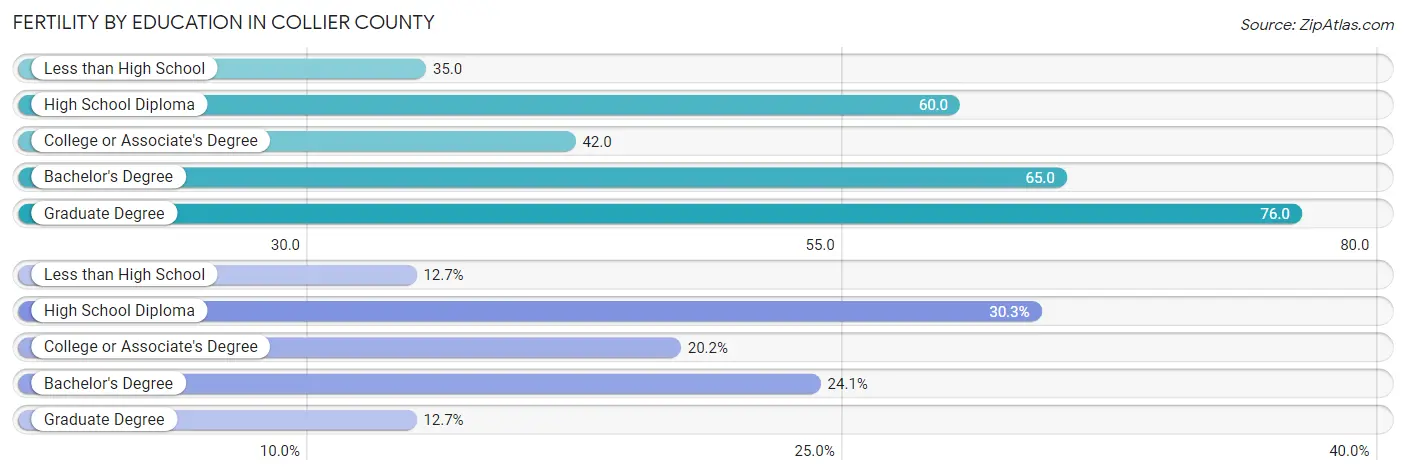
Fertility by Education in Collier County
Average fertility rate in Collier County is 53.0 births per 1,000 women. Women with the education attainment of graduate degree have the highest fertility rate of 76.0 births per 1,000 women, while women with the education attainment of less than high school have the lowest fertility at 35.0 births per 1,000 women. Women with the education attainment of high school diploma represent 30.3% of all women with births.
| Educational Attainment | Women with Births | Births / 1,000 Women |
| Less than High School | 435 (12.7%) | 35.0 |
| High School Diploma | 1,035 (30.3%) | 60.0 |
| College or Associate's Degree | 689 (20.2%) | 42.0 |
| Bachelor's Degree | 823 (24.1%) | 65.0 |
| Graduate Degree | 435 (12.7%) | 76.0 |
| Total | 3,417 (100.0%) | 53.0 |
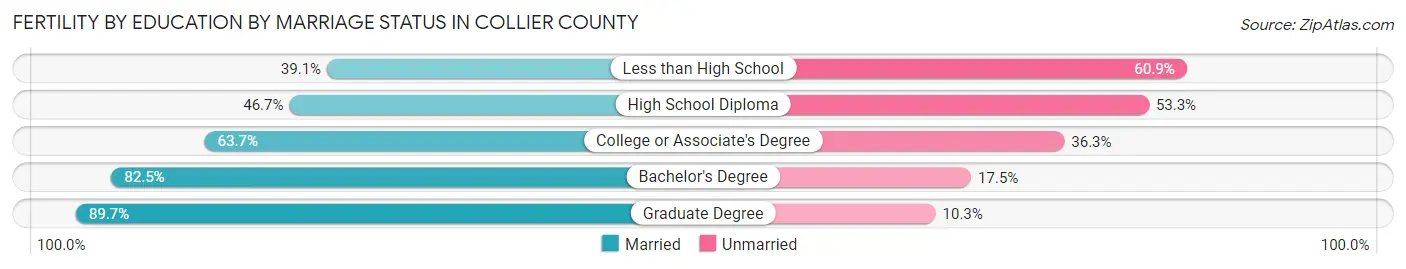
Fertility by Education by Marriage Status in Collier County
36.8% of women with births in Collier County are unmarried. Women with the educational attainment of graduate degree are most likely to be married with 89.7% of them married at childbirth, while women with the educational attainment of less than high school are least likely to be married with 60.9% of them unmarried at childbirth.
| Educational Attainment | Married | Unmarried |
| Less than High School | 170 (39.1%) | 265 (60.9%) |
| High School Diploma | 483 (46.7%) | 552 (53.3%) |
| College or Associate's Degree | 439 (63.7%) | 250 (36.3%) |
| Bachelor's Degree | 679 (82.5%) | 144 (17.5%) |
| Graduate Degree | 390 (89.7%) | 45 (10.3%) |
| Total | 2,160 (63.2%) | 1,257 (36.8%) |
Employment Characteristics in Collier County
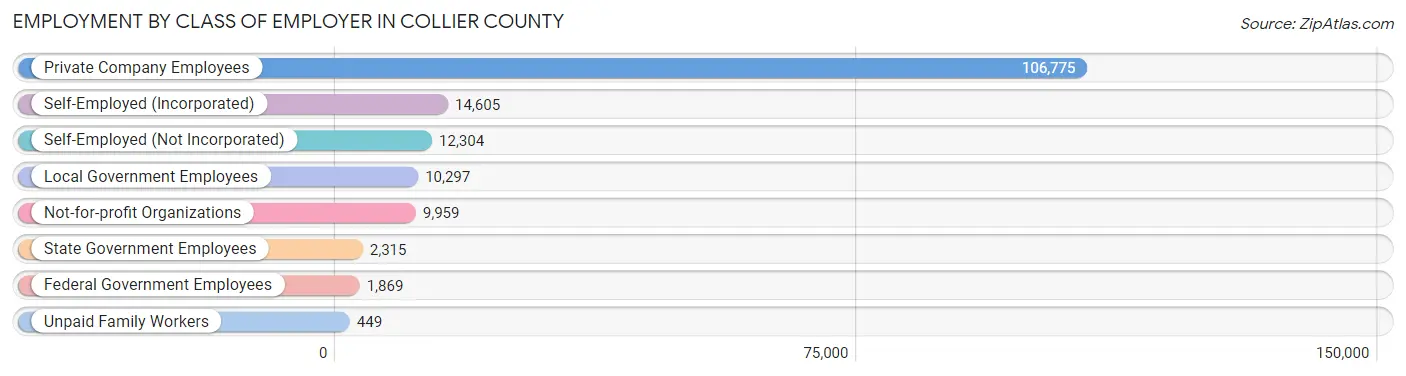
Employment by Class of Employer in Collier County
Among the 158,573 employed individuals in Collier County, private company employees (106,775 | 67.3%), self-employed (incorporated) (14,605 | 9.2%), and self-employed (not incorporated) (12,304 | 7.8%) make up the most common classes of employment.
| Employer Class | # Employees | % Employees |
| Private Company Employees | 106,775 | 67.3% |
| Self-Employed (Incorporated) | 14,605 | 9.2% |
| Self-Employed (Not Incorporated) | 12,304 | 7.8% |
| Not-for-profit Organizations | 9,959 | 6.3% |
| Local Government Employees | 10,297 | 6.5% |
| State Government Employees | 2,315 | 1.5% |
| Federal Government Employees | 1,869 | 1.2% |
| Unpaid Family Workers | 449 | 0.3% |
| Total | 158,573 | 100.0% |
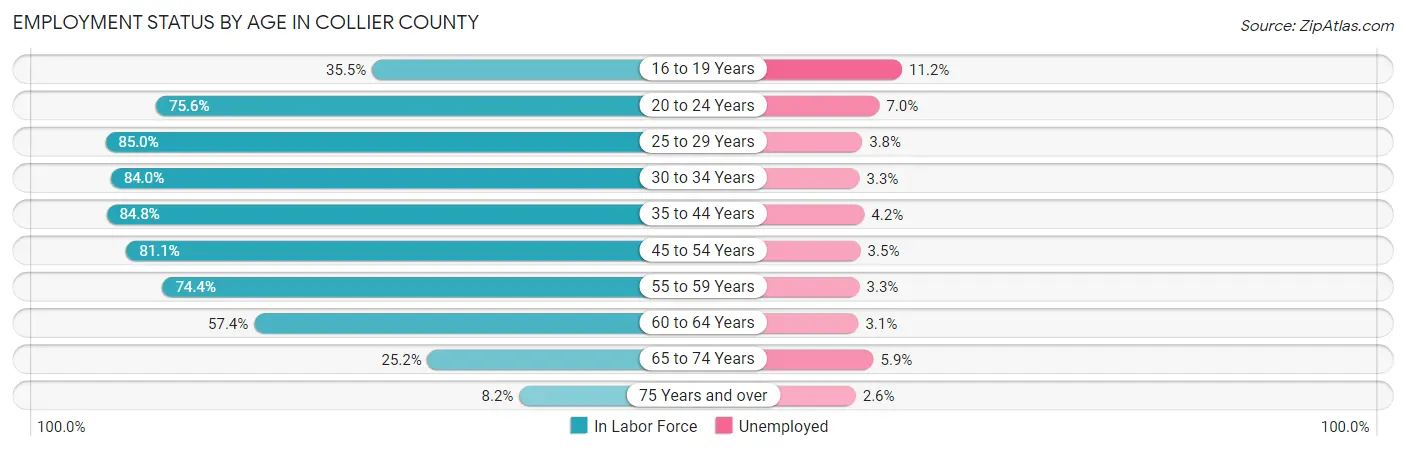
Employment Status by Age in Collier County
According to the labor force statistics for Collier County, out of the total population over 16 years of age (324,396), 52.1% or 169,010 individuals are in the labor force, with 4.3% or 7,267 of them unemployed. The age group with the highest labor force participation rate is 25 to 29 years, with 85.0% or 14,840 individuals in the labor force. Within the labor force, the 16 to 19 years age range has the highest percentage of unemployed individuals, with 11.2% or 588 of them being unemployed.
| Age Bracket | In Labor Force | Unemployed |
| 16 to 19 Years | 5,253 (35.5%) | 588 (11.2%) |
| 20 to 24 Years | 13,493 (75.6%) | 945 (7.0%) |
| 25 to 29 Years | 14,840 (85.0%) | 564 (3.8%) |
| 30 to 34 Years | 14,857 (84.0%) | 490 (3.3%) |
| 35 to 44 Years | 31,455 (84.8%) | 1,321 (4.2%) |
| 45 to 54 Years | 34,292 (81.1%) | 1,200 (3.5%) |
| 55 to 59 Years | 18,951 (74.4%) | 625 (3.3%) |
| 60 to 64 Years | 15,483 (57.4%) | 480 (3.1%) |
| 65 to 74 Years | 15,109 (25.2%) | 891 (5.9%) |
| 75 Years and over | 5,316 (8.2%) | 138 (2.6%) |
| Total | 169,010 (52.1%) | 7,267 (4.3%) |
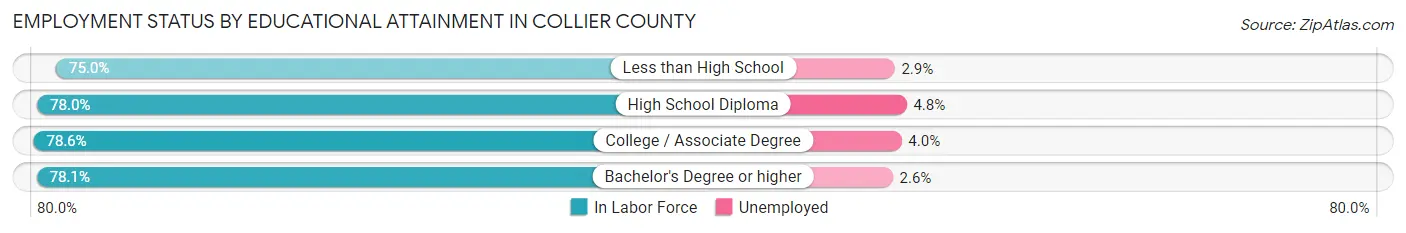
Employment Status by Educational Attainment in Collier County
According to labor force statistics for Collier County, 77.8% of individuals (129,901) out of the total population between 25 and 64 years of age (166,968) are in the labor force, with 3.6% or 4,676 of them being unemployed. The group with the highest labor force participation rate are those with the educational attainment of college / associate degree, with 78.6% or 33,051 individuals in the labor force. Within the labor force, individuals with high school diploma education have the highest percentage of unemployment, with 4.8% or 1,784 of them being unemployed.
| Educational Attainment | In Labor Force | Unemployed |
| Less than High School | 16,228 (75.0%) | 627 (2.9%) |
| High School Diploma | 37,162 (78.0%) | 2,287 (4.8%) |
| College / Associate Degree | 33,051 (78.6%) | 1,682 (4.0%) |
| Bachelor's Degree or higher | 43,453 (78.1%) | 1,447 (2.6%) |
| Total | 129,901 (77.8%) | 6,011 (3.6%) |
Employment Occupations by Sex in Collier County
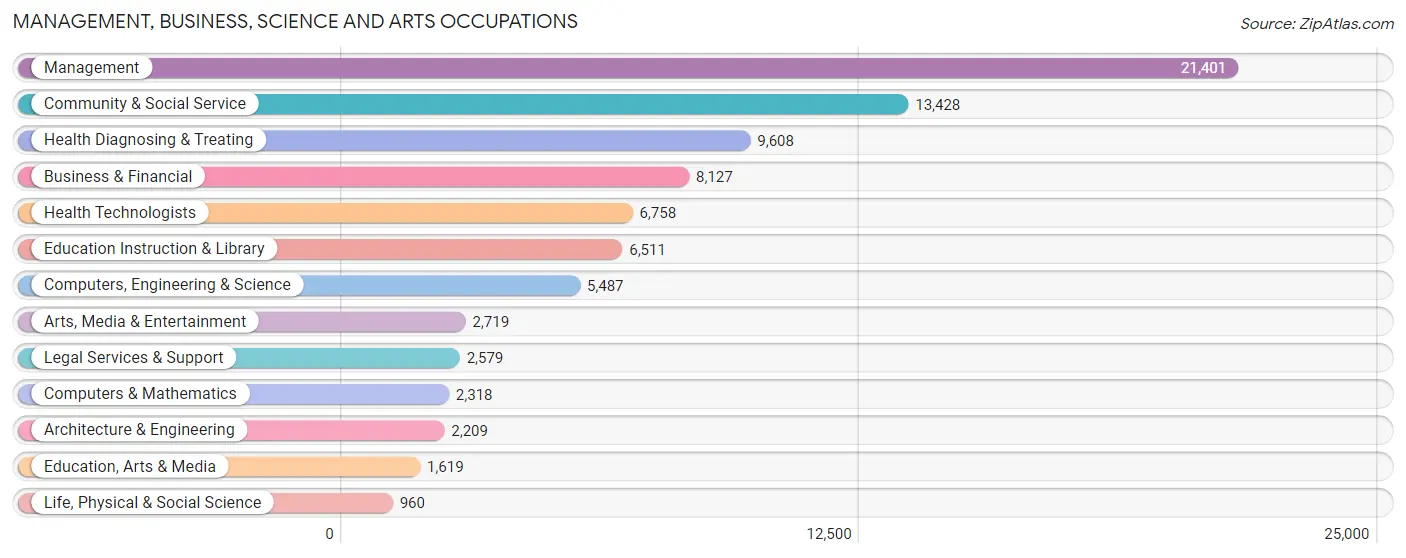
Management, Business, Science and Arts Occupations
The most common Management, Business, Science and Arts occupations in Collier County are Management (21,401 | 13.2%), Community & Social Service (13,428 | 8.3%), Health Diagnosing & Treating (9,608 | 5.9%), Business & Financial (8,127 | 5.0%), and Health Technologists (6,758 | 4.2%).
Management, Business, Science and Arts Occupations by Sex
Within the Management, Business, Science and Arts occupations in Collier County, the most male-oriented occupations are Architecture & Engineering (85.6%), Computers, Engineering & Science (71.1%), and Management (62.6%), while the most female-oriented occupations are Health Technologists (71.1%), Health Diagnosing & Treating (70.1%), and Education Instruction & Library (69.7%).
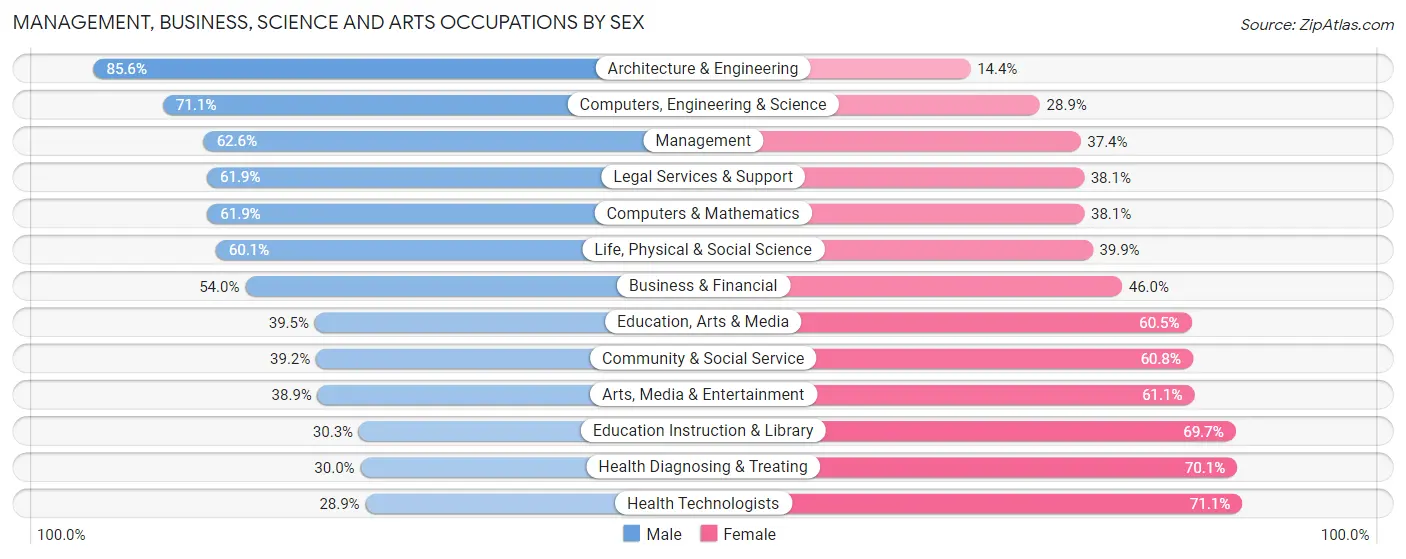
| Occupation | Male | Female |
| Management | 13,401 (62.6%) | 8,000 (37.4%) |
| Business & Financial | 4,386 (54.0%) | 3,741 (46.0%) |
| Computers, Engineering & Science | 3,902 (71.1%) | 1,585 (28.9%) |
| Computers & Mathematics | 1,434 (61.9%) | 884 (38.1%) |
| Architecture & Engineering | 1,891 (85.6%) | 318 (14.4%) |
| Life, Physical & Social Science | 577 (60.1%) | 383 (39.9%) |
| Community & Social Service | 5,263 (39.2%) | 8,165 (60.8%) |
| Education, Arts & Media | 639 (39.5%) | 980 (60.5%) |
| Legal Services & Support | 1,597 (61.9%) | 982 (38.1%) |
| Education Instruction & Library | 1,970 (30.3%) | 4,541 (69.7%) |
| Arts, Media & Entertainment | 1,057 (38.9%) | 1,662 (61.1%) |
| Health Diagnosing & Treating | 2,878 (29.9%) | 6,730 (70.1%) |
| Health Technologists | 1,953 (28.9%) | 4,805 (71.1%) |
| Total (Category) | 29,830 (51.4%) | 28,221 (48.6%) |
| Total (Overall) | 89,476 (55.3%) | 72,258 (44.7%) |
Services Occupations
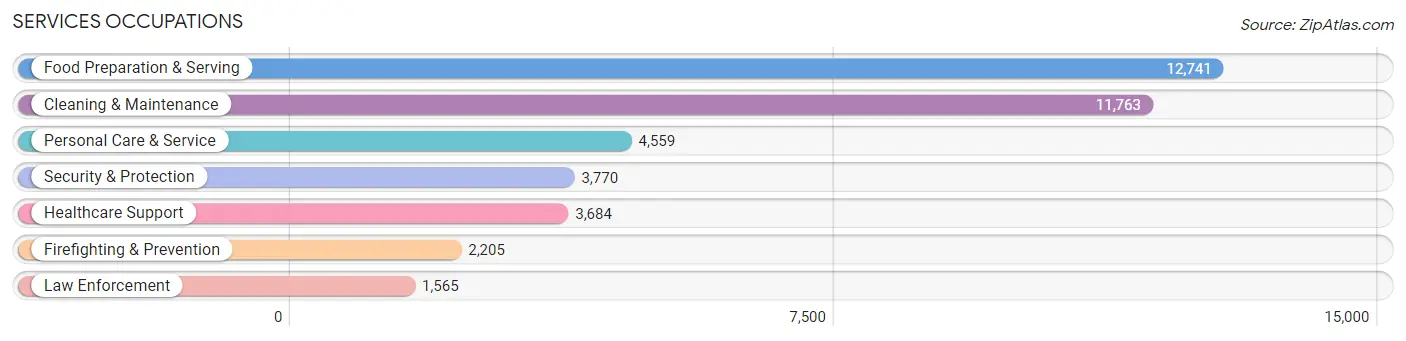
The most common Services occupations in Collier County are Food Preparation & Serving (12,741 | 7.9%), Cleaning & Maintenance (11,763 | 7.3%), Personal Care & Service (4,559 | 2.8%), Security & Protection (3,770 | 2.3%), and Healthcare Support (3,684 | 2.3%).
Services Occupations by Sex
Within the Services occupations in Collier County, the most male-oriented occupations are Law Enforcement (81.7%), Security & Protection (81.6%), and Firefighting & Prevention (81.5%), while the most female-oriented occupations are Healthcare Support (86.2%), Personal Care & Service (64.7%), and Food Preparation & Serving (51.8%).
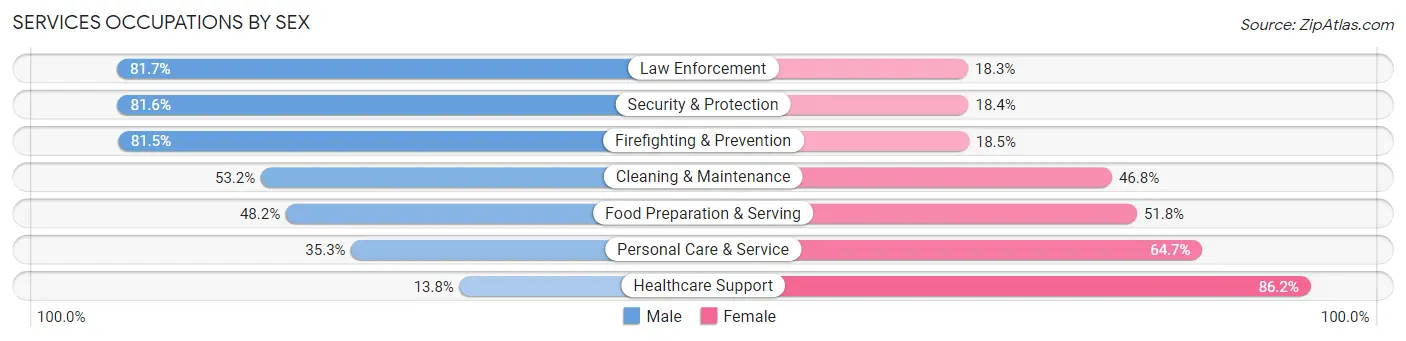
| Occupation | Male | Female |
| Healthcare Support | 510 (13.8%) | 3,174 (86.2%) |
| Security & Protection | 3,076 (81.6%) | 694 (18.4%) |
| Firefighting & Prevention | 1,798 (81.5%) | 407 (18.5%) |
| Law Enforcement | 1,278 (81.7%) | 287 (18.3%) |
| Food Preparation & Serving | 6,146 (48.2%) | 6,595 (51.8%) |
| Cleaning & Maintenance | 6,256 (53.2%) | 5,507 (46.8%) |
| Personal Care & Service | 1,609 (35.3%) | 2,950 (64.7%) |
| Total (Category) | 17,597 (48.2%) | 18,920 (51.8%) |
| Total (Overall) | 89,476 (55.3%) | 72,258 (44.7%) |
Sales and Office Occupations
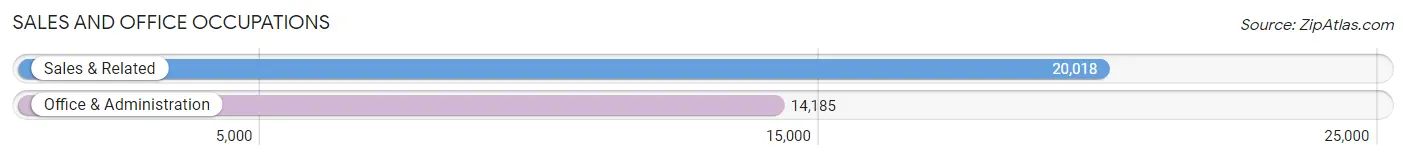
The most common Sales and Office occupations in Collier County are Sales & Related (20,018 | 12.4%), and Office & Administration (14,185 | 8.8%).
Sales and Office Occupations by Sex
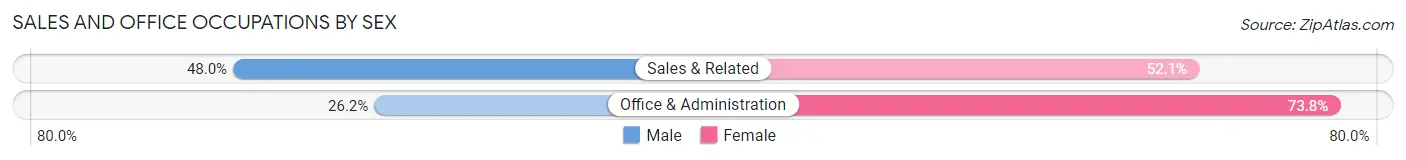
| Occupation | Male | Female |
| Sales & Related | 9,598 (47.9%) | 10,420 (52.0%) |
| Office & Administration | 3,721 (26.2%) | 10,464 (73.8%) |
| Total (Category) | 13,319 (38.9%) | 20,884 (61.1%) |
| Total (Overall) | 89,476 (55.3%) | 72,258 (44.7%) |
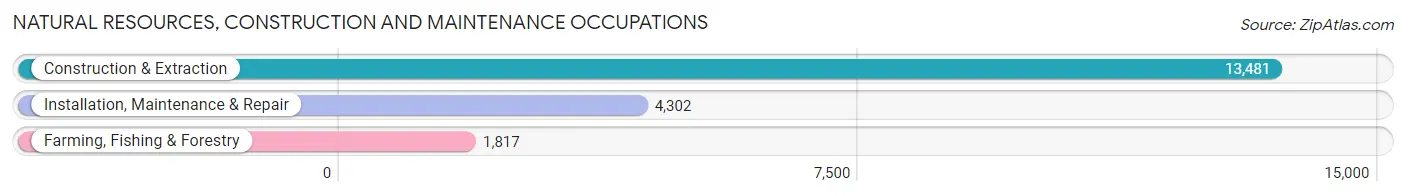
Natural Resources, Construction and Maintenance Occupations
The most common Natural Resources, Construction and Maintenance occupations in Collier County are Construction & Extraction (13,481 | 8.3%), Installation, Maintenance & Repair (4,302 | 2.7%), and Farming, Fishing & Forestry (1,817 | 1.1%).
Natural Resources, Construction and Maintenance Occupations by Sex
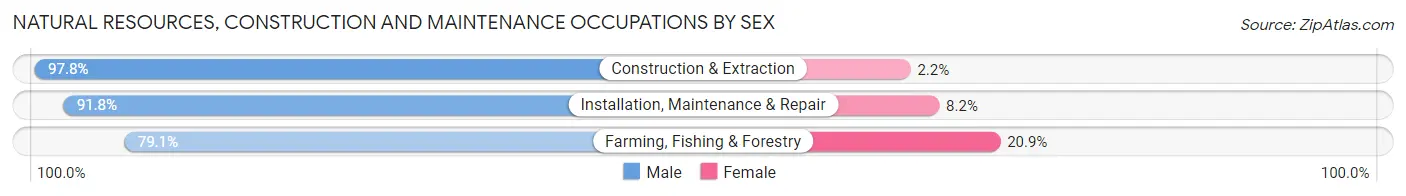
| Occupation | Male | Female |
| Farming, Fishing & Forestry | 1,438 (79.1%) | 379 (20.9%) |
| Construction & Extraction | 13,184 (97.8%) | 297 (2.2%) |
| Installation, Maintenance & Repair | 3,951 (91.8%) | 351 (8.2%) |
| Total (Category) | 18,573 (94.8%) | 1,027 (5.2%) |
| Total (Overall) | 89,476 (55.3%) | 72,258 (44.7%) |
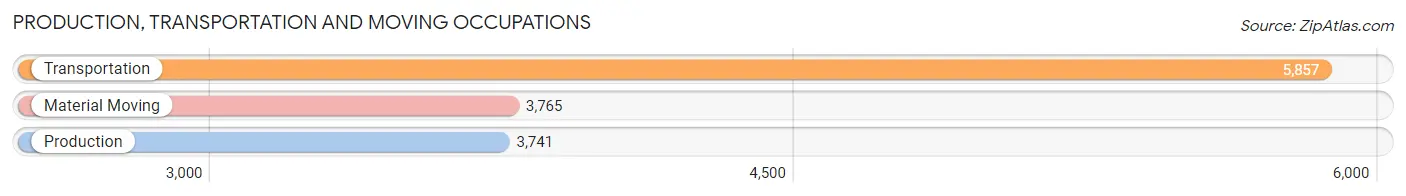
Production, Transportation and Moving Occupations
The most common Production, Transportation and Moving occupations in Collier County are Transportation (5,857 | 3.6%), Material Moving (3,765 | 2.3%), and Production (3,741 | 2.3%).
Production, Transportation and Moving Occupations by Sex
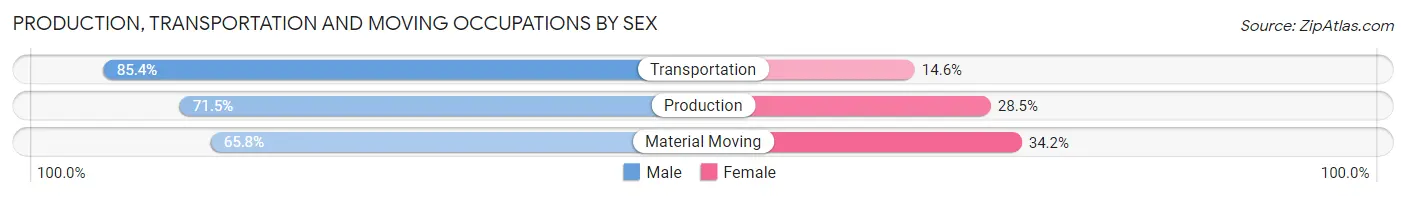
| Occupation | Male | Female |
| Production | 2,675 (71.5%) | 1,066 (28.5%) |
| Transportation | 5,004 (85.4%) | 853 (14.6%) |
| Material Moving | 2,478 (65.8%) | 1,287 (34.2%) |
| Total (Category) | 10,157 (76.0%) | 3,206 (24.0%) |
| Total (Overall) | 89,476 (55.3%) | 72,258 (44.7%) |
Employment Industries by Sex in Collier County
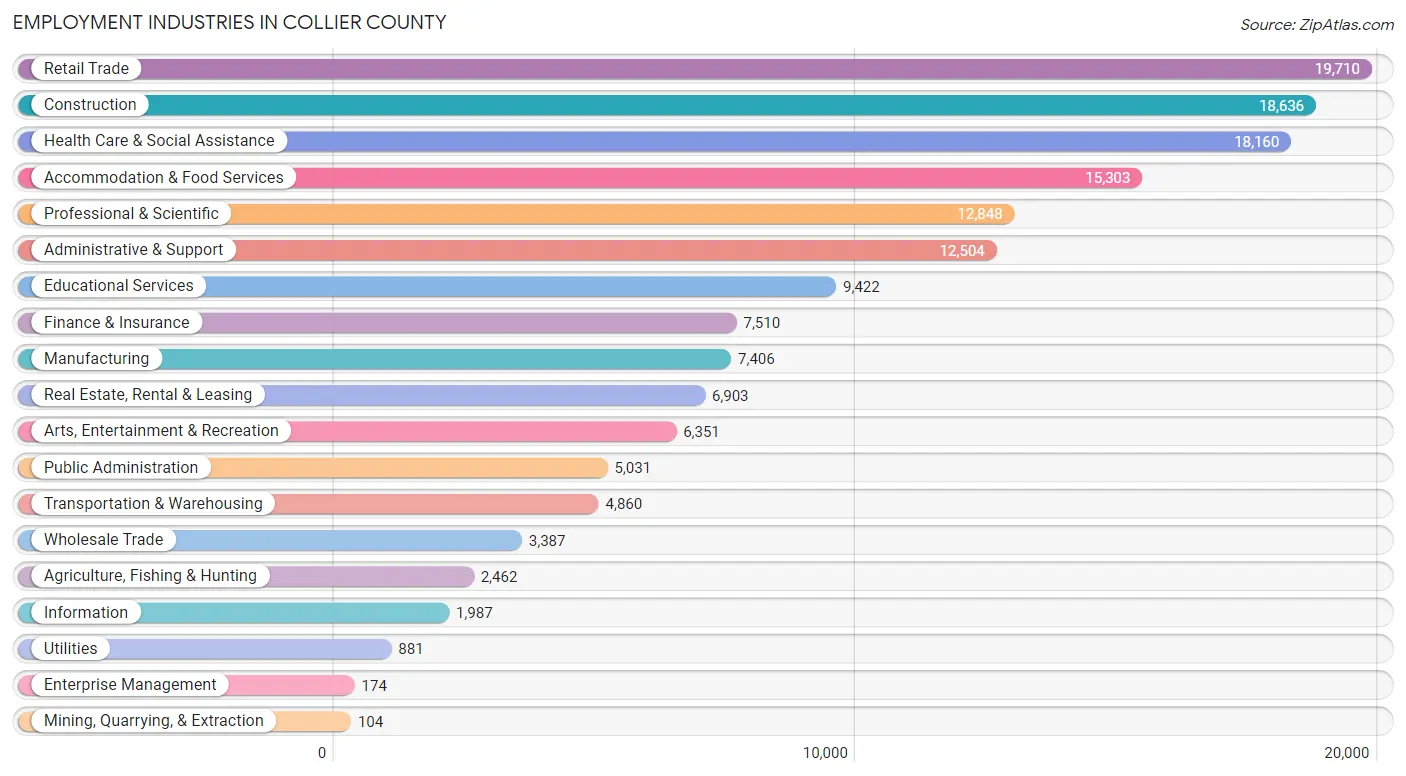
Employment Industries in Collier County
The major employment industries in Collier County include Retail Trade (19,710 | 12.2%), Construction (18,636 | 11.5%), Health Care & Social Assistance (18,160 | 11.2%), Accommodation & Food Services (15,303 | 9.5%), and Professional & Scientific (12,848 | 7.9%).
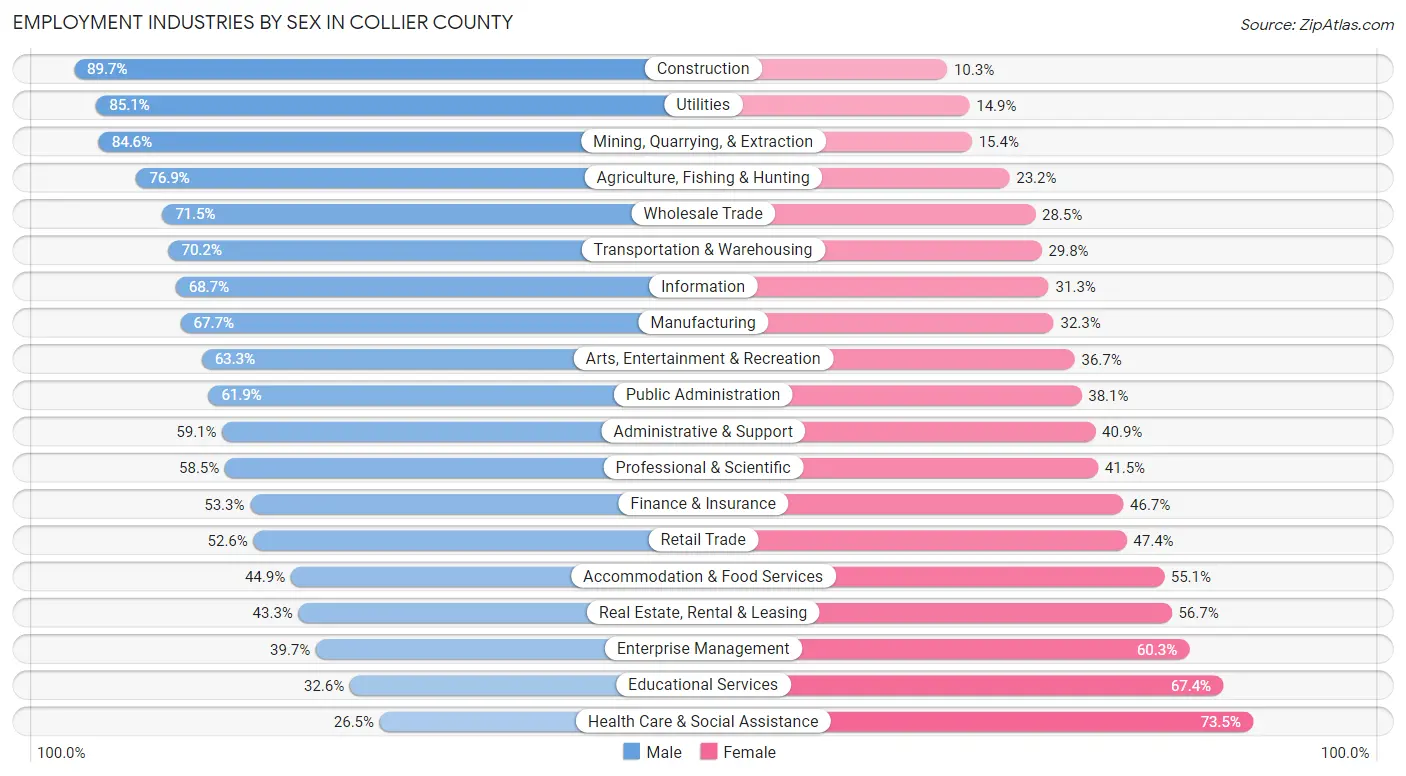
Employment Industries by Sex in Collier County
The Collier County industries that see more men than women are Construction (89.7%), Utilities (85.1%), and Mining, Quarrying, & Extraction (84.6%), whereas the industries that tend to have a higher number of women are Health Care & Social Assistance (73.5%), Educational Services (67.4%), and Enterprise Management (60.3%).
| Industry | Male | Female |
| Agriculture, Fishing & Hunting | 1,892 (76.8%) | 570 (23.2%) |
| Mining, Quarrying, & Extraction | 88 (84.6%) | 16 (15.4%) |
| Construction | 16,724 (89.7%) | 1,912 (10.3%) |
| Manufacturing | 5,013 (67.7%) | 2,393 (32.3%) |
| Wholesale Trade | 2,422 (71.5%) | 965 (28.5%) |
| Retail Trade | 10,368 (52.6%) | 9,342 (47.4%) |
| Transportation & Warehousing | 3,411 (70.2%) | 1,449 (29.8%) |
| Utilities | 750 (85.1%) | 131 (14.9%) |
| Information | 1,365 (68.7%) | 622 (31.3%) |
| Finance & Insurance | 4,002 (53.3%) | 3,508 (46.7%) |
| Real Estate, Rental & Leasing | 2,987 (43.3%) | 3,916 (56.7%) |
| Professional & Scientific | 7,516 (58.5%) | 5,332 (41.5%) |
| Enterprise Management | 69 (39.7%) | 105 (60.3%) |
| Administrative & Support | 7,386 (59.1%) | 5,118 (40.9%) |
| Educational Services | 3,074 (32.6%) | 6,348 (67.4%) |
| Health Care & Social Assistance | 4,806 (26.5%) | 13,354 (73.5%) |
| Arts, Entertainment & Recreation | 4,022 (63.3%) | 2,329 (36.7%) |
| Accommodation & Food Services | 6,865 (44.9%) | 8,438 (55.1%) |
| Public Administration | 3,116 (61.9%) | 1,915 (38.1%) |
| Total | 89,476 (55.3%) | 72,258 (44.7%) |
Education in Collier County
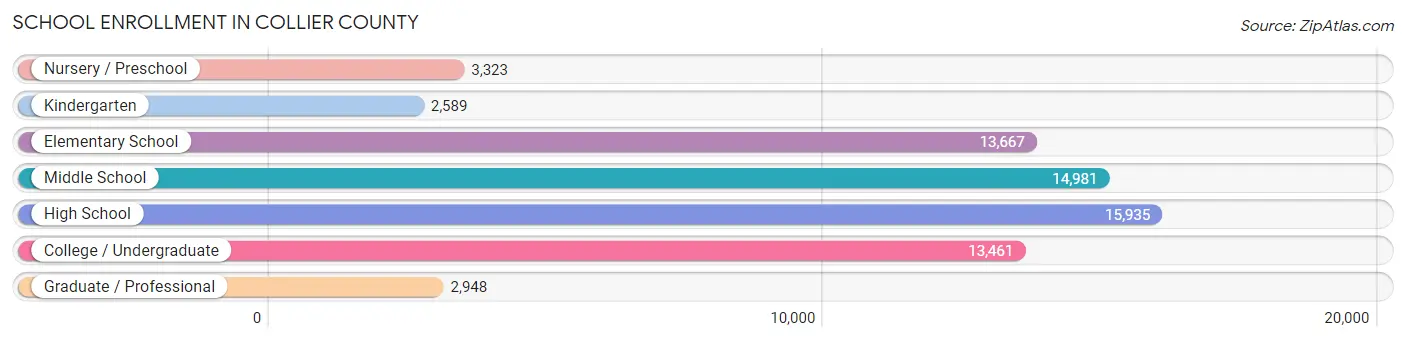
School Enrollment in Collier County
The most common levels of schooling among the 66,904 students in Collier County are high school (15,935 | 23.8%), middle school (14,981 | 22.4%), and elementary school (13,667 | 20.4%).
| School Level | # Students | % Students |
| Nursery / Preschool | 3,323 | 5.0% |
| Kindergarten | 2,589 | 3.9% |
| Elementary School | 13,667 | 20.4% |
| Middle School | 14,981 | 22.4% |
| High School | 15,935 | 23.8% |
| College / Undergraduate | 13,461 | 20.1% |
| Graduate / Professional | 2,948 | 4.4% |
| Total | 66,904 | 100.0% |
School Enrollment by Age by Funding Source in Collier County
Out of a total of 66,904 students who are enrolled in schools in Collier County, 13,180 (19.7%) attend a private institution, while the remaining 53,724 (80.3%) are enrolled in public schools. The age group of 25 to 34 year olds has the highest likelihood of being enrolled in private schools, with 1,914 (53.3% in the age bracket) enrolled. Conversely, the age group of 15 to 17 year olds has the lowest likelihood of being enrolled in a private school, with 10,519 (92.2% in the age bracket) attending a public institution.
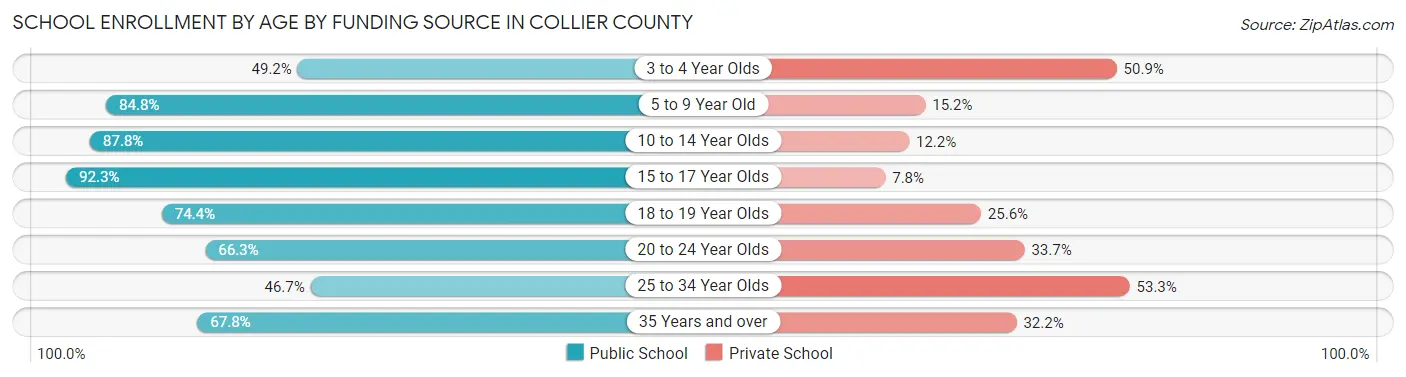
| Age Bracket | Public School | Private School |
| 3 to 4 Year Olds | 1,016 (49.1%) | 1,051 (50.8%) |
| 5 to 9 Year Old | 12,796 (84.8%) | 2,293 (15.2%) |
| 10 to 14 Year Olds | 17,041 (87.8%) | 2,361 (12.2%) |
| 15 to 17 Year Olds | 10,519 (92.2%) | 884 (7.7%) |
| 18 to 19 Year Olds | 3,908 (74.4%) | 1,342 (25.6%) |
| 20 to 24 Year Olds | 4,623 (66.3%) | 2,348 (33.7%) |
| 25 to 34 Year Olds | 1,680 (46.7%) | 1,914 (53.3%) |
| 35 Years and over | 2,121 (67.8%) | 1,007 (32.2%) |
| Total | 53,724 (80.3%) | 13,180 (19.7%) |
Educational Attainment by Field of Study in Collier County
Business (29,316 | 24.3%), education (17,928 | 14.8%), social sciences (11,599 | 9.6%), science & technology (10,496 | 8.7%), and engineering (8,971 | 7.4%) are the most common fields of study among 120,799 individuals in Collier County who have obtained a bachelor's degree or higher.
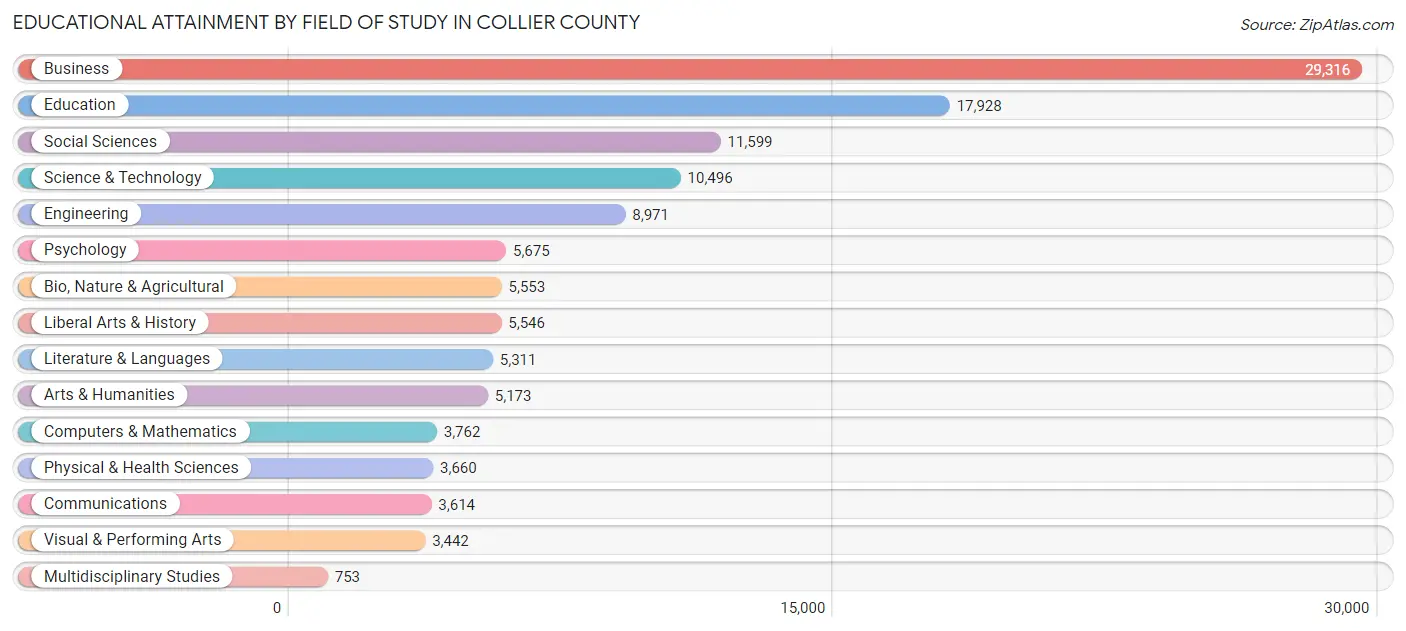
| Field of Study | # Graduates | % Graduates |
| Computers & Mathematics | 3,762 | 3.1% |
| Bio, Nature & Agricultural | 5,553 | 4.6% |
| Physical & Health Sciences | 3,660 | 3.0% |
| Psychology | 5,675 | 4.7% |
| Social Sciences | 11,599 | 9.6% |
| Engineering | 8,971 | 7.4% |
| Multidisciplinary Studies | 753 | 0.6% |
| Science & Technology | 10,496 | 8.7% |
| Business | 29,316 | 24.3% |
| Education | 17,928 | 14.8% |
| Literature & Languages | 5,311 | 4.4% |
| Liberal Arts & History | 5,546 | 4.6% |
| Visual & Performing Arts | 3,442 | 2.9% |
| Communications | 3,614 | 3.0% |
| Arts & Humanities | 5,173 | 4.3% |
| Total | 120,799 | 100.0% |
Transportation & Commute in Collier County
Vehicle Availability by Sex in Collier County
The most prevalent vehicle ownership categories in Collier County are males with 2 vehicles (40,464, accounting for 46.2%) and females with 2 vehicles (29,936, making up 57.7%).
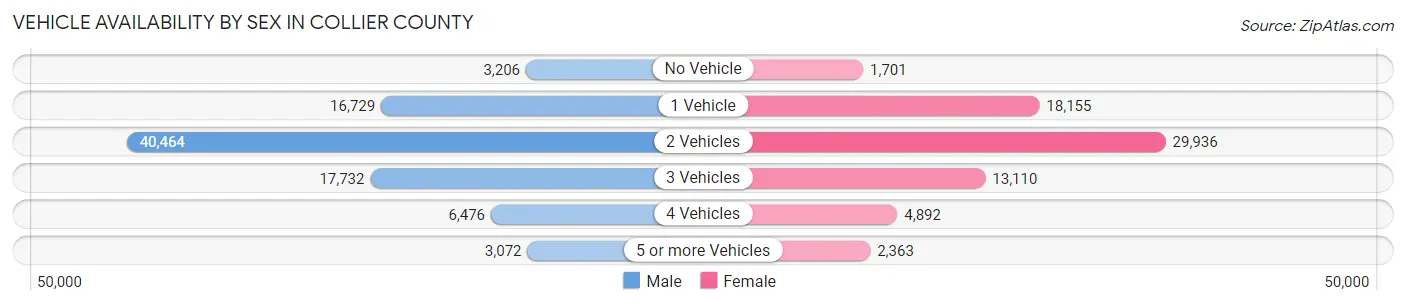
| Vehicles Available | Male | Female |
| No Vehicle | 3,206 (3.7%) | 1,701 (2.4%) |
| 1 Vehicle | 16,729 (19.1%) | 18,155 (25.9%) |
| 2 Vehicles | 40,464 (46.2%) | 29,936 (42.7%) |
| 3 Vehicles | 17,732 (20.2%) | 13,110 (18.7%) |
| 4 Vehicles | 6,476 (7.4%) | 4,892 (7.0%) |
| 5 or more Vehicles | 3,072 (3.5%) | 2,363 (3.4%) |
| Total | 87,679 (100.0%) | 70,157 (100.0%) |
Commute Time in Collier County
The most frequently occuring commute durations in Collier County are 15 to 19 minutes (24,655 commuters, 17.6%), 20 to 24 minutes (24,346 commuters, 17.4%), and 30 to 34 minutes (21,217 commuters, 15.2%).
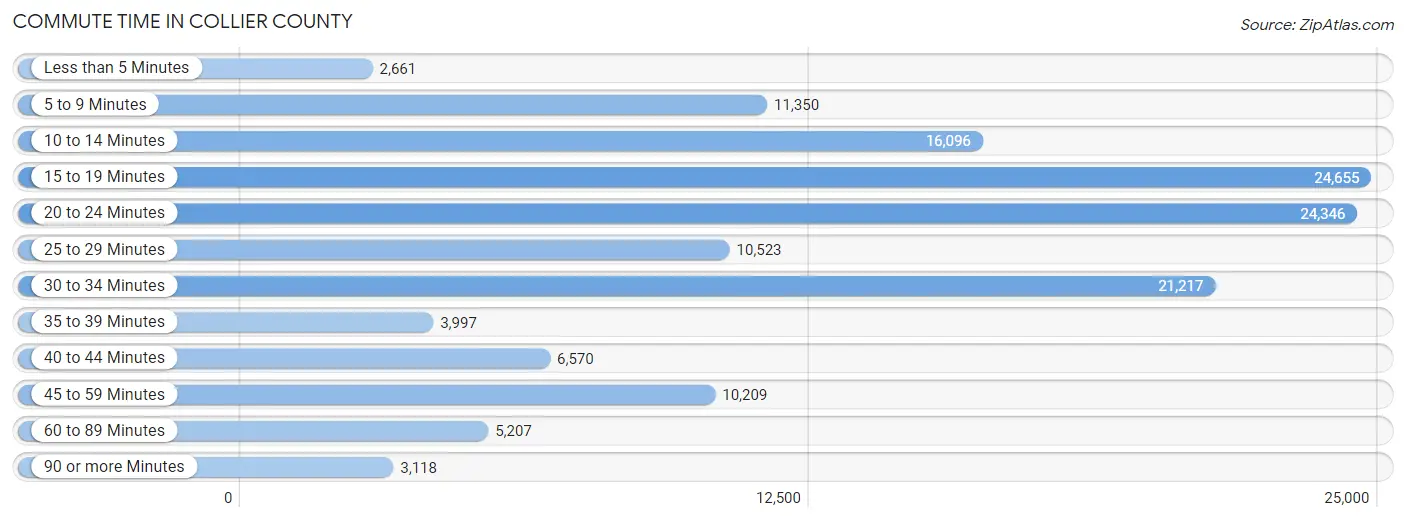
| Commute Time | # Commuters | % Commuters |
| Less than 5 Minutes | 2,661 | 1.9% |
| 5 to 9 Minutes | 11,350 | 8.1% |
| 10 to 14 Minutes | 16,096 | 11.5% |
| 15 to 19 Minutes | 24,655 | 17.6% |
| 20 to 24 Minutes | 24,346 | 17.4% |
| 25 to 29 Minutes | 10,523 | 7.5% |
| 30 to 34 Minutes | 21,217 | 15.2% |
| 35 to 39 Minutes | 3,997 | 2.9% |
| 40 to 44 Minutes | 6,570 | 4.7% |
| 45 to 59 Minutes | 10,209 | 7.3% |
| 60 to 89 Minutes | 5,207 | 3.7% |
| 90 or more Minutes | 3,118 | 2.2% |
Commute Time by Sex in Collier County
The most common commute times in Collier County are 20 to 24 minutes (12,877 commuters, 16.6%) for males and 15 to 19 minutes (12,293 commuters, 19.8%) for females.
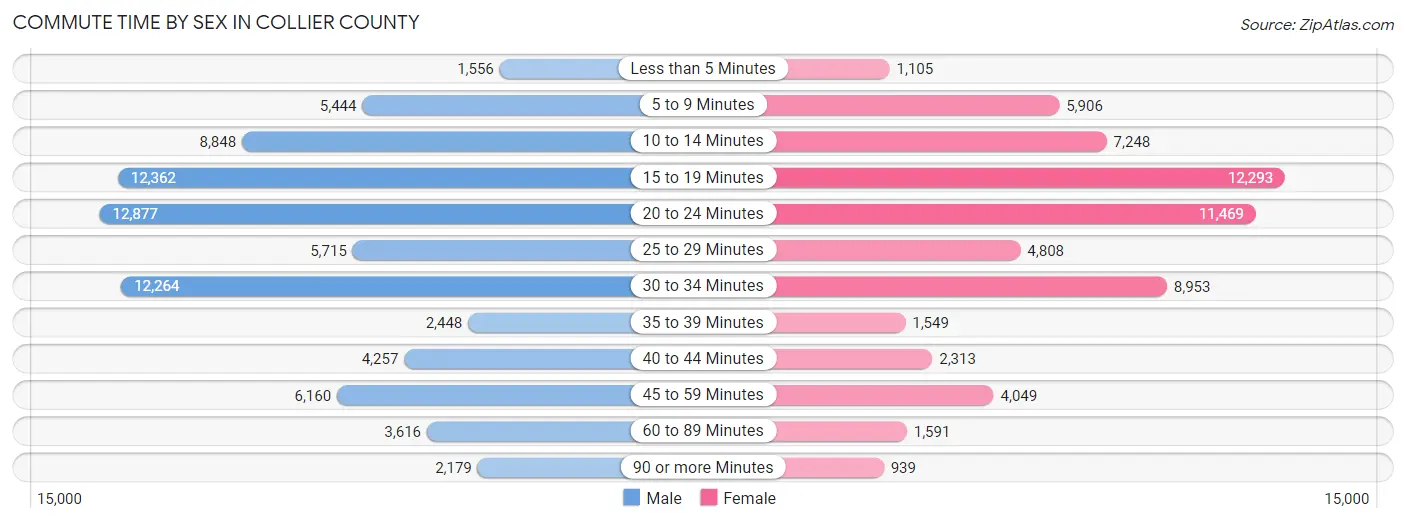
| Commute Time | Male | Female |
| Less than 5 Minutes | 1,556 (2.0%) | 1,105 (1.8%) |
| 5 to 9 Minutes | 5,444 (7.0%) | 5,906 (9.5%) |
| 10 to 14 Minutes | 8,848 (11.4%) | 7,248 (11.7%) |
| 15 to 19 Minutes | 12,362 (15.9%) | 12,293 (19.8%) |
| 20 to 24 Minutes | 12,877 (16.6%) | 11,469 (18.4%) |
| 25 to 29 Minutes | 5,715 (7.3%) | 4,808 (7.7%) |
| 30 to 34 Minutes | 12,264 (15.8%) | 8,953 (14.4%) |
| 35 to 39 Minutes | 2,448 (3.2%) | 1,549 (2.5%) |
| 40 to 44 Minutes | 4,257 (5.5%) | 2,313 (3.7%) |
| 45 to 59 Minutes | 6,160 (7.9%) | 4,049 (6.5%) |
| 60 to 89 Minutes | 3,616 (4.6%) | 1,591 (2.6%) |
| 90 or more Minutes | 2,179 (2.8%) | 939 (1.5%) |
Time of Departure to Work by Sex in Collier County
The most frequent times of departure to work in Collier County are 7:00 AM to 7:29 AM (12,738, 16.4%) for males and 8:00 AM to 8:29 AM (9,316, 15.0%) for females.
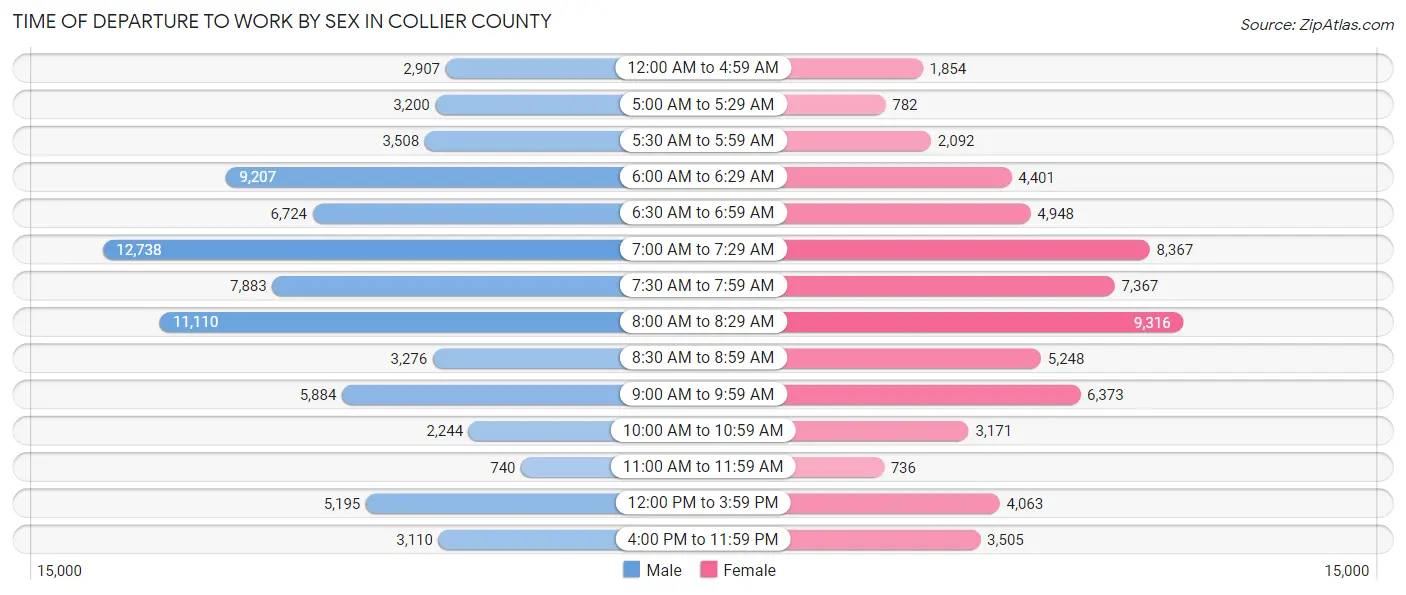
| Time of Departure | Male | Female |
| 12:00 AM to 4:59 AM | 2,907 (3.7%) | 1,854 (3.0%) |
| 5:00 AM to 5:29 AM | 3,200 (4.1%) | 782 (1.3%) |
| 5:30 AM to 5:59 AM | 3,508 (4.5%) | 2,092 (3.4%) |
| 6:00 AM to 6:29 AM | 9,207 (11.8%) | 4,401 (7.1%) |
| 6:30 AM to 6:59 AM | 6,724 (8.6%) | 4,948 (8.0%) |
| 7:00 AM to 7:29 AM | 12,738 (16.4%) | 8,367 (13.5%) |
| 7:30 AM to 7:59 AM | 7,883 (10.1%) | 7,367 (11.8%) |
| 8:00 AM to 8:29 AM | 11,110 (14.3%) | 9,316 (15.0%) |
| 8:30 AM to 8:59 AM | 3,276 (4.2%) | 5,248 (8.4%) |
| 9:00 AM to 9:59 AM | 5,884 (7.6%) | 6,373 (10.2%) |
| 10:00 AM to 10:59 AM | 2,244 (2.9%) | 3,171 (5.1%) |
| 11:00 AM to 11:59 AM | 740 (0.9%) | 736 (1.2%) |
| 12:00 PM to 3:59 PM | 5,195 (6.7%) | 4,063 (6.5%) |
| 4:00 PM to 11:59 PM | 3,110 (4.0%) | 3,505 (5.6%) |
| Total | 77,726 (100.0%) | 62,223 (100.0%) |
Housing Occupancy in Collier County
Occupancy by Ownership in Collier County
Of the total 156,768 dwellings in Collier County, owner-occupied units account for 117,362 (74.9%), while renter-occupied units make up 39,406 (25.1%).
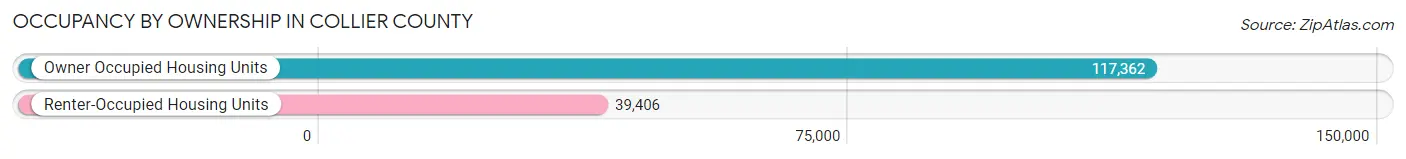
| Occupancy | # Housing Units | % Housing Units |
| Owner Occupied Housing Units | 117,362 | 74.9% |
| Renter-Occupied Housing Units | 39,406 | 25.1% |
| Total Occupied Housing Units | 156,768 | 100.0% |
Occupancy by Household Size in Collier County
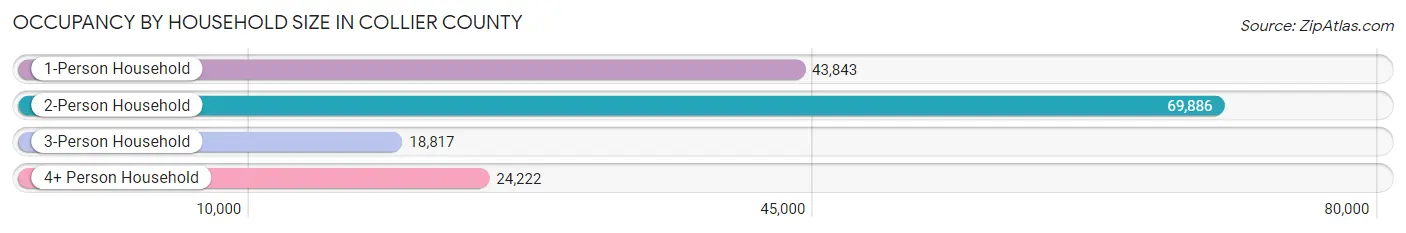
| Household Size | # Housing Units | % Housing Units |
| 1-Person Household | 43,843 | 28.0% |
| 2-Person Household | 69,886 | 44.6% |
| 3-Person Household | 18,817 | 12.0% |
| 4+ Person Household | 24,222 | 15.4% |
| Total Housing Units | 156,768 | 100.0% |
Occupancy by Ownership by Household Size in Collier County
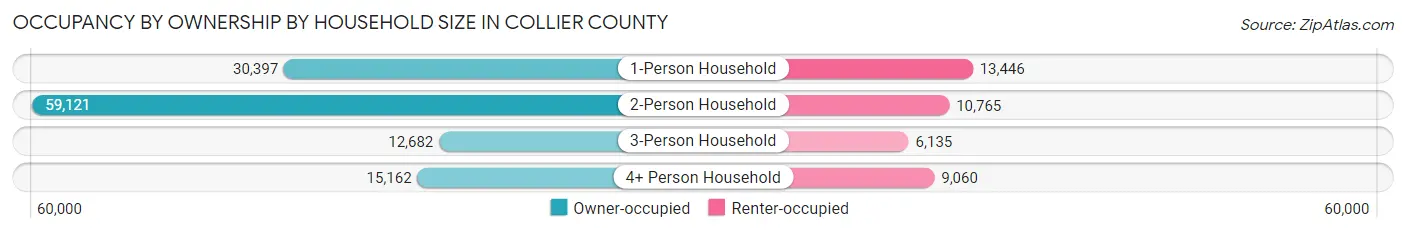
| Household Size | Owner-occupied | Renter-occupied |
| 1-Person Household | 30,397 (69.3%) | 13,446 (30.7%) |
| 2-Person Household | 59,121 (84.6%) | 10,765 (15.4%) |
| 3-Person Household | 12,682 (67.4%) | 6,135 (32.6%) |
| 4+ Person Household | 15,162 (62.6%) | 9,060 (37.4%) |
| Total Housing Units | 117,362 (74.9%) | 39,406 (25.1%) |
Occupancy by Educational Attainment in Collier County
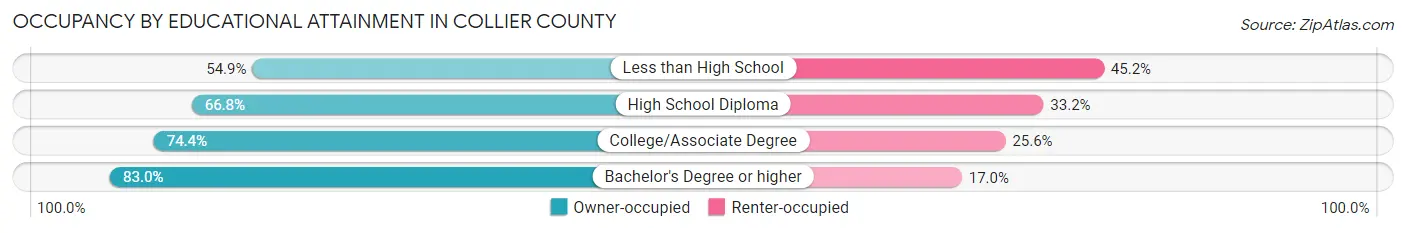
| Household Size | Owner-occupied | Renter-occupied |
| Less than High School | 7,288 (54.8%) | 5,998 (45.2%) |
| High School Diploma | 23,114 (66.8%) | 11,467 (33.2%) |
| College/Associate Degree | 29,725 (74.4%) | 10,244 (25.6%) |
| Bachelor's Degree or higher | 57,235 (83.0%) | 11,697 (17.0%) |
Occupancy by Age of Householder in Collier County
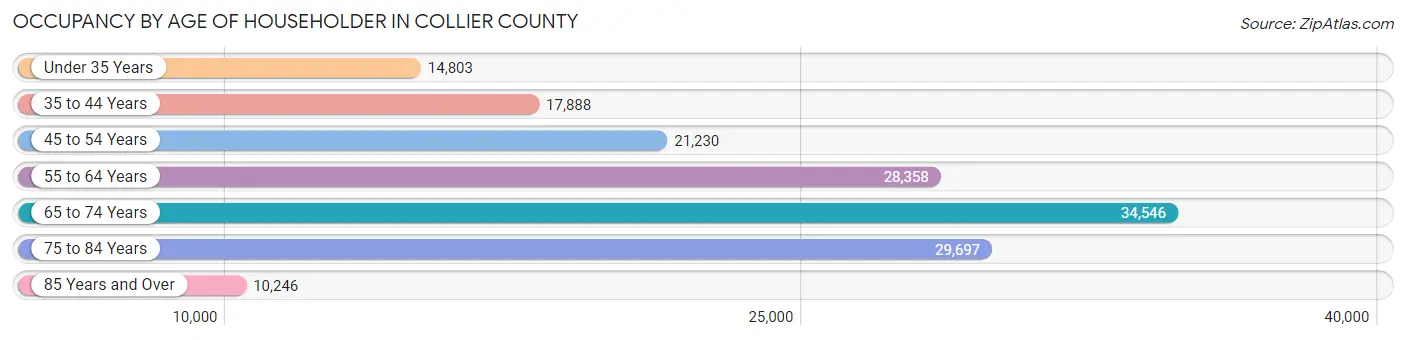
| Age Bracket | # Households | % Households |
| Under 35 Years | 14,803 | 9.4% |
| 35 to 44 Years | 17,888 | 11.4% |
| 45 to 54 Years | 21,230 | 13.5% |
| 55 to 64 Years | 28,358 | 18.1% |
| 65 to 74 Years | 34,546 | 22.0% |
| 75 to 84 Years | 29,697 | 18.9% |
| 85 Years and Over | 10,246 | 6.5% |
| Total | 156,768 | 100.0% |
Housing Finances in Collier County
Median Income by Occupancy in Collier County
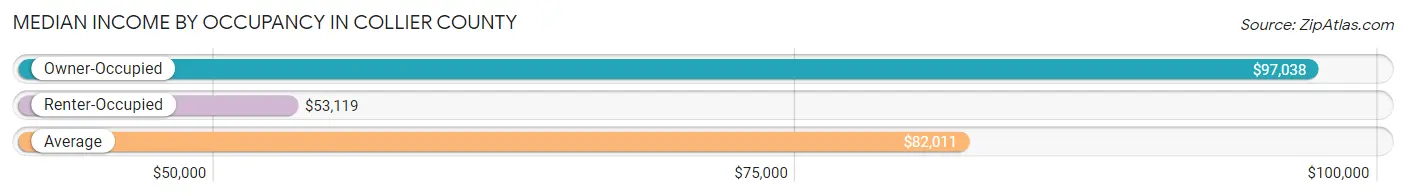
| Occupancy Type | # Households | Median Income |
| Owner-Occupied | 117,362 (74.9%) | $97,038 |
| Renter-Occupied | 39,406 (25.1%) | $53,119 |
| Average | 156,768 (100.0%) | $82,011 |
Occupancy by Householder Income Bracket in Collier County
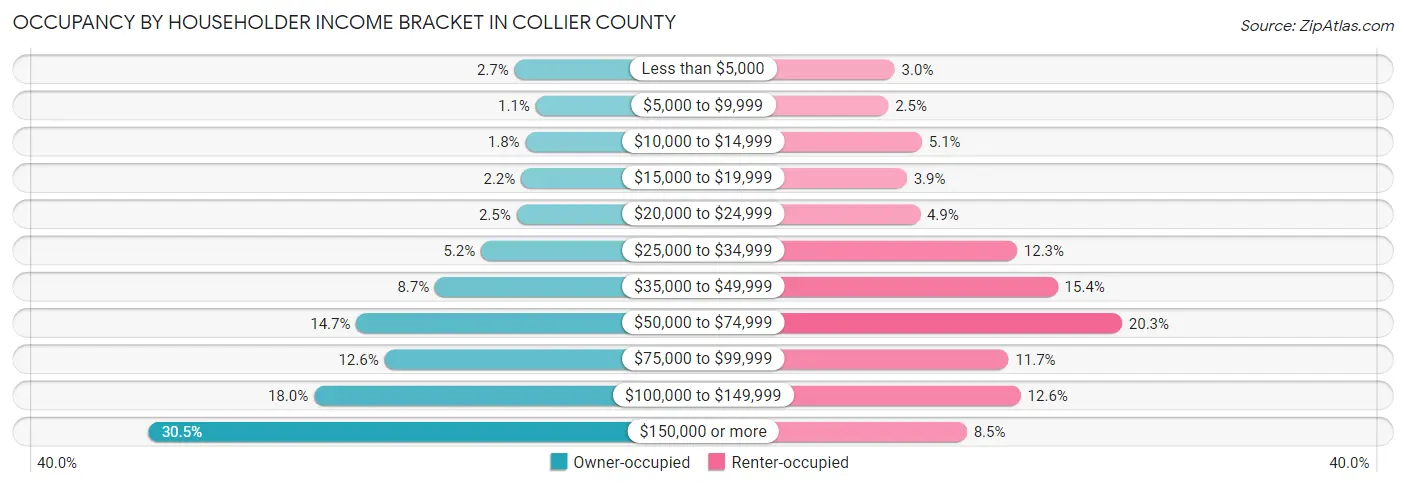
| Income Bracket | Owner-occupied | Renter-occupied |
| Less than $5,000 | 3,136 (2.7%) | 1,174 (3.0%) |
| $5,000 to $9,999 | 1,243 (1.1%) | 980 (2.5%) |
| $10,000 to $14,999 | 2,158 (1.8%) | 1,989 (5.1%) |
| $15,000 to $19,999 | 2,550 (2.2%) | 1,536 (3.9%) |
| $20,000 to $24,999 | 2,953 (2.5%) | 1,933 (4.9%) |
| $25,000 to $34,999 | 6,130 (5.2%) | 4,844 (12.3%) |
| $35,000 to $49,999 | 10,240 (8.7%) | 6,069 (15.4%) |
| $50,000 to $74,999 | 17,284 (14.7%) | 7,994 (20.3%) |
| $75,000 to $99,999 | 14,761 (12.6%) | 4,592 (11.7%) |
| $100,000 to $149,999 | 21,069 (17.9%) | 4,958 (12.6%) |
| $150,000 or more | 35,838 (30.5%) | 3,337 (8.5%) |
| Total | 117,362 (100.0%) | 39,406 (100.0%) |
Monthly Housing Cost Tiers in Collier County
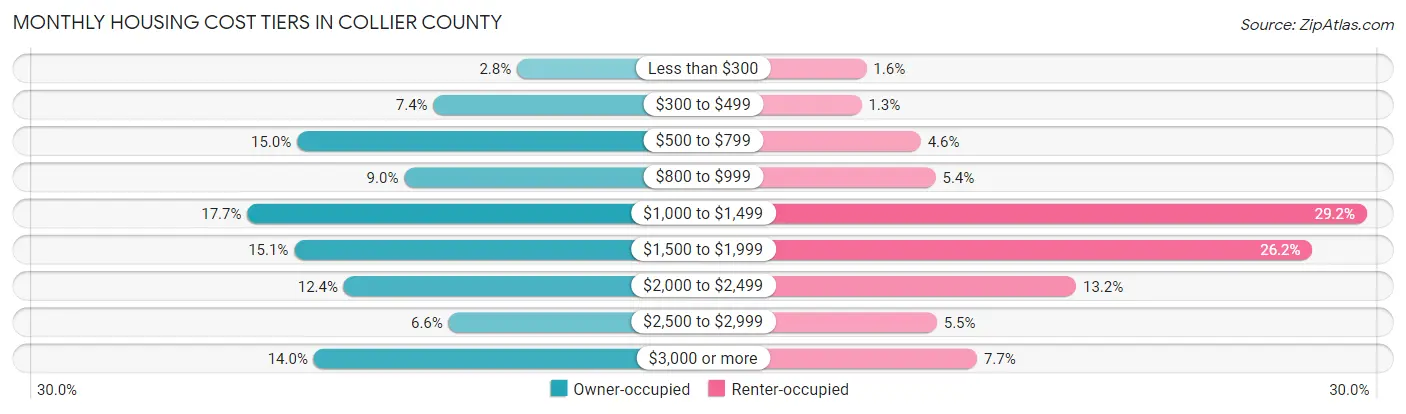
| Monthly Cost | Owner-occupied | Renter-occupied |
| Less than $300 | 3,288 (2.8%) | 629 (1.6%) |
| $300 to $499 | 8,710 (7.4%) | 523 (1.3%) |
| $500 to $799 | 17,549 (14.9%) | 1,811 (4.6%) |
| $800 to $999 | 10,600 (9.0%) | 2,135 (5.4%) |
| $1,000 to $1,499 | 20,772 (17.7%) | 11,521 (29.2%) |
| $1,500 to $1,999 | 17,734 (15.1%) | 10,337 (26.2%) |
| $2,000 to $2,499 | 14,515 (12.4%) | 5,193 (13.2%) |
| $2,500 to $2,999 | 7,724 (6.6%) | 2,163 (5.5%) |
| $3,000 or more | 16,470 (14.0%) | 3,040 (7.7%) |
| Total | 117,362 (100.0%) | 39,406 (100.0%) |
Physical Housing Characteristics in Collier County
Housing Structures in Collier County
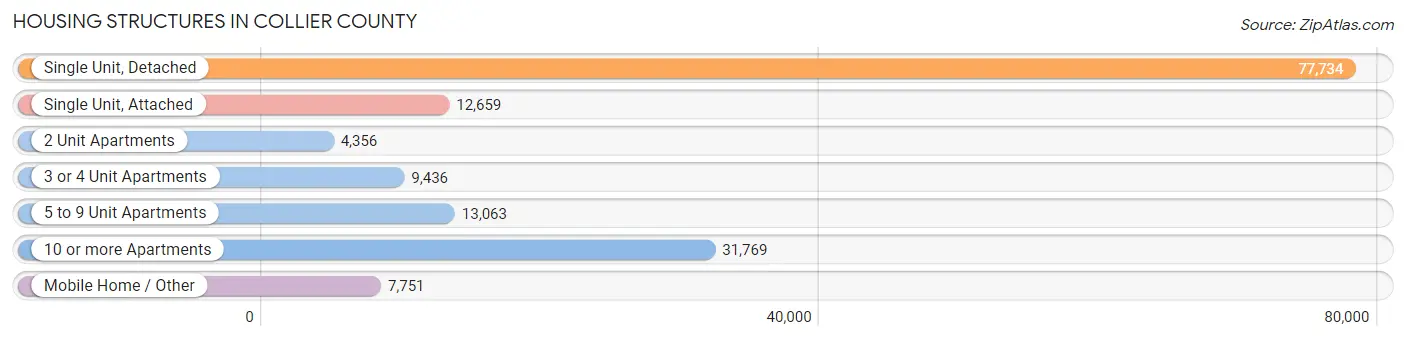
| Structure Type | # Housing Units | % Housing Units |
| Single Unit, Detached | 77,734 | 49.6% |
| Single Unit, Attached | 12,659 | 8.1% |
| 2 Unit Apartments | 4,356 | 2.8% |
| 3 or 4 Unit Apartments | 9,436 | 6.0% |
| 5 to 9 Unit Apartments | 13,063 | 8.3% |
| 10 or more Apartments | 31,769 | 20.3% |
| Mobile Home / Other | 7,751 | 4.9% |
| Total | 156,768 | 100.0% |
Housing Structures by Occupancy in Collier County
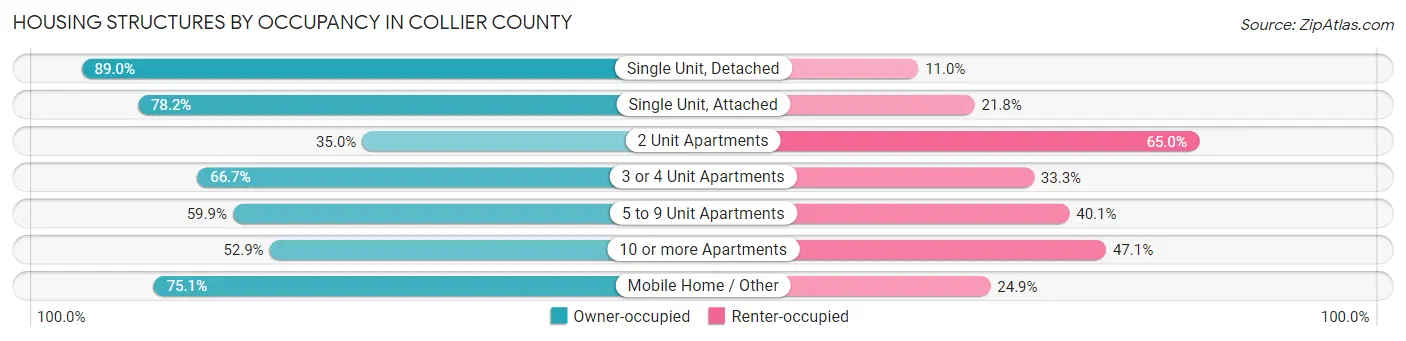
| Structure Type | Owner-occupied | Renter-occupied |
| Single Unit, Detached | 69,199 (89.0%) | 8,535 (11.0%) |
| Single Unit, Attached | 9,895 (78.2%) | 2,764 (21.8%) |
| 2 Unit Apartments | 1,525 (35.0%) | 2,831 (65.0%) |
| 3 or 4 Unit Apartments | 6,298 (66.7%) | 3,138 (33.3%) |
| 5 to 9 Unit Apartments | 7,829 (59.9%) | 5,234 (40.1%) |
| 10 or more Apartments | 16,793 (52.9%) | 14,976 (47.1%) |
| Mobile Home / Other | 5,823 (75.1%) | 1,928 (24.9%) |
| Total | 117,362 (74.9%) | 39,406 (25.1%) |
Housing Structures by Number of Rooms in Collier County
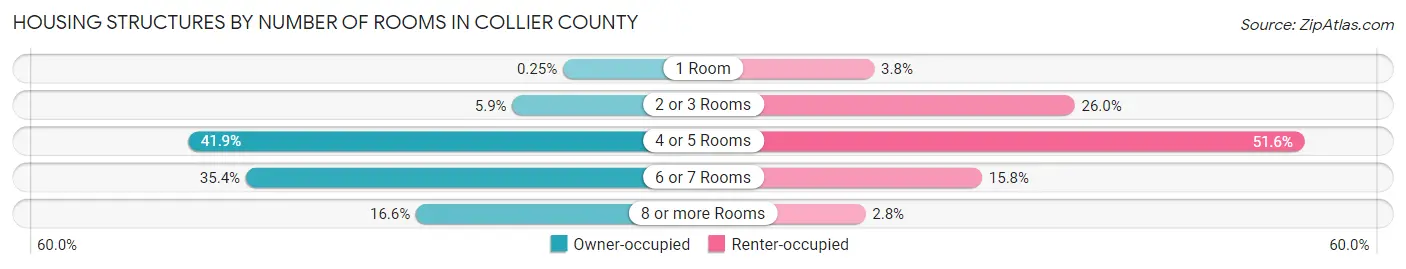
| Number of Rooms | Owner-occupied | Renter-occupied |
| 1 Room | 293 (0.3%) | 1,499 (3.8%) |
| 2 or 3 Rooms | 6,882 (5.9%) | 10,261 (26.0%) |
| 4 or 5 Rooms | 49,157 (41.9%) | 20,330 (51.6%) |
| 6 or 7 Rooms | 41,590 (35.4%) | 6,205 (15.8%) |
| 8 or more Rooms | 19,440 (16.6%) | 1,111 (2.8%) |
| Total | 117,362 (100.0%) | 39,406 (100.0%) |
Housing Structure by Heating Type in Collier County
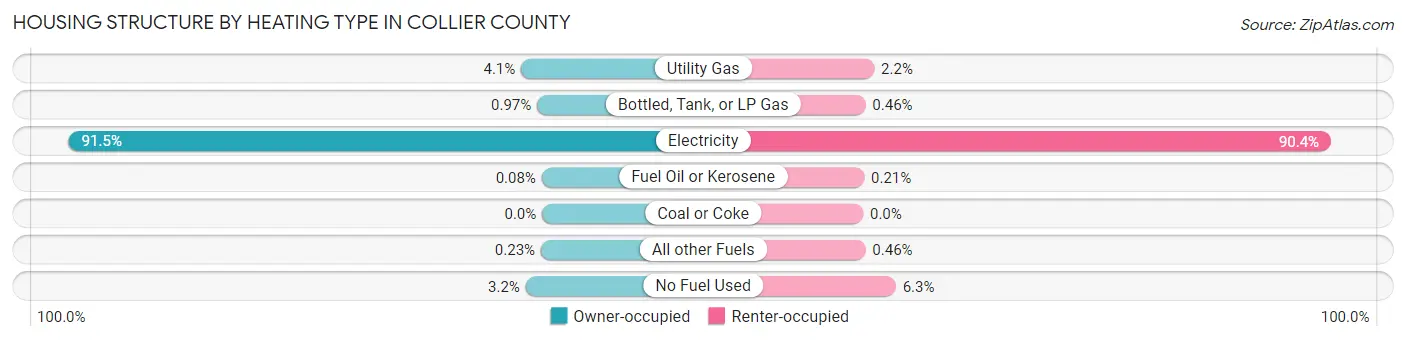
| Heating Type | Owner-occupied | Renter-occupied |
| Utility Gas | 4,749 (4.1%) | 849 (2.1%) |
| Bottled, Tank, or LP Gas | 1,137 (1.0%) | 181 (0.5%) |
| Electricity | 107,385 (91.5%) | 35,625 (90.4%) |
| Fuel Oil or Kerosene | 92 (0.1%) | 83 (0.2%) |
| Coal or Coke | 0 (0.0%) | 0 (0.0%) |
| All other Fuels | 275 (0.2%) | 183 (0.5%) |
| No Fuel Used | 3,724 (3.2%) | 2,485 (6.3%) |
| Total | 117,362 (100.0%) | 39,406 (100.0%) |
Household Vehicle Usage in Collier County
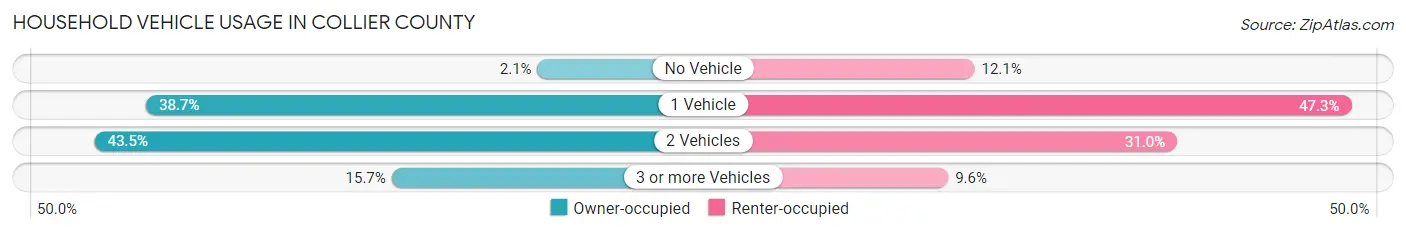
| Vehicles per Household | Owner-occupied | Renter-occupied |
| No Vehicle | 2,501 (2.1%) | 4,769 (12.1%) |
| 1 Vehicle | 45,375 (38.7%) | 18,623 (47.3%) |
| 2 Vehicles | 51,012 (43.5%) | 12,214 (31.0%) |
| 3 or more Vehicles | 18,474 (15.7%) | 3,800 (9.6%) |
| Total | 117,362 (100.0%) | 39,406 (100.0%) |
Real Estate & Mortgages in Collier County
Real Estate and Mortgage Overview in Collier County
| Characteristic | Without Mortgage | With Mortgage |
| Housing Units | 62,160 | 55,202 |
| Median Property Value | $454,600 | $435,000 |
| Median Household Income | $88,217 | $17,602 |
| Monthly Housing Costs | $868 | $13,533 |
| Real Estate Taxes | $3,229 | $1,408 |
Property Value by Mortgage Status in Collier County
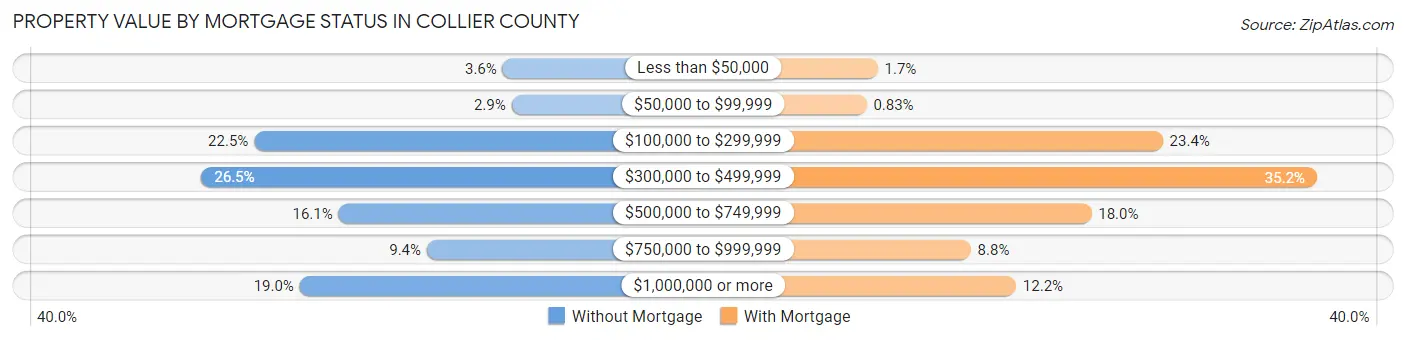
| Property Value | Without Mortgage | With Mortgage |
| Less than $50,000 | 2,225 (3.6%) | 926 (1.7%) |
| $50,000 to $99,999 | 1,804 (2.9%) | 456 (0.8%) |
| $100,000 to $299,999 | 13,992 (22.5%) | 12,917 (23.4%) |
| $300,000 to $499,999 | 16,489 (26.5%) | 19,403 (35.1%) |
| $500,000 to $749,999 | 9,998 (16.1%) | 9,916 (18.0%) |
| $750,000 to $999,999 | 5,814 (9.3%) | 4,840 (8.8%) |
| $1,000,000 or more | 11,838 (19.0%) | 6,744 (12.2%) |
| Total | 62,160 (100.0%) | 55,202 (100.0%) |
Household Income by Mortgage Status in Collier County
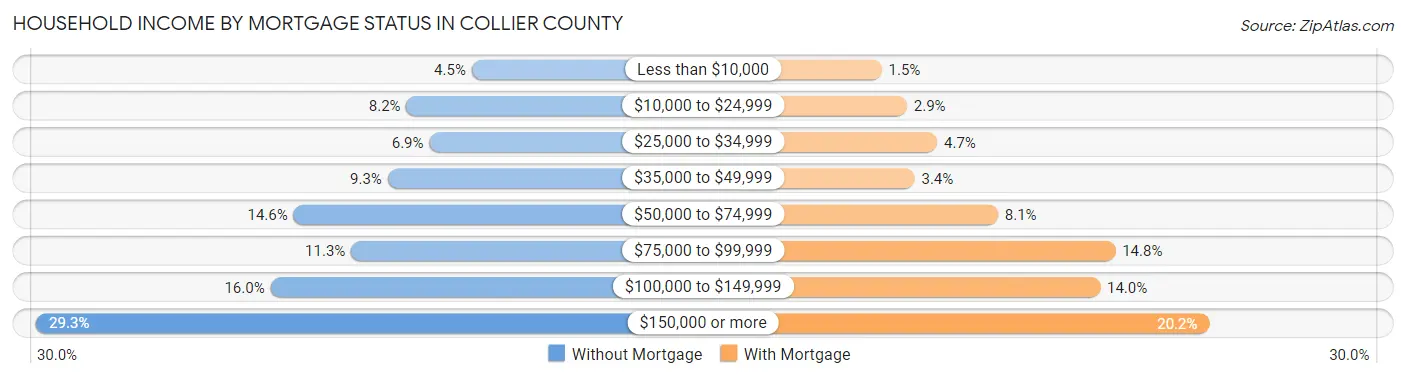
| Household Income | Without Mortgage | With Mortgage |
| Less than $10,000 | 2,764 (4.4%) | 825 (1.5%) |
| $10,000 to $24,999 | 5,087 (8.2%) | 1,615 (2.9%) |
| $25,000 to $34,999 | 4,269 (6.9%) | 2,574 (4.7%) |
| $35,000 to $49,999 | 5,750 (9.2%) | 1,861 (3.4%) |
| $50,000 to $74,999 | 9,094 (14.6%) | 4,490 (8.1%) |
| $75,000 to $99,999 | 7,048 (11.3%) | 8,190 (14.8%) |
| $100,000 to $149,999 | 9,912 (16.0%) | 7,713 (14.0%) |
| $150,000 or more | 18,236 (29.3%) | 11,157 (20.2%) |
| Total | 62,160 (100.0%) | 55,202 (100.0%) |
Property Value to Household Income Ratio in Collier County
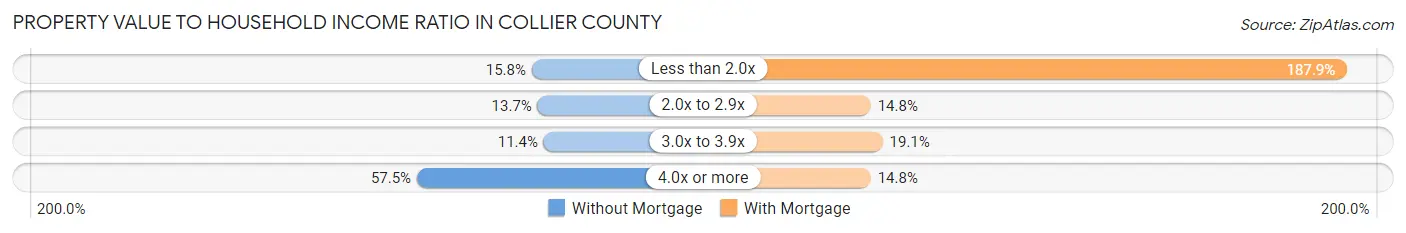
| Value-to-Income Ratio | Without Mortgage | With Mortgage |
| Less than 2.0x | 9,805 (15.8%) | 103,701 (187.9%) |
| 2.0x to 2.9x | 8,482 (13.7%) | 8,180 (14.8%) |
| 3.0x to 3.9x | 7,095 (11.4%) | 10,560 (19.1%) |
| 4.0x or more | 35,738 (57.5%) | 8,179 (14.8%) |
| Total | 62,160 (100.0%) | 55,202 (100.0%) |
Real Estate Taxes by Mortgage Status in Collier County
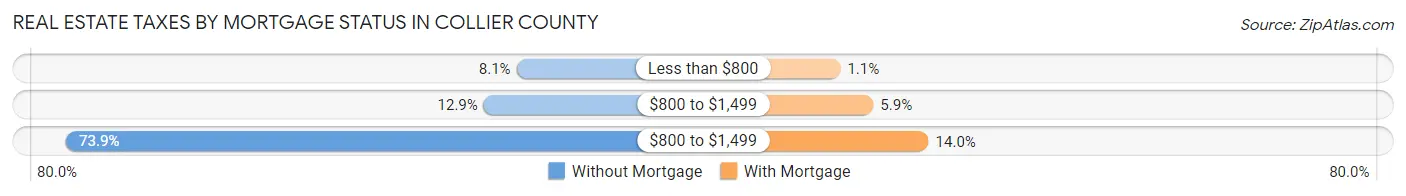
| Property Taxes | Without Mortgage | With Mortgage |
| Less than $800 | 5,053 (8.1%) | 599 (1.1%) |
| $800 to $1,499 | 8,036 (12.9%) | 3,256 (5.9%) |
| $800 to $1,499 | 45,948 (73.9%) | 7,709 (14.0%) |
| Total | 62,160 (100.0%) | 55,202 (100.0%) |
Health & Disability in Collier County
Health Insurance Coverage by Age in Collier County
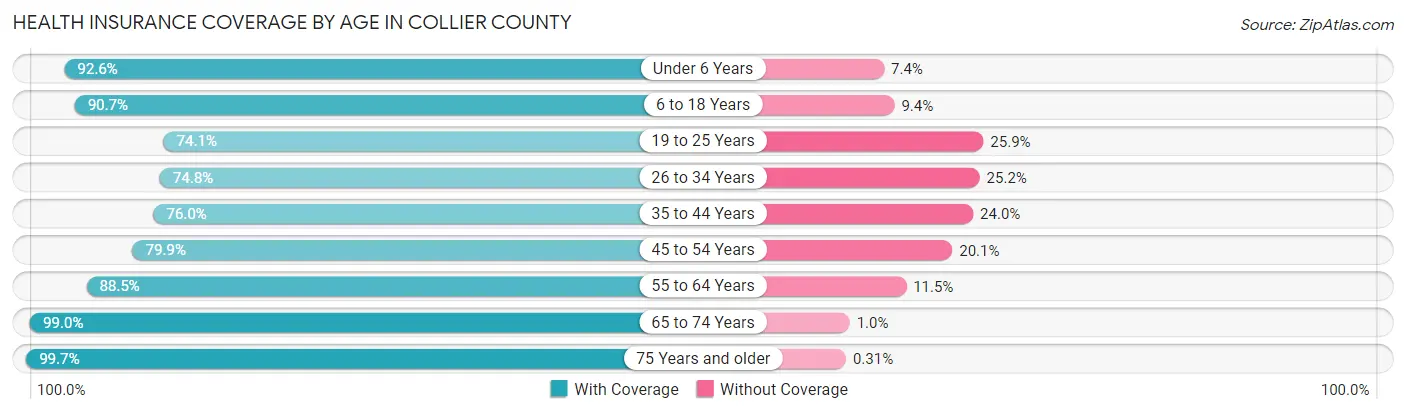
| Age Bracket | With Coverage | Without Coverage |
| Under 6 Years | 17,623 (92.6%) | 1,414 (7.4%) |
| 6 to 18 Years | 43,236 (90.6%) | 4,458 (9.3%) |
| 19 to 25 Years | 19,006 (74.1%) | 6,657 (25.9%) |
| 26 to 34 Years | 23,059 (74.8%) | 7,785 (25.2%) |
| 35 to 44 Years | 28,054 (76.0%) | 8,873 (24.0%) |
| 45 to 54 Years | 33,602 (79.9%) | 8,475 (20.1%) |
| 55 to 64 Years | 46,222 (88.5%) | 6,030 (11.5%) |
| 65 to 74 Years | 59,202 (99.0%) | 605 (1.0%) |
| 75 Years and older | 63,761 (99.7%) | 196 (0.3%) |
| Total | 333,765 (88.2%) | 44,493 (11.8%) |
Health Insurance Coverage by Citizenship Status in Collier County
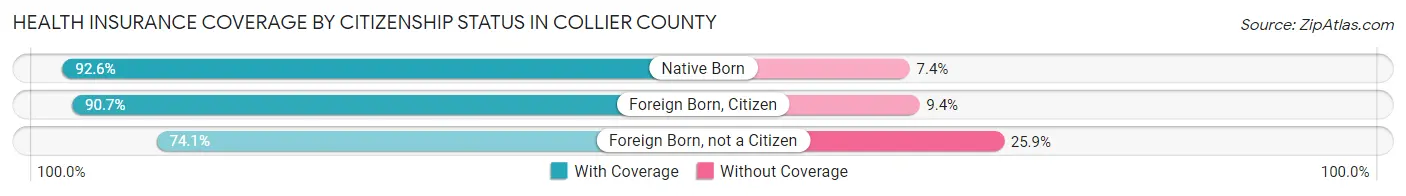
| Citizenship Status | With Coverage | Without Coverage |
| Native Born | 17,623 (92.6%) | 1,414 (7.4%) |
| Foreign Born, Citizen | 43,236 (90.6%) | 4,458 (9.3%) |
| Foreign Born, not a Citizen | 19,006 (74.1%) | 6,657 (25.9%) |
Health Insurance Coverage by Household Income in Collier County
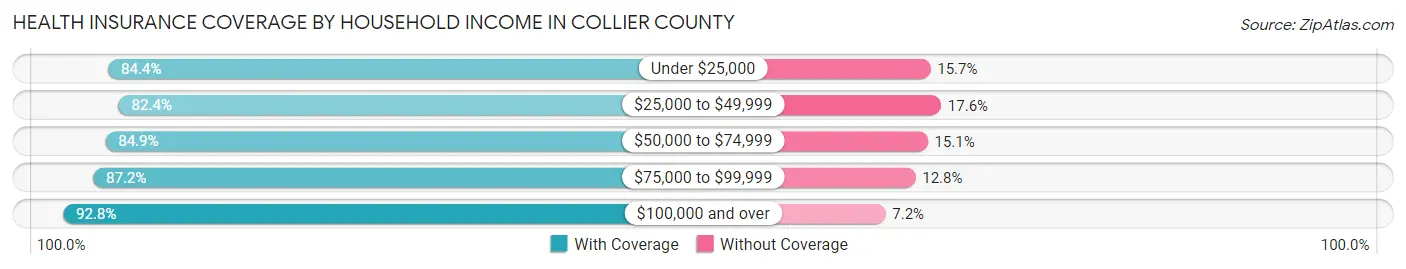
| Household Income | With Coverage | Without Coverage |
| Under $25,000 | 28,178 (84.4%) | 5,228 (15.7%) |
| $25,000 to $49,999 | 46,916 (82.4%) | 10,044 (17.6%) |
| $50,000 to $74,999 | 49,751 (84.9%) | 8,870 (15.1%) |
| $75,000 to $99,999 | 45,912 (87.2%) | 6,765 (12.8%) |
| $100,000 and over | 161,376 (92.8%) | 12,566 (7.2%) |
Public vs Private Health Insurance Coverage by Age in Collier County
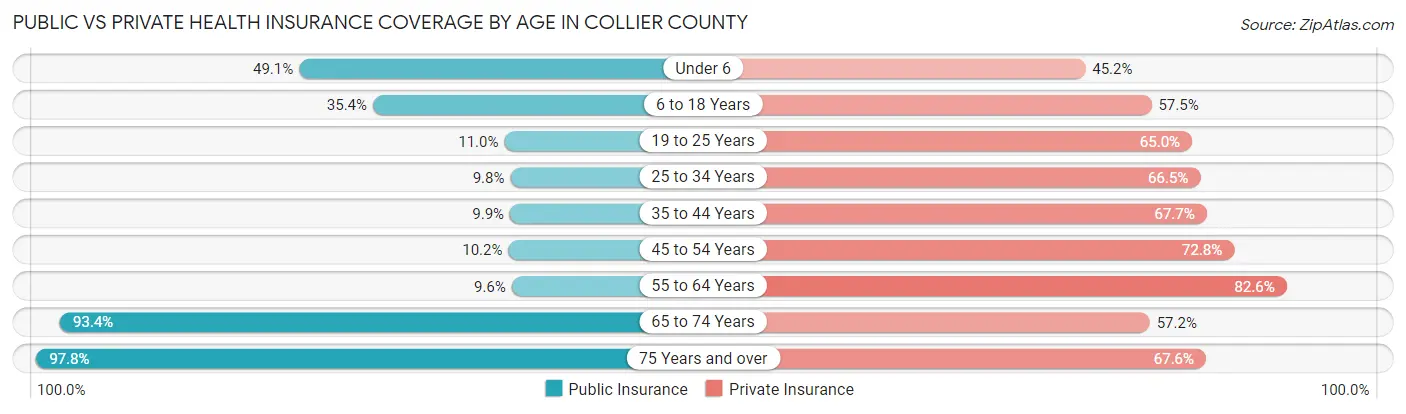
| Age Bracket | Public Insurance | Private Insurance |
| Under 6 | 9,340 (49.1%) | 8,602 (45.2%) |
| 6 to 18 Years | 16,865 (35.4%) | 27,414 (57.5%) |
| 19 to 25 Years | 2,813 (11.0%) | 16,675 (65.0%) |
| 25 to 34 Years | 3,036 (9.8%) | 20,515 (66.5%) |
| 35 to 44 Years | 3,658 (9.9%) | 24,995 (67.7%) |
| 45 to 54 Years | 4,302 (10.2%) | 30,638 (72.8%) |
| 55 to 64 Years | 5,018 (9.6%) | 43,138 (82.6%) |
| 65 to 74 Years | 55,884 (93.4%) | 34,187 (57.2%) |
| 75 Years and over | 62,577 (97.8%) | 43,213 (67.6%) |
| Total | 163,493 (43.2%) | 249,377 (65.9%) |
Disability Status by Sex by Age in Collier County
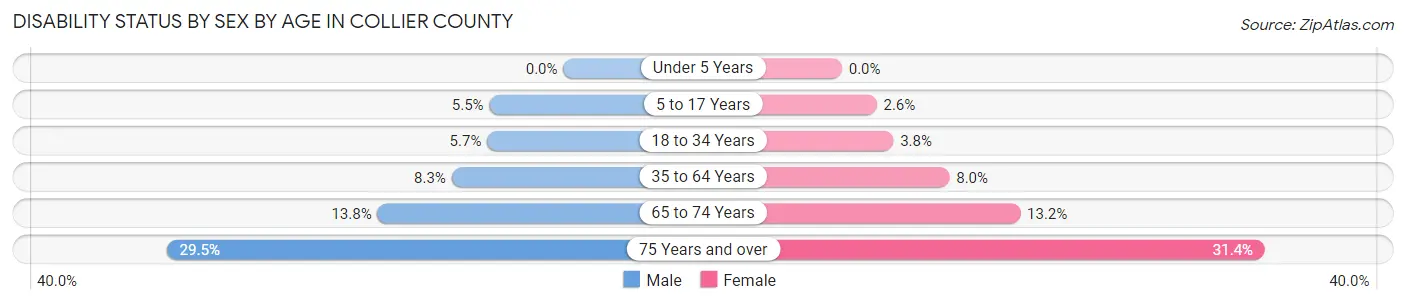
| Age Bracket | Male | Female |
| Under 5 Years | 0 (0.0%) | 0 (0.0%) |
| 5 to 17 Years | 1,330 (5.5%) | 598 (2.6%) |
| 18 to 34 Years | 1,781 (5.7%) | 1,087 (3.8%) |
| 35 to 64 Years | 5,349 (8.3%) | 5,331 (8.0%) |
| 65 to 74 Years | 3,861 (13.8%) | 4,215 (13.2%) |
| 75 Years and over | 8,994 (29.4%) | 10,496 (31.4%) |
Disability Class by Sex by Age in Collier County
Disability Class: Hearing Difficulty
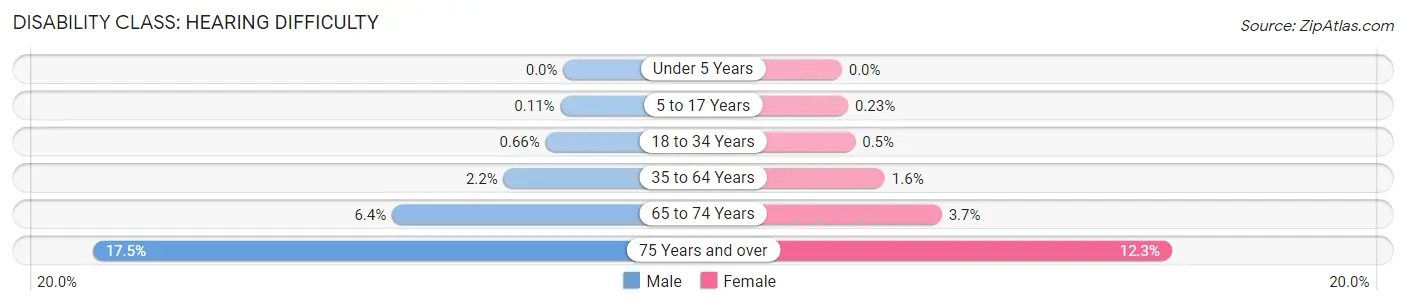
| Age Bracket | Male | Female |
| Under 5 Years | 0 (0.0%) | 0 (0.0%) |
| 5 to 17 Years | 27 (0.1%) | 54 (0.2%) |
| 18 to 34 Years | 209 (0.7%) | 142 (0.5%) |
| 35 to 64 Years | 1,433 (2.2%) | 1,065 (1.6%) |
| 65 to 74 Years | 1,779 (6.4%) | 1,182 (3.7%) |
| 75 Years and over | 5,335 (17.5%) | 4,094 (12.2%) |
Disability Class: Vision Difficulty
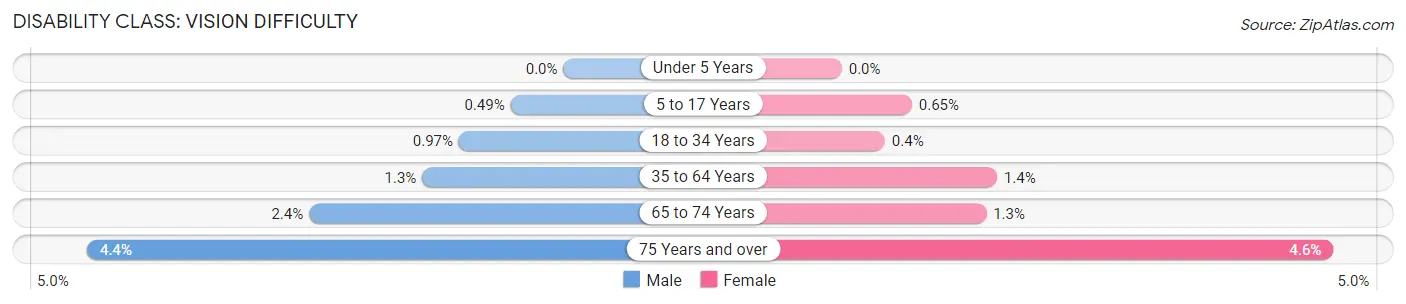
| Age Bracket | Male | Female |
| Under 5 Years | 0 (0.0%) | 0 (0.0%) |
| 5 to 17 Years | 119 (0.5%) | 150 (0.6%) |
| 18 to 34 Years | 304 (1.0%) | 114 (0.4%) |
| 35 to 64 Years | 846 (1.3%) | 961 (1.4%) |
| 65 to 74 Years | 660 (2.4%) | 426 (1.3%) |
| 75 Years and over | 1,351 (4.4%) | 1,523 (4.6%) |
Disability Class: Cognitive Difficulty
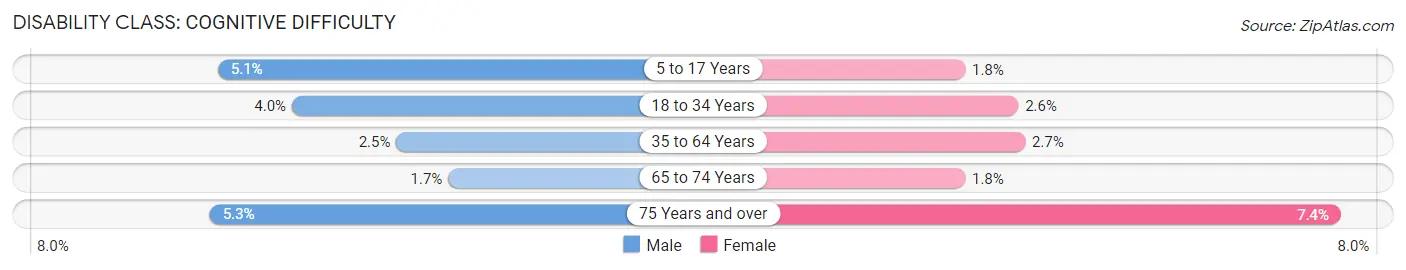
| Age Bracket | Male | Female |
| 5 to 17 Years | 1,244 (5.1%) | 424 (1.8%) |
| 18 to 34 Years | 1,270 (4.0%) | 744 (2.6%) |
| 35 to 64 Years | 1,598 (2.5%) | 1,818 (2.7%) |
| 65 to 74 Years | 479 (1.7%) | 583 (1.8%) |
| 75 Years and over | 1,605 (5.2%) | 2,477 (7.4%) |
Disability Class: Ambulatory Difficulty
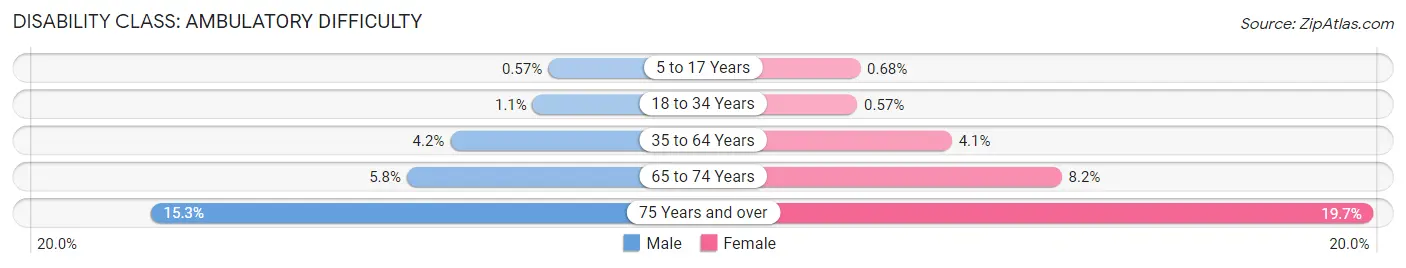
| Age Bracket | Male | Female |
| 5 to 17 Years | 139 (0.6%) | 157 (0.7%) |
| 18 to 34 Years | 358 (1.1%) | 163 (0.6%) |
| 35 to 64 Years | 2,708 (4.2%) | 2,727 (4.1%) |
| 65 to 74 Years | 1,626 (5.8%) | 2,597 (8.2%) |
| 75 Years and over | 4,679 (15.3%) | 6,595 (19.7%) |
Disability Class: Self-Care Difficulty
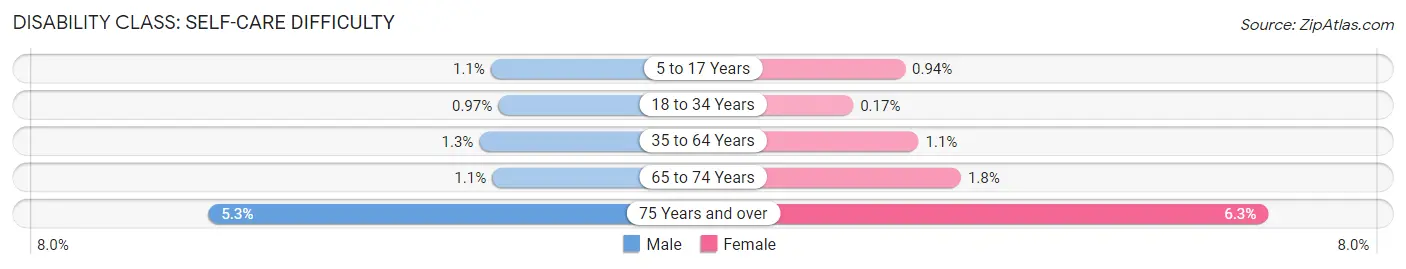
| Age Bracket | Male | Female |
| 5 to 17 Years | 262 (1.1%) | 217 (0.9%) |
| 18 to 34 Years | 306 (1.0%) | 49 (0.2%) |
| 35 to 64 Years | 806 (1.3%) | 759 (1.1%) |
| 65 to 74 Years | 297 (1.1%) | 563 (1.8%) |
| 75 Years and over | 1,611 (5.3%) | 2,116 (6.3%) |
Technology Access in Collier County
Computing Device Access in Collier County
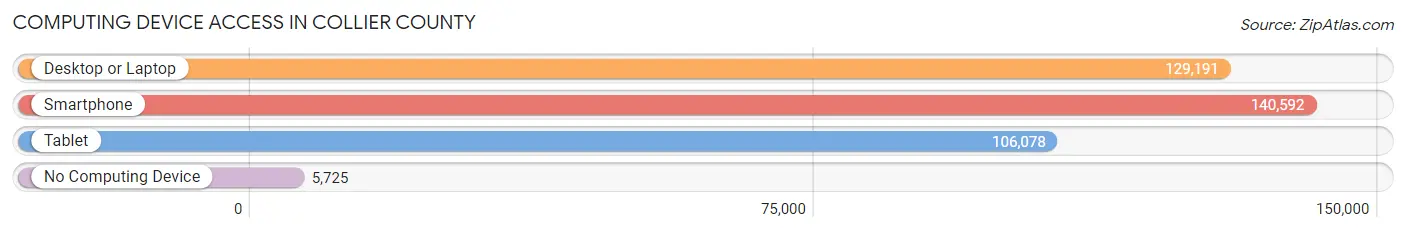
| Device Type | # Households | % Households |
| Desktop or Laptop | 129,191 | 82.4% |
| Smartphone | 140,592 | 89.7% |
| Tablet | 106,078 | 67.7% |
| No Computing Device | 5,725 | 3.6% |
| Total | 156,768 | 100.0% |
Internet Access in Collier County
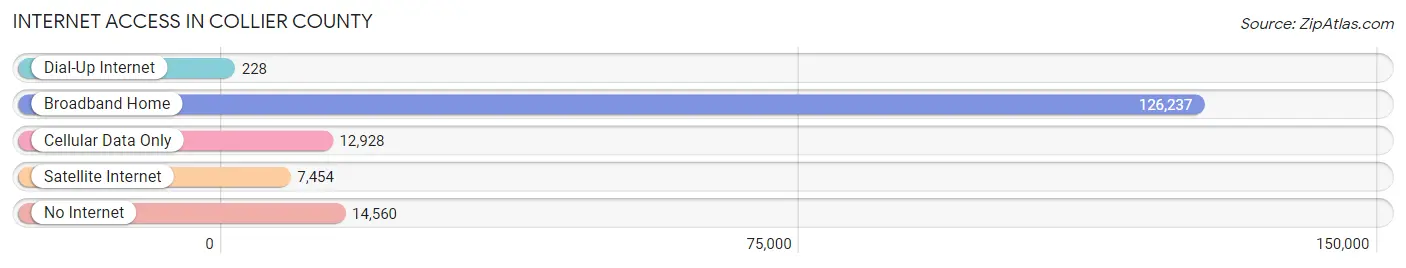
| Internet Type | # Households | % Households |
| Dial-Up Internet | 228 | 0.2% |
| Broadband Home | 126,237 | 80.5% |
| Cellular Data Only | 12,928 | 8.3% |
| Satellite Internet | 7,454 | 4.8% |
| No Internet | 14,560 | 9.3% |
| Total | 156,768 | 100.0% |
Collier County Summary
Collier County is located in the southwestern part of the state of Florida in the United States. It is bordered by Lee County to the north, Hendry County to the east, and Monroe County to the south. Collier County is part of the Naples-Marco Island Metropolitan Statistical Area. The county seat is East Naples.
History
Collier County was created in 1923 from Lee County. It was named for Barron Collier, a New York City advertising mogul and real estate developer who had moved to Southwest Florida in the early 1920s. Collier had purchased large tracts of land in the area and was instrumental in the development of the Tamiami Trail, which connected Tampa and Miami.
Collier County was sparsely populated until the 1950s, when the population began to grow rapidly. This growth was due in part to the development of the Naples area, which became a popular destination for retirees and vacationers. The county's population continued to grow throughout the 1970s and 1980s, and by the 2000 census, it had reached a total of 252,053.
Geography
Collier County covers an area of 2,304 square miles, making it the largest county in Florida. It is located on the Gulf of Mexico and is home to numerous islands, including Marco Island, Keewaydin Island, and Useppa Island. The county is also home to the Big Cypress National Preserve, which is part of the Everglades National Park.
The terrain of Collier County is mostly flat, with some rolling hills in the northern part of the county. The highest point in the county is Panther Point, which has an elevation of 28 feet. The county is home to numerous rivers, lakes, and wetlands, including the Big Cypress Swamp, the Ten Thousand Islands, and the Fakahatchee Strand.
Economy
Collier County has a diverse economy that is largely driven by tourism. The county is home to numerous resorts, hotels, and restaurants, as well as a variety of attractions, such as the Naples Zoo and the Everglades National Park. The county is also home to a number of corporate headquarters, including Arthrex, Chico's FAS, and Hertz Corporation.
The county's agricultural sector is also important to the local economy. Collier County is home to numerous farms and ranches, which produce a variety of crops, including tomatoes, peppers, and citrus fruits. The county is also home to a number of fishing and shrimping operations.
Demographics
As of the 2010 census, Collier County had a population of 321,520. The population was spread out, with 24.3% under the age of 18, 8.2% from 18 to 24, 28.2% from 25 to 44, 25.2% from 45 to 64, and 14.1% who were 65 years of age or older. The median age was 40.2 years.
The racial makeup of the county was 87.2% White, 5.3% African American, 0.3% Native American, 1.7% Asian, 0.1% Pacific Islander, 3.2% from other races, and 2.3% from two or more races. Hispanic or Latino of any race were 14.3% of the population.
The median income for a household in Collier County was $50,890, and the median income for a family was $60,890. The per capita income for the county was $30,945. About 8.7% of families and 11.2% of the population were below the poverty line, including 15.2% of those under age 18 and 5.2% of those age 65 or over.
Common Questions
What is Per Capita Income in Collier County?
Per Capita income in Collier County is $56,666.
What is the Median Family Income in Collier County?
Median Family Income in Collier County is $98,919.
What is the Median Household income in Collier County?
Median Household Income in Collier County is $82,011.
What is Income or Wage Gap in Collier County?
Income or Wage Gap in Collier County is 22.3%.
Women in Collier County earn 77.7 cents for every dollar earned by a man.
What is Family Income Deficit in Collier County?
Family Income Deficit in Collier County is $10,430.
Families that are below poverty line in Collier County earn $10,430 less on average than the poverty threshold level.
What is Inequality or Gini Index in Collier County?
Inequality or Gini Index in Collier County is 0.53.
What is the Total Population of Collier County?
Total Population of Collier County is 380,221.
What is the Total Male Population of Collier County?
Total Male Population of Collier County is 188,078.
What is the Total Female Population of Collier County?
Total Female Population of Collier County is 192,143.
What is the Ratio of Males per 100 Females in Collier County?
There are 97.88 Males per 100 Females in Collier County.
What is the Ratio of Females per 100 Males in Collier County?
There are 102.16 Females per 100 Males in Collier County.
What is the Median Population Age in Collier County?
Median Population Age in Collier County is 52.2 Years.
What is the Average Family Size in Collier County
Average Family Size in Collier County is 2.9 People.
What is the Average Household Size in Collier County
Average Household Size in Collier County is 2.4 People.
How Large is the Labor Force in Collier County?
There are 169,010 People in the Labor Forcein in Collier County.
What is the Percentage of People in the Labor Force in Collier County?
52.1% of People are in the Labor Force in Collier County.
What is the Unemployment Rate in Collier County?
Unemployment Rate in Collier County is 4.3%.