Pinellas County, FL Map & Demographics
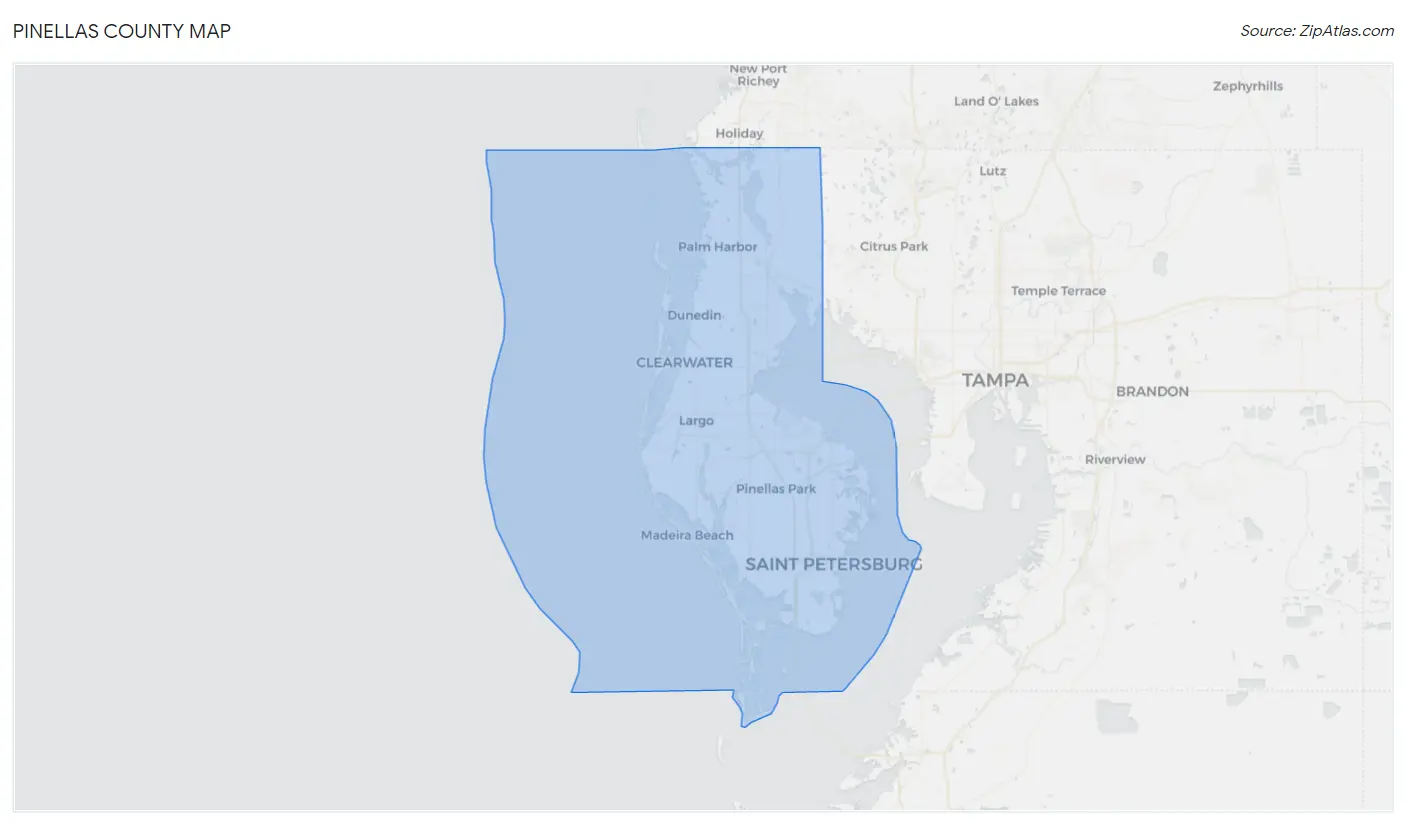
Pinellas County Map
Pinellas County Overview
$44,020
PER CAPITA INCOME
$89,479
AVG FAMILY INCOME
$66,406
AVG HOUSEHOLD INCOME
17.2%
WAGE / INCOME GAP [ % ]
82.8¢/ $1
WAGE / INCOME GAP [ $ ]
$10,369
FAMILY INCOME DEFICIT
0.49
INEQUALITY / GINI INDEX
959,918
TOTAL POPULATION
464,021
MALE POPULATION
495,897
FEMALE POPULATION
93.57
MALES / 100 FEMALES
106.87
FEMALES / 100 MALES
48.8
MEDIAN AGE
2.9
AVG FAMILY SIZE
2.2
AVG HOUSEHOLD SIZE
485,244
LABOR FORCE [ PEOPLE ]
58.7%
PERCENT IN LABOR FORCE
4.6%
UNEMPLOYMENT RATE
Income in Pinellas County
Income Overview in Pinellas County
Per Capita Income in Pinellas County is $44,020, while median incomes of families and households are $89,479 and $66,406 respectively.
| Characteristic | Number | Measure |
| Per Capita Income | 959,918 | $44,020 |
| Median Family Income | 233,391 | $89,479 |
| Mean Family Income | 233,391 | $120,715 |
| Median Household Income | 418,716 | $66,406 |
| Mean Household Income | 418,716 | $96,725 |
| Income Deficit | 233,391 | $10,369 |
| Wage / Income Gap (%) | 959,918 | 17.15% |
| Wage / Income Gap ($) | 959,918 | 82.85¢ per $1 |
| Gini / Inequality Index | 959,918 | 0.49 |
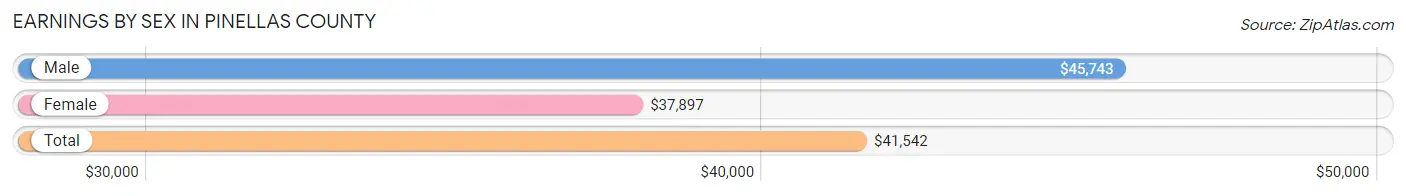
Earnings by Sex in Pinellas County
Average Earnings in Pinellas County are $41,542, $45,743 for men and $37,897 for women, a difference of 17.2%.
| Sex | Number | Average Earnings |
| Male | 255,453 (50.9%) | $45,743 |
| Female | 246,330 (49.1%) | $37,897 |
| Total | 501,783 (100.0%) | $41,542 |
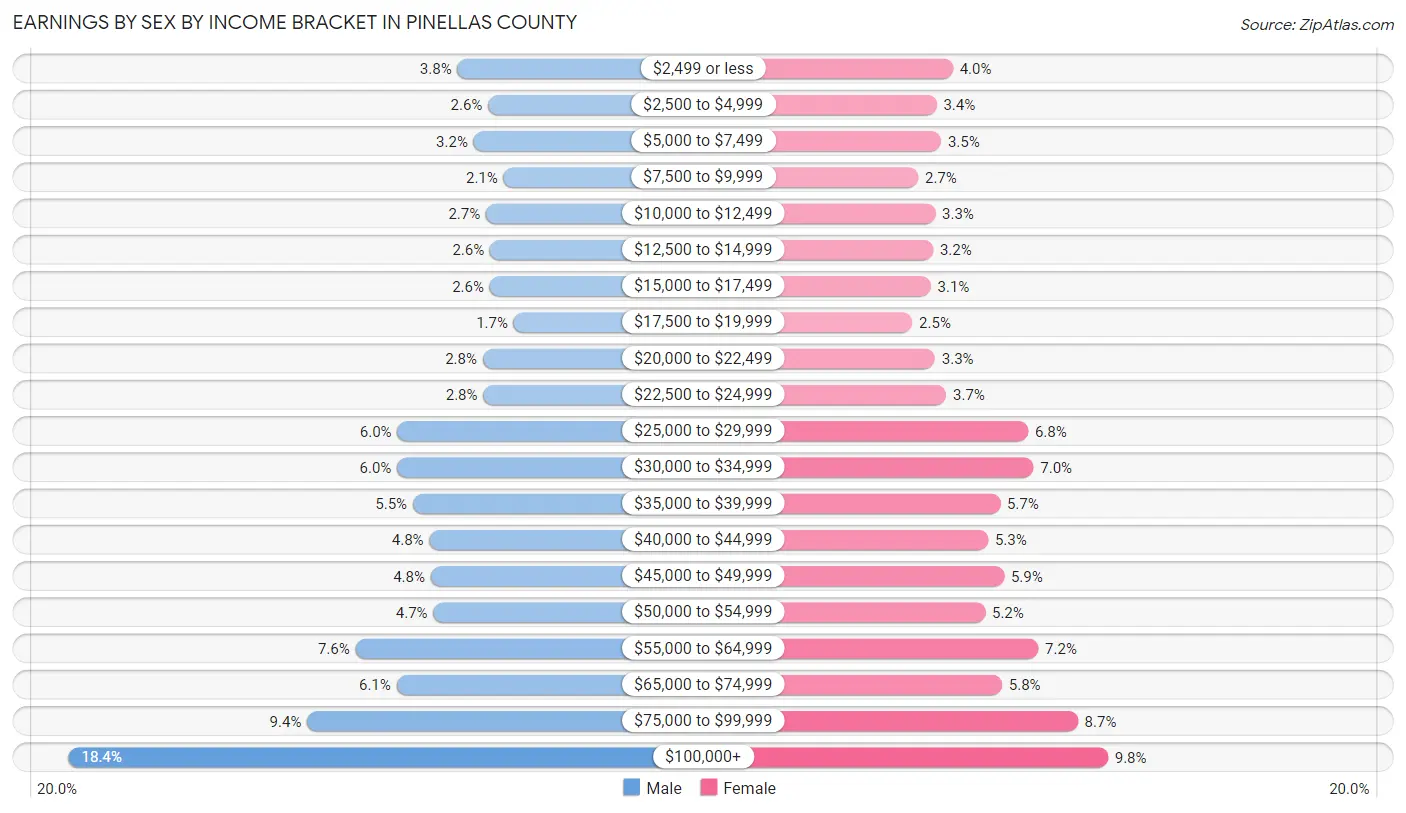
Earnings by Sex by Income Bracket in Pinellas County
The most common earnings brackets in Pinellas County are $100,000+ for men (46,866 | 18.3%) and $100,000+ for women (24,102 | 9.8%).
| Income | Male | Female |
| $2,499 or less | 9,668 (3.8%) | 9,767 (4.0%) |
| $2,500 to $4,999 | 6,722 (2.6%) | 8,288 (3.4%) |
| $5,000 to $7,499 | 8,100 (3.2%) | 8,703 (3.5%) |
| $7,500 to $9,999 | 5,229 (2.1%) | 6,585 (2.7%) |
| $10,000 to $12,499 | 6,912 (2.7%) | 8,153 (3.3%) |
| $12,500 to $14,999 | 6,537 (2.6%) | 7,967 (3.2%) |
| $15,000 to $17,499 | 6,556 (2.6%) | 7,741 (3.1%) |
| $17,500 to $19,999 | 4,274 (1.7%) | 6,023 (2.5%) |
| $20,000 to $22,499 | 7,242 (2.8%) | 8,140 (3.3%) |
| $22,500 to $24,999 | 7,173 (2.8%) | 9,174 (3.7%) |
| $25,000 to $29,999 | 15,407 (6.0%) | 16,729 (6.8%) |
| $30,000 to $34,999 | 15,421 (6.0%) | 17,209 (7.0%) |
| $35,000 to $39,999 | 13,912 (5.4%) | 14,137 (5.7%) |
| $40,000 to $44,999 | 12,337 (4.8%) | 13,042 (5.3%) |
| $45,000 to $49,999 | 12,207 (4.8%) | 14,507 (5.9%) |
| $50,000 to $54,999 | 11,957 (4.7%) | 12,765 (5.2%) |
| $55,000 to $64,999 | 19,403 (7.6%) | 17,671 (7.2%) |
| $65,000 to $74,999 | 15,481 (6.1%) | 14,313 (5.8%) |
| $75,000 to $99,999 | 24,049 (9.4%) | 21,314 (8.6%) |
| $100,000+ | 46,866 (18.3%) | 24,102 (9.8%) |
| Total | 255,453 (100.0%) | 246,330 (100.0%) |
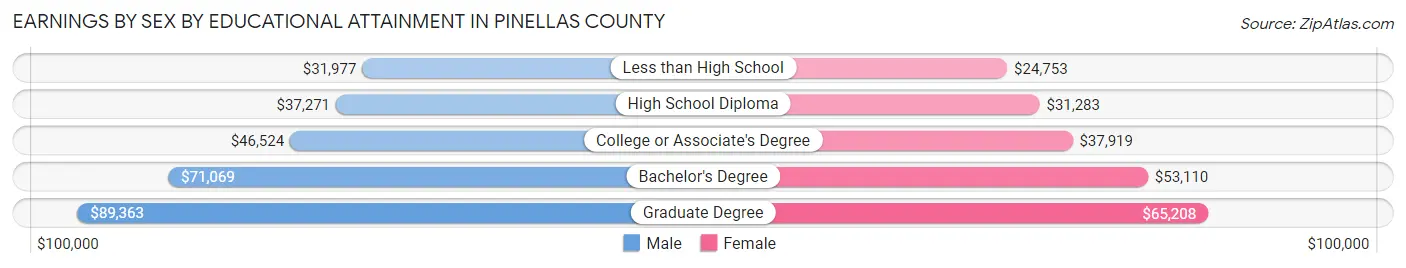
Earnings by Sex by Educational Attainment in Pinellas County
Average earnings in Pinellas County are $50,618 for men and $42,080 for women, a difference of 16.9%. Men with an educational attainment of graduate degree enjoy the highest average annual earnings of $89,363, while those with less than high school education earn the least with $31,977. Women with an educational attainment of graduate degree earn the most with the average annual earnings of $65,208, while those with less than high school education have the smallest earnings of $24,753.
| Educational Attainment | Male Income | Female Income |
| Less than High School | $31,977 | $24,753 |
| High School Diploma | $37,271 | $31,283 |
| College or Associate's Degree | $46,524 | $37,919 |
| Bachelor's Degree | $71,069 | $53,110 |
| Graduate Degree | $89,363 | $65,208 |
| Total | $50,618 | $42,080 |
Family Income in Pinellas County
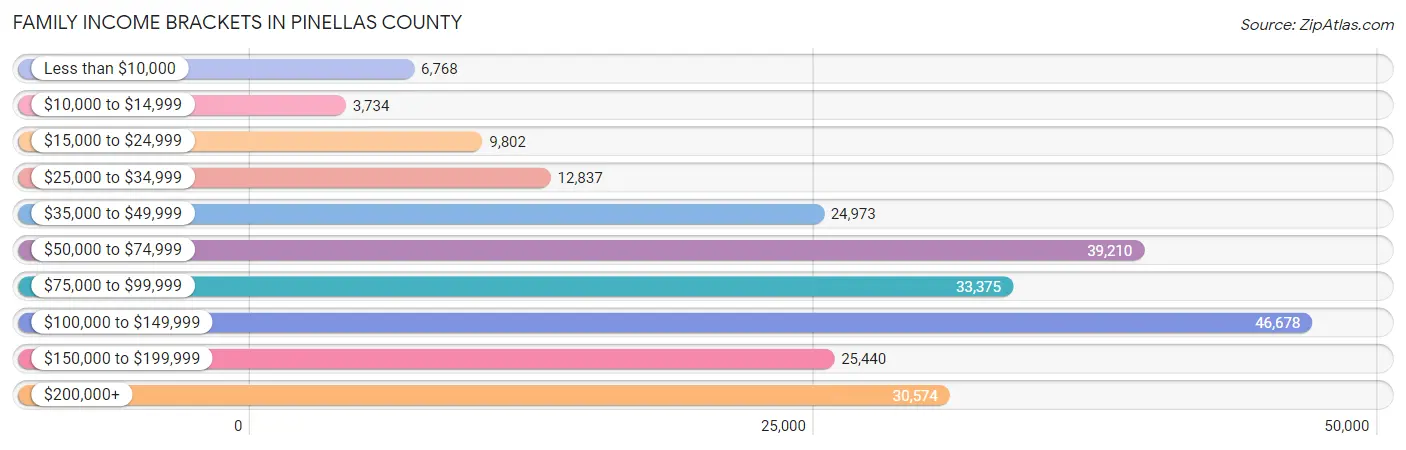
Family Income Brackets in Pinellas County
According to the Pinellas County family income data, there are 46,678 families falling into the $100,000 to $149,999 income range, which is the most common income bracket and makes up 20.0% of all families. Conversely, the $10,000 to $14,999 income bracket is the least frequent group with only 3,734 families (1.6%) belonging to this category.
| Income Bracket | # Families | % Families |
| Less than $10,000 | 6,768 | 2.9% |
| $10,000 to $14,999 | 3,734 | 1.6% |
| $15,000 to $24,999 | 9,802 | 4.2% |
| $25,000 to $34,999 | 12,837 | 5.5% |
| $35,000 to $49,999 | 24,973 | 10.7% |
| $50,000 to $74,999 | 39,210 | 16.8% |
| $75,000 to $99,999 | 33,375 | 14.3% |
| $100,000 to $149,999 | 46,678 | 20.0% |
| $150,000 to $199,999 | 25,440 | 10.9% |
| $200,000+ | 30,574 | 13.1% |
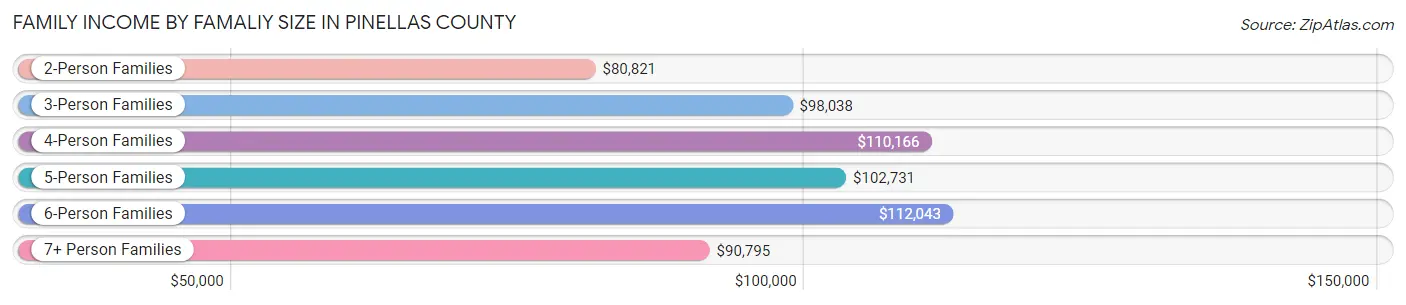
Family Income by Famaliy Size in Pinellas County
6-person families (3,341 | 1.4%) account for the highest median family income in Pinellas County with $112,043 per family, while 2-person families (140,038 | 60.0%) have the highest median income of $40,410 per family member.
| Income Bracket | # Families | Median Income |
| 2-Person Families | 140,038 (60.0%) | $80,821 |
| 3-Person Families | 46,129 (19.8%) | $98,038 |
| 4-Person Families | 31,544 (13.5%) | $110,166 |
| 5-Person Families | 11,013 (4.7%) | $102,731 |
| 6-Person Families | 3,341 (1.4%) | $112,043 |
| 7+ Person Families | 1,326 (0.6%) | $90,795 |
| Total | 233,391 (100.0%) | $89,479 |
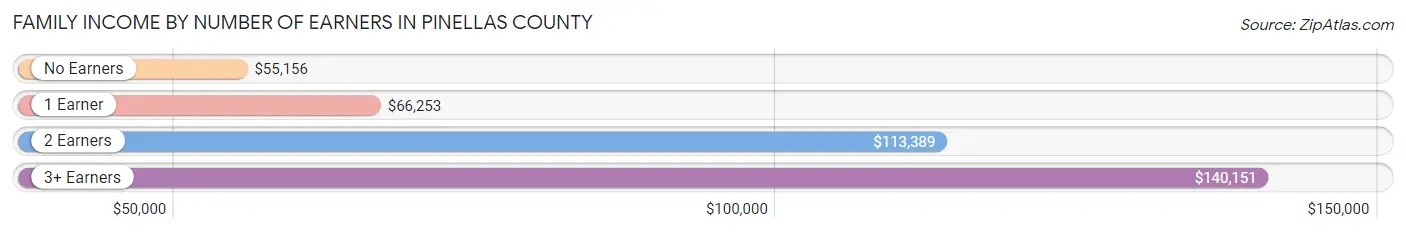
Family Income by Number of Earners in Pinellas County
The median family income in Pinellas County is $89,479, with families comprising 3+ earners (19,015) having the highest median family income of $140,151, while families with no earners (47,841) have the lowest median family income of $55,156, accounting for 8.2% and 20.5% of families, respectively.
| Number of Earners | # Families | Median Income |
| No Earners | 47,841 (20.5%) | $55,156 |
| 1 Earner | 74,510 (31.9%) | $66,253 |
| 2 Earners | 92,025 (39.4%) | $113,389 |
| 3+ Earners | 19,015 (8.2%) | $140,151 |
| Total | 233,391 (100.0%) | $89,479 |
Household Income in Pinellas County
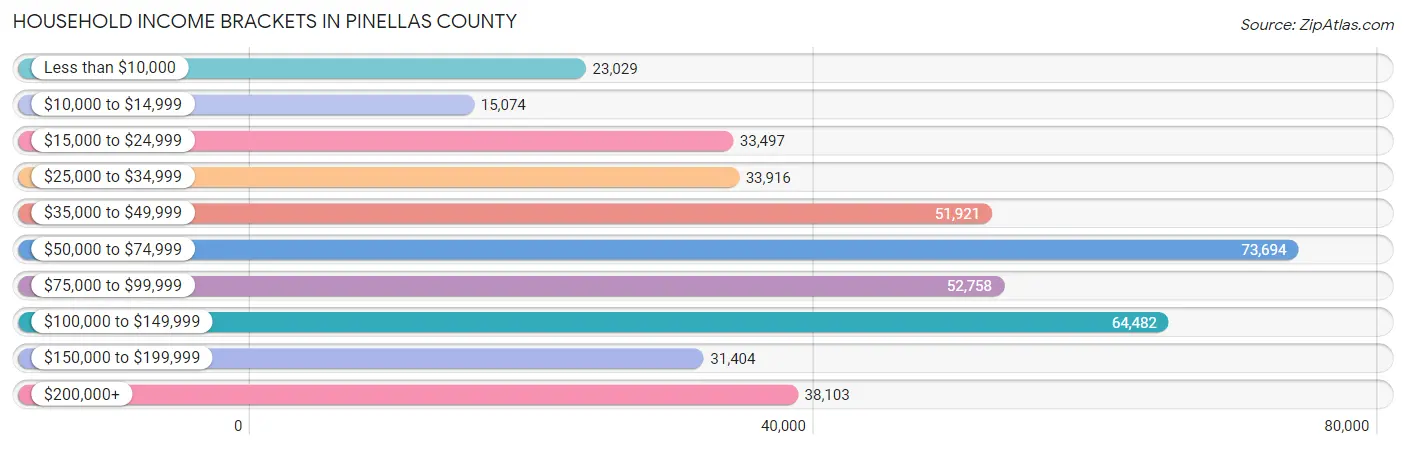
Household Income Brackets in Pinellas County
With 73,694 households falling in the category, the $50,000 to $74,999 income range is the most frequent in Pinellas County, accounting for 17.6% of all households. In contrast, only 15,074 households (3.6%) fall into the $10,000 to $14,999 income bracket, making it the least populous group.
| Income Bracket | # Households | % Households |
| Less than $10,000 | 23,029 | 5.5% |
| $10,000 to $14,999 | 15,074 | 3.6% |
| $15,000 to $24,999 | 33,497 | 8.0% |
| $25,000 to $34,999 | 33,916 | 8.1% |
| $35,000 to $49,999 | 51,921 | 12.4% |
| $50,000 to $74,999 | 73,694 | 17.6% |
| $75,000 to $99,999 | 52,758 | 12.6% |
| $100,000 to $149,999 | 64,482 | 15.4% |
| $150,000 to $199,999 | 31,404 | 7.5% |
| $200,000+ | 38,103 | 9.1% |
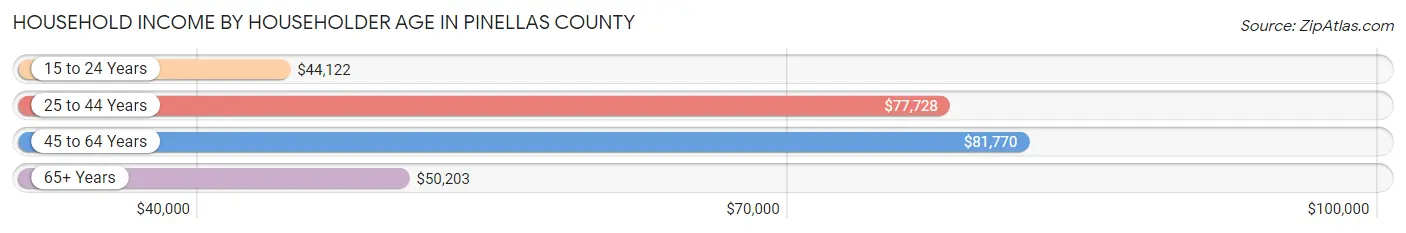
Household Income by Householder Age in Pinellas County
The median household income in Pinellas County is $66,406, with the highest median household income of $81,770 found in the 45 to 64 years age bracket for the primary householder. A total of 156,419 households (37.4%) fall into this category. Meanwhile, the 15 to 24 years age bracket for the primary householder has the lowest median household income of $44,122, with 8,209 households (2.0%) in this group.
| Income Bracket | # Households | Median Income |
| 15 to 24 Years | 8,209 (2.0%) | $44,122 |
| 25 to 44 Years | 101,104 (24.1%) | $77,728 |
| 45 to 64 Years | 156,419 (37.4%) | $81,770 |
| 65+ Years | 152,984 (36.5%) | $50,203 |
| Total | 418,716 (100.0%) | $66,406 |
Poverty in Pinellas County
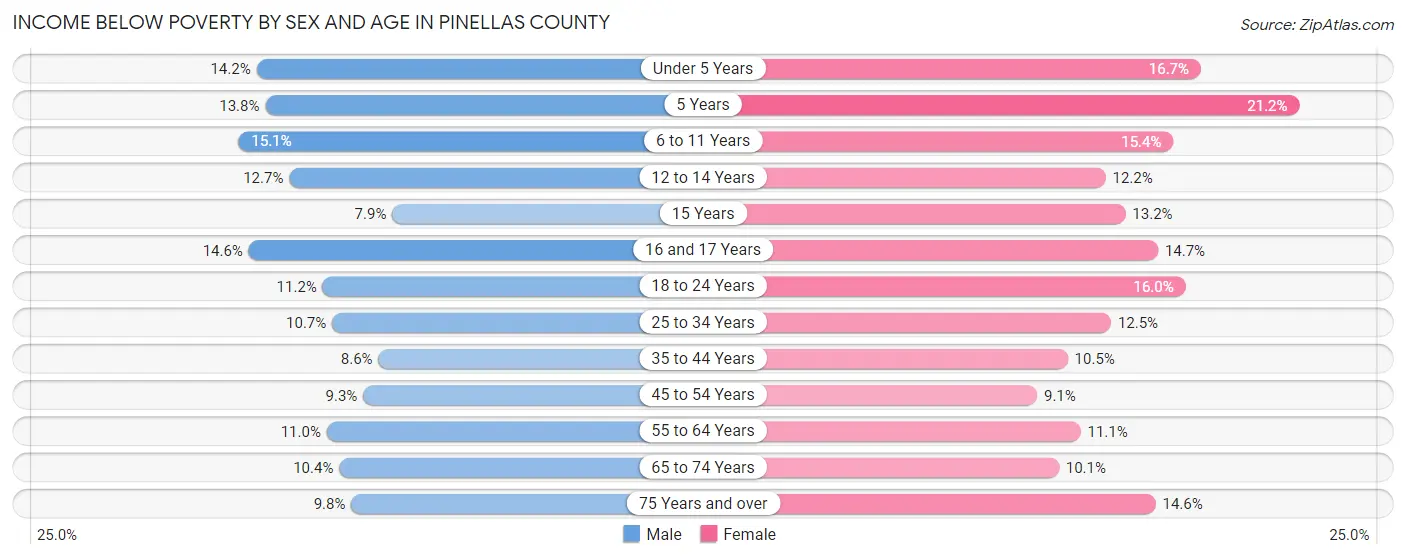
Income Below Poverty by Sex and Age in Pinellas County
With 10.7% poverty level for males and 12.1% for females among the residents of Pinellas County, 6 to 11 year old males and 5 year old females are the most vulnerable to poverty, with 3,894 males (15.1%) and 823 females (21.2%) in their respective age groups living below the poverty level.
| Age Bracket | Male | Female |
| Under 5 Years | 2,746 (14.2%) | 3,004 (16.7%) |
| 5 Years | 499 (13.8%) | 823 (21.2%) |
| 6 to 11 Years | 3,894 (15.1%) | 3,861 (15.4%) |
| 12 to 14 Years | 1,695 (12.7%) | 1,437 (12.2%) |
| 15 Years | 404 (7.9%) | 581 (13.2%) |
| 16 and 17 Years | 1,283 (14.6%) | 1,294 (14.7%) |
| 18 to 24 Years | 3,401 (11.2%) | 4,740 (16.0%) |
| 25 to 34 Years | 6,100 (10.7%) | 7,181 (12.5%) |
| 35 to 44 Years | 4,544 (8.6%) | 5,668 (10.5%) |
| 45 to 54 Years | 5,496 (9.3%) | 5,594 (9.1%) |
| 55 to 64 Years | 8,019 (11.0%) | 8,871 (11.1%) |
| 65 to 74 Years | 6,287 (10.4%) | 6,965 (10.1%) |
| 75 Years and over | 4,503 (9.8%) | 8,975 (14.6%) |
| Total | 48,871 (10.7%) | 58,994 (12.1%) |
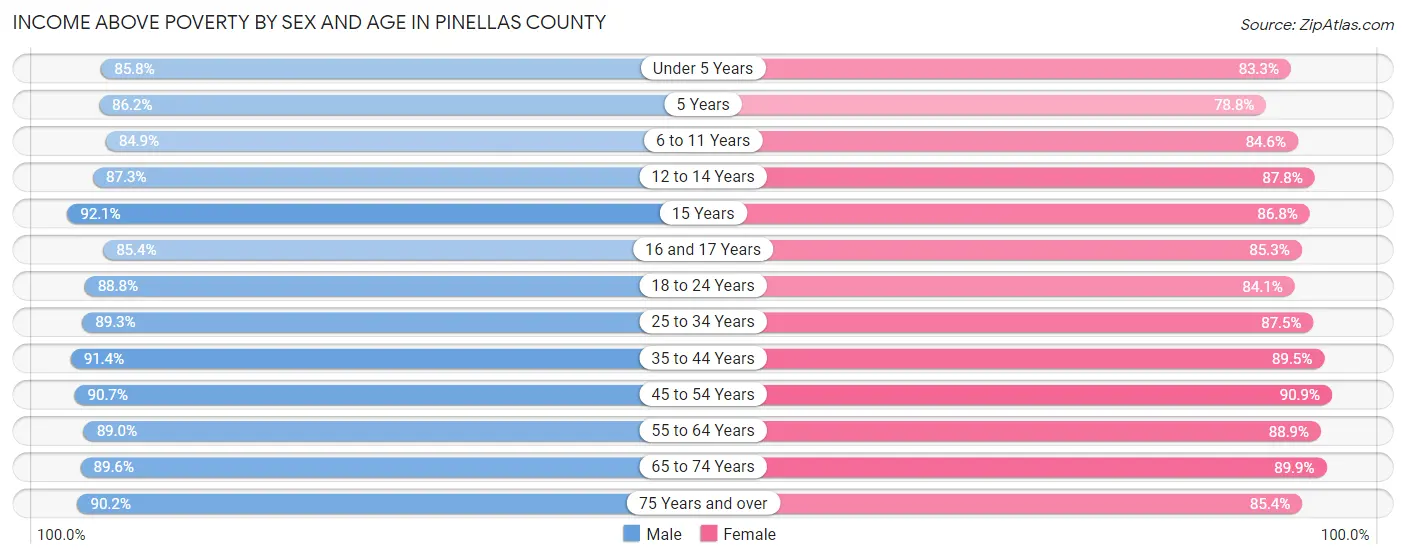
Income Above Poverty by Sex and Age in Pinellas County
According to the poverty statistics in Pinellas County, males aged 15 years and females aged 45 to 54 years are the age groups that are most secure financially, with 92.1% of males and 90.9% of females in these age groups living above the poverty line.
| Age Bracket | Male | Female |
| Under 5 Years | 16,540 (85.8%) | 15,022 (83.3%) |
| 5 Years | 3,109 (86.2%) | 3,053 (78.8%) |
| 6 to 11 Years | 21,921 (84.9%) | 21,240 (84.6%) |
| 12 to 14 Years | 11,633 (87.3%) | 10,299 (87.8%) |
| 15 Years | 4,685 (92.1%) | 3,833 (86.8%) |
| 16 and 17 Years | 7,504 (85.4%) | 7,528 (85.3%) |
| 18 to 24 Years | 27,055 (88.8%) | 24,977 (84.1%) |
| 25 to 34 Years | 50,768 (89.3%) | 50,320 (87.5%) |
| 35 to 44 Years | 48,394 (91.4%) | 48,400 (89.5%) |
| 45 to 54 Years | 53,679 (90.7%) | 56,157 (90.9%) |
| 55 to 64 Years | 65,041 (89.0%) | 71,227 (88.9%) |
| 65 to 74 Years | 54,162 (89.6%) | 62,170 (89.9%) |
| 75 Years and over | 41,246 (90.2%) | 52,664 (85.4%) |
| Total | 405,737 (89.2%) | 426,890 (87.9%) |
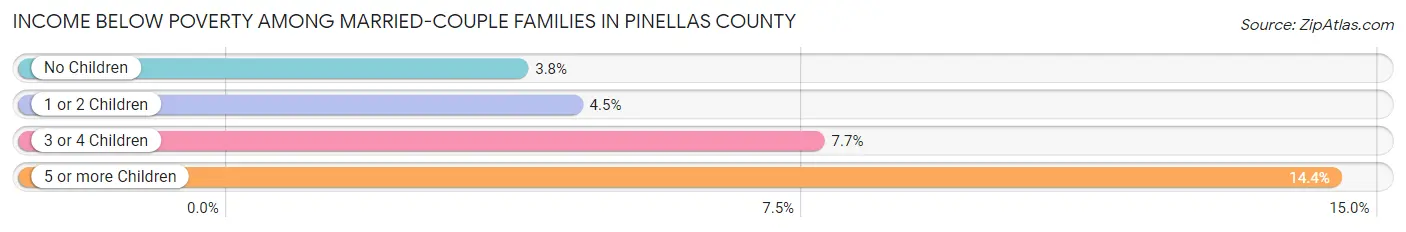
Income Below Poverty Among Married-Couple Families in Pinellas County
The poverty statistics for married-couple families in Pinellas County show that 4.1% or 7,220 of the total 174,417 families live below the poverty line. Families with 5 or more children have the highest poverty rate of 14.4%, comprising of 51 families. On the other hand, families with no children have the lowest poverty rate of 3.8%, which includes 4,735 families.
| Children | Above Poverty | Below Poverty |
| No Children | 120,039 (96.2%) | 4,735 (3.8%) |
| 1 or 2 Children | 40,487 (95.5%) | 1,906 (4.5%) |
| 3 or 4 Children | 6,368 (92.3%) | 528 (7.7%) |
| 5 or more Children | 303 (85.6%) | 51 (14.4%) |
| Total | 167,197 (95.9%) | 7,220 (4.1%) |
Income Below Poverty Among Single-Parent Households in Pinellas County
According to the poverty data in Pinellas County, 14.6% or 2,319 single-father households and 16.9% or 7,256 single-mother households are living below the poverty line. Among single-father households, those with 3 or 4 children have the highest poverty rate, with 171 households (21.1%) experiencing poverty. Likewise, among single-mother households, those with 5 or more children have the highest poverty rate, with 157 households (57.3%) falling below the poverty line.
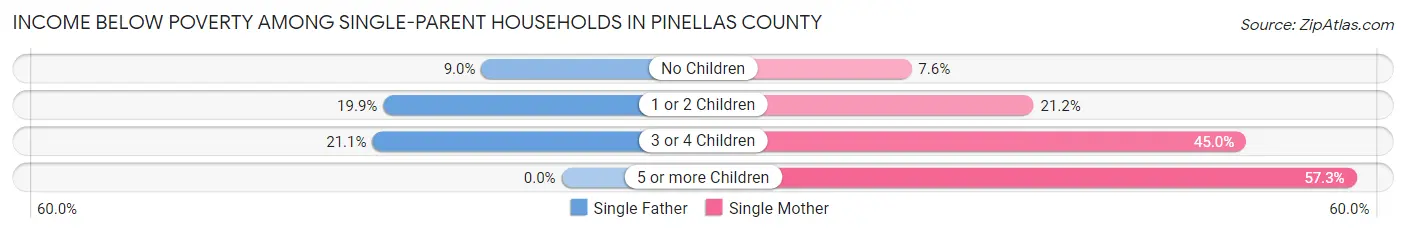
| Children | Single Father | Single Mother |
| No Children | 702 (9.0%) | 1,517 (7.6%) |
| 1 or 2 Children | 1,446 (19.9%) | 4,153 (21.2%) |
| 3 or 4 Children | 171 (21.1%) | 1,429 (45.0%) |
| 5 or more Children | 0 (0.0%) | 157 (57.3%) |
| Total | 2,319 (14.6%) | 7,256 (16.9%) |
Income Below Poverty Among Married-Couple vs Single-Parent Households in Pinellas County
The poverty data for Pinellas County shows that 7,220 of the married-couple family households (4.1%) and 9,575 of the single-parent households (16.2%) are living below the poverty level. Within the married-couple family households, those with 5 or more children have the highest poverty rate, with 51 households (14.4%) falling below the poverty line. Among the single-parent households, those with 5 or more children have the highest poverty rate, with 157 household (54.3%) living below poverty.
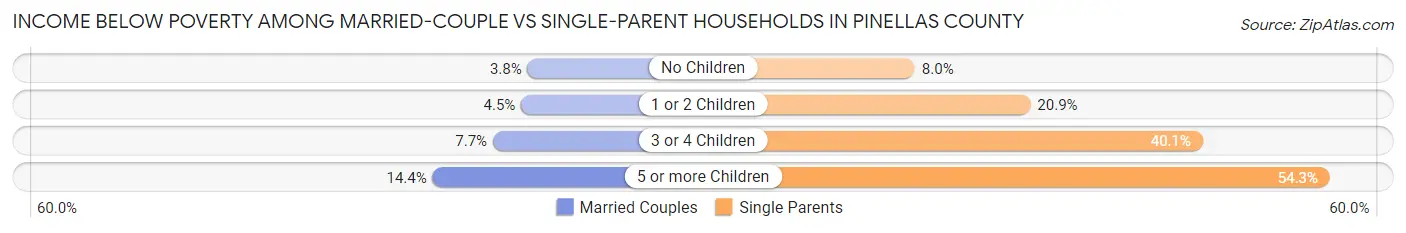
| Children | Married-Couple Families | Single-Parent Households |
| No Children | 4,735 (3.8%) | 2,219 (8.0%) |
| 1 or 2 Children | 1,906 (4.5%) | 5,599 (20.9%) |
| 3 or 4 Children | 528 (7.7%) | 1,600 (40.1%) |
| 5 or more Children | 51 (14.4%) | 157 (54.3%) |
| Total | 7,220 (4.1%) | 9,575 (16.2%) |
Race in Pinellas County
The most populous races in Pinellas County are White / Caucasian (738,122 | 76.9%), Hispanic or Latino (99,956 | 10.4%), and Black / African American (96,357 | 10.0%).
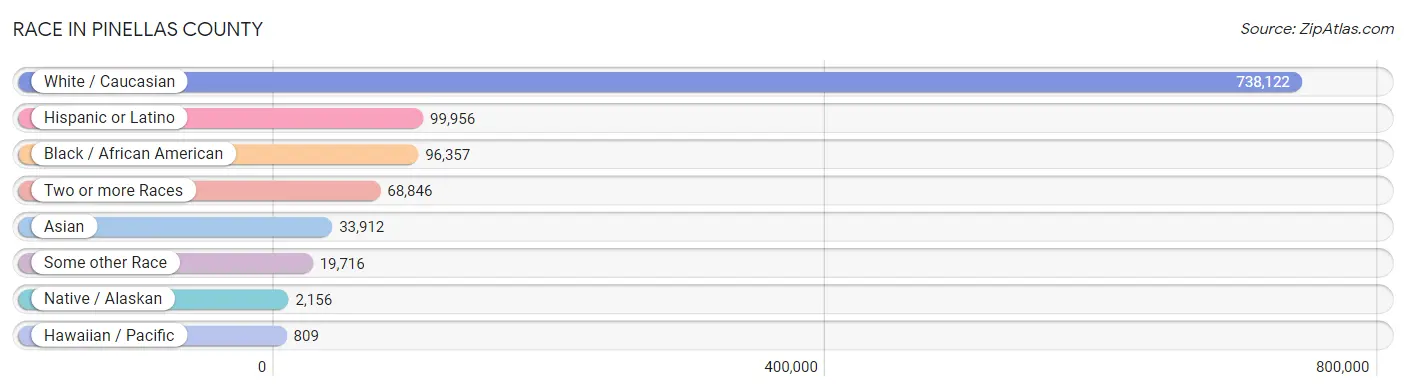
| Race | # Population | % Population |
| Asian | 33,912 | 3.5% |
| Black / African American | 96,357 | 10.0% |
| Hawaiian / Pacific | 809 | 0.1% |
| Hispanic or Latino | 99,956 | 10.4% |
| Native / Alaskan | 2,156 | 0.2% |
| White / Caucasian | 738,122 | 76.9% |
| Two or more Races | 68,846 | 7.2% |
| Some other Race | 19,716 | 2.1% |
| Total | 959,918 | 100.0% |
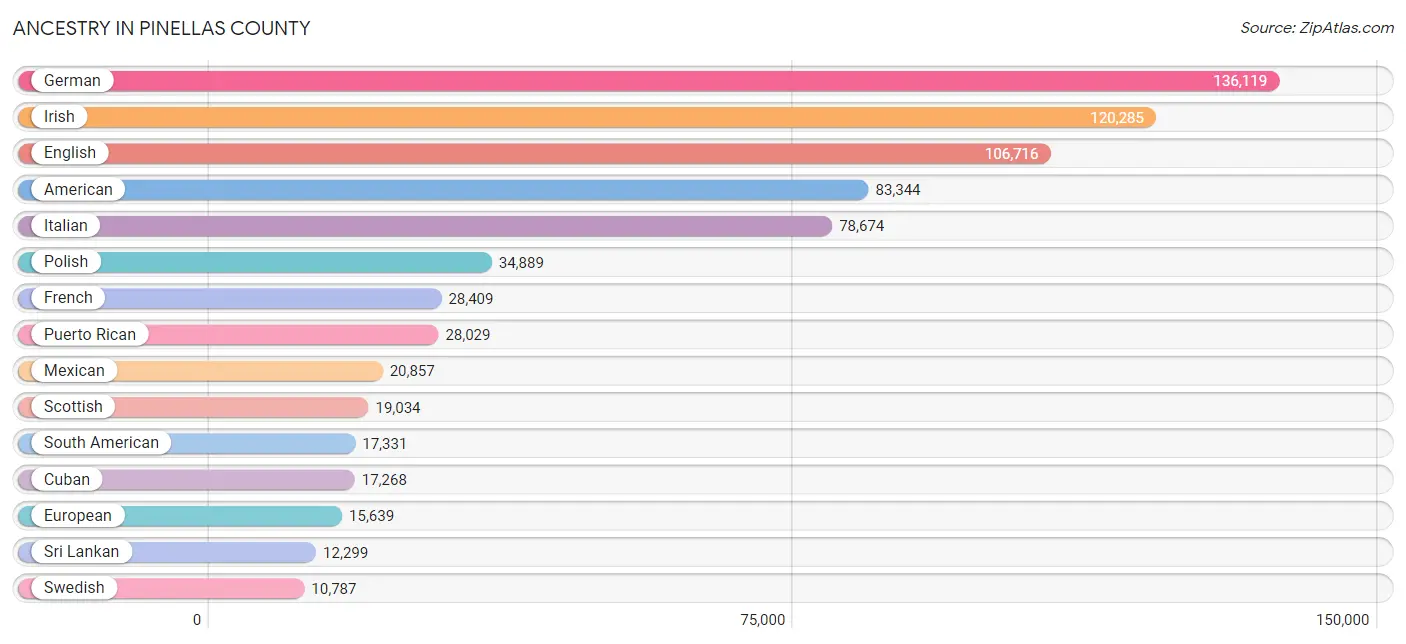
Ancestry in Pinellas County
The most populous ancestries reported in Pinellas County are German (136,119 | 14.2%), Irish (120,285 | 12.5%), English (106,716 | 11.1%), American (83,344 | 8.7%), and Italian (78,674 | 8.2%), together accounting for 54.7% of all Pinellas County residents.
| Ancestry | # Population | % Population |
| Afghan | 83 | 0.0% |
| African | 4,109 | 0.4% |
| Alaska Native | 16 | 0.0% |
| Albanian | 3,106 | 0.3% |
| Aleut | 13 | 0.0% |
| Alsatian | 77 | 0.0% |
| American | 83,344 | 8.7% |
| Apache | 69 | 0.0% |
| Arab | 7,572 | 0.8% |
| Argentinean | 835 | 0.1% |
| Armenian | 503 | 0.1% |
| Assyrian / Chaldean / Syriac | 50 | 0.0% |
| Australian | 824 | 0.1% |
| Austrian | 2,529 | 0.3% |
| Bahamian | 339 | 0.0% |
| Bangladeshi | 266 | 0.0% |
| Barbadian | 91 | 0.0% |
| Basque | 107 | 0.0% |
| Belgian | 1,480 | 0.2% |
| Belizean | 136 | 0.0% |
| Bermudan | 111 | 0.0% |
| Bhutanese | 1,782 | 0.2% |
| Blackfeet | 483 | 0.1% |
| Bolivian | 295 | 0.0% |
| Brazilian | 2,488 | 0.3% |
| British | 8,118 | 0.9% |
| British West Indian | 171 | 0.0% |
| Bulgarian | 734 | 0.1% |
| Burmese | 2,398 | 0.3% |
| Cajun | 123 | 0.0% |
| Cambodian | 18 | 0.0% |
| Canadian | 4,729 | 0.5% |
| Cape Verdean | 142 | 0.0% |
| Carpatho Rusyn | 117 | 0.0% |
| Celtic | 258 | 0.0% |
| Central American | 5,475 | 0.6% |
| Central American Indian | 946 | 0.1% |
| Cherokee | 2,408 | 0.3% |
| Chickasaw | 22 | 0.0% |
| Chilean | 891 | 0.1% |
| Chinese | 23 | 0.0% |
| Chippewa | 147 | 0.0% |
| Choctaw | 352 | 0.0% |
| Colombian | 6,473 | 0.7% |
| Comanche | 9 | 0.0% |
| Costa Rican | 750 | 0.1% |
| Cree | 29 | 0.0% |
| Creek | 111 | 0.0% |
| Croatian | 1,715 | 0.2% |
| Crow | 11 | 0.0% |
| Cuban | 17,268 | 1.8% |
| Cypriot | 36 | 0.0% |
| Czech | 3,840 | 0.4% |
| Czechoslovakian | 1,515 | 0.2% |
| Danish | 3,143 | 0.3% |
| Delaware | 108 | 0.0% |
| Dominican | 3,664 | 0.4% |
| Dutch | 9,417 | 1.0% |
| Dutch West Indian | 80 | 0.0% |
| Eastern European | 3,181 | 0.3% |
| Ecuadorian | 2,038 | 0.2% |
| Egyptian | 1,738 | 0.2% |
| English | 106,716 | 11.1% |
| Estonian | 248 | 0.0% |
| Ethiopian | 170 | 0.0% |
| European | 15,639 | 1.6% |
| Fijian | 123 | 0.0% |
| Filipino | 156 | 0.0% |
| Finnish | 2,043 | 0.2% |
| French | 28,409 | 3.0% |
| French American Indian | 55 | 0.0% |
| French Canadian | 7,351 | 0.8% |
| German | 136,119 | 14.2% |
| German Russian | 14 | 0.0% |
| Ghanaian | 201 | 0.0% |
| Greek | 9,891 | 1.0% |
| Guamanian / Chamorro | 350 | 0.0% |
| Guatemalan | 766 | 0.1% |
| Guyanese | 202 | 0.0% |
| Haitian | 2,243 | 0.2% |
| Honduran | 689 | 0.1% |
| Hungarian | 6,625 | 0.7% |
| Icelander | 49 | 0.0% |
| Indian (Asian) | 4,539 | 0.5% |
| Indonesian | 187 | 0.0% |
| Inupiat | 18 | 0.0% |
| Iranian | 531 | 0.1% |
| Iraqi | 353 | 0.0% |
| Irish | 120,285 | 12.5% |
| Iroquois | 161 | 0.0% |
| Israeli | 268 | 0.0% |
| Italian | 78,674 | 8.2% |
| Jamaican | 6,134 | 0.6% |
| Japanese | 1,645 | 0.2% |
| Jordanian | 154 | 0.0% |
| Kenyan | 29 | 0.0% |
| Korean | 8,179 | 0.9% |
| Laotian | 118 | 0.0% |
| Latvian | 363 | 0.0% |
| Lebanese | 2,595 | 0.3% |
| Liberian | 335 | 0.0% |
| Lithuanian | 3,192 | 0.3% |
| Lumbee | 18 | 0.0% |
| Luxembourger | 100 | 0.0% |
| Macedonian | 187 | 0.0% |
| Malaysian | 2,720 | 0.3% |
| Maltese | 165 | 0.0% |
| Marshallese | 15 | 0.0% |
| Menominee | 24 | 0.0% |
| Mexican | 20,857 | 2.2% |
| Mexican American Indian | 430 | 0.0% |
| Mongolian | 72 | 0.0% |
| Moroccan | 333 | 0.0% |
| Native Hawaiian | 437 | 0.1% |
| Navajo | 7 | 0.0% |
| New Zealander | 186 | 0.0% |
| Nicaraguan | 944 | 0.1% |
| Nigerian | 606 | 0.1% |
| Northern European | 1,416 | 0.2% |
| Norwegian | 8,275 | 0.9% |
| Okinawan | 11 | 0.0% |
| Osage | 60 | 0.0% |
| Pakistani | 1,161 | 0.1% |
| Palestinian | 386 | 0.0% |
| Panamanian | 988 | 0.1% |
| Pennsylvania German | 480 | 0.1% |
| Peruvian | 2,315 | 0.2% |
| Pima | 6 | 0.0% |
| Polish | 34,889 | 3.6% |
| Portuguese | 4,947 | 0.5% |
| Potawatomi | 92 | 0.0% |
| Pueblo | 37 | 0.0% |
| Puerto Rican | 28,029 | 2.9% |
| Romanian | 1,732 | 0.2% |
| Russian | 9,185 | 1.0% |
| Salvadoran | 1,228 | 0.1% |
| Samoan | 171 | 0.0% |
| Scandinavian | 3,013 | 0.3% |
| Scotch-Irish | 10,535 | 1.1% |
| Scottish | 19,034 | 2.0% |
| Seminole | 124 | 0.0% |
| Senegalese | 65 | 0.0% |
| Serbian | 2,053 | 0.2% |
| Shoshone | 9 | 0.0% |
| Sierra Leonean | 15 | 0.0% |
| Sioux | 172 | 0.0% |
| Slavic | 601 | 0.1% |
| Slovak | 2,406 | 0.3% |
| Slovene | 659 | 0.1% |
| South African | 368 | 0.0% |
| South American | 17,331 | 1.8% |
| South American Indian | 64 | 0.0% |
| Soviet Union | 34 | 0.0% |
| Spaniard | 2,038 | 0.2% |
| Spanish | 1,457 | 0.2% |
| Spanish American | 8 | 0.0% |
| Spanish American Indian | 20 | 0.0% |
| Sri Lankan | 12,299 | 1.3% |
| Subsaharan African | 6,249 | 0.6% |
| Swedish | 10,787 | 1.1% |
| Swiss | 2,364 | 0.3% |
| Syrian | 620 | 0.1% |
| Taiwanese | 15 | 0.0% |
| Thai | 6,901 | 0.7% |
| Tongan | 212 | 0.0% |
| Trinidadian and Tobagonian | 1,054 | 0.1% |
| Turkish | 521 | 0.1% |
| U.S. Virgin Islander | 65 | 0.0% |
| Ugandan | 33 | 0.0% |
| Ukrainian | 4,526 | 0.5% |
| Uruguayan | 218 | 0.0% |
| Venezuelan | 4,223 | 0.4% |
| Vietnamese | 45 | 0.0% |
| Welsh | 6,571 | 0.7% |
| West Indian | 1,162 | 0.1% |
| Yaqui | 10 | 0.0% |
| Yugoslavian | 2,991 | 0.3% |
| Zimbabwean | 17 | 0.0% | View All 178 Rows |
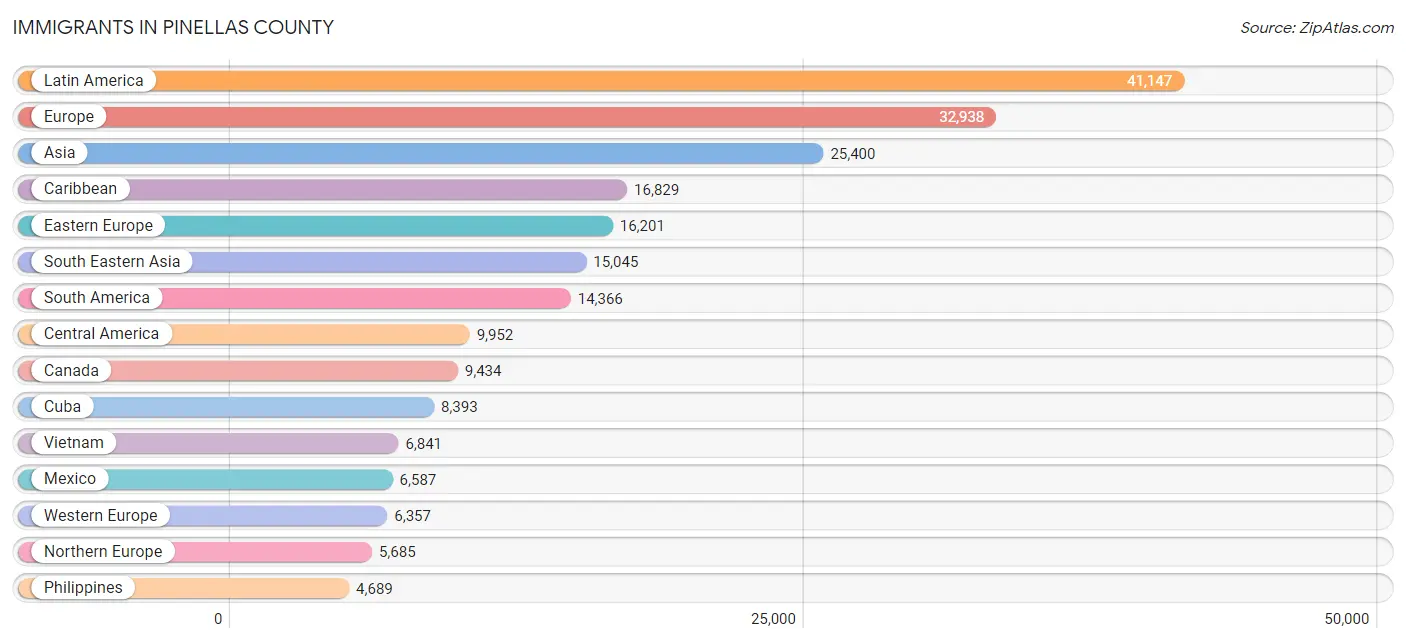
Immigrants in Pinellas County
The most numerous immigrant groups reported in Pinellas County came from Latin America (41,147 | 4.3%), Europe (32,938 | 3.4%), Asia (25,400 | 2.6%), Caribbean (16,829 | 1.8%), and Eastern Europe (16,201 | 1.7%), together accounting for 13.8% of all Pinellas County residents.
| Immigration Origin | # Population | % Population |
| Afghanistan | 4 | 0.0% |
| Africa | 4,166 | 0.4% |
| Albania | 2,199 | 0.2% |
| Argentina | 526 | 0.1% |
| Armenia | 39 | 0.0% |
| Asia | 25,400 | 2.6% |
| Australia | 842 | 0.1% |
| Austria | 207 | 0.0% |
| Azores | 26 | 0.0% |
| Bahamas | 231 | 0.0% |
| Bangladesh | 110 | 0.0% |
| Barbados | 23 | 0.0% |
| Belarus | 45 | 0.0% |
| Belgium | 394 | 0.0% |
| Belize | 118 | 0.0% |
| Bolivia | 205 | 0.0% |
| Bosnia and Herzegovina | 2,141 | 0.2% |
| Brazil | 2,606 | 0.3% |
| Bulgaria | 457 | 0.1% |
| Cabo Verde | 25 | 0.0% |
| Cambodia | 513 | 0.1% |
| Cameroon | 6 | 0.0% |
| Canada | 9,434 | 1.0% |
| Caribbean | 16,829 | 1.8% |
| Central America | 9,952 | 1.0% |
| Chile | 397 | 0.0% |
| China | 2,138 | 0.2% |
| Colombia | 3,769 | 0.4% |
| Costa Rica | 348 | 0.0% |
| Croatia | 938 | 0.1% |
| Cuba | 8,393 | 0.9% |
| Czechoslovakia | 457 | 0.1% |
| Denmark | 76 | 0.0% |
| Dominica | 91 | 0.0% |
| Dominican Republic | 1,700 | 0.2% |
| Eastern Africa | 516 | 0.1% |
| Eastern Asia | 3,595 | 0.4% |
| Eastern Europe | 16,201 | 1.7% |
| Ecuador | 1,074 | 0.1% |
| Egypt | 1,531 | 0.2% |
| El Salvador | 767 | 0.1% |
| England | 2,059 | 0.2% |
| Eritrea | 12 | 0.0% |
| Ethiopia | 129 | 0.0% |
| Europe | 32,938 | 3.4% |
| Fiji | 34 | 0.0% |
| France | 780 | 0.1% |
| Germany | 4,234 | 0.4% |
| Ghana | 222 | 0.0% |
| Greece | 2,298 | 0.2% |
| Grenada | 62 | 0.0% |
| Guatemala | 518 | 0.1% |
| Guyana | 768 | 0.1% |
| Haiti | 1,234 | 0.1% |
| Honduras | 584 | 0.1% |
| Hong Kong | 253 | 0.0% |
| Hungary | 690 | 0.1% |
| India | 3,439 | 0.4% |
| Indonesia | 236 | 0.0% |
| Iran | 408 | 0.0% |
| Iraq | 338 | 0.0% |
| Ireland | 554 | 0.1% |
| Israel | 295 | 0.0% |
| Italy | 1,587 | 0.2% |
| Jamaica | 3,907 | 0.4% |
| Japan | 425 | 0.0% |
| Jordan | 127 | 0.0% |
| Kazakhstan | 155 | 0.0% |
| Kenya | 103 | 0.0% |
| Korea | 1,032 | 0.1% |
| Kuwait | 228 | 0.0% |
| Laos | 1,442 | 0.2% |
| Latin America | 41,147 | 4.3% |
| Latvia | 55 | 0.0% |
| Lebanon | 533 | 0.1% |
| Liberia | 108 | 0.0% |
| Lithuania | 503 | 0.1% |
| Malaysia | 305 | 0.0% |
| Mexico | 6,587 | 0.7% |
| Micronesia | 160 | 0.0% |
| Middle Africa | 27 | 0.0% |
| Moldova | 118 | 0.0% |
| Morocco | 252 | 0.0% |
| Nepal | 38 | 0.0% |
| Netherlands | 476 | 0.1% |
| Nicaragua | 455 | 0.1% |
| Nigeria | 365 | 0.0% |
| North Macedonia | 158 | 0.0% |
| Northern Africa | 1,921 | 0.2% |
| Northern Europe | 5,685 | 0.6% |
| Norway | 150 | 0.0% |
| Oceania | 1,432 | 0.2% |
| Pakistan | 99 | 0.0% |
| Panama | 575 | 0.1% |
| Peru | 1,356 | 0.1% |
| Philippines | 4,689 | 0.5% |
| Poland | 2,991 | 0.3% |
| Portugal | 522 | 0.1% |
| Romania | 504 | 0.1% |
| Russia | 1,120 | 0.1% |
| Saudi Arabia | 193 | 0.0% |
| Scotland | 570 | 0.1% |
| Senegal | 45 | 0.0% |
| Serbia | 634 | 0.1% |
| Sierra Leone | 85 | 0.0% |
| Singapore | 36 | 0.0% |
| South Africa | 844 | 0.1% |
| South America | 14,366 | 1.5% |
| South Central Asia | 4,339 | 0.4% |
| South Eastern Asia | 15,045 | 1.6% |
| Southern Europe | 4,682 | 0.5% |
| Spain | 199 | 0.0% |
| Sri Lanka | 77 | 0.0% |
| St. Vincent and the Grenadines | 72 | 0.0% |
| Sudan | 78 | 0.0% |
| Sweden | 207 | 0.0% |
| Switzerland | 241 | 0.0% |
| Syria | 53 | 0.0% |
| Taiwan | 359 | 0.0% |
| Thailand | 855 | 0.1% |
| Trinidad and Tobago | 880 | 0.1% |
| Turkey | 271 | 0.0% |
| Uganda | 62 | 0.0% |
| Ukraine | 1,943 | 0.2% |
| Uruguay | 295 | 0.0% |
| Venezuela | 3,181 | 0.3% |
| Vietnam | 6,841 | 0.7% |
| West Indies | 103 | 0.0% |
| Western Africa | 852 | 0.1% |
| Western Asia | 2,306 | 0.2% |
| Western Europe | 6,357 | 0.7% |
| Zimbabwe | 28 | 0.0% | View All 132 Rows |
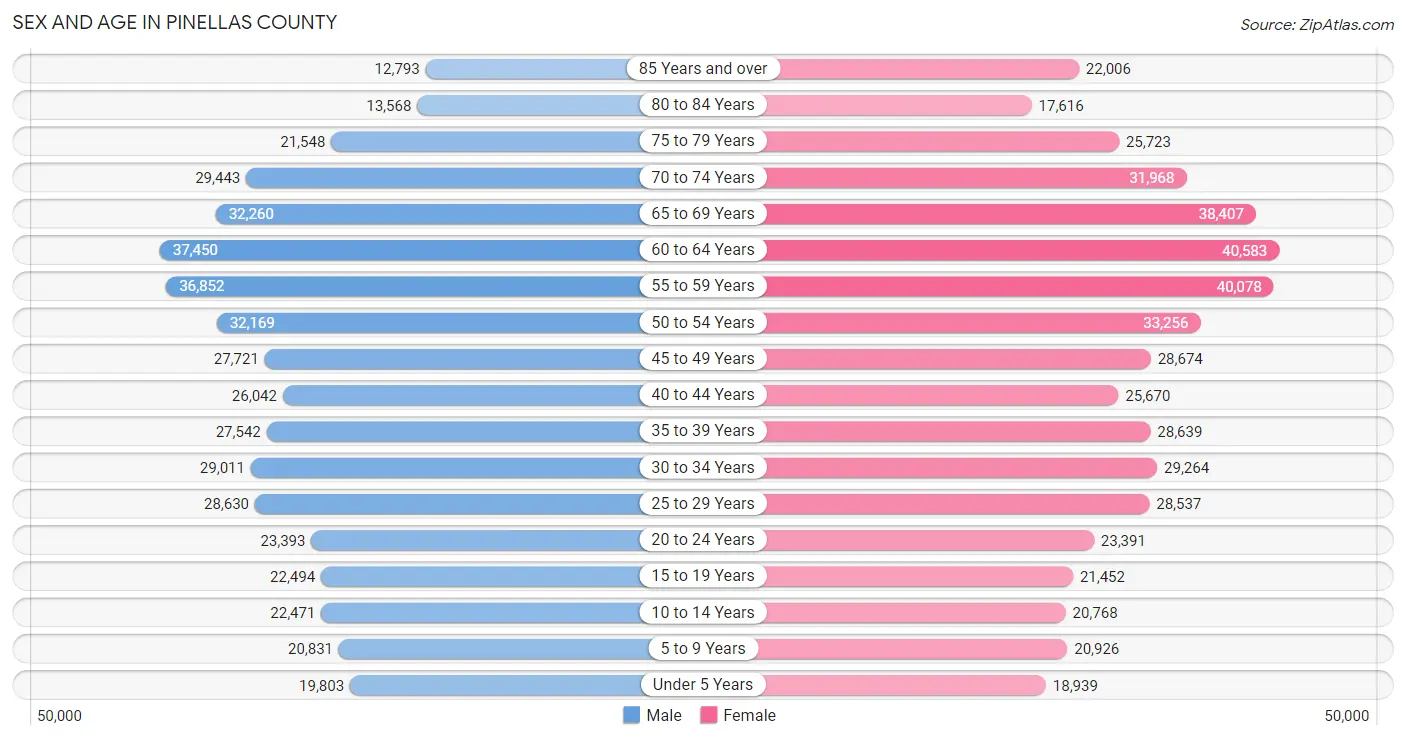
Sex and Age in Pinellas County
Sex and Age in Pinellas County
The most populous age groups in Pinellas County are 60 to 64 Years (37,450 | 8.1%) for men and 60 to 64 Years (40,583 | 8.2%) for women.
| Age Bracket | Male | Female |
| Under 5 Years | 19,803 (4.3%) | 18,939 (3.8%) |
| 5 to 9 Years | 20,831 (4.5%) | 20,926 (4.2%) |
| 10 to 14 Years | 22,471 (4.8%) | 20,768 (4.2%) |
| 15 to 19 Years | 22,494 (4.9%) | 21,452 (4.3%) |
| 20 to 24 Years | 23,393 (5.0%) | 23,391 (4.7%) |
| 25 to 29 Years | 28,630 (6.2%) | 28,537 (5.8%) |
| 30 to 34 Years | 29,011 (6.2%) | 29,264 (5.9%) |
| 35 to 39 Years | 27,542 (5.9%) | 28,639 (5.8%) |
| 40 to 44 Years | 26,042 (5.6%) | 25,670 (5.2%) |
| 45 to 49 Years | 27,721 (6.0%) | 28,674 (5.8%) |
| 50 to 54 Years | 32,169 (6.9%) | 33,256 (6.7%) |
| 55 to 59 Years | 36,852 (7.9%) | 40,078 (8.1%) |
| 60 to 64 Years | 37,450 (8.1%) | 40,583 (8.2%) |
| 65 to 69 Years | 32,260 (7.0%) | 38,407 (7.7%) |
| 70 to 74 Years | 29,443 (6.4%) | 31,968 (6.5%) |
| 75 to 79 Years | 21,548 (4.6%) | 25,723 (5.2%) |
| 80 to 84 Years | 13,568 (2.9%) | 17,616 (3.5%) |
| 85 Years and over | 12,793 (2.8%) | 22,006 (4.4%) |
| Total | 464,021 (100.0%) | 495,897 (100.0%) |
Families and Households in Pinellas County
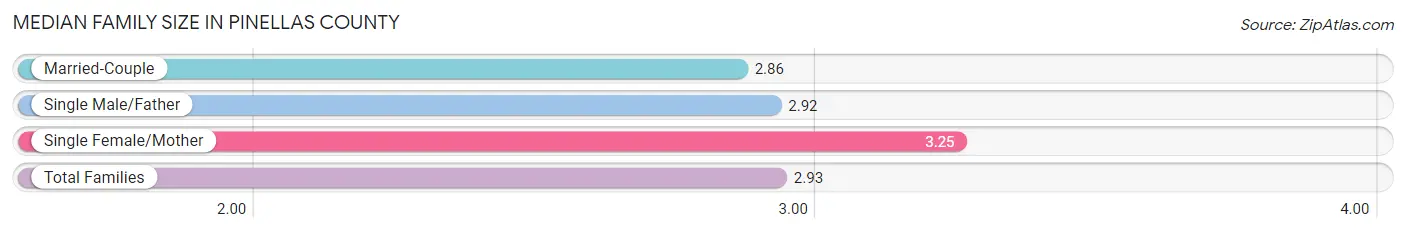
Median Family Size in Pinellas County
The median family size in Pinellas County is 2.93 persons per family, with single female/mother families (43,058 | 18.4%) accounting for the largest median family size of 3.25 persons per family. On the other hand, married-couple families (174,417 | 74.7%) represent the smallest median family size with 2.86 persons per family.
| Family Type | # Families | Family Size |
| Married-Couple | 174,417 (74.7%) | 2.86 |
| Single Male/Father | 15,916 (6.8%) | 2.92 |
| Single Female/Mother | 43,058 (18.4%) | 3.25 |
| Total Families | 233,391 (100.0%) | 2.93 |
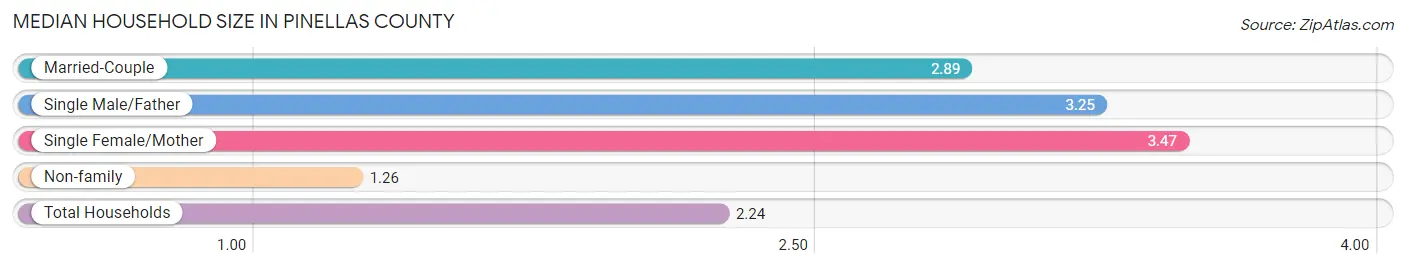
Median Household Size in Pinellas County
The median household size in Pinellas County is 2.24 persons per household, with single female/mother households (43,058 | 10.3%) accounting for the largest median household size of 3.47 persons per household. non-family households (185,325 | 44.3%) represent the smallest median household size with 1.26 persons per household.
| Household Type | # Households | Household Size |
| Married-Couple | 174,417 (41.7%) | 2.89 |
| Single Male/Father | 15,916 (3.8%) | 3.25 |
| Single Female/Mother | 43,058 (10.3%) | 3.47 |
| Non-family | 185,325 (44.3%) | 1.26 |
| Total Households | 418,716 (100.0%) | 2.24 |
Household Size by Marriage Status in Pinellas County
Out of a total of 418,716 households in Pinellas County, 233,391 (55.7%) are family households, while 185,325 (44.3%) are nonfamily households. The most numerous type of family households are 2-person households, comprising 133,226, and the most common type of nonfamily households are 1-person households, comprising 150,581.
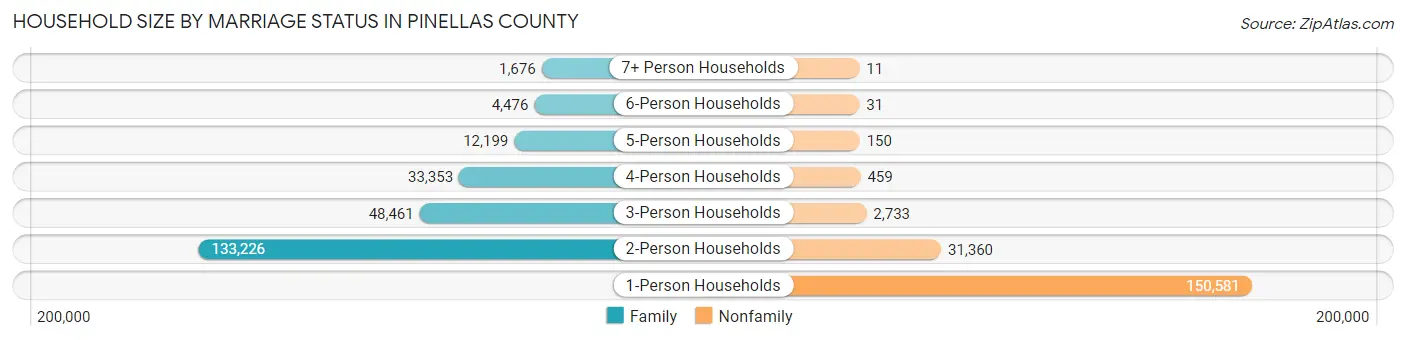
| Household Size | Family Households | Nonfamily Households |
| 1-Person Households | - | 150,581 (36.0%) |
| 2-Person Households | 133,226 (31.8%) | 31,360 (7.5%) |
| 3-Person Households | 48,461 (11.6%) | 2,733 (0.6%) |
| 4-Person Households | 33,353 (8.0%) | 459 (0.1%) |
| 5-Person Households | 12,199 (2.9%) | 150 (0.0%) |
| 6-Person Households | 4,476 (1.1%) | 31 (0.0%) |
| 7+ Person Households | 1,676 (0.4%) | 11 (0.0%) |
| Total | 233,391 (55.7%) | 185,325 (44.3%) |
Female Fertility in Pinellas County
Fertility by Age in Pinellas County
Average fertility rate in Pinellas County is 46.0 births per 1,000 women. Women in the age bracket of 20 to 34 years have the highest fertility rate with 68.0 births per 1,000 women. Women in the age bracket of 20 to 34 years acount for 62.9% of all women with births.
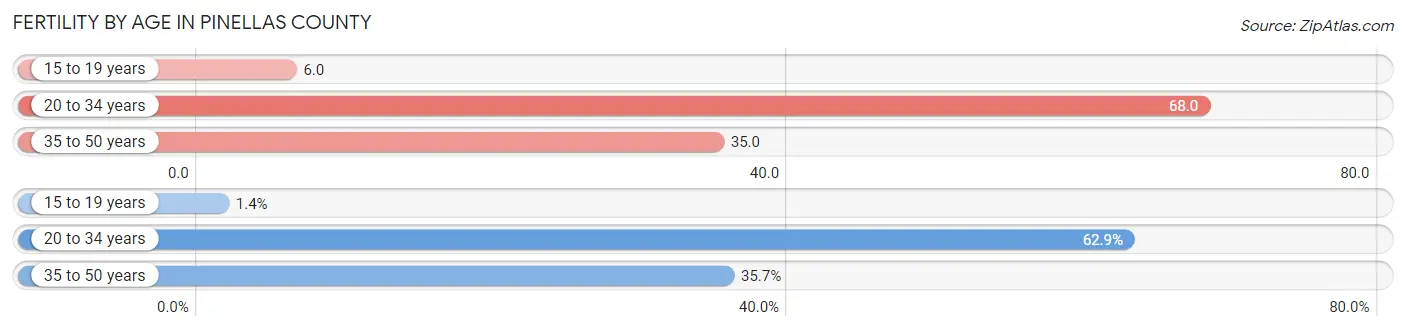
| Age Bracket | Women with Births | Births / 1,000 Women |
| 15 to 19 years | 123 (1.4%) | 6.0 |
| 20 to 34 years | 5,485 (62.9%) | 68.0 |
| 35 to 50 years | 3,114 (35.7%) | 35.0 |
| Total | 8,722 (100.0%) | 46.0 |
Fertility by Age by Marriage Status in Pinellas County
63.6% of women with births (8,722) in Pinellas County are married. The highest percentage of unmarried women with births falls into 15 to 19 years age bracket with 100.0% of them unmarried at the time of birth, while the lowest percentage of unmarried women with births belong to 35 to 50 years age bracket with 20.0% of them unmarried.
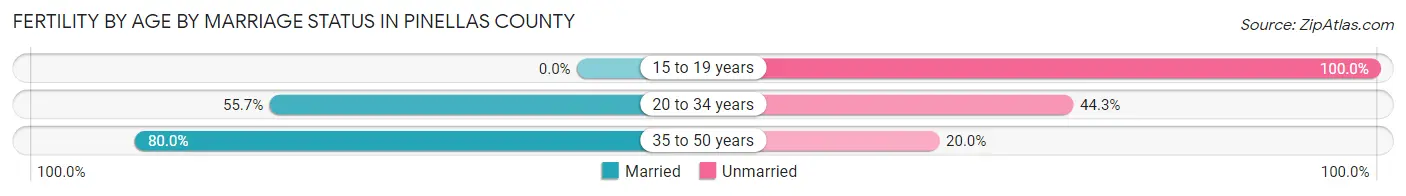
| Age Bracket | Married | Unmarried |
| 15 to 19 years | 0 (0.0%) | 123 (100.0%) |
| 20 to 34 years | 3,055 (55.7%) | 2,430 (44.3%) |
| 35 to 50 years | 2,491 (80.0%) | 623 (20.0%) |
| Total | 5,547 (63.6%) | 3,175 (36.4%) |
Fertility by Education in Pinellas County
Average fertility rate in Pinellas County is 46.0 births per 1,000 women. Women with the education attainment of bachelor's degree have the highest fertility rate of 54.0 births per 1,000 women, while women with the education attainment of less than high school have the lowest fertility at 35.0 births per 1,000 women. Women with the education attainment of bachelor's degree represent 29.7% of all women with births.
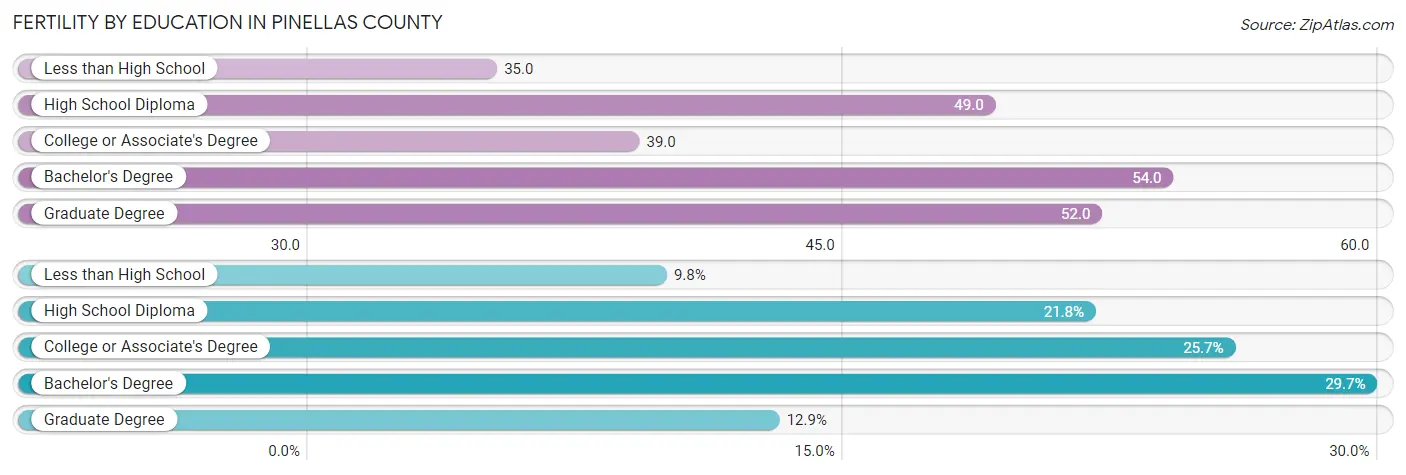
| Educational Attainment | Women with Births | Births / 1,000 Women |
| Less than High School | 852 (9.8%) | 35.0 |
| High School Diploma | 1,903 (21.8%) | 49.0 |
| College or Associate's Degree | 2,245 (25.7%) | 39.0 |
| Bachelor's Degree | 2,593 (29.7%) | 54.0 |
| Graduate Degree | 1,129 (12.9%) | 52.0 |
| Total | 8,722 (100.0%) | 46.0 |
Fertility by Education by Marriage Status in Pinellas County
36.4% of women with births in Pinellas County are unmarried. Women with the educational attainment of graduate degree are most likely to be married with 94.5% of them married at childbirth, while women with the educational attainment of high school diploma are least likely to be married with 62.0% of them unmarried at childbirth.
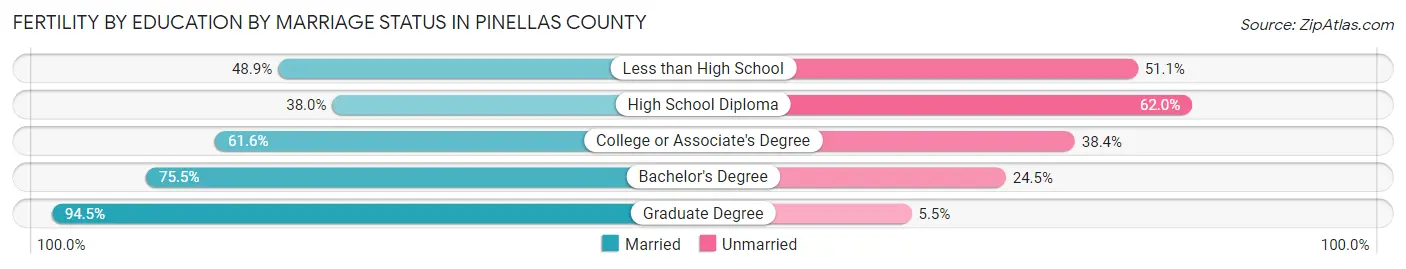
| Educational Attainment | Married | Unmarried |
| Less than High School | 417 (48.9%) | 435 (51.1%) |
| High School Diploma | 723 (38.0%) | 1,180 (62.0%) |
| College or Associate's Degree | 1,383 (61.6%) | 862 (38.4%) |
| Bachelor's Degree | 1,958 (75.5%) | 635 (24.5%) |
| Graduate Degree | 1,067 (94.5%) | 62 (5.5%) |
| Total | 5,547 (63.6%) | 3,175 (36.4%) |
Employment Characteristics in Pinellas County
Employment by Class of Employer in Pinellas County
Among the 454,923 employed individuals in Pinellas County, private company employees (312,996 | 68.8%), not-for-profit organizations (35,913 | 7.9%), and local government employees (29,752 | 6.5%) make up the most common classes of employment.
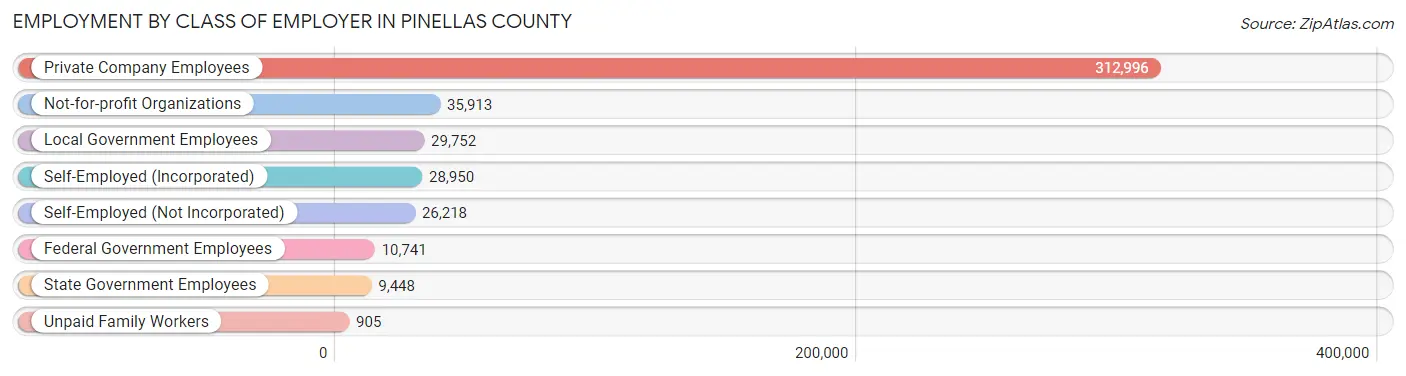
| Employer Class | # Employees | % Employees |
| Private Company Employees | 312,996 | 68.8% |
| Self-Employed (Incorporated) | 28,950 | 6.4% |
| Self-Employed (Not Incorporated) | 26,218 | 5.8% |
| Not-for-profit Organizations | 35,913 | 7.9% |
| Local Government Employees | 29,752 | 6.5% |
| State Government Employees | 9,448 | 2.1% |
| Federal Government Employees | 10,741 | 2.4% |
| Unpaid Family Workers | 905 | 0.2% |
| Total | 454,923 | 100.0% |
Employment Status by Age in Pinellas County
According to the labor force statistics for Pinellas County, out of the total population over 16 years of age (826,650), 58.7% or 485,244 individuals are in the labor force, with 4.6% or 22,321 of them unemployed. The age group with the highest labor force participation rate is 25 to 29 years, with 86.7% or 49,564 individuals in the labor force. Within the labor force, the 16 to 19 years age range has the highest percentage of unemployed individuals, with 13.7% or 1,966 of them being unemployed.
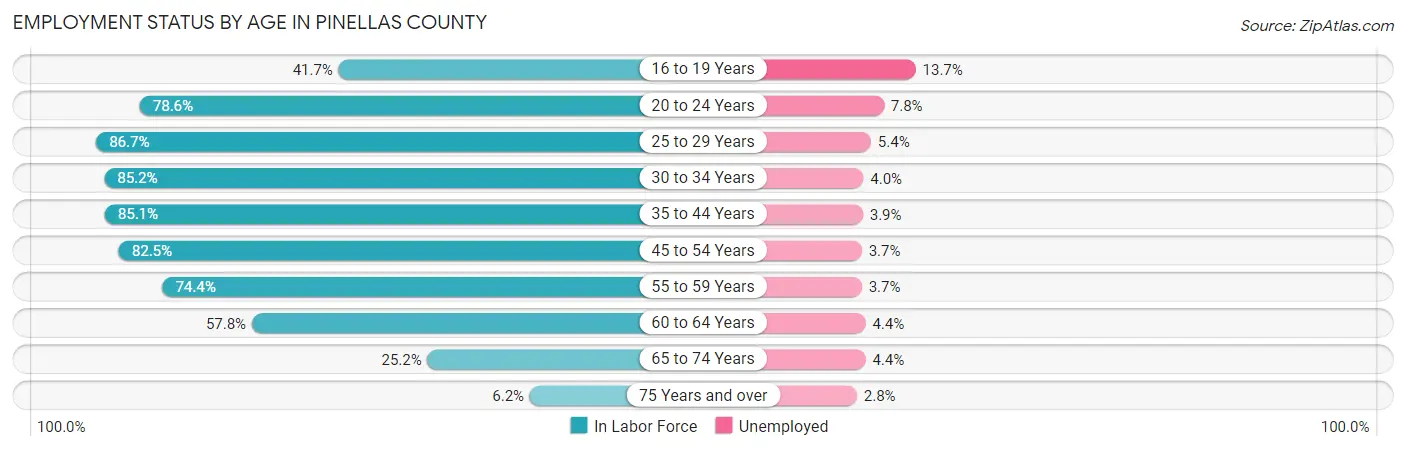
| Age Bracket | In Labor Force | Unemployed |
| 16 to 19 Years | 14,351 (41.7%) | 1,966 (13.7%) |
| 20 to 24 Years | 36,772 (78.6%) | 2,868 (7.8%) |
| 25 to 29 Years | 49,564 (86.7%) | 2,676 (5.4%) |
| 30 to 34 Years | 49,650 (85.2%) | 1,986 (4.0%) |
| 35 to 44 Years | 91,817 (85.1%) | 3,581 (3.9%) |
| 45 to 54 Years | 100,502 (82.5%) | 3,719 (3.7%) |
| 55 to 59 Years | 57,236 (74.4%) | 2,118 (3.7%) |
| 60 to 64 Years | 45,103 (57.8%) | 1,985 (4.4%) |
| 65 to 74 Years | 33,284 (25.2%) | 1,464 (4.4%) |
| 75 Years and over | 7,022 (6.2%) | 197 (2.8%) |
| Total | 485,244 (58.7%) | 22,321 (4.6%) |
Employment Status by Educational Attainment in Pinellas County
According to labor force statistics for Pinellas County, 78.8% of individuals (394,093) out of the total population between 25 and 64 years of age (500,118) are in the labor force, with 4.1% or 16,158 of them being unemployed. The group with the highest labor force participation rate are those with the educational attainment of bachelor's degree or higher, with 85.5% or 158,547 individuals in the labor force. Within the labor force, individuals with less than high school education have the highest percentage of unemployment, with 6.8% or 1,430 of them being unemployed.
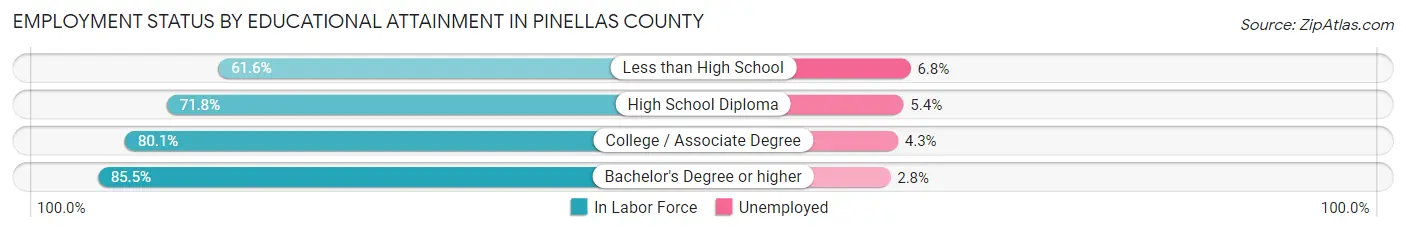
| Educational Attainment | In Labor Force | Unemployed |
| Less than High School | 21,028 (61.6%) | 2,321 (6.8%) |
| High School Diploma | 88,654 (71.8%) | 6,668 (5.4%) |
| College / Associate Degree | 125,815 (80.1%) | 6,754 (4.3%) |
| Bachelor's Degree or higher | 158,547 (85.5%) | 5,192 (2.8%) |
| Total | 394,093 (78.8%) | 20,505 (4.1%) |
Employment Occupations by Sex in Pinellas County
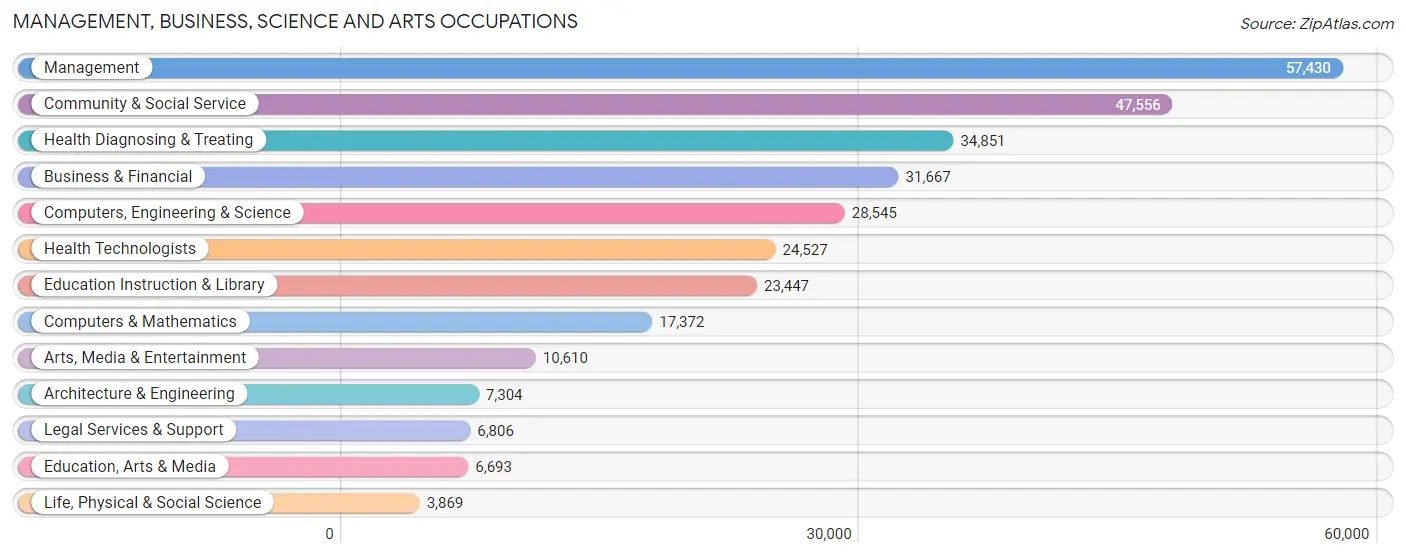
Management, Business, Science and Arts Occupations
The most common Management, Business, Science and Arts occupations in Pinellas County are Management (57,430 | 12.5%), Community & Social Service (47,556 | 10.3%), Health Diagnosing & Treating (34,851 | 7.6%), Business & Financial (31,667 | 6.9%), and Computers, Engineering & Science (28,545 | 6.2%).
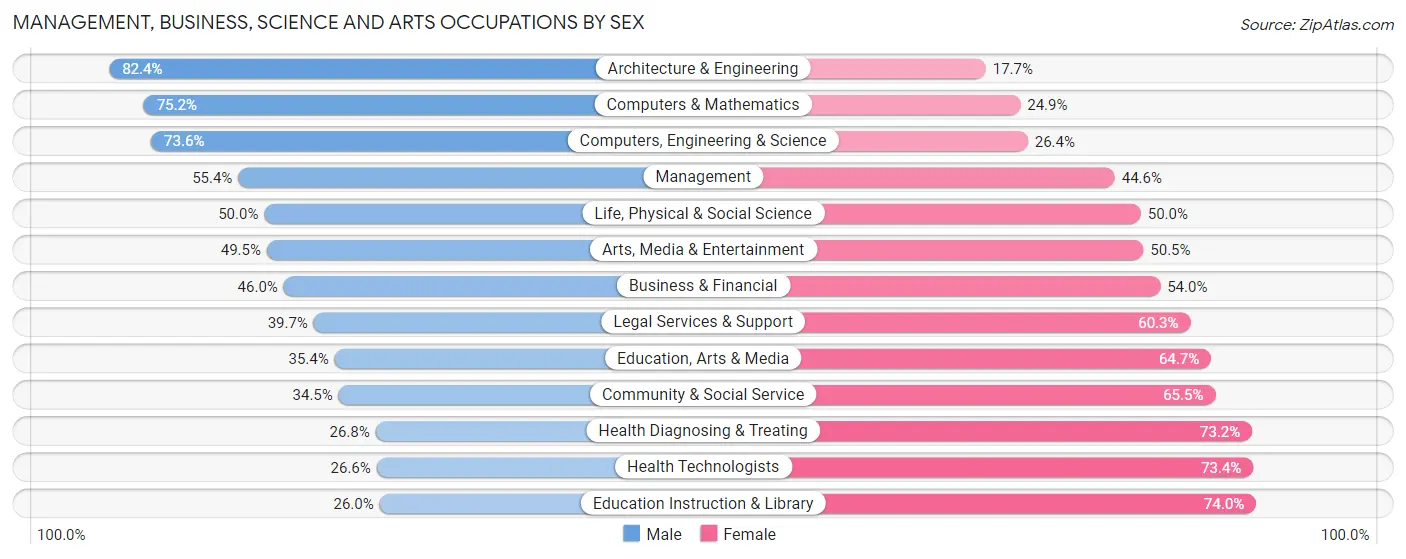
Management, Business, Science and Arts Occupations by Sex
Within the Management, Business, Science and Arts occupations in Pinellas County, the most male-oriented occupations are Architecture & Engineering (82.4%), Computers & Mathematics (75.1%), and Computers, Engineering & Science (73.6%), while the most female-oriented occupations are Education Instruction & Library (74.0%), Health Technologists (73.4%), and Health Diagnosing & Treating (73.2%).
| Occupation | Male | Female |
| Management | 31,840 (55.4%) | 25,590 (44.6%) |
| Business & Financial | 14,555 (46.0%) | 17,112 (54.0%) |
| Computers, Engineering & Science | 21,005 (73.6%) | 7,540 (26.4%) |
| Computers & Mathematics | 13,055 (75.1%) | 4,317 (24.8%) |
| Architecture & Engineering | 6,015 (82.4%) | 1,289 (17.6%) |
| Life, Physical & Social Science | 1,935 (50.0%) | 1,934 (50.0%) |
| Community & Social Service | 16,403 (34.5%) | 31,153 (65.5%) |
| Education, Arts & Media | 2,366 (35.3%) | 4,327 (64.6%) |
| Legal Services & Support | 2,701 (39.7%) | 4,105 (60.3%) |
| Education Instruction & Library | 6,086 (26.0%) | 17,361 (74.0%) |
| Arts, Media & Entertainment | 5,250 (49.5%) | 5,360 (50.5%) |
| Health Diagnosing & Treating | 9,341 (26.8%) | 25,510 (73.2%) |
| Health Technologists | 6,517 (26.6%) | 18,010 (73.4%) |
| Total (Category) | 93,144 (46.6%) | 106,905 (53.4%) |
| Total (Overall) | 232,788 (50.5%) | 227,985 (49.5%) |
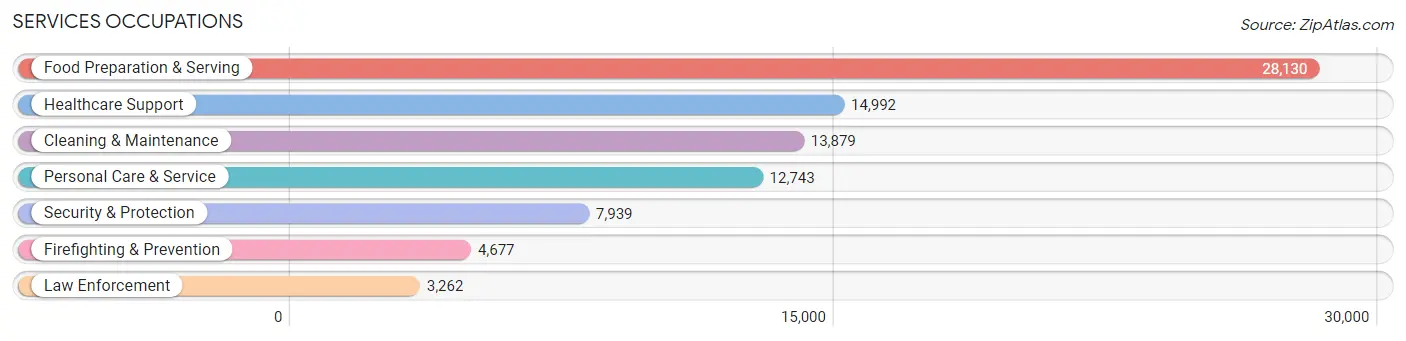
Services Occupations
The most common Services occupations in Pinellas County are Food Preparation & Serving (28,130 | 6.1%), Healthcare Support (14,992 | 3.3%), Cleaning & Maintenance (13,879 | 3.0%), Personal Care & Service (12,743 | 2.8%), and Security & Protection (7,939 | 1.7%).
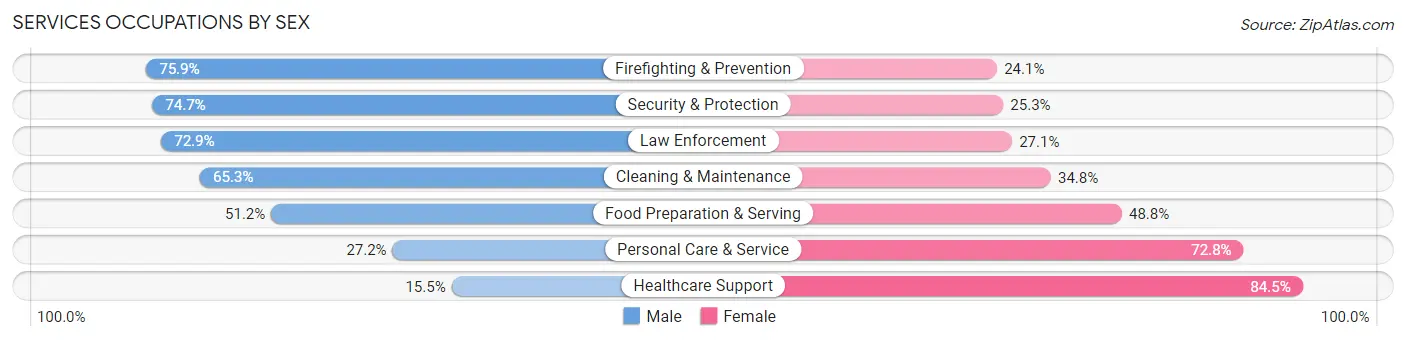
Services Occupations by Sex
Within the Services occupations in Pinellas County, the most male-oriented occupations are Firefighting & Prevention (75.9%), Security & Protection (74.7%), and Law Enforcement (72.9%), while the most female-oriented occupations are Healthcare Support (84.5%), Personal Care & Service (72.8%), and Food Preparation & Serving (48.8%).
| Occupation | Male | Female |
| Healthcare Support | 2,319 (15.5%) | 12,673 (84.5%) |
| Security & Protection | 5,929 (74.7%) | 2,010 (25.3%) |
| Firefighting & Prevention | 3,550 (75.9%) | 1,127 (24.1%) |
| Law Enforcement | 2,379 (72.9%) | 883 (27.1%) |
| Food Preparation & Serving | 14,399 (51.2%) | 13,731 (48.8%) |
| Cleaning & Maintenance | 9,056 (65.2%) | 4,823 (34.7%) |
| Personal Care & Service | 3,461 (27.2%) | 9,282 (72.8%) |
| Total (Category) | 35,164 (45.3%) | 42,519 (54.7%) |
| Total (Overall) | 232,788 (50.5%) | 227,985 (49.5%) |
Sales and Office Occupations
The most common Sales and Office occupations in Pinellas County are Office & Administration (57,402 | 12.5%), and Sales & Related (53,987 | 11.7%).

Sales and Office Occupations by Sex
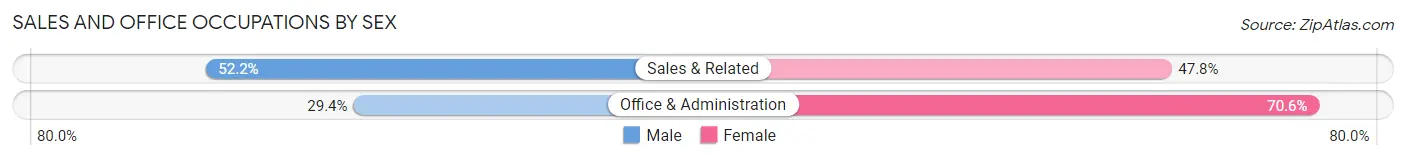
| Occupation | Male | Female |
| Sales & Related | 28,171 (52.2%) | 25,816 (47.8%) |
| Office & Administration | 16,886 (29.4%) | 40,516 (70.6%) |
| Total (Category) | 45,057 (40.5%) | 66,332 (59.6%) |
| Total (Overall) | 232,788 (50.5%) | 227,985 (49.5%) |
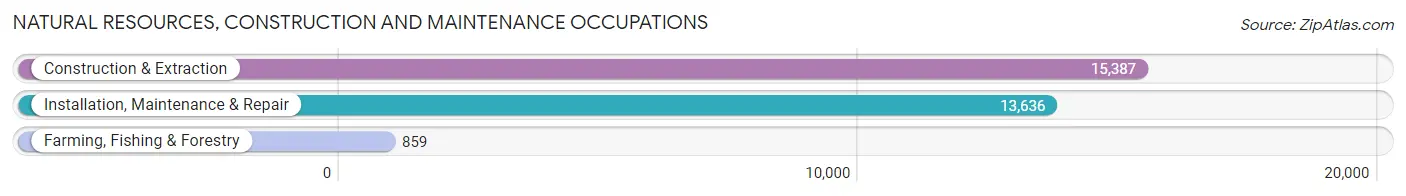
Natural Resources, Construction and Maintenance Occupations
The most common Natural Resources, Construction and Maintenance occupations in Pinellas County are Construction & Extraction (15,387 | 3.3%), Installation, Maintenance & Repair (13,636 | 3.0%), and Farming, Fishing & Forestry (859 | 0.2%).
Natural Resources, Construction and Maintenance Occupations by Sex
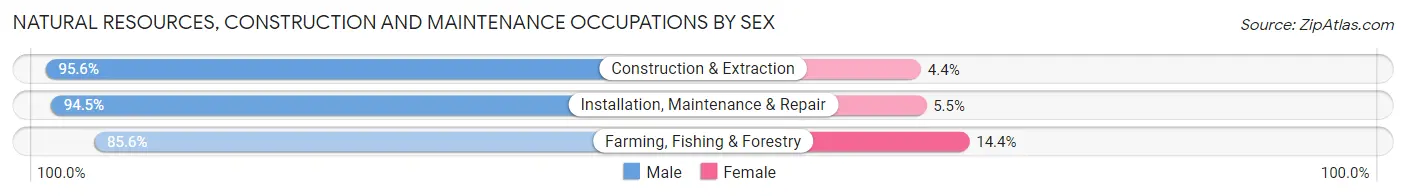
| Occupation | Male | Female |
| Farming, Fishing & Forestry | 735 (85.6%) | 124 (14.4%) |
| Construction & Extraction | 14,715 (95.6%) | 672 (4.4%) |
| Installation, Maintenance & Repair | 12,890 (94.5%) | 746 (5.5%) |
| Total (Category) | 28,340 (94.8%) | 1,542 (5.2%) |
| Total (Overall) | 232,788 (50.5%) | 227,985 (49.5%) |
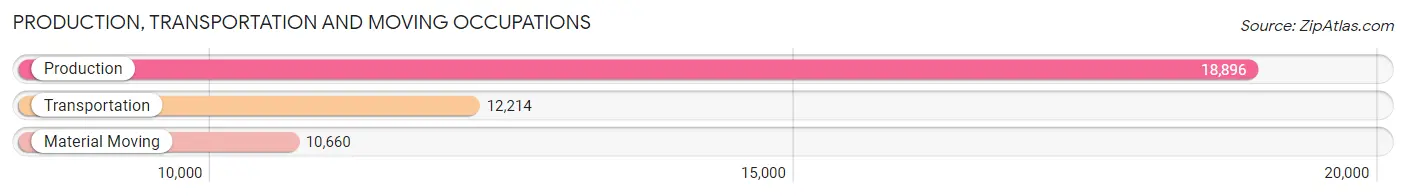
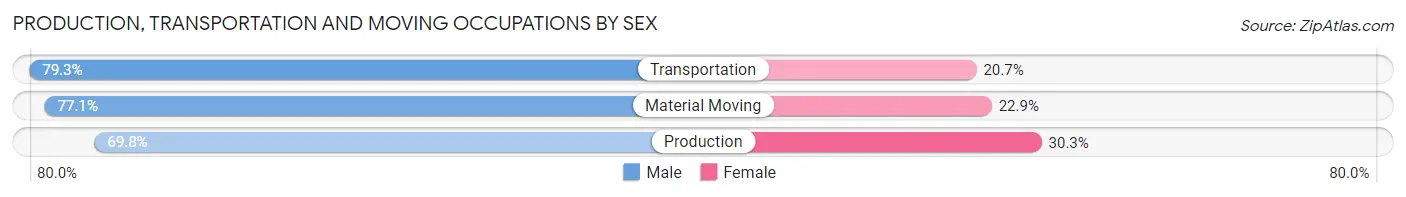
Production, Transportation and Moving Occupations
The most common Production, Transportation and Moving occupations in Pinellas County are Production (18,896 | 4.1%), Transportation (12,214 | 2.6%), and Material Moving (10,660 | 2.3%).
Production, Transportation and Moving Occupations by Sex
| Occupation | Male | Female |
| Production | 13,180 (69.8%) | 5,716 (30.2%) |
| Transportation | 9,687 (79.3%) | 2,527 (20.7%) |
| Material Moving | 8,216 (77.1%) | 2,444 (22.9%) |
| Total (Category) | 31,083 (74.4%) | 10,687 (25.6%) |
| Total (Overall) | 232,788 (50.5%) | 227,985 (49.5%) |
Employment Industries by Sex in Pinellas County
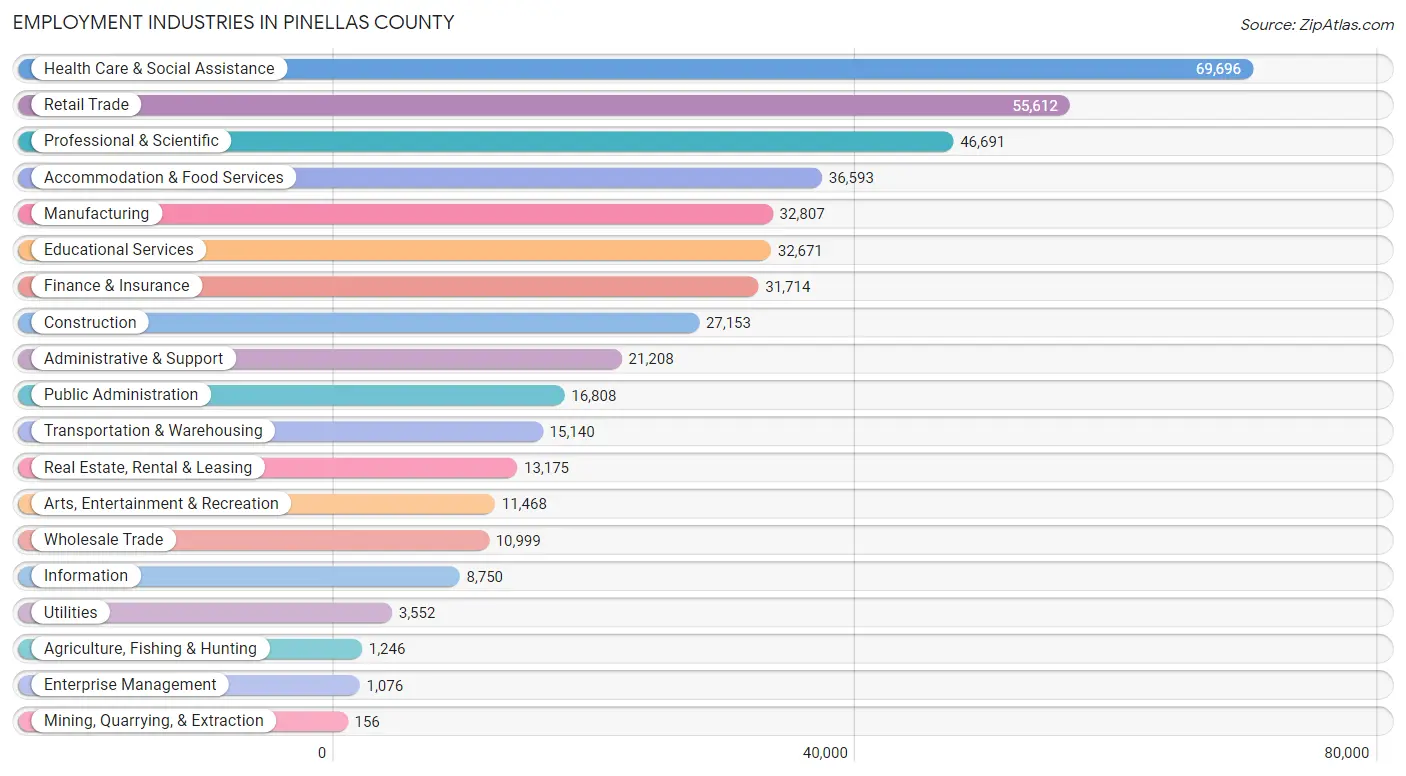
Employment Industries in Pinellas County
The major employment industries in Pinellas County include Health Care & Social Assistance (69,696 | 15.1%), Retail Trade (55,612 | 12.1%), Professional & Scientific (46,691 | 10.1%), Accommodation & Food Services (36,593 | 7.9%), and Manufacturing (32,807 | 7.1%).
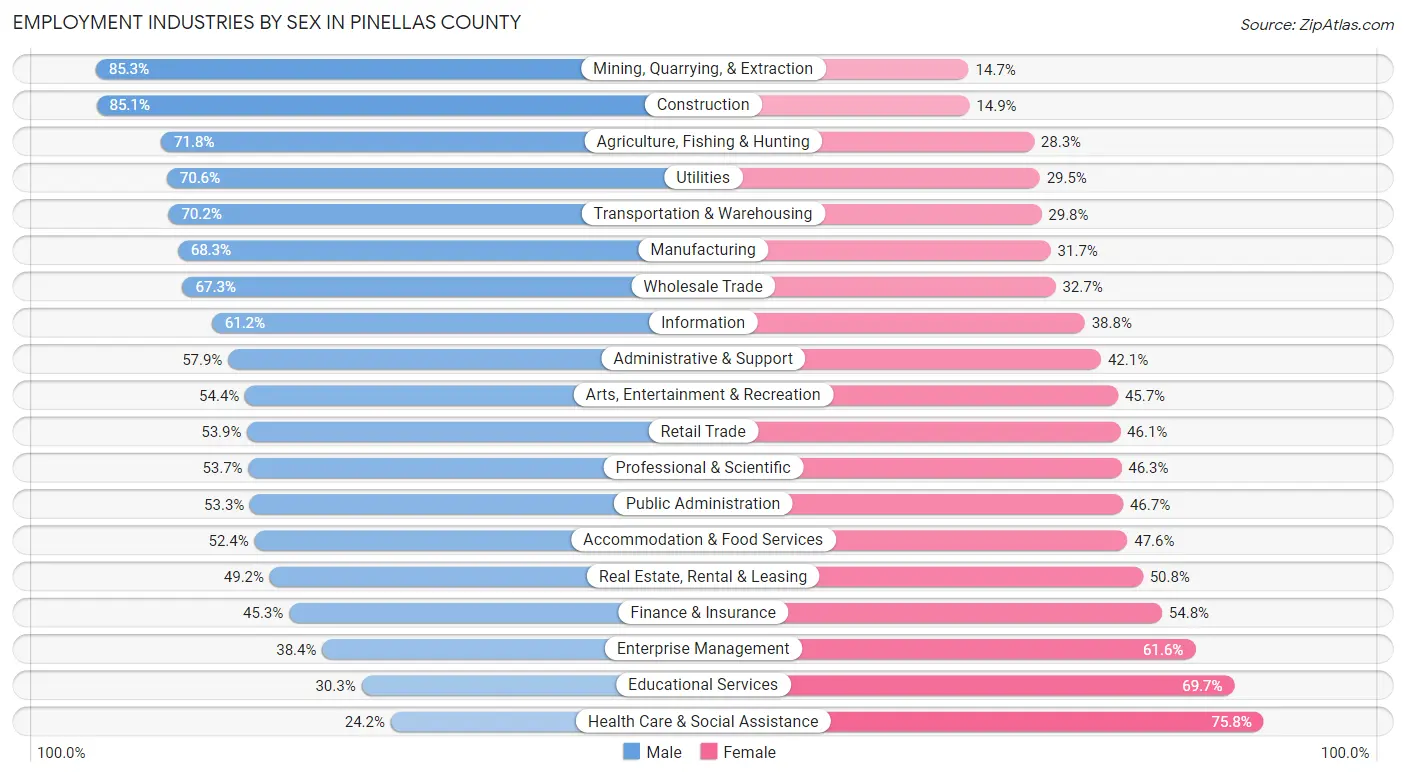
Employment Industries by Sex in Pinellas County
The Pinellas County industries that see more men than women are Mining, Quarrying, & Extraction (85.3%), Construction (85.1%), and Agriculture, Fishing & Hunting (71.8%), whereas the industries that tend to have a higher number of women are Health Care & Social Assistance (75.8%), Educational Services (69.7%), and Enterprise Management (61.6%).
| Industry | Male | Female |
| Agriculture, Fishing & Hunting | 894 (71.8%) | 352 (28.2%) |
| Mining, Quarrying, & Extraction | 133 (85.3%) | 23 (14.7%) |
| Construction | 23,108 (85.1%) | 4,045 (14.9%) |
| Manufacturing | 22,401 (68.3%) | 10,406 (31.7%) |
| Wholesale Trade | 7,400 (67.3%) | 3,599 (32.7%) |
| Retail Trade | 29,975 (53.9%) | 25,637 (46.1%) |
| Transportation & Warehousing | 10,630 (70.2%) | 4,510 (29.8%) |
| Utilities | 2,506 (70.6%) | 1,046 (29.4%) |
| Information | 5,358 (61.2%) | 3,392 (38.8%) |
| Finance & Insurance | 14,352 (45.3%) | 17,362 (54.7%) |
| Real Estate, Rental & Leasing | 6,486 (49.2%) | 6,689 (50.8%) |
| Professional & Scientific | 25,060 (53.7%) | 21,631 (46.3%) |
| Enterprise Management | 413 (38.4%) | 663 (61.6%) |
| Administrative & Support | 12,271 (57.9%) | 8,937 (42.1%) |
| Educational Services | 9,890 (30.3%) | 22,781 (69.7%) |
| Health Care & Social Assistance | 16,867 (24.2%) | 52,829 (75.8%) |
| Arts, Entertainment & Recreation | 6,233 (54.3%) | 5,235 (45.7%) |
| Accommodation & Food Services | 19,180 (52.4%) | 17,413 (47.6%) |
| Public Administration | 8,960 (53.3%) | 7,848 (46.7%) |
| Total | 232,788 (50.5%) | 227,985 (49.5%) |
Education in Pinellas County
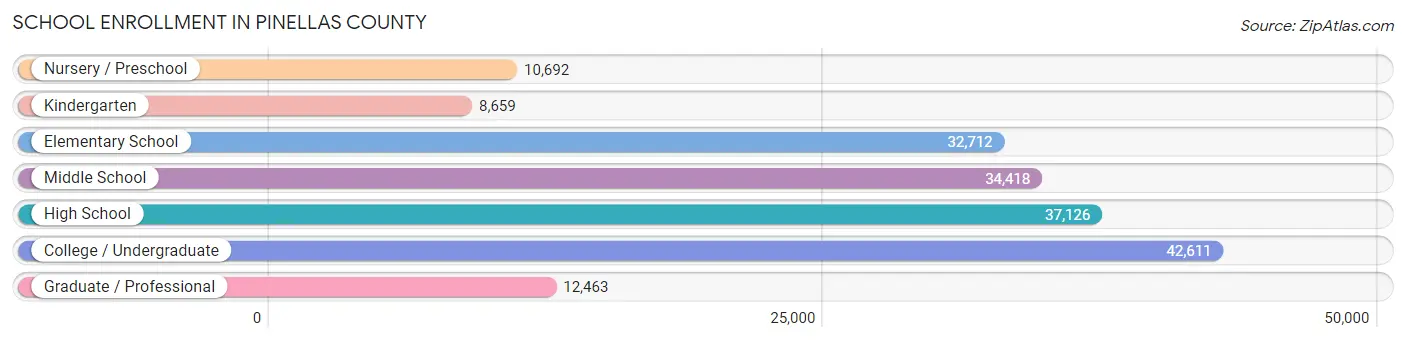
School Enrollment in Pinellas County
The most common levels of schooling among the 178,681 students in Pinellas County are college / undergraduate (42,611 | 23.8%), high school (37,126 | 20.8%), and middle school (34,418 | 19.3%).
| School Level | # Students | % Students |
| Nursery / Preschool | 10,692 | 6.0% |
| Kindergarten | 8,659 | 4.9% |
| Elementary School | 32,712 | 18.3% |
| Middle School | 34,418 | 19.3% |
| High School | 37,126 | 20.8% |
| College / Undergraduate | 42,611 | 23.8% |
| Graduate / Professional | 12,463 | 7.0% |
| Total | 178,681 | 100.0% |
School Enrollment by Age by Funding Source in Pinellas County
Out of a total of 178,681 students who are enrolled in schools in Pinellas County, 38,059 (21.3%) attend a private institution, while the remaining 140,622 (78.7%) are enrolled in public schools. The age group of 3 to 4 year olds has the highest likelihood of being enrolled in private schools, with 4,667 (55.8% in the age bracket) enrolled. Conversely, the age group of 15 to 17 year olds has the lowest likelihood of being enrolled in a private school, with 21,929 (83.5% in the age bracket) attending a public institution.
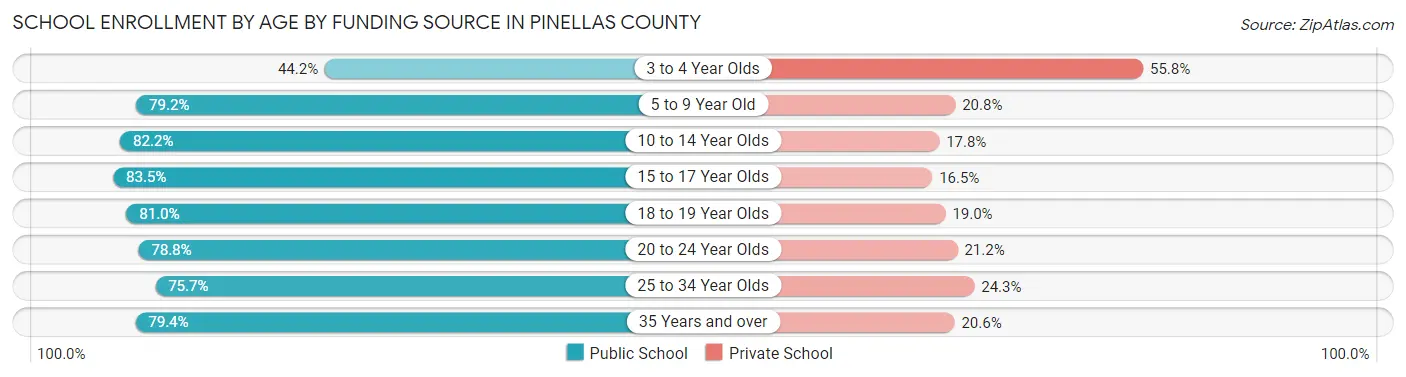
| Age Bracket | Public School | Private School |
| 3 to 4 Year Olds | 3,703 (44.2%) | 4,667 (55.8%) |
| 5 to 9 Year Old | 31,168 (79.2%) | 8,178 (20.8%) |
| 10 to 14 Year Olds | 34,858 (82.2%) | 7,544 (17.8%) |
| 15 to 17 Year Olds | 21,929 (83.5%) | 4,330 (16.5%) |
| 18 to 19 Year Olds | 9,688 (81.0%) | 2,266 (19.0%) |
| 20 to 24 Year Olds | 14,679 (78.8%) | 3,950 (21.2%) |
| 25 to 34 Year Olds | 10,025 (75.7%) | 3,224 (24.3%) |
| 35 Years and over | 14,659 (79.4%) | 3,813 (20.6%) |
| Total | 140,622 (78.7%) | 38,059 (21.3%) |
Educational Attainment by Field of Study in Pinellas County
Business (65,649 | 23.4%), education (33,131 | 11.8%), science & technology (30,766 | 11.0%), social sciences (21,310 | 7.6%), and engineering (17,551 | 6.3%) are the most common fields of study among 280,244 individuals in Pinellas County who have obtained a bachelor's degree or higher.
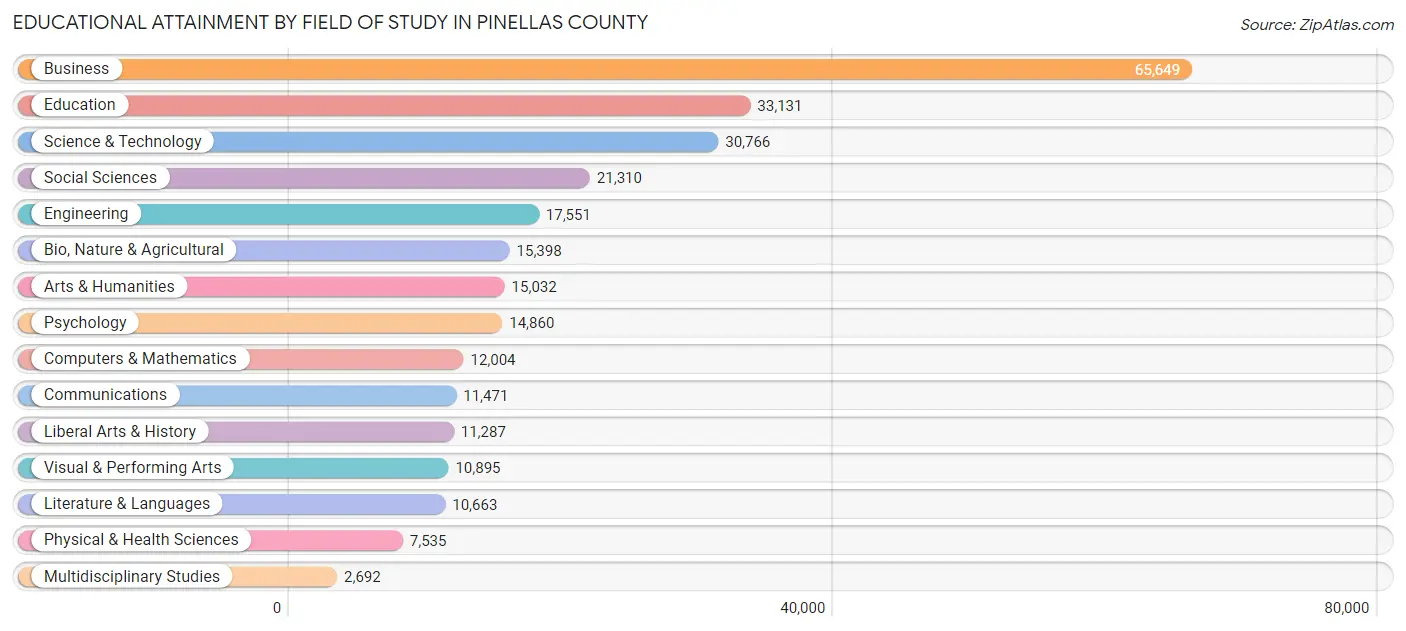
| Field of Study | # Graduates | % Graduates |
| Computers & Mathematics | 12,004 | 4.3% |
| Bio, Nature & Agricultural | 15,398 | 5.5% |
| Physical & Health Sciences | 7,535 | 2.7% |
| Psychology | 14,860 | 5.3% |
| Social Sciences | 21,310 | 7.6% |
| Engineering | 17,551 | 6.3% |
| Multidisciplinary Studies | 2,692 | 1.0% |
| Science & Technology | 30,766 | 11.0% |
| Business | 65,649 | 23.4% |
| Education | 33,131 | 11.8% |
| Literature & Languages | 10,663 | 3.8% |
| Liberal Arts & History | 11,287 | 4.0% |
| Visual & Performing Arts | 10,895 | 3.9% |
| Communications | 11,471 | 4.1% |
| Arts & Humanities | 15,032 | 5.4% |
| Total | 280,244 | 100.0% |
Transportation & Commute in Pinellas County
Vehicle Availability by Sex in Pinellas County
The most prevalent vehicle ownership categories in Pinellas County are males with 2 vehicles (109,457, accounting for 47.6%) and females with 2 vehicles (100,161, making up 49.2%).
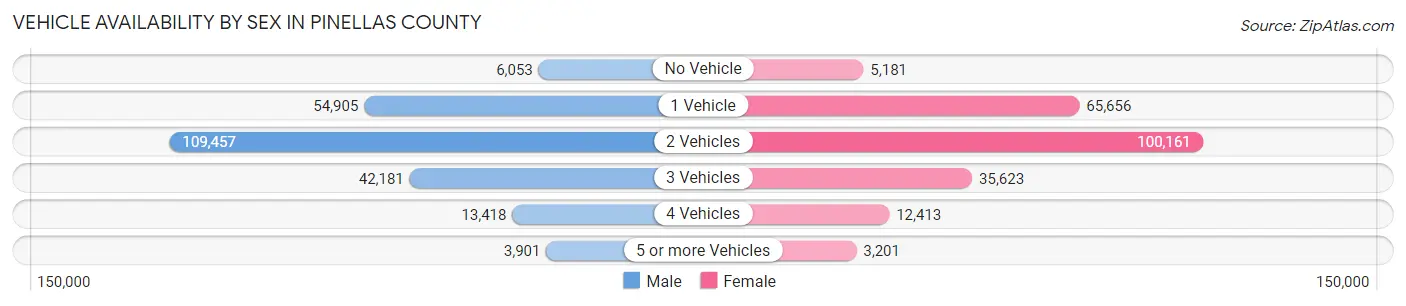
| Vehicles Available | Male | Female |
| No Vehicle | 6,053 (2.6%) | 5,181 (2.3%) |
| 1 Vehicle | 54,905 (23.9%) | 65,656 (29.5%) |
| 2 Vehicles | 109,457 (47.6%) | 100,161 (45.1%) |
| 3 Vehicles | 42,181 (18.3%) | 35,623 (16.0%) |
| 4 Vehicles | 13,418 (5.8%) | 12,413 (5.6%) |
| 5 or more Vehicles | 3,901 (1.7%) | 3,201 (1.4%) |
| Total | 229,915 (100.0%) | 222,235 (100.0%) |
Commute Time in Pinellas County
The most frequently occuring commute durations in Pinellas County are 15 to 19 minutes (72,970 commuters, 18.9%), 20 to 24 minutes (60,731 commuters, 15.7%), and 30 to 34 minutes (54,512 commuters, 14.1%).
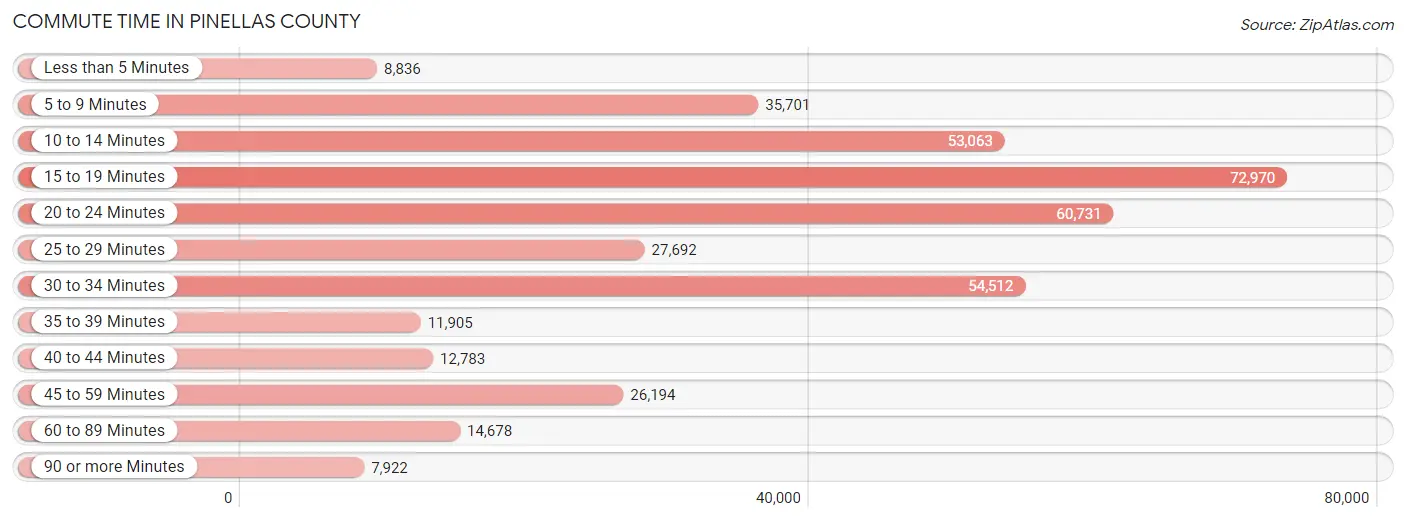
| Commute Time | # Commuters | % Commuters |
| Less than 5 Minutes | 8,836 | 2.3% |
| 5 to 9 Minutes | 35,701 | 9.2% |
| 10 to 14 Minutes | 53,063 | 13.7% |
| 15 to 19 Minutes | 72,970 | 18.9% |
| 20 to 24 Minutes | 60,731 | 15.7% |
| 25 to 29 Minutes | 27,692 | 7.2% |
| 30 to 34 Minutes | 54,512 | 14.1% |
| 35 to 39 Minutes | 11,905 | 3.1% |
| 40 to 44 Minutes | 12,783 | 3.3% |
| 45 to 59 Minutes | 26,194 | 6.8% |
| 60 to 89 Minutes | 14,678 | 3.8% |
| 90 or more Minutes | 7,922 | 2.1% |
Commute Time by Sex in Pinellas County
The most common commute times in Pinellas County are 15 to 19 minutes (36,680 commuters, 18.5%) for males and 15 to 19 minutes (36,290 commuters, 19.3%) for females.
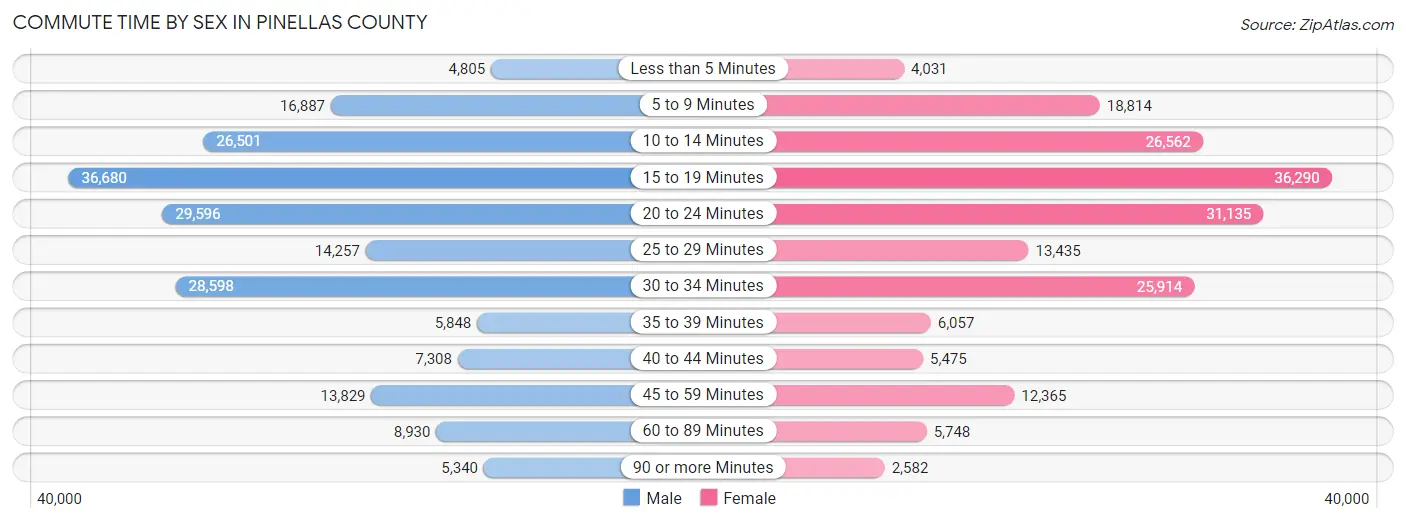
| Commute Time | Male | Female |
| Less than 5 Minutes | 4,805 (2.4%) | 4,031 (2.1%) |
| 5 to 9 Minutes | 16,887 (8.5%) | 18,814 (10.0%) |
| 10 to 14 Minutes | 26,501 (13.4%) | 26,562 (14.1%) |
| 15 to 19 Minutes | 36,680 (18.5%) | 36,290 (19.3%) |
| 20 to 24 Minutes | 29,596 (14.9%) | 31,135 (16.5%) |
| 25 to 29 Minutes | 14,257 (7.2%) | 13,435 (7.1%) |
| 30 to 34 Minutes | 28,598 (14.4%) | 25,914 (13.8%) |
| 35 to 39 Minutes | 5,848 (2.9%) | 6,057 (3.2%) |
| 40 to 44 Minutes | 7,308 (3.7%) | 5,475 (2.9%) |
| 45 to 59 Minutes | 13,829 (7.0%) | 12,365 (6.6%) |
| 60 to 89 Minutes | 8,930 (4.5%) | 5,748 (3.0%) |
| 90 or more Minutes | 5,340 (2.7%) | 2,582 (1.4%) |
Time of Departure to Work by Sex in Pinellas County
The most frequent times of departure to work in Pinellas County are 7:00 AM to 7:29 AM (28,310, 14.3%) for males and 7:00 AM to 7:29 AM (28,052, 14.9%) for females.
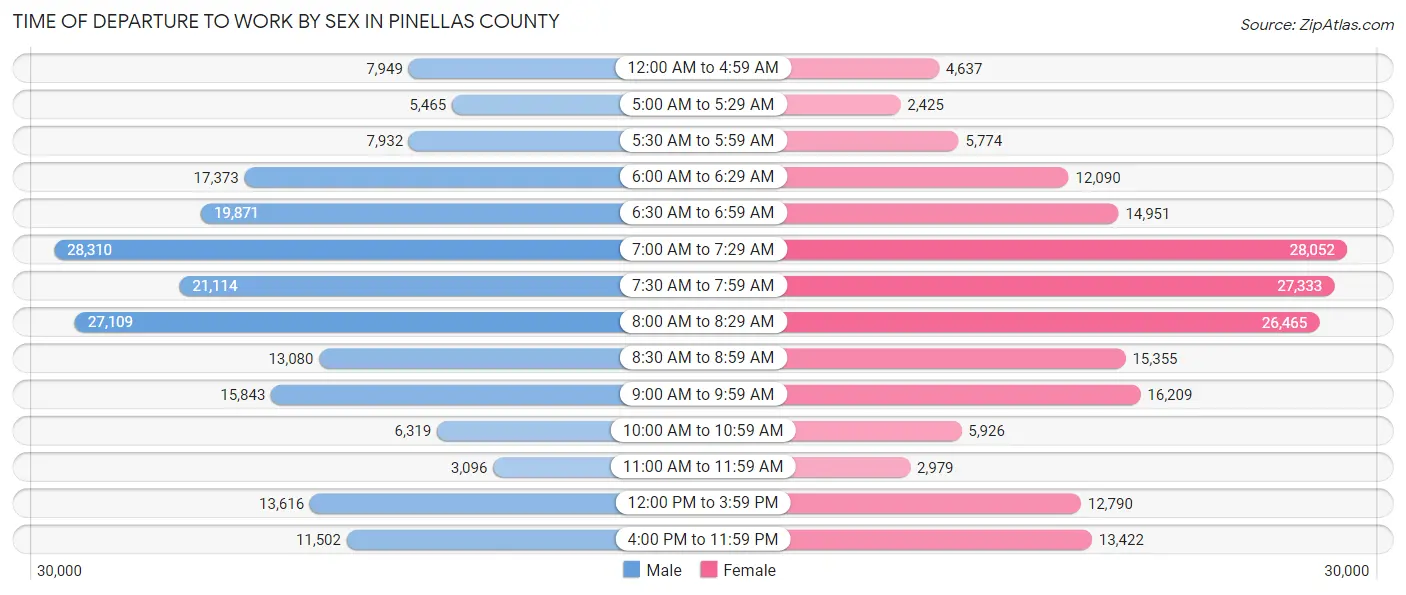
| Time of Departure | Male | Female |
| 12:00 AM to 4:59 AM | 7,949 (4.0%) | 4,637 (2.5%) |
| 5:00 AM to 5:29 AM | 5,465 (2.8%) | 2,425 (1.3%) |
| 5:30 AM to 5:59 AM | 7,932 (4.0%) | 5,774 (3.1%) |
| 6:00 AM to 6:29 AM | 17,373 (8.7%) | 12,090 (6.4%) |
| 6:30 AM to 6:59 AM | 19,871 (10.0%) | 14,951 (7.9%) |
| 7:00 AM to 7:29 AM | 28,310 (14.3%) | 28,052 (14.9%) |
| 7:30 AM to 7:59 AM | 21,114 (10.6%) | 27,333 (14.5%) |
| 8:00 AM to 8:29 AM | 27,109 (13.7%) | 26,465 (14.1%) |
| 8:30 AM to 8:59 AM | 13,080 (6.6%) | 15,355 (8.2%) |
| 9:00 AM to 9:59 AM | 15,843 (8.0%) | 16,209 (8.6%) |
| 10:00 AM to 10:59 AM | 6,319 (3.2%) | 5,926 (3.2%) |
| 11:00 AM to 11:59 AM | 3,096 (1.6%) | 2,979 (1.6%) |
| 12:00 PM to 3:59 PM | 13,616 (6.9%) | 12,790 (6.8%) |
| 4:00 PM to 11:59 PM | 11,502 (5.8%) | 13,422 (7.1%) |
| Total | 198,579 (100.0%) | 188,408 (100.0%) |
Housing Occupancy in Pinellas County
Occupancy by Ownership in Pinellas County
Of the total 418,716 dwellings in Pinellas County, owner-occupied units account for 289,090 (69.0%), while renter-occupied units make up 129,626 (31.0%).
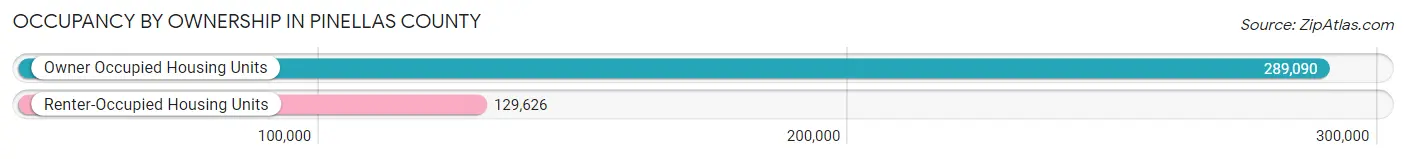
| Occupancy | # Housing Units | % Housing Units |
| Owner Occupied Housing Units | 289,090 | 69.0% |
| Renter-Occupied Housing Units | 129,626 | 31.0% |
| Total Occupied Housing Units | 418,716 | 100.0% |
Occupancy by Household Size in Pinellas County
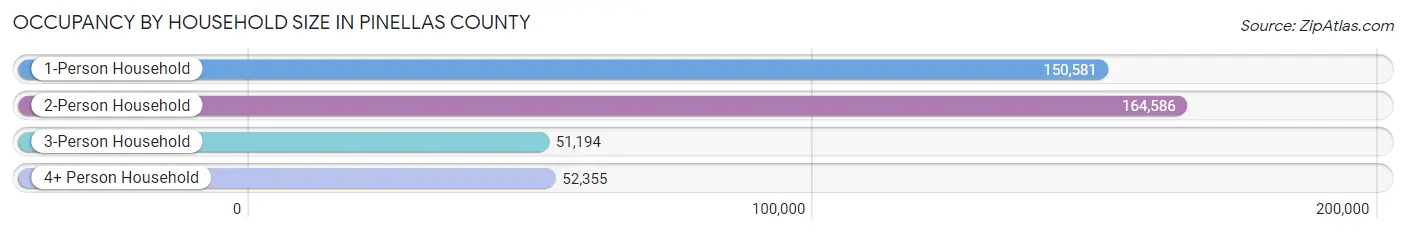
| Household Size | # Housing Units | % Housing Units |
| 1-Person Household | 150,581 | 36.0% |
| 2-Person Household | 164,586 | 39.3% |
| 3-Person Household | 51,194 | 12.2% |
| 4+ Person Household | 52,355 | 12.5% |
| Total Housing Units | 418,716 | 100.0% |
Occupancy by Ownership by Household Size in Pinellas County
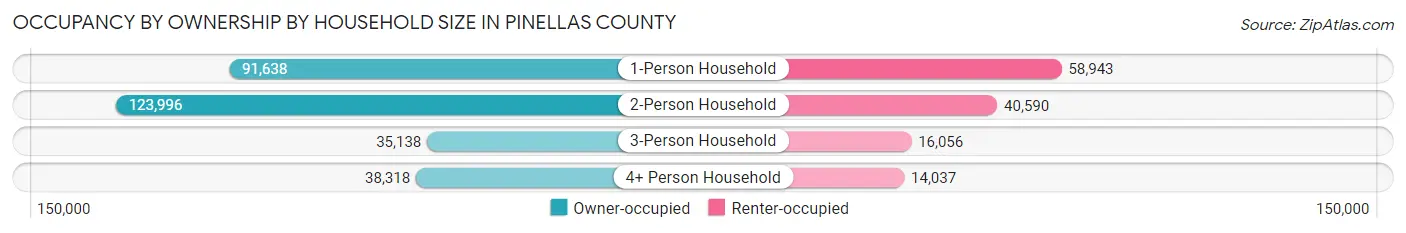
| Household Size | Owner-occupied | Renter-occupied |
| 1-Person Household | 91,638 (60.9%) | 58,943 (39.1%) |
| 2-Person Household | 123,996 (75.3%) | 40,590 (24.7%) |
| 3-Person Household | 35,138 (68.6%) | 16,056 (31.4%) |
| 4+ Person Household | 38,318 (73.2%) | 14,037 (26.8%) |
| Total Housing Units | 289,090 (69.0%) | 129,626 (31.0%) |
Occupancy by Educational Attainment in Pinellas County
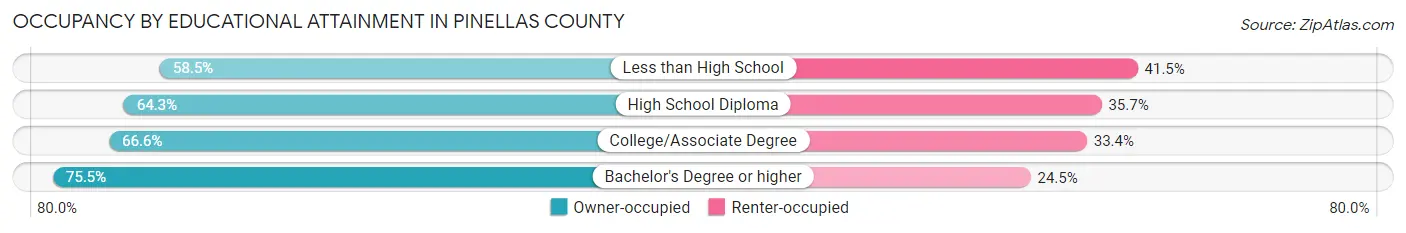
| Household Size | Owner-occupied | Renter-occupied |
| Less than High School | 14,409 (58.5%) | 10,211 (41.5%) |
| High School Diploma | 61,174 (64.3%) | 34,028 (35.7%) |
| College/Associate Degree | 90,966 (66.6%) | 45,650 (33.4%) |
| Bachelor's Degree or higher | 122,541 (75.5%) | 39,737 (24.5%) |
Occupancy by Age of Householder in Pinellas County
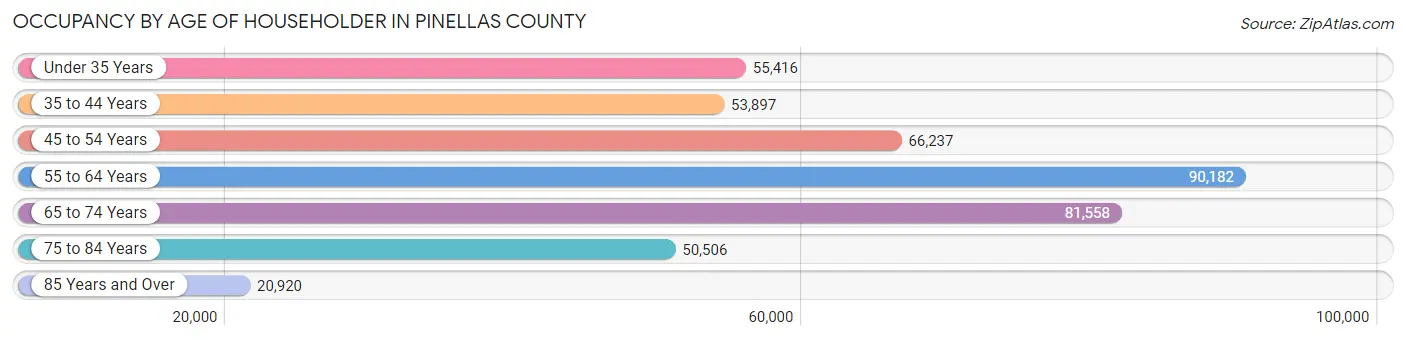
| Age Bracket | # Households | % Households |
| Under 35 Years | 55,416 | 13.2% |
| 35 to 44 Years | 53,897 | 12.9% |
| 45 to 54 Years | 66,237 | 15.8% |
| 55 to 64 Years | 90,182 | 21.5% |
| 65 to 74 Years | 81,558 | 19.5% |
| 75 to 84 Years | 50,506 | 12.1% |
| 85 Years and Over | 20,920 | 5.0% |
| Total | 418,716 | 100.0% |
Housing Finances in Pinellas County
Median Income by Occupancy in Pinellas County
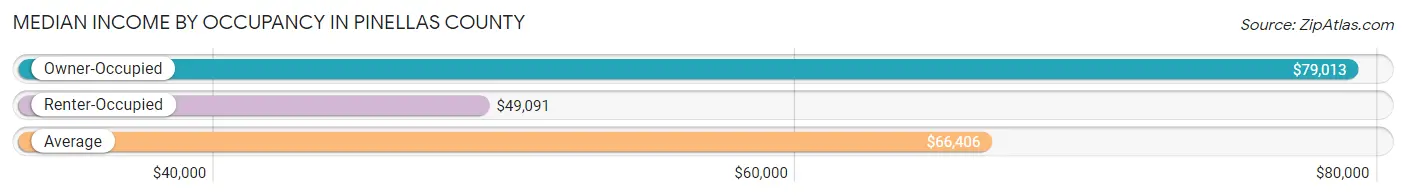
| Occupancy Type | # Households | Median Income |
| Owner-Occupied | 289,090 (69.0%) | $79,013 |
| Renter-Occupied | 129,626 (31.0%) | $49,091 |
| Average | 418,716 (100.0%) | $66,406 |
Occupancy by Householder Income Bracket in Pinellas County
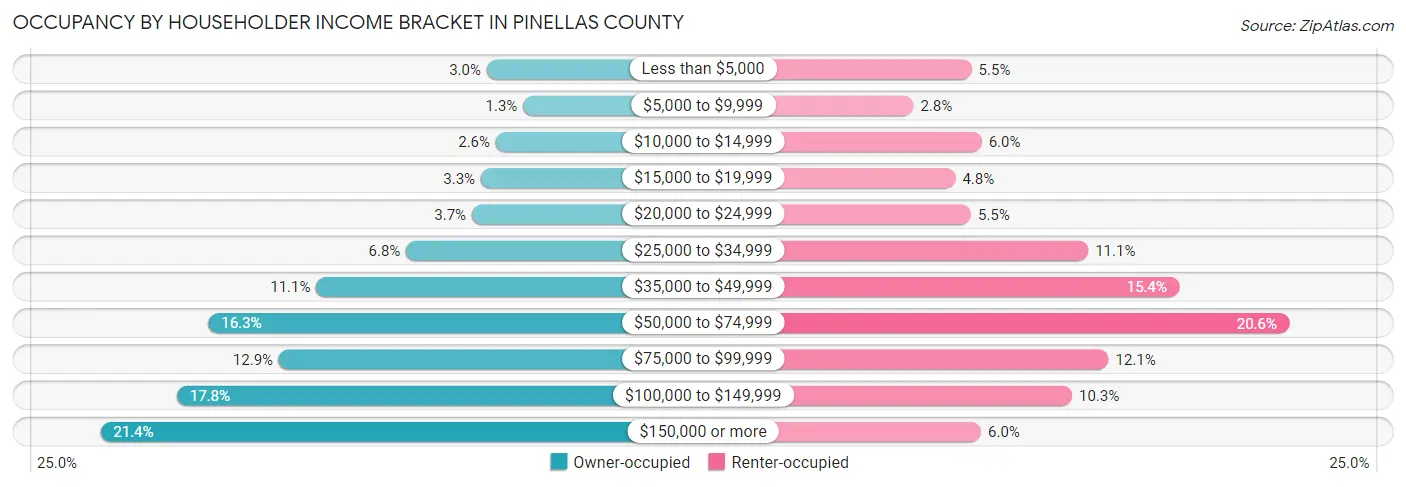
| Income Bracket | Owner-occupied | Renter-occupied |
| Less than $5,000 | 8,640 (3.0%) | 7,167 (5.5%) |
| $5,000 to $9,999 | 3,633 (1.3%) | 3,573 (2.8%) |
| $10,000 to $14,999 | 7,393 (2.6%) | 7,789 (6.0%) |
| $15,000 to $19,999 | 9,462 (3.3%) | 6,174 (4.8%) |
| $20,000 to $24,999 | 10,701 (3.7%) | 7,124 (5.5%) |
| $25,000 to $34,999 | 19,756 (6.8%) | 14,367 (11.1%) |
| $35,000 to $49,999 | 32,128 (11.1%) | 19,950 (15.4%) |
| $50,000 to $74,999 | 46,978 (16.3%) | 26,741 (20.6%) |
| $75,000 to $99,999 | 37,260 (12.9%) | 15,623 (12.0%) |
| $100,000 to $149,999 | 51,311 (17.7%) | 13,368 (10.3%) |
| $150,000 or more | 61,828 (21.4%) | 7,750 (6.0%) |
| Total | 289,090 (100.0%) | 129,626 (100.0%) |
Monthly Housing Cost Tiers in Pinellas County
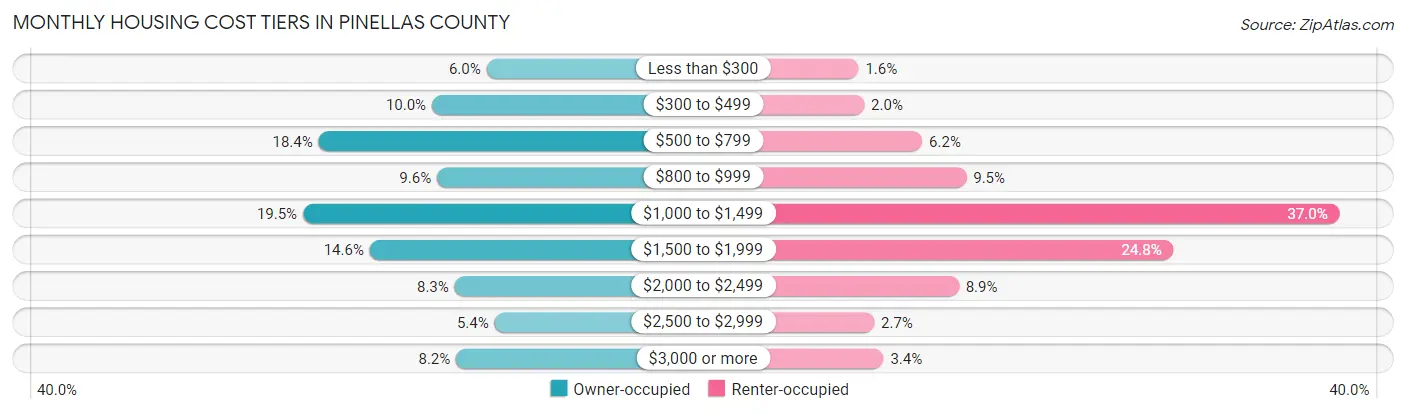
| Monthly Cost | Owner-occupied | Renter-occupied |
| Less than $300 | 17,286 (6.0%) | 2,011 (1.5%) |
| $300 to $499 | 28,923 (10.0%) | 2,554 (2.0%) |
| $500 to $799 | 53,057 (18.3%) | 8,088 (6.2%) |
| $800 to $999 | 27,851 (9.6%) | 12,296 (9.5%) |
| $1,000 to $1,499 | 56,365 (19.5%) | 47,934 (37.0%) |
| $1,500 to $1,999 | 42,159 (14.6%) | 32,086 (24.7%) |
| $2,000 to $2,499 | 24,089 (8.3%) | 11,574 (8.9%) |
| $2,500 to $2,999 | 15,583 (5.4%) | 3,496 (2.7%) |
| $3,000 or more | 23,777 (8.2%) | 4,391 (3.4%) |
| Total | 289,090 (100.0%) | 129,626 (100.0%) |
Physical Housing Characteristics in Pinellas County
Housing Structures in Pinellas County
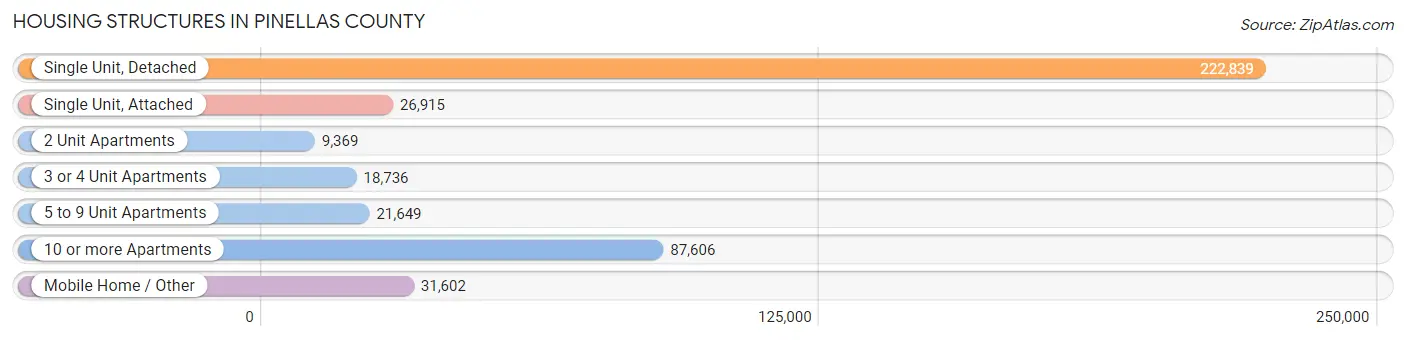
| Structure Type | # Housing Units | % Housing Units |
| Single Unit, Detached | 222,839 | 53.2% |
| Single Unit, Attached | 26,915 | 6.4% |
| 2 Unit Apartments | 9,369 | 2.2% |
| 3 or 4 Unit Apartments | 18,736 | 4.5% |
| 5 to 9 Unit Apartments | 21,649 | 5.2% |
| 10 or more Apartments | 87,606 | 20.9% |
| Mobile Home / Other | 31,602 | 7.5% |
| Total | 418,716 | 100.0% |
Housing Structures by Occupancy in Pinellas County
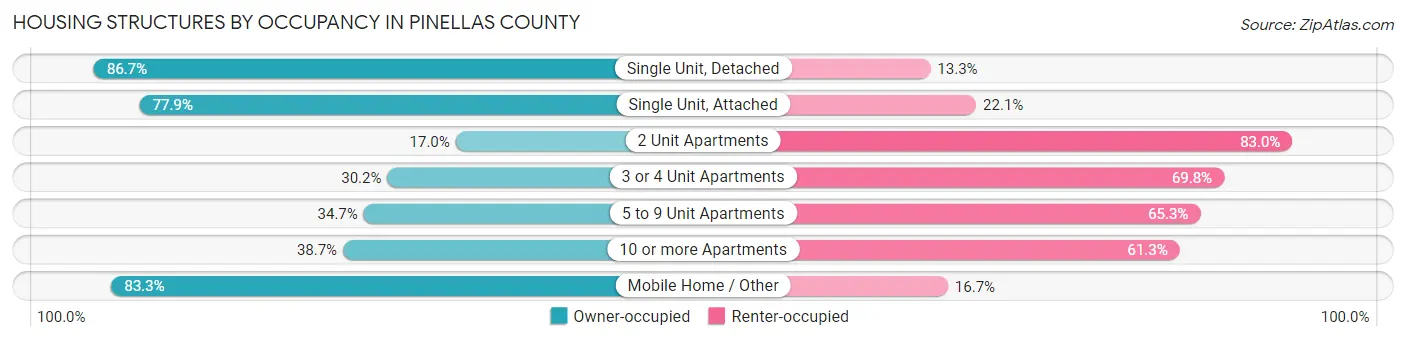
| Structure Type | Owner-occupied | Renter-occupied |
| Single Unit, Detached | 193,130 (86.7%) | 29,709 (13.3%) |
| Single Unit, Attached | 20,955 (77.9%) | 5,960 (22.1%) |
| 2 Unit Apartments | 1,595 (17.0%) | 7,774 (83.0%) |
| 3 or 4 Unit Apartments | 5,650 (30.2%) | 13,086 (69.8%) |
| 5 to 9 Unit Apartments | 7,519 (34.7%) | 14,130 (65.3%) |
| 10 or more Apartments | 33,915 (38.7%) | 53,691 (61.3%) |
| Mobile Home / Other | 26,326 (83.3%) | 5,276 (16.7%) |
| Total | 289,090 (69.0%) | 129,626 (31.0%) |
Housing Structures by Number of Rooms in Pinellas County
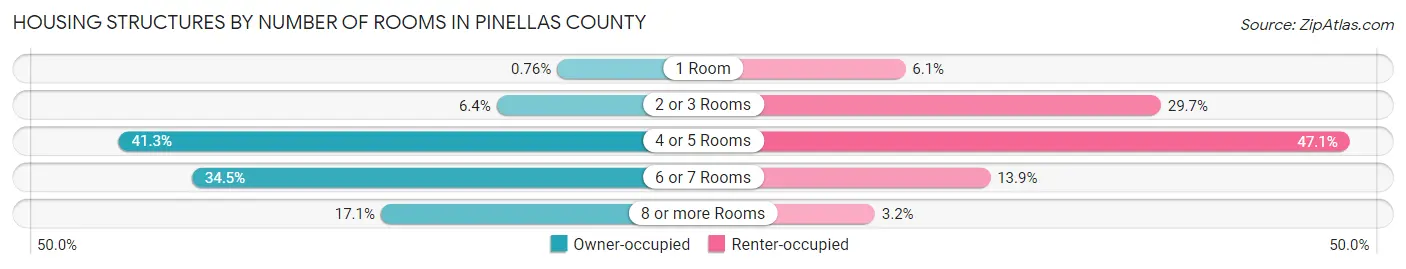
| Number of Rooms | Owner-occupied | Renter-occupied |
| 1 Room | 2,205 (0.8%) | 7,847 (6.0%) |
| 2 or 3 Rooms | 18,352 (6.4%) | 38,472 (29.7%) |
| 4 or 5 Rooms | 119,392 (41.3%) | 61,095 (47.1%) |
| 6 or 7 Rooms | 99,825 (34.5%) | 18,021 (13.9%) |
| 8 or more Rooms | 49,316 (17.1%) | 4,191 (3.2%) |
| Total | 289,090 (100.0%) | 129,626 (100.0%) |
Housing Structure by Heating Type in Pinellas County
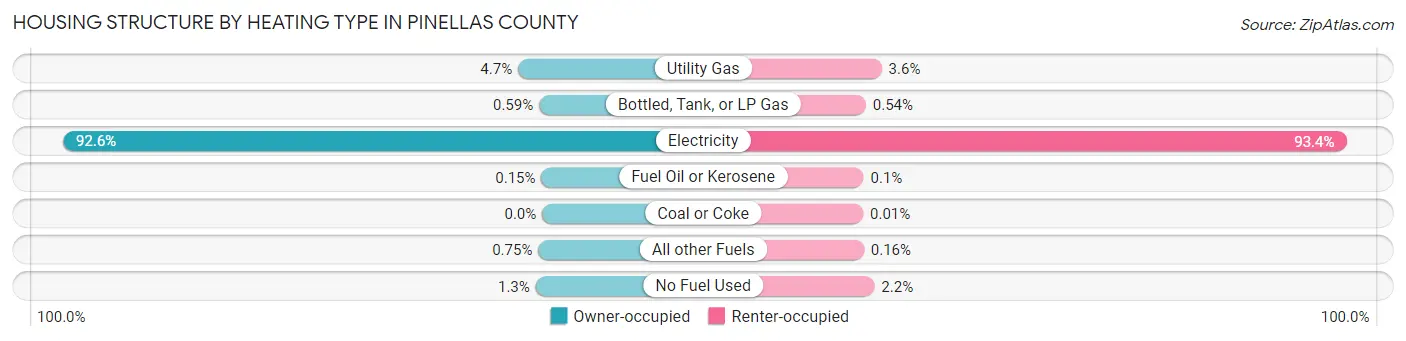
| Heating Type | Owner-occupied | Renter-occupied |
| Utility Gas | 13,481 (4.7%) | 4,673 (3.6%) |
| Bottled, Tank, or LP Gas | 1,711 (0.6%) | 696 (0.5%) |
| Electricity | 267,673 (92.6%) | 121,048 (93.4%) |
| Fuel Oil or Kerosene | 447 (0.2%) | 136 (0.1%) |
| Coal or Coke | 0 (0.0%) | 18 (0.0%) |
| All other Fuels | 2,171 (0.7%) | 205 (0.2%) |
| No Fuel Used | 3,607 (1.3%) | 2,850 (2.2%) |
| Total | 289,090 (100.0%) | 129,626 (100.0%) |
Household Vehicle Usage in Pinellas County
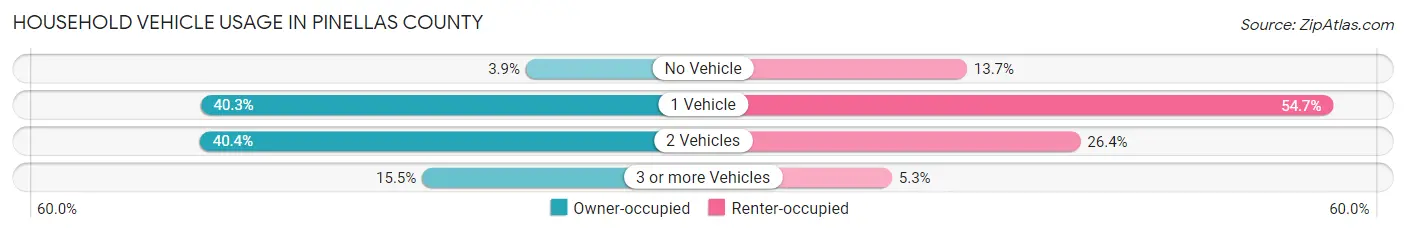
| Vehicles per Household | Owner-occupied | Renter-occupied |
| No Vehicle | 11,168 (3.9%) | 17,707 (13.7%) |
| 1 Vehicle | 116,499 (40.3%) | 70,907 (54.7%) |
| 2 Vehicles | 116,710 (40.4%) | 34,192 (26.4%) |
| 3 or more Vehicles | 44,713 (15.5%) | 6,820 (5.3%) |
| Total | 289,090 (100.0%) | 129,626 (100.0%) |
Real Estate & Mortgages in Pinellas County
Real Estate and Mortgage Overview in Pinellas County
| Characteristic | Without Mortgage | With Mortgage |
| Housing Units | 136,559 | 152,531 |
| Median Property Value | $239,800 | $318,400 |
| Median Household Income | $57,928 | $42,812 |
| Monthly Housing Costs | $635 | $21,880 |
| Real Estate Taxes | $1,730 | $5,242 |
Property Value by Mortgage Status in Pinellas County
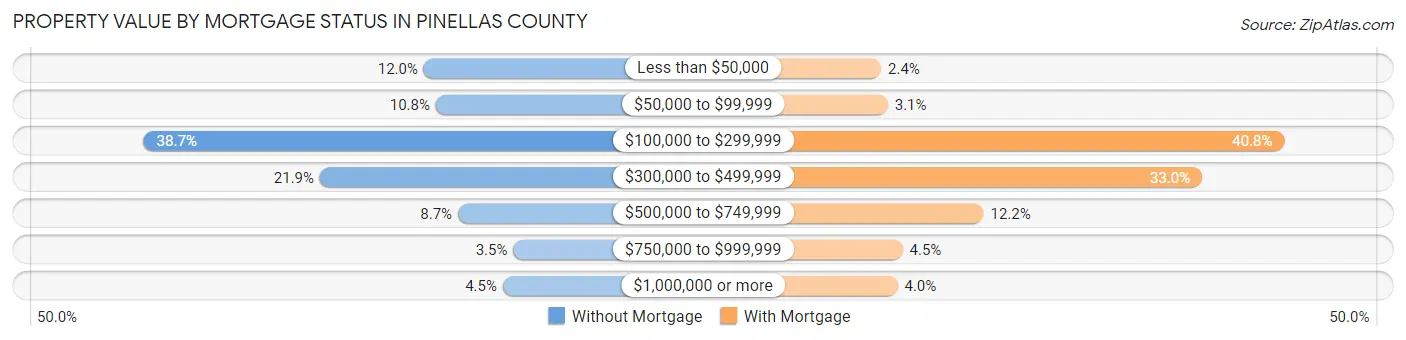
| Property Value | Without Mortgage | With Mortgage |
| Less than $50,000 | 16,362 (12.0%) | 3,713 (2.4%) |
| $50,000 to $99,999 | 14,798 (10.8%) | 4,681 (3.1%) |
| $100,000 to $299,999 | 52,791 (38.7%) | 62,284 (40.8%) |
| $300,000 to $499,999 | 29,882 (21.9%) | 50,331 (33.0%) |
| $500,000 to $749,999 | 11,916 (8.7%) | 18,595 (12.2%) |
| $750,000 to $999,999 | 4,722 (3.5%) | 6,833 (4.5%) |
| $1,000,000 or more | 6,088 (4.5%) | 6,094 (4.0%) |
| Total | 136,559 (100.0%) | 152,531 (100.0%) |
Household Income by Mortgage Status in Pinellas County
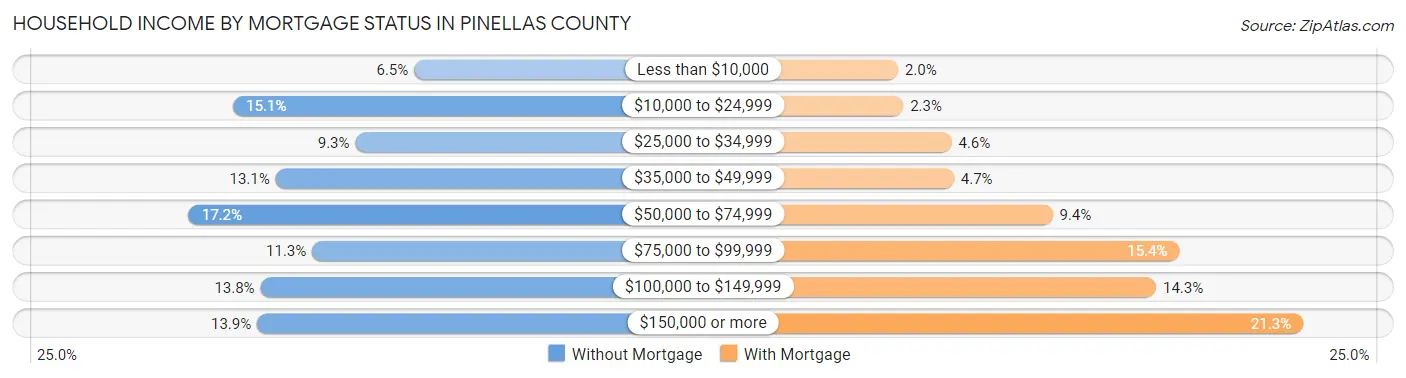
| Household Income | Without Mortgage | With Mortgage |
| Less than $10,000 | 8,813 (6.5%) | 3,088 (2.0%) |
| $10,000 to $24,999 | 20,578 (15.1%) | 3,460 (2.3%) |
| $25,000 to $34,999 | 12,625 (9.2%) | 6,978 (4.6%) |
| $35,000 to $49,999 | 17,827 (13.1%) | 7,131 (4.7%) |
| $50,000 to $74,999 | 23,460 (17.2%) | 14,301 (9.4%) |
| $75,000 to $99,999 | 15,439 (11.3%) | 23,518 (15.4%) |
| $100,000 to $149,999 | 18,801 (13.8%) | 21,821 (14.3%) |
| $150,000 or more | 19,016 (13.9%) | 32,510 (21.3%) |
| Total | 136,559 (100.0%) | 152,531 (100.0%) |
Property Value to Household Income Ratio in Pinellas County
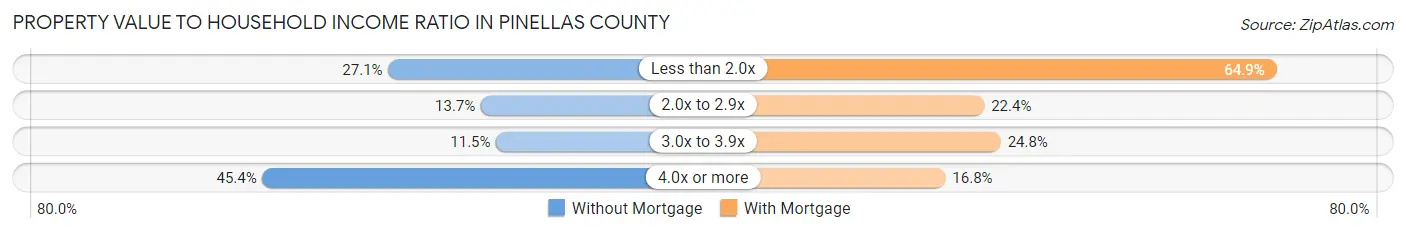
| Value-to-Income Ratio | Without Mortgage | With Mortgage |
| Less than 2.0x | 37,060 (27.1%) | 98,972 (64.9%) |
| 2.0x to 2.9x | 18,672 (13.7%) | 34,194 (22.4%) |
| 3.0x to 3.9x | 15,645 (11.5%) | 37,841 (24.8%) |
| 4.0x or more | 62,033 (45.4%) | 25,590 (16.8%) |
| Total | 136,559 (100.0%) | 152,531 (100.0%) |
Real Estate Taxes by Mortgage Status in Pinellas County
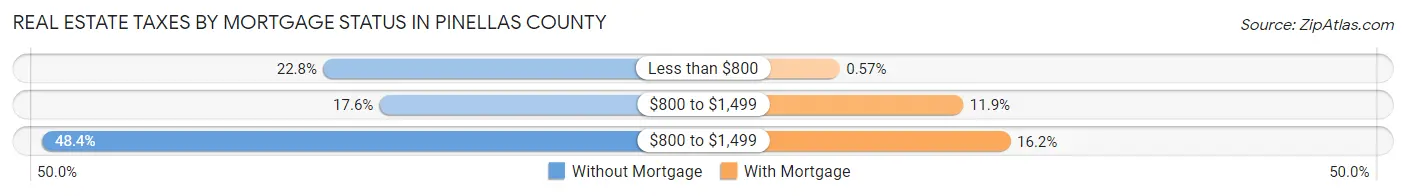
| Property Taxes | Without Mortgage | With Mortgage |
| Less than $800 | 31,096 (22.8%) | 872 (0.6%) |
| $800 to $1,499 | 24,066 (17.6%) | 18,089 (11.9%) |
| $800 to $1,499 | 66,088 (48.4%) | 24,668 (16.2%) |
| Total | 136,559 (100.0%) | 152,531 (100.0%) |
Health & Disability in Pinellas County
Health Insurance Coverage by Age in Pinellas County
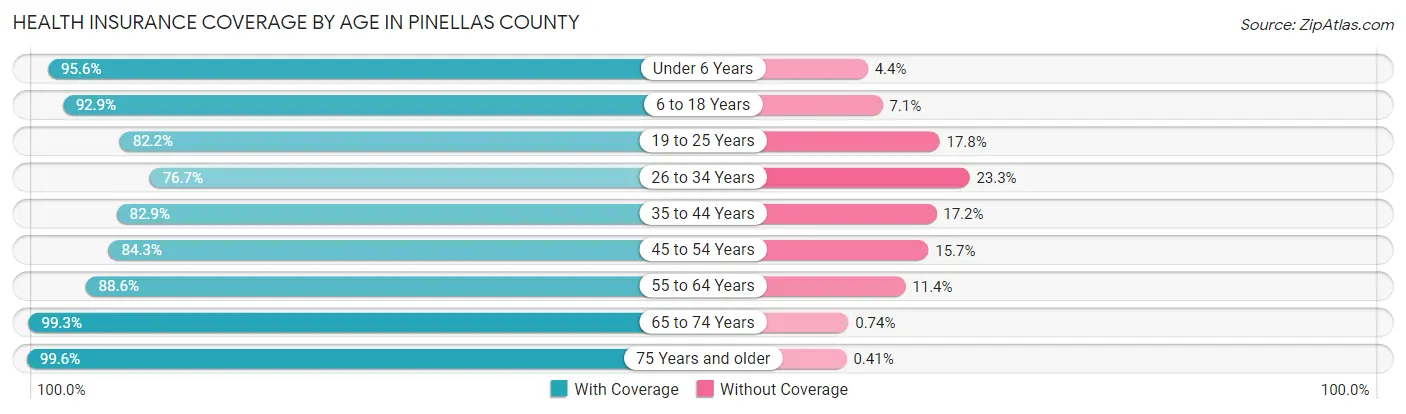
| Age Bracket | With Coverage | Without Coverage |
| Under 6 Years | 44,329 (95.6%) | 2,027 (4.4%) |
| 6 to 18 Years | 104,462 (92.9%) | 8,005 (7.1%) |
| 19 to 25 Years | 53,742 (82.2%) | 11,607 (17.8%) |
| 26 to 34 Years | 78,827 (76.7%) | 23,998 (23.3%) |
| 35 to 44 Years | 88,373 (82.9%) | 18,289 (17.2%) |
| 45 to 54 Years | 101,698 (84.3%) | 18,898 (15.7%) |
| 55 to 64 Years | 135,701 (88.6%) | 17,444 (11.4%) |
| 65 to 74 Years | 128,621 (99.3%) | 963 (0.7%) |
| 75 Years and older | 106,949 (99.6%) | 439 (0.4%) |
| Total | 842,702 (89.2%) | 101,670 (10.8%) |
Health Insurance Coverage by Citizenship Status in Pinellas County
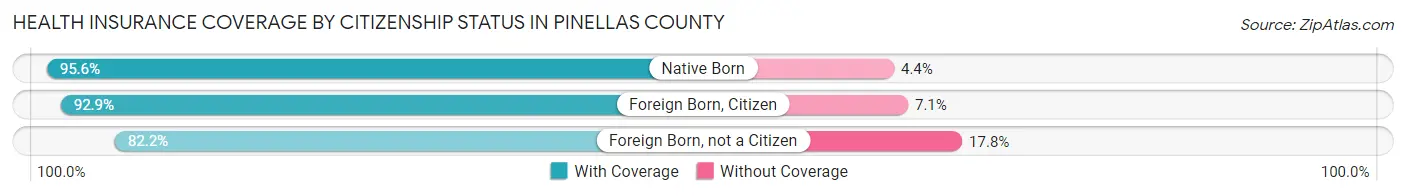
| Citizenship Status | With Coverage | Without Coverage |
| Native Born | 44,329 (95.6%) | 2,027 (4.4%) |
| Foreign Born, Citizen | 104,462 (92.9%) | 8,005 (7.1%) |
| Foreign Born, not a Citizen | 53,742 (82.2%) | 11,607 (17.8%) |
Health Insurance Coverage by Household Income in Pinellas County
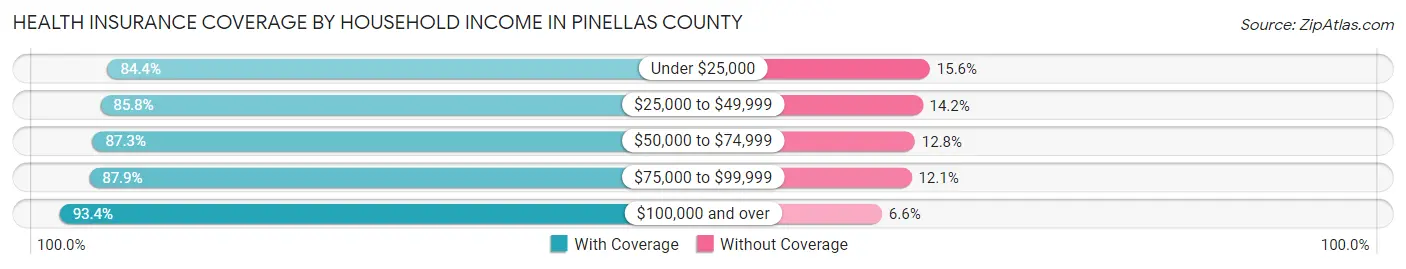
| Household Income | With Coverage | Without Coverage |
| Under $25,000 | 91,580 (84.4%) | 16,874 (15.6%) |
| $25,000 to $49,999 | 138,132 (85.8%) | 22,849 (14.2%) |
| $50,000 to $74,999 | 139,672 (87.3%) | 20,416 (12.8%) |
| $75,000 to $99,999 | 111,871 (87.9%) | 15,425 (12.1%) |
| $100,000 and over | 353,345 (93.4%) | 24,900 (6.6%) |
Public vs Private Health Insurance Coverage by Age in Pinellas County
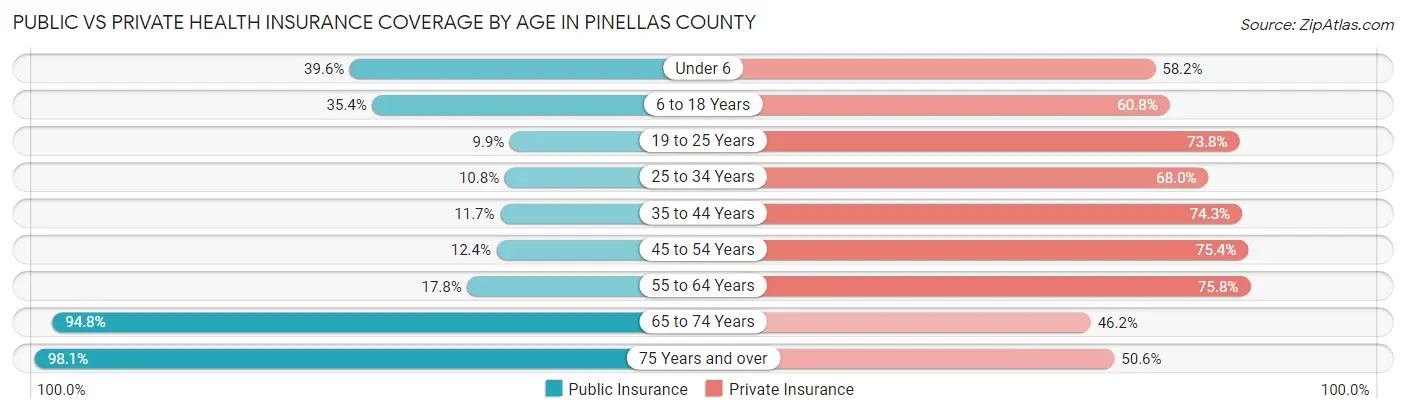
| Age Bracket | Public Insurance | Private Insurance |
| Under 6 | 18,343 (39.6%) | 26,976 (58.2%) |
| 6 to 18 Years | 39,819 (35.4%) | 68,406 (60.8%) |
| 19 to 25 Years | 6,459 (9.9%) | 48,222 (73.8%) |
| 25 to 34 Years | 11,141 (10.8%) | 69,961 (68.0%) |
| 35 to 44 Years | 12,474 (11.7%) | 79,203 (74.3%) |
| 45 to 54 Years | 14,899 (12.3%) | 90,938 (75.4%) |
| 55 to 64 Years | 27,233 (17.8%) | 116,067 (75.8%) |
| 65 to 74 Years | 122,896 (94.8%) | 59,881 (46.2%) |
| 75 Years and over | 105,336 (98.1%) | 54,329 (50.6%) |
| Total | 358,600 (38.0%) | 613,983 (65.0%) |
Disability Status by Sex by Age in Pinellas County
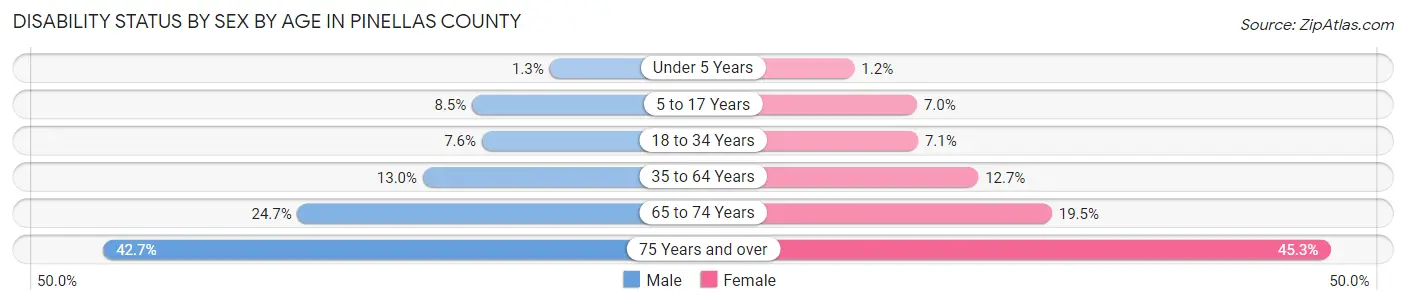
| Age Bracket | Male | Female |
| Under 5 Years | 254 (1.3%) | 221 (1.2%) |
| 5 to 17 Years | 4,846 (8.5%) | 3,836 (7.0%) |
| 18 to 34 Years | 6,617 (7.6%) | 6,279 (7.1%) |
| 35 to 64 Years | 24,056 (13.0%) | 24,789 (12.7%) |
| 65 to 74 Years | 14,914 (24.7%) | 13,471 (19.5%) |
| 75 Years and over | 19,535 (42.7%) | 27,932 (45.3%) |
Disability Class by Sex by Age in Pinellas County
Disability Class: Hearing Difficulty
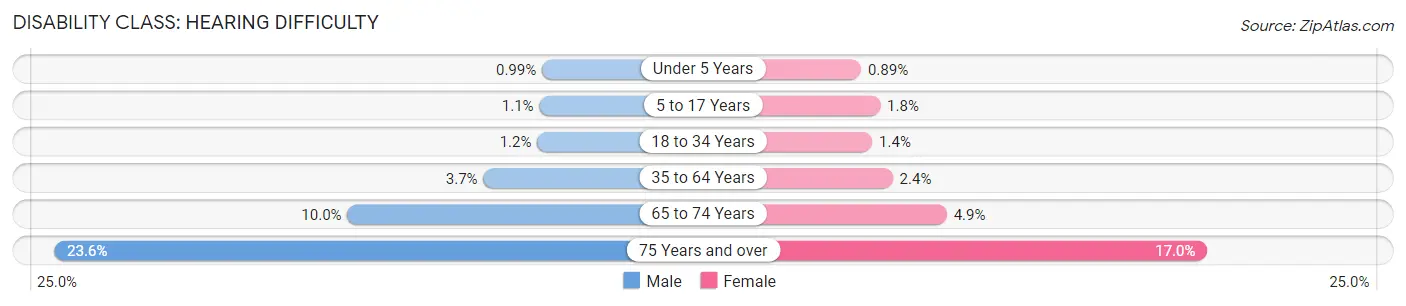
| Age Bracket | Male | Female |
| Under 5 Years | 197 (1.0%) | 169 (0.9%) |
| 5 to 17 Years | 634 (1.1%) | 975 (1.8%) |
| 18 to 34 Years | 1,060 (1.2%) | 1,250 (1.4%) |
| 35 to 64 Years | 6,839 (3.7%) | 4,616 (2.4%) |
| 65 to 74 Years | 6,059 (10.0%) | 3,370 (4.9%) |
| 75 Years and over | 10,810 (23.6%) | 10,456 (17.0%) |
Disability Class: Vision Difficulty
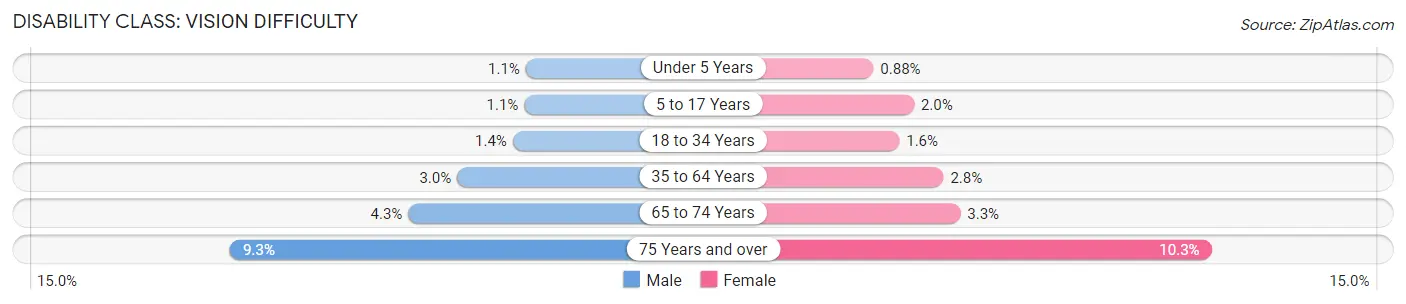
| Age Bracket | Male | Female |
| Under 5 Years | 208 (1.1%) | 166 (0.9%) |
| 5 to 17 Years | 621 (1.1%) | 1,103 (2.0%) |
| 18 to 34 Years | 1,229 (1.4%) | 1,421 (1.6%) |
| 35 to 64 Years | 5,470 (3.0%) | 5,552 (2.8%) |
| 65 to 74 Years | 2,611 (4.3%) | 2,281 (3.3%) |
| 75 Years and over | 4,246 (9.3%) | 6,345 (10.3%) |
Disability Class: Cognitive Difficulty
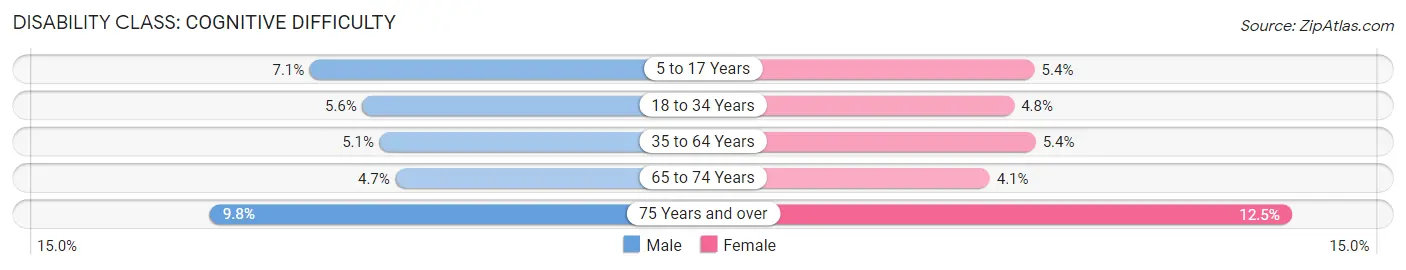
| Age Bracket | Male | Female |
| 5 to 17 Years | 4,034 (7.0%) | 2,952 (5.4%) |
| 18 to 34 Years | 4,888 (5.6%) | 4,259 (4.8%) |
| 35 to 64 Years | 9,428 (5.1%) | 10,575 (5.4%) |
| 65 to 74 Years | 2,822 (4.7%) | 2,849 (4.1%) |
| 75 Years and over | 4,501 (9.8%) | 7,715 (12.5%) |
Disability Class: Ambulatory Difficulty
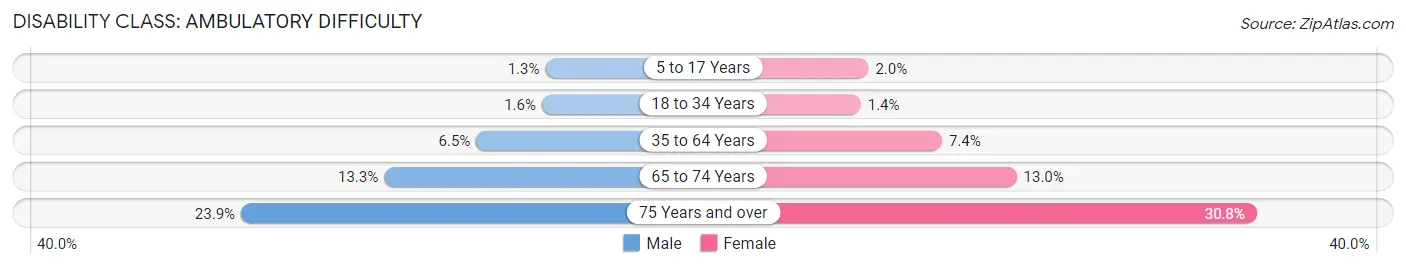
| Age Bracket | Male | Female |
| 5 to 17 Years | 766 (1.3%) | 1,086 (2.0%) |
| 18 to 34 Years | 1,396 (1.6%) | 1,254 (1.4%) |
| 35 to 64 Years | 11,945 (6.5%) | 14,573 (7.4%) |
| 65 to 74 Years | 8,047 (13.3%) | 8,972 (13.0%) |
| 75 Years and over | 10,954 (23.9%) | 18,989 (30.8%) |
Disability Class: Self-Care Difficulty
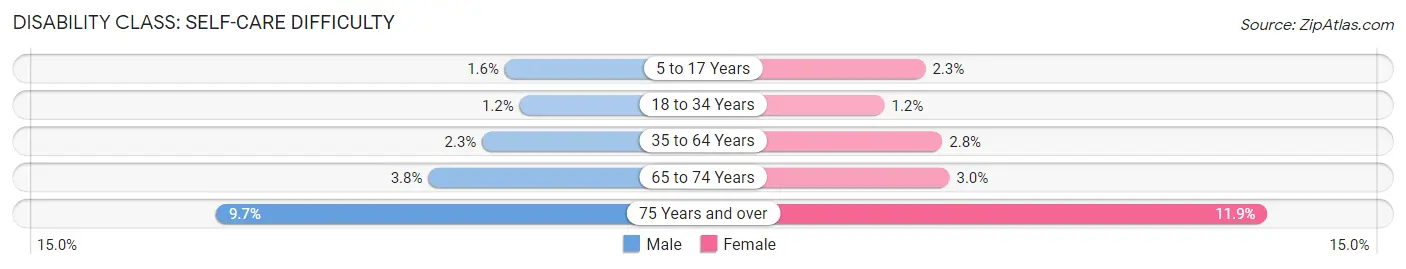
| Age Bracket | Male | Female |
| 5 to 17 Years | 934 (1.6%) | 1,278 (2.3%) |
| 18 to 34 Years | 1,063 (1.2%) | 1,057 (1.2%) |
| 35 to 64 Years | 4,176 (2.3%) | 5,493 (2.8%) |
| 65 to 74 Years | 2,275 (3.8%) | 2,074 (3.0%) |
| 75 Years and over | 4,422 (9.7%) | 7,302 (11.8%) |
Technology Access in Pinellas County
Computing Device Access in Pinellas County
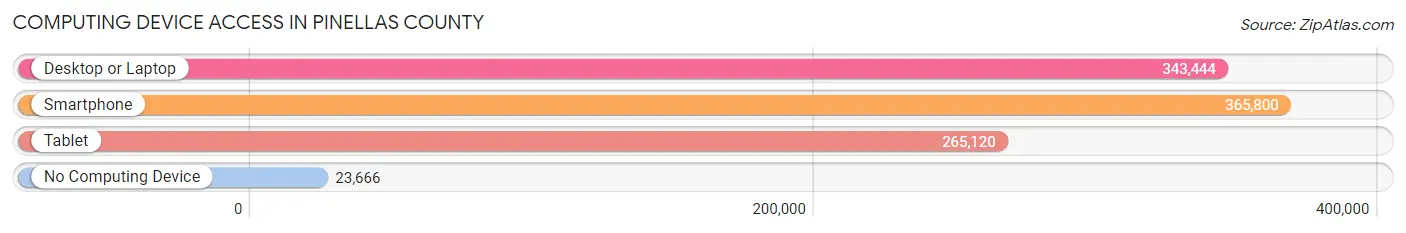
| Device Type | # Households | % Households |
| Desktop or Laptop | 343,444 | 82.0% |
| Smartphone | 365,800 | 87.4% |
| Tablet | 265,120 | 63.3% |
| No Computing Device | 23,666 | 5.7% |
| Total | 418,716 | 100.0% |
Internet Access in Pinellas County
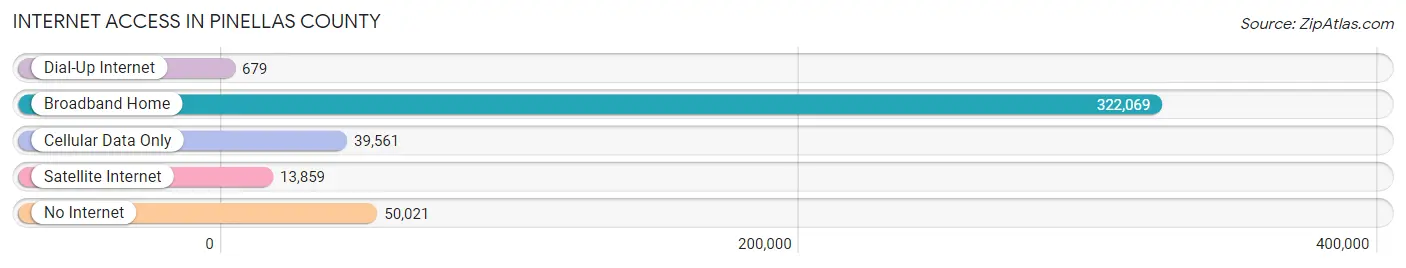
| Internet Type | # Households | % Households |
| Dial-Up Internet | 679 | 0.2% |
| Broadband Home | 322,069 | 76.9% |
| Cellular Data Only | 39,561 | 9.5% |
| Satellite Internet | 13,859 | 3.3% |
| No Internet | 50,021 | 11.9% |
| Total | 418,716 | 100.0% |
Pinellas County Summary
Pinellas County is located in the Tampa Bay area of Florida and is the most densely populated county in the state. It is bordered by Hillsborough County to the north, Manatee County to the east, Sarasota County to the south, and the Gulf of Mexico to the west. The county seat is Clearwater, and the largest city is St. Petersburg. The county was created in 1912 and is named for the Spanish Punta Piñal, which means “point of pines.”
Geography
Pinellas County covers an area of 608 square miles and is located on the west coast of Florida. It is part of the Tampa Bay area and is bordered by the Gulf of Mexico to the west, Hillsborough County to the north, Manatee County to the east, and Sarasota County to the south. The county is divided into 24 municipalities, including the cities of Clearwater, Dunedin, Gulfport, Indian Rocks Beach, Largo, Madeira Beach, Oldsmar, Pinellas Park, Safety Harbor, Seminole, South Pasadena, St. Pete Beach, St. Petersburg, Tarpon Springs, and Treasure Island. The county also includes several unincorporated areas, such as Belleair, Belleair Beach, Belleair Bluffs, Belleair Shore, Indian Shores, Kenneth City, North Redington Beach, Redington Beach, Redington Shores, and Tierra Verde.
The terrain of Pinellas County is mostly flat, with some rolling hills in the northern part of the county. The highest point in the county is located in the northern part of the county, near the Hillsborough County line, and is just over 100 feet above sea level. The county is home to several bodies of water, including Tampa Bay, Boca Ciega Bay, Old Tampa Bay, and the Gulf of Mexico.
History
Pinellas County was created in 1912 from parts of Hillsborough and Manatee counties. The county was named for the Spanish Punta Piñal, which means “point of pines.” The county seat is Clearwater, and the largest city is St. Petersburg.
The area was first inhabited by the Tocobaga people, who were later displaced by the Seminole people. The first European settlers arrived in the area in the late 1700s, and the county was officially established in 1845. The area was largely rural until the late 1800s, when the railroad arrived and the cities of Clearwater and St. Petersburg were founded.
The county experienced rapid growth in the early 1900s, and by the 1950s, it was one of the most populous counties in the state. The county continued to grow throughout the 20th century, and today it is one of the most populous counties in the United States.
Economy
Pinellas County has a diverse economy that is driven by tourism, healthcare, manufacturing, and technology. The county is home to several major employers, including Raymond James Financial, Jabil Circuit, and Tech Data Corporation. The county is also home to several major tourist attractions, including Busch Gardens, Clearwater Beach, and the Salvador Dali Museum.
The county’s economy is also supported by its port, which is the largest port in the state. The port is home to several major shipping companies, including Maersk Line, CMA CGM, and Hapag-Lloyd. The port also serves as a major hub for cruise ships, and it is the second-busiest cruise port in the world.
Demographics
As of the 2020 census, Pinellas County had a population of 990,948. The population is estimated to have grown to 1,011,845 by 2021. The population is racially and ethnically diverse, with the largest racial group being White (68.3%), followed by Black or African American (17.2%), Hispanic or Latino (11.2%), and Asian (3.2%).
The median household income in the county is $54,845, and the median home value is $223,400. The poverty rate is 11.2%, and the unemployment rate is 4.2%.
Conclusion
Pinellas County is located in the Tampa Bay area of Florida and is the most densely populated county in the state. It is bordered by Hillsborough County to the north, Manatee County to the east, Sarasota County to the south, and the Gulf of Mexico to the west. The county was created in 1912 and is named for the Spanish Punta Piñal, which means “point of pines.” The county has a diverse economy that is driven by tourism, healthcare, manufacturing, and technology. The population is racially and ethnically diverse, with the largest racial group being White (68.3%), followed by Black or African American (17.2%), Hispanic or Latino (11.2%), and Asian (3.2%). The median household income in the county is $54,845, and the median home value is $223,400. The poverty rate is 11.2%, and the unemployment rate is 4.2%.
Common Questions
What is Per Capita Income in Pinellas County?
Per Capita income in Pinellas County is $44,020.
What is the Median Family Income in Pinellas County?
Median Family Income in Pinellas County is $89,479.
What is the Median Household income in Pinellas County?
Median Household Income in Pinellas County is $66,406.
What is Income or Wage Gap in Pinellas County?
Income or Wage Gap in Pinellas County is 17.2%.
Women in Pinellas County earn 82.8 cents for every dollar earned by a man.
What is Family Income Deficit in Pinellas County?
Family Income Deficit in Pinellas County is $10,369.
Families that are below poverty line in Pinellas County earn $10,369 less on average than the poverty threshold level.
What is Inequality or Gini Index in Pinellas County?
Inequality or Gini Index in Pinellas County is 0.49.
What is the Total Population of Pinellas County?
Total Population of Pinellas County is 959,918.
What is the Total Male Population of Pinellas County?
Total Male Population of Pinellas County is 464,021.
What is the Total Female Population of Pinellas County?
Total Female Population of Pinellas County is 495,897.
What is the Ratio of Males per 100 Females in Pinellas County?
There are 93.57 Males per 100 Females in Pinellas County.
What is the Ratio of Females per 100 Males in Pinellas County?
There are 106.87 Females per 100 Males in Pinellas County.
What is the Median Population Age in Pinellas County?
Median Population Age in Pinellas County is 48.8 Years.
What is the Average Family Size in Pinellas County
Average Family Size in Pinellas County is 2.9 People.
What is the Average Household Size in Pinellas County
Average Household Size in Pinellas County is 2.2 People.
How Large is the Labor Force in Pinellas County?
There are 485,244 People in the Labor Forcein in Pinellas County.
What is the Percentage of People in the Labor Force in Pinellas County?
58.7% of People are in the Labor Force in Pinellas County.
What is the Unemployment Rate in Pinellas County?
Unemployment Rate in Pinellas County is 4.6%.