Seminole County, FL Map & Demographics
Seminole County Map
Seminole County Overview
$42,281
PER CAPITA INCOME
$96,839
AVG FAMILY INCOME
$79,490
AVG HOUSEHOLD INCOME
20.2%
WAGE / INCOME GAP [ % ]
79.8¢/ $1
WAGE / INCOME GAP [ $ ]
$10,122
FAMILY INCOME DEFICIT
0.45
INEQUALITY / GINI INDEX
471,321
TOTAL POPULATION
229,821
MALE POPULATION
241,500
FEMALE POPULATION
95.16
MALES / 100 FEMALES
105.08
FEMALES / 100 MALES
39.6
MEDIAN AGE
3.1
AVG FAMILY SIZE
2.5
AVG HOUSEHOLD SIZE
259,654
LABOR FORCE [ PEOPLE ]
67.3%
PERCENT IN LABOR FORCE
4.3%
UNEMPLOYMENT RATE
Income in Seminole County
Income Overview in Seminole County
Per Capita Income in Seminole County is $42,281, while median incomes of families and households are $96,839 and $79,490 respectively.
| Characteristic | Number | Measure |
| Per Capita Income | 471,321 | $42,281 |
| Median Family Income | 122,349 | $96,839 |
| Mean Family Income | 122,349 | $124,569 |
| Median Household Income | 183,487 | $79,490 |
| Mean Household Income | 183,487 | $106,626 |
| Income Deficit | 122,349 | $10,122 |
| Wage / Income Gap (%) | 471,321 | 20.18% |
| Wage / Income Gap ($) | 471,321 | 79.82¢ per $1 |
| Gini / Inequality Index | 471,321 | 0.45 |
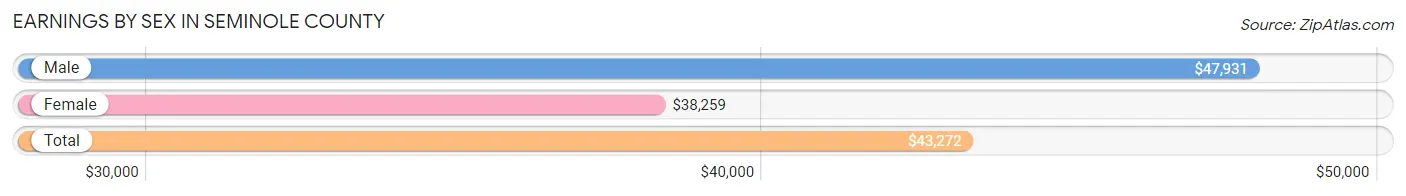
Earnings by Sex in Seminole County
Average Earnings in Seminole County are $43,272, $47,931 for men and $38,259 for women, a difference of 20.2%.
| Sex | Number | Average Earnings |
| Male | 139,297 (52.7%) | $47,931 |
| Female | 124,822 (47.3%) | $38,259 |
| Total | 264,119 (100.0%) | $43,272 |
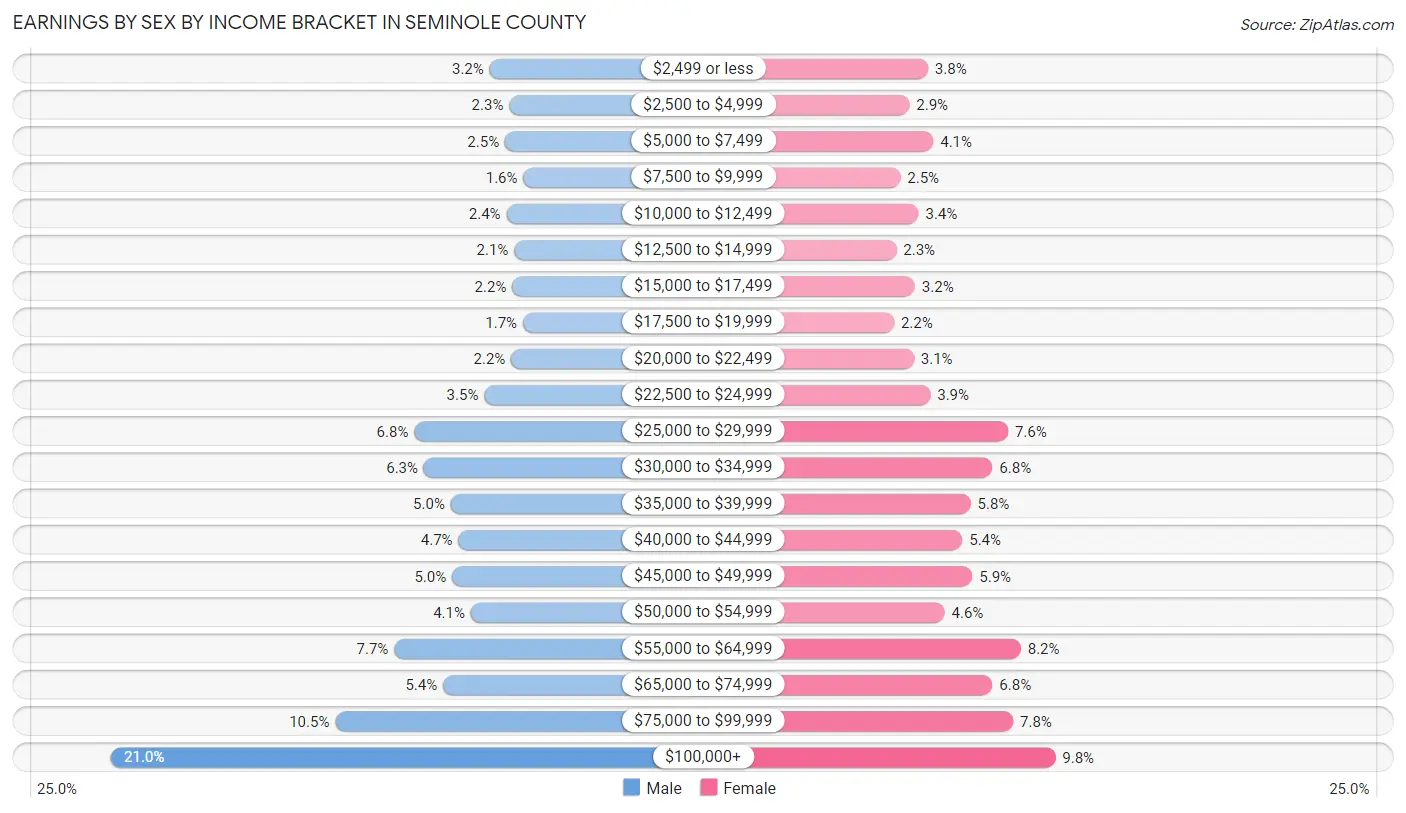
Earnings by Sex by Income Bracket in Seminole County
The most common earnings brackets in Seminole County are $100,000+ for men (29,177 | 20.9%) and $100,000+ for women (12,190 | 9.8%).
| Income | Male | Female |
| $2,499 or less | 4,487 (3.2%) | 4,749 (3.8%) |
| $2,500 to $4,999 | 3,205 (2.3%) | 3,662 (2.9%) |
| $5,000 to $7,499 | 3,484 (2.5%) | 5,056 (4.1%) |
| $7,500 to $9,999 | 2,283 (1.6%) | 3,129 (2.5%) |
| $10,000 to $12,499 | 3,388 (2.4%) | 4,191 (3.4%) |
| $12,500 to $14,999 | 2,884 (2.1%) | 2,896 (2.3%) |
| $15,000 to $17,499 | 3,003 (2.2%) | 3,984 (3.2%) |
| $17,500 to $19,999 | 2,319 (1.7%) | 2,753 (2.2%) |
| $20,000 to $22,499 | 3,072 (2.2%) | 3,925 (3.1%) |
| $22,500 to $24,999 | 4,829 (3.5%) | 4,876 (3.9%) |
| $25,000 to $29,999 | 9,396 (6.8%) | 9,428 (7.5%) |
| $30,000 to $34,999 | 8,777 (6.3%) | 8,514 (6.8%) |
| $35,000 to $39,999 | 7,016 (5.0%) | 7,242 (5.8%) |
| $40,000 to $44,999 | 6,524 (4.7%) | 6,752 (5.4%) |
| $45,000 to $49,999 | 6,943 (5.0%) | 7,344 (5.9%) |
| $50,000 to $54,999 | 5,718 (4.1%) | 5,711 (4.6%) |
| $55,000 to $64,999 | 10,714 (7.7%) | 10,175 (8.2%) |
| $65,000 to $74,999 | 7,521 (5.4%) | 8,518 (6.8%) |
| $75,000 to $99,999 | 14,557 (10.4%) | 9,727 (7.8%) |
| $100,000+ | 29,177 (20.9%) | 12,190 (9.8%) |
| Total | 139,297 (100.0%) | 124,822 (100.0%) |
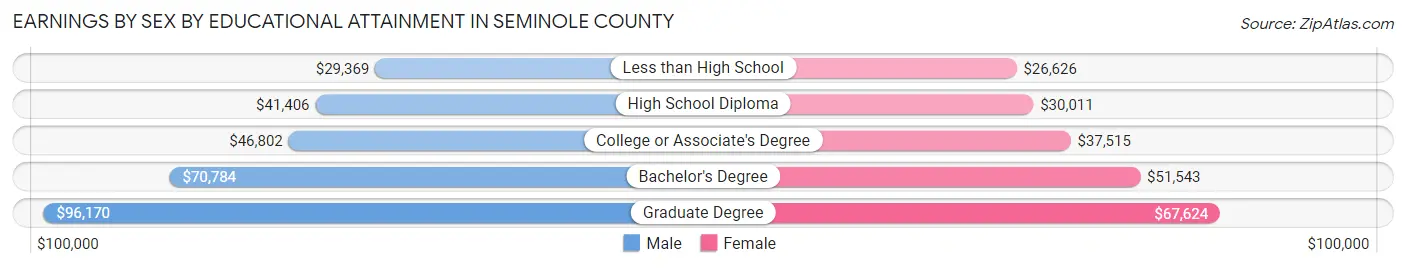
Earnings by Sex by Educational Attainment in Seminole County
Average earnings in Seminole County are $54,635 for men and $43,496 for women, a difference of 20.4%. Men with an educational attainment of graduate degree enjoy the highest average annual earnings of $96,170, while those with less than high school education earn the least with $29,369. Women with an educational attainment of graduate degree earn the most with the average annual earnings of $67,624, while those with less than high school education have the smallest earnings of $26,626.
| Educational Attainment | Male Income | Female Income |
| Less than High School | $29,369 | $26,626 |
| High School Diploma | $41,406 | $30,011 |
| College or Associate's Degree | $46,802 | $37,515 |
| Bachelor's Degree | $70,784 | $51,543 |
| Graduate Degree | $96,170 | $67,624 |
| Total | $54,635 | $43,496 |
Family Income in Seminole County
Family Income Brackets in Seminole County
According to the Seminole County family income data, there are 26,794 families falling into the $100,000 to $149,999 income range, which is the most common income bracket and makes up 21.9% of all families. Conversely, the $10,000 to $14,999 income bracket is the least frequent group with only 1,468 families (1.2%) belonging to this category.
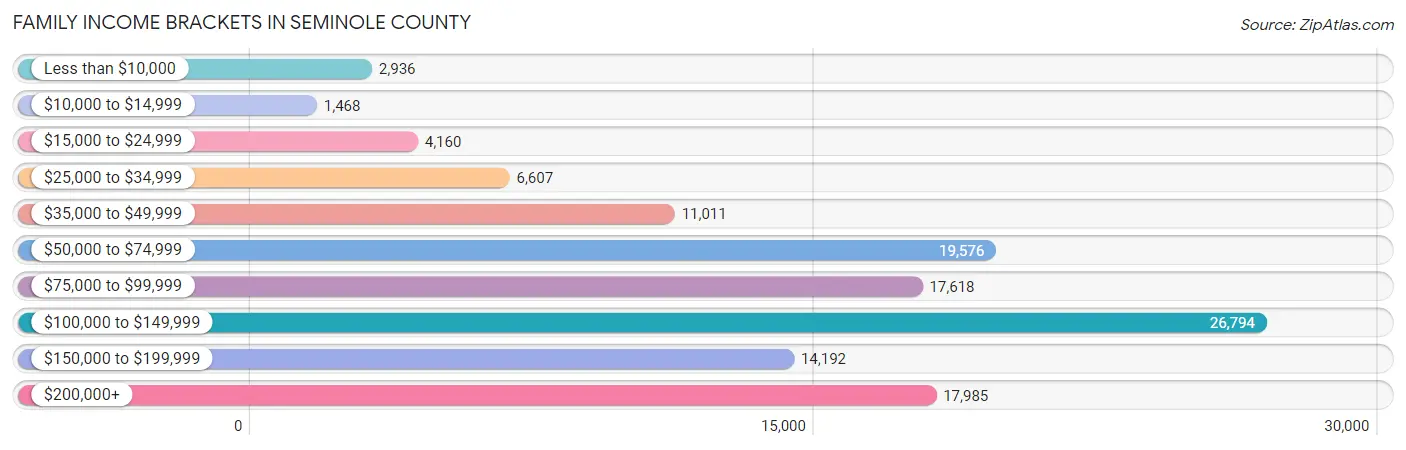
| Income Bracket | # Families | % Families |
| Less than $10,000 | 2,936 | 2.4% |
| $10,000 to $14,999 | 1,468 | 1.2% |
| $15,000 to $24,999 | 4,160 | 3.4% |
| $25,000 to $34,999 | 6,607 | 5.4% |
| $35,000 to $49,999 | 11,011 | 9.0% |
| $50,000 to $74,999 | 19,576 | 16.0% |
| $75,000 to $99,999 | 17,618 | 14.4% |
| $100,000 to $149,999 | 26,794 | 21.9% |
| $150,000 to $199,999 | 14,192 | 11.6% |
| $200,000+ | 17,985 | 14.7% |
Family Income by Famaliy Size in Seminole County
7+ person families (1,273 | 1.0%) account for the highest median family income in Seminole County with $129,658 per family, while 2-person families (55,725 | 45.6%) have the highest median income of $41,164 per family member.
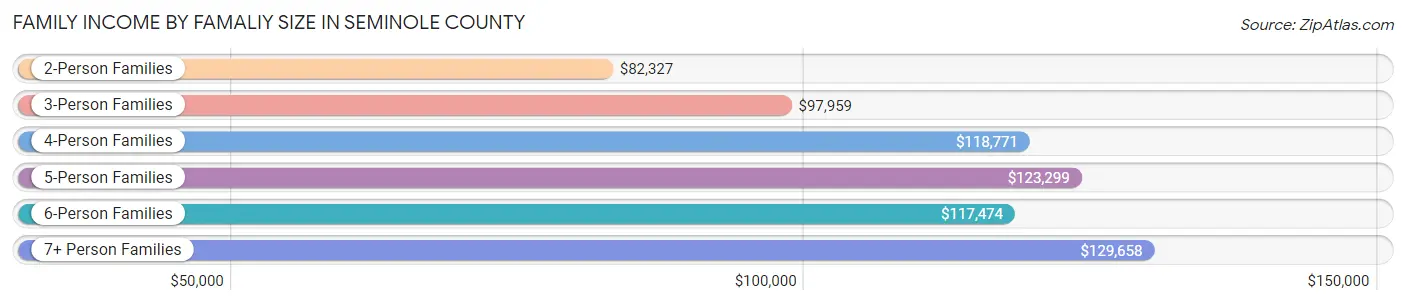
| Income Bracket | # Families | Median Income |
| 2-Person Families | 55,725 (45.6%) | $82,327 |
| 3-Person Families | 28,215 (23.1%) | $97,959 |
| 4-Person Families | 24,562 (20.1%) | $118,771 |
| 5-Person Families | 9,806 (8.0%) | $123,299 |
| 6-Person Families | 2,768 (2.3%) | $117,474 |
| 7+ Person Families | 1,273 (1.0%) | $129,658 |
| Total | 122,349 (100.0%) | $96,839 |
Family Income by Number of Earners in Seminole County
The median family income in Seminole County is $96,839, with families comprising 3+ earners (15,191) having the highest median family income of $146,052, while families with no earners (14,846) have the lowest median family income of $51,468, accounting for 12.4% and 12.1% of families, respectively.
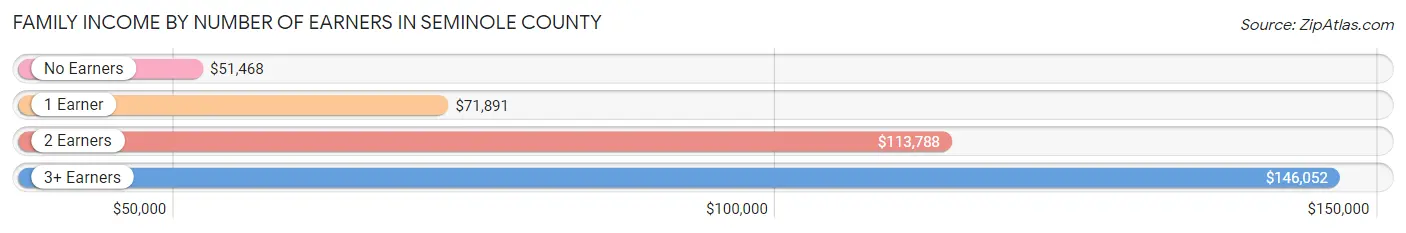
| Number of Earners | # Families | Median Income |
| No Earners | 14,846 (12.1%) | $51,468 |
| 1 Earner | 39,267 (32.1%) | $71,891 |
| 2 Earners | 53,045 (43.4%) | $113,788 |
| 3+ Earners | 15,191 (12.4%) | $146,052 |
| Total | 122,349 (100.0%) | $96,839 |
Household Income in Seminole County
Household Income Brackets in Seminole County
With 33,762 households falling in the category, the $100,000 to $149,999 income range is the most frequent in Seminole County, accounting for 18.4% of all households. In contrast, only 4,037 households (2.2%) fall into the $10,000 to $14,999 income bracket, making it the least populous group.
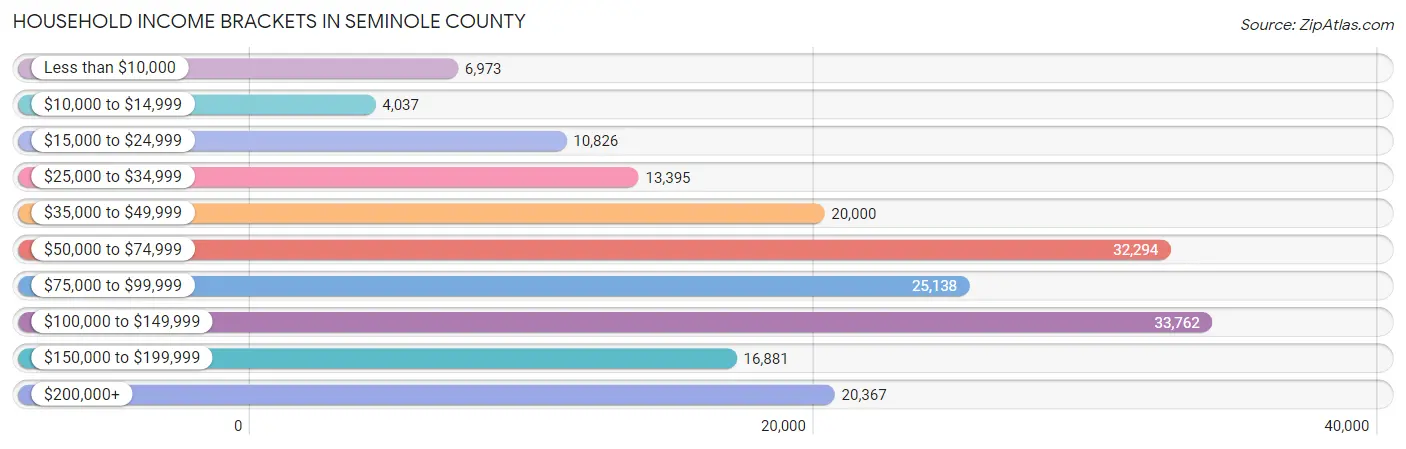
| Income Bracket | # Households | % Households |
| Less than $10,000 | 6,973 | 3.8% |
| $10,000 to $14,999 | 4,037 | 2.2% |
| $15,000 to $24,999 | 10,826 | 5.9% |
| $25,000 to $34,999 | 13,395 | 7.3% |
| $35,000 to $49,999 | 20,000 | 10.9% |
| $50,000 to $74,999 | 32,294 | 17.6% |
| $75,000 to $99,999 | 25,138 | 13.7% |
| $100,000 to $149,999 | 33,762 | 18.4% |
| $150,000 to $199,999 | 16,881 | 9.2% |
| $200,000+ | 20,367 | 11.1% |
Household Income by Householder Age in Seminole County
The median household income in Seminole County is $79,490, with the highest median household income of $95,576 found in the 45 to 64 years age bracket for the primary householder. A total of 70,316 households (38.3%) fall into this category. Meanwhile, the 15 to 24 years age bracket for the primary householder has the lowest median household income of $43,939, with 6,417 households (3.5%) in this group.
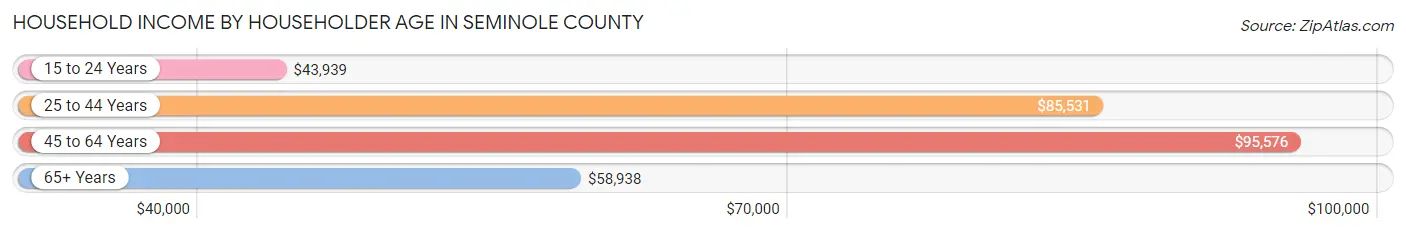
| Income Bracket | # Households | Median Income |
| 15 to 24 Years | 6,417 (3.5%) | $43,939 |
| 25 to 44 Years | 62,667 (34.2%) | $85,531 |
| 45 to 64 Years | 70,316 (38.3%) | $95,576 |
| 65+ Years | 44,087 (24.0%) | $58,938 |
| Total | 183,487 (100.0%) | $79,490 |
Poverty in Seminole County
Income Below Poverty by Sex and Age in Seminole County
With 8.8% poverty level for males and 10.4% for females among the residents of Seminole County, 18 to 24 year old males and 18 to 24 year old females are the most vulnerable to poverty, with 4,037 males (20.5%) and 3,962 females (20.7%) in their respective age groups living below the poverty level.
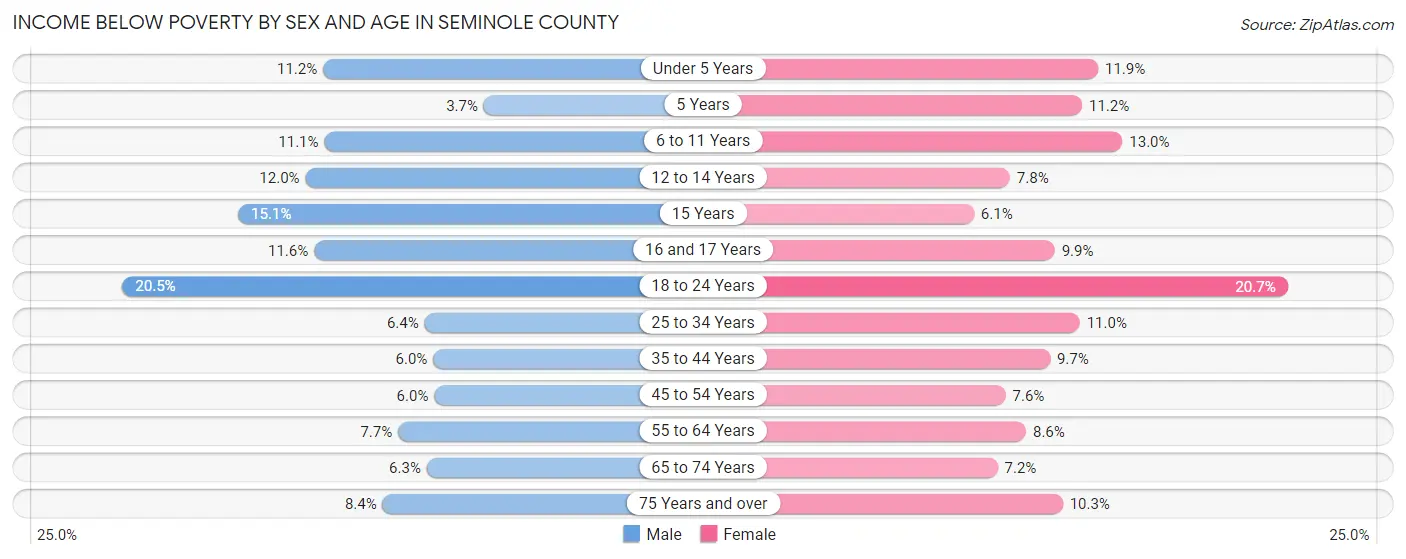
| Age Bracket | Male | Female |
| Under 5 Years | 1,338 (11.2%) | 1,340 (11.9%) |
| 5 Years | 105 (3.7%) | 289 (11.2%) |
| 6 to 11 Years | 1,822 (11.1%) | 2,177 (13.0%) |
| 12 to 14 Years | 1,063 (12.0%) | 591 (7.8%) |
| 15 Years | 451 (15.1%) | 181 (6.1%) |
| 16 and 17 Years | 710 (11.6%) | 589 (9.9%) |
| 18 to 24 Years | 4,037 (20.5%) | 3,962 (20.7%) |
| 25 to 34 Years | 2,177 (6.4%) | 3,682 (11.0%) |
| 35 to 44 Years | 2,001 (6.0%) | 3,261 (9.7%) |
| 45 to 54 Years | 1,843 (6.0%) | 2,463 (7.6%) |
| 55 to 64 Years | 2,226 (7.7%) | 2,675 (8.6%) |
| 65 to 74 Years | 1,268 (6.3%) | 1,728 (7.2%) |
| 75 Years and over | 1,025 (8.4%) | 1,792 (10.2%) |
| Total | 20,066 (8.8%) | 24,730 (10.4%) |
Income Above Poverty by Sex and Age in Seminole County
According to the poverty statistics in Seminole County, males aged 5 years and females aged 15 years are the age groups that are most secure financially, with 96.3% of males and 93.9% of females in these age groups living above the poverty line.
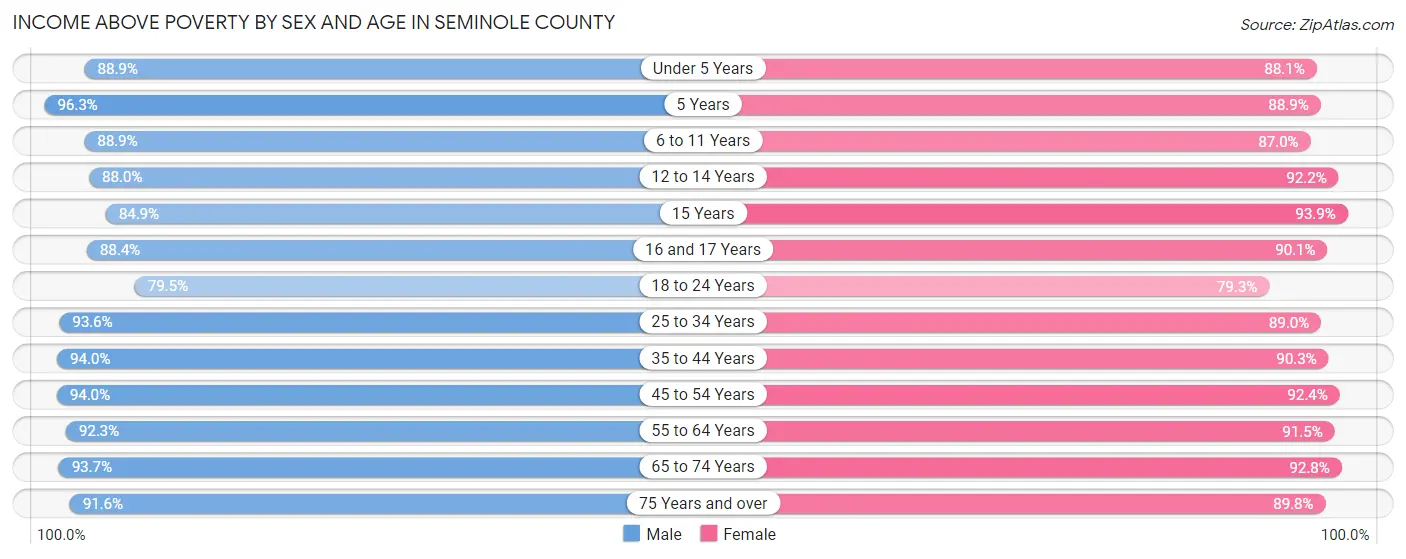
| Age Bracket | Male | Female |
| Under 5 Years | 10,663 (88.8%) | 9,933 (88.1%) |
| 5 Years | 2,744 (96.3%) | 2,302 (88.8%) |
| 6 to 11 Years | 14,612 (88.9%) | 14,538 (87.0%) |
| 12 to 14 Years | 7,819 (88.0%) | 6,986 (92.2%) |
| 15 Years | 2,538 (84.9%) | 2,772 (93.9%) |
| 16 and 17 Years | 5,429 (88.4%) | 5,371 (90.1%) |
| 18 to 24 Years | 15,694 (79.5%) | 15,192 (79.3%) |
| 25 to 34 Years | 31,633 (93.6%) | 29,659 (89.0%) |
| 35 to 44 Years | 31,149 (94.0%) | 30,501 (90.3%) |
| 45 to 54 Years | 28,939 (94.0%) | 29,965 (92.4%) |
| 55 to 64 Years | 26,793 (92.3%) | 28,625 (91.4%) |
| 65 to 74 Years | 18,747 (93.7%) | 22,156 (92.8%) |
| 75 Years and over | 11,199 (91.6%) | 15,699 (89.7%) |
| Total | 207,959 (91.2%) | 213,699 (89.6%) |
Income Below Poverty Among Married-Couple Families in Seminole County
The poverty statistics for married-couple families in Seminole County show that 3.8% or 3,380 of the total 89,610 families live below the poverty line. Families with 5 or more children have the highest poverty rate of 8.4%, comprising of 20 families. On the other hand, families with no children have the lowest poverty rate of 3.1%, which includes 1,581 families.
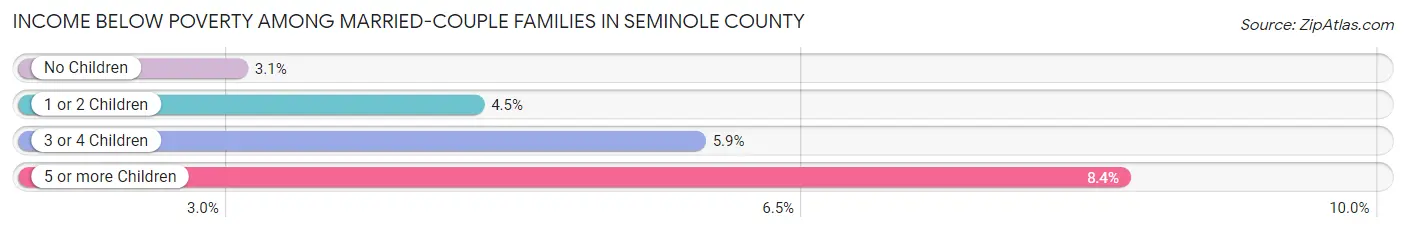
| Children | Above Poverty | Below Poverty |
| No Children | 50,155 (96.9%) | 1,581 (3.1%) |
| 1 or 2 Children | 29,968 (95.5%) | 1,413 (4.5%) |
| 3 or 4 Children | 5,890 (94.2%) | 366 (5.9%) |
| 5 or more Children | 217 (91.6%) | 20 (8.4%) |
| Total | 86,230 (96.2%) | 3,380 (3.8%) |
Income Below Poverty Among Single-Parent Households in Seminole County
According to the poverty data in Seminole County, 9.5% or 888 single-father households and 17.0% or 3,977 single-mother households are living below the poverty line. Among single-father households, those with 3 or 4 children have the highest poverty rate, with 118 households (28.4%) experiencing poverty. Likewise, among single-mother households, those with 5 or more children have the highest poverty rate, with 57 households (47.9%) falling below the poverty line.
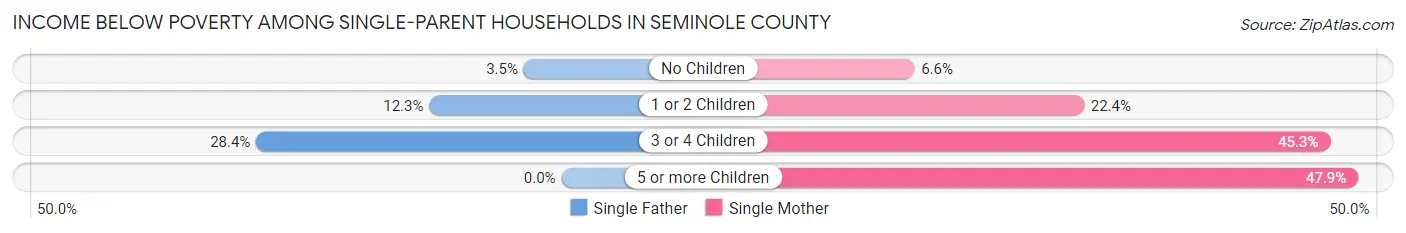
| Children | Single Father | Single Mother |
| No Children | 131 (3.5%) | 690 (6.6%) |
| 1 or 2 Children | 639 (12.3%) | 2,481 (22.4%) |
| 3 or 4 Children | 118 (28.4%) | 749 (45.3%) |
| 5 or more Children | 0 (0.0%) | 57 (47.9%) |
| Total | 888 (9.5%) | 3,977 (17.0%) |
Income Below Poverty Among Married-Couple vs Single-Parent Households in Seminole County
The poverty data for Seminole County shows that 3,380 of the married-couple family households (3.8%) and 4,865 of the single-parent households (14.9%) are living below the poverty level. Within the married-couple family households, those with 5 or more children have the highest poverty rate, with 20 households (8.4%) falling below the poverty line. Among the single-parent households, those with 3 or 4 children have the highest poverty rate, with 867 household (41.9%) living below poverty.
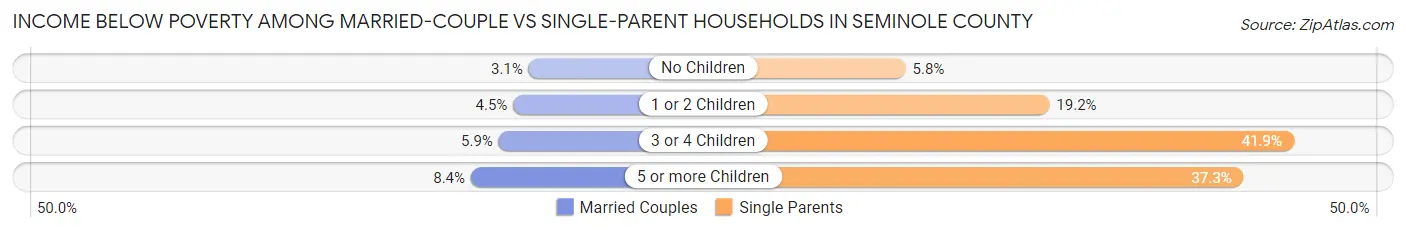
| Children | Married-Couple Families | Single-Parent Households |
| No Children | 1,581 (3.1%) | 821 (5.8%) |
| 1 or 2 Children | 1,413 (4.5%) | 3,120 (19.2%) |
| 3 or 4 Children | 366 (5.9%) | 867 (41.9%) |
| 5 or more Children | 20 (8.4%) | 57 (37.2%) |
| Total | 3,380 (3.8%) | 4,865 (14.9%) |
Race in Seminole County
The most populous races in Seminole County are White / Caucasian (311,064 | 66.0%), Hispanic or Latino (108,146 | 23.0%), and Black / African American (55,496 | 11.8%).
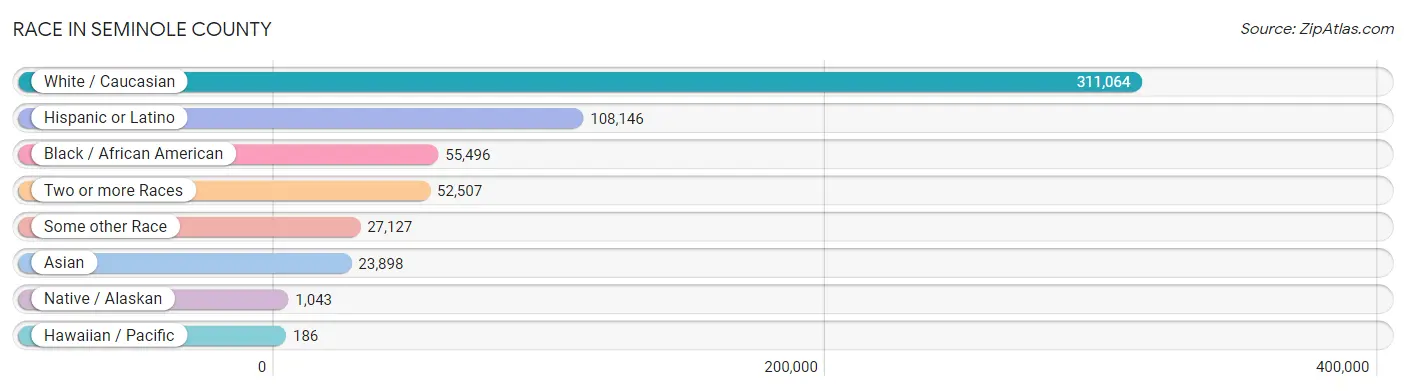
| Race | # Population | % Population |
| Asian | 23,898 | 5.1% |
| Black / African American | 55,496 | 11.8% |
| Hawaiian / Pacific | 186 | 0.0% |
| Hispanic or Latino | 108,146 | 23.0% |
| Native / Alaskan | 1,043 | 0.2% |
| White / Caucasian | 311,064 | 66.0% |
| Two or more Races | 52,507 | 11.1% |
| Some other Race | 27,127 | 5.8% |
| Total | 471,321 | 100.0% |
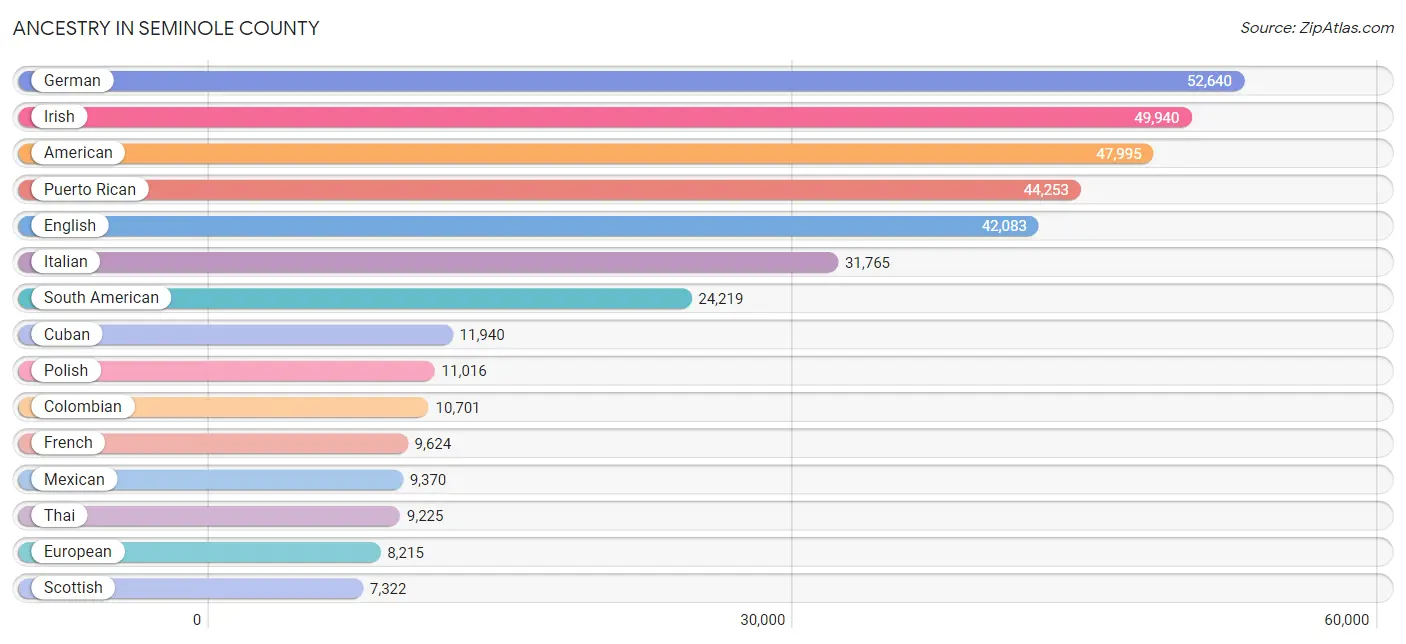
Ancestry in Seminole County
The most populous ancestries reported in Seminole County are German (52,640 | 11.2%), Irish (49,940 | 10.6%), American (47,995 | 10.2%), Puerto Rican (44,253 | 9.4%), and English (42,083 | 8.9%), together accounting for 50.3% of all Seminole County residents.
| Ancestry | # Population | % Population |
| Afghan | 29 | 0.0% |
| African | 2,260 | 0.5% |
| Alaskan Athabascan | 6 | 0.0% |
| Albanian | 346 | 0.1% |
| Alsatian | 18 | 0.0% |
| American | 47,995 | 10.2% |
| Apache | 50 | 0.0% |
| Arab | 3,986 | 0.9% |
| Argentinean | 1,012 | 0.2% |
| Armenian | 262 | 0.1% |
| Assyrian / Chaldean / Syriac | 52 | 0.0% |
| Australian | 48 | 0.0% |
| Austrian | 907 | 0.2% |
| Bahamian | 275 | 0.1% |
| Barbadian | 564 | 0.1% |
| Basque | 64 | 0.0% |
| Belgian | 185 | 0.0% |
| Belizean | 110 | 0.0% |
| Bermudan | 299 | 0.1% |
| Bhutanese | 1,080 | 0.2% |
| Blackfeet | 60 | 0.0% |
| Bolivian | 253 | 0.1% |
| Brazilian | 1,628 | 0.4% |
| British | 4,225 | 0.9% |
| British West Indian | 265 | 0.1% |
| Bulgarian | 407 | 0.1% |
| Burmese | 2,135 | 0.4% |
| Cajun | 54 | 0.0% |
| Canadian | 1,035 | 0.2% |
| Cape Verdean | 31 | 0.0% |
| Celtic | 242 | 0.1% |
| Central American | 6,337 | 1.3% |
| Central American Indian | 794 | 0.2% |
| Cherokee | 932 | 0.2% |
| Chilean | 650 | 0.1% |
| Chinese | 92 | 0.0% |
| Chippewa | 40 | 0.0% |
| Choctaw | 143 | 0.0% |
| Colombian | 10,701 | 2.3% |
| Costa Rican | 447 | 0.1% |
| Creek | 94 | 0.0% |
| Croatian | 477 | 0.1% |
| Cuban | 11,940 | 2.5% |
| Cypriot | 72 | 0.0% |
| Czech | 1,016 | 0.2% |
| Czechoslovakian | 280 | 0.1% |
| Danish | 1,489 | 0.3% |
| Dominican | 6,487 | 1.4% |
| Dutch | 3,403 | 0.7% |
| Dutch West Indian | 5 | 0.0% |
| Eastern European | 2,015 | 0.4% |
| Ecuadorian | 2,276 | 0.5% |
| Egyptian | 1,308 | 0.3% |
| English | 42,083 | 8.9% |
| Estonian | 101 | 0.0% |
| Ethiopian | 235 | 0.1% |
| European | 8,215 | 1.7% |
| Filipino | 554 | 0.1% |
| Finnish | 677 | 0.1% |
| French | 9,624 | 2.0% |
| French American Indian | 41 | 0.0% |
| French Canadian | 2,891 | 0.6% |
| German | 52,640 | 11.2% |
| German Russian | 31 | 0.0% |
| Ghanaian | 7 | 0.0% |
| Greek | 1,996 | 0.4% |
| Guamanian / Chamorro | 97 | 0.0% |
| Guatemalan | 1,280 | 0.3% |
| Guyanese | 651 | 0.1% |
| Haitian | 4,464 | 0.9% |
| Hmong | 44 | 0.0% |
| Honduran | 534 | 0.1% |
| Hungarian | 2,250 | 0.5% |
| Icelander | 42 | 0.0% |
| Indian (Asian) | 4,396 | 0.9% |
| Indonesian | 199 | 0.0% |
| Inupiat | 8 | 0.0% |
| Iranian | 879 | 0.2% |
| Iraqi | 35 | 0.0% |
| Irish | 49,940 | 10.6% |
| Iroquois | 220 | 0.1% |
| Israeli | 145 | 0.0% |
| Italian | 31,765 | 6.7% |
| Jamaican | 5,677 | 1.2% |
| Japanese | 49 | 0.0% |
| Jordanian | 49 | 0.0% |
| Kenyan | 310 | 0.1% |
| Korean | 3,919 | 0.8% |
| Laotian | 96 | 0.0% |
| Latvian | 105 | 0.0% |
| Lebanese | 1,343 | 0.3% |
| Lithuanian | 672 | 0.1% |
| Lumbee | 7 | 0.0% |
| Luxembourger | 10 | 0.0% |
| Macedonian | 9 | 0.0% |
| Malaysian | 223 | 0.1% |
| Maltese | 51 | 0.0% |
| Mexican | 9,370 | 2.0% |
| Mexican American Indian | 153 | 0.0% |
| Mongolian | 39 | 0.0% |
| Moroccan | 88 | 0.0% |
| Native Hawaiian | 266 | 0.1% |
| Navajo | 253 | 0.1% |
| Nicaraguan | 979 | 0.2% |
| Nigerian | 638 | 0.1% |
| Northern European | 637 | 0.1% |
| Norwegian | 2,907 | 0.6% |
| Pakistani | 441 | 0.1% |
| Palestinian | 463 | 0.1% |
| Panamanian | 1,405 | 0.3% |
| Paraguayan | 5 | 0.0% |
| Pennsylvania German | 83 | 0.0% |
| Peruvian | 2,865 | 0.6% |
| Polish | 11,016 | 2.3% |
| Portuguese | 2,613 | 0.5% |
| Puerto Rican | 44,253 | 9.4% |
| Romanian | 745 | 0.2% |
| Russian | 5,906 | 1.3% |
| Salvadoran | 1,607 | 0.3% |
| Scandinavian | 1,018 | 0.2% |
| Scotch-Irish | 3,693 | 0.8% |
| Scottish | 7,322 | 1.5% |
| Seminole | 73 | 0.0% |
| Serbian | 402 | 0.1% |
| Sioux | 15 | 0.0% |
| Slavic | 230 | 0.1% |
| Slovak | 847 | 0.2% |
| Slovene | 178 | 0.0% |
| South African | 105 | 0.0% |
| South American | 24,219 | 5.1% |
| South American Indian | 286 | 0.1% |
| Spaniard | 1,641 | 0.4% |
| Spanish | 1,500 | 0.3% |
| Spanish American Indian | 5 | 0.0% |
| Sri Lankan | 4,487 | 0.9% |
| Subsaharan African | 4,733 | 1.0% |
| Swedish | 3,880 | 0.8% |
| Swiss | 865 | 0.2% |
| Syrian | 91 | 0.0% |
| Thai | 9,225 | 2.0% |
| Trinidadian and Tobagonian | 1,125 | 0.2% |
| Turkish | 655 | 0.1% |
| U.S. Virgin Islander | 94 | 0.0% |
| Ukrainian | 1,175 | 0.3% |
| Uruguayan | 423 | 0.1% |
| Venezuelan | 5,952 | 1.3% |
| Vietnamese | 444 | 0.1% |
| Welsh | 2,363 | 0.5% |
| West Indian | 839 | 0.2% |
| Yugoslavian | 458 | 0.1% |
| Zimbabwean | 153 | 0.0% | View All 151 Rows |
Immigrants in Seminole County
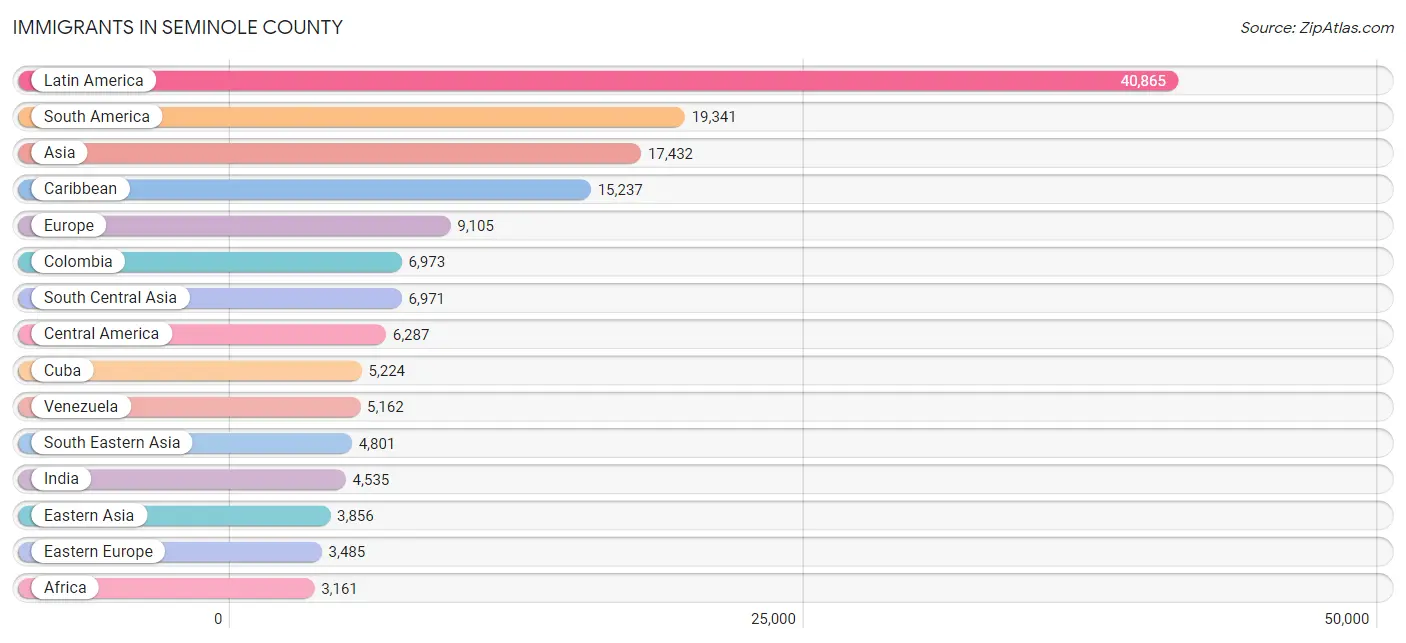
The most numerous immigrant groups reported in Seminole County came from Latin America (40,865 | 8.7%), South America (19,341 | 4.1%), Asia (17,432 | 3.7%), Caribbean (15,237 | 3.2%), and Europe (9,105 | 1.9%), together accounting for 21.6% of all Seminole County residents.
| Immigration Origin | # Population | % Population |
| Afghanistan | 29 | 0.0% |
| Africa | 3,161 | 0.7% |
| Albania | 339 | 0.1% |
| Argentina | 497 | 0.1% |
| Armenia | 85 | 0.0% |
| Asia | 17,432 | 3.7% |
| Australia | 45 | 0.0% |
| Austria | 38 | 0.0% |
| Bahamas | 251 | 0.1% |
| Bangladesh | 654 | 0.1% |
| Barbados | 270 | 0.1% |
| Belarus | 34 | 0.0% |
| Belgium | 39 | 0.0% |
| Belize | 57 | 0.0% |
| Bolivia | 44 | 0.0% |
| Bosnia and Herzegovina | 467 | 0.1% |
| Brazil | 1,395 | 0.3% |
| Bulgaria | 256 | 0.1% |
| Cambodia | 45 | 0.0% |
| Canada | 1,751 | 0.4% |
| Caribbean | 15,237 | 3.2% |
| Central America | 6,287 | 1.3% |
| Chile | 261 | 0.1% |
| China | 2,755 | 0.6% |
| Colombia | 6,973 | 1.5% |
| Costa Rica | 329 | 0.1% |
| Croatia | 136 | 0.0% |
| Cuba | 5,224 | 1.1% |
| Czechoslovakia | 198 | 0.0% |
| Denmark | 65 | 0.0% |
| Dominica | 30 | 0.0% |
| Dominican Republic | 2,644 | 0.6% |
| Eastern Africa | 1,282 | 0.3% |
| Eastern Asia | 3,856 | 0.8% |
| Eastern Europe | 3,485 | 0.7% |
| Ecuador | 1,726 | 0.4% |
| Egypt | 787 | 0.2% |
| El Salvador | 617 | 0.1% |
| England | 943 | 0.2% |
| Eritrea | 110 | 0.0% |
| Ethiopia | 8 | 0.0% |
| Europe | 9,105 | 1.9% |
| France | 149 | 0.0% |
| Germany | 1,092 | 0.2% |
| Ghana | 74 | 0.0% |
| Greece | 199 | 0.0% |
| Grenada | 117 | 0.0% |
| Guatemala | 964 | 0.2% |
| Guyana | 717 | 0.2% |
| Haiti | 2,452 | 0.5% |
| Honduras | 377 | 0.1% |
| Hong Kong | 71 | 0.0% |
| Hungary | 164 | 0.0% |
| India | 4,535 | 1.0% |
| Indonesia | 73 | 0.0% |
| Iran | 698 | 0.2% |
| Iraq | 35 | 0.0% |
| Ireland | 449 | 0.1% |
| Israel | 194 | 0.0% |
| Italy | 391 | 0.1% |
| Jamaica | 3,102 | 0.7% |
| Japan | 231 | 0.1% |
| Jordan | 180 | 0.0% |
| Kazakhstan | 91 | 0.0% |
| Kenya | 207 | 0.0% |
| Korea | 870 | 0.2% |
| Kuwait | 210 | 0.0% |
| Laos | 58 | 0.0% |
| Latin America | 40,865 | 8.7% |
| Latvia | 6 | 0.0% |
| Lebanon | 254 | 0.1% |
| Liberia | 22 | 0.0% |
| Lithuania | 22 | 0.0% |
| Malaysia | 77 | 0.0% |
| Mexico | 2,865 | 0.6% |
| Middle Africa | 48 | 0.0% |
| Moldova | 24 | 0.0% |
| Morocco | 126 | 0.0% |
| Netherlands | 102 | 0.0% |
| Nicaragua | 482 | 0.1% |
| Nigeria | 369 | 0.1% |
| Northern Africa | 939 | 0.2% |
| Northern Europe | 3,135 | 0.7% |
| Norway | 30 | 0.0% |
| Oceania | 219 | 0.1% |
| Pakistan | 761 | 0.2% |
| Panama | 596 | 0.1% |
| Peru | 2,205 | 0.5% |
| Philippines | 1,805 | 0.4% |
| Poland | 387 | 0.1% |
| Portugal | 83 | 0.0% |
| Romania | 209 | 0.0% |
| Russia | 652 | 0.1% |
| Saudi Arabia | 77 | 0.0% |
| Scotland | 149 | 0.0% |
| Serbia | 22 | 0.0% |
| Sierra Leone | 14 | 0.0% |
| Singapore | 64 | 0.0% |
| South Africa | 185 | 0.0% |
| South America | 19,341 | 4.1% |
| South Central Asia | 6,971 | 1.5% |
| South Eastern Asia | 4,801 | 1.0% |
| Southern Europe | 949 | 0.2% |
| Spain | 245 | 0.1% |
| St. Vincent and the Grenadines | 10 | 0.0% |
| Sweden | 69 | 0.0% |
| Switzerland | 75 | 0.0% |
| Syria | 28 | 0.0% |
| Taiwan | 585 | 0.1% |
| Thailand | 219 | 0.1% |
| Trinidad and Tobago | 708 | 0.2% |
| Turkey | 397 | 0.1% |
| Uganda | 61 | 0.0% |
| Ukraine | 380 | 0.1% |
| Uruguay | 288 | 0.1% |
| Uzbekistan | 76 | 0.0% |
| Venezuela | 5,162 | 1.1% |
| Vietnam | 2,386 | 0.5% |
| West Indies | 37 | 0.0% |
| Western Africa | 651 | 0.1% |
| Western Asia | 1,635 | 0.4% |
| Western Europe | 1,495 | 0.3% |
| Zaire | 48 | 0.0% |
| Zimbabwe | 167 | 0.0% | View All 124 Rows |
Sex and Age in Seminole County
Sex and Age in Seminole County
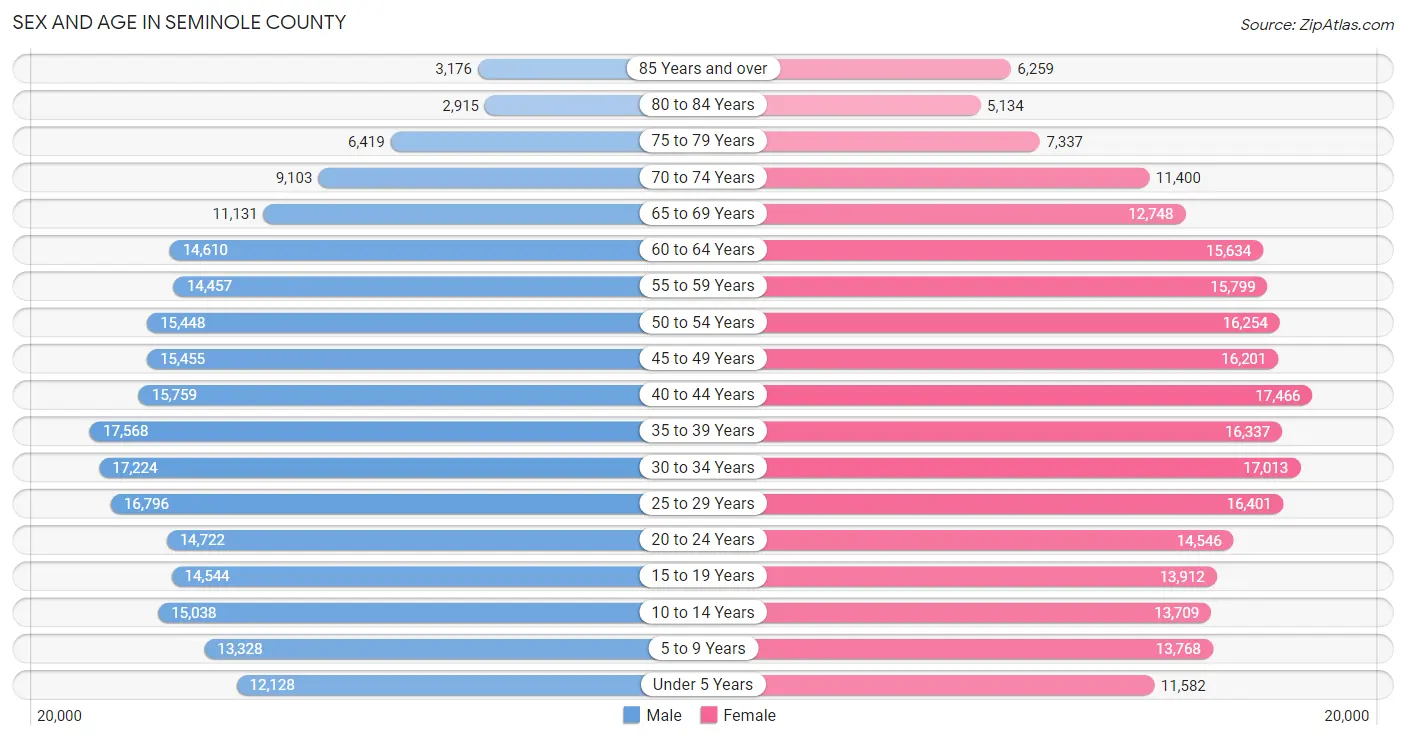
The most populous age groups in Seminole County are 35 to 39 Years (17,568 | 7.6%) for men and 40 to 44 Years (17,466 | 7.2%) for women.
| Age Bracket | Male | Female |
| Under 5 Years | 12,128 (5.3%) | 11,582 (4.8%) |
| 5 to 9 Years | 13,328 (5.8%) | 13,768 (5.7%) |
| 10 to 14 Years | 15,038 (6.5%) | 13,709 (5.7%) |
| 15 to 19 Years | 14,544 (6.3%) | 13,912 (5.8%) |
| 20 to 24 Years | 14,722 (6.4%) | 14,546 (6.0%) |
| 25 to 29 Years | 16,796 (7.3%) | 16,401 (6.8%) |
| 30 to 34 Years | 17,224 (7.5%) | 17,013 (7.0%) |
| 35 to 39 Years | 17,568 (7.6%) | 16,337 (6.8%) |
| 40 to 44 Years | 15,759 (6.9%) | 17,466 (7.2%) |
| 45 to 49 Years | 15,455 (6.7%) | 16,201 (6.7%) |
| 50 to 54 Years | 15,448 (6.7%) | 16,254 (6.7%) |
| 55 to 59 Years | 14,457 (6.3%) | 15,799 (6.5%) |
| 60 to 64 Years | 14,610 (6.4%) | 15,634 (6.5%) |
| 65 to 69 Years | 11,131 (4.8%) | 12,748 (5.3%) |
| 70 to 74 Years | 9,103 (4.0%) | 11,400 (4.7%) |
| 75 to 79 Years | 6,419 (2.8%) | 7,337 (3.0%) |
| 80 to 84 Years | 2,915 (1.3%) | 5,134 (2.1%) |
| 85 Years and over | 3,176 (1.4%) | 6,259 (2.6%) |
| Total | 229,821 (100.0%) | 241,500 (100.0%) |
Families and Households in Seminole County
Median Family Size in Seminole County
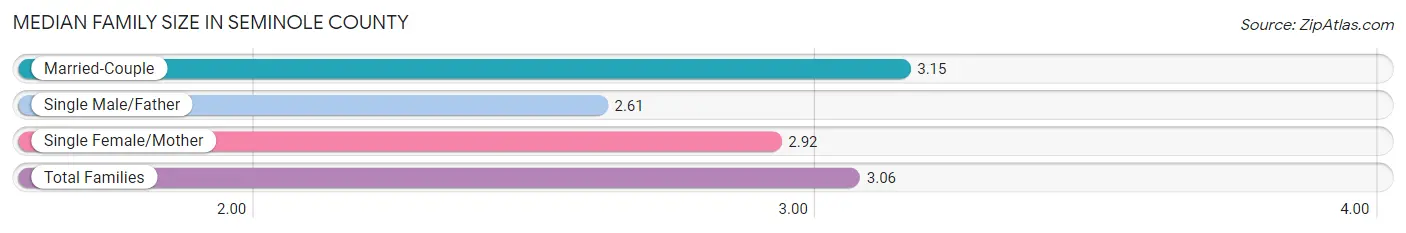
The median family size in Seminole County is 3.06 persons per family, with married-couple families (89,610 | 73.2%) accounting for the largest median family size of 3.15 persons per family. On the other hand, single male/father families (9,375 | 7.7%) represent the smallest median family size with 2.61 persons per family.
| Family Type | # Families | Family Size |
| Married-Couple | 89,610 (73.2%) | 3.15 |
| Single Male/Father | 9,375 (7.7%) | 2.61 |
| Single Female/Mother | 23,364 (19.1%) | 2.92 |
| Total Families | 122,349 (100.0%) | 3.06 |
Median Household Size in Seminole County
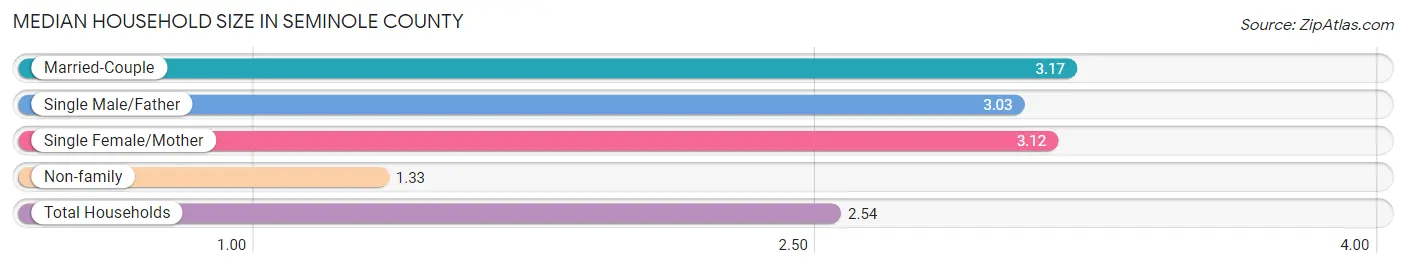
The median household size in Seminole County is 2.54 persons per household, with married-couple households (89,610 | 48.8%) accounting for the largest median household size of 3.17 persons per household. non-family households (61,138 | 33.3%) represent the smallest median household size with 1.33 persons per household.
| Household Type | # Households | Household Size |
| Married-Couple | 89,610 (48.8%) | 3.17 |
| Single Male/Father | 9,375 (5.1%) | 3.03 |
| Single Female/Mother | 23,364 (12.7%) | 3.12 |
| Non-family | 61,138 (33.3%) | 1.33 |
| Total Households | 183,487 (100.0%) | 2.54 |
Household Size by Marriage Status in Seminole County
Out of a total of 183,487 households in Seminole County, 122,349 (66.7%) are family households, while 61,138 (33.3%) are nonfamily households. The most numerous type of family households are 2-person households, comprising 51,848, and the most common type of nonfamily households are 1-person households, comprising 46,908.
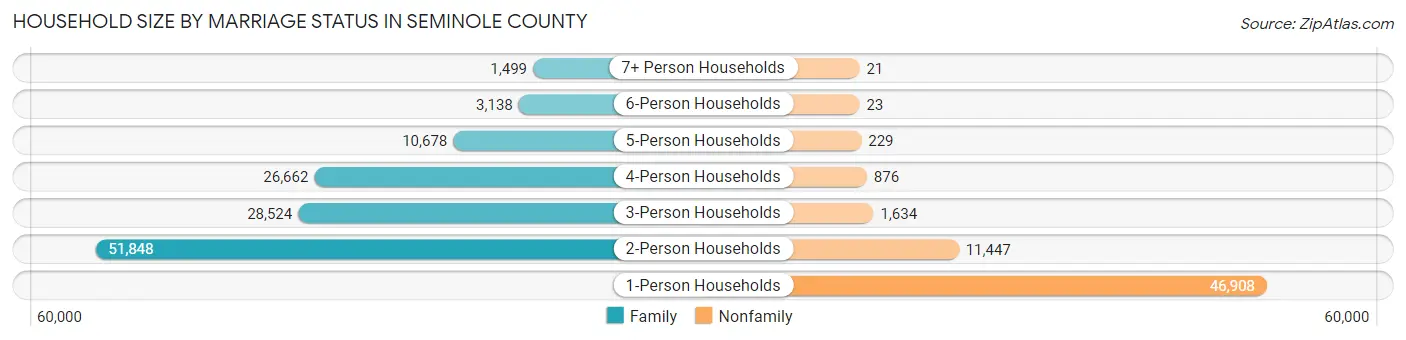
| Household Size | Family Households | Nonfamily Households |
| 1-Person Households | - | 46,908 (25.6%) |
| 2-Person Households | 51,848 (28.3%) | 11,447 (6.2%) |
| 3-Person Households | 28,524 (15.5%) | 1,634 (0.9%) |
| 4-Person Households | 26,662 (14.5%) | 876 (0.5%) |
| 5-Person Households | 10,678 (5.8%) | 229 (0.1%) |
| 6-Person Households | 3,138 (1.7%) | 23 (0.0%) |
| 7+ Person Households | 1,499 (0.8%) | 21 (0.0%) |
| Total | 122,349 (66.7%) | 61,138 (33.3%) |
Female Fertility in Seminole County
Fertility by Age in Seminole County
Average fertility rate in Seminole County is 41.0 births per 1,000 women. Women in the age bracket of 20 to 34 years have the highest fertility rate with 66.0 births per 1,000 women. Women in the age bracket of 20 to 34 years acount for 66.4% of all women with births.
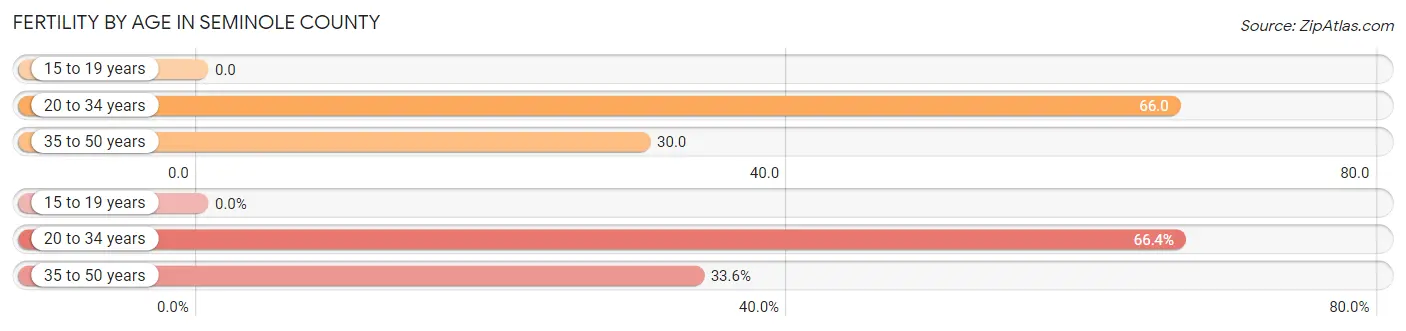
| Age Bracket | Women with Births | Births / 1,000 Women |
| 15 to 19 years | 0 (0.0%) | 0.0 |
| 20 to 34 years | 3,143 (66.4%) | 66.0 |
| 35 to 50 years | 1,593 (33.6%) | 30.0 |
| Total | 4,736 (100.0%) | 41.0 |
Fertility by Age by Marriage Status in Seminole County
80.0% of women with births (4,736) in Seminole County are married. The highest percentage of unmarried women with births falls into 35 to 50 years age bracket with 22.8% of them unmarried at the time of birth, while the lowest percentage of unmarried women with births belong to 20 to 34 years age bracket with 18.6% of them unmarried.
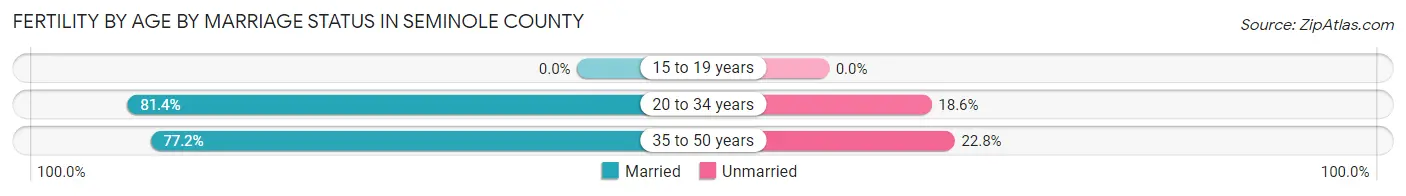
| Age Bracket | Married | Unmarried |
| 15 to 19 years | 0 (0.0%) | 0 (0.0%) |
| 20 to 34 years | 2,558 (81.4%) | 585 (18.6%) |
| 35 to 50 years | 1,230 (77.2%) | 363 (22.8%) |
| Total | 3,789 (80.0%) | 947 (20.0%) |
Fertility by Education in Seminole County
Average fertility rate in Seminole County is 41.0 births per 1,000 women. Women with the education attainment of graduate degree have the highest fertility rate of 67.0 births per 1,000 women, while women with the education attainment of less than high school have the lowest fertility at 9.0 births per 1,000 women. Women with the education attainment of college or associate's degree represent 29.7% of all women with births.
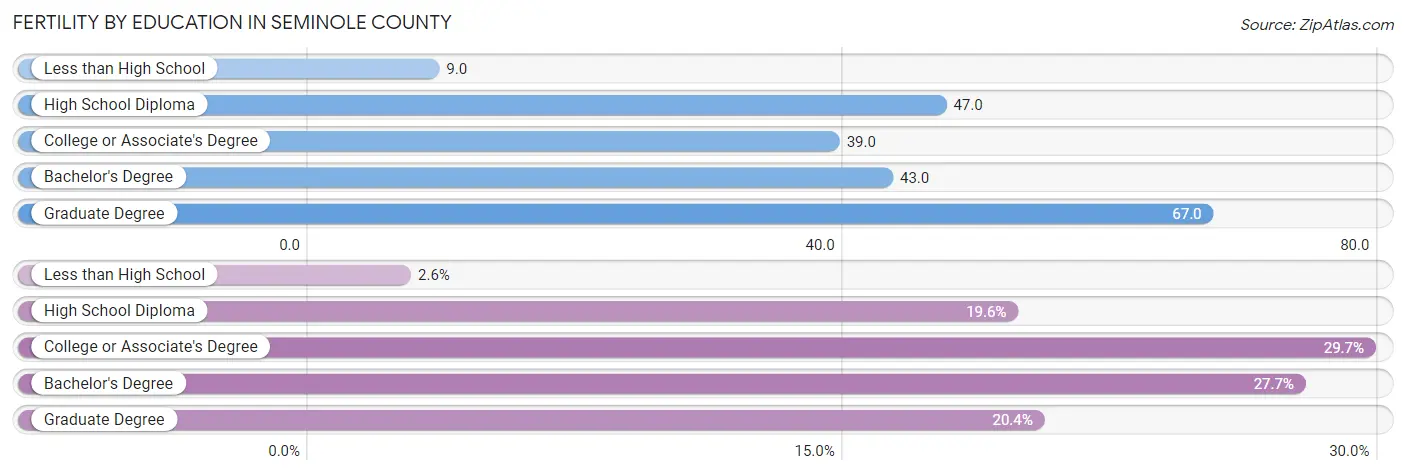
| Educational Attainment | Women with Births | Births / 1,000 Women |
| Less than High School | 122 (2.6%) | 9.0 |
| High School Diploma | 930 (19.6%) | 47.0 |
| College or Associate's Degree | 1,406 (29.7%) | 39.0 |
| Bachelor's Degree | 1,313 (27.7%) | 43.0 |
| Graduate Degree | 965 (20.4%) | 67.0 |
| Total | 4,736 (100.0%) | 41.0 |
Fertility by Education by Marriage Status in Seminole County
20.0% of women with births in Seminole County are unmarried. Women with the educational attainment of graduate degree are most likely to be married with 98.2% of them married at childbirth, while women with the educational attainment of less than high school are least likely to be married with 52.5% of them unmarried at childbirth.
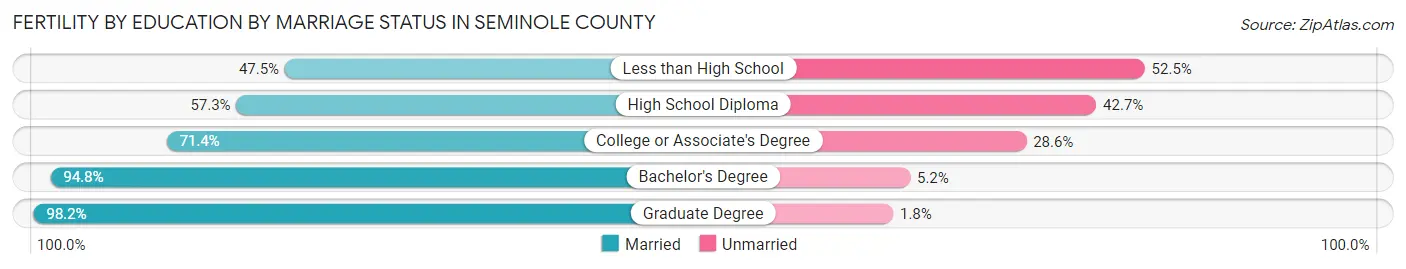
| Educational Attainment | Married | Unmarried |
| Less than High School | 58 (47.5%) | 64 (52.5%) |
| High School Diploma | 533 (57.3%) | 397 (42.7%) |
| College or Associate's Degree | 1,004 (71.4%) | 402 (28.6%) |
| Bachelor's Degree | 1,245 (94.8%) | 68 (5.2%) |
| Graduate Degree | 948 (98.2%) | 17 (1.8%) |
| Total | 3,789 (80.0%) | 947 (20.0%) |
Employment Characteristics in Seminole County
Employment by Class of Employer in Seminole County
Among the 243,840 employed individuals in Seminole County, private company employees (172,082 | 70.6%), not-for-profit organizations (19,088 | 7.8%), and local government employees (15,122 | 6.2%) make up the most common classes of employment.
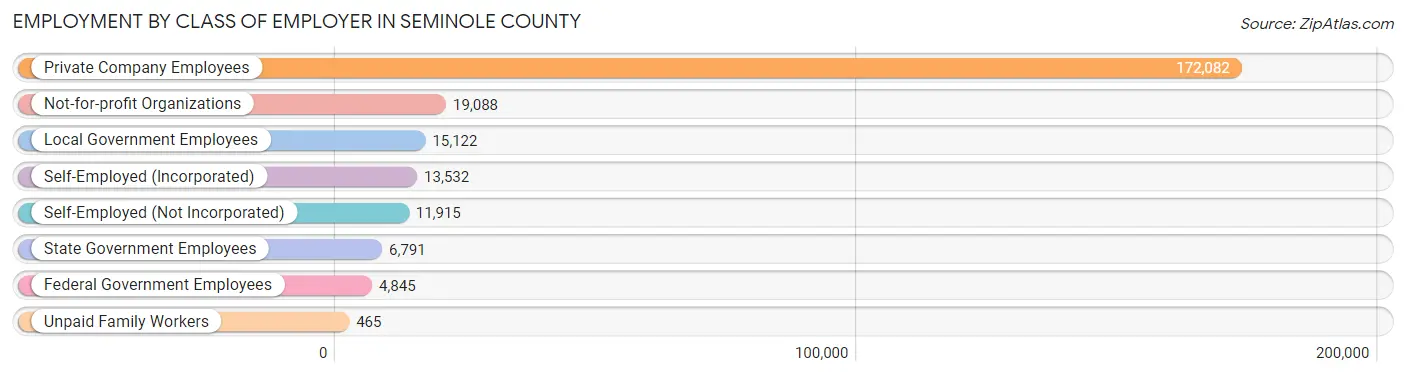
| Employer Class | # Employees | % Employees |
| Private Company Employees | 172,082 | 70.6% |
| Self-Employed (Incorporated) | 13,532 | 5.6% |
| Self-Employed (Not Incorporated) | 11,915 | 4.9% |
| Not-for-profit Organizations | 19,088 | 7.8% |
| Local Government Employees | 15,122 | 6.2% |
| State Government Employees | 6,791 | 2.8% |
| Federal Government Employees | 4,845 | 2.0% |
| Unpaid Family Workers | 465 | 0.2% |
| Total | 243,840 | 100.0% |
Employment Status by Age in Seminole County
According to the labor force statistics for Seminole County, out of the total population over 16 years of age (385,816), 67.3% or 259,654 individuals are in the labor force, with 4.3% or 11,165 of them unemployed. The age group with the highest labor force participation rate is 25 to 29 years, with 87.7% or 29,114 individuals in the labor force. Within the labor force, the 16 to 19 years age range has the highest percentage of unemployed individuals, with 13.5% or 1,112 of them being unemployed.
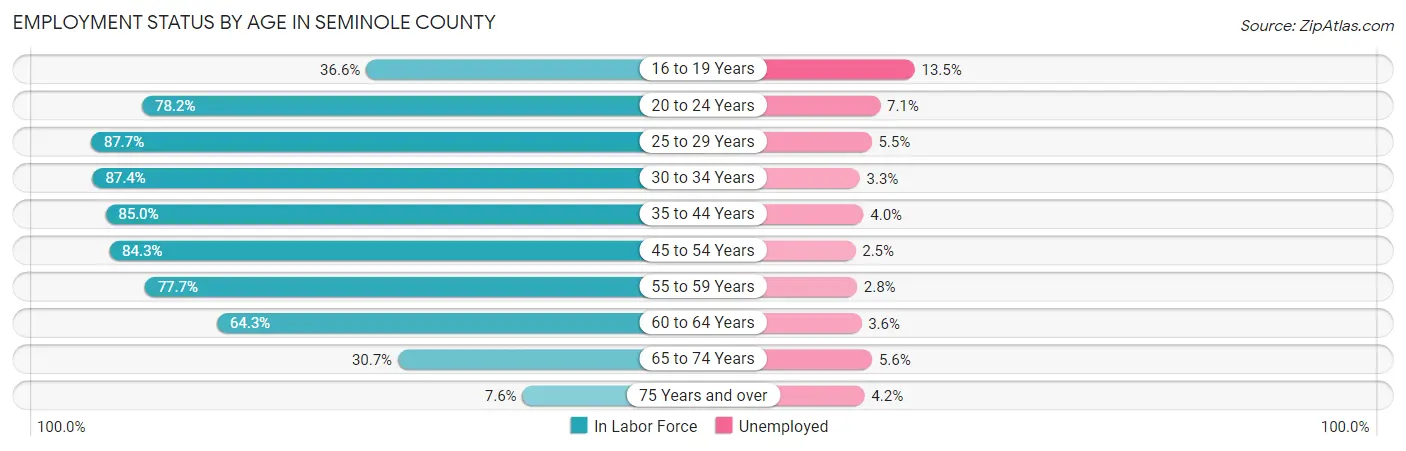
| Age Bracket | In Labor Force | Unemployed |
| 16 to 19 Years | 8,236 (36.6%) | 1,112 (13.5%) |
| 20 to 24 Years | 22,888 (78.2%) | 1,625 (7.1%) |
| 25 to 29 Years | 29,114 (87.7%) | 1,601 (5.5%) |
| 30 to 34 Years | 29,923 (87.4%) | 987 (3.3%) |
| 35 to 44 Years | 57,060 (85.0%) | 2,282 (4.0%) |
| 45 to 54 Years | 53,411 (84.3%) | 1,335 (2.5%) |
| 55 to 59 Years | 23,509 (77.7%) | 658 (2.8%) |
| 60 to 64 Years | 19,447 (64.3%) | 700 (3.6%) |
| 65 to 74 Years | 13,625 (30.7%) | 763 (5.6%) |
| 75 Years and over | 2,374 (7.6%) | 100 (4.2%) |
| Total | 259,654 (67.3%) | 11,165 (4.3%) |
Employment Status by Educational Attainment in Seminole County
According to labor force statistics for Seminole County, 82.2% of individuals (212,423) out of the total population between 25 and 64 years of age (258,422) are in the labor force, with 3.6% or 7,647 of them being unemployed. The group with the highest labor force participation rate are those with the educational attainment of bachelor's degree or higher, with 86.1% or 97,718 individuals in the labor force. Within the labor force, individuals with less than high school education have the highest percentage of unemployment, with 9.0% or 797 of them being unemployed.
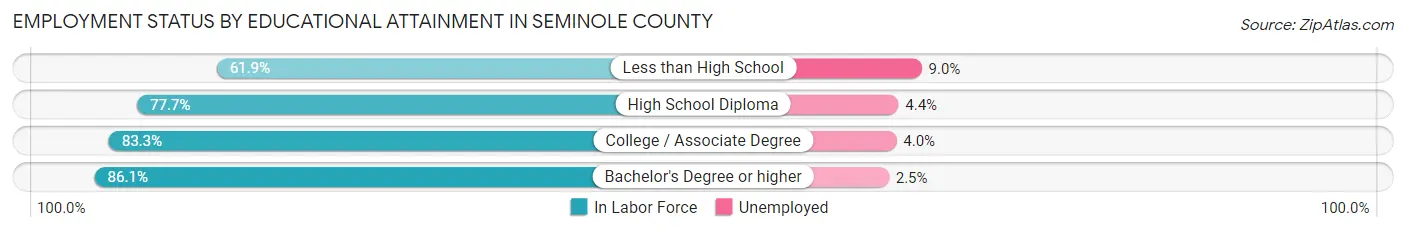
| Educational Attainment | In Labor Force | Unemployed |
| Less than High School | 8,852 (61.9%) | 1,287 (9.0%) |
| High School Diploma | 39,768 (77.7%) | 2,252 (4.4%) |
| College / Associate Degree | 66,179 (83.3%) | 3,178 (4.0%) |
| Bachelor's Degree or higher | 97,718 (86.1%) | 2,837 (2.5%) |
| Total | 212,423 (82.2%) | 9,303 (3.6%) |
Employment Occupations by Sex in Seminole County
Management, Business, Science and Arts Occupations
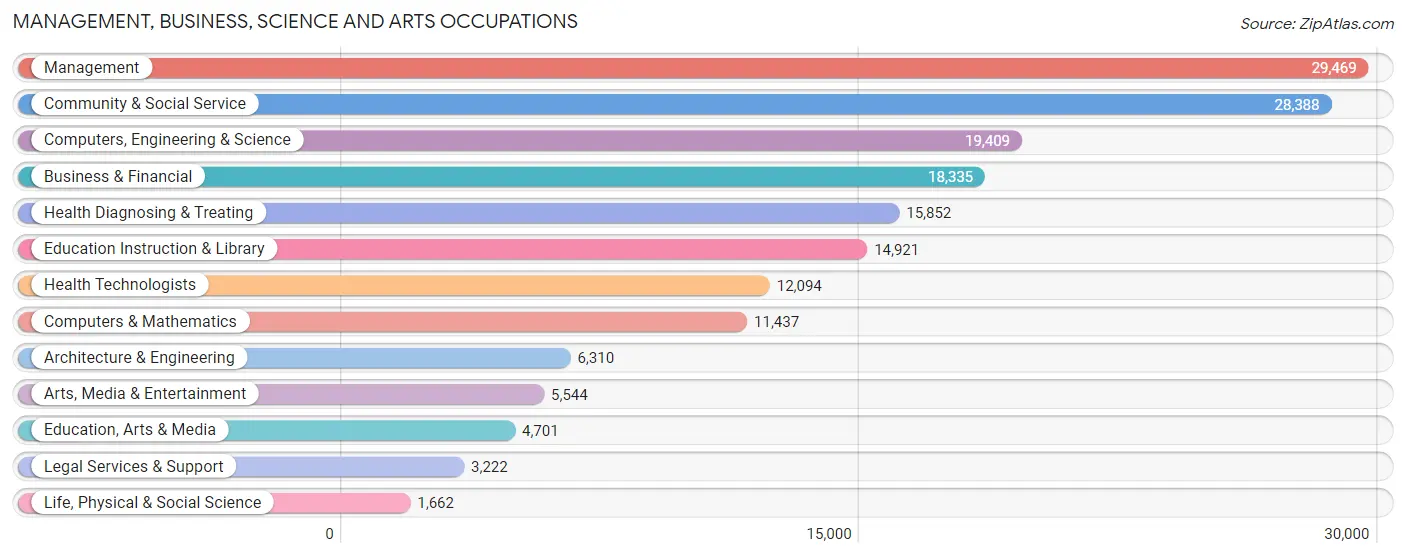
The most common Management, Business, Science and Arts occupations in Seminole County are Management (29,469 | 11.9%), Community & Social Service (28,388 | 11.5%), Computers, Engineering & Science (19,409 | 7.8%), Business & Financial (18,335 | 7.4%), and Health Diagnosing & Treating (15,852 | 6.4%).
Management, Business, Science and Arts Occupations by Sex
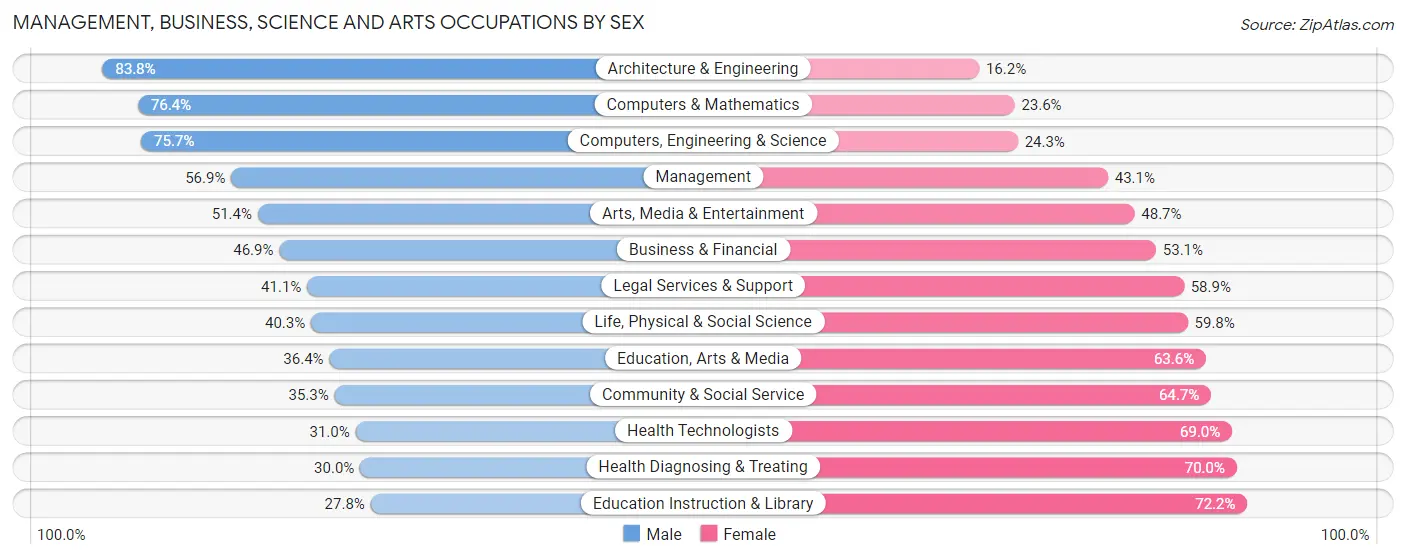
Within the Management, Business, Science and Arts occupations in Seminole County, the most male-oriented occupations are Architecture & Engineering (83.8%), Computers & Mathematics (76.4%), and Computers, Engineering & Science (75.7%), while the most female-oriented occupations are Education Instruction & Library (72.2%), Health Diagnosing & Treating (70.0%), and Health Technologists (69.0%).
| Occupation | Male | Female |
| Management | 16,764 (56.9%) | 12,705 (43.1%) |
| Business & Financial | 8,593 (46.9%) | 9,742 (53.1%) |
| Computers, Engineering & Science | 14,690 (75.7%) | 4,719 (24.3%) |
| Computers & Mathematics | 8,735 (76.4%) | 2,702 (23.6%) |
| Architecture & Engineering | 5,286 (83.8%) | 1,024 (16.2%) |
| Life, Physical & Social Science | 669 (40.3%) | 993 (59.8%) |
| Community & Social Service | 10,032 (35.3%) | 18,356 (64.7%) |
| Education, Arts & Media | 1,712 (36.4%) | 2,989 (63.6%) |
| Legal Services & Support | 1,323 (41.1%) | 1,899 (58.9%) |
| Education Instruction & Library | 4,150 (27.8%) | 10,771 (72.2%) |
| Arts, Media & Entertainment | 2,847 (51.3%) | 2,697 (48.6%) |
| Health Diagnosing & Treating | 4,756 (30.0%) | 11,096 (70.0%) |
| Health Technologists | 3,746 (31.0%) | 8,348 (69.0%) |
| Total (Category) | 54,835 (49.2%) | 56,618 (50.8%) |
| Total (Overall) | 130,811 (52.7%) | 117,177 (47.2%) |
Services Occupations
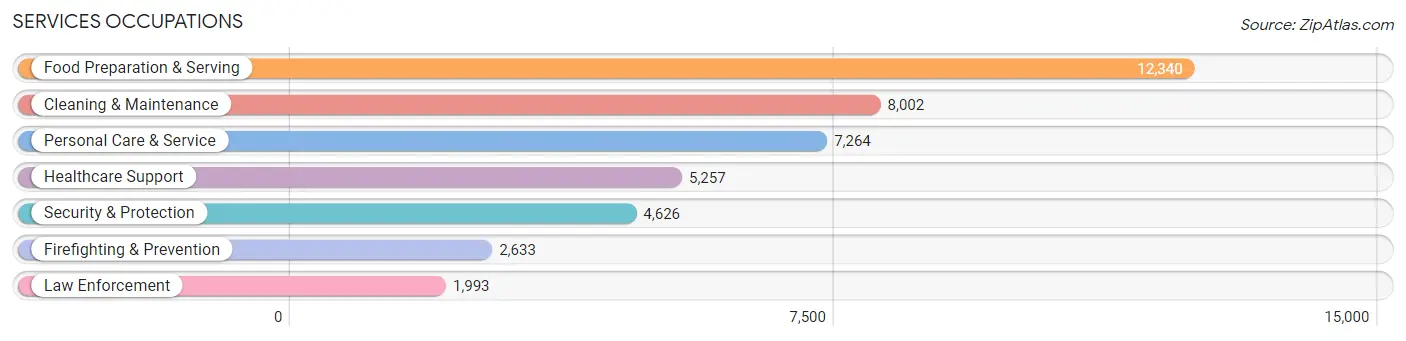
The most common Services occupations in Seminole County are Food Preparation & Serving (12,340 | 5.0%), Cleaning & Maintenance (8,002 | 3.2%), Personal Care & Service (7,264 | 2.9%), Healthcare Support (5,257 | 2.1%), and Security & Protection (4,626 | 1.9%).
Services Occupations by Sex
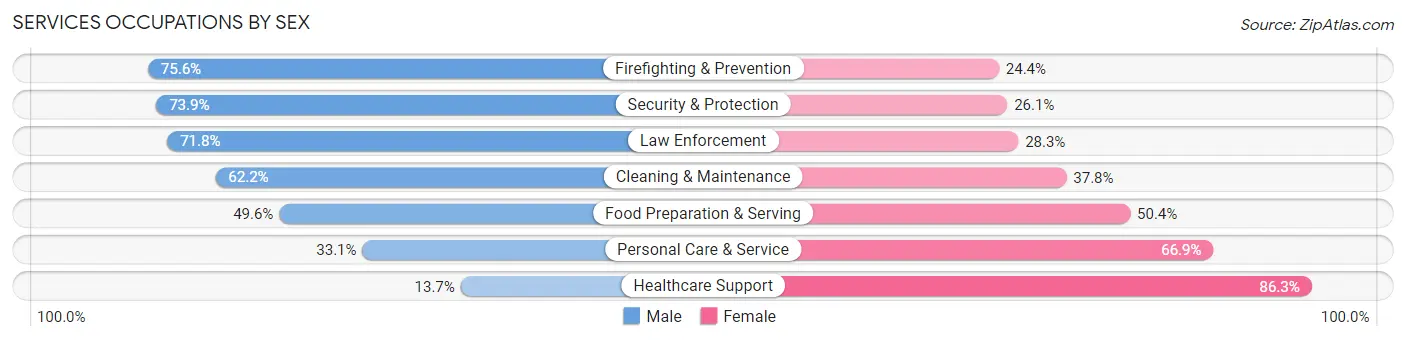
Within the Services occupations in Seminole County, the most male-oriented occupations are Firefighting & Prevention (75.6%), Security & Protection (73.9%), and Law Enforcement (71.8%), while the most female-oriented occupations are Healthcare Support (86.3%), Personal Care & Service (66.9%), and Food Preparation & Serving (50.4%).
| Occupation | Male | Female |
| Healthcare Support | 718 (13.7%) | 4,539 (86.3%) |
| Security & Protection | 3,420 (73.9%) | 1,206 (26.1%) |
| Firefighting & Prevention | 1,990 (75.6%) | 643 (24.4%) |
| Law Enforcement | 1,430 (71.8%) | 563 (28.2%) |
| Food Preparation & Serving | 6,120 (49.6%) | 6,220 (50.4%) |
| Cleaning & Maintenance | 4,978 (62.2%) | 3,024 (37.8%) |
| Personal Care & Service | 2,406 (33.1%) | 4,858 (66.9%) |
| Total (Category) | 17,642 (47.1%) | 19,847 (52.9%) |
| Total (Overall) | 130,811 (52.7%) | 117,177 (47.2%) |
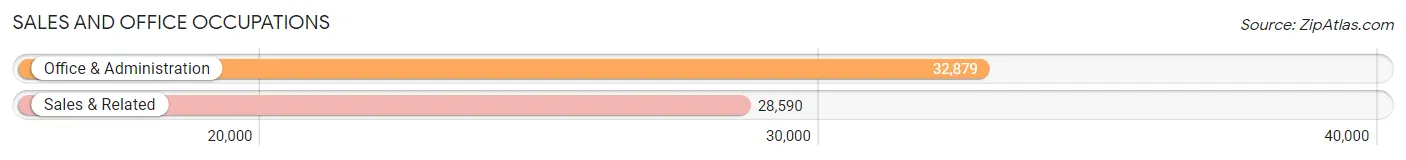
Sales and Office Occupations
The most common Sales and Office occupations in Seminole County are Office & Administration (32,879 | 13.3%), and Sales & Related (28,590 | 11.5%).
Sales and Office Occupations by Sex
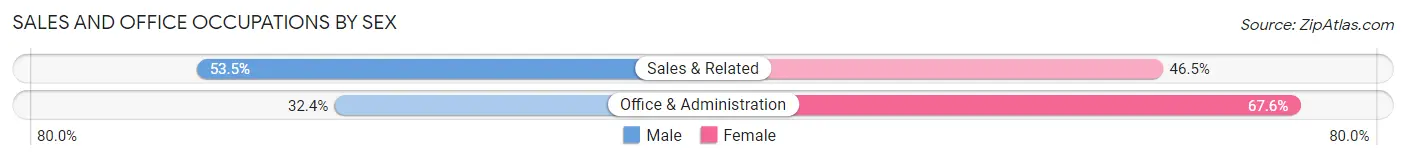
| Occupation | Male | Female |
| Sales & Related | 15,302 (53.5%) | 13,288 (46.5%) |
| Office & Administration | 10,648 (32.4%) | 22,231 (67.6%) |
| Total (Category) | 25,950 (42.2%) | 35,519 (57.8%) |
| Total (Overall) | 130,811 (52.7%) | 117,177 (47.2%) |
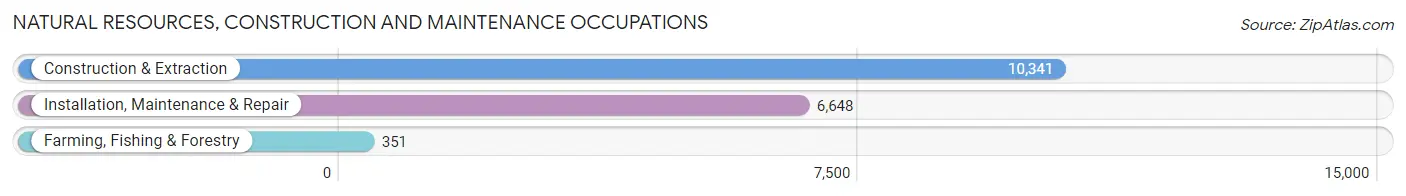
Natural Resources, Construction and Maintenance Occupations
The most common Natural Resources, Construction and Maintenance occupations in Seminole County are Construction & Extraction (10,341 | 4.2%), Installation, Maintenance & Repair (6,648 | 2.7%), and Farming, Fishing & Forestry (351 | 0.1%).
Natural Resources, Construction and Maintenance Occupations by Sex
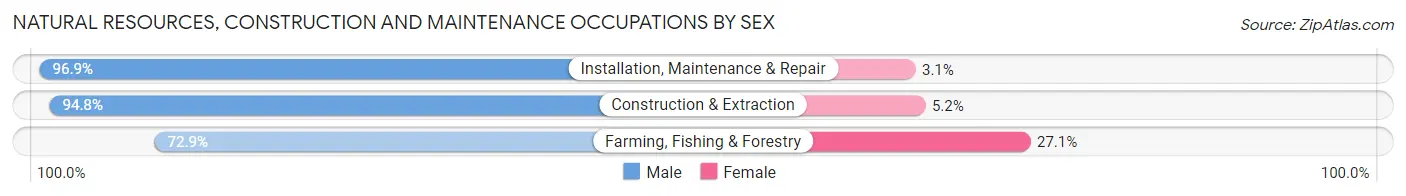
| Occupation | Male | Female |
| Farming, Fishing & Forestry | 256 (72.9%) | 95 (27.1%) |
| Construction & Extraction | 9,802 (94.8%) | 539 (5.2%) |
| Installation, Maintenance & Repair | 6,439 (96.9%) | 209 (3.1%) |
| Total (Category) | 16,497 (95.1%) | 843 (4.9%) |
| Total (Overall) | 130,811 (52.7%) | 117,177 (47.2%) |
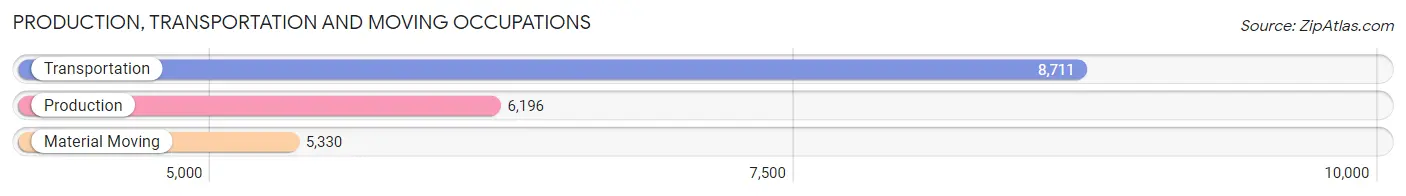
Production, Transportation and Moving Occupations
The most common Production, Transportation and Moving occupations in Seminole County are Transportation (8,711 | 3.5%), Production (6,196 | 2.5%), and Material Moving (5,330 | 2.1%).
Production, Transportation and Moving Occupations by Sex
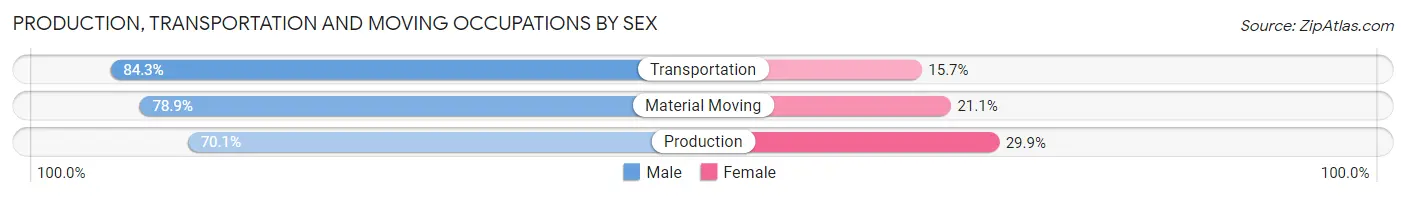
| Occupation | Male | Female |
| Production | 4,341 (70.1%) | 1,855 (29.9%) |
| Transportation | 7,340 (84.3%) | 1,371 (15.7%) |
| Material Moving | 4,206 (78.9%) | 1,124 (21.1%) |
| Total (Category) | 15,887 (78.5%) | 4,350 (21.5%) |
| Total (Overall) | 130,811 (52.7%) | 117,177 (47.2%) |
Employment Industries by Sex in Seminole County
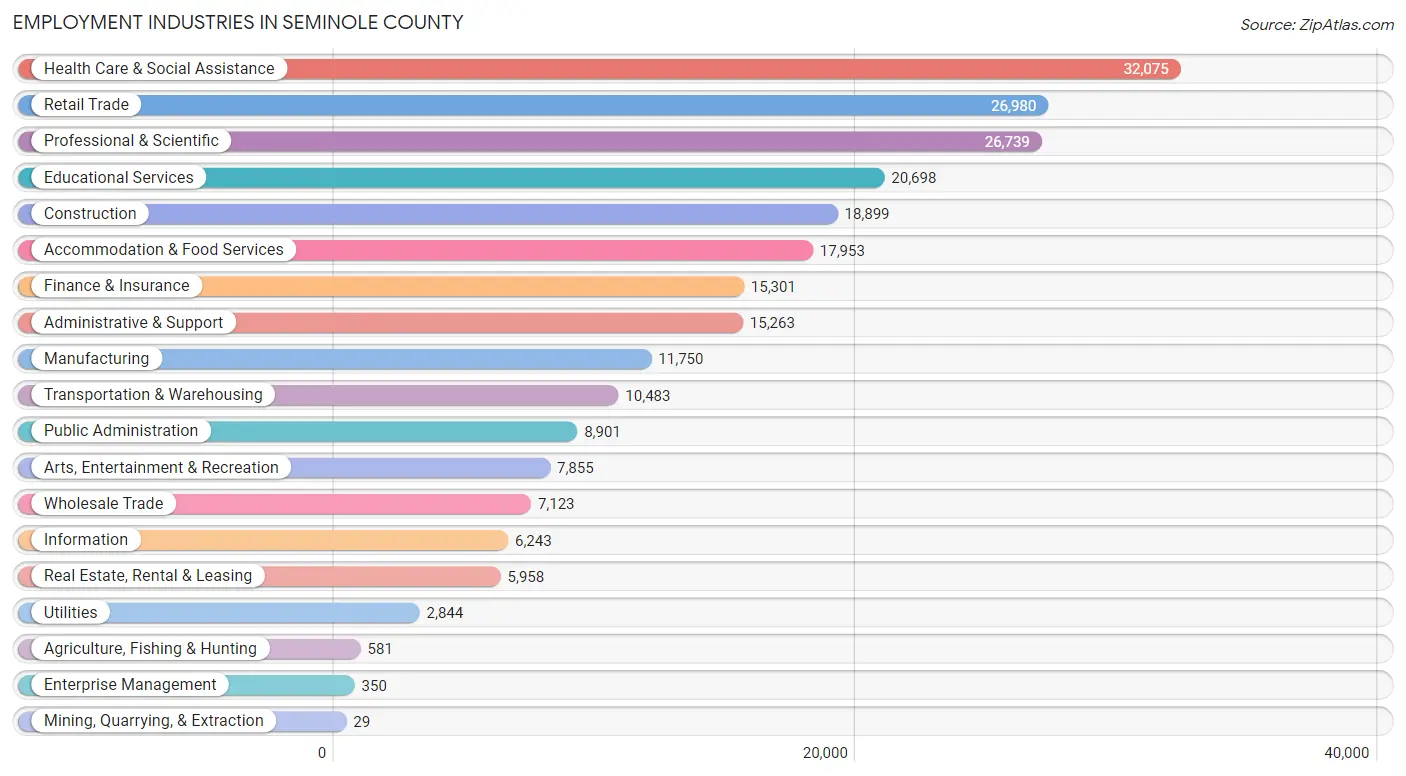
Employment Industries in Seminole County
The major employment industries in Seminole County include Health Care & Social Assistance (32,075 | 12.9%), Retail Trade (26,980 | 10.9%), Professional & Scientific (26,739 | 10.8%), Educational Services (20,698 | 8.4%), and Construction (18,899 | 7.6%).
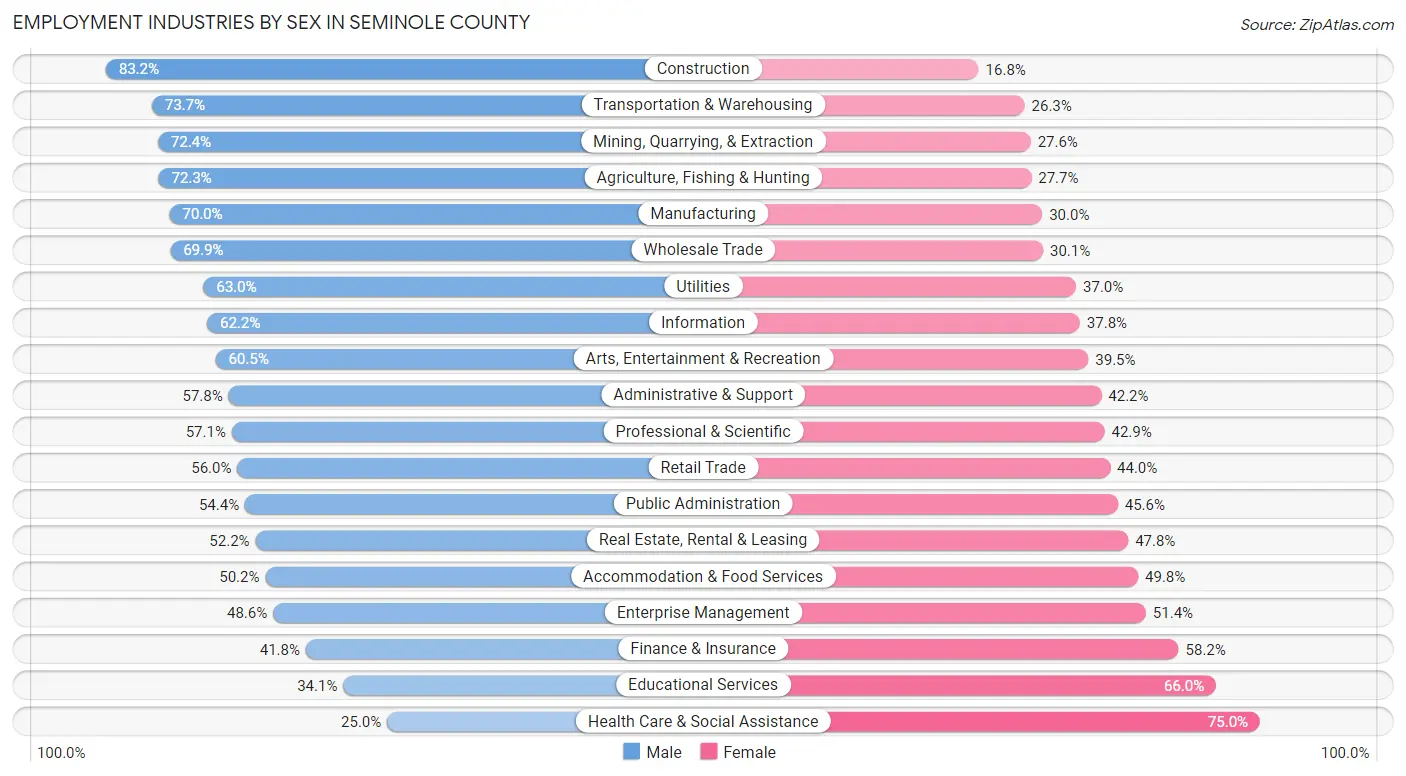
Employment Industries by Sex in Seminole County
The Seminole County industries that see more men than women are Construction (83.2%), Transportation & Warehousing (73.7%), and Mining, Quarrying, & Extraction (72.4%), whereas the industries that tend to have a higher number of women are Health Care & Social Assistance (75.0%), Educational Services (65.9%), and Finance & Insurance (58.2%).
| Industry | Male | Female |
| Agriculture, Fishing & Hunting | 420 (72.3%) | 161 (27.7%) |
| Mining, Quarrying, & Extraction | 21 (72.4%) | 8 (27.6%) |
| Construction | 15,723 (83.2%) | 3,176 (16.8%) |
| Manufacturing | 8,229 (70.0%) | 3,521 (30.0%) |
| Wholesale Trade | 4,976 (69.9%) | 2,147 (30.1%) |
| Retail Trade | 15,104 (56.0%) | 11,876 (44.0%) |
| Transportation & Warehousing | 7,723 (73.7%) | 2,760 (26.3%) |
| Utilities | 1,792 (63.0%) | 1,052 (37.0%) |
| Information | 3,885 (62.2%) | 2,358 (37.8%) |
| Finance & Insurance | 6,396 (41.8%) | 8,905 (58.2%) |
| Real Estate, Rental & Leasing | 3,112 (52.2%) | 2,846 (47.8%) |
| Professional & Scientific | 15,277 (57.1%) | 11,462 (42.9%) |
| Enterprise Management | 170 (48.6%) | 180 (51.4%) |
| Administrative & Support | 8,820 (57.8%) | 6,443 (42.2%) |
| Educational Services | 7,048 (34.1%) | 13,650 (65.9%) |
| Health Care & Social Assistance | 8,010 (25.0%) | 24,065 (75.0%) |
| Arts, Entertainment & Recreation | 4,751 (60.5%) | 3,104 (39.5%) |
| Accommodation & Food Services | 9,008 (50.2%) | 8,945 (49.8%) |
| Public Administration | 4,840 (54.4%) | 4,061 (45.6%) |
| Total | 130,811 (52.7%) | 117,177 (47.2%) |
Education in Seminole County
School Enrollment in Seminole County
The most common levels of schooling among the 115,436 students in Seminole County are college / undergraduate (28,626 | 24.8%), high school (24,437 | 21.2%), and middle school (21,831 | 18.9%).
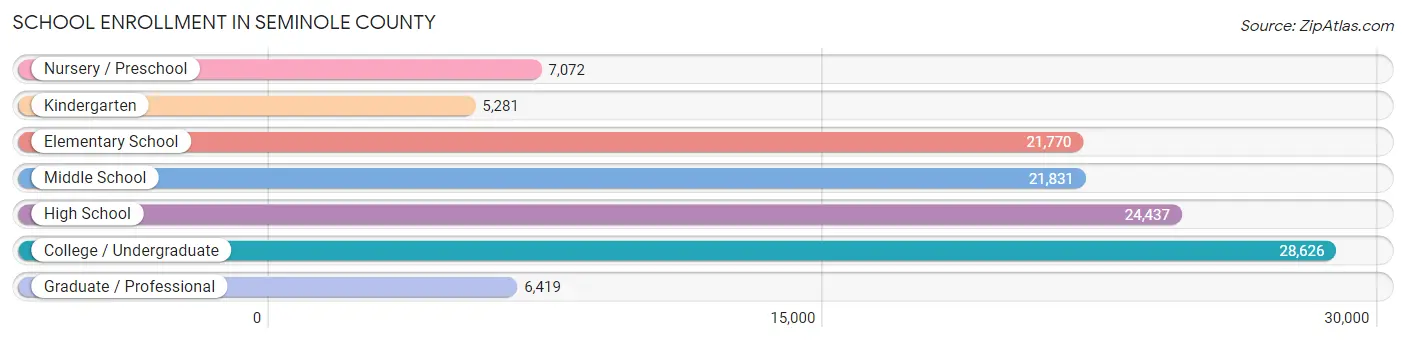
| School Level | # Students | % Students |
| Nursery / Preschool | 7,072 | 6.1% |
| Kindergarten | 5,281 | 4.6% |
| Elementary School | 21,770 | 18.9% |
| Middle School | 21,831 | 18.9% |
| High School | 24,437 | 21.2% |
| College / Undergraduate | 28,626 | 24.8% |
| Graduate / Professional | 6,419 | 5.6% |
| Total | 115,436 | 100.0% |
School Enrollment by Age by Funding Source in Seminole County
Out of a total of 115,436 students who are enrolled in schools in Seminole County, 22,395 (19.4%) attend a private institution, while the remaining 93,041 (80.6%) are enrolled in public schools. The age group of 3 to 4 year olds has the highest likelihood of being enrolled in private schools, with 2,854 (53.0% in the age bracket) enrolled. Conversely, the age group of 15 to 17 year olds has the lowest likelihood of being enrolled in a private school, with 15,752 (88.3% in the age bracket) attending a public institution.
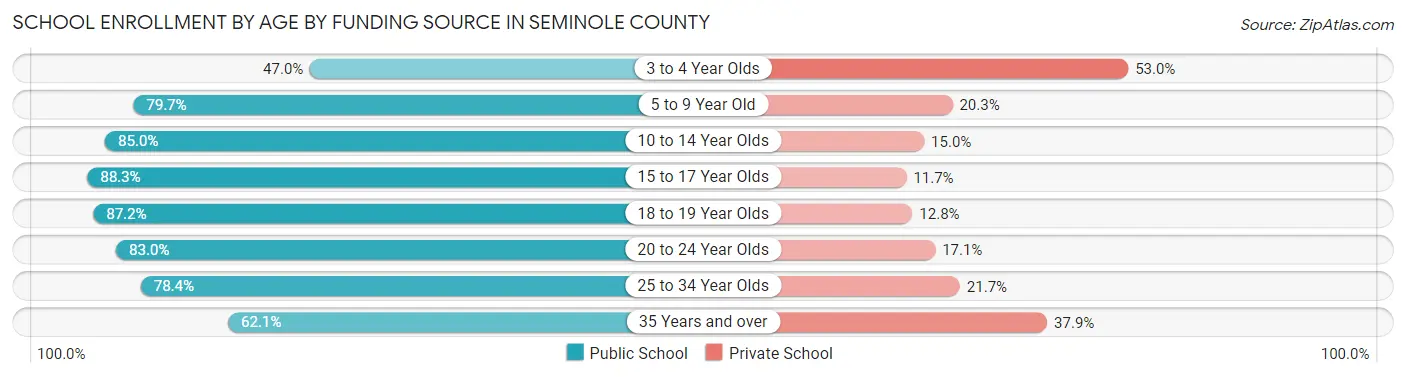
| Age Bracket | Public School | Private School |
| 3 to 4 Year Olds | 2,531 (47.0%) | 2,854 (53.0%) |
| 5 to 9 Year Old | 20,436 (79.7%) | 5,197 (20.3%) |
| 10 to 14 Year Olds | 23,827 (85.0%) | 4,201 (15.0%) |
| 15 to 17 Year Olds | 15,752 (88.3%) | 2,085 (11.7%) |
| 18 to 19 Year Olds | 7,525 (87.2%) | 1,105 (12.8%) |
| 20 to 24 Year Olds | 11,653 (83.0%) | 2,396 (17.1%) |
| 25 to 34 Year Olds | 6,970 (78.3%) | 1,926 (21.6%) |
| 35 Years and over | 4,333 (62.1%) | 2,645 (37.9%) |
| Total | 93,041 (80.6%) | 22,395 (19.4%) |
Educational Attainment by Field of Study in Seminole County
Business (35,708 | 24.1%), science & technology (15,351 | 10.4%), education (14,217 | 9.6%), engineering (12,647 | 8.5%), and social sciences (9,567 | 6.5%) are the most common fields of study among 148,153 individuals in Seminole County who have obtained a bachelor's degree or higher.
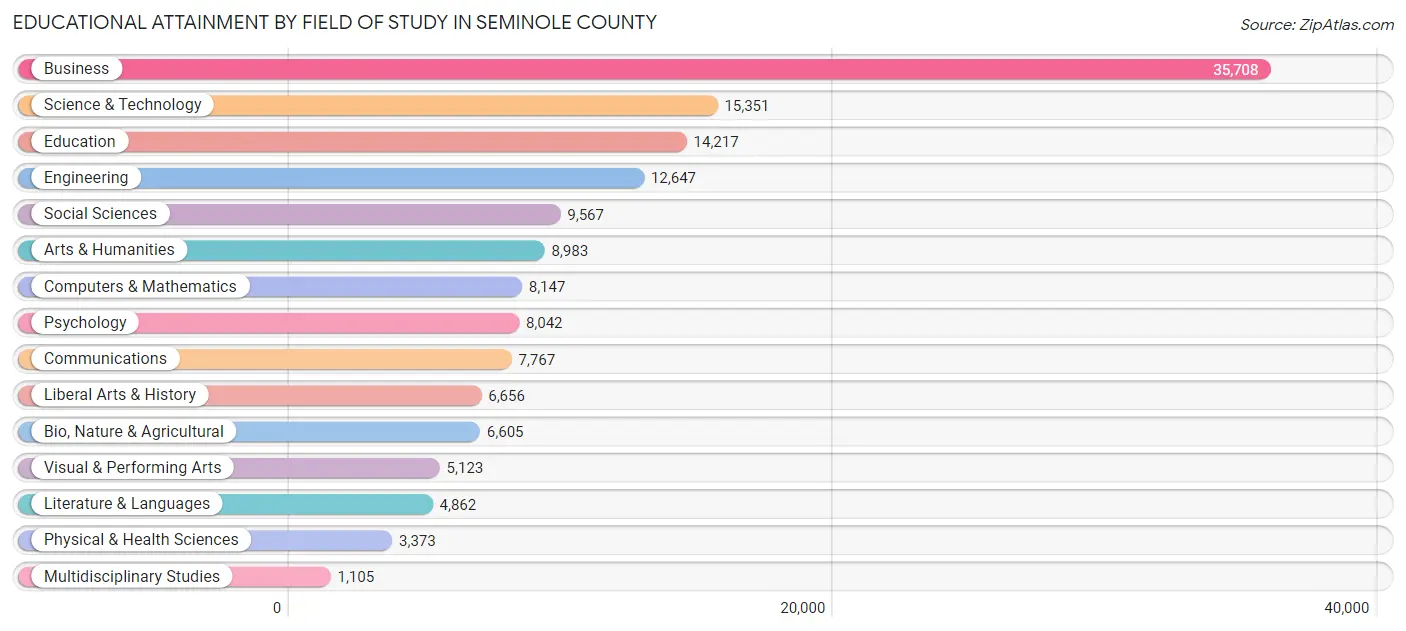
| Field of Study | # Graduates | % Graduates |
| Computers & Mathematics | 8,147 | 5.5% |
| Bio, Nature & Agricultural | 6,605 | 4.5% |
| Physical & Health Sciences | 3,373 | 2.3% |
| Psychology | 8,042 | 5.4% |
| Social Sciences | 9,567 | 6.5% |
| Engineering | 12,647 | 8.5% |
| Multidisciplinary Studies | 1,105 | 0.7% |
| Science & Technology | 15,351 | 10.4% |
| Business | 35,708 | 24.1% |
| Education | 14,217 | 9.6% |
| Literature & Languages | 4,862 | 3.3% |
| Liberal Arts & History | 6,656 | 4.5% |
| Visual & Performing Arts | 5,123 | 3.5% |
| Communications | 7,767 | 5.2% |
| Arts & Humanities | 8,983 | 6.1% |
| Total | 148,153 | 100.0% |
Transportation & Commute in Seminole County
Vehicle Availability by Sex in Seminole County
The most prevalent vehicle ownership categories in Seminole County are males with 2 vehicles (57,644, accounting for 44.8%) and females with 2 vehicles (50,723, making up 50.2%).
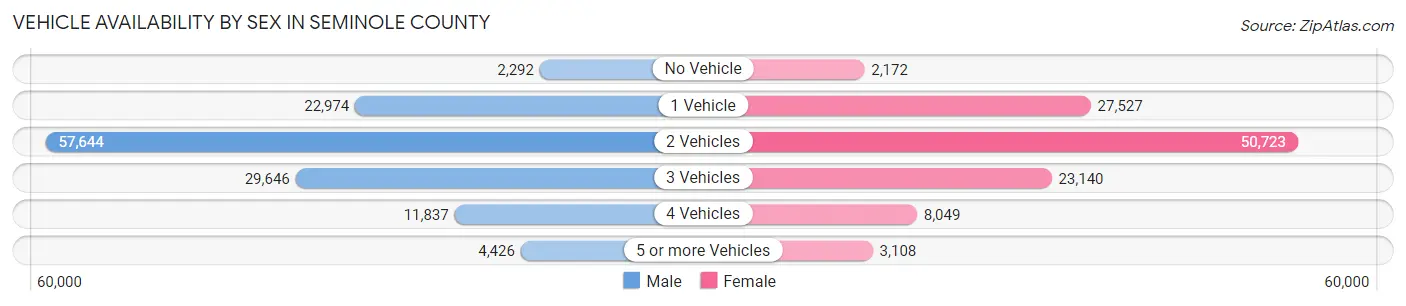
| Vehicles Available | Male | Female |
| No Vehicle | 2,292 (1.8%) | 2,172 (1.9%) |
| 1 Vehicle | 22,974 (17.8%) | 27,527 (24.0%) |
| 2 Vehicles | 57,644 (44.8%) | 50,723 (44.2%) |
| 3 Vehicles | 29,646 (23.0%) | 23,140 (20.2%) |
| 4 Vehicles | 11,837 (9.2%) | 8,049 (7.0%) |
| 5 or more Vehicles | 4,426 (3.4%) | 3,108 (2.7%) |
| Total | 128,819 (100.0%) | 114,719 (100.0%) |
Commute Time in Seminole County
The most frequently occuring commute durations in Seminole County are 30 to 34 minutes (33,067 commuters, 16.1%), 20 to 24 minutes (31,107 commuters, 15.1%), and 15 to 19 minutes (30,322 commuters, 14.7%).
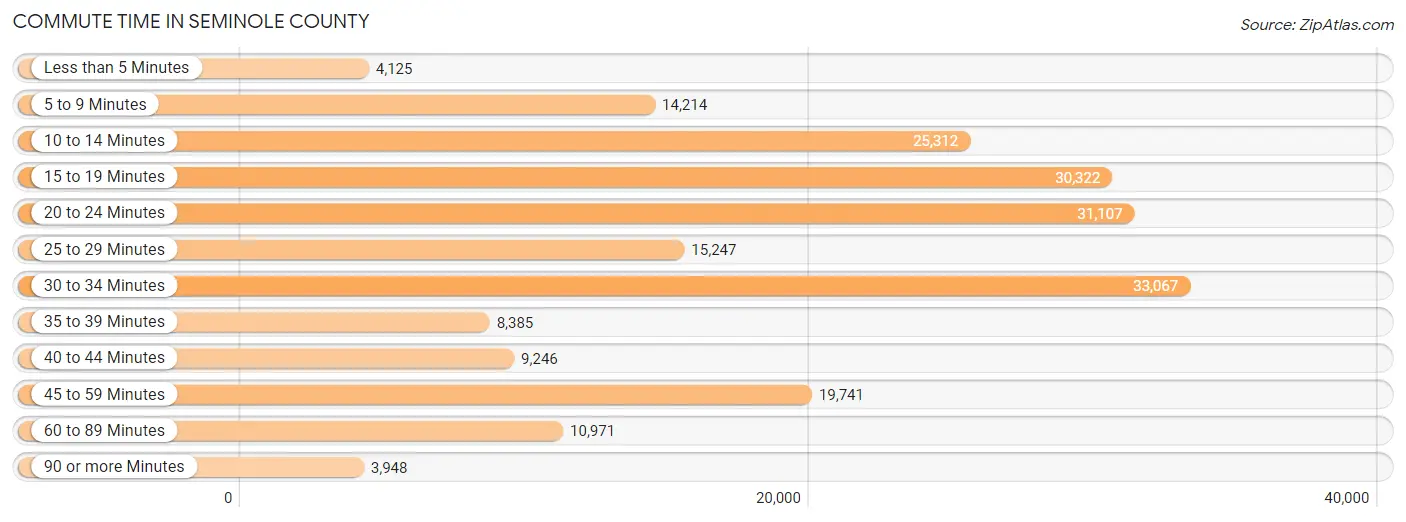
| Commute Time | # Commuters | % Commuters |
| Less than 5 Minutes | 4,125 | 2.0% |
| 5 to 9 Minutes | 14,214 | 6.9% |
| 10 to 14 Minutes | 25,312 | 12.3% |
| 15 to 19 Minutes | 30,322 | 14.7% |
| 20 to 24 Minutes | 31,107 | 15.1% |
| 25 to 29 Minutes | 15,247 | 7.4% |
| 30 to 34 Minutes | 33,067 | 16.1% |
| 35 to 39 Minutes | 8,385 | 4.1% |
| 40 to 44 Minutes | 9,246 | 4.5% |
| 45 to 59 Minutes | 19,741 | 9.6% |
| 60 to 89 Minutes | 10,971 | 5.3% |
| 90 or more Minutes | 3,948 | 1.9% |
Commute Time by Sex in Seminole County
The most common commute times in Seminole County are 30 to 34 minutes (17,223 commuters, 15.6%) for males and 30 to 34 minutes (15,844 commuters, 16.6%) for females.
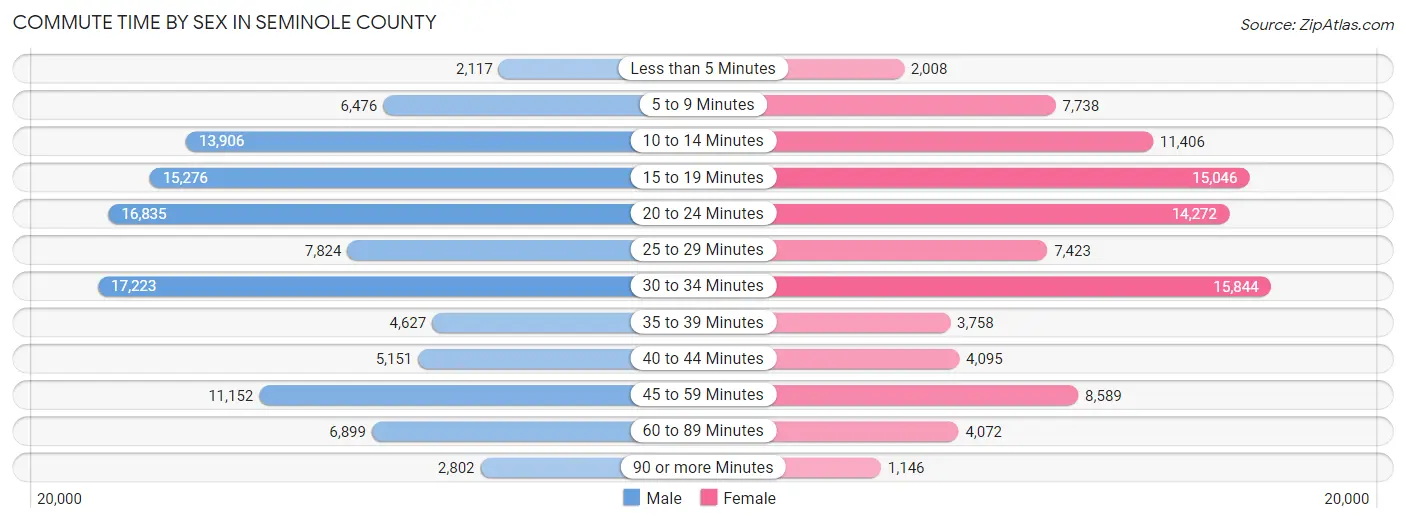
| Commute Time | Male | Female |
| Less than 5 Minutes | 2,117 (1.9%) | 2,008 (2.1%) |
| 5 to 9 Minutes | 6,476 (5.9%) | 7,738 (8.1%) |
| 10 to 14 Minutes | 13,906 (12.6%) | 11,406 (12.0%) |
| 15 to 19 Minutes | 15,276 (13.9%) | 15,046 (15.8%) |
| 20 to 24 Minutes | 16,835 (15.3%) | 14,272 (15.0%) |
| 25 to 29 Minutes | 7,824 (7.1%) | 7,423 (7.8%) |
| 30 to 34 Minutes | 17,223 (15.6%) | 15,844 (16.6%) |
| 35 to 39 Minutes | 4,627 (4.2%) | 3,758 (3.9%) |
| 40 to 44 Minutes | 5,151 (4.7%) | 4,095 (4.3%) |
| 45 to 59 Minutes | 11,152 (10.1%) | 8,589 (9.0%) |
| 60 to 89 Minutes | 6,899 (6.3%) | 4,072 (4.3%) |
| 90 or more Minutes | 2,802 (2.5%) | 1,146 (1.2%) |
Time of Departure to Work by Sex in Seminole County
The most frequent times of departure to work in Seminole County are 7:00 AM to 7:29 AM (16,779, 15.2%) for males and 8:00 AM to 8:29 AM (14,325, 15.0%) for females.
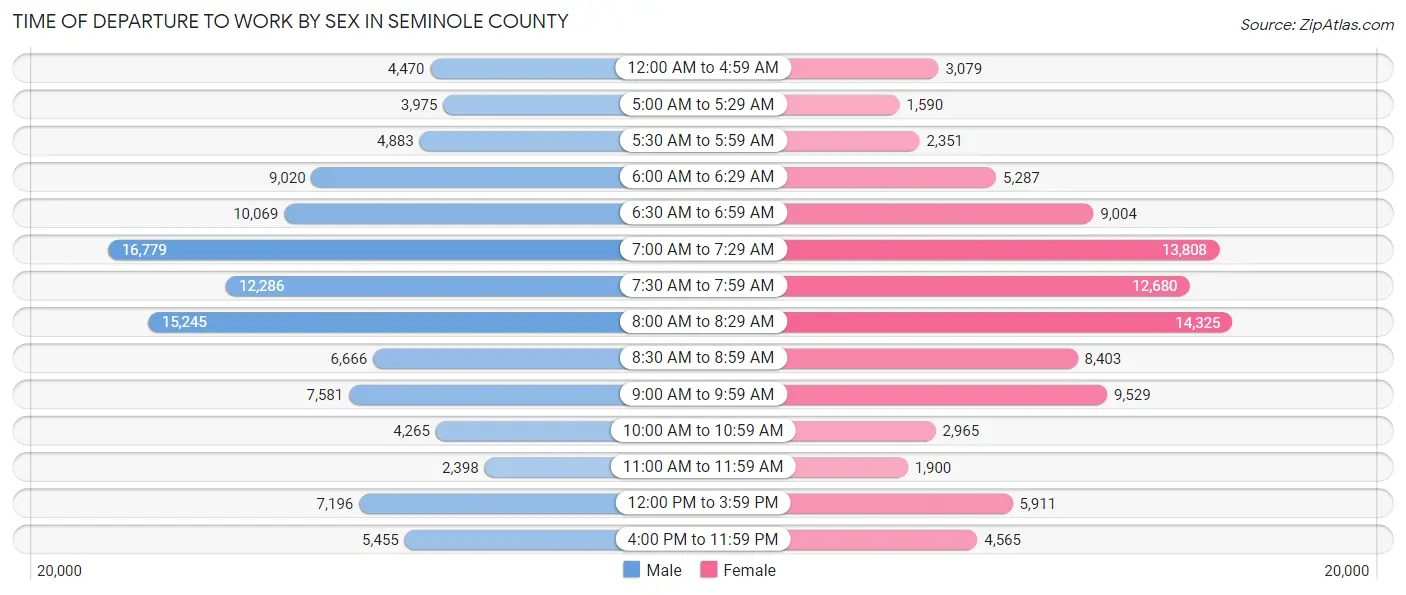
| Time of Departure | Male | Female |
| 12:00 AM to 4:59 AM | 4,470 (4.1%) | 3,079 (3.2%) |
| 5:00 AM to 5:29 AM | 3,975 (3.6%) | 1,590 (1.7%) |
| 5:30 AM to 5:59 AM | 4,883 (4.4%) | 2,351 (2.5%) |
| 6:00 AM to 6:29 AM | 9,020 (8.2%) | 5,287 (5.5%) |
| 6:30 AM to 6:59 AM | 10,069 (9.1%) | 9,004 (9.4%) |
| 7:00 AM to 7:29 AM | 16,779 (15.2%) | 13,808 (14.5%) |
| 7:30 AM to 7:59 AM | 12,286 (11.1%) | 12,680 (13.3%) |
| 8:00 AM to 8:29 AM | 15,245 (13.8%) | 14,325 (15.0%) |
| 8:30 AM to 8:59 AM | 6,666 (6.0%) | 8,403 (8.8%) |
| 9:00 AM to 9:59 AM | 7,581 (6.9%) | 9,529 (10.0%) |
| 10:00 AM to 10:59 AM | 4,265 (3.9%) | 2,965 (3.1%) |
| 11:00 AM to 11:59 AM | 2,398 (2.2%) | 1,900 (2.0%) |
| 12:00 PM to 3:59 PM | 7,196 (6.5%) | 5,911 (6.2%) |
| 4:00 PM to 11:59 PM | 5,455 (5.0%) | 4,565 (4.8%) |
| Total | 110,288 (100.0%) | 95,397 (100.0%) |
Housing Occupancy in Seminole County
Occupancy by Ownership in Seminole County
Of the total 183,487 dwellings in Seminole County, owner-occupied units account for 120,506 (65.7%), while renter-occupied units make up 62,981 (34.3%).
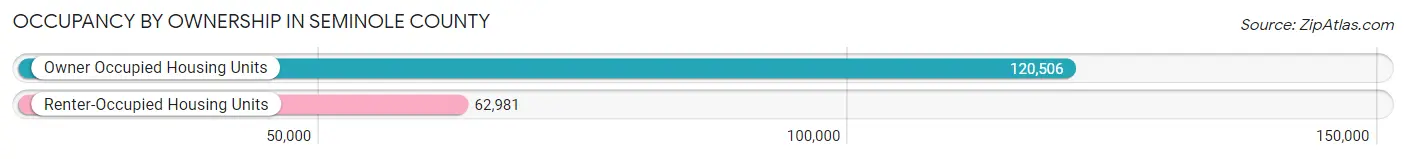
| Occupancy | # Housing Units | % Housing Units |
| Owner Occupied Housing Units | 120,506 | 65.7% |
| Renter-Occupied Housing Units | 62,981 | 34.3% |
| Total Occupied Housing Units | 183,487 | 100.0% |
Occupancy by Household Size in Seminole County
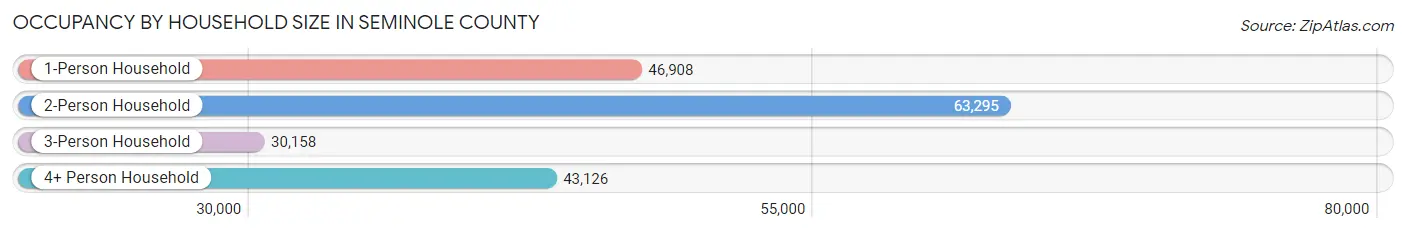
| Household Size | # Housing Units | % Housing Units |
| 1-Person Household | 46,908 | 25.6% |
| 2-Person Household | 63,295 | 34.5% |
| 3-Person Household | 30,158 | 16.4% |
| 4+ Person Household | 43,126 | 23.5% |
| Total Housing Units | 183,487 | 100.0% |
Occupancy by Ownership by Household Size in Seminole County
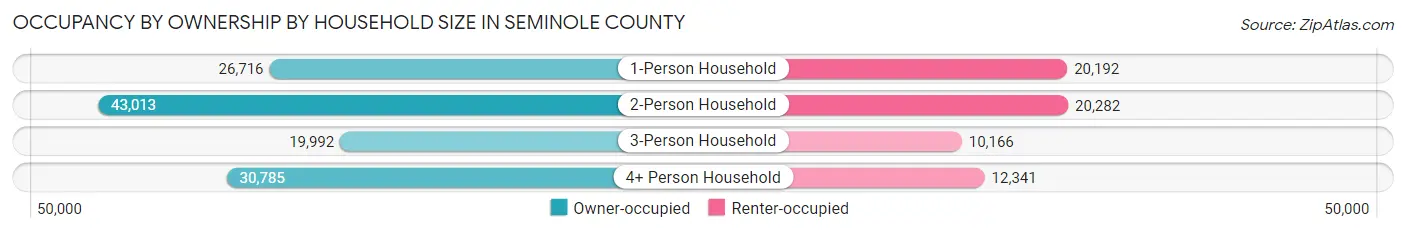
| Household Size | Owner-occupied | Renter-occupied |
| 1-Person Household | 26,716 (57.0%) | 20,192 (43.0%) |
| 2-Person Household | 43,013 (68.0%) | 20,282 (32.0%) |
| 3-Person Household | 19,992 (66.3%) | 10,166 (33.7%) |
| 4+ Person Household | 30,785 (71.4%) | 12,341 (28.6%) |
| Total Housing Units | 120,506 (65.7%) | 62,981 (34.3%) |
Occupancy by Educational Attainment in Seminole County
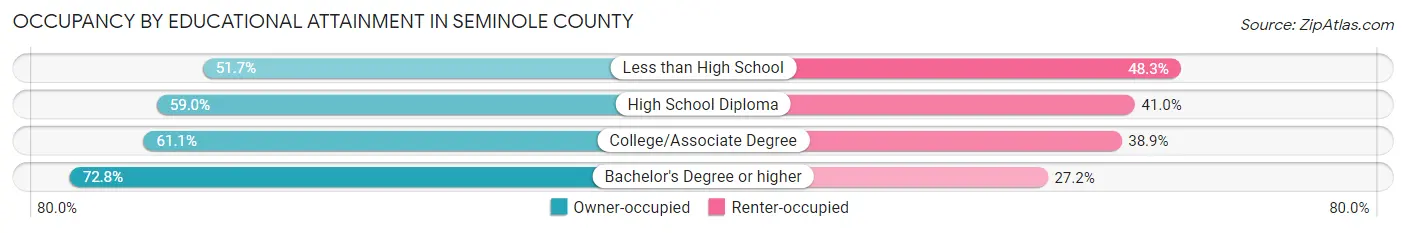
| Household Size | Owner-occupied | Renter-occupied |
| Less than High School | 4,272 (51.7%) | 3,984 (48.3%) |
| High School Diploma | 18,874 (59.0%) | 13,107 (41.0%) |
| College/Associate Degree | 36,341 (61.1%) | 23,121 (38.9%) |
| Bachelor's Degree or higher | 61,019 (72.8%) | 22,769 (27.2%) |
Occupancy by Age of Householder in Seminole County
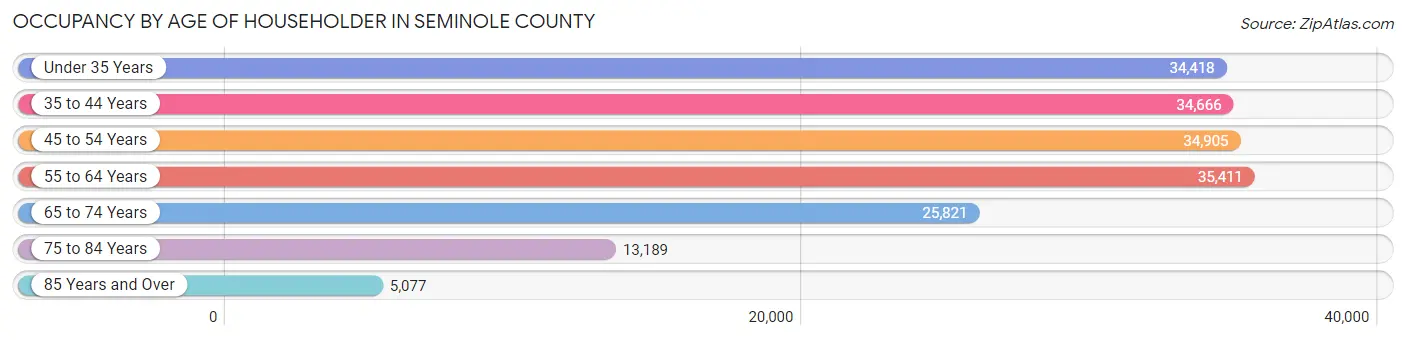
| Age Bracket | # Households | % Households |
| Under 35 Years | 34,418 | 18.8% |
| 35 to 44 Years | 34,666 | 18.9% |
| 45 to 54 Years | 34,905 | 19.0% |
| 55 to 64 Years | 35,411 | 19.3% |
| 65 to 74 Years | 25,821 | 14.1% |
| 75 to 84 Years | 13,189 | 7.2% |
| 85 Years and Over | 5,077 | 2.8% |
| Total | 183,487 | 100.0% |
Housing Finances in Seminole County
Median Income by Occupancy in Seminole County
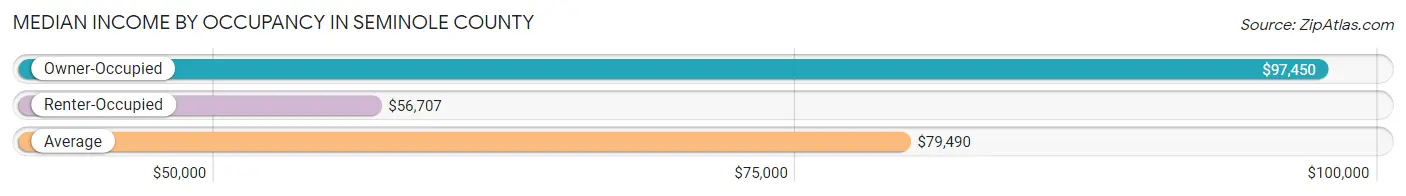
| Occupancy Type | # Households | Median Income |
| Owner-Occupied | 120,506 (65.7%) | $97,450 |
| Renter-Occupied | 62,981 (34.3%) | $56,707 |
| Average | 183,487 (100.0%) | $79,490 |
Occupancy by Householder Income Bracket in Seminole County
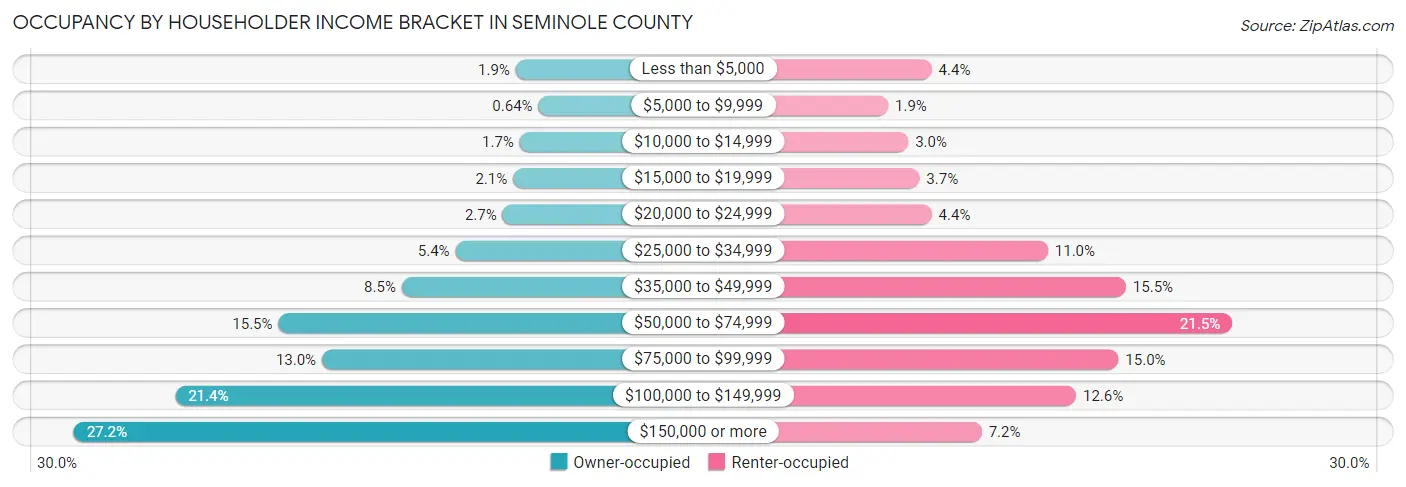
| Income Bracket | Owner-occupied | Renter-occupied |
| Less than $5,000 | 2,336 (1.9%) | 2,739 (4.3%) |
| $5,000 to $9,999 | 770 (0.6%) | 1,169 (1.9%) |
| $10,000 to $14,999 | 2,066 (1.7%) | 1,897 (3.0%) |
| $15,000 to $19,999 | 2,519 (2.1%) | 2,301 (3.6%) |
| $20,000 to $24,999 | 3,244 (2.7%) | 2,740 (4.3%) |
| $25,000 to $34,999 | 6,480 (5.4%) | 6,920 (11.0%) |
| $35,000 to $49,999 | 10,181 (8.5%) | 9,729 (15.4%) |
| $50,000 to $74,999 | 18,679 (15.5%) | 13,551 (21.5%) |
| $75,000 to $99,999 | 15,682 (13.0%) | 9,460 (15.0%) |
| $100,000 to $149,999 | 25,779 (21.4%) | 7,935 (12.6%) |
| $150,000 or more | 32,770 (27.2%) | 4,540 (7.2%) |
| Total | 120,506 (100.0%) | 62,981 (100.0%) |
Monthly Housing Cost Tiers in Seminole County
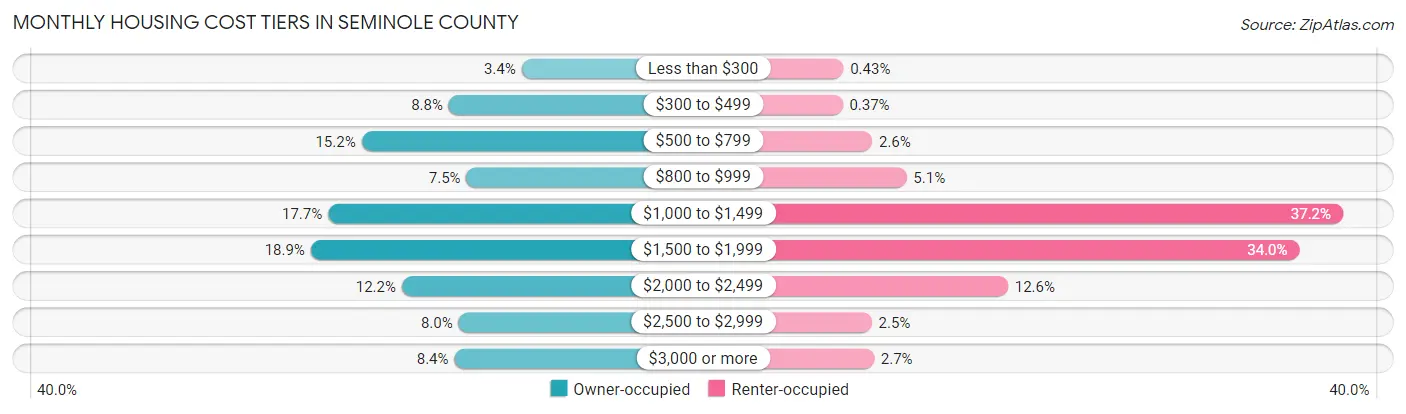
| Monthly Cost | Owner-occupied | Renter-occupied |
| Less than $300 | 4,096 (3.4%) | 273 (0.4%) |
| $300 to $499 | 10,553 (8.8%) | 232 (0.4%) |
| $500 to $799 | 18,300 (15.2%) | 1,609 (2.5%) |
| $800 to $999 | 8,994 (7.5%) | 3,201 (5.1%) |
| $1,000 to $1,499 | 21,267 (17.6%) | 23,444 (37.2%) |
| $1,500 to $1,999 | 22,817 (18.9%) | 21,427 (34.0%) |
| $2,000 to $2,499 | 14,730 (12.2%) | 7,904 (12.6%) |
| $2,500 to $2,999 | 9,685 (8.0%) | 1,589 (2.5%) |
| $3,000 or more | 10,064 (8.4%) | 1,686 (2.7%) |
| Total | 120,506 (100.0%) | 62,981 (100.0%) |
Physical Housing Characteristics in Seminole County
Housing Structures in Seminole County
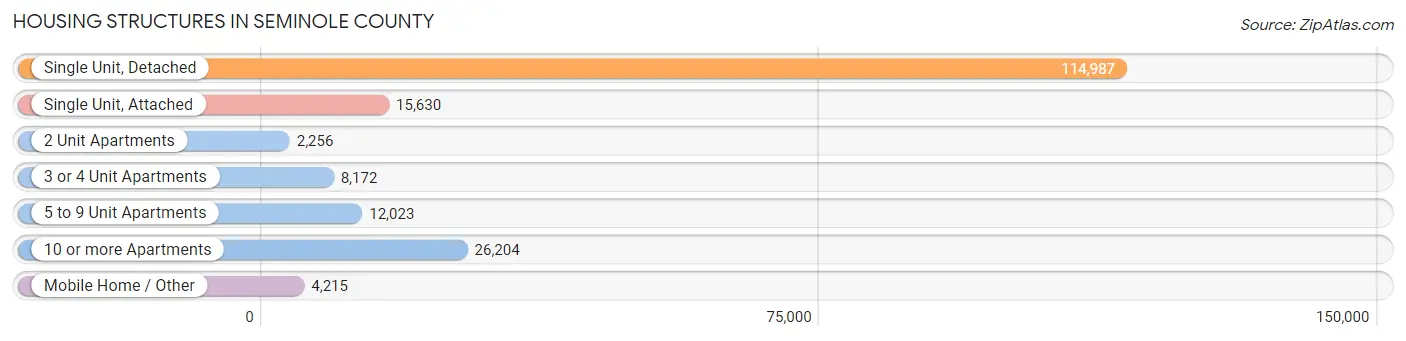
| Structure Type | # Housing Units | % Housing Units |
| Single Unit, Detached | 114,987 | 62.7% |
| Single Unit, Attached | 15,630 | 8.5% |
| 2 Unit Apartments | 2,256 | 1.2% |
| 3 or 4 Unit Apartments | 8,172 | 4.4% |
| 5 to 9 Unit Apartments | 12,023 | 6.6% |
| 10 or more Apartments | 26,204 | 14.3% |
| Mobile Home / Other | 4,215 | 2.3% |
| Total | 183,487 | 100.0% |
Housing Structures by Occupancy in Seminole County
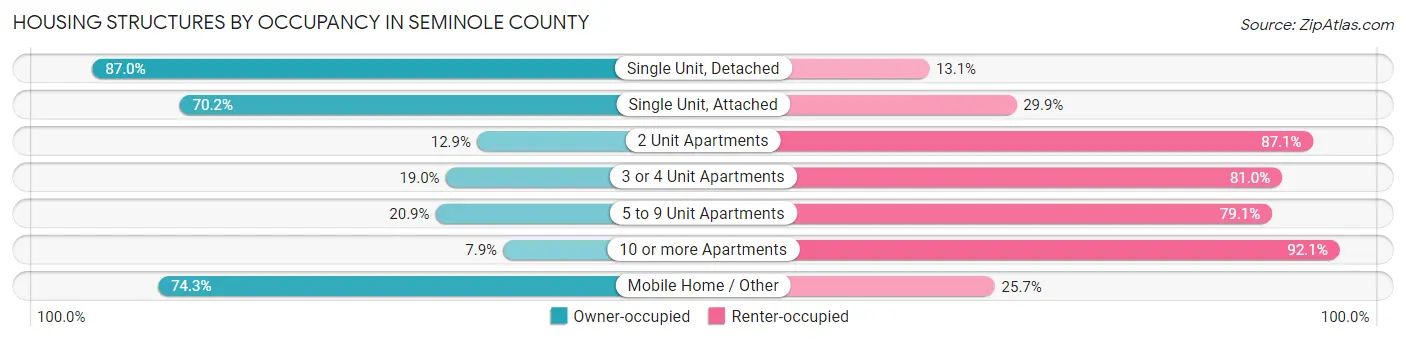
| Structure Type | Owner-occupied | Renter-occupied |
| Single Unit, Detached | 99,982 (87.0%) | 15,005 (13.1%) |
| Single Unit, Attached | 10,965 (70.2%) | 4,665 (29.8%) |
| 2 Unit Apartments | 292 (12.9%) | 1,964 (87.1%) |
| 3 or 4 Unit Apartments | 1,550 (19.0%) | 6,622 (81.0%) |
| 5 to 9 Unit Apartments | 2,514 (20.9%) | 9,509 (79.1%) |
| 10 or more Apartments | 2,071 (7.9%) | 24,133 (92.1%) |
| Mobile Home / Other | 3,132 (74.3%) | 1,083 (25.7%) |
| Total | 120,506 (65.7%) | 62,981 (34.3%) |
Housing Structures by Number of Rooms in Seminole County
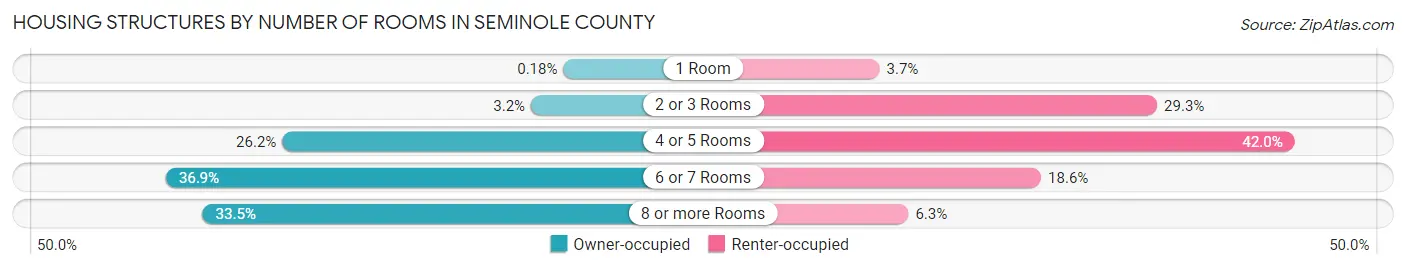
| Number of Rooms | Owner-occupied | Renter-occupied |
| 1 Room | 221 (0.2%) | 2,314 (3.7%) |
| 2 or 3 Rooms | 3,824 (3.2%) | 18,476 (29.3%) |
| 4 or 5 Rooms | 31,552 (26.2%) | 26,478 (42.0%) |
| 6 or 7 Rooms | 44,499 (36.9%) | 11,719 (18.6%) |
| 8 or more Rooms | 40,410 (33.5%) | 3,994 (6.3%) |
| Total | 120,506 (100.0%) | 62,981 (100.0%) |
Housing Structure by Heating Type in Seminole County
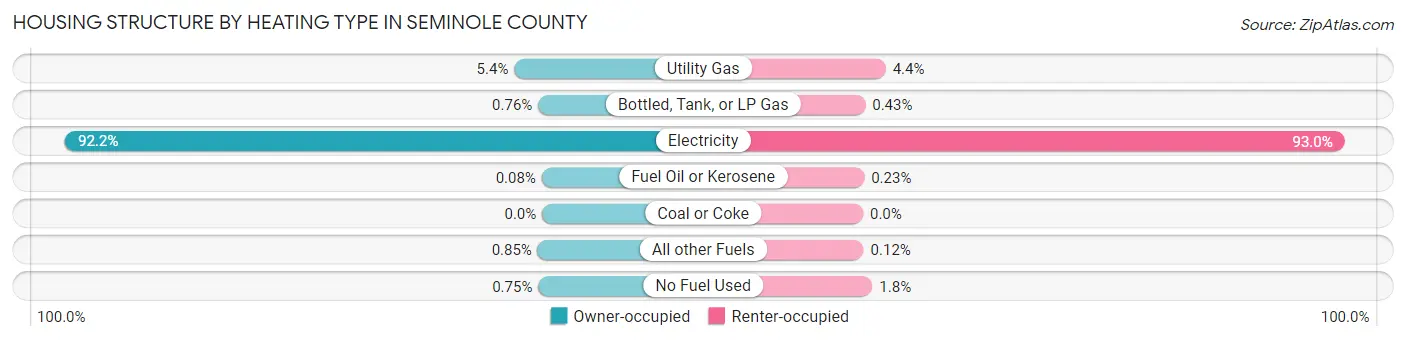
| Heating Type | Owner-occupied | Renter-occupied |
| Utility Gas | 6,489 (5.4%) | 2,756 (4.4%) |
| Bottled, Tank, or LP Gas | 917 (0.8%) | 269 (0.4%) |
| Electricity | 111,066 (92.2%) | 58,595 (93.0%) |
| Fuel Oil or Kerosene | 100 (0.1%) | 147 (0.2%) |
| Coal or Coke | 0 (0.0%) | 0 (0.0%) |
| All other Fuels | 1,028 (0.9%) | 75 (0.1%) |
| No Fuel Used | 906 (0.7%) | 1,139 (1.8%) |
| Total | 120,506 (100.0%) | 62,981 (100.0%) |
Household Vehicle Usage in Seminole County
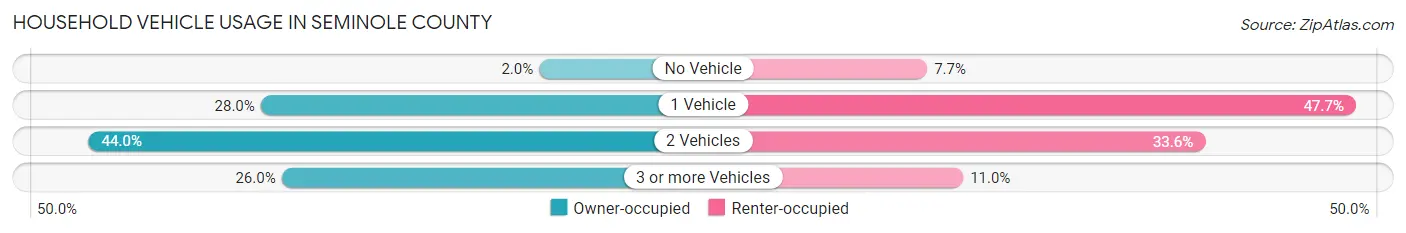
| Vehicles per Household | Owner-occupied | Renter-occupied |
| No Vehicle | 2,387 (2.0%) | 4,835 (7.7%) |
| 1 Vehicle | 33,708 (28.0%) | 30,029 (47.7%) |
| 2 Vehicles | 53,061 (44.0%) | 21,165 (33.6%) |
| 3 or more Vehicles | 31,350 (26.0%) | 6,952 (11.0%) |
| Total | 120,506 (100.0%) | 62,981 (100.0%) |
Real Estate & Mortgages in Seminole County
Real Estate and Mortgage Overview in Seminole County
| Characteristic | Without Mortgage | With Mortgage |
| Housing Units | 39,568 | 80,938 |
| Median Property Value | $297,000 | $341,700 |
| Median Household Income | $73,772 | $25,301 |
| Monthly Housing Costs | $599 | $9,961 |
| Real Estate Taxes | $1,975 | $3,711 |
Property Value by Mortgage Status in Seminole County
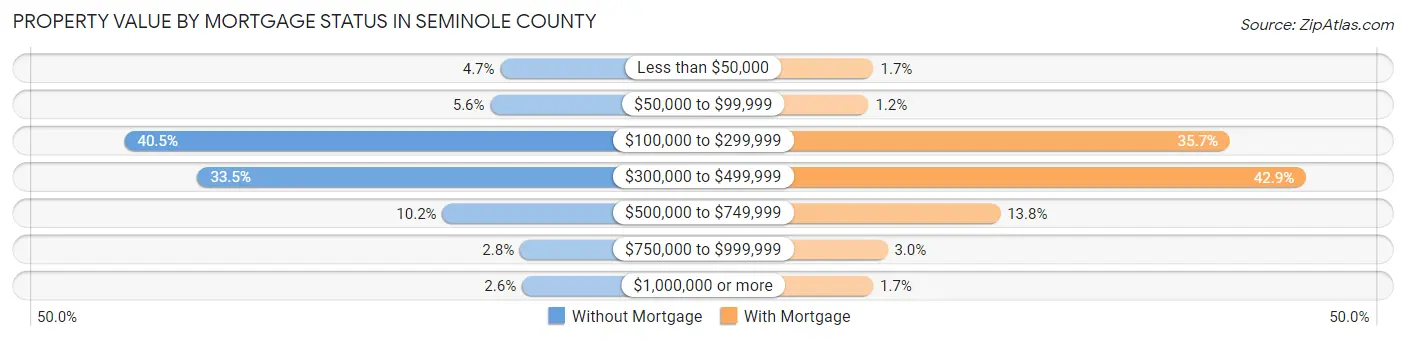
| Property Value | Without Mortgage | With Mortgage |
| Less than $50,000 | 1,855 (4.7%) | 1,394 (1.7%) |
| $50,000 to $99,999 | 2,233 (5.6%) | 995 (1.2%) |
| $100,000 to $299,999 | 16,017 (40.5%) | 28,851 (35.6%) |
| $300,000 to $499,999 | 13,267 (33.5%) | 34,733 (42.9%) |
| $500,000 to $749,999 | 4,040 (10.2%) | 11,153 (13.8%) |
| $750,000 to $999,999 | 1,117 (2.8%) | 2,460 (3.0%) |
| $1,000,000 or more | 1,039 (2.6%) | 1,352 (1.7%) |
| Total | 39,568 (100.0%) | 80,938 (100.0%) |
Household Income by Mortgage Status in Seminole County
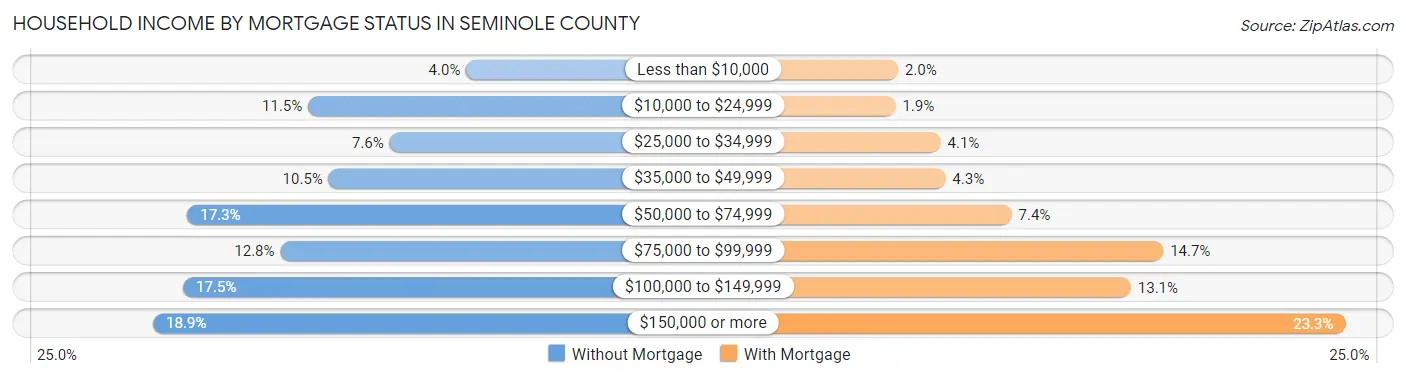
| Household Income | Without Mortgage | With Mortgage |
| Less than $10,000 | 1,569 (4.0%) | 1,632 (2.0%) |
| $10,000 to $24,999 | 4,551 (11.5%) | 1,537 (1.9%) |
| $25,000 to $34,999 | 3,017 (7.6%) | 3,278 (4.1%) |
| $35,000 to $49,999 | 4,164 (10.5%) | 3,463 (4.3%) |
| $50,000 to $74,999 | 6,824 (17.2%) | 6,017 (7.4%) |
| $75,000 to $99,999 | 5,071 (12.8%) | 11,855 (14.6%) |
| $100,000 to $149,999 | 6,903 (17.4%) | 10,611 (13.1%) |
| $150,000 or more | 7,469 (18.9%) | 18,876 (23.3%) |
| Total | 39,568 (100.0%) | 80,938 (100.0%) |
Property Value to Household Income Ratio in Seminole County
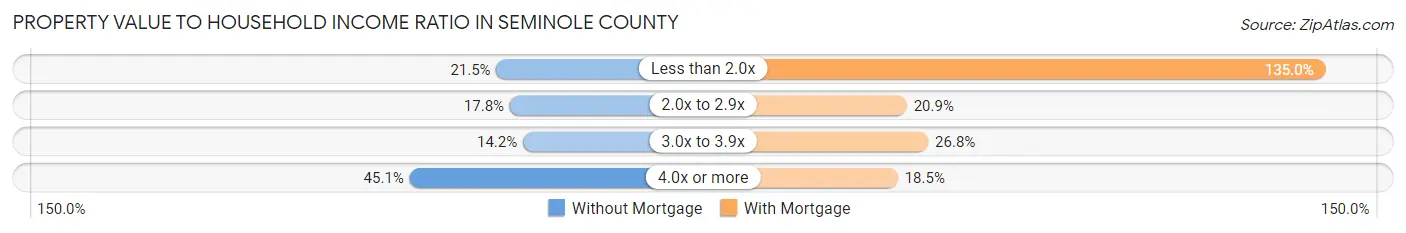
| Value-to-Income Ratio | Without Mortgage | With Mortgage |
| Less than 2.0x | 8,492 (21.5%) | 109,255 (135.0%) |
| 2.0x to 2.9x | 7,039 (17.8%) | 16,941 (20.9%) |
| 3.0x to 3.9x | 5,624 (14.2%) | 21,660 (26.8%) |
| 4.0x or more | 17,845 (45.1%) | 14,947 (18.5%) |
| Total | 39,568 (100.0%) | 80,938 (100.0%) |
Real Estate Taxes by Mortgage Status in Seminole County
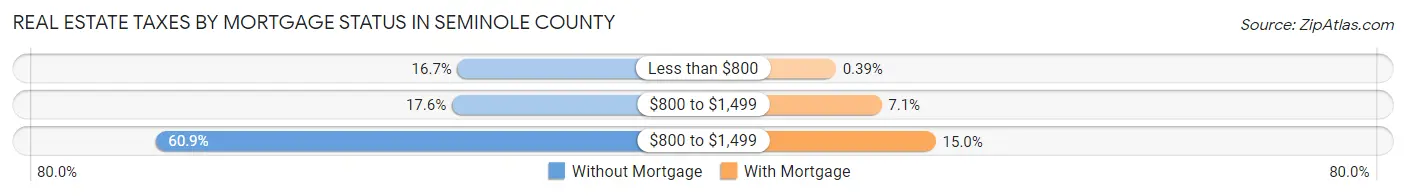
| Property Taxes | Without Mortgage | With Mortgage |
| Less than $800 | 6,614 (16.7%) | 315 (0.4%) |
| $800 to $1,499 | 6,945 (17.5%) | 5,713 (7.1%) |
| $800 to $1,499 | 24,093 (60.9%) | 12,136 (15.0%) |
| Total | 39,568 (100.0%) | 80,938 (100.0%) |
Health & Disability in Seminole County
Health Insurance Coverage by Age in Seminole County
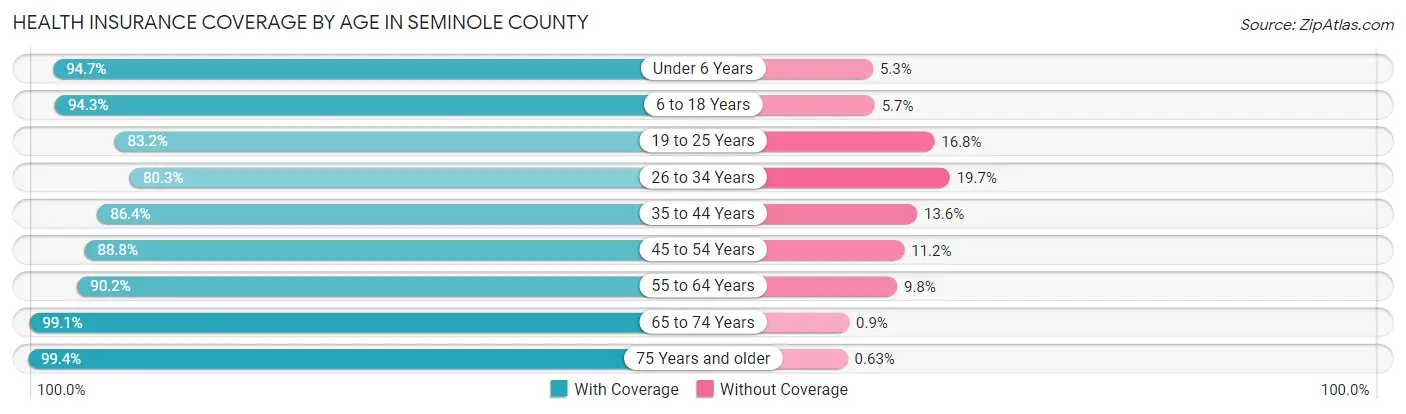
| Age Bracket | With Coverage | Without Coverage |
| Under 6 Years | 27,655 (94.7%) | 1,559 (5.3%) |
| 6 to 18 Years | 69,330 (94.3%) | 4,166 (5.7%) |
| 19 to 25 Years | 33,572 (83.2%) | 6,777 (16.8%) |
| 26 to 34 Years | 48,929 (80.3%) | 11,975 (19.7%) |
| 35 to 44 Years | 57,695 (86.4%) | 9,051 (13.6%) |
| 45 to 54 Years | 56,087 (88.8%) | 7,066 (11.2%) |
| 55 to 64 Years | 54,381 (90.2%) | 5,938 (9.8%) |
| 65 to 74 Years | 43,504 (99.1%) | 395 (0.9%) |
| 75 Years and older | 29,527 (99.4%) | 188 (0.6%) |
| Total | 420,680 (89.9%) | 47,115 (10.1%) |
Health Insurance Coverage by Citizenship Status in Seminole County
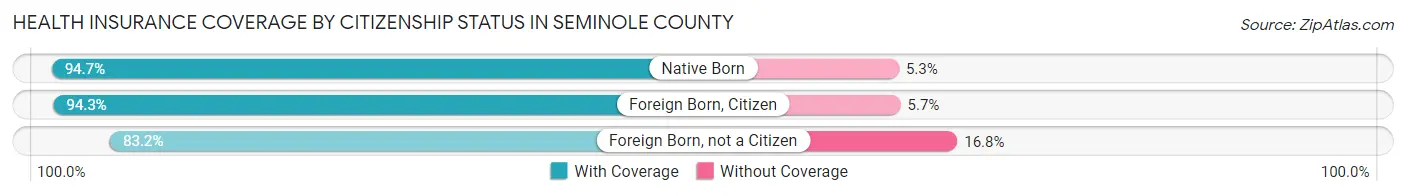
| Citizenship Status | With Coverage | Without Coverage |
| Native Born | 27,655 (94.7%) | 1,559 (5.3%) |
| Foreign Born, Citizen | 69,330 (94.3%) | 4,166 (5.7%) |
| Foreign Born, not a Citizen | 33,572 (83.2%) | 6,777 (16.8%) |
Health Insurance Coverage by Household Income in Seminole County
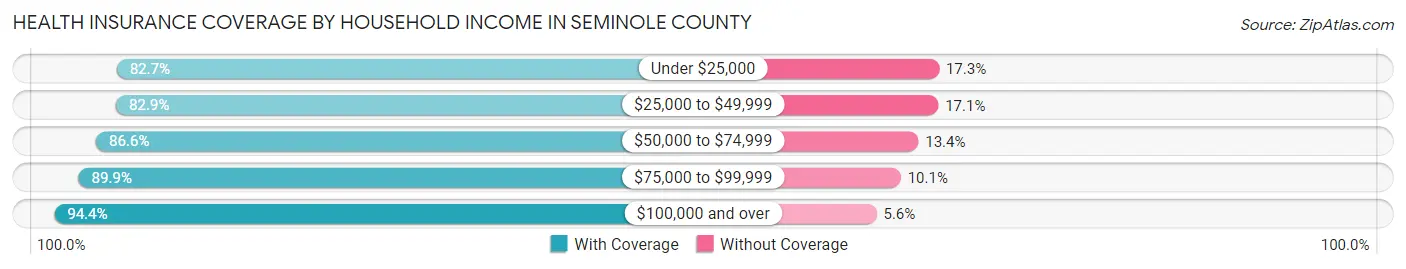
| Household Income | With Coverage | Without Coverage |
| Under $25,000 | 30,994 (82.7%) | 6,470 (17.3%) |
| $25,000 to $49,999 | 56,106 (82.9%) | 11,601 (17.1%) |
| $50,000 to $74,999 | 63,900 (86.6%) | 9,885 (13.4%) |
| $75,000 to $99,999 | 59,400 (89.9%) | 6,679 (10.1%) |
| $100,000 and over | 209,049 (94.4%) | 12,327 (5.6%) |
Public vs Private Health Insurance Coverage by Age in Seminole County
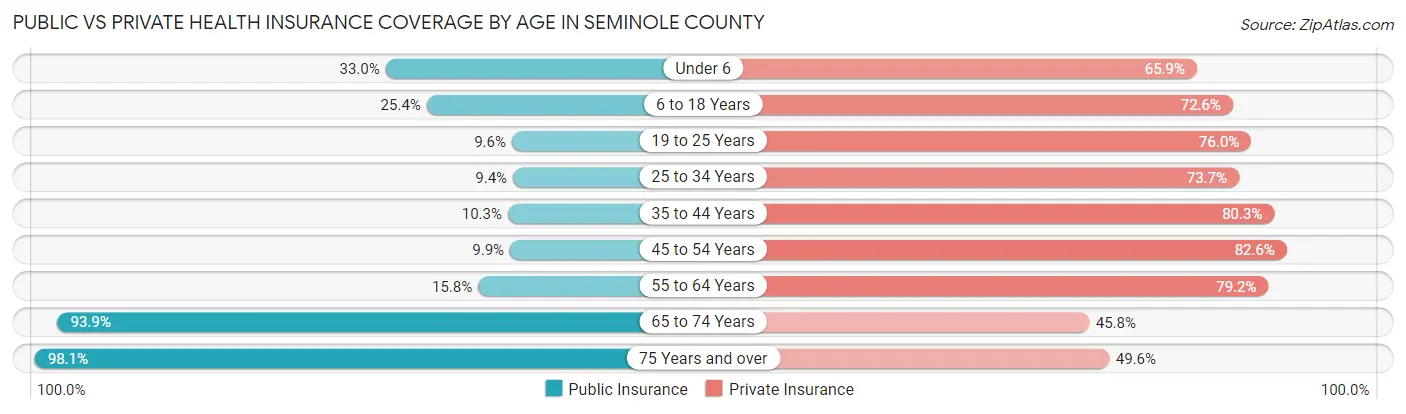
| Age Bracket | Public Insurance | Private Insurance |
| Under 6 | 9,640 (33.0%) | 19,249 (65.9%) |
| 6 to 18 Years | 18,649 (25.4%) | 53,335 (72.6%) |
| 19 to 25 Years | 3,857 (9.6%) | 30,659 (76.0%) |
| 25 to 34 Years | 5,703 (9.4%) | 44,882 (73.7%) |
| 35 to 44 Years | 6,884 (10.3%) | 53,568 (80.3%) |
| 45 to 54 Years | 6,256 (9.9%) | 52,147 (82.6%) |
| 55 to 64 Years | 9,553 (15.8%) | 47,751 (79.2%) |
| 65 to 74 Years | 41,216 (93.9%) | 20,124 (45.8%) |
| 75 Years and over | 29,149 (98.1%) | 14,730 (49.6%) |
| Total | 130,907 (28.0%) | 336,445 (71.9%) |
Disability Status by Sex by Age in Seminole County
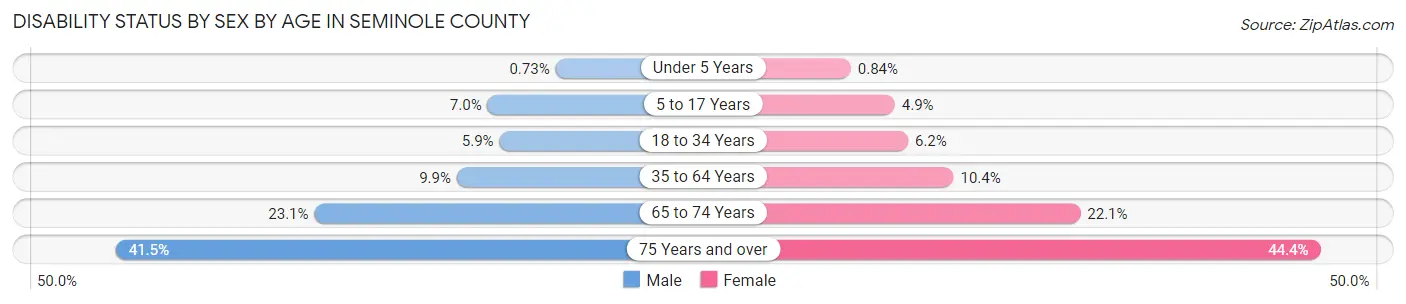
| Age Bracket | Male | Female |
| Under 5 Years | 88 (0.7%) | 97 (0.8%) |
| 5 to 17 Years | 2,638 (7.0%) | 1,789 (4.9%) |
| 18 to 34 Years | 3,177 (5.9%) | 3,252 (6.1%) |
| 35 to 64 Years | 9,175 (9.9%) | 10,109 (10.4%) |
| 65 to 74 Years | 4,626 (23.1%) | 5,289 (22.1%) |
| 75 Years and over | 5,077 (41.5%) | 7,769 (44.4%) |
Disability Class by Sex by Age in Seminole County
Disability Class: Hearing Difficulty
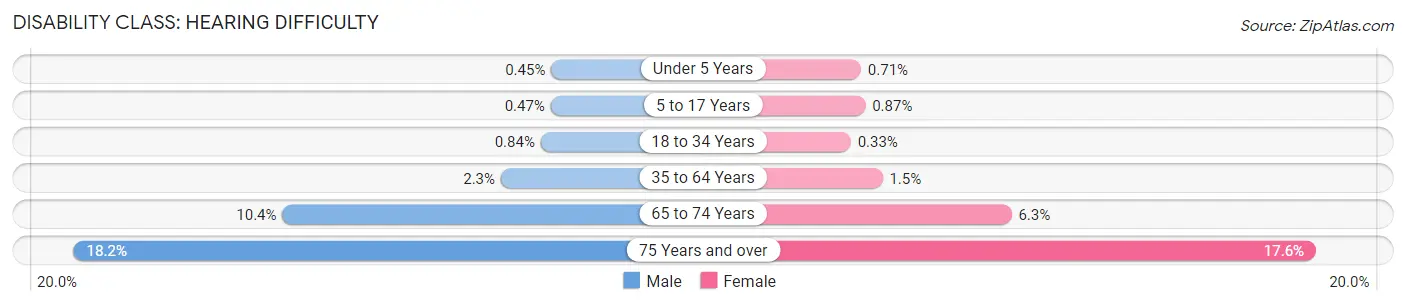
| Age Bracket | Male | Female |
| Under 5 Years | 55 (0.4%) | 82 (0.7%) |
| 5 to 17 Years | 178 (0.5%) | 315 (0.9%) |
| 18 to 34 Years | 452 (0.8%) | 173 (0.3%) |
| 35 to 64 Years | 2,151 (2.3%) | 1,471 (1.5%) |
| 65 to 74 Years | 2,087 (10.4%) | 1,505 (6.3%) |
| 75 Years and over | 2,222 (18.2%) | 3,079 (17.6%) |
Disability Class: Vision Difficulty
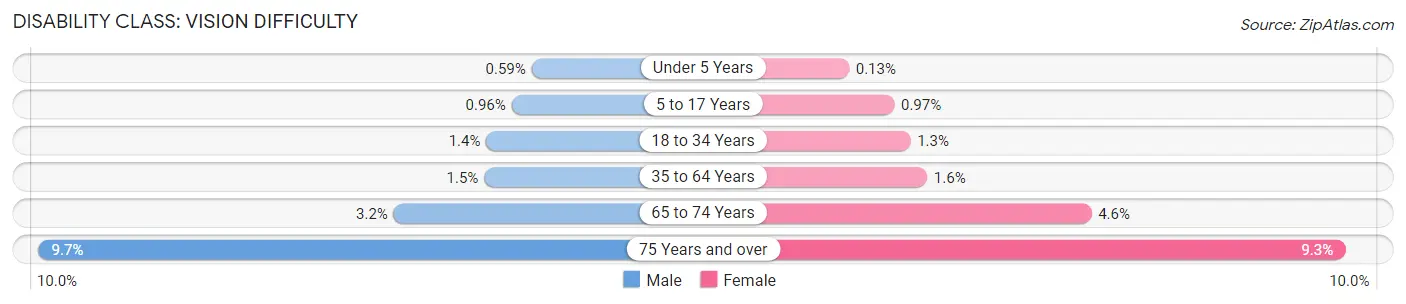
| Age Bracket | Male | Female |
| Under 5 Years | 72 (0.6%) | 15 (0.1%) |
| 5 to 17 Years | 360 (1.0%) | 352 (1.0%) |
| 18 to 34 Years | 766 (1.4%) | 673 (1.3%) |
| 35 to 64 Years | 1,363 (1.5%) | 1,542 (1.6%) |
| 65 to 74 Years | 631 (3.2%) | 1,106 (4.6%) |
| 75 Years and over | 1,191 (9.7%) | 1,633 (9.3%) |
Disability Class: Cognitive Difficulty
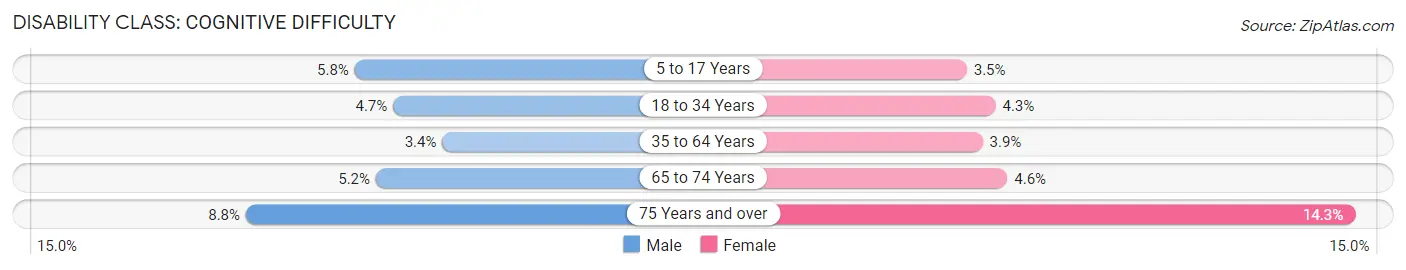
| Age Bracket | Male | Female |
| 5 to 17 Years | 2,179 (5.8%) | 1,265 (3.5%) |
| 18 to 34 Years | 2,539 (4.7%) | 2,264 (4.3%) |
| 35 to 64 Years | 3,125 (3.4%) | 3,820 (3.9%) |
| 65 to 74 Years | 1,044 (5.2%) | 1,102 (4.6%) |
| 75 Years and over | 1,080 (8.8%) | 2,500 (14.3%) |
Disability Class: Ambulatory Difficulty
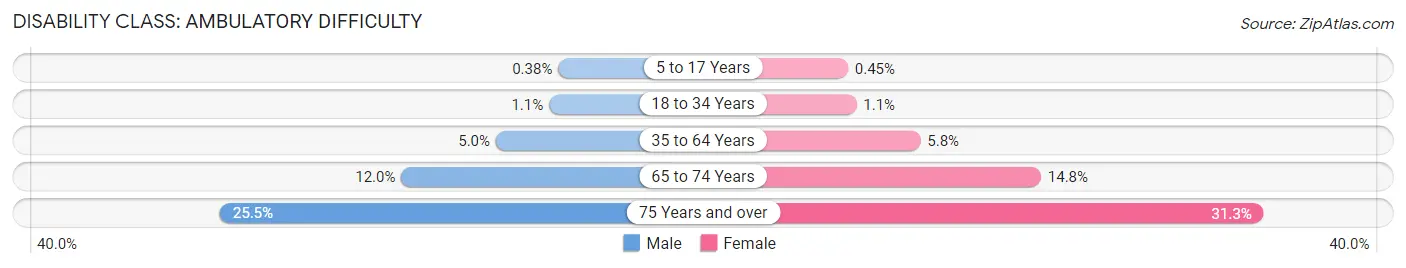
| Age Bracket | Male | Female |
| 5 to 17 Years | 144 (0.4%) | 162 (0.4%) |
| 18 to 34 Years | 566 (1.1%) | 571 (1.1%) |
| 35 to 64 Years | 4,647 (5.0%) | 5,684 (5.8%) |
| 65 to 74 Years | 2,407 (12.0%) | 3,531 (14.8%) |
| 75 Years and over | 3,117 (25.5%) | 5,478 (31.3%) |
Disability Class: Self-Care Difficulty
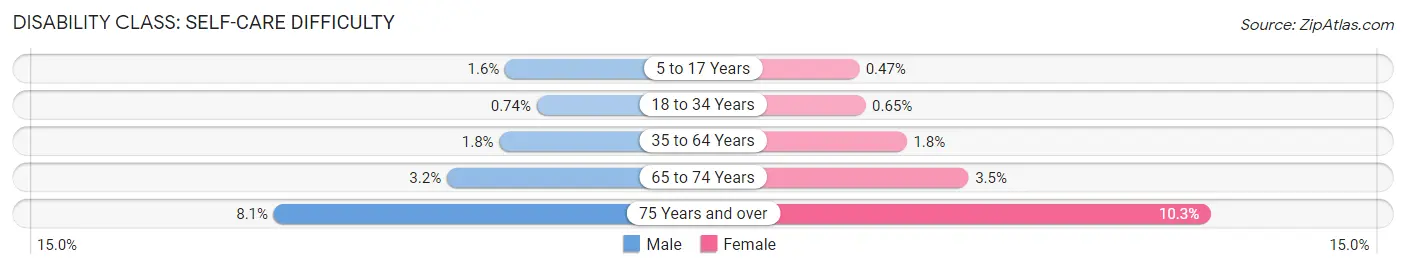
| Age Bracket | Male | Female |
| 5 to 17 Years | 606 (1.6%) | 171 (0.5%) |
| 18 to 34 Years | 399 (0.7%) | 343 (0.6%) |
| 35 to 64 Years | 1,654 (1.8%) | 1,751 (1.8%) |
| 65 to 74 Years | 649 (3.2%) | 840 (3.5%) |
| 75 Years and over | 985 (8.1%) | 1,798 (10.3%) |
Technology Access in Seminole County
Computing Device Access in Seminole County
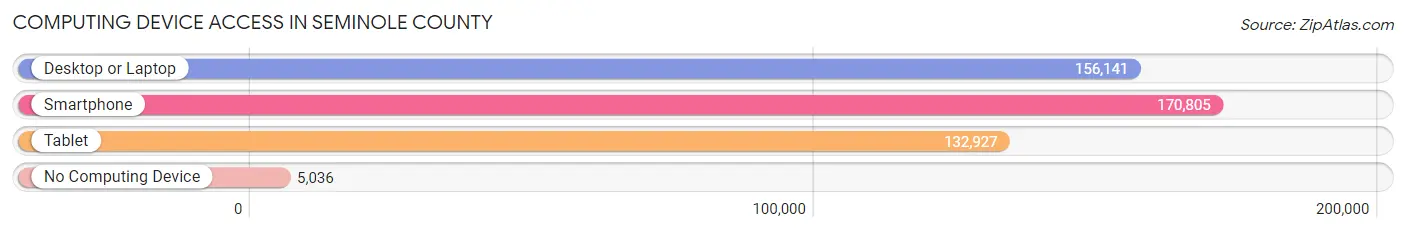
| Device Type | # Households | % Households |
| Desktop or Laptop | 156,141 | 85.1% |
| Smartphone | 170,805 | 93.1% |
| Tablet | 132,927 | 72.4% |
| No Computing Device | 5,036 | 2.7% |
| Total | 183,487 | 100.0% |
Internet Access in Seminole County
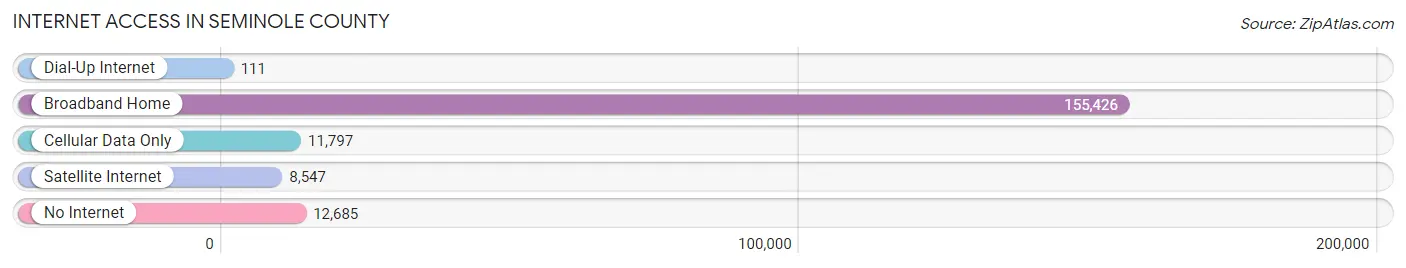
| Internet Type | # Households | % Households |
| Dial-Up Internet | 111 | 0.1% |
| Broadband Home | 155,426 | 84.7% |
| Cellular Data Only | 11,797 | 6.4% |
| Satellite Internet | 8,547 | 4.7% |
| No Internet | 12,685 | 6.9% |
| Total | 183,487 | 100.0% |
Seminole County Summary
Seminole County, Florida is located in the central part of the state, just north of Orlando. It is part of the Orlando-Kissimmee-Sanford Metropolitan Statistical Area and is home to over 446,000 people. The county is bordered by Orange County to the south, Volusia County to the east, and Lake County to the west.
History
Seminole County was created in 1913 from parts of Orange and Volusia counties. It was named after the Seminole Native American tribe, which had inhabited the area for centuries. The county was originally home to citrus groves and cattle ranches, but in the 1950s and 1960s, the population began to grow rapidly as people moved to the area for its proximity to Orlando.
Geography
Seminole County covers an area of 845 square miles and is located in the central part of the state. It is bordered by Orange County to the south, Volusia County to the east, and Lake County to the west. The county is home to several lakes, including Lake Jesup, Lake Mary Jane, and Lake Monroe. The county also contains part of the Ocala National Forest, which is the second-largest national forest in the state.
Economy
Seminole County has a diverse economy, with a mix of industries including tourism, manufacturing, healthcare, and technology. The county is home to several major employers, including the University of Central Florida, AdventHealth, and Lockheed Martin. Tourism is a major industry in the county, with attractions such as Disney World, Universal Studios, and SeaWorld drawing millions of visitors each year.
Demographics
As of the 2020 census, Seminole County had a population of 446,000. The population is fairly diverse, with the largest racial/ethnic groups being White (63.2%), Hispanic or Latino (19.2%), and Black or African American (13.2%). The median household income is $60,000, and the median age is 38.
Seminole County is a vibrant and diverse community with a strong economy and a rich history. It is home to a variety of attractions and businesses, and its population is growing rapidly. With its proximity to Orlando and its many amenities, Seminole County is an attractive place to live and work.
Common Questions
What is Per Capita Income in Seminole County?
Per Capita income in Seminole County is $42,281.
What is the Median Family Income in Seminole County?
Median Family Income in Seminole County is $96,839.
What is the Median Household income in Seminole County?
Median Household Income in Seminole County is $79,490.
What is Income or Wage Gap in Seminole County?
Income or Wage Gap in Seminole County is 20.2%.
Women in Seminole County earn 79.8 cents for every dollar earned by a man.
What is Family Income Deficit in Seminole County?
Family Income Deficit in Seminole County is $10,122.
Families that are below poverty line in Seminole County earn $10,122 less on average than the poverty threshold level.
What is Inequality or Gini Index in Seminole County?
Inequality or Gini Index in Seminole County is 0.45.
What is the Total Population of Seminole County?
Total Population of Seminole County is 471,321.
What is the Total Male Population of Seminole County?
Total Male Population of Seminole County is 229,821.
What is the Total Female Population of Seminole County?
Total Female Population of Seminole County is 241,500.
What is the Ratio of Males per 100 Females in Seminole County?
There are 95.16 Males per 100 Females in Seminole County.
What is the Ratio of Females per 100 Males in Seminole County?
There are 105.08 Females per 100 Males in Seminole County.
What is the Median Population Age in Seminole County?
Median Population Age in Seminole County is 39.6 Years.
What is the Average Family Size in Seminole County
Average Family Size in Seminole County is 3.1 People.
What is the Average Household Size in Seminole County
Average Household Size in Seminole County is 2.5 People.
How Large is the Labor Force in Seminole County?
There are 259,654 People in the Labor Forcein in Seminole County.
What is the Percentage of People in the Labor Force in Seminole County?
67.3% of People are in the Labor Force in Seminole County.
What is the Unemployment Rate in Seminole County?
Unemployment Rate in Seminole County is 4.3%.