Orange County, FL Map & Demographics
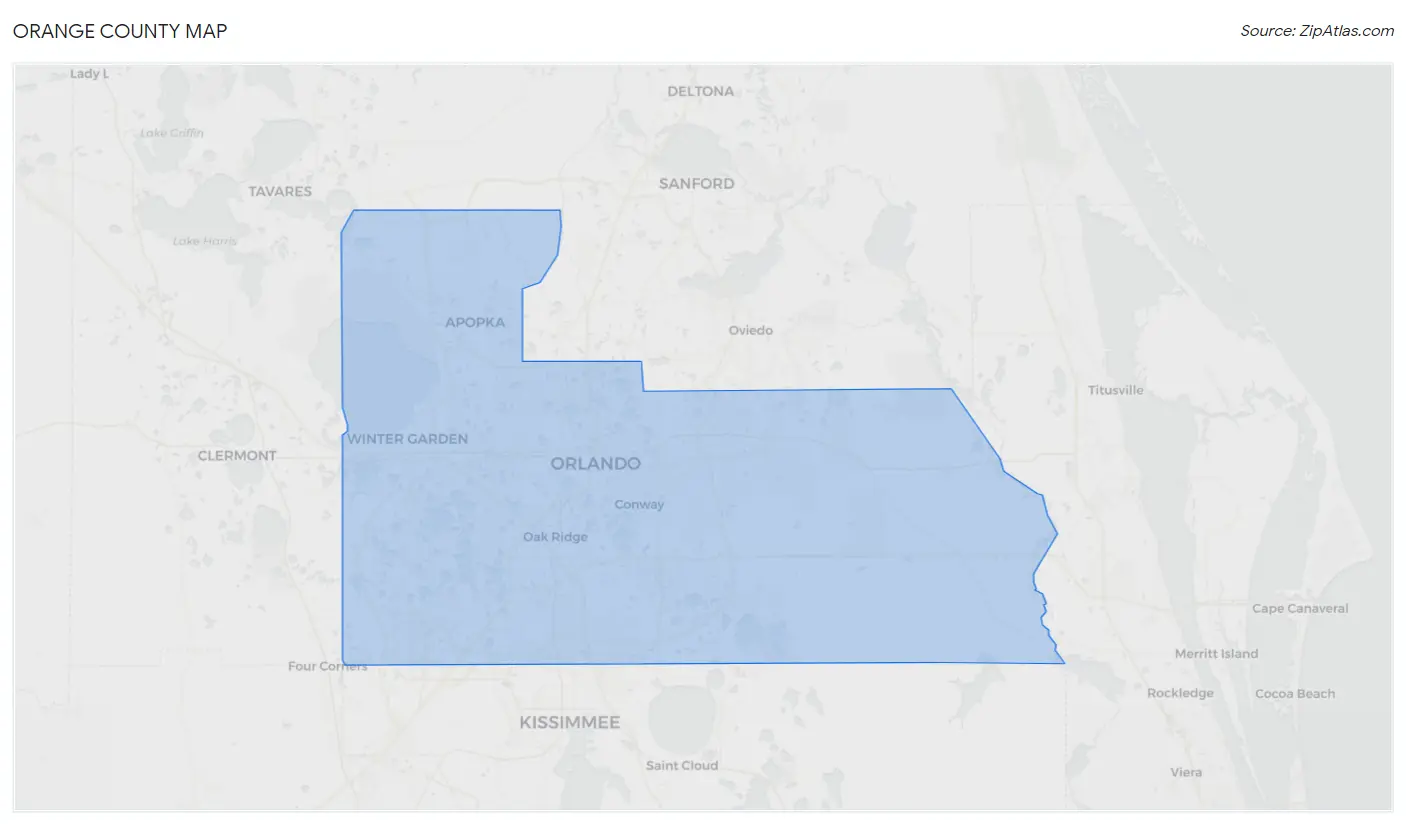
Orange County Map
Orange County Overview
$37,330
PER CAPITA INCOME
$83,625
AVG FAMILY INCOME
$72,629
AVG HOUSEHOLD INCOME
22.6%
WAGE / INCOME GAP [ % ]
77.4¢/ $1
WAGE / INCOME GAP [ $ ]
$10,759
FAMILY INCOME DEFICIT
0.48
INEQUALITY / GINI INDEX
1,427,403
TOTAL POPULATION
704,643
MALE POPULATION
722,760
FEMALE POPULATION
97.49
MALES / 100 FEMALES
102.57
FEMALES / 100 MALES
35.9
MEDIAN AGE
3.4
AVG FAMILY SIZE
2.8
AVG HOUSEHOLD SIZE
773,818
LABOR FORCE [ PEOPLE ]
67.1%
PERCENT IN LABOR FORCE
5.5%
UNEMPLOYMENT RATE
Income in Orange County
Income Overview in Orange County
Per Capita Income in Orange County is $37,330, while median incomes of families and households are $83,625 and $72,629 respectively.
| Characteristic | Number | Measure |
| Per Capita Income | 1,427,403 | $37,330 |
| Median Family Income | 326,446 | $83,625 |
| Mean Family Income | 326,446 | $117,200 |
| Median Household Income | 491,378 | $72,629 |
| Mean Household Income | 491,378 | $103,222 |
| Income Deficit | 326,446 | $10,759 |
| Wage / Income Gap (%) | 1,427,403 | 22.60% |
| Wage / Income Gap ($) | 1,427,403 | 77.40¢ per $1 |
| Gini / Inequality Index | 1,427,403 | 0.48 |
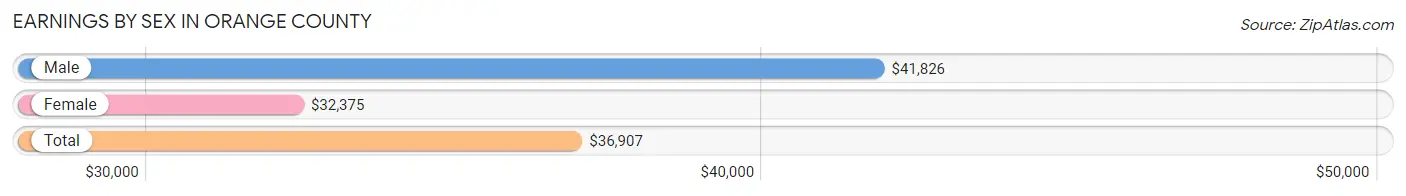
Earnings by Sex in Orange County
Average Earnings in Orange County are $36,907, $41,826 for men and $32,375 for women, a difference of 22.6%.
| Sex | Number | Average Earnings |
| Male | 414,478 (52.6%) | $41,826 |
| Female | 374,173 (47.4%) | $32,375 |
| Total | 788,651 (100.0%) | $36,907 |
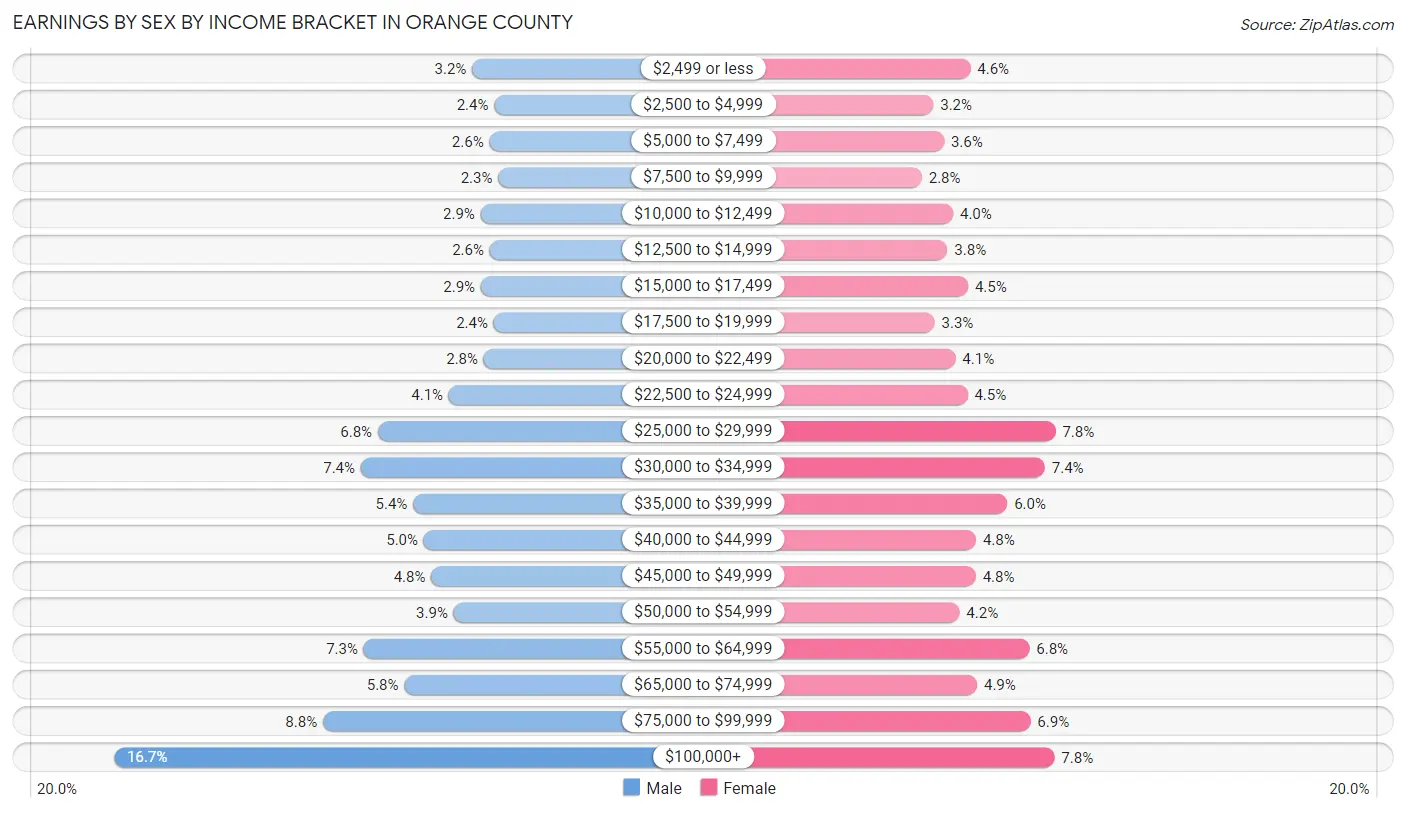
Earnings by Sex by Income Bracket in Orange County
The most common earnings brackets in Orange County are $100,000+ for men (69,021 | 16.7%) and $25,000 to $29,999 for women (29,258 | 7.8%).
| Income | Male | Female |
| $2,499 or less | 13,369 (3.2%) | 17,311 (4.6%) |
| $2,500 to $4,999 | 9,931 (2.4%) | 12,130 (3.2%) |
| $5,000 to $7,499 | 10,685 (2.6%) | 13,612 (3.6%) |
| $7,500 to $9,999 | 9,338 (2.2%) | 10,508 (2.8%) |
| $10,000 to $12,499 | 12,050 (2.9%) | 14,888 (4.0%) |
| $12,500 to $14,999 | 10,636 (2.6%) | 14,089 (3.8%) |
| $15,000 to $17,499 | 12,027 (2.9%) | 16,976 (4.5%) |
| $17,500 to $19,999 | 10,046 (2.4%) | 12,311 (3.3%) |
| $20,000 to $22,499 | 11,549 (2.8%) | 15,225 (4.1%) |
| $22,500 to $24,999 | 16,983 (4.1%) | 16,923 (4.5%) |
| $25,000 to $29,999 | 28,002 (6.8%) | 29,258 (7.8%) |
| $30,000 to $34,999 | 30,665 (7.4%) | 27,768 (7.4%) |
| $35,000 to $39,999 | 22,556 (5.4%) | 22,498 (6.0%) |
| $40,000 to $44,999 | 20,905 (5.0%) | 18,109 (4.8%) |
| $45,000 to $49,999 | 19,746 (4.8%) | 18,089 (4.8%) |
| $50,000 to $54,999 | 16,267 (3.9%) | 15,781 (4.2%) |
| $55,000 to $64,999 | 30,195 (7.3%) | 25,593 (6.8%) |
| $65,000 to $74,999 | 23,933 (5.8%) | 18,251 (4.9%) |
| $75,000 to $99,999 | 36,574 (8.8%) | 25,746 (6.9%) |
| $100,000+ | 69,021 (16.7%) | 29,107 (7.8%) |
| Total | 414,478 (100.0%) | 374,173 (100.0%) |
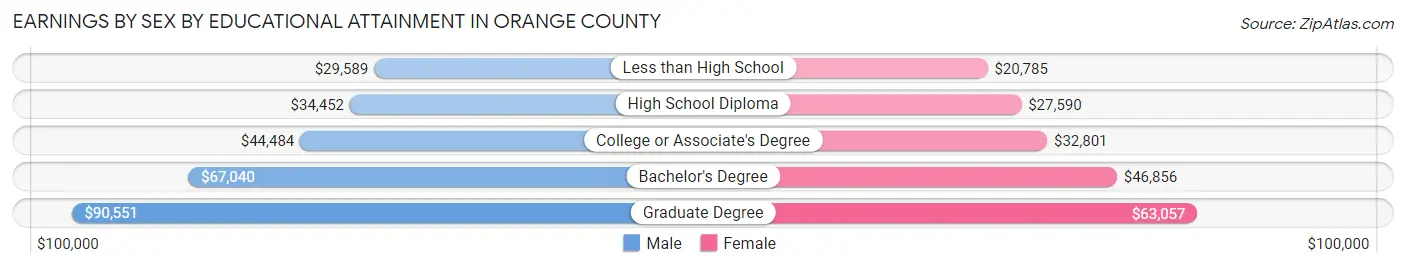
Earnings by Sex by Educational Attainment in Orange County
Average earnings in Orange County are $47,269 for men and $36,394 for women, a difference of 23.0%. Men with an educational attainment of graduate degree enjoy the highest average annual earnings of $90,551, while those with less than high school education earn the least with $29,589. Women with an educational attainment of graduate degree earn the most with the average annual earnings of $63,057, while those with less than high school education have the smallest earnings of $20,785.
| Educational Attainment | Male Income | Female Income |
| Less than High School | $29,589 | $20,785 |
| High School Diploma | $34,452 | $27,590 |
| College or Associate's Degree | $44,484 | $32,801 |
| Bachelor's Degree | $67,040 | $46,856 |
| Graduate Degree | $90,551 | $63,057 |
| Total | $47,269 | $36,394 |
Family Income in Orange County
Family Income Brackets in Orange County
According to the Orange County family income data, there are 62,351 families falling into the $100,000 to $149,999 income range, which is the most common income bracket and makes up 19.1% of all families. Conversely, the $10,000 to $14,999 income bracket is the least frequent group with only 5,550 families (1.7%) belonging to this category.
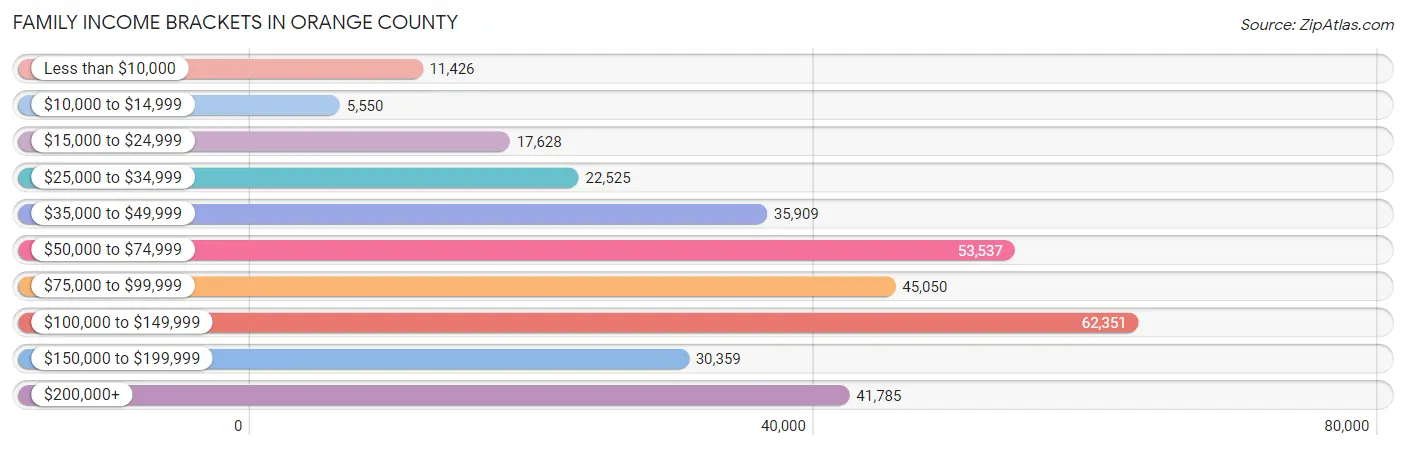
| Income Bracket | # Families | % Families |
| Less than $10,000 | 11,426 | 3.5% |
| $10,000 to $14,999 | 5,550 | 1.7% |
| $15,000 to $24,999 | 17,628 | 5.4% |
| $25,000 to $34,999 | 22,525 | 6.9% |
| $35,000 to $49,999 | 35,909 | 11.0% |
| $50,000 to $74,999 | 53,537 | 16.4% |
| $75,000 to $99,999 | 45,050 | 13.8% |
| $100,000 to $149,999 | 62,351 | 19.1% |
| $150,000 to $199,999 | 30,359 | 9.3% |
| $200,000+ | 41,785 | 12.8% |
Family Income by Famaliy Size in Orange County
7+ person families (5,795 | 1.8%) account for the highest median family income in Orange County with $100,044 per family, while 2-person families (138,333 | 42.4%) have the highest median income of $37,214 per family member.
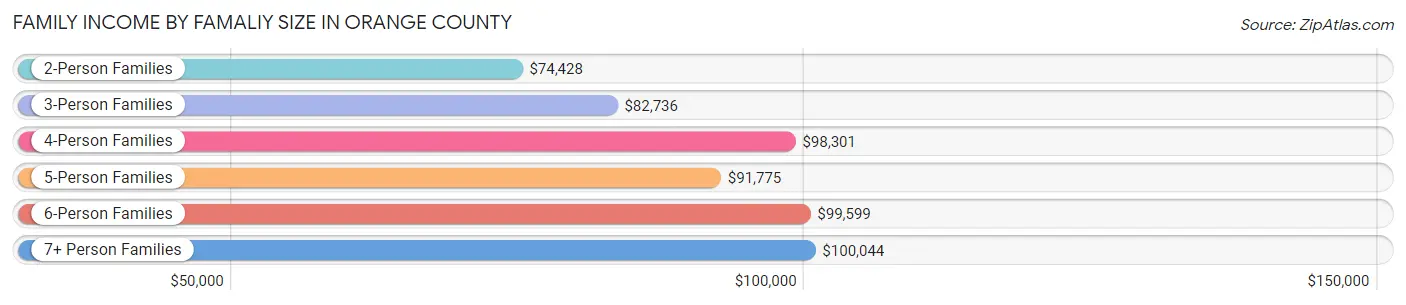
| Income Bracket | # Families | Median Income |
| 2-Person Families | 138,333 (42.4%) | $74,428 |
| 3-Person Families | 80,564 (24.7%) | $82,736 |
| 4-Person Families | 62,588 (19.2%) | $98,301 |
| 5-Person Families | 29,611 (9.1%) | $91,775 |
| 6-Person Families | 9,555 (2.9%) | $99,599 |
| 7+ Person Families | 5,795 (1.8%) | $100,044 |
| Total | 326,446 (100.0%) | $83,625 |
Family Income by Number of Earners in Orange County
The median family income in Orange County is $83,625, with families comprising 3+ earners (42,452) having the highest median family income of $118,668, while families with no earners (37,450) have the lowest median family income of $36,916, accounting for 13.0% and 11.5% of families, respectively.
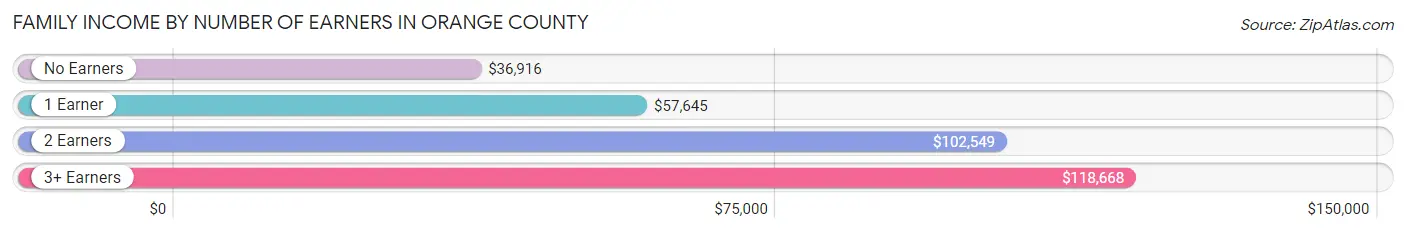
| Number of Earners | # Families | Median Income |
| No Earners | 37,450 (11.5%) | $36,916 |
| 1 Earner | 106,515 (32.6%) | $57,645 |
| 2 Earners | 140,029 (42.9%) | $102,549 |
| 3+ Earners | 42,452 (13.0%) | $118,668 |
| Total | 326,446 (100.0%) | $83,625 |
Household Income in Orange County
Household Income Brackets in Orange County
With 85,500 households falling in the category, the $50,000 to $74,999 income range is the most frequent in Orange County, accounting for 17.4% of all households. In contrast, only 14,741 households (3.0%) fall into the $10,000 to $14,999 income bracket, making it the least populous group.
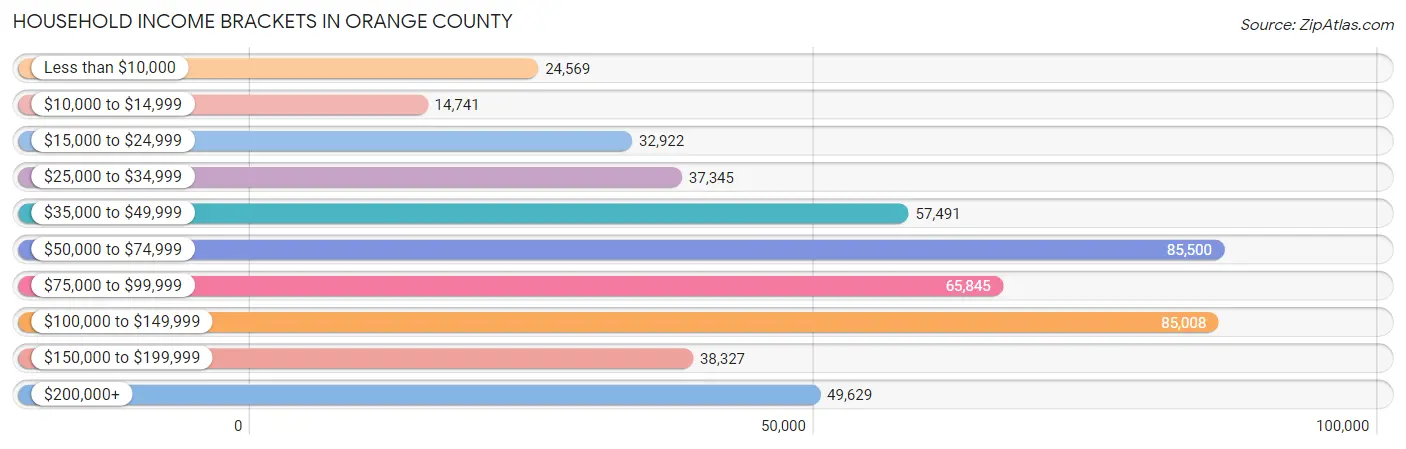
| Income Bracket | # Households | % Households |
| Less than $10,000 | 24,569 | 5.0% |
| $10,000 to $14,999 | 14,741 | 3.0% |
| $15,000 to $24,999 | 32,922 | 6.7% |
| $25,000 to $34,999 | 37,345 | 7.6% |
| $35,000 to $49,999 | 57,491 | 11.7% |
| $50,000 to $74,999 | 85,500 | 17.4% |
| $75,000 to $99,999 | 65,845 | 13.4% |
| $100,000 to $149,999 | 85,008 | 17.3% |
| $150,000 to $199,999 | 38,327 | 7.8% |
| $200,000+ | 49,629 | 10.1% |
Household Income by Householder Age in Orange County
The median household income in Orange County is $72,629, with the highest median household income of $84,681 found in the 45 to 64 years age bracket for the primary householder. A total of 182,585 households (37.2%) fall into this category. Meanwhile, the 15 to 24 years age bracket for the primary householder has the lowest median household income of $42,220, with 19,253 households (3.9%) in this group.
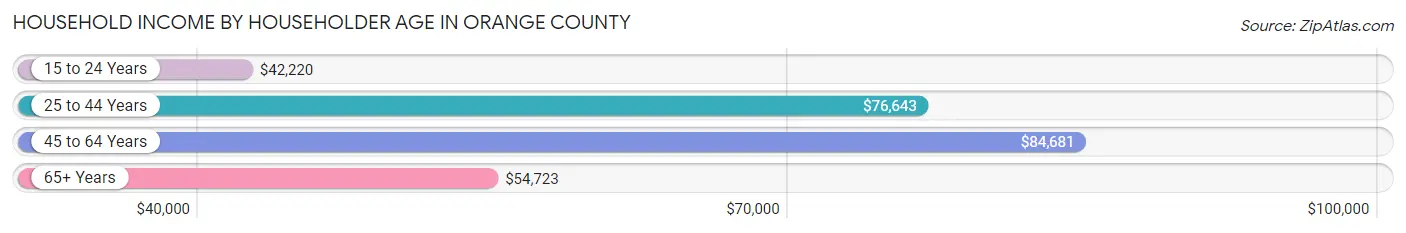
| Income Bracket | # Households | Median Income |
| 15 to 24 Years | 19,253 (3.9%) | $42,220 |
| 25 to 44 Years | 193,878 (39.5%) | $76,643 |
| 45 to 64 Years | 182,585 (37.2%) | $84,681 |
| 65+ Years | 95,662 (19.5%) | $54,723 |
| Total | 491,378 (100.0%) | $72,629 |
Poverty in Orange County
Income Below Poverty by Sex and Age in Orange County
With 12.4% poverty level for males and 14.5% for females among the residents of Orange County, 5 year old males and 18 to 24 year old females are the most vulnerable to poverty, with 1,787 males (20.9%) and 14,005 females (21.7%) in their respective age groups living below the poverty level.
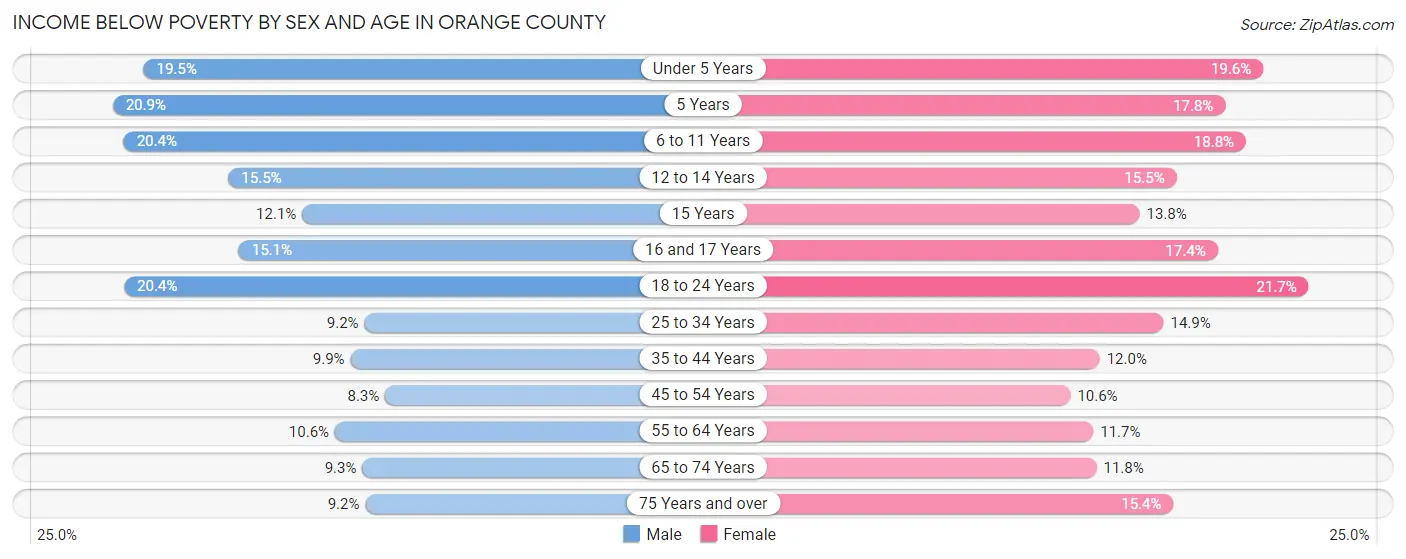
| Age Bracket | Male | Female |
| Under 5 Years | 8,028 (19.5%) | 7,722 (19.6%) |
| 5 Years | 1,787 (20.9%) | 1,391 (17.8%) |
| 6 to 11 Years | 10,609 (20.4%) | 9,092 (18.8%) |
| 12 to 14 Years | 4,188 (15.5%) | 4,109 (15.5%) |
| 15 Years | 1,179 (12.1%) | 1,257 (13.8%) |
| 16 and 17 Years | 2,574 (15.1%) | 2,932 (17.4%) |
| 18 to 24 Years | 12,796 (20.4%) | 14,005 (21.7%) |
| 25 to 34 Years | 10,655 (9.2%) | 17,149 (14.9%) |
| 35 to 44 Years | 10,196 (9.9%) | 12,407 (12.0%) |
| 45 to 54 Years | 7,600 (8.3%) | 9,838 (10.6%) |
| 55 to 64 Years | 8,379 (10.6%) | 9,642 (11.7%) |
| 65 to 74 Years | 4,569 (9.3%) | 6,811 (11.8%) |
| 75 Years and over | 2,518 (9.2%) | 6,021 (15.4%) |
| Total | 85,078 (12.4%) | 102,376 (14.5%) |
Income Above Poverty by Sex and Age in Orange County
According to the poverty statistics in Orange County, males aged 45 to 54 years and females aged 45 to 54 years are the age groups that are most secure financially, with 91.7% of males and 89.4% of females in these age groups living above the poverty line.
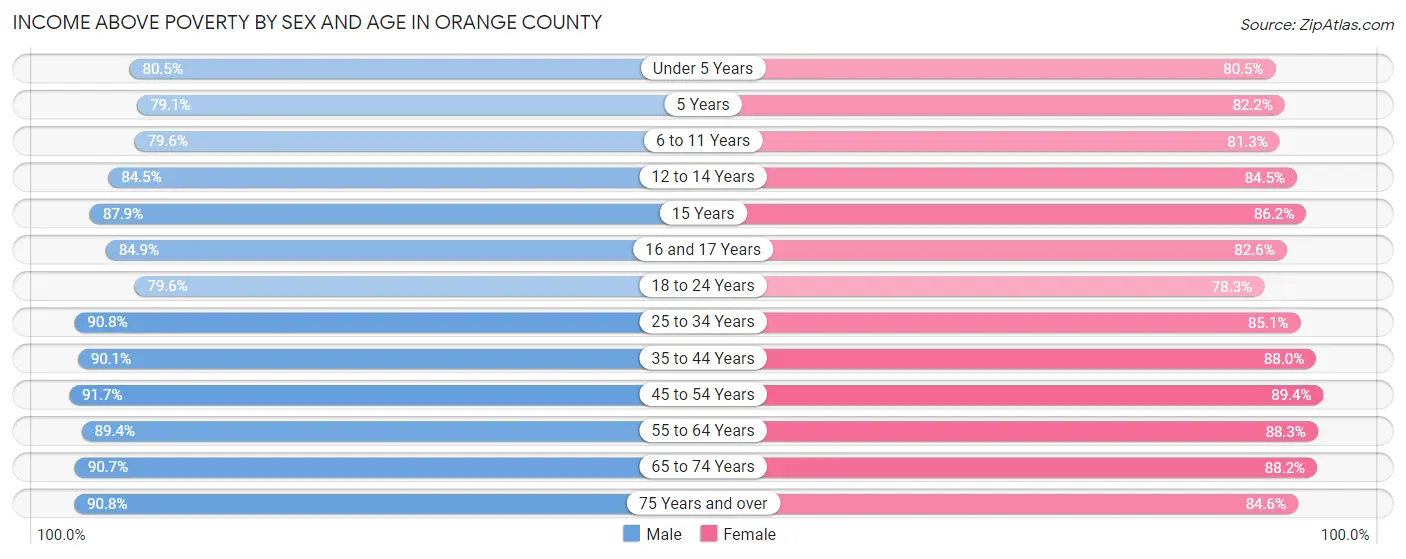
| Age Bracket | Male | Female |
| Under 5 Years | 33,182 (80.5%) | 31,772 (80.4%) |
| 5 Years | 6,760 (79.1%) | 6,426 (82.2%) |
| 6 to 11 Years | 41,391 (79.6%) | 39,408 (81.2%) |
| 12 to 14 Years | 22,764 (84.5%) | 22,341 (84.5%) |
| 15 Years | 8,545 (87.9%) | 7,841 (86.2%) |
| 16 and 17 Years | 14,520 (84.9%) | 13,883 (82.6%) |
| 18 to 24 Years | 49,995 (79.6%) | 50,648 (78.3%) |
| 25 to 34 Years | 104,794 (90.8%) | 97,720 (85.1%) |
| 35 to 44 Years | 92,977 (90.1%) | 91,212 (88.0%) |
| 45 to 54 Years | 84,287 (91.7%) | 82,850 (89.4%) |
| 55 to 64 Years | 70,683 (89.4%) | 73,015 (88.3%) |
| 65 to 74 Years | 44,383 (90.7%) | 50,807 (88.2%) |
| 75 Years and over | 24,892 (90.8%) | 33,118 (84.6%) |
| Total | 599,173 (87.6%) | 601,041 (85.5%) |
Income Below Poverty Among Married-Couple Families in Orange County
The poverty statistics for married-couple families in Orange County show that 6.2% or 14,055 of the total 228,229 families live below the poverty line. Families with 5 or more children have the highest poverty rate of 32.4%, comprising of 315 families. On the other hand, families with no children have the lowest poverty rate of 4.6%, which includes 5,832 families.
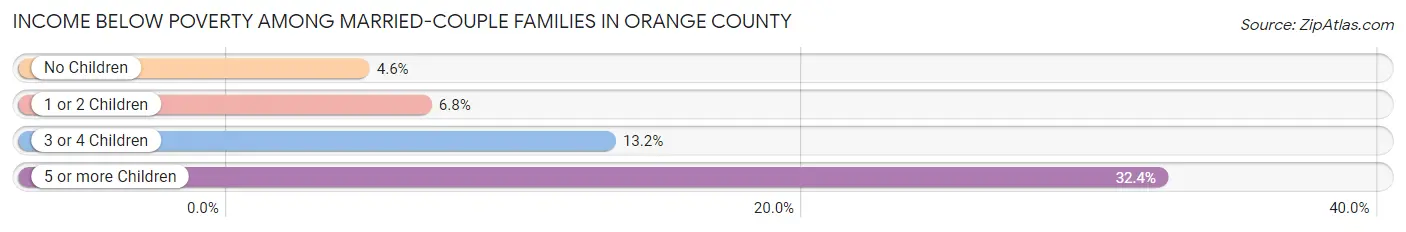
| Children | Above Poverty | Below Poverty |
| No Children | 121,165 (95.4%) | 5,832 (4.6%) |
| 1 or 2 Children | 76,940 (93.2%) | 5,572 (6.8%) |
| 3 or 4 Children | 15,411 (86.8%) | 2,336 (13.2%) |
| 5 or more Children | 658 (67.6%) | 315 (32.4%) |
| Total | 214,174 (93.8%) | 14,055 (6.2%) |
Income Below Poverty Among Single-Parent Households in Orange County
According to the poverty data in Orange County, 12.8% or 3,570 single-father households and 21.6% or 15,213 single-mother households are living below the poverty line. Among single-father households, those with 5 or more children have the highest poverty rate, with 45 households (64.3%) experiencing poverty. Likewise, among single-mother households, those with 5 or more children have the highest poverty rate, with 516 households (61.1%) falling below the poverty line.
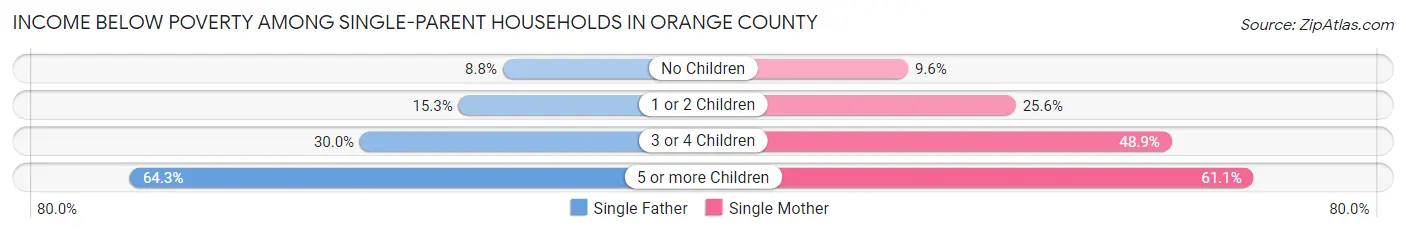
| Children | Single Father | Single Mother |
| No Children | 1,303 (8.7%) | 2,658 (9.6%) |
| 1 or 2 Children | 1,753 (15.3%) | 9,182 (25.6%) |
| 3 or 4 Children | 469 (30.0%) | 2,857 (48.9%) |
| 5 or more Children | 45 (64.3%) | 516 (61.1%) |
| Total | 3,570 (12.8%) | 15,213 (21.6%) |
Income Below Poverty Among Married-Couple vs Single-Parent Households in Orange County
The poverty data for Orange County shows that 14,055 of the married-couple family households (6.2%) and 18,783 of the single-parent households (19.1%) are living below the poverty level. Within the married-couple family households, those with 5 or more children have the highest poverty rate, with 315 households (32.4%) falling below the poverty line. Among the single-parent households, those with 5 or more children have the highest poverty rate, with 561 household (61.3%) living below poverty.
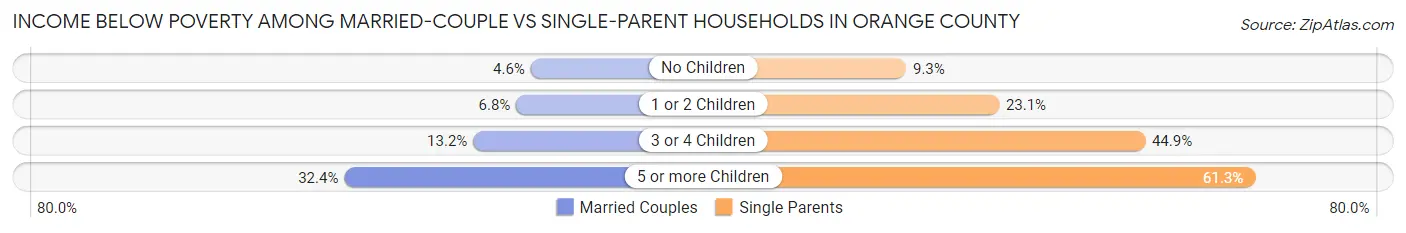
| Children | Married-Couple Families | Single-Parent Households |
| No Children | 5,832 (4.6%) | 3,961 (9.3%) |
| 1 or 2 Children | 5,572 (6.8%) | 10,935 (23.1%) |
| 3 or 4 Children | 2,336 (13.2%) | 3,326 (44.9%) |
| 5 or more Children | 315 (32.4%) | 561 (61.3%) |
| Total | 14,055 (6.2%) | 18,783 (19.1%) |
Race in Orange County
The most populous races in Orange County are White / Caucasian (731,351 | 51.2%), Hispanic or Latino (469,883 | 32.9%), and Black / African American (291,433 | 20.4%).
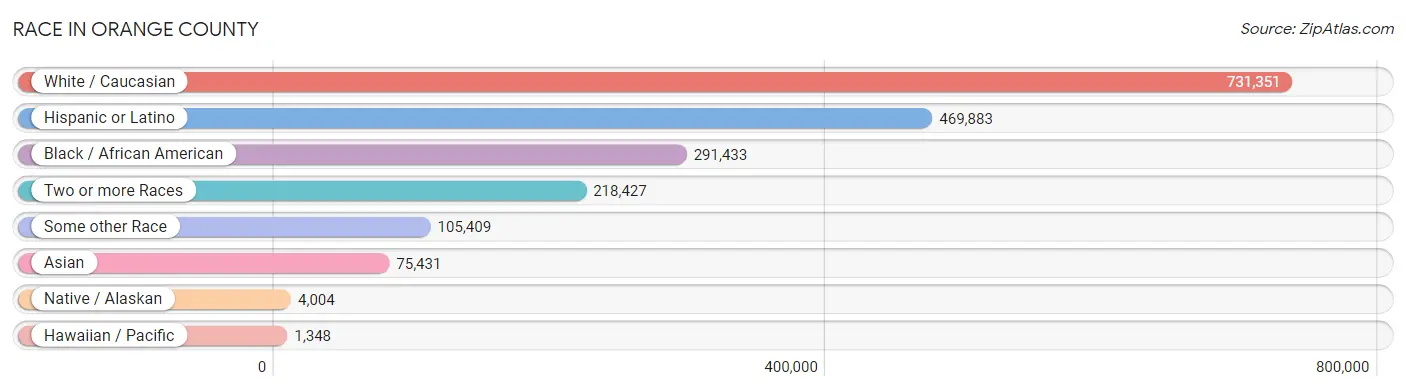
| Race | # Population | % Population |
| Asian | 75,431 | 5.3% |
| Black / African American | 291,433 | 20.4% |
| Hawaiian / Pacific | 1,348 | 0.1% |
| Hispanic or Latino | 469,883 | 32.9% |
| Native / Alaskan | 4,004 | 0.3% |
| White / Caucasian | 731,351 | 51.2% |
| Two or more Races | 218,427 | 15.3% |
| Some other Race | 105,409 | 7.4% |
| Total | 1,427,403 | 100.0% |
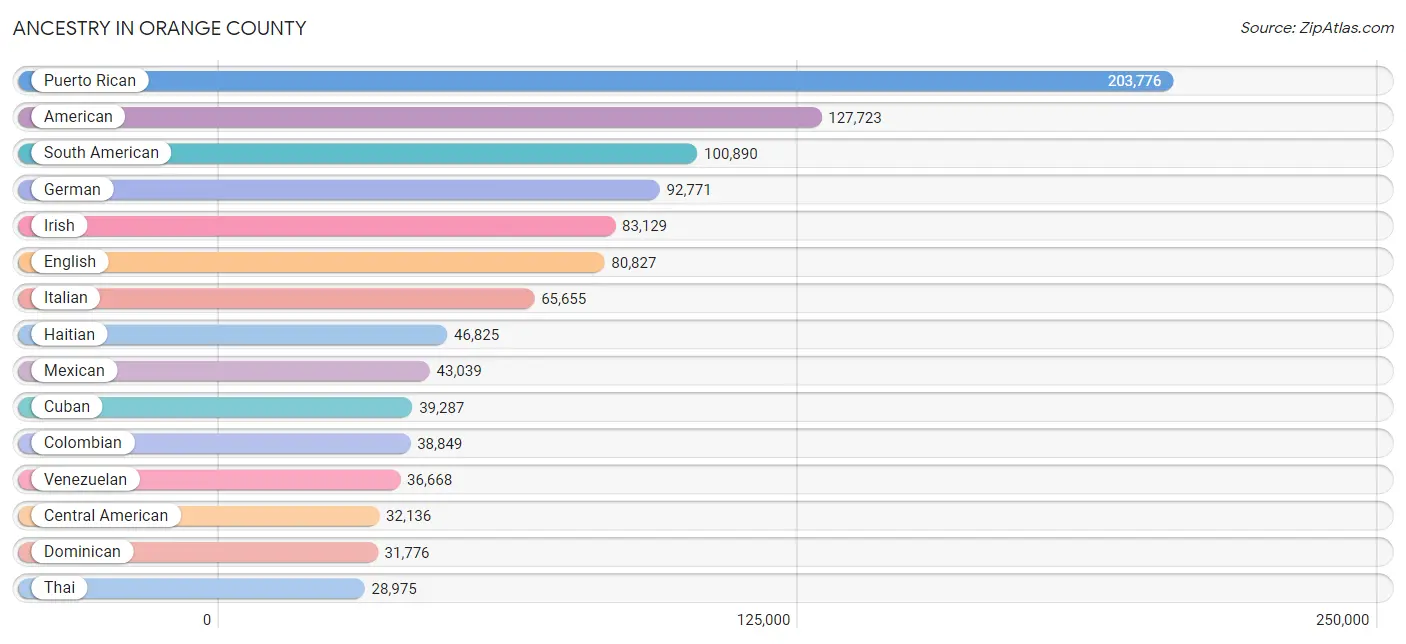
Ancestry in Orange County
The most populous ancestries reported in Orange County are Puerto Rican (203,776 | 14.3%), American (127,723 | 8.9%), South American (100,890 | 7.1%), German (92,771 | 6.5%), and Irish (83,129 | 5.8%), together accounting for 42.6% of all Orange County residents.
| Ancestry | # Population | % Population |
| Afghan | 16 | 0.0% |
| African | 9,536 | 0.7% |
| Alaska Native | 2 | 0.0% |
| Albanian | 425 | 0.0% |
| Aleut | 13 | 0.0% |
| American | 127,723 | 8.9% |
| Apache | 165 | 0.0% |
| Arab | 14,271 | 1.0% |
| Argentinean | 3,729 | 0.3% |
| Armenian | 517 | 0.0% |
| Assyrian / Chaldean / Syriac | 62 | 0.0% |
| Australian | 161 | 0.0% |
| Austrian | 1,646 | 0.1% |
| Bahamian | 1,965 | 0.1% |
| Bangladeshi | 18 | 0.0% |
| Barbadian | 503 | 0.0% |
| Basque | 144 | 0.0% |
| Belgian | 584 | 0.0% |
| Belizean | 131 | 0.0% |
| Bermudan | 55 | 0.0% |
| Bhutanese | 3,117 | 0.2% |
| Blackfeet | 860 | 0.1% |
| Bolivian | 476 | 0.0% |
| Brazilian | 18,015 | 1.3% |
| British | 7,775 | 0.5% |
| British West Indian | 2,306 | 0.2% |
| Bulgarian | 1,125 | 0.1% |
| Burmese | 3,720 | 0.3% |
| Cajun | 224 | 0.0% |
| Cambodian | 23 | 0.0% |
| Canadian | 1,749 | 0.1% |
| Cape Verdean | 403 | 0.0% |
| Carpatho Rusyn | 12 | 0.0% |
| Celtic | 177 | 0.0% |
| Central American | 32,136 | 2.2% |
| Central American Indian | 3,958 | 0.3% |
| Cherokee | 2,545 | 0.2% |
| Chickasaw | 46 | 0.0% |
| Chilean | 1,780 | 0.1% |
| Chinese | 32 | 0.0% |
| Chippewa | 140 | 0.0% |
| Choctaw | 390 | 0.0% |
| Colombian | 38,849 | 2.7% |
| Comanche | 34 | 0.0% |
| Costa Rican | 2,629 | 0.2% |
| Creek | 290 | 0.0% |
| Croatian | 521 | 0.0% |
| Crow | 8 | 0.0% |
| Cuban | 39,287 | 2.8% |
| Cypriot | 54 | 0.0% |
| Czech | 2,454 | 0.2% |
| Czechoslovakian | 625 | 0.0% |
| Danish | 1,717 | 0.1% |
| Delaware | 79 | 0.0% |
| Dominican | 31,776 | 2.2% |
| Dutch | 7,935 | 0.6% |
| Dutch West Indian | 140 | 0.0% |
| Eastern European | 3,180 | 0.2% |
| Ecuadorian | 8,242 | 0.6% |
| Egyptian | 1,562 | 0.1% |
| English | 80,827 | 5.7% |
| Estonian | 44 | 0.0% |
| Ethiopian | 479 | 0.0% |
| European | 15,016 | 1.1% |
| Fijian | 262 | 0.0% |
| Filipino | 725 | 0.1% |
| Finnish | 1,044 | 0.1% |
| French | 19,716 | 1.4% |
| French American Indian | 95 | 0.0% |
| French Canadian | 3,341 | 0.2% |
| German | 92,771 | 6.5% |
| German Russian | 15 | 0.0% |
| Ghanaian | 226 | 0.0% |
| Greek | 4,053 | 0.3% |
| Guamanian / Chamorro | 478 | 0.0% |
| Guatemalan | 12,168 | 0.9% |
| Guyanese | 5,388 | 0.4% |
| Haitian | 46,825 | 3.3% |
| Honduran | 6,774 | 0.5% |
| Hopi | 10 | 0.0% |
| Hungarian | 3,016 | 0.2% |
| Icelander | 522 | 0.0% |
| Indian (Asian) | 17,367 | 1.2% |
| Indonesian | 437 | 0.0% |
| Inupiat | 33 | 0.0% |
| Iranian | 1,886 | 0.1% |
| Iraqi | 76 | 0.0% |
| Irish | 83,129 | 5.8% |
| Iroquois | 188 | 0.0% |
| Israeli | 919 | 0.1% |
| Italian | 65,655 | 4.6% |
| Jamaican | 24,342 | 1.7% |
| Japanese | 1,098 | 0.1% |
| Jordanian | 282 | 0.0% |
| Kenyan | 214 | 0.0% |
| Korean | 13,868 | 1.0% |
| Laotian | 509 | 0.0% |
| Latvian | 194 | 0.0% |
| Lebanese | 3,487 | 0.2% |
| Liberian | 299 | 0.0% |
| Lithuanian | 1,398 | 0.1% |
| Lumbee | 72 | 0.0% |
| Luxembourger | 21 | 0.0% |
| Macedonian | 153 | 0.0% |
| Malaysian | 577 | 0.0% |
| Maltese | 167 | 0.0% |
| Menominee | 6 | 0.0% |
| Mexican | 43,039 | 3.0% |
| Mexican American Indian | 1,638 | 0.1% |
| Mongolian | 171 | 0.0% |
| Moroccan | 1,607 | 0.1% |
| Native Hawaiian | 933 | 0.1% |
| Navajo | 141 | 0.0% |
| New Zealander | 20 | 0.0% |
| Nicaraguan | 3,071 | 0.2% |
| Nigerian | 1,651 | 0.1% |
| Northern European | 1,066 | 0.1% |
| Norwegian | 6,622 | 0.5% |
| Okinawan | 63 | 0.0% |
| Osage | 102 | 0.0% |
| Pakistani | 1,768 | 0.1% |
| Palestinian | 2,201 | 0.2% |
| Panamanian | 2,931 | 0.2% |
| Paraguayan | 327 | 0.0% |
| Pennsylvania German | 724 | 0.1% |
| Peruvian | 9,342 | 0.6% |
| Pima | 19 | 0.0% |
| Polish | 22,336 | 1.6% |
| Portuguese | 8,131 | 0.6% |
| Potawatomi | 225 | 0.0% |
| Pueblo | 40 | 0.0% |
| Puerto Rican | 203,776 | 14.3% |
| Romanian | 1,573 | 0.1% |
| Russian | 7,451 | 0.5% |
| Salvadoran | 4,431 | 0.3% |
| Samoan | 331 | 0.0% |
| Scandinavian | 2,019 | 0.1% |
| Scotch-Irish | 6,508 | 0.5% |
| Scottish | 14,203 | 1.0% |
| Seminole | 261 | 0.0% |
| Senegalese | 14 | 0.0% |
| Serbian | 686 | 0.1% |
| Sierra Leonean | 7 | 0.0% |
| Sioux | 136 | 0.0% |
| Slavic | 385 | 0.0% |
| Slovak | 1,834 | 0.1% |
| Slovene | 491 | 0.0% |
| Somali | 44 | 0.0% |
| South African | 250 | 0.0% |
| South American | 100,890 | 7.1% |
| South American Indian | 658 | 0.1% |
| Spaniard | 4,134 | 0.3% |
| Spanish | 1,795 | 0.1% |
| Spanish American | 678 | 0.1% |
| Spanish American Indian | 41 | 0.0% |
| Sri Lankan | 16,156 | 1.1% |
| Subsaharan African | 14,318 | 1.0% |
| Sudanese | 26 | 0.0% |
| Swedish | 5,818 | 0.4% |
| Swiss | 1,756 | 0.1% |
| Syrian | 1,100 | 0.1% |
| Thai | 28,975 | 2.0% |
| Tlingit-Haida | 6 | 0.0% |
| Tongan | 12 | 0.0% |
| Trinidadian and Tobagonian | 2,954 | 0.2% |
| Turkish | 1,689 | 0.1% |
| U.S. Virgin Islander | 2,413 | 0.2% |
| Ukrainian | 3,087 | 0.2% |
| Uruguayan | 1,256 | 0.1% |
| Venezuelan | 36,668 | 2.6% |
| Vietnamese | 467 | 0.0% |
| Welsh | 4,944 | 0.4% |
| West Indian | 3,444 | 0.2% |
| Yaqui | 7 | 0.0% |
| Yugoslavian | 573 | 0.0% |
| Zimbabwean | 293 | 0.0% | View All 176 Rows |
Immigrants in Orange County
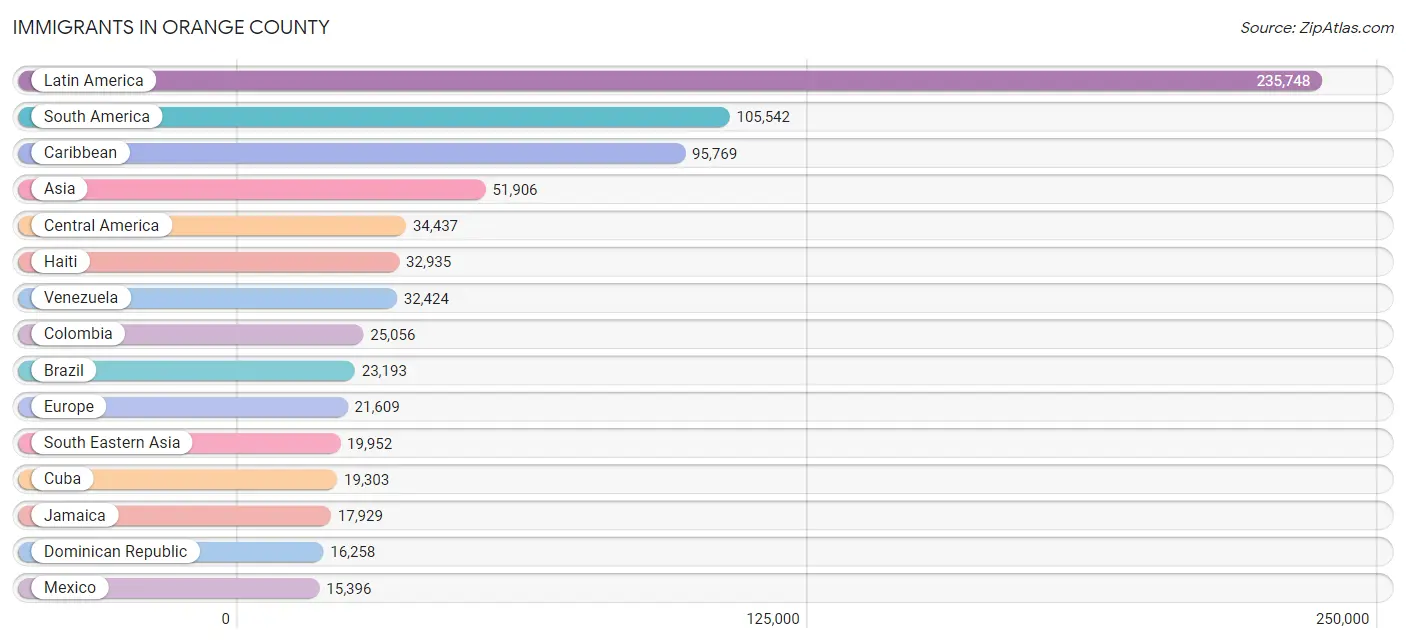
The most numerous immigrant groups reported in Orange County came from Latin America (235,748 | 16.5%), South America (105,542 | 7.4%), Caribbean (95,769 | 6.7%), Asia (51,906 | 3.6%), and Central America (34,437 | 2.4%), together accounting for 36.7% of all Orange County residents.
| Immigration Origin | # Population | % Population |
| Afghanistan | 59 | 0.0% |
| Africa | 8,437 | 0.6% |
| Albania | 222 | 0.0% |
| Argentina | 2,605 | 0.2% |
| Armenia | 26 | 0.0% |
| Asia | 51,906 | 3.6% |
| Australia | 201 | 0.0% |
| Austria | 192 | 0.0% |
| Azores | 25 | 0.0% |
| Bahamas | 1,129 | 0.1% |
| Bangladesh | 1,144 | 0.1% |
| Barbados | 374 | 0.0% |
| Belarus | 547 | 0.0% |
| Belgium | 84 | 0.0% |
| Belize | 130 | 0.0% |
| Bolivia | 353 | 0.0% |
| Bosnia and Herzegovina | 312 | 0.0% |
| Brazil | 23,193 | 1.6% |
| Bulgaria | 996 | 0.1% |
| Cabo Verde | 31 | 0.0% |
| Cambodia | 349 | 0.0% |
| Cameroon | 33 | 0.0% |
| Canada | 3,895 | 0.3% |
| Caribbean | 95,769 | 6.7% |
| Central America | 34,437 | 2.4% |
| Chile | 1,129 | 0.1% |
| China | 8,345 | 0.6% |
| Colombia | 25,056 | 1.8% |
| Congo | 82 | 0.0% |
| Costa Rica | 1,513 | 0.1% |
| Croatia | 130 | 0.0% |
| Cuba | 19,303 | 1.3% |
| Czechoslovakia | 275 | 0.0% |
| Denmark | 24 | 0.0% |
| Dominica | 288 | 0.0% |
| Dominican Republic | 16,258 | 1.1% |
| Eastern Africa | 2,291 | 0.2% |
| Eastern Asia | 10,969 | 0.8% |
| Eastern Europe | 7,775 | 0.5% |
| Ecuador | 5,073 | 0.4% |
| Egypt | 1,091 | 0.1% |
| El Salvador | 2,473 | 0.2% |
| England | 1,906 | 0.1% |
| Eritrea | 101 | 0.0% |
| Ethiopia | 230 | 0.0% |
| Europe | 21,609 | 1.5% |
| Fiji | 133 | 0.0% |
| France | 1,028 | 0.1% |
| Germany | 2,822 | 0.2% |
| Ghana | 232 | 0.0% |
| Greece | 245 | 0.0% |
| Grenada | 351 | 0.0% |
| Guatemala | 7,362 | 0.5% |
| Guyana | 7,590 | 0.5% |
| Haiti | 32,935 | 2.3% |
| Honduras | 3,817 | 0.3% |
| Hong Kong | 575 | 0.0% |
| Hungary | 248 | 0.0% |
| India | 9,864 | 0.7% |
| Indonesia | 300 | 0.0% |
| Iran | 1,199 | 0.1% |
| Iraq | 246 | 0.0% |
| Ireland | 458 | 0.0% |
| Israel | 831 | 0.1% |
| Italy | 928 | 0.1% |
| Jamaica | 17,929 | 1.3% |
| Japan | 860 | 0.1% |
| Jordan | 154 | 0.0% |
| Kazakhstan | 335 | 0.0% |
| Kenya | 799 | 0.1% |
| Korea | 1,764 | 0.1% |
| Kuwait | 175 | 0.0% |
| Laos | 133 | 0.0% |
| Latin America | 235,748 | 16.5% |
| Latvia | 69 | 0.0% |
| Lebanon | 738 | 0.1% |
| Liberia | 314 | 0.0% |
| Lithuania | 160 | 0.0% |
| Malaysia | 220 | 0.0% |
| Mexico | 15,396 | 1.1% |
| Micronesia | 208 | 0.0% |
| Middle Africa | 373 | 0.0% |
| Moldova | 364 | 0.0% |
| Morocco | 1,551 | 0.1% |
| Nepal | 177 | 0.0% |
| Netherlands | 901 | 0.1% |
| Nicaragua | 2,168 | 0.2% |
| Nigeria | 754 | 0.1% |
| North Macedonia | 14 | 0.0% |
| Northern Africa | 3,710 | 0.3% |
| Northern Europe | 6,315 | 0.4% |
| Norway | 149 | 0.0% |
| Oceania | 687 | 0.1% |
| Pakistan | 1,885 | 0.1% |
| Panama | 1,572 | 0.1% |
| Peru | 6,640 | 0.5% |
| Philippines | 6,774 | 0.5% |
| Poland | 599 | 0.0% |
| Portugal | 194 | 0.0% |
| Romania | 628 | 0.0% |
| Russia | 1,442 | 0.1% |
| Saudi Arabia | 659 | 0.1% |
| Scotland | 374 | 0.0% |
| Senegal | 92 | 0.0% |
| Serbia | 246 | 0.0% |
| Sierra Leone | 39 | 0.0% |
| Singapore | 385 | 0.0% |
| Somalia | 42 | 0.0% |
| South Africa | 431 | 0.0% |
| South America | 105,542 | 7.4% |
| South Central Asia | 15,193 | 1.1% |
| South Eastern Asia | 19,952 | 1.4% |
| Southern Europe | 2,290 | 0.2% |
| Spain | 891 | 0.1% |
| Sri Lanka | 208 | 0.0% |
| St. Vincent and the Grenadines | 245 | 0.0% |
| Sudan | 156 | 0.0% |
| Sweden | 178 | 0.0% |
| Switzerland | 93 | 0.0% |
| Syria | 602 | 0.0% |
| Taiwan | 1,182 | 0.1% |
| Thailand | 1,075 | 0.1% |
| Trinidad and Tobago | 3,893 | 0.3% |
| Turkey | 1,026 | 0.1% |
| Uganda | 70 | 0.0% |
| Ukraine | 1,114 | 0.1% |
| Uruguay | 854 | 0.1% |
| Uzbekistan | 98 | 0.0% |
| Venezuela | 32,424 | 2.3% |
| Vietnam | 10,346 | 0.7% |
| West Indies | 381 | 0.0% |
| Western Africa | 1,548 | 0.1% |
| Western Asia | 4,820 | 0.3% |
| Western Europe | 5,120 | 0.4% |
| Yemen | 21 | 0.0% |
| Zaire | 93 | 0.0% |
| Zimbabwe | 456 | 0.0% | View All 137 Rows |
Sex and Age in Orange County
Sex and Age in Orange County
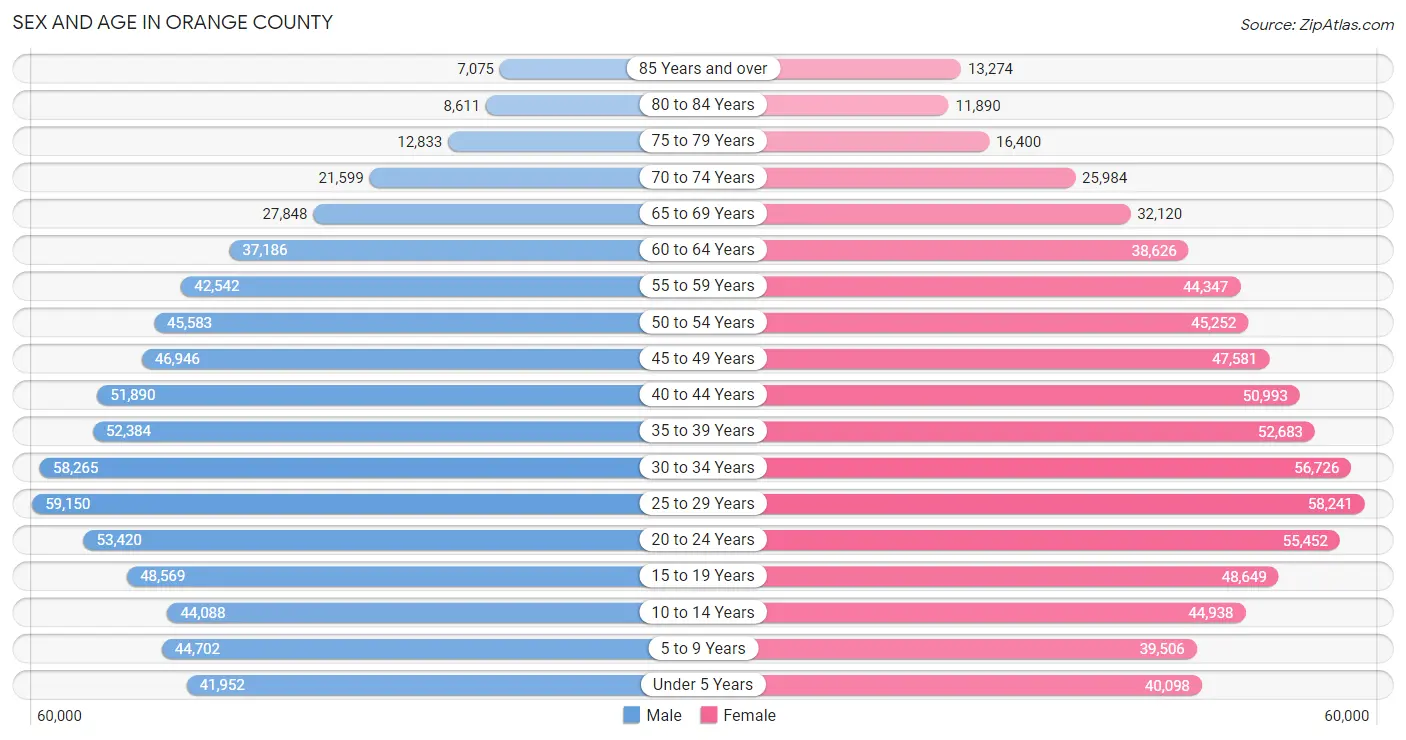
The most populous age groups in Orange County are 25 to 29 Years (59,150 | 8.4%) for men and 25 to 29 Years (58,241 | 8.1%) for women.
| Age Bracket | Male | Female |
| Under 5 Years | 41,952 (5.9%) | 40,098 (5.6%) |
| 5 to 9 Years | 44,702 (6.3%) | 39,506 (5.5%) |
| 10 to 14 Years | 44,088 (6.3%) | 44,938 (6.2%) |
| 15 to 19 Years | 48,569 (6.9%) | 48,649 (6.7%) |
| 20 to 24 Years | 53,420 (7.6%) | 55,452 (7.7%) |
| 25 to 29 Years | 59,150 (8.4%) | 58,241 (8.1%) |
| 30 to 34 Years | 58,265 (8.3%) | 56,726 (7.9%) |
| 35 to 39 Years | 52,384 (7.4%) | 52,683 (7.3%) |
| 40 to 44 Years | 51,890 (7.4%) | 50,993 (7.1%) |
| 45 to 49 Years | 46,946 (6.7%) | 47,581 (6.6%) |
| 50 to 54 Years | 45,583 (6.5%) | 45,252 (6.3%) |
| 55 to 59 Years | 42,542 (6.0%) | 44,347 (6.1%) |
| 60 to 64 Years | 37,186 (5.3%) | 38,626 (5.3%) |
| 65 to 69 Years | 27,848 (4.0%) | 32,120 (4.4%) |
| 70 to 74 Years | 21,599 (3.1%) | 25,984 (3.6%) |
| 75 to 79 Years | 12,833 (1.8%) | 16,400 (2.3%) |
| 80 to 84 Years | 8,611 (1.2%) | 11,890 (1.7%) |
| 85 Years and over | 7,075 (1.0%) | 13,274 (1.8%) |
| Total | 704,643 (100.0%) | 722,760 (100.0%) |
Families and Households in Orange County
Median Family Size in Orange County
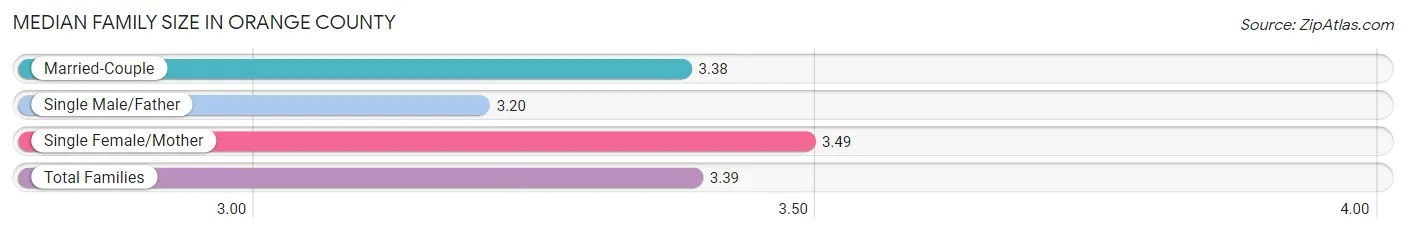
The median family size in Orange County is 3.39 persons per family, with single female/mother families (70,259 | 21.5%) accounting for the largest median family size of 3.49 persons per family. On the other hand, single male/father families (27,958 | 8.6%) represent the smallest median family size with 3.20 persons per family.
| Family Type | # Families | Family Size |
| Married-Couple | 228,229 (69.9%) | 3.38 |
| Single Male/Father | 27,958 (8.6%) | 3.20 |
| Single Female/Mother | 70,259 (21.5%) | 3.49 |
| Total Families | 326,446 (100.0%) | 3.39 |
Median Household Size in Orange County
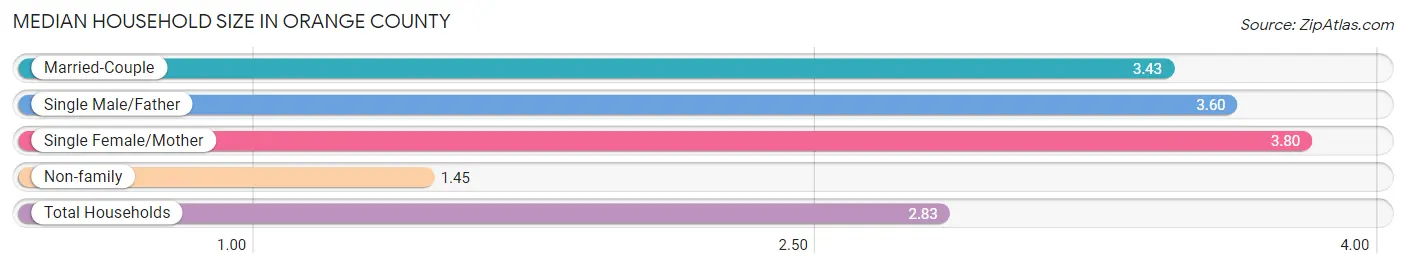
The median household size in Orange County is 2.83 persons per household, with single female/mother households (70,259 | 14.3%) accounting for the largest median household size of 3.8 persons per household. non-family households (164,932 | 33.6%) represent the smallest median household size with 1.45 persons per household.
| Household Type | # Households | Household Size |
| Married-Couple | 228,229 (46.5%) | 3.43 |
| Single Male/Father | 27,958 (5.7%) | 3.60 |
| Single Female/Mother | 70,259 (14.3%) | 3.80 |
| Non-family | 164,932 (33.6%) | 1.45 |
| Total Households | 491,378 (100.0%) | 2.83 |
Household Size by Marriage Status in Orange County
Out of a total of 491,378 households in Orange County, 326,446 (66.4%) are family households, while 164,932 (33.6%) are nonfamily households. The most numerous type of family households are 2-person households, comprising 126,200, and the most common type of nonfamily households are 1-person households, comprising 119,804.
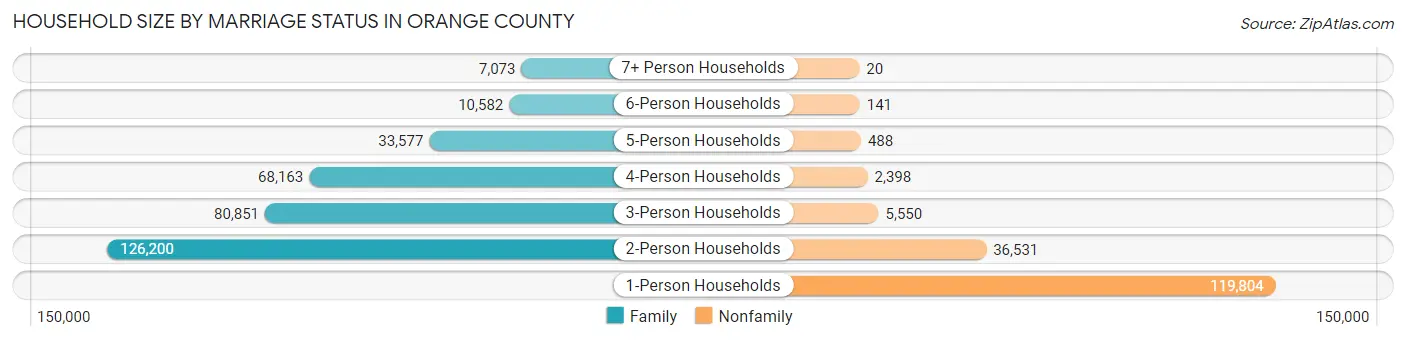
| Household Size | Family Households | Nonfamily Households |
| 1-Person Households | - | 119,804 (24.4%) |
| 2-Person Households | 126,200 (25.7%) | 36,531 (7.4%) |
| 3-Person Households | 80,851 (16.5%) | 5,550 (1.1%) |
| 4-Person Households | 68,163 (13.9%) | 2,398 (0.5%) |
| 5-Person Households | 33,577 (6.8%) | 488 (0.1%) |
| 6-Person Households | 10,582 (2.1%) | 141 (0.0%) |
| 7+ Person Households | 7,073 (1.4%) | 20 (0.0%) |
| Total | 326,446 (66.4%) | 164,932 (33.6%) |
Female Fertility in Orange County
Fertility by Age in Orange County
Average fertility rate in Orange County is 45.0 births per 1,000 women. Women in the age bracket of 20 to 34 years have the highest fertility rate with 72.0 births per 1,000 women. Women in the age bracket of 20 to 34 years acount for 72.0% of all women with births.
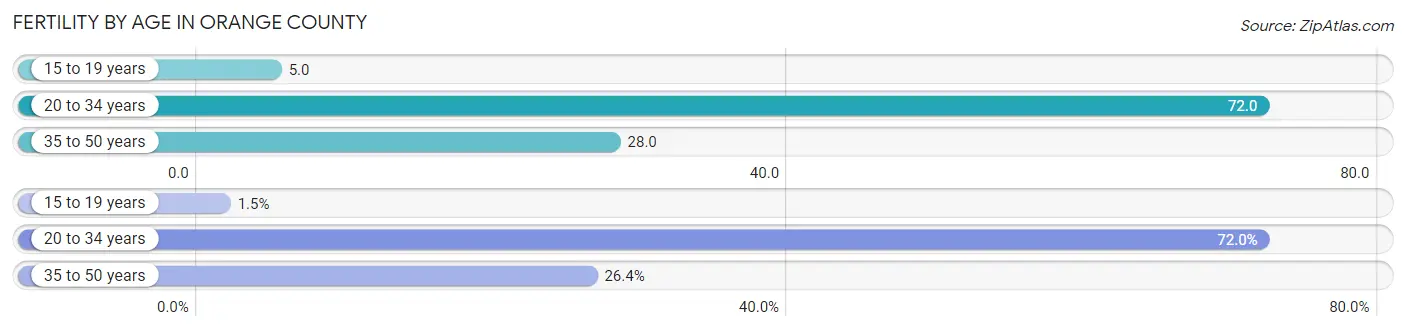
| Age Bracket | Women with Births | Births / 1,000 Women |
| 15 to 19 years | 262 (1.5%) | 5.0 |
| 20 to 34 years | 12,263 (72.0%) | 72.0 |
| 35 to 50 years | 4,499 (26.4%) | 28.0 |
| Total | 17,024 (100.0%) | 45.0 |
Fertility by Age by Marriage Status in Orange County
66.3% of women with births (17,024) in Orange County are married. The highest percentage of unmarried women with births falls into 15 to 19 years age bracket with 94.3% of them unmarried at the time of birth, while the lowest percentage of unmarried women with births belong to 35 to 50 years age bracket with 16.2% of them unmarried.
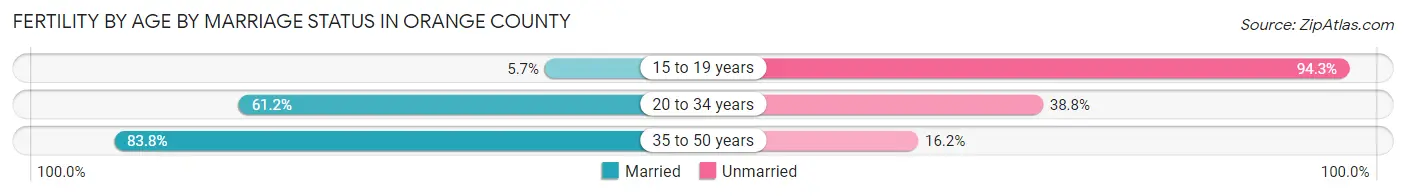
| Age Bracket | Married | Unmarried |
| 15 to 19 years | 15 (5.7%) | 247 (94.3%) |
| 20 to 34 years | 7,505 (61.2%) | 4,758 (38.8%) |
| 35 to 50 years | 3,770 (83.8%) | 729 (16.2%) |
| Total | 11,287 (66.3%) | 5,737 (33.7%) |
Fertility by Education in Orange County
Average fertility rate in Orange County is 45.0 births per 1,000 women. Women with the education attainment of high school diploma have the highest fertility rate of 54.0 births per 1,000 women, while women with the education attainment of college or associate's degree have the lowest fertility at 39.0 births per 1,000 women. Women with the education attainment of college or associate's degree represent 27.8% of all women with births.
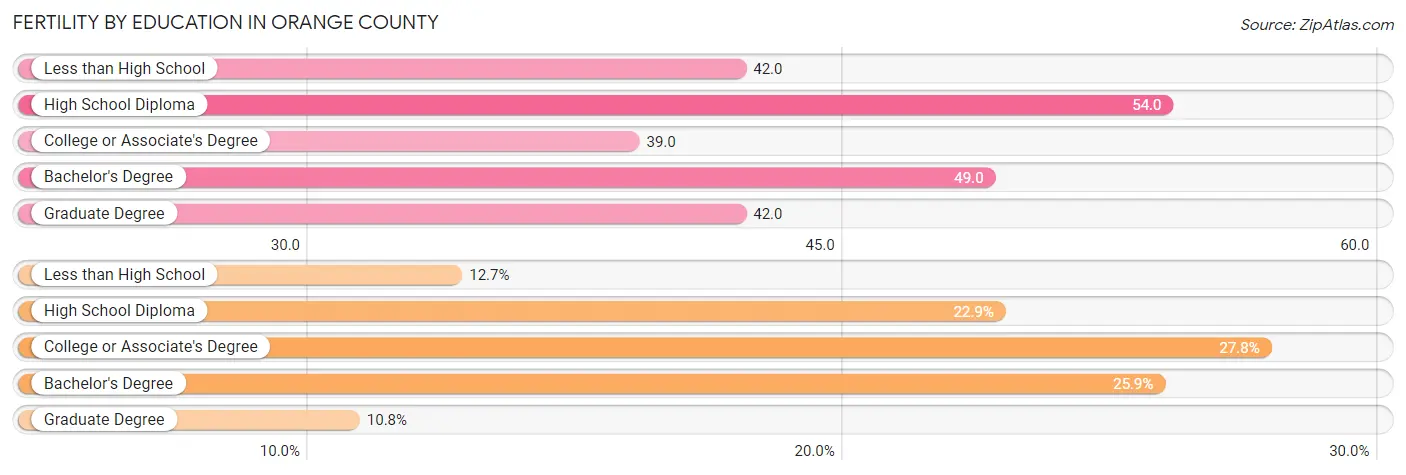
| Educational Attainment | Women with Births | Births / 1,000 Women |
| Less than High School | 2,159 (12.7%) | 42.0 |
| High School Diploma | 3,892 (22.9%) | 54.0 |
| College or Associate's Degree | 4,740 (27.8%) | 39.0 |
| Bachelor's Degree | 4,401 (25.9%) | 49.0 |
| Graduate Degree | 1,832 (10.8%) | 42.0 |
| Total | 17,024 (100.0%) | 45.0 |
Fertility by Education by Marriage Status in Orange County
33.7% of women with births in Orange County are unmarried. Women with the educational attainment of graduate degree are most likely to be married with 91.4% of them married at childbirth, while women with the educational attainment of less than high school are least likely to be married with 60.0% of them unmarried at childbirth.
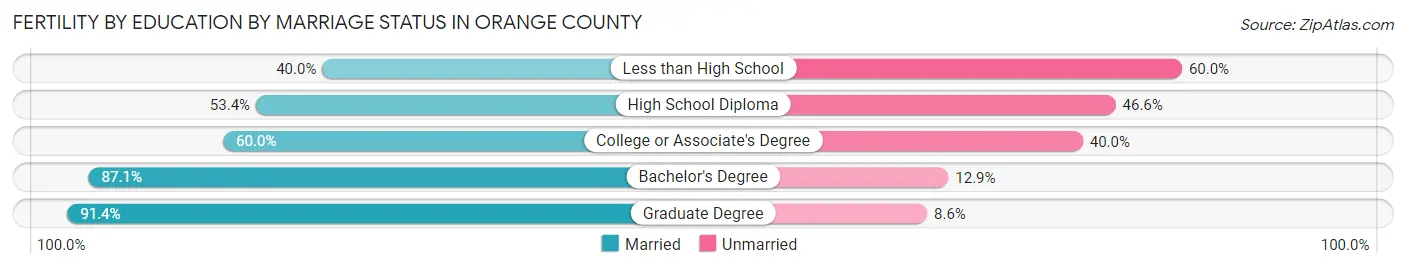
| Educational Attainment | Married | Unmarried |
| Less than High School | 864 (40.0%) | 1,295 (60.0%) |
| High School Diploma | 2,078 (53.4%) | 1,814 (46.6%) |
| College or Associate's Degree | 2,844 (60.0%) | 1,896 (40.0%) |
| Bachelor's Degree | 3,833 (87.1%) | 568 (12.9%) |
| Graduate Degree | 1,674 (91.4%) | 158 (8.6%) |
| Total | 11,287 (66.3%) | 5,737 (33.7%) |
Employment Characteristics in Orange County
Employment by Class of Employer in Orange County
Among the 717,790 employed individuals in Orange County, private company employees (522,440 | 72.8%), not-for-profit organizations (49,614 | 6.9%), and local government employees (38,625 | 5.4%) make up the most common classes of employment.
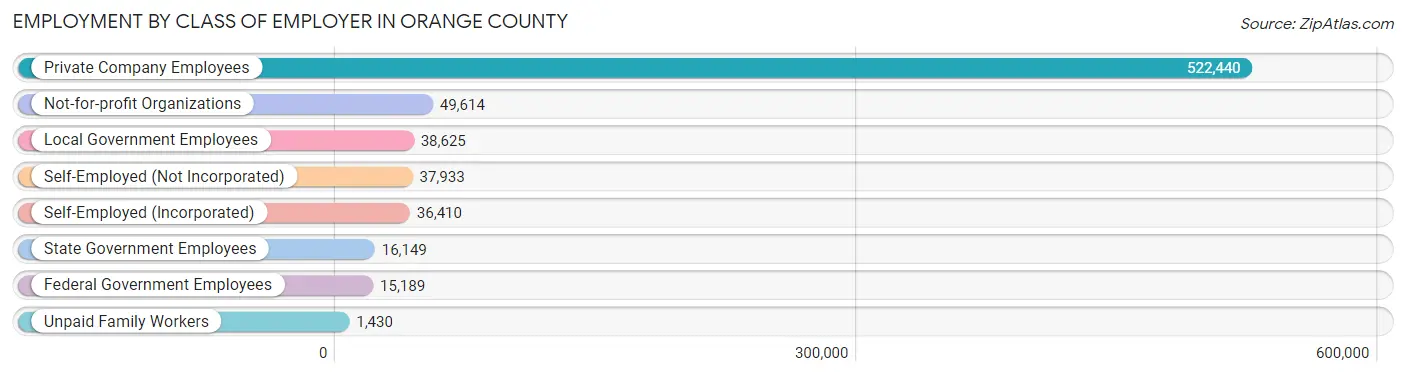
| Employer Class | # Employees | % Employees |
| Private Company Employees | 522,440 | 72.8% |
| Self-Employed (Incorporated) | 36,410 | 5.1% |
| Self-Employed (Not Incorporated) | 37,933 | 5.3% |
| Not-for-profit Organizations | 49,614 | 6.9% |
| Local Government Employees | 38,625 | 5.4% |
| State Government Employees | 16,149 | 2.2% |
| Federal Government Employees | 15,189 | 2.1% |
| Unpaid Family Workers | 1,430 | 0.2% |
| Total | 717,790 | 100.0% |
Employment Status by Age in Orange County
According to the labor force statistics for Orange County, out of the total population over 16 years of age (1,153,231), 67.1% or 773,818 individuals are in the labor force, with 5.5% or 42,560 of them unemployed. The age group with the highest labor force participation rate is 25 to 29 years, with 85.6% or 100,487 individuals in the labor force. Within the labor force, the 16 to 19 years age range has the highest percentage of unemployed individuals, with 19.4% or 4,331 of them being unemployed.
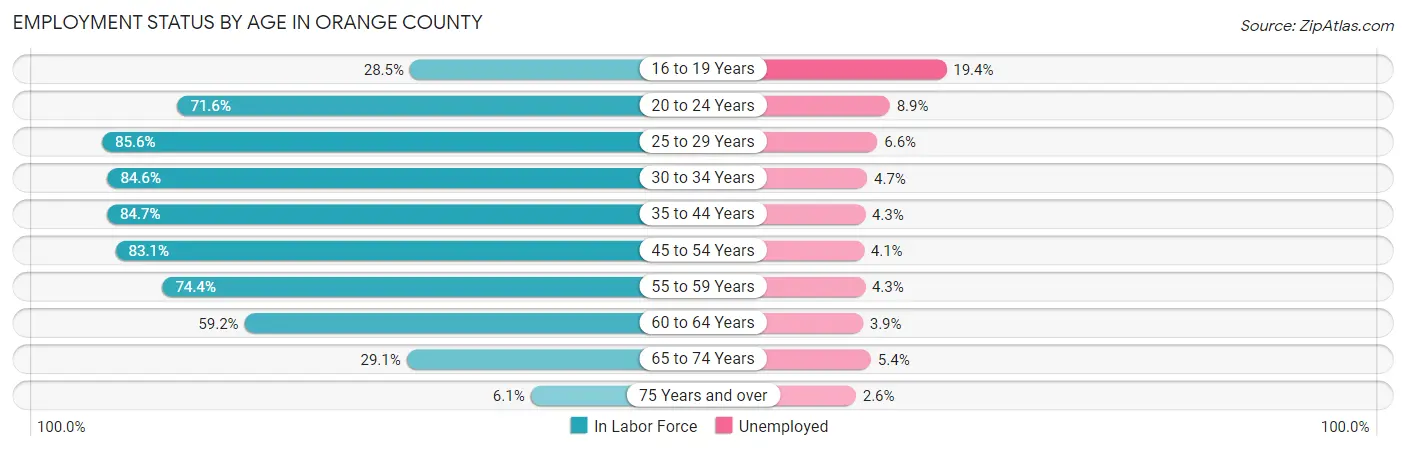
| Age Bracket | In Labor Force | Unemployed |
| 16 to 19 Years | 22,324 (28.5%) | 4,331 (19.4%) |
| 20 to 24 Years | 77,952 (71.6%) | 6,938 (8.9%) |
| 25 to 29 Years | 100,487 (85.6%) | 6,632 (6.6%) |
| 30 to 34 Years | 97,282 (84.6%) | 4,572 (4.7%) |
| 35 to 44 Years | 176,134 (84.7%) | 7,574 (4.3%) |
| 45 to 54 Years | 154,036 (83.1%) | 6,315 (4.1%) |
| 55 to 59 Years | 64,645 (74.4%) | 2,780 (4.3%) |
| 60 to 64 Years | 44,881 (59.2%) | 1,750 (3.9%) |
| 65 to 74 Years | 31,297 (29.1%) | 1,690 (5.4%) |
| 75 Years and over | 4,275 (6.1%) | 111 (2.6%) |
| Total | 773,818 (67.1%) | 42,560 (5.5%) |
Employment Status by Educational Attainment in Orange County
According to labor force statistics for Orange County, 80.9% of individuals (637,812) out of the total population between 25 and 64 years of age (788,395) are in the labor force, with 4.6% or 29,339 of them being unemployed. The group with the highest labor force participation rate are those with the educational attainment of bachelor's degree or higher, with 86.7% or 265,799 individuals in the labor force. Within the labor force, individuals with less than high school education have the highest percentage of unemployment, with 7.8% or 3,633 of them being unemployed.
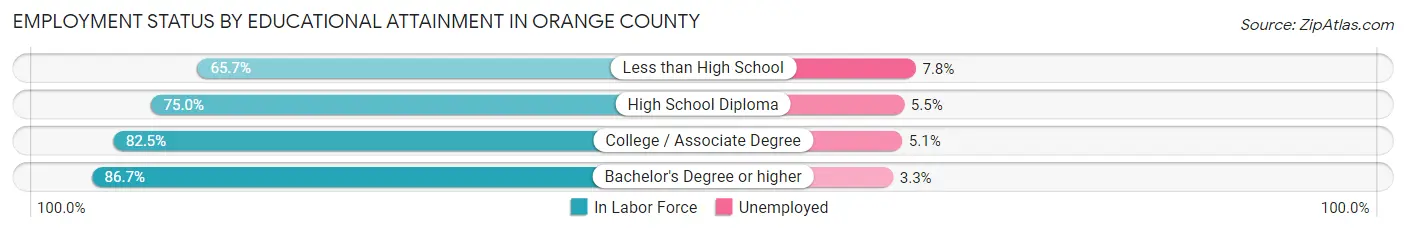
| Educational Attainment | In Labor Force | Unemployed |
| Less than High School | 46,571 (65.7%) | 5,529 (7.8%) |
| High School Diploma | 137,289 (75.0%) | 10,068 (5.5%) |
| College / Associate Degree | 188,005 (82.5%) | 11,622 (5.1%) |
| Bachelor's Degree or higher | 265,799 (86.7%) | 10,117 (3.3%) |
| Total | 637,812 (80.9%) | 36,266 (4.6%) |
Employment Occupations by Sex in Orange County
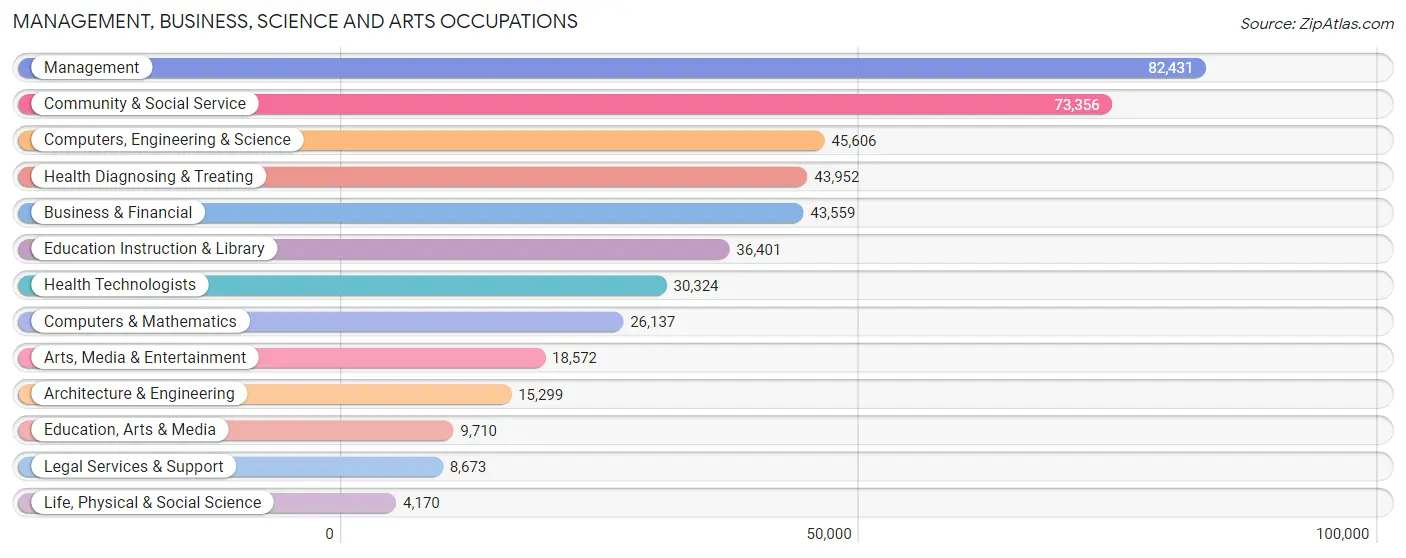
Management, Business, Science and Arts Occupations
The most common Management, Business, Science and Arts occupations in Orange County are Management (82,431 | 11.3%), Community & Social Service (73,356 | 10.1%), Computers, Engineering & Science (45,606 | 6.2%), Health Diagnosing & Treating (43,952 | 6.0%), and Business & Financial (43,559 | 6.0%).
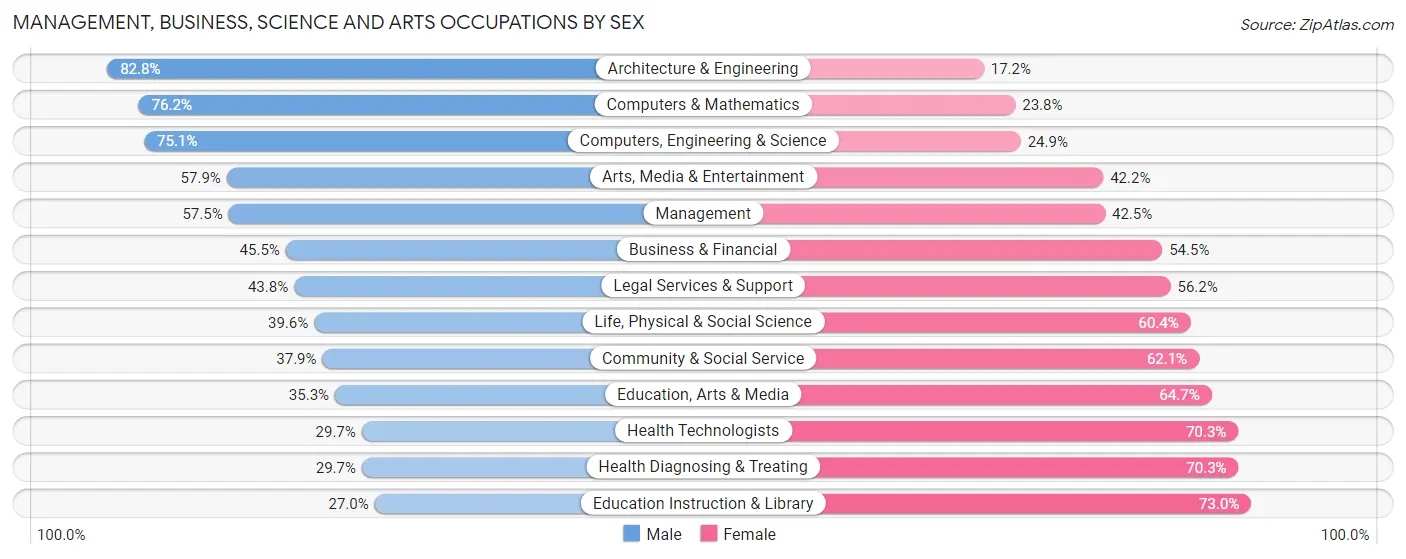
Management, Business, Science and Arts Occupations by Sex
Within the Management, Business, Science and Arts occupations in Orange County, the most male-oriented occupations are Architecture & Engineering (82.8%), Computers & Mathematics (76.2%), and Computers, Engineering & Science (75.1%), while the most female-oriented occupations are Education Instruction & Library (73.0%), Health Diagnosing & Treating (70.3%), and Health Technologists (70.3%).
| Occupation | Male | Female |
| Management | 47,369 (57.5%) | 35,062 (42.5%) |
| Business & Financial | 19,838 (45.5%) | 23,721 (54.5%) |
| Computers, Engineering & Science | 34,231 (75.1%) | 11,375 (24.9%) |
| Computers & Mathematics | 19,917 (76.2%) | 6,220 (23.8%) |
| Architecture & Engineering | 12,662 (82.8%) | 2,637 (17.2%) |
| Life, Physical & Social Science | 1,652 (39.6%) | 2,518 (60.4%) |
| Community & Social Service | 27,798 (37.9%) | 45,558 (62.1%) |
| Education, Arts & Media | 3,425 (35.3%) | 6,285 (64.7%) |
| Legal Services & Support | 3,800 (43.8%) | 4,873 (56.2%) |
| Education Instruction & Library | 9,830 (27.0%) | 26,571 (73.0%) |
| Arts, Media & Entertainment | 10,743 (57.9%) | 7,829 (42.1%) |
| Health Diagnosing & Treating | 13,037 (29.7%) | 30,915 (70.3%) |
| Health Technologists | 9,005 (29.7%) | 21,319 (70.3%) |
| Total (Category) | 142,273 (49.2%) | 146,631 (50.7%) |
| Total (Overall) | 384,780 (52.8%) | 344,503 (47.2%) |
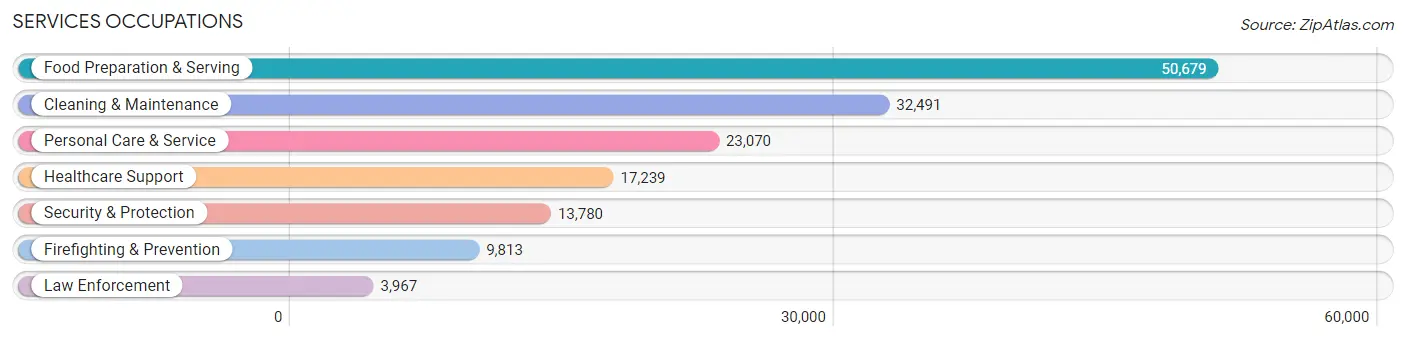
Services Occupations
The most common Services occupations in Orange County are Food Preparation & Serving (50,679 | 7.0%), Cleaning & Maintenance (32,491 | 4.5%), Personal Care & Service (23,070 | 3.2%), Healthcare Support (17,239 | 2.4%), and Security & Protection (13,780 | 1.9%).
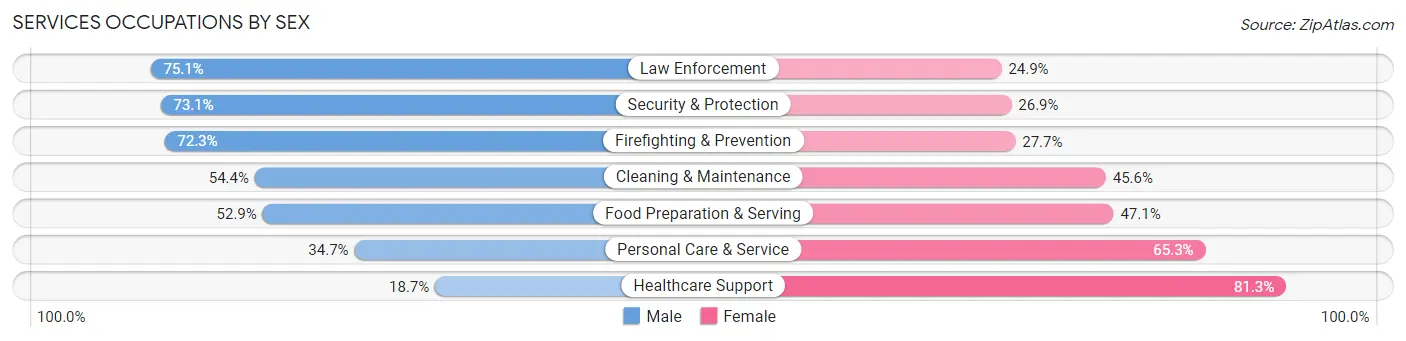
Services Occupations by Sex
Within the Services occupations in Orange County, the most male-oriented occupations are Law Enforcement (75.1%), Security & Protection (73.1%), and Firefighting & Prevention (72.3%), while the most female-oriented occupations are Healthcare Support (81.3%), Personal Care & Service (65.3%), and Food Preparation & Serving (47.1%).
| Occupation | Male | Female |
| Healthcare Support | 3,225 (18.7%) | 14,014 (81.3%) |
| Security & Protection | 10,075 (73.1%) | 3,705 (26.9%) |
| Firefighting & Prevention | 7,097 (72.3%) | 2,716 (27.7%) |
| Law Enforcement | 2,978 (75.1%) | 989 (24.9%) |
| Food Preparation & Serving | 26,801 (52.9%) | 23,878 (47.1%) |
| Cleaning & Maintenance | 17,679 (54.4%) | 14,812 (45.6%) |
| Personal Care & Service | 8,004 (34.7%) | 15,066 (65.3%) |
| Total (Category) | 65,784 (47.9%) | 71,475 (52.1%) |
| Total (Overall) | 384,780 (52.8%) | 344,503 (47.2%) |
Sales and Office Occupations
The most common Sales and Office occupations in Orange County are Sales & Related (86,365 | 11.8%), and Office & Administration (83,770 | 11.5%).

Sales and Office Occupations by Sex

| Occupation | Male | Female |
| Sales & Related | 42,770 (49.5%) | 43,595 (50.5%) |
| Office & Administration | 26,066 (31.1%) | 57,704 (68.9%) |
| Total (Category) | 68,836 (40.5%) | 101,299 (59.5%) |
| Total (Overall) | 384,780 (52.8%) | 344,503 (47.2%) |
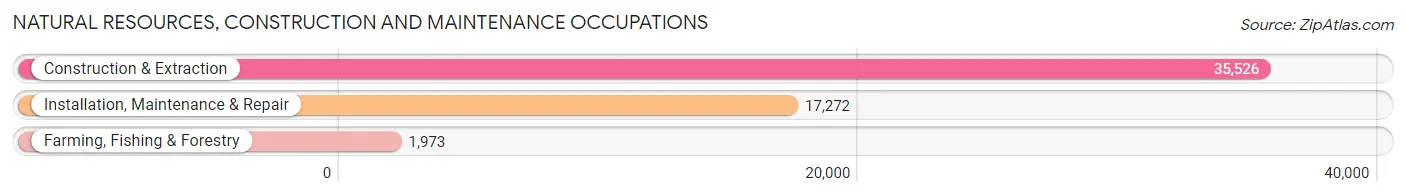
Natural Resources, Construction and Maintenance Occupations
The most common Natural Resources, Construction and Maintenance occupations in Orange County are Construction & Extraction (35,526 | 4.9%), Installation, Maintenance & Repair (17,272 | 2.4%), and Farming, Fishing & Forestry (1,973 | 0.3%).
Natural Resources, Construction and Maintenance Occupations by Sex
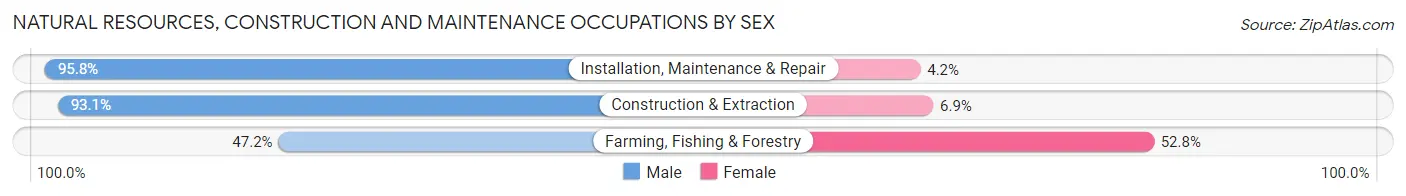
| Occupation | Male | Female |
| Farming, Fishing & Forestry | 931 (47.2%) | 1,042 (52.8%) |
| Construction & Extraction | 33,074 (93.1%) | 2,452 (6.9%) |
| Installation, Maintenance & Repair | 16,539 (95.8%) | 733 (4.2%) |
| Total (Category) | 50,544 (92.3%) | 4,227 (7.7%) |
| Total (Overall) | 384,780 (52.8%) | 344,503 (47.2%) |
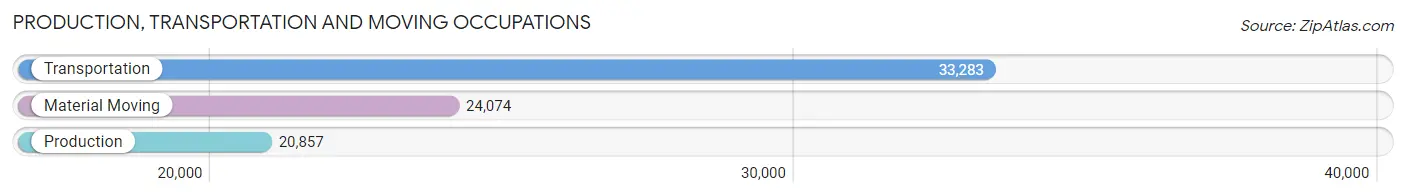
Production, Transportation and Moving Occupations
The most common Production, Transportation and Moving occupations in Orange County are Transportation (33,283 | 4.6%), Material Moving (24,074 | 3.3%), and Production (20,857 | 2.9%).
Production, Transportation and Moving Occupations by Sex
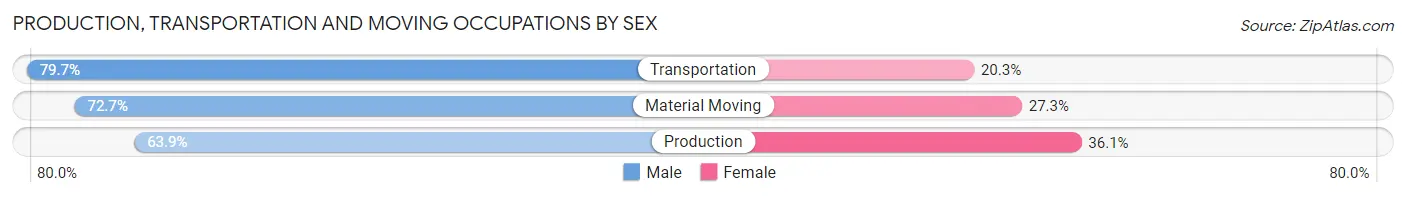
| Occupation | Male | Female |
| Production | 13,329 (63.9%) | 7,528 (36.1%) |
| Transportation | 26,521 (79.7%) | 6,762 (20.3%) |
| Material Moving | 17,493 (72.7%) | 6,581 (27.3%) |
| Total (Category) | 57,343 (73.3%) | 20,871 (26.7%) |
| Total (Overall) | 384,780 (52.8%) | 344,503 (47.2%) |
Employment Industries by Sex in Orange County
Employment Industries in Orange County
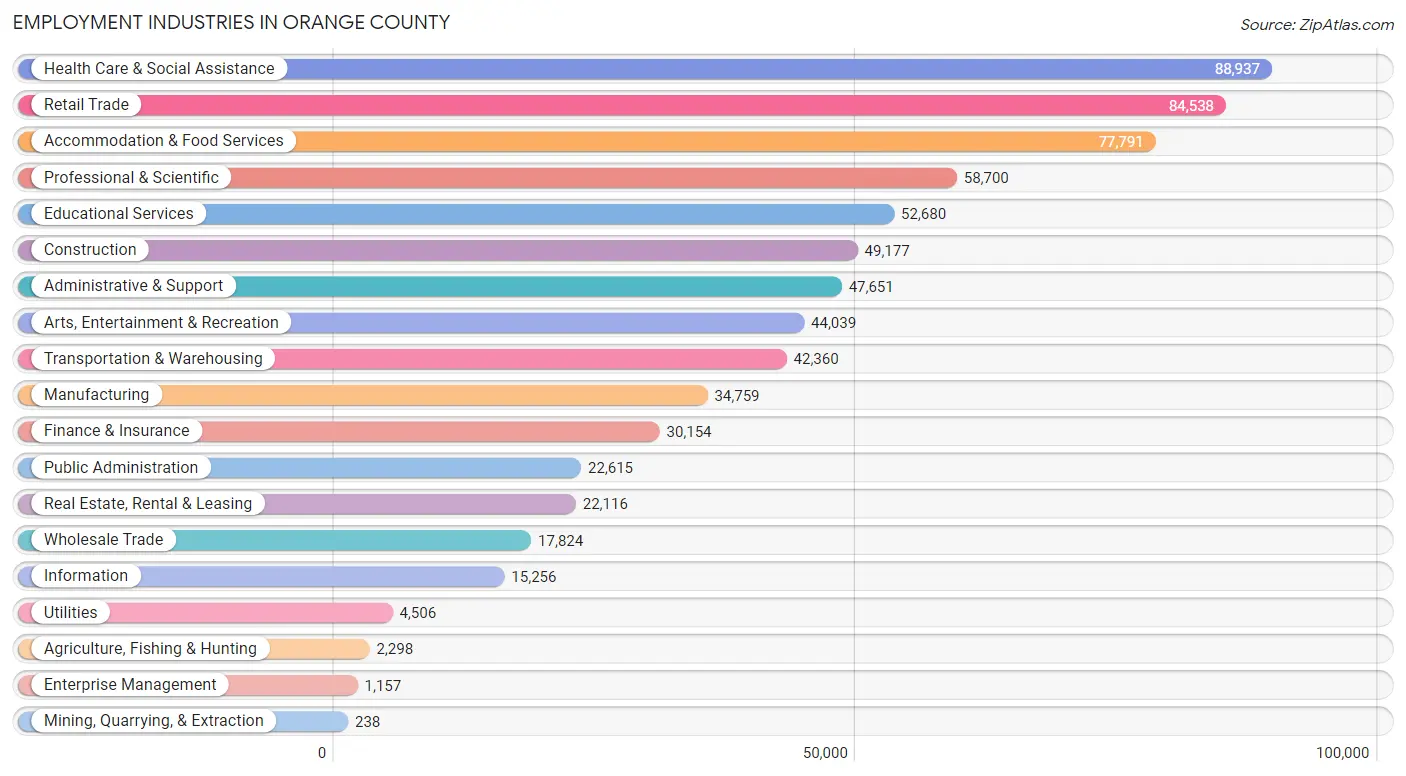
The major employment industries in Orange County include Health Care & Social Assistance (88,937 | 12.2%), Retail Trade (84,538 | 11.6%), Accommodation & Food Services (77,791 | 10.7%), Professional & Scientific (58,700 | 8.1%), and Educational Services (52,680 | 7.2%).
Employment Industries by Sex in Orange County
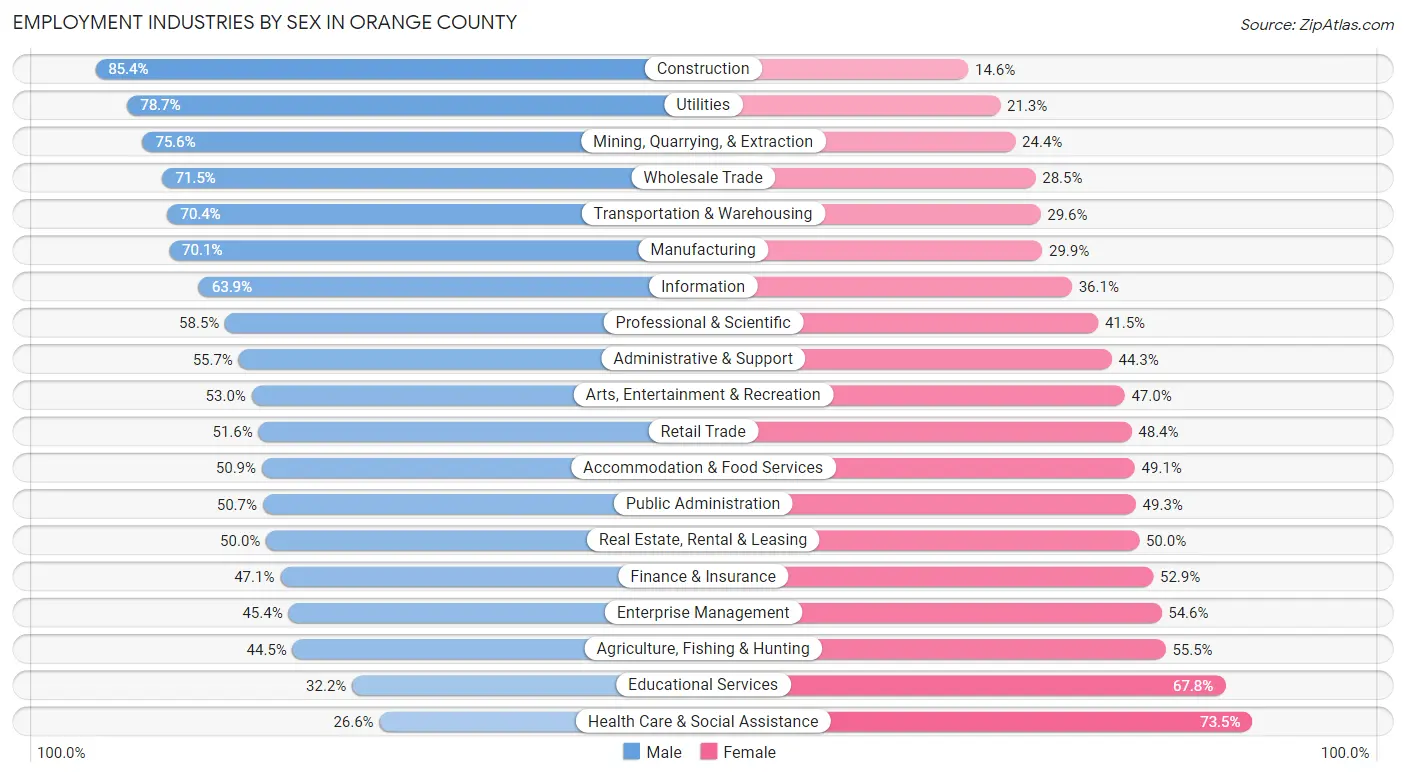
The Orange County industries that see more men than women are Construction (85.4%), Utilities (78.7%), and Mining, Quarrying, & Extraction (75.6%), whereas the industries that tend to have a higher number of women are Health Care & Social Assistance (73.5%), Educational Services (67.8%), and Agriculture, Fishing & Hunting (55.5%).
| Industry | Male | Female |
| Agriculture, Fishing & Hunting | 1,023 (44.5%) | 1,275 (55.5%) |
| Mining, Quarrying, & Extraction | 180 (75.6%) | 58 (24.4%) |
| Construction | 41,989 (85.4%) | 7,188 (14.6%) |
| Manufacturing | 24,355 (70.1%) | 10,404 (29.9%) |
| Wholesale Trade | 12,739 (71.5%) | 5,085 (28.5%) |
| Retail Trade | 43,607 (51.6%) | 40,931 (48.4%) |
| Transportation & Warehousing | 29,836 (70.4%) | 12,524 (29.6%) |
| Utilities | 3,548 (78.7%) | 958 (21.3%) |
| Information | 9,752 (63.9%) | 5,504 (36.1%) |
| Finance & Insurance | 14,199 (47.1%) | 15,955 (52.9%) |
| Real Estate, Rental & Leasing | 11,058 (50.0%) | 11,058 (50.0%) |
| Professional & Scientific | 34,332 (58.5%) | 24,368 (41.5%) |
| Enterprise Management | 525 (45.4%) | 632 (54.6%) |
| Administrative & Support | 26,533 (55.7%) | 21,118 (44.3%) |
| Educational Services | 16,963 (32.2%) | 35,717 (67.8%) |
| Health Care & Social Assistance | 23,610 (26.6%) | 65,327 (73.5%) |
| Arts, Entertainment & Recreation | 23,339 (53.0%) | 20,700 (47.0%) |
| Accommodation & Food Services | 39,585 (50.9%) | 38,206 (49.1%) |
| Public Administration | 11,464 (50.7%) | 11,151 (49.3%) |
| Total | 384,780 (52.8%) | 344,503 (47.2%) |
Education in Orange County
School Enrollment in Orange County
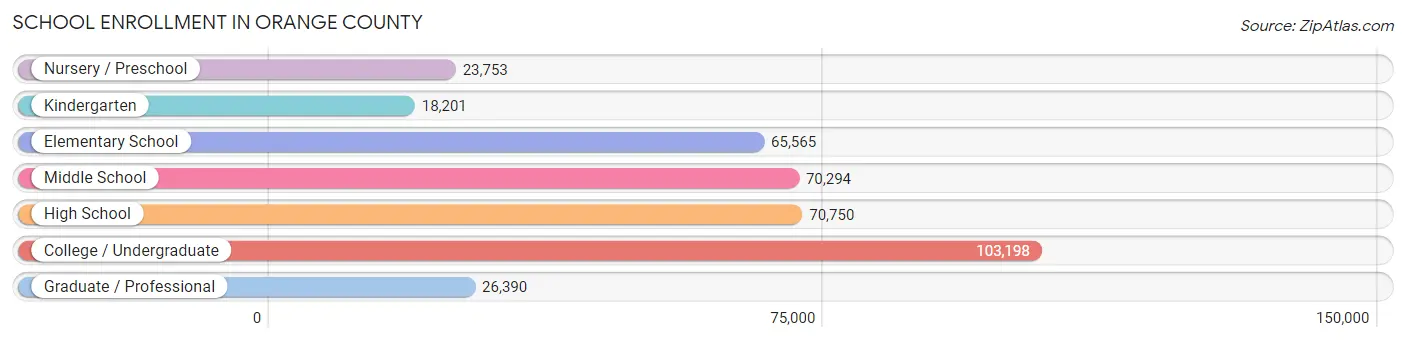
The most common levels of schooling among the 378,151 students in Orange County are college / undergraduate (103,198 | 27.3%), high school (70,750 | 18.7%), and middle school (70,294 | 18.6%).
| School Level | # Students | % Students |
| Nursery / Preschool | 23,753 | 6.3% |
| Kindergarten | 18,201 | 4.8% |
| Elementary School | 65,565 | 17.3% |
| Middle School | 70,294 | 18.6% |
| High School | 70,750 | 18.7% |
| College / Undergraduate | 103,198 | 27.3% |
| Graduate / Professional | 26,390 | 7.0% |
| Total | 378,151 | 100.0% |
School Enrollment by Age by Funding Source in Orange County
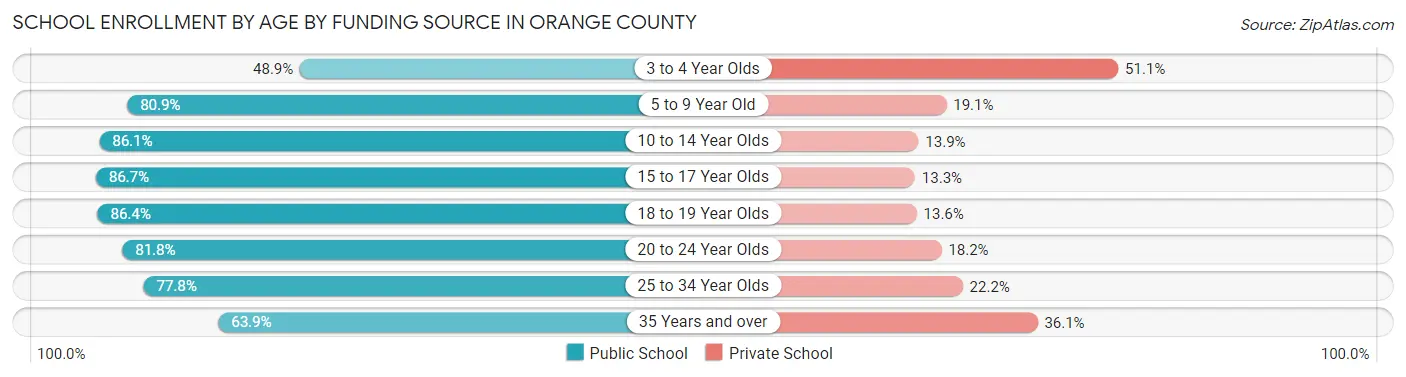
Out of a total of 378,151 students who are enrolled in schools in Orange County, 72,983 (19.3%) attend a private institution, while the remaining 305,168 (80.7%) are enrolled in public schools. The age group of 3 to 4 year olds has the highest likelihood of being enrolled in private schools, with 9,516 (51.1% in the age bracket) enrolled. Conversely, the age group of 15 to 17 year olds has the lowest likelihood of being enrolled in a private school, with 45,081 (86.7% in the age bracket) attending a public institution.
| Age Bracket | Public School | Private School |
| 3 to 4 Year Olds | 9,095 (48.9%) | 9,516 (51.1%) |
| 5 to 9 Year Old | 65,421 (80.9%) | 15,463 (19.1%) |
| 10 to 14 Year Olds | 75,159 (86.1%) | 12,154 (13.9%) |
| 15 to 17 Year Olds | 45,081 (86.7%) | 6,896 (13.3%) |
| 18 to 19 Year Olds | 31,752 (86.4%) | 4,994 (13.6%) |
| 20 to 24 Year Olds | 41,124 (81.8%) | 9,158 (18.2%) |
| 25 to 34 Year Olds | 23,332 (77.8%) | 6,643 (22.2%) |
| 35 Years and over | 14,292 (63.9%) | 8,071 (36.1%) |
| Total | 305,168 (80.7%) | 72,983 (19.3%) |
Educational Attainment by Field of Study in Orange County
Business (93,703 | 24.6%), science & technology (40,864 | 10.7%), engineering (35,608 | 9.3%), education (35,028 | 9.2%), and arts & humanities (24,401 | 6.4%) are the most common fields of study among 381,000 individuals in Orange County who have obtained a bachelor's degree or higher.
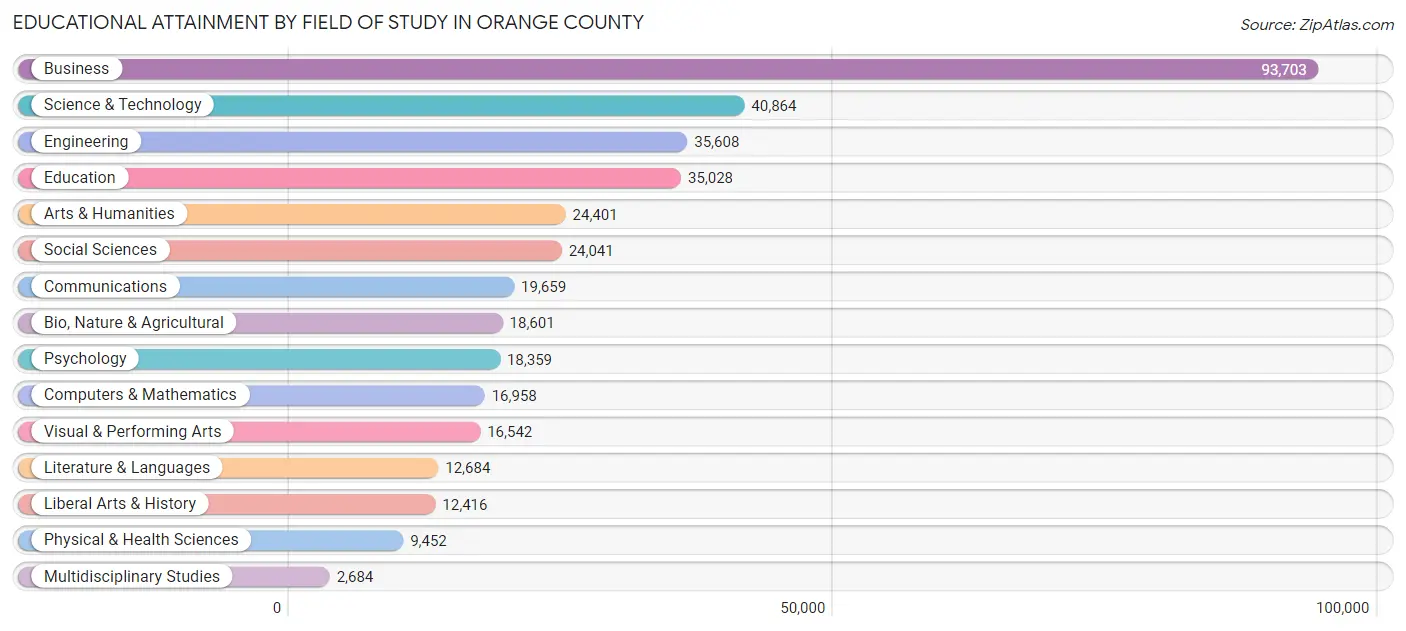
| Field of Study | # Graduates | % Graduates |
| Computers & Mathematics | 16,958 | 4.4% |
| Bio, Nature & Agricultural | 18,601 | 4.9% |
| Physical & Health Sciences | 9,452 | 2.5% |
| Psychology | 18,359 | 4.8% |
| Social Sciences | 24,041 | 6.3% |
| Engineering | 35,608 | 9.3% |
| Multidisciplinary Studies | 2,684 | 0.7% |
| Science & Technology | 40,864 | 10.7% |
| Business | 93,703 | 24.6% |
| Education | 35,028 | 9.2% |
| Literature & Languages | 12,684 | 3.3% |
| Liberal Arts & History | 12,416 | 3.3% |
| Visual & Performing Arts | 16,542 | 4.3% |
| Communications | 19,659 | 5.2% |
| Arts & Humanities | 24,401 | 6.4% |
| Total | 381,000 | 100.0% |
Transportation & Commute in Orange County
Vehicle Availability by Sex in Orange County
The most prevalent vehicle ownership categories in Orange County are males with 2 vehicles (174,363, accounting for 46.0%) and females with 2 vehicles (145,025, making up 52.0%).
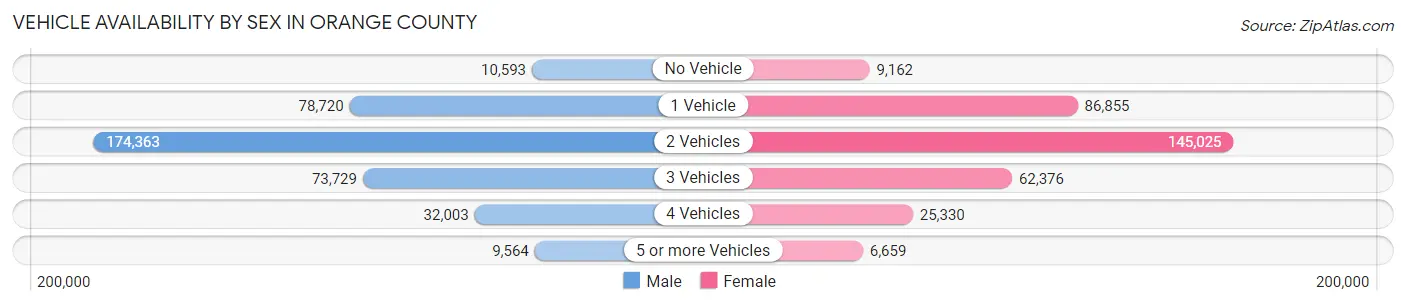
| Vehicles Available | Male | Female |
| No Vehicle | 10,593 (2.8%) | 9,162 (2.7%) |
| 1 Vehicle | 78,720 (20.8%) | 86,855 (25.9%) |
| 2 Vehicles | 174,363 (46.0%) | 145,025 (43.2%) |
| 3 Vehicles | 73,729 (19.5%) | 62,376 (18.6%) |
| 4 Vehicles | 32,003 (8.4%) | 25,330 (7.5%) |
| 5 or more Vehicles | 9,564 (2.5%) | 6,659 (2.0%) |
| Total | 378,972 (100.0%) | 335,407 (100.0%) |
Commute Time in Orange County
The most frequently occuring commute durations in Orange County are 30 to 34 minutes (122,750 commuters, 19.7%), 20 to 24 minutes (99,818 commuters, 16.0%), and 15 to 19 minutes (87,418 commuters, 14.0%).
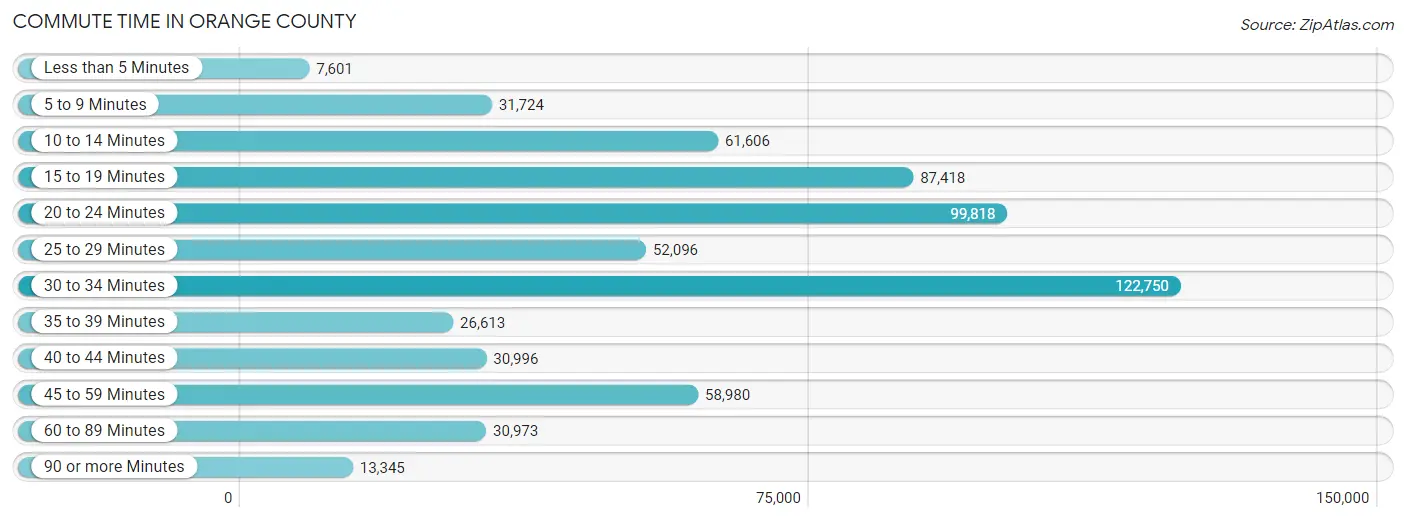
| Commute Time | # Commuters | % Commuters |
| Less than 5 Minutes | 7,601 | 1.2% |
| 5 to 9 Minutes | 31,724 | 5.1% |
| 10 to 14 Minutes | 61,606 | 9.9% |
| 15 to 19 Minutes | 87,418 | 14.0% |
| 20 to 24 Minutes | 99,818 | 16.0% |
| 25 to 29 Minutes | 52,096 | 8.4% |
| 30 to 34 Minutes | 122,750 | 19.7% |
| 35 to 39 Minutes | 26,613 | 4.3% |
| 40 to 44 Minutes | 30,996 | 5.0% |
| 45 to 59 Minutes | 58,980 | 9.5% |
| 60 to 89 Minutes | 30,973 | 5.0% |
| 90 or more Minutes | 13,345 | 2.1% |
Commute Time by Sex in Orange County
The most common commute times in Orange County are 30 to 34 minutes (68,747 commuters, 20.6%) for males and 30 to 34 minutes (54,003 commuters, 18.6%) for females.
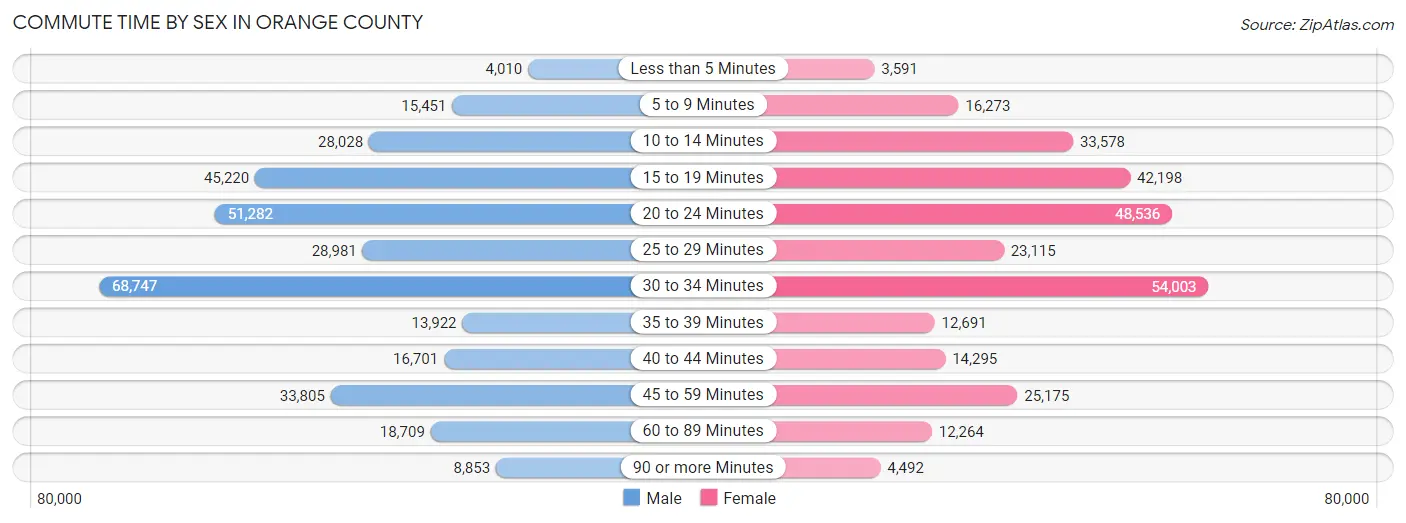
| Commute Time | Male | Female |
| Less than 5 Minutes | 4,010 (1.2%) | 3,591 (1.2%) |
| 5 to 9 Minutes | 15,451 (4.6%) | 16,273 (5.6%) |
| 10 to 14 Minutes | 28,028 (8.4%) | 33,578 (11.6%) |
| 15 to 19 Minutes | 45,220 (13.6%) | 42,198 (14.5%) |
| 20 to 24 Minutes | 51,282 (15.4%) | 48,536 (16.7%) |
| 25 to 29 Minutes | 28,981 (8.7%) | 23,115 (8.0%) |
| 30 to 34 Minutes | 68,747 (20.6%) | 54,003 (18.6%) |
| 35 to 39 Minutes | 13,922 (4.2%) | 12,691 (4.4%) |
| 40 to 44 Minutes | 16,701 (5.0%) | 14,295 (4.9%) |
| 45 to 59 Minutes | 33,805 (10.1%) | 25,175 (8.7%) |
| 60 to 89 Minutes | 18,709 (5.6%) | 12,264 (4.2%) |
| 90 or more Minutes | 8,853 (2.6%) | 4,492 (1.5%) |
Time of Departure to Work by Sex in Orange County
The most frequent times of departure to work in Orange County are 7:00 AM to 7:29 AM (47,037, 14.1%) for males and 8:00 AM to 8:29 AM (41,535, 14.3%) for females.
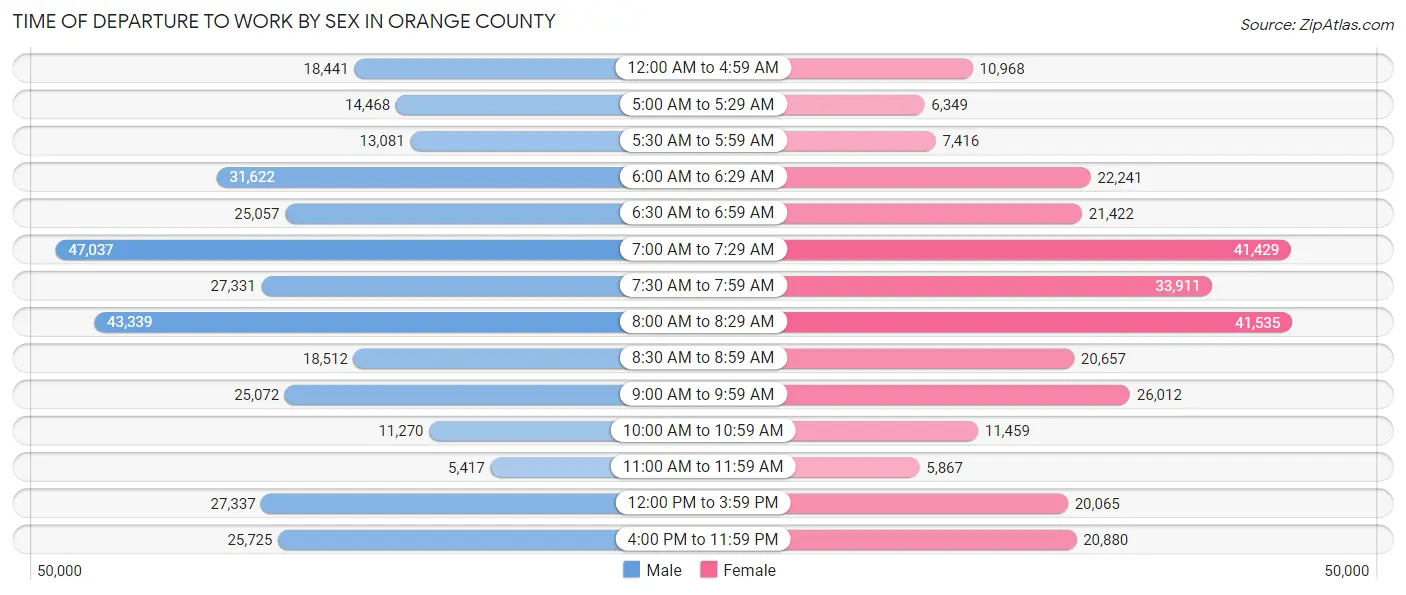
| Time of Departure | Male | Female |
| 12:00 AM to 4:59 AM | 18,441 (5.5%) | 10,968 (3.8%) |
| 5:00 AM to 5:29 AM | 14,468 (4.3%) | 6,349 (2.2%) |
| 5:30 AM to 5:59 AM | 13,081 (3.9%) | 7,416 (2.6%) |
| 6:00 AM to 6:29 AM | 31,622 (9.5%) | 22,241 (7.7%) |
| 6:30 AM to 6:59 AM | 25,057 (7.5%) | 21,422 (7.4%) |
| 7:00 AM to 7:29 AM | 47,037 (14.1%) | 41,429 (14.3%) |
| 7:30 AM to 7:59 AM | 27,331 (8.2%) | 33,911 (11.7%) |
| 8:00 AM to 8:29 AM | 43,339 (13.0%) | 41,535 (14.3%) |
| 8:30 AM to 8:59 AM | 18,512 (5.6%) | 20,657 (7.1%) |
| 9:00 AM to 9:59 AM | 25,072 (7.5%) | 26,012 (9.0%) |
| 10:00 AM to 10:59 AM | 11,270 (3.4%) | 11,459 (4.0%) |
| 11:00 AM to 11:59 AM | 5,417 (1.6%) | 5,867 (2.0%) |
| 12:00 PM to 3:59 PM | 27,337 (8.2%) | 20,065 (6.9%) |
| 4:00 PM to 11:59 PM | 25,725 (7.7%) | 20,880 (7.2%) |
| Total | 333,709 (100.0%) | 290,211 (100.0%) |
Housing Occupancy in Orange County
Occupancy by Ownership in Orange County
Of the total 491,378 dwellings in Orange County, owner-occupied units account for 279,925 (57.0%), while renter-occupied units make up 211,453 (43.0%).
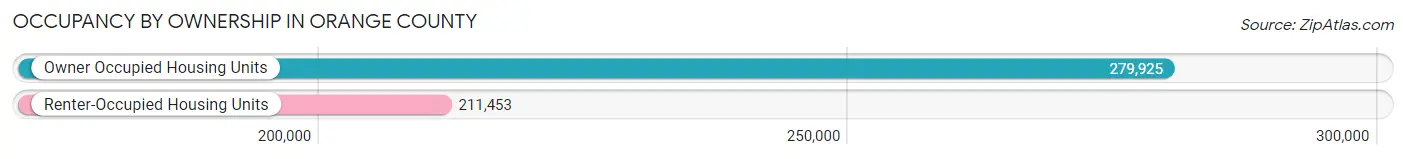
| Occupancy | # Housing Units | % Housing Units |
| Owner Occupied Housing Units | 279,925 | 57.0% |
| Renter-Occupied Housing Units | 211,453 | 43.0% |
| Total Occupied Housing Units | 491,378 | 100.0% |
Occupancy by Household Size in Orange County
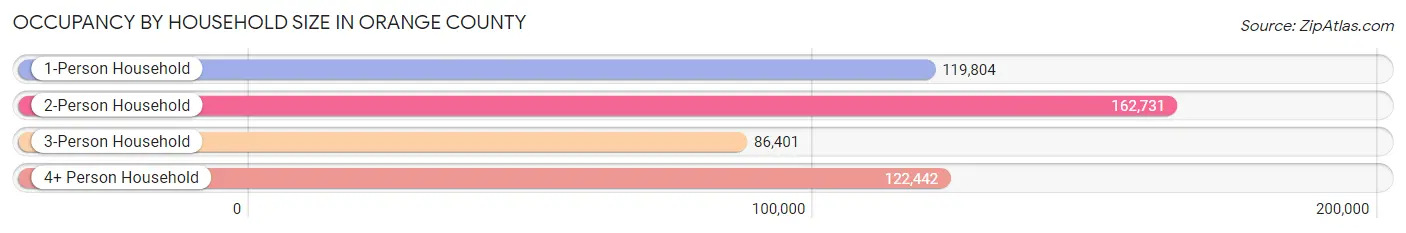
| Household Size | # Housing Units | % Housing Units |
| 1-Person Household | 119,804 | 24.4% |
| 2-Person Household | 162,731 | 33.1% |
| 3-Person Household | 86,401 | 17.6% |
| 4+ Person Household | 122,442 | 24.9% |
| Total Housing Units | 491,378 | 100.0% |
Occupancy by Ownership by Household Size in Orange County
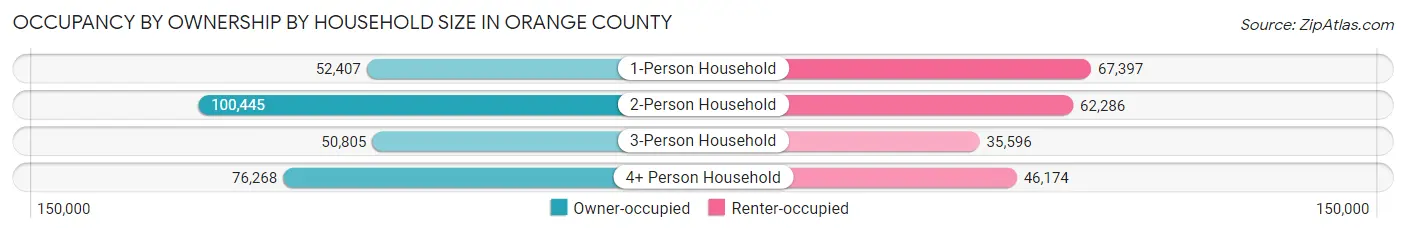
| Household Size | Owner-occupied | Renter-occupied |
| 1-Person Household | 52,407 (43.7%) | 67,397 (56.3%) |
| 2-Person Household | 100,445 (61.7%) | 62,286 (38.3%) |
| 3-Person Household | 50,805 (58.8%) | 35,596 (41.2%) |
| 4+ Person Household | 76,268 (62.3%) | 46,174 (37.7%) |
| Total Housing Units | 279,925 (57.0%) | 211,453 (43.0%) |
Occupancy by Educational Attainment in Orange County
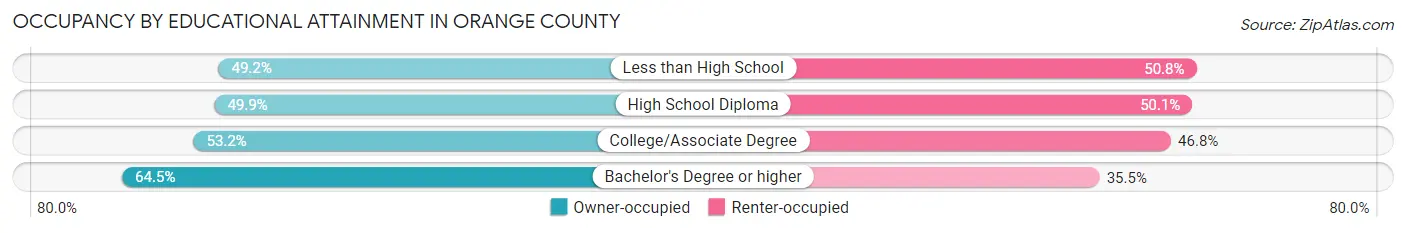
| Household Size | Owner-occupied | Renter-occupied |
| Less than High School | 19,777 (49.2%) | 20,392 (50.8%) |
| High School Diploma | 49,550 (49.9%) | 49,780 (50.1%) |
| College/Associate Degree | 77,452 (53.2%) | 68,120 (46.8%) |
| Bachelor's Degree or higher | 133,146 (64.5%) | 73,161 (35.5%) |
Occupancy by Age of Householder in Orange County
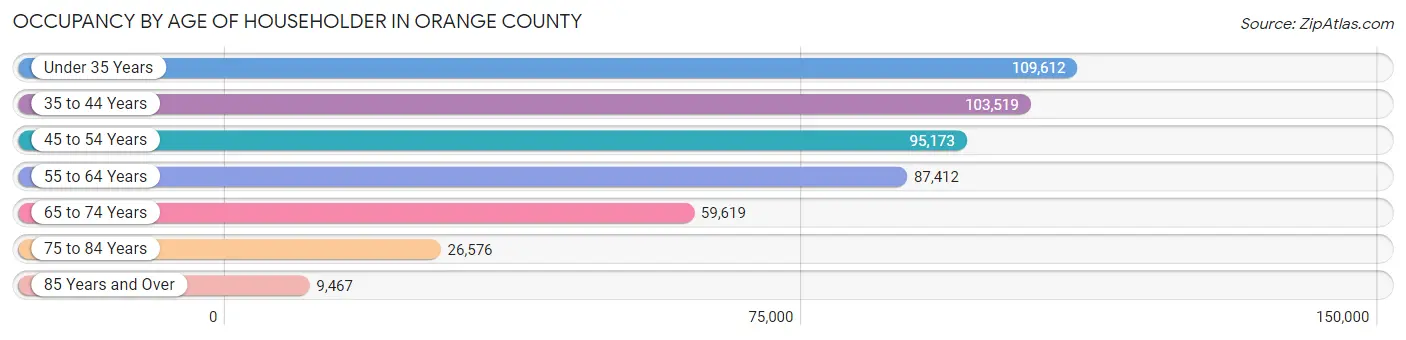
| Age Bracket | # Households | % Households |
| Under 35 Years | 109,612 | 22.3% |
| 35 to 44 Years | 103,519 | 21.1% |
| 45 to 54 Years | 95,173 | 19.4% |
| 55 to 64 Years | 87,412 | 17.8% |
| 65 to 74 Years | 59,619 | 12.1% |
| 75 to 84 Years | 26,576 | 5.4% |
| 85 Years and Over | 9,467 | 1.9% |
| Total | 491,378 | 100.0% |
Housing Finances in Orange County
Median Income by Occupancy in Orange County
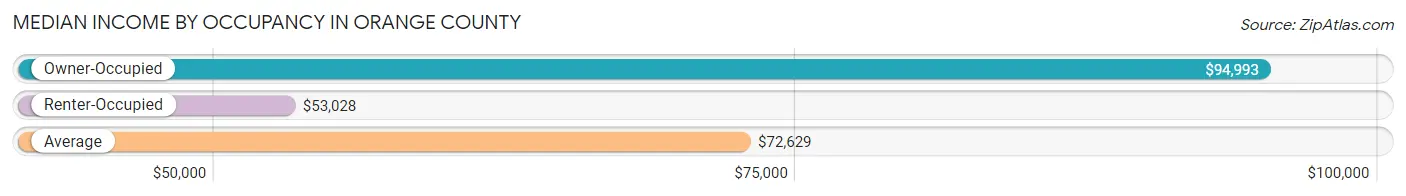
| Occupancy Type | # Households | Median Income |
| Owner-Occupied | 279,925 (57.0%) | $94,993 |
| Renter-Occupied | 211,453 (43.0%) | $53,028 |
| Average | 491,378 (100.0%) | $72,629 |
Occupancy by Householder Income Bracket in Orange County
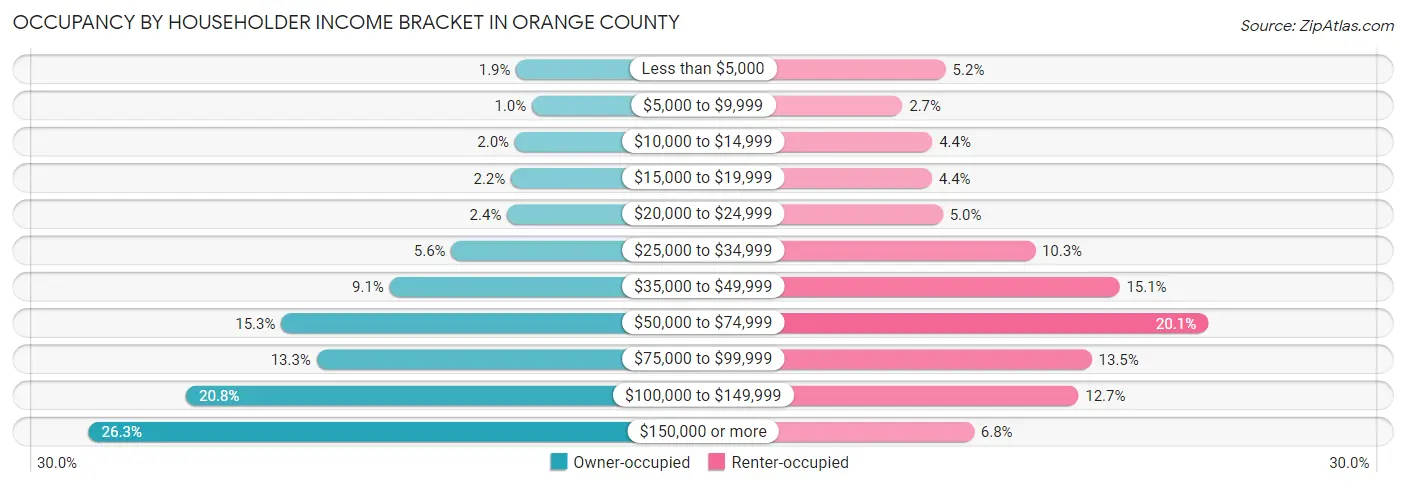
| Income Bracket | Owner-occupied | Renter-occupied |
| Less than $5,000 | 5,309 (1.9%) | 10,898 (5.1%) |
| $5,000 to $9,999 | 2,808 (1.0%) | 5,654 (2.7%) |
| $10,000 to $14,999 | 5,536 (2.0%) | 9,272 (4.4%) |
| $15,000 to $19,999 | 6,154 (2.2%) | 9,229 (4.4%) |
| $20,000 to $24,999 | 6,783 (2.4%) | 10,523 (5.0%) |
| $25,000 to $34,999 | 15,714 (5.6%) | 21,670 (10.2%) |
| $35,000 to $49,999 | 25,583 (9.1%) | 31,886 (15.1%) |
| $50,000 to $74,999 | 42,915 (15.3%) | 42,587 (20.1%) |
| $75,000 to $99,999 | 37,261 (13.3%) | 28,521 (13.5%) |
| $100,000 to $149,999 | 58,129 (20.8%) | 26,914 (12.7%) |
| $150,000 or more | 73,733 (26.3%) | 14,299 (6.8%) |
| Total | 279,925 (100.0%) | 211,453 (100.0%) |
Monthly Housing Cost Tiers in Orange County
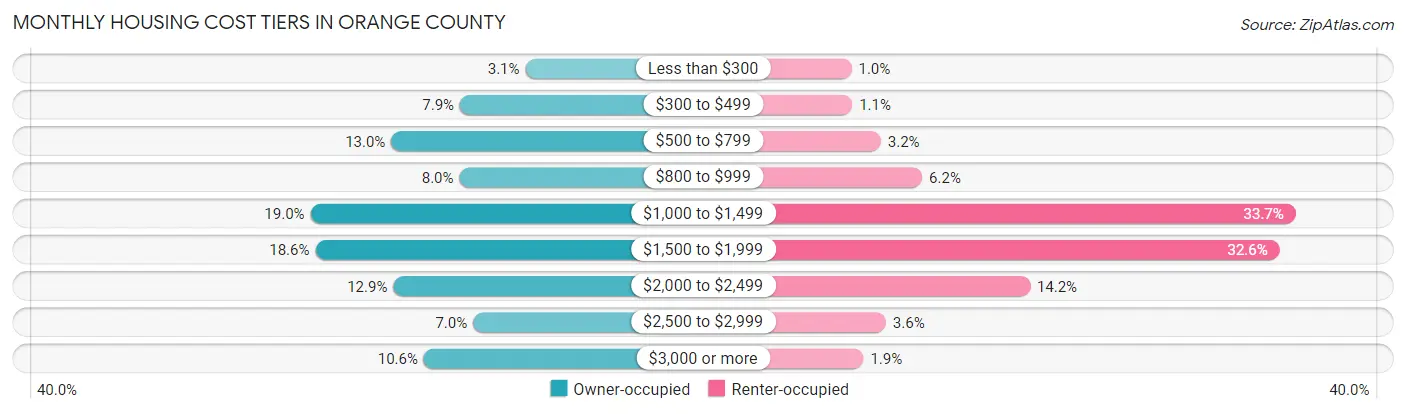
| Monthly Cost | Owner-occupied | Renter-occupied |
| Less than $300 | 8,744 (3.1%) | 2,208 (1.0%) |
| $300 to $499 | 22,229 (7.9%) | 2,309 (1.1%) |
| $500 to $799 | 36,377 (13.0%) | 6,770 (3.2%) |
| $800 to $999 | 22,328 (8.0%) | 13,187 (6.2%) |
| $1,000 to $1,499 | 53,047 (19.0%) | 71,335 (33.7%) |
| $1,500 to $1,999 | 52,035 (18.6%) | 68,843 (32.6%) |
| $2,000 to $2,499 | 35,974 (12.9%) | 29,994 (14.2%) |
| $2,500 to $2,999 | 19,508 (7.0%) | 7,555 (3.6%) |
| $3,000 or more | 29,683 (10.6%) | 4,066 (1.9%) |
| Total | 279,925 (100.0%) | 211,453 (100.0%) |
Physical Housing Characteristics in Orange County
Housing Structures in Orange County
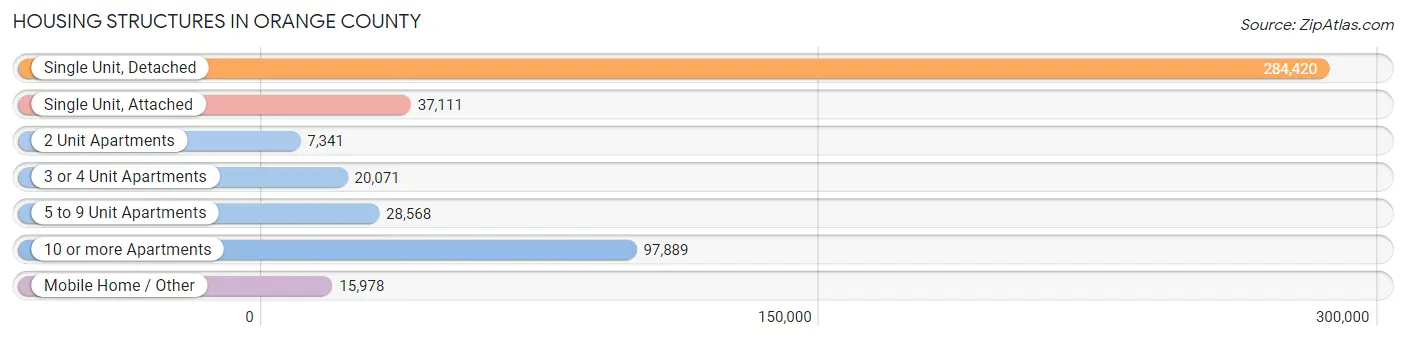
| Structure Type | # Housing Units | % Housing Units |
| Single Unit, Detached | 284,420 | 57.9% |
| Single Unit, Attached | 37,111 | 7.5% |
| 2 Unit Apartments | 7,341 | 1.5% |
| 3 or 4 Unit Apartments | 20,071 | 4.1% |
| 5 to 9 Unit Apartments | 28,568 | 5.8% |
| 10 or more Apartments | 97,889 | 19.9% |
| Mobile Home / Other | 15,978 | 3.3% |
| Total | 491,378 | 100.0% |
Housing Structures by Occupancy in Orange County
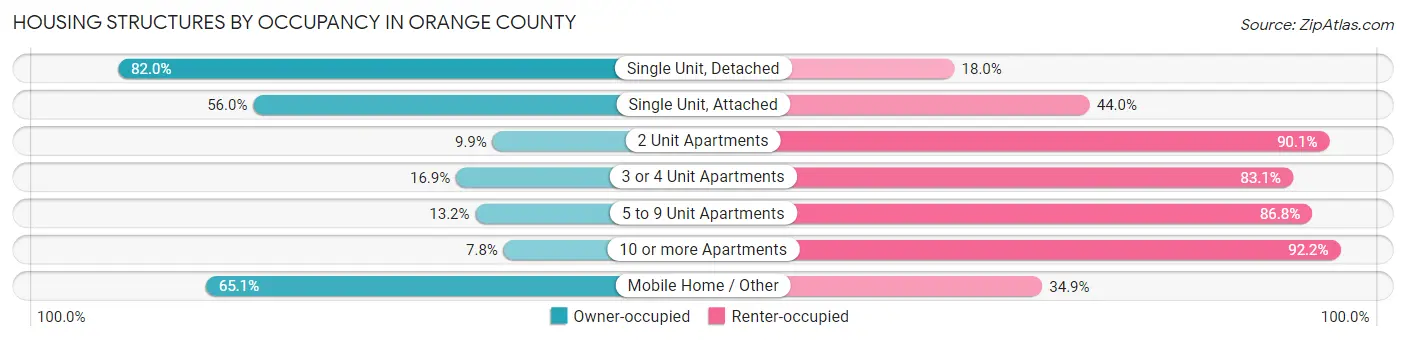
| Structure Type | Owner-occupied | Renter-occupied |
| Single Unit, Detached | 233,253 (82.0%) | 51,167 (18.0%) |
| Single Unit, Attached | 20,774 (56.0%) | 16,337 (44.0%) |
| 2 Unit Apartments | 726 (9.9%) | 6,615 (90.1%) |
| 3 or 4 Unit Apartments | 3,398 (16.9%) | 16,673 (83.1%) |
| 5 to 9 Unit Apartments | 3,774 (13.2%) | 24,794 (86.8%) |
| 10 or more Apartments | 7,596 (7.8%) | 90,293 (92.2%) |
| Mobile Home / Other | 10,404 (65.1%) | 5,574 (34.9%) |
| Total | 279,925 (57.0%) | 211,453 (43.0%) |
Housing Structures by Number of Rooms in Orange County
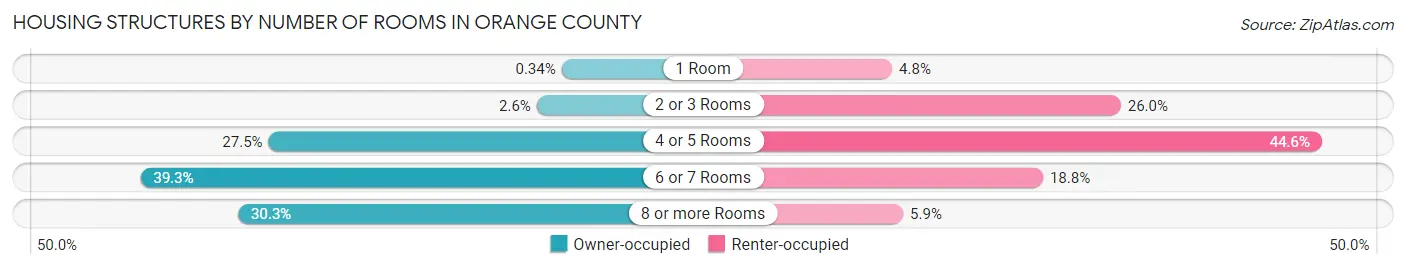
| Number of Rooms | Owner-occupied | Renter-occupied |
| 1 Room | 952 (0.3%) | 10,213 (4.8%) |
| 2 or 3 Rooms | 7,379 (2.6%) | 54,930 (26.0%) |
| 4 or 5 Rooms | 76,850 (27.5%) | 94,229 (44.6%) |
| 6 or 7 Rooms | 110,020 (39.3%) | 39,701 (18.8%) |
| 8 or more Rooms | 84,724 (30.3%) | 12,380 (5.9%) |
| Total | 279,925 (100.0%) | 211,453 (100.0%) |
Housing Structure by Heating Type in Orange County
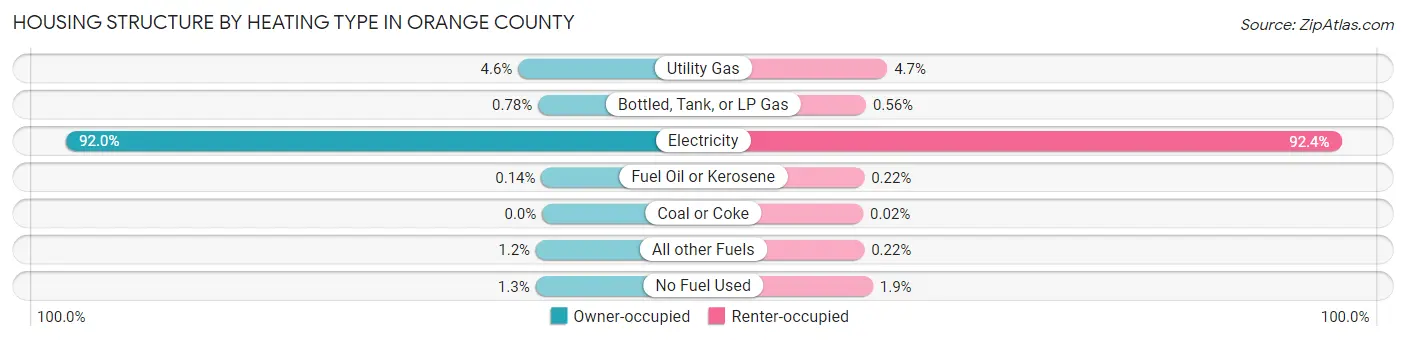
| Heating Type | Owner-occupied | Renter-occupied |
| Utility Gas | 12,944 (4.6%) | 9,882 (4.7%) |
| Bottled, Tank, or LP Gas | 2,182 (0.8%) | 1,183 (0.6%) |
| Electricity | 257,499 (92.0%) | 195,417 (92.4%) |
| Fuel Oil or Kerosene | 381 (0.1%) | 465 (0.2%) |
| Coal or Coke | 0 (0.0%) | 38 (0.0%) |
| All other Fuels | 3,330 (1.2%) | 467 (0.2%) |
| No Fuel Used | 3,589 (1.3%) | 4,001 (1.9%) |
| Total | 279,925 (100.0%) | 211,453 (100.0%) |
Household Vehicle Usage in Orange County
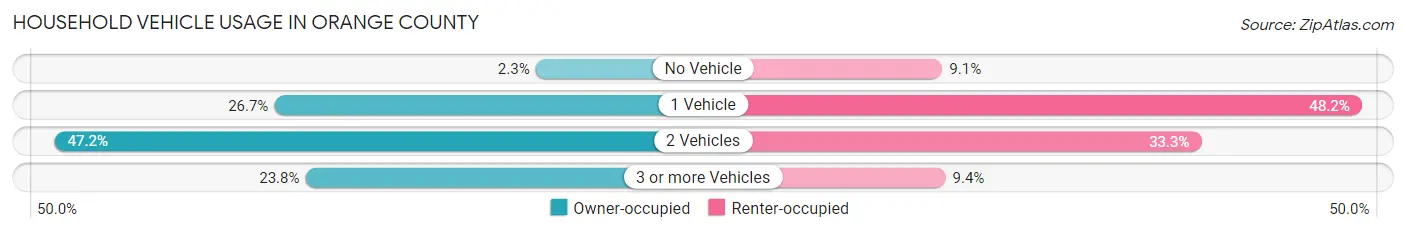
| Vehicles per Household | Owner-occupied | Renter-occupied |
| No Vehicle | 6,461 (2.3%) | 19,249 (9.1%) |
| 1 Vehicle | 74,734 (26.7%) | 101,992 (48.2%) |
| 2 Vehicles | 132,102 (47.2%) | 70,325 (33.3%) |
| 3 or more Vehicles | 66,628 (23.8%) | 19,887 (9.4%) |
| Total | 279,925 (100.0%) | 211,453 (100.0%) |
Real Estate & Mortgages in Orange County
Real Estate and Mortgage Overview in Orange County
| Characteristic | Without Mortgage | With Mortgage |
| Housing Units | 88,765 | 191,160 |
| Median Property Value | $292,400 | $342,400 |
| Median Household Income | $69,250 | $57,262 |
| Monthly Housing Costs | $625 | $27,997 |
| Real Estate Taxes | $2,280 | $5,110 |
Property Value by Mortgage Status in Orange County
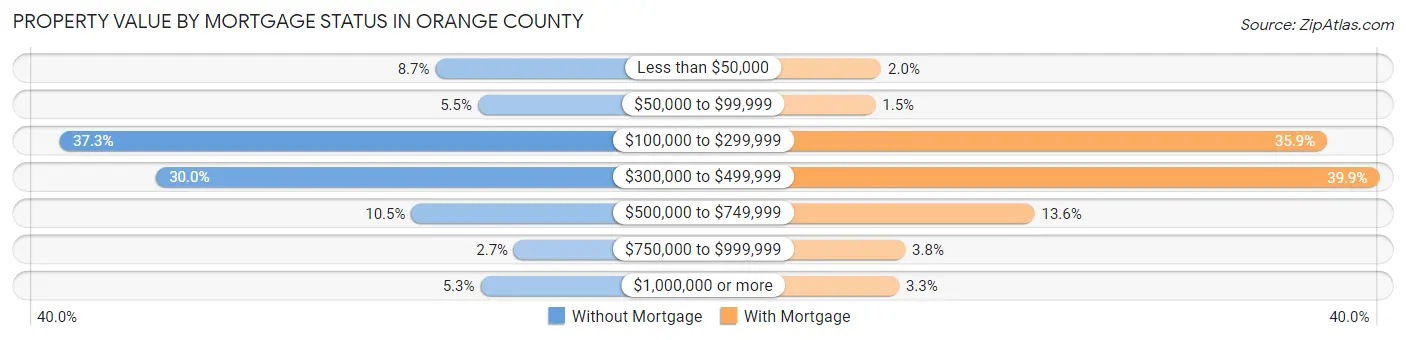
| Property Value | Without Mortgage | With Mortgage |
| Less than $50,000 | 7,731 (8.7%) | 3,723 (1.9%) |
| $50,000 to $99,999 | 4,854 (5.5%) | 2,879 (1.5%) |
| $100,000 to $299,999 | 33,109 (37.3%) | 68,662 (35.9%) |
| $300,000 to $499,999 | 26,606 (30.0%) | 76,264 (39.9%) |
| $500,000 to $749,999 | 9,356 (10.5%) | 26,071 (13.6%) |
| $750,000 to $999,999 | 2,418 (2.7%) | 7,235 (3.8%) |
| $1,000,000 or more | 4,691 (5.3%) | 6,326 (3.3%) |
| Total | 88,765 (100.0%) | 191,160 (100.0%) |
Household Income by Mortgage Status in Orange County
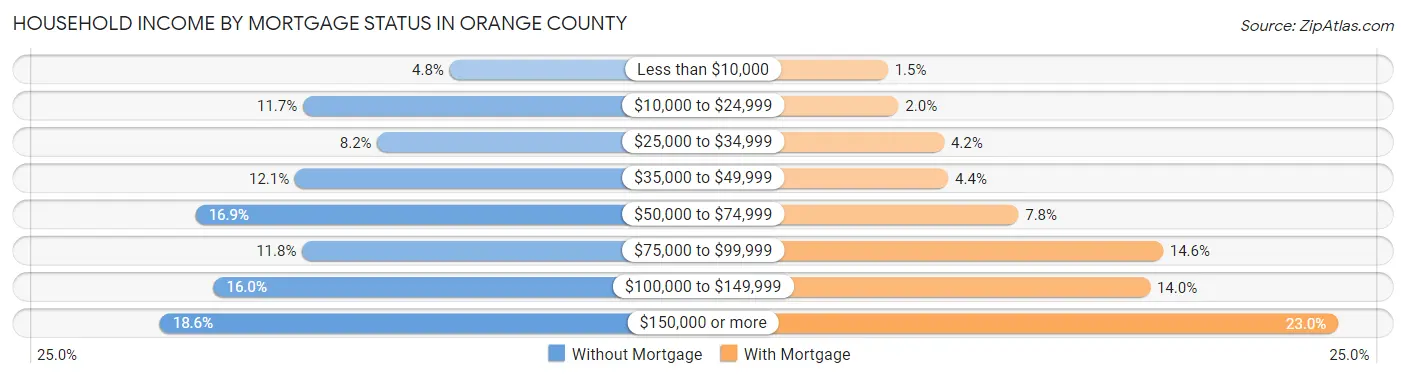
| Household Income | Without Mortgage | With Mortgage |
| Less than $10,000 | 4,221 (4.8%) | 2,919 (1.5%) |
| $10,000 to $24,999 | 10,417 (11.7%) | 3,896 (2.0%) |
| $25,000 to $34,999 | 7,281 (8.2%) | 8,056 (4.2%) |
| $35,000 to $49,999 | 10,762 (12.1%) | 8,433 (4.4%) |
| $50,000 to $74,999 | 14,953 (16.9%) | 14,821 (7.7%) |
| $75,000 to $99,999 | 10,459 (11.8%) | 27,962 (14.6%) |
| $100,000 to $149,999 | 14,201 (16.0%) | 26,802 (14.0%) |
| $150,000 or more | 16,471 (18.6%) | 43,928 (23.0%) |
| Total | 88,765 (100.0%) | 191,160 (100.0%) |
Property Value to Household Income Ratio in Orange County
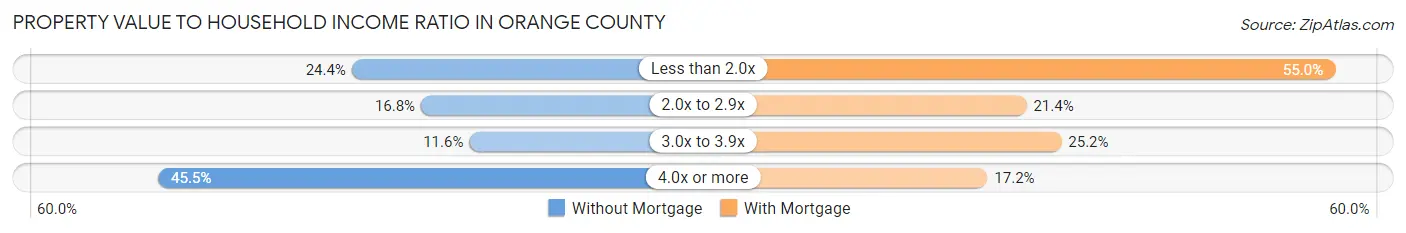
| Value-to-Income Ratio | Without Mortgage | With Mortgage |
| Less than 2.0x | 21,620 (24.4%) | 105,208 (55.0%) |
| 2.0x to 2.9x | 14,925 (16.8%) | 40,953 (21.4%) |
| 3.0x to 3.9x | 10,251 (11.6%) | 48,202 (25.2%) |
| 4.0x or more | 40,341 (45.5%) | 32,809 (17.2%) |
| Total | 88,765 (100.0%) | 191,160 (100.0%) |
Real Estate Taxes by Mortgage Status in Orange County
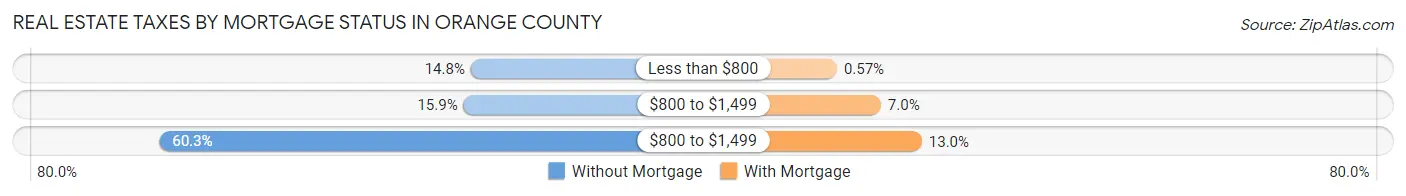
| Property Taxes | Without Mortgage | With Mortgage |
| Less than $800 | 13,148 (14.8%) | 1,085 (0.6%) |
| $800 to $1,499 | 14,085 (15.9%) | 13,366 (7.0%) |
| $800 to $1,499 | 53,530 (60.3%) | 24,805 (13.0%) |
| Total | 88,765 (100.0%) | 191,160 (100.0%) |
Health & Disability in Orange County
Health Insurance Coverage by Age in Orange County
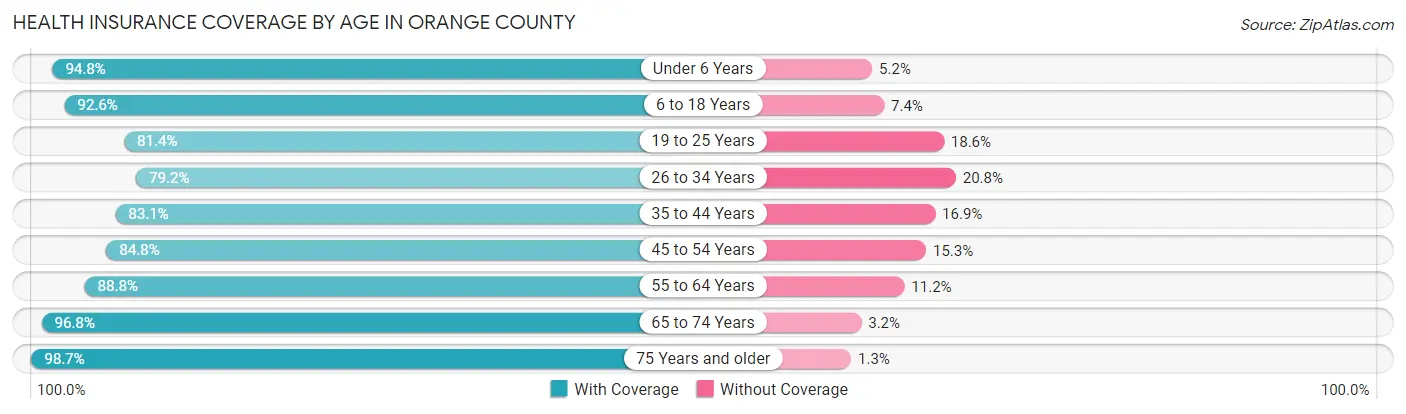
| Age Bracket | With Coverage | Without Coverage |
| Under 6 Years | 93,482 (94.8%) | 5,127 (5.2%) |
| 6 to 18 Years | 215,537 (92.6%) | 17,311 (7.4%) |
| 19 to 25 Years | 125,507 (81.4%) | 28,622 (18.6%) |
| 26 to 34 Years | 161,536 (79.2%) | 42,400 (20.8%) |
| 35 to 44 Years | 171,397 (83.1%) | 34,949 (16.9%) |
| 45 to 54 Years | 156,308 (84.8%) | 28,132 (15.2%) |
| 55 to 64 Years | 143,538 (88.8%) | 18,121 (11.2%) |
| 65 to 74 Years | 103,191 (96.8%) | 3,379 (3.2%) |
| 75 Years and older | 65,701 (98.7%) | 848 (1.3%) |
| Total | 1,236,197 (87.4%) | 178,889 (12.6%) |
Health Insurance Coverage by Citizenship Status in Orange County
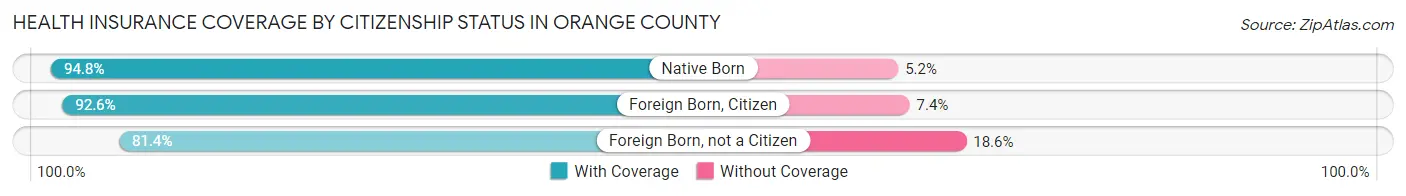
| Citizenship Status | With Coverage | Without Coverage |
| Native Born | 93,482 (94.8%) | 5,127 (5.2%) |
| Foreign Born, Citizen | 215,537 (92.6%) | 17,311 (7.4%) |
| Foreign Born, not a Citizen | 125,507 (81.4%) | 28,622 (18.6%) |
Health Insurance Coverage by Household Income in Orange County
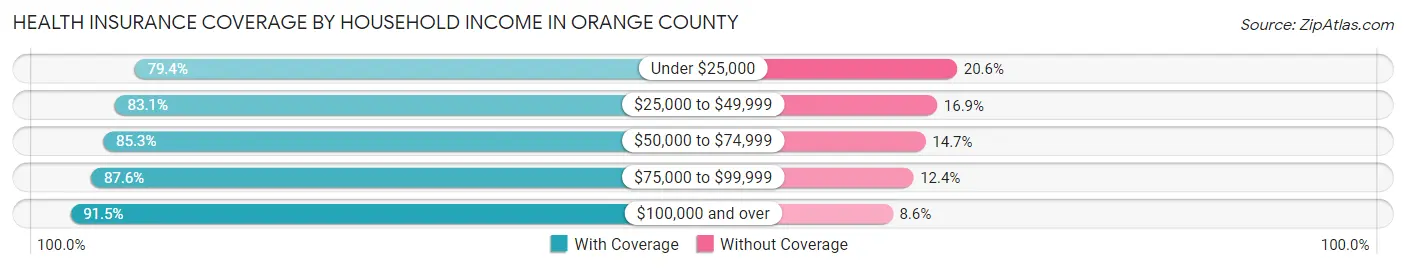
| Household Income | With Coverage | Without Coverage |
| Under $25,000 | 115,357 (79.4%) | 29,939 (20.6%) |
| $25,000 to $49,999 | 197,136 (83.1%) | 39,994 (16.9%) |
| $50,000 to $74,999 | 200,481 (85.3%) | 34,597 (14.7%) |
| $75,000 to $99,999 | 173,838 (87.6%) | 24,701 (12.4%) |
| $100,000 and over | 522,863 (91.4%) | 48,883 (8.6%) |
Public vs Private Health Insurance Coverage by Age in Orange County
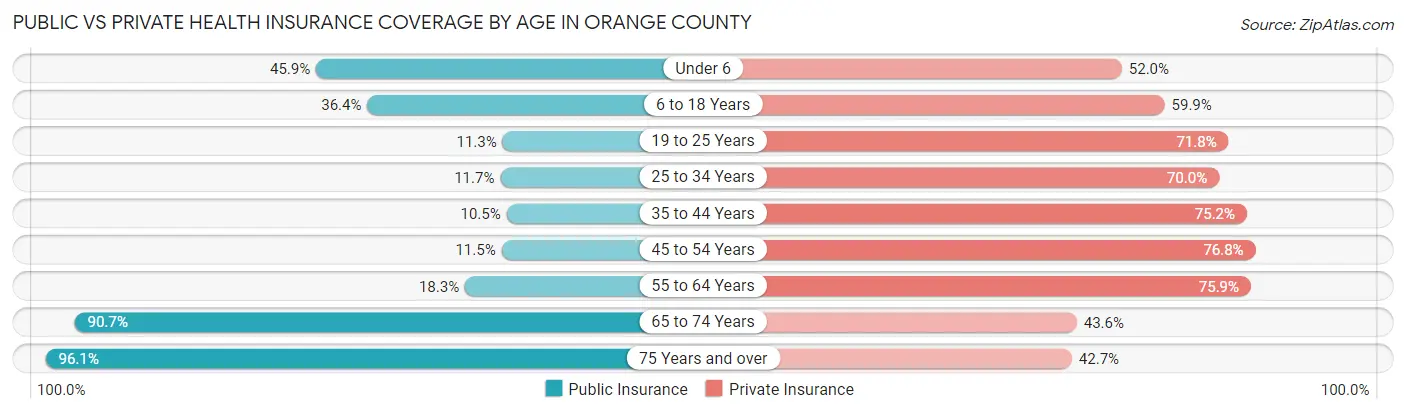
| Age Bracket | Public Insurance | Private Insurance |
| Under 6 | 45,260 (45.9%) | 51,257 (52.0%) |
| 6 to 18 Years | 84,728 (36.4%) | 139,522 (59.9%) |
| 19 to 25 Years | 17,406 (11.3%) | 110,625 (71.8%) |
| 25 to 34 Years | 23,899 (11.7%) | 142,782 (70.0%) |
| 35 to 44 Years | 21,749 (10.5%) | 155,129 (75.2%) |
| 45 to 54 Years | 21,166 (11.5%) | 141,590 (76.8%) |
| 55 to 64 Years | 29,524 (18.3%) | 122,730 (75.9%) |
| 65 to 74 Years | 96,695 (90.7%) | 46,484 (43.6%) |
| 75 Years and over | 63,951 (96.1%) | 28,422 (42.7%) |
| Total | 404,378 (28.6%) | 938,541 (66.3%) |
Disability Status by Sex by Age in Orange County
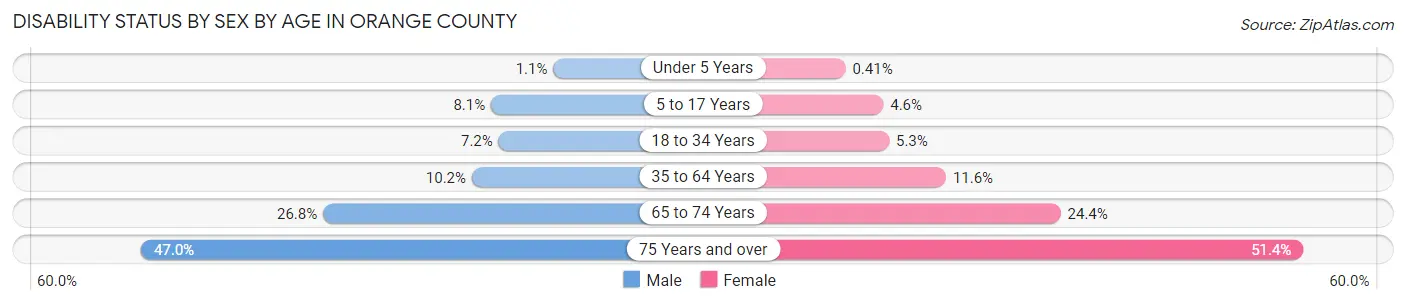
| Age Bracket | Male | Female |
| Under 5 Years | 468 (1.1%) | 166 (0.4%) |
| 5 to 17 Years | 9,302 (8.1%) | 5,109 (4.6%) |
| 18 to 34 Years | 13,592 (7.2%) | 10,133 (5.3%) |
| 35 to 64 Years | 27,883 (10.2%) | 32,353 (11.6%) |
| 65 to 74 Years | 13,099 (26.8%) | 14,042 (24.4%) |
| 75 Years and over | 12,894 (47.0%) | 20,109 (51.4%) |
Disability Class by Sex by Age in Orange County
Disability Class: Hearing Difficulty
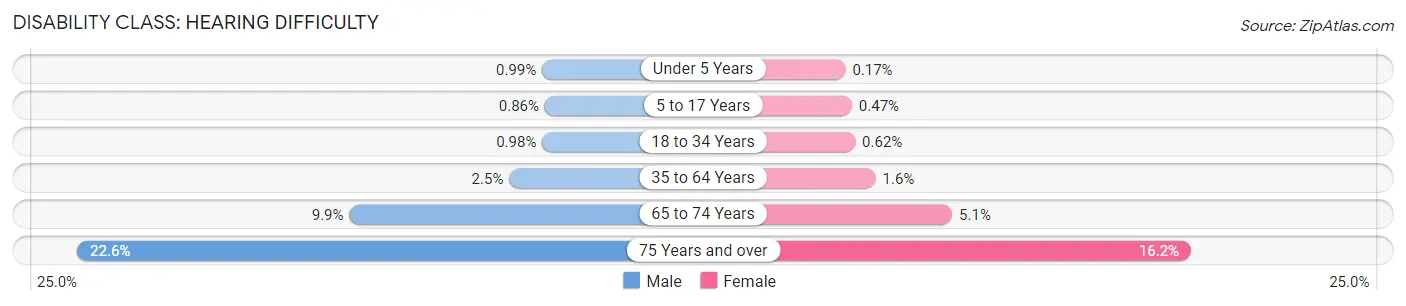
| Age Bracket | Male | Female |
| Under 5 Years | 415 (1.0%) | 69 (0.2%) |
| 5 to 17 Years | 991 (0.9%) | 516 (0.5%) |
| 18 to 34 Years | 1,842 (1.0%) | 1,187 (0.6%) |
| 35 to 64 Years | 6,870 (2.5%) | 4,387 (1.6%) |
| 65 to 74 Years | 4,860 (9.9%) | 2,950 (5.1%) |
| 75 Years and over | 6,183 (22.6%) | 6,339 (16.2%) |
Disability Class: Vision Difficulty
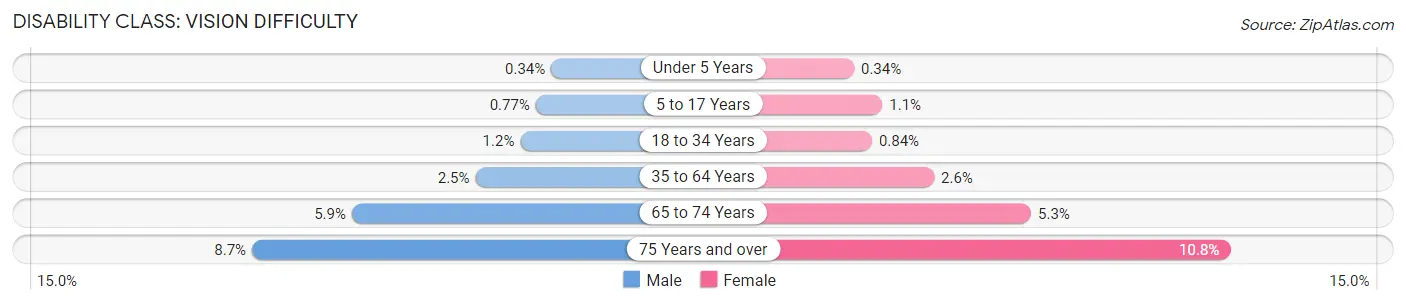
| Age Bracket | Male | Female |
| Under 5 Years | 142 (0.3%) | 135 (0.3%) |
| 5 to 17 Years | 891 (0.8%) | 1,248 (1.1%) |
| 18 to 34 Years | 2,255 (1.2%) | 1,618 (0.8%) |
| 35 to 64 Years | 6,700 (2.5%) | 7,171 (2.6%) |
| 65 to 74 Years | 2,882 (5.9%) | 3,034 (5.3%) |
| 75 Years and over | 2,377 (8.7%) | 4,241 (10.8%) |
Disability Class: Cognitive Difficulty
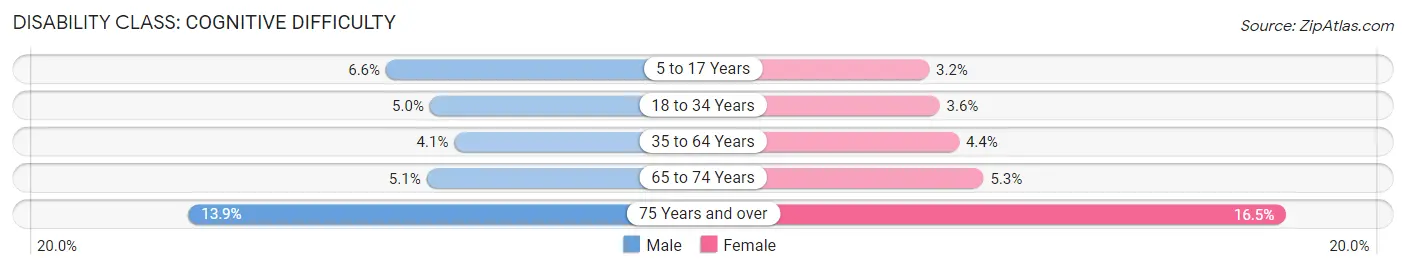
| Age Bracket | Male | Female |
| 5 to 17 Years | 7,618 (6.6%) | 3,582 (3.2%) |
| 18 to 34 Years | 9,347 (5.0%) | 6,992 (3.6%) |
| 35 to 64 Years | 11,094 (4.1%) | 12,135 (4.3%) |
| 65 to 74 Years | 2,489 (5.1%) | 3,030 (5.3%) |
| 75 Years and over | 3,816 (13.9%) | 6,454 (16.5%) |
Disability Class: Ambulatory Difficulty
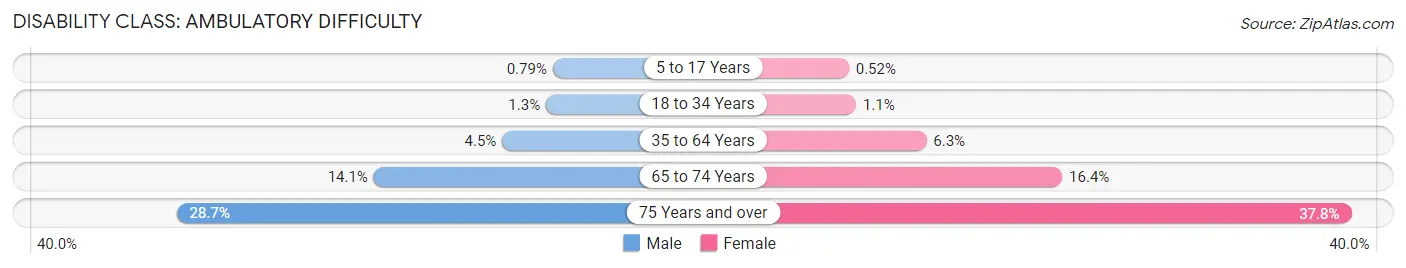
| Age Bracket | Male | Female |
| 5 to 17 Years | 918 (0.8%) | 579 (0.5%) |
| 18 to 34 Years | 2,429 (1.3%) | 2,018 (1.1%) |
| 35 to 64 Years | 12,435 (4.5%) | 17,513 (6.3%) |
| 65 to 74 Years | 6,893 (14.1%) | 9,427 (16.4%) |
| 75 Years and over | 7,871 (28.7%) | 14,803 (37.8%) |
Disability Class: Self-Care Difficulty
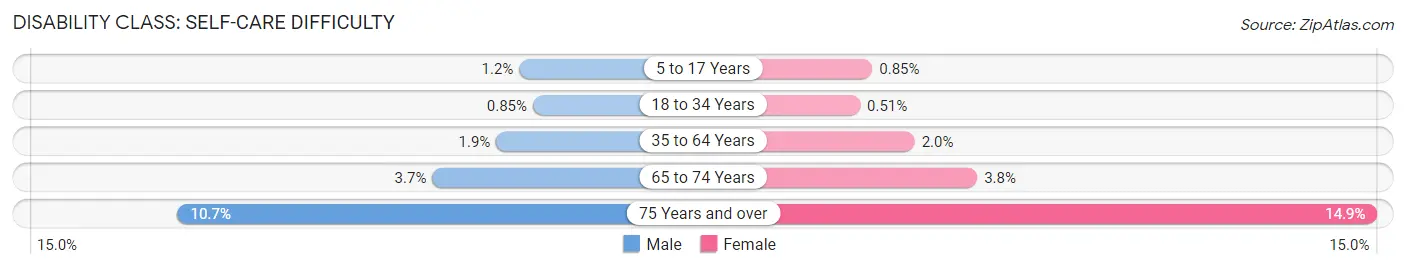
| Age Bracket | Male | Female |
| 5 to 17 Years | 1,418 (1.2%) | 935 (0.9%) |
| 18 to 34 Years | 1,600 (0.9%) | 986 (0.5%) |
| 35 to 64 Years | 5,130 (1.9%) | 5,666 (2.0%) |
| 65 to 74 Years | 1,786 (3.6%) | 2,172 (3.8%) |
| 75 Years and over | 2,943 (10.7%) | 5,836 (14.9%) |
Technology Access in Orange County
Computing Device Access in Orange County
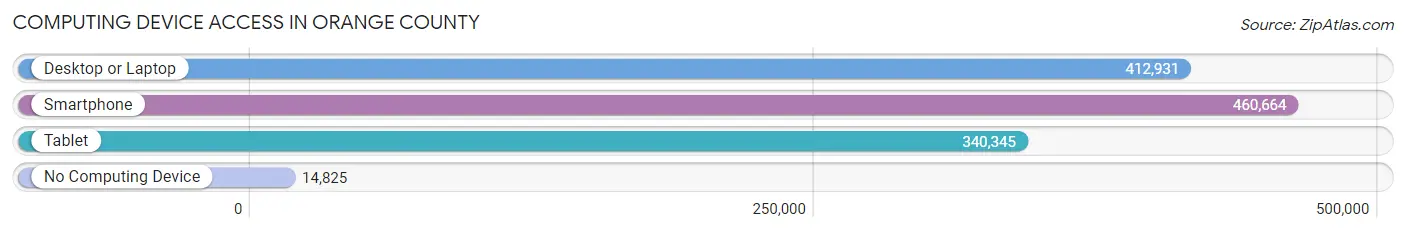
| Device Type | # Households | % Households |
| Desktop or Laptop | 412,931 | 84.0% |
| Smartphone | 460,664 | 93.8% |
| Tablet | 340,345 | 69.3% |
| No Computing Device | 14,825 | 3.0% |
| Total | 491,378 | 100.0% |
Internet Access in Orange County
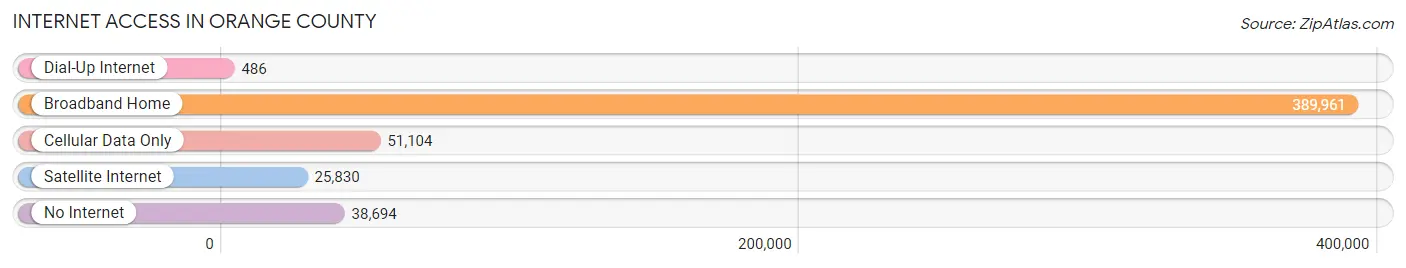
| Internet Type | # Households | % Households |
| Dial-Up Internet | 486 | 0.1% |
| Broadband Home | 389,961 | 79.4% |
| Cellular Data Only | 51,104 | 10.4% |
| Satellite Internet | 25,830 | 5.3% |
| No Internet | 38,694 | 7.9% |
| Total | 491,378 | 100.0% |
Orange County Summary
Orange County, Florida is located in the central part of the state and is part of the Orlando-Kissimmee-Sanford Metropolitan Statistical Area. It is the sixth most populous county in Florida, with a population of 1,145,956 as of the 2019 census. The county seat is Orlando, the state's third-largest city. Orange County is home to the University of Central Florida, the second-largest university in the United States by enrollment.
History
Orange County was created in 1845 from parts of Mosquito County and was named for the citrus fruit that was grown in the area. The county was originally part of the Seminole Wars, and the area was home to many Seminole and Miccosukee tribes. In 1856, the county was divided into two parts, with the northern part becoming Brevard County and the southern part remaining as Orange County.
In the late 19th century, the area was developed for citrus production, and the county became known as the "Orange Capital of the World." The county was also home to many of the early theme parks in the area, including Cypress Gardens, which opened in 1936.
Geography
Orange County covers an area of 1,003 square miles and is located in the central part of the state. It is bordered by Lake County to the north, Seminole County to the east, Osceola County to the south, and Polk County to the west. The county is home to many lakes, including Lake Apopka, Lake Conway, and Lake Mary Jane. The county also contains the headwaters of the St. Johns River.
The terrain of Orange County is mostly flat, with some rolling hills in the northern part of the county. The highest point in the county is Sugarloaf Mountain, which has an elevation of 312 feet. The county is home to many parks and preserves, including the Wekiwa Springs State Park, the Orlando Wetlands Park, and the Split Oak Forest.
Economy
Orange County has a diverse economy, with a mix of industries including tourism, manufacturing, healthcare, and technology. The county is home to many major employers, including Walt Disney World, Universal Orlando Resort, and Lockheed Martin. The county is also home to the University of Central Florida, which is the second-largest university in the United States by enrollment.
Tourism is a major industry in Orange County, with the county being home to many of the state's major attractions, including Walt Disney World, Universal Orlando Resort, and SeaWorld Orlando. The county is also home to many other attractions, including the Kennedy Space Center, Gatorland, and the Orange County Convention Center.
Demographics
As of the 2019 census, Orange County had a population of 1,145,956. The racial makeup of the county was 57.2% White, 28.2% Hispanic or Latino, 13.2% Black or African American, 5.2% Asian, and 2.2% other races. The median household income was $50,890, and the median age was 36.7 years.
Orange County is home to many immigrants, with the largest groups being from Mexico, Puerto Rico, and Cuba. The county is also home to many religious groups, with the largest being Catholic, followed by Baptist, Methodist, and Pentecostal.
Conclusion
Orange County, Florida is a diverse and vibrant county located in the central part of the state. It is home to many major employers, attractions, and universities, and has a diverse economy. The county is also home to many immigrants, with the largest groups being from Mexico, Puerto Rico, and Cuba. With its rich history, vibrant economy, and diverse population, Orange County is an important part of the state of Florida.
Common Questions
What is Per Capita Income in Orange County?
Per Capita income in Orange County is $37,330.
What is the Median Family Income in Orange County?
Median Family Income in Orange County is $83,625.
What is the Median Household income in Orange County?
Median Household Income in Orange County is $72,629.
What is Income or Wage Gap in Orange County?
Income or Wage Gap in Orange County is 22.6%.
Women in Orange County earn 77.4 cents for every dollar earned by a man.
What is Family Income Deficit in Orange County?
Family Income Deficit in Orange County is $10,759.
Families that are below poverty line in Orange County earn $10,759 less on average than the poverty threshold level.
What is Inequality or Gini Index in Orange County?
Inequality or Gini Index in Orange County is 0.48.
What is the Total Population of Orange County?
Total Population of Orange County is 1,427,403.
What is the Total Male Population of Orange County?
Total Male Population of Orange County is 704,643.
What is the Total Female Population of Orange County?
Total Female Population of Orange County is 722,760.
What is the Ratio of Males per 100 Females in Orange County?
There are 97.49 Males per 100 Females in Orange County.
What is the Ratio of Females per 100 Males in Orange County?
There are 102.57 Females per 100 Males in Orange County.
What is the Median Population Age in Orange County?
Median Population Age in Orange County is 35.9 Years.
What is the Average Family Size in Orange County
Average Family Size in Orange County is 3.4 People.
What is the Average Household Size in Orange County
Average Household Size in Orange County is 2.8 People.
How Large is the Labor Force in Orange County?
There are 773,818 People in the Labor Forcein in Orange County.
What is the Percentage of People in the Labor Force in Orange County?
67.1% of People are in the Labor Force in Orange County.
What is the Unemployment Rate in Orange County?
Unemployment Rate in Orange County is 5.5%.