Broward County, FL Map & Demographics
Broward County Map
Broward County Overview
$39,753
PER CAPITA INCOME
$83,825
AVG FAMILY INCOME
$70,331
AVG HOUSEHOLD INCOME
21.1%
WAGE / INCOME GAP [ % ]
78.9¢/ $1
WAGE / INCOME GAP [ $ ]
$10,273
FAMILY INCOME DEFICIT
0.49
INEQUALITY / GINI INDEX
1,940,907
TOTAL POPULATION
952,900
MALE POPULATION
988,007
FEMALE POPULATION
96.45
MALES / 100 FEMALES
103.68
FEMALES / 100 MALES
41.0
MEDIAN AGE
3.2
AVG FAMILY SIZE
2.6
AVG HOUSEHOLD SIZE
1,046,351
LABOR FORCE [ PEOPLE ]
66.1%
PERCENT IN LABOR FORCE
5.8%
UNEMPLOYMENT RATE
Income in Broward County
Income Overview in Broward County
Per Capita Income in Broward County is $39,753, while median incomes of families and households are $83,825 and $70,331 respectively.
| Characteristic | Number | Measure |
| Per Capita Income | 1,940,907 | $39,753 |
| Median Family Income | 473,124 | $83,825 |
| Mean Family Income | 473,124 | $116,464 |
| Median Household Income | 741,973 | $70,331 |
| Mean Household Income | 741,973 | $100,559 |
| Income Deficit | 473,124 | $10,273 |
| Wage / Income Gap (%) | 1,940,907 | 21.12% |
| Wage / Income Gap ($) | 1,940,907 | 78.88¢ per $1 |
| Gini / Inequality Index | 1,940,907 | 0.49 |
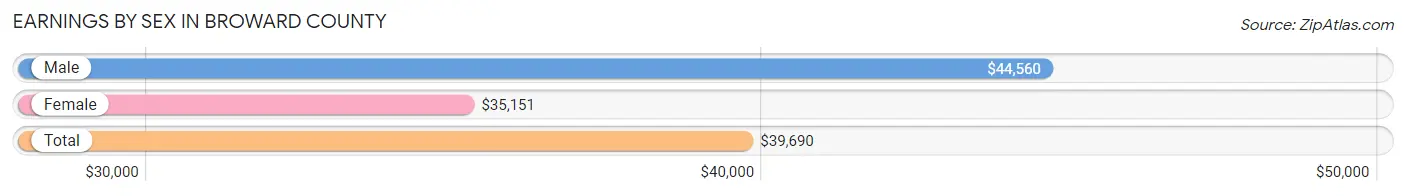
Earnings by Sex in Broward County
Average Earnings in Broward County are $39,690, $44,560 for men and $35,151 for women, a difference of 21.1%.
| Sex | Number | Average Earnings |
| Male | 559,592 (52.3%) | $44,560 |
| Female | 510,887 (47.7%) | $35,151 |
| Total | 1,070,479 (100.0%) | $39,690 |
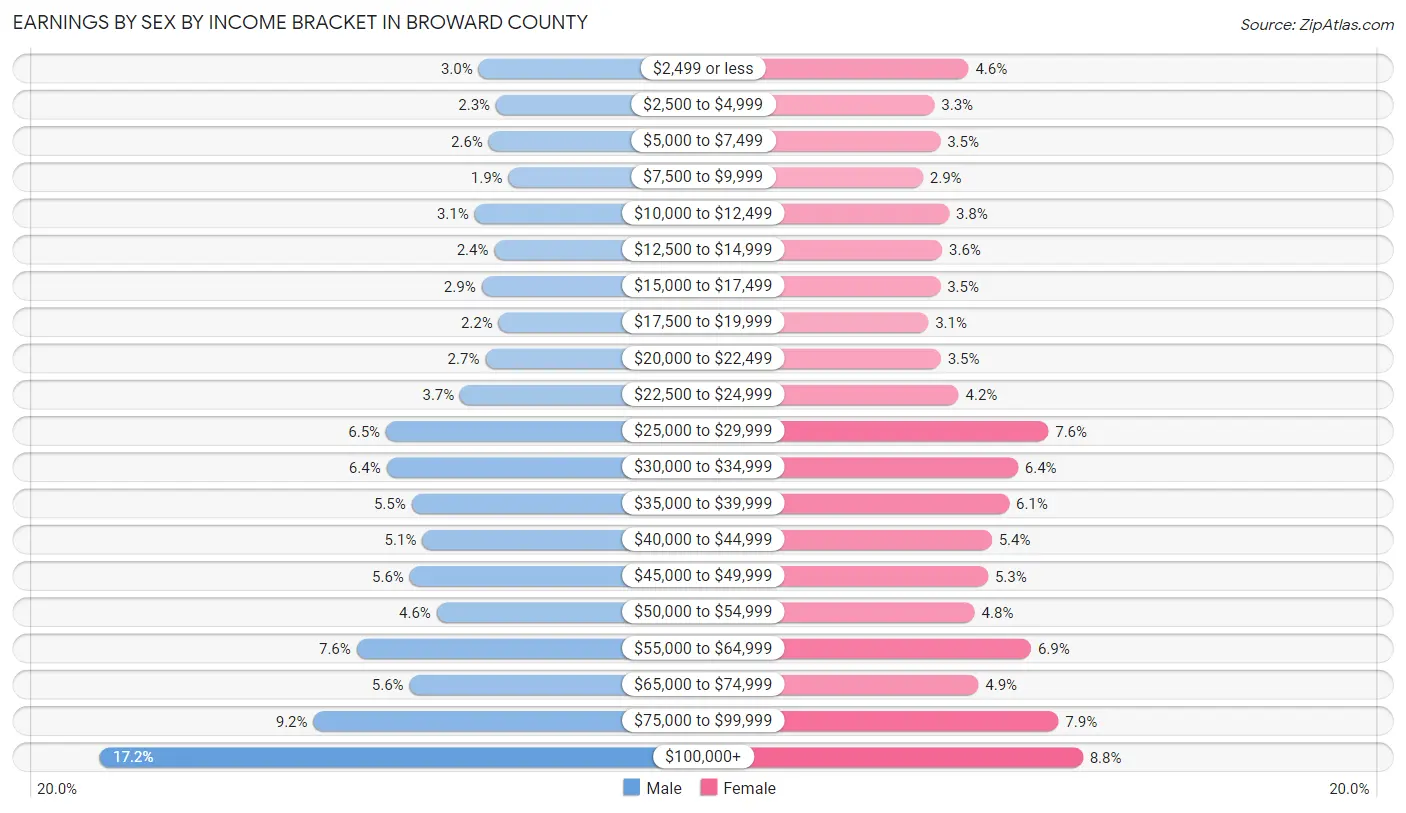
Earnings by Sex by Income Bracket in Broward County
The most common earnings brackets in Broward County are $100,000+ for men (96,090 | 17.2%) and $100,000+ for women (45,174 | 8.8%).
| Income | Male | Female |
| $2,499 or less | 16,746 (3.0%) | 23,285 (4.6%) |
| $2,500 to $4,999 | 13,084 (2.3%) | 16,777 (3.3%) |
| $5,000 to $7,499 | 14,621 (2.6%) | 17,894 (3.5%) |
| $7,500 to $9,999 | 10,459 (1.9%) | 14,565 (2.9%) |
| $10,000 to $12,499 | 17,555 (3.1%) | 19,580 (3.8%) |
| $12,500 to $14,999 | 13,409 (2.4%) | 18,215 (3.6%) |
| $15,000 to $17,499 | 16,096 (2.9%) | 17,857 (3.5%) |
| $17,500 to $19,999 | 12,522 (2.2%) | 15,596 (3.0%) |
| $20,000 to $22,499 | 15,338 (2.7%) | 17,962 (3.5%) |
| $22,500 to $24,999 | 20,617 (3.7%) | 21,414 (4.2%) |
| $25,000 to $29,999 | 36,128 (6.5%) | 38,568 (7.5%) |
| $30,000 to $34,999 | 36,043 (6.4%) | 32,764 (6.4%) |
| $35,000 to $39,999 | 30,752 (5.5%) | 31,077 (6.1%) |
| $40,000 to $44,999 | 28,515 (5.1%) | 27,748 (5.4%) |
| $45,000 to $49,999 | 31,194 (5.6%) | 27,020 (5.3%) |
| $50,000 to $54,999 | 25,495 (4.6%) | 24,455 (4.8%) |
| $55,000 to $64,999 | 42,325 (7.6%) | 35,259 (6.9%) |
| $65,000 to $74,999 | 31,230 (5.6%) | 25,173 (4.9%) |
| $75,000 to $99,999 | 51,373 (9.2%) | 40,504 (7.9%) |
| $100,000+ | 96,090 (17.2%) | 45,174 (8.8%) |
| Total | 559,592 (100.0%) | 510,887 (100.0%) |
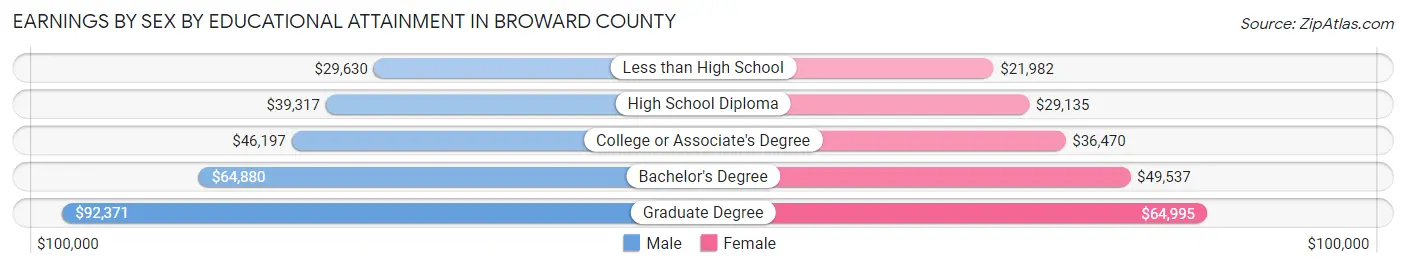
Earnings by Sex by Educational Attainment in Broward County
Average earnings in Broward County are $48,366 for men and $39,222 for women, a difference of 18.9%. Men with an educational attainment of graduate degree enjoy the highest average annual earnings of $92,371, while those with less than high school education earn the least with $29,630. Women with an educational attainment of graduate degree earn the most with the average annual earnings of $64,995, while those with less than high school education have the smallest earnings of $21,982.
| Educational Attainment | Male Income | Female Income |
| Less than High School | $29,630 | $21,982 |
| High School Diploma | $39,317 | $29,135 |
| College or Associate's Degree | $46,197 | $36,470 |
| Bachelor's Degree | $64,880 | $49,537 |
| Graduate Degree | $92,371 | $64,995 |
| Total | $48,366 | $39,222 |
Family Income in Broward County
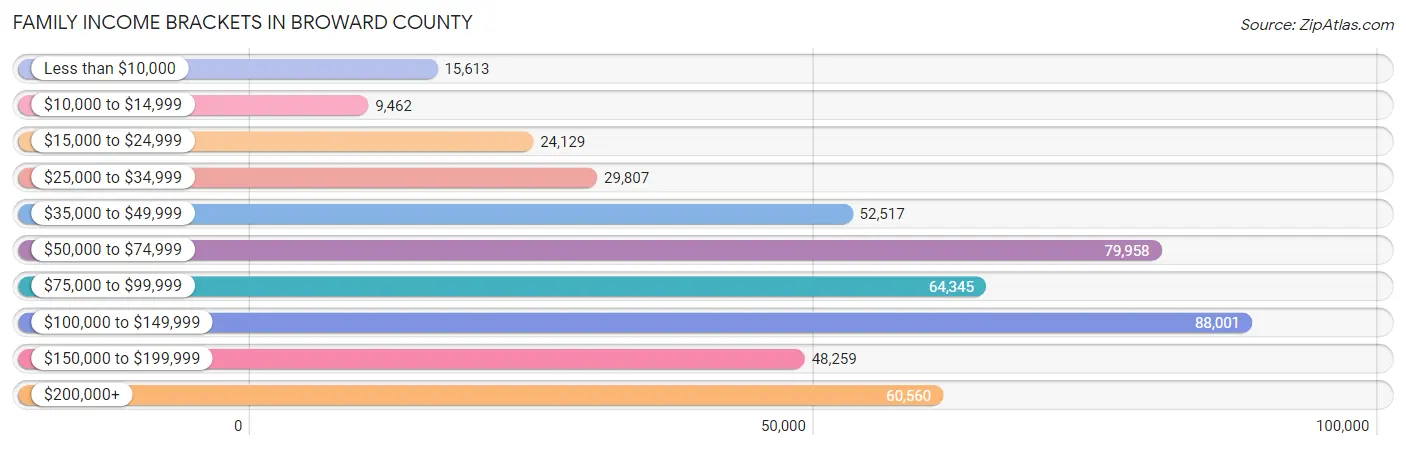
Family Income Brackets in Broward County
According to the Broward County family income data, there are 88,001 families falling into the $100,000 to $149,999 income range, which is the most common income bracket and makes up 18.6% of all families. Conversely, the $10,000 to $14,999 income bracket is the least frequent group with only 9,462 families (2.0%) belonging to this category.
| Income Bracket | # Families | % Families |
| Less than $10,000 | 15,613 | 3.3% |
| $10,000 to $14,999 | 9,462 | 2.0% |
| $15,000 to $24,999 | 24,129 | 5.1% |
| $25,000 to $34,999 | 29,807 | 6.3% |
| $35,000 to $49,999 | 52,517 | 11.1% |
| $50,000 to $74,999 | 79,958 | 16.9% |
| $75,000 to $99,999 | 64,345 | 13.6% |
| $100,000 to $149,999 | 88,001 | 18.6% |
| $150,000 to $199,999 | 48,259 | 10.2% |
| $200,000+ | 60,560 | 12.8% |
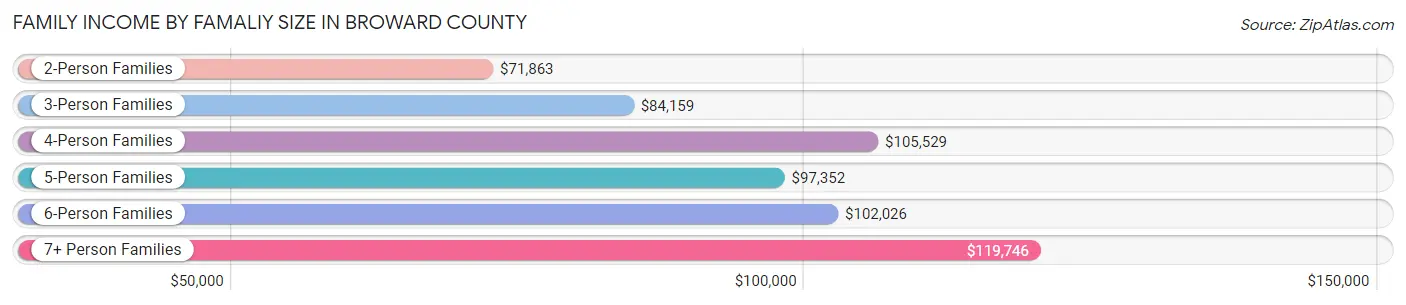
Family Income by Famaliy Size in Broward County
7+ person families (5,908 | 1.3%) account for the highest median family income in Broward County with $119,746 per family, while 2-person families (213,807 | 45.2%) have the highest median income of $35,932 per family member.
| Income Bracket | # Families | Median Income |
| 2-Person Families | 213,807 (45.2%) | $71,863 |
| 3-Person Families | 115,538 (24.4%) | $84,159 |
| 4-Person Families | 88,800 (18.8%) | $105,529 |
| 5-Person Families | 35,895 (7.6%) | $97,352 |
| 6-Person Families | 13,176 (2.8%) | $102,026 |
| 7+ Person Families | 5,908 (1.3%) | $119,746 |
| Total | 473,124 (100.0%) | $83,825 |
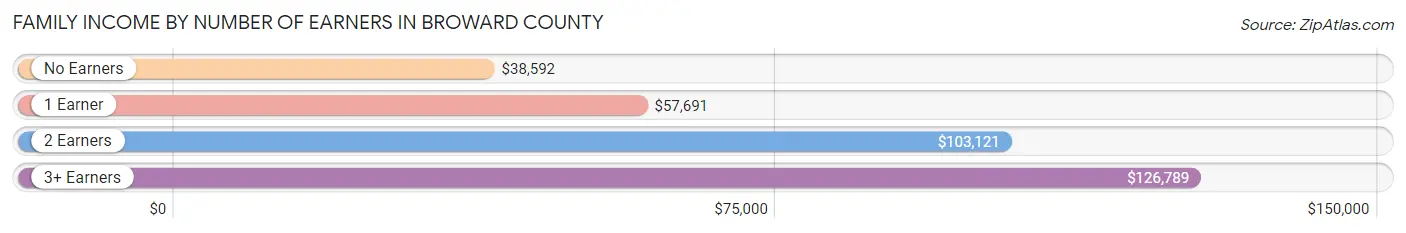
Family Income by Number of Earners in Broward County
The median family income in Broward County is $83,825, with families comprising 3+ earners (65,481) having the highest median family income of $126,789, while families with no earners (58,705) have the lowest median family income of $38,592, accounting for 13.8% and 12.4% of families, respectively.
| Number of Earners | # Families | Median Income |
| No Earners | 58,705 (12.4%) | $38,592 |
| 1 Earner | 150,346 (31.8%) | $57,691 |
| 2 Earners | 198,592 (42.0%) | $103,121 |
| 3+ Earners | 65,481 (13.8%) | $126,789 |
| Total | 473,124 (100.0%) | $83,825 |
Household Income in Broward County
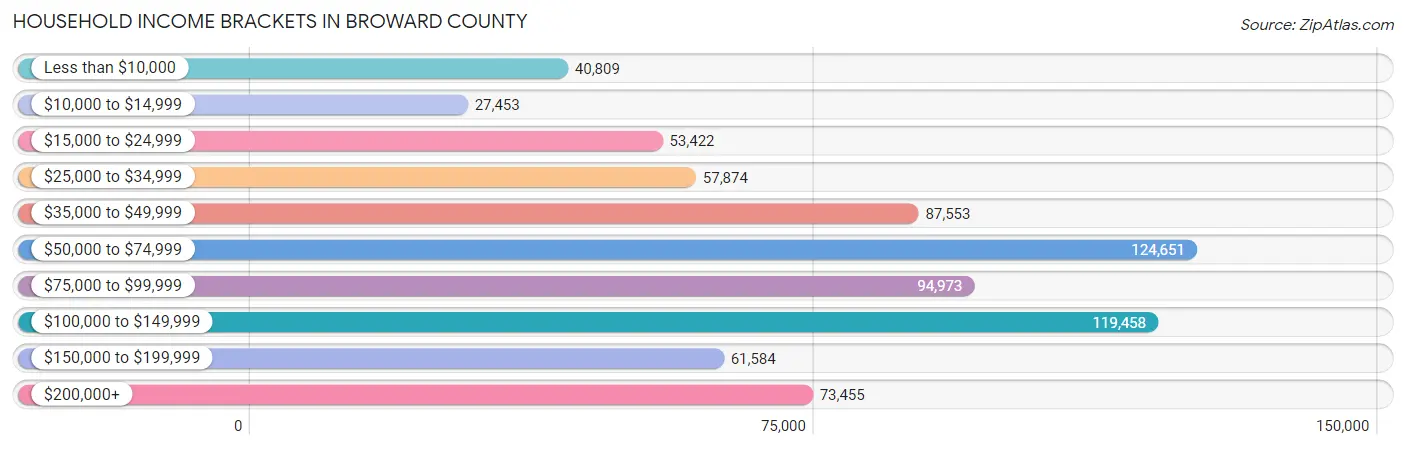
Household Income Brackets in Broward County
With 124,651 households falling in the category, the $50,000 to $74,999 income range is the most frequent in Broward County, accounting for 16.8% of all households. In contrast, only 27,453 households (3.7%) fall into the $10,000 to $14,999 income bracket, making it the least populous group.
| Income Bracket | # Households | % Households |
| Less than $10,000 | 40,809 | 5.5% |
| $10,000 to $14,999 | 27,453 | 3.7% |
| $15,000 to $24,999 | 53,422 | 7.2% |
| $25,000 to $34,999 | 57,874 | 7.8% |
| $35,000 to $49,999 | 87,553 | 11.8% |
| $50,000 to $74,999 | 124,651 | 16.8% |
| $75,000 to $99,999 | 94,973 | 12.8% |
| $100,000 to $149,999 | 119,458 | 16.1% |
| $150,000 to $199,999 | 61,584 | 8.3% |
| $200,000+ | 73,455 | 9.9% |
Household Income by Householder Age in Broward County
The median household income in Broward County is $70,331, with the highest median household income of $83,372 found in the 45 to 64 years age bracket for the primary householder. A total of 296,247 households (39.9%) fall into this category. Meanwhile, the 15 to 24 years age bracket for the primary householder has the lowest median household income of $47,047, with 14,506 households (2.0%) in this group.
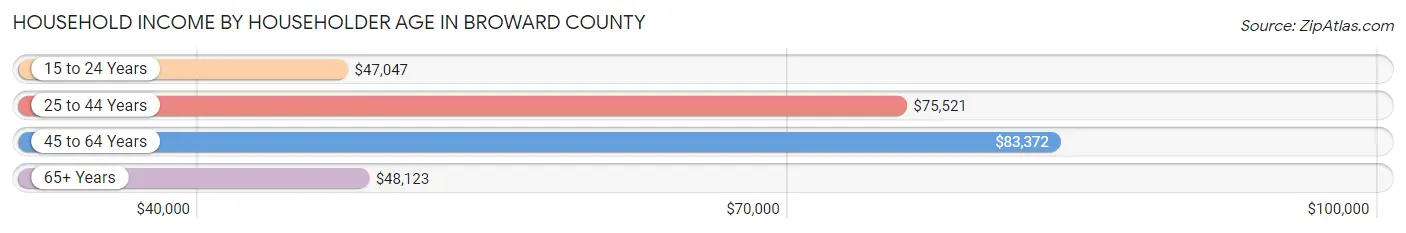
| Income Bracket | # Households | Median Income |
| 15 to 24 Years | 14,506 (2.0%) | $47,047 |
| 25 to 44 Years | 230,570 (31.1%) | $75,521 |
| 45 to 64 Years | 296,247 (39.9%) | $83,372 |
| 65+ Years | 200,650 (27.0%) | $48,123 |
| Total | 741,973 (100.0%) | $70,331 |
Poverty in Broward County
Income Below Poverty by Sex and Age in Broward County
With 11.4% poverty level for males and 13.4% for females among the residents of Broward County, 5 year old males and 15 year old females are the most vulnerable to poverty, with 2,247 males (22.8%) and 2,417 females (20.0%) in their respective age groups living below the poverty level.
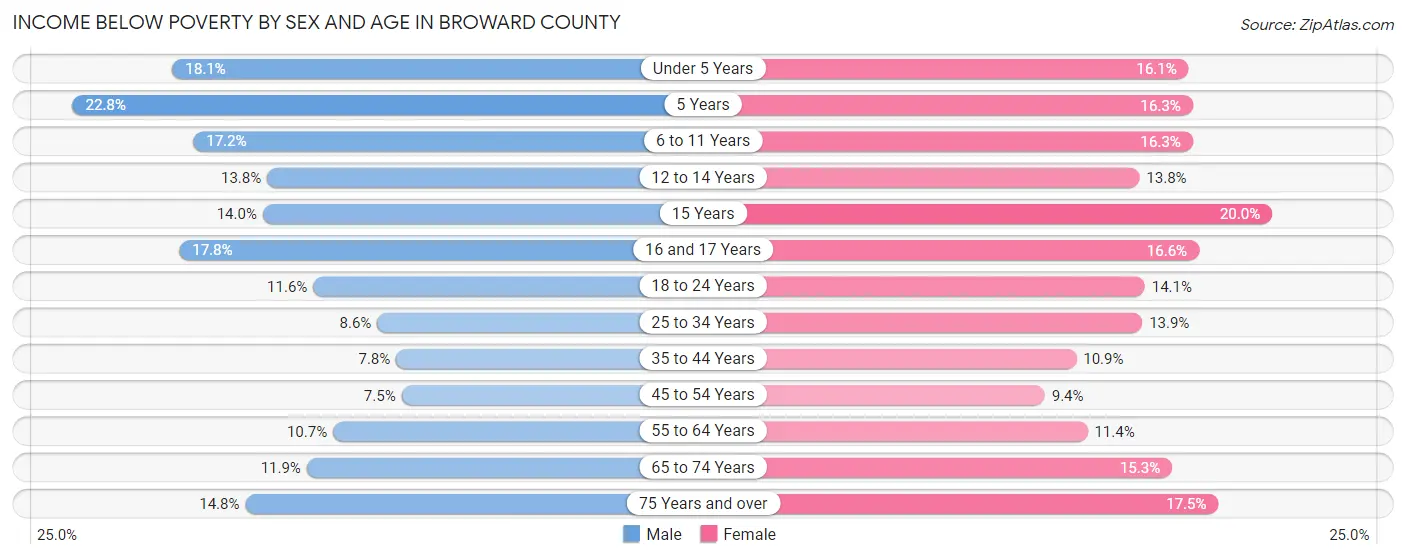
| Age Bracket | Male | Female |
| Under 5 Years | 9,722 (18.1%) | 8,384 (16.1%) |
| 5 Years | 2,247 (22.8%) | 1,693 (16.3%) |
| 6 to 11 Years | 11,423 (17.2%) | 10,639 (16.3%) |
| 12 to 14 Years | 5,179 (13.8%) | 4,769 (13.8%) |
| 15 Years | 1,553 (14.0%) | 2,417 (20.0%) |
| 16 and 17 Years | 4,312 (17.8%) | 3,765 (16.6%) |
| 18 to 24 Years | 8,851 (11.6%) | 10,438 (14.1%) |
| 25 to 34 Years | 10,898 (8.6%) | 17,621 (13.9%) |
| 35 to 44 Years | 10,045 (7.8%) | 14,374 (10.9%) |
| 45 to 54 Years | 9,830 (7.5%) | 12,636 (9.4%) |
| 55 to 64 Years | 13,978 (10.7%) | 15,191 (11.4%) |
| 65 to 74 Years | 10,413 (11.9%) | 15,168 (15.3%) |
| 75 Years and over | 8,728 (14.8%) | 14,606 (17.5%) |
| Total | 107,179 (11.4%) | 131,701 (13.4%) |
Income Above Poverty by Sex and Age in Broward County
According to the poverty statistics in Broward County, males aged 45 to 54 years and females aged 45 to 54 years are the age groups that are most secure financially, with 92.5% of males and 90.6% of females in these age groups living above the poverty line.
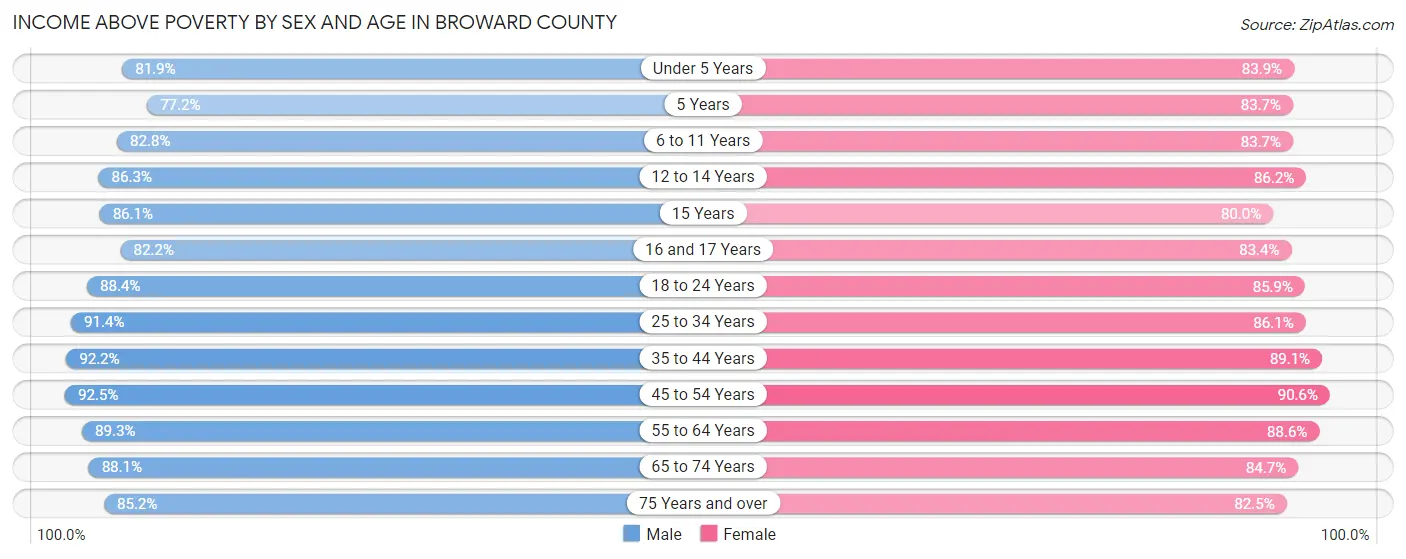
| Age Bracket | Male | Female |
| Under 5 Years | 43,884 (81.9%) | 43,718 (83.9%) |
| 5 Years | 7,620 (77.2%) | 8,706 (83.7%) |
| 6 to 11 Years | 55,095 (82.8%) | 54,729 (83.7%) |
| 12 to 14 Years | 32,484 (86.3%) | 29,756 (86.2%) |
| 15 Years | 9,579 (86.1%) | 9,690 (80.0%) |
| 16 and 17 Years | 19,890 (82.2%) | 18,956 (83.4%) |
| 18 to 24 Years | 67,361 (88.4%) | 63,805 (85.9%) |
| 25 to 34 Years | 115,264 (91.4%) | 108,746 (86.1%) |
| 35 to 44 Years | 119,332 (92.2%) | 117,754 (89.1%) |
| 45 to 54 Years | 121,063 (92.5%) | 121,546 (90.6%) |
| 55 to 64 Years | 116,739 (89.3%) | 118,064 (88.6%) |
| 65 to 74 Years | 77,013 (88.1%) | 83,826 (84.7%) |
| 75 Years and over | 50,394 (85.2%) | 69,008 (82.5%) |
| Total | 835,718 (88.6%) | 848,304 (86.6%) |
Income Below Poverty Among Married-Couple Families in Broward County
The poverty statistics for married-couple families in Broward County show that 5.8% or 18,547 of the total 319,235 families live below the poverty line. Families with 5 or more children have the highest poverty rate of 20.1%, comprising of 245 families. On the other hand, families with 1 or 2 children have the lowest poverty rate of 5.2%, which includes 5,587 families.
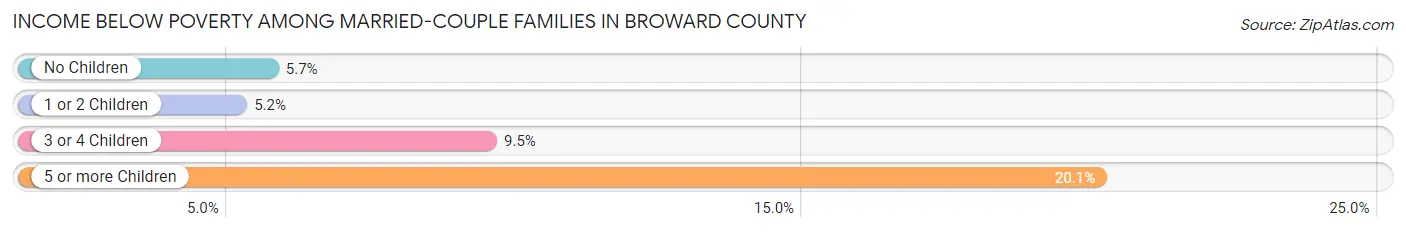
| Children | Above Poverty | Below Poverty |
| No Children | 179,377 (94.3%) | 10,863 (5.7%) |
| 1 or 2 Children | 102,714 (94.8%) | 5,587 (5.2%) |
| 3 or 4 Children | 17,625 (90.5%) | 1,852 (9.5%) |
| 5 or more Children | 972 (79.9%) | 245 (20.1%) |
| Total | 300,688 (94.2%) | 18,547 (5.8%) |
Income Below Poverty Among Single-Parent Households in Broward County
According to the poverty data in Broward County, 10.9% or 4,654 single-father households and 19.8% or 21,995 single-mother households are living below the poverty line. Among single-father households, those with 5 or more children have the highest poverty rate, with 79 households (42.9%) experiencing poverty. Likewise, among single-mother households, those with 5 or more children have the highest poverty rate, with 736 households (85.5%) falling below the poverty line.
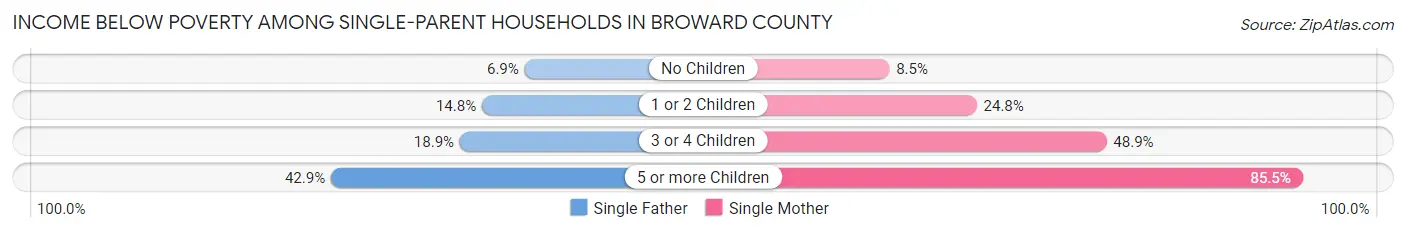
| Children | Single Father | Single Mother |
| No Children | 1,554 (6.9%) | 4,215 (8.5%) |
| 1 or 2 Children | 2,650 (14.8%) | 12,963 (24.8%) |
| 3 or 4 Children | 371 (18.9%) | 4,081 (48.9%) |
| 5 or more Children | 79 (42.9%) | 736 (85.5%) |
| Total | 4,654 (10.9%) | 21,995 (19.8%) |
Income Below Poverty Among Married-Couple vs Single-Parent Households in Broward County
The poverty data for Broward County shows that 18,547 of the married-couple family households (5.8%) and 26,649 of the single-parent households (17.3%) are living below the poverty level. Within the married-couple family households, those with 5 or more children have the highest poverty rate, with 245 households (20.1%) falling below the poverty line. Among the single-parent households, those with 5 or more children have the highest poverty rate, with 815 household (78.0%) living below poverty.
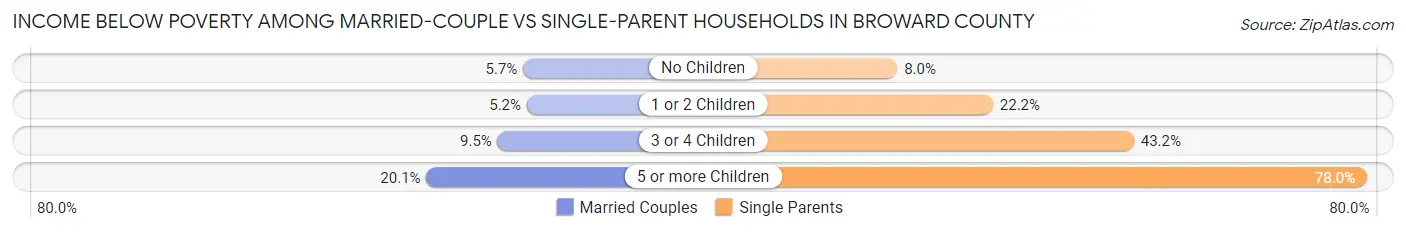
| Children | Married-Couple Families | Single-Parent Households |
| No Children | 10,863 (5.7%) | 5,769 (8.0%) |
| 1 or 2 Children | 5,587 (5.2%) | 15,613 (22.2%) |
| 3 or 4 Children | 1,852 (9.5%) | 4,452 (43.2%) |
| 5 or more Children | 245 (20.1%) | 815 (78.0%) |
| Total | 18,547 (5.8%) | 26,649 (17.3%) |
Race in Broward County
The most populous races in Broward County are White / Caucasian (925,110 | 47.7%), Hispanic or Latino (610,462 | 31.5%), and Black / African American (550,613 | 28.4%).
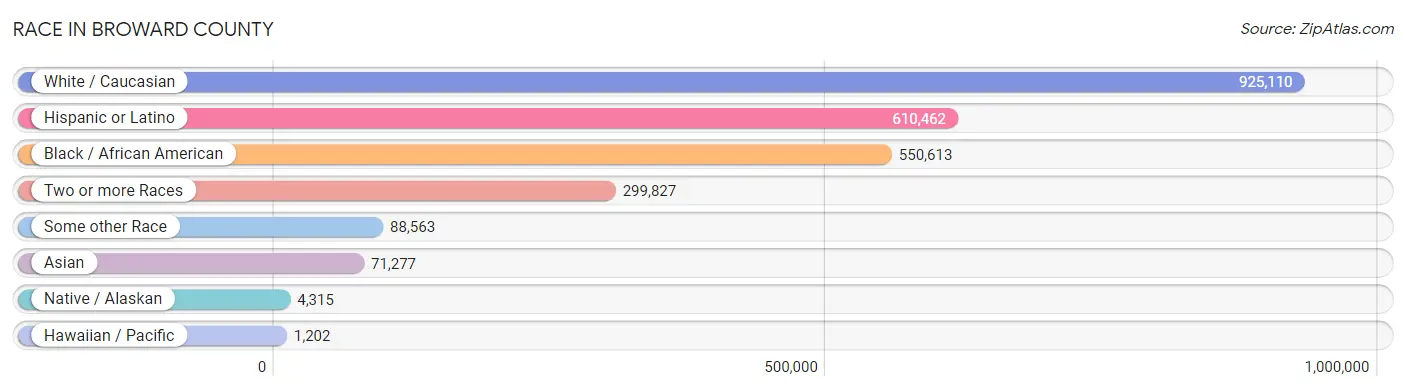
| Race | # Population | % Population |
| Asian | 71,277 | 3.7% |
| Black / African American | 550,613 | 28.4% |
| Hawaiian / Pacific | 1,202 | 0.1% |
| Hispanic or Latino | 610,462 | 31.5% |
| Native / Alaskan | 4,315 | 0.2% |
| White / Caucasian | 925,110 | 47.7% |
| Two or more Races | 299,827 | 15.4% |
| Some other Race | 88,563 | 4.6% |
| Total | 1,940,907 | 100.0% |
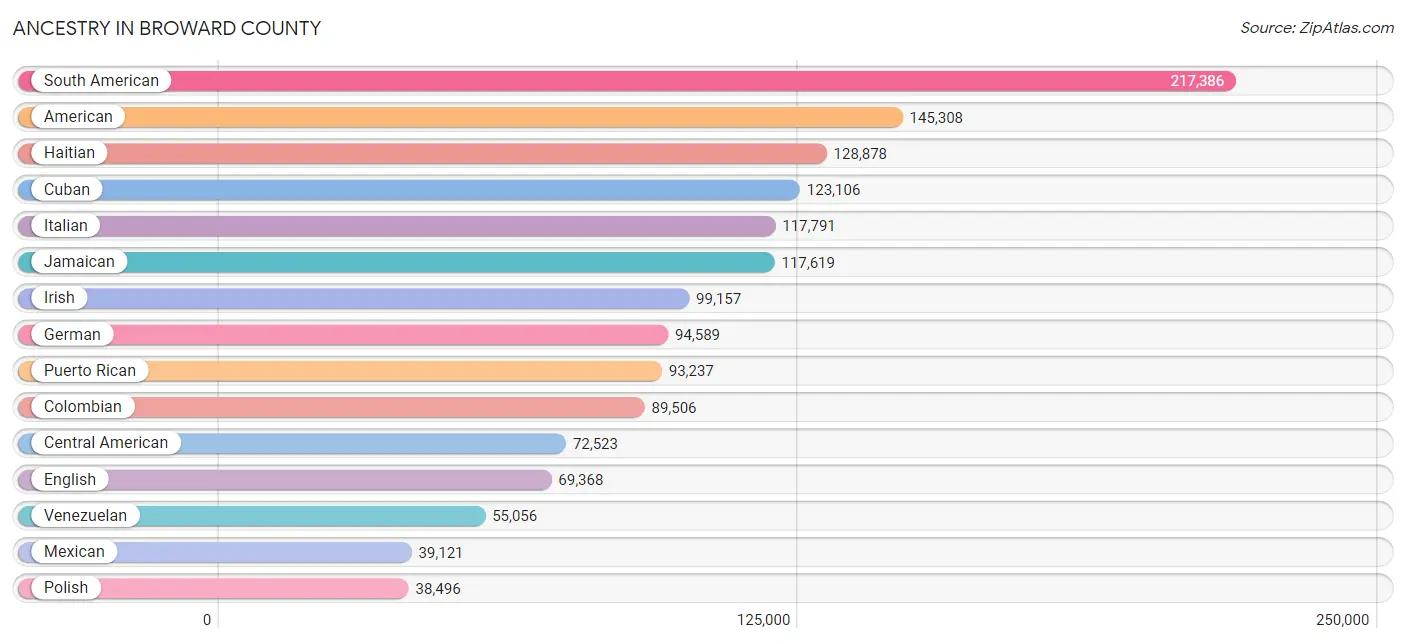
Ancestry in Broward County
The most populous ancestries reported in Broward County are South American (217,386 | 11.2%), American (145,308 | 7.5%), Haitian (128,878 | 6.6%), Cuban (123,106 | 6.3%), and Italian (117,791 | 6.1%), together accounting for 37.7% of all Broward County residents.
| Ancestry | # Population | % Population |
| Afghan | 17 | 0.0% |
| African | 9,503 | 0.5% |
| Albanian | 1,410 | 0.1% |
| American | 145,308 | 7.5% |
| Apache | 60 | 0.0% |
| Arab | 13,793 | 0.7% |
| Argentinean | 14,267 | 0.7% |
| Armenian | 2,071 | 0.1% |
| Assyrian / Chaldean / Syriac | 146 | 0.0% |
| Australian | 1,330 | 0.1% |
| Austrian | 4,312 | 0.2% |
| Bahamian | 10,067 | 0.5% |
| Bangladeshi | 54 | 0.0% |
| Barbadian | 1,468 | 0.1% |
| Basque | 155 | 0.0% |
| Belgian | 958 | 0.1% |
| Belizean | 717 | 0.0% |
| Bermudan | 145 | 0.0% |
| Bhutanese | 3,158 | 0.2% |
| Blackfeet | 665 | 0.0% |
| Bolivian | 2,379 | 0.1% |
| Brazilian | 24,310 | 1.3% |
| British | 7,840 | 0.4% |
| British West Indian | 4,620 | 0.2% |
| Bulgarian | 1,026 | 0.1% |
| Burmese | 3,470 | 0.2% |
| Cajun | 20 | 0.0% |
| Cambodian | 13 | 0.0% |
| Canadian | 6,736 | 0.4% |
| Cape Verdean | 111 | 0.0% |
| Carpatho Rusyn | 9 | 0.0% |
| Celtic | 49 | 0.0% |
| Central American | 72,523 | 3.7% |
| Central American Indian | 3,576 | 0.2% |
| Cherokee | 2,313 | 0.1% |
| Chickasaw | 39 | 0.0% |
| Chilean | 5,263 | 0.3% |
| Chippewa | 140 | 0.0% |
| Choctaw | 80 | 0.0% |
| Colombian | 89,506 | 4.6% |
| Comanche | 12 | 0.0% |
| Costa Rican | 3,279 | 0.2% |
| Cree | 126 | 0.0% |
| Creek | 334 | 0.0% |
| Croatian | 1,244 | 0.1% |
| Crow | 15 | 0.0% |
| Cuban | 123,106 | 6.3% |
| Cypriot | 169 | 0.0% |
| Czech | 3,519 | 0.2% |
| Czechoslovakian | 598 | 0.0% |
| Danish | 1,937 | 0.1% |
| Delaware | 38 | 0.0% |
| Dominican | 37,907 | 1.9% |
| Dutch | 7,021 | 0.4% |
| Dutch West Indian | 291 | 0.0% |
| Eastern European | 9,760 | 0.5% |
| Ecuadorian | 14,136 | 0.7% |
| Egyptian | 1,424 | 0.1% |
| English | 69,368 | 3.6% |
| Estonian | 115 | 0.0% |
| Ethiopian | 353 | 0.0% |
| European | 19,693 | 1.0% |
| Fijian | 118 | 0.0% |
| Filipino | 607 | 0.0% |
| Finnish | 953 | 0.1% |
| French | 23,126 | 1.2% |
| French American Indian | 12 | 0.0% |
| French Canadian | 7,754 | 0.4% |
| German | 94,589 | 4.9% |
| Ghanaian | 452 | 0.0% |
| Greek | 7,952 | 0.4% |
| Guamanian / Chamorro | 315 | 0.0% |
| Guatemalan | 14,362 | 0.7% |
| Guyanese | 4,477 | 0.2% |
| Haitian | 128,878 | 6.6% |
| Honduran | 21,033 | 1.1% |
| Hopi | 14 | 0.0% |
| Hungarian | 8,497 | 0.4% |
| Icelander | 128 | 0.0% |
| Indian (Asian) | 21,958 | 1.1% |
| Indonesian | 97 | 0.0% |
| Inupiat | 89 | 0.0% |
| Iranian | 1,603 | 0.1% |
| Iraqi | 128 | 0.0% |
| Irish | 99,157 | 5.1% |
| Iroquois | 243 | 0.0% |
| Israeli | 5,500 | 0.3% |
| Italian | 117,791 | 6.1% |
| Jamaican | 117,619 | 6.1% |
| Japanese | 264 | 0.0% |
| Jordanian | 285 | 0.0% |
| Kenyan | 197 | 0.0% |
| Korean | 11,887 | 0.6% |
| Laotian | 275 | 0.0% |
| Latvian | 499 | 0.0% |
| Lebanese | 4,790 | 0.3% |
| Liberian | 40 | 0.0% |
| Lithuanian | 3,931 | 0.2% |
| Lumbee | 230 | 0.0% |
| Luxembourger | 203 | 0.0% |
| Macedonian | 337 | 0.0% |
| Malaysian | 266 | 0.0% |
| Maltese | 96 | 0.0% |
| Mexican | 39,121 | 2.0% |
| Mexican American Indian | 343 | 0.0% |
| Mongolian | 197 | 0.0% |
| Moroccan | 1,808 | 0.1% |
| Native Hawaiian | 483 | 0.0% |
| Navajo | 121 | 0.0% |
| New Zealander | 213 | 0.0% |
| Nicaraguan | 13,486 | 0.7% |
| Nigerian | 2,262 | 0.1% |
| Northern European | 772 | 0.0% |
| Norwegian | 5,081 | 0.3% |
| Osage | 3 | 0.0% |
| Paiute | 10 | 0.0% |
| Pakistani | 1,022 | 0.1% |
| Palestinian | 1,019 | 0.1% |
| Panamanian | 4,614 | 0.2% |
| Paraguayan | 791 | 0.0% |
| Pennsylvania German | 279 | 0.0% |
| Peruvian | 31,674 | 1.6% |
| Polish | 38,496 | 2.0% |
| Portuguese | 10,498 | 0.5% |
| Potawatomi | 291 | 0.0% |
| Pueblo | 26 | 0.0% |
| Puerto Rican | 93,237 | 4.8% |
| Romanian | 6,559 | 0.3% |
| Russian | 27,930 | 1.4% |
| Salvadoran | 15,495 | 0.8% |
| Samoan | 539 | 0.0% |
| Scandinavian | 1,404 | 0.1% |
| Scotch-Irish | 5,709 | 0.3% |
| Scottish | 12,901 | 0.7% |
| Seminole | 1,344 | 0.1% |
| Senegalese | 63 | 0.0% |
| Serbian | 1,464 | 0.1% |
| Sierra Leonean | 129 | 0.0% |
| Sioux | 298 | 0.0% |
| Slavic | 620 | 0.0% |
| Slovak | 1,662 | 0.1% |
| Slovene | 337 | 0.0% |
| South African | 838 | 0.0% |
| South American | 217,386 | 11.2% |
| South American Indian | 1,876 | 0.1% |
| Spaniard | 8,452 | 0.4% |
| Spanish | 3,463 | 0.2% |
| Spanish American | 331 | 0.0% |
| Spanish American Indian | 39 | 0.0% |
| Sri Lankan | 8,097 | 0.4% |
| Subsaharan African | 14,990 | 0.8% |
| Sudanese | 358 | 0.0% |
| Swedish | 6,872 | 0.4% |
| Swiss | 1,758 | 0.1% |
| Syrian | 1,561 | 0.1% |
| Thai | 30,558 | 1.6% |
| Tlingit-Haida | 58 | 0.0% |
| Tongan | 152 | 0.0% |
| Trinidadian and Tobagonian | 12,126 | 0.6% |
| Turkish | 3,277 | 0.2% |
| U.S. Virgin Islander | 1,375 | 0.1% |
| Ugandan | 115 | 0.0% |
| Ukrainian | 6,438 | 0.3% |
| Uruguayan | 3,522 | 0.2% |
| Venezuelan | 55,056 | 2.8% |
| Vietnamese | 1,330 | 0.1% |
| Welsh | 4,063 | 0.2% |
| West Indian | 7,257 | 0.4% |
| Yugoslavian | 384 | 0.0% |
| Yuman | 16 | 0.0% |
| Zimbabwean | 144 | 0.0% | View All 171 Rows |
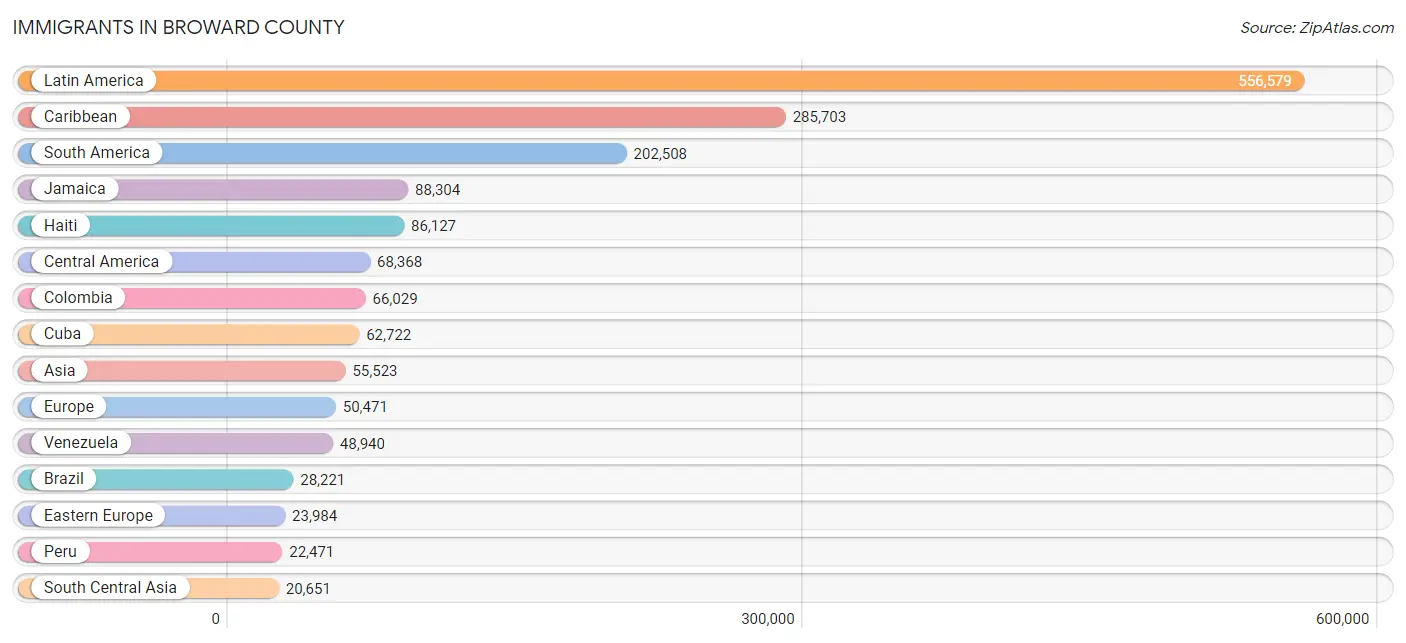
Immigrants in Broward County
The most numerous immigrant groups reported in Broward County came from Latin America (556,579 | 28.7%), Caribbean (285,703 | 14.7%), South America (202,508 | 10.4%), Jamaica (88,304 | 4.5%), and Haiti (86,127 | 4.4%), together accounting for 62.8% of all Broward County residents.
| Immigration Origin | # Population | % Population |
| Africa | 7,940 | 0.4% |
| Albania | 932 | 0.1% |
| Argentina | 11,977 | 0.6% |
| Armenia | 60 | 0.0% |
| Asia | 55,523 | 2.9% |
| Australia | 469 | 0.0% |
| Austria | 191 | 0.0% |
| Bahamas | 5,268 | 0.3% |
| Bangladesh | 2,425 | 0.1% |
| Barbados | 1,505 | 0.1% |
| Belarus | 857 | 0.0% |
| Belgium | 655 | 0.0% |
| Belize | 767 | 0.0% |
| Bolivia | 1,374 | 0.1% |
| Bosnia and Herzegovina | 137 | 0.0% |
| Brazil | 28,221 | 1.5% |
| Bulgaria | 1,074 | 0.1% |
| Cabo Verde | 26 | 0.0% |
| Cambodia | 136 | 0.0% |
| Cameroon | 162 | 0.0% |
| Canada | 16,162 | 0.8% |
| Caribbean | 285,703 | 14.7% |
| Central America | 68,368 | 3.5% |
| Chile | 3,963 | 0.2% |
| China | 9,264 | 0.5% |
| Colombia | 66,029 | 3.4% |
| Congo | 32 | 0.0% |
| Costa Rica | 2,262 | 0.1% |
| Croatia | 238 | 0.0% |
| Cuba | 62,722 | 3.2% |
| Czechoslovakia | 1,002 | 0.1% |
| Denmark | 129 | 0.0% |
| Dominica | 1,246 | 0.1% |
| Dominican Republic | 19,919 | 1.0% |
| Eastern Africa | 1,305 | 0.1% |
| Eastern Asia | 11,769 | 0.6% |
| Eastern Europe | 23,984 | 1.2% |
| Ecuador | 9,824 | 0.5% |
| Egypt | 1,281 | 0.1% |
| El Salvador | 10,126 | 0.5% |
| England | 4,420 | 0.2% |
| Eritrea | 10 | 0.0% |
| Ethiopia | 414 | 0.0% |
| Europe | 50,471 | 2.6% |
| Fiji | 39 | 0.0% |
| France | 2,485 | 0.1% |
| Germany | 3,986 | 0.2% |
| Ghana | 376 | 0.0% |
| Greece | 935 | 0.1% |
| Grenada | 437 | 0.0% |
| Guatemala | 9,875 | 0.5% |
| Guyana | 5,762 | 0.3% |
| Haiti | 86,127 | 4.4% |
| Honduras | 14,895 | 0.8% |
| Hong Kong | 896 | 0.1% |
| Hungary | 1,583 | 0.1% |
| India | 11,229 | 0.6% |
| Indonesia | 66 | 0.0% |
| Iran | 1,366 | 0.1% |
| Iraq | 381 | 0.0% |
| Ireland | 916 | 0.1% |
| Israel | 3,960 | 0.2% |
| Italy | 4,165 | 0.2% |
| Jamaica | 88,304 | 4.5% |
| Japan | 619 | 0.0% |
| Jordan | 364 | 0.0% |
| Kazakhstan | 550 | 0.0% |
| Kenya | 326 | 0.0% |
| Korea | 1,848 | 0.1% |
| Kuwait | 274 | 0.0% |
| Laos | 171 | 0.0% |
| Latin America | 556,579 | 28.7% |
| Latvia | 169 | 0.0% |
| Lebanon | 1,007 | 0.1% |
| Liberia | 49 | 0.0% |
| Lithuania | 397 | 0.0% |
| Malaysia | 302 | 0.0% |
| Mexico | 18,862 | 1.0% |
| Middle Africa | 227 | 0.0% |
| Moldova | 651 | 0.0% |
| Morocco | 988 | 0.1% |
| Nepal | 436 | 0.0% |
| Netherlands | 772 | 0.0% |
| Nicaragua | 8,740 | 0.4% |
| Nigeria | 1,562 | 0.1% |
| North Macedonia | 207 | 0.0% |
| Northern Africa | 2,844 | 0.2% |
| Northern Europe | 10,022 | 0.5% |
| Norway | 198 | 0.0% |
| Oceania | 801 | 0.0% |
| Pakistan | 3,303 | 0.2% |
| Panama | 2,833 | 0.2% |
| Peru | 22,471 | 1.2% |
| Philippines | 6,077 | 0.3% |
| Poland | 3,053 | 0.2% |
| Portugal | 843 | 0.0% |
| Romania | 3,605 | 0.2% |
| Russia | 5,457 | 0.3% |
| Saudi Arabia | 337 | 0.0% |
| Scotland | 363 | 0.0% |
| Senegal | 119 | 0.0% |
| Serbia | 535 | 0.0% |
| Sierra Leone | 59 | 0.0% |
| Singapore | 98 | 0.0% |
| Somalia | 36 | 0.0% |
| South Africa | 1,140 | 0.1% |
| South America | 202,508 | 10.4% |
| South Central Asia | 20,651 | 1.1% |
| South Eastern Asia | 13,607 | 0.7% |
| Southern Europe | 7,658 | 0.4% |
| Spain | 1,704 | 0.1% |
| Sri Lanka | 233 | 0.0% |
| St. Vincent and the Grenadines | 479 | 0.0% |
| Sudan | 123 | 0.0% |
| Sweden | 593 | 0.0% |
| Switzerland | 351 | 0.0% |
| Syria | 379 | 0.0% |
| Taiwan | 842 | 0.0% |
| Thailand | 790 | 0.0% |
| Trinidad and Tobago | 13,824 | 0.7% |
| Turkey | 1,529 | 0.1% |
| Uganda | 35 | 0.0% |
| Ukraine | 3,054 | 0.2% |
| Uruguay | 2,713 | 0.1% |
| Uzbekistan | 587 | 0.0% |
| Venezuela | 48,940 | 2.5% |
| Vietnam | 5,802 | 0.3% |
| West Indies | 797 | 0.0% |
| Western Africa | 2,249 | 0.1% |
| Western Asia | 9,157 | 0.5% |
| Western Europe | 8,467 | 0.4% |
| Yemen | 30 | 0.0% |
| Zimbabwe | 166 | 0.0% | View All 133 Rows |
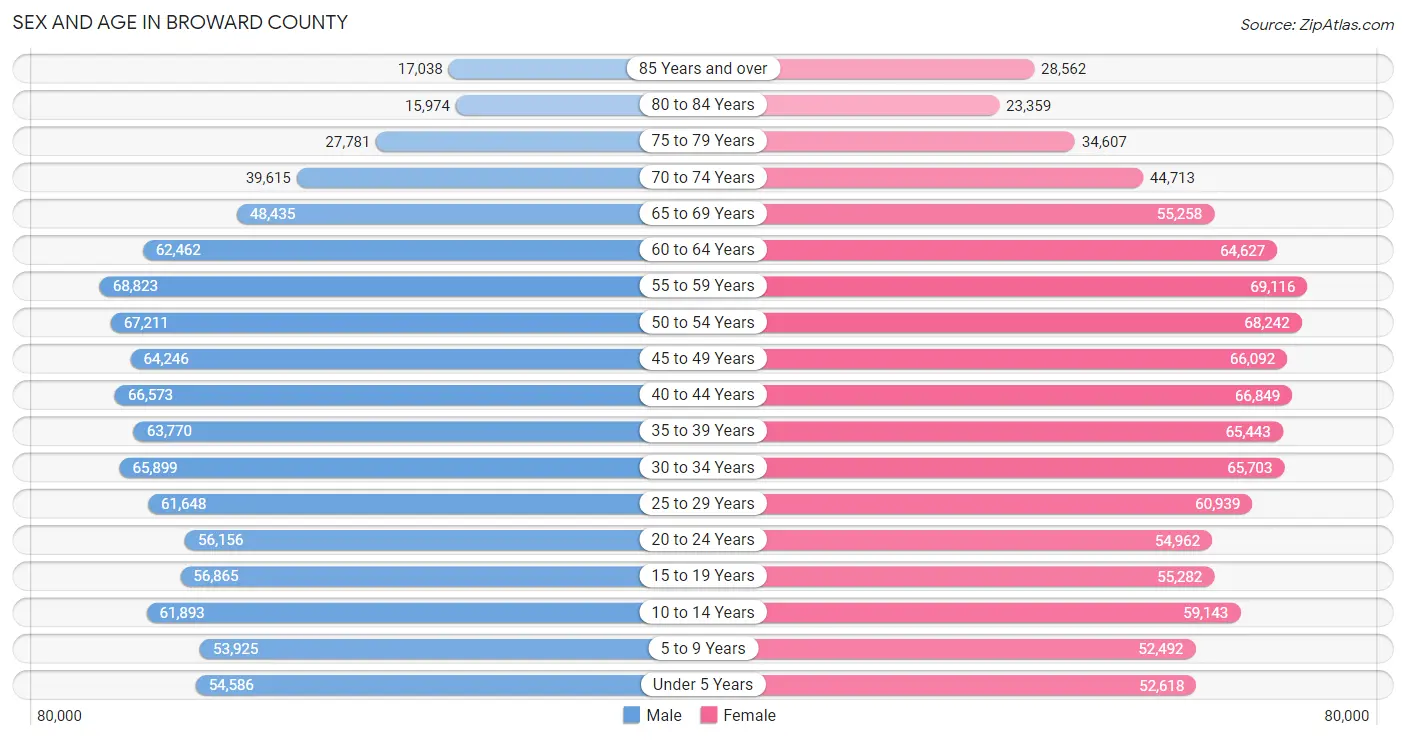
Sex and Age in Broward County
Sex and Age in Broward County
The most populous age groups in Broward County are 55 to 59 Years (68,823 | 7.2%) for men and 55 to 59 Years (69,116 | 7.0%) for women.
| Age Bracket | Male | Female |
| Under 5 Years | 54,586 (5.7%) | 52,618 (5.3%) |
| 5 to 9 Years | 53,925 (5.7%) | 52,492 (5.3%) |
| 10 to 14 Years | 61,893 (6.5%) | 59,143 (6.0%) |
| 15 to 19 Years | 56,865 (6.0%) | 55,282 (5.6%) |
| 20 to 24 Years | 56,156 (5.9%) | 54,962 (5.6%) |
| 25 to 29 Years | 61,648 (6.5%) | 60,939 (6.2%) |
| 30 to 34 Years | 65,899 (6.9%) | 65,703 (6.7%) |
| 35 to 39 Years | 63,770 (6.7%) | 65,443 (6.6%) |
| 40 to 44 Years | 66,573 (7.0%) | 66,849 (6.8%) |
| 45 to 49 Years | 64,246 (6.7%) | 66,092 (6.7%) |
| 50 to 54 Years | 67,211 (7.0%) | 68,242 (6.9%) |
| 55 to 59 Years | 68,823 (7.2%) | 69,116 (7.0%) |
| 60 to 64 Years | 62,462 (6.6%) | 64,627 (6.5%) |
| 65 to 69 Years | 48,435 (5.1%) | 55,258 (5.6%) |
| 70 to 74 Years | 39,615 (4.2%) | 44,713 (4.5%) |
| 75 to 79 Years | 27,781 (2.9%) | 34,607 (3.5%) |
| 80 to 84 Years | 15,974 (1.7%) | 23,359 (2.4%) |
| 85 Years and over | 17,038 (1.8%) | 28,562 (2.9%) |
| Total | 952,900 (100.0%) | 988,007 (100.0%) |
Families and Households in Broward County
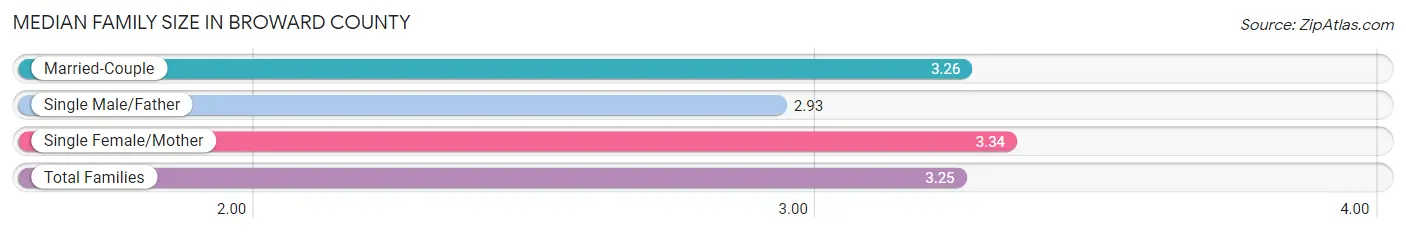
Median Family Size in Broward County
The median family size in Broward County is 3.25 persons per family, with single female/mother families (111,237 | 23.5%) accounting for the largest median family size of 3.34 persons per family. On the other hand, single male/father families (42,652 | 9.0%) represent the smallest median family size with 2.93 persons per family.
| Family Type | # Families | Family Size |
| Married-Couple | 319,235 (67.5%) | 3.26 |
| Single Male/Father | 42,652 (9.0%) | 2.93 |
| Single Female/Mother | 111,237 (23.5%) | 3.34 |
| Total Families | 473,124 (100.0%) | 3.25 |
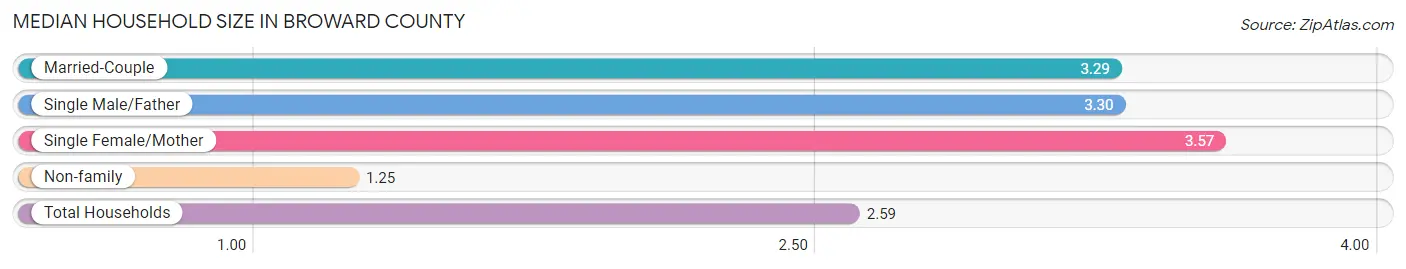
Median Household Size in Broward County
The median household size in Broward County is 2.59 persons per household, with single female/mother households (111,237 | 15.0%) accounting for the largest median household size of 3.57 persons per household. non-family households (268,849 | 36.2%) represent the smallest median household size with 1.25 persons per household.
| Household Type | # Households | Household Size |
| Married-Couple | 319,235 (43.0%) | 3.29 |
| Single Male/Father | 42,652 (5.8%) | 3.30 |
| Single Female/Mother | 111,237 (15.0%) | 3.57 |
| Non-family | 268,849 (36.2%) | 1.25 |
| Total Households | 741,973 (100.0%) | 2.59 |
Household Size by Marriage Status in Broward County
Out of a total of 741,973 households in Broward County, 473,124 (63.8%) are family households, while 268,849 (36.2%) are nonfamily households. The most numerous type of family households are 2-person households, comprising 196,315, and the most common type of nonfamily households are 1-person households, comprising 218,328.
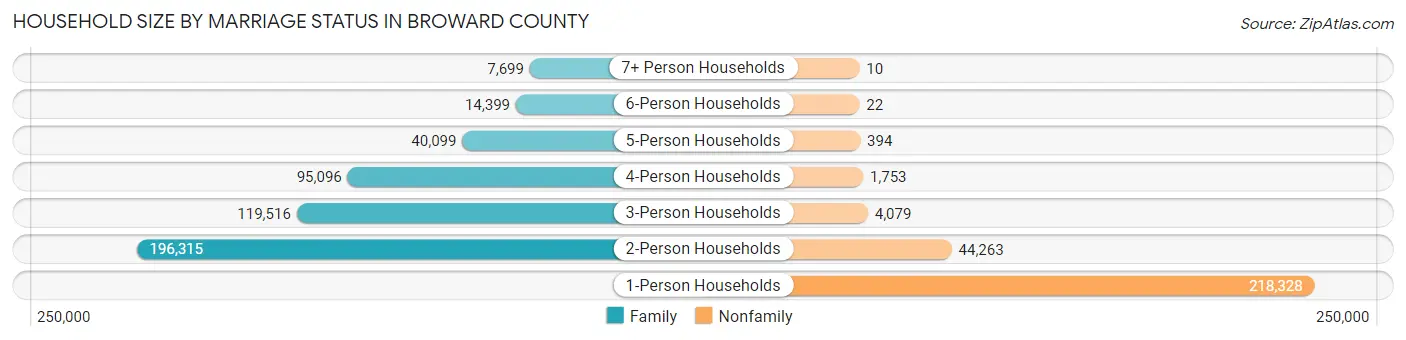
| Household Size | Family Households | Nonfamily Households |
| 1-Person Households | - | 218,328 (29.4%) |
| 2-Person Households | 196,315 (26.5%) | 44,263 (6.0%) |
| 3-Person Households | 119,516 (16.1%) | 4,079 (0.5%) |
| 4-Person Households | 95,096 (12.8%) | 1,753 (0.2%) |
| 5-Person Households | 40,099 (5.4%) | 394 (0.1%) |
| 6-Person Households | 14,399 (1.9%) | 22 (0.0%) |
| 7+ Person Households | 7,699 (1.0%) | 10 (0.0%) |
| Total | 473,124 (63.8%) | 268,849 (36.2%) |
Female Fertility in Broward County
Fertility by Age in Broward County
Average fertility rate in Broward County is 47.0 births per 1,000 women. Women in the age bracket of 20 to 34 years have the highest fertility rate with 76.0 births per 1,000 women. Women in the age bracket of 20 to 34 years acount for 65.6% of all women with births.
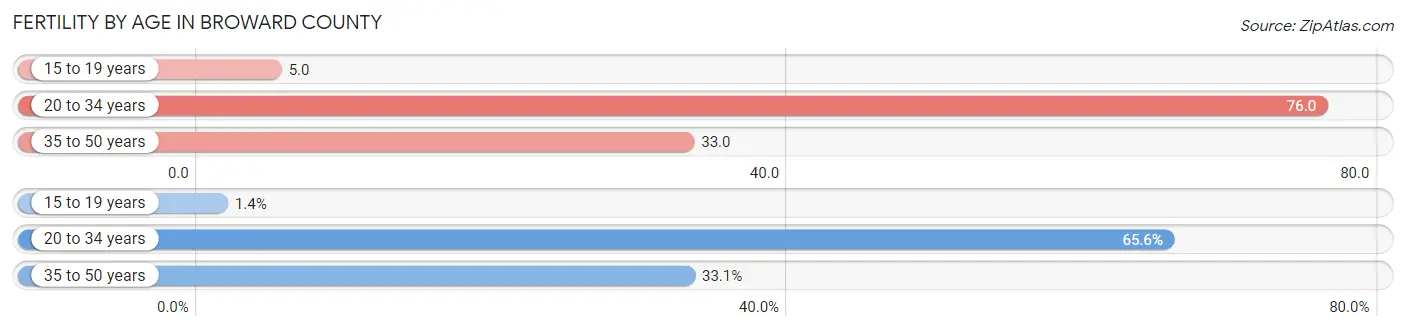
| Age Bracket | Women with Births | Births / 1,000 Women |
| 15 to 19 years | 285 (1.3%) | 5.0 |
| 20 to 34 years | 13,819 (65.6%) | 76.0 |
| 35 to 50 years | 6,964 (33.1%) | 33.0 |
| Total | 21,068 (100.0%) | 47.0 |
Fertility by Age by Marriage Status in Broward County
64.9% of women with births (21,068) in Broward County are married. The highest percentage of unmarried women with births falls into 15 to 19 years age bracket with 96.1% of them unmarried at the time of birth, while the lowest percentage of unmarried women with births belong to 35 to 50 years age bracket with 23.4% of them unmarried.
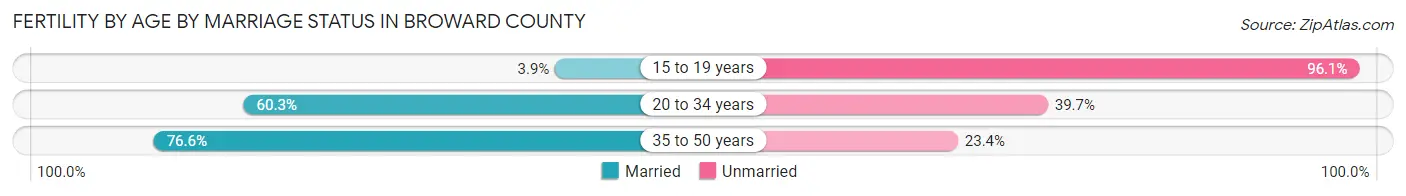
| Age Bracket | Married | Unmarried |
| 15 to 19 years | 11 (3.9%) | 274 (96.1%) |
| 20 to 34 years | 8,333 (60.3%) | 5,486 (39.7%) |
| 35 to 50 years | 5,334 (76.6%) | 1,630 (23.4%) |
| Total | 13,673 (64.9%) | 7,395 (35.1%) |
Fertility by Education in Broward County
Average fertility rate in Broward County is 47.0 births per 1,000 women. Women with the education attainment of graduate degree have the highest fertility rate of 57.0 births per 1,000 women, while women with the education attainment of less than high school have the lowest fertility at 29.0 births per 1,000 women. Women with the education attainment of college or associate's degree represent 34.2% of all women with births.
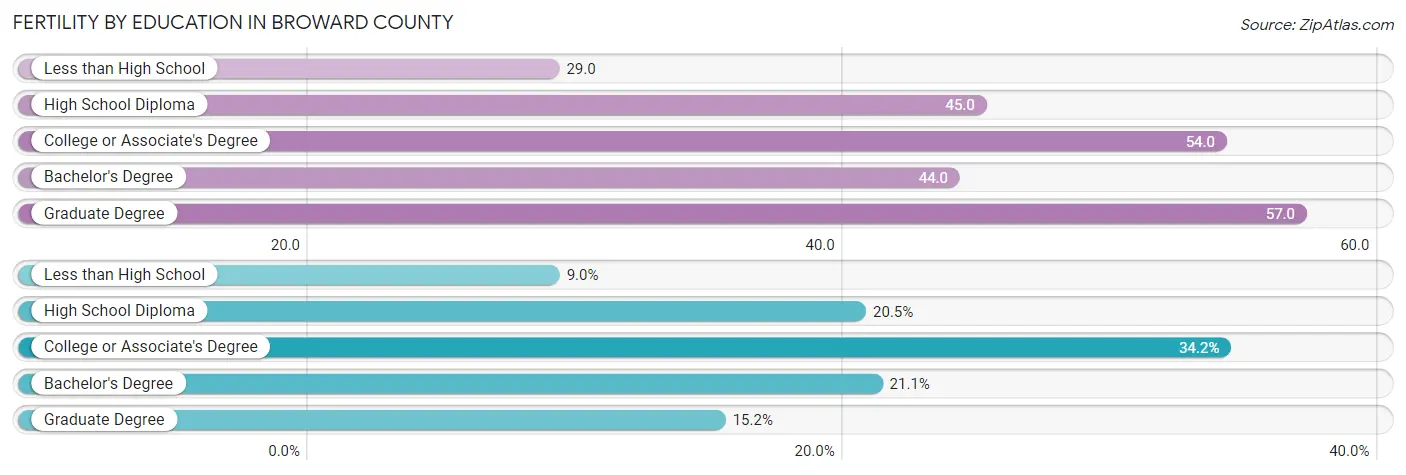
| Educational Attainment | Women with Births | Births / 1,000 Women |
| Less than High School | 1,899 (9.0%) | 29.0 |
| High School Diploma | 4,316 (20.5%) | 45.0 |
| College or Associate's Degree | 7,197 (34.2%) | 54.0 |
| Bachelor's Degree | 4,448 (21.1%) | 44.0 |
| Graduate Degree | 3,208 (15.2%) | 57.0 |
| Total | 21,068 (100.0%) | 47.0 |
Fertility by Education by Marriage Status in Broward County
35.1% of women with births in Broward County are unmarried. Women with the educational attainment of graduate degree are most likely to be married with 92.1% of them married at childbirth, while women with the educational attainment of less than high school are least likely to be married with 44.8% of them unmarried at childbirth.
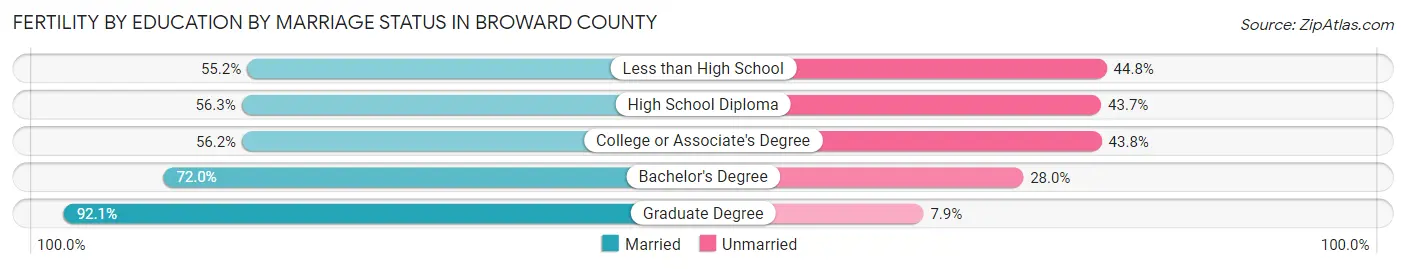
| Educational Attainment | Married | Unmarried |
| Less than High School | 1,048 (55.2%) | 851 (44.8%) |
| High School Diploma | 2,430 (56.3%) | 1,886 (43.7%) |
| College or Associate's Degree | 4,045 (56.2%) | 3,152 (43.8%) |
| Bachelor's Degree | 3,203 (72.0%) | 1,245 (28.0%) |
| Graduate Degree | 2,955 (92.1%) | 253 (7.9%) |
| Total | 13,673 (64.9%) | 7,395 (35.1%) |
Employment Characteristics in Broward County
Employment by Class of Employer in Broward County
Among the 965,176 employed individuals in Broward County, private company employees (672,432 | 69.7%), self-employed (incorporated) (70,596 | 7.3%), and local government employees (67,148 | 7.0%) make up the most common classes of employment.
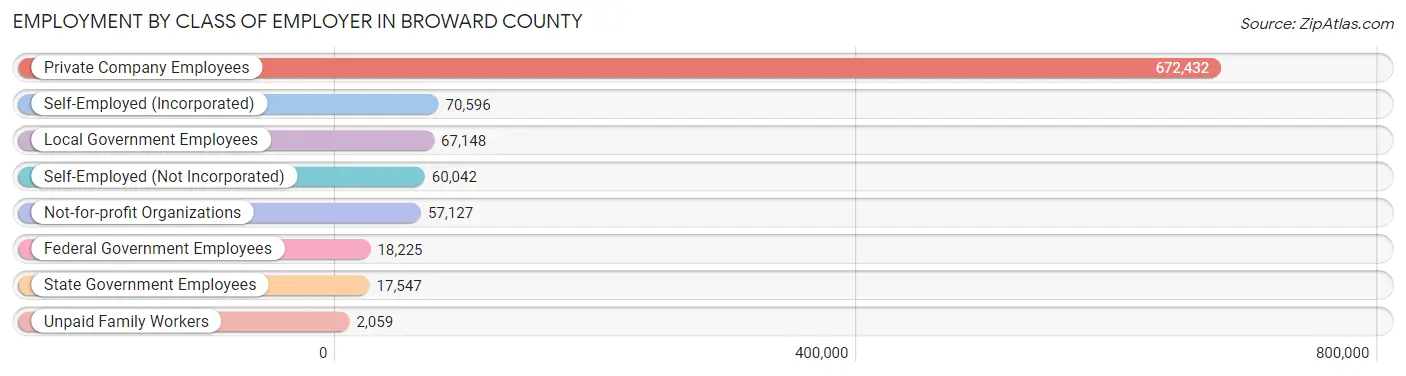
| Employer Class | # Employees | % Employees |
| Private Company Employees | 672,432 | 69.7% |
| Self-Employed (Incorporated) | 70,596 | 7.3% |
| Self-Employed (Not Incorporated) | 60,042 | 6.2% |
| Not-for-profit Organizations | 57,127 | 5.9% |
| Local Government Employees | 67,148 | 7.0% |
| State Government Employees | 17,547 | 1.8% |
| Federal Government Employees | 18,225 | 1.9% |
| Unpaid Family Workers | 2,059 | 0.2% |
| Total | 965,176 | 100.0% |
Employment Status by Age in Broward County
According to the labor force statistics for Broward County, out of the total population over 16 years of age (1,582,982), 66.1% or 1,046,351 individuals are in the labor force, with 5.8% or 60,688 of them unemployed. The age group with the highest labor force participation rate is 35 to 44 years, with 86.9% or 228,230 individuals in the labor force. Within the labor force, the 16 to 19 years age range has the highest percentage of unemployed individuals, with 17.8% or 5,173 of them being unemployed.
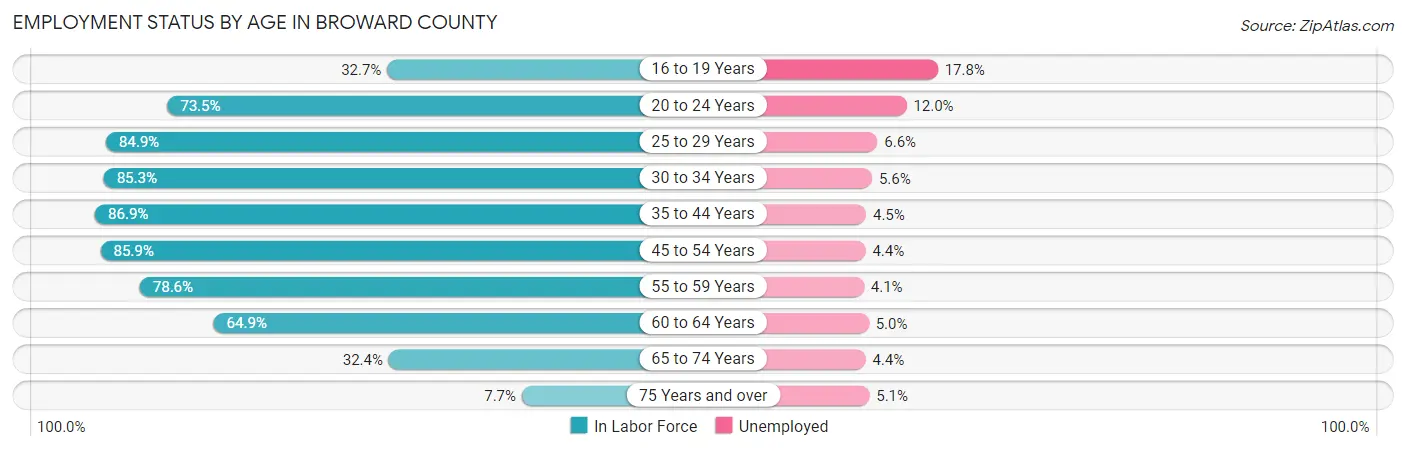
| Age Bracket | In Labor Force | Unemployed |
| 16 to 19 Years | 29,063 (32.7%) | 5,173 (17.8%) |
| 20 to 24 Years | 81,672 (73.5%) | 9,801 (12.0%) |
| 25 to 29 Years | 104,076 (84.9%) | 6,869 (6.6%) |
| 30 to 34 Years | 112,257 (85.3%) | 6,286 (5.6%) |
| 35 to 44 Years | 228,230 (86.9%) | 10,270 (4.5%) |
| 45 to 54 Years | 228,314 (85.9%) | 10,046 (4.4%) |
| 55 to 59 Years | 108,420 (78.6%) | 4,445 (4.1%) |
| 60 to 64 Years | 82,481 (64.9%) | 4,124 (5.0%) |
| 65 to 74 Years | 60,919 (32.4%) | 2,680 (4.4%) |
| 75 Years and over | 11,344 (7.7%) | 579 (5.1%) |
| Total | 1,046,351 (66.1%) | 60,688 (5.8%) |
Employment Status by Educational Attainment in Broward County
According to labor force statistics for Broward County, 82.5% of individuals (864,305) out of the total population between 25 and 64 years of age (1,047,643) are in the labor force, with 4.9% or 42,351 of them being unemployed. The group with the highest labor force participation rate are those with the educational attainment of bachelor's degree or higher, with 86.8% or 333,347 individuals in the labor force. Within the labor force, individuals with less than high school education have the highest percentage of unemployment, with 8.9% or 5,441 of them being unemployed.
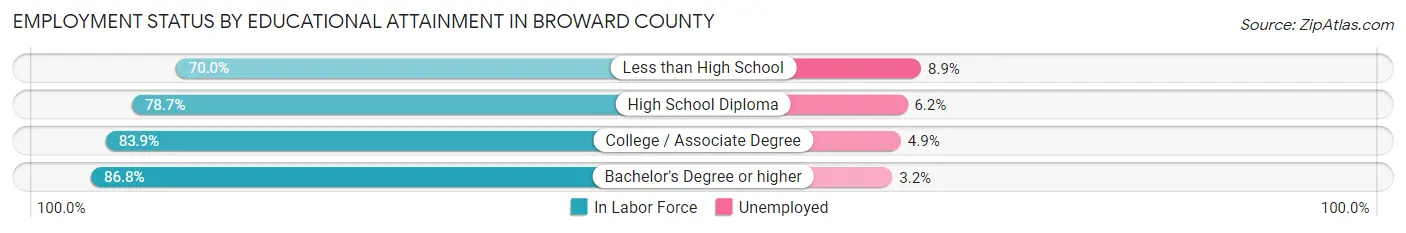
| Educational Attainment | In Labor Force | Unemployed |
| Less than High School | 61,131 (70.0%) | 7,772 (8.9%) |
| High School Diploma | 211,656 (78.7%) | 16,674 (6.2%) |
| College / Associate Degree | 257,852 (83.9%) | 15,059 (4.9%) |
| Bachelor's Degree or higher | 333,347 (86.8%) | 12,289 (3.2%) |
| Total | 864,305 (82.5%) | 51,335 (4.9%) |
Employment Occupations by Sex in Broward County
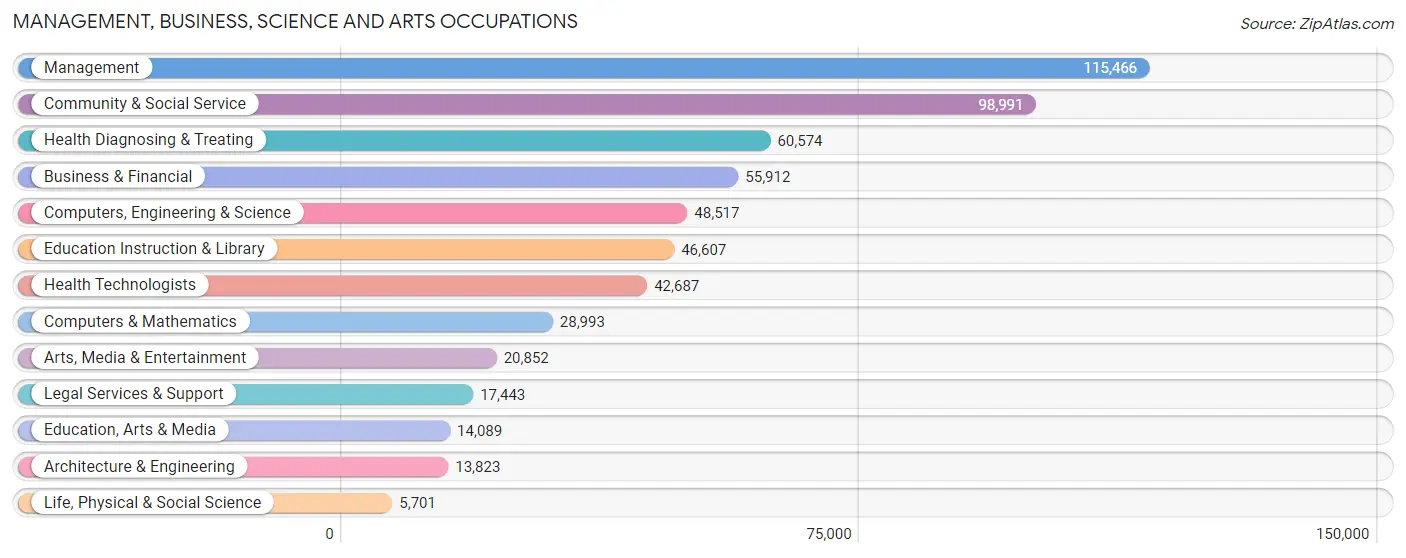
Management, Business, Science and Arts Occupations
The most common Management, Business, Science and Arts occupations in Broward County are Management (115,466 | 11.7%), Community & Social Service (98,991 | 10.1%), Health Diagnosing & Treating (60,574 | 6.1%), Business & Financial (55,912 | 5.7%), and Computers, Engineering & Science (48,517 | 4.9%).
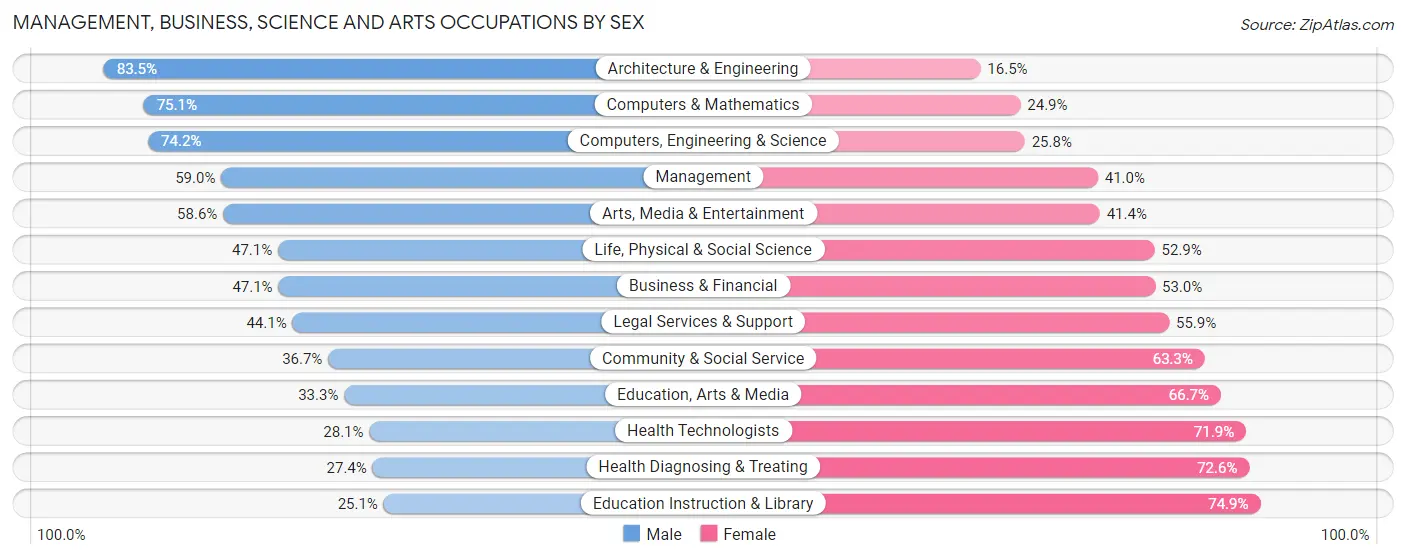
Management, Business, Science and Arts Occupations by Sex
Within the Management, Business, Science and Arts occupations in Broward County, the most male-oriented occupations are Architecture & Engineering (83.5%), Computers & Mathematics (75.1%), and Computers, Engineering & Science (74.2%), while the most female-oriented occupations are Education Instruction & Library (74.9%), Health Diagnosing & Treating (72.6%), and Health Technologists (71.9%).
| Occupation | Male | Female |
| Management | 68,104 (59.0%) | 47,362 (41.0%) |
| Business & Financial | 26,307 (47.0%) | 29,605 (52.9%) |
| Computers, Engineering & Science | 36,009 (74.2%) | 12,508 (25.8%) |
| Computers & Mathematics | 21,784 (75.1%) | 7,209 (24.9%) |
| Architecture & Engineering | 11,538 (83.5%) | 2,285 (16.5%) |
| Life, Physical & Social Science | 2,687 (47.1%) | 3,014 (52.9%) |
| Community & Social Service | 36,299 (36.7%) | 62,692 (63.3%) |
| Education, Arts & Media | 4,694 (33.3%) | 9,395 (66.7%) |
| Legal Services & Support | 7,695 (44.1%) | 9,748 (55.9%) |
| Education Instruction & Library | 11,695 (25.1%) | 34,912 (74.9%) |
| Arts, Media & Entertainment | 12,215 (58.6%) | 8,637 (41.4%) |
| Health Diagnosing & Treating | 16,598 (27.4%) | 43,976 (72.6%) |
| Health Technologists | 11,985 (28.1%) | 30,702 (71.9%) |
| Total (Category) | 183,317 (48.3%) | 196,143 (51.7%) |
| Total (Overall) | 517,090 (52.5%) | 468,273 (47.5%) |
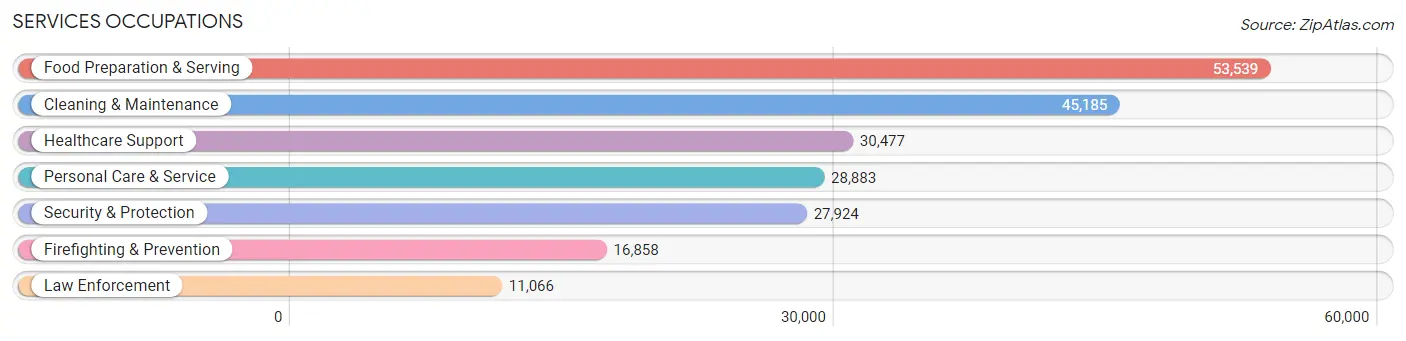
Services Occupations
The most common Services occupations in Broward County are Food Preparation & Serving (53,539 | 5.4%), Cleaning & Maintenance (45,185 | 4.6%), Healthcare Support (30,477 | 3.1%), Personal Care & Service (28,883 | 2.9%), and Security & Protection (27,924 | 2.8%).
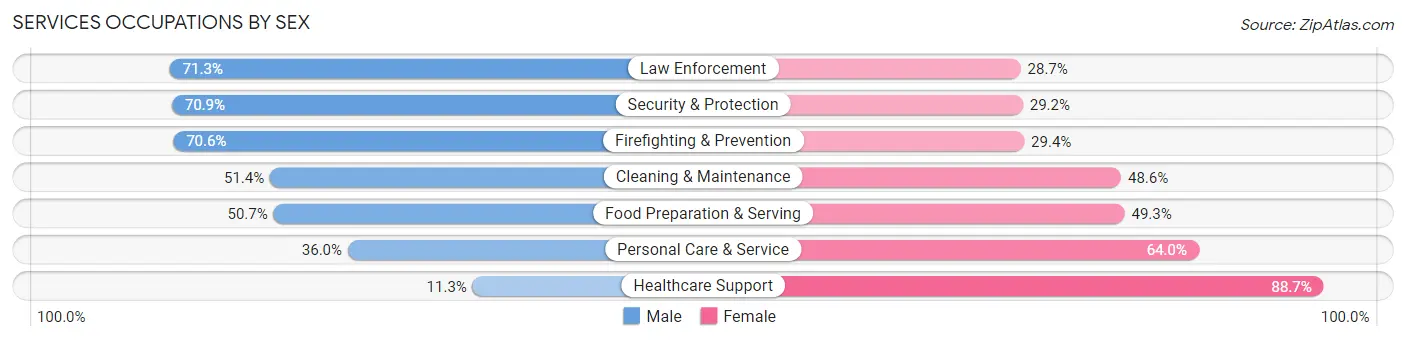
Services Occupations by Sex
Within the Services occupations in Broward County, the most male-oriented occupations are Law Enforcement (71.3%), Security & Protection (70.9%), and Firefighting & Prevention (70.6%), while the most female-oriented occupations are Healthcare Support (88.7%), Personal Care & Service (64.0%), and Food Preparation & Serving (49.3%).
| Occupation | Male | Female |
| Healthcare Support | 3,439 (11.3%) | 27,038 (88.7%) |
| Security & Protection | 19,783 (70.9%) | 8,141 (29.1%) |
| Firefighting & Prevention | 11,896 (70.6%) | 4,962 (29.4%) |
| Law Enforcement | 7,887 (71.3%) | 3,179 (28.7%) |
| Food Preparation & Serving | 27,142 (50.7%) | 26,397 (49.3%) |
| Cleaning & Maintenance | 23,219 (51.4%) | 21,966 (48.6%) |
| Personal Care & Service | 10,394 (36.0%) | 18,489 (64.0%) |
| Total (Category) | 83,977 (45.2%) | 102,031 (54.8%) |
| Total (Overall) | 517,090 (52.5%) | 468,273 (47.5%) |
Sales and Office Occupations
The most common Sales and Office occupations in Broward County are Office & Administration (120,864 | 12.3%), and Sales & Related (116,923 | 11.9%).
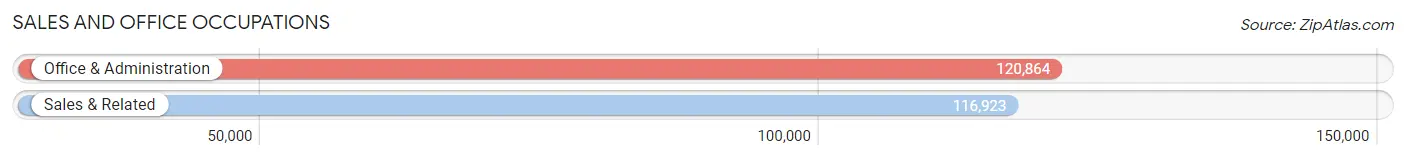
Sales and Office Occupations by Sex
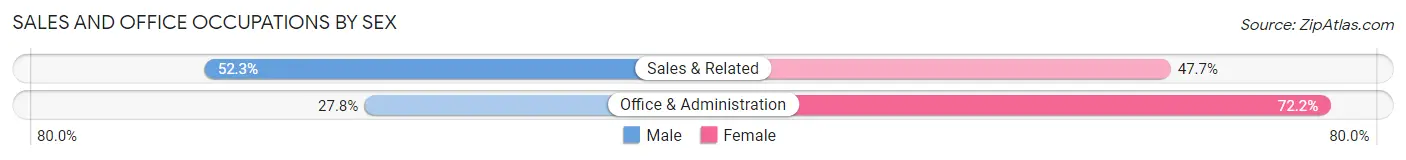
| Occupation | Male | Female |
| Sales & Related | 61,112 (52.3%) | 55,811 (47.7%) |
| Office & Administration | 33,560 (27.8%) | 87,304 (72.2%) |
| Total (Category) | 94,672 (39.8%) | 143,115 (60.2%) |
| Total (Overall) | 517,090 (52.5%) | 468,273 (47.5%) |
Natural Resources, Construction and Maintenance Occupations
The most common Natural Resources, Construction and Maintenance occupations in Broward County are Construction & Extraction (49,852 | 5.1%), Installation, Maintenance & Repair (31,701 | 3.2%), and Farming, Fishing & Forestry (1,310 | 0.1%).
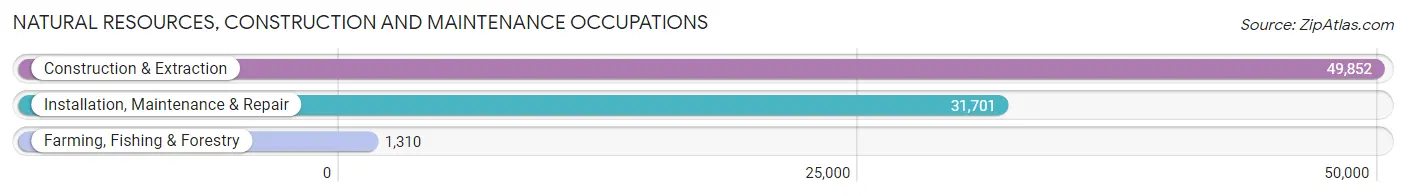
Natural Resources, Construction and Maintenance Occupations by Sex
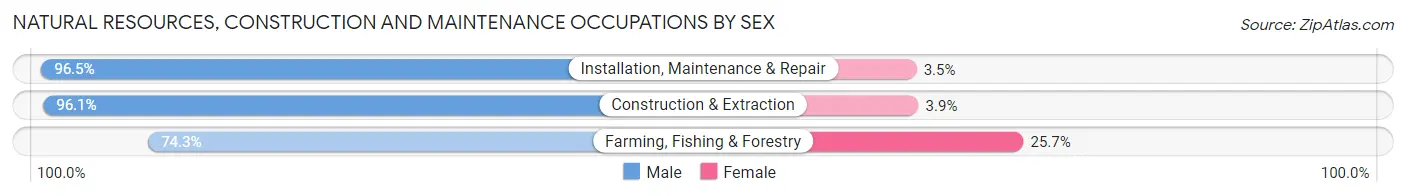
| Occupation | Male | Female |
| Farming, Fishing & Forestry | 973 (74.3%) | 337 (25.7%) |
| Construction & Extraction | 47,909 (96.1%) | 1,943 (3.9%) |
| Installation, Maintenance & Repair | 30,595 (96.5%) | 1,106 (3.5%) |
| Total (Category) | 79,477 (95.9%) | 3,386 (4.1%) |
| Total (Overall) | 517,090 (52.5%) | 468,273 (47.5%) |
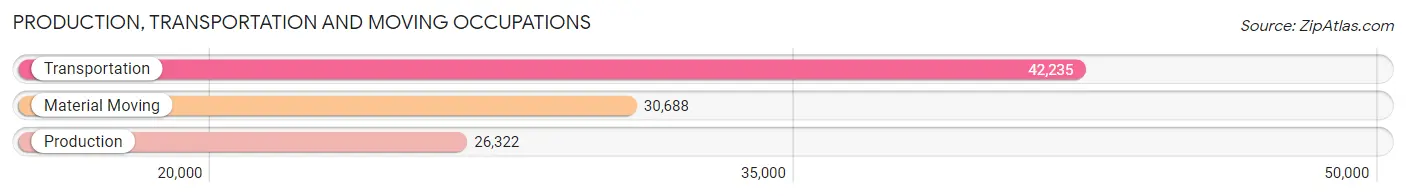
Production, Transportation and Moving Occupations
The most common Production, Transportation and Moving occupations in Broward County are Transportation (42,235 | 4.3%), Material Moving (30,688 | 3.1%), and Production (26,322 | 2.7%).
Production, Transportation and Moving Occupations by Sex
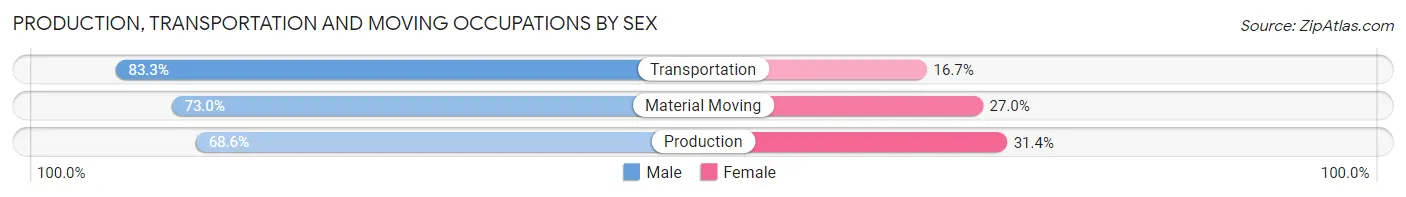
| Occupation | Male | Female |
| Production | 18,054 (68.6%) | 8,268 (31.4%) |
| Transportation | 35,183 (83.3%) | 7,052 (16.7%) |
| Material Moving | 22,410 (73.0%) | 8,278 (27.0%) |
| Total (Category) | 75,647 (76.2%) | 23,598 (23.8%) |
| Total (Overall) | 517,090 (52.5%) | 468,273 (47.5%) |
Employment Industries by Sex in Broward County
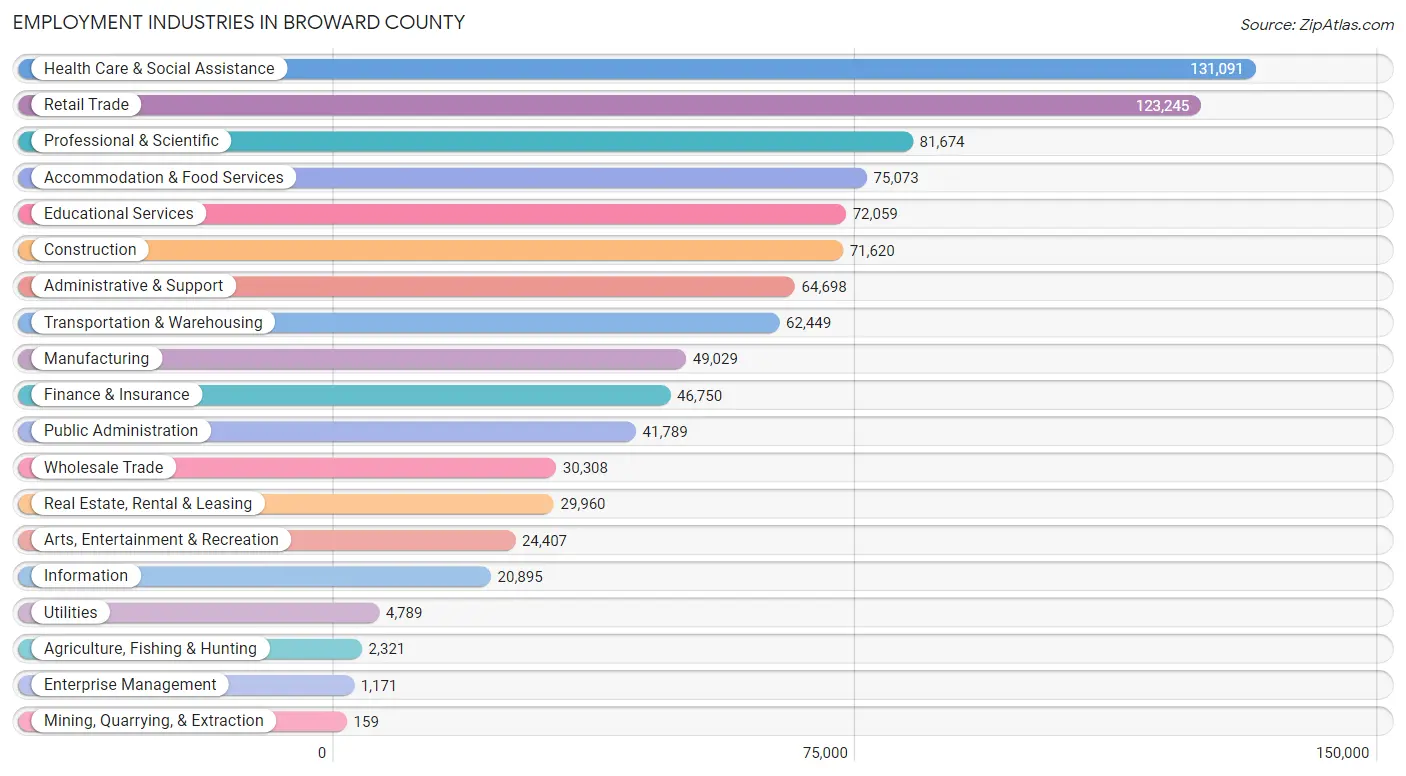
Employment Industries in Broward County
The major employment industries in Broward County include Health Care & Social Assistance (131,091 | 13.3%), Retail Trade (123,245 | 12.5%), Professional & Scientific (81,674 | 8.3%), Accommodation & Food Services (75,073 | 7.6%), and Educational Services (72,059 | 7.3%).
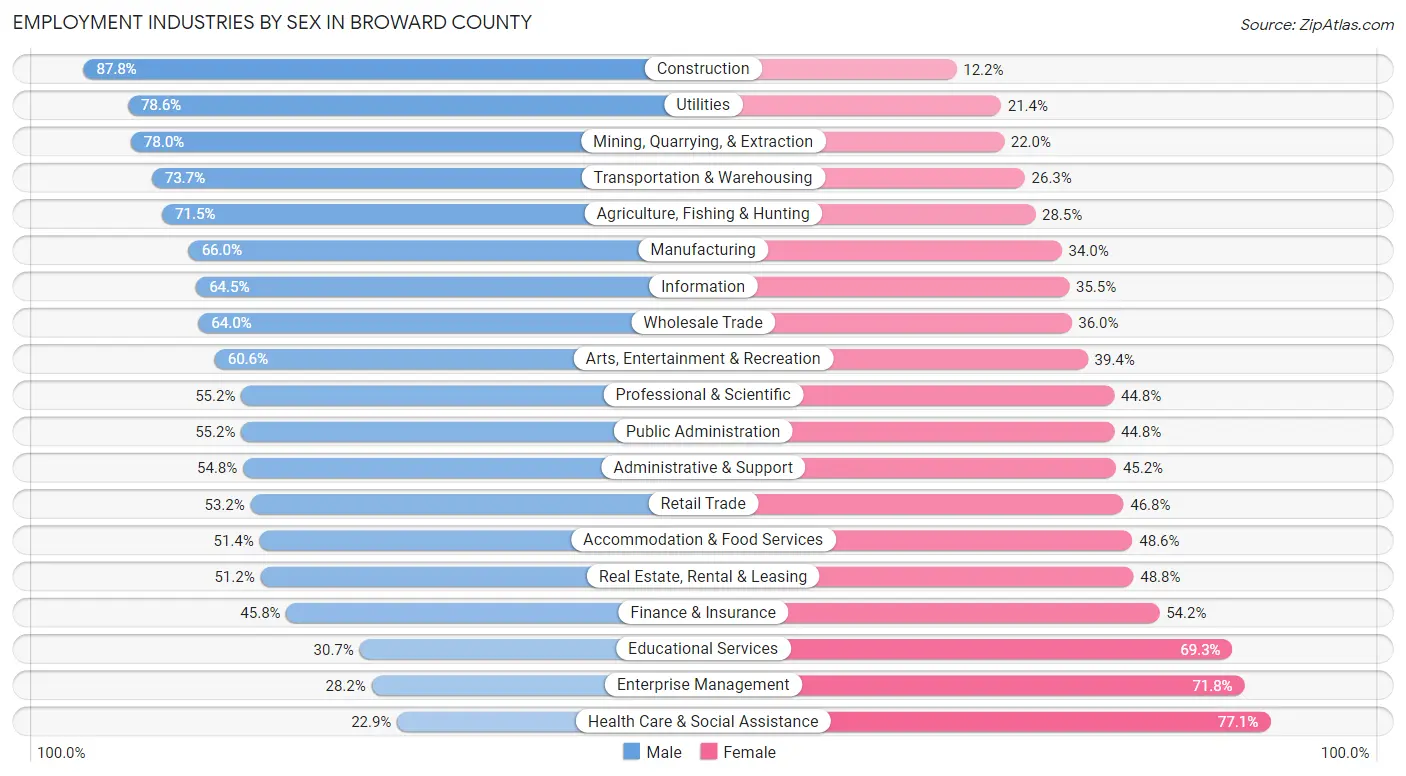
Employment Industries by Sex in Broward County
The Broward County industries that see more men than women are Construction (87.8%), Utilities (78.6%), and Mining, Quarrying, & Extraction (78.0%), whereas the industries that tend to have a higher number of women are Health Care & Social Assistance (77.1%), Enterprise Management (71.8%), and Educational Services (69.3%).
| Industry | Male | Female |
| Agriculture, Fishing & Hunting | 1,660 (71.5%) | 661 (28.5%) |
| Mining, Quarrying, & Extraction | 124 (78.0%) | 35 (22.0%) |
| Construction | 62,891 (87.8%) | 8,729 (12.2%) |
| Manufacturing | 32,371 (66.0%) | 16,658 (34.0%) |
| Wholesale Trade | 19,403 (64.0%) | 10,905 (36.0%) |
| Retail Trade | 65,619 (53.2%) | 57,626 (46.8%) |
| Transportation & Warehousing | 46,004 (73.7%) | 16,445 (26.3%) |
| Utilities | 3,764 (78.6%) | 1,025 (21.4%) |
| Information | 13,472 (64.5%) | 7,423 (35.5%) |
| Finance & Insurance | 21,414 (45.8%) | 25,336 (54.2%) |
| Real Estate, Rental & Leasing | 15,333 (51.2%) | 14,627 (48.8%) |
| Professional & Scientific | 45,055 (55.2%) | 36,619 (44.8%) |
| Enterprise Management | 330 (28.2%) | 841 (71.8%) |
| Administrative & Support | 35,436 (54.8%) | 29,262 (45.2%) |
| Educational Services | 22,090 (30.7%) | 49,969 (69.3%) |
| Health Care & Social Assistance | 30,000 (22.9%) | 101,091 (77.1%) |
| Arts, Entertainment & Recreation | 14,797 (60.6%) | 9,610 (39.4%) |
| Accommodation & Food Services | 38,564 (51.4%) | 36,509 (48.6%) |
| Public Administration | 23,049 (55.2%) | 18,740 (44.8%) |
| Total | 517,090 (52.5%) | 468,273 (47.5%) |
Education in Broward County
School Enrollment in Broward County
The most common levels of schooling among the 460,018 students in Broward County are high school (97,864 | 21.3%), middle school (96,405 | 21.0%), and college / undergraduate (95,693 | 20.8%).
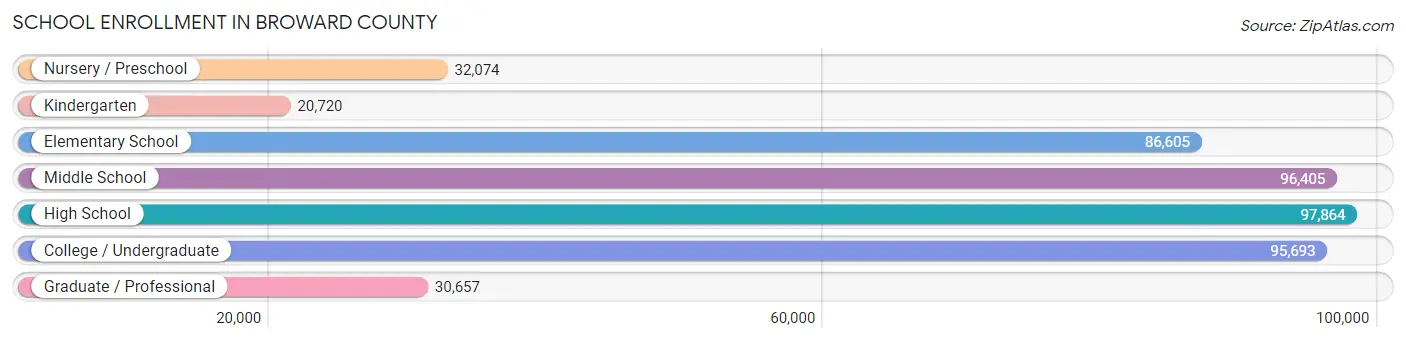
| School Level | # Students | % Students |
| Nursery / Preschool | 32,074 | 7.0% |
| Kindergarten | 20,720 | 4.5% |
| Elementary School | 86,605 | 18.8% |
| Middle School | 96,405 | 21.0% |
| High School | 97,864 | 21.3% |
| College / Undergraduate | 95,693 | 20.8% |
| Graduate / Professional | 30,657 | 6.7% |
| Total | 460,018 | 100.0% |
School Enrollment by Age by Funding Source in Broward County
Out of a total of 460,018 students who are enrolled in schools in Broward County, 100,284 (21.8%) attend a private institution, while the remaining 359,734 (78.2%) are enrolled in public schools. The age group of 3 to 4 year olds has the highest likelihood of being enrolled in private schools, with 14,161 (52.8% in the age bracket) enrolled. Conversely, the age group of 10 to 14 year olds has the lowest likelihood of being enrolled in a private school, with 101,614 (86.0% in the age bracket) attending a public institution.
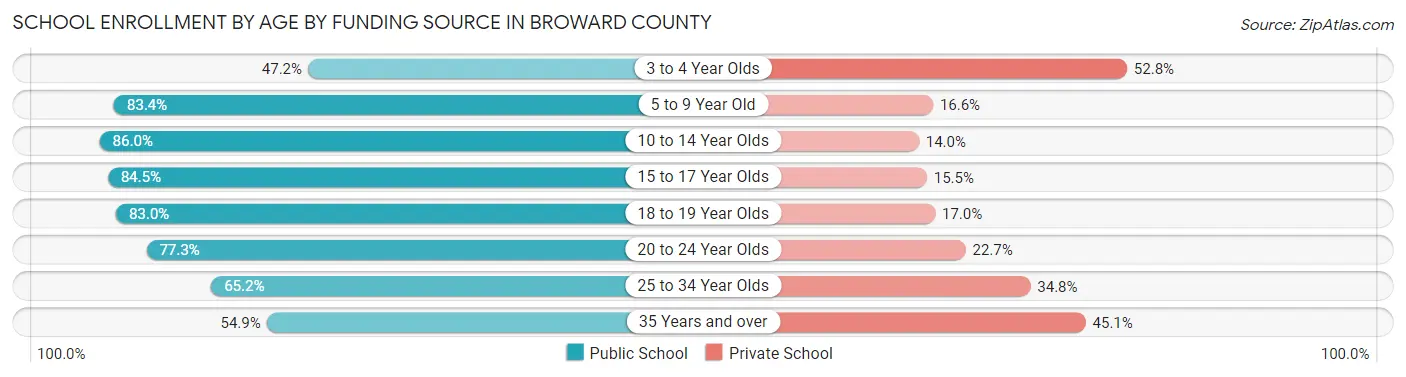
| Age Bracket | Public School | Private School |
| 3 to 4 Year Olds | 12,681 (47.2%) | 14,161 (52.8%) |
| 5 to 9 Year Old | 84,898 (83.4%) | 16,933 (16.6%) |
| 10 to 14 Year Olds | 101,614 (86.0%) | 16,525 (14.0%) |
| 15 to 17 Year Olds | 57,647 (84.5%) | 10,564 (15.5%) |
| 18 to 19 Year Olds | 26,676 (83.0%) | 5,471 (17.0%) |
| 20 to 24 Year Olds | 36,925 (77.3%) | 10,843 (22.7%) |
| 25 to 34 Year Olds | 22,456 (65.2%) | 11,970 (34.8%) |
| 35 Years and over | 16,837 (54.9%) | 13,817 (45.1%) |
| Total | 359,734 (78.2%) | 100,284 (21.8%) |
Educational Attainment by Field of Study in Broward County
Business (132,741 | 25.8%), science & technology (57,411 | 11.2%), education (50,638 | 9.9%), engineering (43,364 | 8.4%), and social sciences (36,228 | 7.0%) are the most common fields of study among 513,897 individuals in Broward County who have obtained a bachelor's degree or higher.
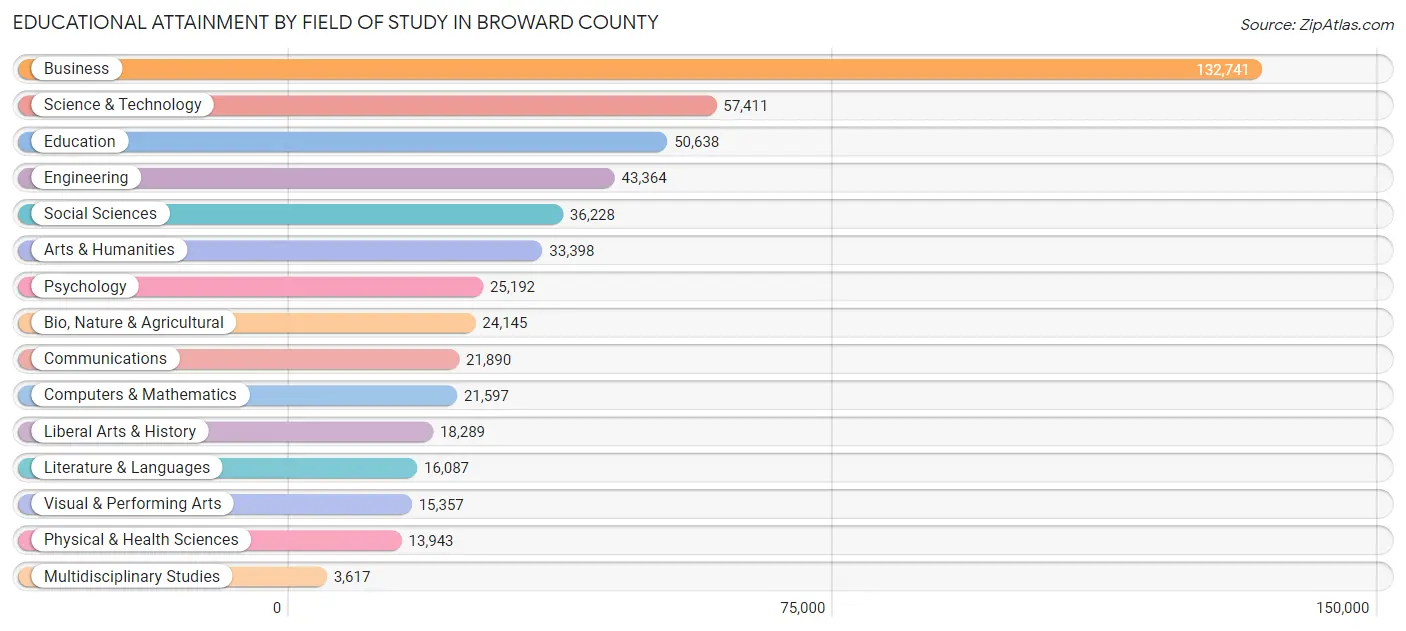
| Field of Study | # Graduates | % Graduates |
| Computers & Mathematics | 21,597 | 4.2% |
| Bio, Nature & Agricultural | 24,145 | 4.7% |
| Physical & Health Sciences | 13,943 | 2.7% |
| Psychology | 25,192 | 4.9% |
| Social Sciences | 36,228 | 7.0% |
| Engineering | 43,364 | 8.4% |
| Multidisciplinary Studies | 3,617 | 0.7% |
| Science & Technology | 57,411 | 11.2% |
| Business | 132,741 | 25.8% |
| Education | 50,638 | 9.9% |
| Literature & Languages | 16,087 | 3.1% |
| Liberal Arts & History | 18,289 | 3.6% |
| Visual & Performing Arts | 15,357 | 3.0% |
| Communications | 21,890 | 4.3% |
| Arts & Humanities | 33,398 | 6.5% |
| Total | 513,897 | 100.0% |
Transportation & Commute in Broward County
Vehicle Availability by Sex in Broward County
The most prevalent vehicle ownership categories in Broward County are males with 2 vehicles (231,064, accounting for 45.5%) and females with 2 vehicles (191,712, making up 50.6%).
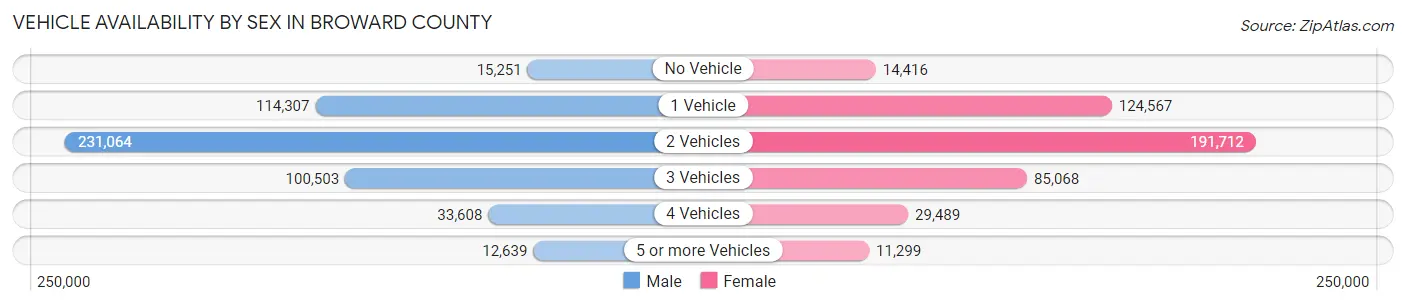
| Vehicles Available | Male | Female |
| No Vehicle | 15,251 (3.0%) | 14,416 (3.2%) |
| 1 Vehicle | 114,307 (22.5%) | 124,567 (27.3%) |
| 2 Vehicles | 231,064 (45.5%) | 191,712 (42.0%) |
| 3 Vehicles | 100,503 (19.8%) | 85,068 (18.6%) |
| 4 Vehicles | 33,608 (6.6%) | 29,489 (6.5%) |
| 5 or more Vehicles | 12,639 (2.5%) | 11,299 (2.5%) |
| Total | 507,372 (100.0%) | 456,551 (100.0%) |
Commute Time in Broward County
The most frequently occuring commute durations in Broward County are 30 to 34 minutes (158,941 commuters, 18.5%), 20 to 24 minutes (145,695 commuters, 17.0%), and 15 to 19 minutes (116,942 commuters, 13.6%).
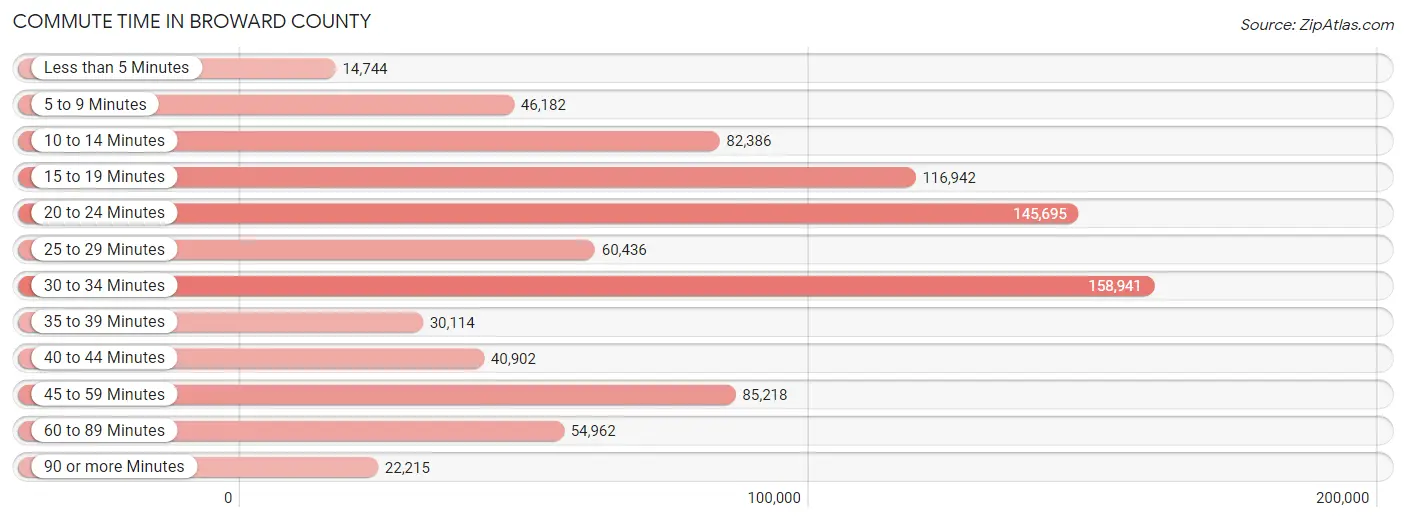
| Commute Time | # Commuters | % Commuters |
| Less than 5 Minutes | 14,744 | 1.7% |
| 5 to 9 Minutes | 46,182 | 5.4% |
| 10 to 14 Minutes | 82,386 | 9.6% |
| 15 to 19 Minutes | 116,942 | 13.6% |
| 20 to 24 Minutes | 145,695 | 17.0% |
| 25 to 29 Minutes | 60,436 | 7.0% |
| 30 to 34 Minutes | 158,941 | 18.5% |
| 35 to 39 Minutes | 30,114 | 3.5% |
| 40 to 44 Minutes | 40,902 | 4.8% |
| 45 to 59 Minutes | 85,218 | 9.9% |
| 60 to 89 Minutes | 54,962 | 6.4% |
| 90 or more Minutes | 22,215 | 2.6% |
Commute Time by Sex in Broward County
The most common commute times in Broward County are 30 to 34 minutes (85,256 commuters, 18.7%) for males and 30 to 34 minutes (73,685 commuters, 18.3%) for females.
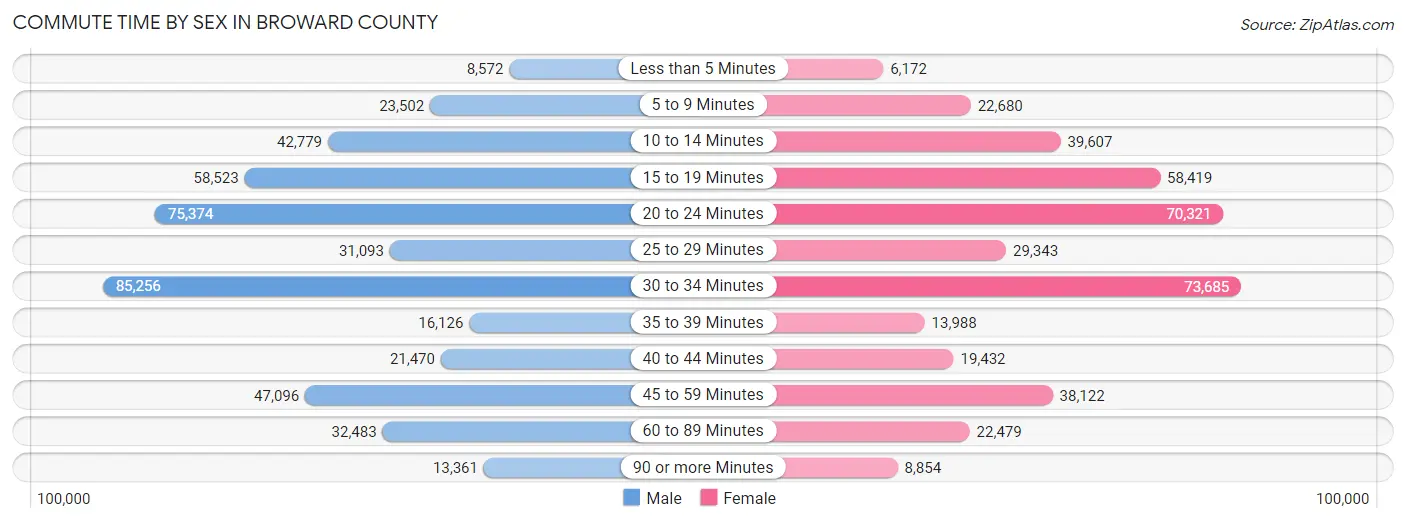
| Commute Time | Male | Female |
| Less than 5 Minutes | 8,572 (1.9%) | 6,172 (1.5%) |
| 5 to 9 Minutes | 23,502 (5.2%) | 22,680 (5.6%) |
| 10 to 14 Minutes | 42,779 (9.4%) | 39,607 (9.8%) |
| 15 to 19 Minutes | 58,523 (12.8%) | 58,419 (14.5%) |
| 20 to 24 Minutes | 75,374 (16.5%) | 70,321 (17.4%) |
| 25 to 29 Minutes | 31,093 (6.8%) | 29,343 (7.3%) |
| 30 to 34 Minutes | 85,256 (18.7%) | 73,685 (18.3%) |
| 35 to 39 Minutes | 16,126 (3.5%) | 13,988 (3.5%) |
| 40 to 44 Minutes | 21,470 (4.7%) | 19,432 (4.8%) |
| 45 to 59 Minutes | 47,096 (10.3%) | 38,122 (9.5%) |
| 60 to 89 Minutes | 32,483 (7.1%) | 22,479 (5.6%) |
| 90 or more Minutes | 13,361 (2.9%) | 8,854 (2.2%) |
Time of Departure to Work by Sex in Broward County
The most frequent times of departure to work in Broward County are 7:00 AM to 7:29 AM (67,873, 14.9%) for males and 8:00 AM to 8:29 AM (64,784, 16.1%) for females.
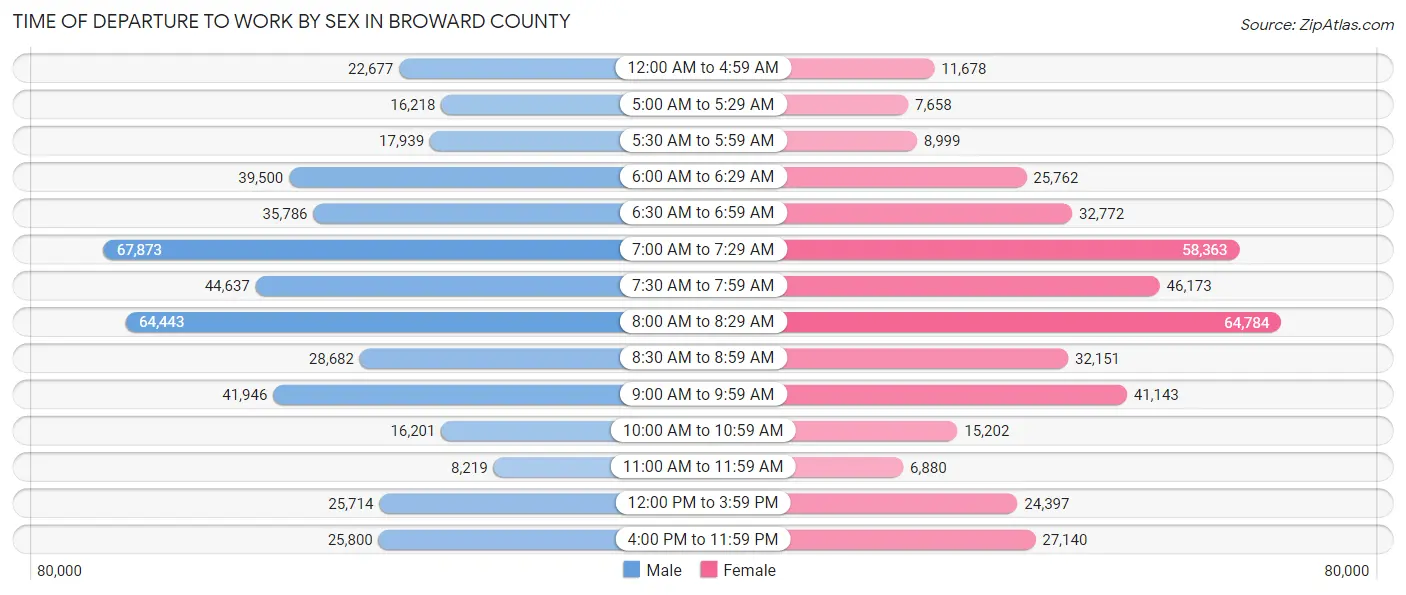
| Time of Departure | Male | Female |
| 12:00 AM to 4:59 AM | 22,677 (5.0%) | 11,678 (2.9%) |
| 5:00 AM to 5:29 AM | 16,218 (3.6%) | 7,658 (1.9%) |
| 5:30 AM to 5:59 AM | 17,939 (3.9%) | 8,999 (2.2%) |
| 6:00 AM to 6:29 AM | 39,500 (8.7%) | 25,762 (6.4%) |
| 6:30 AM to 6:59 AM | 35,786 (7.9%) | 32,772 (8.1%) |
| 7:00 AM to 7:29 AM | 67,873 (14.9%) | 58,363 (14.5%) |
| 7:30 AM to 7:59 AM | 44,637 (9.8%) | 46,173 (11.5%) |
| 8:00 AM to 8:29 AM | 64,443 (14.1%) | 64,784 (16.1%) |
| 8:30 AM to 8:59 AM | 28,682 (6.3%) | 32,151 (8.0%) |
| 9:00 AM to 9:59 AM | 41,946 (9.2%) | 41,143 (10.2%) |
| 10:00 AM to 10:59 AM | 16,201 (3.6%) | 15,202 (3.8%) |
| 11:00 AM to 11:59 AM | 8,219 (1.8%) | 6,880 (1.7%) |
| 12:00 PM to 3:59 PM | 25,714 (5.6%) | 24,397 (6.0%) |
| 4:00 PM to 11:59 PM | 25,800 (5.7%) | 27,140 (6.7%) |
| Total | 455,635 (100.0%) | 403,102 (100.0%) |
Housing Occupancy in Broward County
Occupancy by Ownership in Broward County
Of the total 741,973 dwellings in Broward County, owner-occupied units account for 466,131 (62.8%), while renter-occupied units make up 275,842 (37.2%).
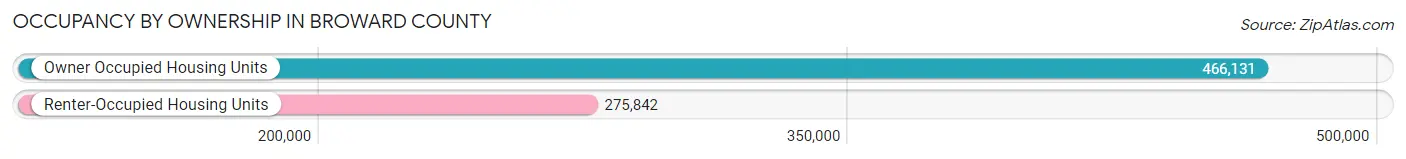
| Occupancy | # Housing Units | % Housing Units |
| Owner Occupied Housing Units | 466,131 | 62.8% |
| Renter-Occupied Housing Units | 275,842 | 37.2% |
| Total Occupied Housing Units | 741,973 | 100.0% |
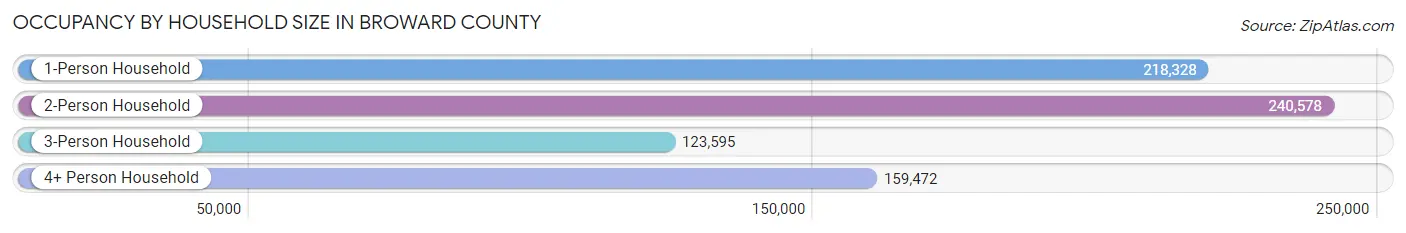
Occupancy by Household Size in Broward County
| Household Size | # Housing Units | % Housing Units |
| 1-Person Household | 218,328 | 29.4% |
| 2-Person Household | 240,578 | 32.4% |
| 3-Person Household | 123,595 | 16.7% |
| 4+ Person Household | 159,472 | 21.5% |
| Total Housing Units | 741,973 | 100.0% |
Occupancy by Ownership by Household Size in Broward County
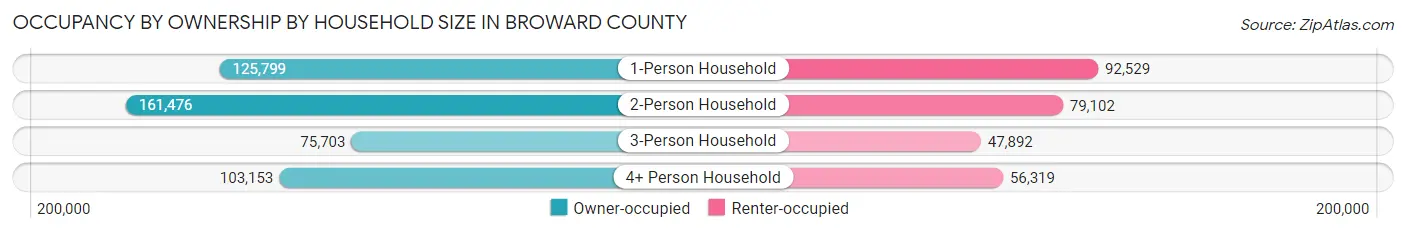
| Household Size | Owner-occupied | Renter-occupied |
| 1-Person Household | 125,799 (57.6%) | 92,529 (42.4%) |
| 2-Person Household | 161,476 (67.1%) | 79,102 (32.9%) |
| 3-Person Household | 75,703 (61.3%) | 47,892 (38.8%) |
| 4+ Person Household | 103,153 (64.7%) | 56,319 (35.3%) |
| Total Housing Units | 466,131 (62.8%) | 275,842 (37.2%) |
Occupancy by Educational Attainment in Broward County
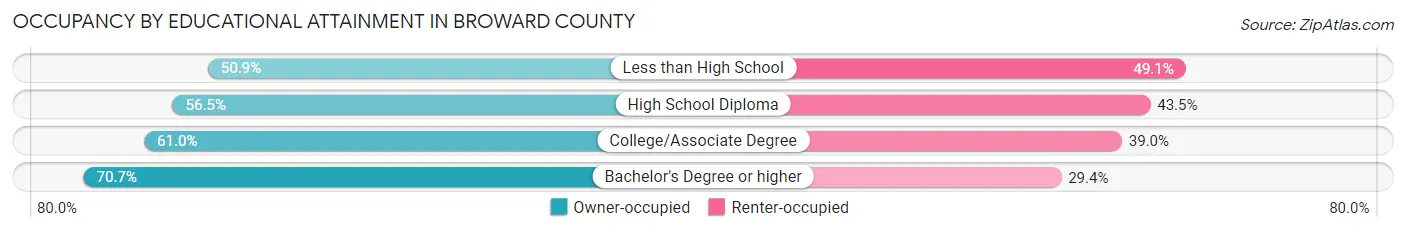
| Household Size | Owner-occupied | Renter-occupied |
| Less than High School | 30,515 (50.9%) | 29,405 (49.1%) |
| High School Diploma | 100,060 (56.5%) | 76,975 (43.5%) |
| College/Associate Degree | 134,793 (61.0%) | 86,065 (39.0%) |
| Bachelor's Degree or higher | 200,763 (70.7%) | 83,397 (29.3%) |
Occupancy by Age of Householder in Broward County
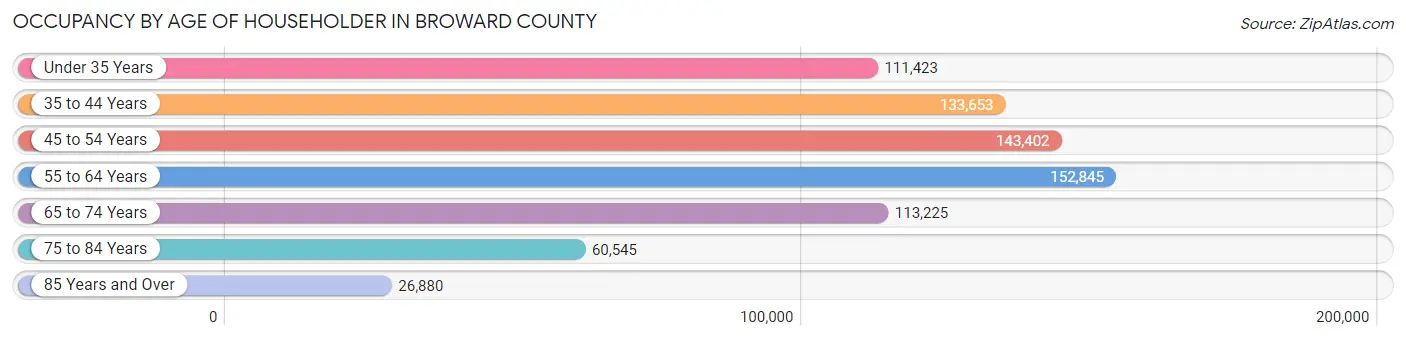
| Age Bracket | # Households | % Households |
| Under 35 Years | 111,423 | 15.0% |
| 35 to 44 Years | 133,653 | 18.0% |
| 45 to 54 Years | 143,402 | 19.3% |
| 55 to 64 Years | 152,845 | 20.6% |
| 65 to 74 Years | 113,225 | 15.3% |
| 75 to 84 Years | 60,545 | 8.2% |
| 85 Years and Over | 26,880 | 3.6% |
| Total | 741,973 | 100.0% |
Housing Finances in Broward County
Median Income by Occupancy in Broward County
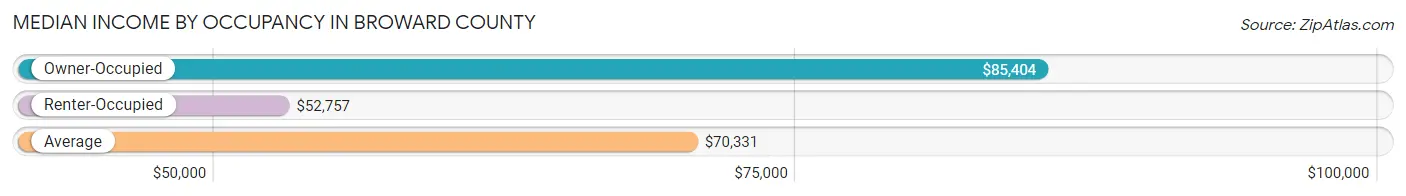
| Occupancy Type | # Households | Median Income |
| Owner-Occupied | 466,131 (62.8%) | $85,404 |
| Renter-Occupied | 275,842 (37.2%) | $52,757 |
| Average | 741,973 (100.0%) | $70,331 |
Occupancy by Householder Income Bracket in Broward County
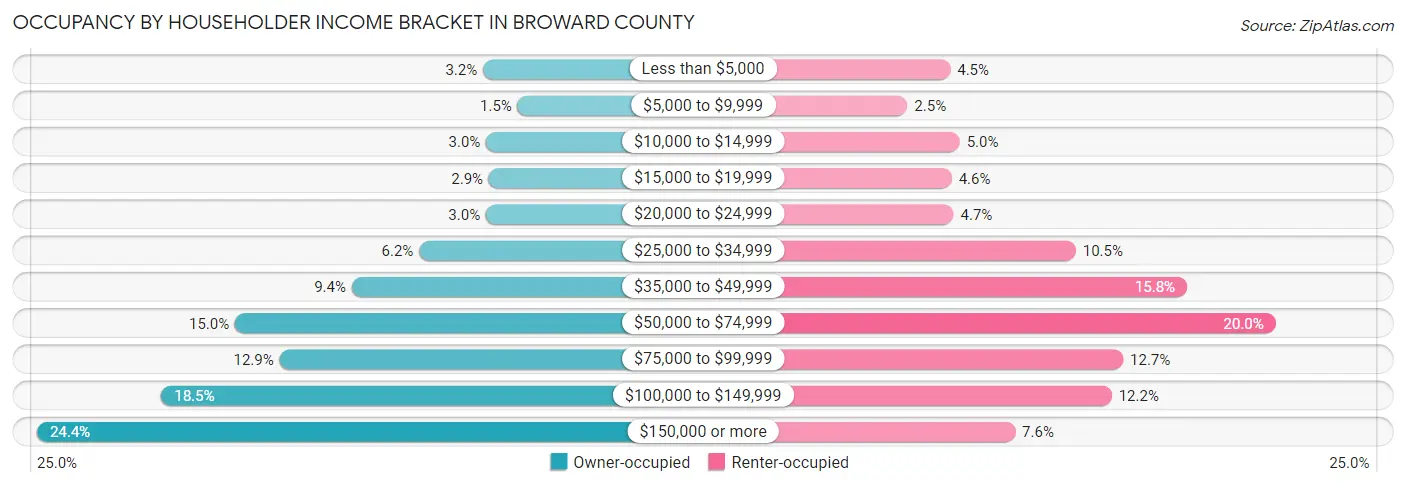
| Income Bracket | Owner-occupied | Renter-occupied |
| Less than $5,000 | 14,764 (3.2%) | 12,452 (4.5%) |
| $5,000 to $9,999 | 7,096 (1.5%) | 6,818 (2.5%) |
| $10,000 to $14,999 | 14,080 (3.0%) | 13,684 (5.0%) |
| $15,000 to $19,999 | 13,466 (2.9%) | 12,635 (4.6%) |
| $20,000 to $24,999 | 14,118 (3.0%) | 12,885 (4.7%) |
| $25,000 to $34,999 | 28,954 (6.2%) | 28,926 (10.5%) |
| $35,000 to $49,999 | 43,925 (9.4%) | 43,531 (15.8%) |
| $50,000 to $74,999 | 69,812 (15.0%) | 55,176 (20.0%) |
| $75,000 to $99,999 | 59,959 (12.9%) | 35,129 (12.7%) |
| $100,000 to $149,999 | 86,165 (18.5%) | 33,651 (12.2%) |
| $150,000 or more | 113,792 (24.4%) | 20,955 (7.6%) |
| Total | 466,131 (100.0%) | 275,842 (100.0%) |
Monthly Housing Cost Tiers in Broward County
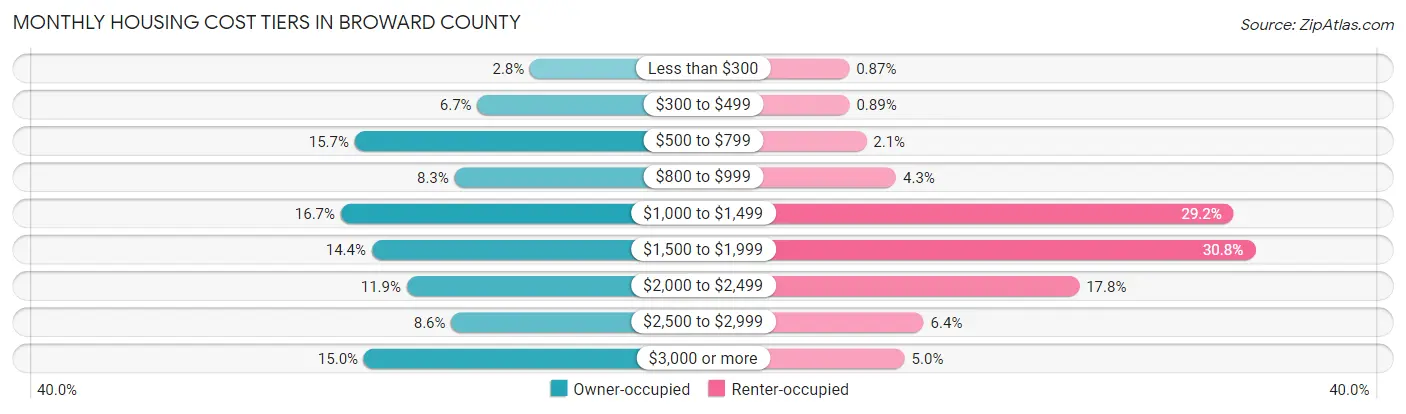
| Monthly Cost | Owner-occupied | Renter-occupied |
| Less than $300 | 12,905 (2.8%) | 2,405 (0.9%) |
| $300 to $499 | 30,990 (6.7%) | 2,465 (0.9%) |
| $500 to $799 | 73,103 (15.7%) | 5,872 (2.1%) |
| $800 to $999 | 38,806 (8.3%) | 11,922 (4.3%) |
| $1,000 to $1,499 | 77,907 (16.7%) | 80,475 (29.2%) |
| $1,500 to $1,999 | 67,258 (14.4%) | 84,831 (30.7%) |
| $2,000 to $2,499 | 55,247 (11.8%) | 49,135 (17.8%) |
| $2,500 to $2,999 | 39,938 (8.6%) | 17,521 (6.4%) |
| $3,000 or more | 69,977 (15.0%) | 13,654 (5.0%) |
| Total | 466,131 (100.0%) | 275,842 (100.0%) |
Physical Housing Characteristics in Broward County
Housing Structures in Broward County
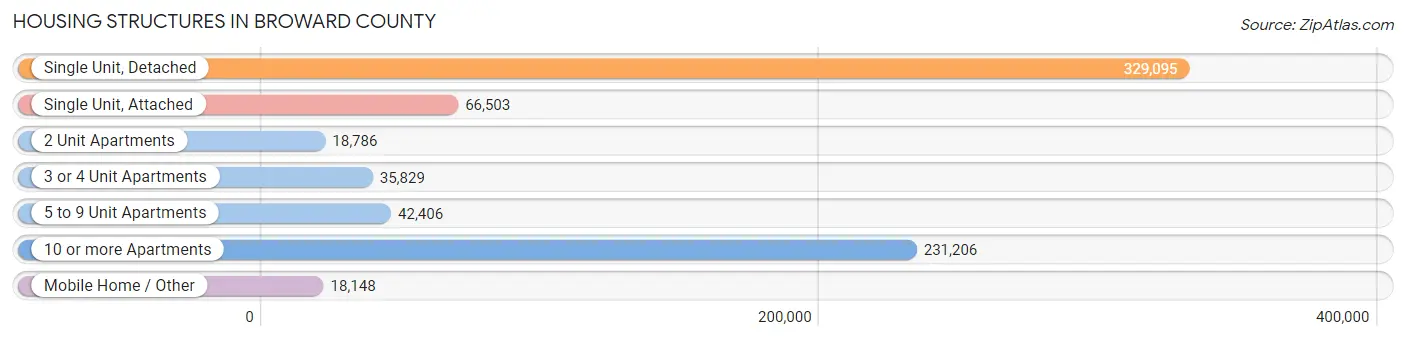
| Structure Type | # Housing Units | % Housing Units |
| Single Unit, Detached | 329,095 | 44.4% |
| Single Unit, Attached | 66,503 | 9.0% |
| 2 Unit Apartments | 18,786 | 2.5% |
| 3 or 4 Unit Apartments | 35,829 | 4.8% |
| 5 to 9 Unit Apartments | 42,406 | 5.7% |
| 10 or more Apartments | 231,206 | 31.2% |
| Mobile Home / Other | 18,148 | 2.5% |
| Total | 741,973 | 100.0% |
Housing Structures by Occupancy in Broward County
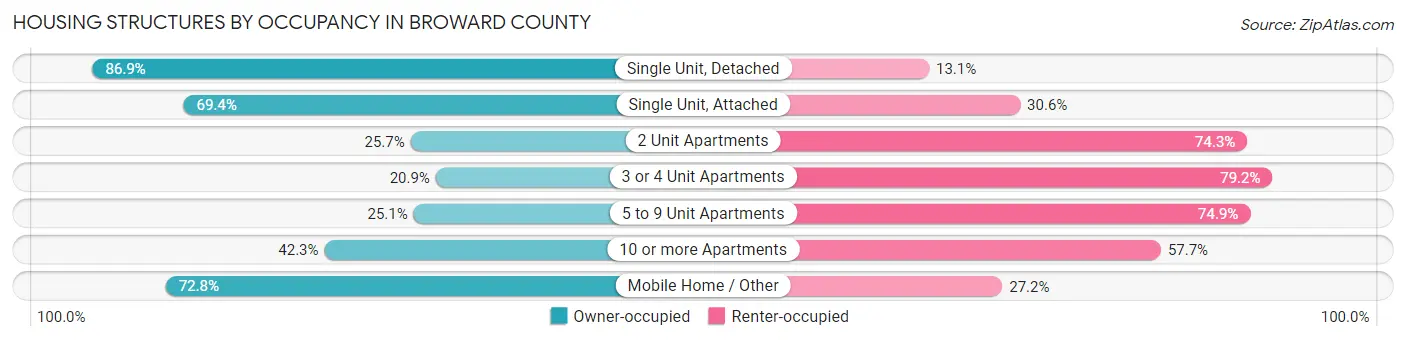
| Structure Type | Owner-occupied | Renter-occupied |
| Single Unit, Detached | 286,070 (86.9%) | 43,025 (13.1%) |
| Single Unit, Attached | 46,144 (69.4%) | 20,359 (30.6%) |
| 2 Unit Apartments | 4,826 (25.7%) | 13,960 (74.3%) |
| 3 or 4 Unit Apartments | 7,472 (20.8%) | 28,357 (79.1%) |
| 5 to 9 Unit Apartments | 10,650 (25.1%) | 31,756 (74.9%) |
| 10 or more Apartments | 97,753 (42.3%) | 133,453 (57.7%) |
| Mobile Home / Other | 13,216 (72.8%) | 4,932 (27.2%) |
| Total | 466,131 (62.8%) | 275,842 (37.2%) |
Housing Structures by Number of Rooms in Broward County
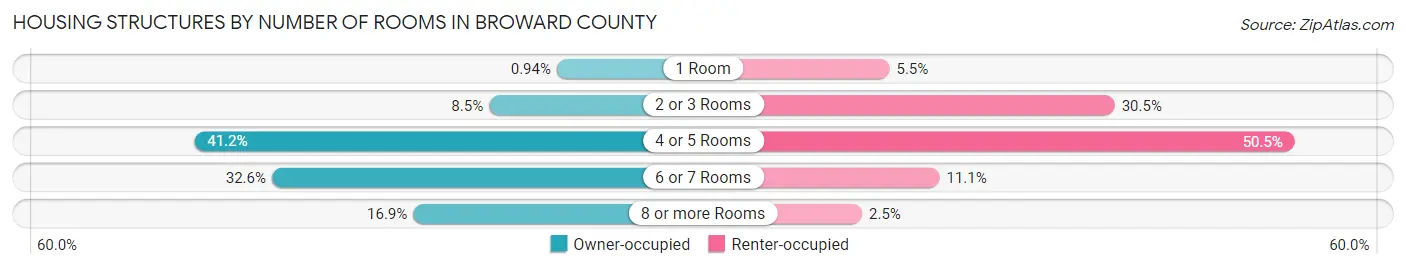
| Number of Rooms | Owner-occupied | Renter-occupied |
| 1 Room | 4,359 (0.9%) | 15,189 (5.5%) |
| 2 or 3 Rooms | 39,442 (8.5%) | 84,127 (30.5%) |
| 4 or 5 Rooms | 191,847 (41.2%) | 139,217 (50.5%) |
| 6 or 7 Rooms | 151,798 (32.6%) | 30,513 (11.1%) |
| 8 or more Rooms | 78,685 (16.9%) | 6,796 (2.5%) |
| Total | 466,131 (100.0%) | 275,842 (100.0%) |
Housing Structure by Heating Type in Broward County
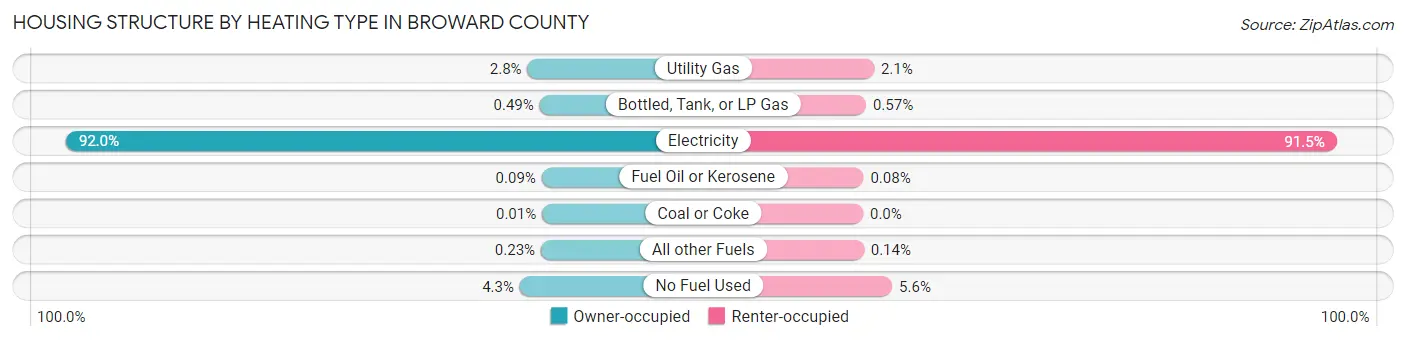
| Heating Type | Owner-occupied | Renter-occupied |
| Utility Gas | 13,182 (2.8%) | 5,820 (2.1%) |
| Bottled, Tank, or LP Gas | 2,274 (0.5%) | 1,567 (0.6%) |
| Electricity | 429,041 (92.0%) | 252,356 (91.5%) |
| Fuel Oil or Kerosene | 404 (0.1%) | 212 (0.1%) |
| Coal or Coke | 40 (0.0%) | 5 (0.0%) |
| All other Fuels | 1,080 (0.2%) | 385 (0.1%) |
| No Fuel Used | 20,110 (4.3%) | 15,497 (5.6%) |
| Total | 466,131 (100.0%) | 275,842 (100.0%) |
Household Vehicle Usage in Broward County
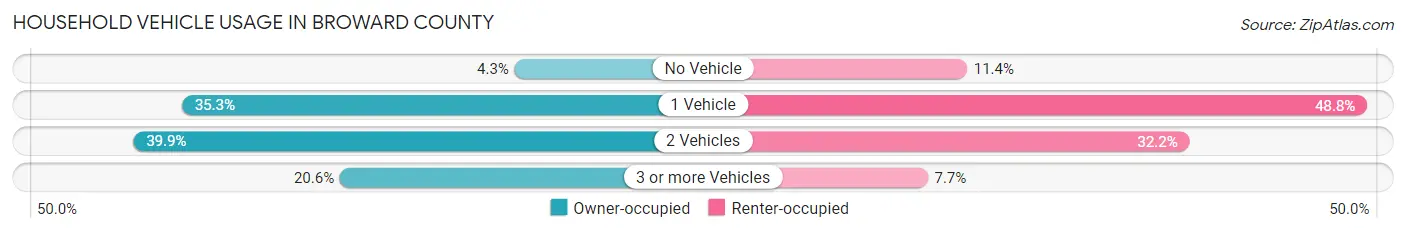
| Vehicles per Household | Owner-occupied | Renter-occupied |
| No Vehicle | 19,812 (4.3%) | 31,390 (11.4%) |
| 1 Vehicle | 164,673 (35.3%) | 134,467 (48.7%) |
| 2 Vehicles | 185,797 (39.9%) | 88,726 (32.2%) |
| 3 or more Vehicles | 95,849 (20.6%) | 21,259 (7.7%) |
| Total | 466,131 (100.0%) | 275,842 (100.0%) |
Real Estate & Mortgages in Broward County
Real Estate and Mortgage Overview in Broward County
| Characteristic | Without Mortgage | With Mortgage |
| Housing Units | 191,669 | 274,462 |
| Median Property Value | $285,100 | $380,300 |
| Median Household Income | $60,494 | $83,880 |
| Monthly Housing Costs | $732 | $66,760 |
| Real Estate Taxes | $2,573 | $8,916 |
Property Value by Mortgage Status in Broward County
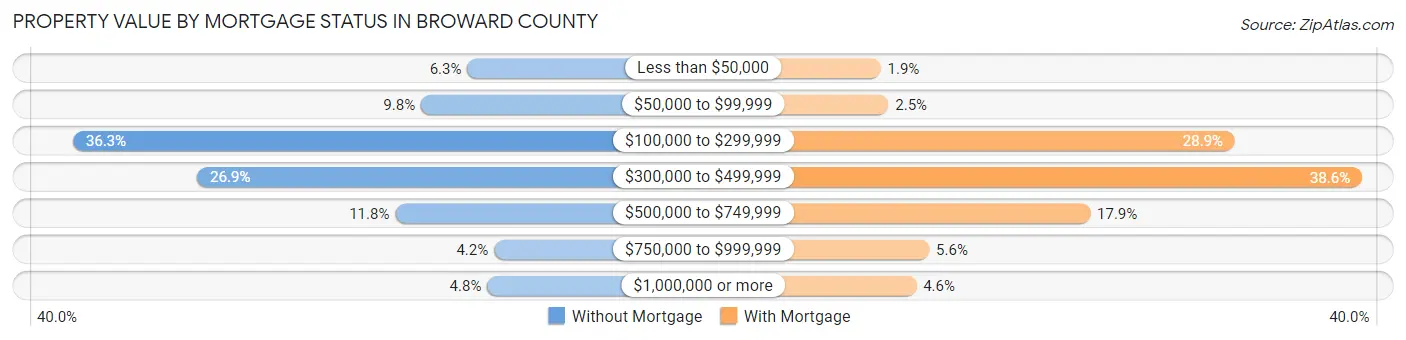
| Property Value | Without Mortgage | With Mortgage |
| Less than $50,000 | 12,019 (6.3%) | 5,251 (1.9%) |
| $50,000 to $99,999 | 18,785 (9.8%) | 6,861 (2.5%) |
| $100,000 to $299,999 | 69,623 (36.3%) | 79,308 (28.9%) |
| $300,000 to $499,999 | 51,485 (26.9%) | 105,924 (38.6%) |
| $500,000 to $749,999 | 22,535 (11.8%) | 49,047 (17.9%) |
| $750,000 to $999,999 | 8,117 (4.2%) | 15,394 (5.6%) |
| $1,000,000 or more | 9,105 (4.8%) | 12,677 (4.6%) |
| Total | 191,669 (100.0%) | 274,462 (100.0%) |
Household Income by Mortgage Status in Broward County
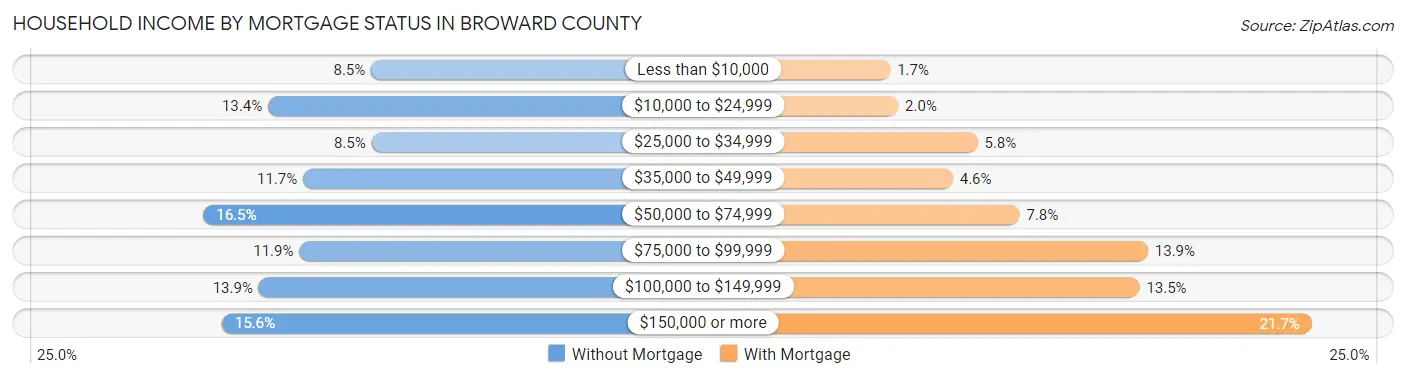
| Household Income | Without Mortgage | With Mortgage |
| Less than $10,000 | 16,297 (8.5%) | 4,533 (1.7%) |
| $10,000 to $24,999 | 25,707 (13.4%) | 5,563 (2.0%) |
| $25,000 to $34,999 | 16,255 (8.5%) | 15,957 (5.8%) |
| $35,000 to $49,999 | 22,502 (11.7%) | 12,699 (4.6%) |
| $50,000 to $74,999 | 31,597 (16.5%) | 21,423 (7.8%) |
| $75,000 to $99,999 | 22,848 (11.9%) | 38,215 (13.9%) |
| $100,000 to $149,999 | 26,551 (13.9%) | 37,111 (13.5%) |
| $150,000 or more | 29,912 (15.6%) | 59,614 (21.7%) |
| Total | 191,669 (100.0%) | 274,462 (100.0%) |
Property Value to Household Income Ratio in Broward County
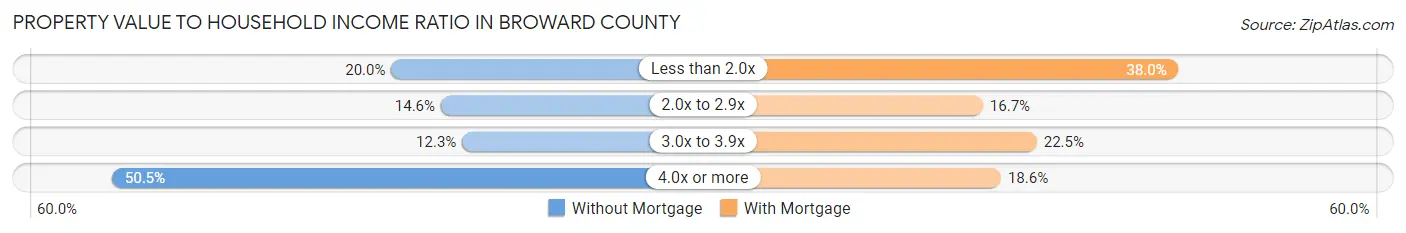
| Value-to-Income Ratio | Without Mortgage | With Mortgage |
| Less than 2.0x | 38,403 (20.0%) | 104,270 (38.0%) |
| 2.0x to 2.9x | 28,066 (14.6%) | 45,747 (16.7%) |
| 3.0x to 3.9x | 23,605 (12.3%) | 61,868 (22.5%) |
| 4.0x or more | 96,768 (50.5%) | 51,173 (18.6%) |
| Total | 191,669 (100.0%) | 274,462 (100.0%) |
Real Estate Taxes by Mortgage Status in Broward County
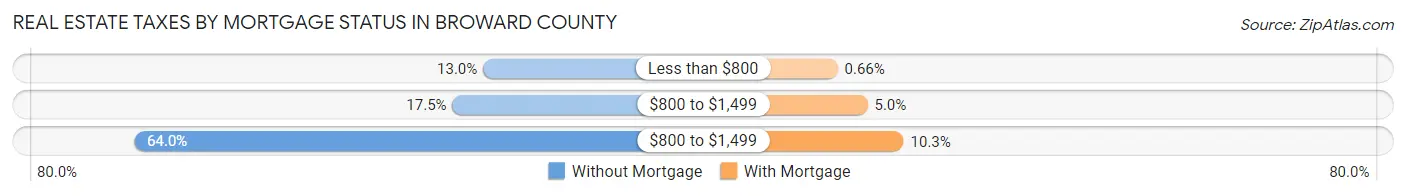
| Property Taxes | Without Mortgage | With Mortgage |
| Less than $800 | 24,908 (13.0%) | 1,798 (0.7%) |
| $800 to $1,499 | 33,530 (17.5%) | 13,838 (5.0%) |
| $800 to $1,499 | 122,711 (64.0%) | 28,290 (10.3%) |
| Total | 191,669 (100.0%) | 274,462 (100.0%) |
Health & Disability in Broward County
Health Insurance Coverage by Age in Broward County
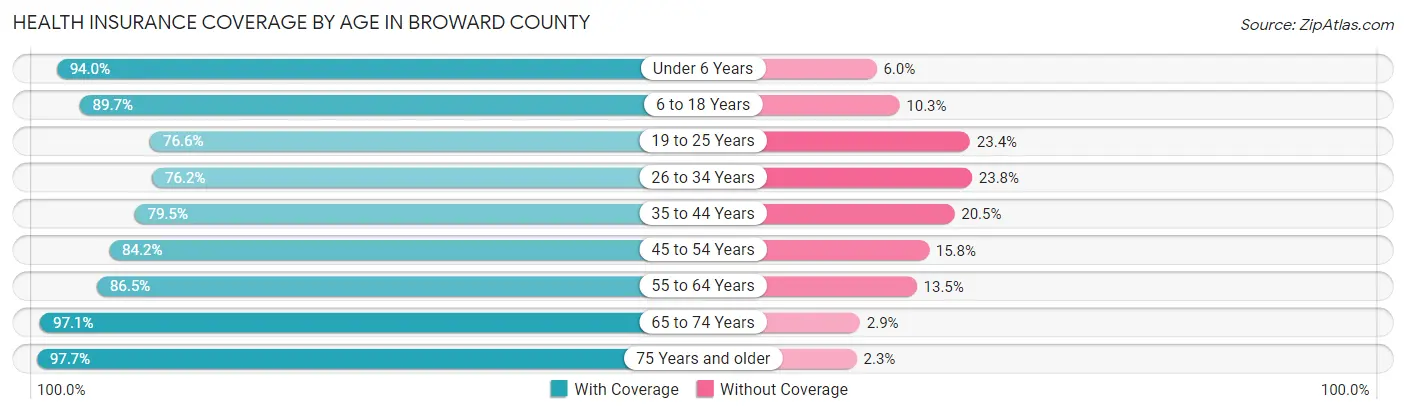
| Age Bracket | With Coverage | Without Coverage |
| Under 6 Years | 119,965 (94.0%) | 7,654 (6.0%) |
| 6 to 18 Years | 269,500 (89.7%) | 30,858 (10.3%) |
| 19 to 25 Years | 115,661 (76.6%) | 35,374 (23.4%) |
| 26 to 34 Years | 174,707 (76.2%) | 54,548 (23.8%) |
| 35 to 44 Years | 207,558 (79.5%) | 53,552 (20.5%) |
| 45 to 54 Years | 223,161 (84.2%) | 41,744 (15.8%) |
| 55 to 64 Years | 228,338 (86.5%) | 35,620 (13.5%) |
| 65 to 74 Years | 181,023 (97.1%) | 5,397 (2.9%) |
| 75 Years and older | 139,467 (97.7%) | 3,269 (2.3%) |
| Total | 1,659,380 (86.1%) | 268,016 (13.9%) |
Health Insurance Coverage by Citizenship Status in Broward County
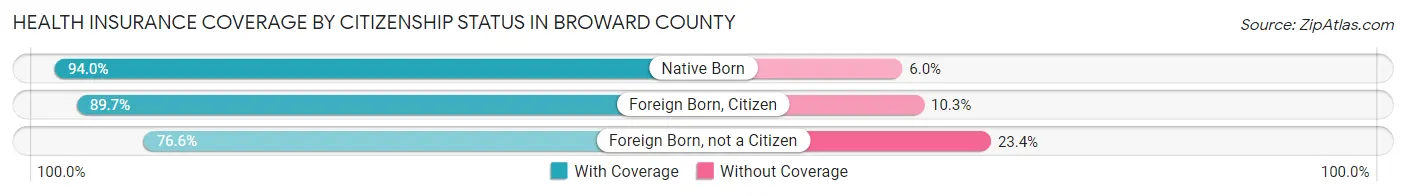
| Citizenship Status | With Coverage | Without Coverage |
| Native Born | 119,965 (94.0%) | 7,654 (6.0%) |
| Foreign Born, Citizen | 269,500 (89.7%) | 30,858 (10.3%) |
| Foreign Born, not a Citizen | 115,661 (76.6%) | 35,374 (23.4%) |
Health Insurance Coverage by Household Income in Broward County
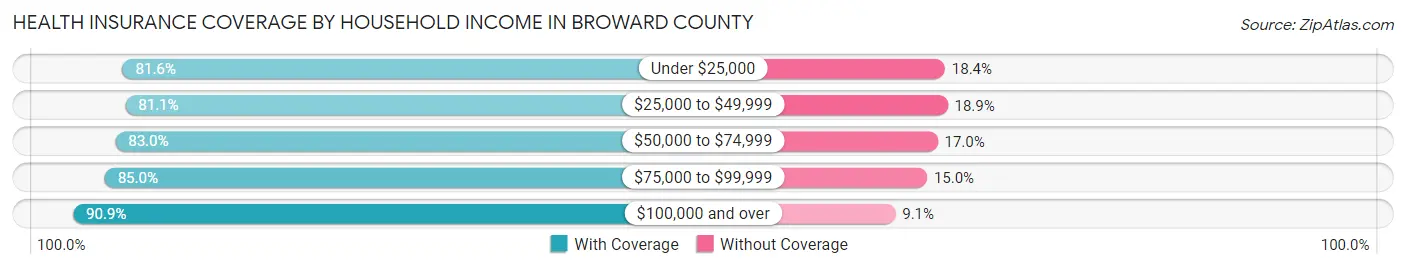
| Household Income | With Coverage | Without Coverage |
| Under $25,000 | 175,877 (81.6%) | 39,578 (18.4%) |
| $25,000 to $49,999 | 258,224 (81.1%) | 60,105 (18.9%) |
| $50,000 to $74,999 | 260,743 (83.0%) | 53,397 (17.0%) |
| $75,000 to $99,999 | 225,801 (85.0%) | 39,920 (15.0%) |
| $100,000 and over | 733,997 (90.9%) | 73,265 (9.1%) |
Public vs Private Health Insurance Coverage by Age in Broward County
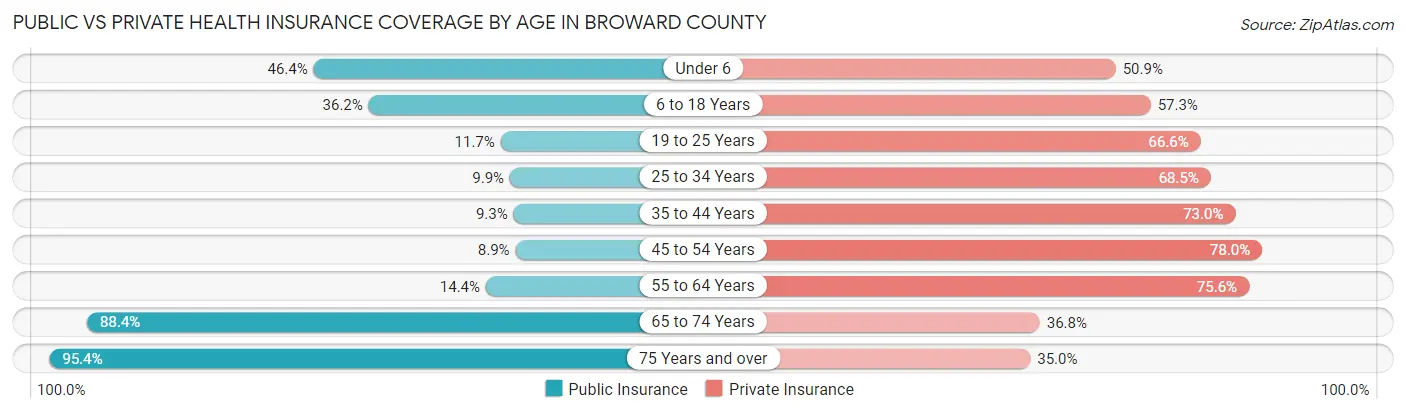
| Age Bracket | Public Insurance | Private Insurance |
| Under 6 | 59,171 (46.4%) | 64,894 (50.8%) |
| 6 to 18 Years | 108,577 (36.1%) | 172,232 (57.3%) |
| 19 to 25 Years | 17,598 (11.7%) | 100,577 (66.6%) |
| 25 to 34 Years | 22,730 (9.9%) | 156,975 (68.5%) |
| 35 to 44 Years | 24,151 (9.2%) | 190,656 (73.0%) |
| 45 to 54 Years | 23,585 (8.9%) | 206,654 (78.0%) |
| 55 to 64 Years | 37,950 (14.4%) | 199,436 (75.6%) |
| 65 to 74 Years | 164,848 (88.4%) | 68,534 (36.8%) |
| 75 Years and over | 136,191 (95.4%) | 49,938 (35.0%) |
| Total | 594,801 (30.9%) | 1,209,896 (62.8%) |
Disability Status by Sex by Age in Broward County
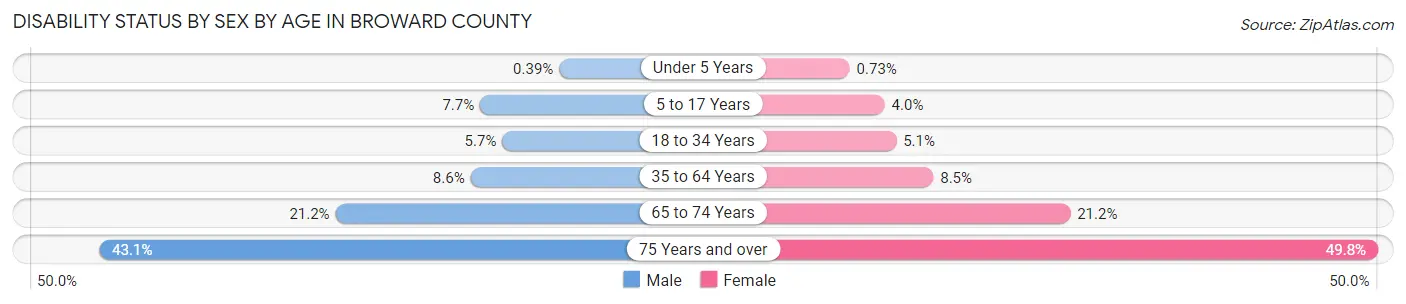
| Age Bracket | Male | Female |
| Under 5 Years | 211 (0.4%) | 385 (0.7%) |
| 5 to 17 Years | 11,677 (7.7%) | 5,820 (4.0%) |
| 18 to 34 Years | 11,463 (5.7%) | 10,166 (5.1%) |
| 35 to 64 Years | 33,680 (8.6%) | 33,915 (8.5%) |
| 65 to 74 Years | 18,494 (21.1%) | 20,988 (21.2%) |
| 75 Years and over | 25,476 (43.1%) | 41,601 (49.7%) |
Disability Class by Sex by Age in Broward County
Disability Class: Hearing Difficulty
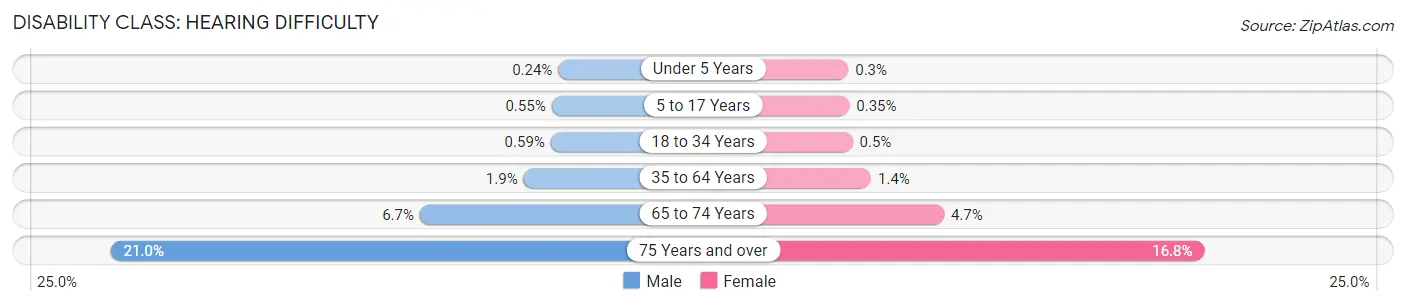
| Age Bracket | Male | Female |
| Under 5 Years | 131 (0.2%) | 160 (0.3%) |
| 5 to 17 Years | 828 (0.5%) | 506 (0.4%) |
| 18 to 34 Years | 1,199 (0.6%) | 1,016 (0.5%) |
| 35 to 64 Years | 7,228 (1.8%) | 5,429 (1.4%) |
| 65 to 74 Years | 5,822 (6.7%) | 4,696 (4.7%) |
| 75 Years and over | 12,423 (21.0%) | 14,060 (16.8%) |
Disability Class: Vision Difficulty
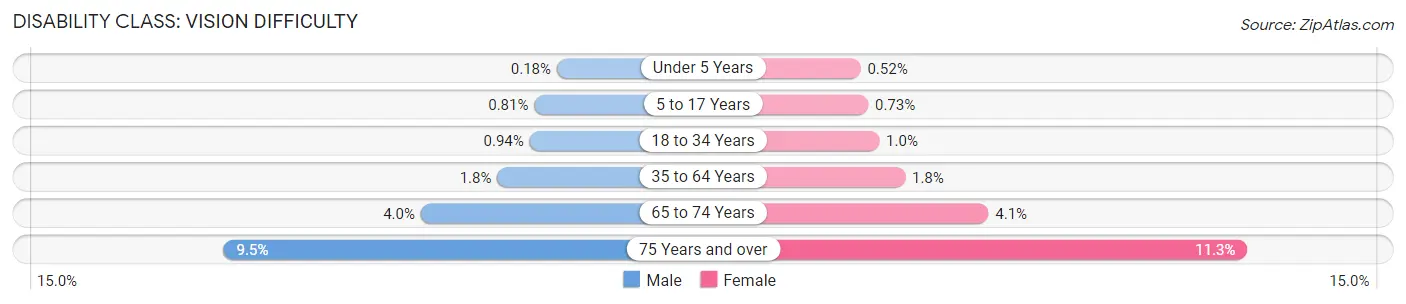
| Age Bracket | Male | Female |
| Under 5 Years | 100 (0.2%) | 272 (0.5%) |
| 5 to 17 Years | 1,221 (0.8%) | 1,073 (0.7%) |
| 18 to 34 Years | 1,901 (0.9%) | 2,093 (1.0%) |
| 35 to 64 Years | 7,201 (1.8%) | 7,029 (1.8%) |
| 65 to 74 Years | 3,475 (4.0%) | 4,037 (4.1%) |
| 75 Years and over | 5,592 (9.5%) | 9,444 (11.3%) |
Disability Class: Cognitive Difficulty
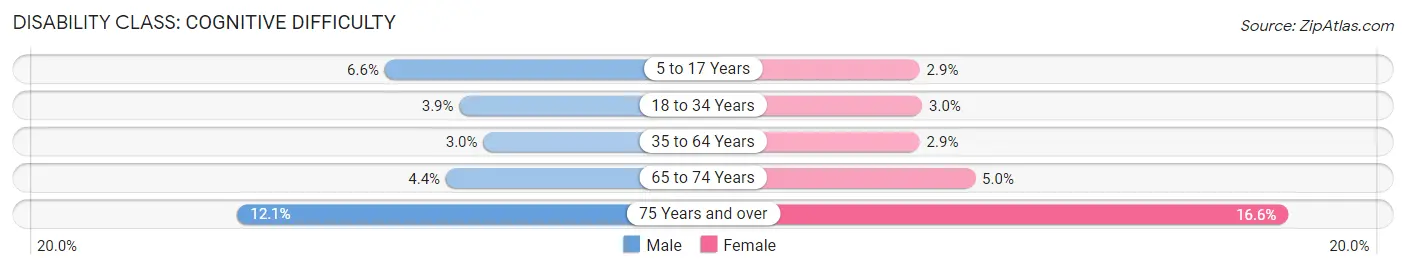
| Age Bracket | Male | Female |
| 5 to 17 Years | 10,019 (6.6%) | 4,225 (2.9%) |
| 18 to 34 Years | 7,808 (3.9%) | 6,010 (3.0%) |
| 35 to 64 Years | 11,591 (3.0%) | 11,558 (2.9%) |
| 65 to 74 Years | 3,813 (4.4%) | 4,899 (5.0%) |
| 75 Years and over | 7,153 (12.1%) | 13,853 (16.6%) |
Disability Class: Ambulatory Difficulty
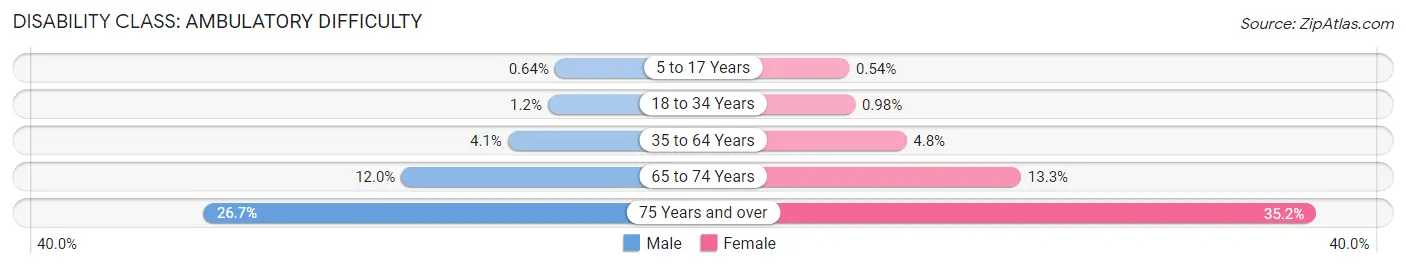
| Age Bracket | Male | Female |
| 5 to 17 Years | 969 (0.6%) | 794 (0.5%) |
| 18 to 34 Years | 2,351 (1.2%) | 1,966 (1.0%) |
| 35 to 64 Years | 16,110 (4.1%) | 19,119 (4.8%) |
| 65 to 74 Years | 10,530 (12.0%) | 13,167 (13.3%) |
| 75 Years and over | 15,777 (26.7%) | 29,437 (35.2%) |
Disability Class: Self-Care Difficulty
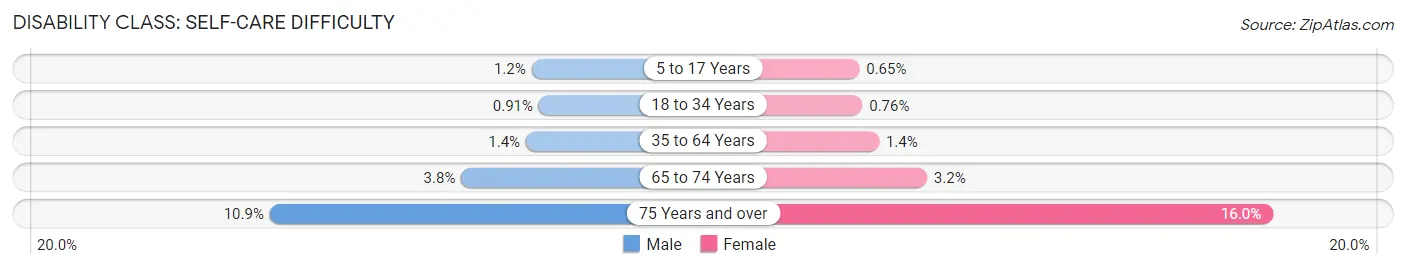
| Age Bracket | Male | Female |
| 5 to 17 Years | 1,779 (1.2%) | 948 (0.6%) |
| 18 to 34 Years | 1,836 (0.9%) | 1,535 (0.8%) |
| 35 to 64 Years | 5,421 (1.4%) | 5,500 (1.4%) |
| 65 to 74 Years | 3,312 (3.8%) | 3,130 (3.2%) |
| 75 Years and over | 6,444 (10.9%) | 13,390 (16.0%) |
Technology Access in Broward County
Computing Device Access in Broward County
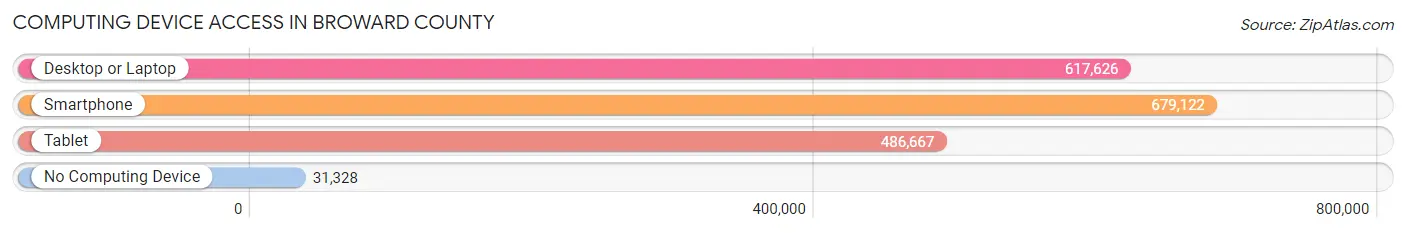
| Device Type | # Households | % Households |
| Desktop or Laptop | 617,626 | 83.2% |
| Smartphone | 679,122 | 91.5% |
| Tablet | 486,667 | 65.6% |
| No Computing Device | 31,328 | 4.2% |
| Total | 741,973 | 100.0% |
Internet Access in Broward County
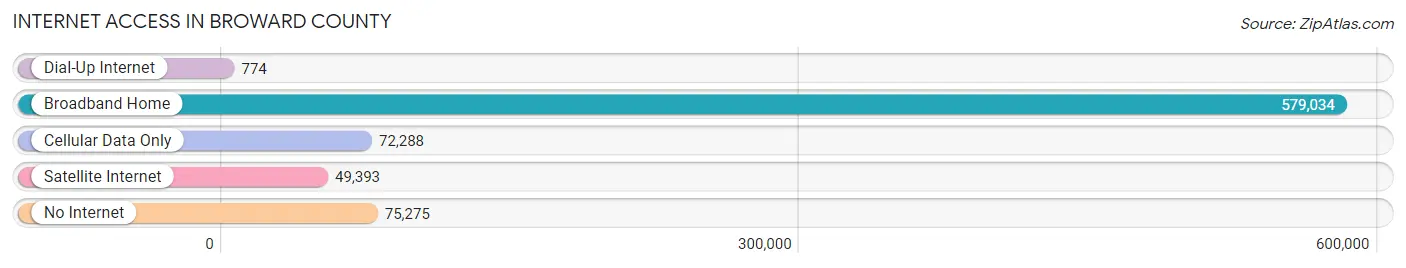
| Internet Type | # Households | % Households |
| Dial-Up Internet | 774 | 0.1% |
| Broadband Home | 579,034 | 78.0% |
| Cellular Data Only | 72,288 | 9.7% |
| Satellite Internet | 49,393 | 6.7% |
| No Internet | 75,275 | 10.2% |
| Total | 741,973 | 100.0% |
Broward County Summary
Broward County, Florida is located in the southeastern part of the state and is the second most populous county in the state. It is bordered by Palm Beach County to the north, Miami-Dade County to the south, and the Atlantic Ocean to the east. The county seat is Fort Lauderdale, and the largest city is Hollywood.
Geography
Broward County covers an area of 1,322 square miles, making it the 18th largest county in the United States. It is located in the southeastern part of the state and is bordered by Palm Beach County to the north, Miami-Dade County to the south, and the Atlantic Ocean to the east. The county is divided into 31 municipalities, including the cities of Fort Lauderdale, Hollywood, Pembroke Pines, and Miramar. The county is also home to several unincorporated communities, such as Weston, Davie, and Plantation.
The county is home to several bodies of water, including the Atlantic Ocean, the Intracoastal Waterway, and the Everglades. The county is also home to several parks, including the Everglades National Park, the John U. Lloyd Beach State Park, and the Hugh Taylor Birch State Park.
History
The area that is now Broward County was originally inhabited by the Tequesta and Seminole Native American tribes. The area was explored by Spanish explorers in the 16th century and was later claimed by the United States in 1821. The area was part of Dade County until 1915, when it was split off to form Broward County. The county was named after Napoleon Bonaparte Broward, who served as the 19th Governor of Florida from 1905 to 1909.
Economy
The economy of Broward County is largely driven by tourism, with the county being home to several popular tourist destinations, such as Fort Lauderdale Beach, Hollywood Beach, and the Everglades National Park. The county is also home to several major corporations, such as AutoNation, Citrix Systems, and Spirit Airlines. The county is also home to several major airports, including Fort Lauderdale-Hollywood International Airport and Miami International Airport.
Demographics
As of the 2020 census, Broward County had a population of 1,951,260. The population is made up of a diverse mix of ethnicities, with the largest groups being White (54.2%), Hispanic or Latino (30.2%), and Black or African American (14.2%). The median household income in the county is $60,845, and the median home value is $272,400.
Conclusion
Broward County, Florida is a diverse and vibrant county located in the southeastern part of the state. It is home to several popular tourist destinations, major corporations, and airports. The county has a population of 1,951,260, with the largest ethnic groups being White, Hispanic or Latino, and Black or African American. The economy of the county is largely driven by tourism, and the median household income is $60,845.
Common Questions
What is Per Capita Income in Broward County?
Per Capita income in Broward County is $39,753.
What is the Median Family Income in Broward County?
Median Family Income in Broward County is $83,825.
What is the Median Household income in Broward County?
Median Household Income in Broward County is $70,331.
What is Income or Wage Gap in Broward County?
Income or Wage Gap in Broward County is 21.1%.
Women in Broward County earn 78.9 cents for every dollar earned by a man.
What is Family Income Deficit in Broward County?
Family Income Deficit in Broward County is $10,273.
Families that are below poverty line in Broward County earn $10,273 less on average than the poverty threshold level.
What is Inequality or Gini Index in Broward County?
Inequality or Gini Index in Broward County is 0.49.
What is the Total Population of Broward County?
Total Population of Broward County is 1,940,907.
What is the Total Male Population of Broward County?
Total Male Population of Broward County is 952,900.
What is the Total Female Population of Broward County?
Total Female Population of Broward County is 988,007.
What is the Ratio of Males per 100 Females in Broward County?
There are 96.45 Males per 100 Females in Broward County.
What is the Ratio of Females per 100 Males in Broward County?
There are 103.68 Females per 100 Males in Broward County.
What is the Median Population Age in Broward County?
Median Population Age in Broward County is 41.0 Years.
What is the Average Family Size in Broward County
Average Family Size in Broward County is 3.2 People.
What is the Average Household Size in Broward County
Average Household Size in Broward County is 2.6 People.
How Large is the Labor Force in Broward County?
There are 1,046,351 People in the Labor Forcein in Broward County.
What is the Percentage of People in the Labor Force in Broward County?
66.1% of People are in the Labor Force in Broward County.
What is the Unemployment Rate in Broward County?
Unemployment Rate in Broward County is 5.8%.