Miami-Dade County, FL Map & Demographics
Miami-Dade County Map
Miami-Dade County Overview
$35,563
PER CAPITA INCOME
$71,621
AVG FAMILY INCOME
$64,215
AVG HOUSEHOLD INCOME
21.8%
WAGE / INCOME GAP [ % ]
78.2¢/ $1
WAGE / INCOME GAP [ $ ]
$9,746
FAMILY INCOME DEFICIT
0.52
INEQUALITY / GINI INDEX
2,688,237
TOTAL POPULATION
1,318,559
MALE POPULATION
1,369,678
FEMALE POPULATION
96.27
MALES / 100 FEMALES
103.88
FEMALES / 100 MALES
40.6
MEDIAN AGE
3.3
AVG FAMILY SIZE
2.8
AVG HOUSEHOLD SIZE
1,410,620
LABOR FORCE [ PEOPLE ]
63.8%
PERCENT IN LABOR FORCE
4.6%
UNEMPLOYMENT RATE
Income in Miami-Dade County
Income Overview in Miami-Dade County
Per Capita Income in Miami-Dade County is $35,563, while median incomes of families and households are $71,621 and $64,215 respectively.
| Characteristic | Number | Measure |
| Per Capita Income | 2,688,237 | $35,563 |
| Median Family Income | 650,892 | $71,621 |
| Mean Family Income | 650,892 | $107,121 |
| Median Household Income | 952,680 | $64,215 |
| Mean Household Income | 952,680 | $96,595 |
| Income Deficit | 650,892 | $9,746 |
| Wage / Income Gap (%) | 2,688,237 | 21.80% |
| Wage / Income Gap ($) | 2,688,237 | 78.20¢ per $1 |
| Gini / Inequality Index | 2,688,237 | 0.52 |
Earnings by Sex in Miami-Dade County
Average Earnings in Miami-Dade County are $35,899, $40,529 for men and $31,692 for women, a difference of 21.8%.
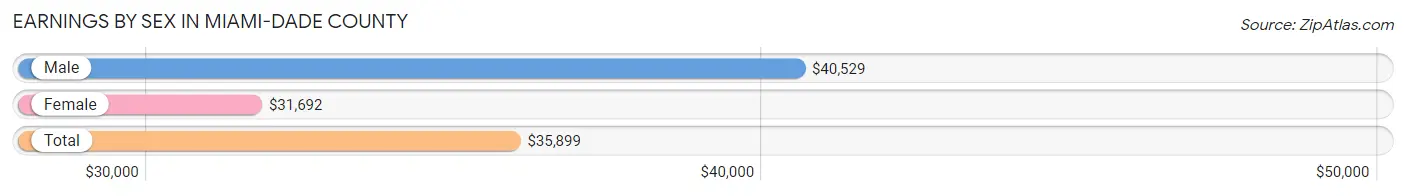
| Sex | Number | Average Earnings |
| Male | 762,200 (53.2%) | $40,529 |
| Female | 670,999 (46.8%) | $31,692 |
| Total | 1,433,199 (100.0%) | $35,899 |
Earnings by Sex by Income Bracket in Miami-Dade County
The most common earnings brackets in Miami-Dade County are $100,000+ for men (114,241 | 15.0%) and $25,000 to $29,999 for women (58,875 | 8.8%).
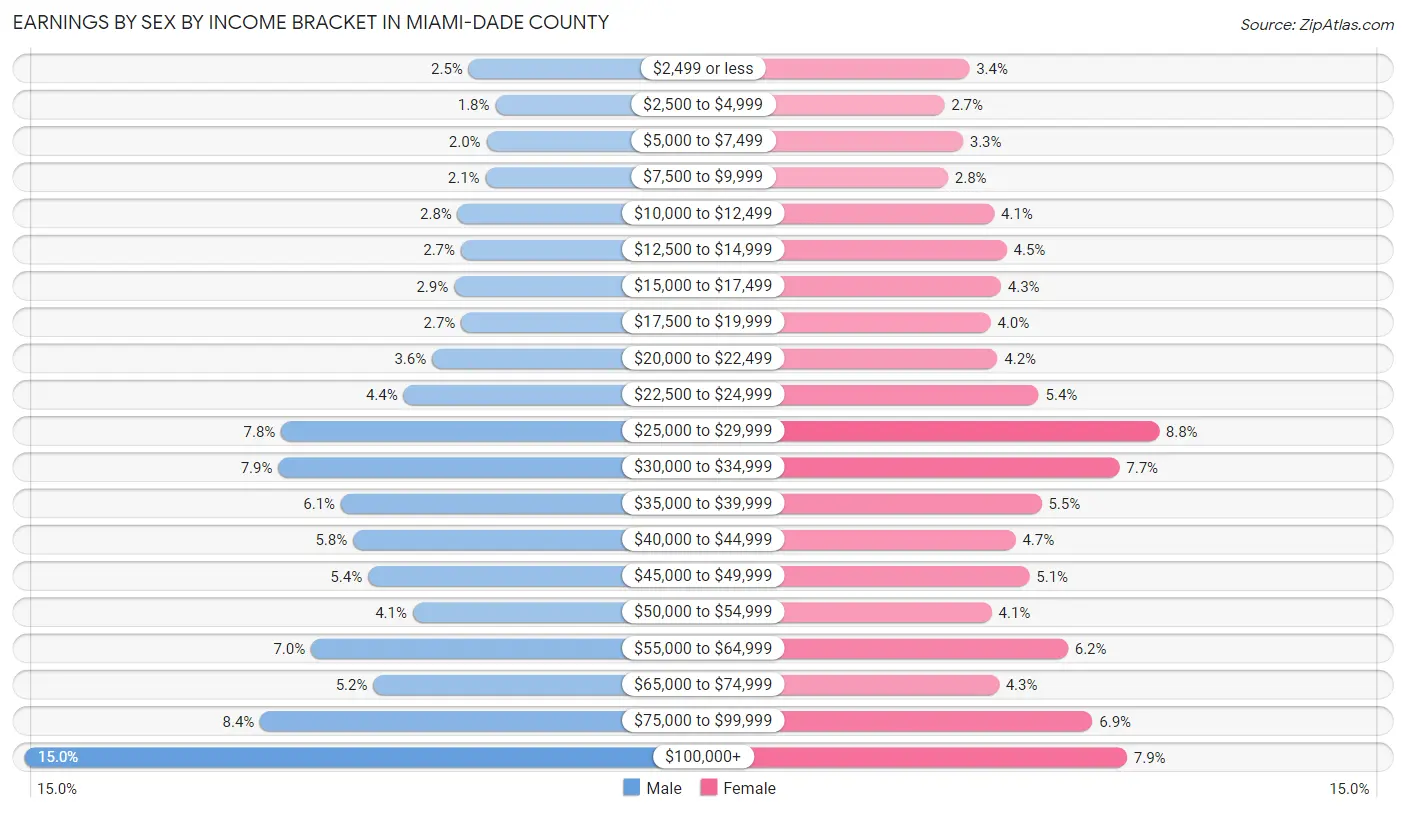
| Income | Male | Female |
| $2,499 or less | 19,209 (2.5%) | 23,098 (3.4%) |
| $2,500 to $4,999 | 13,463 (1.8%) | 18,394 (2.7%) |
| $5,000 to $7,499 | 15,389 (2.0%) | 21,889 (3.3%) |
| $7,500 to $9,999 | 15,597 (2.1%) | 19,087 (2.8%) |
| $10,000 to $12,499 | 21,584 (2.8%) | 27,779 (4.1%) |
| $12,500 to $14,999 | 20,900 (2.7%) | 30,102 (4.5%) |
| $15,000 to $17,499 | 22,352 (2.9%) | 29,034 (4.3%) |
| $17,500 to $19,999 | 20,809 (2.7%) | 27,080 (4.0%) |
| $20,000 to $22,499 | 27,094 (3.5%) | 28,410 (4.2%) |
| $22,500 to $24,999 | 33,131 (4.3%) | 36,159 (5.4%) |
| $25,000 to $29,999 | 59,361 (7.8%) | 58,875 (8.8%) |
| $30,000 to $34,999 | 59,961 (7.9%) | 51,406 (7.7%) |
| $35,000 to $39,999 | 46,599 (6.1%) | 36,714 (5.5%) |
| $40,000 to $44,999 | 44,016 (5.8%) | 31,827 (4.7%) |
| $45,000 to $49,999 | 40,815 (5.3%) | 34,391 (5.1%) |
| $50,000 to $54,999 | 31,149 (4.1%) | 27,278 (4.1%) |
| $55,000 to $64,999 | 53,006 (7.0%) | 41,647 (6.2%) |
| $65,000 to $74,999 | 39,620 (5.2%) | 28,678 (4.3%) |
| $75,000 to $99,999 | 63,904 (8.4%) | 46,310 (6.9%) |
| $100,000+ | 114,241 (15.0%) | 52,841 (7.9%) |
| Total | 762,200 (100.0%) | 670,999 (100.0%) |
Earnings by Sex by Educational Attainment in Miami-Dade County
Average earnings in Miami-Dade County are $43,774 for men and $34,119 for women, a difference of 22.1%. Men with an educational attainment of graduate degree enjoy the highest average annual earnings of $87,270, while those with less than high school education earn the least with $30,290. Women with an educational attainment of graduate degree earn the most with the average annual earnings of $62,936, while those with less than high school education have the smallest earnings of $21,662.
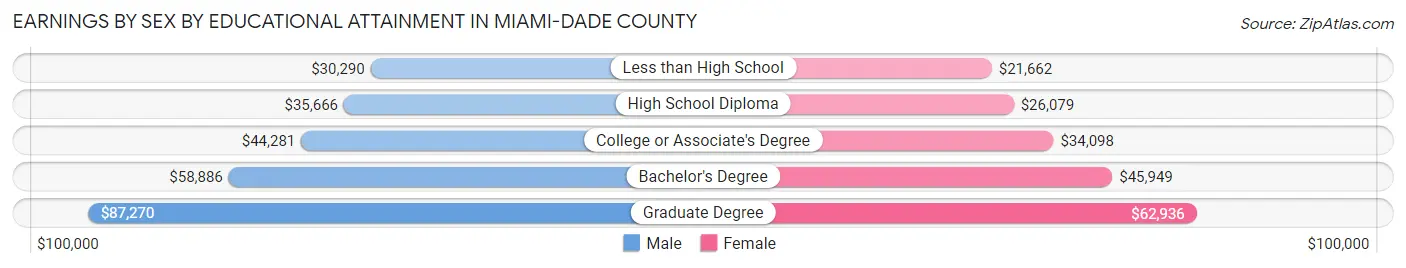
| Educational Attainment | Male Income | Female Income |
| Less than High School | $30,290 | $21,662 |
| High School Diploma | $35,666 | $26,079 |
| College or Associate's Degree | $44,281 | $34,098 |
| Bachelor's Degree | $58,886 | $45,949 |
| Graduate Degree | $87,270 | $62,936 |
| Total | $43,774 | $34,119 |
Family Income in Miami-Dade County
Family Income Brackets in Miami-Dade County
According to the Miami-Dade County family income data, there are 114,557 families falling into the $50,000 to $74,999 income range, which is the most common income bracket and makes up 17.6% of all families. Conversely, the $10,000 to $14,999 income bracket is the least frequent group with only 16,923 families (2.6%) belonging to this category.
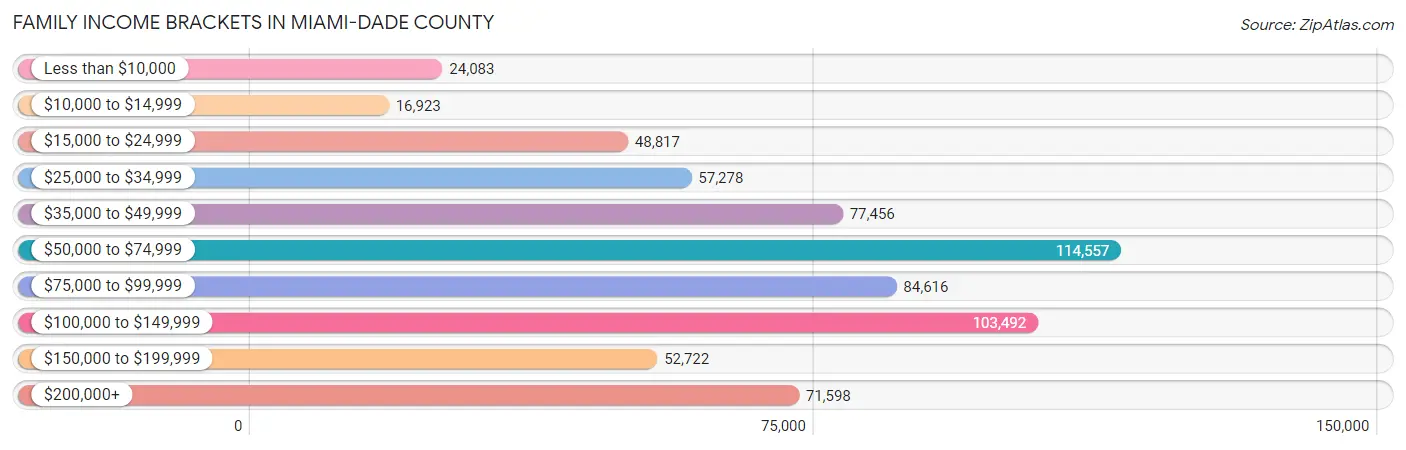
| Income Bracket | # Families | % Families |
| Less than $10,000 | 24,083 | 3.7% |
| $10,000 to $14,999 | 16,923 | 2.6% |
| $15,000 to $24,999 | 48,817 | 7.5% |
| $25,000 to $34,999 | 57,278 | 8.8% |
| $35,000 to $49,999 | 77,456 | 11.9% |
| $50,000 to $74,999 | 114,557 | 17.6% |
| $75,000 to $99,999 | 84,616 | 13.0% |
| $100,000 to $149,999 | 103,492 | 15.9% |
| $150,000 to $199,999 | 52,722 | 8.1% |
| $200,000+ | 71,598 | 11.0% |
Family Income by Famaliy Size in Miami-Dade County
7+ person families (10,631 | 1.6%) account for the highest median family income in Miami-Dade County with $111,318 per family, while 2-person families (262,411 | 40.3%) have the highest median income of $28,031 per family member.
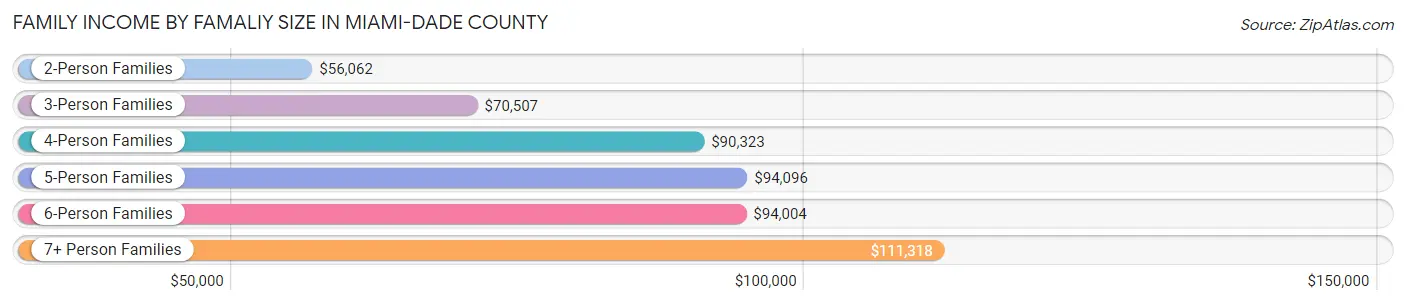
| Income Bracket | # Families | Median Income |
| 2-Person Families | 262,411 (40.3%) | $56,062 |
| 3-Person Families | 172,576 (26.5%) | $70,507 |
| 4-Person Families | 130,601 (20.1%) | $90,323 |
| 5-Person Families | 54,932 (8.4%) | $94,096 |
| 6-Person Families | 19,741 (3.0%) | $94,004 |
| 7+ Person Families | 10,631 (1.6%) | $111,318 |
| Total | 650,892 (100.0%) | $71,621 |
Family Income by Number of Earners in Miami-Dade County
The median family income in Miami-Dade County is $71,621, with families comprising 3+ earners (93,664) having the highest median family income of $119,139, while families with no earners (76,780) have the lowest median family income of $23,977, accounting for 14.4% and 11.8% of families, respectively.
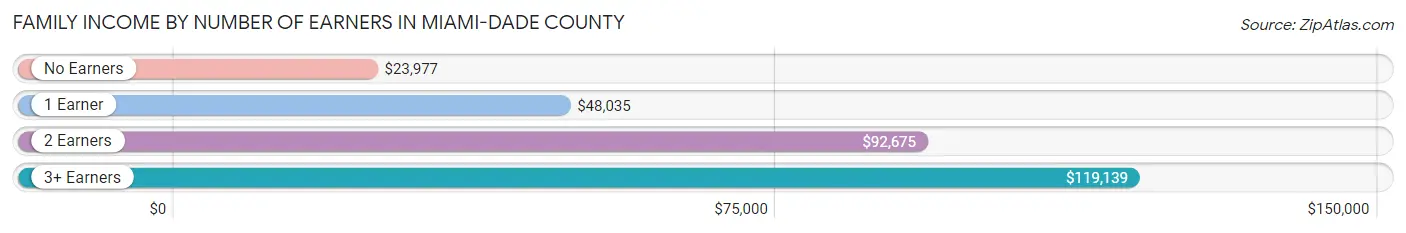
| Number of Earners | # Families | Median Income |
| No Earners | 76,780 (11.8%) | $23,977 |
| 1 Earner | 219,145 (33.7%) | $48,035 |
| 2 Earners | 261,303 (40.2%) | $92,675 |
| 3+ Earners | 93,664 (14.4%) | $119,139 |
| Total | 650,892 (100.0%) | $71,621 |
Household Income in Miami-Dade County
Household Income Brackets in Miami-Dade County
With 157,192 households falling in the category, the $50,000 to $74,999 income range is the most frequent in Miami-Dade County, accounting for 16.5% of all households. In contrast, only 51,445 households (5.4%) fall into the $10,000 to $14,999 income bracket, making it the least populous group.
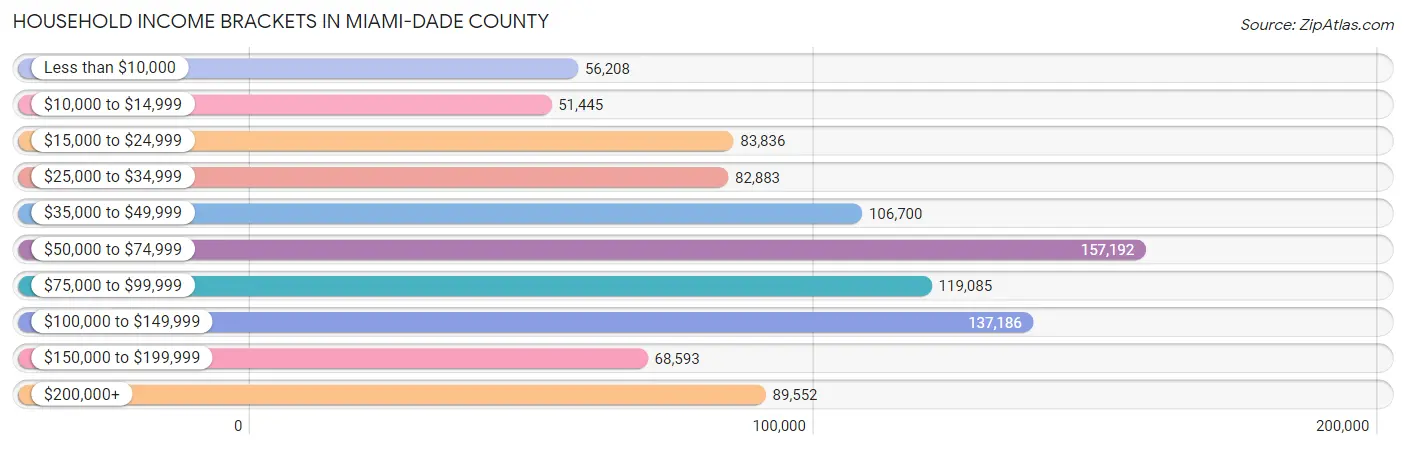
| Income Bracket | # Households | % Households |
| Less than $10,000 | 56,208 | 5.9% |
| $10,000 to $14,999 | 51,445 | 5.4% |
| $15,000 to $24,999 | 83,836 | 8.8% |
| $25,000 to $34,999 | 82,883 | 8.7% |
| $35,000 to $49,999 | 106,700 | 11.2% |
| $50,000 to $74,999 | 157,192 | 16.5% |
| $75,000 to $99,999 | 119,085 | 12.5% |
| $100,000 to $149,999 | 137,186 | 14.4% |
| $150,000 to $199,999 | 68,593 | 7.2% |
| $200,000+ | 89,552 | 9.4% |
Household Income by Householder Age in Miami-Dade County
The median household income in Miami-Dade County is $64,215, with the highest median household income of $75,382 found in the 45 to 64 years age bracket for the primary householder. A total of 388,484 households (40.8%) fall into this category. Meanwhile, the 65+ years age bracket for the primary householder has the lowest median household income of $36,559, with 241,730 households (25.4%) in this group.
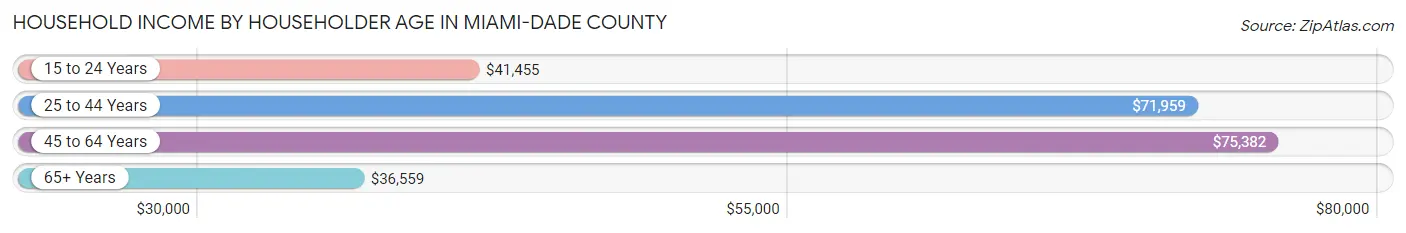
| Income Bracket | # Households | Median Income |
| 15 to 24 Years | 19,612 (2.1%) | $41,455 |
| 25 to 44 Years | 302,854 (31.8%) | $71,959 |
| 45 to 64 Years | 388,484 (40.8%) | $75,382 |
| 65+ Years | 241,730 (25.4%) | $36,559 |
| Total | 952,680 (100.0%) | $64,215 |
Poverty in Miami-Dade County
Income Below Poverty by Sex and Age in Miami-Dade County
With 13.7% poverty level for males and 16.8% for females among the residents of Miami-Dade County, 15 year old males and 75 year old and over females are the most vulnerable to poverty, with 3,409 males (22.7%) and 31,442 females (25.8%) in their respective age groups living below the poverty level.
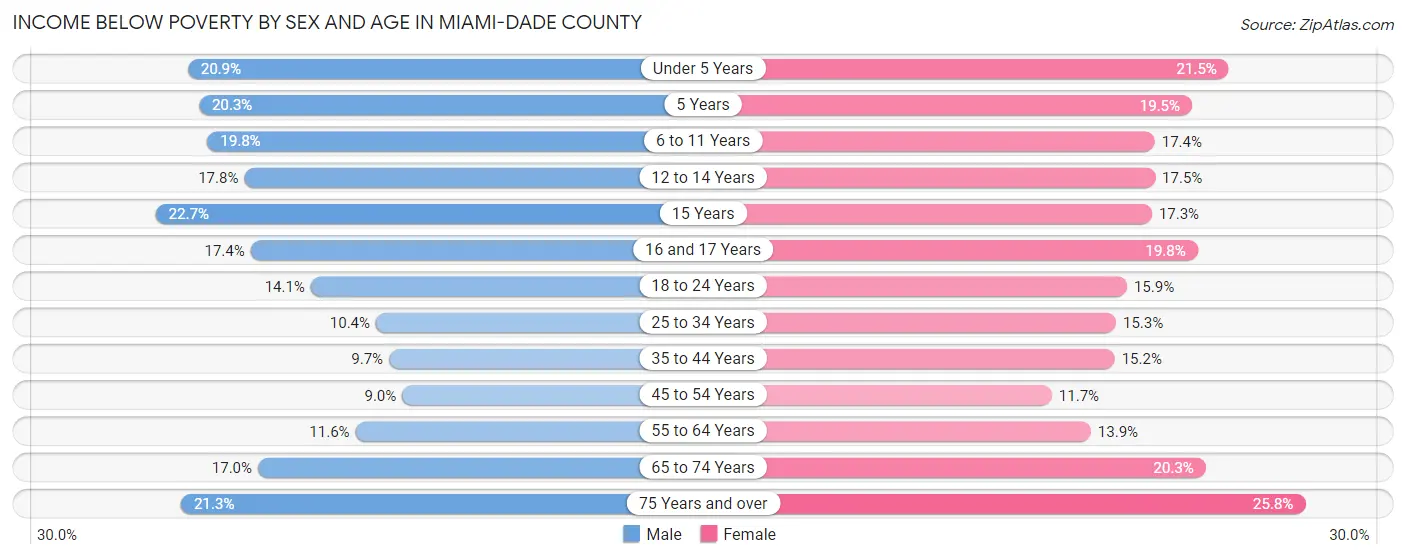
| Age Bracket | Male | Female |
| Under 5 Years | 15,721 (20.9%) | 15,449 (21.5%) |
| 5 Years | 2,879 (20.3%) | 2,560 (19.5%) |
| 6 to 11 Years | 17,420 (19.8%) | 15,006 (17.4%) |
| 12 to 14 Years | 8,533 (17.8%) | 7,855 (17.4%) |
| 15 Years | 3,409 (22.7%) | 2,619 (17.3%) |
| 16 and 17 Years | 5,615 (17.4%) | 6,068 (19.8%) |
| 18 to 24 Years | 15,617 (14.1%) | 16,606 (15.9%) |
| 25 to 34 Years | 19,458 (10.4%) | 27,363 (15.3%) |
| 35 to 44 Years | 17,932 (9.7%) | 27,453 (15.2%) |
| 45 to 54 Years | 17,373 (9.0%) | 22,427 (11.7%) |
| 55 to 64 Years | 19,153 (11.6%) | 24,903 (13.9%) |
| 65 to 74 Years | 18,005 (17.0%) | 26,785 (20.3%) |
| 75 Years and over | 16,346 (21.3%) | 31,442 (25.8%) |
| Total | 177,461 (13.7%) | 226,536 (16.8%) |
Income Above Poverty by Sex and Age in Miami-Dade County
According to the poverty statistics in Miami-Dade County, males aged 45 to 54 years and females aged 45 to 54 years are the age groups that are most secure financially, with 91.0% of males and 88.3% of females in these age groups living above the poverty line.
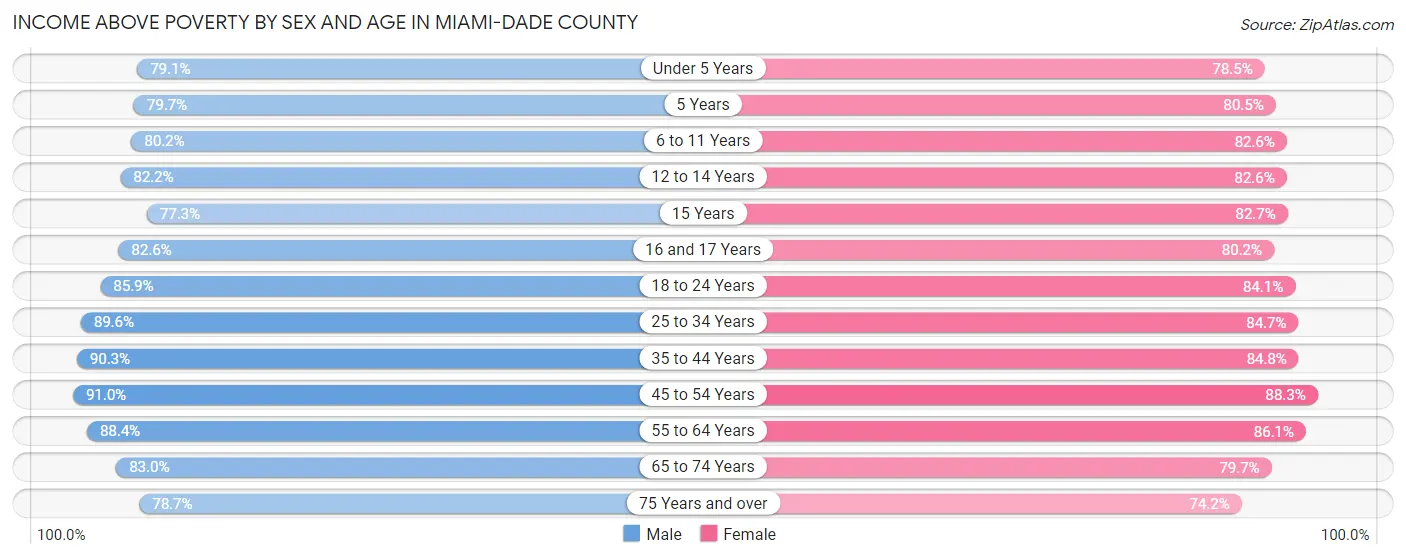
| Age Bracket | Male | Female |
| Under 5 Years | 59,472 (79.1%) | 56,281 (78.5%) |
| 5 Years | 11,309 (79.7%) | 10,577 (80.5%) |
| 6 to 11 Years | 70,463 (80.2%) | 71,091 (82.6%) |
| 12 to 14 Years | 39,499 (82.2%) | 37,159 (82.6%) |
| 15 Years | 11,609 (77.3%) | 12,542 (82.7%) |
| 16 and 17 Years | 26,625 (82.6%) | 24,559 (80.2%) |
| 18 to 24 Years | 95,378 (85.9%) | 87,934 (84.1%) |
| 25 to 34 Years | 166,842 (89.6%) | 151,856 (84.7%) |
| 35 to 44 Years | 166,764 (90.3%) | 153,206 (84.8%) |
| 45 to 54 Years | 176,148 (91.0%) | 169,317 (88.3%) |
| 55 to 64 Years | 146,287 (88.4%) | 154,654 (86.1%) |
| 65 to 74 Years | 87,848 (83.0%) | 105,446 (79.7%) |
| 75 Years and over | 60,445 (78.7%) | 90,444 (74.2%) |
| Total | 1,118,689 (86.3%) | 1,125,066 (83.2%) |
Income Below Poverty Among Married-Couple Families in Miami-Dade County
The poverty statistics for married-couple families in Miami-Dade County show that 7.9% or 32,369 of the total 409,828 families live below the poverty line. Families with 5 or more children have the highest poverty rate of 27.2%, comprising of 342 families. On the other hand, families with 1 or 2 children have the lowest poverty rate of 7.3%, which includes 11,040 families.
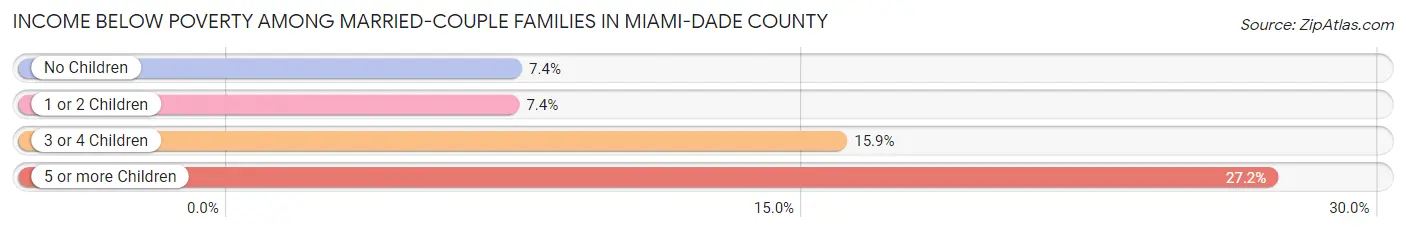
| Children | Above Poverty | Below Poverty |
| No Children | 219,346 (92.6%) | 17,589 (7.4%) |
| 1 or 2 Children | 139,243 (92.6%) | 11,040 (7.3%) |
| 3 or 4 Children | 17,953 (84.1%) | 3,398 (15.9%) |
| 5 or more Children | 917 (72.8%) | 342 (27.2%) |
| Total | 377,459 (92.1%) | 32,369 (7.9%) |
Income Below Poverty Among Single-Parent Households in Miami-Dade County
According to the poverty data in Miami-Dade County, 12.3% or 8,825 single-father households and 21.3% or 36,122 single-mother households are living below the poverty line. Among single-father households, those with 5 or more children have the highest poverty rate, with 23 households (39.0%) experiencing poverty. Likewise, among single-mother households, those with 5 or more children have the highest poverty rate, with 829 households (84.6%) falling below the poverty line.
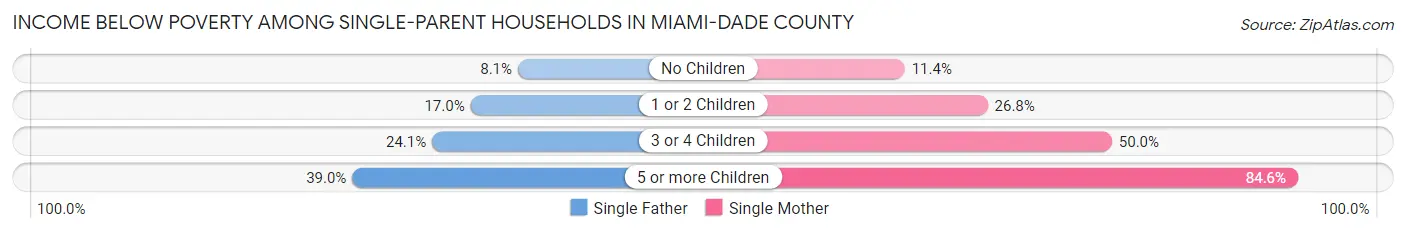
| Children | Single Father | Single Mother |
| No Children | 3,285 (8.1%) | 9,079 (11.4%) |
| 1 or 2 Children | 4,829 (17.0%) | 20,809 (26.8%) |
| 3 or 4 Children | 688 (24.1%) | 5,405 (49.9%) |
| 5 or more Children | 23 (39.0%) | 829 (84.6%) |
| Total | 8,825 (12.3%) | 36,122 (21.3%) |
Income Below Poverty Among Married-Couple vs Single-Parent Households in Miami-Dade County
The poverty data for Miami-Dade County shows that 32,369 of the married-couple family households (7.9%) and 44,947 of the single-parent households (18.6%) are living below the poverty level. Within the married-couple family households, those with 5 or more children have the highest poverty rate, with 342 households (27.2%) falling below the poverty line. Among the single-parent households, those with 5 or more children have the highest poverty rate, with 852 household (82.0%) living below poverty.
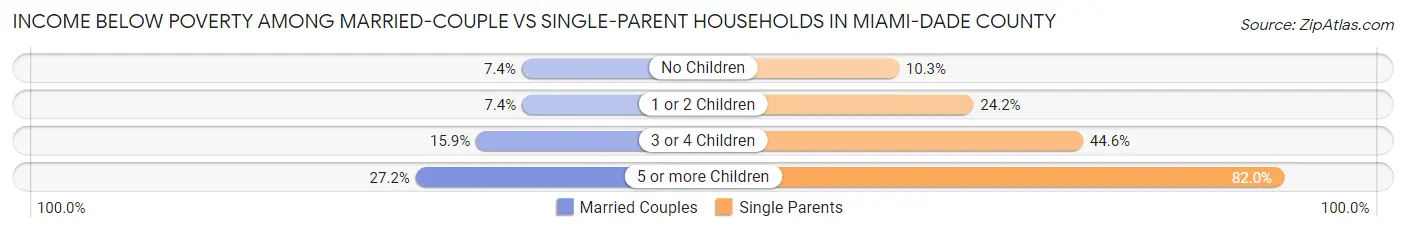
| Children | Married-Couple Families | Single-Parent Households |
| No Children | 17,589 (7.4%) | 12,364 (10.3%) |
| 1 or 2 Children | 11,040 (7.3%) | 25,638 (24.2%) |
| 3 or 4 Children | 3,398 (15.9%) | 6,093 (44.6%) |
| 5 or more Children | 342 (27.2%) | 852 (82.0%) |
| Total | 32,369 (7.9%) | 44,947 (18.6%) |
Race in Miami-Dade County
The most populous races in Miami-Dade County are Hispanic or Latino (1,848,739 | 68.8%), White / Caucasian (1,259,156 | 46.8%), and Two or more Races (783,517 | 29.1%).
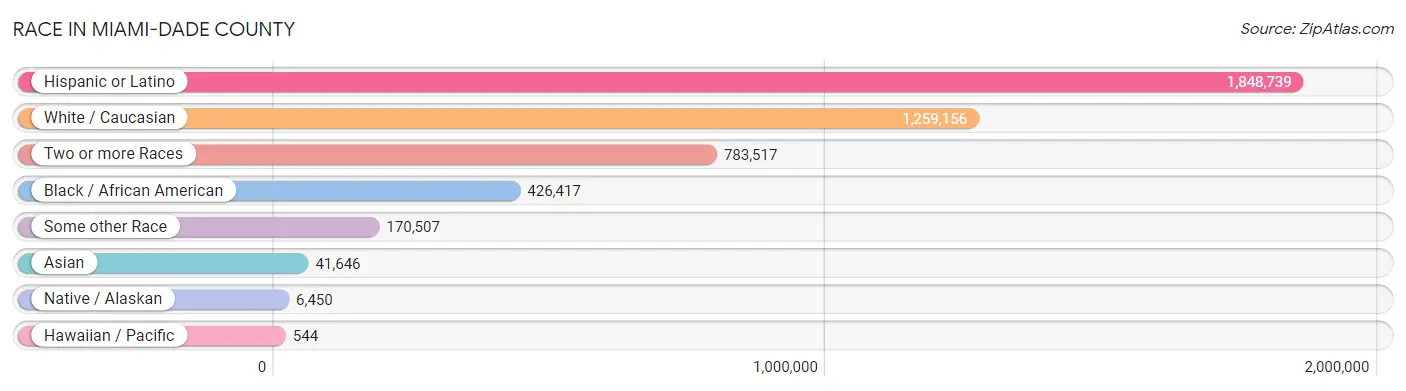
| Race | # Population | % Population |
| Asian | 41,646 | 1.5% |
| Black / African American | 426,417 | 15.9% |
| Hawaiian / Pacific | 544 | 0.0% |
| Hispanic or Latino | 1,848,739 | 68.8% |
| Native / Alaskan | 6,450 | 0.2% |
| White / Caucasian | 1,259,156 | 46.8% |
| Two or more Races | 783,517 | 29.1% |
| Some other Race | 170,507 | 6.3% |
| Total | 2,688,237 | 100.0% |
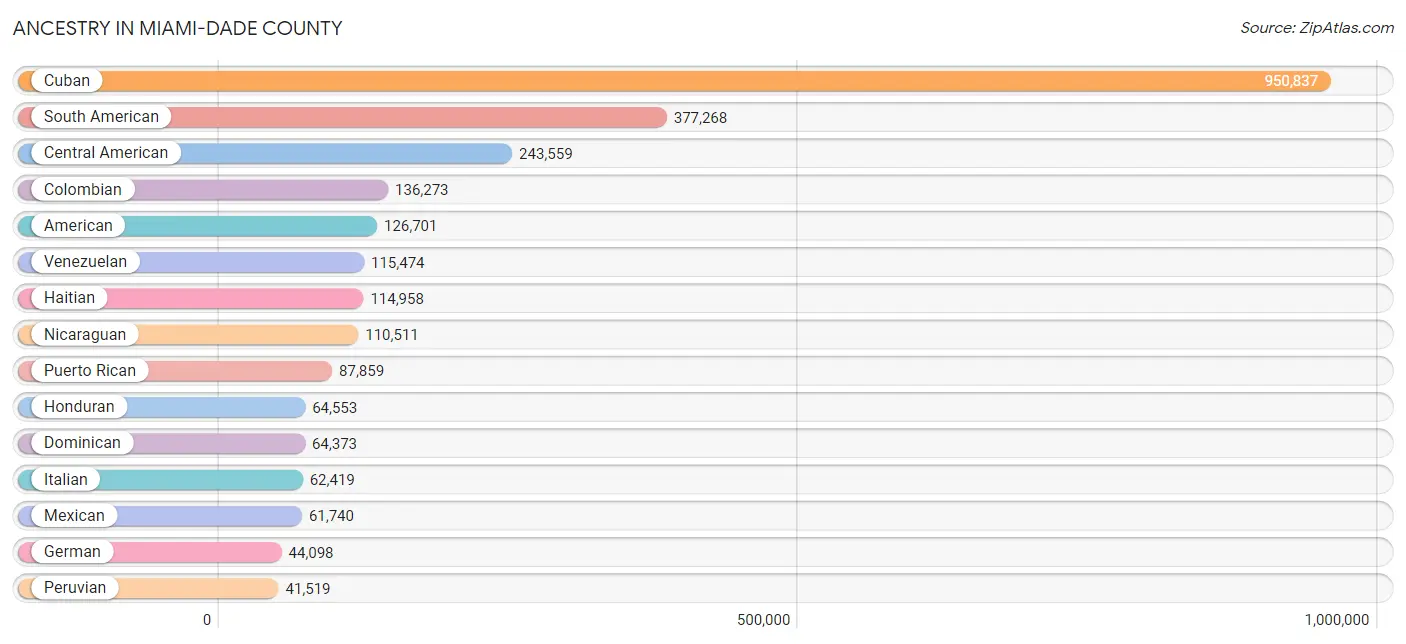
Ancestry in Miami-Dade County
The most populous ancestries reported in Miami-Dade County are Cuban (950,837 | 35.4%), South American (377,268 | 14.0%), Central American (243,559 | 9.1%), Colombian (136,273 | 5.1%), and American (126,701 | 4.7%), together accounting for 68.2% of all Miami-Dade County residents.
| Ancestry | # Population | % Population |
| Afghan | 233 | 0.0% |
| African | 7,992 | 0.3% |
| Alaska Native | 4 | 0.0% |
| Alaskan Athabascan | 5 | 0.0% |
| Albanian | 119 | 0.0% |
| Aleut | 6 | 0.0% |
| Alsatian | 4 | 0.0% |
| American | 126,701 | 4.7% |
| Apache | 224 | 0.0% |
| Arab | 18,852 | 0.7% |
| Arapaho | 131 | 0.0% |
| Argentinean | 34,065 | 1.3% |
| Armenian | 1,162 | 0.0% |
| Assyrian / Chaldean / Syriac | 17 | 0.0% |
| Australian | 370 | 0.0% |
| Austrian | 2,751 | 0.1% |
| Bahamian | 7,671 | 0.3% |
| Bangladeshi | 37 | 0.0% |
| Barbadian | 640 | 0.0% |
| Basque | 880 | 0.0% |
| Belgian | 1,354 | 0.1% |
| Belizean | 647 | 0.0% |
| Bermudan | 108 | 0.0% |
| Bhutanese | 2,518 | 0.1% |
| Blackfeet | 260 | 0.0% |
| Bolivian | 4,704 | 0.2% |
| Brazilian | 14,659 | 0.5% |
| British | 5,367 | 0.2% |
| British West Indian | 2,563 | 0.1% |
| Bulgarian | 806 | 0.0% |
| Burmese | 3,529 | 0.1% |
| Cajun | 47 | 0.0% |
| Cambodian | 38 | 0.0% |
| Canadian | 2,420 | 0.1% |
| Cape Verdean | 107 | 0.0% |
| Celtic | 69 | 0.0% |
| Central American | 243,559 | 9.1% |
| Central American Indian | 4,344 | 0.2% |
| Cherokee | 1,379 | 0.1% |
| Cheyenne | 3 | 0.0% |
| Chickasaw | 71 | 0.0% |
| Chilean | 12,683 | 0.5% |
| Chippewa | 86 | 0.0% |
| Choctaw | 49 | 0.0% |
| Colombian | 136,273 | 5.1% |
| Comanche | 21 | 0.0% |
| Costa Rican | 5,998 | 0.2% |
| Creek | 150 | 0.0% |
| Croatian | 852 | 0.0% |
| Cuban | 950,837 | 35.4% |
| Cypriot | 66 | 0.0% |
| Czech | 1,364 | 0.1% |
| Czechoslovakian | 219 | 0.0% |
| Danish | 1,501 | 0.1% |
| Dominican | 64,373 | 2.4% |
| Dutch | 3,771 | 0.1% |
| Dutch West Indian | 511 | 0.0% |
| Eastern European | 6,133 | 0.2% |
| Ecuadorian | 24,714 | 0.9% |
| Egyptian | 894 | 0.0% |
| English | 28,673 | 1.1% |
| Estonian | 172 | 0.0% |
| Ethiopian | 268 | 0.0% |
| European | 14,087 | 0.5% |
| Filipino | 656 | 0.0% |
| Finnish | 593 | 0.0% |
| French | 21,898 | 0.8% |
| French American Indian | 85 | 0.0% |
| French Canadian | 1,882 | 0.1% |
| German | 44,098 | 1.6% |
| German Russian | 29 | 0.0% |
| Ghanaian | 125 | 0.0% |
| Greek | 4,520 | 0.2% |
| Guamanian / Chamorro | 157 | 0.0% |
| Guatemalan | 29,148 | 1.1% |
| Guyanese | 1,464 | 0.1% |
| Haitian | 114,958 | 4.3% |
| Honduran | 64,553 | 2.4% |
| Hungarian | 3,590 | 0.1% |
| Icelander | 63 | 0.0% |
| Indian (Asian) | 17,868 | 0.7% |
| Indonesian | 273 | 0.0% |
| Inupiat | 13 | 0.0% |
| Iranian | 2,419 | 0.1% |
| Iraqi | 262 | 0.0% |
| Irish | 33,805 | 1.3% |
| Iroquois | 140 | 0.0% |
| Israeli | 4,251 | 0.2% |
| Italian | 62,419 | 2.3% |
| Jamaican | 35,423 | 1.3% |
| Japanese | 359 | 0.0% |
| Jordanian | 886 | 0.0% |
| Kenyan | 150 | 0.0% |
| Korean | 7,861 | 0.3% |
| Laotian | 245 | 0.0% |
| Latvian | 311 | 0.0% |
| Lebanese | 8,064 | 0.3% |
| Lithuanian | 1,430 | 0.1% |
| Lumbee | 31 | 0.0% |
| Luxembourger | 42 | 0.0% |
| Macedonian | 77 | 0.0% |
| Malaysian | 240 | 0.0% |
| Maltese | 152 | 0.0% |
| Mexican | 61,740 | 2.3% |
| Mexican American Indian | 1,089 | 0.0% |
| Mongolian | 120 | 0.0% |
| Moroccan | 1,534 | 0.1% |
| Native Hawaiian | 361 | 0.0% |
| Navajo | 39 | 0.0% |
| New Zealander | 91 | 0.0% |
| Nicaraguan | 110,511 | 4.1% |
| Nigerian | 2,198 | 0.1% |
| Northern European | 560 | 0.0% |
| Norwegian | 2,891 | 0.1% |
| Okinawan | 4 | 0.0% |
| Ottawa | 10 | 0.0% |
| Pakistani | 1,636 | 0.1% |
| Palestinian | 614 | 0.0% |
| Panamanian | 9,472 | 0.4% |
| Paraguayan | 1,388 | 0.1% |
| Pennsylvania German | 59 | 0.0% |
| Peruvian | 41,519 | 1.5% |
| Polish | 18,340 | 0.7% |
| Portuguese | 8,949 | 0.3% |
| Potawatomi | 30 | 0.0% |
| Pueblo | 28 | 0.0% |
| Puerto Rican | 87,859 | 3.3% |
| Romanian | 3,323 | 0.1% |
| Russian | 18,486 | 0.7% |
| Salvadoran | 23,302 | 0.9% |
| Samoan | 190 | 0.0% |
| Scandinavian | 794 | 0.0% |
| Scotch-Irish | 2,019 | 0.1% |
| Scottish | 6,796 | 0.3% |
| Seminole | 329 | 0.0% |
| Senegalese | 48 | 0.0% |
| Serbian | 635 | 0.0% |
| Sioux | 82 | 0.0% |
| Slavic | 223 | 0.0% |
| Slovak | 987 | 0.0% |
| Slovene | 141 | 0.0% |
| South African | 709 | 0.0% |
| South American | 377,268 | 14.0% |
| South American Indian | 983 | 0.0% |
| Spaniard | 18,381 | 0.7% |
| Spanish | 6,450 | 0.2% |
| Spanish American | 393 | 0.0% |
| Spanish American Indian | 119 | 0.0% |
| Sri Lankan | 3,169 | 0.1% |
| Subsaharan African | 12,747 | 0.5% |
| Sudanese | 111 | 0.0% |
| Swedish | 3,845 | 0.1% |
| Swiss | 1,569 | 0.1% |
| Syrian | 2,095 | 0.1% |
| Taiwanese | 89 | 0.0% |
| Thai | 14,374 | 0.5% |
| Tongan | 137 | 0.0% |
| Trinidadian and Tobagonian | 4,447 | 0.2% |
| Turkish | 2,591 | 0.1% |
| U.S. Virgin Islander | 786 | 0.0% |
| Ugandan | 7 | 0.0% |
| Ukrainian | 4,449 | 0.2% |
| Uruguayan | 6,084 | 0.2% |
| Venezuelan | 115,474 | 4.3% |
| Vietnamese | 822 | 0.0% |
| Welsh | 1,320 | 0.1% |
| West Indian | 2,952 | 0.1% |
| Yaqui | 14 | 0.0% |
| Yugoslavian | 307 | 0.0% |
| Yup'ik | 22 | 0.0% |
| Zimbabwean | 51 | 0.0% | View All 171 Rows |
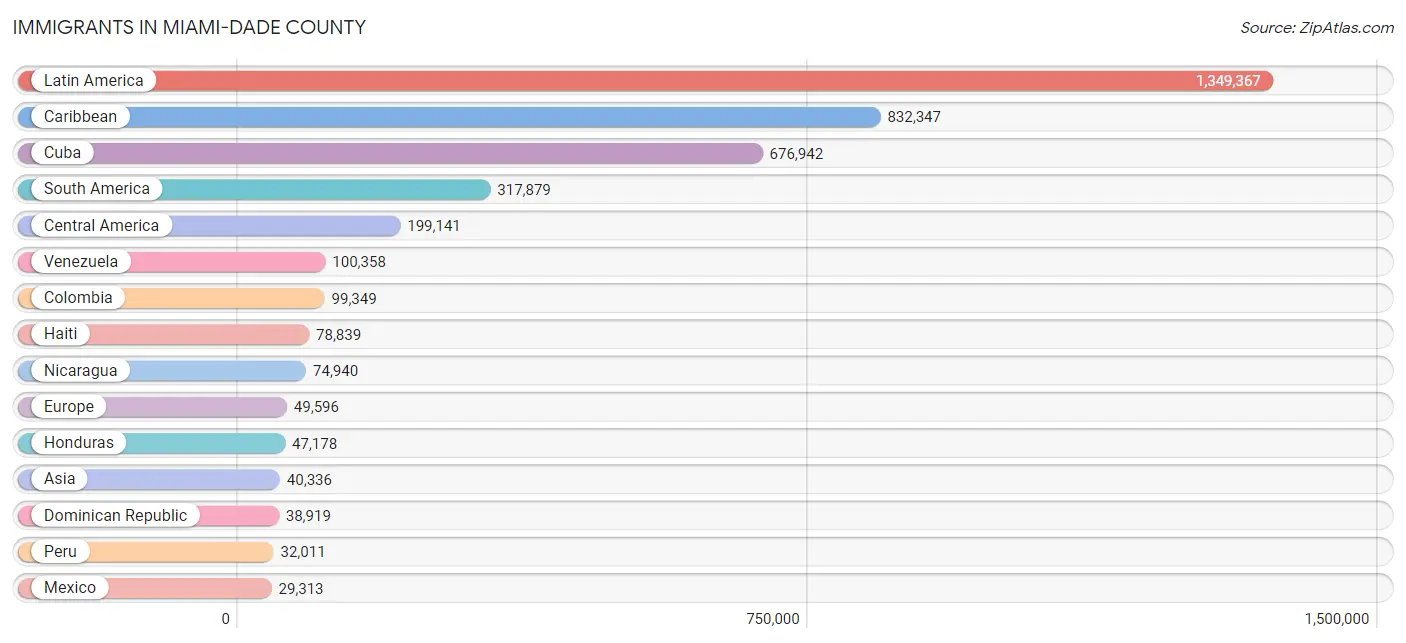
Immigrants in Miami-Dade County
The most numerous immigrant groups reported in Miami-Dade County came from Latin America (1,349,367 | 50.2%), Caribbean (832,347 | 31.0%), Cuba (676,942 | 25.2%), South America (317,879 | 11.8%), and Central America (199,141 | 7.4%), together accounting for 125.6% of all Miami-Dade County residents.
| Immigration Origin | # Population | % Population |
| Afghanistan | 165 | 0.0% |
| Africa | 7,916 | 0.3% |
| Albania | 96 | 0.0% |
| Argentina | 27,982 | 1.0% |
| Armenia | 65 | 0.0% |
| Asia | 40,336 | 1.5% |
| Australia | 532 | 0.0% |
| Austria | 382 | 0.0% |
| Bahamas | 4,158 | 0.2% |
| Bangladesh | 1,499 | 0.1% |
| Barbados | 192 | 0.0% |
| Belarus | 598 | 0.0% |
| Belgium | 601 | 0.0% |
| Belize | 512 | 0.0% |
| Bolivia | 3,878 | 0.1% |
| Bosnia and Herzegovina | 110 | 0.0% |
| Brazil | 18,010 | 0.7% |
| Bulgaria | 605 | 0.0% |
| Cambodia | 292 | 0.0% |
| Cameroon | 385 | 0.0% |
| Canada | 4,846 | 0.2% |
| Caribbean | 832,347 | 31.0% |
| Central America | 199,141 | 7.4% |
| Chile | 9,656 | 0.4% |
| China | 7,634 | 0.3% |
| Colombia | 99,349 | 3.7% |
| Costa Rica | 4,534 | 0.2% |
| Croatia | 226 | 0.0% |
| Cuba | 676,942 | 25.2% |
| Czechoslovakia | 429 | 0.0% |
| Denmark | 136 | 0.0% |
| Dominica | 873 | 0.0% |
| Dominican Republic | 38,919 | 1.5% |
| Eastern Africa | 1,102 | 0.0% |
| Eastern Asia | 9,995 | 0.4% |
| Eastern Europe | 14,831 | 0.5% |
| Ecuador | 17,596 | 0.6% |
| Egypt | 760 | 0.0% |
| El Salvador | 14,728 | 0.5% |
| England | 1,640 | 0.1% |
| Ethiopia | 176 | 0.0% |
| Europe | 49,596 | 1.8% |
| Fiji | 13 | 0.0% |
| France | 6,011 | 0.2% |
| Germany | 3,126 | 0.1% |
| Ghana | 51 | 0.0% |
| Greece | 710 | 0.0% |
| Grenada | 354 | 0.0% |
| Guatemala | 20,646 | 0.8% |
| Guyana | 2,039 | 0.1% |
| Haiti | 78,839 | 2.9% |
| Honduras | 47,178 | 1.8% |
| Hong Kong | 319 | 0.0% |
| Hungary | 698 | 0.0% |
| India | 6,208 | 0.2% |
| Indonesia | 172 | 0.0% |
| Iran | 1,404 | 0.1% |
| Iraq | 271 | 0.0% |
| Ireland | 472 | 0.0% |
| Israel | 3,029 | 0.1% |
| Italy | 5,750 | 0.2% |
| Jamaica | 24,027 | 0.9% |
| Japan | 966 | 0.0% |
| Jordan | 1,006 | 0.0% |
| Kazakhstan | 333 | 0.0% |
| Kenya | 227 | 0.0% |
| Korea | 1,376 | 0.1% |
| Kuwait | 234 | 0.0% |
| Laos | 73 | 0.0% |
| Latin America | 1,349,367 | 50.2% |
| Latvia | 190 | 0.0% |
| Lebanon | 1,232 | 0.1% |
| Liberia | 9 | 0.0% |
| Lithuania | 165 | 0.0% |
| Malaysia | 274 | 0.0% |
| Mexico | 29,313 | 1.1% |
| Micronesia | 35 | 0.0% |
| Middle Africa | 677 | 0.0% |
| Moldova | 481 | 0.0% |
| Morocco | 1,109 | 0.0% |
| Nepal | 130 | 0.0% |
| Netherlands | 461 | 0.0% |
| Nicaragua | 74,940 | 2.8% |
| Nigeria | 2,076 | 0.1% |
| North Macedonia | 9 | 0.0% |
| Northern Africa | 2,452 | 0.1% |
| Northern Europe | 5,102 | 0.2% |
| Norway | 195 | 0.0% |
| Oceania | 775 | 0.0% |
| Pakistan | 1,590 | 0.1% |
| Panama | 7,068 | 0.3% |
| Peru | 32,011 | 1.2% |
| Philippines | 4,772 | 0.2% |
| Poland | 1,244 | 0.1% |
| Portugal | 561 | 0.0% |
| Romania | 1,082 | 0.0% |
| Russia | 5,176 | 0.2% |
| Saudi Arabia | 919 | 0.0% |
| Scotland | 203 | 0.0% |
| Senegal | 51 | 0.0% |
| Serbia | 247 | 0.0% |
| Sierra Leone | 7 | 0.0% |
| Singapore | 170 | 0.0% |
| Somalia | 12 | 0.0% |
| South Africa | 1,088 | 0.0% |
| South America | 317,879 | 11.8% |
| South Central Asia | 11,814 | 0.4% |
| South Eastern Asia | 8,631 | 0.3% |
| Southern Europe | 18,252 | 0.7% |
| Spain | 11,215 | 0.4% |
| Sri Lanka | 193 | 0.0% |
| St. Vincent and the Grenadines | 474 | 0.0% |
| Sudan | 138 | 0.0% |
| Sweden | 521 | 0.0% |
| Switzerland | 785 | 0.0% |
| Syria | 693 | 0.0% |
| Taiwan | 625 | 0.0% |
| Thailand | 1,076 | 0.0% |
| Trinidad and Tobago | 4,416 | 0.2% |
| Turkey | 1,707 | 0.1% |
| Uganda | 72 | 0.0% |
| Ukraine | 2,694 | 0.1% |
| Uruguay | 5,352 | 0.2% |
| Uzbekistan | 233 | 0.0% |
| Venezuela | 100,358 | 3.7% |
| Vietnam | 1,667 | 0.1% |
| West Indies | 271 | 0.0% |
| Western Africa | 2,348 | 0.1% |
| Western Asia | 9,703 | 0.4% |
| Western Europe | 11,371 | 0.4% |
| Yemen | 9 | 0.0% |
| Zaire | 132 | 0.0% |
| Zimbabwe | 90 | 0.0% | View All 133 Rows |
Sex and Age in Miami-Dade County
Sex and Age in Miami-Dade County
The most populous age groups in Miami-Dade County are 30 to 34 Years (98,728 | 7.5%) for men and 55 to 59 Years (97,377 | 7.1%) for women.
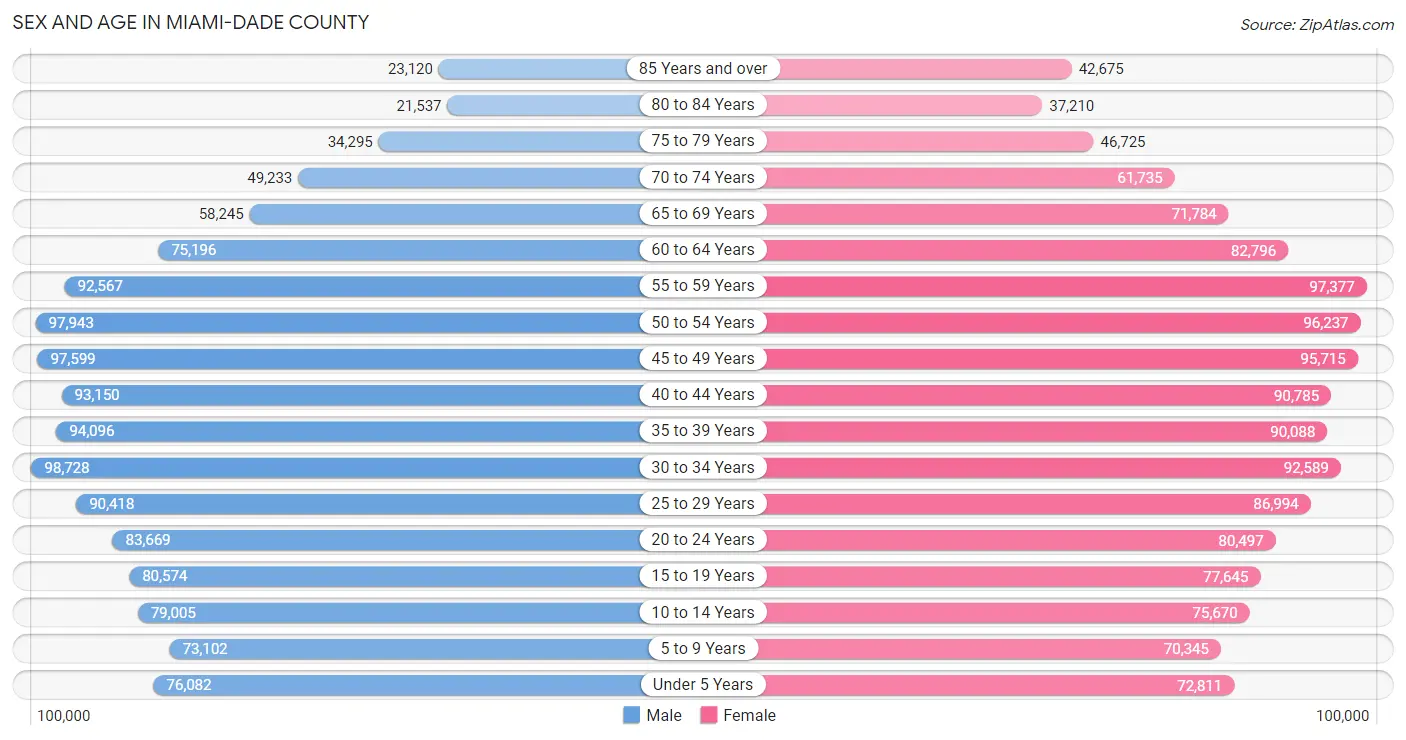
| Age Bracket | Male | Female |
| Under 5 Years | 76,082 (5.8%) | 72,811 (5.3%) |
| 5 to 9 Years | 73,102 (5.5%) | 70,345 (5.1%) |
| 10 to 14 Years | 79,005 (6.0%) | 75,670 (5.5%) |
| 15 to 19 Years | 80,574 (6.1%) | 77,645 (5.7%) |
| 20 to 24 Years | 83,669 (6.4%) | 80,497 (5.9%) |
| 25 to 29 Years | 90,418 (6.9%) | 86,994 (6.4%) |
| 30 to 34 Years | 98,728 (7.5%) | 92,589 (6.8%) |
| 35 to 39 Years | 94,096 (7.1%) | 90,088 (6.6%) |
| 40 to 44 Years | 93,150 (7.1%) | 90,785 (6.6%) |
| 45 to 49 Years | 97,599 (7.4%) | 95,715 (7.0%) |
| 50 to 54 Years | 97,943 (7.4%) | 96,237 (7.0%) |
| 55 to 59 Years | 92,567 (7.0%) | 97,377 (7.1%) |
| 60 to 64 Years | 75,196 (5.7%) | 82,796 (6.0%) |
| 65 to 69 Years | 58,245 (4.4%) | 71,784 (5.2%) |
| 70 to 74 Years | 49,233 (3.7%) | 61,735 (4.5%) |
| 75 to 79 Years | 34,295 (2.6%) | 46,725 (3.4%) |
| 80 to 84 Years | 21,537 (1.6%) | 37,210 (2.7%) |
| 85 Years and over | 23,120 (1.8%) | 42,675 (3.1%) |
| Total | 1,318,559 (100.0%) | 1,369,678 (100.0%) |
Families and Households in Miami-Dade County
Median Family Size in Miami-Dade County
The median family size in Miami-Dade County is 3.33 persons per family, with married-couple families (409,828 | 63.0%) accounting for the largest median family size of 3.43 persons per family. On the other hand, single male/father families (71,838 | 11.0%) represent the smallest median family size with 2.89 persons per family.
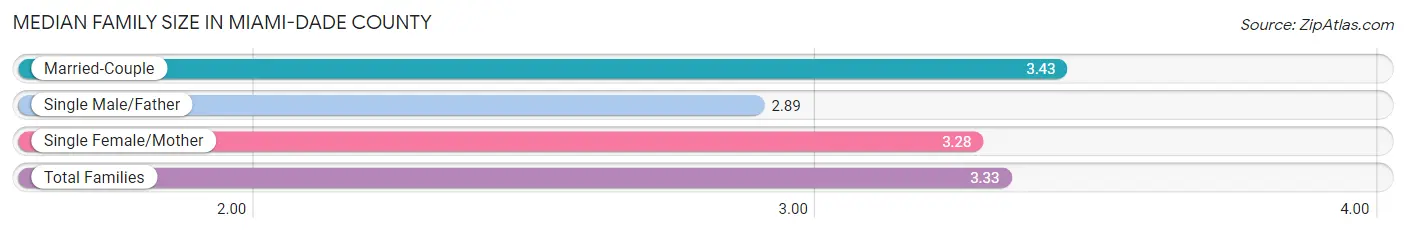
| Family Type | # Families | Family Size |
| Married-Couple | 409,828 (63.0%) | 3.43 |
| Single Male/Father | 71,838 (11.0%) | 2.89 |
| Single Female/Mother | 169,226 (26.0%) | 3.28 |
| Total Families | 650,892 (100.0%) | 3.33 |
Median Household Size in Miami-Dade County
The median household size in Miami-Dade County is 2.77 persons per household, with single female/mother households (169,226 | 17.8%) accounting for the largest median household size of 3.53 persons per household. non-family households (301,788 | 31.7%) represent the smallest median household size with 1.27 persons per household.
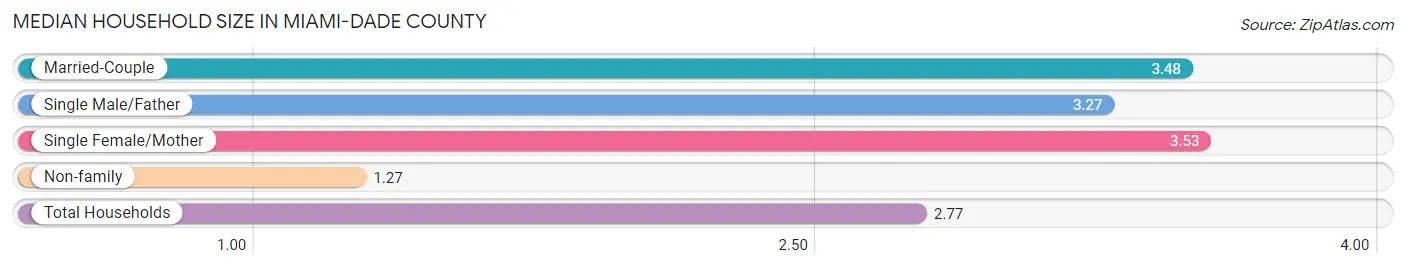
| Household Type | # Households | Household Size |
| Married-Couple | 409,828 (43.0%) | 3.48 |
| Single Male/Father | 71,838 (7.5%) | 3.27 |
| Single Female/Mother | 169,226 (17.8%) | 3.53 |
| Non-family | 301,788 (31.7%) | 1.27 |
| Total Households | 952,680 (100.0%) | 2.77 |
Household Size by Marriage Status in Miami-Dade County
Out of a total of 952,680 households in Miami-Dade County, 650,892 (68.3%) are family households, while 301,788 (31.7%) are nonfamily households. The most numerous type of family households are 2-person households, comprising 232,230, and the most common type of nonfamily households are 1-person households, comprising 241,691.
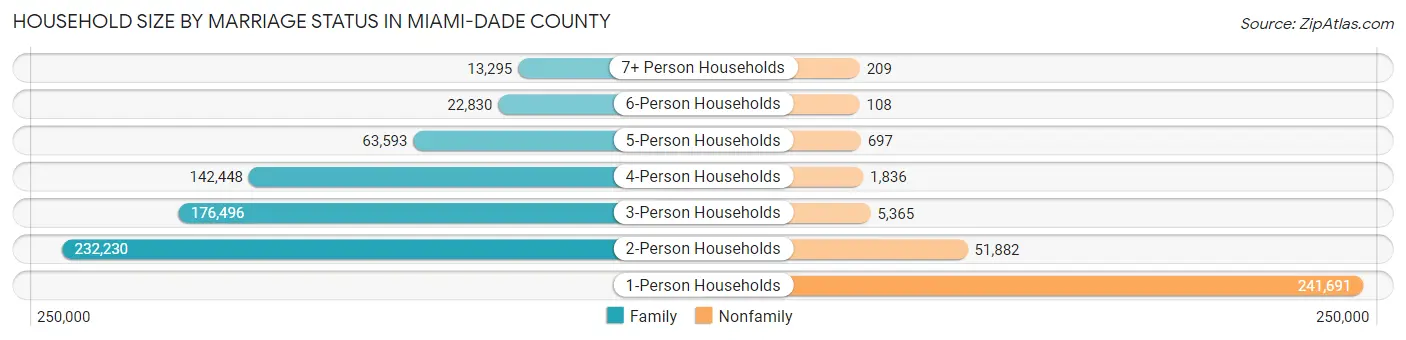
| Household Size | Family Households | Nonfamily Households |
| 1-Person Households | - | 241,691 (25.4%) |
| 2-Person Households | 232,230 (24.4%) | 51,882 (5.4%) |
| 3-Person Households | 176,496 (18.5%) | 5,365 (0.6%) |
| 4-Person Households | 142,448 (14.9%) | 1,836 (0.2%) |
| 5-Person Households | 63,593 (6.7%) | 697 (0.1%) |
| 6-Person Households | 22,830 (2.4%) | 108 (0.0%) |
| 7+ Person Households | 13,295 (1.4%) | 209 (0.0%) |
| Total | 650,892 (68.3%) | 301,788 (31.7%) |
Female Fertility in Miami-Dade County
Fertility by Age in Miami-Dade County
Average fertility rate in Miami-Dade County is 44.0 births per 1,000 women. Women in the age bracket of 20 to 34 years have the highest fertility rate with 67.0 births per 1,000 women. Women in the age bracket of 20 to 34 years acount for 62.2% of all women with births.
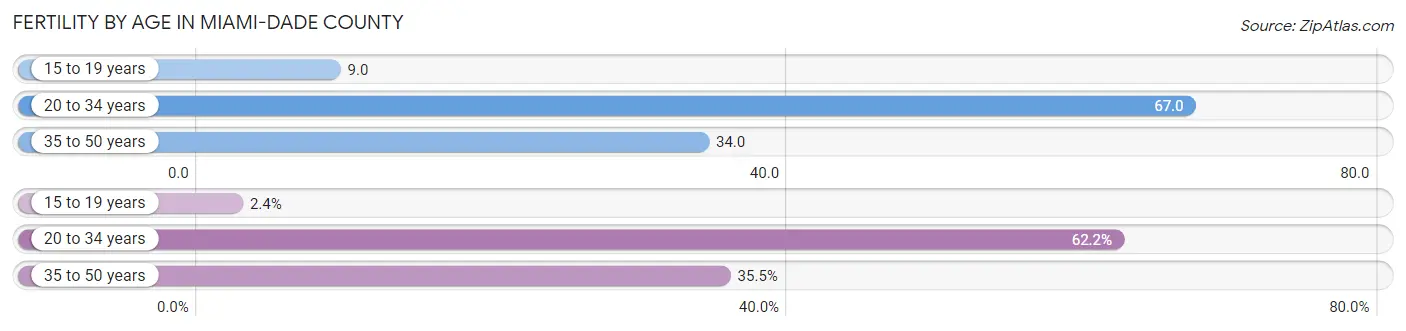
| Age Bracket | Women with Births | Births / 1,000 Women |
| 15 to 19 years | 669 (2.4%) | 9.0 |
| 20 to 34 years | 17,511 (62.2%) | 67.0 |
| 35 to 50 years | 9,994 (35.5%) | 34.0 |
| Total | 28,174 (100.0%) | 44.0 |
Fertility by Age by Marriage Status in Miami-Dade County
57.4% of women with births (28,174) in Miami-Dade County are married. The highest percentage of unmarried women with births falls into 15 to 19 years age bracket with 96.7% of them unmarried at the time of birth, while the lowest percentage of unmarried women with births belong to 35 to 50 years age bracket with 27.3% of them unmarried.
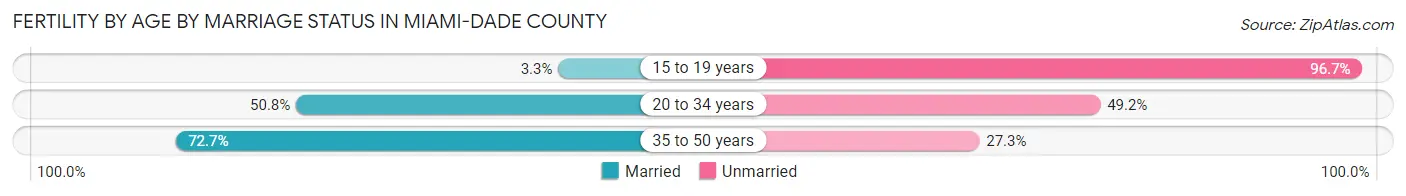
| Age Bracket | Married | Unmarried |
| 15 to 19 years | 22 (3.3%) | 647 (96.7%) |
| 20 to 34 years | 8,896 (50.8%) | 8,615 (49.2%) |
| 35 to 50 years | 7,266 (72.7%) | 2,728 (27.3%) |
| Total | 16,172 (57.4%) | 12,002 (42.6%) |
Fertility by Education in Miami-Dade County
Average fertility rate in Miami-Dade County is 44.0 births per 1,000 women. Women with the education attainment of high school diploma have the highest fertility rate of 51.0 births per 1,000 women, while women with the education attainment of college or associate's degree have the lowest fertility at 37.0 births per 1,000 women. Women with the education attainment of high school diploma represent 25.9% of all women with births.
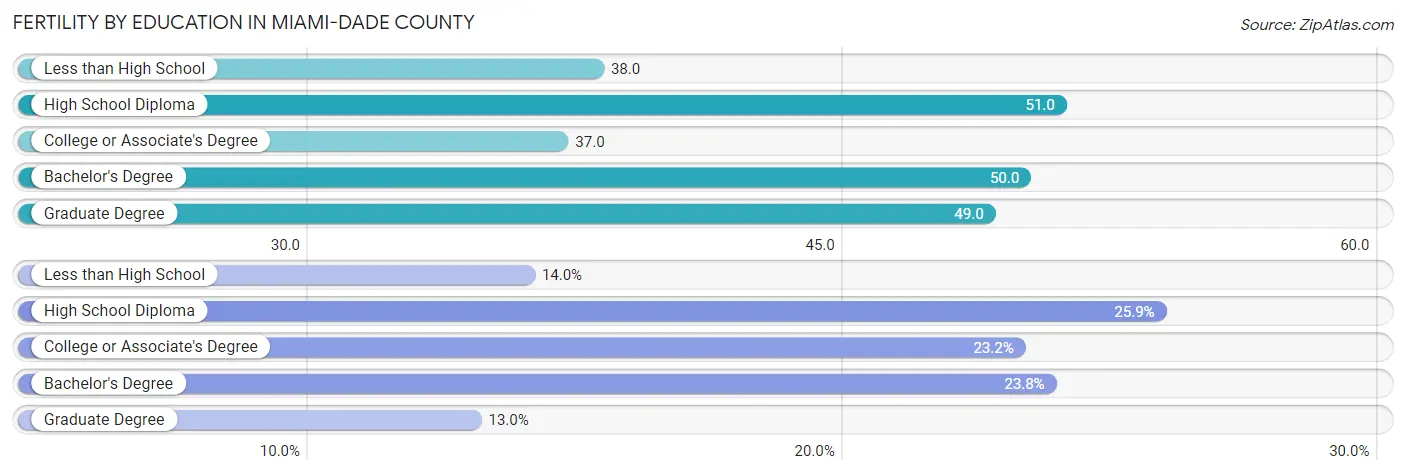
| Educational Attainment | Women with Births | Births / 1,000 Women |
| Less than High School | 3,956 (14.0%) | 38.0 |
| High School Diploma | 7,290 (25.9%) | 51.0 |
| College or Associate's Degree | 6,545 (23.2%) | 37.0 |
| Bachelor's Degree | 6,709 (23.8%) | 50.0 |
| Graduate Degree | 3,674 (13.0%) | 49.0 |
| Total | 28,174 (100.0%) | 44.0 |
Fertility by Education by Marriage Status in Miami-Dade County
42.6% of women with births in Miami-Dade County are unmarried. Women with the educational attainment of graduate degree are most likely to be married with 82.3% of them married at childbirth, while women with the educational attainment of less than high school are least likely to be married with 55.0% of them unmarried at childbirth.
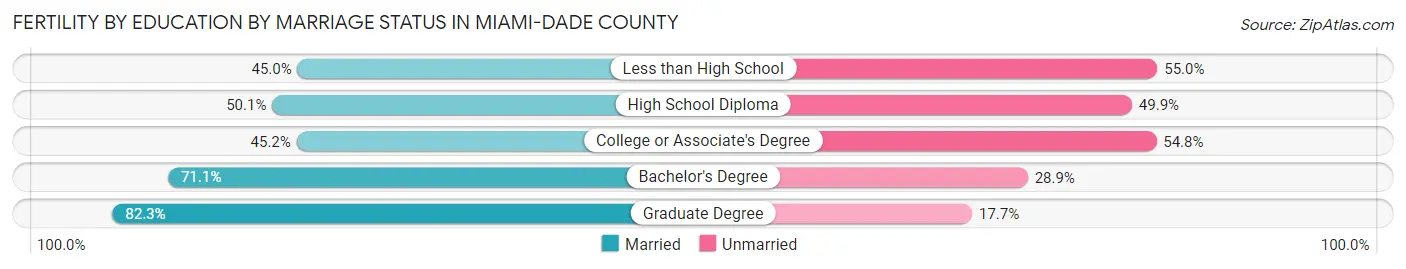
| Educational Attainment | Married | Unmarried |
| Less than High School | 1,780 (45.0%) | 2,176 (55.0%) |
| High School Diploma | 3,652 (50.1%) | 3,638 (49.9%) |
| College or Associate's Degree | 2,958 (45.2%) | 3,587 (54.8%) |
| Bachelor's Degree | 4,770 (71.1%) | 1,939 (28.9%) |
| Graduate Degree | 3,024 (82.3%) | 650 (17.7%) |
| Total | 16,172 (57.4%) | 12,002 (42.6%) |
Employment Characteristics in Miami-Dade County
Employment by Class of Employer in Miami-Dade County
Among the 1,319,578 employed individuals in Miami-Dade County, private company employees (920,672 | 69.8%), self-employed (not incorporated) (106,897 | 8.1%), and self-employed (incorporated) (93,230 | 7.1%) make up the most common classes of employment.
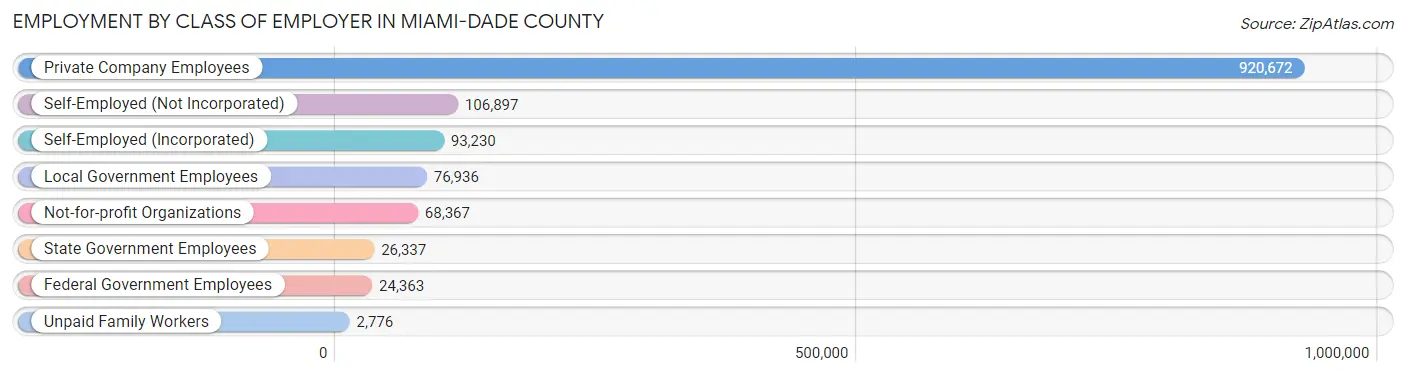
| Employer Class | # Employees | % Employees |
| Private Company Employees | 920,672 | 69.8% |
| Self-Employed (Incorporated) | 93,230 | 7.1% |
| Self-Employed (Not Incorporated) | 106,897 | 8.1% |
| Not-for-profit Organizations | 68,367 | 5.2% |
| Local Government Employees | 76,936 | 5.8% |
| State Government Employees | 26,337 | 2.0% |
| Federal Government Employees | 24,363 | 1.8% |
| Unpaid Family Workers | 2,776 | 0.2% |
| Total | 1,319,578 | 100.0% |
Employment Status by Age in Miami-Dade County
According to the labor force statistics for Miami-Dade County, out of the total population over 16 years of age (2,211,003), 63.8% or 1,410,620 individuals are in the labor force, with 4.6% or 64,889 of them unemployed. The age group with the highest labor force participation rate is 35 to 44 years, with 84.6% or 311,429 individuals in the labor force. Within the labor force, the 16 to 19 years age range has the highest percentage of unemployed individuals, with 16.2% or 4,914 of them being unemployed.
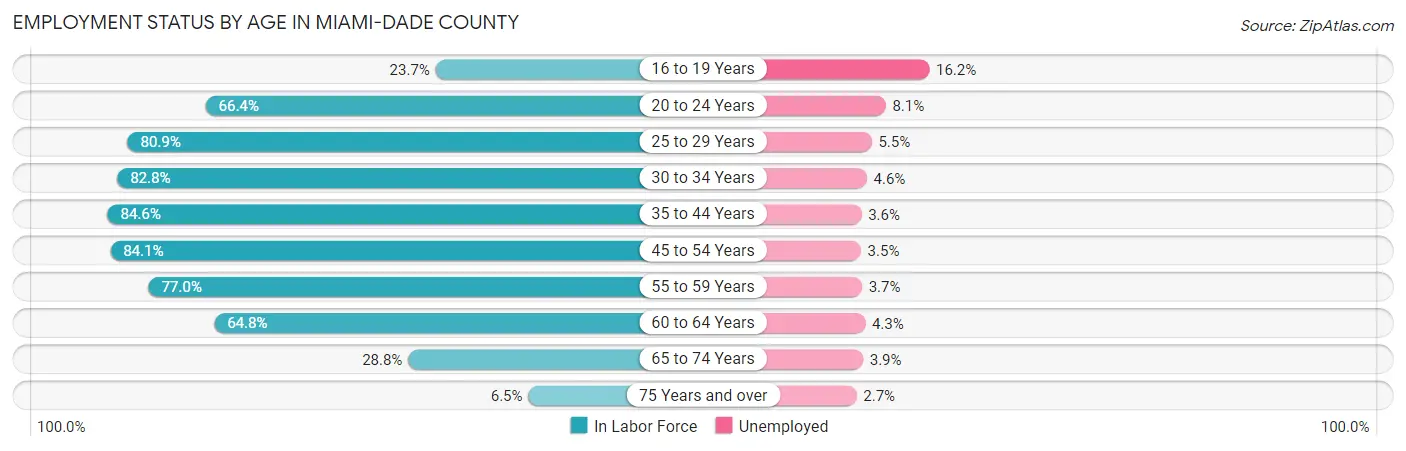
| Age Bracket | In Labor Force | Unemployed |
| 16 to 19 Years | 30,336 (23.7%) | 4,914 (16.2%) |
| 20 to 24 Years | 109,006 (66.4%) | 8,829 (8.1%) |
| 25 to 29 Years | 143,526 (80.9%) | 7,894 (5.5%) |
| 30 to 34 Years | 158,410 (82.8%) | 7,287 (4.6%) |
| 35 to 44 Years | 311,429 (84.6%) | 11,211 (3.6%) |
| 45 to 54 Years | 325,882 (84.1%) | 11,406 (3.5%) |
| 55 to 59 Years | 146,257 (77.0%) | 5,412 (3.7%) |
| 60 to 64 Years | 102,379 (64.8%) | 4,402 (4.3%) |
| 65 to 74 Years | 69,407 (28.8%) | 2,707 (3.9%) |
| 75 Years and over | 13,362 (6.5%) | 361 (2.7%) |
| Total | 1,410,620 (63.8%) | 64,889 (4.6%) |
Employment Status by Educational Attainment in Miami-Dade County
According to labor force statistics for Miami-Dade County, 80.7% of individuals (1,188,128) out of the total population between 25 and 64 years of age (1,472,278) are in the labor force, with 4.0% or 47,525 of them being unemployed. The group with the highest labor force participation rate are those with the educational attainment of bachelor's degree or higher, with 87.2% or 449,377 individuals in the labor force. Within the labor force, individuals with less than high school education have the highest percentage of unemployment, with 5.2% or 6,910 of them being unemployed.
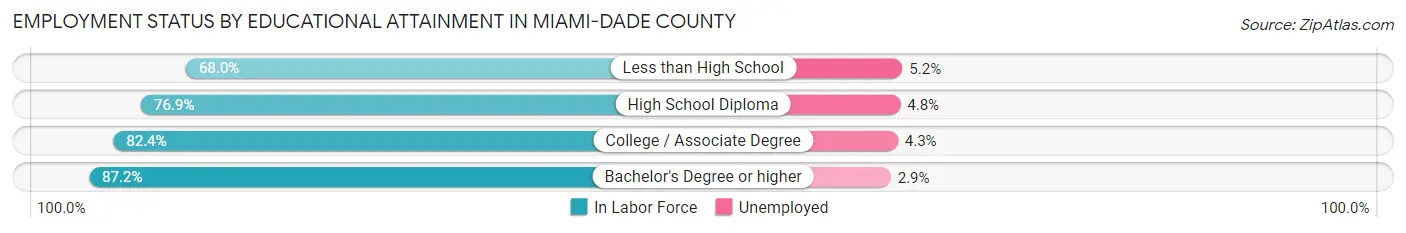
| Educational Attainment | In Labor Force | Unemployed |
| Less than High School | 132,875 (68.0%) | 10,161 (5.2%) |
| High School Diploma | 302,046 (76.9%) | 18,853 (4.8%) |
| College / Associate Degree | 303,853 (82.4%) | 15,856 (4.3%) |
| Bachelor's Degree or higher | 449,377 (87.2%) | 14,945 (2.9%) |
| Total | 1,188,128 (80.7%) | 58,891 (4.0%) |
Employment Occupations by Sex in Miami-Dade County
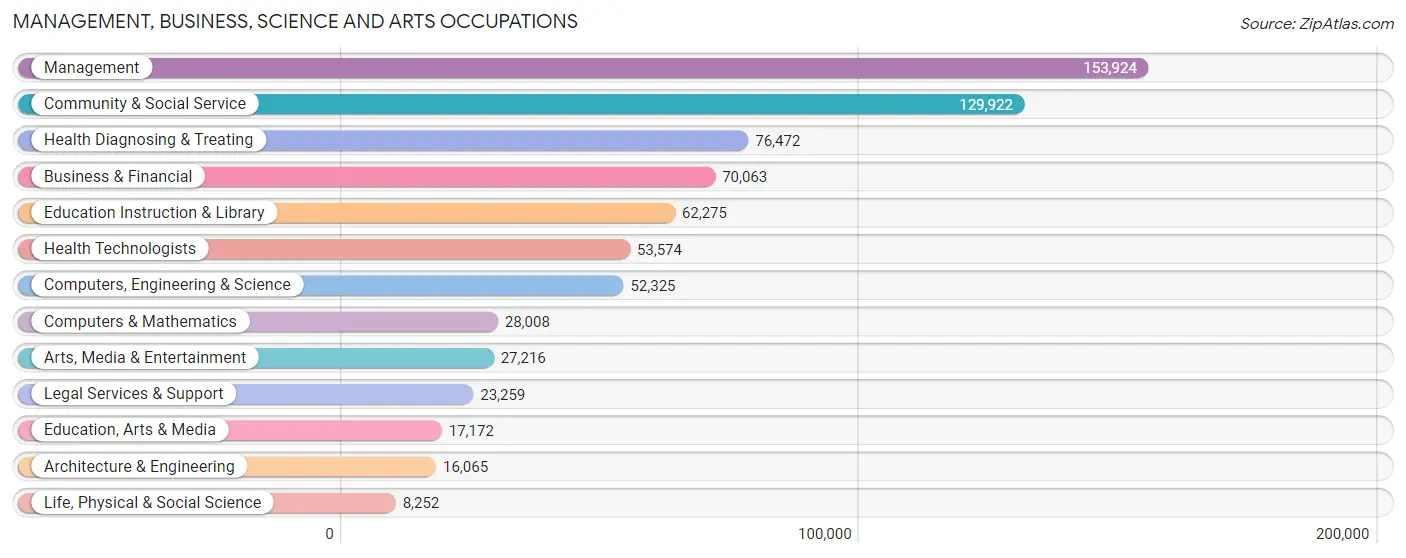
Management, Business, Science and Arts Occupations
The most common Management, Business, Science and Arts occupations in Miami-Dade County are Management (153,924 | 11.5%), Community & Social Service (129,922 | 9.7%), Health Diagnosing & Treating (76,472 | 5.7%), Business & Financial (70,063 | 5.2%), and Education Instruction & Library (62,275 | 4.6%).
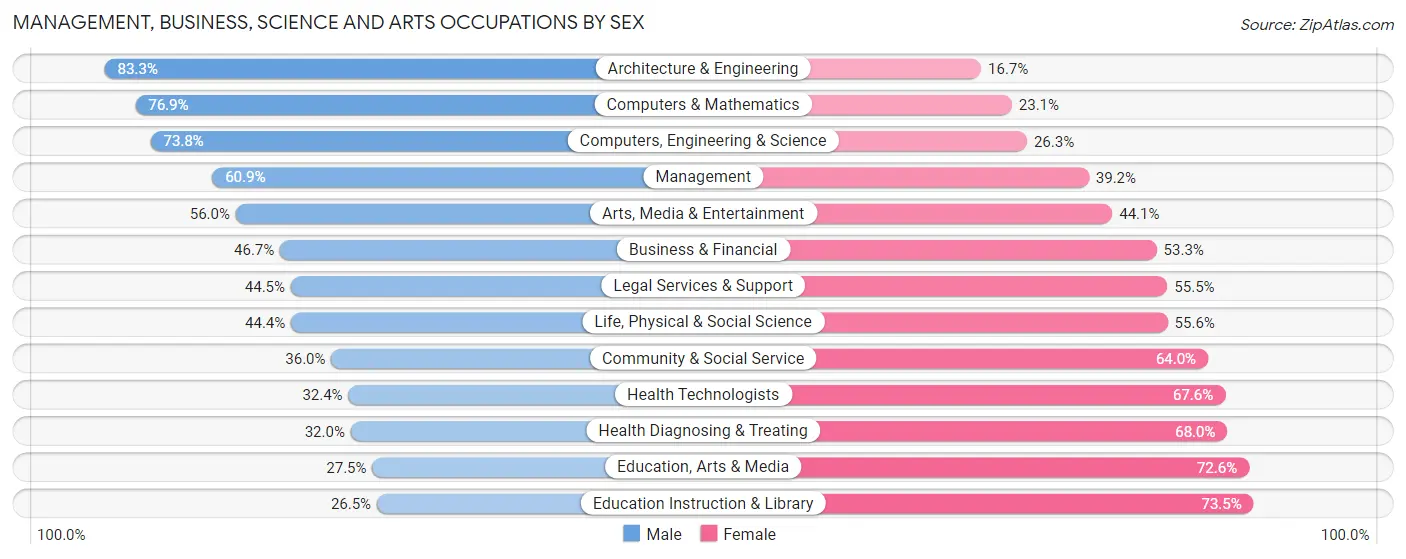
Management, Business, Science and Arts Occupations by Sex
Within the Management, Business, Science and Arts occupations in Miami-Dade County, the most male-oriented occupations are Architecture & Engineering (83.3%), Computers & Mathematics (76.9%), and Computers, Engineering & Science (73.8%), while the most female-oriented occupations are Education Instruction & Library (73.5%), Education, Arts & Media (72.6%), and Health Diagnosing & Treating (68.0%).
| Occupation | Male | Female |
| Management | 93,666 (60.9%) | 60,258 (39.2%) |
| Business & Financial | 32,718 (46.7%) | 37,345 (53.3%) |
| Computers, Engineering & Science | 38,592 (73.8%) | 13,733 (26.3%) |
| Computers & Mathematics | 21,542 (76.9%) | 6,466 (23.1%) |
| Architecture & Engineering | 13,385 (83.3%) | 2,680 (16.7%) |
| Life, Physical & Social Science | 3,665 (44.4%) | 4,587 (55.6%) |
| Community & Social Service | 46,784 (36.0%) | 83,138 (64.0%) |
| Education, Arts & Media | 4,713 (27.5%) | 12,459 (72.6%) |
| Legal Services & Support | 10,341 (44.5%) | 12,918 (55.5%) |
| Education Instruction & Library | 16,502 (26.5%) | 45,773 (73.5%) |
| Arts, Media & Entertainment | 15,228 (55.9%) | 11,988 (44.1%) |
| Health Diagnosing & Treating | 24,446 (32.0%) | 52,026 (68.0%) |
| Health Technologists | 17,380 (32.4%) | 36,194 (67.6%) |
| Total (Category) | 236,206 (48.9%) | 246,500 (51.1%) |
| Total (Overall) | 717,714 (53.4%) | 625,642 (46.6%) |
Services Occupations
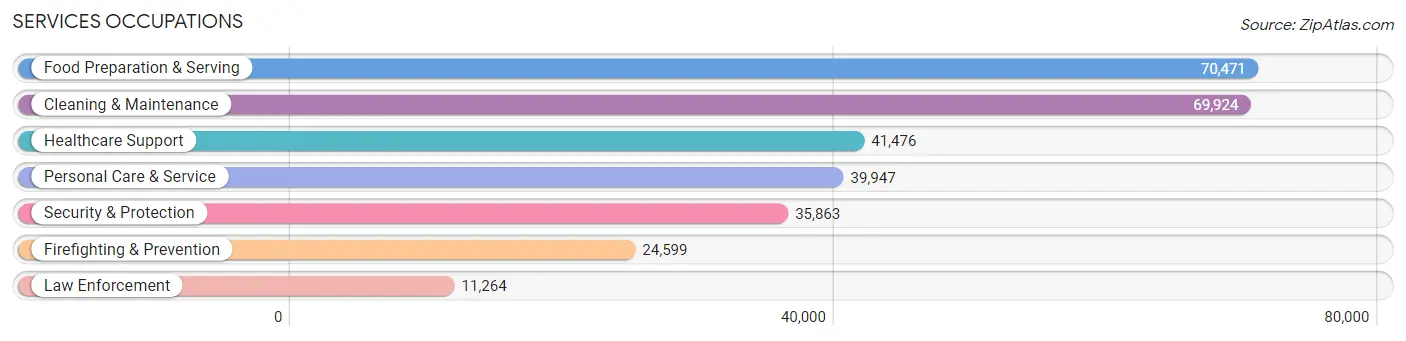
The most common Services occupations in Miami-Dade County are Food Preparation & Serving (70,471 | 5.2%), Cleaning & Maintenance (69,924 | 5.2%), Healthcare Support (41,476 | 3.1%), Personal Care & Service (39,947 | 3.0%), and Security & Protection (35,863 | 2.7%).
Services Occupations by Sex
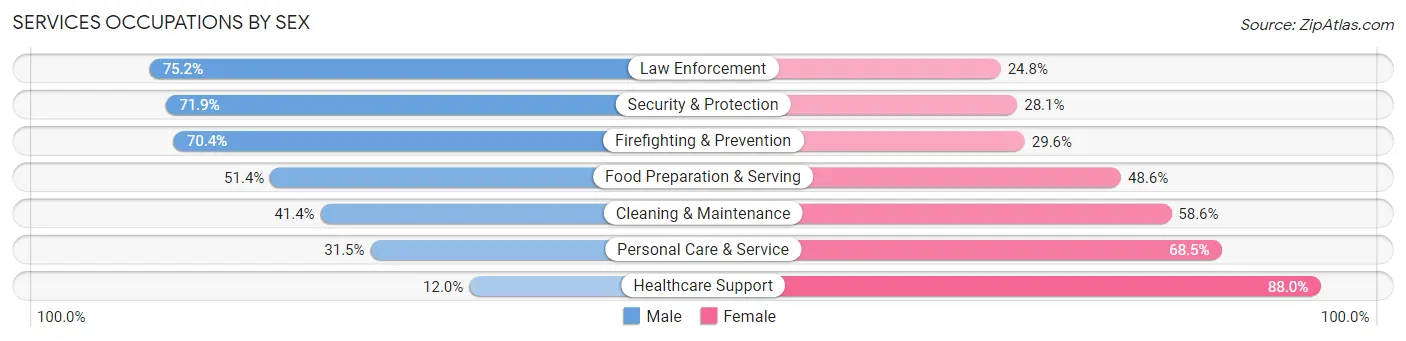
Within the Services occupations in Miami-Dade County, the most male-oriented occupations are Law Enforcement (75.2%), Security & Protection (71.9%), and Firefighting & Prevention (70.4%), while the most female-oriented occupations are Healthcare Support (88.0%), Personal Care & Service (68.5%), and Cleaning & Maintenance (58.6%).
| Occupation | Male | Female |
| Healthcare Support | 4,967 (12.0%) | 36,509 (88.0%) |
| Security & Protection | 25,796 (71.9%) | 10,067 (28.1%) |
| Firefighting & Prevention | 17,324 (70.4%) | 7,275 (29.6%) |
| Law Enforcement | 8,472 (75.2%) | 2,792 (24.8%) |
| Food Preparation & Serving | 36,204 (51.4%) | 34,267 (48.6%) |
| Cleaning & Maintenance | 28,966 (41.4%) | 40,958 (58.6%) |
| Personal Care & Service | 12,595 (31.5%) | 27,352 (68.5%) |
| Total (Category) | 108,528 (42.1%) | 149,153 (57.9%) |
| Total (Overall) | 717,714 (53.4%) | 625,642 (46.6%) |
Sales and Office Occupations
The most common Sales and Office occupations in Miami-Dade County are Office & Administration (157,417 | 11.7%), and Sales & Related (153,702 | 11.4%).

Sales and Office Occupations by Sex

| Occupation | Male | Female |
| Sales & Related | 76,237 (49.6%) | 77,465 (50.4%) |
| Office & Administration | 49,147 (31.2%) | 108,270 (68.8%) |
| Total (Category) | 125,384 (40.3%) | 185,735 (59.7%) |
| Total (Overall) | 717,714 (53.4%) | 625,642 (46.6%) |
Natural Resources, Construction and Maintenance Occupations
The most common Natural Resources, Construction and Maintenance occupations in Miami-Dade County are Construction & Extraction (84,096 | 6.3%), Installation, Maintenance & Repair (44,372 | 3.3%), and Farming, Fishing & Forestry (6,047 | 0.4%).

Natural Resources, Construction and Maintenance Occupations by Sex
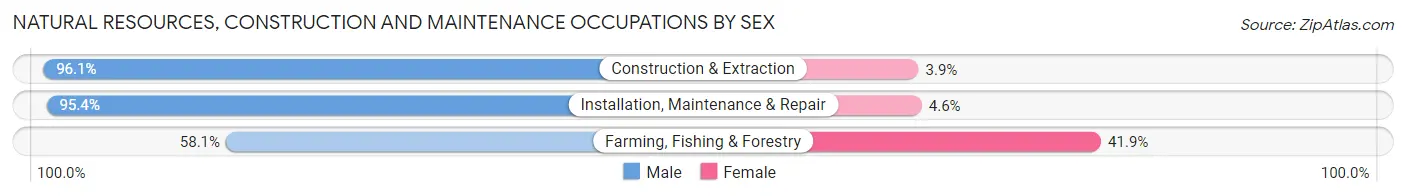
| Occupation | Male | Female |
| Farming, Fishing & Forestry | 3,515 (58.1%) | 2,532 (41.9%) |
| Construction & Extraction | 80,831 (96.1%) | 3,265 (3.9%) |
| Installation, Maintenance & Repair | 42,349 (95.4%) | 2,023 (4.6%) |
| Total (Category) | 126,695 (94.2%) | 7,820 (5.8%) |
| Total (Overall) | 717,714 (53.4%) | 625,642 (46.6%) |
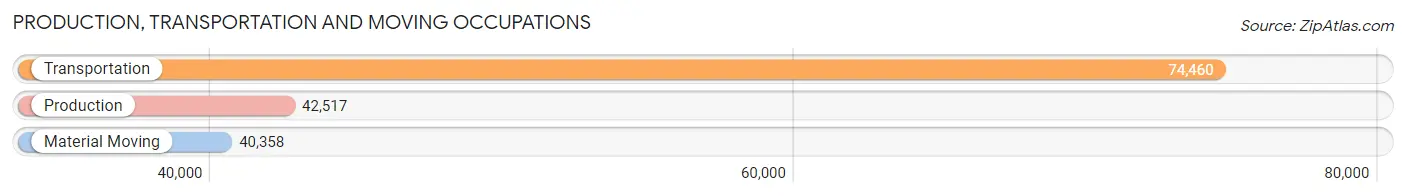
Production, Transportation and Moving Occupations
The most common Production, Transportation and Moving occupations in Miami-Dade County are Transportation (74,460 | 5.5%), Production (42,517 | 3.2%), and Material Moving (40,358 | 3.0%).
Production, Transportation and Moving Occupations by Sex
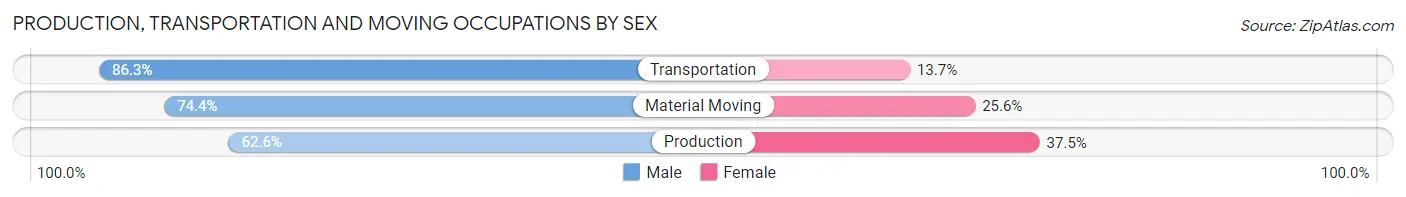
| Occupation | Male | Female |
| Production | 26,594 (62.5%) | 15,923 (37.4%) |
| Transportation | 64,290 (86.3%) | 10,170 (13.7%) |
| Material Moving | 30,017 (74.4%) | 10,341 (25.6%) |
| Total (Category) | 120,901 (76.8%) | 36,434 (23.2%) |
| Total (Overall) | 717,714 (53.4%) | 625,642 (46.6%) |
Employment Industries by Sex in Miami-Dade County
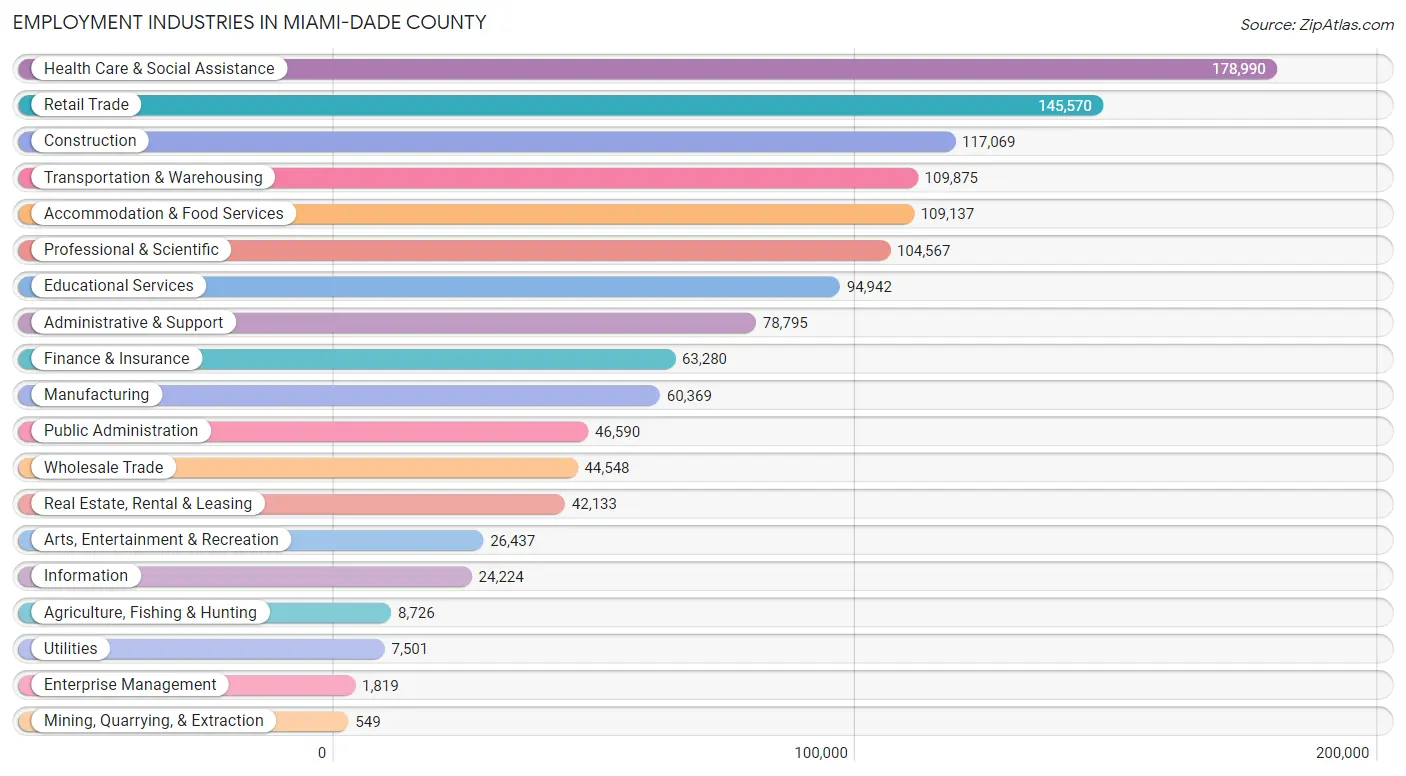
Employment Industries in Miami-Dade County
The major employment industries in Miami-Dade County include Health Care & Social Assistance (178,990 | 13.3%), Retail Trade (145,570 | 10.8%), Construction (117,069 | 8.7%), Transportation & Warehousing (109,875 | 8.2%), and Accommodation & Food Services (109,137 | 8.1%).
Employment Industries by Sex in Miami-Dade County
The Miami-Dade County industries that see more men than women are Mining, Quarrying, & Extraction (92.3%), Construction (89.2%), and Utilities (76.1%), whereas the industries that tend to have a higher number of women are Health Care & Social Assistance (73.5%), Educational Services (68.8%), and Enterprise Management (56.1%).
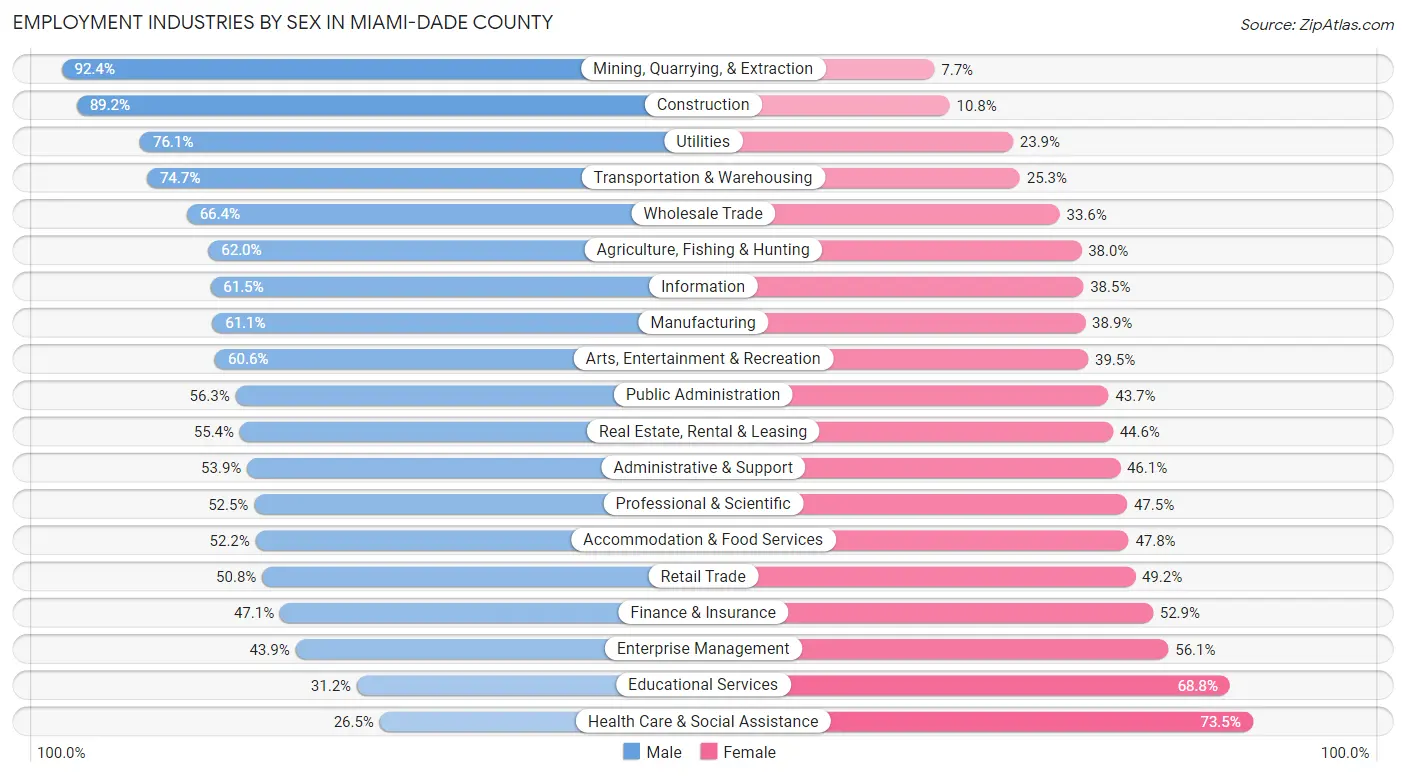
| Industry | Male | Female |
| Agriculture, Fishing & Hunting | 5,407 (62.0%) | 3,319 (38.0%) |
| Mining, Quarrying, & Extraction | 507 (92.3%) | 42 (7.6%) |
| Construction | 104,425 (89.2%) | 12,644 (10.8%) |
| Manufacturing | 36,912 (61.1%) | 23,457 (38.9%) |
| Wholesale Trade | 29,594 (66.4%) | 14,954 (33.6%) |
| Retail Trade | 73,988 (50.8%) | 71,582 (49.2%) |
| Transportation & Warehousing | 82,035 (74.7%) | 27,840 (25.3%) |
| Utilities | 5,708 (76.1%) | 1,793 (23.9%) |
| Information | 14,908 (61.5%) | 9,316 (38.5%) |
| Finance & Insurance | 29,831 (47.1%) | 33,449 (52.9%) |
| Real Estate, Rental & Leasing | 23,359 (55.4%) | 18,774 (44.6%) |
| Professional & Scientific | 54,873 (52.5%) | 49,694 (47.5%) |
| Enterprise Management | 799 (43.9%) | 1,020 (56.1%) |
| Administrative & Support | 42,493 (53.9%) | 36,302 (46.1%) |
| Educational Services | 29,642 (31.2%) | 65,300 (68.8%) |
| Health Care & Social Assistance | 47,428 (26.5%) | 131,562 (73.5%) |
| Arts, Entertainment & Recreation | 16,007 (60.6%) | 10,430 (39.5%) |
| Accommodation & Food Services | 56,947 (52.2%) | 52,190 (47.8%) |
| Public Administration | 26,249 (56.3%) | 20,341 (43.7%) |
| Total | 717,714 (53.4%) | 625,642 (46.6%) |
Education in Miami-Dade County
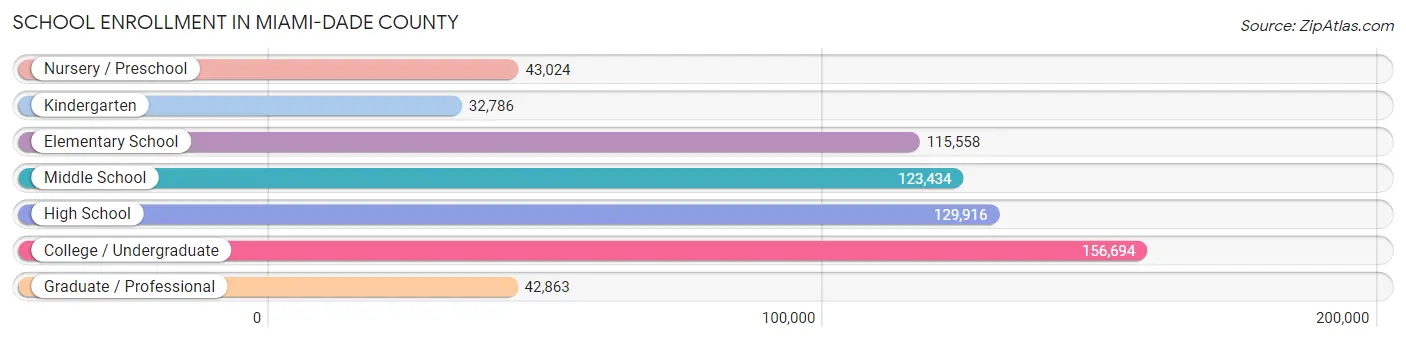
School Enrollment in Miami-Dade County
The most common levels of schooling among the 644,275 students in Miami-Dade County are college / undergraduate (156,694 | 24.3%), high school (129,916 | 20.2%), and middle school (123,434 | 19.2%).
| School Level | # Students | % Students |
| Nursery / Preschool | 43,024 | 6.7% |
| Kindergarten | 32,786 | 5.1% |
| Elementary School | 115,558 | 17.9% |
| Middle School | 123,434 | 19.2% |
| High School | 129,916 | 20.2% |
| College / Undergraduate | 156,694 | 24.3% |
| Graduate / Professional | 42,863 | 6.7% |
| Total | 644,275 | 100.0% |
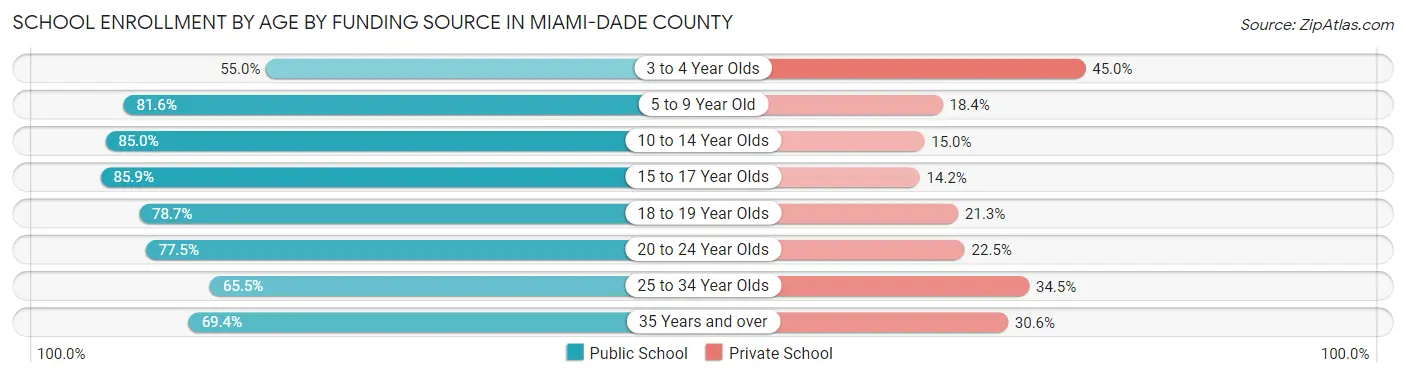
School Enrollment by Age by Funding Source in Miami-Dade County
Out of a total of 644,275 students who are enrolled in schools in Miami-Dade County, 138,519 (21.5%) attend a private institution, while the remaining 505,756 (78.5%) are enrolled in public schools. The age group of 3 to 4 year olds has the highest likelihood of being enrolled in private schools, with 17,461 (45.0% in the age bracket) enrolled. Conversely, the age group of 15 to 17 year olds has the lowest likelihood of being enrolled in a private school, with 76,551 (85.9% in the age bracket) attending a public institution.
| Age Bracket | Public School | Private School |
| 3 to 4 Year Olds | 21,335 (55.0%) | 17,461 (45.0%) |
| 5 to 9 Year Old | 111,816 (81.6%) | 25,271 (18.4%) |
| 10 to 14 Year Olds | 128,038 (85.0%) | 22,649 (15.0%) |
| 15 to 17 Year Olds | 76,551 (85.9%) | 12,621 (14.1%) |
| 18 to 19 Year Olds | 40,936 (78.7%) | 11,092 (21.3%) |
| 20 to 24 Year Olds | 61,879 (77.5%) | 18,007 (22.5%) |
| 25 to 34 Year Olds | 31,458 (65.5%) | 16,594 (34.5%) |
| 35 Years and over | 33,713 (69.4%) | 14,854 (30.6%) |
| Total | 505,756 (78.5%) | 138,519 (21.5%) |
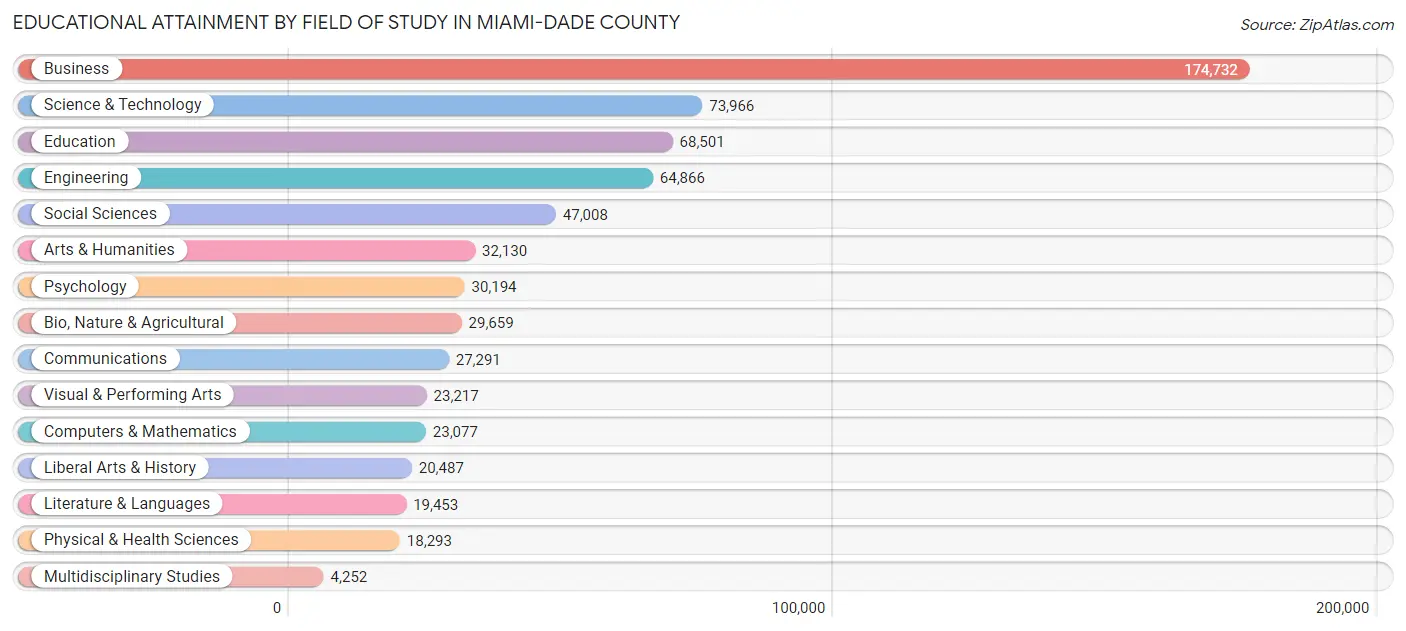
Educational Attainment by Field of Study in Miami-Dade County
Business (174,732 | 26.6%), science & technology (73,966 | 11.3%), education (68,501 | 10.4%), engineering (64,866 | 9.9%), and social sciences (47,008 | 7.1%) are the most common fields of study among 657,126 individuals in Miami-Dade County who have obtained a bachelor's degree or higher.
| Field of Study | # Graduates | % Graduates |
| Computers & Mathematics | 23,077 | 3.5% |
| Bio, Nature & Agricultural | 29,659 | 4.5% |
| Physical & Health Sciences | 18,293 | 2.8% |
| Psychology | 30,194 | 4.6% |
| Social Sciences | 47,008 | 7.1% |
| Engineering | 64,866 | 9.9% |
| Multidisciplinary Studies | 4,252 | 0.6% |
| Science & Technology | 73,966 | 11.3% |
| Business | 174,732 | 26.6% |
| Education | 68,501 | 10.4% |
| Literature & Languages | 19,453 | 3.0% |
| Liberal Arts & History | 20,487 | 3.1% |
| Visual & Performing Arts | 23,217 | 3.5% |
| Communications | 27,291 | 4.2% |
| Arts & Humanities | 32,130 | 4.9% |
| Total | 657,126 | 100.0% |
Transportation & Commute in Miami-Dade County
Vehicle Availability by Sex in Miami-Dade County
The most prevalent vehicle ownership categories in Miami-Dade County are males with 2 vehicles (294,451, accounting for 41.7%) and females with 2 vehicles (241,028, making up 48.3%).
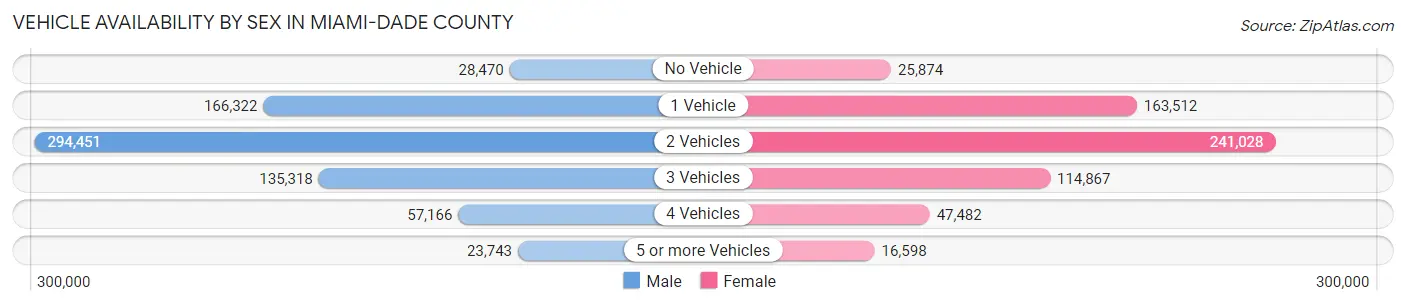
| Vehicles Available | Male | Female |
| No Vehicle | 28,470 (4.0%) | 25,874 (4.3%) |
| 1 Vehicle | 166,322 (23.6%) | 163,512 (26.8%) |
| 2 Vehicles | 294,451 (41.7%) | 241,028 (39.6%) |
| 3 Vehicles | 135,318 (19.2%) | 114,867 (18.9%) |
| 4 Vehicles | 57,166 (8.1%) | 47,482 (7.8%) |
| 5 or more Vehicles | 23,743 (3.4%) | 16,598 (2.7%) |
| Total | 705,470 (100.0%) | 609,361 (100.0%) |
Commute Time in Miami-Dade County
The most frequently occuring commute durations in Miami-Dade County are 30 to 34 minutes (237,816 commuters, 20.1%), 20 to 24 minutes (175,145 commuters, 14.8%), and 45 to 59 minutes (137,335 commuters, 11.6%).
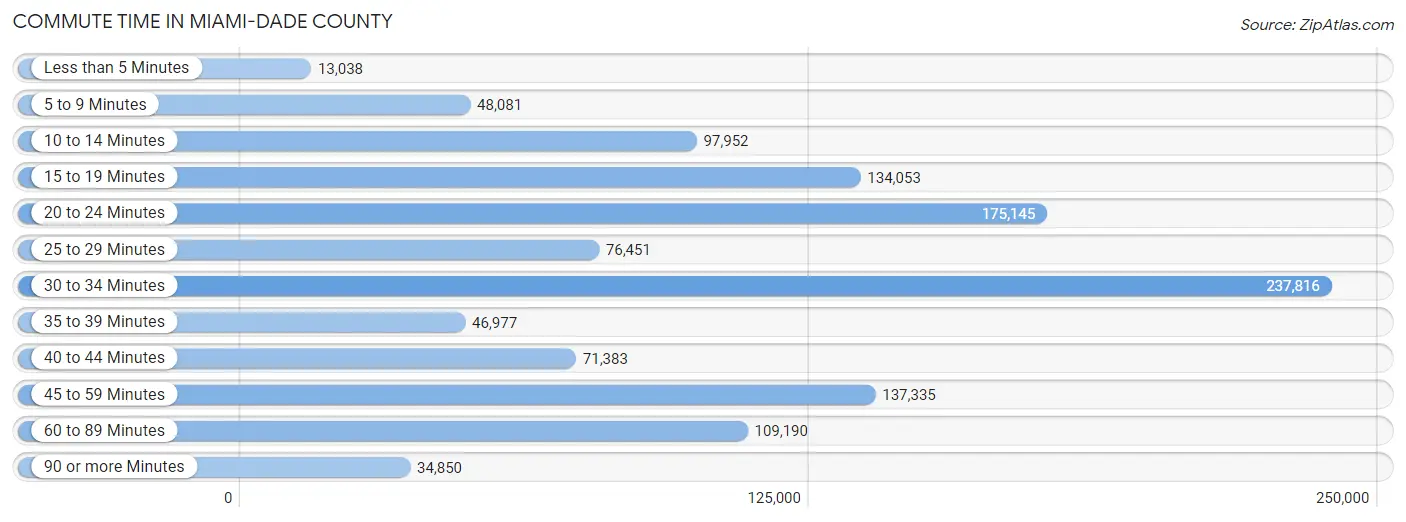
| Commute Time | # Commuters | % Commuters |
| Less than 5 Minutes | 13,038 | 1.1% |
| 5 to 9 Minutes | 48,081 | 4.1% |
| 10 to 14 Minutes | 97,952 | 8.3% |
| 15 to 19 Minutes | 134,053 | 11.3% |
| 20 to 24 Minutes | 175,145 | 14.8% |
| 25 to 29 Minutes | 76,451 | 6.5% |
| 30 to 34 Minutes | 237,816 | 20.1% |
| 35 to 39 Minutes | 46,977 | 4.0% |
| 40 to 44 Minutes | 71,383 | 6.0% |
| 45 to 59 Minutes | 137,335 | 11.6% |
| 60 to 89 Minutes | 109,190 | 9.2% |
| 90 or more Minutes | 34,850 | 2.9% |
Commute Time by Sex in Miami-Dade County
The most common commute times in Miami-Dade County are 30 to 34 minutes (130,144 commuters, 20.4%) for males and 30 to 34 minutes (107,672 commuters, 19.8%) for females.
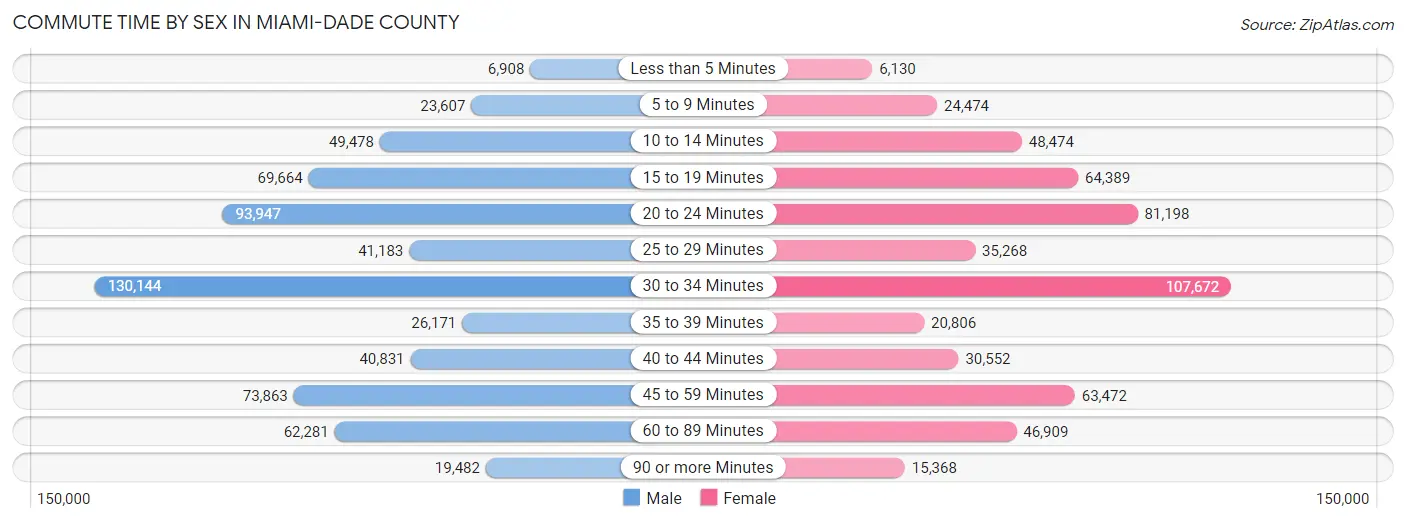
| Commute Time | Male | Female |
| Less than 5 Minutes | 6,908 (1.1%) | 6,130 (1.1%) |
| 5 to 9 Minutes | 23,607 (3.7%) | 24,474 (4.5%) |
| 10 to 14 Minutes | 49,478 (7.8%) | 48,474 (8.9%) |
| 15 to 19 Minutes | 69,664 (10.9%) | 64,389 (11.8%) |
| 20 to 24 Minutes | 93,947 (14.7%) | 81,198 (14.9%) |
| 25 to 29 Minutes | 41,183 (6.5%) | 35,268 (6.5%) |
| 30 to 34 Minutes | 130,144 (20.4%) | 107,672 (19.8%) |
| 35 to 39 Minutes | 26,171 (4.1%) | 20,806 (3.8%) |
| 40 to 44 Minutes | 40,831 (6.4%) | 30,552 (5.6%) |
| 45 to 59 Minutes | 73,863 (11.6%) | 63,472 (11.7%) |
| 60 to 89 Minutes | 62,281 (9.8%) | 46,909 (8.6%) |
| 90 or more Minutes | 19,482 (3.1%) | 15,368 (2.8%) |
Time of Departure to Work by Sex in Miami-Dade County
The most frequent times of departure to work in Miami-Dade County are 8:00 AM to 8:29 AM (104,482, 16.4%) for males and 8:00 AM to 8:29 AM (99,185, 18.2%) for females.
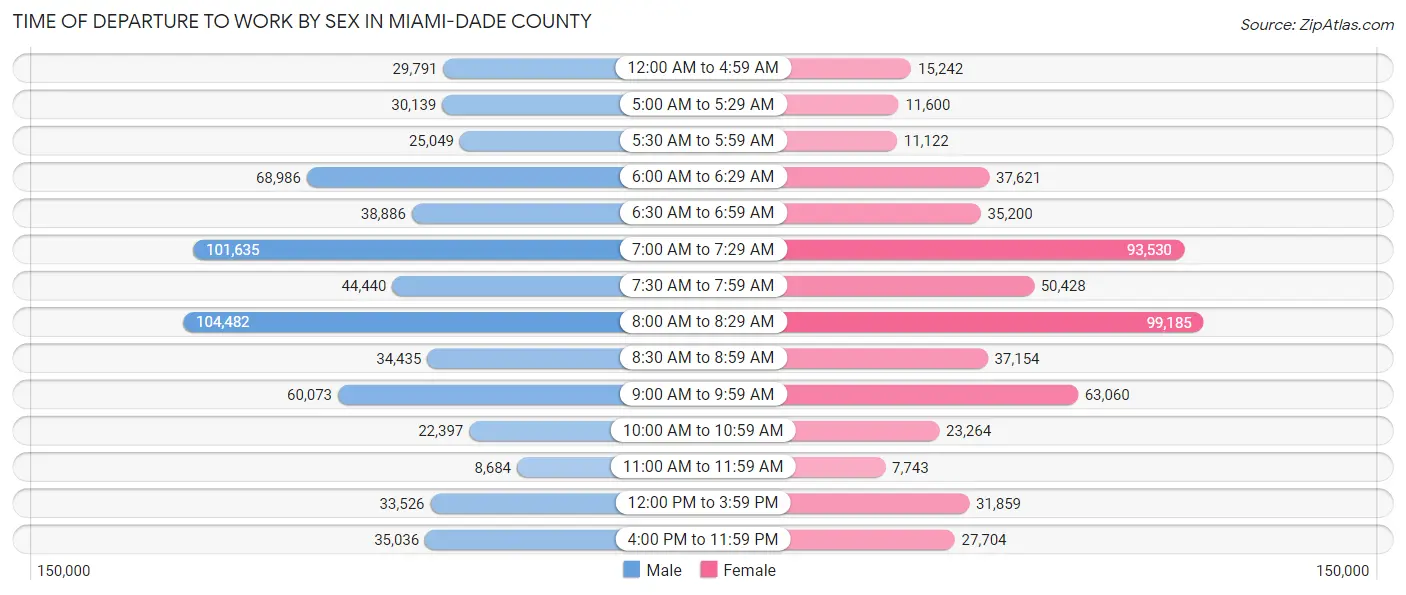
| Time of Departure | Male | Female |
| 12:00 AM to 4:59 AM | 29,791 (4.7%) | 15,242 (2.8%) |
| 5:00 AM to 5:29 AM | 30,139 (4.7%) | 11,600 (2.1%) |
| 5:30 AM to 5:59 AM | 25,049 (3.9%) | 11,122 (2.0%) |
| 6:00 AM to 6:29 AM | 68,986 (10.8%) | 37,621 (6.9%) |
| 6:30 AM to 6:59 AM | 38,886 (6.1%) | 35,200 (6.5%) |
| 7:00 AM to 7:29 AM | 101,635 (15.9%) | 93,530 (17.2%) |
| 7:30 AM to 7:59 AM | 44,440 (7.0%) | 50,428 (9.3%) |
| 8:00 AM to 8:29 AM | 104,482 (16.4%) | 99,185 (18.2%) |
| 8:30 AM to 8:59 AM | 34,435 (5.4%) | 37,154 (6.8%) |
| 9:00 AM to 9:59 AM | 60,073 (9.4%) | 63,060 (11.6%) |
| 10:00 AM to 10:59 AM | 22,397 (3.5%) | 23,264 (4.3%) |
| 11:00 AM to 11:59 AM | 8,684 (1.4%) | 7,743 (1.4%) |
| 12:00 PM to 3:59 PM | 33,526 (5.3%) | 31,859 (5.9%) |
| 4:00 PM to 11:59 PM | 35,036 (5.5%) | 27,704 (5.1%) |
| Total | 637,559 (100.0%) | 544,712 (100.0%) |
Housing Occupancy in Miami-Dade County
Occupancy by Ownership in Miami-Dade County
Of the total 952,680 dwellings in Miami-Dade County, owner-occupied units account for 494,141 (51.9%), while renter-occupied units make up 458,539 (48.1%).
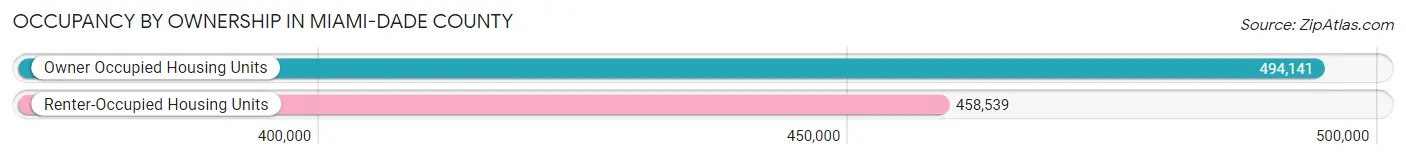
| Occupancy | # Housing Units | % Housing Units |
| Owner Occupied Housing Units | 494,141 | 51.9% |
| Renter-Occupied Housing Units | 458,539 | 48.1% |
| Total Occupied Housing Units | 952,680 | 100.0% |
Occupancy by Household Size in Miami-Dade County
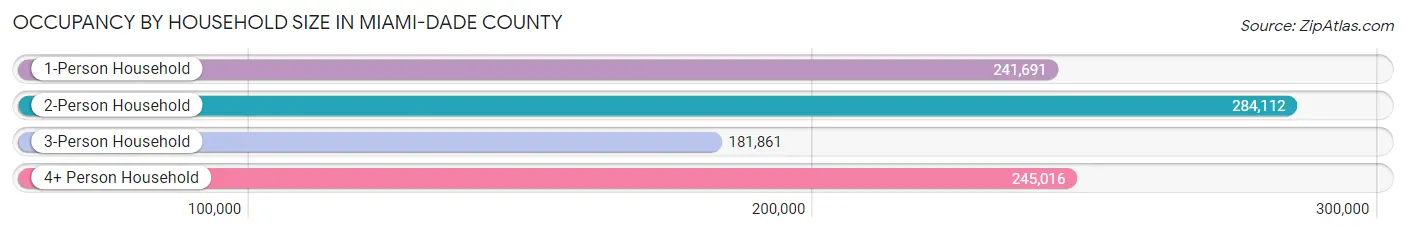
| Household Size | # Housing Units | % Housing Units |
| 1-Person Household | 241,691 | 25.4% |
| 2-Person Household | 284,112 | 29.8% |
| 3-Person Household | 181,861 | 19.1% |
| 4+ Person Household | 245,016 | 25.7% |
| Total Housing Units | 952,680 | 100.0% |
Occupancy by Ownership by Household Size in Miami-Dade County
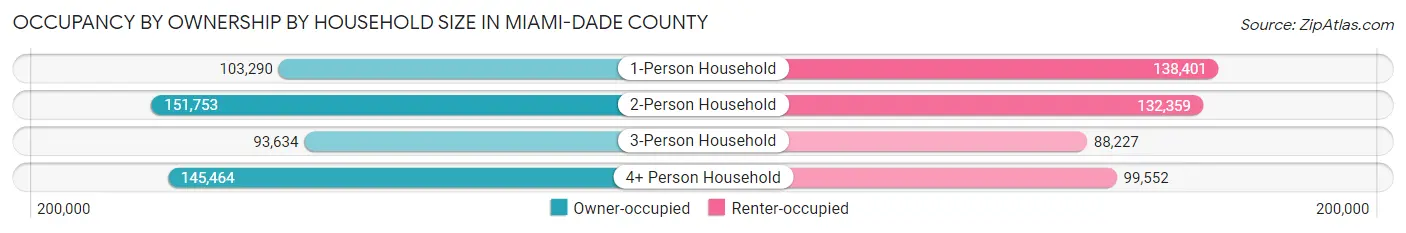
| Household Size | Owner-occupied | Renter-occupied |
| 1-Person Household | 103,290 (42.7%) | 138,401 (57.3%) |
| 2-Person Household | 151,753 (53.4%) | 132,359 (46.6%) |
| 3-Person Household | 93,634 (51.5%) | 88,227 (48.5%) |
| 4+ Person Household | 145,464 (59.4%) | 99,552 (40.6%) |
| Total Housing Units | 494,141 (51.9%) | 458,539 (48.1%) |
Occupancy by Educational Attainment in Miami-Dade County
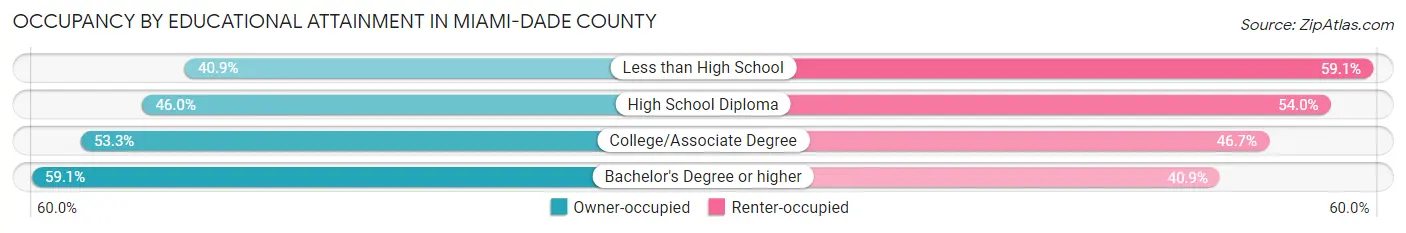
| Household Size | Owner-occupied | Renter-occupied |
| Less than High School | 58,677 (40.9%) | 84,754 (59.1%) |
| High School Diploma | 101,746 (46.0%) | 119,576 (54.0%) |
| College/Associate Degree | 127,043 (53.3%) | 111,374 (46.7%) |
| Bachelor's Degree or higher | 206,675 (59.1%) | 142,835 (40.9%) |
Occupancy by Age of Householder in Miami-Dade County
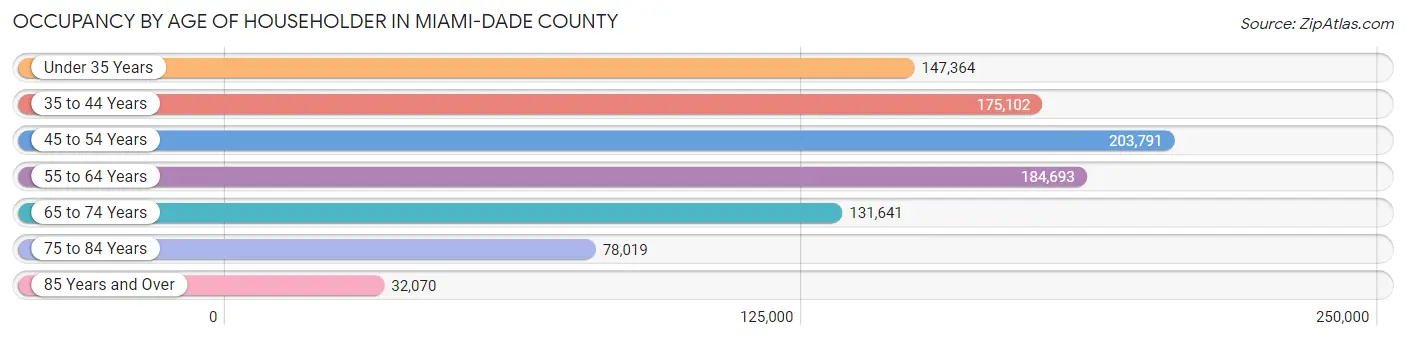
| Age Bracket | # Households | % Households |
| Under 35 Years | 147,364 | 15.5% |
| 35 to 44 Years | 175,102 | 18.4% |
| 45 to 54 Years | 203,791 | 21.4% |
| 55 to 64 Years | 184,693 | 19.4% |
| 65 to 74 Years | 131,641 | 13.8% |
| 75 to 84 Years | 78,019 | 8.2% |
| 85 Years and Over | 32,070 | 3.4% |
| Total | 952,680 | 100.0% |
Housing Finances in Miami-Dade County
Median Income by Occupancy in Miami-Dade County
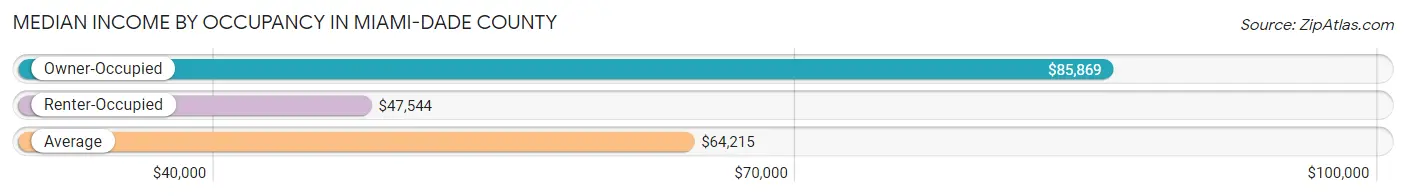
| Occupancy Type | # Households | Median Income |
| Owner-Occupied | 494,141 (51.9%) | $85,869 |
| Renter-Occupied | 458,539 (48.1%) | $47,544 |
| Average | 952,680 (100.0%) | $64,215 |
Occupancy by Householder Income Bracket in Miami-Dade County
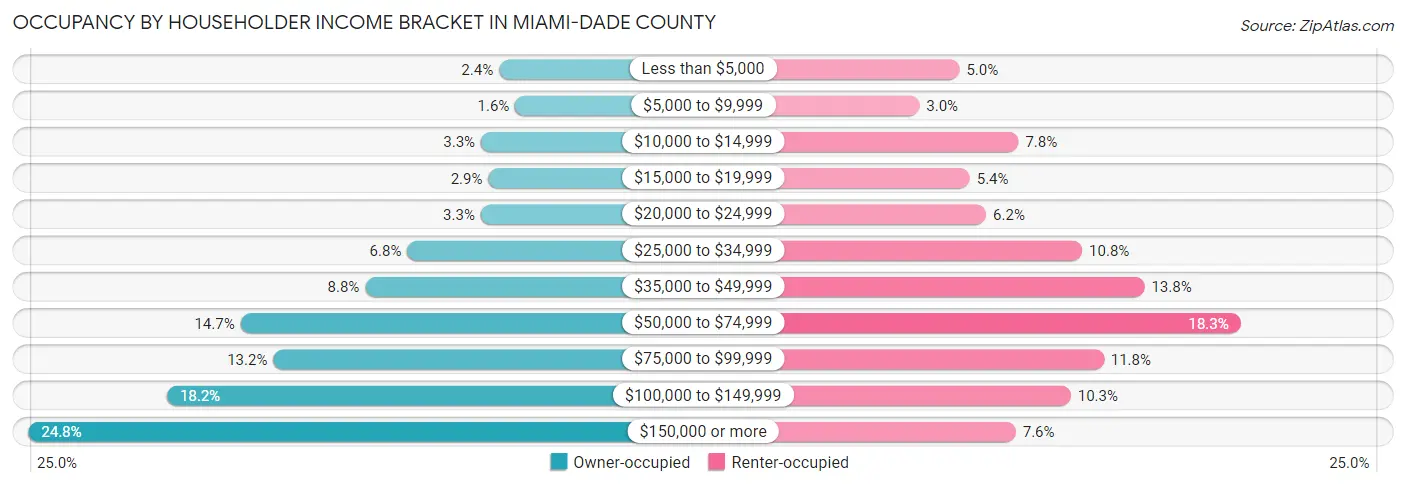
| Income Bracket | Owner-occupied | Renter-occupied |
| Less than $5,000 | 11,893 (2.4%) | 22,700 (5.0%) |
| $5,000 to $9,999 | 8,107 (1.6%) | 13,941 (3.0%) |
| $10,000 to $14,999 | 16,151 (3.3%) | 35,595 (7.8%) |
| $15,000 to $19,999 | 14,451 (2.9%) | 24,956 (5.4%) |
| $20,000 to $24,999 | 16,221 (3.3%) | 28,504 (6.2%) |
| $25,000 to $34,999 | 33,486 (6.8%) | 49,485 (10.8%) |
| $35,000 to $49,999 | 43,400 (8.8%) | 63,110 (13.8%) |
| $50,000 to $74,999 | 72,762 (14.7%) | 84,049 (18.3%) |
| $75,000 to $99,999 | 65,017 (13.2%) | 54,206 (11.8%) |
| $100,000 to $149,999 | 90,008 (18.2%) | 46,997 (10.2%) |
| $150,000 or more | 122,645 (24.8%) | 34,996 (7.6%) |
| Total | 494,141 (100.0%) | 458,539 (100.0%) |
Monthly Housing Cost Tiers in Miami-Dade County
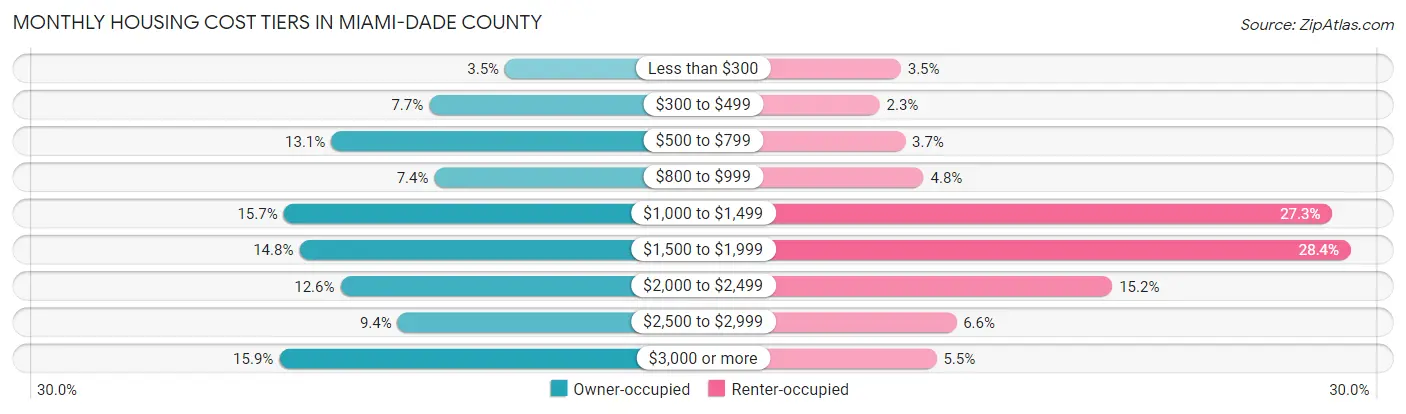
| Monthly Cost | Owner-occupied | Renter-occupied |
| Less than $300 | 17,146 (3.5%) | 16,034 (3.5%) |
| $300 to $499 | 37,842 (7.7%) | 10,688 (2.3%) |
| $500 to $799 | 64,582 (13.1%) | 17,129 (3.7%) |
| $800 to $999 | 36,442 (7.4%) | 21,844 (4.8%) |
| $1,000 to $1,499 | 77,599 (15.7%) | 125,313 (27.3%) |
| $1,500 to $1,999 | 73,305 (14.8%) | 130,062 (28.4%) |
| $2,000 to $2,499 | 62,045 (12.6%) | 69,605 (15.2%) |
| $2,500 to $2,999 | 46,427 (9.4%) | 30,065 (6.6%) |
| $3,000 or more | 78,753 (15.9%) | 25,091 (5.5%) |
| Total | 494,141 (100.0%) | 458,539 (100.0%) |
Physical Housing Characteristics in Miami-Dade County
Housing Structures in Miami-Dade County
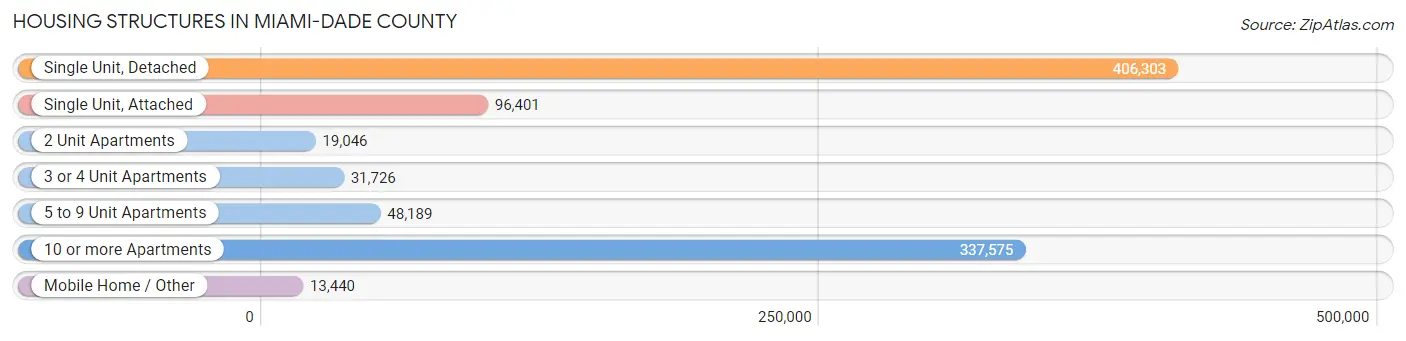
| Structure Type | # Housing Units | % Housing Units |
| Single Unit, Detached | 406,303 | 42.6% |
| Single Unit, Attached | 96,401 | 10.1% |
| 2 Unit Apartments | 19,046 | 2.0% |
| 3 or 4 Unit Apartments | 31,726 | 3.3% |
| 5 to 9 Unit Apartments | 48,189 | 5.1% |
| 10 or more Apartments | 337,575 | 35.4% |
| Mobile Home / Other | 13,440 | 1.4% |
| Total | 952,680 | 100.0% |
Housing Structures by Occupancy in Miami-Dade County
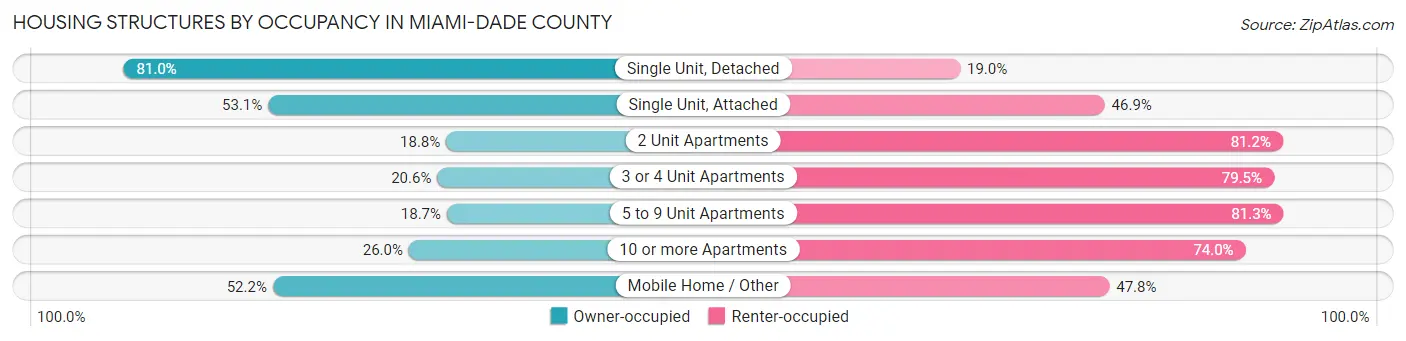
| Structure Type | Owner-occupied | Renter-occupied |
| Single Unit, Detached | 328,952 (81.0%) | 77,351 (19.0%) |
| Single Unit, Attached | 51,206 (53.1%) | 45,195 (46.9%) |
| 2 Unit Apartments | 3,588 (18.8%) | 15,458 (81.2%) |
| 3 or 4 Unit Apartments | 6,520 (20.5%) | 25,206 (79.4%) |
| 5 to 9 Unit Apartments | 9,011 (18.7%) | 39,178 (81.3%) |
| 10 or more Apartments | 87,846 (26.0%) | 249,729 (74.0%) |
| Mobile Home / Other | 7,018 (52.2%) | 6,422 (47.8%) |
| Total | 494,141 (51.9%) | 458,539 (48.1%) |
Housing Structures by Number of Rooms in Miami-Dade County
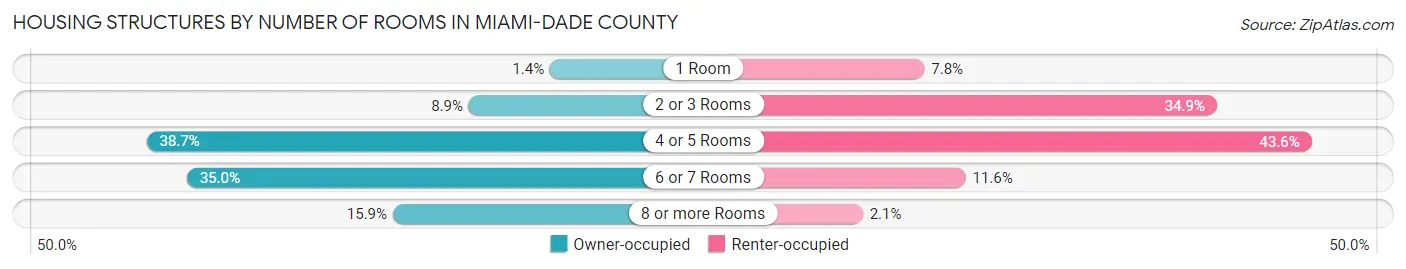
| Number of Rooms | Owner-occupied | Renter-occupied |
| 1 Room | 6,903 (1.4%) | 35,789 (7.8%) |
| 2 or 3 Rooms | 44,100 (8.9%) | 159,819 (34.8%) |
| 4 or 5 Rooms | 191,402 (38.7%) | 200,003 (43.6%) |
| 6 or 7 Rooms | 172,950 (35.0%) | 53,266 (11.6%) |
| 8 or more Rooms | 78,786 (15.9%) | 9,662 (2.1%) |
| Total | 494,141 (100.0%) | 458,539 (100.0%) |
Housing Structure by Heating Type in Miami-Dade County
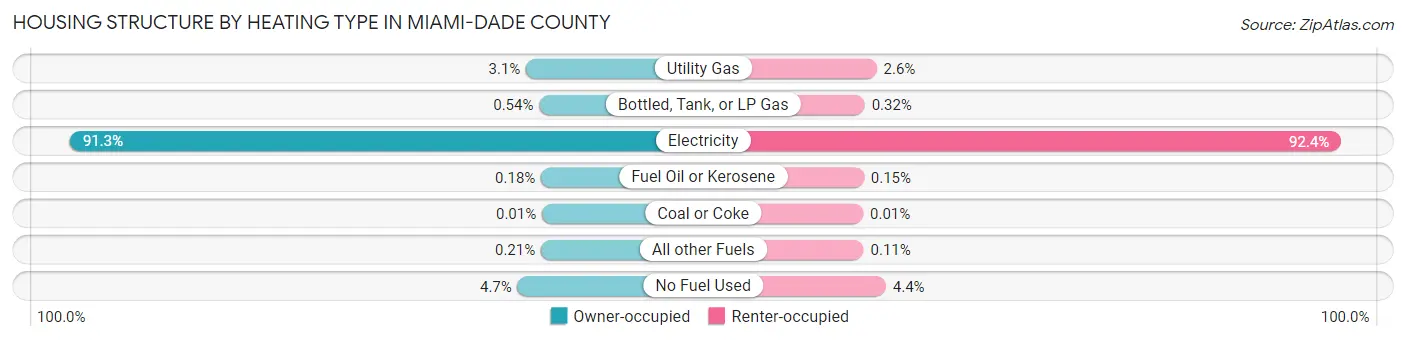
| Heating Type | Owner-occupied | Renter-occupied |
| Utility Gas | 15,183 (3.1%) | 11,991 (2.6%) |
| Bottled, Tank, or LP Gas | 2,692 (0.5%) | 1,488 (0.3%) |
| Electricity | 450,936 (91.3%) | 423,617 (92.4%) |
| Fuel Oil or Kerosene | 888 (0.2%) | 703 (0.2%) |
| Coal or Coke | 31 (0.0%) | 31 (0.0%) |
| All other Fuels | 1,061 (0.2%) | 483 (0.1%) |
| No Fuel Used | 23,350 (4.7%) | 20,226 (4.4%) |
| Total | 494,141 (100.0%) | 458,539 (100.0%) |
Household Vehicle Usage in Miami-Dade County
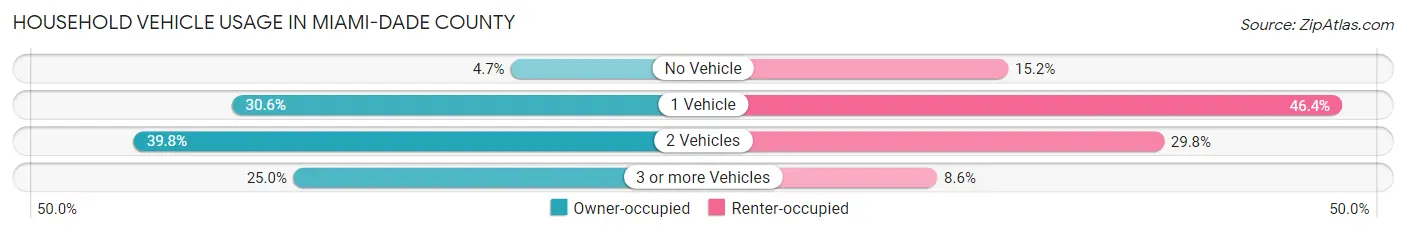
| Vehicles per Household | Owner-occupied | Renter-occupied |
| No Vehicle | 22,987 (4.6%) | 69,837 (15.2%) |
| 1 Vehicle | 151,110 (30.6%) | 212,708 (46.4%) |
| 2 Vehicles | 196,668 (39.8%) | 136,521 (29.8%) |
| 3 or more Vehicles | 123,376 (25.0%) | 39,473 (8.6%) |
| Total | 494,141 (100.0%) | 458,539 (100.0%) |
Real Estate & Mortgages in Miami-Dade County
Real Estate and Mortgage Overview in Miami-Dade County
| Characteristic | Without Mortgage | With Mortgage |
| Housing Units | 197,486 | 296,655 |
| Median Property Value | $373,100 | $395,100 |
| Median Household Income | $66,308 | $84,699 |
| Monthly Housing Costs | $722 | $72,039 |
| Real Estate Taxes | $2,807 | $7,235 |
Property Value by Mortgage Status in Miami-Dade County
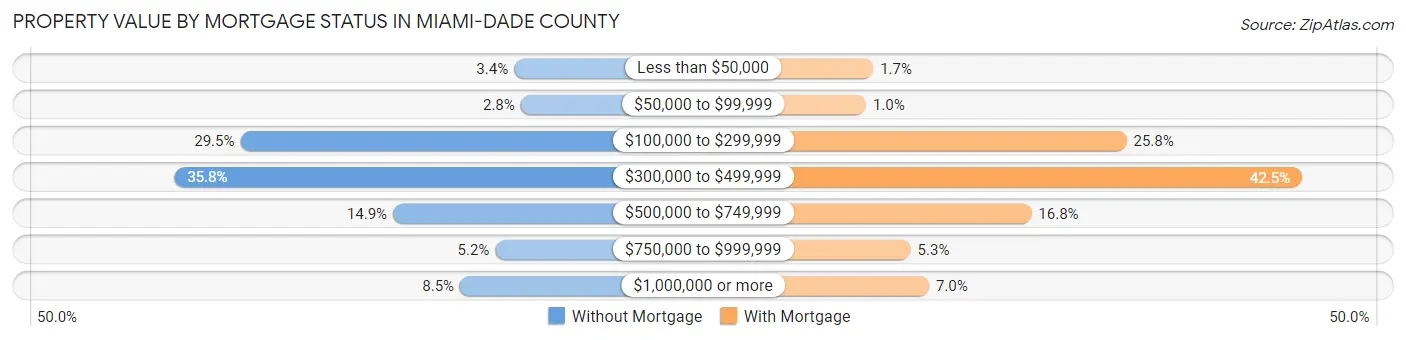
| Property Value | Without Mortgage | With Mortgage |
| Less than $50,000 | 6,702 (3.4%) | 4,989 (1.7%) |
| $50,000 to $99,999 | 5,447 (2.8%) | 2,954 (1.0%) |
| $100,000 to $299,999 | 58,177 (29.5%) | 76,554 (25.8%) |
| $300,000 to $499,999 | 70,601 (35.7%) | 126,140 (42.5%) |
| $500,000 to $749,999 | 29,470 (14.9%) | 49,704 (16.8%) |
| $750,000 to $999,999 | 10,220 (5.2%) | 15,564 (5.2%) |
| $1,000,000 or more | 16,869 (8.5%) | 20,750 (7.0%) |
| Total | 197,486 (100.0%) | 296,655 (100.0%) |
Household Income by Mortgage Status in Miami-Dade County
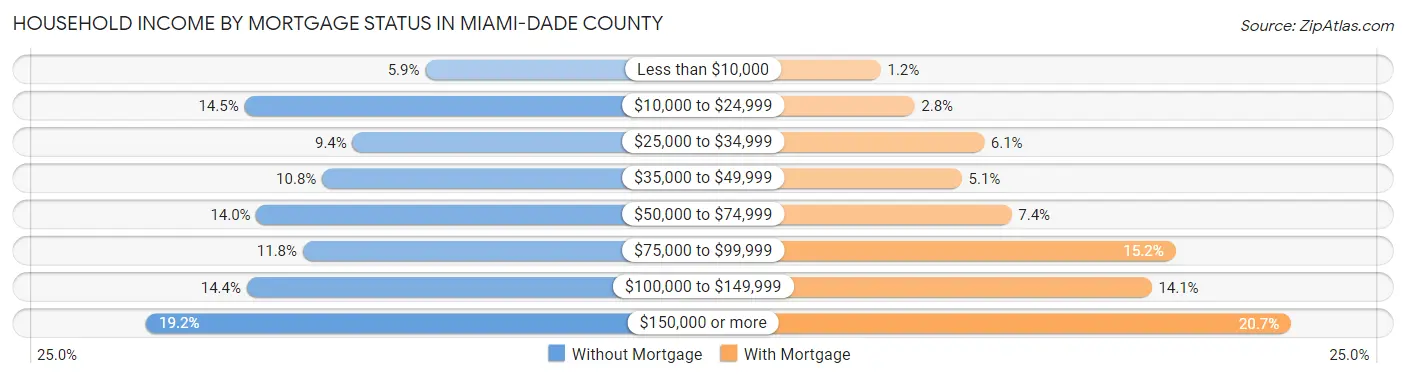
| Household Income | Without Mortgage | With Mortgage |
| Less than $10,000 | 11,697 (5.9%) | 3,542 (1.2%) |
| $10,000 to $24,999 | 28,690 (14.5%) | 8,303 (2.8%) |
| $25,000 to $34,999 | 18,518 (9.4%) | 18,133 (6.1%) |
| $35,000 to $49,999 | 21,392 (10.8%) | 14,968 (5.1%) |
| $50,000 to $74,999 | 27,561 (14.0%) | 22,008 (7.4%) |
| $75,000 to $99,999 | 23,214 (11.7%) | 45,201 (15.2%) |
| $100,000 to $149,999 | 28,468 (14.4%) | 41,803 (14.1%) |
| $150,000 or more | 37,946 (19.2%) | 61,540 (20.7%) |
| Total | 197,486 (100.0%) | 296,655 (100.0%) |
Property Value to Household Income Ratio in Miami-Dade County
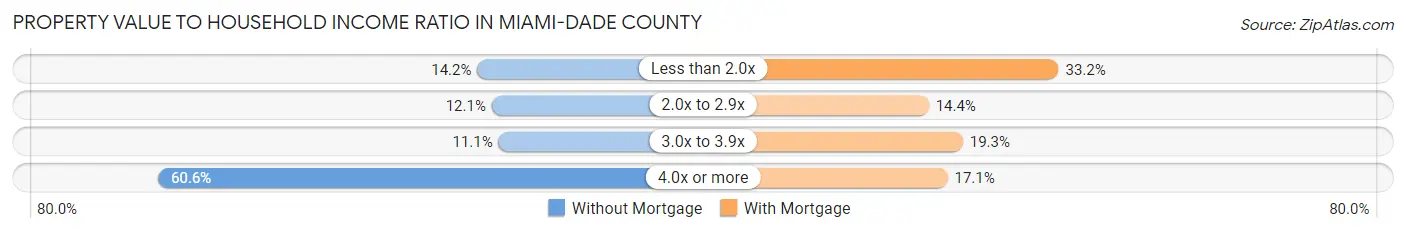
| Value-to-Income Ratio | Without Mortgage | With Mortgage |
| Less than 2.0x | 28,103 (14.2%) | 98,552 (33.2%) |
| 2.0x to 2.9x | 23,964 (12.1%) | 42,561 (14.3%) |
| 3.0x to 3.9x | 22,001 (11.1%) | 57,293 (19.3%) |
| 4.0x or more | 119,716 (60.6%) | 50,688 (17.1%) |
| Total | 197,486 (100.0%) | 296,655 (100.0%) |
Real Estate Taxes by Mortgage Status in Miami-Dade County
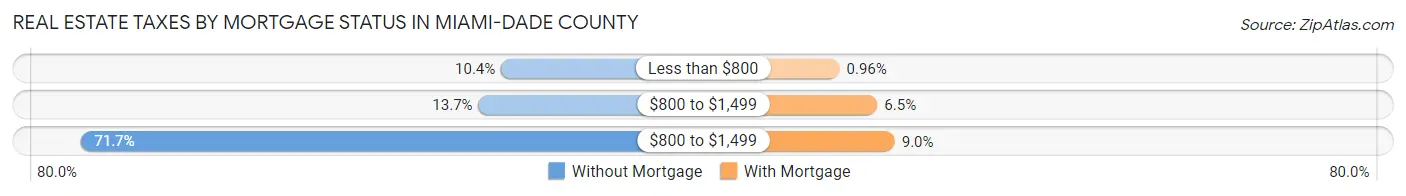
| Property Taxes | Without Mortgage | With Mortgage |
| Less than $800 | 20,486 (10.4%) | 2,860 (1.0%) |
| $800 to $1,499 | 27,029 (13.7%) | 19,232 (6.5%) |
| $800 to $1,499 | 141,596 (71.7%) | 26,765 (9.0%) |
| Total | 197,486 (100.0%) | 296,655 (100.0%) |
Health & Disability in Miami-Dade County
Health Insurance Coverage by Age in Miami-Dade County
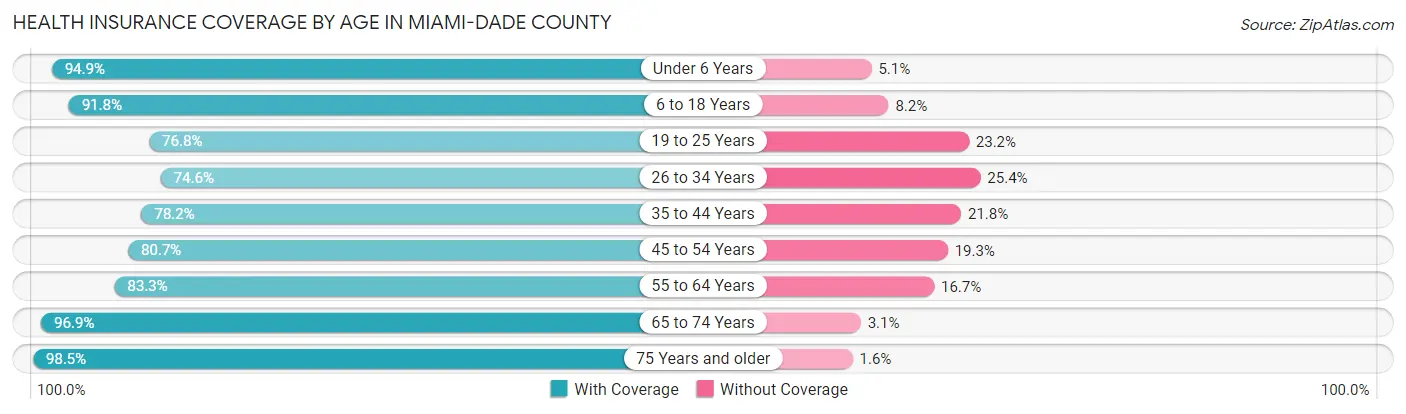
| Age Bracket | With Coverage | Without Coverage |
| Under 6 Years | 167,800 (94.9%) | 8,943 (5.1%) |
| 6 to 18 Years | 363,050 (91.8%) | 32,593 (8.2%) |
| 19 to 25 Years | 176,340 (76.8%) | 53,374 (23.2%) |
| 26 to 34 Years | 246,454 (74.6%) | 83,816 (25.4%) |
| 35 to 44 Years | 285,365 (78.2%) | 79,405 (21.8%) |
| 45 to 54 Years | 310,858 (80.7%) | 74,252 (19.3%) |
| 55 to 64 Years | 287,232 (83.3%) | 57,738 (16.7%) |
| 65 to 74 Years | 230,768 (96.9%) | 7,316 (3.1%) |
| 75 Years and older | 195,599 (98.5%) | 3,078 (1.5%) |
| Total | 2,263,466 (85.0%) | 400,515 (15.0%) |
Health Insurance Coverage by Citizenship Status in Miami-Dade County
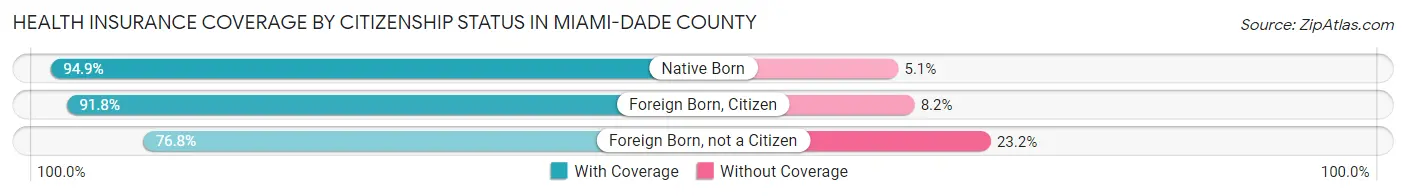
| Citizenship Status | With Coverage | Without Coverage |
| Native Born | 167,800 (94.9%) | 8,943 (5.1%) |
| Foreign Born, Citizen | 363,050 (91.8%) | 32,593 (8.2%) |
| Foreign Born, not a Citizen | 176,340 (76.8%) | 53,374 (23.2%) |
Health Insurance Coverage by Household Income in Miami-Dade County
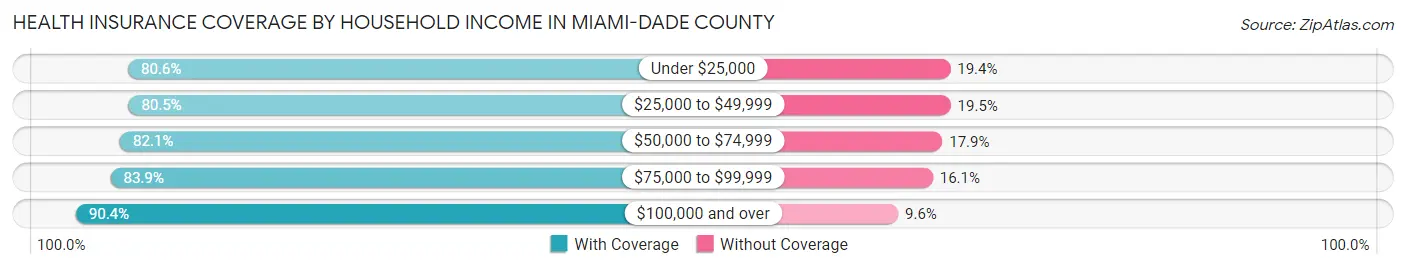
| Household Income | With Coverage | Without Coverage |
| Under $25,000 | 288,971 (80.6%) | 69,507 (19.4%) |
| $25,000 to $49,999 | 380,439 (80.5%) | 91,918 (19.5%) |
| $50,000 to $74,999 | 366,343 (82.1%) | 79,867 (17.9%) |
| $75,000 to $99,999 | 309,188 (83.9%) | 59,366 (16.1%) |
| $100,000 and over | 898,146 (90.4%) | 95,513 (9.6%) |
Public vs Private Health Insurance Coverage by Age in Miami-Dade County
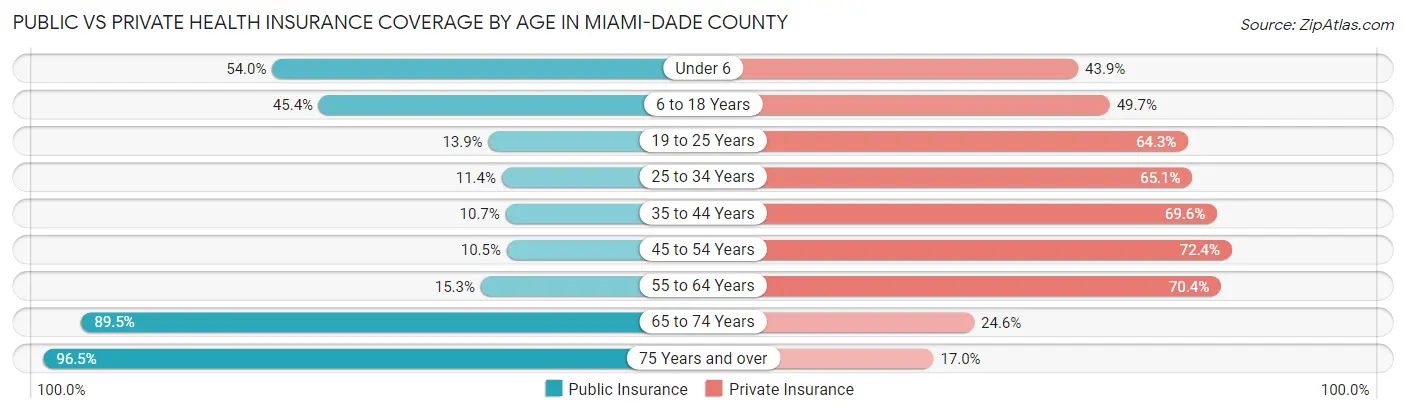
| Age Bracket | Public Insurance | Private Insurance |
| Under 6 | 95,477 (54.0%) | 77,544 (43.9%) |
| 6 to 18 Years | 179,511 (45.4%) | 196,748 (49.7%) |
| 19 to 25 Years | 31,922 (13.9%) | 147,679 (64.3%) |
| 25 to 34 Years | 37,720 (11.4%) | 214,830 (65.0%) |
| 35 to 44 Years | 39,087 (10.7%) | 254,013 (69.6%) |
| 45 to 54 Years | 40,448 (10.5%) | 278,808 (72.4%) |
| 55 to 64 Years | 52,871 (15.3%) | 242,862 (70.4%) |
| 65 to 74 Years | 212,962 (89.4%) | 58,463 (24.6%) |
| 75 Years and over | 191,740 (96.5%) | 33,799 (17.0%) |
| Total | 881,738 (33.1%) | 1,504,746 (56.5%) |
Disability Status by Sex by Age in Miami-Dade County
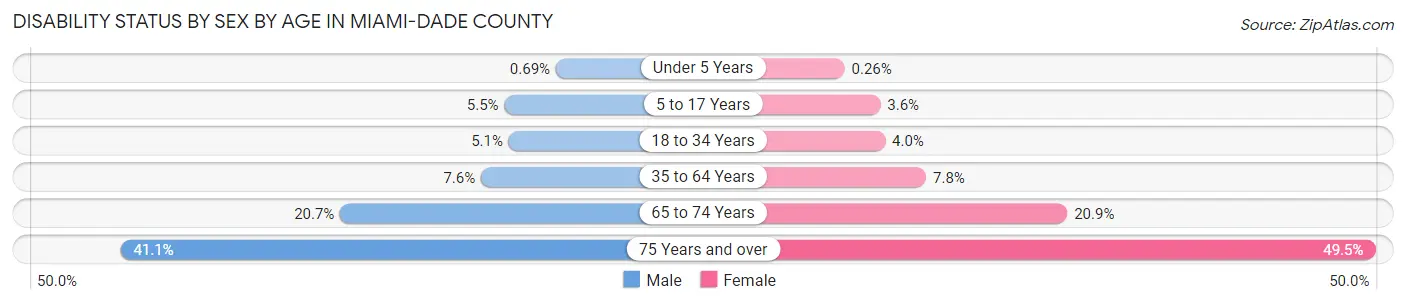
| Age Bracket | Male | Female |
| Under 5 Years | 522 (0.7%) | 190 (0.3%) |
| 5 to 17 Years | 10,902 (5.5%) | 6,877 (3.6%) |
| 18 to 34 Years | 15,240 (5.1%) | 11,701 (4.0%) |
| 35 to 64 Years | 41,496 (7.6%) | 43,125 (7.8%) |
| 65 to 74 Years | 21,918 (20.7%) | 27,659 (20.9%) |
| 75 Years and over | 31,563 (41.1%) | 60,351 (49.5%) |
Disability Class by Sex by Age in Miami-Dade County
Disability Class: Hearing Difficulty
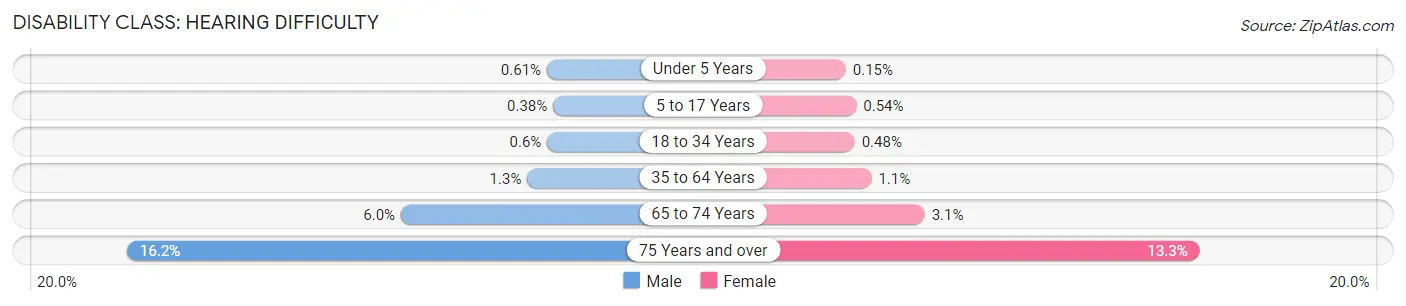
| Age Bracket | Male | Female |
| Under 5 Years | 464 (0.6%) | 108 (0.2%) |
| 5 to 17 Years | 752 (0.4%) | 1,033 (0.5%) |
| 18 to 34 Years | 1,810 (0.6%) | 1,390 (0.5%) |
| 35 to 64 Years | 7,267 (1.3%) | 6,093 (1.1%) |
| 65 to 74 Years | 6,388 (6.0%) | 4,076 (3.1%) |
| 75 Years and over | 12,443 (16.2%) | 16,181 (13.3%) |
Disability Class: Vision Difficulty
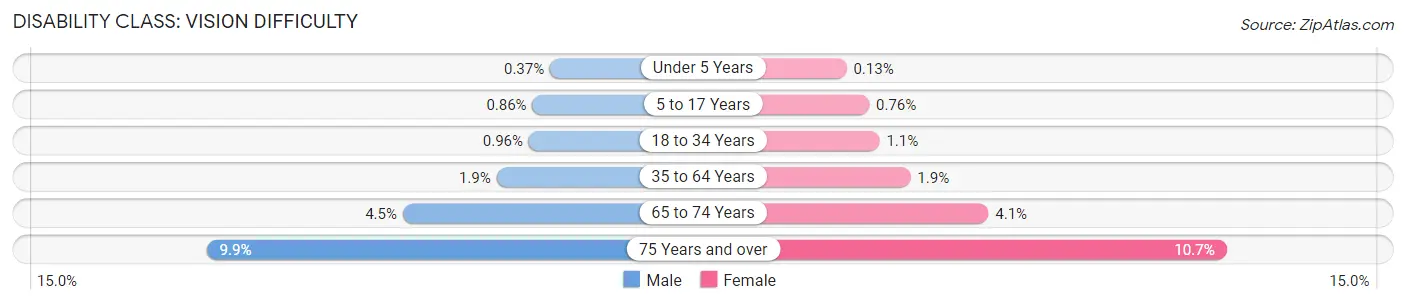
| Age Bracket | Male | Female |
| Under 5 Years | 280 (0.4%) | 92 (0.1%) |
| 5 to 17 Years | 1,710 (0.9%) | 1,455 (0.8%) |
| 18 to 34 Years | 2,883 (1.0%) | 3,044 (1.1%) |
| 35 to 64 Years | 10,110 (1.9%) | 10,566 (1.9%) |
| 65 to 74 Years | 4,730 (4.5%) | 5,400 (4.1%) |
| 75 Years and over | 7,622 (9.9%) | 13,052 (10.7%) |
Disability Class: Cognitive Difficulty
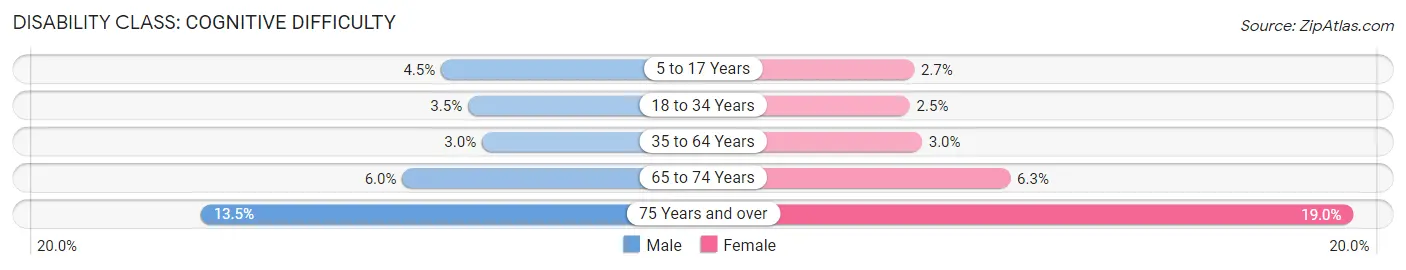
| Age Bracket | Male | Female |
| 5 to 17 Years | 9,056 (4.5%) | 5,144 (2.7%) |
| 18 to 34 Years | 10,649 (3.5%) | 7,331 (2.5%) |
| 35 to 64 Years | 16,418 (3.0%) | 16,379 (3.0%) |
| 65 to 74 Years | 6,334 (6.0%) | 8,270 (6.2%) |
| 75 Years and over | 10,333 (13.5%) | 23,150 (19.0%) |
Disability Class: Ambulatory Difficulty
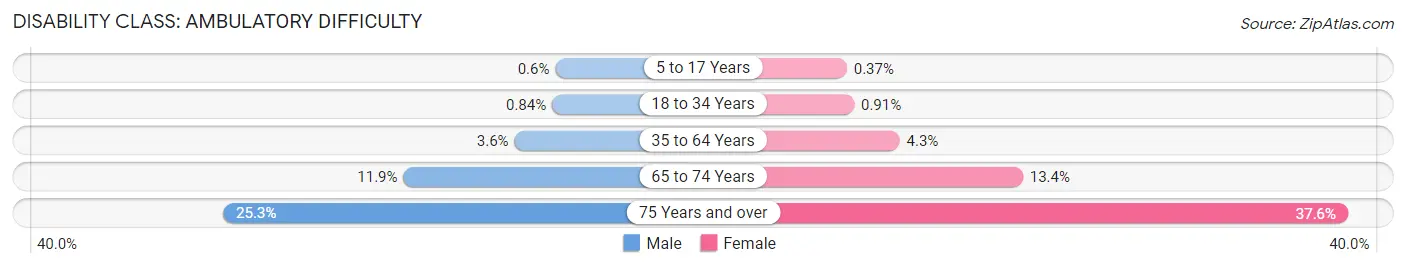
| Age Bracket | Male | Female |
| 5 to 17 Years | 1,195 (0.6%) | 715 (0.4%) |
| 18 to 34 Years | 2,541 (0.8%) | 2,644 (0.9%) |
| 35 to 64 Years | 19,701 (3.6%) | 23,693 (4.3%) |
| 65 to 74 Years | 12,573 (11.9%) | 17,777 (13.4%) |
| 75 Years and over | 19,394 (25.3%) | 45,792 (37.6%) |
Disability Class: Self-Care Difficulty
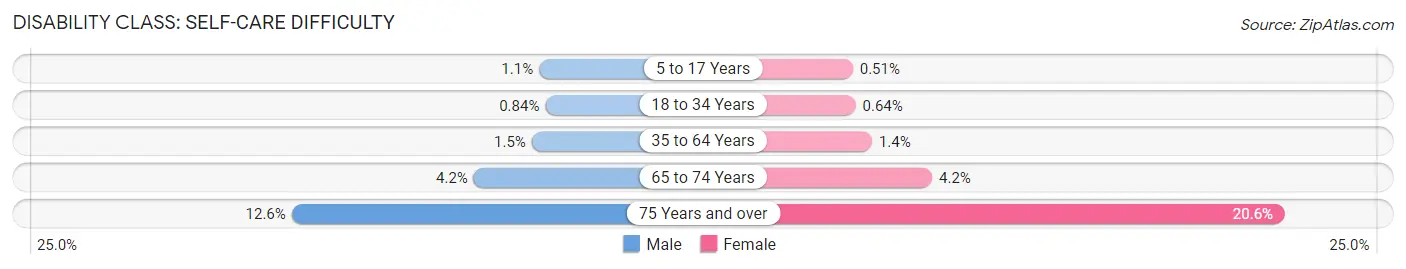
| Age Bracket | Male | Female |
| 5 to 17 Years | 2,252 (1.1%) | 982 (0.5%) |
| 18 to 34 Years | 2,527 (0.8%) | 1,873 (0.6%) |
| 35 to 64 Years | 8,002 (1.5%) | 7,698 (1.4%) |
| 65 to 74 Years | 4,406 (4.2%) | 5,535 (4.2%) |
| 75 Years and over | 9,682 (12.6%) | 25,055 (20.6%) |
Technology Access in Miami-Dade County
Computing Device Access in Miami-Dade County
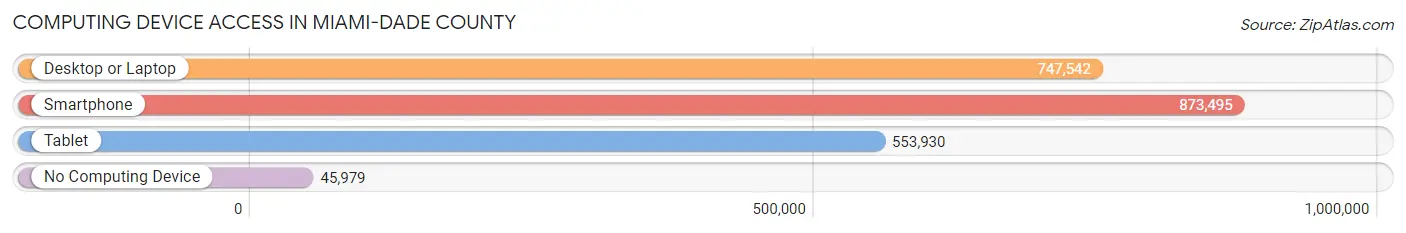
| Device Type | # Households | % Households |
| Desktop or Laptop | 747,542 | 78.5% |
| Smartphone | 873,495 | 91.7% |
| Tablet | 553,930 | 58.1% |
| No Computing Device | 45,979 | 4.8% |
| Total | 952,680 | 100.0% |
Internet Access in Miami-Dade County
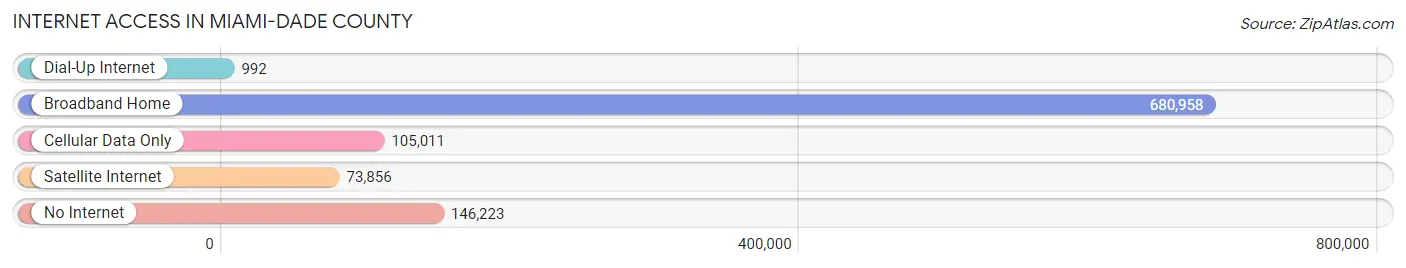
| Internet Type | # Households | % Households |
| Dial-Up Internet | 992 | 0.1% |
| Broadband Home | 680,958 | 71.5% |
| Cellular Data Only | 105,011 | 11.0% |
| Satellite Internet | 73,856 | 7.7% |
| No Internet | 146,223 | 15.3% |
| Total | 952,680 | 100.0% |
Miami-Dade County Summary
Miami-Dade County, FL is located in the southeastern corner of the state of Florida and is the most populous county in the state. It is bordered by Broward County to the north, Monroe County to the south, and Collier County to the west. The county seat is Miami, and the county is home to over 2.7 million people.
History
Miami-Dade County was created in 1836 as part of the Florida Territory. It was originally part of Monroe County, but was split off in 1844. The county was named after Major Francis L. Dade, who was killed in the Second Seminole War in 1835.
In the late 19th century, the county experienced a population boom due to the arrival of immigrants from the Bahamas and Cuba. This influx of people helped to shape the culture of the county, and it remains a diverse and vibrant place today.
In the early 20th century, the county experienced a period of rapid growth and development. This was due to the construction of the Florida East Coast Railway, which connected Miami to the rest of the state. This allowed for the development of the tourism industry, which has been a major driver of the county’s economy ever since.
Geography
Miami-Dade County covers an area of 2,431 square miles, making it the largest county in the state. It is located in the southeastern corner of the state, and is bordered by the Atlantic Ocean to the east and the Everglades to the west.
The county is divided into 34 municipalities, including the cities of Miami, Miami Beach, Hialeah, and Coral Gables. The county also includes several unincorporated areas, such as Kendall and Homestead.
The county is home to a variety of landscapes, from the urban areas of Miami to the rural areas of the Everglades. The county is also home to several islands, including Key Biscayne, Virginia Key, and Fisher Island.
Economy
Miami-Dade County has a diverse and vibrant economy. The county is home to several major industries, including tourism, finance, trade, and manufacturing.
Tourism is a major driver of the county’s economy. The county is home to several popular tourist destinations, including Miami Beach, South Beach, and the Everglades. The county also hosts several major events, such as the Miami International Boat Show and the Miami Open tennis tournament.
The county is also home to several major financial institutions, including Bank of America, Citibank, and Wells Fargo. The county is also home to several major trade centers, such as the Port of Miami and the Miami International Airport.
The county is also home to several major manufacturing companies, including Ryder Systems, Royal Caribbean Cruise Lines, and Burger King.
Demographics
As of 2019, Miami-Dade County had a population of 2,716,940 people. The population is diverse, with the largest ethnic groups being Hispanic (63.2%), White (19.7%), and Black (14.3%).
The median household income in the county is $50,867, and the median home value is $269,000. The unemployment rate is 4.2%, and the poverty rate is 17.2%.
Conclusion
Miami-Dade County, FL is a vibrant and diverse county located in the southeastern corner of the state. It has a rich history, and its economy is driven by tourism, finance, trade, and manufacturing. The county is home to a diverse population, and its median household income and home value are higher than the state average.
Common Questions
What is Per Capita Income in Miami-Dade County?
Per Capita income in Miami-Dade County is $35,563.
What is the Median Family Income in Miami-Dade County?
Median Family Income in Miami-Dade County is $71,621.
What is the Median Household income in Miami-Dade County?
Median Household Income in Miami-Dade County is $64,215.
What is Income or Wage Gap in Miami-Dade County?
Income or Wage Gap in Miami-Dade County is 21.8%.
Women in Miami-Dade County earn 78.2 cents for every dollar earned by a man.
What is Family Income Deficit in Miami-Dade County?
Family Income Deficit in Miami-Dade County is $9,746.
Families that are below poverty line in Miami-Dade County earn $9,746 less on average than the poverty threshold level.
What is Inequality or Gini Index in Miami-Dade County?
Inequality or Gini Index in Miami-Dade County is 0.52.
What is the Total Population of Miami-Dade County?
Total Population of Miami-Dade County is 2,688,237.
What is the Total Male Population of Miami-Dade County?
Total Male Population of Miami-Dade County is 1,318,559.
What is the Total Female Population of Miami-Dade County?
Total Female Population of Miami-Dade County is 1,369,678.
What is the Ratio of Males per 100 Females in Miami-Dade County?
There are 96.27 Males per 100 Females in Miami-Dade County.
What is the Ratio of Females per 100 Males in Miami-Dade County?
There are 103.88 Females per 100 Males in Miami-Dade County.
What is the Median Population Age in Miami-Dade County?
Median Population Age in Miami-Dade County is 40.6 Years.
What is the Average Family Size in Miami-Dade County
Average Family Size in Miami-Dade County is 3.3 People.
What is the Average Household Size in Miami-Dade County
Average Household Size in Miami-Dade County is 2.8 People.
How Large is the Labor Force in Miami-Dade County?
There are 1,410,620 People in the Labor Forcein in Miami-Dade County.
What is the Percentage of People in the Labor Force in Miami-Dade County?
63.8% of People are in the Labor Force in Miami-Dade County.
What is the Unemployment Rate in Miami-Dade County?
Unemployment Rate in Miami-Dade County is 4.6%.