St. Johns County, FL Map & Demographics
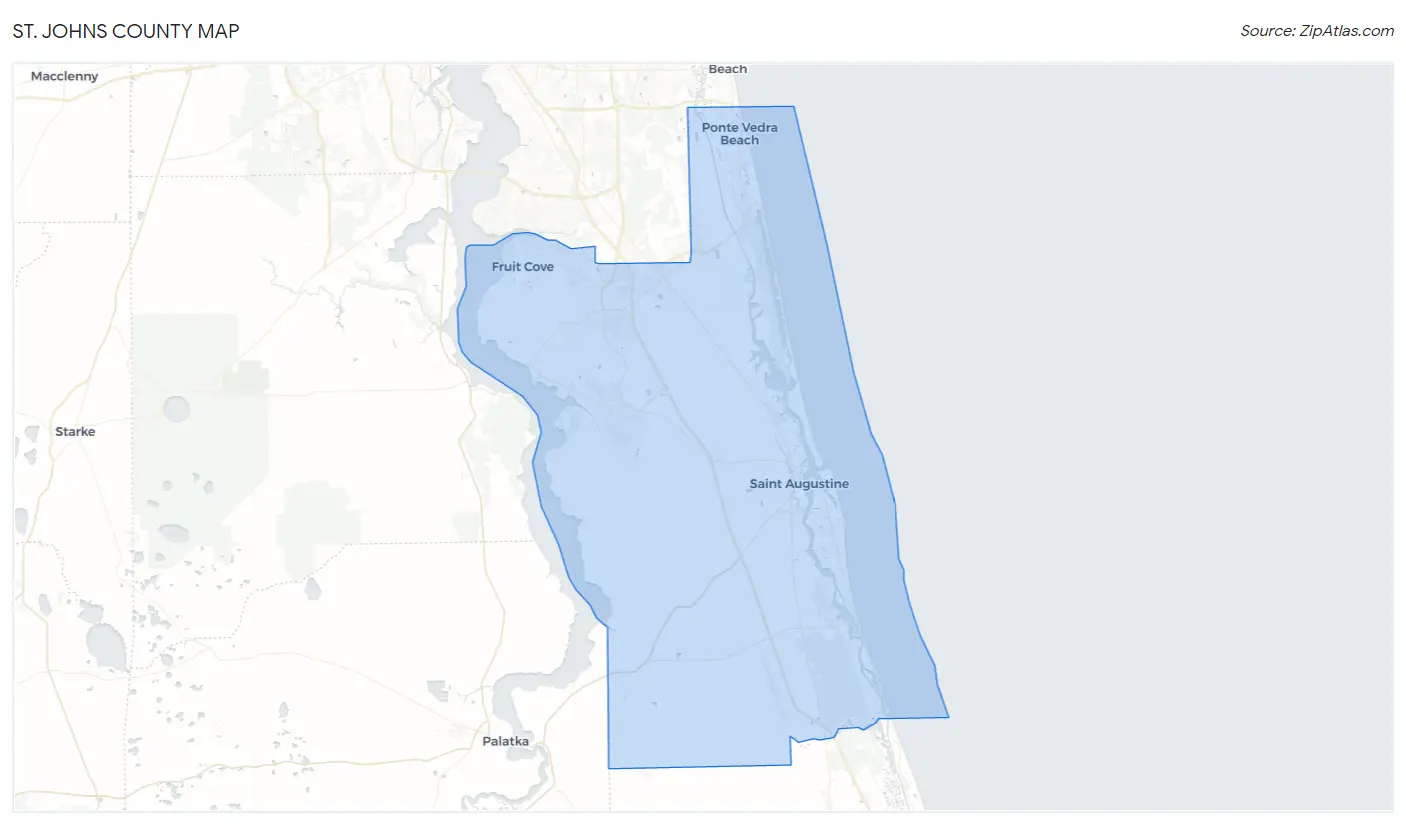
St. Johns County Map
St. Johns County Overview
$52,096
PER CAPITA INCOME
$119,534
AVG FAMILY INCOME
$100,020
AVG HOUSEHOLD INCOME
36.0%
WAGE / INCOME GAP [ % ]
64.0¢/ $1
WAGE / INCOME GAP [ $ ]
$9,539
FAMILY INCOME DEFICIT
0.46
INEQUALITY / GINI INDEX
278,722
TOTAL POPULATION
136,822
MALE POPULATION
141,900
FEMALE POPULATION
96.42
MALES / 100 FEMALES
103.71
FEMALES / 100 MALES
44.0
MEDIAN AGE
3.1
AVG FAMILY SIZE
2.7
AVG HOUSEHOLD SIZE
136,603
LABOR FORCE [ PEOPLE ]
60.5%
PERCENT IN LABOR FORCE
4.4%
UNEMPLOYMENT RATE
St. Johns County Area Codes
Income in St. Johns County
Income Overview in St. Johns County
Per Capita Income in St. Johns County is $52,096, while median incomes of families and households are $119,534 and $100,020 respectively.
| Characteristic | Number | Measure |
| Per Capita Income | 278,722 | $52,096 |
| Median Family Income | 75,793 | $119,534 |
| Mean Family Income | 75,793 | $156,205 |
| Median Household Income | 102,056 | $100,020 |
| Mean Household Income | 102,056 | $136,986 |
| Income Deficit | 75,793 | $9,539 |
| Wage / Income Gap (%) | 278,722 | 36.02% |
| Wage / Income Gap ($) | 278,722 | 63.98¢ per $1 |
| Gini / Inequality Index | 278,722 | 0.46 |
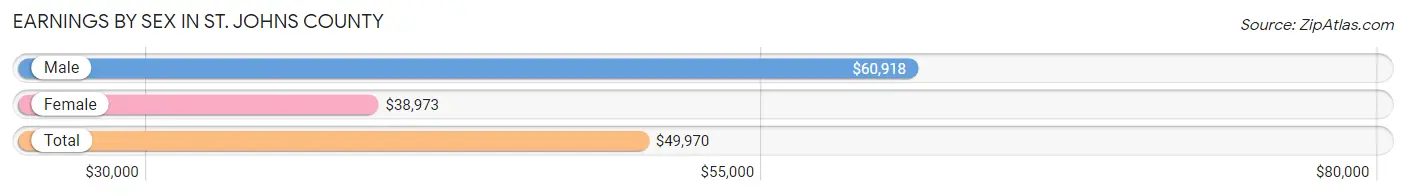
Earnings by Sex in St. Johns County
Average Earnings in St. Johns County are $49,970, $60,918 for men and $38,973 for women, a difference of 36.0%.
| Sex | Number | Average Earnings |
| Male | 77,164 (54.5%) | $60,918 |
| Female | 64,308 (45.5%) | $38,973 |
| Total | 141,472 (100.0%) | $49,970 |
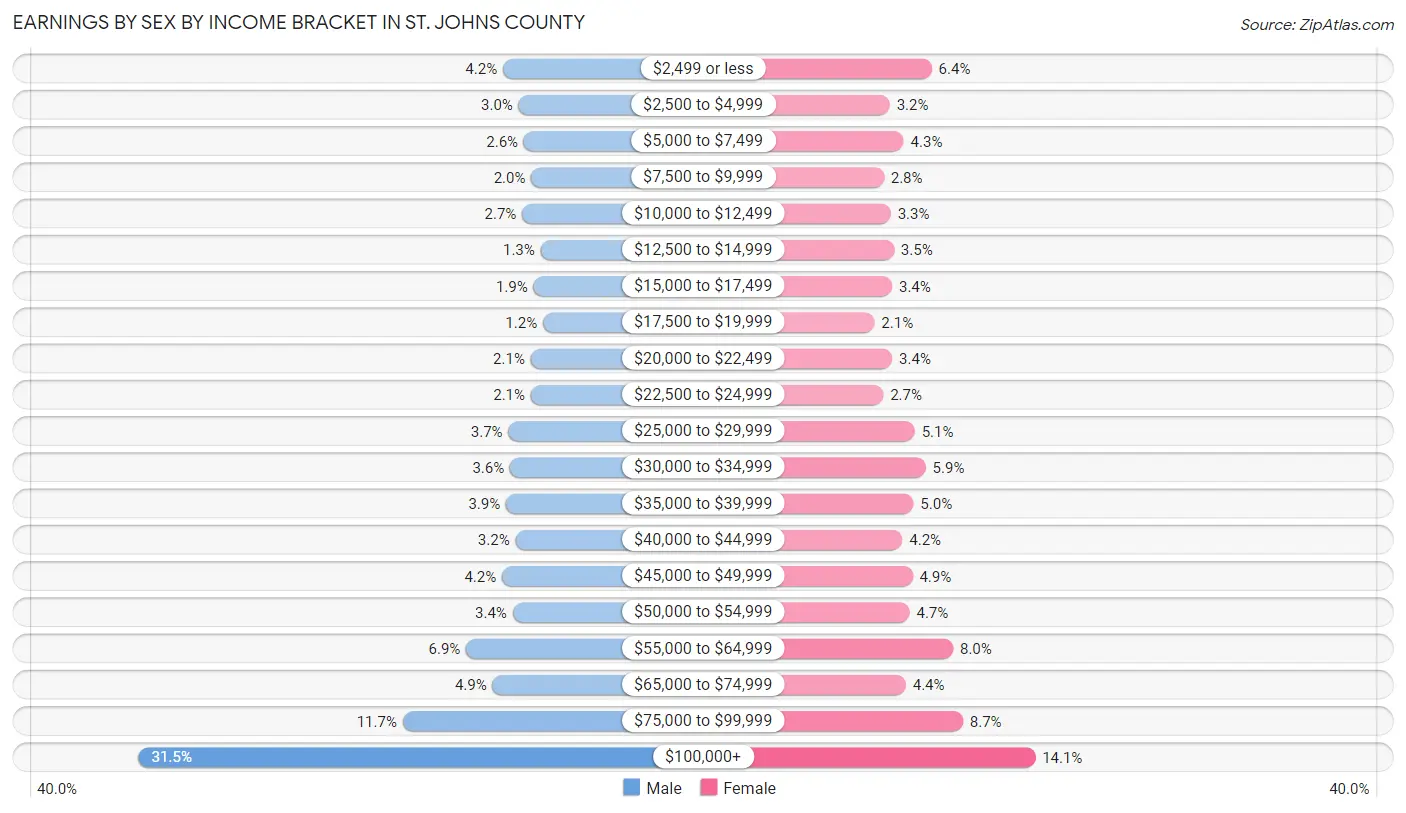
Earnings by Sex by Income Bracket in St. Johns County
The most common earnings brackets in St. Johns County are $100,000+ for men (24,278 | 31.5%) and $100,000+ for women (9,079 | 14.1%).
| Income | Male | Female |
| $2,499 or less | 3,200 (4.2%) | 4,088 (6.4%) |
| $2,500 to $4,999 | 2,293 (3.0%) | 2,073 (3.2%) |
| $5,000 to $7,499 | 1,991 (2.6%) | 2,742 (4.3%) |
| $7,500 to $9,999 | 1,565 (2.0%) | 1,783 (2.8%) |
| $10,000 to $12,499 | 2,095 (2.7%) | 2,118 (3.3%) |
| $12,500 to $14,999 | 1,028 (1.3%) | 2,273 (3.5%) |
| $15,000 to $17,499 | 1,432 (1.9%) | 2,181 (3.4%) |
| $17,500 to $19,999 | 889 (1.1%) | 1,332 (2.1%) |
| $20,000 to $22,499 | 1,601 (2.1%) | 2,187 (3.4%) |
| $22,500 to $24,999 | 1,589 (2.1%) | 1,753 (2.7%) |
| $25,000 to $29,999 | 2,885 (3.7%) | 3,273 (5.1%) |
| $30,000 to $34,999 | 2,792 (3.6%) | 3,798 (5.9%) |
| $35,000 to $39,999 | 3,023 (3.9%) | 3,211 (5.0%) |
| $40,000 to $44,999 | 2,476 (3.2%) | 2,673 (4.2%) |
| $45,000 to $49,999 | 3,257 (4.2%) | 3,166 (4.9%) |
| $50,000 to $54,999 | 2,642 (3.4%) | 3,022 (4.7%) |
| $55,000 to $64,999 | 5,330 (6.9%) | 5,117 (8.0%) |
| $65,000 to $74,999 | 3,804 (4.9%) | 2,843 (4.4%) |
| $75,000 to $99,999 | 8,994 (11.7%) | 5,596 (8.7%) |
| $100,000+ | 24,278 (31.5%) | 9,079 (14.1%) |
| Total | 77,164 (100.0%) | 64,308 (100.0%) |
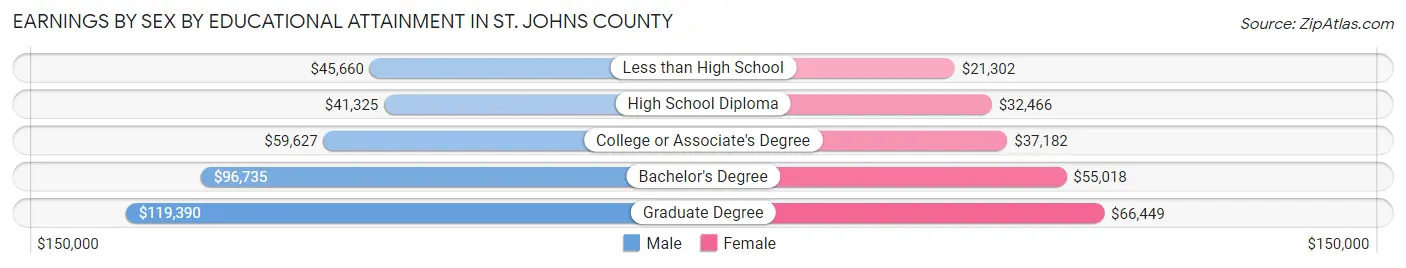
Earnings by Sex by Educational Attainment in St. Johns County
Average earnings in St. Johns County are $71,421 for men and $45,524 for women, a difference of 36.3%. Men with an educational attainment of graduate degree enjoy the highest average annual earnings of $119,390, while those with high school diploma education earn the least with $41,325. Women with an educational attainment of graduate degree earn the most with the average annual earnings of $66,449, while those with less than high school education have the smallest earnings of $21,302.
| Educational Attainment | Male Income | Female Income |
| Less than High School | $45,660 | $21,302 |
| High School Diploma | $41,325 | $32,466 |
| College or Associate's Degree | $59,627 | $37,182 |
| Bachelor's Degree | $96,735 | $55,018 |
| Graduate Degree | $119,390 | $66,449 |
| Total | $71,421 | $45,524 |
Family Income in St. Johns County
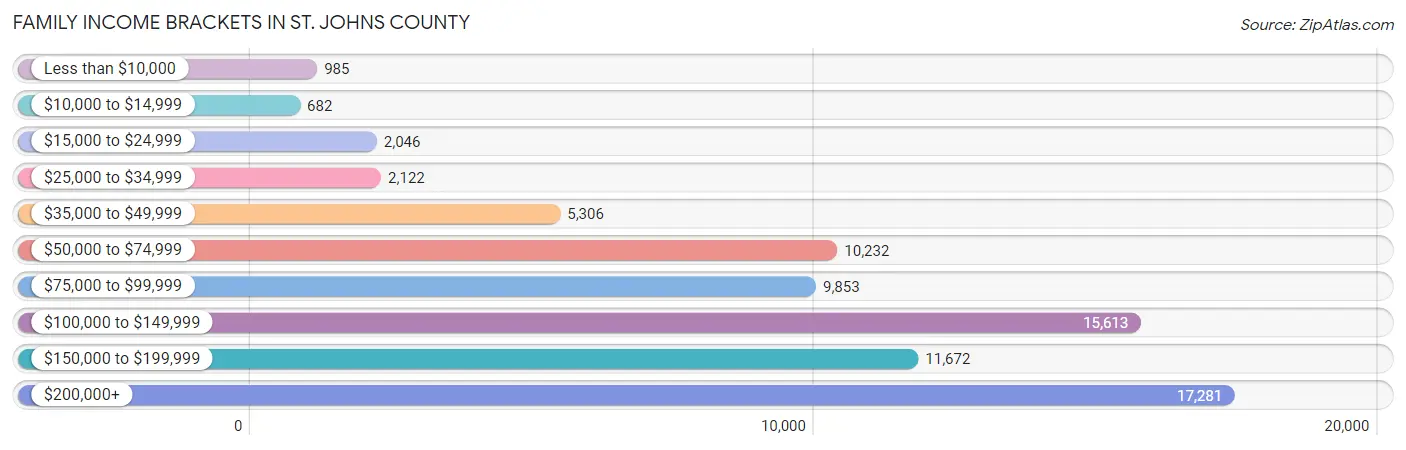
Family Income Brackets in St. Johns County
According to the St. Johns County family income data, there are 17,281 families falling into the $200,000+ income range, which is the most common income bracket and makes up 22.8% of all families. Conversely, the $10,000 to $14,999 income bracket is the least frequent group with only 682 families (0.9%) belonging to this category.
| Income Bracket | # Families | % Families |
| Less than $10,000 | 985 | 1.3% |
| $10,000 to $14,999 | 682 | 0.9% |
| $15,000 to $24,999 | 2,046 | 2.7% |
| $25,000 to $34,999 | 2,122 | 2.8% |
| $35,000 to $49,999 | 5,306 | 7.0% |
| $50,000 to $74,999 | 10,232 | 13.5% |
| $75,000 to $99,999 | 9,853 | 13.0% |
| $100,000 to $149,999 | 15,613 | 20.6% |
| $150,000 to $199,999 | 11,672 | 15.4% |
| $200,000+ | 17,281 | 22.8% |
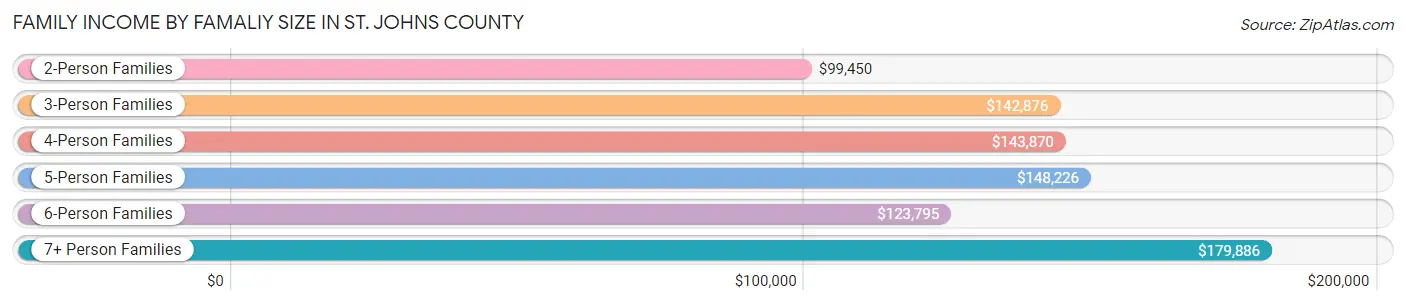
Family Income by Famaliy Size in St. Johns County
7+ person families (556 | 0.7%) account for the highest median family income in St. Johns County with $179,886 per family, while 2-person families (36,808 | 48.6%) have the highest median income of $49,725 per family member.
| Income Bracket | # Families | Median Income |
| 2-Person Families | 36,808 (48.6%) | $99,450 |
| 3-Person Families | 16,109 (21.2%) | $142,876 |
| 4-Person Families | 14,649 (19.3%) | $143,870 |
| 5-Person Families | 6,384 (8.4%) | $148,226 |
| 6-Person Families | 1,287 (1.7%) | $123,795 |
| 7+ Person Families | 556 (0.7%) | $179,886 |
| Total | 75,793 (100.0%) | $119,534 |
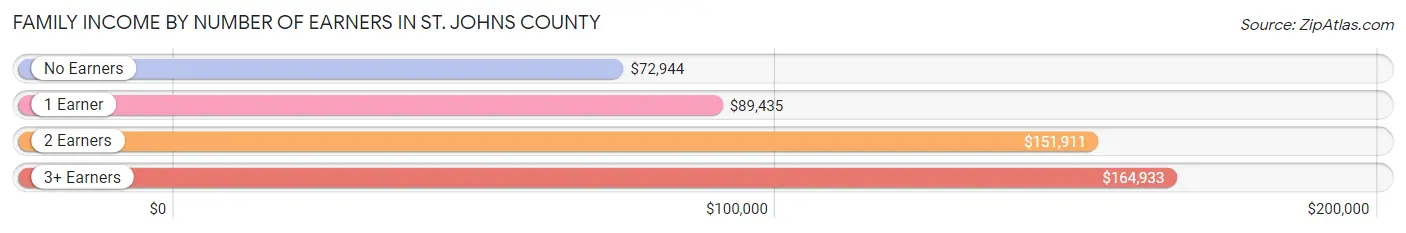
Family Income by Number of Earners in St. Johns County
The median family income in St. Johns County is $119,534, with families comprising 3+ earners (7,566) having the highest median family income of $164,933, while families with no earners (13,907) have the lowest median family income of $72,944, accounting for 10.0% and 18.3% of families, respectively.
| Number of Earners | # Families | Median Income |
| No Earners | 13,907 (18.3%) | $72,944 |
| 1 Earner | 23,117 (30.5%) | $89,435 |
| 2 Earners | 31,203 (41.2%) | $151,911 |
| 3+ Earners | 7,566 (10.0%) | $164,933 |
| Total | 75,793 (100.0%) | $119,534 |
Household Income in St. Johns County
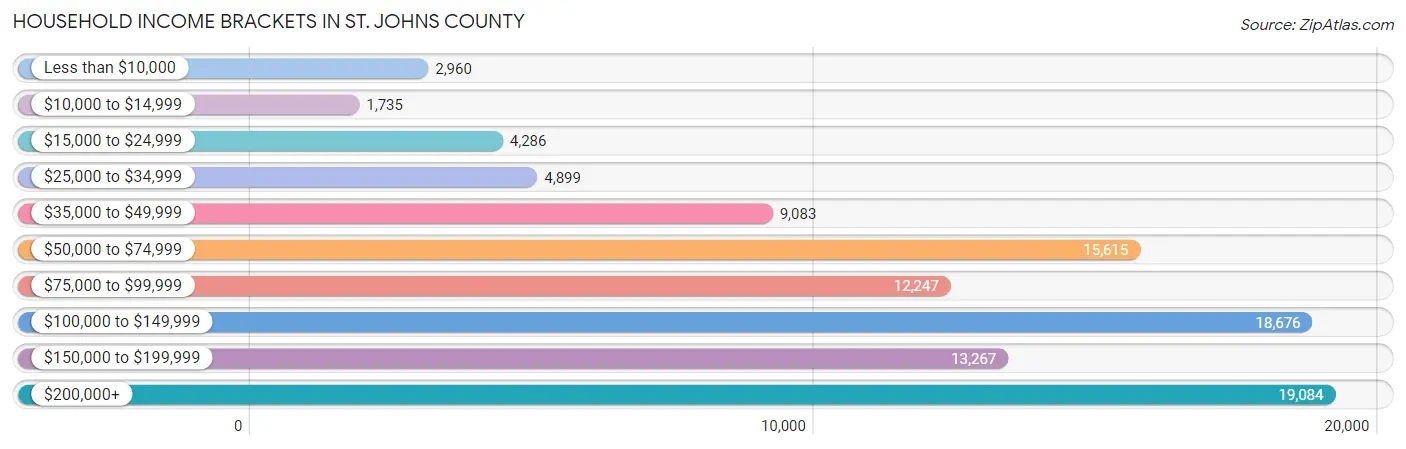
Household Income Brackets in St. Johns County
With 19,084 households falling in the category, the $200,000+ income range is the most frequent in St. Johns County, accounting for 18.7% of all households. In contrast, only 1,735 households (1.7%) fall into the $10,000 to $14,999 income bracket, making it the least populous group.
| Income Bracket | # Households | % Households |
| Less than $10,000 | 2,960 | 2.9% |
| $10,000 to $14,999 | 1,735 | 1.7% |
| $15,000 to $24,999 | 4,286 | 4.2% |
| $25,000 to $34,999 | 4,899 | 4.8% |
| $35,000 to $49,999 | 9,083 | 8.9% |
| $50,000 to $74,999 | 15,615 | 15.3% |
| $75,000 to $99,999 | 12,247 | 12.0% |
| $100,000 to $149,999 | 18,676 | 18.3% |
| $150,000 to $199,999 | 13,267 | 13.0% |
| $200,000+ | 19,084 | 18.7% |
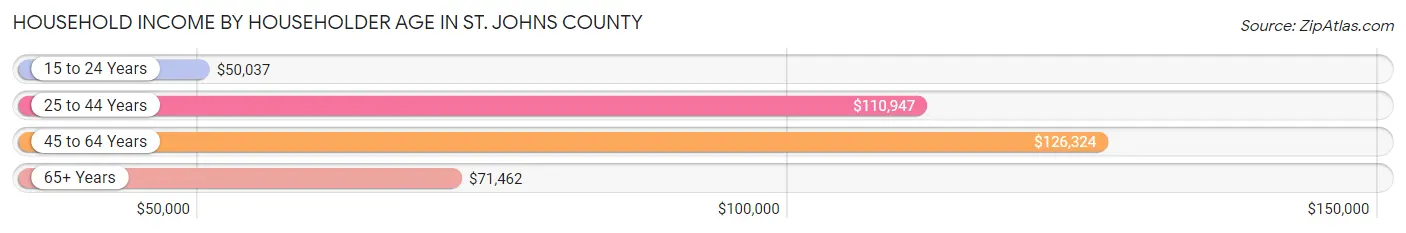
Household Income by Householder Age in St. Johns County
The median household income in St. Johns County is $100,020, with the highest median household income of $126,324 found in the 45 to 64 years age bracket for the primary householder. A total of 41,246 households (40.4%) fall into this category. Meanwhile, the 15 to 24 years age bracket for the primary householder has the lowest median household income of $50,037, with 1,381 households (1.3%) in this group.
| Income Bracket | # Households | Median Income |
| 15 to 24 Years | 1,381 (1.3%) | $50,037 |
| 25 to 44 Years | 26,819 (26.3%) | $110,947 |
| 45 to 64 Years | 41,246 (40.4%) | $126,324 |
| 65+ Years | 32,610 (32.0%) | $71,462 |
| Total | 102,056 (100.0%) | $100,020 |
Poverty in St. Johns County
Income Below Poverty by Sex and Age in St. Johns County
With 6.6% poverty level for males and 7.0% for females among the residents of St. Johns County, 16 and 17 year old males and 18 to 24 year old females are the most vulnerable to poverty, with 599 males (16.3%) and 1,038 females (11.7%) in their respective age groups living below the poverty level.
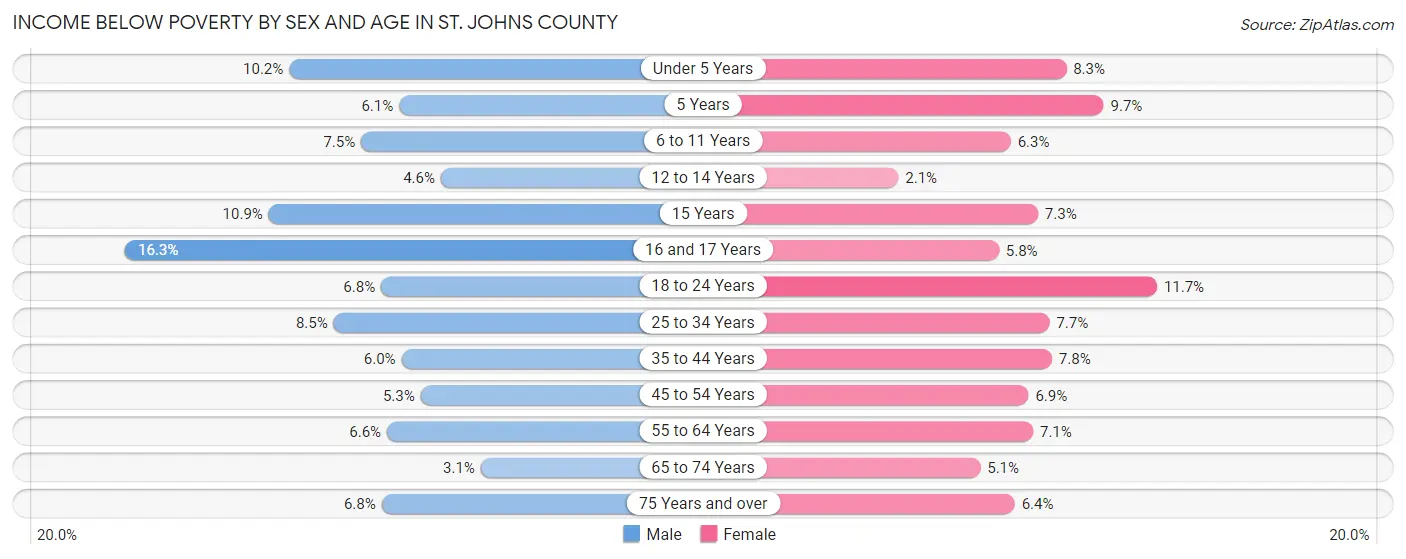
| Age Bracket | Male | Female |
| Under 5 Years | 674 (10.2%) | 524 (8.3%) |
| 5 Years | 97 (6.1%) | 146 (9.7%) |
| 6 to 11 Years | 764 (7.5%) | 644 (6.3%) |
| 12 to 14 Years | 273 (4.5%) | 113 (2.1%) |
| 15 Years | 226 (10.9%) | 162 (7.3%) |
| 16 and 17 Years | 599 (16.3%) | 191 (5.8%) |
| 18 to 24 Years | 666 (6.8%) | 1,038 (11.7%) |
| 25 to 34 Years | 1,054 (8.5%) | 1,008 (7.7%) |
| 35 to 44 Years | 1,103 (6.0%) | 1,488 (7.8%) |
| 45 to 54 Years | 1,032 (5.3%) | 1,323 (6.9%) |
| 55 to 64 Years | 1,243 (6.6%) | 1,448 (7.1%) |
| 65 to 74 Years | 505 (3.1%) | 927 (5.1%) |
| 75 Years and over | 669 (6.8%) | 803 (6.4%) |
| Total | 8,905 (6.6%) | 9,815 (7.0%) |
Income Above Poverty by Sex and Age in St. Johns County
According to the poverty statistics in St. Johns County, males aged 65 to 74 years and females aged 12 to 14 years are the age groups that are most secure financially, with 96.9% of males and 97.9% of females in these age groups living above the poverty line.
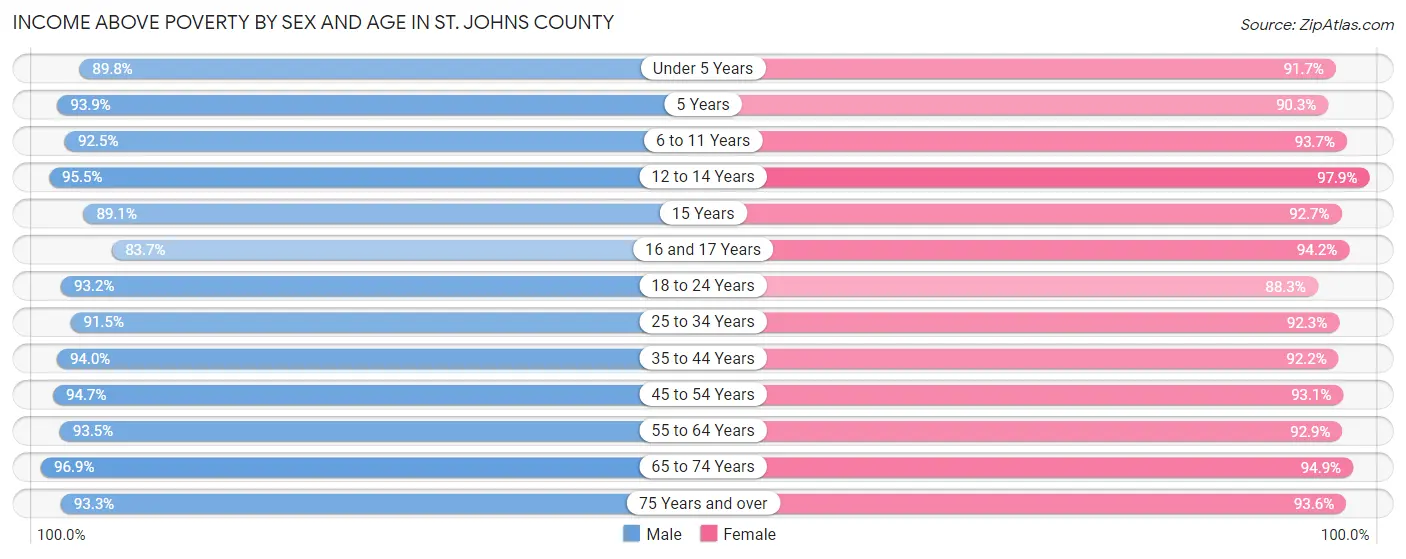
| Age Bracket | Male | Female |
| Under 5 Years | 5,949 (89.8%) | 5,764 (91.7%) |
| 5 Years | 1,492 (93.9%) | 1,356 (90.3%) |
| 6 to 11 Years | 9,412 (92.5%) | 9,623 (93.7%) |
| 12 to 14 Years | 5,731 (95.5%) | 5,271 (97.9%) |
| 15 Years | 1,839 (89.1%) | 2,063 (92.7%) |
| 16 and 17 Years | 3,083 (83.7%) | 3,084 (94.2%) |
| 18 to 24 Years | 9,171 (93.2%) | 7,835 (88.3%) |
| 25 to 34 Years | 11,304 (91.5%) | 12,070 (92.3%) |
| 35 to 44 Years | 17,244 (94.0%) | 17,588 (92.2%) |
| 45 to 54 Years | 18,433 (94.7%) | 17,779 (93.1%) |
| 55 to 64 Years | 17,729 (93.4%) | 18,945 (92.9%) |
| 65 to 74 Years | 15,949 (96.9%) | 17,108 (94.9%) |
| 75 Years and over | 9,241 (93.2%) | 11,708 (93.6%) |
| Total | 126,577 (93.4%) | 130,194 (93.0%) |
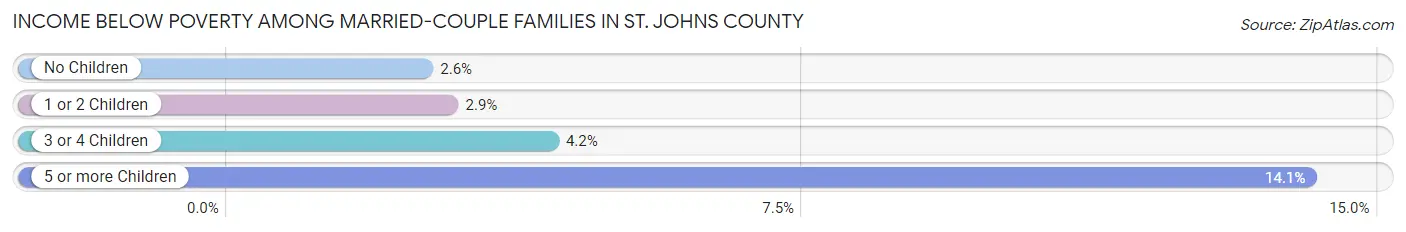
Income Below Poverty Among Married-Couple Families in St. Johns County
The poverty statistics for married-couple families in St. Johns County show that 2.8% or 1,799 of the total 63,906 families live below the poverty line. Families with 5 or more children have the highest poverty rate of 14.1%, comprising of 21 families. On the other hand, families with no children have the lowest poverty rate of 2.5%, which includes 952 families.
| Children | Above Poverty | Below Poverty |
| No Children | 36,439 (97.5%) | 952 (2.5%) |
| 1 or 2 Children | 20,668 (97.1%) | 613 (2.9%) |
| 3 or 4 Children | 4,872 (95.8%) | 213 (4.2%) |
| 5 or more Children | 128 (85.9%) | 21 (14.1%) |
| Total | 62,107 (97.2%) | 1,799 (2.8%) |
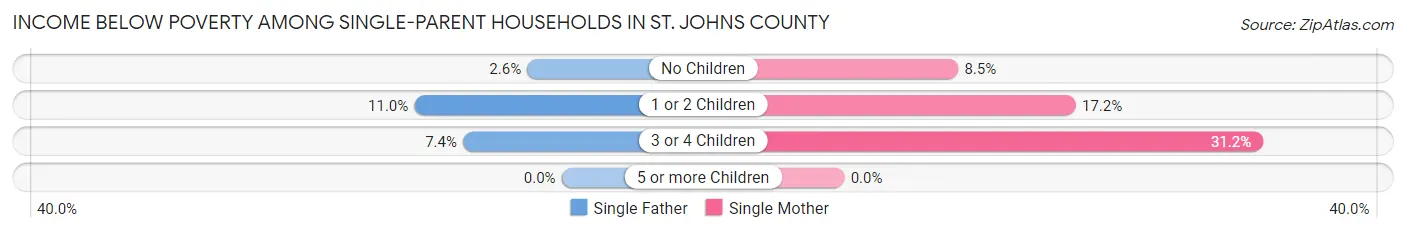
Income Below Poverty Among Single-Parent Households in St. Johns County
According to the poverty data in St. Johns County, 7.4% or 250 single-father households and 14.3% or 1,217 single-mother households are living below the poverty line. Among single-father households, those with 1 or 2 children have the highest poverty rate, with 200 households (11.0%) experiencing poverty. Likewise, among single-mother households, those with 3 or 4 children have the highest poverty rate, with 149 households (31.2%) falling below the poverty line.
| Children | Single Father | Single Mother |
| No Children | 35 (2.6%) | 294 (8.5%) |
| 1 or 2 Children | 200 (11.0%) | 774 (17.2%) |
| 3 or 4 Children | 15 (7.3%) | 149 (31.2%) |
| 5 or more Children | 0 (0.0%) | 0 (0.0%) |
| Total | 250 (7.4%) | 1,217 (14.3%) |
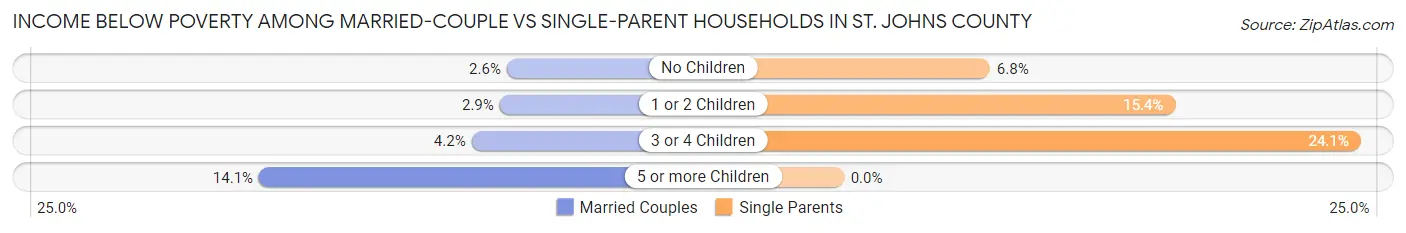
Income Below Poverty Among Married-Couple vs Single-Parent Households in St. Johns County
The poverty data for St. Johns County shows that 1,799 of the married-couple family households (2.8%) and 1,467 of the single-parent households (12.3%) are living below the poverty level. Within the married-couple family households, those with 5 or more children have the highest poverty rate, with 21 households (14.1%) falling below the poverty line. Among the single-parent households, those with 3 or 4 children have the highest poverty rate, with 164 household (24.1%) living below poverty.
| Children | Married-Couple Families | Single-Parent Households |
| No Children | 952 (2.5%) | 329 (6.8%) |
| 1 or 2 Children | 613 (2.9%) | 974 (15.4%) |
| 3 or 4 Children | 213 (4.2%) | 164 (24.1%) |
| 5 or more Children | 21 (14.1%) | 0 (0.0%) |
| Total | 1,799 (2.8%) | 1,467 (12.3%) |
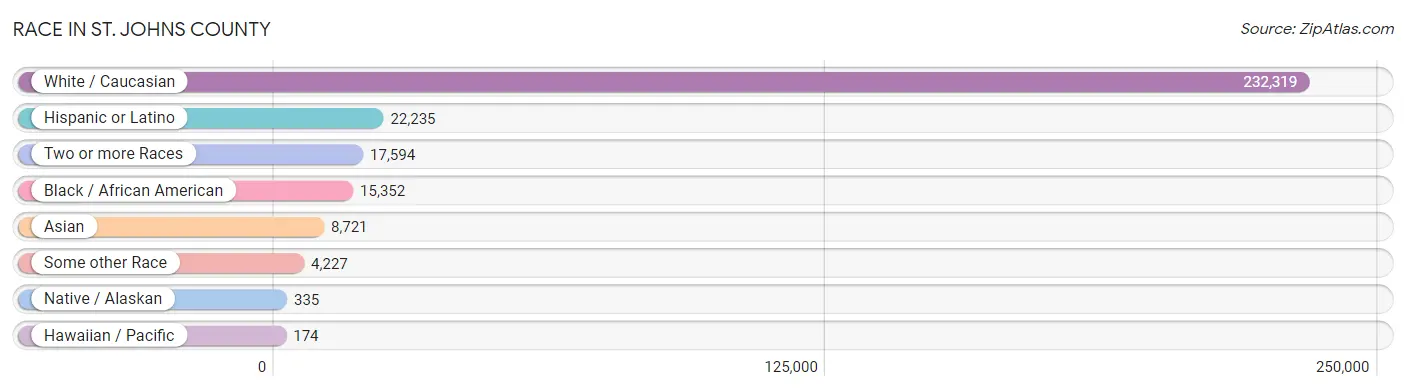
Race in St. Johns County
The most populous races in St. Johns County are White / Caucasian (232,319 | 83.4%), Hispanic or Latino (22,235 | 8.0%), and Two or more Races (17,594 | 6.3%).
| Race | # Population | % Population |
| Asian | 8,721 | 3.1% |
| Black / African American | 15,352 | 5.5% |
| Hawaiian / Pacific | 174 | 0.1% |
| Hispanic or Latino | 22,235 | 8.0% |
| Native / Alaskan | 335 | 0.1% |
| White / Caucasian | 232,319 | 83.4% |
| Two or more Races | 17,594 | 6.3% |
| Some other Race | 4,227 | 1.5% |
| Total | 278,722 | 100.0% |
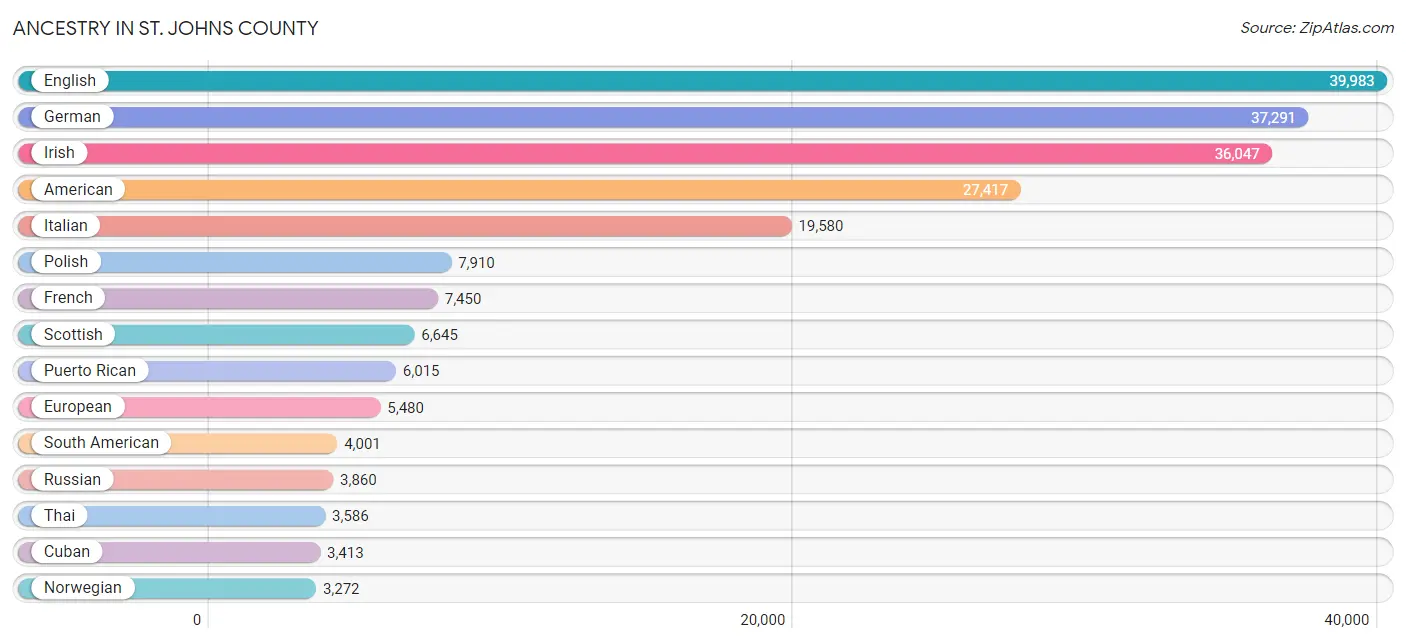
Ancestry in St. Johns County
The most populous ancestries reported in St. Johns County are English (39,983 | 14.3%), German (37,291 | 13.4%), Irish (36,047 | 12.9%), American (27,417 | 9.8%), and Italian (19,580 | 7.0%), together accounting for 57.5% of all St. Johns County residents.
| Ancestry | # Population | % Population |
| African | 243 | 0.1% |
| Albanian | 740 | 0.3% |
| American | 27,417 | 9.8% |
| Apache | 5 | 0.0% |
| Arab | 1,657 | 0.6% |
| Argentinean | 65 | 0.0% |
| Armenian | 126 | 0.1% |
| Australian | 249 | 0.1% |
| Austrian | 845 | 0.3% |
| Bahamian | 9 | 0.0% |
| Bangladeshi | 14 | 0.0% |
| Belgian | 689 | 0.3% |
| Belizean | 9 | 0.0% |
| Bhutanese | 1,110 | 0.4% |
| Blackfeet | 49 | 0.0% |
| Bolivian | 20 | 0.0% |
| Brazilian | 1,185 | 0.4% |
| British | 2,994 | 1.1% |
| British West Indian | 6 | 0.0% |
| Bulgarian | 88 | 0.0% |
| Burmese | 725 | 0.3% |
| Cajun | 14 | 0.0% |
| Canadian | 643 | 0.2% |
| Cape Verdean | 129 | 0.1% |
| Central American | 1,803 | 0.6% |
| Central American Indian | 57 | 0.0% |
| Cherokee | 863 | 0.3% |
| Cheyenne | 117 | 0.0% |
| Chilean | 53 | 0.0% |
| Chippewa | 75 | 0.0% |
| Choctaw | 74 | 0.0% |
| Colombian | 2,151 | 0.8% |
| Costa Rican | 298 | 0.1% |
| Creek | 72 | 0.0% |
| Croatian | 398 | 0.1% |
| Cuban | 3,413 | 1.2% |
| Czech | 1,042 | 0.4% |
| Czechoslovakian | 298 | 0.1% |
| Danish | 846 | 0.3% |
| Dominican | 1,156 | 0.4% |
| Dutch | 2,579 | 0.9% |
| Dutch West Indian | 13 | 0.0% |
| Eastern European | 1,300 | 0.5% |
| Ecuadorian | 389 | 0.1% |
| Egyptian | 45 | 0.0% |
| English | 39,983 | 14.3% |
| Ethiopian | 81 | 0.0% |
| European | 5,480 | 2.0% |
| Filipino | 309 | 0.1% |
| Finnish | 381 | 0.1% |
| French | 7,450 | 2.7% |
| French American Indian | 21 | 0.0% |
| French Canadian | 1,655 | 0.6% |
| German | 37,291 | 13.4% |
| German Russian | 235 | 0.1% |
| Greek | 1,892 | 0.7% |
| Guamanian / Chamorro | 119 | 0.0% |
| Guatemalan | 215 | 0.1% |
| Guyanese | 126 | 0.1% |
| Haitian | 515 | 0.2% |
| Honduran | 600 | 0.2% |
| Hungarian | 1,688 | 0.6% |
| Icelander | 107 | 0.0% |
| Indian (Asian) | 1,959 | 0.7% |
| Indonesian | 10 | 0.0% |
| Iranian | 61 | 0.0% |
| Iraqi | 34 | 0.0% |
| Irish | 36,047 | 12.9% |
| Israeli | 14 | 0.0% |
| Italian | 19,580 | 7.0% |
| Jamaican | 593 | 0.2% |
| Japanese | 11 | 0.0% |
| Korean | 2,370 | 0.9% |
| Laotian | 203 | 0.1% |
| Latvian | 55 | 0.0% |
| Lebanese | 917 | 0.3% |
| Lithuanian | 589 | 0.2% |
| Lumbee | 21 | 0.0% |
| Luxembourger | 49 | 0.0% |
| Macedonian | 9 | 0.0% |
| Malaysian | 31 | 0.0% |
| Mexican | 2,727 | 1.0% |
| Mexican American Indian | 11 | 0.0% |
| Moroccan | 22 | 0.0% |
| Native Hawaiian | 109 | 0.0% |
| Navajo | 66 | 0.0% |
| Nicaraguan | 395 | 0.1% |
| Nigerian | 242 | 0.1% |
| Northern European | 531 | 0.2% |
| Norwegian | 3,272 | 1.2% |
| Okinawan | 9 | 0.0% |
| Osage | 6 | 0.0% |
| Pakistani | 175 | 0.1% |
| Palestinian | 31 | 0.0% |
| Panamanian | 263 | 0.1% |
| Pennsylvania German | 97 | 0.0% |
| Peruvian | 723 | 0.3% |
| Polish | 7,910 | 2.8% |
| Portuguese | 1,084 | 0.4% |
| Puerto Rican | 6,015 | 2.2% |
| Romanian | 529 | 0.2% |
| Russian | 3,860 | 1.4% |
| Salvadoran | 32 | 0.0% |
| Scandinavian | 1,604 | 0.6% |
| Scotch-Irish | 2,789 | 1.0% |
| Scottish | 6,645 | 2.4% |
| Seminole | 50 | 0.0% |
| Serbian | 183 | 0.1% |
| Sioux | 29 | 0.0% |
| Slavic | 56 | 0.0% |
| Slovak | 439 | 0.2% |
| Slovene | 43 | 0.0% |
| South African | 65 | 0.0% |
| South American | 4,001 | 1.4% |
| Spaniard | 1,122 | 0.4% |
| Spanish | 949 | 0.3% |
| Spanish American | 7 | 0.0% |
| Sri Lankan | 764 | 0.3% |
| Subsaharan African | 882 | 0.3% |
| Swedish | 2,982 | 1.1% |
| Swiss | 599 | 0.2% |
| Syrian | 393 | 0.1% |
| Thai | 3,586 | 1.3% |
| Tlingit-Haida | 10 | 0.0% |
| Tongan | 52 | 0.0% |
| Trinidadian and Tobagonian | 47 | 0.0% |
| Turkish | 354 | 0.1% |
| U.S. Virgin Islander | 278 | 0.1% |
| Ukrainian | 1,032 | 0.4% |
| Uruguayan | 22 | 0.0% |
| Ute | 27 | 0.0% |
| Venezuelan | 578 | 0.2% |
| Vietnamese | 52 | 0.0% |
| Welsh | 2,374 | 0.9% |
| West Indian | 230 | 0.1% |
| Yugoslavian | 161 | 0.1% | View All 136 Rows |
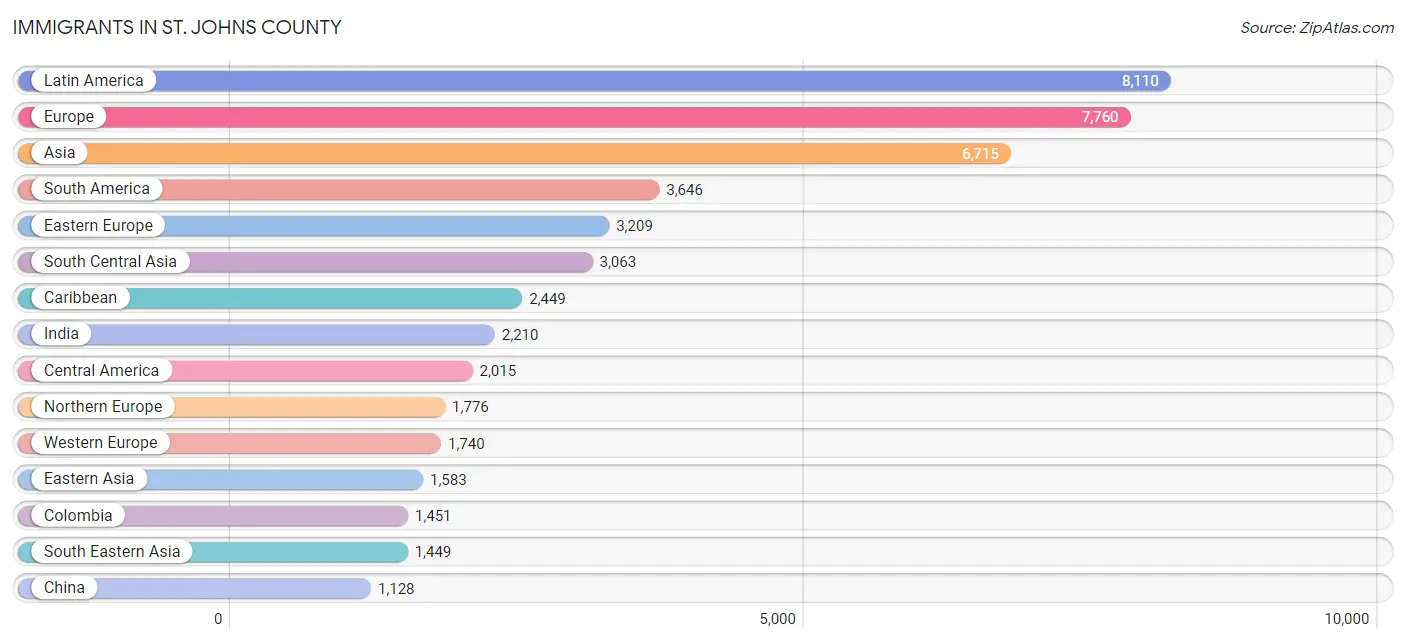
Immigrants in St. Johns County
The most numerous immigrant groups reported in St. Johns County came from Latin America (8,110 | 2.9%), Europe (7,760 | 2.8%), Asia (6,715 | 2.4%), South America (3,646 | 1.3%), and Eastern Europe (3,209 | 1.1%), together accounting for 10.6% of all St. Johns County residents.
| Immigration Origin | # Population | % Population |
| Africa | 681 | 0.2% |
| Albania | 568 | 0.2% |
| Argentina | 22 | 0.0% |
| Armenia | 25 | 0.0% |
| Asia | 6,715 | 2.4% |
| Australia | 310 | 0.1% |
| Austria | 59 | 0.0% |
| Bangladesh | 91 | 0.0% |
| Barbados | 167 | 0.1% |
| Belarus | 78 | 0.0% |
| Belgium | 452 | 0.2% |
| Belize | 18 | 0.0% |
| Bolivia | 4 | 0.0% |
| Bosnia and Herzegovina | 84 | 0.0% |
| Brazil | 1,091 | 0.4% |
| Bulgaria | 48 | 0.0% |
| Canada | 1,021 | 0.4% |
| Caribbean | 2,449 | 0.9% |
| Central America | 2,015 | 0.7% |
| Chile | 24 | 0.0% |
| China | 1,128 | 0.4% |
| Colombia | 1,451 | 0.5% |
| Costa Rica | 190 | 0.1% |
| Croatia | 45 | 0.0% |
| Cuba | 953 | 0.3% |
| Czechoslovakia | 107 | 0.0% |
| Dominican Republic | 491 | 0.2% |
| Eastern Africa | 218 | 0.1% |
| Eastern Asia | 1,583 | 0.6% |
| Eastern Europe | 3,209 | 1.1% |
| Ecuador | 354 | 0.1% |
| Egypt | 24 | 0.0% |
| El Salvador | 30 | 0.0% |
| England | 817 | 0.3% |
| Ethiopia | 81 | 0.0% |
| Europe | 7,760 | 2.8% |
| France | 220 | 0.1% |
| Germany | 906 | 0.3% |
| Ghana | 18 | 0.0% |
| Greece | 364 | 0.1% |
| Guatemala | 124 | 0.0% |
| Guyana | 50 | 0.0% |
| Haiti | 362 | 0.1% |
| Honduras | 190 | 0.1% |
| Hong Kong | 11 | 0.0% |
| Hungary | 14 | 0.0% |
| India | 2,210 | 0.8% |
| Indonesia | 124 | 0.0% |
| Iran | 108 | 0.0% |
| Iraq | 34 | 0.0% |
| Ireland | 149 | 0.1% |
| Israel | 23 | 0.0% |
| Italy | 375 | 0.1% |
| Jamaica | 398 | 0.1% |
| Japan | 148 | 0.1% |
| Kazakhstan | 88 | 0.0% |
| Kenya | 93 | 0.0% |
| Korea | 307 | 0.1% |
| Kuwait | 15 | 0.0% |
| Laos | 40 | 0.0% |
| Latin America | 8,110 | 2.9% |
| Lebanon | 59 | 0.0% |
| Lithuania | 158 | 0.1% |
| Malaysia | 31 | 0.0% |
| Mexico | 1,086 | 0.4% |
| Moldova | 13 | 0.0% |
| Morocco | 33 | 0.0% |
| Nepal | 29 | 0.0% |
| Netherlands | 103 | 0.0% |
| Nicaragua | 224 | 0.1% |
| Nigeria | 123 | 0.0% |
| Northern Africa | 157 | 0.1% |
| Northern Europe | 1,776 | 0.6% |
| Norway | 13 | 0.0% |
| Oceania | 362 | 0.1% |
| Pakistan | 470 | 0.2% |
| Panama | 153 | 0.1% |
| Peru | 263 | 0.1% |
| Philippines | 672 | 0.2% |
| Poland | 431 | 0.2% |
| Portugal | 175 | 0.1% |
| Romania | 264 | 0.1% |
| Russia | 653 | 0.2% |
| Saudi Arabia | 10 | 0.0% |
| Scotland | 156 | 0.1% |
| Serbia | 47 | 0.0% |
| Singapore | 114 | 0.0% |
| South Africa | 150 | 0.1% |
| South America | 3,646 | 1.3% |
| South Central Asia | 3,063 | 1.1% |
| South Eastern Asia | 1,449 | 0.5% |
| Southern Europe | 1,032 | 0.4% |
| Spain | 118 | 0.0% |
| Sri Lanka | 51 | 0.0% |
| St. Vincent and the Grenadines | 9 | 0.0% |
| Sweden | 67 | 0.0% |
| Syria | 111 | 0.0% |
| Taiwan | 208 | 0.1% |
| Thailand | 54 | 0.0% |
| Trinidad and Tobago | 54 | 0.0% |
| Turkey | 102 | 0.0% |
| Uganda | 6 | 0.0% |
| Ukraine | 259 | 0.1% |
| Uruguay | 12 | 0.0% |
| Uzbekistan | 16 | 0.0% |
| Venezuela | 342 | 0.1% |
| Vietnam | 414 | 0.2% |
| Western Africa | 141 | 0.1% |
| Western Asia | 574 | 0.2% |
| Western Europe | 1,740 | 0.6% | View All 110 Rows |
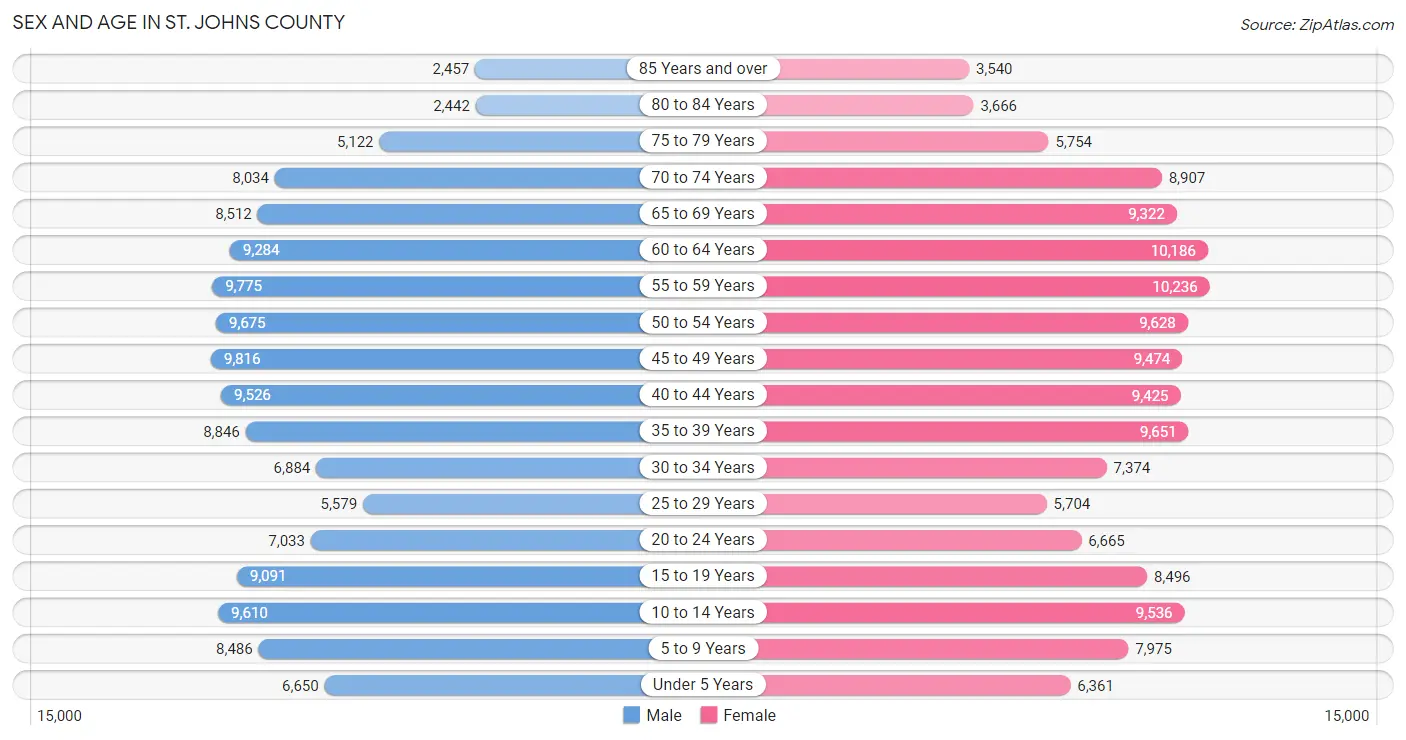
Sex and Age in St. Johns County
Sex and Age in St. Johns County
The most populous age groups in St. Johns County are 45 to 49 Years (9,816 | 7.2%) for men and 55 to 59 Years (10,236 | 7.2%) for women.
| Age Bracket | Male | Female |
| Under 5 Years | 6,650 (4.9%) | 6,361 (4.5%) |
| 5 to 9 Years | 8,486 (6.2%) | 7,975 (5.6%) |
| 10 to 14 Years | 9,610 (7.0%) | 9,536 (6.7%) |
| 15 to 19 Years | 9,091 (6.6%) | 8,496 (6.0%) |
| 20 to 24 Years | 7,033 (5.1%) | 6,665 (4.7%) |
| 25 to 29 Years | 5,579 (4.1%) | 5,704 (4.0%) |
| 30 to 34 Years | 6,884 (5.0%) | 7,374 (5.2%) |
| 35 to 39 Years | 8,846 (6.5%) | 9,651 (6.8%) |
| 40 to 44 Years | 9,526 (7.0%) | 9,425 (6.6%) |
| 45 to 49 Years | 9,816 (7.2%) | 9,474 (6.7%) |
| 50 to 54 Years | 9,675 (7.1%) | 9,628 (6.8%) |
| 55 to 59 Years | 9,775 (7.1%) | 10,236 (7.2%) |
| 60 to 64 Years | 9,284 (6.8%) | 10,186 (7.2%) |
| 65 to 69 Years | 8,512 (6.2%) | 9,322 (6.6%) |
| 70 to 74 Years | 8,034 (5.9%) | 8,907 (6.3%) |
| 75 to 79 Years | 5,122 (3.7%) | 5,754 (4.1%) |
| 80 to 84 Years | 2,442 (1.8%) | 3,666 (2.6%) |
| 85 Years and over | 2,457 (1.8%) | 3,540 (2.5%) |
| Total | 136,822 (100.0%) | 141,900 (100.0%) |
Families and Households in St. Johns County
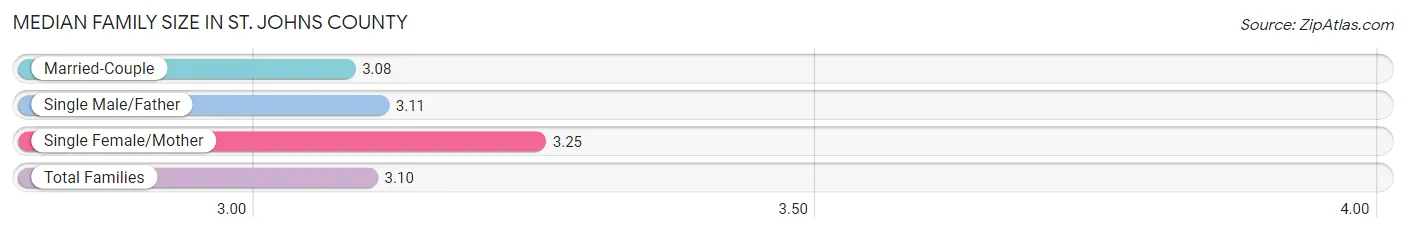
Median Family Size in St. Johns County
The median family size in St. Johns County is 3.10 persons per family, with single female/mother families (8,501 | 11.2%) accounting for the largest median family size of 3.25 persons per family. On the other hand, married-couple families (63,906 | 84.3%) represent the smallest median family size with 3.08 persons per family.
| Family Type | # Families | Family Size |
| Married-Couple | 63,906 (84.3%) | 3.08 |
| Single Male/Father | 3,386 (4.5%) | 3.11 |
| Single Female/Mother | 8,501 (11.2%) | 3.25 |
| Total Families | 75,793 (100.0%) | 3.10 |
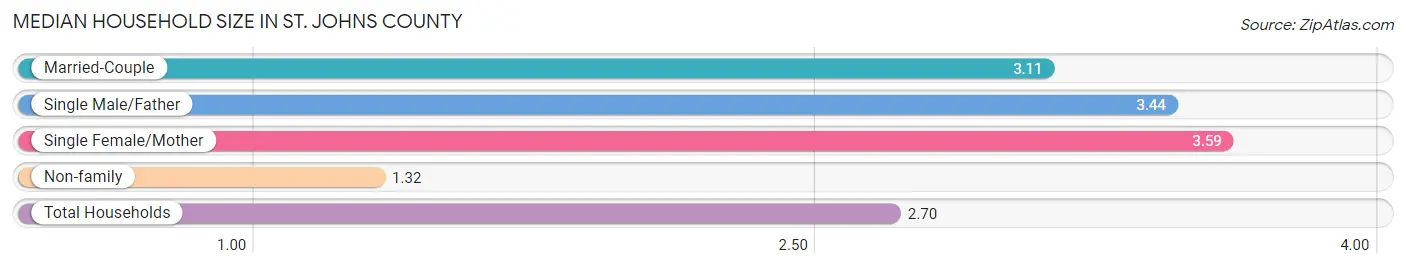
Median Household Size in St. Johns County
The median household size in St. Johns County is 2.70 persons per household, with single female/mother households (8,501 | 8.3%) accounting for the largest median household size of 3.59 persons per household. non-family households (26,263 | 25.7%) represent the smallest median household size with 1.32 persons per household.
| Household Type | # Households | Household Size |
| Married-Couple | 63,906 (62.6%) | 3.11 |
| Single Male/Father | 3,386 (3.3%) | 3.44 |
| Single Female/Mother | 8,501 (8.3%) | 3.59 |
| Non-family | 26,263 (25.7%) | 1.32 |
| Total Households | 102,056 (100.0%) | 2.70 |
Household Size by Marriage Status in St. Johns County
Out of a total of 102,056 households in St. Johns County, 75,793 (74.3%) are family households, while 26,263 (25.7%) are nonfamily households. The most numerous type of family households are 2-person households, comprising 35,037, and the most common type of nonfamily households are 1-person households, comprising 20,781.
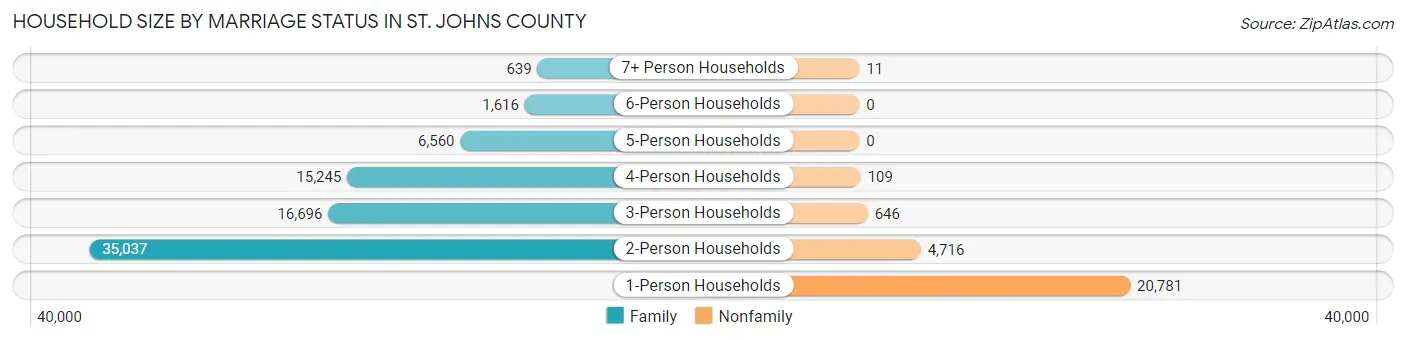
| Household Size | Family Households | Nonfamily Households |
| 1-Person Households | - | 20,781 (20.4%) |
| 2-Person Households | 35,037 (34.3%) | 4,716 (4.6%) |
| 3-Person Households | 16,696 (16.4%) | 646 (0.6%) |
| 4-Person Households | 15,245 (14.9%) | 109 (0.1%) |
| 5-Person Households | 6,560 (6.4%) | 0 (0.0%) |
| 6-Person Households | 1,616 (1.6%) | 0 (0.0%) |
| 7+ Person Households | 639 (0.6%) | 11 (0.0%) |
| Total | 75,793 (74.3%) | 26,263 (25.7%) |
Female Fertility in St. Johns County
Fertility by Age in St. Johns County
Average fertility rate in St. Johns County is 66.0 births per 1,000 women. Women in the age bracket of 20 to 34 years have the highest fertility rate with 114.0 births per 1,000 women. Women in the age bracket of 20 to 34 years acount for 57.9% of all women with births.
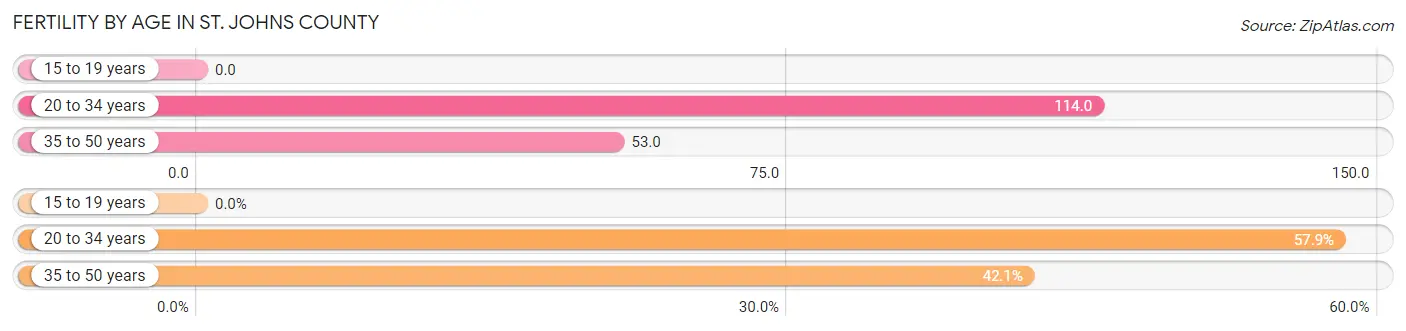
| Age Bracket | Women with Births | Births / 1,000 Women |
| 15 to 19 years | 0 (0.0%) | 0.0 |
| 20 to 34 years | 2,259 (57.9%) | 114.0 |
| 35 to 50 years | 1,641 (42.1%) | 53.0 |
| Total | 3,900 (100.0%) | 66.0 |
Fertility by Age by Marriage Status in St. Johns County
74.4% of women with births (3,900) in St. Johns County are married. The highest percentage of unmarried women with births falls into 35 to 50 years age bracket with 41.9% of them unmarried at the time of birth, while the lowest percentage of unmarried women with births belong to 20 to 34 years age bracket with 13.8% of them unmarried.
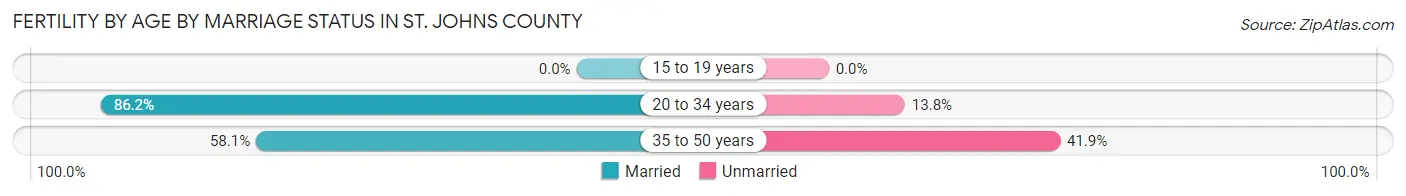
| Age Bracket | Married | Unmarried |
| 15 to 19 years | 0 (0.0%) | 0 (0.0%) |
| 20 to 34 years | 1,947 (86.2%) | 312 (13.8%) |
| 35 to 50 years | 953 (58.1%) | 688 (41.9%) |
| Total | 2,902 (74.4%) | 998 (25.6%) |
Fertility by Education in St. Johns County
Average fertility rate in St. Johns County is 66.0 births per 1,000 women. Women with the education attainment of graduate degree have the highest fertility rate of 107.0 births per 1,000 women, while women with the education attainment of less than high school have the lowest fertility at 17.0 births per 1,000 women. Women with the education attainment of high school diploma represent 27.1% of all women with births.
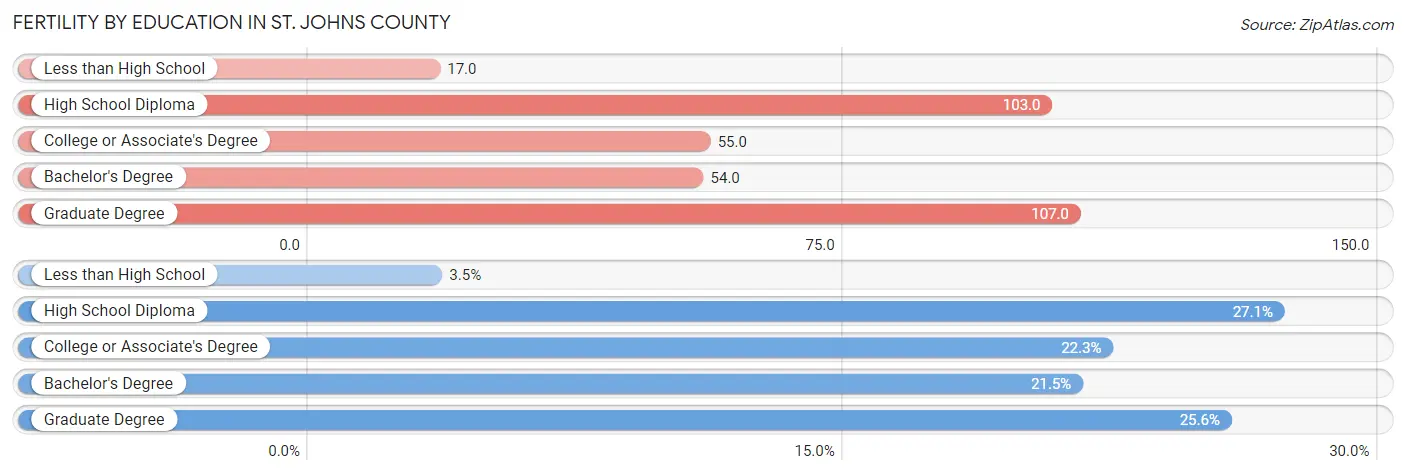
| Educational Attainment | Women with Births | Births / 1,000 Women |
| Less than High School | 135 (3.5%) | 17.0 |
| High School Diploma | 1,058 (27.1%) | 103.0 |
| College or Associate's Degree | 870 (22.3%) | 55.0 |
| Bachelor's Degree | 837 (21.5%) | 54.0 |
| Graduate Degree | 1,000 (25.6%) | 107.0 |
| Total | 3,900 (100.0%) | 66.0 |
Fertility by Education by Marriage Status in St. Johns County
25.6% of women with births in St. Johns County are unmarried. Women with the educational attainment of bachelor's degree are most likely to be married with 93.3% of them married at childbirth, while women with the educational attainment of less than high school are least likely to be married with 61.5% of them unmarried at childbirth.
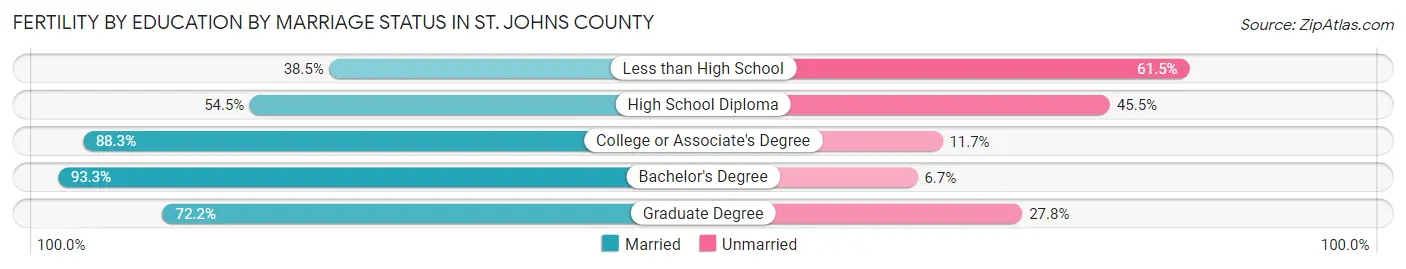
| Educational Attainment | Married | Unmarried |
| Less than High School | 52 (38.5%) | 83 (61.5%) |
| High School Diploma | 577 (54.5%) | 481 (45.5%) |
| College or Associate's Degree | 768 (88.3%) | 102 (11.7%) |
| Bachelor's Degree | 781 (93.3%) | 56 (6.7%) |
| Graduate Degree | 722 (72.2%) | 278 (27.8%) |
| Total | 2,902 (74.4%) | 998 (25.6%) |
Employment Characteristics in St. Johns County
Employment by Class of Employer in St. Johns County
Among the 128,385 employed individuals in St. Johns County, private company employees (84,132 | 65.5%), not-for-profit organizations (11,401 | 8.9%), and self-employed (incorporated) (9,618 | 7.5%) make up the most common classes of employment.
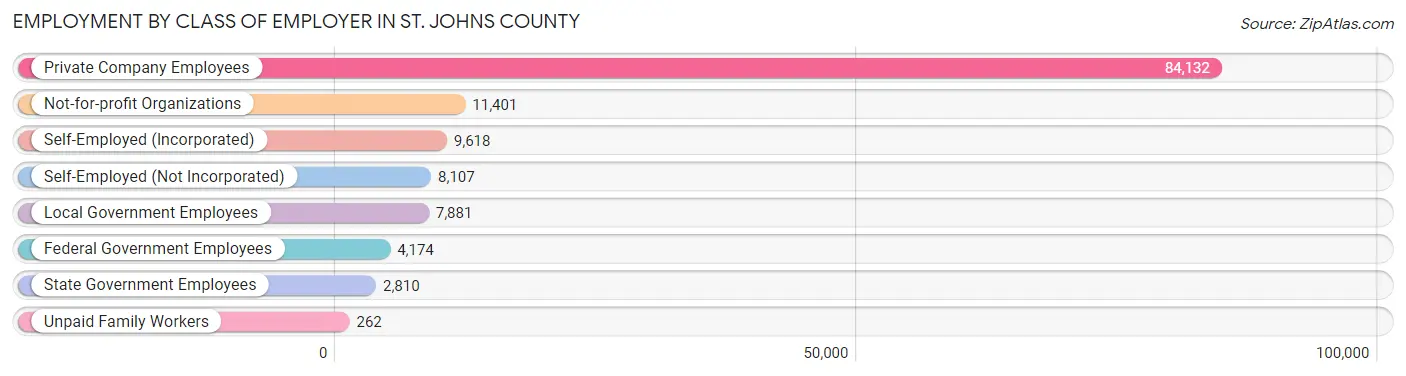
| Employer Class | # Employees | % Employees |
| Private Company Employees | 84,132 | 65.5% |
| Self-Employed (Incorporated) | 9,618 | 7.5% |
| Self-Employed (Not Incorporated) | 8,107 | 6.3% |
| Not-for-profit Organizations | 11,401 | 8.9% |
| Local Government Employees | 7,881 | 6.1% |
| State Government Employees | 2,810 | 2.2% |
| Federal Government Employees | 4,174 | 3.3% |
| Unpaid Family Workers | 262 | 0.2% |
| Total | 128,385 | 100.0% |
Employment Status by Age in St. Johns County
According to the labor force statistics for St. Johns County, out of the total population over 16 years of age (225,790), 60.5% or 136,603 individuals are in the labor force, with 4.4% or 6,011 of them unemployed. The age group with the highest labor force participation rate is 30 to 34 years, with 84.8% or 12,091 individuals in the labor force. Within the labor force, the 20 to 24 years age range has the highest percentage of unemployed individuals, with 11.0% or 1,114 of them being unemployed.
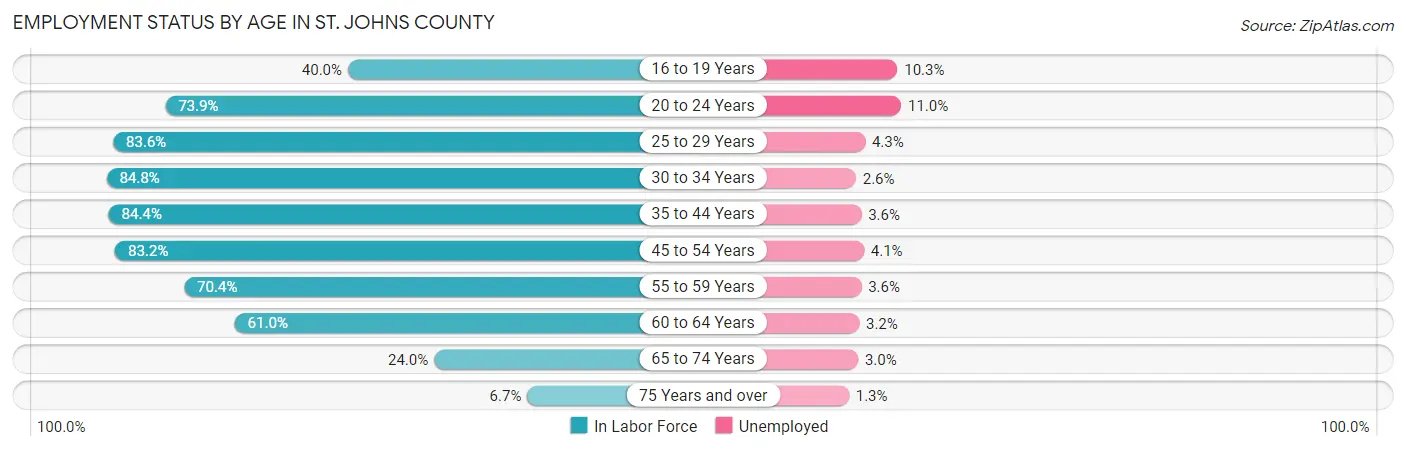
| Age Bracket | In Labor Force | Unemployed |
| 16 to 19 Years | 5,309 (40.0%) | 547 (10.3%) |
| 20 to 24 Years | 10,123 (73.9%) | 1,114 (11.0%) |
| 25 to 29 Years | 9,433 (83.6%) | 406 (4.3%) |
| 30 to 34 Years | 12,091 (84.8%) | 314 (2.6%) |
| 35 to 44 Years | 31,606 (84.4%) | 1,138 (3.6%) |
| 45 to 54 Years | 32,109 (83.2%) | 1,316 (4.1%) |
| 55 to 59 Years | 14,088 (70.4%) | 507 (3.6%) |
| 60 to 64 Years | 11,877 (61.0%) | 380 (3.2%) |
| 65 to 74 Years | 8,346 (24.0%) | 250 (3.0%) |
| 75 Years and over | 1,540 (6.7%) | 20 (1.3%) |
| Total | 136,603 (60.5%) | 6,011 (4.4%) |
Employment Status by Educational Attainment in St. Johns County
According to labor force statistics for St. Johns County, 78.9% of individuals (111,299) out of the total population between 25 and 64 years of age (141,063) are in the labor force, with 3.7% or 4,118 of them being unemployed. The group with the highest labor force participation rate are those with the educational attainment of bachelor's degree or higher, with 82.8% or 56,340 individuals in the labor force. Within the labor force, individuals with high school diploma education have the highest percentage of unemployment, with 5.3% or 1,054 of them being unemployed.
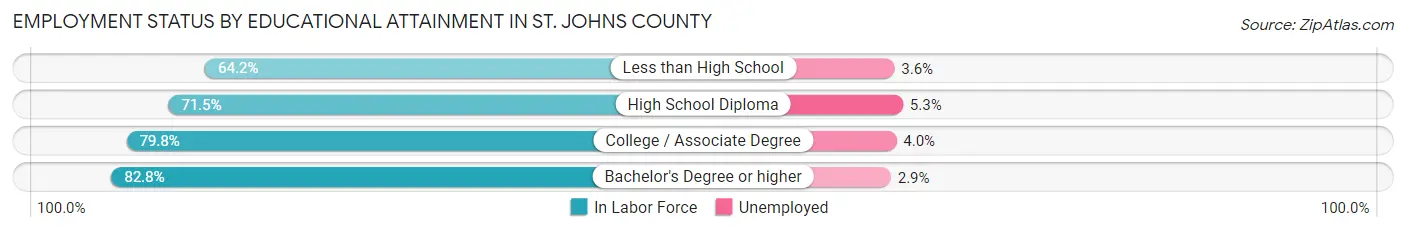
| Educational Attainment | In Labor Force | Unemployed |
| Less than High School | 4,466 (64.2%) | 250 (3.6%) |
| High School Diploma | 19,885 (71.5%) | 1,474 (5.3%) |
| College / Associate Degree | 30,524 (79.8%) | 1,530 (4.0%) |
| Bachelor's Degree or higher | 56,340 (82.8%) | 1,973 (2.9%) |
| Total | 111,299 (78.9%) | 5,219 (3.7%) |
Employment Occupations by Sex in St. Johns County
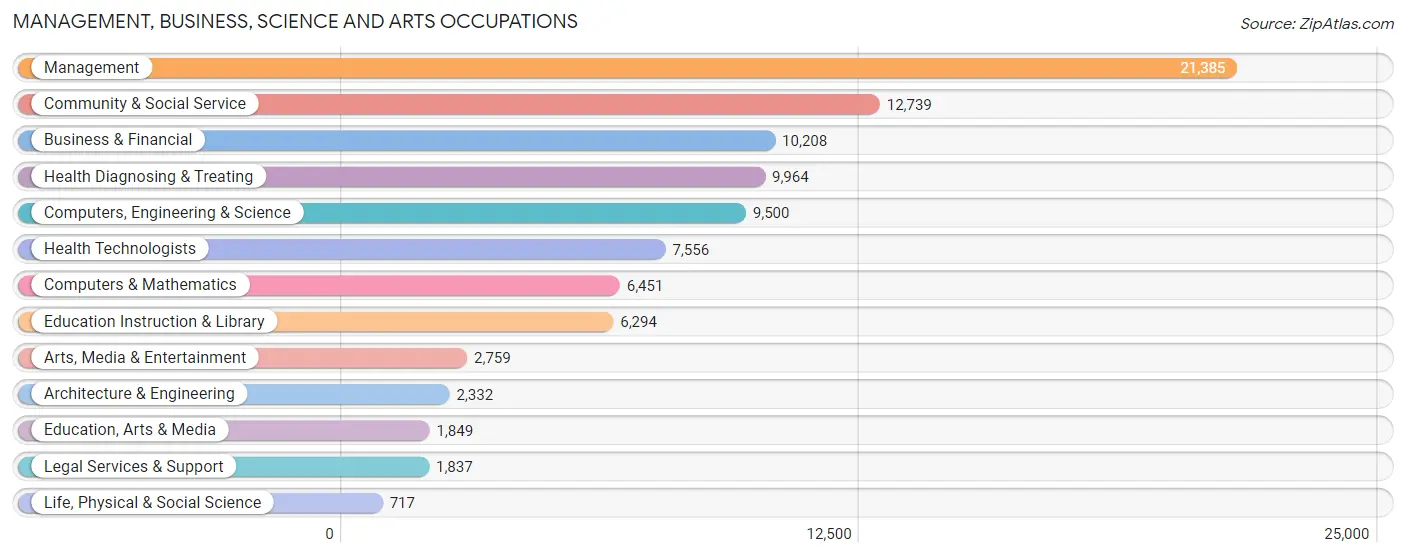
Management, Business, Science and Arts Occupations
The most common Management, Business, Science and Arts occupations in St. Johns County are Management (21,385 | 16.5%), Community & Social Service (12,739 | 9.8%), Business & Financial (10,208 | 7.9%), Health Diagnosing & Treating (9,964 | 7.7%), and Computers, Engineering & Science (9,500 | 7.3%).
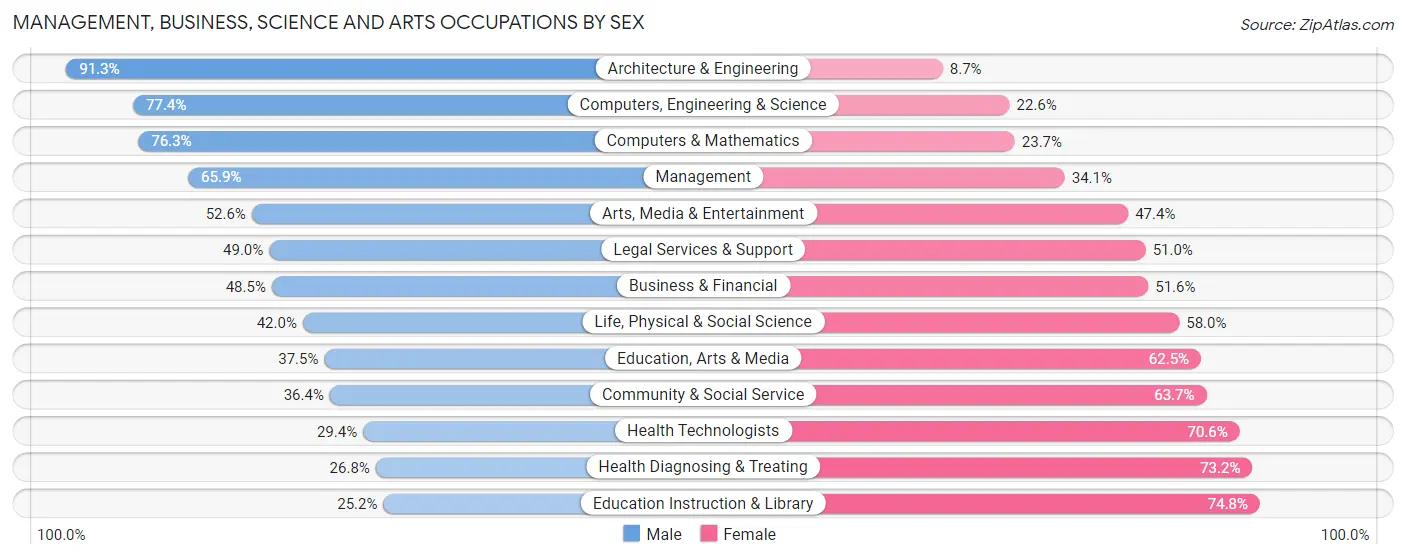
Management, Business, Science and Arts Occupations by Sex
Within the Management, Business, Science and Arts occupations in St. Johns County, the most male-oriented occupations are Architecture & Engineering (91.3%), Computers, Engineering & Science (77.4%), and Computers & Mathematics (76.3%), while the most female-oriented occupations are Education Instruction & Library (74.8%), Health Diagnosing & Treating (73.2%), and Health Technologists (70.6%).
| Occupation | Male | Female |
| Management | 14,087 (65.9%) | 7,298 (34.1%) |
| Business & Financial | 4,946 (48.4%) | 5,262 (51.5%) |
| Computers, Engineering & Science | 7,351 (77.4%) | 2,149 (22.6%) |
| Computers & Mathematics | 4,921 (76.3%) | 1,530 (23.7%) |
| Architecture & Engineering | 2,129 (91.3%) | 203 (8.7%) |
| Life, Physical & Social Science | 301 (42.0%) | 416 (58.0%) |
| Community & Social Service | 4,630 (36.3%) | 8,109 (63.6%) |
| Education, Arts & Media | 693 (37.5%) | 1,156 (62.5%) |
| Legal Services & Support | 900 (49.0%) | 937 (51.0%) |
| Education Instruction & Library | 1,585 (25.2%) | 4,709 (74.8%) |
| Arts, Media & Entertainment | 1,452 (52.6%) | 1,307 (47.4%) |
| Health Diagnosing & Treating | 2,667 (26.8%) | 7,297 (73.2%) |
| Health Technologists | 2,222 (29.4%) | 5,334 (70.6%) |
| Total (Category) | 33,681 (52.8%) | 30,115 (47.2%) |
| Total (Overall) | 71,242 (54.8%) | 58,656 (45.2%) |
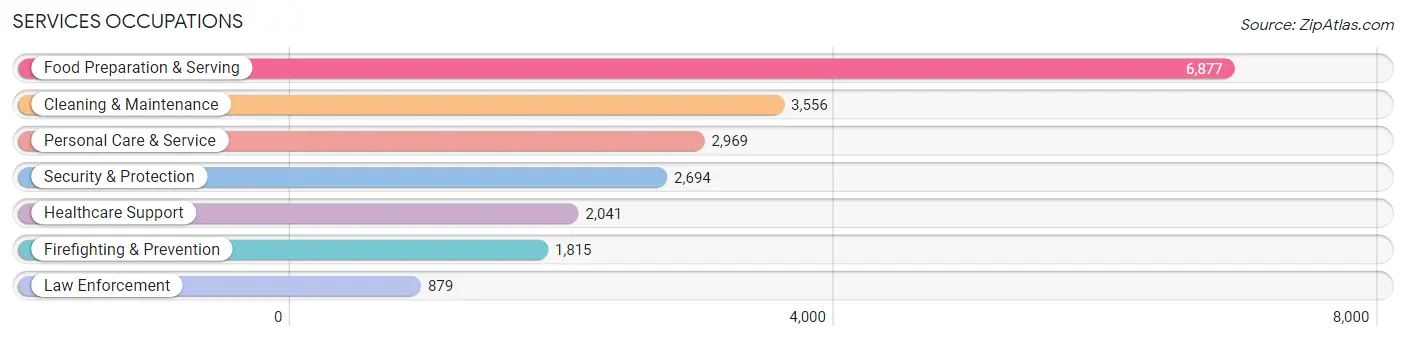
Services Occupations
The most common Services occupations in St. Johns County are Food Preparation & Serving (6,877 | 5.3%), Cleaning & Maintenance (3,556 | 2.7%), Personal Care & Service (2,969 | 2.3%), Security & Protection (2,694 | 2.1%), and Healthcare Support (2,041 | 1.6%).
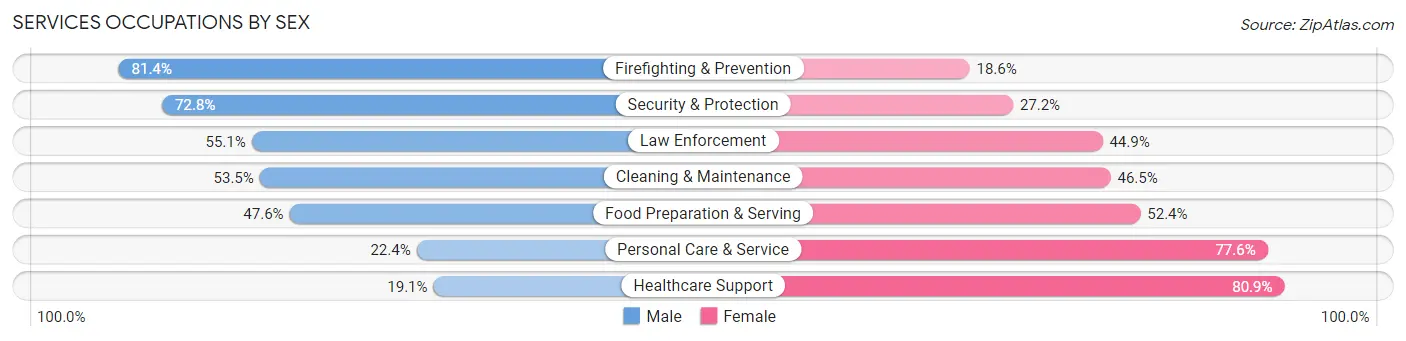
Services Occupations by Sex
Within the Services occupations in St. Johns County, the most male-oriented occupations are Firefighting & Prevention (81.4%), Security & Protection (72.8%), and Law Enforcement (55.1%), while the most female-oriented occupations are Healthcare Support (80.9%), Personal Care & Service (77.6%), and Food Preparation & Serving (52.4%).
| Occupation | Male | Female |
| Healthcare Support | 389 (19.1%) | 1,652 (80.9%) |
| Security & Protection | 1,961 (72.8%) | 733 (27.2%) |
| Firefighting & Prevention | 1,477 (81.4%) | 338 (18.6%) |
| Law Enforcement | 484 (55.1%) | 395 (44.9%) |
| Food Preparation & Serving | 3,271 (47.6%) | 3,606 (52.4%) |
| Cleaning & Maintenance | 1,901 (53.5%) | 1,655 (46.5%) |
| Personal Care & Service | 665 (22.4%) | 2,304 (77.6%) |
| Total (Category) | 8,187 (45.1%) | 9,950 (54.9%) |
| Total (Overall) | 71,242 (54.8%) | 58,656 (45.2%) |
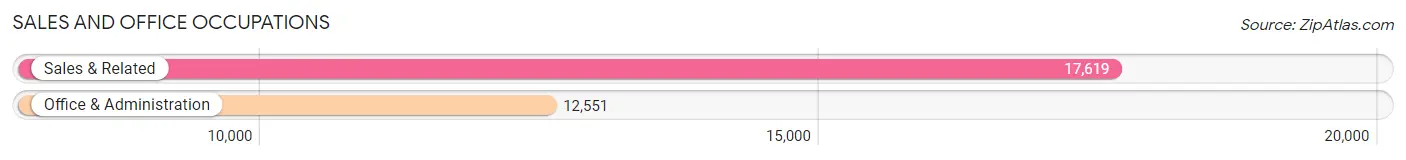
Sales and Office Occupations
The most common Sales and Office occupations in St. Johns County are Sales & Related (17,619 | 13.6%), and Office & Administration (12,551 | 9.7%).
Sales and Office Occupations by Sex
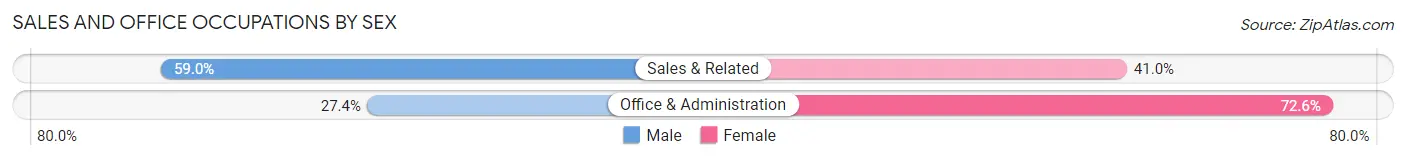
| Occupation | Male | Female |
| Sales & Related | 10,399 (59.0%) | 7,220 (41.0%) |
| Office & Administration | 3,434 (27.4%) | 9,117 (72.6%) |
| Total (Category) | 13,833 (45.9%) | 16,337 (54.1%) |
| Total (Overall) | 71,242 (54.8%) | 58,656 (45.2%) |
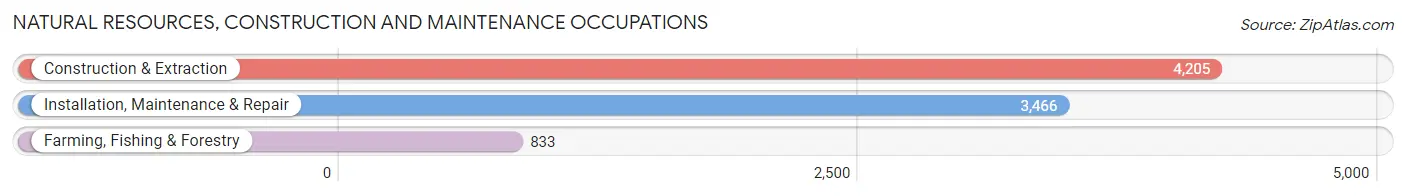
Natural Resources, Construction and Maintenance Occupations
The most common Natural Resources, Construction and Maintenance occupations in St. Johns County are Construction & Extraction (4,205 | 3.2%), Installation, Maintenance & Repair (3,466 | 2.7%), and Farming, Fishing & Forestry (833 | 0.6%).
Natural Resources, Construction and Maintenance Occupations by Sex
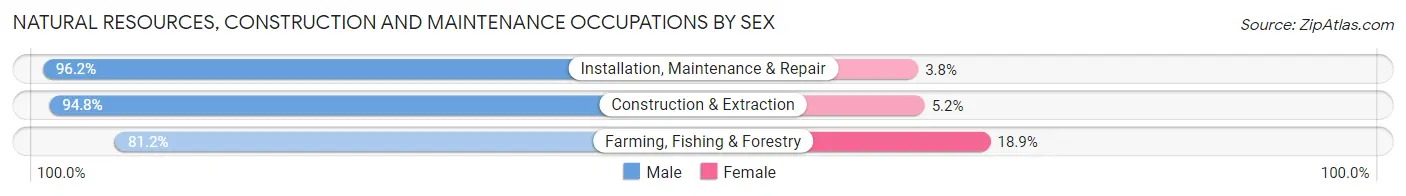
| Occupation | Male | Female |
| Farming, Fishing & Forestry | 676 (81.1%) | 157 (18.9%) |
| Construction & Extraction | 3,988 (94.8%) | 217 (5.2%) |
| Installation, Maintenance & Repair | 3,334 (96.2%) | 132 (3.8%) |
| Total (Category) | 7,998 (94.1%) | 506 (5.9%) |
| Total (Overall) | 71,242 (54.8%) | 58,656 (45.2%) |
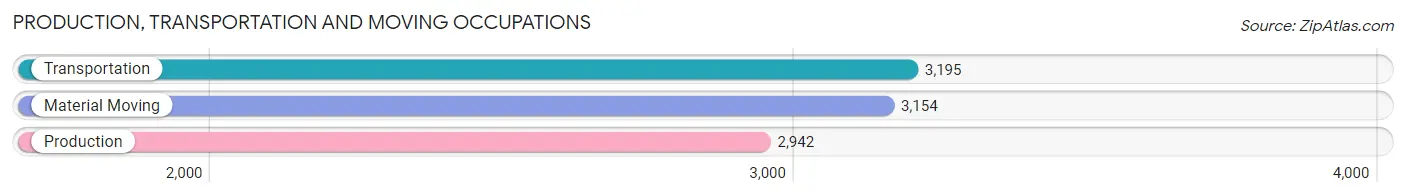
Production, Transportation and Moving Occupations
The most common Production, Transportation and Moving occupations in St. Johns County are Transportation (3,195 | 2.5%), Material Moving (3,154 | 2.4%), and Production (2,942 | 2.3%).
Production, Transportation and Moving Occupations by Sex
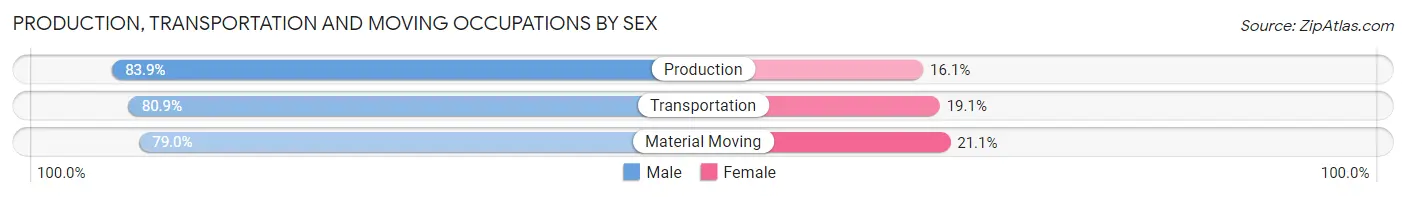
| Occupation | Male | Female |
| Production | 2,469 (83.9%) | 473 (16.1%) |
| Transportation | 2,584 (80.9%) | 611 (19.1%) |
| Material Moving | 2,490 (78.9%) | 664 (21.0%) |
| Total (Category) | 7,543 (81.2%) | 1,748 (18.8%) |
| Total (Overall) | 71,242 (54.8%) | 58,656 (45.2%) |
Employment Industries by Sex in St. Johns County
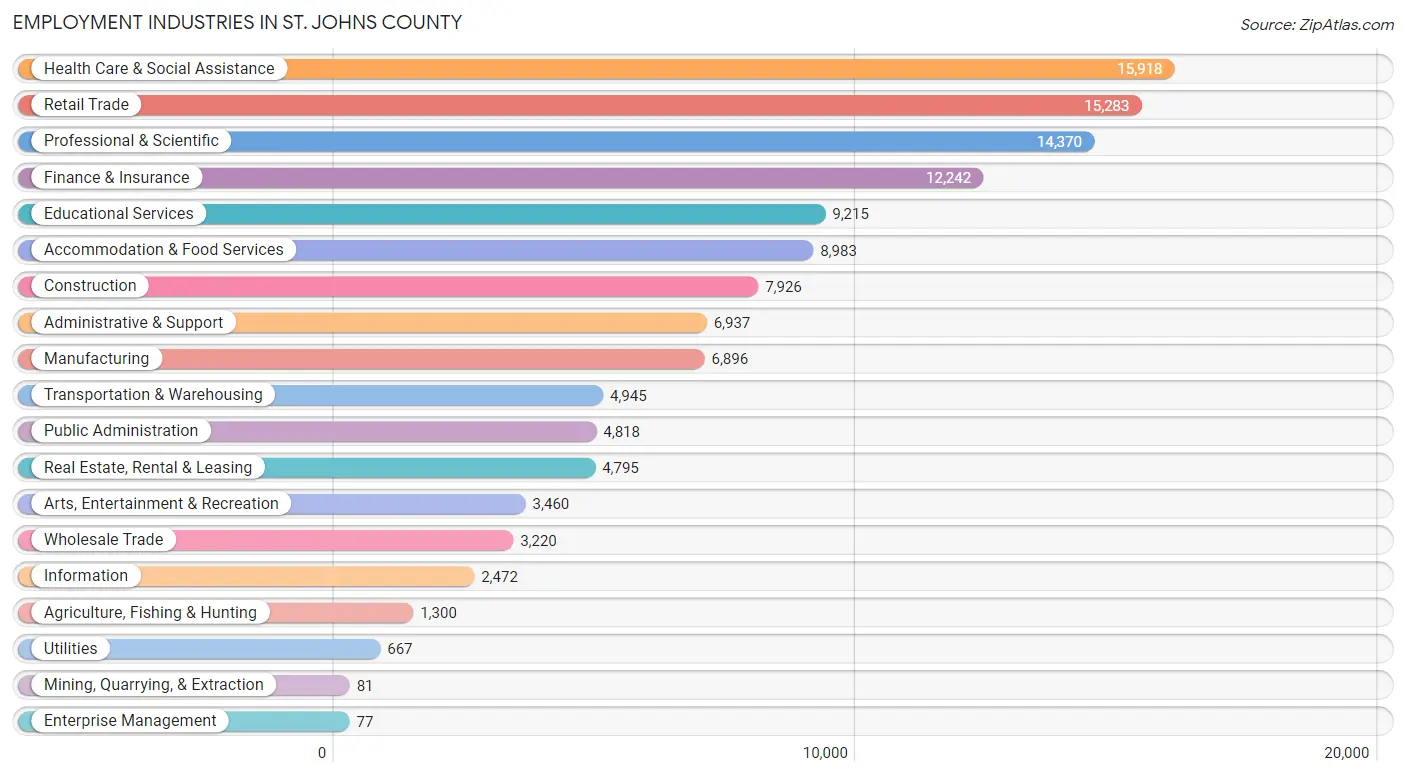
Employment Industries in St. Johns County
The major employment industries in St. Johns County include Health Care & Social Assistance (15,918 | 12.2%), Retail Trade (15,283 | 11.8%), Professional & Scientific (14,370 | 11.1%), Finance & Insurance (12,242 | 9.4%), and Educational Services (9,215 | 7.1%).
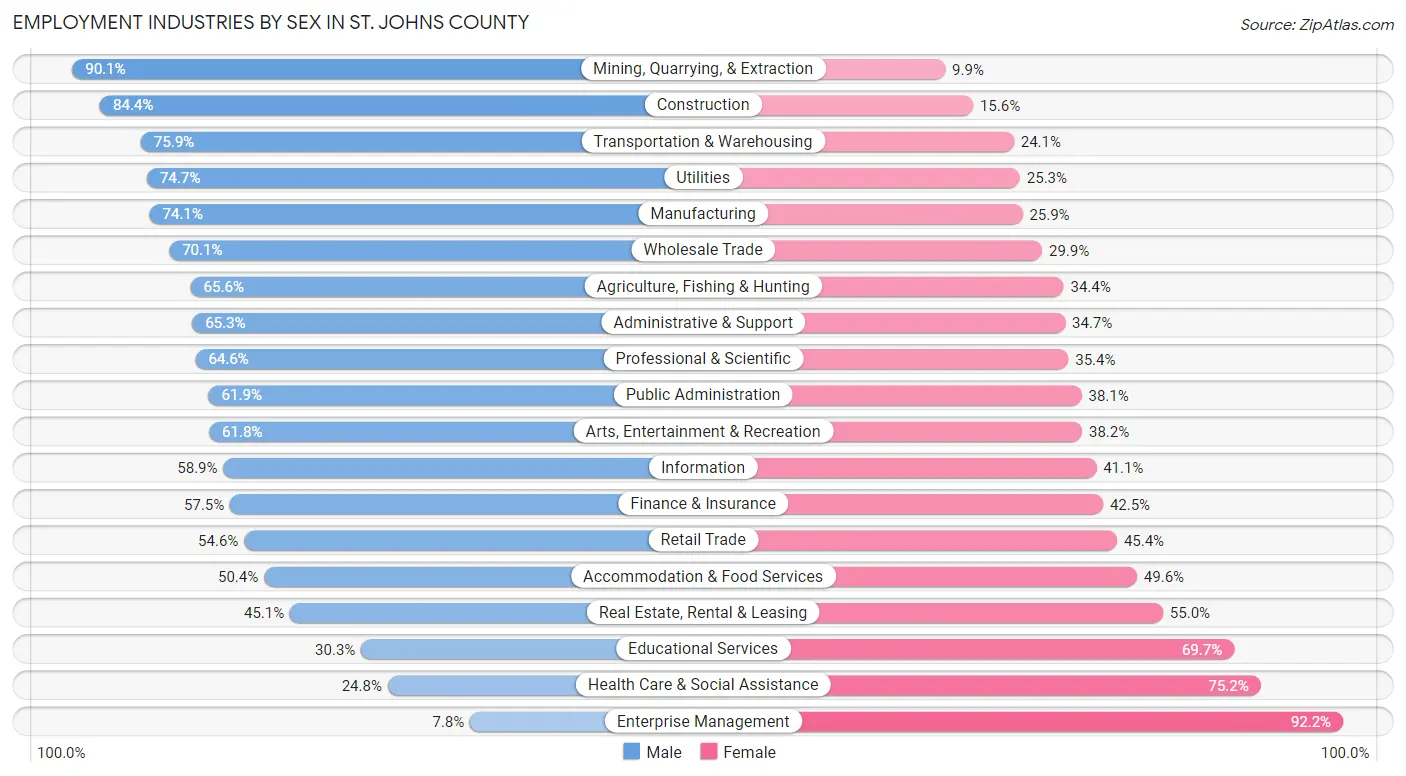
Employment Industries by Sex in St. Johns County
The St. Johns County industries that see more men than women are Mining, Quarrying, & Extraction (90.1%), Construction (84.4%), and Transportation & Warehousing (75.9%), whereas the industries that tend to have a higher number of women are Enterprise Management (92.2%), Health Care & Social Assistance (75.2%), and Educational Services (69.7%).
| Industry | Male | Female |
| Agriculture, Fishing & Hunting | 853 (65.6%) | 447 (34.4%) |
| Mining, Quarrying, & Extraction | 73 (90.1%) | 8 (9.9%) |
| Construction | 6,686 (84.4%) | 1,240 (15.6%) |
| Manufacturing | 5,111 (74.1%) | 1,785 (25.9%) |
| Wholesale Trade | 2,256 (70.1%) | 964 (29.9%) |
| Retail Trade | 8,339 (54.6%) | 6,944 (45.4%) |
| Transportation & Warehousing | 3,754 (75.9%) | 1,191 (24.1%) |
| Utilities | 498 (74.7%) | 169 (25.3%) |
| Information | 1,455 (58.9%) | 1,017 (41.1%) |
| Finance & Insurance | 7,034 (57.5%) | 5,208 (42.5%) |
| Real Estate, Rental & Leasing | 2,160 (45.1%) | 2,635 (54.9%) |
| Professional & Scientific | 9,287 (64.6%) | 5,083 (35.4%) |
| Enterprise Management | 6 (7.8%) | 71 (92.2%) |
| Administrative & Support | 4,529 (65.3%) | 2,408 (34.7%) |
| Educational Services | 2,796 (30.3%) | 6,419 (69.7%) |
| Health Care & Social Assistance | 3,954 (24.8%) | 11,964 (75.2%) |
| Arts, Entertainment & Recreation | 2,138 (61.8%) | 1,322 (38.2%) |
| Accommodation & Food Services | 4,530 (50.4%) | 4,453 (49.6%) |
| Public Administration | 2,982 (61.9%) | 1,836 (38.1%) |
| Total | 71,242 (54.8%) | 58,656 (45.2%) |
Education in St. Johns County
School Enrollment in St. Johns County
The most common levels of schooling among the 65,762 students in St. Johns County are middle school (15,108 | 23.0%), high school (14,847 | 22.6%), and elementary school (12,586 | 19.1%).
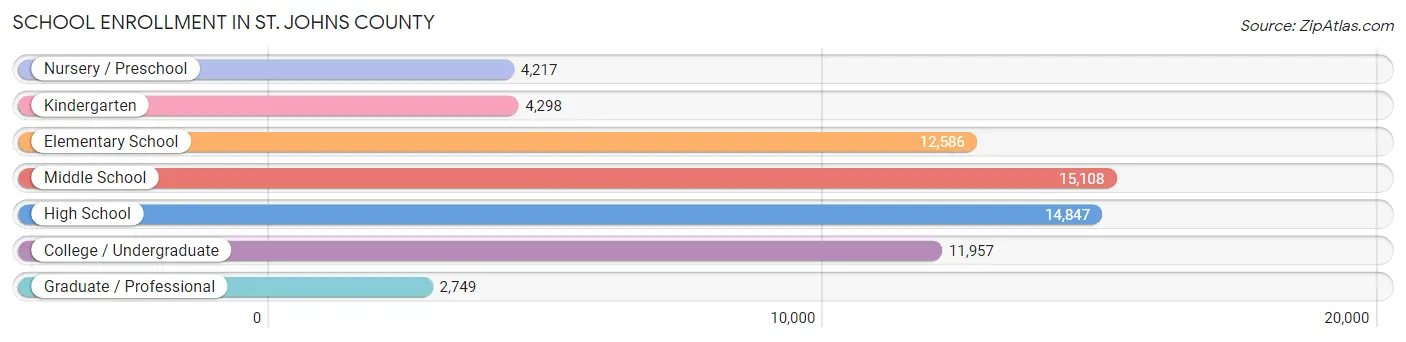
| School Level | # Students | % Students |
| Nursery / Preschool | 4,217 | 6.4% |
| Kindergarten | 4,298 | 6.5% |
| Elementary School | 12,586 | 19.1% |
| Middle School | 15,108 | 23.0% |
| High School | 14,847 | 22.6% |
| College / Undergraduate | 11,957 | 18.2% |
| Graduate / Professional | 2,749 | 4.2% |
| Total | 65,762 | 100.0% |
School Enrollment by Age by Funding Source in St. Johns County
Out of a total of 65,762 students who are enrolled in schools in St. Johns County, 11,574 (17.6%) attend a private institution, while the remaining 54,188 (82.4%) are enrolled in public schools. The age group of 3 to 4 year olds has the highest likelihood of being enrolled in private schools, with 1,505 (48.1% in the age bracket) enrolled. Conversely, the age group of 15 to 17 year olds has the lowest likelihood of being enrolled in a private school, with 10,012 (91.7% in the age bracket) attending a public institution.
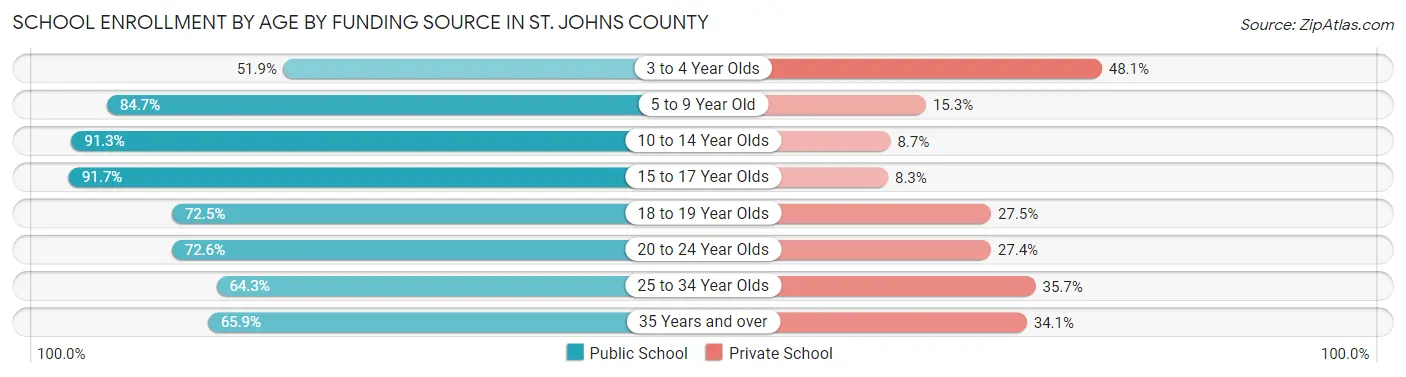
| Age Bracket | Public School | Private School |
| 3 to 4 Year Olds | 1,625 (51.9%) | 1,505 (48.1%) |
| 5 to 9 Year Old | 13,376 (84.7%) | 2,421 (15.3%) |
| 10 to 14 Year Olds | 17,201 (91.3%) | 1,641 (8.7%) |
| 15 to 17 Year Olds | 10,012 (91.7%) | 902 (8.3%) |
| 18 to 19 Year Olds | 3,642 (72.5%) | 1,379 (27.5%) |
| 20 to 24 Year Olds | 4,493 (72.6%) | 1,698 (27.4%) |
| 25 to 34 Year Olds | 1,534 (64.3%) | 853 (35.7%) |
| 35 Years and over | 2,293 (65.9%) | 1,187 (34.1%) |
| Total | 54,188 (82.4%) | 11,574 (17.6%) |
Educational Attainment by Field of Study in St. Johns County
Business (25,884 | 25.7%), education (10,861 | 10.8%), science & technology (10,155 | 10.1%), social sciences (7,485 | 7.4%), and engineering (7,379 | 7.3%) are the most common fields of study among 100,693 individuals in St. Johns County who have obtained a bachelor's degree or higher.
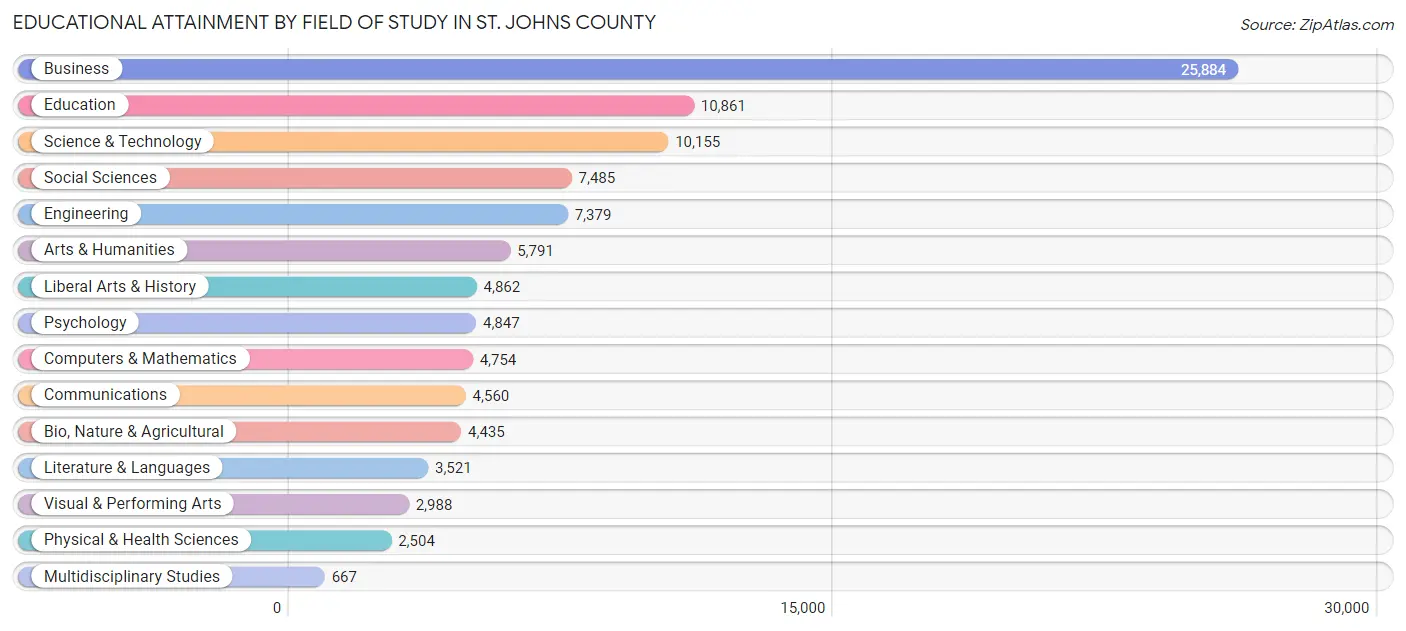
| Field of Study | # Graduates | % Graduates |
| Computers & Mathematics | 4,754 | 4.7% |
| Bio, Nature & Agricultural | 4,435 | 4.4% |
| Physical & Health Sciences | 2,504 | 2.5% |
| Psychology | 4,847 | 4.8% |
| Social Sciences | 7,485 | 7.4% |
| Engineering | 7,379 | 7.3% |
| Multidisciplinary Studies | 667 | 0.7% |
| Science & Technology | 10,155 | 10.1% |
| Business | 25,884 | 25.7% |
| Education | 10,861 | 10.8% |
| Literature & Languages | 3,521 | 3.5% |
| Liberal Arts & History | 4,862 | 4.8% |
| Visual & Performing Arts | 2,988 | 3.0% |
| Communications | 4,560 | 4.5% |
| Arts & Humanities | 5,791 | 5.8% |
| Total | 100,693 | 100.0% |
Transportation & Commute in St. Johns County
Vehicle Availability by Sex in St. Johns County
The most prevalent vehicle ownership categories in St. Johns County are males with 2 vehicles (36,061, accounting for 51.1%) and females with 2 vehicles (27,184, making up 62.7%).
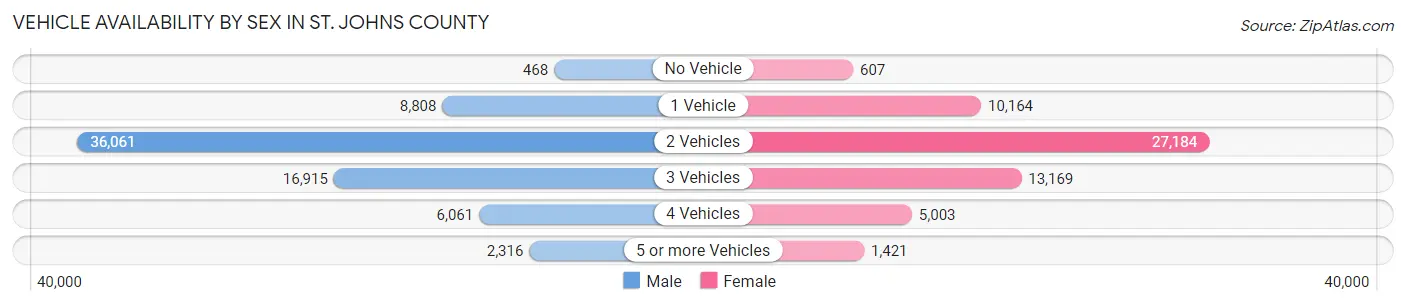
| Vehicles Available | Male | Female |
| No Vehicle | 468 (0.7%) | 607 (1.1%) |
| 1 Vehicle | 8,808 (12.5%) | 10,164 (17.7%) |
| 2 Vehicles | 36,061 (51.1%) | 27,184 (47.2%) |
| 3 Vehicles | 16,915 (23.9%) | 13,169 (22.9%) |
| 4 Vehicles | 6,061 (8.6%) | 5,003 (8.7%) |
| 5 or more Vehicles | 2,316 (3.3%) | 1,421 (2.5%) |
| Total | 70,629 (100.0%) | 57,548 (100.0%) |
Commute Time in St. Johns County
The most frequently occuring commute durations in St. Johns County are 30 to 34 minutes (17,220 commuters, 16.8%), 15 to 19 minutes (15,368 commuters, 15.0%), and 20 to 24 minutes (14,284 commuters, 13.9%).
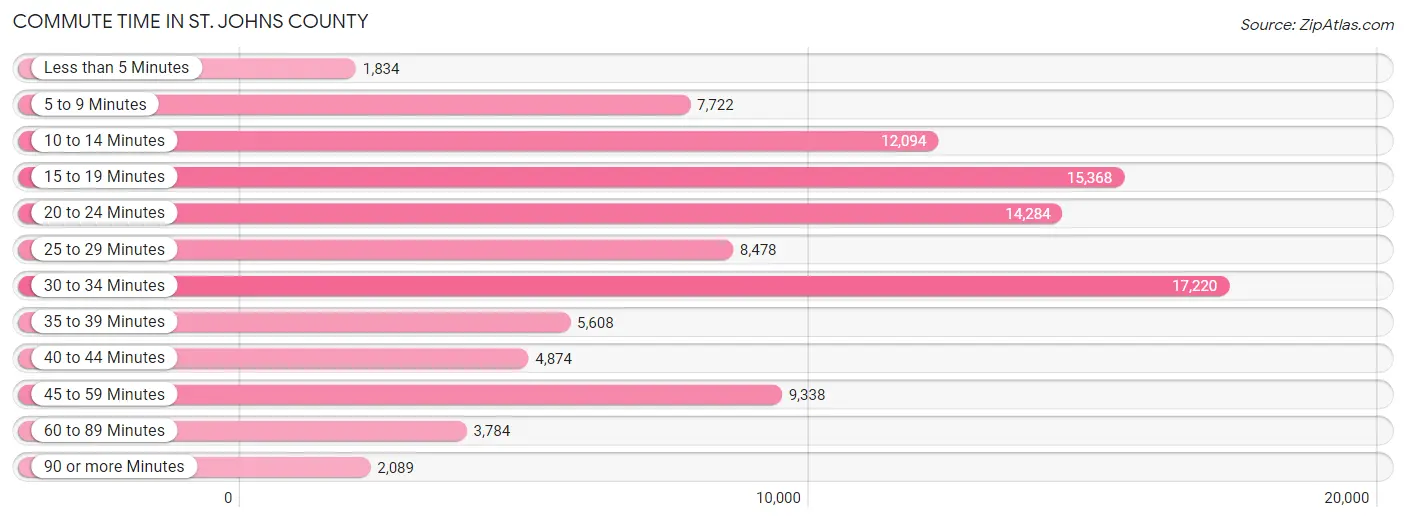
| Commute Time | # Commuters | % Commuters |
| Less than 5 Minutes | 1,834 | 1.8% |
| 5 to 9 Minutes | 7,722 | 7.5% |
| 10 to 14 Minutes | 12,094 | 11.8% |
| 15 to 19 Minutes | 15,368 | 15.0% |
| 20 to 24 Minutes | 14,284 | 13.9% |
| 25 to 29 Minutes | 8,478 | 8.3% |
| 30 to 34 Minutes | 17,220 | 16.8% |
| 35 to 39 Minutes | 5,608 | 5.5% |
| 40 to 44 Minutes | 4,874 | 4.8% |
| 45 to 59 Minutes | 9,338 | 9.1% |
| 60 to 89 Minutes | 3,784 | 3.7% |
| 90 or more Minutes | 2,089 | 2.0% |
Commute Time by Sex in St. Johns County
The most common commute times in St. Johns County are 30 to 34 minutes (10,728 commuters, 18.9%) for males and 15 to 19 minutes (7,733 commuters, 16.8%) for females.
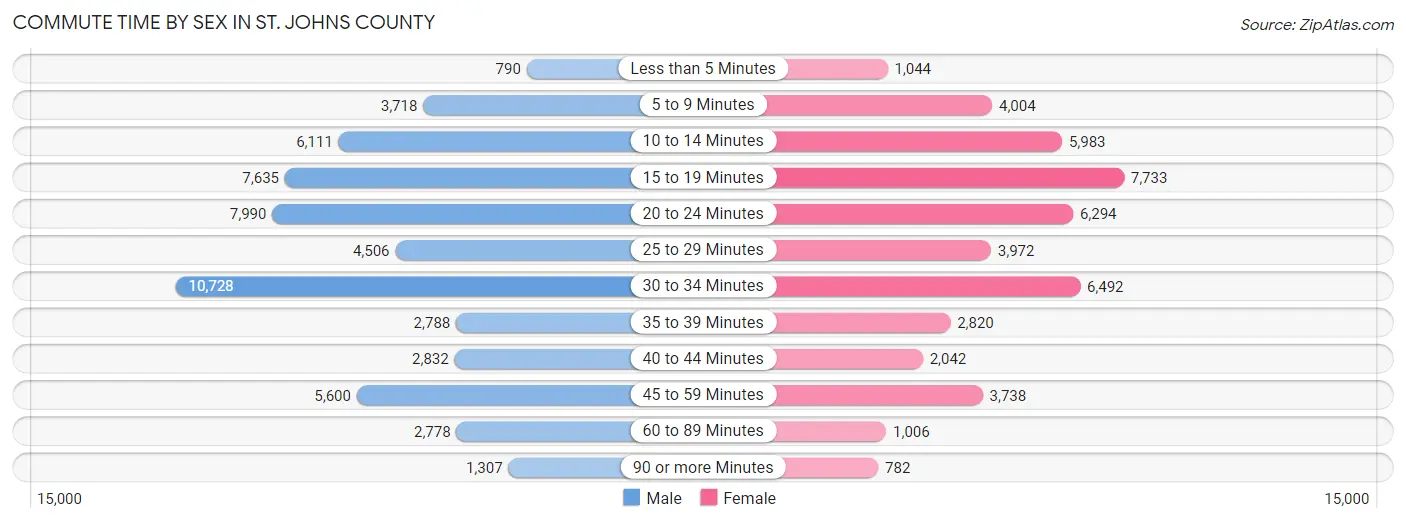
| Commute Time | Male | Female |
| Less than 5 Minutes | 790 (1.4%) | 1,044 (2.3%) |
| 5 to 9 Minutes | 3,718 (6.6%) | 4,004 (8.7%) |
| 10 to 14 Minutes | 6,111 (10.8%) | 5,983 (13.0%) |
| 15 to 19 Minutes | 7,635 (13.5%) | 7,733 (16.8%) |
| 20 to 24 Minutes | 7,990 (14.1%) | 6,294 (13.7%) |
| 25 to 29 Minutes | 4,506 (7.9%) | 3,972 (8.6%) |
| 30 to 34 Minutes | 10,728 (18.9%) | 6,492 (14.1%) |
| 35 to 39 Minutes | 2,788 (4.9%) | 2,820 (6.1%) |
| 40 to 44 Minutes | 2,832 (5.0%) | 2,042 (4.4%) |
| 45 to 59 Minutes | 5,600 (9.9%) | 3,738 (8.1%) |
| 60 to 89 Minutes | 2,778 (4.9%) | 1,006 (2.2%) |
| 90 or more Minutes | 1,307 (2.3%) | 782 (1.7%) |
Time of Departure to Work by Sex in St. Johns County
The most frequent times of departure to work in St. Johns County are 7:00 AM to 7:29 AM (9,514, 16.8%) for males and 8:00 AM to 8:29 AM (7,889, 17.2%) for females.
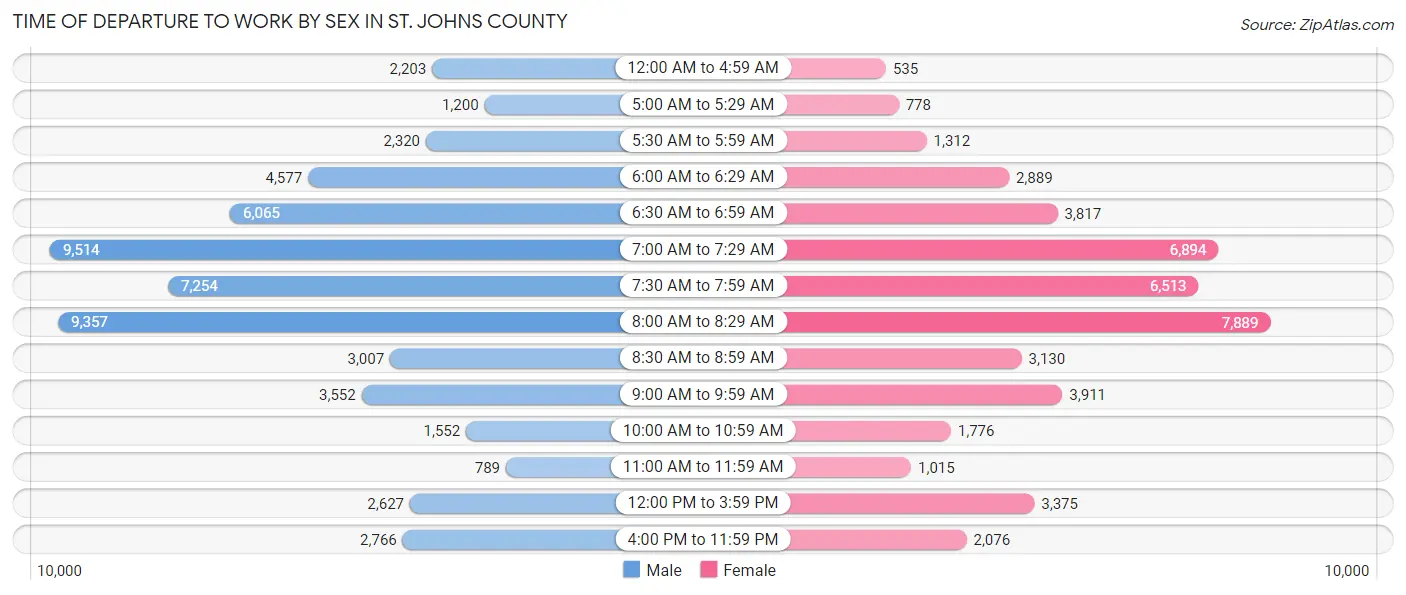
| Time of Departure | Male | Female |
| 12:00 AM to 4:59 AM | 2,203 (3.9%) | 535 (1.2%) |
| 5:00 AM to 5:29 AM | 1,200 (2.1%) | 778 (1.7%) |
| 5:30 AM to 5:59 AM | 2,320 (4.1%) | 1,312 (2.9%) |
| 6:00 AM to 6:29 AM | 4,577 (8.1%) | 2,889 (6.3%) |
| 6:30 AM to 6:59 AM | 6,065 (10.7%) | 3,817 (8.3%) |
| 7:00 AM to 7:29 AM | 9,514 (16.8%) | 6,894 (15.0%) |
| 7:30 AM to 7:59 AM | 7,254 (12.8%) | 6,513 (14.2%) |
| 8:00 AM to 8:29 AM | 9,357 (16.5%) | 7,889 (17.2%) |
| 8:30 AM to 8:59 AM | 3,007 (5.3%) | 3,130 (6.8%) |
| 9:00 AM to 9:59 AM | 3,552 (6.3%) | 3,911 (8.5%) |
| 10:00 AM to 10:59 AM | 1,552 (2.7%) | 1,776 (3.9%) |
| 11:00 AM to 11:59 AM | 789 (1.4%) | 1,015 (2.2%) |
| 12:00 PM to 3:59 PM | 2,627 (4.6%) | 3,375 (7.3%) |
| 4:00 PM to 11:59 PM | 2,766 (4.9%) | 2,076 (4.5%) |
| Total | 56,783 (100.0%) | 45,910 (100.0%) |
Housing Occupancy in St. Johns County
Occupancy by Ownership in St. Johns County
Of the total 102,056 dwellings in St. Johns County, owner-occupied units account for 84,061 (82.4%), while renter-occupied units make up 17,995 (17.6%).
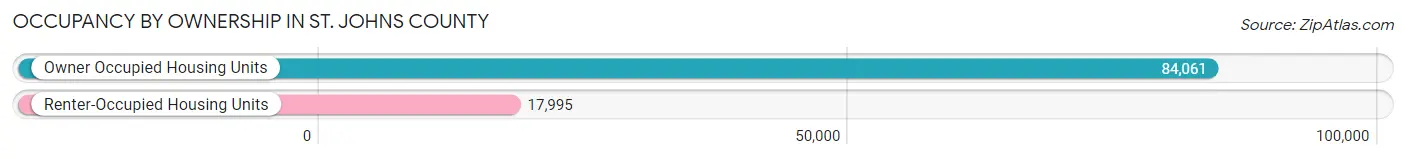
| Occupancy | # Housing Units | % Housing Units |
| Owner Occupied Housing Units | 84,061 | 82.4% |
| Renter-Occupied Housing Units | 17,995 | 17.6% |
| Total Occupied Housing Units | 102,056 | 100.0% |
Occupancy by Household Size in St. Johns County
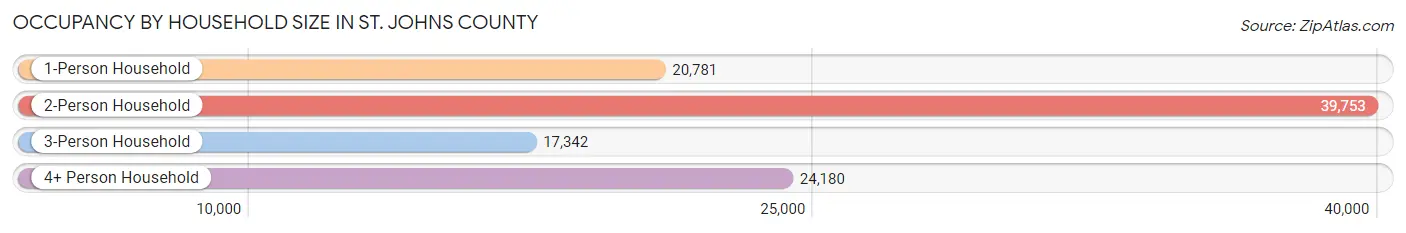
| Household Size | # Housing Units | % Housing Units |
| 1-Person Household | 20,781 | 20.4% |
| 2-Person Household | 39,753 | 39.0% |
| 3-Person Household | 17,342 | 17.0% |
| 4+ Person Household | 24,180 | 23.7% |
| Total Housing Units | 102,056 | 100.0% |
Occupancy by Ownership by Household Size in St. Johns County
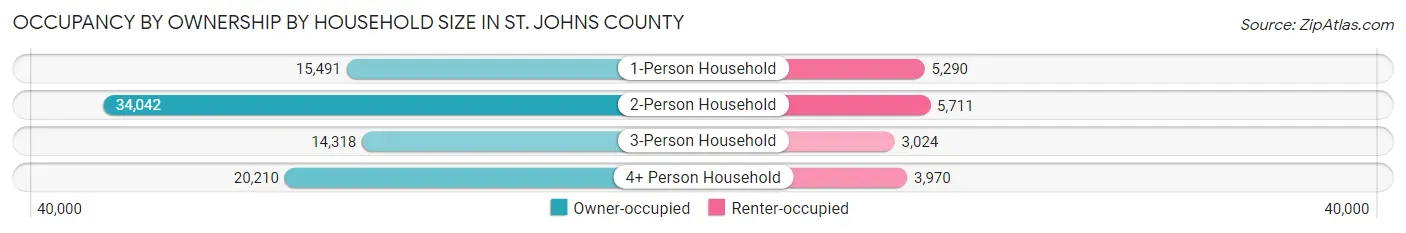
| Household Size | Owner-occupied | Renter-occupied |
| 1-Person Household | 15,491 (74.5%) | 5,290 (25.5%) |
| 2-Person Household | 34,042 (85.6%) | 5,711 (14.4%) |
| 3-Person Household | 14,318 (82.6%) | 3,024 (17.4%) |
| 4+ Person Household | 20,210 (83.6%) | 3,970 (16.4%) |
| Total Housing Units | 84,061 (82.4%) | 17,995 (17.6%) |
Occupancy by Educational Attainment in St. Johns County
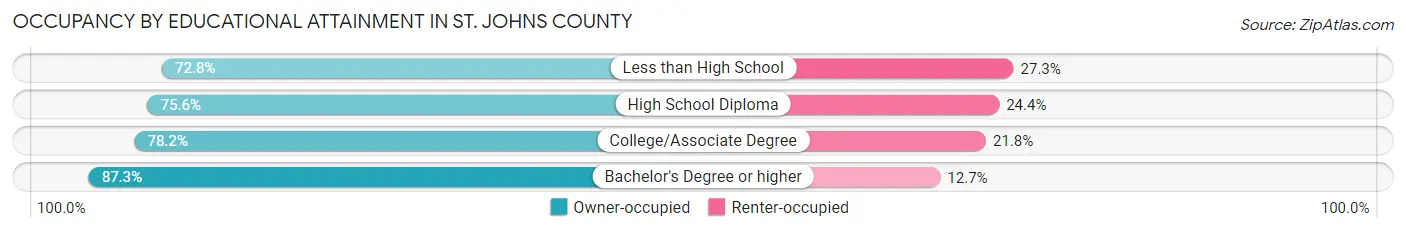
| Household Size | Owner-occupied | Renter-occupied |
| Less than High School | 2,856 (72.8%) | 1,070 (27.3%) |
| High School Diploma | 12,140 (75.6%) | 3,918 (24.4%) |
| College/Associate Degree | 22,016 (78.2%) | 6,138 (21.8%) |
| Bachelor's Degree or higher | 47,049 (87.3%) | 6,869 (12.7%) |
Occupancy by Age of Householder in St. Johns County
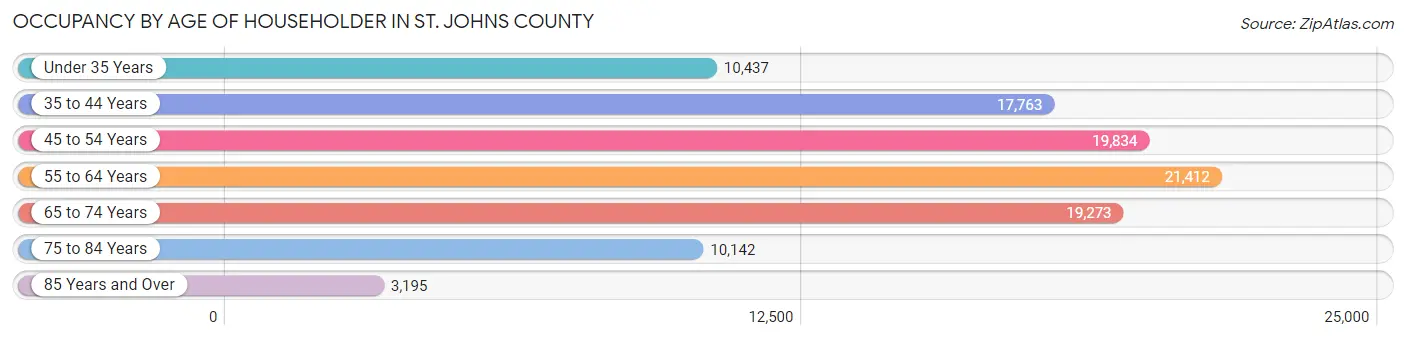
| Age Bracket | # Households | % Households |
| Under 35 Years | 10,437 | 10.2% |
| 35 to 44 Years | 17,763 | 17.4% |
| 45 to 54 Years | 19,834 | 19.4% |
| 55 to 64 Years | 21,412 | 21.0% |
| 65 to 74 Years | 19,273 | 18.9% |
| 75 to 84 Years | 10,142 | 9.9% |
| 85 Years and Over | 3,195 | 3.1% |
| Total | 102,056 | 100.0% |
Housing Finances in St. Johns County
Median Income by Occupancy in St. Johns County
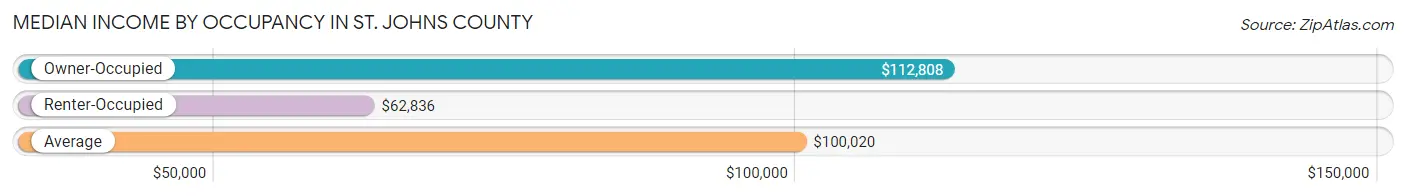
| Occupancy Type | # Households | Median Income |
| Owner-Occupied | 84,061 (82.4%) | $112,808 |
| Renter-Occupied | 17,995 (17.6%) | $62,836 |
| Average | 102,056 (100.0%) | $100,020 |
Occupancy by Householder Income Bracket in St. Johns County
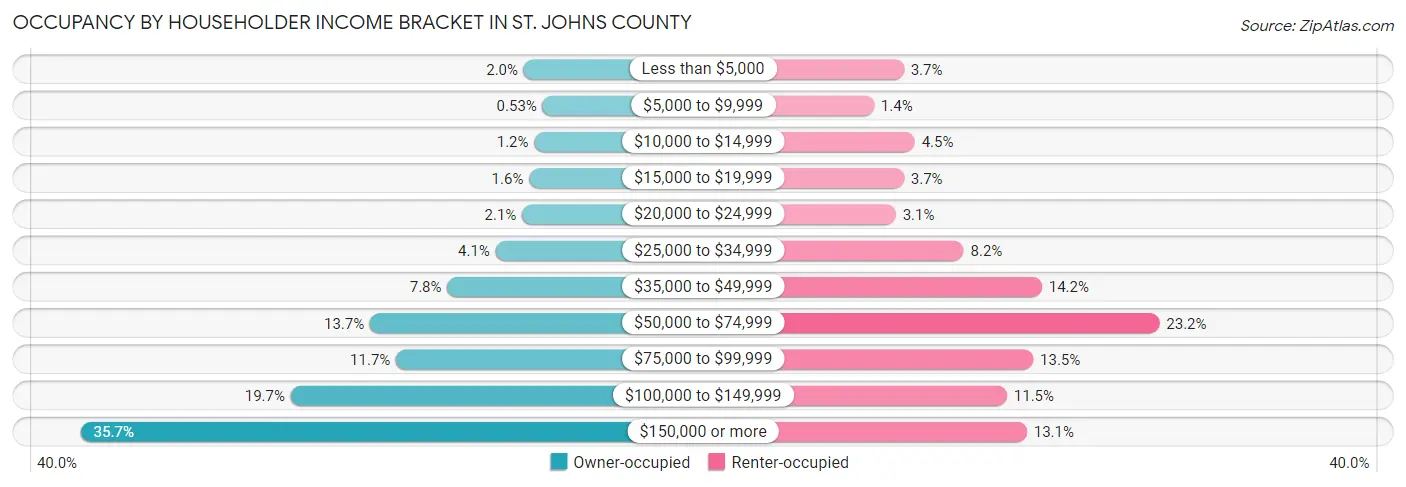
| Income Bracket | Owner-occupied | Renter-occupied |
| Less than $5,000 | 1,645 (2.0%) | 661 (3.7%) |
| $5,000 to $9,999 | 445 (0.5%) | 252 (1.4%) |
| $10,000 to $14,999 | 972 (1.2%) | 811 (4.5%) |
| $15,000 to $19,999 | 1,305 (1.5%) | 662 (3.7%) |
| $20,000 to $24,999 | 1,753 (2.1%) | 551 (3.1%) |
| $25,000 to $34,999 | 3,459 (4.1%) | 1,481 (8.2%) |
| $35,000 to $49,999 | 6,546 (7.8%) | 2,554 (14.2%) |
| $50,000 to $74,999 | 11,497 (13.7%) | 4,165 (23.2%) |
| $75,000 to $99,999 | 9,827 (11.7%) | 2,435 (13.5%) |
| $100,000 to $149,999 | 16,577 (19.7%) | 2,075 (11.5%) |
| $150,000 or more | 30,035 (35.7%) | 2,348 (13.1%) |
| Total | 84,061 (100.0%) | 17,995 (100.0%) |
Monthly Housing Cost Tiers in St. Johns County
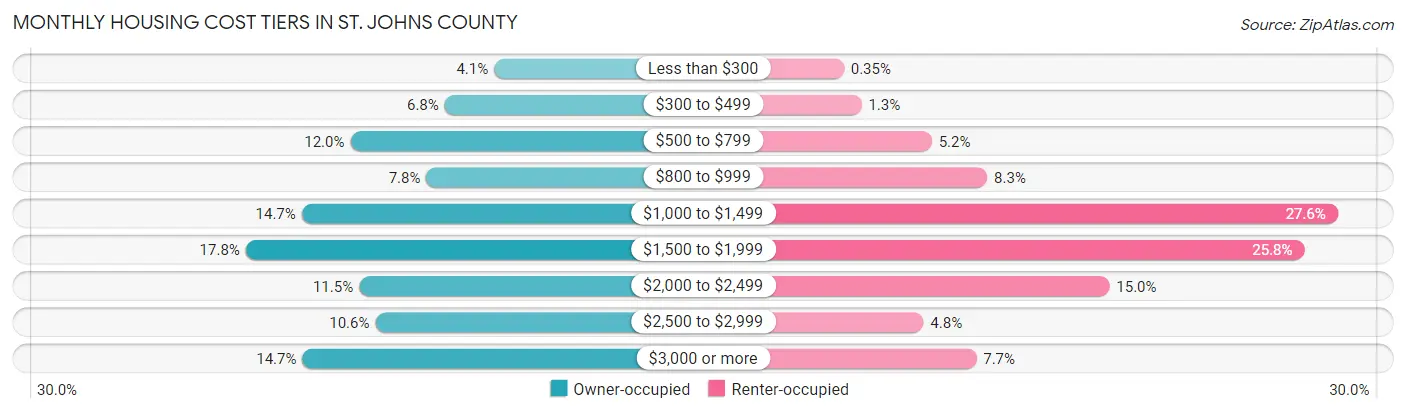
| Monthly Cost | Owner-occupied | Renter-occupied |
| Less than $300 | 3,418 (4.1%) | 63 (0.4%) |
| $300 to $499 | 5,718 (6.8%) | 240 (1.3%) |
| $500 to $799 | 10,098 (12.0%) | 938 (5.2%) |
| $800 to $999 | 6,568 (7.8%) | 1,489 (8.3%) |
| $1,000 to $1,499 | 12,355 (14.7%) | 4,972 (27.6%) |
| $1,500 to $1,999 | 14,954 (17.8%) | 4,641 (25.8%) |
| $2,000 to $2,499 | 9,689 (11.5%) | 2,702 (15.0%) |
| $2,500 to $2,999 | 8,939 (10.6%) | 854 (4.8%) |
| $3,000 or more | 12,322 (14.7%) | 1,380 (7.7%) |
| Total | 84,061 (100.0%) | 17,995 (100.0%) |
Physical Housing Characteristics in St. Johns County
Housing Structures in St. Johns County
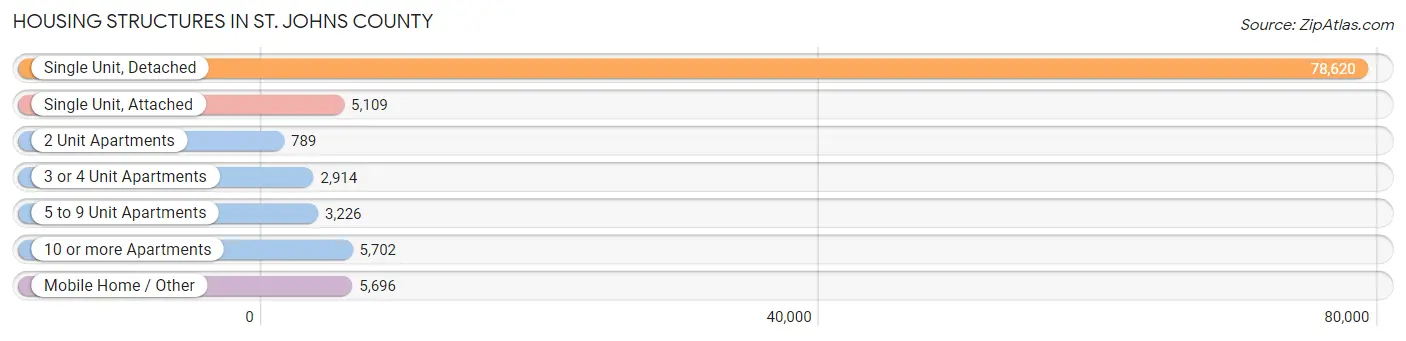
| Structure Type | # Housing Units | % Housing Units |
| Single Unit, Detached | 78,620 | 77.0% |
| Single Unit, Attached | 5,109 | 5.0% |
| 2 Unit Apartments | 789 | 0.8% |
| 3 or 4 Unit Apartments | 2,914 | 2.9% |
| 5 to 9 Unit Apartments | 3,226 | 3.2% |
| 10 or more Apartments | 5,702 | 5.6% |
| Mobile Home / Other | 5,696 | 5.6% |
| Total | 102,056 | 100.0% |
Housing Structures by Occupancy in St. Johns County
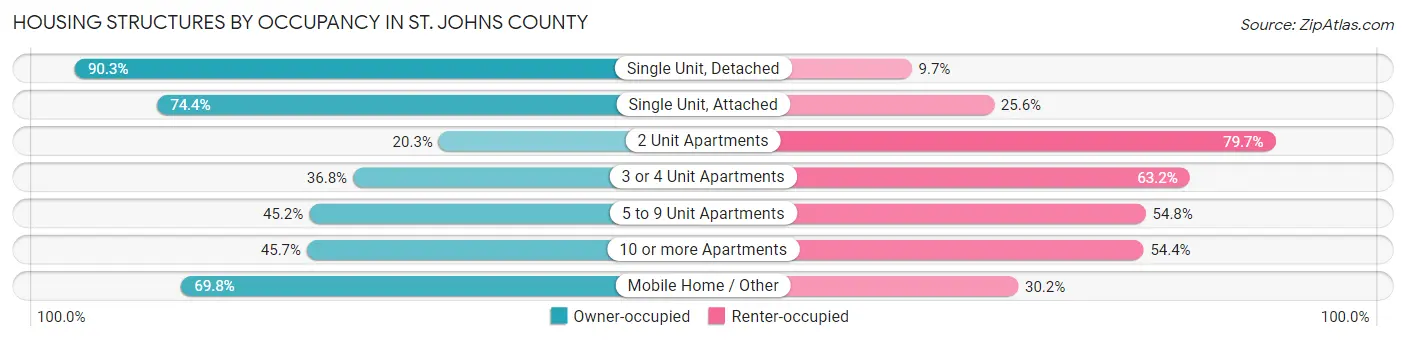
| Structure Type | Owner-occupied | Renter-occupied |
| Single Unit, Detached | 70,988 (90.3%) | 7,632 (9.7%) |
| Single Unit, Attached | 3,803 (74.4%) | 1,306 (25.6%) |
| 2 Unit Apartments | 160 (20.3%) | 629 (79.7%) |
| 3 or 4 Unit Apartments | 1,072 (36.8%) | 1,842 (63.2%) |
| 5 to 9 Unit Apartments | 1,459 (45.2%) | 1,767 (54.8%) |
| 10 or more Apartments | 2,603 (45.7%) | 3,099 (54.3%) |
| Mobile Home / Other | 3,976 (69.8%) | 1,720 (30.2%) |
| Total | 84,061 (82.4%) | 17,995 (17.6%) |
Housing Structures by Number of Rooms in St. Johns County
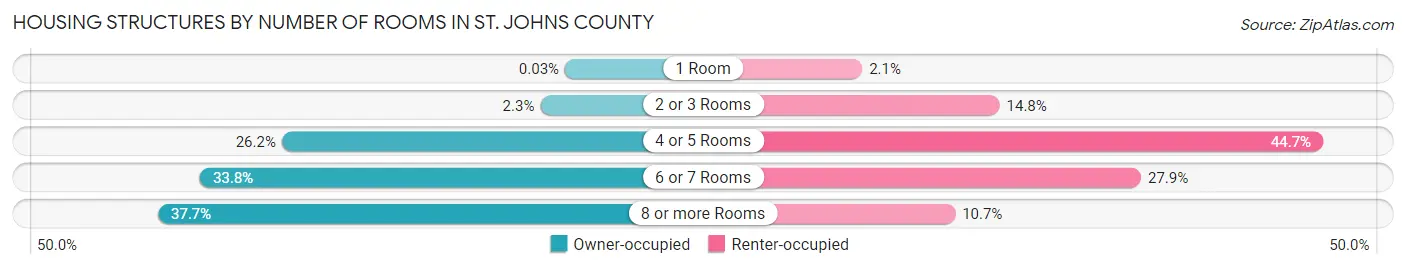
| Number of Rooms | Owner-occupied | Renter-occupied |
| 1 Room | 28 (0.0%) | 370 (2.1%) |
| 2 or 3 Rooms | 1,941 (2.3%) | 2,657 (14.8%) |
| 4 or 5 Rooms | 22,037 (26.2%) | 8,039 (44.7%) |
| 6 or 7 Rooms | 28,392 (33.8%) | 5,011 (27.9%) |
| 8 or more Rooms | 31,663 (37.7%) | 1,918 (10.7%) |
| Total | 84,061 (100.0%) | 17,995 (100.0%) |
Housing Structure by Heating Type in St. Johns County
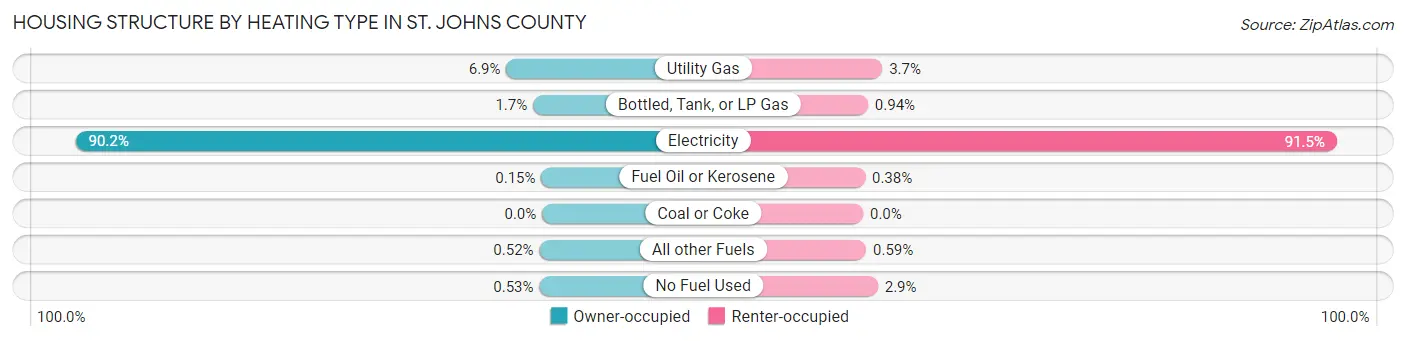
| Heating Type | Owner-occupied | Renter-occupied |
| Utility Gas | 5,799 (6.9%) | 665 (3.7%) |
| Bottled, Tank, or LP Gas | 1,466 (1.7%) | 170 (0.9%) |
| Electricity | 75,790 (90.2%) | 16,472 (91.5%) |
| Fuel Oil or Kerosene | 126 (0.2%) | 68 (0.4%) |
| Coal or Coke | 0 (0.0%) | 0 (0.0%) |
| All other Fuels | 438 (0.5%) | 107 (0.6%) |
| No Fuel Used | 442 (0.5%) | 513 (2.9%) |
| Total | 84,061 (100.0%) | 17,995 (100.0%) |
Household Vehicle Usage in St. Johns County
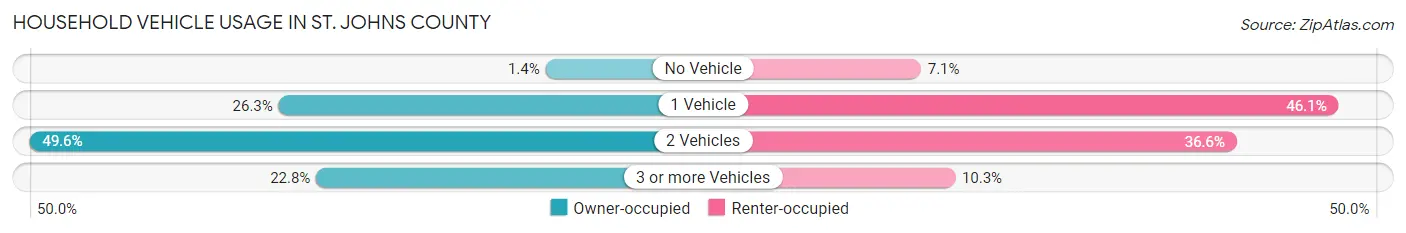
| Vehicles per Household | Owner-occupied | Renter-occupied |
| No Vehicle | 1,153 (1.4%) | 1,274 (7.1%) |
| 1 Vehicle | 22,098 (26.3%) | 8,291 (46.1%) |
| 2 Vehicles | 41,659 (49.6%) | 6,582 (36.6%) |
| 3 or more Vehicles | 19,151 (22.8%) | 1,848 (10.3%) |
| Total | 84,061 (100.0%) | 17,995 (100.0%) |
Real Estate & Mortgages in St. Johns County
Real Estate and Mortgage Overview in St. Johns County
| Characteristic | Without Mortgage | With Mortgage |
| Housing Units | 28,242 | 55,819 |
| Median Property Value | $394,200 | $424,800 |
| Median Household Income | $83,299 | $22,682 |
| Monthly Housing Costs | $652 | $11,826 |
| Real Estate Taxes | $3,119 | $991 |
Property Value by Mortgage Status in St. Johns County
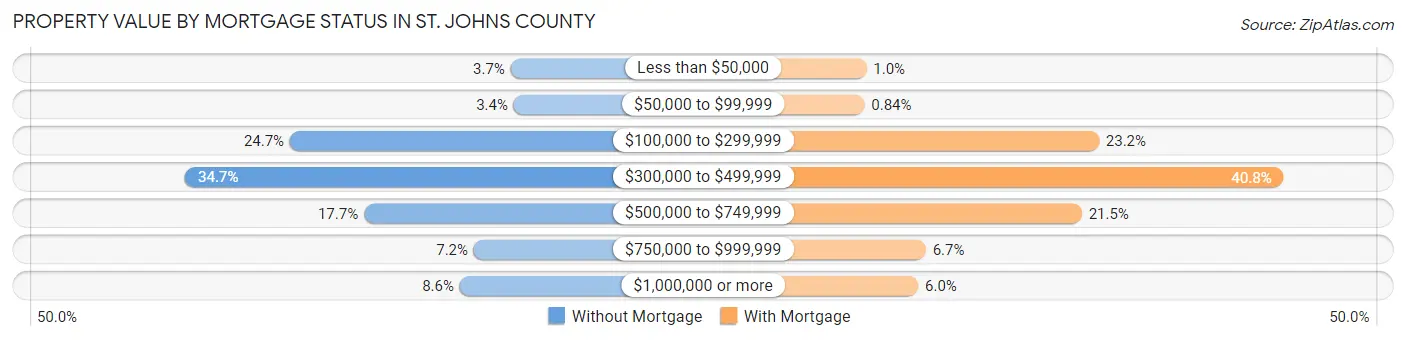
| Property Value | Without Mortgage | With Mortgage |
| Less than $50,000 | 1,049 (3.7%) | 576 (1.0%) |
| $50,000 to $99,999 | 963 (3.4%) | 467 (0.8%) |
| $100,000 to $299,999 | 6,983 (24.7%) | 12,934 (23.2%) |
| $300,000 to $499,999 | 9,802 (34.7%) | 22,760 (40.8%) |
| $500,000 to $749,999 | 4,994 (17.7%) | 12,024 (21.5%) |
| $750,000 to $999,999 | 2,036 (7.2%) | 3,731 (6.7%) |
| $1,000,000 or more | 2,415 (8.6%) | 3,327 (6.0%) |
| Total | 28,242 (100.0%) | 55,819 (100.0%) |
Household Income by Mortgage Status in St. Johns County
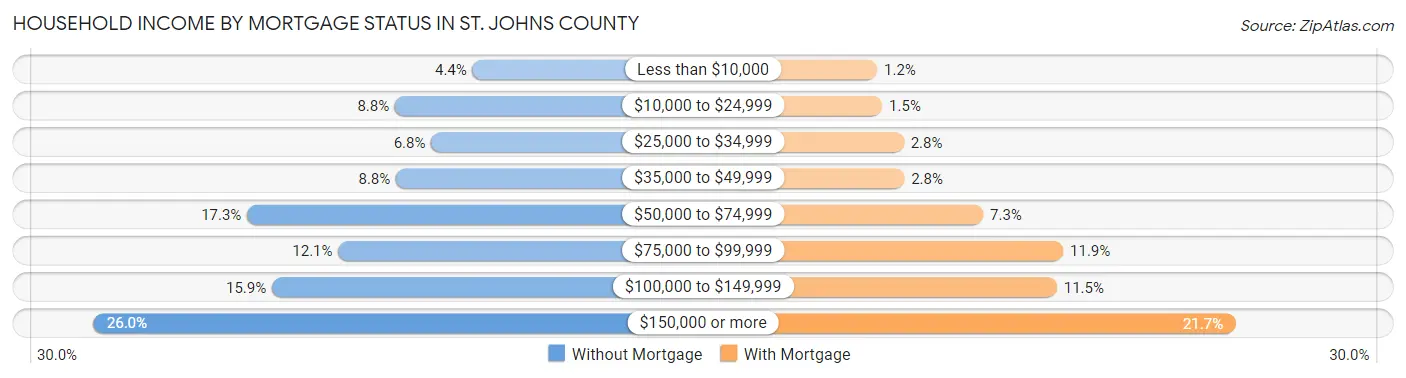
| Household Income | Without Mortgage | With Mortgage |
| Less than $10,000 | 1,243 (4.4%) | 688 (1.2%) |
| $10,000 to $24,999 | 2,494 (8.8%) | 847 (1.5%) |
| $25,000 to $34,999 | 1,908 (6.8%) | 1,536 (2.8%) |
| $35,000 to $49,999 | 2,477 (8.8%) | 1,551 (2.8%) |
| $50,000 to $74,999 | 4,879 (17.3%) | 4,069 (7.3%) |
| $75,000 to $99,999 | 3,410 (12.1%) | 6,618 (11.9%) |
| $100,000 to $149,999 | 4,478 (15.9%) | 6,417 (11.5%) |
| $150,000 or more | 7,353 (26.0%) | 12,099 (21.7%) |
| Total | 28,242 (100.0%) | 55,819 (100.0%) |
Property Value to Household Income Ratio in St. Johns County
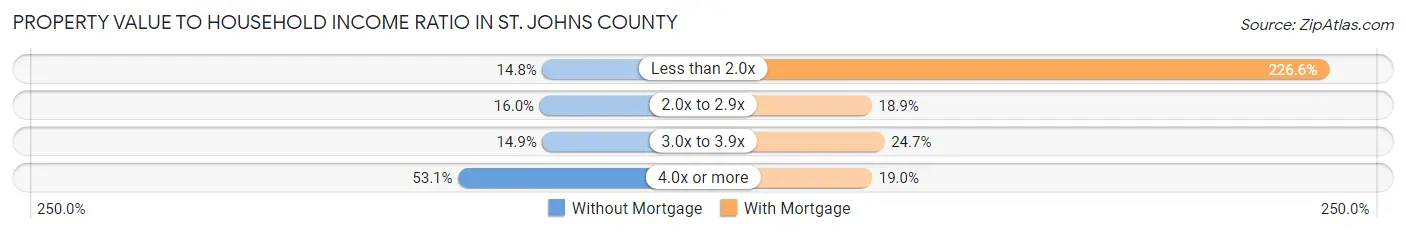
| Value-to-Income Ratio | Without Mortgage | With Mortgage |
| Less than 2.0x | 4,173 (14.8%) | 126,503 (226.6%) |
| 2.0x to 2.9x | 4,529 (16.0%) | 10,551 (18.9%) |
| 3.0x to 3.9x | 4,197 (14.9%) | 13,766 (24.7%) |
| 4.0x or more | 14,987 (53.1%) | 10,613 (19.0%) |
| Total | 28,242 (100.0%) | 55,819 (100.0%) |
Real Estate Taxes by Mortgage Status in St. Johns County
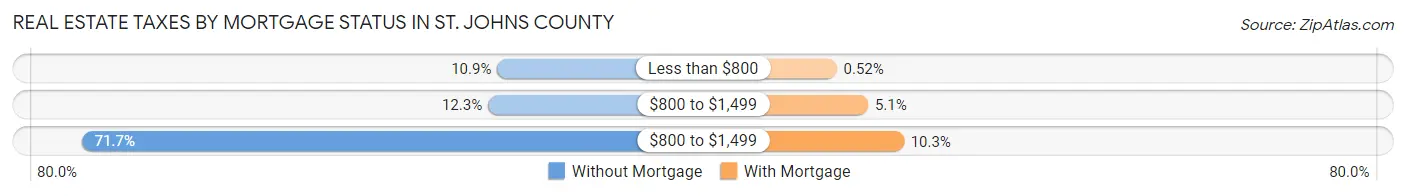
| Property Taxes | Without Mortgage | With Mortgage |
| Less than $800 | 3,091 (10.9%) | 292 (0.5%) |
| $800 to $1,499 | 3,472 (12.3%) | 2,845 (5.1%) |
| $800 to $1,499 | 20,243 (71.7%) | 5,759 (10.3%) |
| Total | 28,242 (100.0%) | 55,819 (100.0%) |
Health & Disability in St. Johns County
Health Insurance Coverage by Age in St. Johns County
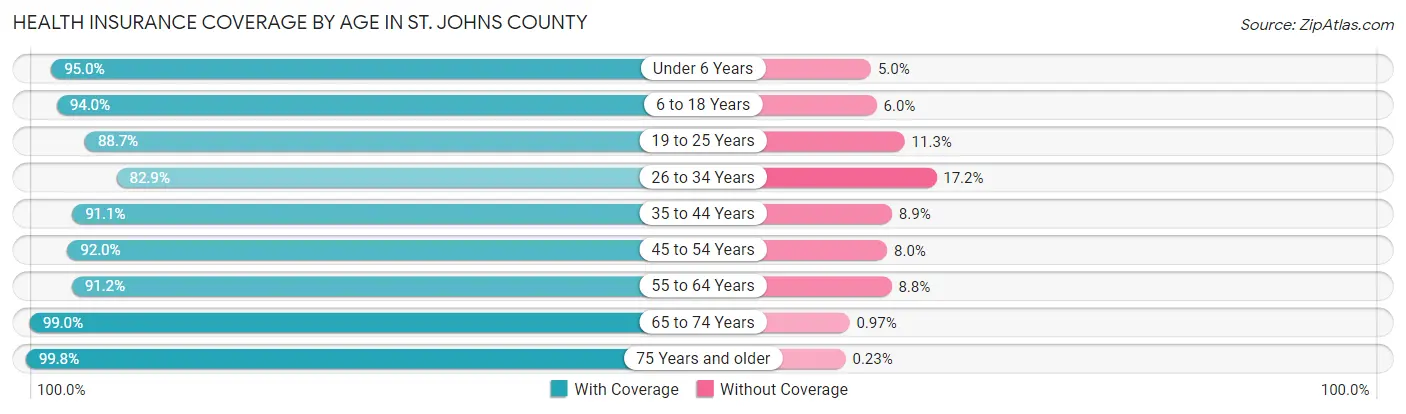
| Age Bracket | With Coverage | Without Coverage |
| Under 6 Years | 15,360 (95.0%) | 804 (5.0%) |
| 6 to 18 Years | 44,889 (94.0%) | 2,875 (6.0%) |
| 19 to 25 Years | 16,568 (88.7%) | 2,102 (11.3%) |
| 26 to 34 Years | 18,520 (82.9%) | 3,835 (17.2%) |
| 35 to 44 Years | 33,787 (91.1%) | 3,293 (8.9%) |
| 45 to 54 Years | 35,421 (92.0%) | 3,071 (8.0%) |
| 55 to 64 Years | 35,874 (91.2%) | 3,460 (8.8%) |
| 65 to 74 Years | 34,155 (99.0%) | 334 (1.0%) |
| 75 Years and older | 22,369 (99.8%) | 52 (0.2%) |
| Total | 256,943 (92.8%) | 19,826 (7.2%) |
Health Insurance Coverage by Citizenship Status in St. Johns County
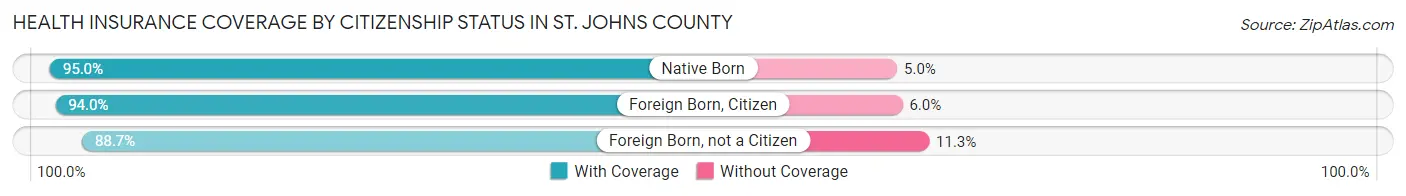
| Citizenship Status | With Coverage | Without Coverage |
| Native Born | 15,360 (95.0%) | 804 (5.0%) |
| Foreign Born, Citizen | 44,889 (94.0%) | 2,875 (6.0%) |
| Foreign Born, not a Citizen | 16,568 (88.7%) | 2,102 (11.3%) |
Health Insurance Coverage by Household Income in St. Johns County
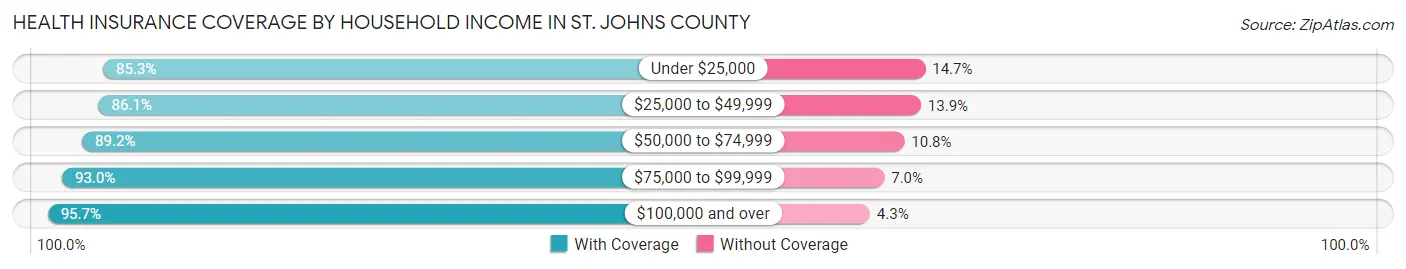
| Household Income | With Coverage | Without Coverage |
| Under $25,000 | 13,681 (85.3%) | 2,360 (14.7%) |
| $25,000 to $49,999 | 24,417 (86.1%) | 3,935 (13.9%) |
| $50,000 to $74,999 | 33,142 (89.2%) | 4,010 (10.8%) |
| $75,000 to $99,999 | 30,845 (93.0%) | 2,330 (7.0%) |
| $100,000 and over | 153,348 (95.7%) | 6,942 (4.3%) |
Public vs Private Health Insurance Coverage by Age in St. Johns County
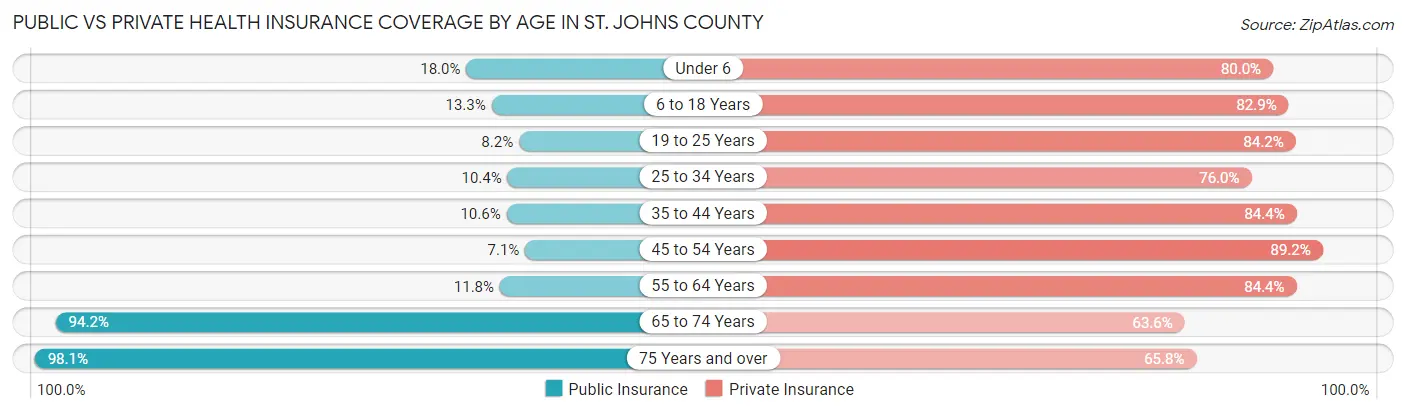
| Age Bracket | Public Insurance | Private Insurance |
| Under 6 | 2,912 (18.0%) | 12,935 (80.0%) |
| 6 to 18 Years | 6,368 (13.3%) | 39,602 (82.9%) |
| 19 to 25 Years | 1,536 (8.2%) | 15,725 (84.2%) |
| 25 to 34 Years | 2,317 (10.4%) | 16,992 (76.0%) |
| 35 to 44 Years | 3,917 (10.6%) | 31,292 (84.4%) |
| 45 to 54 Years | 2,731 (7.1%) | 34,351 (89.2%) |
| 55 to 64 Years | 4,634 (11.8%) | 33,187 (84.4%) |
| 65 to 74 Years | 32,498 (94.2%) | 21,944 (63.6%) |
| 75 Years and over | 21,997 (98.1%) | 14,749 (65.8%) |
| Total | 78,910 (28.5%) | 220,777 (79.8%) |
Disability Status by Sex by Age in St. Johns County
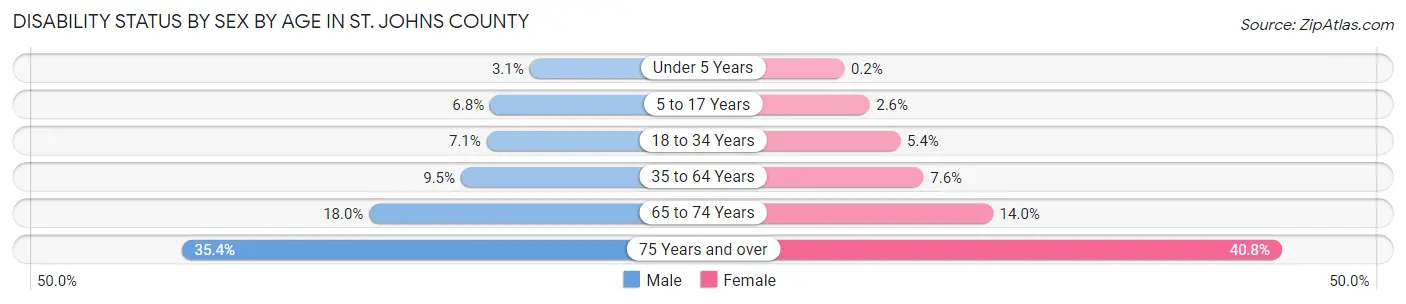
| Age Bracket | Male | Female |
| Under 5 Years | 209 (3.1%) | 13 (0.2%) |
| 5 to 17 Years | 1,624 (6.8%) | 587 (2.5%) |
| 18 to 34 Years | 1,594 (7.1%) | 1,229 (5.4%) |
| 35 to 64 Years | 5,371 (9.5%) | 4,426 (7.6%) |
| 65 to 74 Years | 2,965 (18.0%) | 2,525 (14.0%) |
| 75 Years and over | 3,510 (35.4%) | 5,108 (40.8%) |
Disability Class by Sex by Age in St. Johns County
Disability Class: Hearing Difficulty
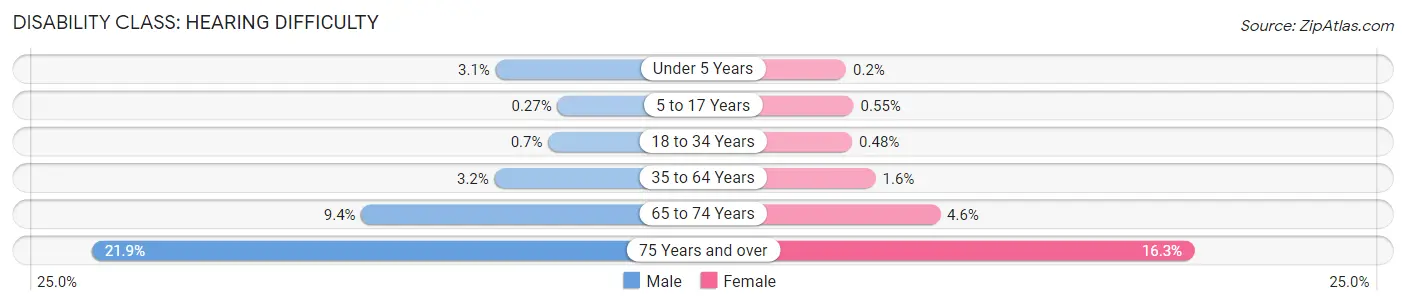
| Age Bracket | Male | Female |
| Under 5 Years | 209 (3.1%) | 13 (0.2%) |
| 5 to 17 Years | 64 (0.3%) | 126 (0.5%) |
| 18 to 34 Years | 157 (0.7%) | 109 (0.5%) |
| 35 to 64 Years | 1,801 (3.2%) | 918 (1.6%) |
| 65 to 74 Years | 1,541 (9.4%) | 823 (4.6%) |
| 75 Years and over | 2,168 (21.9%) | 2,044 (16.3%) |
Disability Class: Vision Difficulty
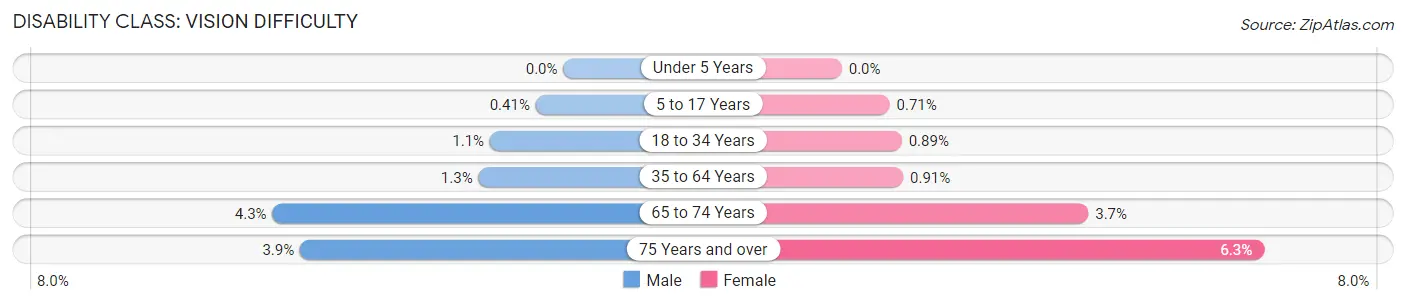
| Age Bracket | Male | Female |
| Under 5 Years | 0 (0.0%) | 0 (0.0%) |
| 5 to 17 Years | 98 (0.4%) | 164 (0.7%) |
| 18 to 34 Years | 244 (1.1%) | 202 (0.9%) |
| 35 to 64 Years | 709 (1.3%) | 532 (0.9%) |
| 65 to 74 Years | 711 (4.3%) | 660 (3.7%) |
| 75 Years and over | 387 (3.9%) | 785 (6.3%) |
Disability Class: Cognitive Difficulty
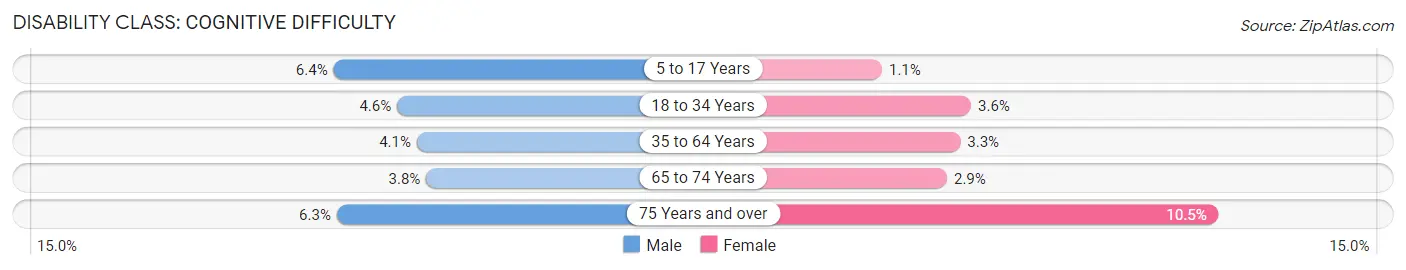
| Age Bracket | Male | Female |
| 5 to 17 Years | 1,526 (6.4%) | 257 (1.1%) |
| 18 to 34 Years | 1,035 (4.6%) | 817 (3.6%) |
| 35 to 64 Years | 2,304 (4.1%) | 1,926 (3.3%) |
| 65 to 74 Years | 628 (3.8%) | 529 (2.9%) |
| 75 Years and over | 625 (6.3%) | 1,313 (10.5%) |
Disability Class: Ambulatory Difficulty
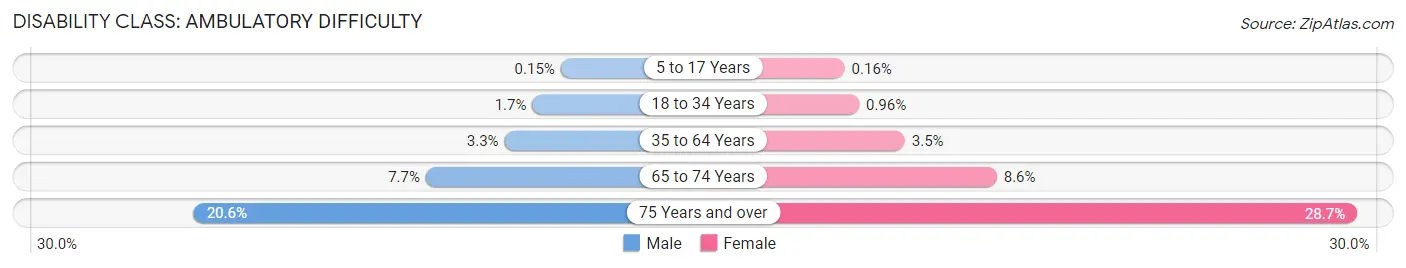
| Age Bracket | Male | Female |
| 5 to 17 Years | 36 (0.2%) | 37 (0.2%) |
| 18 to 34 Years | 386 (1.7%) | 219 (1.0%) |
| 35 to 64 Years | 1,855 (3.3%) | 2,052 (3.5%) |
| 65 to 74 Years | 1,261 (7.7%) | 1,557 (8.6%) |
| 75 Years and over | 2,039 (20.6%) | 3,590 (28.7%) |
Disability Class: Self-Care Difficulty
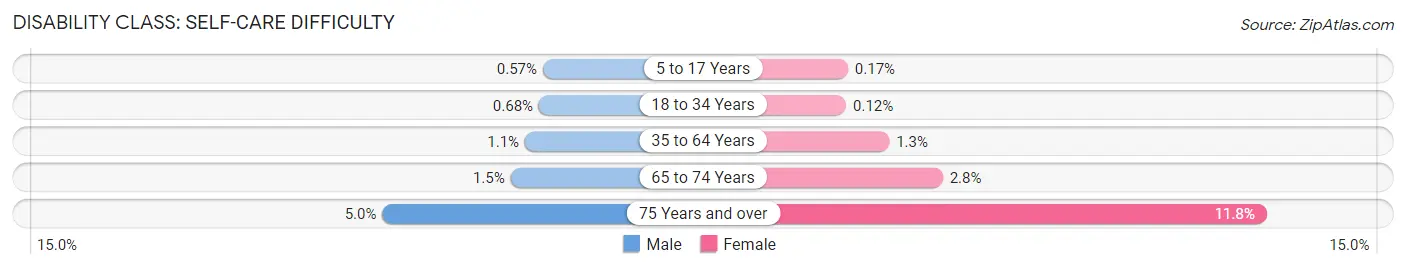
| Age Bracket | Male | Female |
| 5 to 17 Years | 136 (0.6%) | 38 (0.2%) |
| 18 to 34 Years | 153 (0.7%) | 27 (0.1%) |
| 35 to 64 Years | 605 (1.1%) | 770 (1.3%) |
| 65 to 74 Years | 242 (1.5%) | 506 (2.8%) |
| 75 Years and over | 499 (5.0%) | 1,480 (11.8%) |
Technology Access in St. Johns County
Computing Device Access in St. Johns County
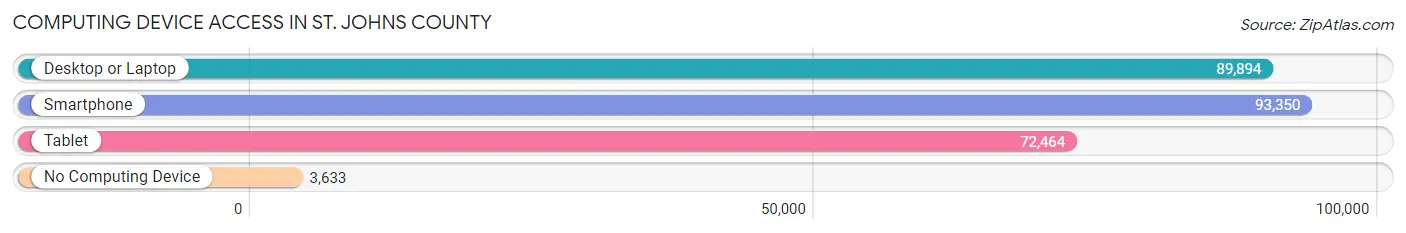
| Device Type | # Households | % Households |
| Desktop or Laptop | 89,894 | 88.1% |
| Smartphone | 93,350 | 91.5% |
| Tablet | 72,464 | 71.0% |
| No Computing Device | 3,633 | 3.6% |
| Total | 102,056 | 100.0% |
Internet Access in St. Johns County
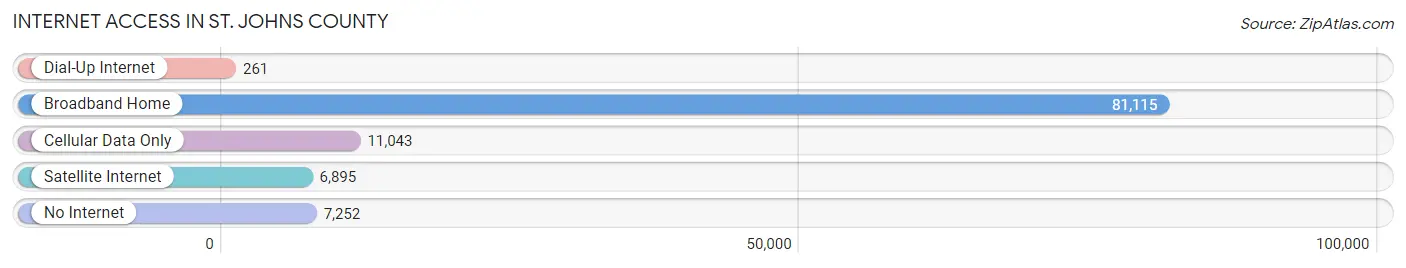
| Internet Type | # Households | % Households |
| Dial-Up Internet | 261 | 0.3% |
| Broadband Home | 81,115 | 79.5% |
| Cellular Data Only | 11,043 | 10.8% |
| Satellite Internet | 6,895 | 6.8% |
| No Internet | 7,252 | 7.1% |
| Total | 102,056 | 100.0% |
St. Johns County Summary
St. Johns County is a county located in the northeastern part of the U.S. state of Florida. As of the 2010 census, the population was 190,039. The county seat and largest incorporated city is St. Augustine. St. Johns County is part of the Jacksonville metropolitan area.
History
St. Johns County was established in 1821. It was named after St. John the Baptist, the patron saint of the Spanish territory of Florida. The county was created from parts of Duval County and Alachua County. The county was originally divided into six districts, each of which was governed by a justice of the peace.
The county was originally inhabited by the Timucua Indians, who were later displaced by the Spanish. The Spanish established a mission in the area in 1565, which was the first permanent European settlement in the United States. The area was part of the Spanish colony of Florida until 1821, when it became part of the United States.
Geography
St. Johns County is located in the northeastern part of Florida. It is bordered by Duval County to the north, Clay County to the west, Putnam County to the south, and the Atlantic Ocean to the east. The county covers an area of 822 square miles, making it the third-largest county in Florida.
The county is mostly flat, with some rolling hills in the northern part. The St. Johns River runs through the county, and there are several lakes and wetlands in the area. The county is home to several state parks, including Anastasia State Park, Fort Matanzas National Monument, and the Guana Tolomato Matanzas National Estuarine Research Reserve.
Economy
St. Johns County has a diverse economy, with a mix of industries including tourism, manufacturing, agriculture, and services. The county is home to several large employers, including Flagler College, Flagler Hospital, and the St. Johns County School District.
Tourism is a major industry in the county, with visitors drawn to the area's beaches, historic sites, and other attractions. The county is home to several golf courses, and is a popular destination for fishing and boating.
Agriculture is also an important part of the county's economy. The county is home to several farms, and produces a variety of crops, including citrus, vegetables, and hay.
Demographics
As of the 2010 census, there were 190,039 people, 73,845 households, and 51,845 families living in the county. The population density was 229.3 people per square mile. The racial makeup of the county was 84.3% White, 8.3% African American, 0.4% Native American, 2.2% Asian, 0.1% Pacific Islander, 2.7% from other races, and 1.9% from two or more races. Hispanic or Latino of any race were 8.7% of the population.
The median income for a household in the county was $50,890, and the median income for a family was $60,890. The per capita income for the county was $25,945. About 8.3% of families and 11.2% of the population were below the poverty line, including 15.2% of those under age 18 and 6.2% of those age 65 or over.
Common Questions
What is Per Capita Income in St. Johns County?
Per Capita income in St. Johns County is $52,096.
What is the Median Family Income in St. Johns County?
Median Family Income in St. Johns County is $119,534.
What is the Median Household income in St. Johns County?
Median Household Income in St. Johns County is $100,020.
What is Income or Wage Gap in St. Johns County?
Income or Wage Gap in St. Johns County is 36.0%.
Women in St. Johns County earn 64.0 cents for every dollar earned by a man.
What is Family Income Deficit in St. Johns County?
Family Income Deficit in St. Johns County is $9,539.
Families that are below poverty line in St. Johns County earn $9,539 less on average than the poverty threshold level.
What is Inequality or Gini Index in St. Johns County?
Inequality or Gini Index in St. Johns County is 0.46.
What is the Total Population of St. Johns County?
Total Population of St. Johns County is 278,722.
What is the Total Male Population of St. Johns County?
Total Male Population of St. Johns County is 136,822.
What is the Total Female Population of St. Johns County?
Total Female Population of St. Johns County is 141,900.
What is the Ratio of Males per 100 Females in St. Johns County?
There are 96.42 Males per 100 Females in St. Johns County.
What is the Ratio of Females per 100 Males in St. Johns County?
There are 103.71 Females per 100 Males in St. Johns County.
What is the Median Population Age in St. Johns County?
Median Population Age in St. Johns County is 44.0 Years.
What is the Average Family Size in St. Johns County
Average Family Size in St. Johns County is 3.1 People.
What is the Average Household Size in St. Johns County
Average Household Size in St. Johns County is 2.7 People.
How Large is the Labor Force in St. Johns County?
There are 136,603 People in the Labor Forcein in St. Johns County.
What is the Percentage of People in the Labor Force in St. Johns County?
60.5% of People are in the Labor Force in St. Johns County.
What is the Unemployment Rate in St. Johns County?
Unemployment Rate in St. Johns County is 4.4%.