Hernando County, FL Map & Demographics
Hernando County Map
Hernando County Overview
$31,516
PER CAPITA INCOME
$69,993
AVG FAMILY INCOME
$59,202
AVG HOUSEHOLD INCOME
27.6%
WAGE / INCOME GAP [ % ]
72.4¢/ $1
WAGE / INCOME GAP [ $ ]
$10,811
FAMILY INCOME DEFICIT
0.43
INEQUALITY / GINI INDEX
196,621
TOTAL POPULATION
95,719
MALE POPULATION
100,902
FEMALE POPULATION
94.86
MALES / 100 FEMALES
105.41
FEMALES / 100 MALES
48.5
MEDIAN AGE
2.9
AVG FAMILY SIZE
2.5
AVG HOUSEHOLD SIZE
83,879
LABOR FORCE [ PEOPLE ]
50.9%
PERCENT IN LABOR FORCE
5.9%
UNEMPLOYMENT RATE
Hernando County Area Codes
Income in Hernando County
Income Overview in Hernando County
Per Capita Income in Hernando County is $31,516, while median incomes of families and households are $69,993 and $59,202 respectively.
| Characteristic | Number | Measure |
| Per Capita Income | 196,621 | $31,516 |
| Median Family Income | 53,502 | $69,993 |
| Mean Family Income | 53,502 | $85,244 |
| Median Household Income | 79,169 | $59,202 |
| Mean Household Income | 79,169 | $76,007 |
| Income Deficit | 53,502 | $10,811 |
| Wage / Income Gap (%) | 196,621 | 27.55% |
| Wage / Income Gap ($) | 196,621 | 72.45¢ per $1 |
| Gini / Inequality Index | 196,621 | 0.43 |
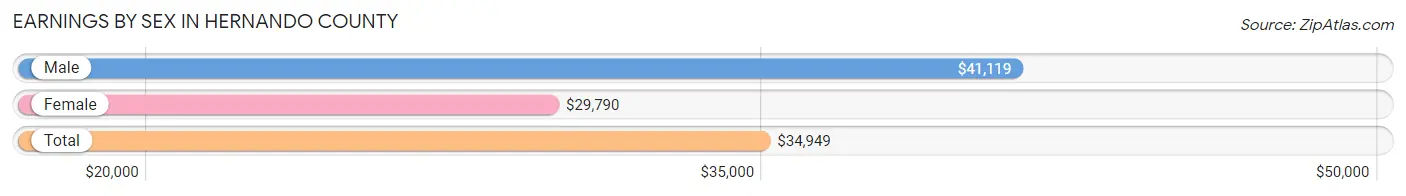
Earnings by Sex in Hernando County
Average Earnings in Hernando County are $34,949, $41,119 for men and $29,790 for women, a difference of 27.6%.
| Sex | Number | Average Earnings |
| Male | 44,891 (51.8%) | $41,119 |
| Female | 41,768 (48.2%) | $29,790 |
| Total | 86,659 (100.0%) | $34,949 |
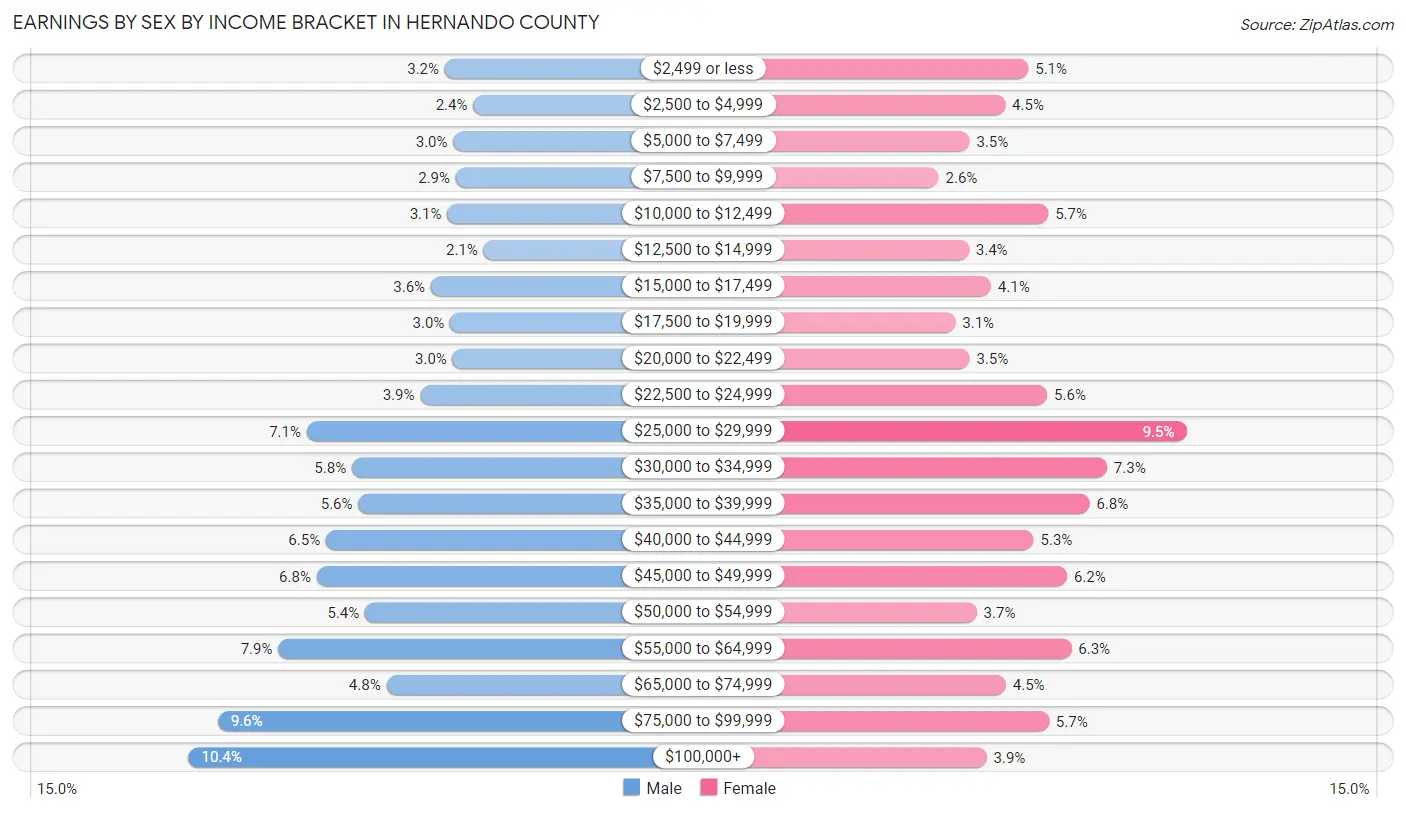
Earnings by Sex by Income Bracket in Hernando County
The most common earnings brackets in Hernando County are $100,000+ for men (4,663 | 10.4%) and $25,000 to $29,999 for women (3,986 | 9.5%).
| Income | Male | Female |
| $2,499 or less | 1,430 (3.2%) | 2,130 (5.1%) |
| $2,500 to $4,999 | 1,073 (2.4%) | 1,860 (4.4%) |
| $5,000 to $7,499 | 1,326 (2.9%) | 1,443 (3.5%) |
| $7,500 to $9,999 | 1,291 (2.9%) | 1,078 (2.6%) |
| $10,000 to $12,499 | 1,401 (3.1%) | 2,363 (5.7%) |
| $12,500 to $14,999 | 942 (2.1%) | 1,433 (3.4%) |
| $15,000 to $17,499 | 1,608 (3.6%) | 1,691 (4.1%) |
| $17,500 to $19,999 | 1,365 (3.0%) | 1,272 (3.0%) |
| $20,000 to $22,499 | 1,335 (3.0%) | 1,439 (3.5%) |
| $22,500 to $24,999 | 1,743 (3.9%) | 2,351 (5.6%) |
| $25,000 to $29,999 | 3,175 (7.1%) | 3,986 (9.5%) |
| $30,000 to $34,999 | 2,604 (5.8%) | 3,055 (7.3%) |
| $35,000 to $39,999 | 2,523 (5.6%) | 2,850 (6.8%) |
| $40,000 to $44,999 | 2,930 (6.5%) | 2,192 (5.2%) |
| $45,000 to $49,999 | 3,049 (6.8%) | 2,585 (6.2%) |
| $50,000 to $54,999 | 2,436 (5.4%) | 1,525 (3.6%) |
| $55,000 to $64,999 | 3,534 (7.9%) | 2,635 (6.3%) |
| $65,000 to $74,999 | 2,169 (4.8%) | 1,867 (4.5%) |
| $75,000 to $99,999 | 4,294 (9.6%) | 2,372 (5.7%) |
| $100,000+ | 4,663 (10.4%) | 1,641 (3.9%) |
| Total | 44,891 (100.0%) | 41,768 (100.0%) |
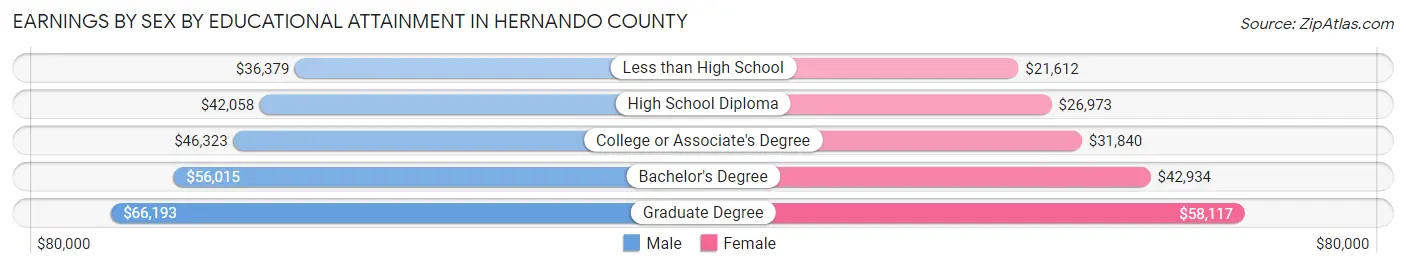
Earnings by Sex by Educational Attainment in Hernando County
Average earnings in Hernando County are $45,235 for men and $33,298 for women, a difference of 26.4%. Men with an educational attainment of graduate degree enjoy the highest average annual earnings of $66,193, while those with less than high school education earn the least with $36,379. Women with an educational attainment of graduate degree earn the most with the average annual earnings of $58,117, while those with less than high school education have the smallest earnings of $21,612.
| Educational Attainment | Male Income | Female Income |
| Less than High School | $36,379 | $21,612 |
| High School Diploma | $42,058 | $26,973 |
| College or Associate's Degree | $46,323 | $31,840 |
| Bachelor's Degree | $56,015 | $42,934 |
| Graduate Degree | $66,193 | $58,117 |
| Total | $45,235 | $33,298 |
Family Income in Hernando County
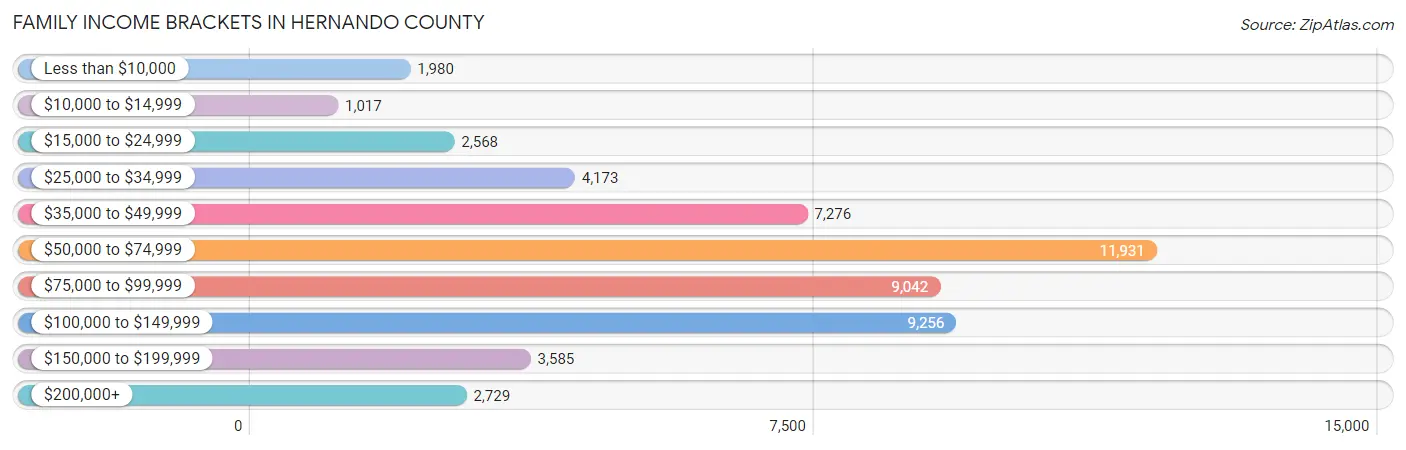
Family Income Brackets in Hernando County
According to the Hernando County family income data, there are 11,931 families falling into the $50,000 to $74,999 income range, which is the most common income bracket and makes up 22.3% of all families. Conversely, the $10,000 to $14,999 income bracket is the least frequent group with only 1,017 families (1.9%) belonging to this category.
| Income Bracket | # Families | % Families |
| Less than $10,000 | 1,980 | 3.7% |
| $10,000 to $14,999 | 1,017 | 1.9% |
| $15,000 to $24,999 | 2,568 | 4.8% |
| $25,000 to $34,999 | 4,173 | 7.8% |
| $35,000 to $49,999 | 7,276 | 13.6% |
| $50,000 to $74,999 | 11,931 | 22.3% |
| $75,000 to $99,999 | 9,042 | 16.9% |
| $100,000 to $149,999 | 9,256 | 17.3% |
| $150,000 to $199,999 | 3,585 | 6.7% |
| $200,000+ | 2,729 | 5.1% |
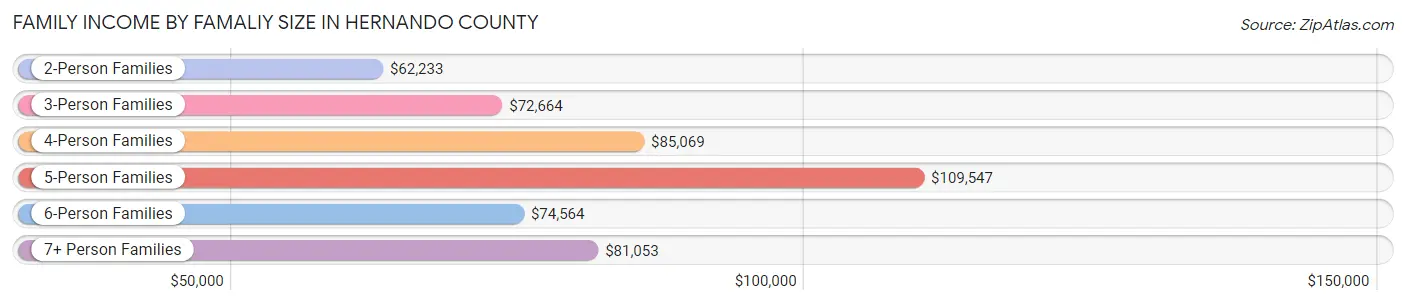
Family Income by Famaliy Size in Hernando County
5-person families (3,327 | 6.2%) account for the highest median family income in Hernando County with $109,547 per family, while 2-person families (29,124 | 54.4%) have the highest median income of $31,116 per family member.
| Income Bracket | # Families | Median Income |
| 2-Person Families | 29,124 (54.4%) | $62,233 |
| 3-Person Families | 11,602 (21.7%) | $72,664 |
| 4-Person Families | 7,719 (14.4%) | $85,069 |
| 5-Person Families | 3,327 (6.2%) | $109,547 |
| 6-Person Families | 1,244 (2.3%) | $74,564 |
| 7+ Person Families | 486 (0.9%) | $81,053 |
| Total | 53,502 (100.0%) | $69,993 |
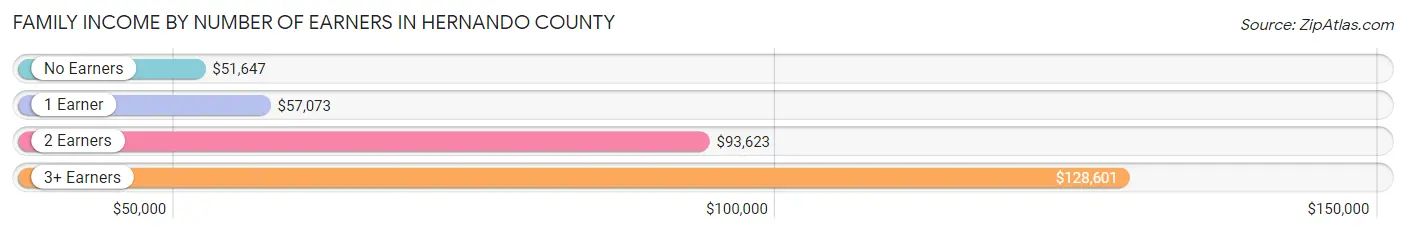
Family Income by Number of Earners in Hernando County
The median family income in Hernando County is $69,993, with families comprising 3+ earners (4,252) having the highest median family income of $128,601, while families with no earners (15,442) have the lowest median family income of $51,647, accounting for 8.0% and 28.9% of families, respectively.
| Number of Earners | # Families | Median Income |
| No Earners | 15,442 (28.9%) | $51,647 |
| 1 Earner | 17,383 (32.5%) | $57,073 |
| 2 Earners | 16,425 (30.7%) | $93,623 |
| 3+ Earners | 4,252 (8.0%) | $128,601 |
| Total | 53,502 (100.0%) | $69,993 |
Household Income in Hernando County
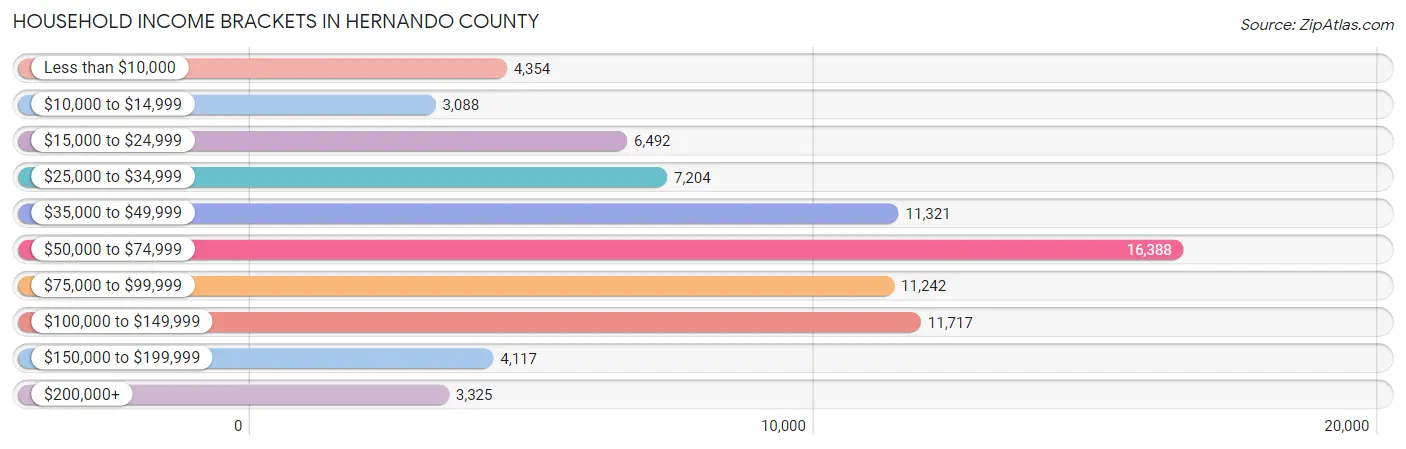
Household Income Brackets in Hernando County
With 16,388 households falling in the category, the $50,000 to $74,999 income range is the most frequent in Hernando County, accounting for 20.7% of all households. In contrast, only 3,088 households (3.9%) fall into the $10,000 to $14,999 income bracket, making it the least populous group.
| Income Bracket | # Households | % Households |
| Less than $10,000 | 4,354 | 5.5% |
| $10,000 to $14,999 | 3,088 | 3.9% |
| $15,000 to $24,999 | 6,492 | 8.2% |
| $25,000 to $34,999 | 7,204 | 9.1% |
| $35,000 to $49,999 | 11,321 | 14.3% |
| $50,000 to $74,999 | 16,388 | 20.7% |
| $75,000 to $99,999 | 11,242 | 14.2% |
| $100,000 to $149,999 | 11,717 | 14.8% |
| $150,000 to $199,999 | 4,117 | 5.2% |
| $200,000+ | 3,325 | 4.2% |
Household Income by Householder Age in Hernando County
The median household income in Hernando County is $59,202, with the highest median household income of $73,497 found in the 45 to 64 years age bracket for the primary householder. A total of 28,207 households (35.6%) fall into this category. Meanwhile, the 15 to 24 years age bracket for the primary householder has the lowest median household income of $47,978, with 1,382 households (1.8%) in this group.
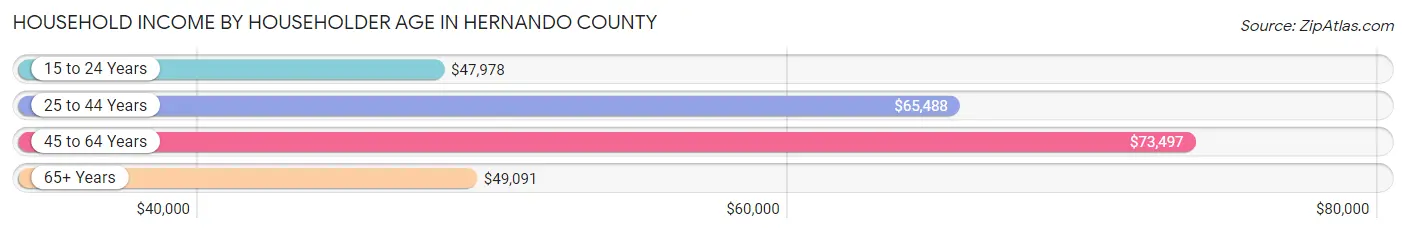
| Income Bracket | # Households | Median Income |
| 15 to 24 Years | 1,382 (1.8%) | $47,978 |
| 25 to 44 Years | 17,442 (22.0%) | $65,488 |
| 45 to 64 Years | 28,207 (35.6%) | $73,497 |
| 65+ Years | 32,138 (40.6%) | $49,091 |
| Total | 79,169 (100.0%) | $59,202 |
Poverty in Hernando County
Income Below Poverty by Sex and Age in Hernando County
With 11.5% poverty level for males and 13.4% for females among the residents of Hernando County, 15 year old males and 5 year old females are the most vulnerable to poverty, with 297 males (24.0%) and 232 females (28.6%) in their respective age groups living below the poverty level.
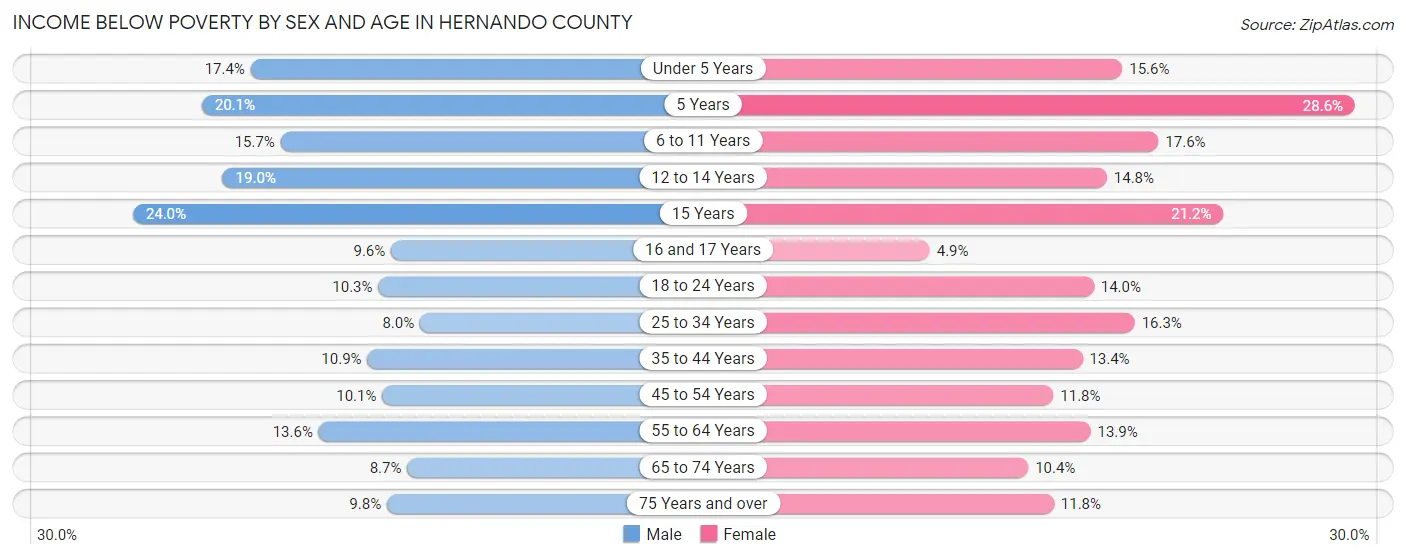
| Age Bracket | Male | Female |
| Under 5 Years | 745 (17.4%) | 634 (15.6%) |
| 5 Years | 157 (20.1%) | 232 (28.6%) |
| 6 to 11 Years | 851 (15.7%) | 981 (17.6%) |
| 12 to 14 Years | 762 (19.0%) | 473 (14.8%) |
| 15 Years | 297 (24.0%) | 267 (21.2%) |
| 16 and 17 Years | 214 (9.6%) | 98 (4.9%) |
| 18 to 24 Years | 691 (10.3%) | 911 (14.0%) |
| 25 to 34 Years | 833 (8.0%) | 1,683 (16.3%) |
| 35 to 44 Years | 1,119 (10.9%) | 1,407 (13.4%) |
| 45 to 54 Years | 1,156 (10.1%) | 1,410 (11.8%) |
| 55 to 64 Years | 1,834 (13.6%) | 2,075 (13.9%) |
| 65 to 74 Years | 1,157 (8.7%) | 1,572 (10.4%) |
| 75 Years and over | 1,072 (9.8%) | 1,503 (11.8%) |
| Total | 10,888 (11.5%) | 13,246 (13.4%) |
Income Above Poverty by Sex and Age in Hernando County
According to the poverty statistics in Hernando County, males aged 25 to 34 years and females aged 16 and 17 years are the age groups that are most secure financially, with 92.0% of males and 95.1% of females in these age groups living above the poverty line.
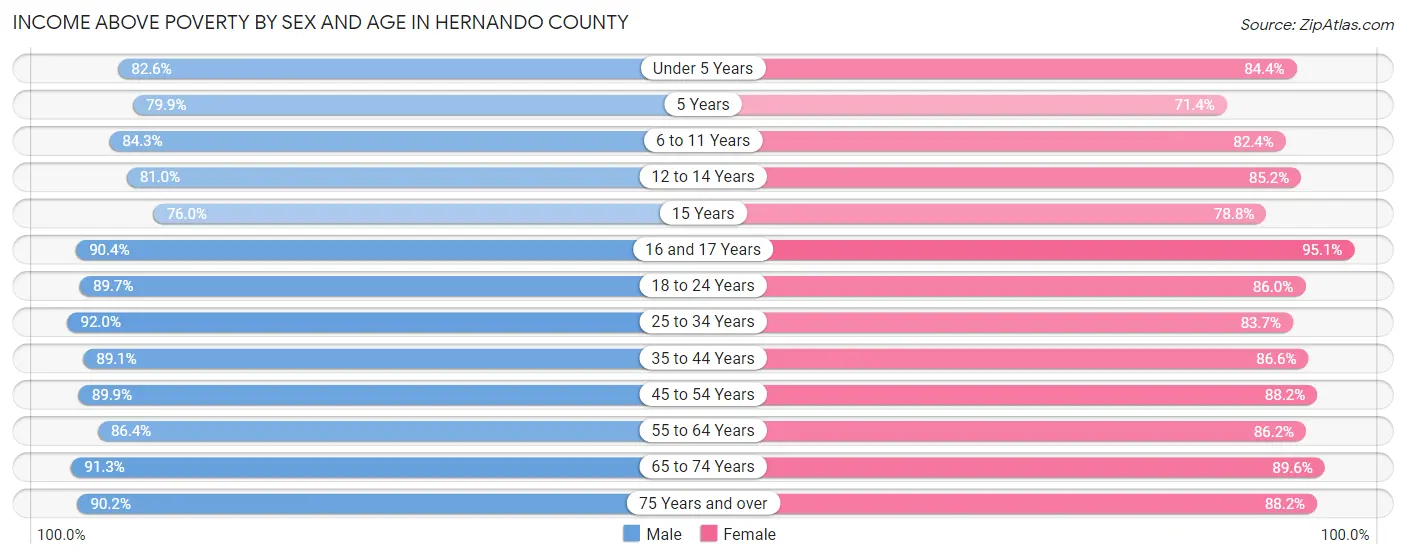
| Age Bracket | Male | Female |
| Under 5 Years | 3,534 (82.6%) | 3,426 (84.4%) |
| 5 Years | 623 (79.9%) | 580 (71.4%) |
| 6 to 11 Years | 4,556 (84.3%) | 4,584 (82.4%) |
| 12 to 14 Years | 3,254 (81.0%) | 2,731 (85.2%) |
| 15 Years | 942 (76.0%) | 990 (78.8%) |
| 16 and 17 Years | 2,017 (90.4%) | 1,903 (95.1%) |
| 18 to 24 Years | 6,017 (89.7%) | 5,581 (86.0%) |
| 25 to 34 Years | 9,609 (92.0%) | 8,635 (83.7%) |
| 35 to 44 Years | 9,133 (89.1%) | 9,092 (86.6%) |
| 45 to 54 Years | 10,313 (89.9%) | 10,564 (88.2%) |
| 55 to 64 Years | 11,628 (86.4%) | 12,903 (86.2%) |
| 65 to 74 Years | 12,160 (91.3%) | 13,574 (89.6%) |
| 75 Years and over | 9,845 (90.2%) | 11,223 (88.2%) |
| Total | 83,631 (88.5%) | 85,786 (86.6%) |
Income Below Poverty Among Married-Couple Families in Hernando County
The poverty statistics for married-couple families in Hernando County show that 5.9% or 2,369 of the total 39,838 families live below the poverty line. Families with 3 or 4 children have the highest poverty rate of 15.9%, comprising of 389 families. On the other hand, families with 5 or more children have the lowest poverty rate of 0.0%, which includes 0 families.
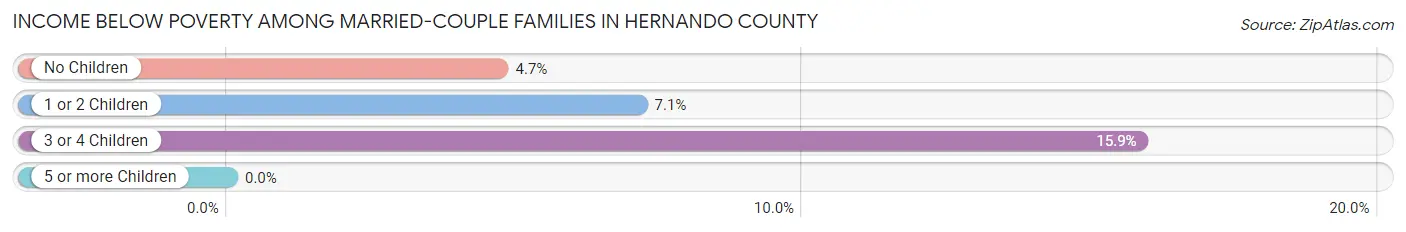
| Children | Above Poverty | Below Poverty |
| No Children | 26,659 (95.3%) | 1,318 (4.7%) |
| 1 or 2 Children | 8,620 (92.9%) | 662 (7.1%) |
| 3 or 4 Children | 2,066 (84.2%) | 389 (15.9%) |
| 5 or more Children | 124 (100.0%) | 0 (0.0%) |
| Total | 37,469 (94.1%) | 2,369 (5.9%) |
Income Below Poverty Among Single-Parent Households in Hernando County
According to the poverty data in Hernando County, 16.7% or 663 single-father households and 19.0% or 1,840 single-mother households are living below the poverty line. Among single-father households, those with 5 or more children have the highest poverty rate, with 12 households (100.0%) experiencing poverty. Likewise, among single-mother households, those with 3 or 4 children have the highest poverty rate, with 258 households (39.6%) falling below the poverty line.
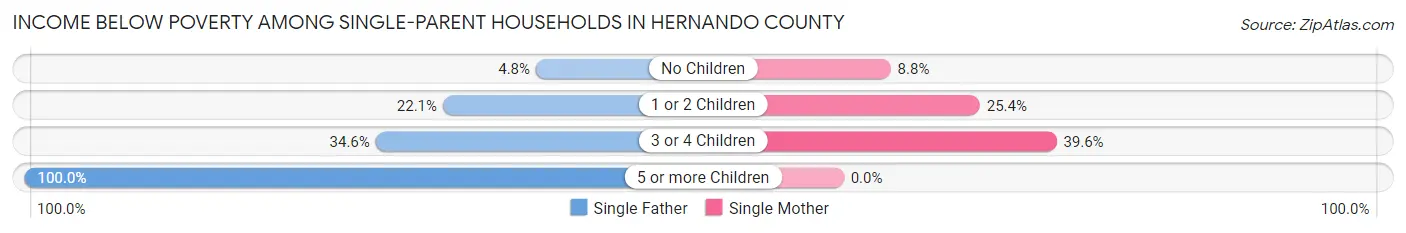
| Children | Single Father | Single Mother |
| No Children | 80 (4.8%) | 375 (8.7%) |
| 1 or 2 Children | 383 (22.1%) | 1,207 (25.4%) |
| 3 or 4 Children | 188 (34.6%) | 258 (39.6%) |
| 5 or more Children | 12 (100.0%) | 0 (0.0%) |
| Total | 663 (16.7%) | 1,840 (19.0%) |
Income Below Poverty Among Married-Couple vs Single-Parent Households in Hernando County
The poverty data for Hernando County shows that 2,369 of the married-couple family households (5.9%) and 2,503 of the single-parent households (18.3%) are living below the poverty level. Within the married-couple family households, those with 3 or 4 children have the highest poverty rate, with 389 households (15.9%) falling below the poverty line. Among the single-parent households, those with 5 or more children have the highest poverty rate, with 12 household (100.0%) living below poverty.
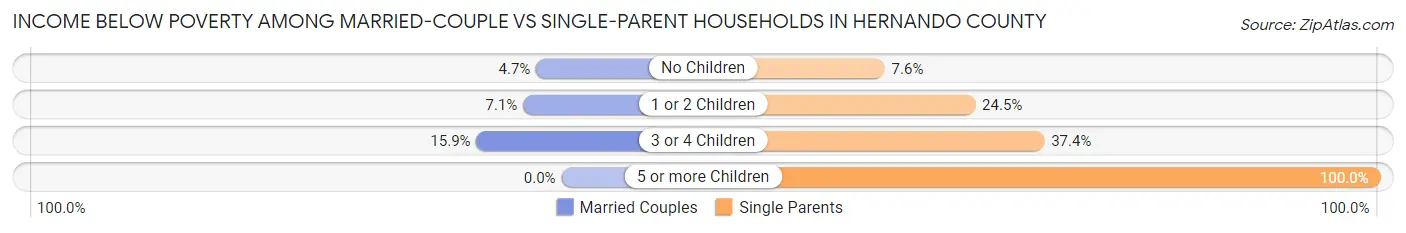
| Children | Married-Couple Families | Single-Parent Households |
| No Children | 1,318 (4.7%) | 455 (7.6%) |
| 1 or 2 Children | 662 (7.1%) | 1,590 (24.5%) |
| 3 or 4 Children | 389 (15.9%) | 446 (37.3%) |
| 5 or more Children | 0 (0.0%) | 12 (100.0%) |
| Total | 2,369 (5.9%) | 2,503 (18.3%) |
Race in Hernando County
The most populous races in Hernando County are White / Caucasian (158,612 | 80.7%), Hispanic or Latino (30,693 | 15.6%), and Two or more Races (16,634 | 8.5%).
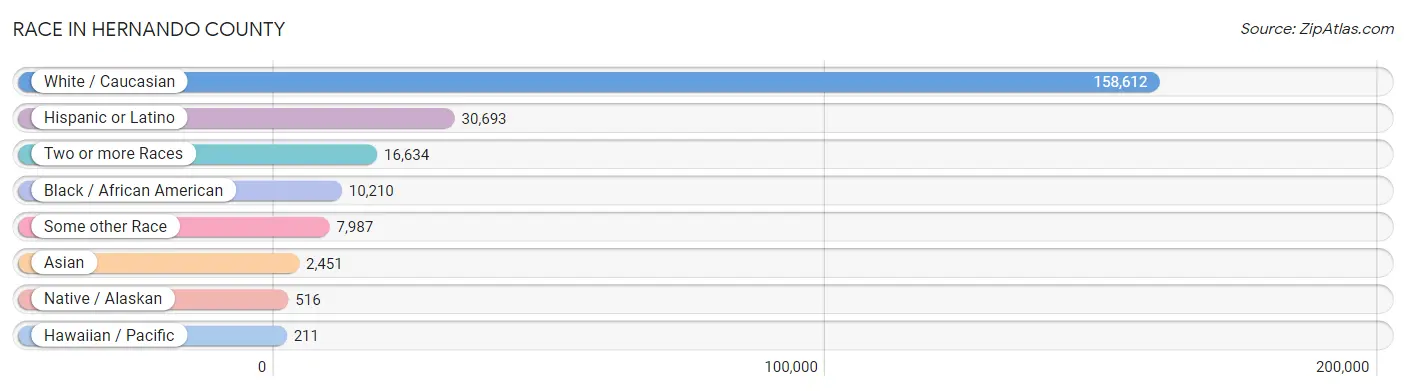
| Race | # Population | % Population |
| Asian | 2,451 | 1.3% |
| Black / African American | 10,210 | 5.2% |
| Hawaiian / Pacific | 211 | 0.1% |
| Hispanic or Latino | 30,693 | 15.6% |
| Native / Alaskan | 516 | 0.3% |
| White / Caucasian | 158,612 | 80.7% |
| Two or more Races | 16,634 | 8.5% |
| Some other Race | 7,987 | 4.1% |
| Total | 196,621 | 100.0% |
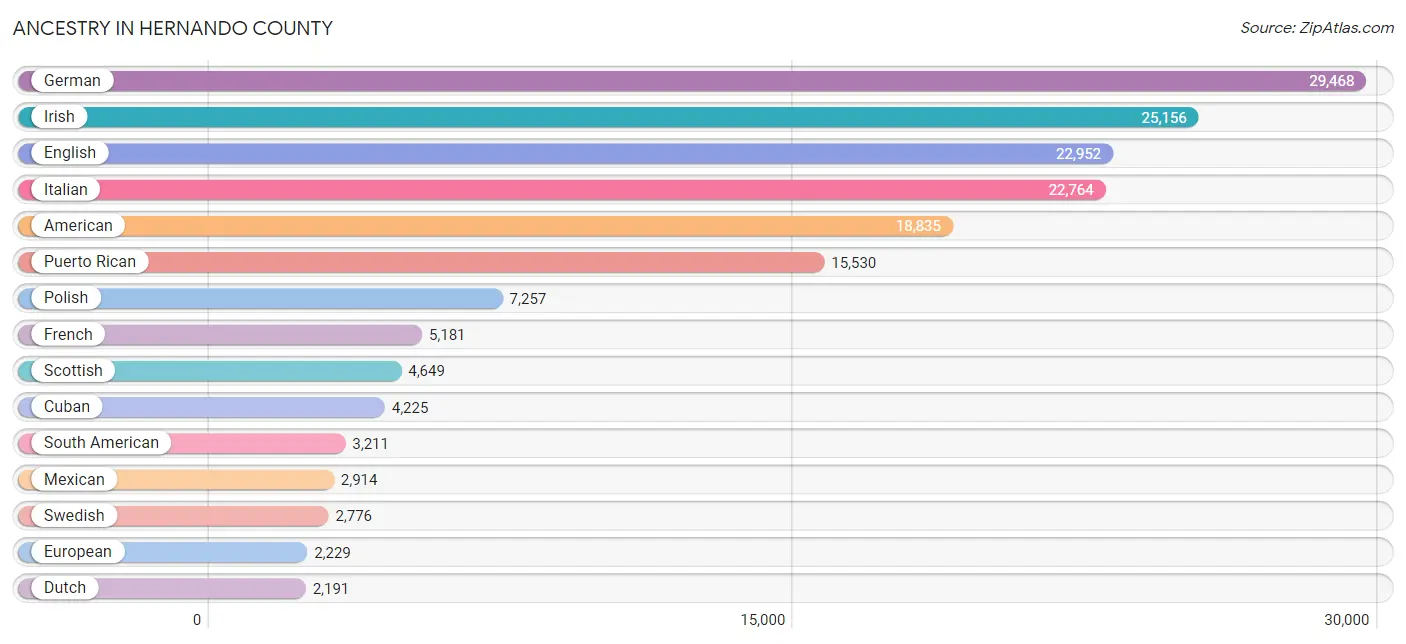
Ancestry in Hernando County
The most populous ancestries reported in Hernando County are German (29,468 | 15.0%), Irish (25,156 | 12.8%), English (22,952 | 11.7%), Italian (22,764 | 11.6%), and American (18,835 | 9.6%), together accounting for 60.6% of all Hernando County residents.
| Ancestry | # Population | % Population |
| African | 302 | 0.2% |
| Alaskan Athabascan | 27 | 0.0% |
| Albanian | 462 | 0.2% |
| Aleut | 10 | 0.0% |
| American | 18,835 | 9.6% |
| Apache | 37 | 0.0% |
| Arab | 346 | 0.2% |
| Argentinean | 80 | 0.0% |
| Assyrian / Chaldean / Syriac | 8 | 0.0% |
| Australian | 46 | 0.0% |
| Austrian | 436 | 0.2% |
| Bahamian | 350 | 0.2% |
| Barbadian | 341 | 0.2% |
| Belgian | 206 | 0.1% |
| Belizean | 17 | 0.0% |
| Bermudan | 45 | 0.0% |
| Bhutanese | 355 | 0.2% |
| Blackfeet | 174 | 0.1% |
| Bolivian | 297 | 0.2% |
| Brazilian | 363 | 0.2% |
| British | 783 | 0.4% |
| British West Indian | 95 | 0.1% |
| Burmese | 121 | 0.1% |
| Canadian | 386 | 0.2% |
| Cape Verdean | 62 | 0.0% |
| Celtic | 34 | 0.0% |
| Central American | 1,706 | 0.9% |
| Central American Indian | 82 | 0.0% |
| Cherokee | 603 | 0.3% |
| Chickasaw | 8 | 0.0% |
| Chilean | 231 | 0.1% |
| Chippewa | 4 | 0.0% |
| Choctaw | 42 | 0.0% |
| Colombian | 1,019 | 0.5% |
| Costa Rican | 161 | 0.1% |
| Creek | 16 | 0.0% |
| Croatian | 207 | 0.1% |
| Cuban | 4,225 | 2.1% |
| Czech | 651 | 0.3% |
| Czechoslovakian | 179 | 0.1% |
| Danish | 506 | 0.3% |
| Delaware | 14 | 0.0% |
| Dominican | 1,622 | 0.8% |
| Dutch | 2,191 | 1.1% |
| Dutch West Indian | 10 | 0.0% |
| Eastern European | 278 | 0.1% |
| Ecuadorian | 537 | 0.3% |
| Egyptian | 16 | 0.0% |
| English | 22,952 | 11.7% |
| Ethiopian | 60 | 0.0% |
| European | 2,229 | 1.1% |
| Finnish | 333 | 0.2% |
| French | 5,181 | 2.6% |
| French American Indian | 17 | 0.0% |
| French Canadian | 1,430 | 0.7% |
| German | 29,468 | 15.0% |
| Greek | 1,538 | 0.8% |
| Guamanian / Chamorro | 137 | 0.1% |
| Guatemalan | 178 | 0.1% |
| Guyanese | 174 | 0.1% |
| Haitian | 410 | 0.2% |
| Honduran | 452 | 0.2% |
| Hungarian | 1,192 | 0.6% |
| Indian (Asian) | 394 | 0.2% |
| Iranian | 11 | 0.0% |
| Irish | 25,156 | 12.8% |
| Iroquois | 136 | 0.1% |
| Israeli | 93 | 0.1% |
| Italian | 22,764 | 11.6% |
| Jamaican | 1,110 | 0.6% |
| Korean | 1,355 | 0.7% |
| Latvian | 17 | 0.0% |
| Lebanese | 192 | 0.1% |
| Lithuanian | 634 | 0.3% |
| Malaysian | 170 | 0.1% |
| Maltese | 14 | 0.0% |
| Mexican | 2,914 | 1.5% |
| Mexican American Indian | 43 | 0.0% |
| Native Hawaiian | 264 | 0.1% |
| Nicaraguan | 205 | 0.1% |
| Nigerian | 23 | 0.0% |
| Northern European | 139 | 0.1% |
| Norwegian | 1,406 | 0.7% |
| Ottawa | 62 | 0.0% |
| Pakistani | 220 | 0.1% |
| Panamanian | 230 | 0.1% |
| Pennsylvania German | 140 | 0.1% |
| Peruvian | 512 | 0.3% |
| Polish | 7,257 | 3.7% |
| Portuguese | 1,273 | 0.6% |
| Potawatomi | 4 | 0.0% |
| Pueblo | 76 | 0.0% |
| Puerto Rican | 15,530 | 7.9% |
| Romanian | 185 | 0.1% |
| Russian | 1,532 | 0.8% |
| Salvadoran | 480 | 0.2% |
| Scandinavian | 521 | 0.3% |
| Scotch-Irish | 1,476 | 0.7% |
| Scottish | 4,649 | 2.4% |
| Senegalese | 9 | 0.0% |
| Serbian | 78 | 0.0% |
| Sioux | 25 | 0.0% |
| Slavic | 137 | 0.1% |
| Slovak | 256 | 0.1% |
| Slovene | 83 | 0.0% |
| South African | 6 | 0.0% |
| South American | 3,211 | 1.6% |
| South American Indian | 12 | 0.0% |
| Spaniard | 648 | 0.3% |
| Spanish | 280 | 0.1% |
| Sri Lankan | 337 | 0.2% |
| Subsaharan African | 472 | 0.2% |
| Swedish | 2,776 | 1.4% |
| Swiss | 177 | 0.1% |
| Syrian | 31 | 0.0% |
| Thai | 713 | 0.4% |
| Tongan | 17 | 0.0% |
| Trinidadian and Tobagonian | 301 | 0.2% |
| Turkish | 42 | 0.0% |
| U.S. Virgin Islander | 9 | 0.0% |
| Ugandan | 10 | 0.0% |
| Ukrainian | 665 | 0.3% |
| Uruguayan | 87 | 0.0% |
| Venezuelan | 448 | 0.2% |
| Welsh | 1,383 | 0.7% |
| West Indian | 302 | 0.2% |
| Yugoslavian | 102 | 0.1% | View All 127 Rows |
Immigrants in Hernando County
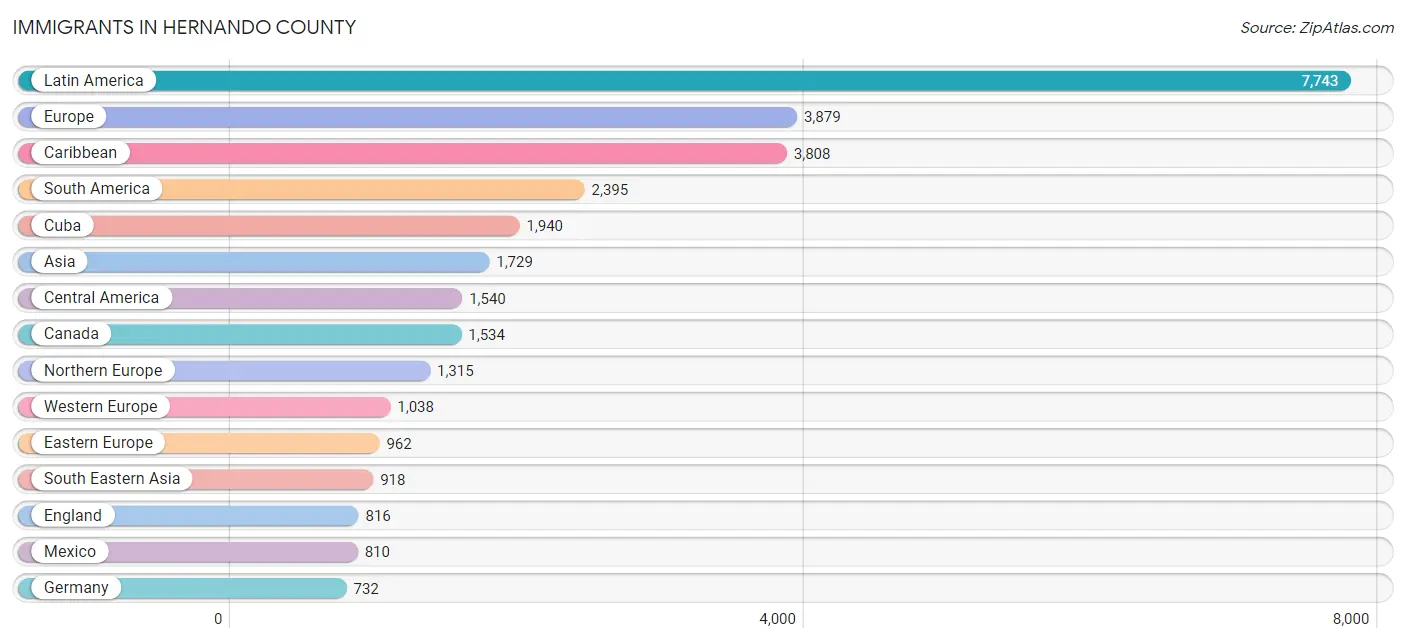
The most numerous immigrant groups reported in Hernando County came from Latin America (7,743 | 3.9%), Europe (3,879 | 2.0%), Caribbean (3,808 | 1.9%), South America (2,395 | 1.2%), and Cuba (1,940 | 1.0%), together accounting for 10.1% of all Hernando County residents.
| Immigration Origin | # Population | % Population |
| Africa | 175 | 0.1% |
| Albania | 190 | 0.1% |
| Argentina | 42 | 0.0% |
| Asia | 1,729 | 0.9% |
| Australia | 8 | 0.0% |
| Austria | 29 | 0.0% |
| Azores | 26 | 0.0% |
| Bahamas | 81 | 0.0% |
| Barbados | 110 | 0.1% |
| Belarus | 14 | 0.0% |
| Belgium | 44 | 0.0% |
| Belize | 26 | 0.0% |
| Bolivia | 136 | 0.1% |
| Brazil | 168 | 0.1% |
| Canada | 1,534 | 0.8% |
| Caribbean | 3,808 | 1.9% |
| Central America | 1,540 | 0.8% |
| Chile | 231 | 0.1% |
| China | 211 | 0.1% |
| Colombia | 711 | 0.4% |
| Costa Rica | 92 | 0.1% |
| Croatia | 6 | 0.0% |
| Cuba | 1,940 | 1.0% |
| Czechoslovakia | 13 | 0.0% |
| Dominican Republic | 534 | 0.3% |
| Eastern Africa | 38 | 0.0% |
| Eastern Asia | 307 | 0.2% |
| Eastern Europe | 962 | 0.5% |
| Ecuador | 189 | 0.1% |
| Egypt | 7 | 0.0% |
| El Salvador | 92 | 0.1% |
| England | 816 | 0.4% |
| Ethiopia | 38 | 0.0% |
| Europe | 3,879 | 2.0% |
| France | 226 | 0.1% |
| Germany | 732 | 0.4% |
| Greece | 59 | 0.0% |
| Grenada | 28 | 0.0% |
| Guatemala | 170 | 0.1% |
| Guyana | 320 | 0.2% |
| Haiti | 138 | 0.1% |
| Honduras | 105 | 0.1% |
| Hungary | 68 | 0.0% |
| India | 273 | 0.1% |
| Indonesia | 25 | 0.0% |
| Iran | 11 | 0.0% |
| Ireland | 86 | 0.0% |
| Israel | 31 | 0.0% |
| Italy | 272 | 0.1% |
| Jamaica | 645 | 0.3% |
| Japan | 13 | 0.0% |
| Kazakhstan | 57 | 0.0% |
| Korea | 83 | 0.0% |
| Laos | 24 | 0.0% |
| Latin America | 7,743 | 3.9% |
| Latvia | 19 | 0.0% |
| Lebanon | 16 | 0.0% |
| Mexico | 810 | 0.4% |
| Middle Africa | 40 | 0.0% |
| Morocco | 33 | 0.0% |
| Nicaragua | 171 | 0.1% |
| Nigeria | 17 | 0.0% |
| Northern Africa | 66 | 0.0% |
| Northern Europe | 1,315 | 0.7% |
| Norway | 7 | 0.0% |
| Oceania | 17 | 0.0% |
| Pakistan | 6 | 0.0% |
| Panama | 74 | 0.0% |
| Peru | 256 | 0.1% |
| Philippines | 570 | 0.3% |
| Poland | 268 | 0.1% |
| Portugal | 198 | 0.1% |
| Romania | 22 | 0.0% |
| Russia | 60 | 0.0% |
| Scotland | 104 | 0.1% |
| South Africa | 14 | 0.0% |
| South America | 2,395 | 1.2% |
| South Central Asia | 403 | 0.2% |
| South Eastern Asia | 918 | 0.5% |
| Southern Europe | 564 | 0.3% |
| Spain | 21 | 0.0% |
| Sri Lanka | 56 | 0.0% |
| St. Vincent and the Grenadines | 33 | 0.0% |
| Sweden | 5 | 0.0% |
| Switzerland | 7 | 0.0% |
| Syria | 38 | 0.0% |
| Taiwan | 7 | 0.0% |
| Thailand | 127 | 0.1% |
| Trinidad and Tobago | 209 | 0.1% |
| Turkey | 16 | 0.0% |
| Ukraine | 92 | 0.1% |
| Uruguay | 49 | 0.0% |
| Venezuela | 293 | 0.2% |
| Vietnam | 172 | 0.1% |
| Western Africa | 17 | 0.0% |
| Western Asia | 101 | 0.1% |
| Western Europe | 1,038 | 0.5% | View All 97 Rows |
Sex and Age in Hernando County
Sex and Age in Hernando County
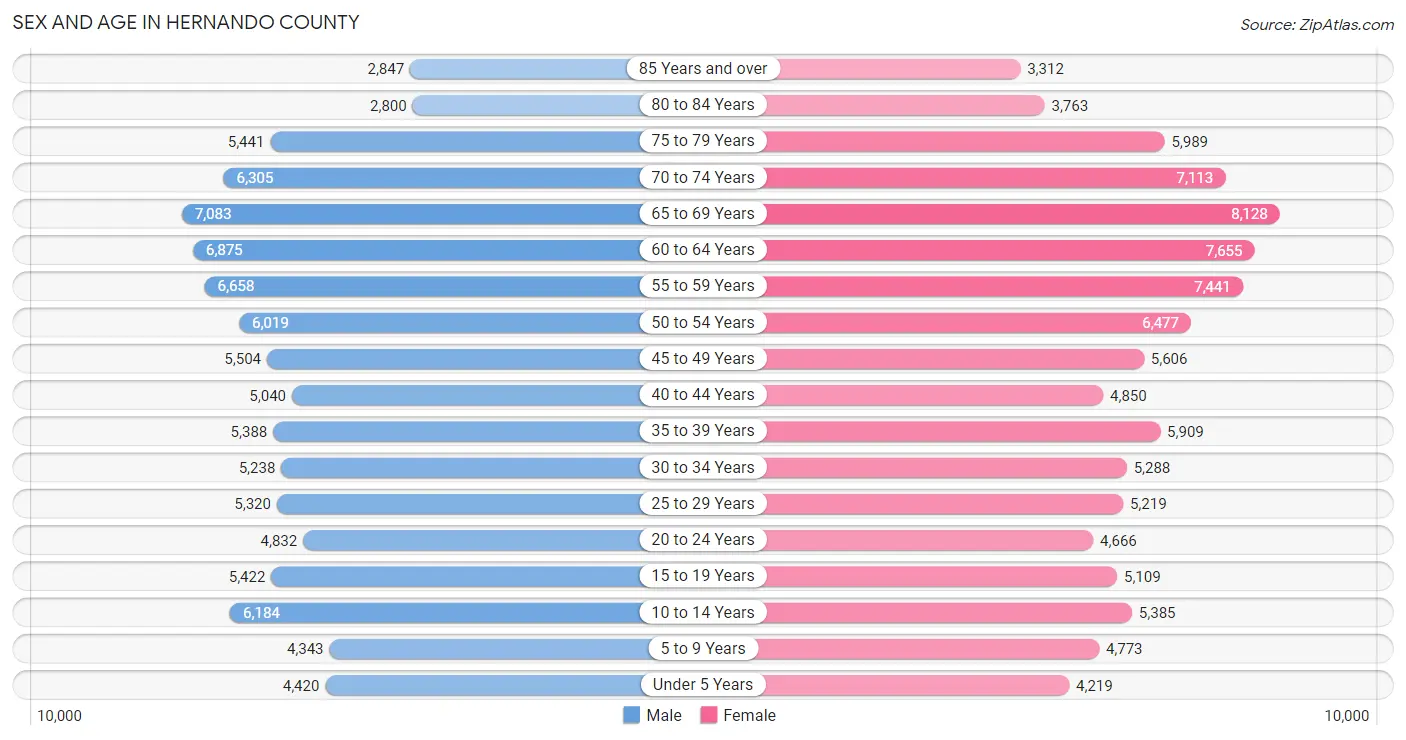
The most populous age groups in Hernando County are 65 to 69 Years (7,083 | 7.4%) for men and 65 to 69 Years (8,128 | 8.1%) for women.
| Age Bracket | Male | Female |
| Under 5 Years | 4,420 (4.6%) | 4,219 (4.2%) |
| 5 to 9 Years | 4,343 (4.5%) | 4,773 (4.7%) |
| 10 to 14 Years | 6,184 (6.5%) | 5,385 (5.3%) |
| 15 to 19 Years | 5,422 (5.7%) | 5,109 (5.1%) |
| 20 to 24 Years | 4,832 (5.1%) | 4,666 (4.6%) |
| 25 to 29 Years | 5,320 (5.6%) | 5,219 (5.2%) |
| 30 to 34 Years | 5,238 (5.5%) | 5,288 (5.2%) |
| 35 to 39 Years | 5,388 (5.6%) | 5,909 (5.9%) |
| 40 to 44 Years | 5,040 (5.3%) | 4,850 (4.8%) |
| 45 to 49 Years | 5,504 (5.8%) | 5,606 (5.6%) |
| 50 to 54 Years | 6,019 (6.3%) | 6,477 (6.4%) |
| 55 to 59 Years | 6,658 (7.0%) | 7,441 (7.4%) |
| 60 to 64 Years | 6,875 (7.2%) | 7,655 (7.6%) |
| 65 to 69 Years | 7,083 (7.4%) | 8,128 (8.1%) |
| 70 to 74 Years | 6,305 (6.6%) | 7,113 (7.0%) |
| 75 to 79 Years | 5,441 (5.7%) | 5,989 (5.9%) |
| 80 to 84 Years | 2,800 (2.9%) | 3,763 (3.7%) |
| 85 Years and over | 2,847 (3.0%) | 3,312 (3.3%) |
| Total | 95,719 (100.0%) | 100,902 (100.0%) |
Families and Households in Hernando County
Median Family Size in Hernando County
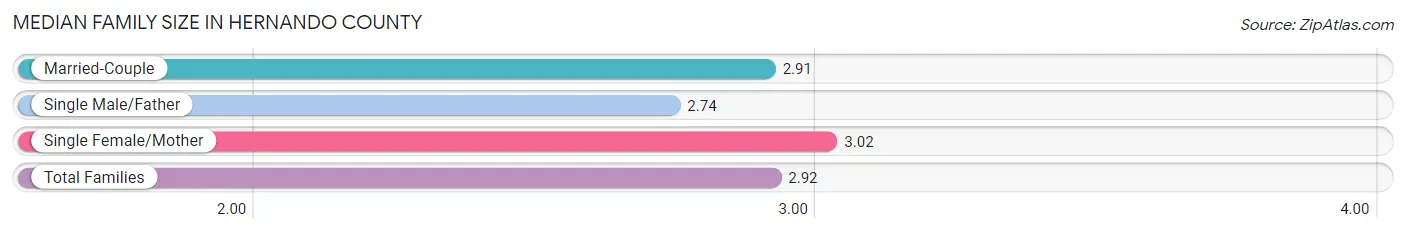
The median family size in Hernando County is 2.92 persons per family, with single female/mother families (9,698 | 18.1%) accounting for the largest median family size of 3.02 persons per family. On the other hand, single male/father families (3,966 | 7.4%) represent the smallest median family size with 2.74 persons per family.
| Family Type | # Families | Family Size |
| Married-Couple | 39,838 (74.5%) | 2.91 |
| Single Male/Father | 3,966 (7.4%) | 2.74 |
| Single Female/Mother | 9,698 (18.1%) | 3.02 |
| Total Families | 53,502 (100.0%) | 2.92 |
Median Household Size in Hernando County
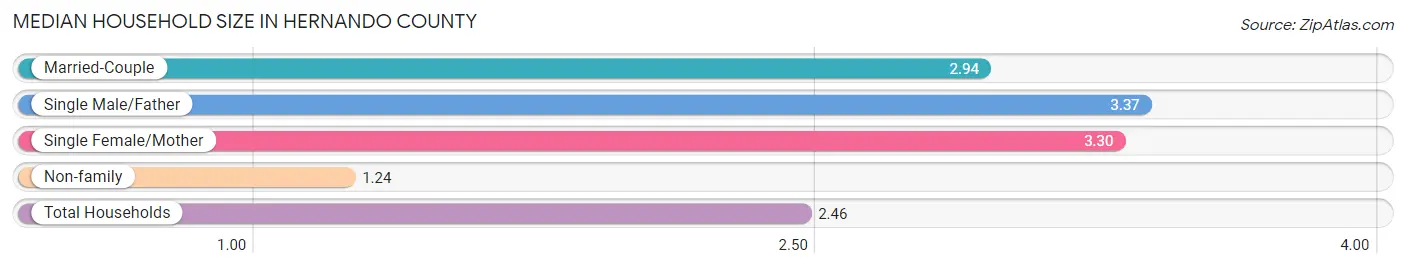
The median household size in Hernando County is 2.46 persons per household, with single male/father households (3,966 | 5.0%) accounting for the largest median household size of 3.37 persons per household. non-family households (25,667 | 32.4%) represent the smallest median household size with 1.24 persons per household.
| Household Type | # Households | Household Size |
| Married-Couple | 39,838 (50.3%) | 2.94 |
| Single Male/Father | 3,966 (5.0%) | 3.37 |
| Single Female/Mother | 9,698 (12.2%) | 3.30 |
| Non-family | 25,667 (32.4%) | 1.24 |
| Total Households | 79,169 (100.0%) | 2.46 |
Household Size by Marriage Status in Hernando County
Out of a total of 79,169 households in Hernando County, 53,502 (67.6%) are family households, while 25,667 (32.4%) are nonfamily households. The most numerous type of family households are 2-person households, comprising 27,341, and the most common type of nonfamily households are 1-person households, comprising 20,416.
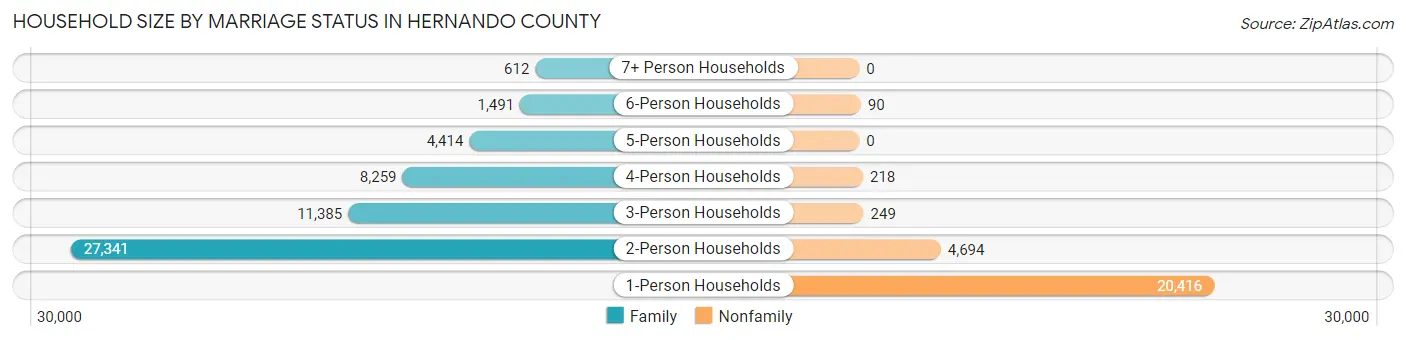
| Household Size | Family Households | Nonfamily Households |
| 1-Person Households | - | 20,416 (25.8%) |
| 2-Person Households | 27,341 (34.5%) | 4,694 (5.9%) |
| 3-Person Households | 11,385 (14.4%) | 249 (0.3%) |
| 4-Person Households | 8,259 (10.4%) | 218 (0.3%) |
| 5-Person Households | 4,414 (5.6%) | 0 (0.0%) |
| 6-Person Households | 1,491 (1.9%) | 90 (0.1%) |
| 7+ Person Households | 612 (0.8%) | 0 (0.0%) |
| Total | 53,502 (67.6%) | 25,667 (32.4%) |
Female Fertility in Hernando County
Fertility by Age in Hernando County
Average fertility rate in Hernando County is 45.0 births per 1,000 women. Women in the age bracket of 20 to 34 years have the highest fertility rate with 81.0 births per 1,000 women. Women in the age bracket of 20 to 34 years acount for 73.1% of all women with births.
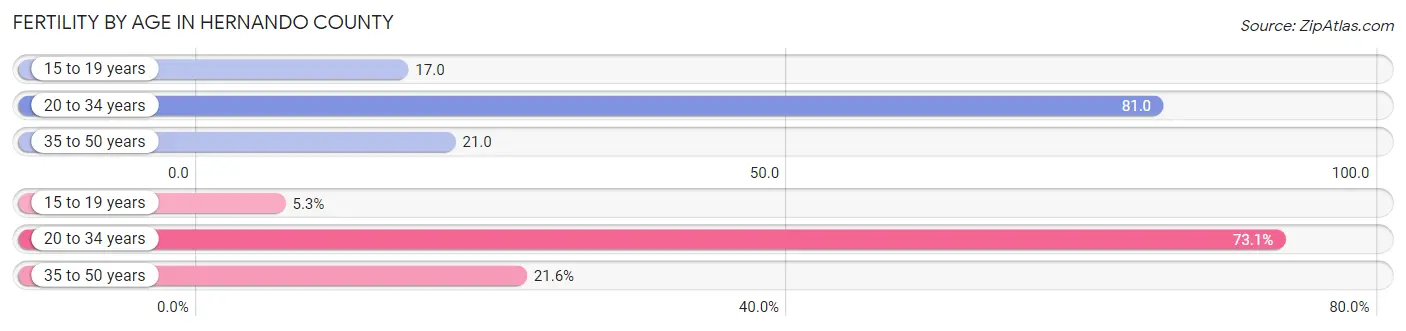
| Age Bracket | Women with Births | Births / 1,000 Women |
| 15 to 19 years | 89 (5.3%) | 17.0 |
| 20 to 34 years | 1,236 (73.1%) | 81.0 |
| 35 to 50 years | 366 (21.6%) | 21.0 |
| Total | 1,691 (100.0%) | 45.0 |
Fertility by Age by Marriage Status in Hernando County
60.1% of women with births (1,691) in Hernando County are married. The highest percentage of unmarried women with births falls into 20 to 34 years age bracket with 47.5% of them unmarried at the time of birth, while the lowest percentage of unmarried women with births belong to 35 to 50 years age bracket with 17.5% of them unmarried.
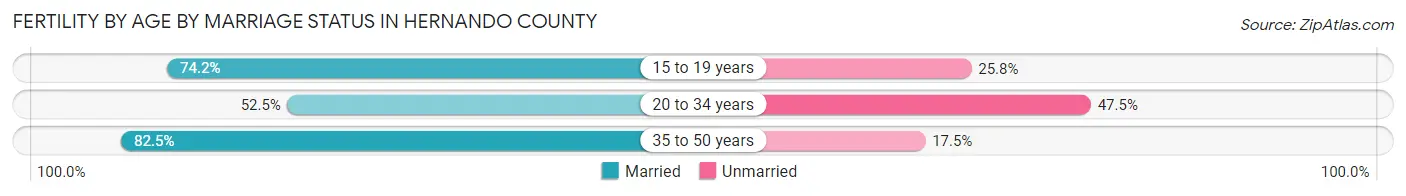
| Age Bracket | Married | Unmarried |
| 15 to 19 years | 66 (74.2%) | 23 (25.8%) |
| 20 to 34 years | 649 (52.5%) | 587 (47.5%) |
| 35 to 50 years | 302 (82.5%) | 64 (17.5%) |
| Total | 1,016 (60.1%) | 675 (39.9%) |
Fertility by Education in Hernando County
Average fertility rate in Hernando County is 45.0 births per 1,000 women. Women with the education attainment of bachelor's degree have the highest fertility rate of 82.0 births per 1,000 women, while women with the education attainment of less than high school have the lowest fertility at 28.0 births per 1,000 women. Women with the education attainment of high school diploma represent 27.3% of all women with births.
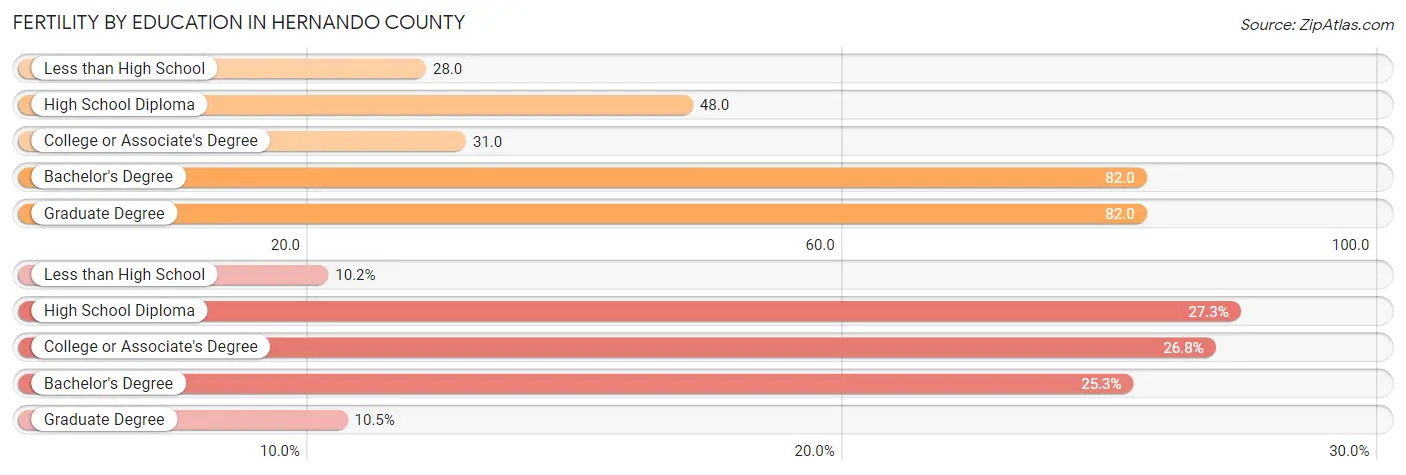
| Educational Attainment | Women with Births | Births / 1,000 Women |
| Less than High School | 172 (10.2%) | 28.0 |
| High School Diploma | 461 (27.3%) | 48.0 |
| College or Associate's Degree | 453 (26.8%) | 31.0 |
| Bachelor's Degree | 427 (25.3%) | 82.0 |
| Graduate Degree | 178 (10.5%) | 82.0 |
| Total | 1,691 (100.0%) | 45.0 |
Fertility by Education by Marriage Status in Hernando County
39.9% of women with births in Hernando County are unmarried. Women with the educational attainment of graduate degree are most likely to be married with 93.3% of them married at childbirth, while women with the educational attainment of college or associate's degree are least likely to be married with 57.6% of them unmarried at childbirth.
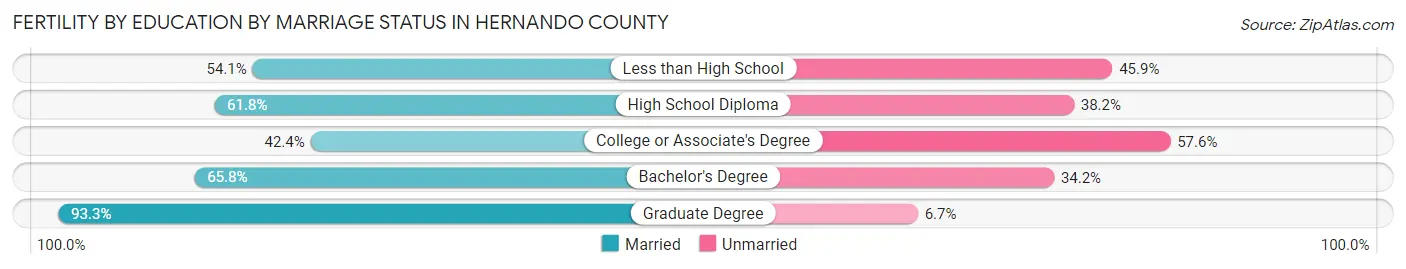
| Educational Attainment | Married | Unmarried |
| Less than High School | 93 (54.1%) | 79 (45.9%) |
| High School Diploma | 285 (61.8%) | 176 (38.2%) |
| College or Associate's Degree | 192 (42.4%) | 261 (57.6%) |
| Bachelor's Degree | 281 (65.8%) | 146 (34.2%) |
| Graduate Degree | 166 (93.3%) | 12 (6.7%) |
| Total | 1,016 (60.1%) | 675 (39.9%) |
Employment Characteristics in Hernando County
Employment by Class of Employer in Hernando County
Among the 77,385 employed individuals in Hernando County, private company employees (55,573 | 71.8%), local government employees (6,789 | 8.8%), and self-employed (not incorporated) (4,581 | 5.9%) make up the most common classes of employment.
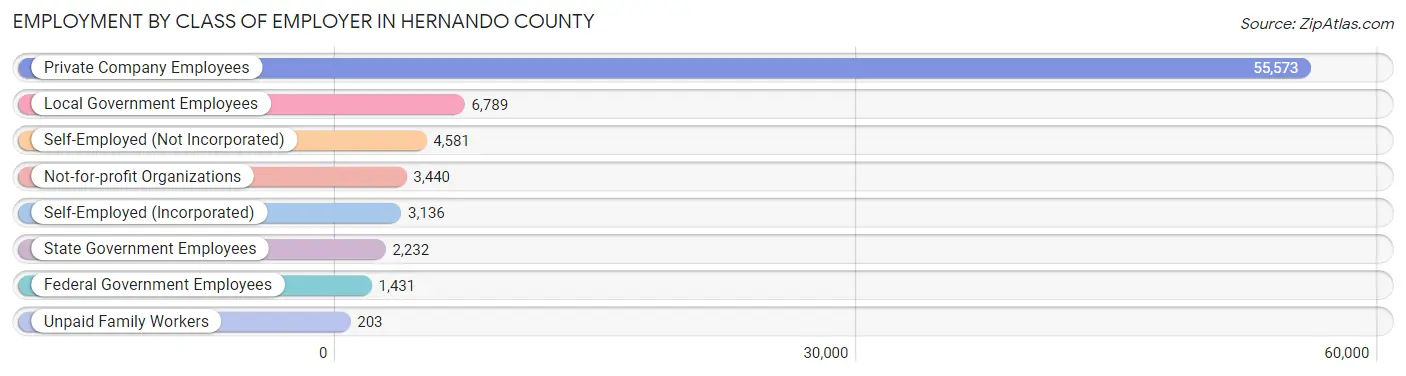
| Employer Class | # Employees | % Employees |
| Private Company Employees | 55,573 | 71.8% |
| Self-Employed (Incorporated) | 3,136 | 4.1% |
| Self-Employed (Not Incorporated) | 4,581 | 5.9% |
| Not-for-profit Organizations | 3,440 | 4.4% |
| Local Government Employees | 6,789 | 8.8% |
| State Government Employees | 2,232 | 2.9% |
| Federal Government Employees | 1,431 | 1.8% |
| Unpaid Family Workers | 203 | 0.3% |
| Total | 77,385 | 100.0% |
Employment Status by Age in Hernando County
According to the labor force statistics for Hernando County, out of the total population over 16 years of age (164,792), 50.9% or 83,879 individuals are in the labor force, with 5.9% or 4,949 of them unemployed. The age group with the highest labor force participation rate is 25 to 29 years, with 82.0% or 8,642 individuals in the labor force. Within the labor force, the 16 to 19 years age range has the highest percentage of unemployed individuals, with 15.7% or 587 of them being unemployed.
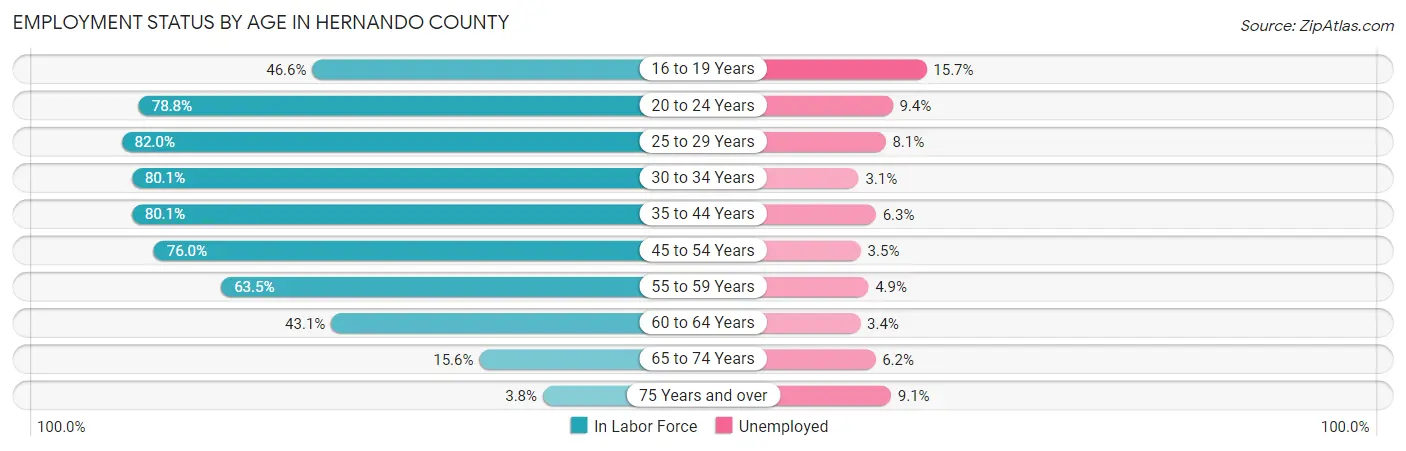
| Age Bracket | In Labor Force | Unemployed |
| 16 to 19 Years | 3,740 (46.6%) | 587 (15.7%) |
| 20 to 24 Years | 7,484 (78.8%) | 703 (9.4%) |
| 25 to 29 Years | 8,642 (82.0%) | 700 (8.1%) |
| 30 to 34 Years | 8,431 (80.1%) | 261 (3.1%) |
| 35 to 44 Years | 16,971 (80.1%) | 1,069 (6.3%) |
| 45 to 54 Years | 17,941 (76.0%) | 628 (3.5%) |
| 55 to 59 Years | 8,953 (63.5%) | 439 (4.9%) |
| 60 to 64 Years | 6,262 (43.1%) | 213 (3.4%) |
| 65 to 74 Years | 4,466 (15.6%) | 277 (6.2%) |
| 75 Years and over | 918 (3.8%) | 84 (9.1%) |
| Total | 83,879 (50.9%) | 4,949 (5.9%) |
Employment Status by Educational Attainment in Hernando County
According to labor force statistics for Hernando County, 71.1% of individuals (67,180) out of the total population between 25 and 64 years of age (94,487) are in the labor force, with 4.9% or 3,292 of them being unemployed. The group with the highest labor force participation rate are those with the educational attainment of bachelor's degree or higher, with 81.3% or 15,461 individuals in the labor force. Within the labor force, individuals with less than high school education have the highest percentage of unemployment, with 6.7% or 344 of them being unemployed.
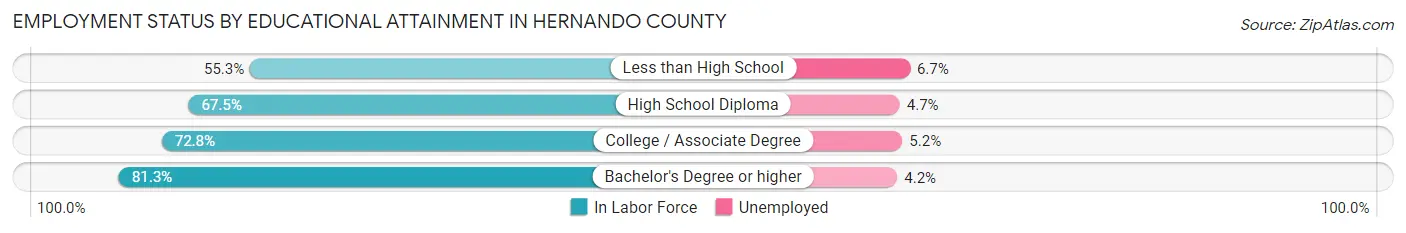
| Educational Attainment | In Labor Force | Unemployed |
| Less than High School | 5,141 (55.3%) | 623 (6.7%) |
| High School Diploma | 20,205 (67.5%) | 1,407 (4.7%) |
| College / Associate Degree | 26,383 (72.8%) | 1,884 (5.2%) |
| Bachelor's Degree or higher | 15,461 (81.3%) | 799 (4.2%) |
| Total | 67,180 (71.1%) | 4,630 (4.9%) |
Employment Occupations by Sex in Hernando County
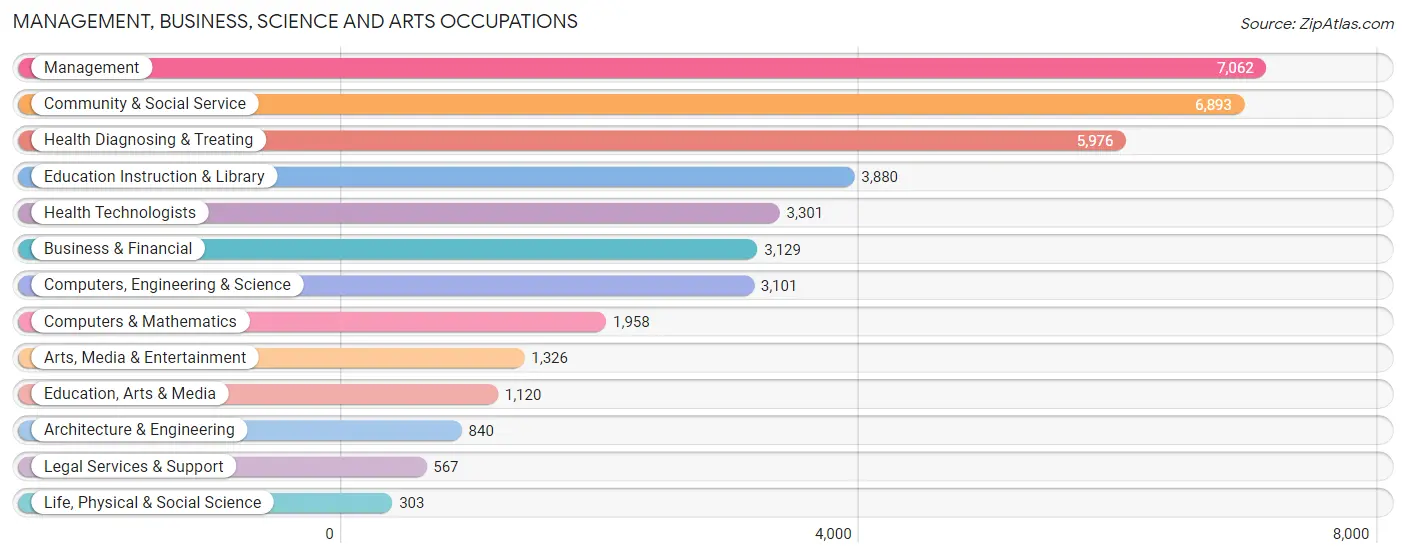
Management, Business, Science and Arts Occupations
The most common Management, Business, Science and Arts occupations in Hernando County are Management (7,062 | 9.0%), Community & Social Service (6,893 | 8.7%), Health Diagnosing & Treating (5,976 | 7.6%), Education Instruction & Library (3,880 | 4.9%), and Health Technologists (3,301 | 4.2%).
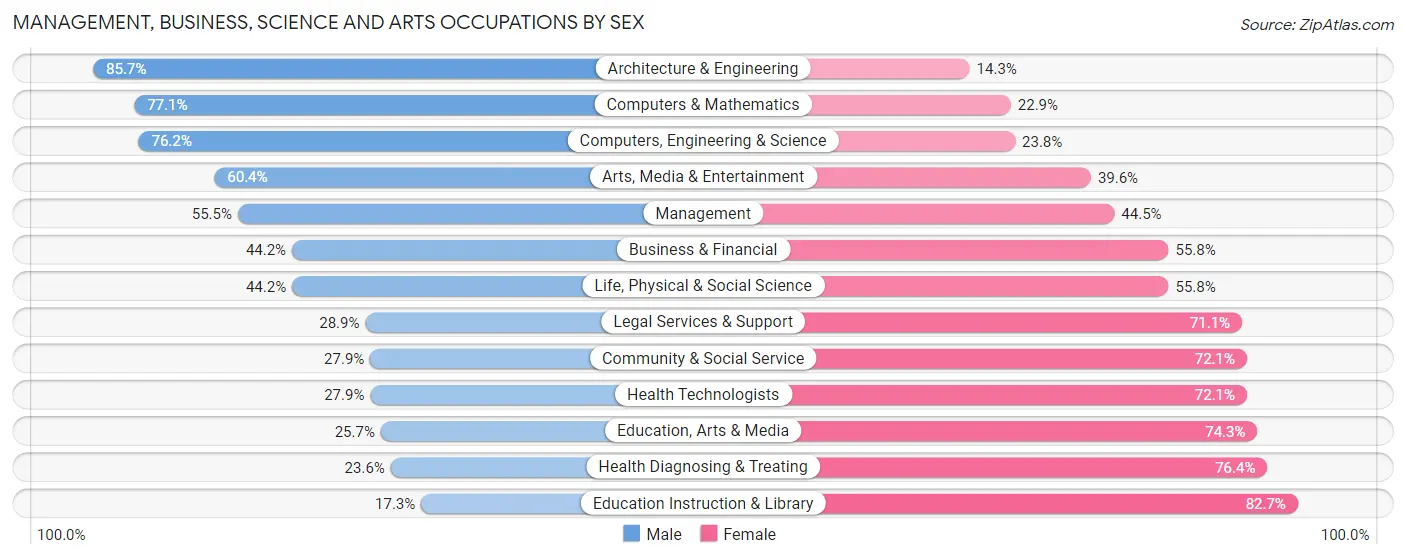
Management, Business, Science and Arts Occupations by Sex
Within the Management, Business, Science and Arts occupations in Hernando County, the most male-oriented occupations are Architecture & Engineering (85.7%), Computers & Mathematics (77.1%), and Computers, Engineering & Science (76.2%), while the most female-oriented occupations are Education Instruction & Library (82.7%), Health Diagnosing & Treating (76.4%), and Education, Arts & Media (74.3%).
| Occupation | Male | Female |
| Management | 3,921 (55.5%) | 3,141 (44.5%) |
| Business & Financial | 1,384 (44.2%) | 1,745 (55.8%) |
| Computers, Engineering & Science | 2,364 (76.2%) | 737 (23.8%) |
| Computers & Mathematics | 1,510 (77.1%) | 448 (22.9%) |
| Architecture & Engineering | 720 (85.7%) | 120 (14.3%) |
| Life, Physical & Social Science | 134 (44.2%) | 169 (55.8%) |
| Community & Social Service | 1,924 (27.9%) | 4,969 (72.1%) |
| Education, Arts & Media | 288 (25.7%) | 832 (74.3%) |
| Legal Services & Support | 164 (28.9%) | 403 (71.1%) |
| Education Instruction & Library | 671 (17.3%) | 3,209 (82.7%) |
| Arts, Media & Entertainment | 801 (60.4%) | 525 (39.6%) |
| Health Diagnosing & Treating | 1,413 (23.6%) | 4,563 (76.4%) |
| Health Technologists | 921 (27.9%) | 2,380 (72.1%) |
| Total (Category) | 11,006 (42.1%) | 15,155 (57.9%) |
| Total (Overall) | 40,959 (52.0%) | 37,819 (48.0%) |
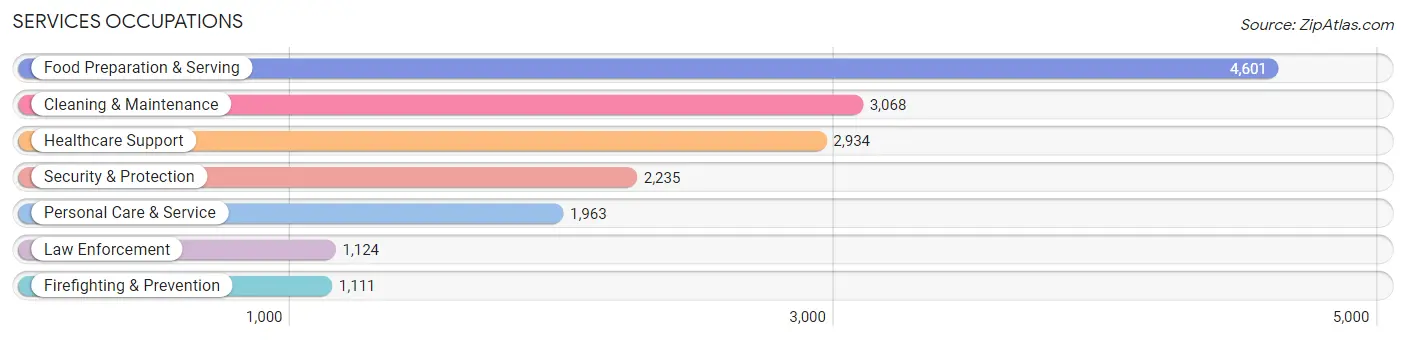
Services Occupations
The most common Services occupations in Hernando County are Food Preparation & Serving (4,601 | 5.8%), Cleaning & Maintenance (3,068 | 3.9%), Healthcare Support (2,934 | 3.7%), Security & Protection (2,235 | 2.8%), and Personal Care & Service (1,963 | 2.5%).
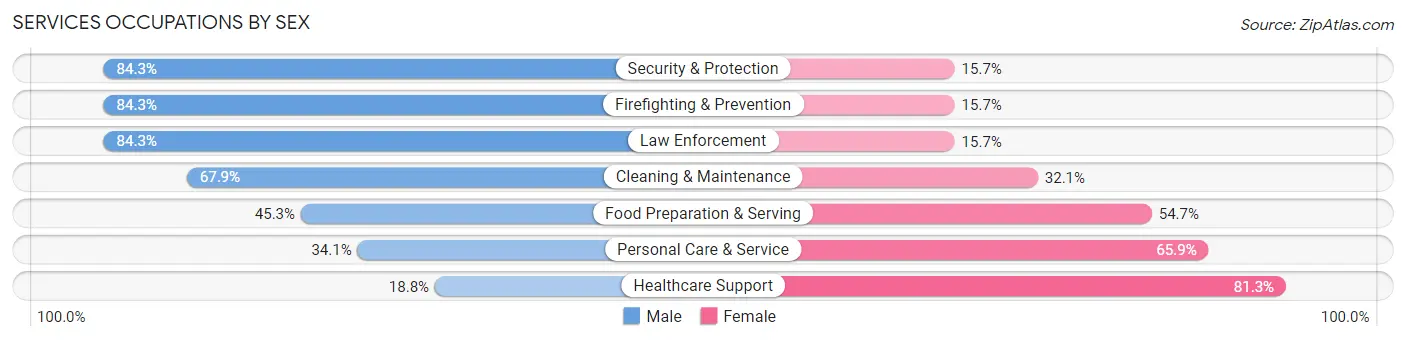
Services Occupations by Sex
Within the Services occupations in Hernando County, the most male-oriented occupations are Security & Protection (84.3%), Firefighting & Prevention (84.3%), and Law Enforcement (84.3%), while the most female-oriented occupations are Healthcare Support (81.2%), Personal Care & Service (65.9%), and Food Preparation & Serving (54.7%).
| Occupation | Male | Female |
| Healthcare Support | 550 (18.8%) | 2,384 (81.2%) |
| Security & Protection | 1,885 (84.3%) | 350 (15.7%) |
| Firefighting & Prevention | 937 (84.3%) | 174 (15.7%) |
| Law Enforcement | 948 (84.3%) | 176 (15.7%) |
| Food Preparation & Serving | 2,084 (45.3%) | 2,517 (54.7%) |
| Cleaning & Maintenance | 2,082 (67.9%) | 986 (32.1%) |
| Personal Care & Service | 669 (34.1%) | 1,294 (65.9%) |
| Total (Category) | 7,270 (49.1%) | 7,531 (50.9%) |
| Total (Overall) | 40,959 (52.0%) | 37,819 (48.0%) |
Sales and Office Occupations
The most common Sales and Office occupations in Hernando County are Office & Administration (10,633 | 13.5%), and Sales & Related (8,840 | 11.2%).

Sales and Office Occupations by Sex

| Occupation | Male | Female |
| Sales & Related | 4,182 (47.3%) | 4,658 (52.7%) |
| Office & Administration | 2,680 (25.2%) | 7,953 (74.8%) |
| Total (Category) | 6,862 (35.2%) | 12,611 (64.8%) |
| Total (Overall) | 40,959 (52.0%) | 37,819 (48.0%) |
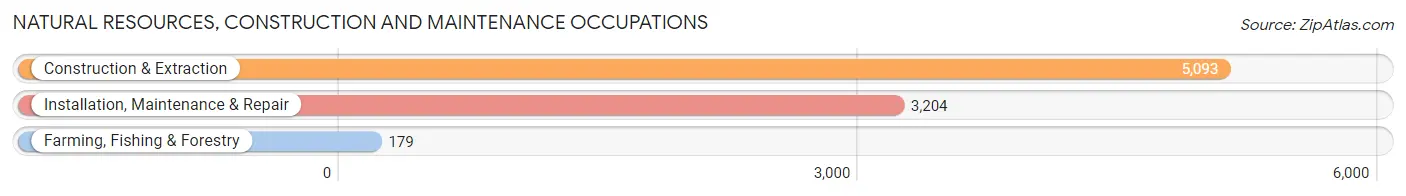
Natural Resources, Construction and Maintenance Occupations
The most common Natural Resources, Construction and Maintenance occupations in Hernando County are Construction & Extraction (5,093 | 6.5%), Installation, Maintenance & Repair (3,204 | 4.1%), and Farming, Fishing & Forestry (179 | 0.2%).
Natural Resources, Construction and Maintenance Occupations by Sex
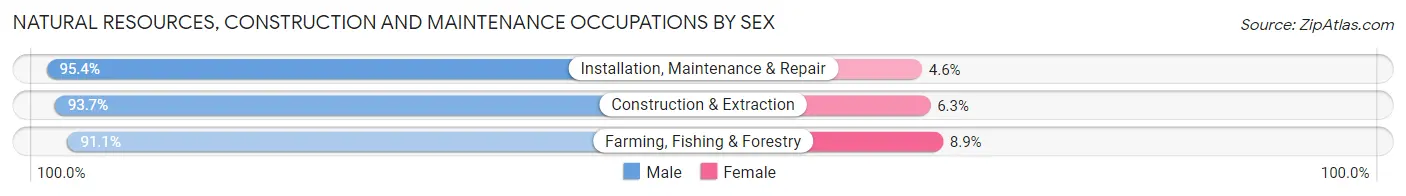
| Occupation | Male | Female |
| Farming, Fishing & Forestry | 163 (91.1%) | 16 (8.9%) |
| Construction & Extraction | 4,772 (93.7%) | 321 (6.3%) |
| Installation, Maintenance & Repair | 3,058 (95.4%) | 146 (4.6%) |
| Total (Category) | 7,993 (94.3%) | 483 (5.7%) |
| Total (Overall) | 40,959 (52.0%) | 37,819 (48.0%) |
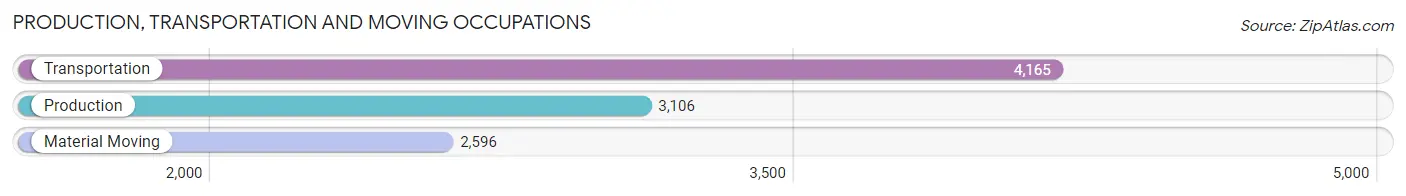
Production, Transportation and Moving Occupations
The most common Production, Transportation and Moving occupations in Hernando County are Transportation (4,165 | 5.3%), Production (3,106 | 3.9%), and Material Moving (2,596 | 3.3%).
Production, Transportation and Moving Occupations by Sex
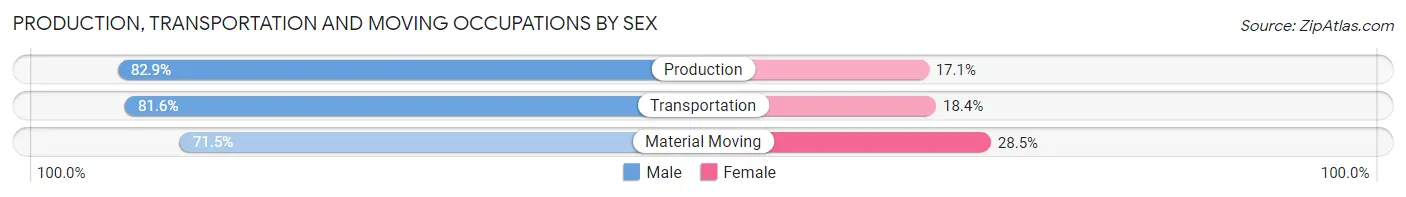
| Occupation | Male | Female |
| Production | 2,575 (82.9%) | 531 (17.1%) |
| Transportation | 3,397 (81.6%) | 768 (18.4%) |
| Material Moving | 1,856 (71.5%) | 740 (28.5%) |
| Total (Category) | 7,828 (79.3%) | 2,039 (20.7%) |
| Total (Overall) | 40,959 (52.0%) | 37,819 (48.0%) |
Employment Industries by Sex in Hernando County
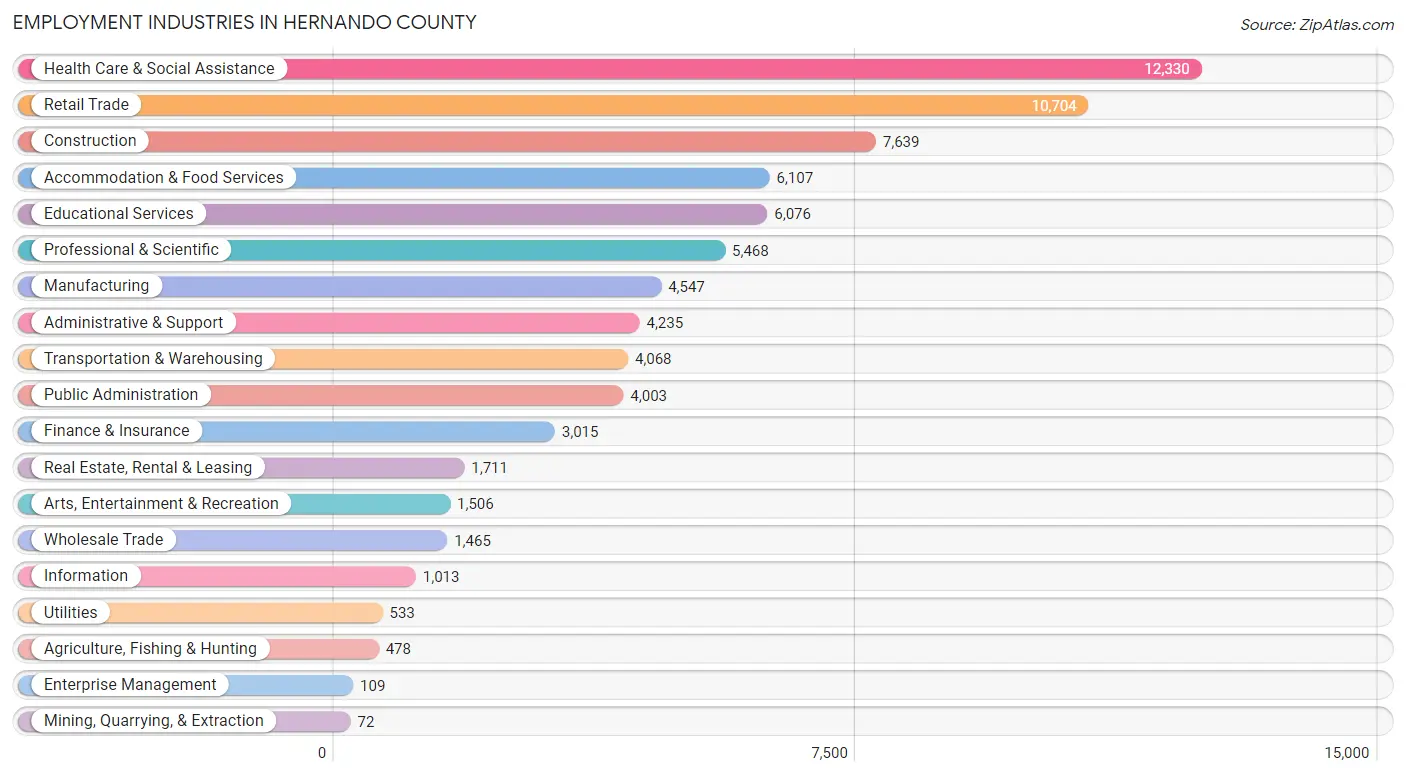
Employment Industries in Hernando County
The major employment industries in Hernando County include Health Care & Social Assistance (12,330 | 15.7%), Retail Trade (10,704 | 13.6%), Construction (7,639 | 9.7%), Accommodation & Food Services (6,107 | 7.7%), and Educational Services (6,076 | 7.7%).
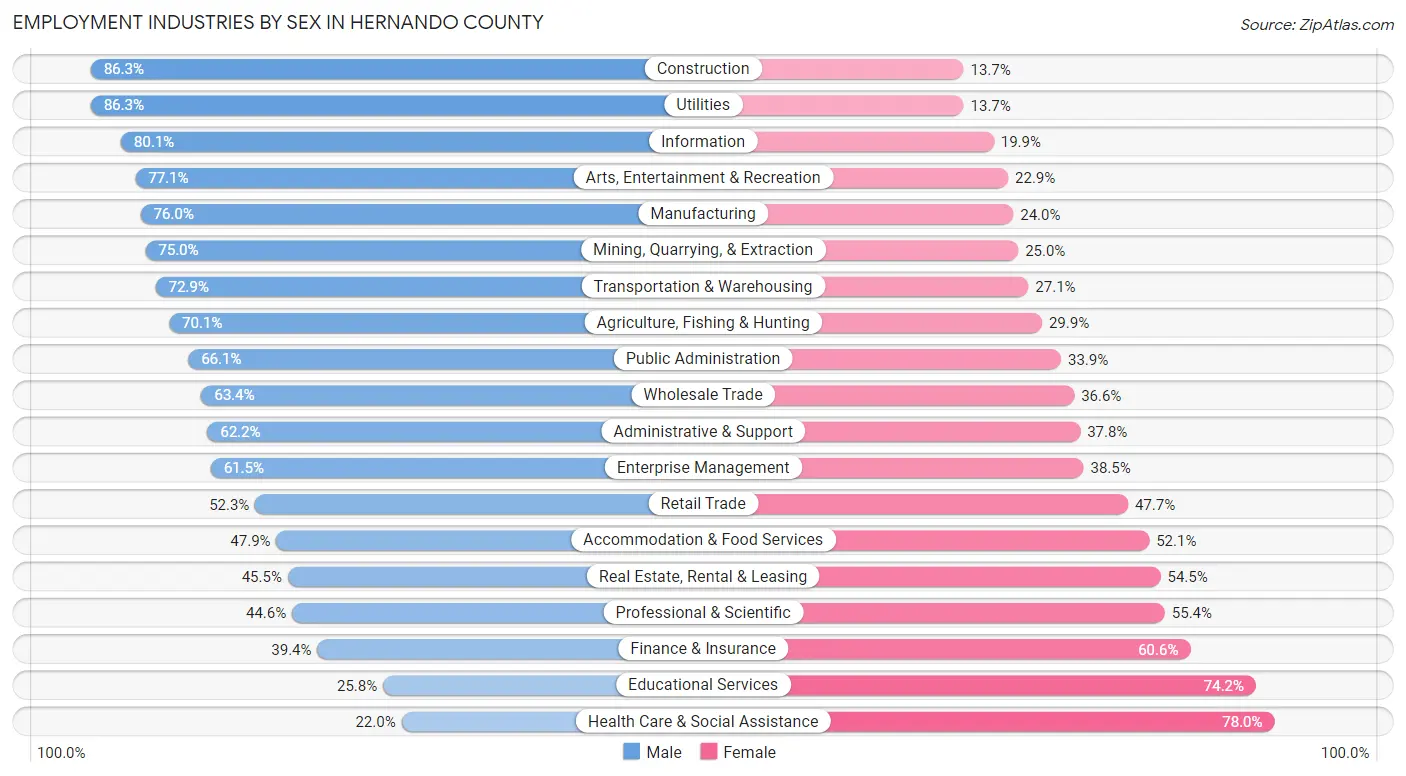
Employment Industries by Sex in Hernando County
The Hernando County industries that see more men than women are Construction (86.3%), Utilities (86.3%), and Information (80.1%), whereas the industries that tend to have a higher number of women are Health Care & Social Assistance (78.0%), Educational Services (74.2%), and Finance & Insurance (60.6%).
| Industry | Male | Female |
| Agriculture, Fishing & Hunting | 335 (70.1%) | 143 (29.9%) |
| Mining, Quarrying, & Extraction | 54 (75.0%) | 18 (25.0%) |
| Construction | 6,593 (86.3%) | 1,046 (13.7%) |
| Manufacturing | 3,456 (76.0%) | 1,091 (24.0%) |
| Wholesale Trade | 929 (63.4%) | 536 (36.6%) |
| Retail Trade | 5,595 (52.3%) | 5,109 (47.7%) |
| Transportation & Warehousing | 2,965 (72.9%) | 1,103 (27.1%) |
| Utilities | 460 (86.3%) | 73 (13.7%) |
| Information | 811 (80.1%) | 202 (19.9%) |
| Finance & Insurance | 1,188 (39.4%) | 1,827 (60.6%) |
| Real Estate, Rental & Leasing | 779 (45.5%) | 932 (54.5%) |
| Professional & Scientific | 2,441 (44.6%) | 3,027 (55.4%) |
| Enterprise Management | 67 (61.5%) | 42 (38.5%) |
| Administrative & Support | 2,633 (62.2%) | 1,602 (37.8%) |
| Educational Services | 1,568 (25.8%) | 4,508 (74.2%) |
| Health Care & Social Assistance | 2,711 (22.0%) | 9,619 (78.0%) |
| Arts, Entertainment & Recreation | 1,161 (77.1%) | 345 (22.9%) |
| Accommodation & Food Services | 2,924 (47.9%) | 3,183 (52.1%) |
| Public Administration | 2,647 (66.1%) | 1,356 (33.9%) |
| Total | 40,959 (52.0%) | 37,819 (48.0%) |
Education in Hernando County
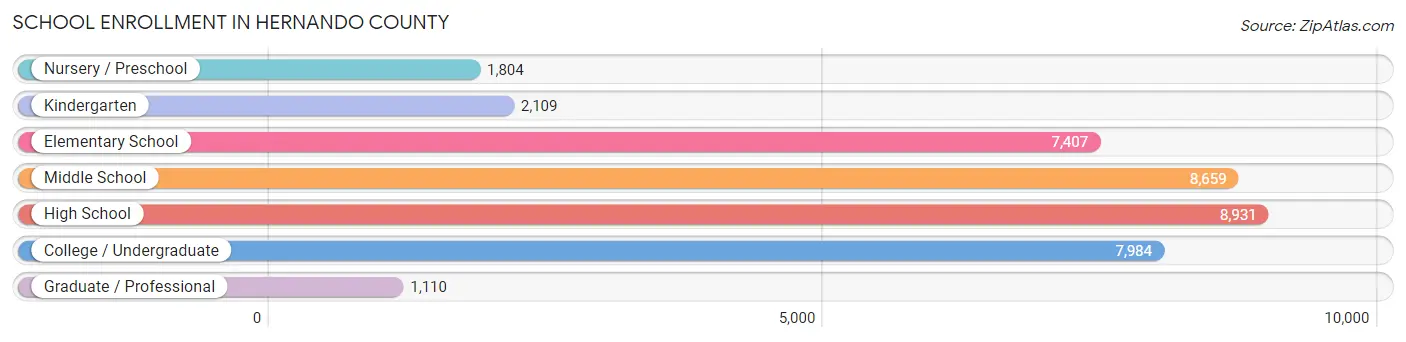
School Enrollment in Hernando County
The most common levels of schooling among the 38,004 students in Hernando County are high school (8,931 | 23.5%), middle school (8,659 | 22.8%), and college / undergraduate (7,984 | 21.0%).
| School Level | # Students | % Students |
| Nursery / Preschool | 1,804 | 4.8% |
| Kindergarten | 2,109 | 5.6% |
| Elementary School | 7,407 | 19.5% |
| Middle School | 8,659 | 22.8% |
| High School | 8,931 | 23.5% |
| College / Undergraduate | 7,984 | 21.0% |
| Graduate / Professional | 1,110 | 2.9% |
| Total | 38,004 | 100.0% |
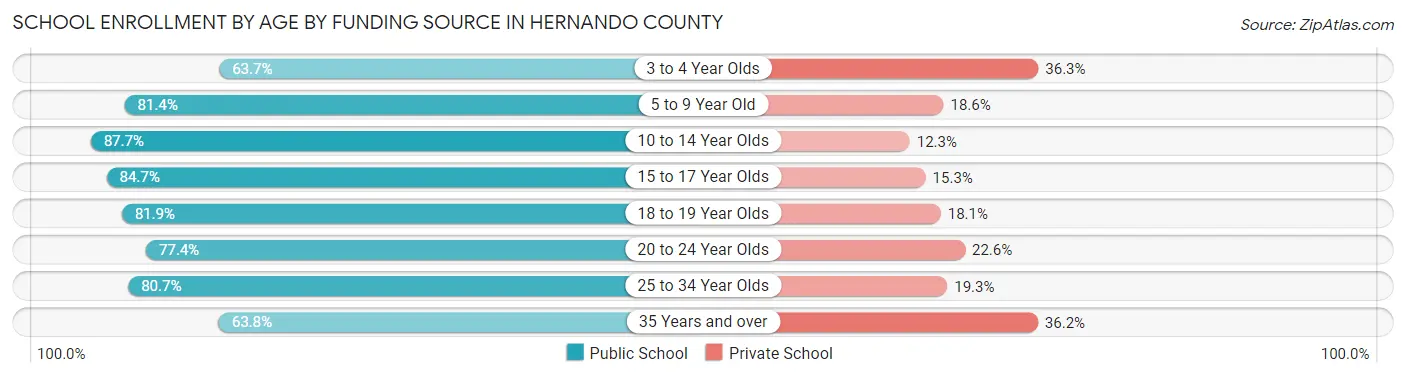
School Enrollment by Age by Funding Source in Hernando County
Out of a total of 38,004 students who are enrolled in schools in Hernando County, 7,069 (18.6%) attend a private institution, while the remaining 30,935 (81.4%) are enrolled in public schools. The age group of 3 to 4 year olds has the highest likelihood of being enrolled in private schools, with 533 (36.3% in the age bracket) enrolled. Conversely, the age group of 10 to 14 year olds has the lowest likelihood of being enrolled in a private school, with 9,677 (87.7% in the age bracket) attending a public institution.
| Age Bracket | Public School | Private School |
| 3 to 4 Year Olds | 937 (63.7%) | 533 (36.3%) |
| 5 to 9 Year Old | 7,013 (81.4%) | 1,604 (18.6%) |
| 10 to 14 Year Olds | 9,677 (87.7%) | 1,360 (12.3%) |
| 15 to 17 Year Olds | 5,547 (84.7%) | 1,000 (15.3%) |
| 18 to 19 Year Olds | 2,088 (81.9%) | 461 (18.1%) |
| 20 to 24 Year Olds | 2,036 (77.4%) | 595 (22.6%) |
| 25 to 34 Year Olds | 1,743 (80.7%) | 417 (19.3%) |
| 35 Years and over | 1,910 (63.8%) | 1,083 (36.2%) |
| Total | 30,935 (81.4%) | 7,069 (18.6%) |
Educational Attainment by Field of Study in Hernando County
Business (6,658 | 21.2%), education (5,010 | 15.9%), science & technology (3,880 | 12.3%), arts & humanities (2,277 | 7.2%), and engineering (1,904 | 6.1%) are the most common fields of study among 31,431 individuals in Hernando County who have obtained a bachelor's degree or higher.
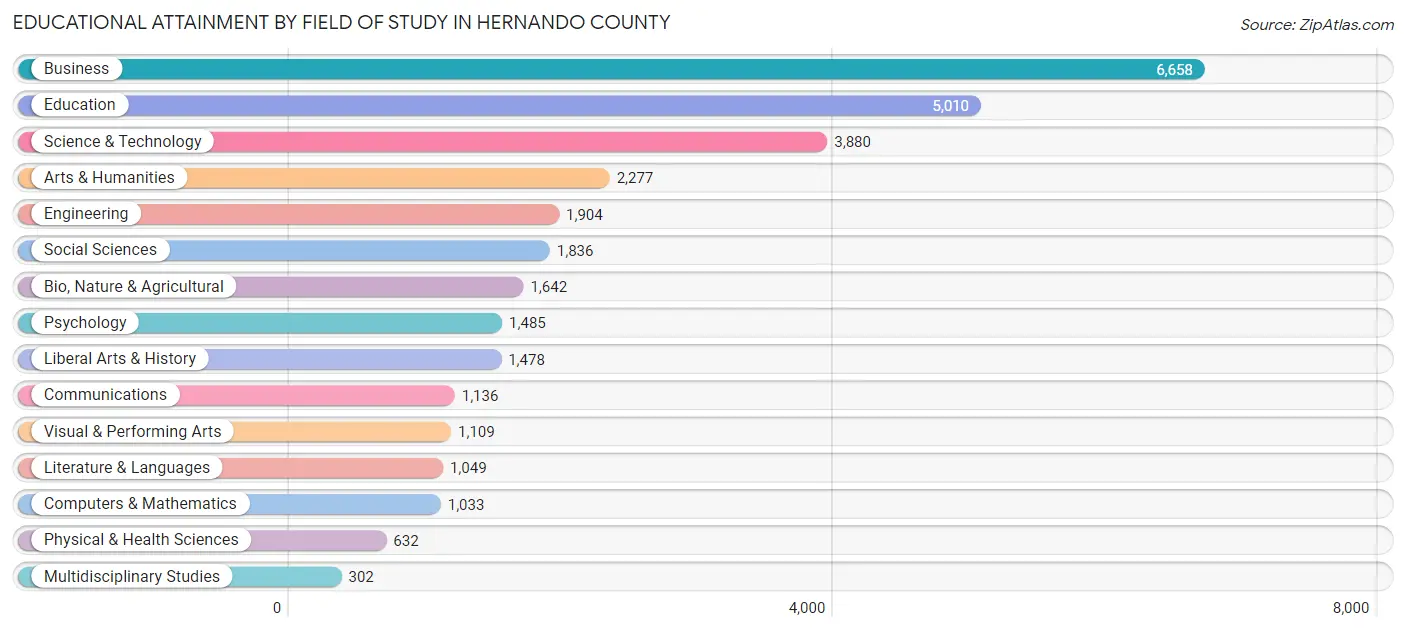
| Field of Study | # Graduates | % Graduates |
| Computers & Mathematics | 1,033 | 3.3% |
| Bio, Nature & Agricultural | 1,642 | 5.2% |
| Physical & Health Sciences | 632 | 2.0% |
| Psychology | 1,485 | 4.7% |
| Social Sciences | 1,836 | 5.8% |
| Engineering | 1,904 | 6.1% |
| Multidisciplinary Studies | 302 | 1.0% |
| Science & Technology | 3,880 | 12.3% |
| Business | 6,658 | 21.2% |
| Education | 5,010 | 15.9% |
| Literature & Languages | 1,049 | 3.3% |
| Liberal Arts & History | 1,478 | 4.7% |
| Visual & Performing Arts | 1,109 | 3.5% |
| Communications | 1,136 | 3.6% |
| Arts & Humanities | 2,277 | 7.2% |
| Total | 31,431 | 100.0% |
Transportation & Commute in Hernando County
Vehicle Availability by Sex in Hernando County
The most prevalent vehicle ownership categories in Hernando County are males with 2 vehicles (17,244, accounting for 42.8%) and females with 2 vehicles (15,272, making up 46.6%).
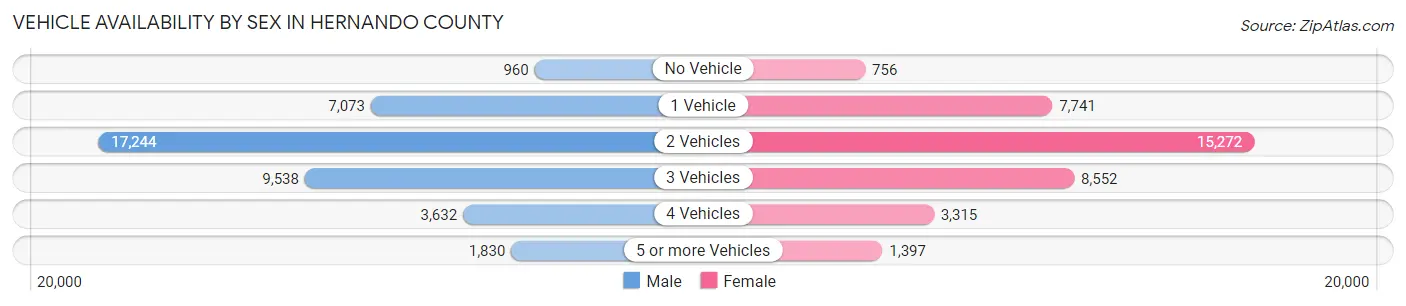
| Vehicles Available | Male | Female |
| No Vehicle | 960 (2.4%) | 756 (2.0%) |
| 1 Vehicle | 7,073 (17.6%) | 7,741 (20.9%) |
| 2 Vehicles | 17,244 (42.8%) | 15,272 (41.2%) |
| 3 Vehicles | 9,538 (23.7%) | 8,552 (23.1%) |
| 4 Vehicles | 3,632 (9.0%) | 3,315 (8.9%) |
| 5 or more Vehicles | 1,830 (4.5%) | 1,397 (3.8%) |
| Total | 40,277 (100.0%) | 37,033 (100.0%) |
Commute Time in Hernando County
The most frequently occuring commute durations in Hernando County are 15 to 19 minutes (11,291 commuters, 16.5%), 10 to 14 minutes (8,635 commuters, 12.6%), and 45 to 59 minutes (8,179 commuters, 11.9%).
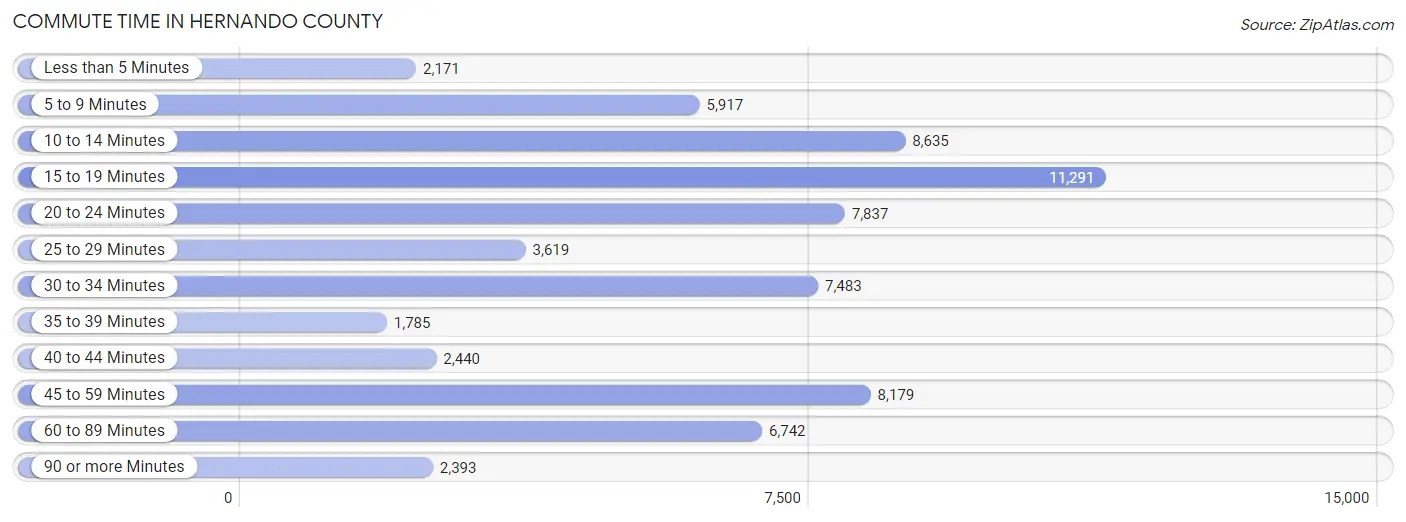
| Commute Time | # Commuters | % Commuters |
| Less than 5 Minutes | 2,171 | 3.2% |
| 5 to 9 Minutes | 5,917 | 8.6% |
| 10 to 14 Minutes | 8,635 | 12.6% |
| 15 to 19 Minutes | 11,291 | 16.5% |
| 20 to 24 Minutes | 7,837 | 11.4% |
| 25 to 29 Minutes | 3,619 | 5.3% |
| 30 to 34 Minutes | 7,483 | 10.9% |
| 35 to 39 Minutes | 1,785 | 2.6% |
| 40 to 44 Minutes | 2,440 | 3.6% |
| 45 to 59 Minutes | 8,179 | 11.9% |
| 60 to 89 Minutes | 6,742 | 9.8% |
| 90 or more Minutes | 2,393 | 3.5% |
Commute Time by Sex in Hernando County
The most common commute times in Hernando County are 15 to 19 minutes (5,430 commuters, 14.8%) for males and 15 to 19 minutes (5,861 commuters, 18.5%) for females.
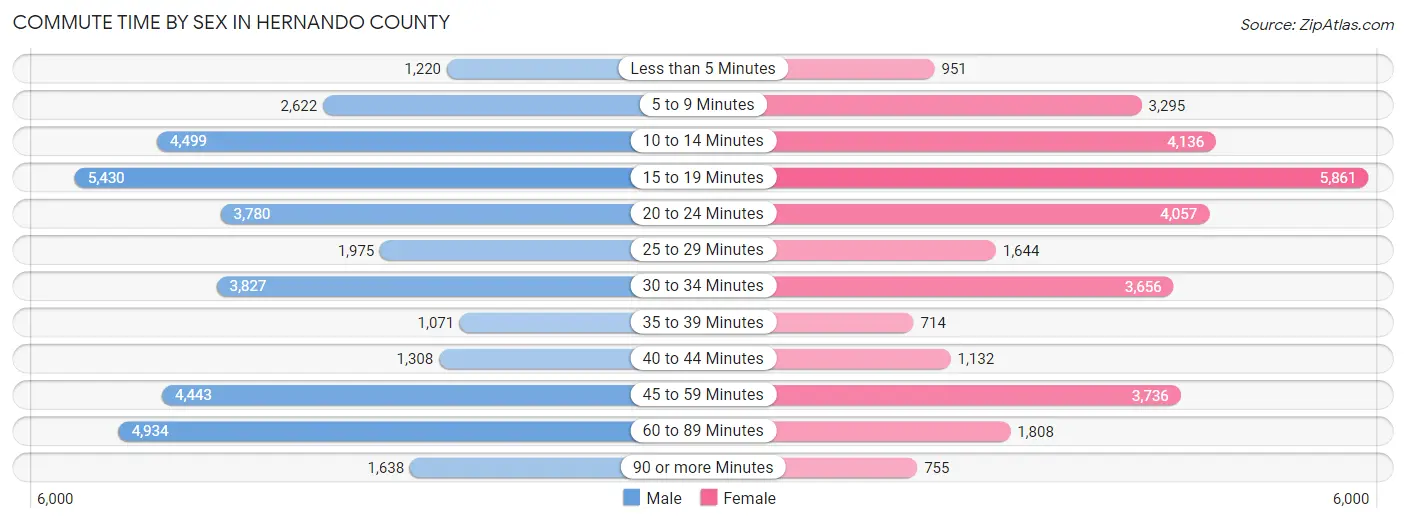
| Commute Time | Male | Female |
| Less than 5 Minutes | 1,220 (3.3%) | 951 (3.0%) |
| 5 to 9 Minutes | 2,622 (7.1%) | 3,295 (10.4%) |
| 10 to 14 Minutes | 4,499 (12.2%) | 4,136 (13.0%) |
| 15 to 19 Minutes | 5,430 (14.8%) | 5,861 (18.5%) |
| 20 to 24 Minutes | 3,780 (10.3%) | 4,057 (12.8%) |
| 25 to 29 Minutes | 1,975 (5.4%) | 1,644 (5.2%) |
| 30 to 34 Minutes | 3,827 (10.4%) | 3,656 (11.5%) |
| 35 to 39 Minutes | 1,071 (2.9%) | 714 (2.2%) |
| 40 to 44 Minutes | 1,308 (3.6%) | 1,132 (3.6%) |
| 45 to 59 Minutes | 4,443 (12.1%) | 3,736 (11.8%) |
| 60 to 89 Minutes | 4,934 (13.4%) | 1,808 (5.7%) |
| 90 or more Minutes | 1,638 (4.5%) | 755 (2.4%) |
Time of Departure to Work by Sex in Hernando County
The most frequent times of departure to work in Hernando County are 7:00 AM to 7:29 AM (4,812, 13.1%) for males and 7:00 AM to 7:29 AM (5,018, 15.8%) for females.
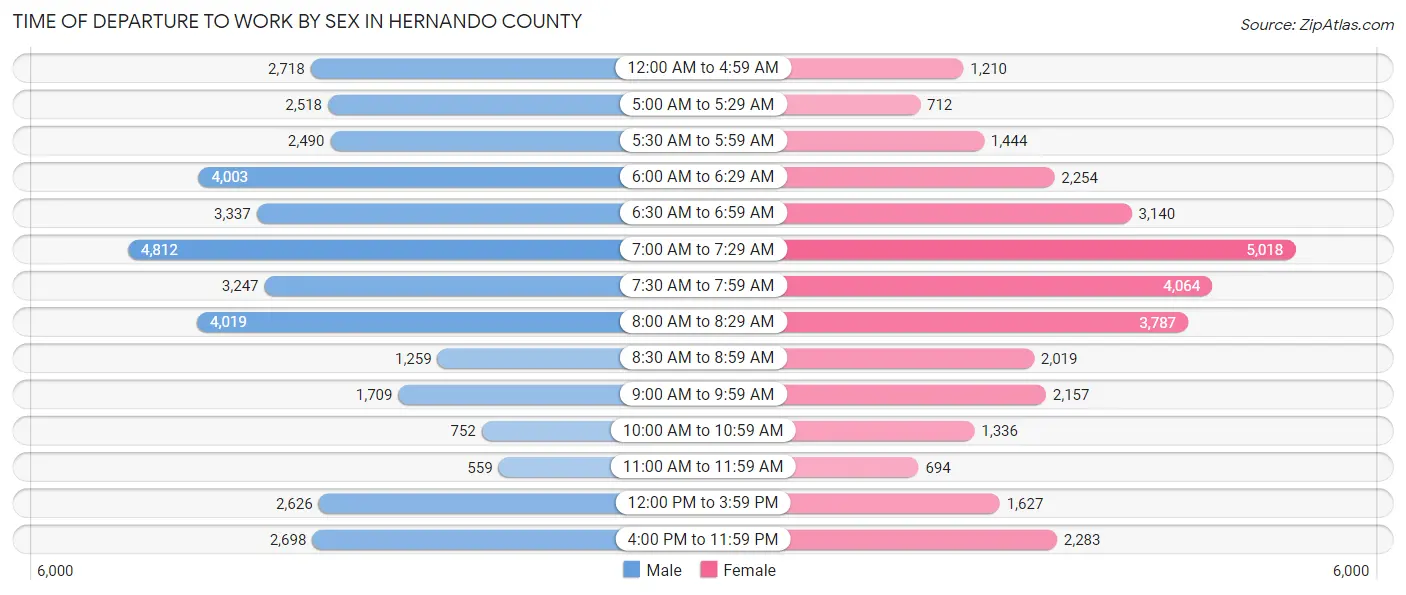
| Time of Departure | Male | Female |
| 12:00 AM to 4:59 AM | 2,718 (7.4%) | 1,210 (3.8%) |
| 5:00 AM to 5:29 AM | 2,518 (6.9%) | 712 (2.2%) |
| 5:30 AM to 5:59 AM | 2,490 (6.8%) | 1,444 (4.5%) |
| 6:00 AM to 6:29 AM | 4,003 (10.9%) | 2,254 (7.1%) |
| 6:30 AM to 6:59 AM | 3,337 (9.1%) | 3,140 (9.9%) |
| 7:00 AM to 7:29 AM | 4,812 (13.1%) | 5,018 (15.8%) |
| 7:30 AM to 7:59 AM | 3,247 (8.8%) | 4,064 (12.8%) |
| 8:00 AM to 8:29 AM | 4,019 (10.9%) | 3,787 (11.9%) |
| 8:30 AM to 8:59 AM | 1,259 (3.4%) | 2,019 (6.4%) |
| 9:00 AM to 9:59 AM | 1,709 (4.6%) | 2,157 (6.8%) |
| 10:00 AM to 10:59 AM | 752 (2.1%) | 1,336 (4.2%) |
| 11:00 AM to 11:59 AM | 559 (1.5%) | 694 (2.2%) |
| 12:00 PM to 3:59 PM | 2,626 (7.1%) | 1,627 (5.1%) |
| 4:00 PM to 11:59 PM | 2,698 (7.3%) | 2,283 (7.2%) |
| Total | 36,747 (100.0%) | 31,745 (100.0%) |
Housing Occupancy in Hernando County
Occupancy by Ownership in Hernando County
Of the total 79,169 dwellings in Hernando County, owner-occupied units account for 63,451 (80.1%), while renter-occupied units make up 15,718 (19.9%).
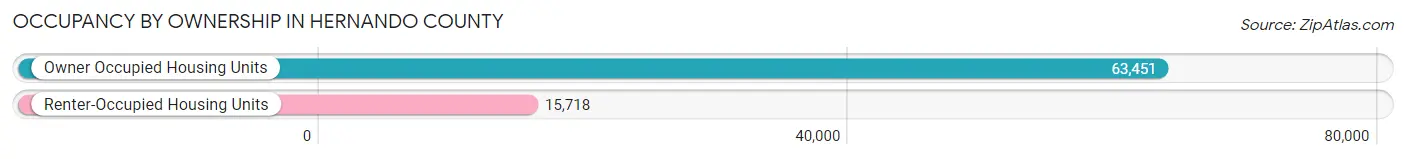
| Occupancy | # Housing Units | % Housing Units |
| Owner Occupied Housing Units | 63,451 | 80.1% |
| Renter-Occupied Housing Units | 15,718 | 19.9% |
| Total Occupied Housing Units | 79,169 | 100.0% |
Occupancy by Household Size in Hernando County
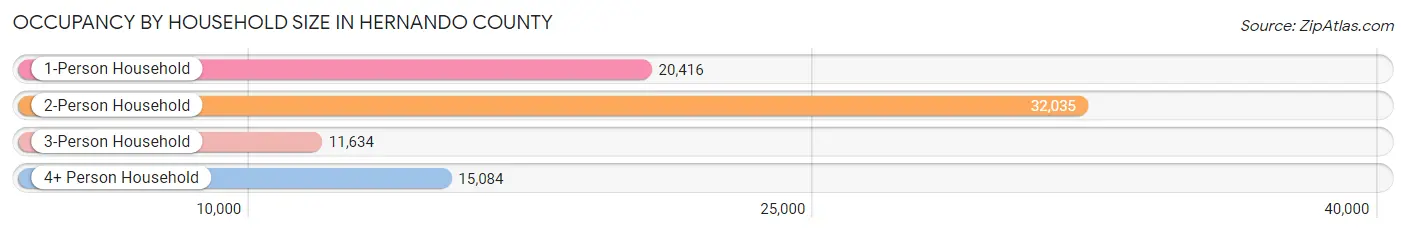
| Household Size | # Housing Units | % Housing Units |
| 1-Person Household | 20,416 | 25.8% |
| 2-Person Household | 32,035 | 40.5% |
| 3-Person Household | 11,634 | 14.7% |
| 4+ Person Household | 15,084 | 19.1% |
| Total Housing Units | 79,169 | 100.0% |
Occupancy by Ownership by Household Size in Hernando County
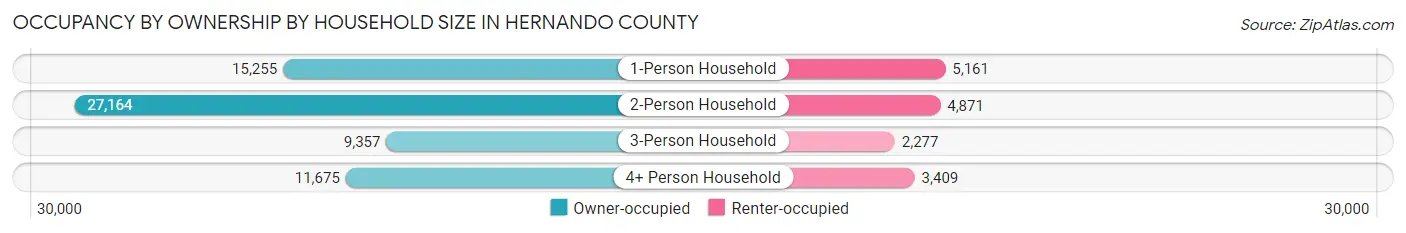
| Household Size | Owner-occupied | Renter-occupied |
| 1-Person Household | 15,255 (74.7%) | 5,161 (25.3%) |
| 2-Person Household | 27,164 (84.8%) | 4,871 (15.2%) |
| 3-Person Household | 9,357 (80.4%) | 2,277 (19.6%) |
| 4+ Person Household | 11,675 (77.4%) | 3,409 (22.6%) |
| Total Housing Units | 63,451 (80.1%) | 15,718 (19.9%) |
Occupancy by Educational Attainment in Hernando County
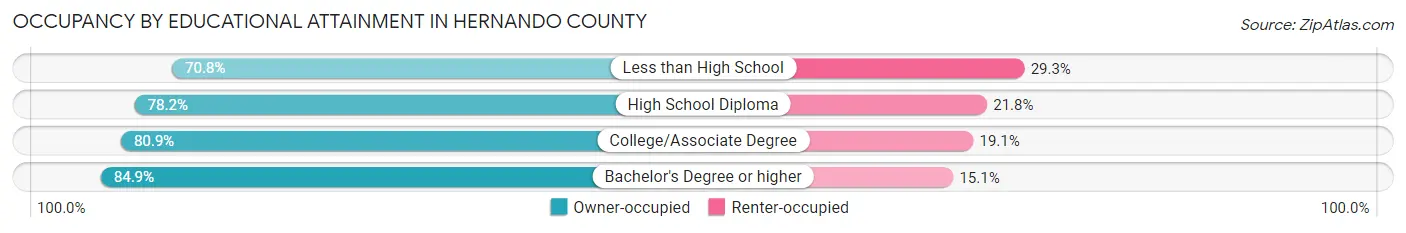
| Household Size | Owner-occupied | Renter-occupied |
| Less than High School | 4,546 (70.8%) | 1,879 (29.2%) |
| High School Diploma | 18,075 (78.2%) | 5,049 (21.8%) |
| College/Associate Degree | 26,028 (80.9%) | 6,151 (19.1%) |
| Bachelor's Degree or higher | 14,802 (84.9%) | 2,639 (15.1%) |
Occupancy by Age of Householder in Hernando County
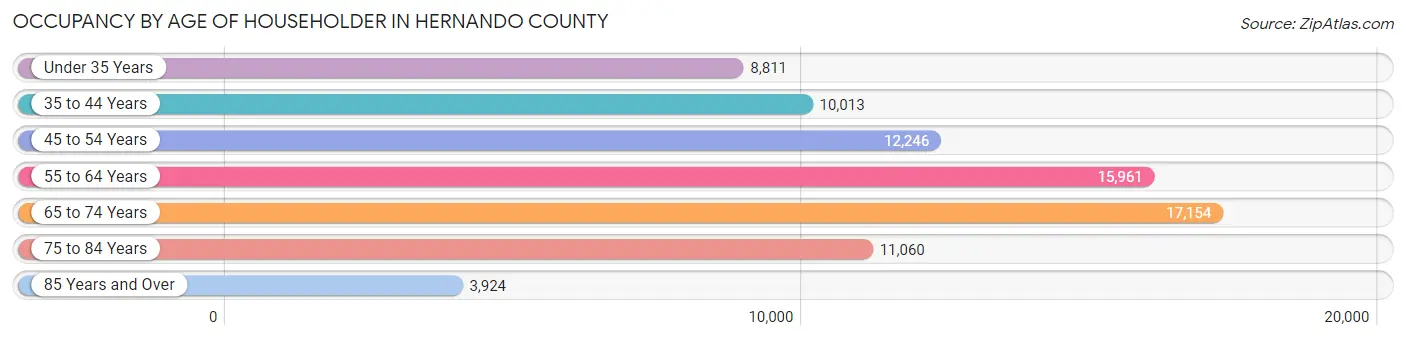
| Age Bracket | # Households | % Households |
| Under 35 Years | 8,811 | 11.1% |
| 35 to 44 Years | 10,013 | 12.7% |
| 45 to 54 Years | 12,246 | 15.5% |
| 55 to 64 Years | 15,961 | 20.2% |
| 65 to 74 Years | 17,154 | 21.7% |
| 75 to 84 Years | 11,060 | 14.0% |
| 85 Years and Over | 3,924 | 5.0% |
| Total | 79,169 | 100.0% |
Housing Finances in Hernando County
Median Income by Occupancy in Hernando County
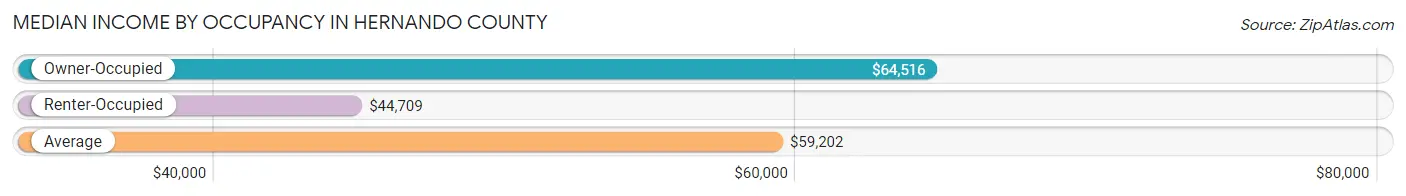
| Occupancy Type | # Households | Median Income |
| Owner-Occupied | 63,451 (80.1%) | $64,516 |
| Renter-Occupied | 15,718 (19.9%) | $44,709 |
| Average | 79,169 (100.0%) | $59,202 |
Occupancy by Householder Income Bracket in Hernando County
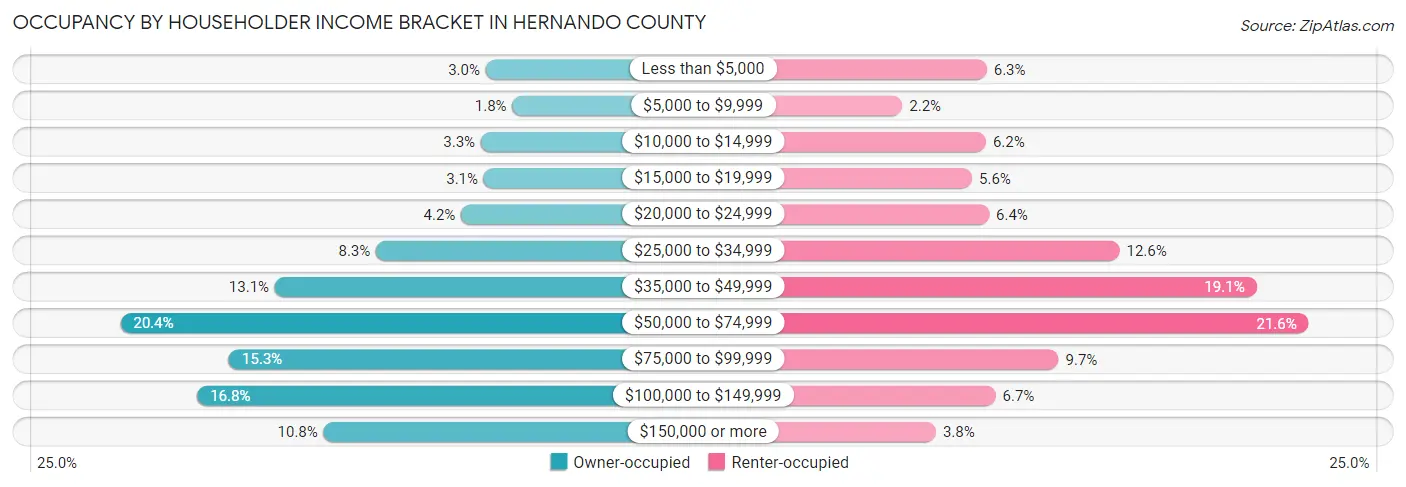
| Income Bracket | Owner-occupied | Renter-occupied |
| Less than $5,000 | 1,930 (3.0%) | 983 (6.2%) |
| $5,000 to $9,999 | 1,121 (1.8%) | 350 (2.2%) |
| $10,000 to $14,999 | 2,075 (3.3%) | 976 (6.2%) |
| $15,000 to $19,999 | 1,986 (3.1%) | 872 (5.6%) |
| $20,000 to $24,999 | 2,671 (4.2%) | 1,000 (6.4%) |
| $25,000 to $34,999 | 5,239 (8.3%) | 1,975 (12.6%) |
| $35,000 to $49,999 | 8,298 (13.1%) | 3,001 (19.1%) |
| $50,000 to $74,999 | 12,967 (20.4%) | 3,390 (21.6%) |
| $75,000 to $99,999 | 9,689 (15.3%) | 1,520 (9.7%) |
| $100,000 to $149,999 | 10,647 (16.8%) | 1,049 (6.7%) |
| $150,000 or more | 6,828 (10.8%) | 602 (3.8%) |
| Total | 63,451 (100.0%) | 15,718 (100.0%) |
Monthly Housing Cost Tiers in Hernando County
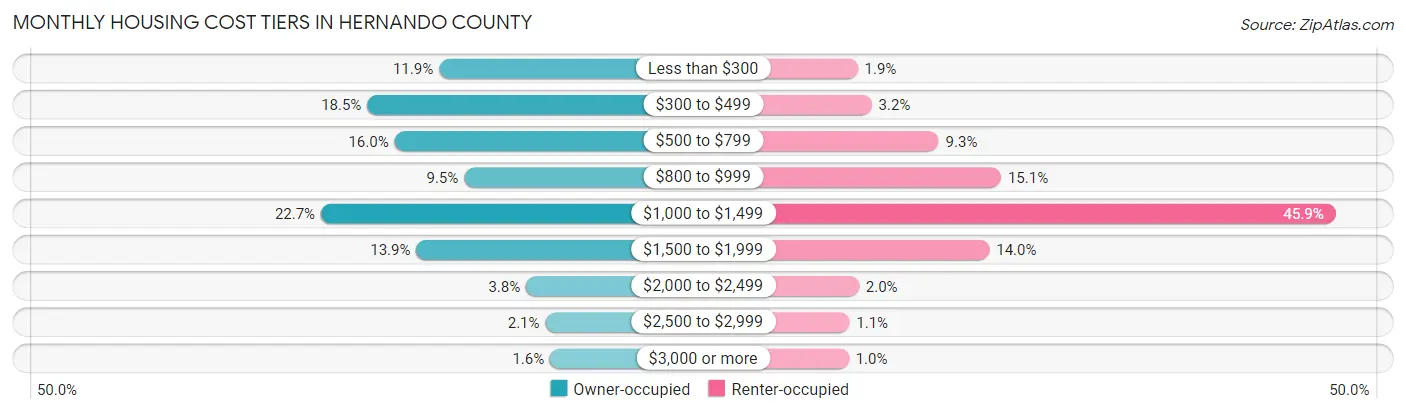
| Monthly Cost | Owner-occupied | Renter-occupied |
| Less than $300 | 7,521 (11.8%) | 293 (1.9%) |
| $300 to $499 | 11,716 (18.5%) | 495 (3.2%) |
| $500 to $799 | 10,122 (16.0%) | 1,465 (9.3%) |
| $800 to $999 | 6,055 (9.5%) | 2,367 (15.1%) |
| $1,000 to $1,499 | 14,418 (22.7%) | 7,209 (45.9%) |
| $1,500 to $1,999 | 8,842 (13.9%) | 2,198 (14.0%) |
| $2,000 to $2,499 | 2,436 (3.8%) | 309 (2.0%) |
| $2,500 to $2,999 | 1,306 (2.1%) | 173 (1.1%) |
| $3,000 or more | 1,035 (1.6%) | 163 (1.0%) |
| Total | 63,451 (100.0%) | 15,718 (100.0%) |
Physical Housing Characteristics in Hernando County
Housing Structures in Hernando County
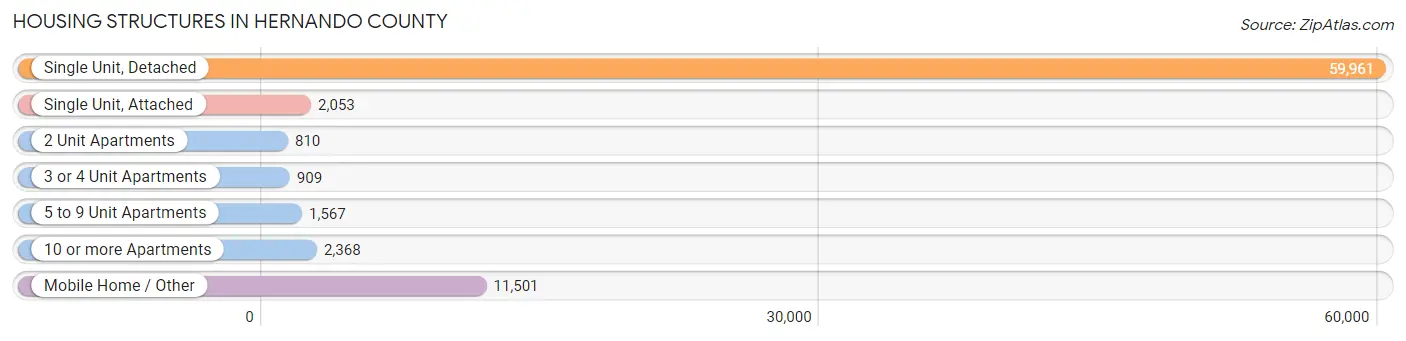
| Structure Type | # Housing Units | % Housing Units |
| Single Unit, Detached | 59,961 | 75.7% |
| Single Unit, Attached | 2,053 | 2.6% |
| 2 Unit Apartments | 810 | 1.0% |
| 3 or 4 Unit Apartments | 909 | 1.1% |
| 5 to 9 Unit Apartments | 1,567 | 2.0% |
| 10 or more Apartments | 2,368 | 3.0% |
| Mobile Home / Other | 11,501 | 14.5% |
| Total | 79,169 | 100.0% |
Housing Structures by Occupancy in Hernando County
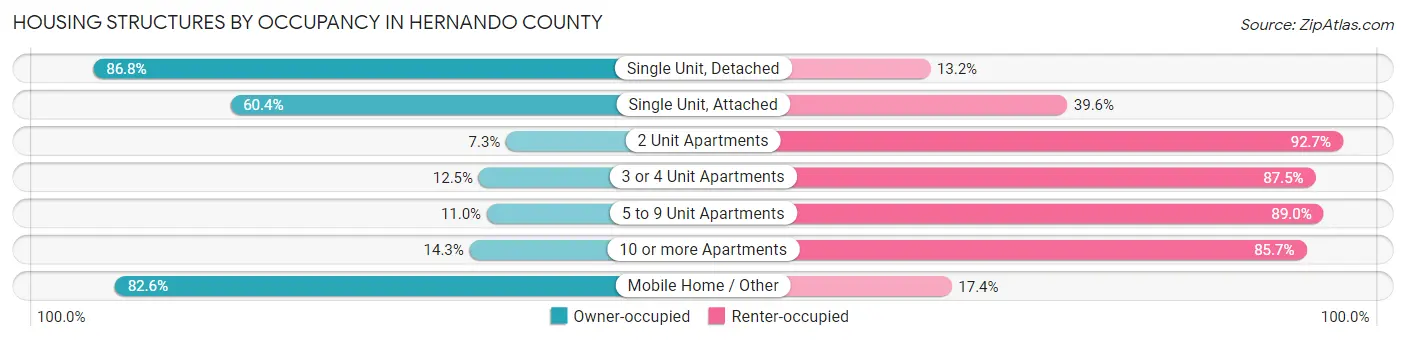
| Structure Type | Owner-occupied | Renter-occupied |
| Single Unit, Detached | 52,022 (86.8%) | 7,939 (13.2%) |
| Single Unit, Attached | 1,240 (60.4%) | 813 (39.6%) |
| 2 Unit Apartments | 59 (7.3%) | 751 (92.7%) |
| 3 or 4 Unit Apartments | 114 (12.5%) | 795 (87.5%) |
| 5 to 9 Unit Apartments | 172 (11.0%) | 1,395 (89.0%) |
| 10 or more Apartments | 339 (14.3%) | 2,029 (85.7%) |
| Mobile Home / Other | 9,505 (82.6%) | 1,996 (17.4%) |
| Total | 63,451 (80.1%) | 15,718 (19.9%) |
Housing Structures by Number of Rooms in Hernando County
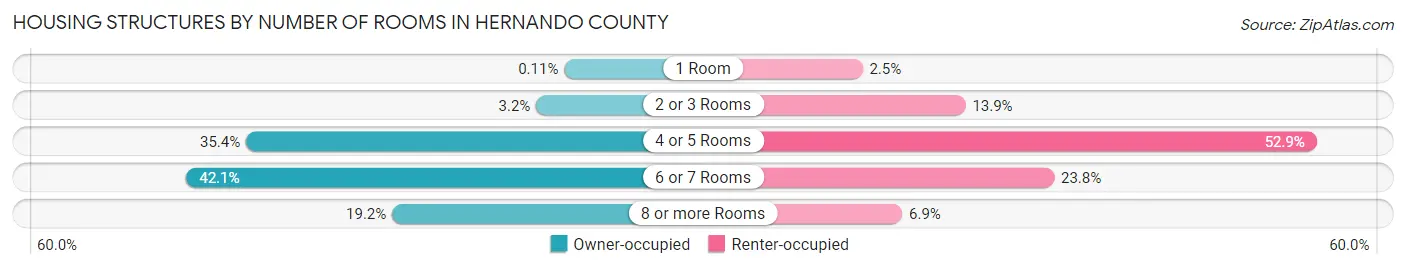
| Number of Rooms | Owner-occupied | Renter-occupied |
| 1 Room | 70 (0.1%) | 393 (2.5%) |
| 2 or 3 Rooms | 2,042 (3.2%) | 2,189 (13.9%) |
| 4 or 5 Rooms | 22,472 (35.4%) | 8,316 (52.9%) |
| 6 or 7 Rooms | 26,678 (42.0%) | 3,735 (23.8%) |
| 8 or more Rooms | 12,189 (19.2%) | 1,085 (6.9%) |
| Total | 63,451 (100.0%) | 15,718 (100.0%) |
Housing Structure by Heating Type in Hernando County
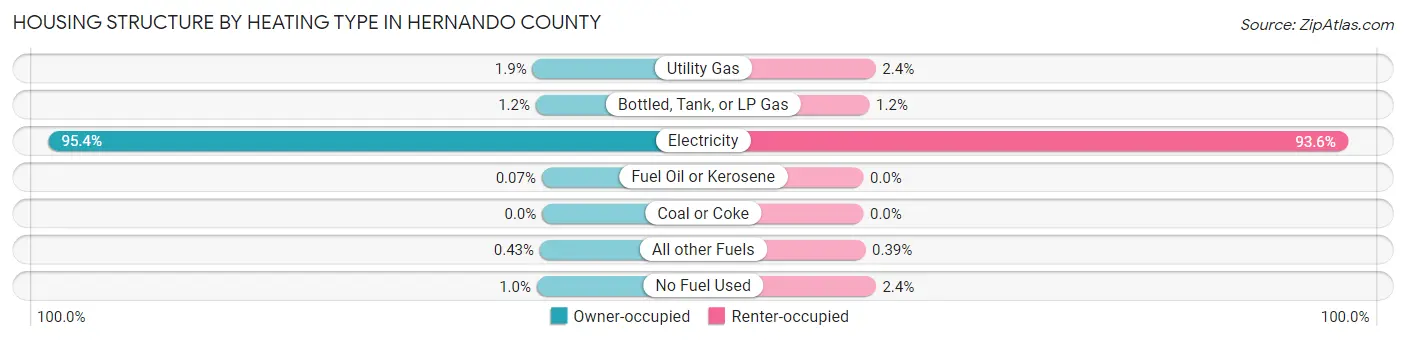
| Heating Type | Owner-occupied | Renter-occupied |
| Utility Gas | 1,181 (1.9%) | 376 (2.4%) |
| Bottled, Tank, or LP Gas | 777 (1.2%) | 186 (1.2%) |
| Electricity | 60,521 (95.4%) | 14,716 (93.6%) |
| Fuel Oil or Kerosene | 46 (0.1%) | 0 (0.0%) |
| Coal or Coke | 0 (0.0%) | 0 (0.0%) |
| All other Fuels | 271 (0.4%) | 62 (0.4%) |
| No Fuel Used | 655 (1.0%) | 378 (2.4%) |
| Total | 63,451 (100.0%) | 15,718 (100.0%) |
Household Vehicle Usage in Hernando County
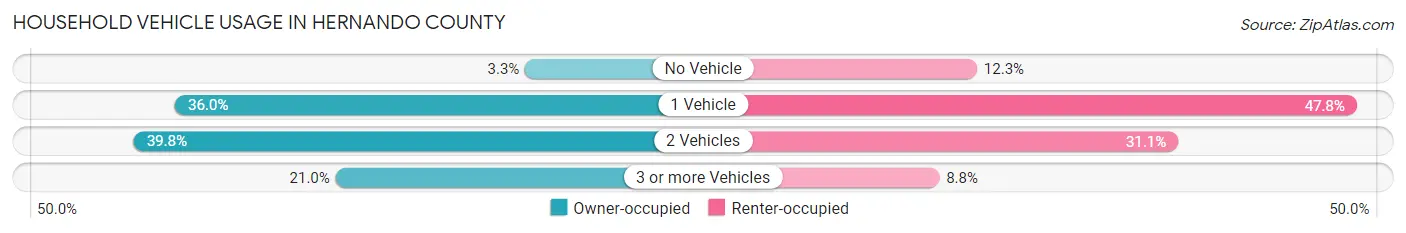
| Vehicles per Household | Owner-occupied | Renter-occupied |
| No Vehicle | 2,073 (3.3%) | 1,937 (12.3%) |
| 1 Vehicle | 22,809 (35.9%) | 7,510 (47.8%) |
| 2 Vehicles | 25,263 (39.8%) | 4,888 (31.1%) |
| 3 or more Vehicles | 13,306 (21.0%) | 1,383 (8.8%) |
| Total | 63,451 (100.0%) | 15,718 (100.0%) |
Real Estate & Mortgages in Hernando County
Real Estate and Mortgage Overview in Hernando County
| Characteristic | Without Mortgage | With Mortgage |
| Housing Units | 28,202 | 35,249 |
| Median Property Value | $181,700 | $232,800 |
| Median Household Income | $50,445 | $4,658 |
| Monthly Housing Costs | $407 | $1,017 |
| Real Estate Taxes | $1,349 | $1,382 |
Property Value by Mortgage Status in Hernando County
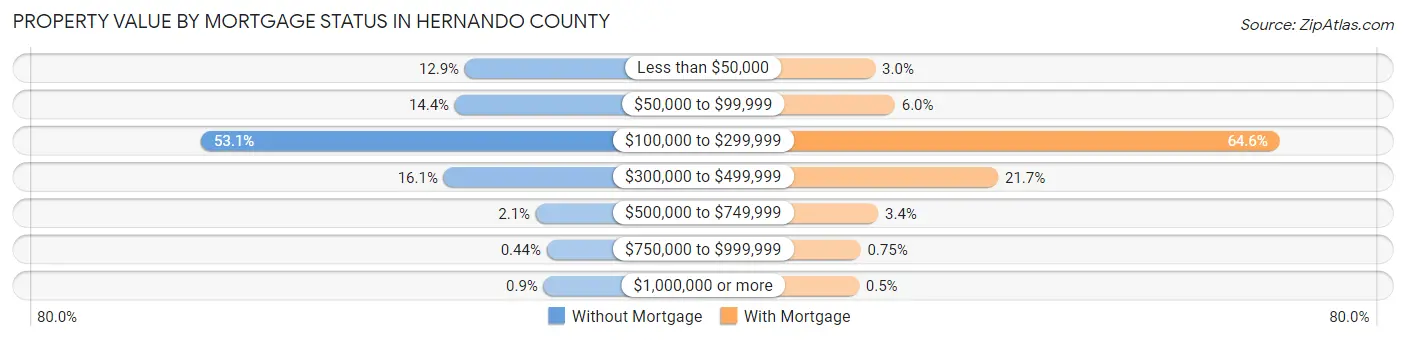
| Property Value | Without Mortgage | With Mortgage |
| Less than $50,000 | 3,637 (12.9%) | 1,053 (3.0%) |
| $50,000 to $99,999 | 4,067 (14.4%) | 2,107 (6.0%) |
| $100,000 to $299,999 | 14,985 (53.1%) | 22,783 (64.6%) |
| $300,000 to $499,999 | 4,548 (16.1%) | 7,653 (21.7%) |
| $500,000 to $749,999 | 587 (2.1%) | 1,212 (3.4%) |
| $750,000 to $999,999 | 124 (0.4%) | 264 (0.7%) |
| $1,000,000 or more | 254 (0.9%) | 177 (0.5%) |
| Total | 28,202 (100.0%) | 35,249 (100.0%) |
Household Income by Mortgage Status in Hernando County
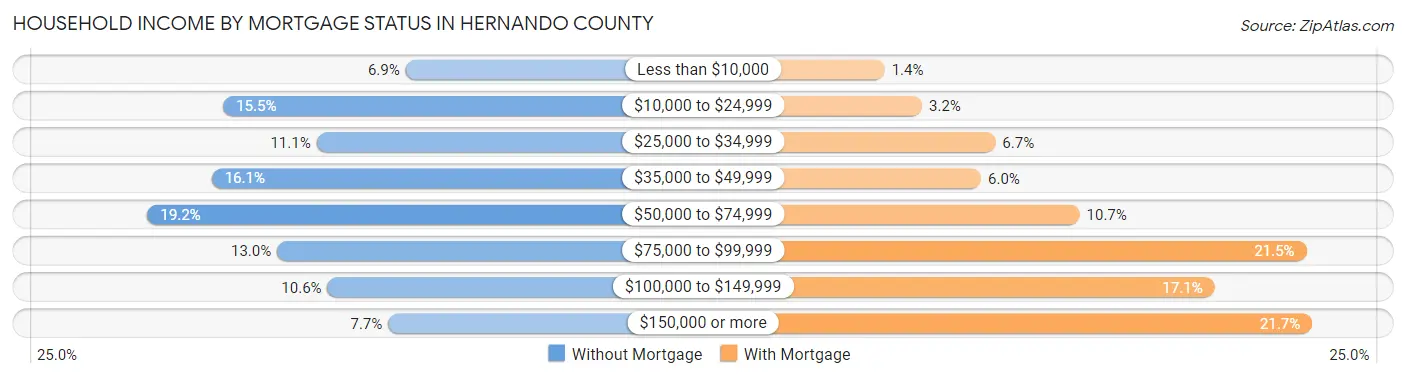
| Household Income | Without Mortgage | With Mortgage |
| Less than $10,000 | 1,935 (6.9%) | 490 (1.4%) |
| $10,000 to $24,999 | 4,383 (15.5%) | 1,116 (3.2%) |
| $25,000 to $34,999 | 3,131 (11.1%) | 2,349 (6.7%) |
| $35,000 to $49,999 | 4,538 (16.1%) | 2,108 (6.0%) |
| $50,000 to $74,999 | 5,400 (19.2%) | 3,760 (10.7%) |
| $75,000 to $99,999 | 3,661 (13.0%) | 7,567 (21.5%) |
| $100,000 to $149,999 | 2,984 (10.6%) | 6,028 (17.1%) |
| $150,000 or more | 2,170 (7.7%) | 7,663 (21.7%) |
| Total | 28,202 (100.0%) | 35,249 (100.0%) |
Property Value to Household Income Ratio in Hernando County
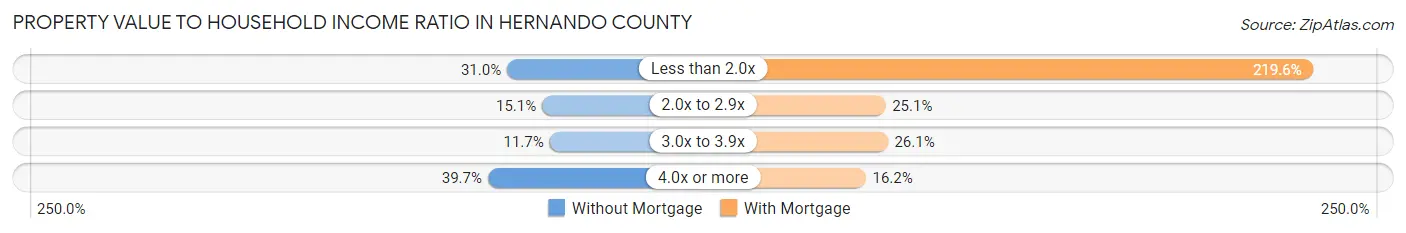
| Value-to-Income Ratio | Without Mortgage | With Mortgage |
| Less than 2.0x | 8,736 (31.0%) | 77,402 (219.6%) |
| 2.0x to 2.9x | 4,246 (15.1%) | 8,852 (25.1%) |
| 3.0x to 3.9x | 3,291 (11.7%) | 9,209 (26.1%) |
| 4.0x or more | 11,193 (39.7%) | 5,699 (16.2%) |
| Total | 28,202 (100.0%) | 35,249 (100.0%) |
Real Estate Taxes by Mortgage Status in Hernando County
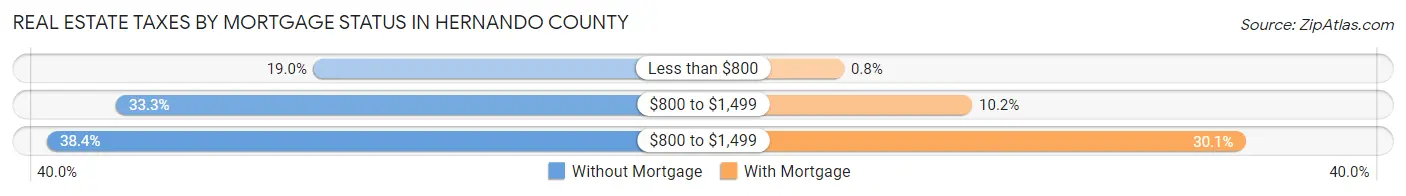
| Property Taxes | Without Mortgage | With Mortgage |
| Less than $800 | 5,345 (19.0%) | 281 (0.8%) |
| $800 to $1,499 | 9,395 (33.3%) | 3,582 (10.2%) |
| $800 to $1,499 | 10,817 (38.4%) | 10,616 (30.1%) |
| Total | 28,202 (100.0%) | 35,249 (100.0%) |
Health & Disability in Hernando County
Health Insurance Coverage by Age in Hernando County
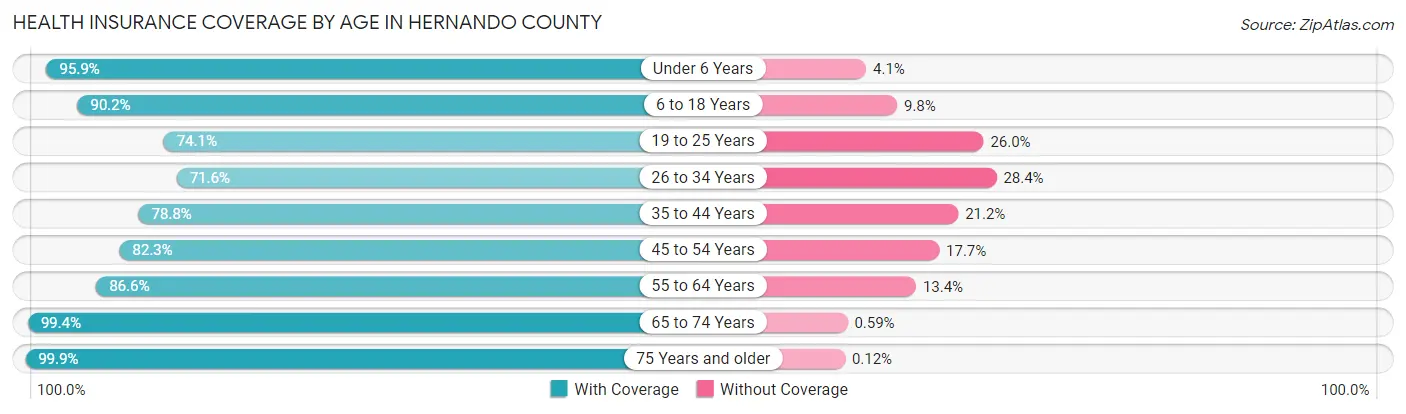
| Age Bracket | With Coverage | Without Coverage |
| Under 6 Years | 9,917 (95.9%) | 421 (4.1%) |
| 6 to 18 Years | 24,867 (90.2%) | 2,715 (9.8%) |
| 19 to 25 Years | 9,894 (74.1%) | 3,467 (26.0%) |
| 26 to 34 Years | 13,392 (71.6%) | 5,303 (28.4%) |
| 35 to 44 Years | 16,324 (78.8%) | 4,403 (21.2%) |
| 45 to 54 Years | 19,299 (82.3%) | 4,144 (17.7%) |
| 55 to 64 Years | 24,641 (86.6%) | 3,799 (13.4%) |
| 65 to 74 Years | 28,296 (99.4%) | 167 (0.6%) |
| 75 Years and older | 23,614 (99.9%) | 29 (0.1%) |
| Total | 170,244 (87.4%) | 24,448 (12.6%) |
Health Insurance Coverage by Citizenship Status in Hernando County

| Citizenship Status | With Coverage | Without Coverage |
| Native Born | 9,917 (95.9%) | 421 (4.1%) |
| Foreign Born, Citizen | 24,867 (90.2%) | 2,715 (9.8%) |
| Foreign Born, not a Citizen | 9,894 (74.1%) | 3,467 (26.0%) |
Health Insurance Coverage by Household Income in Hernando County
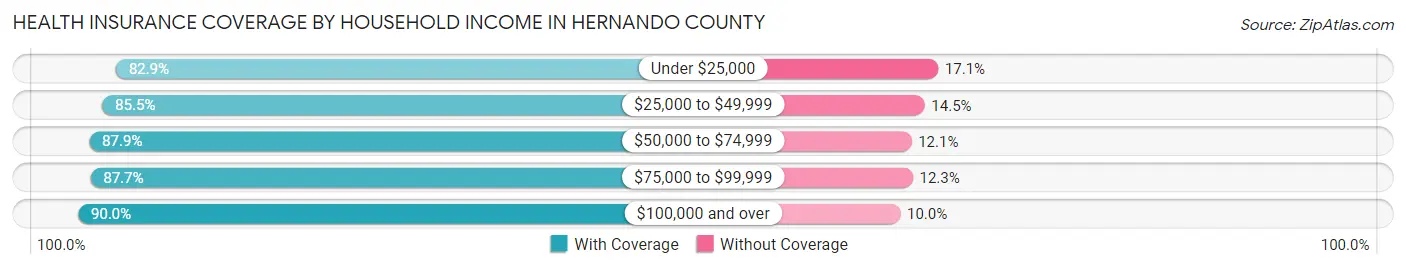
| Household Income | With Coverage | Without Coverage |
| Under $25,000 | 19,781 (82.9%) | 4,074 (17.1%) |
| $25,000 to $49,999 | 32,985 (85.5%) | 5,614 (14.5%) |
| $50,000 to $74,999 | 34,933 (87.9%) | 4,795 (12.1%) |
| $75,000 to $99,999 | 27,244 (87.7%) | 3,824 (12.3%) |
| $100,000 and over | 55,078 (90.0%) | 6,107 (10.0%) |
Public vs Private Health Insurance Coverage by Age in Hernando County
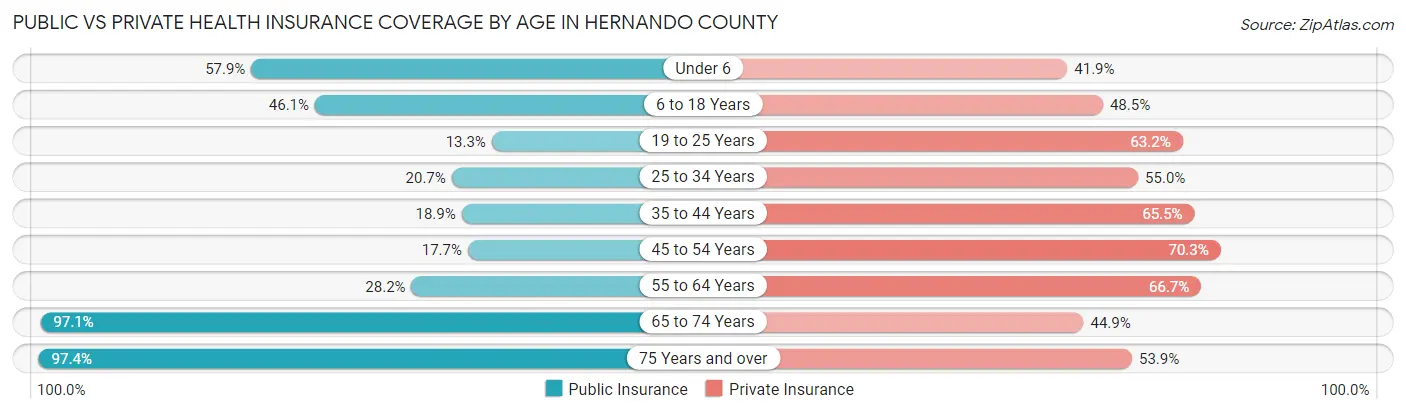
| Age Bracket | Public Insurance | Private Insurance |
| Under 6 | 5,990 (57.9%) | 4,329 (41.9%) |
| 6 to 18 Years | 12,720 (46.1%) | 13,373 (48.5%) |
| 19 to 25 Years | 1,777 (13.3%) | 8,448 (63.2%) |
| 25 to 34 Years | 3,878 (20.7%) | 10,284 (55.0%) |
| 35 to 44 Years | 3,916 (18.9%) | 13,566 (65.4%) |
| 45 to 54 Years | 4,156 (17.7%) | 16,479 (70.3%) |
| 55 to 64 Years | 8,019 (28.2%) | 18,968 (66.7%) |
| 65 to 74 Years | 27,627 (97.1%) | 12,771 (44.9%) |
| 75 Years and over | 23,023 (97.4%) | 12,738 (53.9%) |
| Total | 91,106 (46.8%) | 110,956 (57.0%) |
Disability Status by Sex by Age in Hernando County
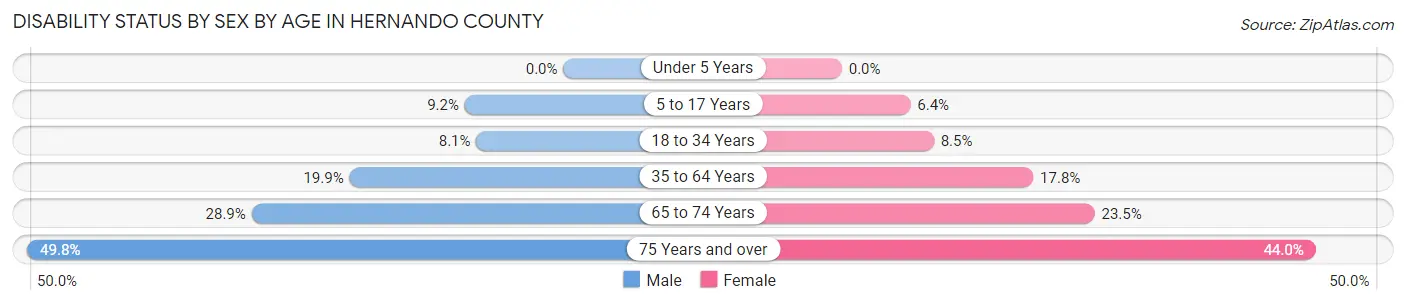
| Age Bracket | Male | Female |
| Under 5 Years | 0 (0.0%) | 0 (0.0%) |
| 5 to 17 Years | 1,280 (9.1%) | 853 (6.4%) |
| 18 to 34 Years | 1,381 (8.1%) | 1,434 (8.5%) |
| 35 to 64 Years | 6,980 (19.9%) | 6,650 (17.8%) |
| 65 to 74 Years | 3,852 (28.9%) | 3,554 (23.5%) |
| 75 Years and over | 5,432 (49.8%) | 5,597 (44.0%) |
Disability Class by Sex by Age in Hernando County
Disability Class: Hearing Difficulty
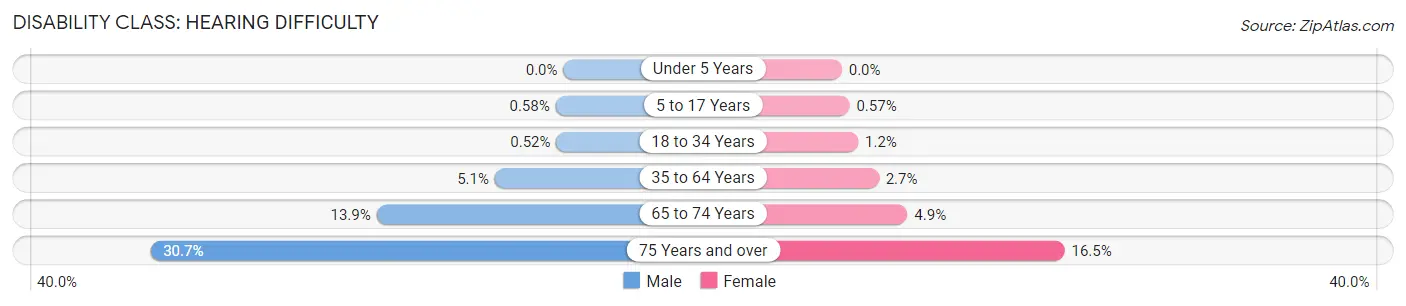
| Age Bracket | Male | Female |
| Under 5 Years | 0 (0.0%) | 0 (0.0%) |
| 5 to 17 Years | 81 (0.6%) | 77 (0.6%) |
| 18 to 34 Years | 89 (0.5%) | 203 (1.2%) |
| 35 to 64 Years | 1,790 (5.1%) | 1,025 (2.7%) |
| 65 to 74 Years | 1,847 (13.9%) | 738 (4.9%) |
| 75 Years and over | 3,348 (30.7%) | 2,105 (16.5%) |
Disability Class: Vision Difficulty
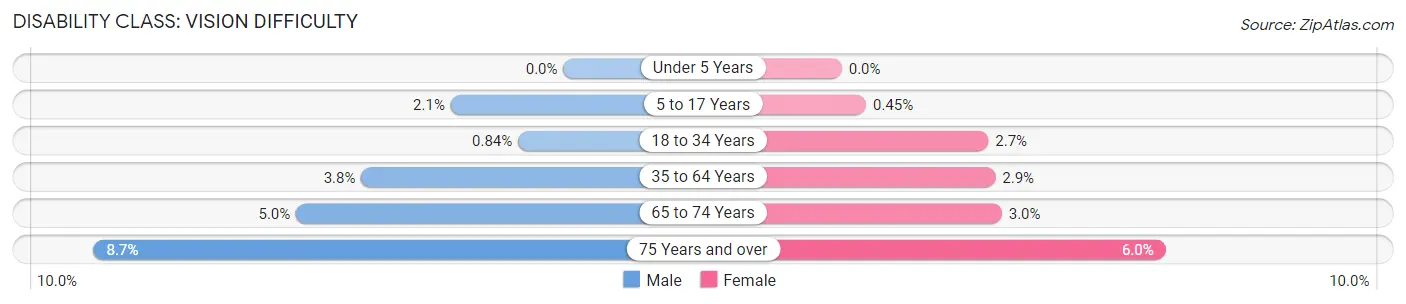
| Age Bracket | Male | Female |
| Under 5 Years | 0 (0.0%) | 0 (0.0%) |
| 5 to 17 Years | 292 (2.1%) | 61 (0.4%) |
| 18 to 34 Years | 143 (0.8%) | 458 (2.7%) |
| 35 to 64 Years | 1,317 (3.7%) | 1,068 (2.9%) |
| 65 to 74 Years | 661 (5.0%) | 450 (3.0%) |
| 75 Years and over | 952 (8.7%) | 765 (6.0%) |
Disability Class: Cognitive Difficulty
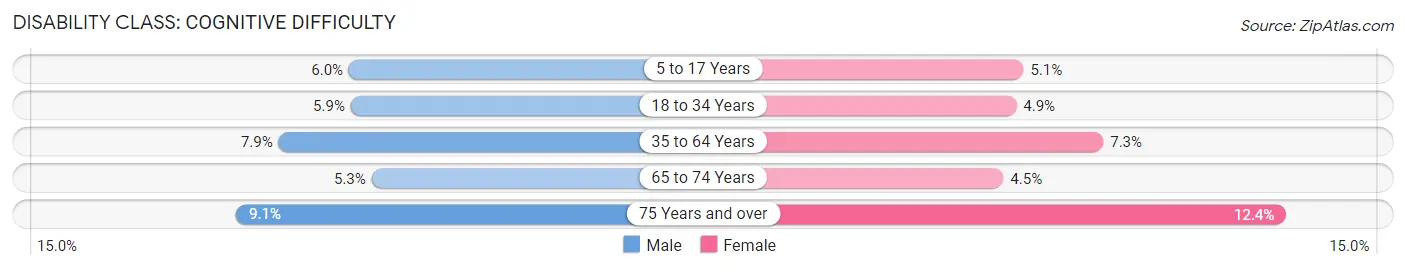
| Age Bracket | Male | Female |
| 5 to 17 Years | 835 (6.0%) | 679 (5.1%) |
| 18 to 34 Years | 1,013 (5.9%) | 817 (4.9%) |
| 35 to 64 Years | 2,788 (7.9%) | 2,728 (7.3%) |
| 65 to 74 Years | 711 (5.3%) | 681 (4.5%) |
| 75 Years and over | 995 (9.1%) | 1,574 (12.4%) |
Disability Class: Ambulatory Difficulty
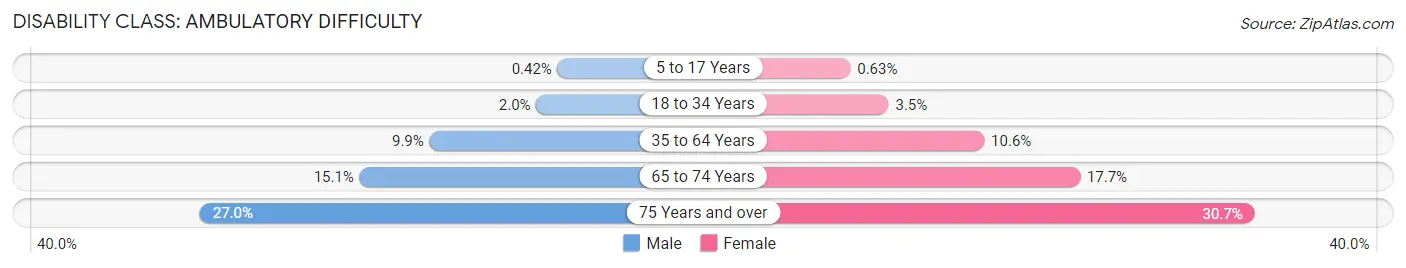
| Age Bracket | Male | Female |
| 5 to 17 Years | 59 (0.4%) | 84 (0.6%) |
| 18 to 34 Years | 343 (2.0%) | 584 (3.5%) |
| 35 to 64 Years | 3,491 (9.9%) | 3,958 (10.6%) |
| 65 to 74 Years | 2,013 (15.1%) | 2,678 (17.7%) |
| 75 Years and over | 2,946 (27.0%) | 3,901 (30.6%) |
Disability Class: Self-Care Difficulty
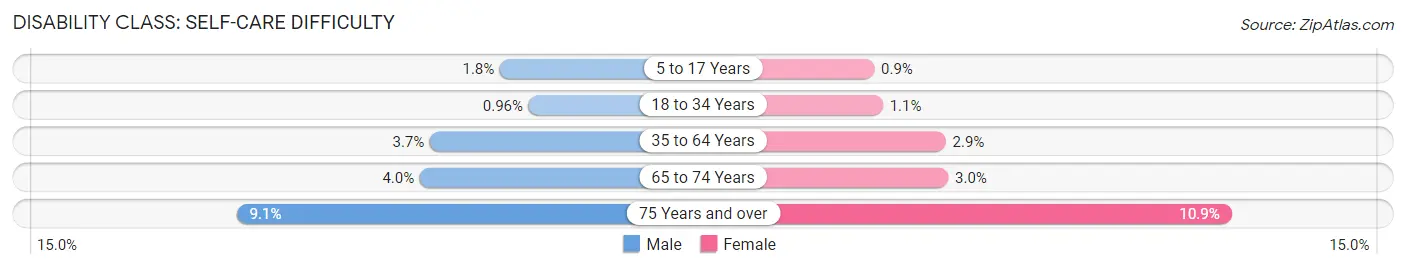
| Age Bracket | Male | Female |
| 5 to 17 Years | 246 (1.8%) | 121 (0.9%) |
| 18 to 34 Years | 164 (1.0%) | 192 (1.1%) |
| 35 to 64 Years | 1,303 (3.7%) | 1,084 (2.9%) |
| 65 to 74 Years | 531 (4.0%) | 449 (3.0%) |
| 75 Years and over | 993 (9.1%) | 1,381 (10.8%) |
Technology Access in Hernando County
Computing Device Access in Hernando County
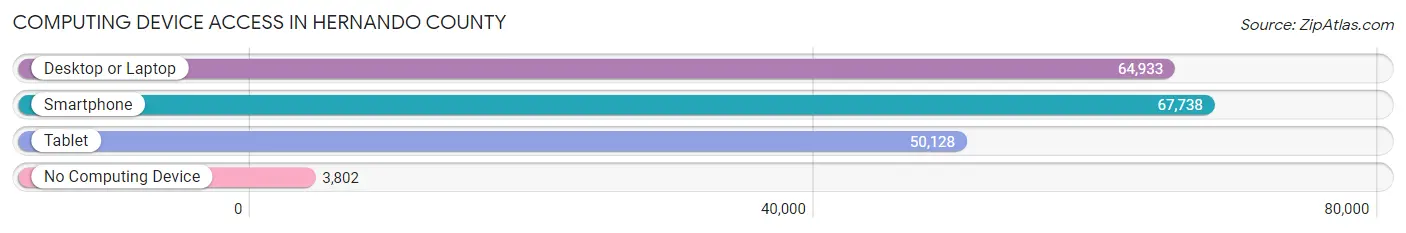
| Device Type | # Households | % Households |
| Desktop or Laptop | 64,933 | 82.0% |
| Smartphone | 67,738 | 85.6% |
| Tablet | 50,128 | 63.3% |
| No Computing Device | 3,802 | 4.8% |
| Total | 79,169 | 100.0% |
Internet Access in Hernando County
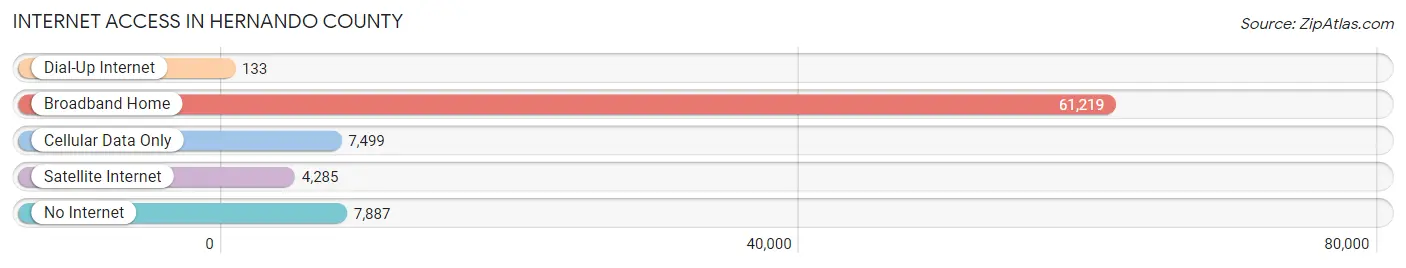
| Internet Type | # Households | % Households |
| Dial-Up Internet | 133 | 0.2% |
| Broadband Home | 61,219 | 77.3% |
| Cellular Data Only | 7,499 | 9.5% |
| Satellite Internet | 4,285 | 5.4% |
| No Internet | 7,887 | 10.0% |
| Total | 79,169 | 100.0% |
Hernando County Summary
Hernando County is located in the west-central part of the U.S. state of Florida. It is part of the Tampa-St. Petersburg-Clearwater Metropolitan Statistical Area. The county seat is Brooksville, and its largest city is Spring Hill. As of the 2010 census, the population was 172,778.
History
Hernando County was created in 1843 from portions of Alachua, Hillsborough, and Orange Counties. It was named for Spanish explorer Hernando de Soto, whose name was also given to the Hernando de Soto Bridge, which crosses the Gulf of Mexico at the entrance to Tampa Bay.
The county was originally part of the vast territory of Florida that was ceded to the United States by Spain in 1821. The county was sparsely populated until the late 19th century, when the area began to be developed for citrus production and other agricultural pursuits.
Geography
Hernando County is located in the west-central part of the state of Florida. It is bordered to the north by Citrus County, to the east by Sumter County, to the south by Pasco County, and to the west by the Gulf of Mexico. The county covers an area of 576 square miles, of which 545 square miles is land and 31 square miles is water.
The county is divided into two distinct geographic regions. The western portion is generally flat and is composed of sandy soils and pine flatwoods. The eastern portion is hilly and is composed of hardwood forests and swamps.
The highest point in the county is the summit of Sugarloaf Mountain, which rises to an elevation of 312 feet above sea level. The county also contains several rivers, including the Withlacoochee, Hillsborough, and Weeki Wachee.
Economy
Hernando County’s economy is largely based on agriculture and tourism. The county is home to several large citrus groves, as well as a number of nurseries and greenhouses. The county is also home to several large resorts, including Weeki Wachee Springs State Park and the Weeki Wachee River.
The county is also home to several manufacturing companies, including a large paper mill in Brooksville. The county is also home to several military installations, including the U.S. Coast Guard Station in Hernando Beach and the U.S. Navy’s Pinellas Training Center in Spring Hill.
Demographics
As of the 2010 census, there were 172,778 people, 68,890 households, and 47,845 families residing in the county. The population density was 315.3 people per square mile. There were 79,890 housing units at an average density of 145.9 per square mile.
The racial makeup of the county was 87.2% White, 8.2% African American, 0.6% Native American, 1.2% Asian, 0.1% Pacific Islander, 1.3% from other races, and 1.6% from two or more races. Hispanic or Latino of any race were 6.7% of the population.
The median income for a household in the county was $41,939, and the median income for a family was $50,890. Males had a median income of $37,845 versus $27,845 for females. The per capita income for the county was $21,845. About 11.2% of families and 14.7% of the population were below the poverty line, including 19.2% of those under age 18 and 8.2% of those age 65 or over.
Common Questions
What is Per Capita Income in Hernando County?
Per Capita income in Hernando County is $31,516.
What is the Median Family Income in Hernando County?
Median Family Income in Hernando County is $69,993.
What is the Median Household income in Hernando County?
Median Household Income in Hernando County is $59,202.
What is Income or Wage Gap in Hernando County?
Income or Wage Gap in Hernando County is 27.6%.
Women in Hernando County earn 72.4 cents for every dollar earned by a man.
What is Family Income Deficit in Hernando County?
Family Income Deficit in Hernando County is $10,811.
Families that are below poverty line in Hernando County earn $10,811 less on average than the poverty threshold level.
What is Inequality or Gini Index in Hernando County?
Inequality or Gini Index in Hernando County is 0.43.
What is the Total Population of Hernando County?
Total Population of Hernando County is 196,621.
What is the Total Male Population of Hernando County?
Total Male Population of Hernando County is 95,719.
What is the Total Female Population of Hernando County?
Total Female Population of Hernando County is 100,902.
What is the Ratio of Males per 100 Females in Hernando County?
There are 94.86 Males per 100 Females in Hernando County.
What is the Ratio of Females per 100 Males in Hernando County?
There are 105.41 Females per 100 Males in Hernando County.
What is the Median Population Age in Hernando County?
Median Population Age in Hernando County is 48.5 Years.
What is the Average Family Size in Hernando County
Average Family Size in Hernando County is 2.9 People.
What is the Average Household Size in Hernando County
Average Household Size in Hernando County is 2.5 People.
How Large is the Labor Force in Hernando County?
There are 83,879 People in the Labor Forcein in Hernando County.
What is the Percentage of People in the Labor Force in Hernando County?
50.9% of People are in the Labor Force in Hernando County.
What is the Unemployment Rate in Hernando County?
Unemployment Rate in Hernando County is 5.9%.