Palm Beach County, FL Map & Demographics
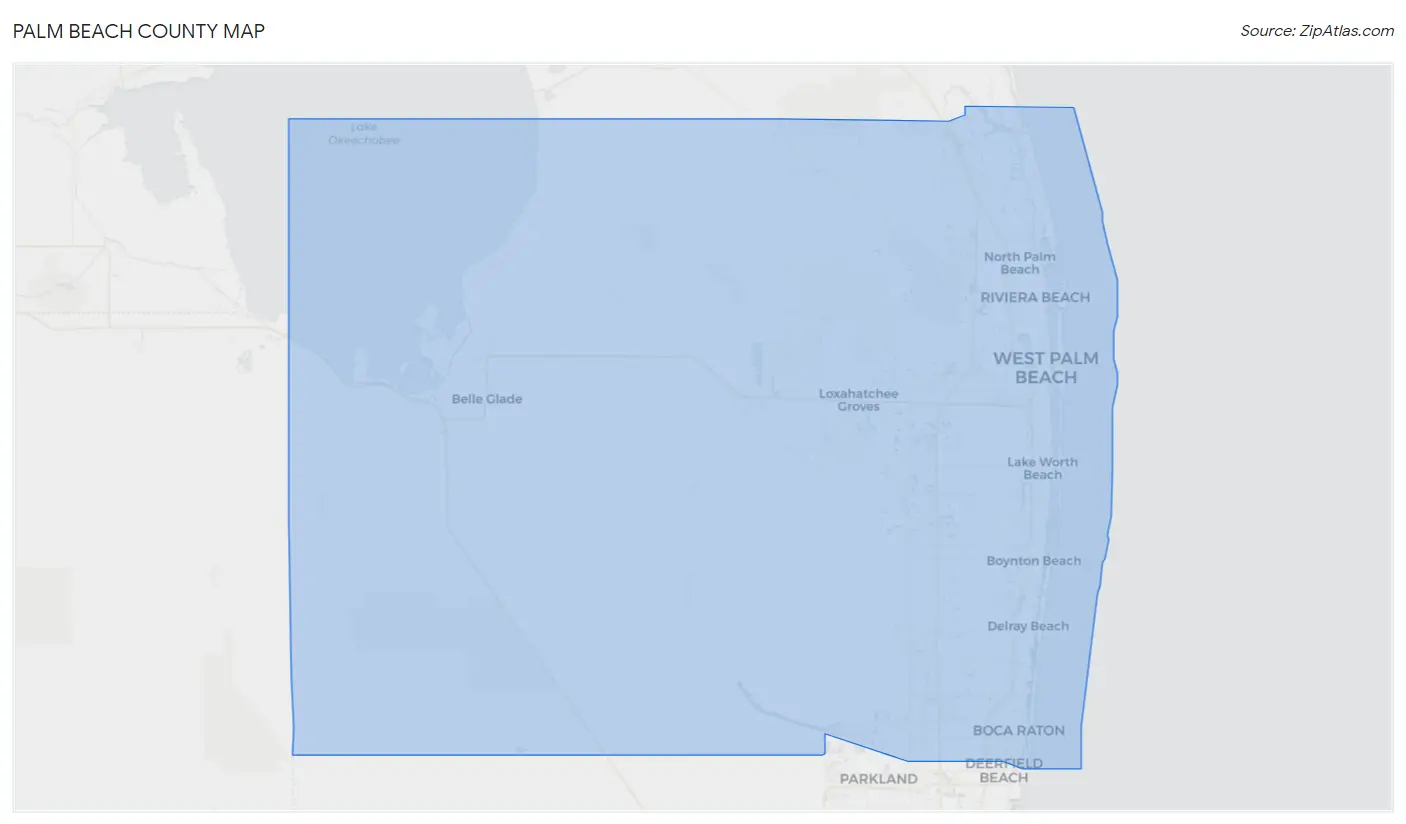
Palm Beach County Map
Palm Beach County Overview
$48,121
PER CAPITA INCOME
$93,221
AVG FAMILY INCOME
$76,066
AVG HOUSEHOLD INCOME
25.4%
WAGE / INCOME GAP [ % ]
74.6¢/ $1
WAGE / INCOME GAP [ $ ]
$10,683
FAMILY INCOME DEFICIT
0.52
INEQUALITY / GINI INDEX
1,494,805
TOTAL POPULATION
729,568
MALE POPULATION
765,237
FEMALE POPULATION
95.34
MALES / 100 FEMALES
104.89
FEMALES / 100 MALES
45.2
MEDIAN AGE
3.1
AVG FAMILY SIZE
2.5
AVG HOUSEHOLD SIZE
741,845
LABOR FORCE [ PEOPLE ]
59.5%
PERCENT IN LABOR FORCE
5.8%
UNEMPLOYMENT RATE
Palm Beach County Area Codes
Income in Palm Beach County
Income Overview in Palm Beach County
Per Capita Income in Palm Beach County is $48,121, while median incomes of families and households are $93,221 and $76,066 respectively.
| Characteristic | Number | Measure |
| Per Capita Income | 1,494,805 | $48,121 |
| Median Family Income | 368,569 | $93,221 |
| Mean Family Income | 368,569 | $138,562 |
| Median Household Income | 589,594 | $76,066 |
| Mean Household Income | 589,594 | $117,712 |
| Income Deficit | 368,569 | $10,683 |
| Wage / Income Gap (%) | 1,494,805 | 25.43% |
| Wage / Income Gap ($) | 1,494,805 | 74.57¢ per $1 |
| Gini / Inequality Index | 1,494,805 | 0.52 |
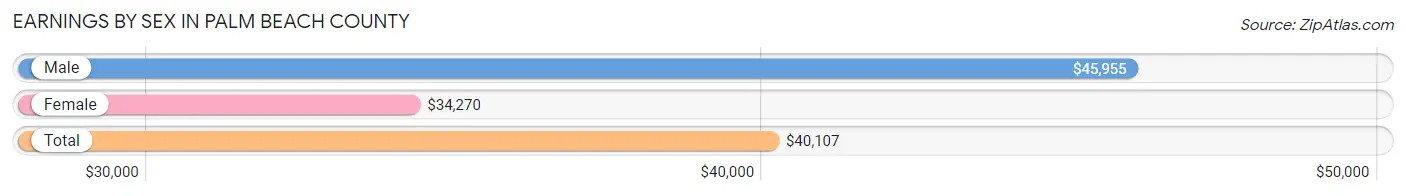
Earnings by Sex in Palm Beach County
Average Earnings in Palm Beach County are $40,107, $45,955 for men and $34,270 for women, a difference of 25.4%.
| Sex | Number | Average Earnings |
| Male | 404,566 (53.0%) | $45,955 |
| Female | 358,799 (47.0%) | $34,270 |
| Total | 763,365 (100.0%) | $40,107 |
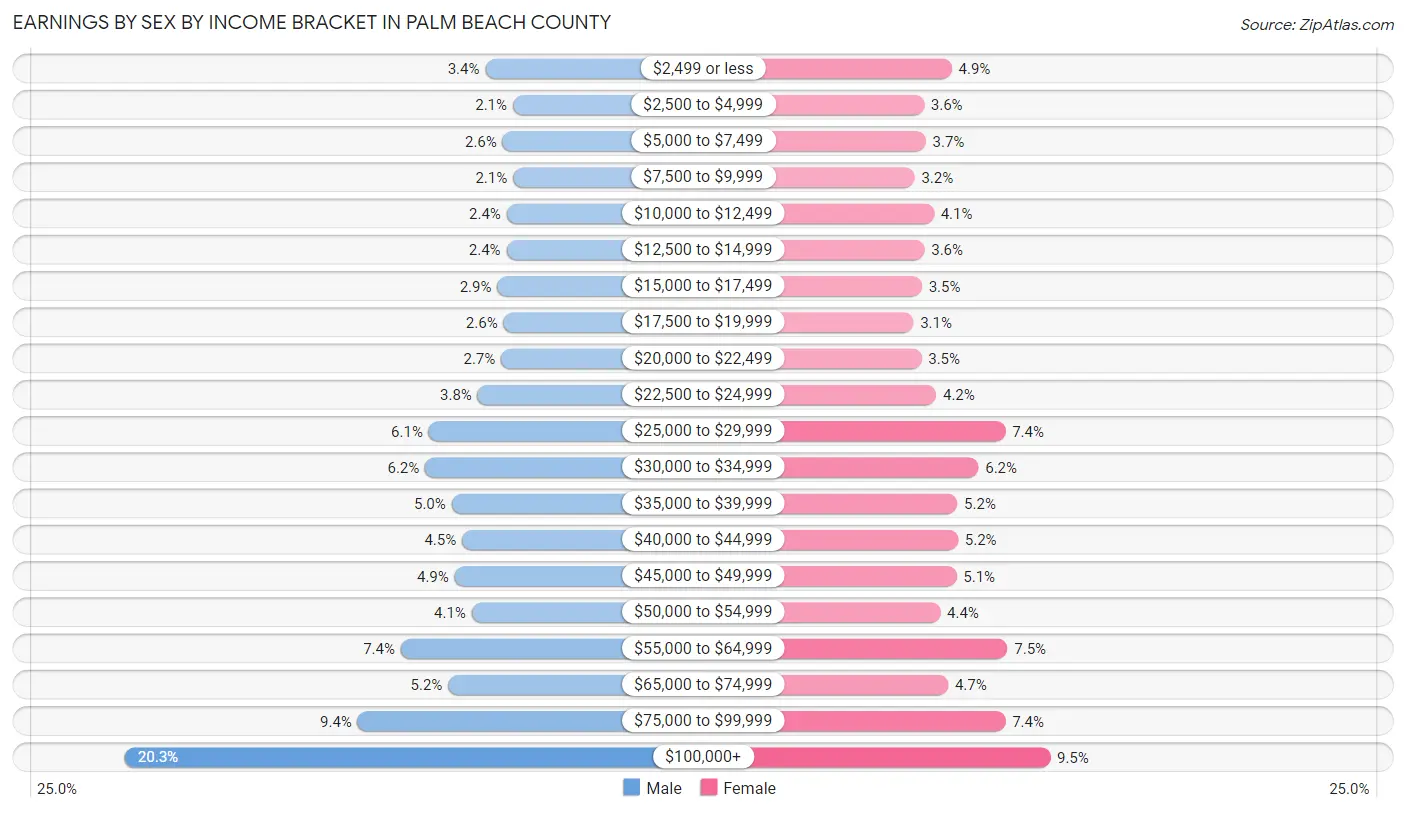
Earnings by Sex by Income Bracket in Palm Beach County
The most common earnings brackets in Palm Beach County are $100,000+ for men (82,108 | 20.3%) and $100,000+ for women (34,145 | 9.5%).
| Income | Male | Female |
| $2,499 or less | 13,822 (3.4%) | 17,632 (4.9%) |
| $2,500 to $4,999 | 8,629 (2.1%) | 12,940 (3.6%) |
| $5,000 to $7,499 | 10,571 (2.6%) | 13,225 (3.7%) |
| $7,500 to $9,999 | 8,584 (2.1%) | 11,366 (3.2%) |
| $10,000 to $12,499 | 9,795 (2.4%) | 14,597 (4.1%) |
| $12,500 to $14,999 | 9,831 (2.4%) | 13,032 (3.6%) |
| $15,000 to $17,499 | 11,589 (2.9%) | 12,578 (3.5%) |
| $17,500 to $19,999 | 10,416 (2.6%) | 11,146 (3.1%) |
| $20,000 to $22,499 | 10,827 (2.7%) | 12,523 (3.5%) |
| $22,500 to $24,999 | 15,278 (3.8%) | 14,985 (4.2%) |
| $25,000 to $29,999 | 24,549 (6.1%) | 26,632 (7.4%) |
| $30,000 to $34,999 | 25,258 (6.2%) | 22,106 (6.2%) |
| $35,000 to $39,999 | 20,240 (5.0%) | 18,557 (5.2%) |
| $40,000 to $44,999 | 18,245 (4.5%) | 18,643 (5.2%) |
| $45,000 to $49,999 | 19,644 (4.9%) | 18,423 (5.1%) |
| $50,000 to $54,999 | 16,422 (4.1%) | 15,664 (4.4%) |
| $55,000 to $64,999 | 29,864 (7.4%) | 26,989 (7.5%) |
| $65,000 to $74,999 | 20,883 (5.2%) | 17,000 (4.7%) |
| $75,000 to $99,999 | 38,011 (9.4%) | 26,616 (7.4%) |
| $100,000+ | 82,108 (20.3%) | 34,145 (9.5%) |
| Total | 404,566 (100.0%) | 358,799 (100.0%) |
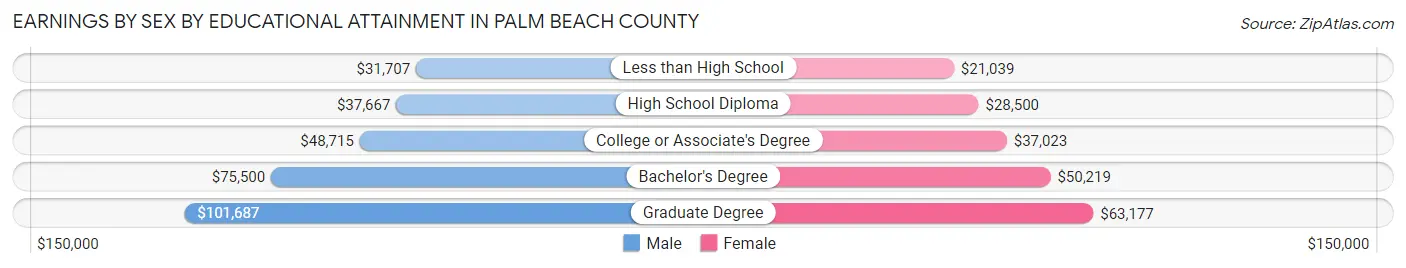
Earnings by Sex by Educational Attainment in Palm Beach County
Average earnings in Palm Beach County are $51,256 for men and $39,237 for women, a difference of 23.4%. Men with an educational attainment of graduate degree enjoy the highest average annual earnings of $101,687, while those with less than high school education earn the least with $31,707. Women with an educational attainment of graduate degree earn the most with the average annual earnings of $63,177, while those with less than high school education have the smallest earnings of $21,039.
| Educational Attainment | Male Income | Female Income |
| Less than High School | $31,707 | $21,039 |
| High School Diploma | $37,667 | $28,500 |
| College or Associate's Degree | $48,715 | $37,023 |
| Bachelor's Degree | $75,500 | $50,219 |
| Graduate Degree | $101,687 | $63,177 |
| Total | $51,256 | $39,237 |
Family Income in Palm Beach County
Family Income Brackets in Palm Beach County
According to the Palm Beach County family income data, there are 71,502 families falling into the $100,000 to $149,999 income range, which is the most common income bracket and makes up 19.4% of all families. Conversely, the $10,000 to $14,999 income bracket is the least frequent group with only 5,897 families (1.6%) belonging to this category.
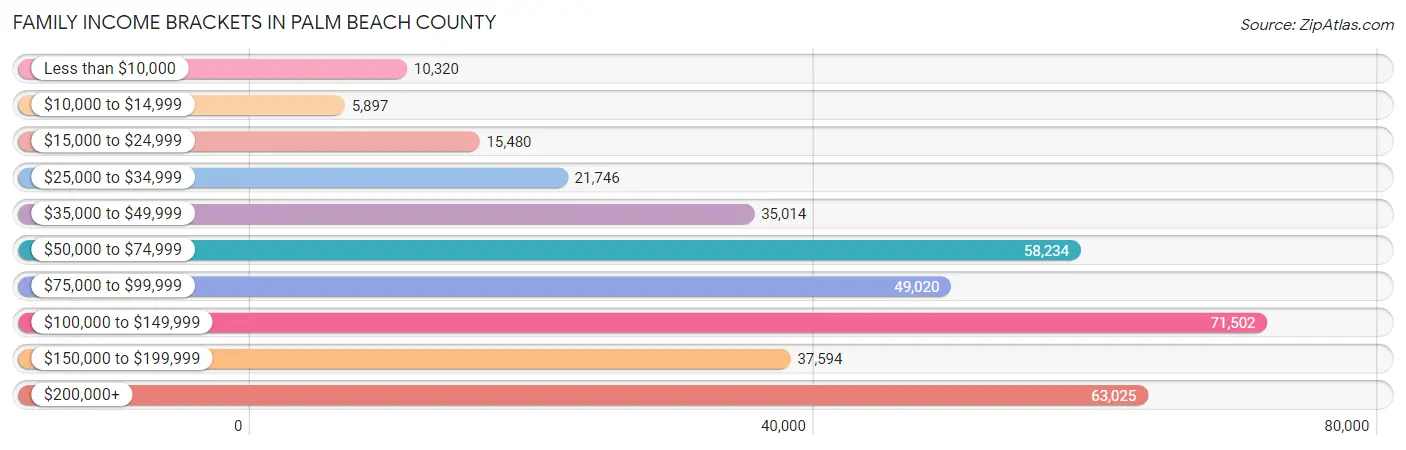
| Income Bracket | # Families | % Families |
| Less than $10,000 | 10,320 | 2.8% |
| $10,000 to $14,999 | 5,897 | 1.6% |
| $15,000 to $24,999 | 15,480 | 4.2% |
| $25,000 to $34,999 | 21,746 | 5.9% |
| $35,000 to $49,999 | 35,014 | 9.5% |
| $50,000 to $74,999 | 58,234 | 15.8% |
| $75,000 to $99,999 | 49,020 | 13.3% |
| $100,000 to $149,999 | 71,502 | 19.4% |
| $150,000 to $199,999 | 37,594 | 10.2% |
| $200,000+ | 63,025 | 17.1% |
Family Income by Famaliy Size in Palm Beach County
4-person families (58,680 | 15.9%) account for the highest median family income in Palm Beach County with $112,535 per family, while 2-person families (191,144 | 51.9%) have the highest median income of $43,393 per family member.
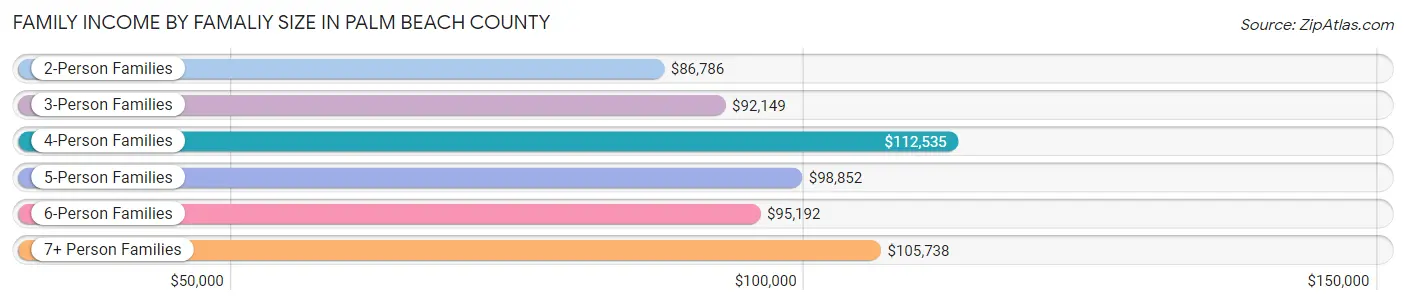
| Income Bracket | # Families | Median Income |
| 2-Person Families | 191,144 (51.9%) | $86,786 |
| 3-Person Families | 77,655 (21.1%) | $92,149 |
| 4-Person Families | 58,680 (15.9%) | $112,535 |
| 5-Person Families | 27,433 (7.4%) | $98,852 |
| 6-Person Families | 8,739 (2.4%) | $95,192 |
| 7+ Person Families | 4,918 (1.3%) | $105,738 |
| Total | 368,569 (100.0%) | $93,221 |
Family Income by Number of Earners in Palm Beach County
The median family income in Palm Beach County is $93,221, with families comprising 3+ earners (40,655) having the highest median family income of $127,212, while families with no earners (72,097) have the lowest median family income of $65,116, accounting for 11.0% and 19.6% of families, respectively.
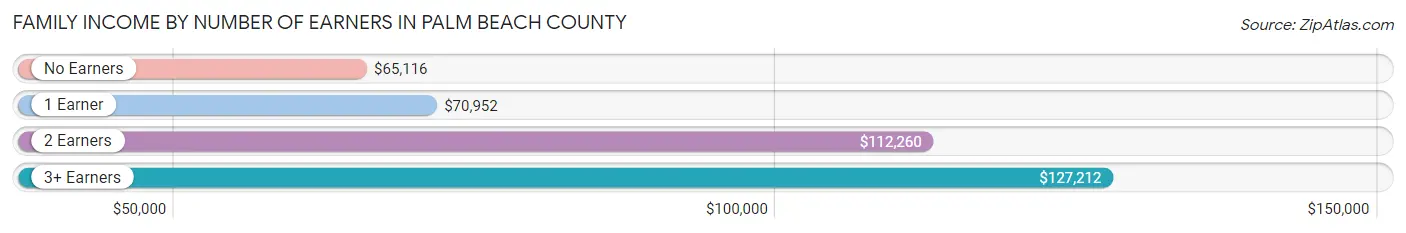
| Number of Earners | # Families | Median Income |
| No Earners | 72,097 (19.6%) | $65,116 |
| 1 Earner | 113,956 (30.9%) | $70,952 |
| 2 Earners | 141,861 (38.5%) | $112,260 |
| 3+ Earners | 40,655 (11.0%) | $127,212 |
| Total | 368,569 (100.0%) | $93,221 |
Household Income in Palm Beach County
Household Income Brackets in Palm Beach County
With 98,462 households falling in the category, the $100,000 to $149,999 income range is the most frequent in Palm Beach County, accounting for 16.7% of all households. In contrast, only 17,688 households (3.0%) fall into the $10,000 to $14,999 income bracket, making it the least populous group.
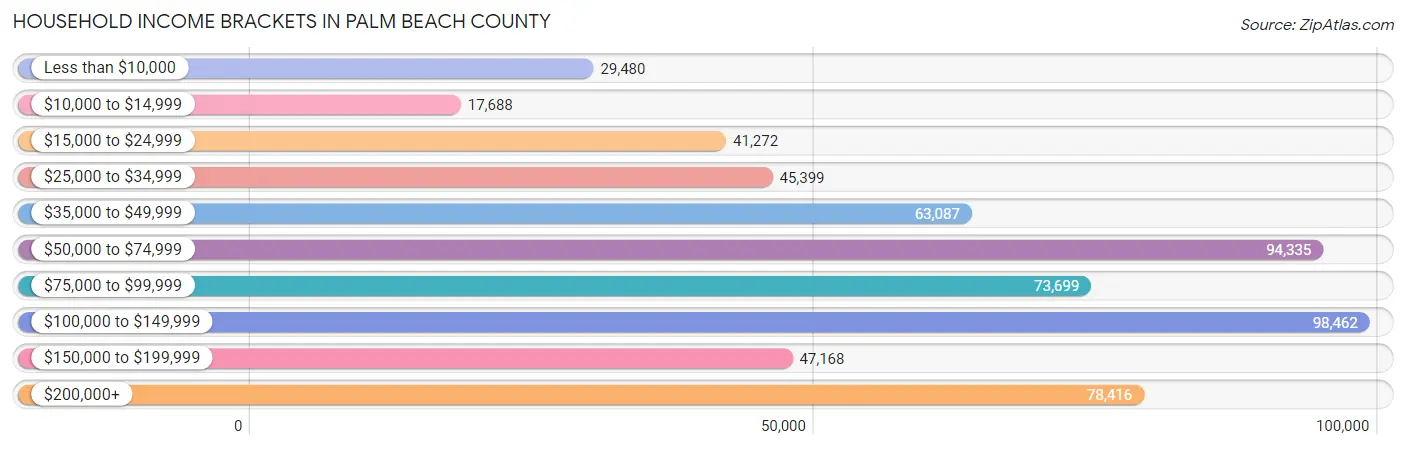
| Income Bracket | # Households | % Households |
| Less than $10,000 | 29,480 | 5.0% |
| $10,000 to $14,999 | 17,688 | 3.0% |
| $15,000 to $24,999 | 41,272 | 7.0% |
| $25,000 to $34,999 | 45,399 | 7.7% |
| $35,000 to $49,999 | 63,087 | 10.7% |
| $50,000 to $74,999 | 94,335 | 16.0% |
| $75,000 to $99,999 | 73,699 | 12.5% |
| $100,000 to $149,999 | 98,462 | 16.7% |
| $150,000 to $199,999 | 47,168 | 8.0% |
| $200,000+ | 78,416 | 13.3% |
Household Income by Householder Age in Palm Beach County
The median household income in Palm Beach County is $76,066, with the highest median household income of $91,201 found in the 45 to 64 years age bracket for the primary householder. A total of 210,604 households (35.7%) fall into this category. Meanwhile, the 15 to 24 years age bracket for the primary householder has the lowest median household income of $45,512, with 10,925 households (1.8%) in this group.
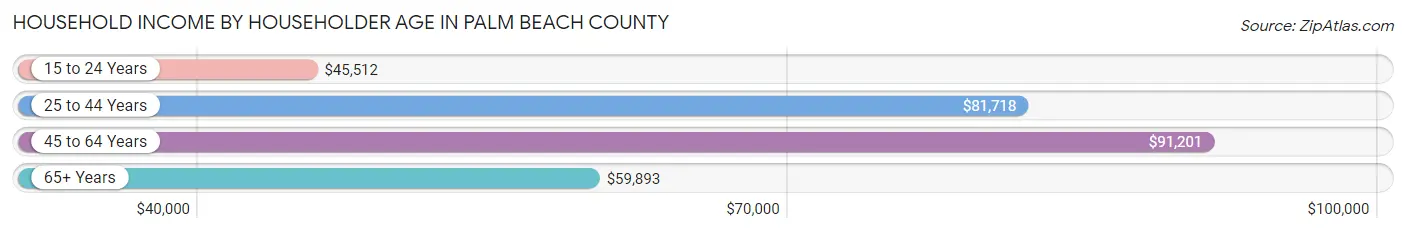
| Income Bracket | # Households | Median Income |
| 15 to 24 Years | 10,925 (1.8%) | $45,512 |
| 25 to 44 Years | 144,005 (24.4%) | $81,718 |
| 45 to 64 Years | 210,604 (35.7%) | $91,201 |
| 65+ Years | 224,060 (38.0%) | $59,893 |
| Total | 589,594 (100.0%) | $76,066 |
Poverty in Palm Beach County
Income Below Poverty by Sex and Age in Palm Beach County
With 10.1% poverty level for males and 12.6% for females among the residents of Palm Beach County, under 5 year old males and 15 year old females are the most vulnerable to poverty, with 6,592 males (18.0%) and 1,522 females (17.9%) in their respective age groups living below the poverty level.
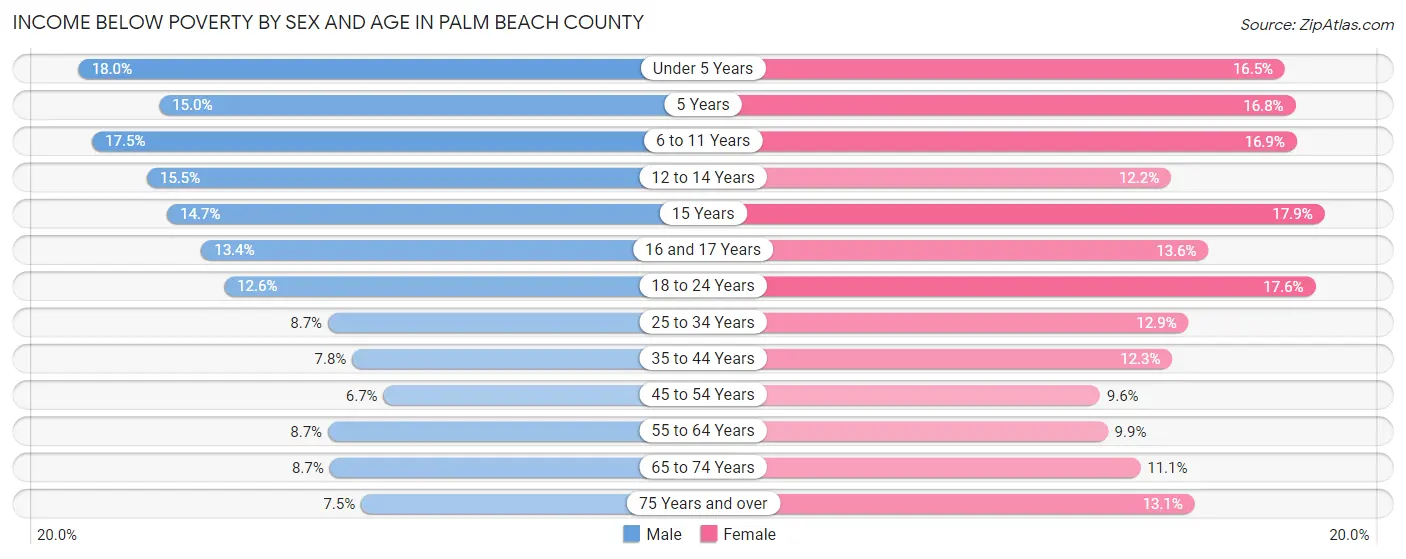
| Age Bracket | Male | Female |
| Under 5 Years | 6,592 (18.0%) | 5,782 (16.5%) |
| 5 Years | 1,108 (15.0%) | 1,126 (16.8%) |
| 6 to 11 Years | 8,211 (17.5%) | 7,489 (16.9%) |
| 12 to 14 Years | 3,748 (15.5%) | 3,007 (12.2%) |
| 15 Years | 1,269 (14.7%) | 1,522 (17.9%) |
| 16 and 17 Years | 2,276 (13.4%) | 2,185 (13.6%) |
| 18 to 24 Years | 7,000 (12.6%) | 9,118 (17.6%) |
| 25 to 34 Years | 7,620 (8.7%) | 10,917 (12.9%) |
| 35 to 44 Years | 6,736 (7.8%) | 10,606 (12.3%) |
| 45 to 54 Years | 6,102 (6.7%) | 8,969 (9.6%) |
| 55 to 64 Years | 8,415 (8.7%) | 10,167 (9.9%) |
| 65 to 74 Years | 6,925 (8.7%) | 10,549 (11.1%) |
| 75 Years and over | 5,960 (7.5%) | 13,539 (13.1%) |
| Total | 71,962 (10.1%) | 94,976 (12.6%) |
Income Above Poverty by Sex and Age in Palm Beach County
According to the poverty statistics in Palm Beach County, males aged 45 to 54 years and females aged 45 to 54 years are the age groups that are most secure financially, with 93.3% of males and 90.4% of females in these age groups living above the poverty line.
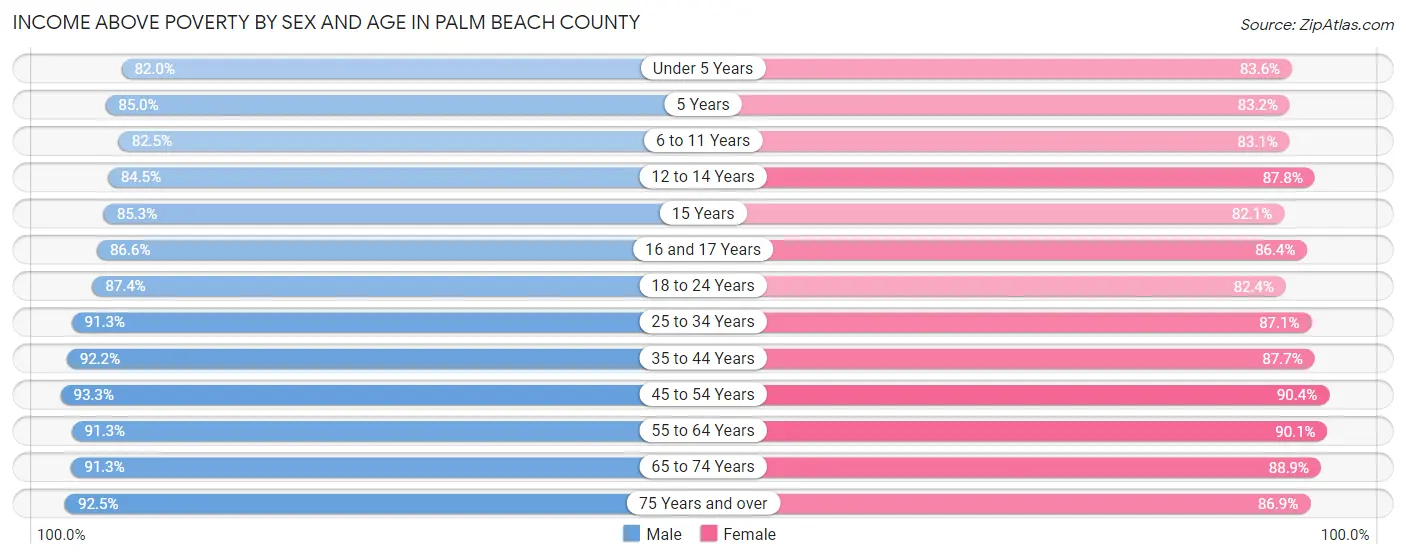
| Age Bracket | Male | Female |
| Under 5 Years | 30,048 (82.0%) | 29,366 (83.6%) |
| 5 Years | 6,277 (85.0%) | 5,562 (83.2%) |
| 6 to 11 Years | 38,733 (82.5%) | 36,854 (83.1%) |
| 12 to 14 Years | 20,502 (84.5%) | 21,594 (87.8%) |
| 15 Years | 7,359 (85.3%) | 6,971 (82.1%) |
| 16 and 17 Years | 14,655 (86.6%) | 13,871 (86.4%) |
| 18 to 24 Years | 48,616 (87.4%) | 42,745 (82.4%) |
| 25 to 34 Years | 79,609 (91.3%) | 73,917 (87.1%) |
| 35 to 44 Years | 79,186 (92.2%) | 75,816 (87.7%) |
| 45 to 54 Years | 85,233 (93.3%) | 84,626 (90.4%) |
| 55 to 64 Years | 87,834 (91.3%) | 92,864 (90.1%) |
| 65 to 74 Years | 72,835 (91.3%) | 84,691 (88.9%) |
| 75 Years and over | 73,446 (92.5%) | 89,790 (86.9%) |
| Total | 644,333 (89.9%) | 658,667 (87.4%) |
Income Below Poverty Among Married-Couple Families in Palm Beach County
The poverty statistics for married-couple families in Palm Beach County show that 4.9% or 13,297 of the total 269,675 families live below the poverty line. Families with 5 or more children have the highest poverty rate of 30.9%, comprising of 332 families. On the other hand, families with no children have the lowest poverty rate of 4.3%, which includes 7,609 families.
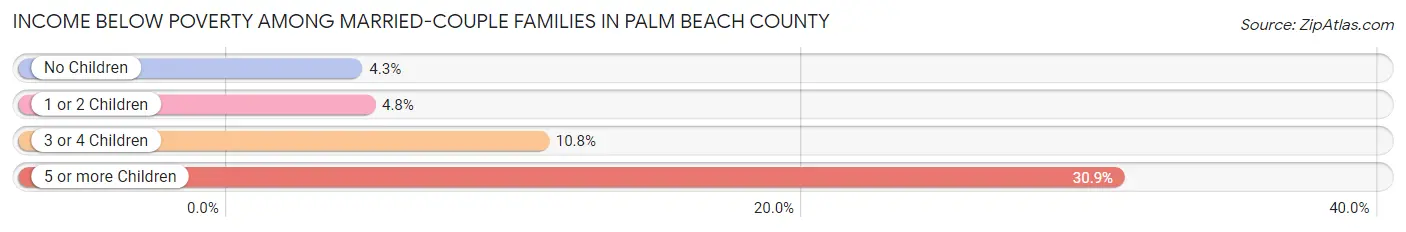
| Children | Above Poverty | Below Poverty |
| No Children | 168,166 (95.7%) | 7,609 (4.3%) |
| 1 or 2 Children | 73,747 (95.2%) | 3,692 (4.8%) |
| 3 or 4 Children | 13,722 (89.2%) | 1,664 (10.8%) |
| 5 or more Children | 743 (69.1%) | 332 (30.9%) |
| Total | 256,378 (95.1%) | 13,297 (4.9%) |
Income Below Poverty Among Single-Parent Households in Palm Beach County
According to the poverty data in Palm Beach County, 9.9% or 3,028 single-father households and 18.6% or 12,723 single-mother households are living below the poverty line. Among single-father households, those with 3 or 4 children have the highest poverty rate, with 658 households (25.7%) experiencing poverty. Likewise, among single-mother households, those with 5 or more children have the highest poverty rate, with 402 households (64.9%) falling below the poverty line.
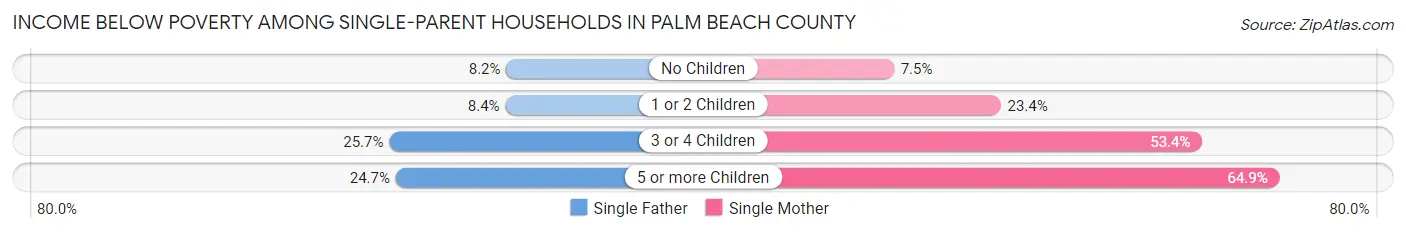
| Children | Single Father | Single Mother |
| No Children | 1,163 (8.2%) | 2,435 (7.5%) |
| 1 or 2 Children | 1,128 (8.4%) | 6,882 (23.4%) |
| 3 or 4 Children | 658 (25.7%) | 3,004 (53.4%) |
| 5 or more Children | 79 (24.7%) | 402 (64.9%) |
| Total | 3,028 (9.9%) | 12,723 (18.6%) |
Income Below Poverty Among Married-Couple vs Single-Parent Households in Palm Beach County
The poverty data for Palm Beach County shows that 13,297 of the married-couple family households (4.9%) and 15,751 of the single-parent households (15.9%) are living below the poverty level. Within the married-couple family households, those with 5 or more children have the highest poverty rate, with 332 households (30.9%) falling below the poverty line. Among the single-parent households, those with 5 or more children have the highest poverty rate, with 481 household (51.2%) living below poverty.
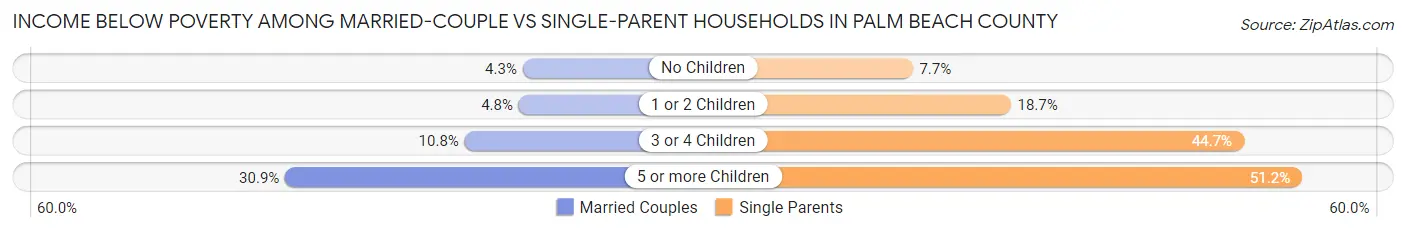
| Children | Married-Couple Families | Single-Parent Households |
| No Children | 7,609 (4.3%) | 3,598 (7.7%) |
| 1 or 2 Children | 3,692 (4.8%) | 8,010 (18.6%) |
| 3 or 4 Children | 1,664 (10.8%) | 3,662 (44.7%) |
| 5 or more Children | 332 (30.9%) | 481 (51.2%) |
| Total | 13,297 (4.9%) | 15,751 (15.9%) |
Race in Palm Beach County
The most populous races in Palm Beach County are White / Caucasian (919,163 | 61.5%), Hispanic or Latino (350,700 | 23.5%), and Black / African American (276,750 | 18.5%).
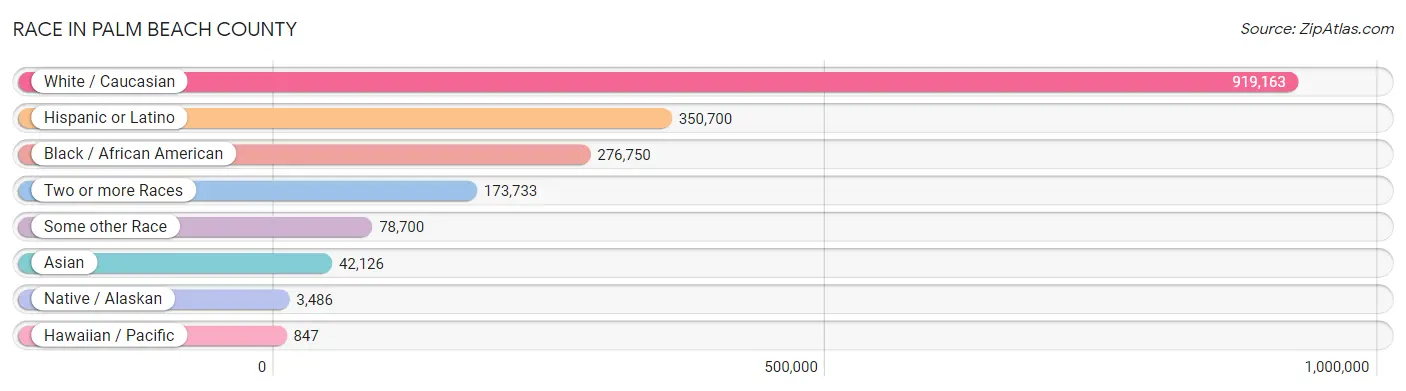
| Race | # Population | % Population |
| Asian | 42,126 | 2.8% |
| Black / African American | 276,750 | 18.5% |
| Hawaiian / Pacific | 847 | 0.1% |
| Hispanic or Latino | 350,700 | 23.5% |
| Native / Alaskan | 3,486 | 0.2% |
| White / Caucasian | 919,163 | 61.5% |
| Two or more Races | 173,733 | 11.6% |
| Some other Race | 78,700 | 5.3% |
| Total | 1,494,805 | 100.0% |
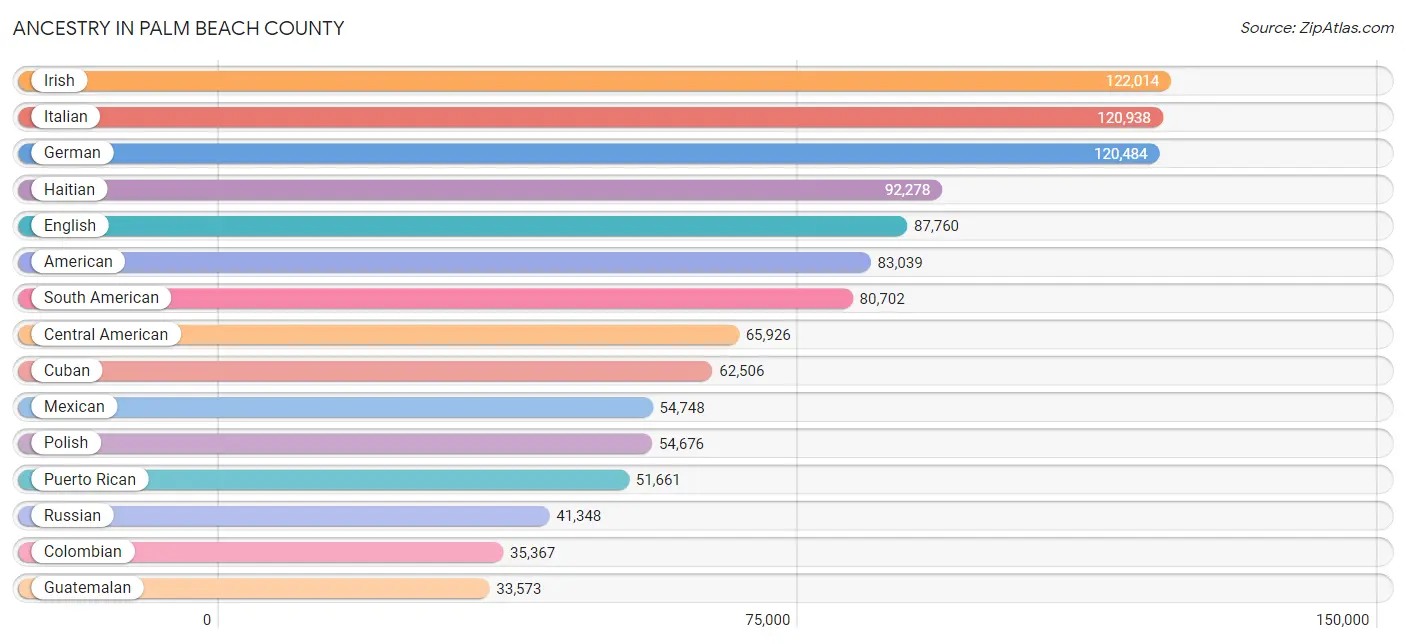
Ancestry in Palm Beach County
The most populous ancestries reported in Palm Beach County are Irish (122,014 | 8.2%), Italian (120,938 | 8.1%), German (120,484 | 8.1%), Haitian (92,278 | 6.2%), and English (87,760 | 5.9%), together accounting for 36.4% of all Palm Beach County residents.
| Ancestry | # Population | % Population |
| Afghan | 45 | 0.0% |
| African | 18,257 | 1.2% |
| Albanian | 895 | 0.1% |
| Aleut | 7 | 0.0% |
| Alsatian | 61 | 0.0% |
| American | 83,039 | 5.6% |
| Apache | 191 | 0.0% |
| Arab | 10,683 | 0.7% |
| Argentinean | 5,608 | 0.4% |
| Armenian | 1,524 | 0.1% |
| Assyrian / Chaldean / Syriac | 50 | 0.0% |
| Australian | 593 | 0.0% |
| Austrian | 7,909 | 0.5% |
| Bahamian | 3,440 | 0.2% |
| Barbadian | 577 | 0.0% |
| Basque | 123 | 0.0% |
| Belgian | 1,183 | 0.1% |
| Belizean | 439 | 0.0% |
| Bermudan | 23 | 0.0% |
| Bhutanese | 2,272 | 0.2% |
| Blackfeet | 360 | 0.0% |
| Bolivian | 1,405 | 0.1% |
| Brazilian | 14,048 | 0.9% |
| British | 6,731 | 0.4% |
| British West Indian | 887 | 0.1% |
| Bulgarian | 908 | 0.1% |
| Burmese | 2,923 | 0.2% |
| Cajun | 74 | 0.0% |
| Canadian | 5,853 | 0.4% |
| Cape Verdean | 44 | 0.0% |
| Carpatho Rusyn | 12 | 0.0% |
| Celtic | 194 | 0.0% |
| Central American | 65,926 | 4.4% |
| Central American Indian | 2,823 | 0.2% |
| Cherokee | 2,254 | 0.2% |
| Cheyenne | 28 | 0.0% |
| Chickasaw | 23 | 0.0% |
| Chilean | 2,420 | 0.2% |
| Chinese | 22 | 0.0% |
| Chippewa | 75 | 0.0% |
| Choctaw | 160 | 0.0% |
| Colombian | 35,367 | 2.4% |
| Comanche | 37 | 0.0% |
| Costa Rican | 2,141 | 0.1% |
| Cree | 28 | 0.0% |
| Creek | 260 | 0.0% |
| Croatian | 1,279 | 0.1% |
| Crow | 31 | 0.0% |
| Cuban | 62,506 | 4.2% |
| Cypriot | 167 | 0.0% |
| Czech | 3,758 | 0.3% |
| Czechoslovakian | 1,084 | 0.1% |
| Danish | 2,262 | 0.2% |
| Delaware | 96 | 0.0% |
| Dominican | 17,176 | 1.1% |
| Dutch | 8,954 | 0.6% |
| Dutch West Indian | 23 | 0.0% |
| Eastern European | 16,550 | 1.1% |
| Ecuadorian | 7,394 | 0.5% |
| Egyptian | 1,864 | 0.1% |
| English | 87,760 | 5.9% |
| Estonian | 159 | 0.0% |
| Ethiopian | 106 | 0.0% |
| European | 21,631 | 1.5% |
| Fijian | 12 | 0.0% |
| Filipino | 315 | 0.0% |
| Finnish | 3,490 | 0.2% |
| French | 24,888 | 1.7% |
| French American Indian | 12 | 0.0% |
| French Canadian | 6,908 | 0.5% |
| German | 120,484 | 8.1% |
| German Russian | 39 | 0.0% |
| Ghanaian | 294 | 0.0% |
| Greek | 7,029 | 0.5% |
| Guamanian / Chamorro | 441 | 0.0% |
| Guatemalan | 33,573 | 2.2% |
| Guyanese | 1,379 | 0.1% |
| Haitian | 92,278 | 6.2% |
| Hmong | 21 | 0.0% |
| Honduran | 14,401 | 1.0% |
| Hopi | 21 | 0.0% |
| Hungarian | 10,122 | 0.7% |
| Icelander | 141 | 0.0% |
| Indian (Asian) | 10,263 | 0.7% |
| Indonesian | 255 | 0.0% |
| Inupiat | 40 | 0.0% |
| Iranian | 1,512 | 0.1% |
| Iraqi | 410 | 0.0% |
| Irish | 122,014 | 8.2% |
| Iroquois | 313 | 0.0% |
| Israeli | 2,661 | 0.2% |
| Italian | 120,938 | 8.1% |
| Jamaican | 33,329 | 2.2% |
| Japanese | 298 | 0.0% |
| Jordanian | 278 | 0.0% |
| Kenyan | 562 | 0.0% |
| Korean | 7,005 | 0.5% |
| Laotian | 247 | 0.0% |
| Latvian | 741 | 0.1% |
| Lebanese | 3,502 | 0.2% |
| Liberian | 117 | 0.0% |
| Lithuanian | 4,636 | 0.3% |
| Lumbee | 39 | 0.0% |
| Luxembourger | 64 | 0.0% |
| Macedonian | 319 | 0.0% |
| Malaysian | 66 | 0.0% |
| Maltese | 256 | 0.0% |
| Mexican | 54,748 | 3.7% |
| Mexican American Indian | 1,056 | 0.1% |
| Mongolian | 40 | 0.0% |
| Moroccan | 713 | 0.1% |
| Native Hawaiian | 697 | 0.1% |
| Navajo | 118 | 0.0% |
| New Zealander | 39 | 0.0% |
| Nicaraguan | 5,992 | 0.4% |
| Nigerian | 1,067 | 0.1% |
| Northern European | 906 | 0.1% |
| Norwegian | 7,708 | 0.5% |
| Pakistani | 1,461 | 0.1% |
| Palestinian | 434 | 0.0% |
| Panamanian | 1,347 | 0.1% |
| Paraguayan | 183 | 0.0% |
| Pennsylvania German | 258 | 0.0% |
| Peruvian | 11,342 | 0.8% |
| Pima | 86 | 0.0% |
| Polish | 54,676 | 3.7% |
| Portuguese | 6,982 | 0.5% |
| Potawatomi | 34 | 0.0% |
| Pueblo | 2 | 0.0% |
| Puerto Rican | 51,661 | 3.5% |
| Romanian | 6,185 | 0.4% |
| Russian | 41,348 | 2.8% |
| Salvadoran | 8,147 | 0.5% |
| Samoan | 382 | 0.0% |
| Scandinavian | 2,398 | 0.2% |
| Scotch-Irish | 7,071 | 0.5% |
| Scottish | 16,223 | 1.1% |
| Seminole | 179 | 0.0% |
| Serbian | 817 | 0.1% |
| Sierra Leonean | 5 | 0.0% |
| Sioux | 209 | 0.0% |
| Slavic | 507 | 0.0% |
| Slovak | 2,133 | 0.1% |
| Slovene | 549 | 0.0% |
| Somali | 66 | 0.0% |
| South African | 1,849 | 0.1% |
| South American | 80,702 | 5.4% |
| South American Indian | 426 | 0.0% |
| Soviet Union | 20 | 0.0% |
| Spaniard | 4,831 | 0.3% |
| Spanish | 2,848 | 0.2% |
| Spanish American | 24 | 0.0% |
| Spanish American Indian | 129 | 0.0% |
| Sri Lankan | 7,595 | 0.5% |
| Subsaharan African | 23,082 | 1.5% |
| Sudanese | 278 | 0.0% |
| Swedish | 8,718 | 0.6% |
| Swiss | 2,427 | 0.2% |
| Syrian | 1,239 | 0.1% |
| Taiwanese | 27 | 0.0% |
| Thai | 16,019 | 1.1% |
| Tlingit-Haida | 32 | 0.0% |
| Tohono O'Odham | 1 | 0.0% |
| Trinidadian and Tobagonian | 2,698 | 0.2% |
| Turkish | 2,526 | 0.2% |
| U.S. Virgin Islander | 188 | 0.0% |
| Ukrainian | 7,089 | 0.5% |
| Uruguayan | 2,475 | 0.2% |
| Venezuelan | 13,956 | 0.9% |
| Vietnamese | 2,327 | 0.2% |
| Welsh | 4,948 | 0.3% |
| West Indian | 2,916 | 0.2% |
| Yugoslavian | 622 | 0.0% |
| Yup'ik | 9 | 0.0% |
| Zimbabwean | 20 | 0.0% | View All 175 Rows |
Immigrants in Palm Beach County
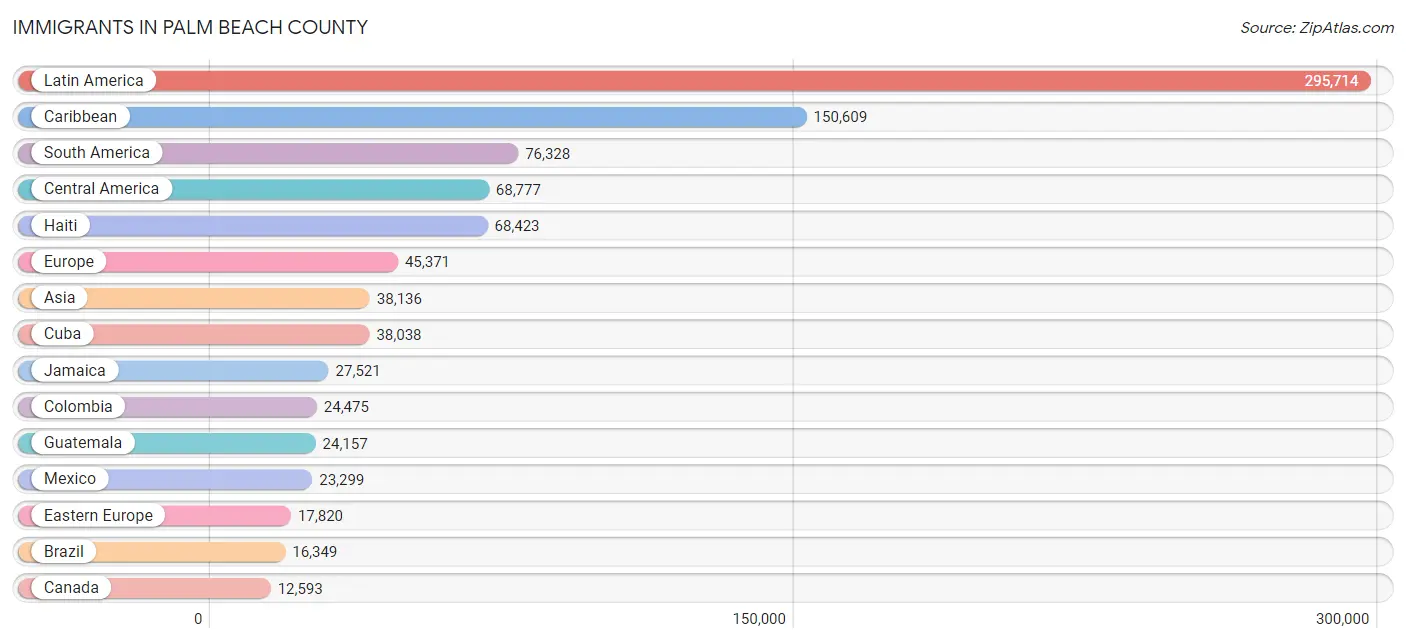
The most numerous immigrant groups reported in Palm Beach County came from Latin America (295,714 | 19.8%), Caribbean (150,609 | 10.1%), South America (76,328 | 5.1%), Central America (68,777 | 4.6%), and Haiti (68,423 | 4.6%), together accounting for 44.1% of all Palm Beach County residents.
| Immigration Origin | # Population | % Population |
| Afghanistan | 307 | 0.0% |
| Africa | 7,568 | 0.5% |
| Albania | 443 | 0.0% |
| Argentina | 4,388 | 0.3% |
| Armenia | 74 | 0.0% |
| Asia | 38,136 | 2.5% |
| Australia | 378 | 0.0% |
| Austria | 699 | 0.1% |
| Azores | 25 | 0.0% |
| Bahamas | 1,475 | 0.1% |
| Bangladesh | 3,120 | 0.2% |
| Barbados | 679 | 0.1% |
| Belarus | 285 | 0.0% |
| Belgium | 440 | 0.0% |
| Belize | 394 | 0.0% |
| Bolivia | 895 | 0.1% |
| Bosnia and Herzegovina | 119 | 0.0% |
| Brazil | 16,349 | 1.1% |
| Bulgaria | 632 | 0.0% |
| Cabo Verde | 78 | 0.0% |
| Cambodia | 178 | 0.0% |
| Cameroon | 109 | 0.0% |
| Canada | 12,593 | 0.8% |
| Caribbean | 150,609 | 10.1% |
| Central America | 68,777 | 4.6% |
| Chile | 2,065 | 0.1% |
| China | 5,718 | 0.4% |
| Colombia | 24,475 | 1.6% |
| Congo | 7 | 0.0% |
| Costa Rica | 1,422 | 0.1% |
| Croatia | 320 | 0.0% |
| Cuba | 38,038 | 2.5% |
| Czechoslovakia | 935 | 0.1% |
| Denmark | 240 | 0.0% |
| Dominica | 396 | 0.0% |
| Dominican Republic | 8,701 | 0.6% |
| Eastern Africa | 1,114 | 0.1% |
| Eastern Asia | 7,636 | 0.5% |
| Eastern Europe | 17,820 | 1.2% |
| Ecuador | 4,495 | 0.3% |
| Egypt | 1,397 | 0.1% |
| El Salvador | 4,969 | 0.3% |
| England | 3,706 | 0.3% |
| Ethiopia | 94 | 0.0% |
| Europe | 45,371 | 3.0% |
| France | 2,228 | 0.2% |
| Germany | 4,674 | 0.3% |
| Ghana | 258 | 0.0% |
| Greece | 864 | 0.1% |
| Grenada | 83 | 0.0% |
| Guatemala | 24,157 | 1.6% |
| Guyana | 1,998 | 0.1% |
| Haiti | 68,423 | 4.6% |
| Honduras | 9,825 | 0.7% |
| Hong Kong | 490 | 0.0% |
| Hungary | 979 | 0.1% |
| India | 5,657 | 0.4% |
| Indonesia | 246 | 0.0% |
| Iran | 909 | 0.1% |
| Iraq | 563 | 0.0% |
| Ireland | 1,156 | 0.1% |
| Israel | 2,802 | 0.2% |
| Italy | 3,787 | 0.3% |
| Jamaica | 27,521 | 1.8% |
| Japan | 676 | 0.1% |
| Jordan | 282 | 0.0% |
| Kazakhstan | 503 | 0.0% |
| Kenya | 491 | 0.0% |
| Korea | 1,242 | 0.1% |
| Kuwait | 50 | 0.0% |
| Laos | 90 | 0.0% |
| Latin America | 295,714 | 19.8% |
| Latvia | 275 | 0.0% |
| Lebanon | 992 | 0.1% |
| Liberia | 151 | 0.0% |
| Lithuania | 333 | 0.0% |
| Malaysia | 71 | 0.0% |
| Mexico | 23,299 | 1.6% |
| Micronesia | 12 | 0.0% |
| Middle Africa | 331 | 0.0% |
| Moldova | 360 | 0.0% |
| Morocco | 601 | 0.0% |
| Nepal | 106 | 0.0% |
| Netherlands | 772 | 0.1% |
| Nicaragua | 4,042 | 0.3% |
| Nigeria | 472 | 0.0% |
| North Macedonia | 146 | 0.0% |
| Northern Africa | 2,578 | 0.2% |
| Northern Europe | 10,416 | 0.7% |
| Norway | 485 | 0.0% |
| Oceania | 706 | 0.1% |
| Pakistan | 943 | 0.1% |
| Panama | 657 | 0.0% |
| Peru | 8,169 | 0.5% |
| Philippines | 3,635 | 0.2% |
| Poland | 3,480 | 0.2% |
| Portugal | 1,225 | 0.1% |
| Romania | 2,339 | 0.2% |
| Russia | 3,272 | 0.2% |
| Saudi Arabia | 143 | 0.0% |
| Scotland | 490 | 0.0% |
| Senegal | 10 | 0.0% |
| Serbia | 643 | 0.0% |
| South Africa | 2,380 | 0.2% |
| South America | 76,328 | 5.1% |
| South Central Asia | 12,059 | 0.8% |
| South Eastern Asia | 9,961 | 0.7% |
| Southern Europe | 7,738 | 0.5% |
| Spain | 1,814 | 0.1% |
| Sri Lanka | 223 | 0.0% |
| St. Vincent and the Grenadines | 201 | 0.0% |
| Sudan | 241 | 0.0% |
| Sweden | 577 | 0.0% |
| Switzerland | 509 | 0.0% |
| Syria | 991 | 0.1% |
| Taiwan | 529 | 0.0% |
| Thailand | 1,022 | 0.1% |
| Trinidad and Tobago | 3,821 | 0.3% |
| Turkey | 1,489 | 0.1% |
| Uganda | 35 | 0.0% |
| Ukraine | 2,253 | 0.2% |
| Uruguay | 1,986 | 0.1% |
| Uzbekistan | 253 | 0.0% |
| Venezuela | 11,060 | 0.7% |
| Vietnam | 4,582 | 0.3% |
| West Indies | 229 | 0.0% |
| Western Africa | 1,025 | 0.1% |
| Western Asia | 8,188 | 0.5% |
| Western Europe | 9,338 | 0.6% |
| Yemen | 361 | 0.0% |
| Zimbabwe | 311 | 0.0% | View All 131 Rows |
Sex and Age in Palm Beach County
Sex and Age in Palm Beach County
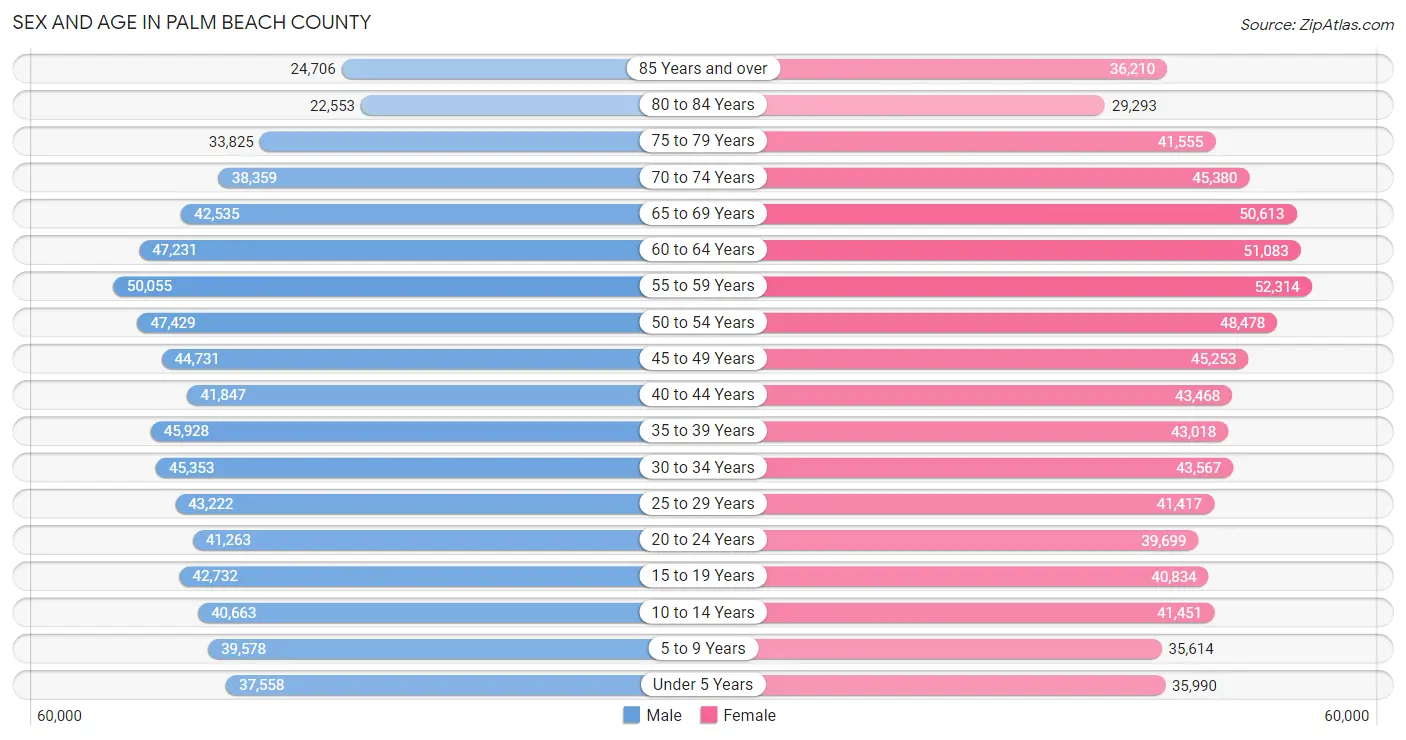
The most populous age groups in Palm Beach County are 55 to 59 Years (50,055 | 6.9%) for men and 55 to 59 Years (52,314 | 6.8%) for women.
| Age Bracket | Male | Female |
| Under 5 Years | 37,558 (5.1%) | 35,990 (4.7%) |
| 5 to 9 Years | 39,578 (5.4%) | 35,614 (4.6%) |
| 10 to 14 Years | 40,663 (5.6%) | 41,451 (5.4%) |
| 15 to 19 Years | 42,732 (5.9%) | 40,834 (5.3%) |
| 20 to 24 Years | 41,263 (5.7%) | 39,699 (5.2%) |
| 25 to 29 Years | 43,222 (5.9%) | 41,417 (5.4%) |
| 30 to 34 Years | 45,353 (6.2%) | 43,567 (5.7%) |
| 35 to 39 Years | 45,928 (6.3%) | 43,018 (5.6%) |
| 40 to 44 Years | 41,847 (5.7%) | 43,468 (5.7%) |
| 45 to 49 Years | 44,731 (6.1%) | 45,253 (5.9%) |
| 50 to 54 Years | 47,429 (6.5%) | 48,478 (6.3%) |
| 55 to 59 Years | 50,055 (6.9%) | 52,314 (6.8%) |
| 60 to 64 Years | 47,231 (6.5%) | 51,083 (6.7%) |
| 65 to 69 Years | 42,535 (5.8%) | 50,613 (6.6%) |
| 70 to 74 Years | 38,359 (5.3%) | 45,380 (5.9%) |
| 75 to 79 Years | 33,825 (4.6%) | 41,555 (5.4%) |
| 80 to 84 Years | 22,553 (3.1%) | 29,293 (3.8%) |
| 85 Years and over | 24,706 (3.4%) | 36,210 (4.7%) |
| Total | 729,568 (100.0%) | 765,237 (100.0%) |
Families and Households in Palm Beach County
Median Family Size in Palm Beach County
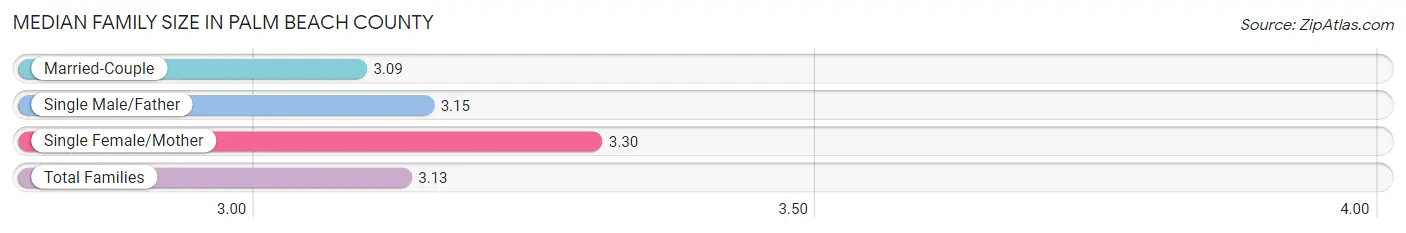
The median family size in Palm Beach County is 3.13 persons per family, with single female/mother families (68,335 | 18.5%) accounting for the largest median family size of 3.3 persons per family. On the other hand, married-couple families (269,675 | 73.2%) represent the smallest median family size with 3.09 persons per family.
| Family Type | # Families | Family Size |
| Married-Couple | 269,675 (73.2%) | 3.09 |
| Single Male/Father | 30,559 (8.3%) | 3.15 |
| Single Female/Mother | 68,335 (18.5%) | 3.30 |
| Total Families | 368,569 (100.0%) | 3.13 |
Median Household Size in Palm Beach County
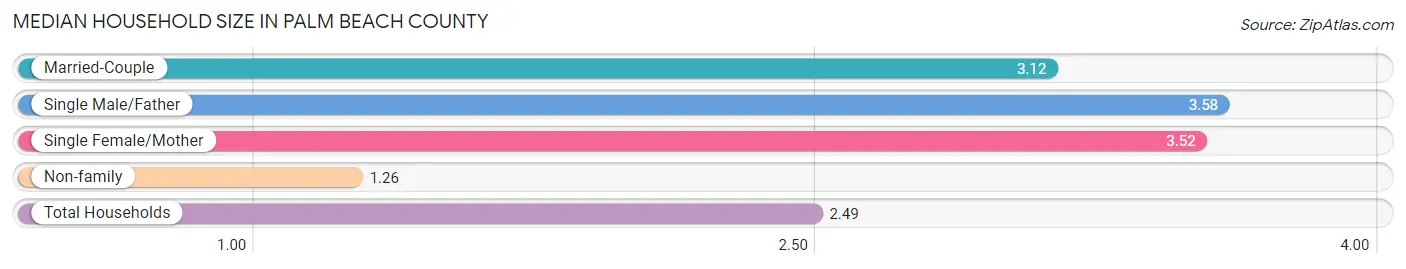
The median household size in Palm Beach County is 2.49 persons per household, with single male/father households (30,559 | 5.2%) accounting for the largest median household size of 3.58 persons per household. non-family households (221,025 | 37.5%) represent the smallest median household size with 1.26 persons per household.
| Household Type | # Households | Household Size |
| Married-Couple | 269,675 (45.7%) | 3.12 |
| Single Male/Father | 30,559 (5.2%) | 3.58 |
| Single Female/Mother | 68,335 (11.6%) | 3.52 |
| Non-family | 221,025 (37.5%) | 1.26 |
| Total Households | 589,594 (100.0%) | 2.49 |
Household Size by Marriage Status in Palm Beach County
Out of a total of 589,594 households in Palm Beach County, 368,569 (62.5%) are family households, while 221,025 (37.5%) are nonfamily households. The most numerous type of family households are 2-person households, comprising 179,457, and the most common type of nonfamily households are 1-person households, comprising 180,410.
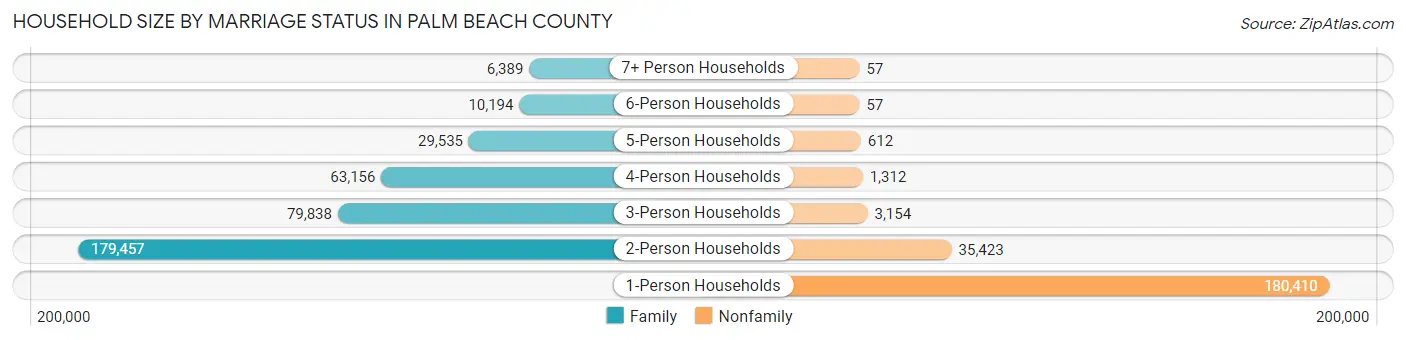
| Household Size | Family Households | Nonfamily Households |
| 1-Person Households | - | 180,410 (30.6%) |
| 2-Person Households | 179,457 (30.4%) | 35,423 (6.0%) |
| 3-Person Households | 79,838 (13.5%) | 3,154 (0.5%) |
| 4-Person Households | 63,156 (10.7%) | 1,312 (0.2%) |
| 5-Person Households | 29,535 (5.0%) | 612 (0.1%) |
| 6-Person Households | 10,194 (1.7%) | 57 (0.0%) |
| 7+ Person Households | 6,389 (1.1%) | 57 (0.0%) |
| Total | 368,569 (62.5%) | 221,025 (37.5%) |
Female Fertility in Palm Beach County
Fertility by Age in Palm Beach County
Average fertility rate in Palm Beach County is 49.0 births per 1,000 women. Women in the age bracket of 20 to 34 years have the highest fertility rate with 77.0 births per 1,000 women. Women in the age bracket of 20 to 34 years acount for 63.2% of all women with births.
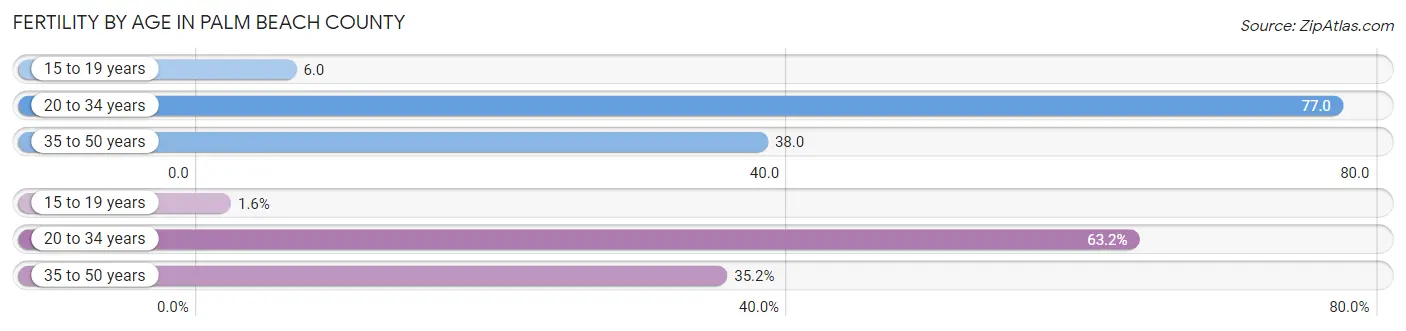
| Age Bracket | Women with Births | Births / 1,000 Women |
| 15 to 19 years | 237 (1.6%) | 6.0 |
| 20 to 34 years | 9,576 (63.2%) | 77.0 |
| 35 to 50 years | 5,340 (35.2%) | 38.0 |
| Total | 15,153 (100.0%) | 49.0 |
Fertility by Age by Marriage Status in Palm Beach County
64.6% of women with births (15,153) in Palm Beach County are married. The highest percentage of unmarried women with births falls into 15 to 19 years age bracket with 73.4% of them unmarried at the time of birth, while the lowest percentage of unmarried women with births belong to 35 to 50 years age bracket with 21.4% of them unmarried.
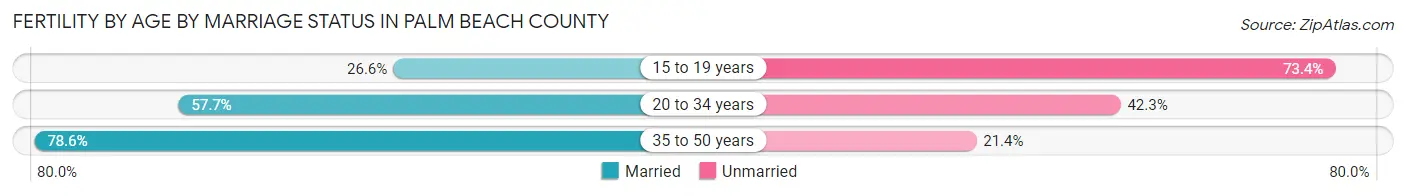
| Age Bracket | Married | Unmarried |
| 15 to 19 years | 63 (26.6%) | 174 (73.4%) |
| 20 to 34 years | 5,525 (57.7%) | 4,051 (42.3%) |
| 35 to 50 years | 4,197 (78.6%) | 1,143 (21.4%) |
| Total | 9,789 (64.6%) | 5,364 (35.4%) |
Fertility by Education in Palm Beach County
Average fertility rate in Palm Beach County is 49.0 births per 1,000 women. Women with the education attainment of graduate degree have the highest fertility rate of 56.0 births per 1,000 women, while women with the education attainment of less than high school have the lowest fertility at 40.0 births per 1,000 women. Women with the education attainment of college or associate's degree represent 28.9% of all women with births.
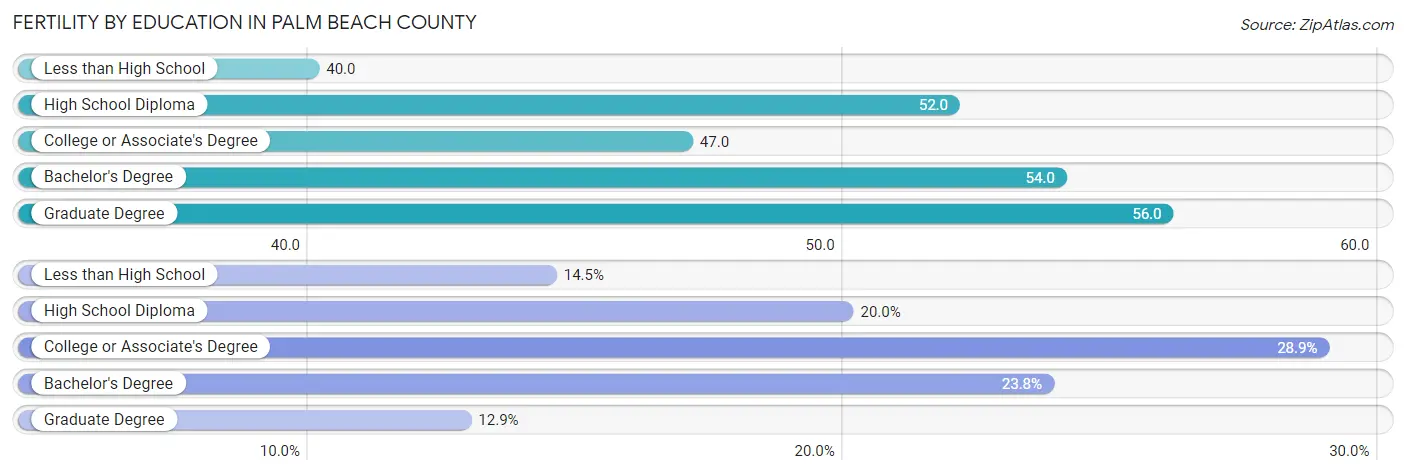
| Educational Attainment | Women with Births | Births / 1,000 Women |
| Less than High School | 2,190 (14.4%) | 40.0 |
| High School Diploma | 3,032 (20.0%) | 52.0 |
| College or Associate's Degree | 4,383 (28.9%) | 47.0 |
| Bachelor's Degree | 3,601 (23.8%) | 54.0 |
| Graduate Degree | 1,947 (12.9%) | 56.0 |
| Total | 15,153 (100.0%) | 49.0 |
Fertility by Education by Marriage Status in Palm Beach County
35.4% of women with births in Palm Beach County are unmarried. Women with the educational attainment of graduate degree are most likely to be married with 92.5% of them married at childbirth, while women with the educational attainment of less than high school are least likely to be married with 55.8% of them unmarried at childbirth.
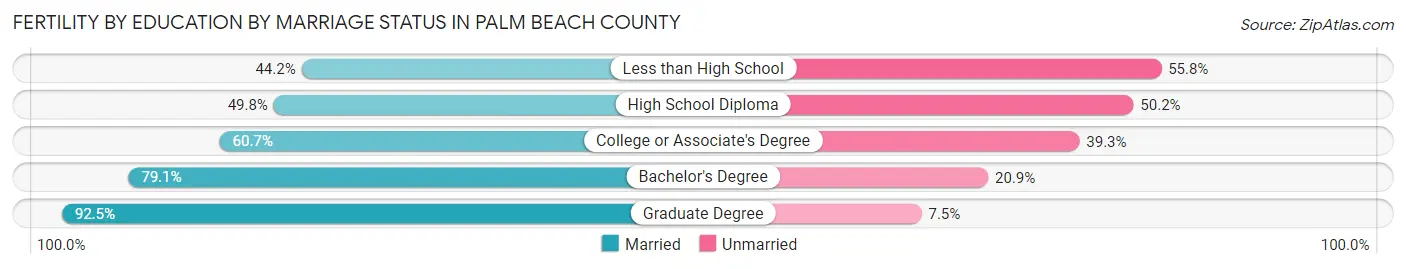
| Educational Attainment | Married | Unmarried |
| Less than High School | 968 (44.2%) | 1,222 (55.8%) |
| High School Diploma | 1,510 (49.8%) | 1,522 (50.2%) |
| College or Associate's Degree | 2,660 (60.7%) | 1,723 (39.3%) |
| Bachelor's Degree | 2,848 (79.1%) | 753 (20.9%) |
| Graduate Degree | 1,801 (92.5%) | 146 (7.5%) |
| Total | 9,789 (64.6%) | 5,364 (35.4%) |
Employment Characteristics in Palm Beach County
Employment by Class of Employer in Palm Beach County
Among the 682,181 employed individuals in Palm Beach County, private company employees (472,407 | 69.3%), self-employed (incorporated) (56,320 | 8.3%), and local government employees (45,603 | 6.7%) make up the most common classes of employment.
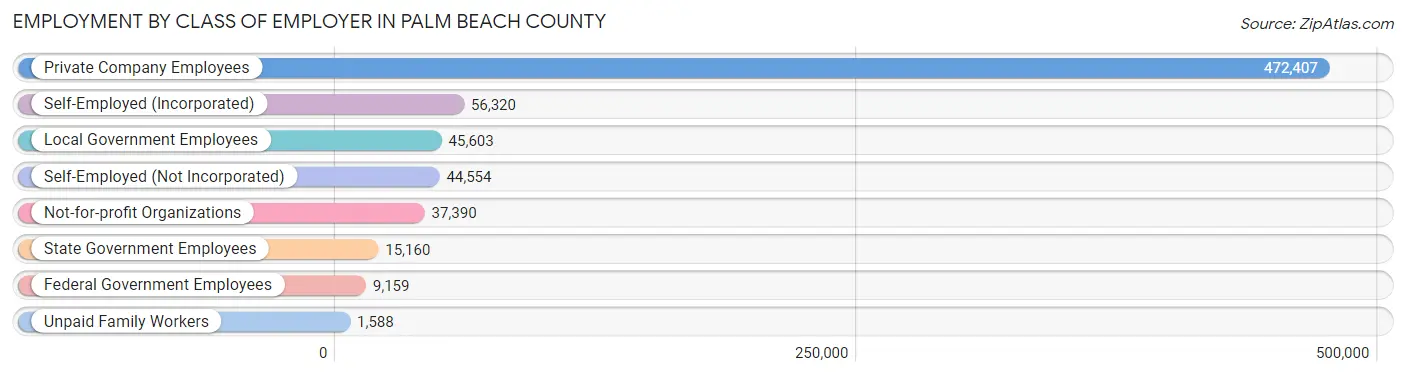
| Employer Class | # Employees | % Employees |
| Private Company Employees | 472,407 | 69.3% |
| Self-Employed (Incorporated) | 56,320 | 8.3% |
| Self-Employed (Not Incorporated) | 44,554 | 6.5% |
| Not-for-profit Organizations | 37,390 | 5.5% |
| Local Government Employees | 45,603 | 6.7% |
| State Government Employees | 15,160 | 2.2% |
| Federal Government Employees | 9,159 | 1.3% |
| Unpaid Family Workers | 1,588 | 0.2% |
| Total | 682,181 | 100.0% |
Employment Status by Age in Palm Beach County
According to the labor force statistics for Palm Beach County, out of the total population over 16 years of age (1,246,799), 59.5% or 741,845 individuals are in the labor force, with 5.8% or 43,027 of them unemployed. The age group with the highest labor force participation rate is 30 to 34 years, with 85.0% or 75,582 individuals in the labor force. Within the labor force, the 16 to 19 years age range has the highest percentage of unemployed individuals, with 18.3% or 4,546 of them being unemployed.
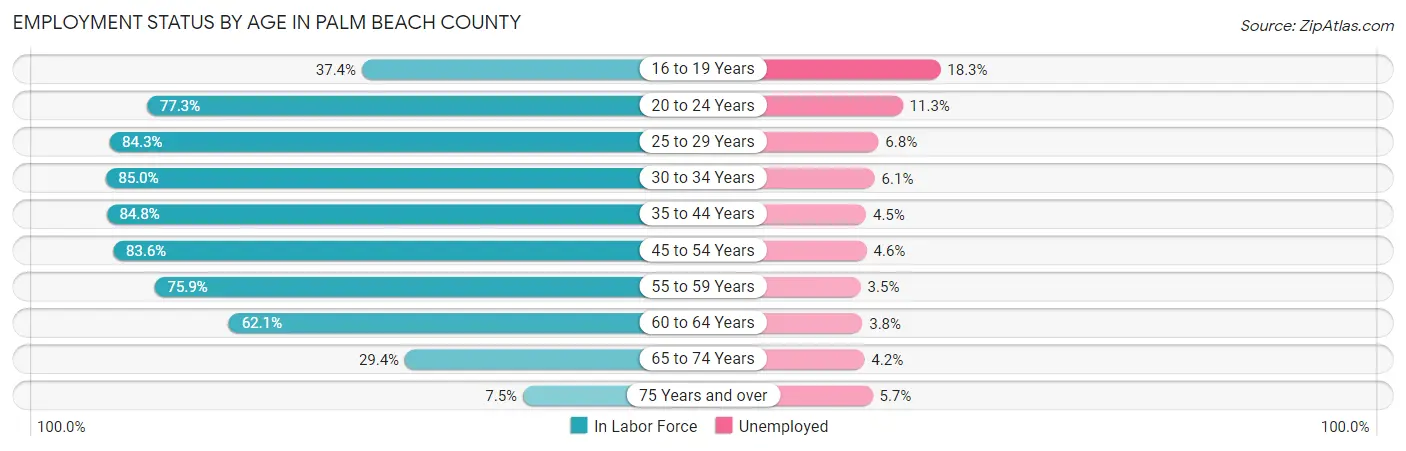
| Age Bracket | In Labor Force | Unemployed |
| 16 to 19 Years | 24,839 (37.4%) | 4,546 (18.3%) |
| 20 to 24 Years | 62,584 (77.3%) | 7,072 (11.3%) |
| 25 to 29 Years | 71,351 (84.3%) | 4,852 (6.8%) |
| 30 to 34 Years | 75,582 (85.0%) | 4,611 (6.1%) |
| 35 to 44 Years | 147,773 (84.8%) | 6,650 (4.5%) |
| 45 to 54 Years | 155,405 (83.6%) | 7,149 (4.6%) |
| 55 to 59 Years | 77,698 (75.9%) | 2,719 (3.5%) |
| 60 to 64 Years | 61,053 (62.1%) | 2,320 (3.8%) |
| 65 to 74 Years | 52,005 (29.4%) | 2,184 (4.2%) |
| 75 Years and over | 14,111 (7.5%) | 804 (5.7%) |
| Total | 741,845 (59.5%) | 43,027 (5.8%) |
Employment Status by Educational Attainment in Palm Beach County
According to labor force statistics for Palm Beach County, 80.2% of individuals (588,984) out of the total population between 25 and 64 years of age (734,394) are in the labor force, with 4.8% or 28,271 of them being unemployed. The group with the highest labor force participation rate are those with the educational attainment of bachelor's degree or higher, with 84.3% or 234,016 individuals in the labor force. Within the labor force, individuals with high school diploma education have the highest percentage of unemployment, with 6.9% or 8,787 of them being unemployed.
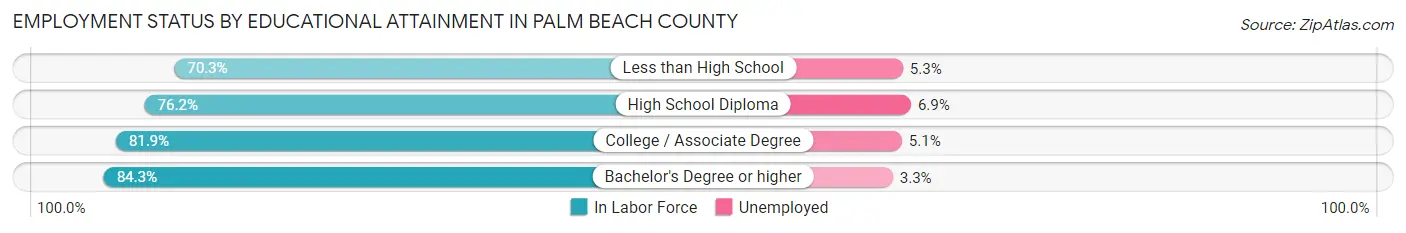
| Educational Attainment | In Labor Force | Unemployed |
| Less than High School | 59,499 (70.3%) | 4,486 (5.3%) |
| High School Diploma | 127,351 (76.2%) | 11,532 (6.9%) |
| College / Associate Degree | 167,921 (81.9%) | 10,457 (5.1%) |
| Bachelor's Degree or higher | 234,016 (84.3%) | 9,161 (3.3%) |
| Total | 588,984 (80.2%) | 35,251 (4.8%) |
Employment Occupations by Sex in Palm Beach County
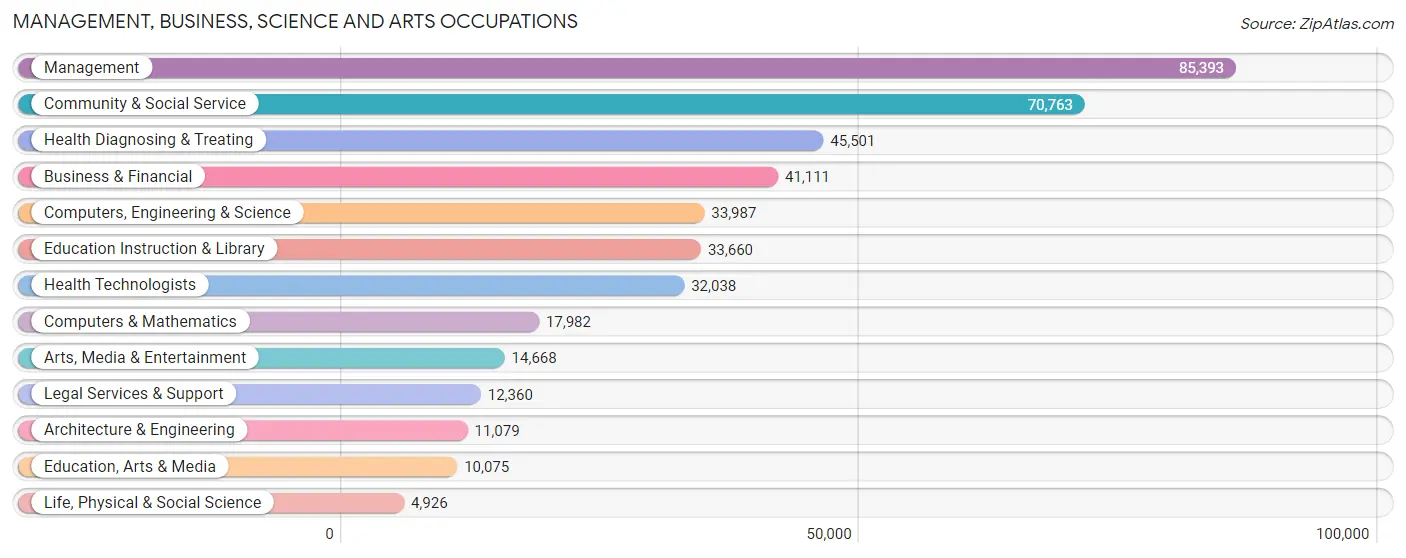
Management, Business, Science and Arts Occupations
The most common Management, Business, Science and Arts occupations in Palm Beach County are Management (85,393 | 12.2%), Community & Social Service (70,763 | 10.1%), Health Diagnosing & Treating (45,501 | 6.5%), Business & Financial (41,111 | 5.9%), and Computers, Engineering & Science (33,987 | 4.9%).
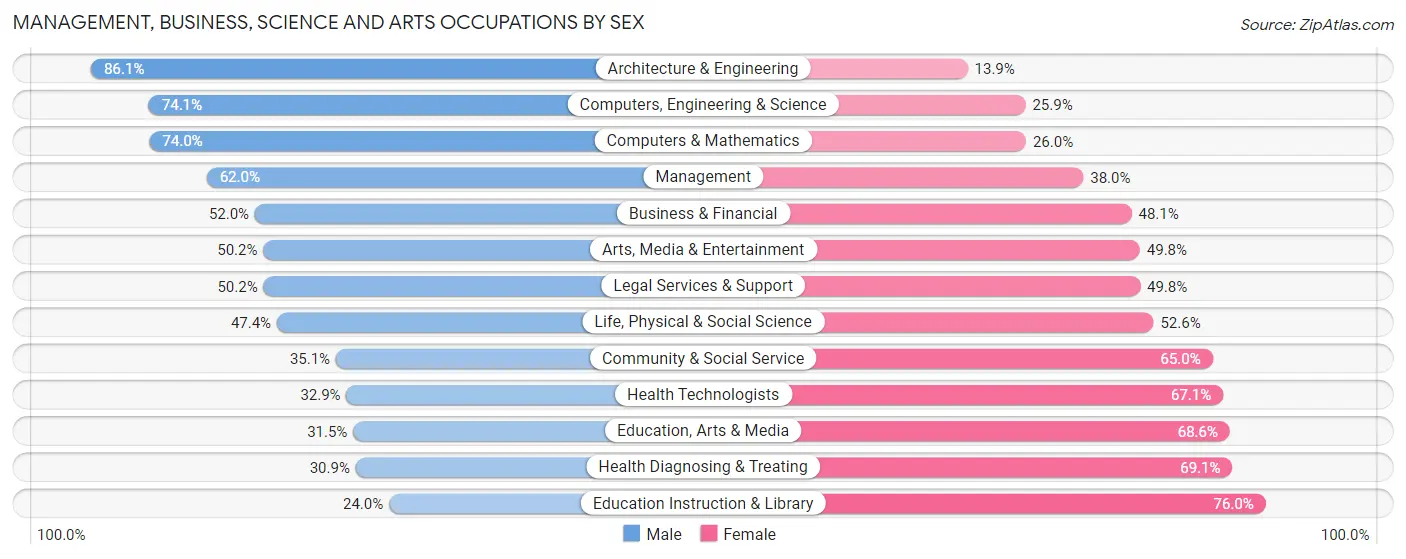
Management, Business, Science and Arts Occupations by Sex
Within the Management, Business, Science and Arts occupations in Palm Beach County, the most male-oriented occupations are Architecture & Engineering (86.1%), Computers, Engineering & Science (74.1%), and Computers & Mathematics (74.0%), while the most female-oriented occupations are Education Instruction & Library (76.0%), Health Diagnosing & Treating (69.1%), and Education, Arts & Media (68.5%).
| Occupation | Male | Female |
| Management | 52,940 (62.0%) | 32,453 (38.0%) |
| Business & Financial | 21,356 (51.9%) | 19,755 (48.0%) |
| Computers, Engineering & Science | 25,175 (74.1%) | 8,812 (25.9%) |
| Computers & Mathematics | 13,299 (74.0%) | 4,683 (26.0%) |
| Architecture & Engineering | 9,543 (86.1%) | 1,536 (13.9%) |
| Life, Physical & Social Science | 2,333 (47.4%) | 2,593 (52.6%) |
| Community & Social Service | 24,804 (35.0%) | 45,959 (64.9%) |
| Education, Arts & Media | 3,169 (31.5%) | 6,906 (68.5%) |
| Legal Services & Support | 6,201 (50.2%) | 6,159 (49.8%) |
| Education Instruction & Library | 8,069 (24.0%) | 25,591 (76.0%) |
| Arts, Media & Entertainment | 7,365 (50.2%) | 7,303 (49.8%) |
| Health Diagnosing & Treating | 14,070 (30.9%) | 31,431 (69.1%) |
| Health Technologists | 10,529 (32.9%) | 21,509 (67.1%) |
| Total (Category) | 138,345 (50.0%) | 138,410 (50.0%) |
| Total (Overall) | 372,878 (53.3%) | 326,131 (46.7%) |
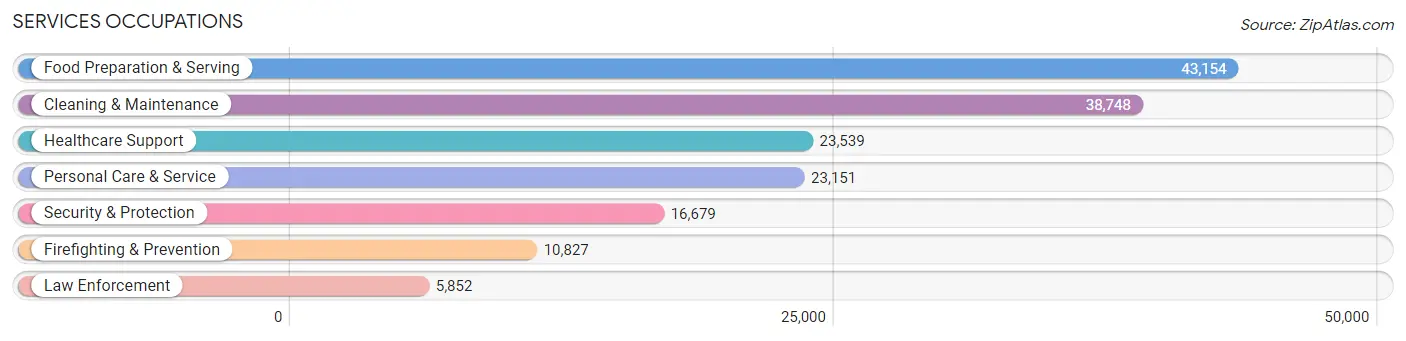
Services Occupations
The most common Services occupations in Palm Beach County are Food Preparation & Serving (43,154 | 6.2%), Cleaning & Maintenance (38,748 | 5.5%), Healthcare Support (23,539 | 3.4%), Personal Care & Service (23,151 | 3.3%), and Security & Protection (16,679 | 2.4%).
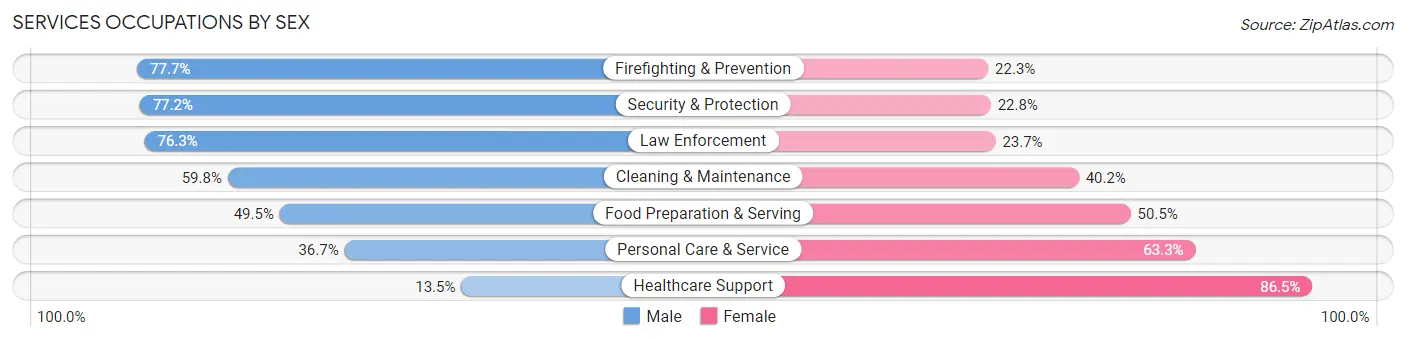
Services Occupations by Sex
Within the Services occupations in Palm Beach County, the most male-oriented occupations are Firefighting & Prevention (77.7%), Security & Protection (77.2%), and Law Enforcement (76.3%), while the most female-oriented occupations are Healthcare Support (86.5%), Personal Care & Service (63.3%), and Food Preparation & Serving (50.5%).
| Occupation | Male | Female |
| Healthcare Support | 3,183 (13.5%) | 20,356 (86.5%) |
| Security & Protection | 12,876 (77.2%) | 3,803 (22.8%) |
| Firefighting & Prevention | 8,413 (77.7%) | 2,414 (22.3%) |
| Law Enforcement | 4,463 (76.3%) | 1,389 (23.7%) |
| Food Preparation & Serving | 21,351 (49.5%) | 21,803 (50.5%) |
| Cleaning & Maintenance | 23,160 (59.8%) | 15,588 (40.2%) |
| Personal Care & Service | 8,487 (36.7%) | 14,664 (63.3%) |
| Total (Category) | 69,057 (47.5%) | 76,214 (52.5%) |
| Total (Overall) | 372,878 (53.3%) | 326,131 (46.7%) |
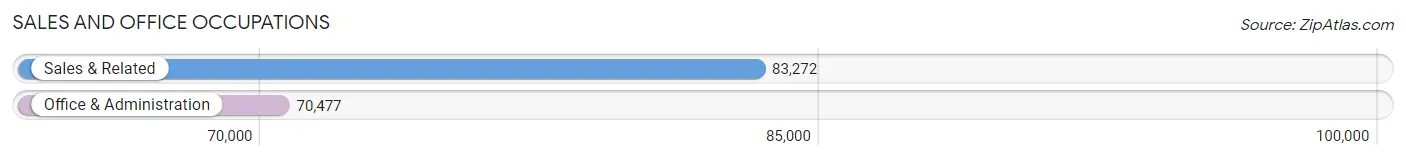
Sales and Office Occupations
The most common Sales and Office occupations in Palm Beach County are Sales & Related (83,272 | 11.9%), and Office & Administration (70,477 | 10.1%).
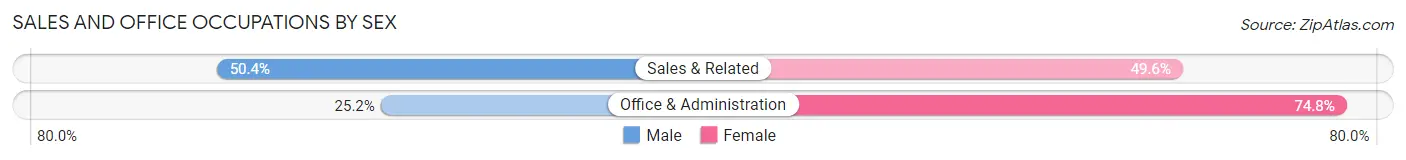
Sales and Office Occupations by Sex
| Occupation | Male | Female |
| Sales & Related | 42,000 (50.4%) | 41,272 (49.6%) |
| Office & Administration | 17,781 (25.2%) | 52,696 (74.8%) |
| Total (Category) | 59,781 (38.9%) | 93,968 (61.1%) |
| Total (Overall) | 372,878 (53.3%) | 326,131 (46.7%) |
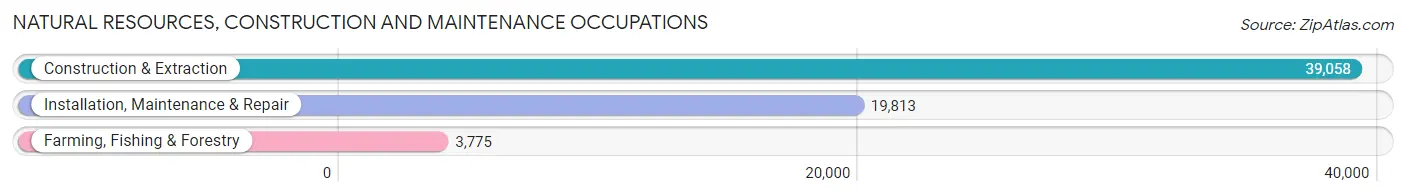
Natural Resources, Construction and Maintenance Occupations
The most common Natural Resources, Construction and Maintenance occupations in Palm Beach County are Construction & Extraction (39,058 | 5.6%), Installation, Maintenance & Repair (19,813 | 2.8%), and Farming, Fishing & Forestry (3,775 | 0.5%).
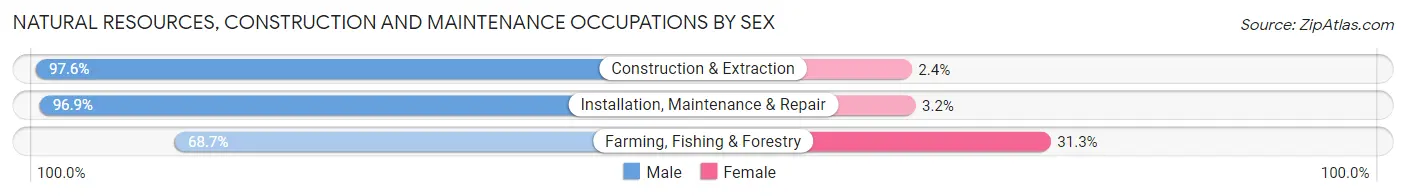
Natural Resources, Construction and Maintenance Occupations by Sex
| Occupation | Male | Female |
| Farming, Fishing & Forestry | 2,593 (68.7%) | 1,182 (31.3%) |
| Construction & Extraction | 38,124 (97.6%) | 934 (2.4%) |
| Installation, Maintenance & Repair | 19,188 (96.9%) | 625 (3.2%) |
| Total (Category) | 59,905 (95.6%) | 2,741 (4.4%) |
| Total (Overall) | 372,878 (53.3%) | 326,131 (46.7%) |
Production, Transportation and Moving Occupations
The most common Production, Transportation and Moving occupations in Palm Beach County are Transportation (22,833 | 3.3%), Material Moving (19,193 | 2.8%), and Production (18,562 | 2.7%).
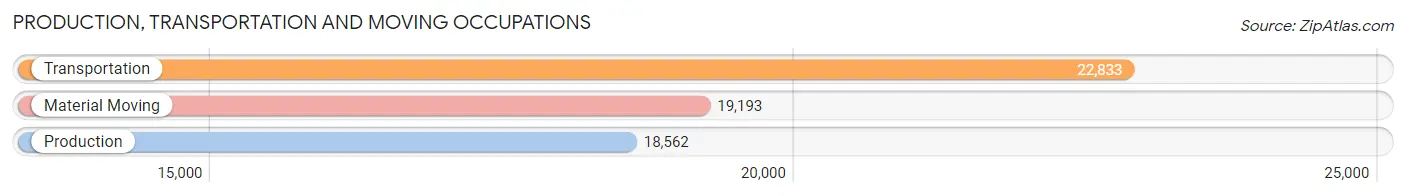
Production, Transportation and Moving Occupations by Sex
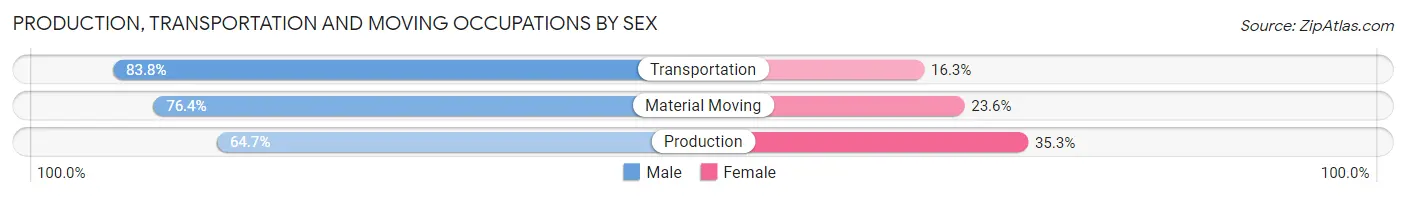
| Occupation | Male | Female |
| Production | 12,008 (64.7%) | 6,554 (35.3%) |
| Transportation | 19,122 (83.8%) | 3,711 (16.3%) |
| Material Moving | 14,660 (76.4%) | 4,533 (23.6%) |
| Total (Category) | 45,790 (75.6%) | 14,798 (24.4%) |
| Total (Overall) | 372,878 (53.3%) | 326,131 (46.7%) |
Employment Industries by Sex in Palm Beach County
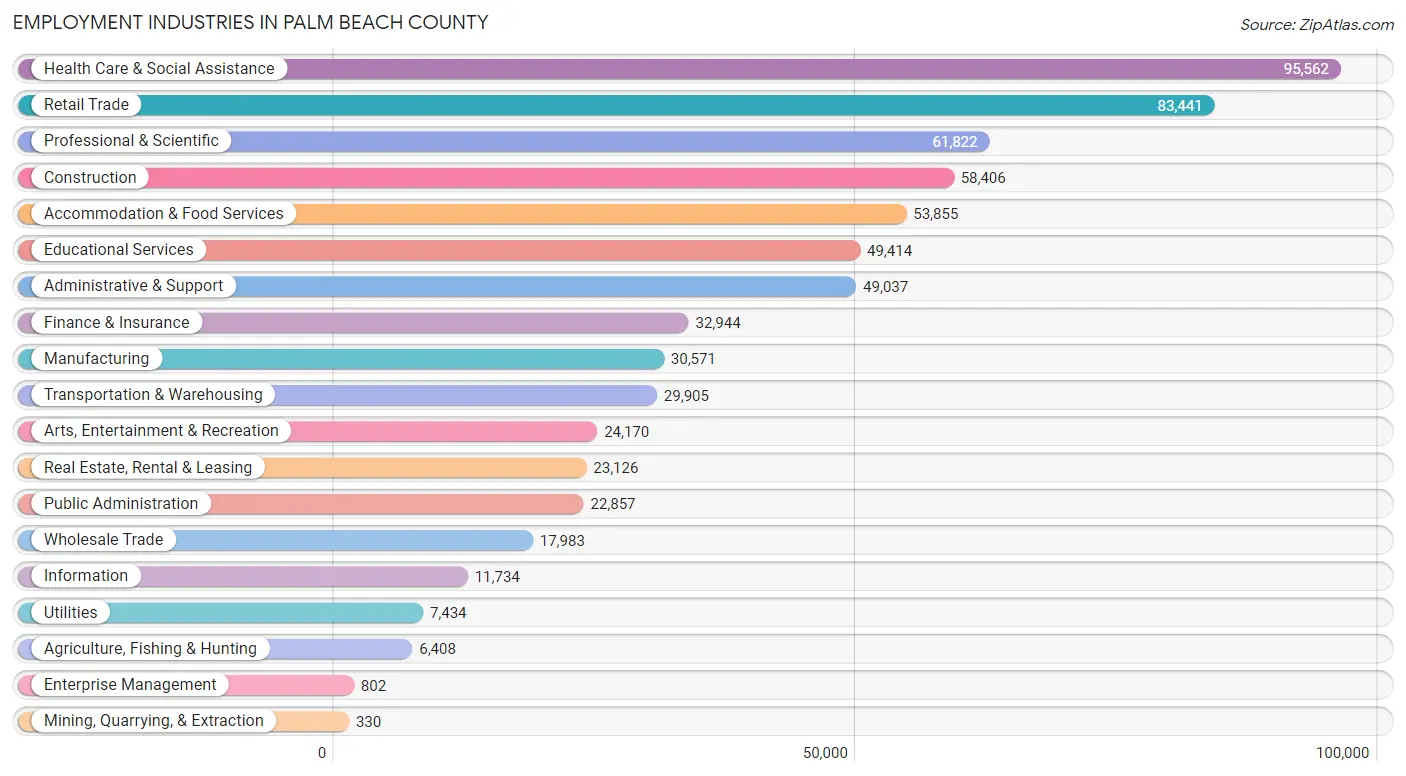
Employment Industries in Palm Beach County
The major employment industries in Palm Beach County include Health Care & Social Assistance (95,562 | 13.7%), Retail Trade (83,441 | 11.9%), Professional & Scientific (61,822 | 8.8%), Construction (58,406 | 8.4%), and Accommodation & Food Services (53,855 | 7.7%).
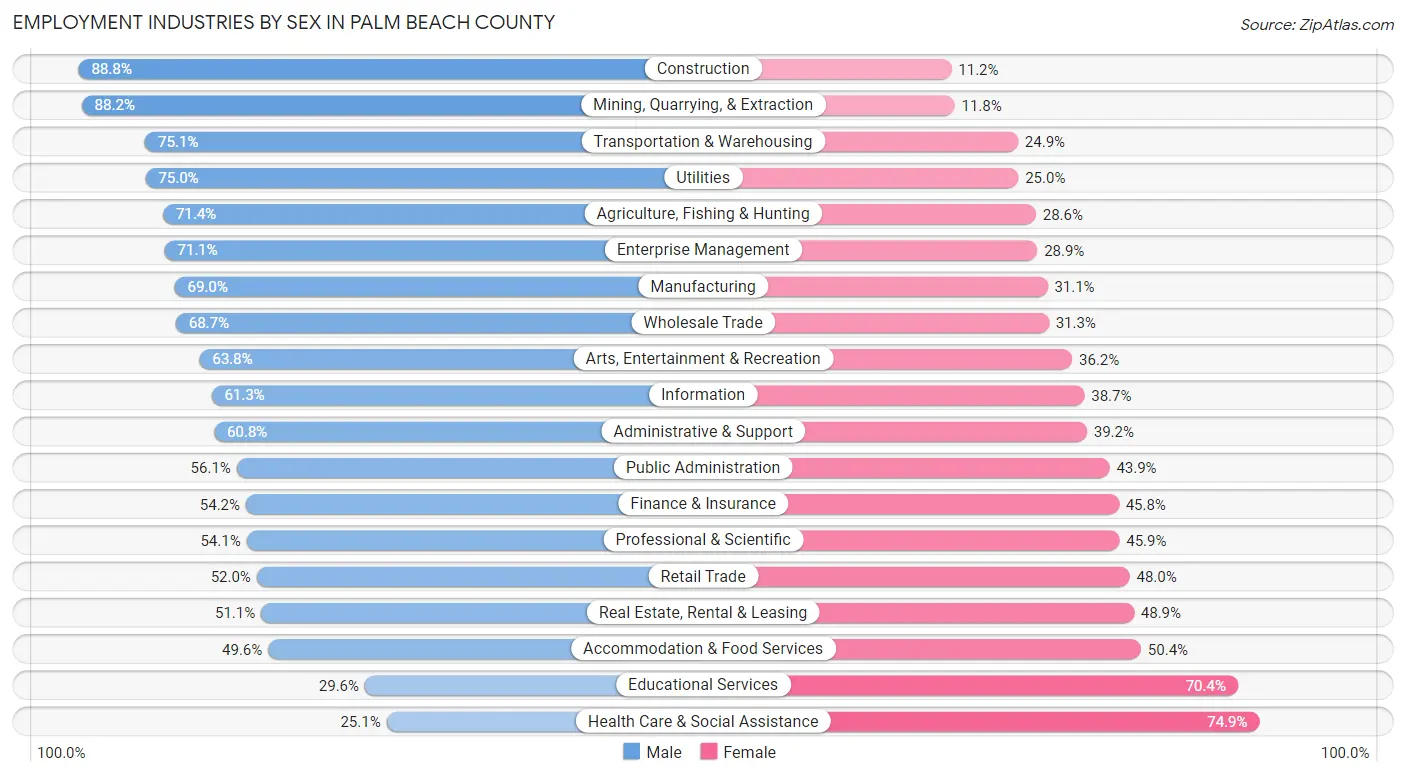
Employment Industries by Sex in Palm Beach County
The Palm Beach County industries that see more men than women are Construction (88.8%), Mining, Quarrying, & Extraction (88.2%), and Transportation & Warehousing (75.1%), whereas the industries that tend to have a higher number of women are Health Care & Social Assistance (74.9%), Educational Services (70.4%), and Accommodation & Food Services (50.4%).
| Industry | Male | Female |
| Agriculture, Fishing & Hunting | 4,573 (71.4%) | 1,835 (28.6%) |
| Mining, Quarrying, & Extraction | 291 (88.2%) | 39 (11.8%) |
| Construction | 51,885 (88.8%) | 6,521 (11.2%) |
| Manufacturing | 21,079 (69.0%) | 9,492 (31.0%) |
| Wholesale Trade | 12,353 (68.7%) | 5,630 (31.3%) |
| Retail Trade | 43,356 (52.0%) | 40,085 (48.0%) |
| Transportation & Warehousing | 22,446 (75.1%) | 7,459 (24.9%) |
| Utilities | 5,575 (75.0%) | 1,859 (25.0%) |
| Information | 7,195 (61.3%) | 4,539 (38.7%) |
| Finance & Insurance | 17,856 (54.2%) | 15,088 (45.8%) |
| Real Estate, Rental & Leasing | 11,807 (51.1%) | 11,319 (48.9%) |
| Professional & Scientific | 33,428 (54.1%) | 28,394 (45.9%) |
| Enterprise Management | 570 (71.1%) | 232 (28.9%) |
| Administrative & Support | 29,813 (60.8%) | 19,224 (39.2%) |
| Educational Services | 14,613 (29.6%) | 34,801 (70.4%) |
| Health Care & Social Assistance | 23,973 (25.1%) | 71,589 (74.9%) |
| Arts, Entertainment & Recreation | 15,429 (63.8%) | 8,741 (36.2%) |
| Accommodation & Food Services | 26,713 (49.6%) | 27,142 (50.4%) |
| Public Administration | 12,824 (56.1%) | 10,033 (43.9%) |
| Total | 372,878 (53.3%) | 326,131 (46.7%) |
Education in Palm Beach County
School Enrollment in Palm Beach County
The most common levels of schooling among the 317,267 students in Palm Beach County are college / undergraduate (70,822 | 22.3%), high school (69,875 | 22.0%), and middle school (64,921 | 20.5%).
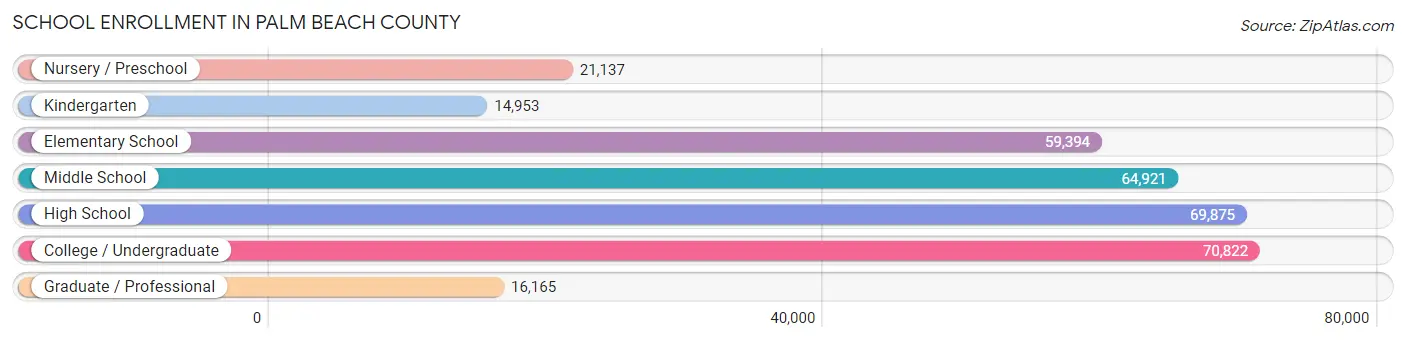
| School Level | # Students | % Students |
| Nursery / Preschool | 21,137 | 6.7% |
| Kindergarten | 14,953 | 4.7% |
| Elementary School | 59,394 | 18.7% |
| Middle School | 64,921 | 20.5% |
| High School | 69,875 | 22.0% |
| College / Undergraduate | 70,822 | 22.3% |
| Graduate / Professional | 16,165 | 5.1% |
| Total | 317,267 | 100.0% |
School Enrollment by Age by Funding Source in Palm Beach County
Out of a total of 317,267 students who are enrolled in schools in Palm Beach County, 65,040 (20.5%) attend a private institution, while the remaining 252,227 (79.5%) are enrolled in public schools. The age group of 3 to 4 year olds has the highest likelihood of being enrolled in private schools, with 8,849 (51.8% in the age bracket) enrolled. Conversely, the age group of 15 to 17 year olds has the lowest likelihood of being enrolled in a private school, with 42,032 (86.2% in the age bracket) attending a public institution.
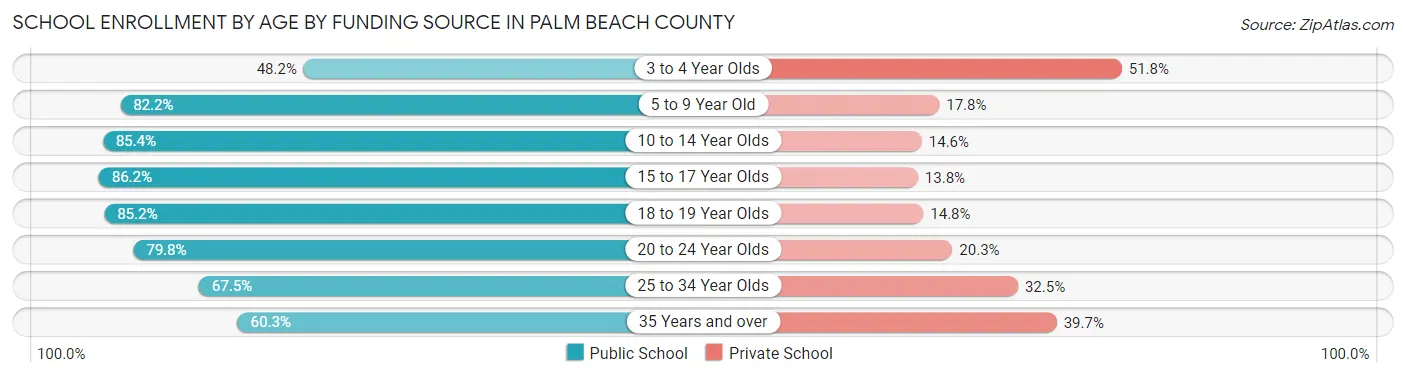
| Age Bracket | Public School | Private School |
| 3 to 4 Year Olds | 8,232 (48.2%) | 8,849 (51.8%) |
| 5 to 9 Year Old | 58,591 (82.2%) | 12,700 (17.8%) |
| 10 to 14 Year Olds | 67,992 (85.4%) | 11,587 (14.6%) |
| 15 to 17 Year Olds | 42,032 (86.2%) | 6,746 (13.8%) |
| 18 to 19 Year Olds | 22,033 (85.2%) | 3,840 (14.8%) |
| 20 to 24 Year Olds | 27,977 (79.7%) | 7,104 (20.3%) |
| 25 to 34 Year Olds | 13,424 (67.5%) | 6,454 (32.5%) |
| 35 Years and over | 11,884 (60.3%) | 7,822 (39.7%) |
| Total | 252,227 (79.5%) | 65,040 (20.5%) |
Educational Attainment by Field of Study in Palm Beach County
Business (110,745 | 24.4%), education (57,356 | 12.6%), science & technology (44,586 | 9.8%), social sciences (38,400 | 8.5%), and engineering (33,215 | 7.3%) are the most common fields of study among 453,803 individuals in Palm Beach County who have obtained a bachelor's degree or higher.
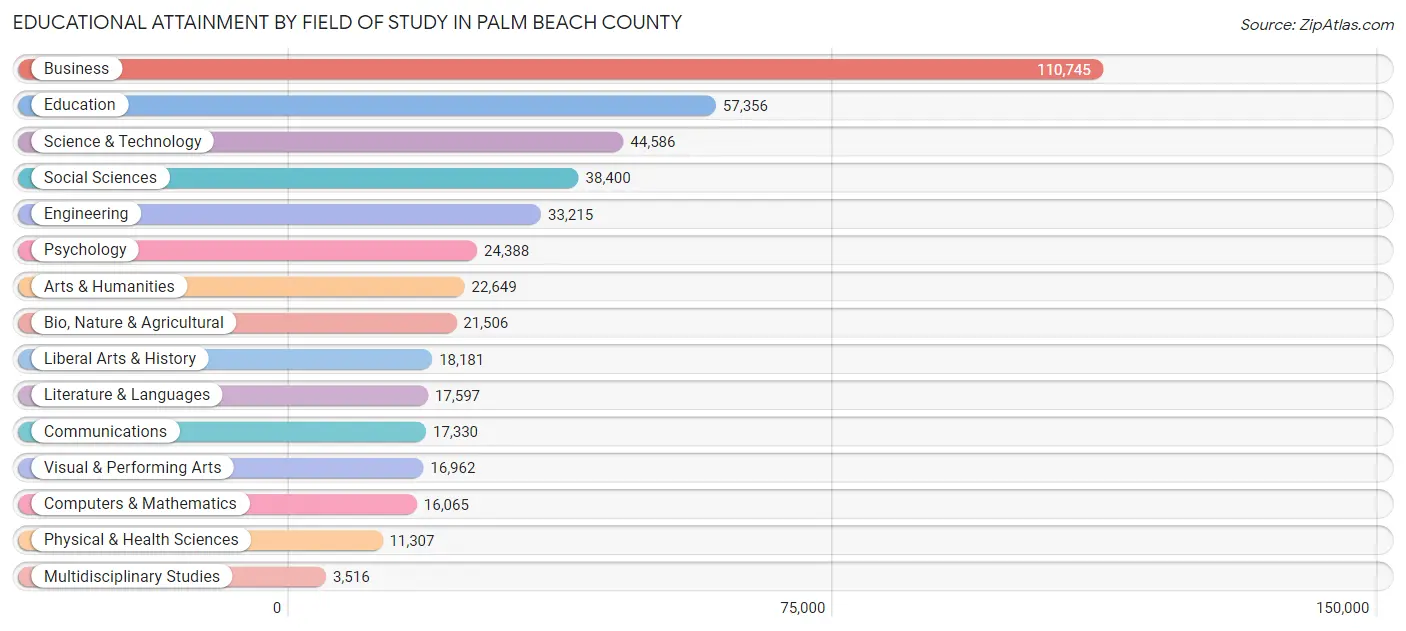
| Field of Study | # Graduates | % Graduates |
| Computers & Mathematics | 16,065 | 3.5% |
| Bio, Nature & Agricultural | 21,506 | 4.7% |
| Physical & Health Sciences | 11,307 | 2.5% |
| Psychology | 24,388 | 5.4% |
| Social Sciences | 38,400 | 8.5% |
| Engineering | 33,215 | 7.3% |
| Multidisciplinary Studies | 3,516 | 0.8% |
| Science & Technology | 44,586 | 9.8% |
| Business | 110,745 | 24.4% |
| Education | 57,356 | 12.6% |
| Literature & Languages | 17,597 | 3.9% |
| Liberal Arts & History | 18,181 | 4.0% |
| Visual & Performing Arts | 16,962 | 3.7% |
| Communications | 17,330 | 3.8% |
| Arts & Humanities | 22,649 | 5.0% |
| Total | 453,803 | 100.0% |
Transportation & Commute in Palm Beach County
Vehicle Availability by Sex in Palm Beach County
The most prevalent vehicle ownership categories in Palm Beach County are males with 2 vehicles (166,672, accounting for 45.7%) and females with 2 vehicles (133,411, making up 53.0%).
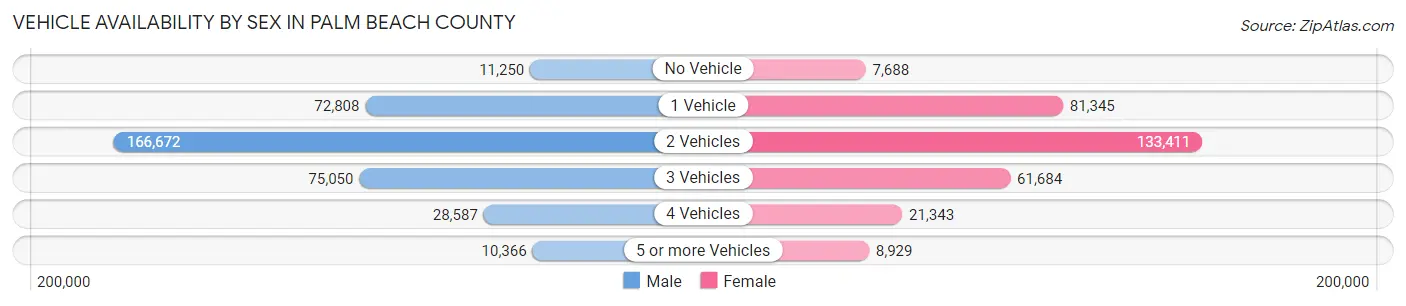
| Vehicles Available | Male | Female |
| No Vehicle | 11,250 (3.1%) | 7,688 (2.5%) |
| 1 Vehicle | 72,808 (20.0%) | 81,345 (25.9%) |
| 2 Vehicles | 166,672 (45.7%) | 133,411 (42.4%) |
| 3 Vehicles | 75,050 (20.6%) | 61,684 (19.6%) |
| 4 Vehicles | 28,587 (7.8%) | 21,343 (6.8%) |
| 5 or more Vehicles | 10,366 (2.8%) | 8,929 (2.8%) |
| Total | 364,733 (100.0%) | 314,400 (100.0%) |
Commute Time in Palm Beach County
The most frequently occuring commute durations in Palm Beach County are 30 to 34 minutes (100,229 commuters, 16.7%), 15 to 19 minutes (95,610 commuters, 16.0%), and 20 to 24 minutes (95,232 commuters, 15.9%).
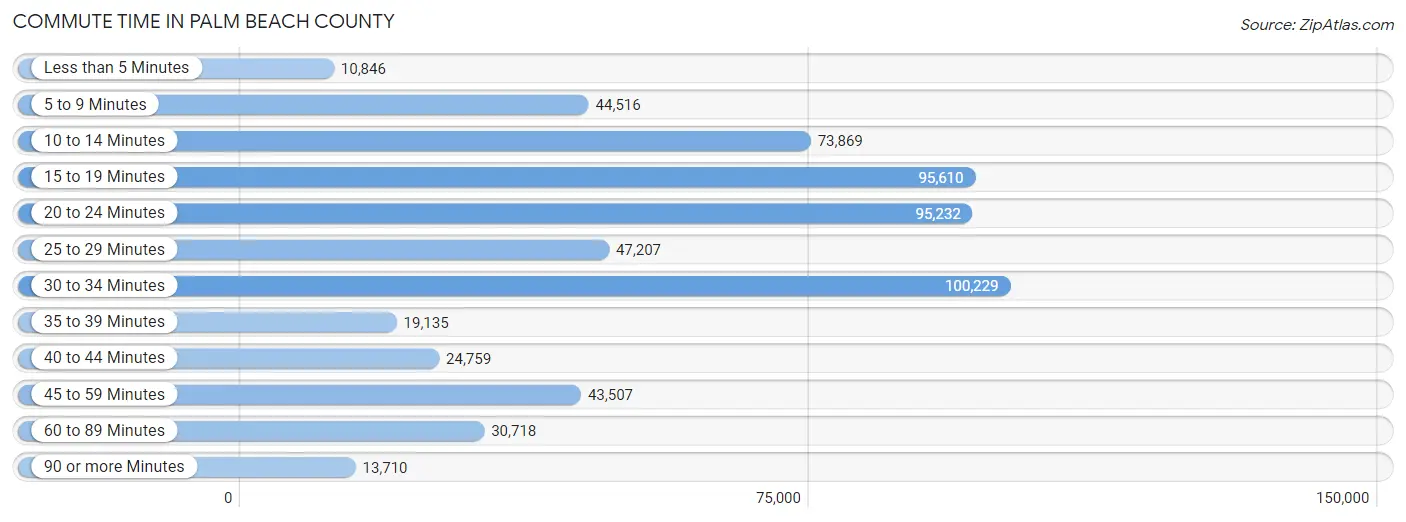
| Commute Time | # Commuters | % Commuters |
| Less than 5 Minutes | 10,846 | 1.8% |
| 5 to 9 Minutes | 44,516 | 7.4% |
| 10 to 14 Minutes | 73,869 | 12.3% |
| 15 to 19 Minutes | 95,610 | 16.0% |
| 20 to 24 Minutes | 95,232 | 15.9% |
| 25 to 29 Minutes | 47,207 | 7.9% |
| 30 to 34 Minutes | 100,229 | 16.7% |
| 35 to 39 Minutes | 19,135 | 3.2% |
| 40 to 44 Minutes | 24,759 | 4.1% |
| 45 to 59 Minutes | 43,507 | 7.3% |
| 60 to 89 Minutes | 30,718 | 5.1% |
| 90 or more Minutes | 13,710 | 2.3% |
Commute Time by Sex in Palm Beach County
The most common commute times in Palm Beach County are 30 to 34 minutes (56,686 commuters, 17.5%) for males and 15 to 19 minutes (46,096 commuters, 16.8%) for females.
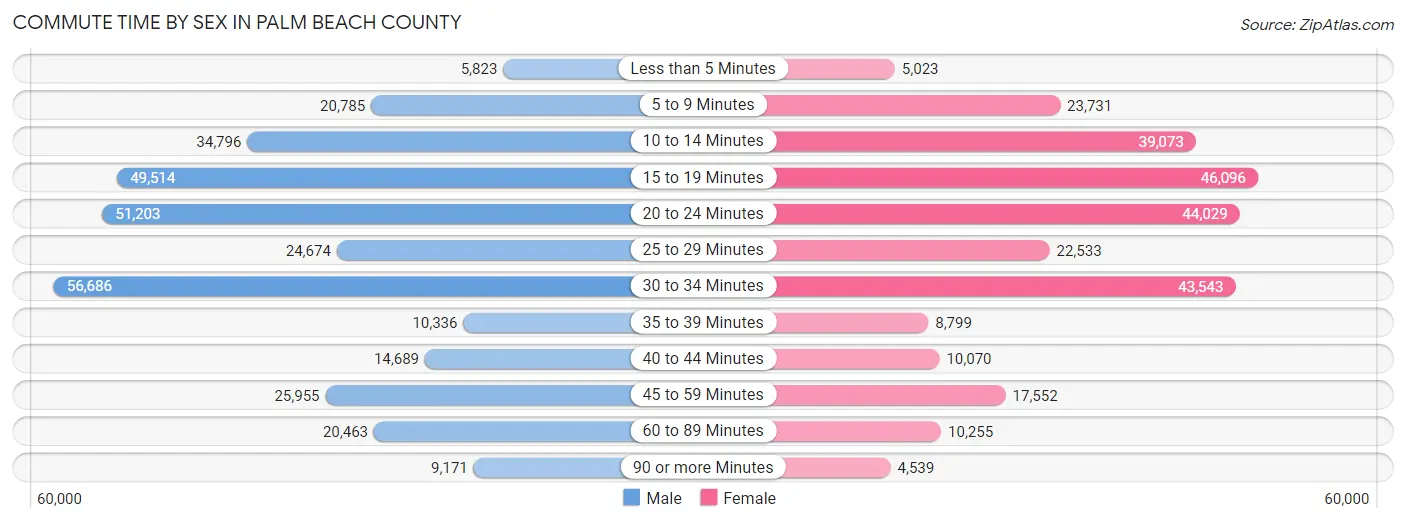
| Commute Time | Male | Female |
| Less than 5 Minutes | 5,823 (1.8%) | 5,023 (1.8%) |
| 5 to 9 Minutes | 20,785 (6.4%) | 23,731 (8.6%) |
| 10 to 14 Minutes | 34,796 (10.7%) | 39,073 (14.2%) |
| 15 to 19 Minutes | 49,514 (15.3%) | 46,096 (16.8%) |
| 20 to 24 Minutes | 51,203 (15.8%) | 44,029 (16.0%) |
| 25 to 29 Minutes | 24,674 (7.6%) | 22,533 (8.2%) |
| 30 to 34 Minutes | 56,686 (17.5%) | 43,543 (15.8%) |
| 35 to 39 Minutes | 10,336 (3.2%) | 8,799 (3.2%) |
| 40 to 44 Minutes | 14,689 (4.5%) | 10,070 (3.7%) |
| 45 to 59 Minutes | 25,955 (8.0%) | 17,552 (6.4%) |
| 60 to 89 Minutes | 20,463 (6.3%) | 10,255 (3.7%) |
| 90 or more Minutes | 9,171 (2.8%) | 4,539 (1.7%) |
Time of Departure to Work by Sex in Palm Beach County
The most frequent times of departure to work in Palm Beach County are 7:00 AM to 7:29 AM (49,191, 15.2%) for males and 8:00 AM to 8:29 AM (42,545, 15.5%) for females.
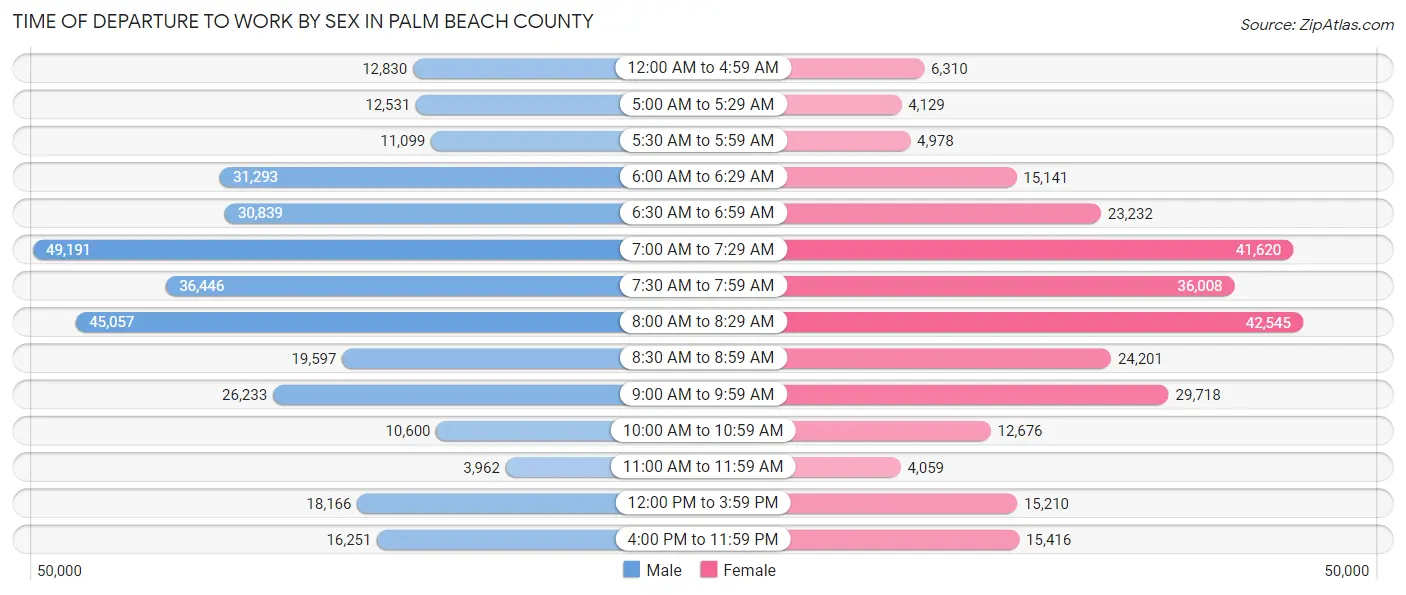
| Time of Departure | Male | Female |
| 12:00 AM to 4:59 AM | 12,830 (4.0%) | 6,310 (2.3%) |
| 5:00 AM to 5:29 AM | 12,531 (3.9%) | 4,129 (1.5%) |
| 5:30 AM to 5:59 AM | 11,099 (3.4%) | 4,978 (1.8%) |
| 6:00 AM to 6:29 AM | 31,293 (9.7%) | 15,141 (5.5%) |
| 6:30 AM to 6:59 AM | 30,839 (9.5%) | 23,232 (8.4%) |
| 7:00 AM to 7:29 AM | 49,191 (15.2%) | 41,620 (15.1%) |
| 7:30 AM to 7:59 AM | 36,446 (11.3%) | 36,008 (13.1%) |
| 8:00 AM to 8:29 AM | 45,057 (13.9%) | 42,545 (15.5%) |
| 8:30 AM to 8:59 AM | 19,597 (6.0%) | 24,201 (8.8%) |
| 9:00 AM to 9:59 AM | 26,233 (8.1%) | 29,718 (10.8%) |
| 10:00 AM to 10:59 AM | 10,600 (3.3%) | 12,676 (4.6%) |
| 11:00 AM to 11:59 AM | 3,962 (1.2%) | 4,059 (1.5%) |
| 12:00 PM to 3:59 PM | 18,166 (5.6%) | 15,210 (5.5%) |
| 4:00 PM to 11:59 PM | 16,251 (5.0%) | 15,416 (5.6%) |
| Total | 324,095 (100.0%) | 275,243 (100.0%) |
Housing Occupancy in Palm Beach County
Occupancy by Ownership in Palm Beach County
Of the total 589,594 dwellings in Palm Beach County, owner-occupied units account for 409,975 (69.5%), while renter-occupied units make up 179,619 (30.5%).
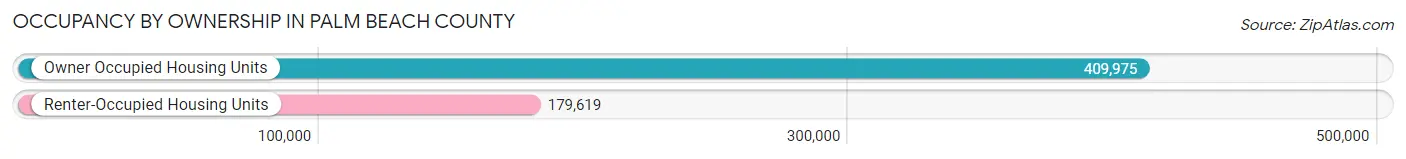
| Occupancy | # Housing Units | % Housing Units |
| Owner Occupied Housing Units | 409,975 | 69.5% |
| Renter-Occupied Housing Units | 179,619 | 30.5% |
| Total Occupied Housing Units | 589,594 | 100.0% |
Occupancy by Household Size in Palm Beach County
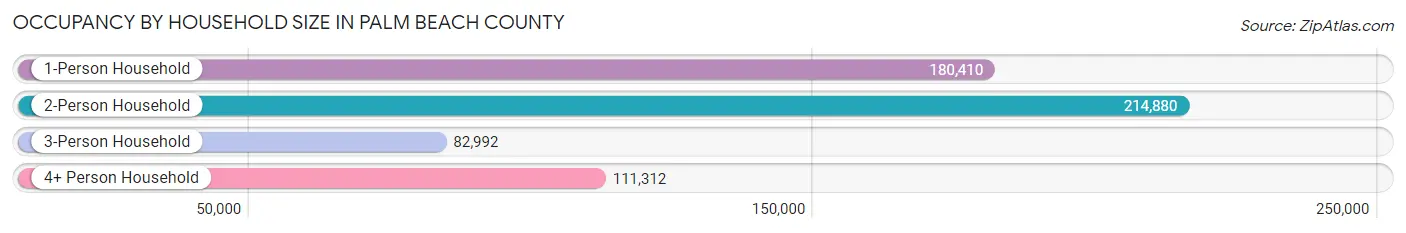
| Household Size | # Housing Units | % Housing Units |
| 1-Person Household | 180,410 | 30.6% |
| 2-Person Household | 214,880 | 36.4% |
| 3-Person Household | 82,992 | 14.1% |
| 4+ Person Household | 111,312 | 18.9% |
| Total Housing Units | 589,594 | 100.0% |
Occupancy by Ownership by Household Size in Palm Beach County
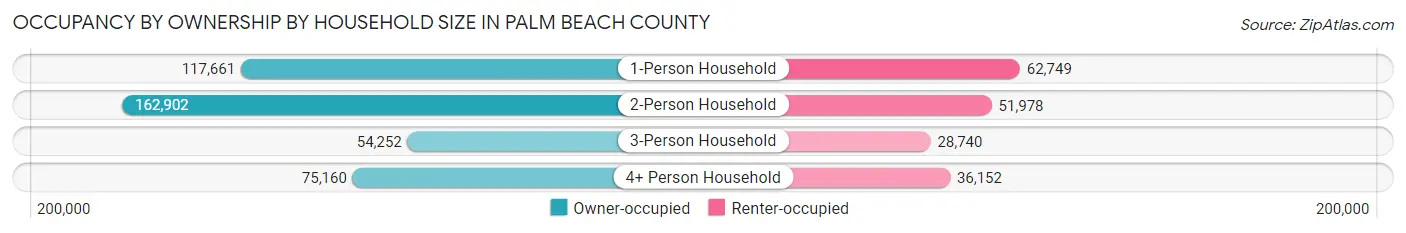
| Household Size | Owner-occupied | Renter-occupied |
| 1-Person Household | 117,661 (65.2%) | 62,749 (34.8%) |
| 2-Person Household | 162,902 (75.8%) | 51,978 (24.2%) |
| 3-Person Household | 54,252 (65.4%) | 28,740 (34.6%) |
| 4+ Person Household | 75,160 (67.5%) | 36,152 (32.5%) |
| Total Housing Units | 409,975 (69.5%) | 179,619 (30.5%) |
Occupancy by Educational Attainment in Palm Beach County
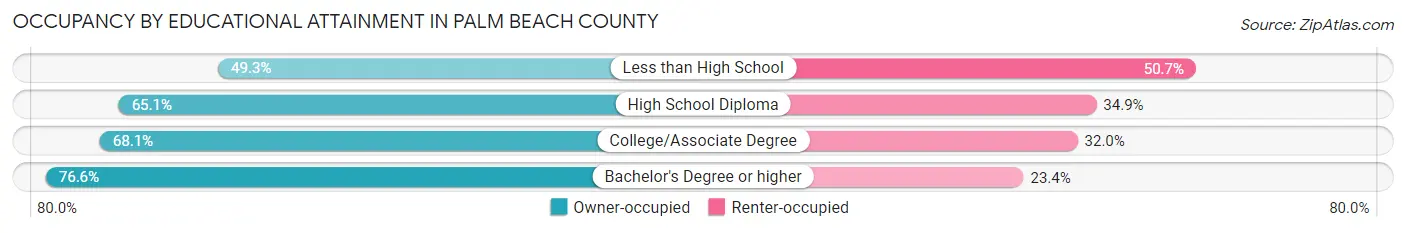
| Household Size | Owner-occupied | Renter-occupied |
| Less than High School | 24,993 (49.3%) | 25,692 (50.7%) |
| High School Diploma | 76,078 (65.1%) | 40,834 (34.9%) |
| College/Associate Degree | 114,604 (68.0%) | 53,805 (32.0%) |
| Bachelor's Degree or higher | 194,300 (76.6%) | 59,288 (23.4%) |
Occupancy by Age of Householder in Palm Beach County
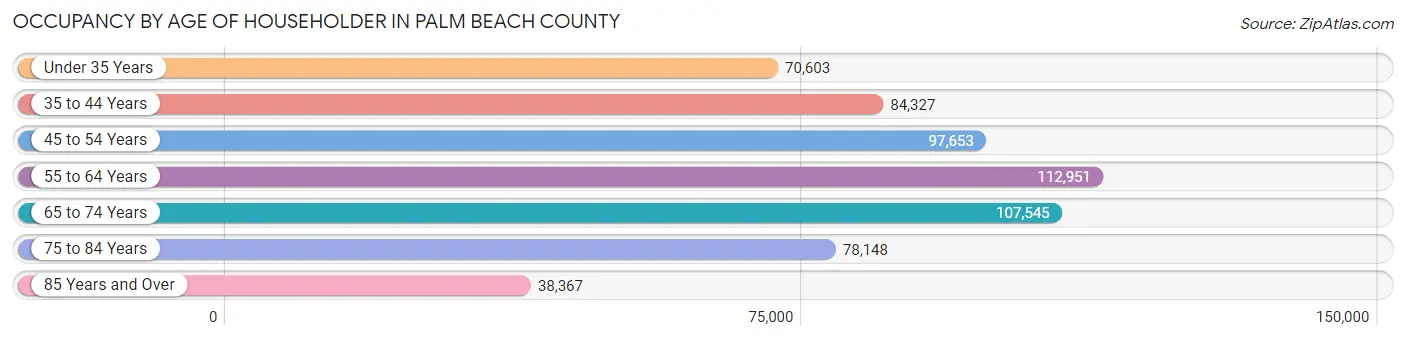
| Age Bracket | # Households | % Households |
| Under 35 Years | 70,603 | 12.0% |
| 35 to 44 Years | 84,327 | 14.3% |
| 45 to 54 Years | 97,653 | 16.6% |
| 55 to 64 Years | 112,951 | 19.2% |
| 65 to 74 Years | 107,545 | 18.2% |
| 75 to 84 Years | 78,148 | 13.3% |
| 85 Years and Over | 38,367 | 6.5% |
| Total | 589,594 | 100.0% |
Housing Finances in Palm Beach County
Median Income by Occupancy in Palm Beach County
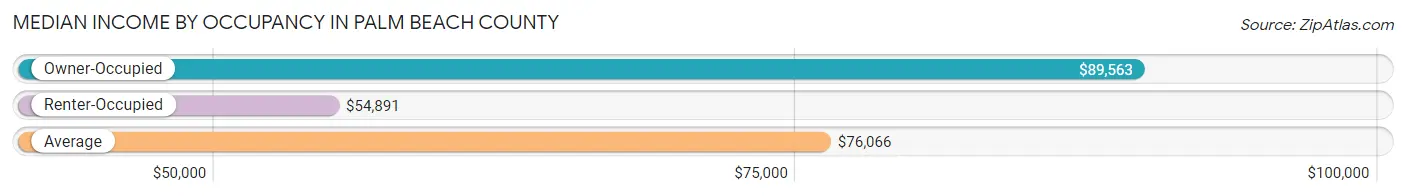
| Occupancy Type | # Households | Median Income |
| Owner-Occupied | 409,975 (69.5%) | $89,563 |
| Renter-Occupied | 179,619 (30.5%) | $54,891 |
| Average | 589,594 (100.0%) | $76,066 |
Occupancy by Householder Income Bracket in Palm Beach County
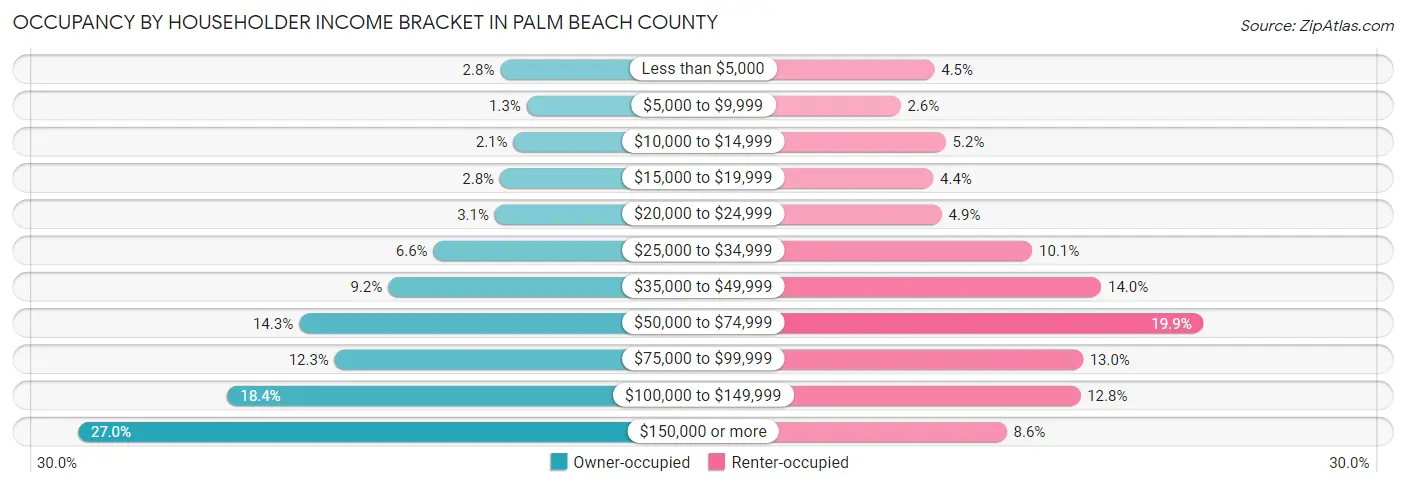
| Income Bracket | Owner-occupied | Renter-occupied |
| Less than $5,000 | 11,560 (2.8%) | 8,084 (4.5%) |
| $5,000 to $9,999 | 5,352 (1.3%) | 4,609 (2.6%) |
| $10,000 to $14,999 | 8,476 (2.1%) | 9,242 (5.1%) |
| $15,000 to $19,999 | 11,645 (2.8%) | 7,952 (4.4%) |
| $20,000 to $24,999 | 12,823 (3.1%) | 8,830 (4.9%) |
| $25,000 to $34,999 | 27,210 (6.6%) | 18,131 (10.1%) |
| $35,000 to $49,999 | 37,844 (9.2%) | 25,200 (14.0%) |
| $50,000 to $74,999 | 58,710 (14.3%) | 35,709 (19.9%) |
| $75,000 to $99,999 | 50,327 (12.3%) | 23,306 (13.0%) |
| $100,000 to $149,999 | 75,481 (18.4%) | 23,061 (12.8%) |
| $150,000 or more | 110,547 (27.0%) | 15,495 (8.6%) |
| Total | 409,975 (100.0%) | 179,619 (100.0%) |
Monthly Housing Cost Tiers in Palm Beach County
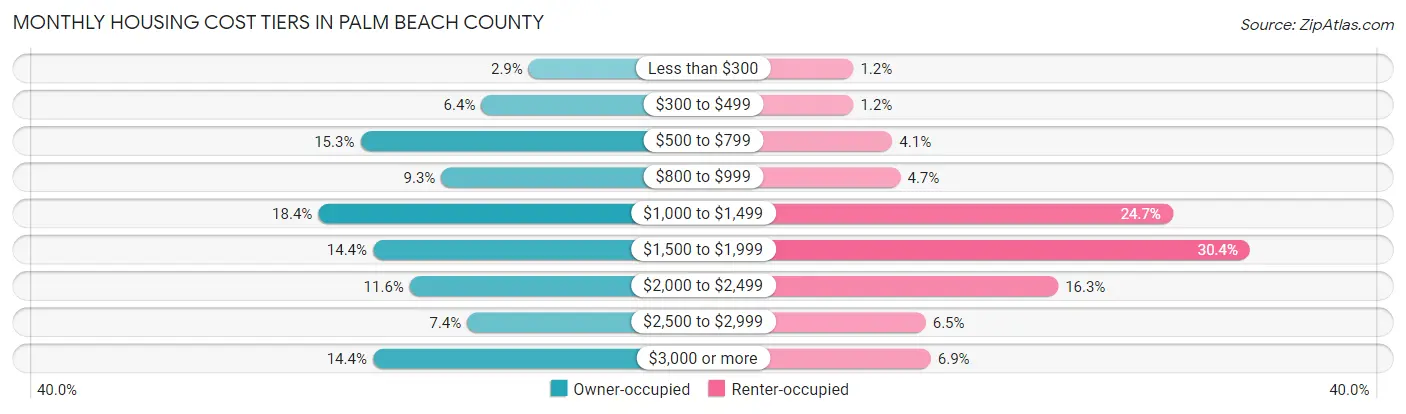
| Monthly Cost | Owner-occupied | Renter-occupied |
| Less than $300 | 11,788 (2.9%) | 2,128 (1.2%) |
| $300 to $499 | 26,115 (6.4%) | 2,133 (1.2%) |
| $500 to $799 | 62,657 (15.3%) | 7,282 (4.1%) |
| $800 to $999 | 38,207 (9.3%) | 8,354 (4.6%) |
| $1,000 to $1,499 | 75,364 (18.4%) | 44,355 (24.7%) |
| $1,500 to $1,999 | 58,845 (14.3%) | 54,542 (30.4%) |
| $2,000 to $2,499 | 47,738 (11.6%) | 29,203 (16.3%) |
| $2,500 to $2,999 | 30,371 (7.4%) | 11,687 (6.5%) |
| $3,000 or more | 58,890 (14.4%) | 12,351 (6.9%) |
| Total | 409,975 (100.0%) | 179,619 (100.0%) |
Physical Housing Characteristics in Palm Beach County
Housing Structures in Palm Beach County
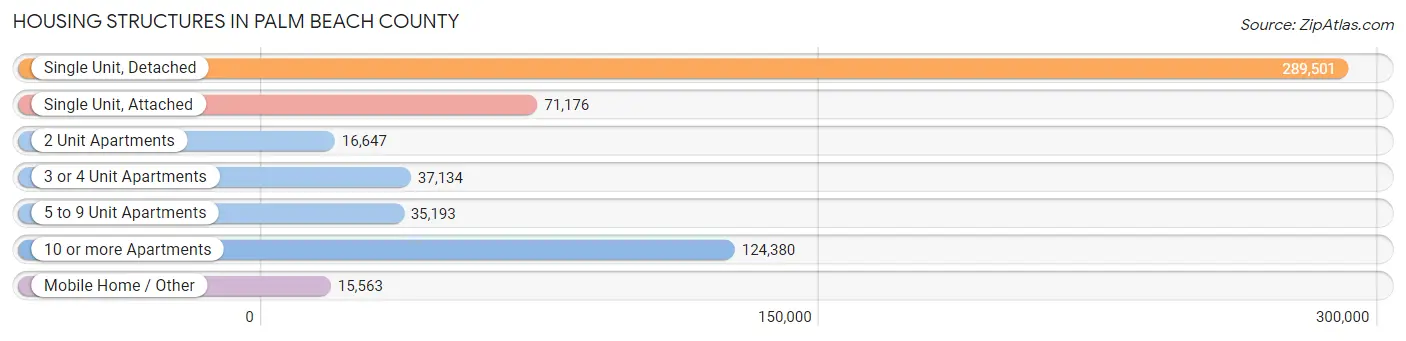
| Structure Type | # Housing Units | % Housing Units |
| Single Unit, Detached | 289,501 | 49.1% |
| Single Unit, Attached | 71,176 | 12.1% |
| 2 Unit Apartments | 16,647 | 2.8% |
| 3 or 4 Unit Apartments | 37,134 | 6.3% |
| 5 to 9 Unit Apartments | 35,193 | 6.0% |
| 10 or more Apartments | 124,380 | 21.1% |
| Mobile Home / Other | 15,563 | 2.6% |
| Total | 589,594 | 100.0% |
Housing Structures by Occupancy in Palm Beach County
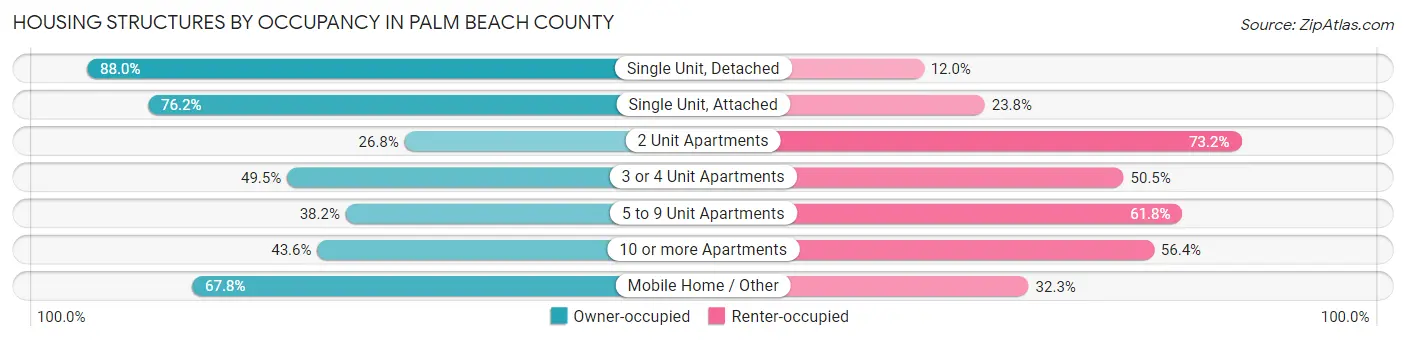
| Structure Type | Owner-occupied | Renter-occupied |
| Single Unit, Detached | 254,646 (88.0%) | 34,855 (12.0%) |
| Single Unit, Attached | 54,235 (76.2%) | 16,941 (23.8%) |
| 2 Unit Apartments | 4,467 (26.8%) | 12,180 (73.2%) |
| 3 or 4 Unit Apartments | 18,370 (49.5%) | 18,764 (50.5%) |
| 5 to 9 Unit Apartments | 13,434 (38.2%) | 21,759 (61.8%) |
| 10 or more Apartments | 54,279 (43.6%) | 70,101 (56.4%) |
| Mobile Home / Other | 10,544 (67.7%) | 5,019 (32.3%) |
| Total | 409,975 (69.5%) | 179,619 (30.5%) |
Housing Structures by Number of Rooms in Palm Beach County
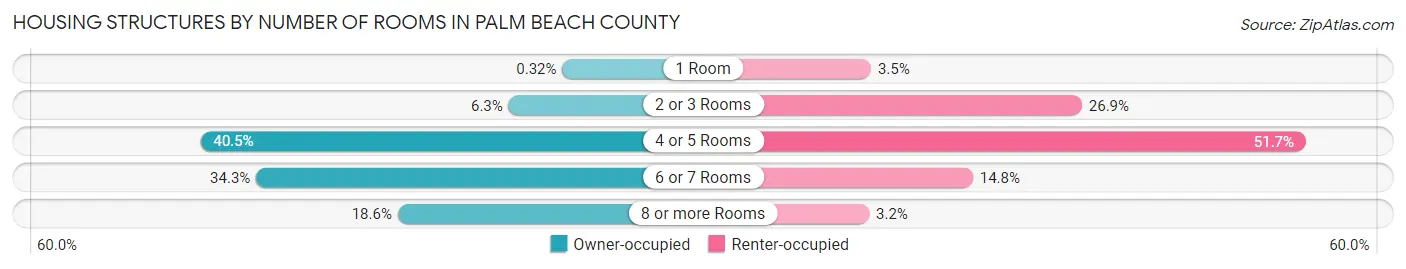
| Number of Rooms | Owner-occupied | Renter-occupied |
| 1 Room | 1,325 (0.3%) | 6,190 (3.5%) |
| 2 or 3 Rooms | 25,746 (6.3%) | 48,219 (26.9%) |
| 4 or 5 Rooms | 166,052 (40.5%) | 92,886 (51.7%) |
| 6 or 7 Rooms | 140,632 (34.3%) | 26,498 (14.7%) |
| 8 or more Rooms | 76,220 (18.6%) | 5,826 (3.2%) |
| Total | 409,975 (100.0%) | 179,619 (100.0%) |
Housing Structure by Heating Type in Palm Beach County
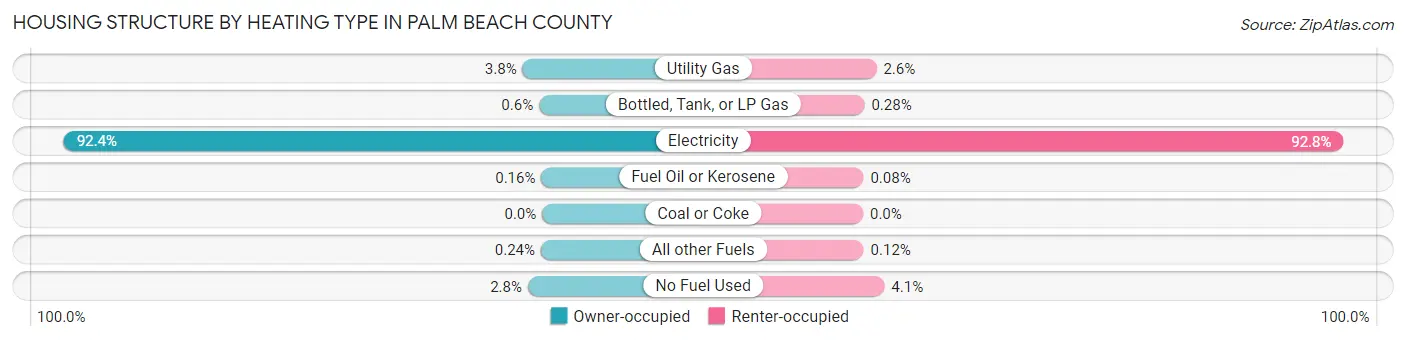
| Heating Type | Owner-occupied | Renter-occupied |
| Utility Gas | 15,532 (3.8%) | 4,664 (2.6%) |
| Bottled, Tank, or LP Gas | 2,451 (0.6%) | 501 (0.3%) |
| Electricity | 378,999 (92.4%) | 166,672 (92.8%) |
| Fuel Oil or Kerosene | 673 (0.2%) | 145 (0.1%) |
| Coal or Coke | 5 (0.0%) | 0 (0.0%) |
| All other Fuels | 984 (0.2%) | 214 (0.1%) |
| No Fuel Used | 11,331 (2.8%) | 7,423 (4.1%) |
| Total | 409,975 (100.0%) | 179,619 (100.0%) |
Household Vehicle Usage in Palm Beach County
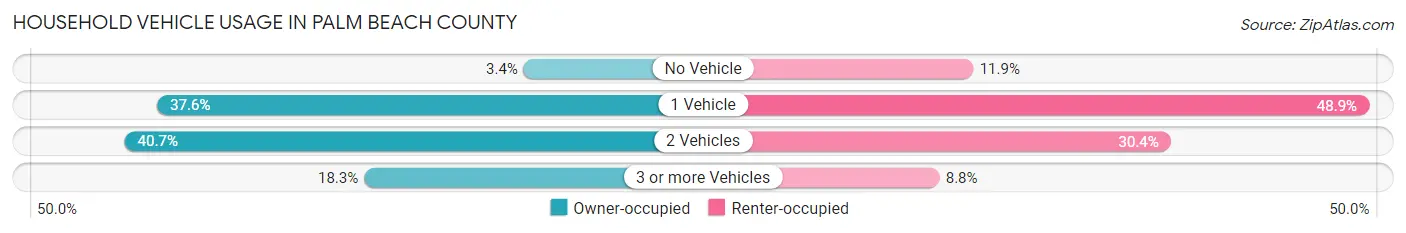
| Vehicles per Household | Owner-occupied | Renter-occupied |
| No Vehicle | 13,980 (3.4%) | 21,422 (11.9%) |
| 1 Vehicle | 154,258 (37.6%) | 87,859 (48.9%) |
| 2 Vehicles | 166,683 (40.7%) | 54,598 (30.4%) |
| 3 or more Vehicles | 75,054 (18.3%) | 15,740 (8.8%) |
| Total | 409,975 (100.0%) | 179,619 (100.0%) |
Real Estate & Mortgages in Palm Beach County
Real Estate and Mortgage Overview in Palm Beach County
| Characteristic | Without Mortgage | With Mortgage |
| Housing Units | 190,823 | 219,152 |
| Median Property Value | $338,800 | $387,400 |
| Median Household Income | $68,931 | $68,594 |
| Monthly Housing Costs | $803 | $50,958 |
| Real Estate Taxes | $2,996 | $3,831 |
Property Value by Mortgage Status in Palm Beach County
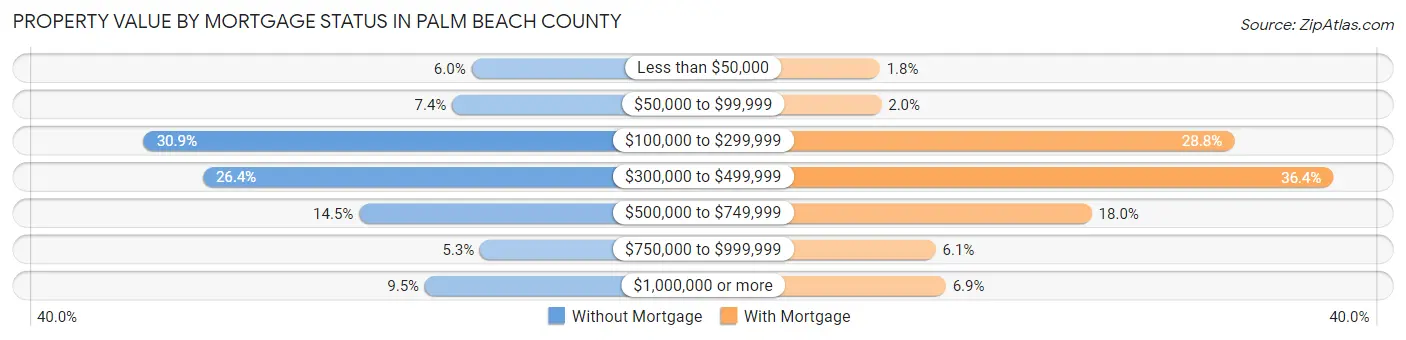
| Property Value | Without Mortgage | With Mortgage |
| Less than $50,000 | 11,346 (5.9%) | 4,023 (1.8%) |
| $50,000 to $99,999 | 14,150 (7.4%) | 4,295 (2.0%) |
| $100,000 to $299,999 | 59,009 (30.9%) | 63,209 (28.8%) |
| $300,000 to $499,999 | 50,390 (26.4%) | 79,767 (36.4%) |
| $500,000 to $749,999 | 27,683 (14.5%) | 39,431 (18.0%) |
| $750,000 to $999,999 | 10,109 (5.3%) | 13,363 (6.1%) |
| $1,000,000 or more | 18,136 (9.5%) | 15,064 (6.9%) |
| Total | 190,823 (100.0%) | 219,152 (100.0%) |
Household Income by Mortgage Status in Palm Beach County
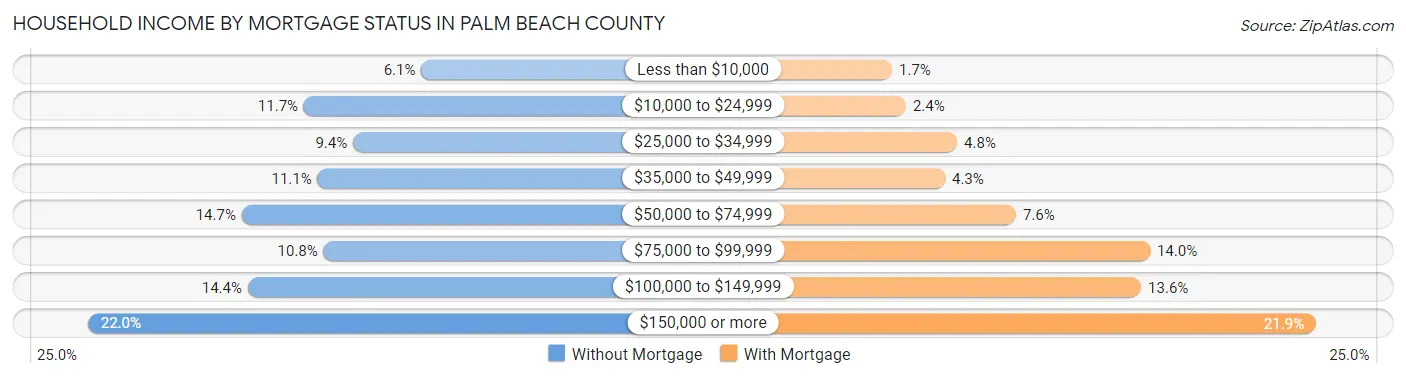
| Household Income | Without Mortgage | With Mortgage |
| Less than $10,000 | 11,650 (6.1%) | 3,821 (1.7%) |
| $10,000 to $24,999 | 22,327 (11.7%) | 5,262 (2.4%) |
| $25,000 to $34,999 | 17,867 (9.4%) | 10,617 (4.8%) |
| $35,000 to $49,999 | 21,090 (11.1%) | 9,343 (4.3%) |
| $50,000 to $74,999 | 27,979 (14.7%) | 16,754 (7.6%) |
| $75,000 to $99,999 | 20,528 (10.8%) | 30,731 (14.0%) |
| $100,000 to $149,999 | 27,429 (14.4%) | 29,799 (13.6%) |
| $150,000 or more | 41,953 (22.0%) | 48,052 (21.9%) |
| Total | 190,823 (100.0%) | 219,152 (100.0%) |
Property Value to Household Income Ratio in Palm Beach County
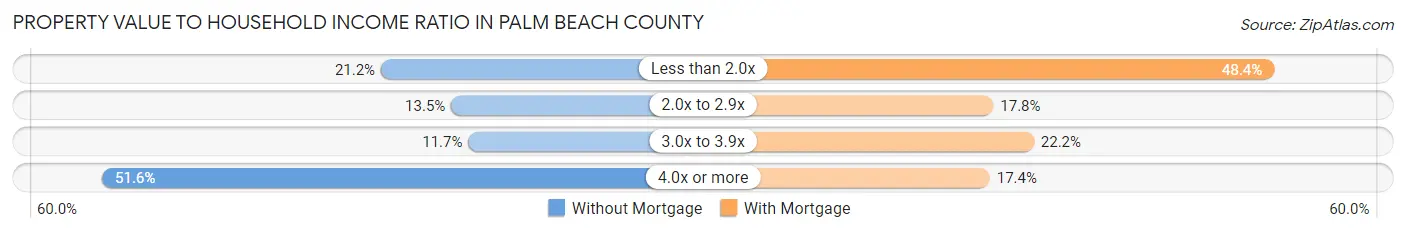
| Value-to-Income Ratio | Without Mortgage | With Mortgage |
| Less than 2.0x | 40,406 (21.2%) | 106,078 (48.4%) |
| 2.0x to 2.9x | 25,802 (13.5%) | 39,025 (17.8%) |
| 3.0x to 3.9x | 22,234 (11.7%) | 48,703 (22.2%) |
| 4.0x or more | 98,394 (51.6%) | 38,174 (17.4%) |
| Total | 190,823 (100.0%) | 219,152 (100.0%) |
Real Estate Taxes by Mortgage Status in Palm Beach County
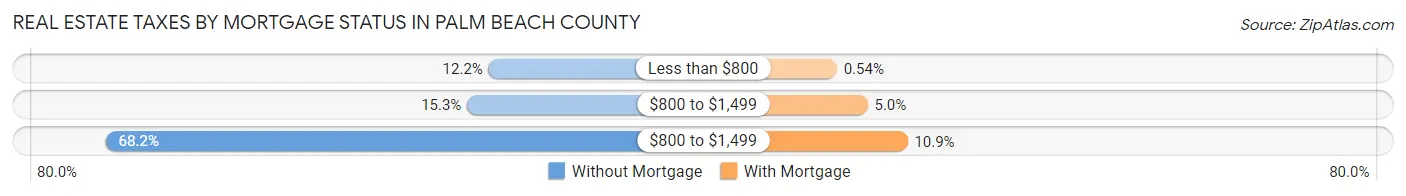
| Property Taxes | Without Mortgage | With Mortgage |
| Less than $800 | 23,264 (12.2%) | 1,175 (0.5%) |
| $800 to $1,499 | 29,245 (15.3%) | 11,047 (5.0%) |
| $800 to $1,499 | 130,084 (68.2%) | 23,827 (10.9%) |
| Total | 190,823 (100.0%) | 219,152 (100.0%) |
Health & Disability in Palm Beach County
Health Insurance Coverage by Age in Palm Beach County
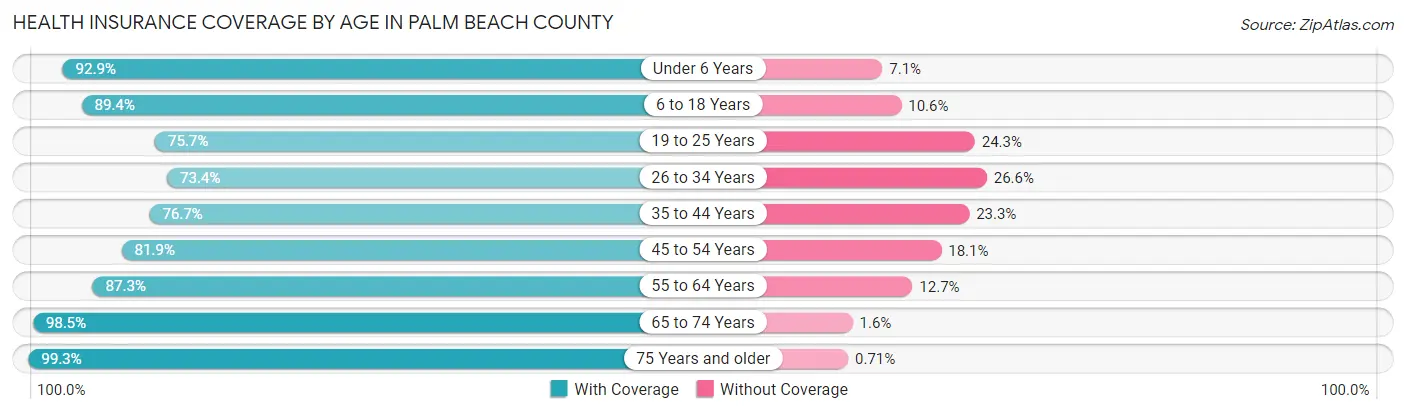
| Age Bracket | With Coverage | Without Coverage |
| Under 6 Years | 81,753 (92.9%) | 6,247 (7.1%) |
| 6 to 18 Years | 188,104 (89.4%) | 22,372 (10.6%) |
| 19 to 25 Years | 85,971 (75.7%) | 27,641 (24.3%) |
| 26 to 34 Years | 113,432 (73.4%) | 41,043 (26.6%) |
| 35 to 44 Years | 132,094 (76.7%) | 40,098 (23.3%) |
| 45 to 54 Years | 151,398 (81.9%) | 33,439 (18.1%) |
| 55 to 64 Years | 173,969 (87.3%) | 25,311 (12.7%) |
| 65 to 74 Years | 172,291 (98.5%) | 2,709 (1.5%) |
| 75 Years and older | 181,436 (99.3%) | 1,299 (0.7%) |
| Total | 1,280,448 (86.5%) | 200,159 (13.5%) |
Health Insurance Coverage by Citizenship Status in Palm Beach County
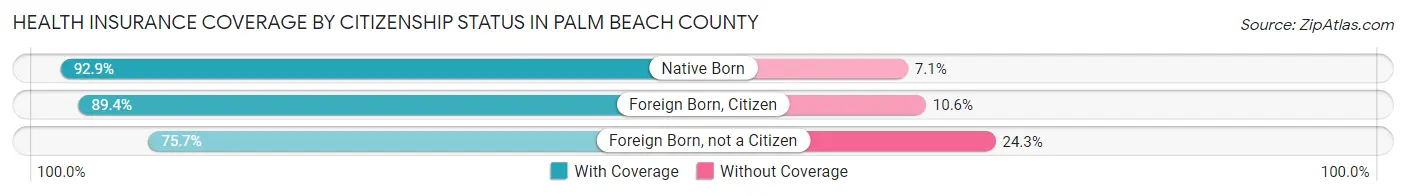
| Citizenship Status | With Coverage | Without Coverage |
| Native Born | 81,753 (92.9%) | 6,247 (7.1%) |
| Foreign Born, Citizen | 188,104 (89.4%) | 22,372 (10.6%) |
| Foreign Born, not a Citizen | 85,971 (75.7%) | 27,641 (24.3%) |
Health Insurance Coverage by Household Income in Palm Beach County
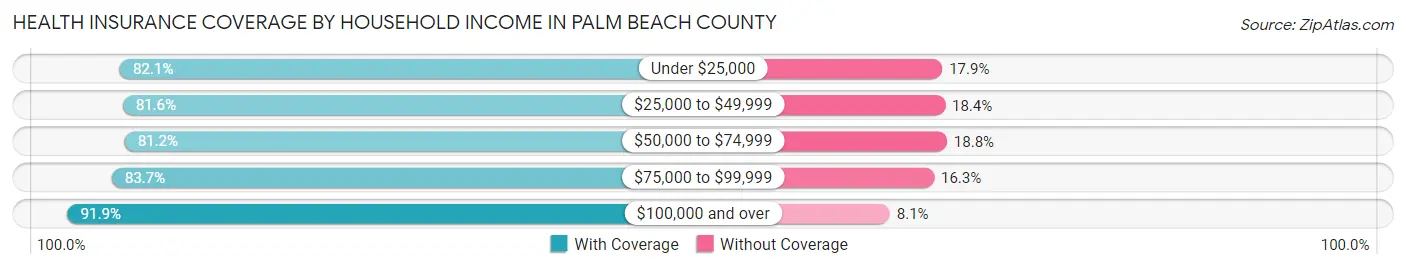
| Household Income | With Coverage | Without Coverage |
| Under $25,000 | 125,849 (82.1%) | 27,393 (17.9%) |
| $25,000 to $49,999 | 184,594 (81.6%) | 41,614 (18.4%) |
| $50,000 to $74,999 | 187,934 (81.2%) | 43,392 (18.8%) |
| $75,000 to $99,999 | 166,906 (83.7%) | 32,588 (16.3%) |
| $100,000 and over | 605,943 (91.9%) | 53,165 (8.1%) |
Public vs Private Health Insurance Coverage by Age in Palm Beach County
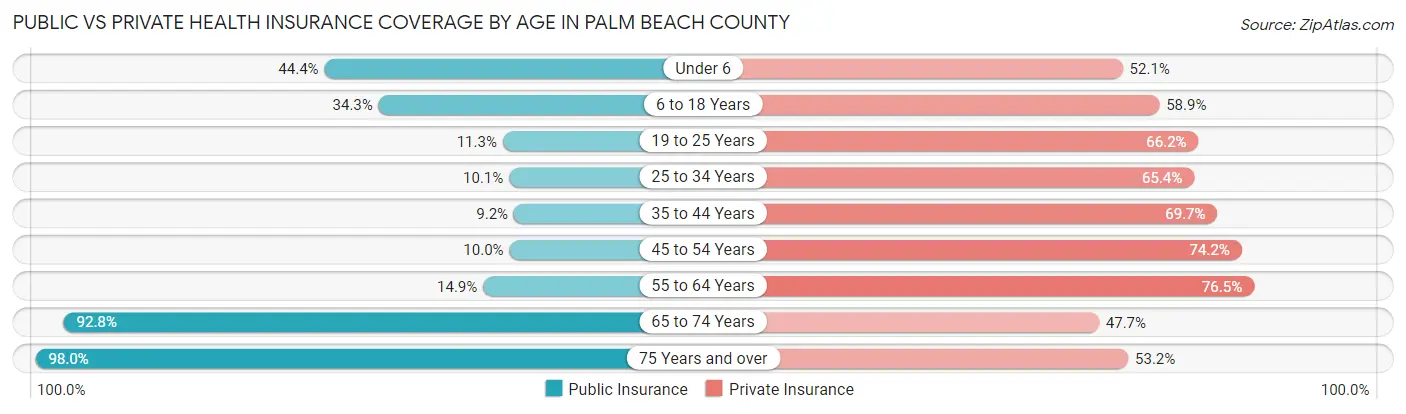
| Age Bracket | Public Insurance | Private Insurance |
| Under 6 | 39,030 (44.4%) | 45,878 (52.1%) |
| 6 to 18 Years | 72,166 (34.3%) | 124,021 (58.9%) |
| 19 to 25 Years | 12,776 (11.3%) | 75,201 (66.2%) |
| 25 to 34 Years | 15,555 (10.1%) | 101,000 (65.4%) |
| 35 to 44 Years | 15,792 (9.2%) | 120,012 (69.7%) |
| 45 to 54 Years | 18,509 (10.0%) | 137,162 (74.2%) |
| 55 to 64 Years | 29,665 (14.9%) | 152,447 (76.5%) |
| 65 to 74 Years | 162,314 (92.7%) | 83,495 (47.7%) |
| 75 Years and over | 179,042 (98.0%) | 97,130 (53.1%) |
| Total | 544,849 (36.8%) | 936,346 (63.2%) |
Disability Status by Sex by Age in Palm Beach County
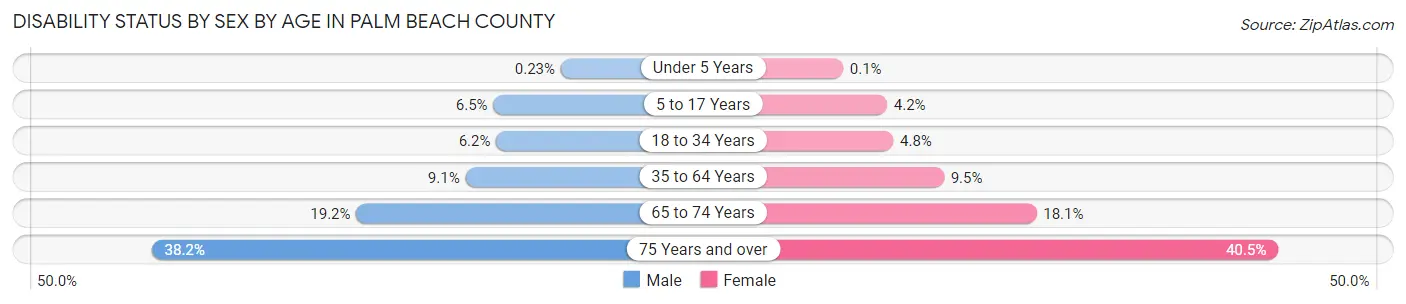
| Age Bracket | Male | Female |
| Under 5 Years | 88 (0.2%) | 37 (0.1%) |
| 5 to 17 Years | 6,869 (6.5%) | 4,248 (4.2%) |
| 18 to 34 Years | 9,022 (6.2%) | 6,696 (4.8%) |
| 35 to 64 Years | 24,810 (9.1%) | 26,778 (9.5%) |
| 65 to 74 Years | 15,325 (19.2%) | 17,191 (18.0%) |
| 75 Years and over | 30,345 (38.2%) | 41,850 (40.5%) |
Disability Class by Sex by Age in Palm Beach County
Disability Class: Hearing Difficulty
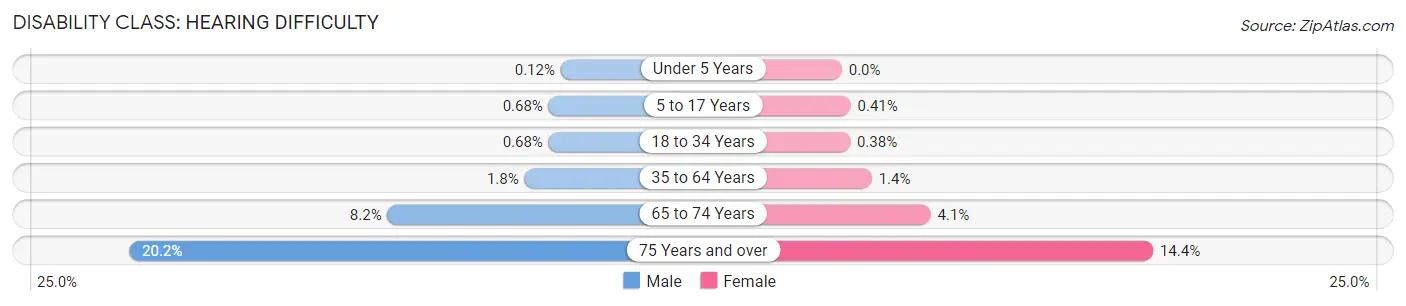
| Age Bracket | Male | Female |
| Under 5 Years | 46 (0.1%) | 1 (0.0%) |
| 5 to 17 Years | 719 (0.7%) | 417 (0.4%) |
| 18 to 34 Years | 979 (0.7%) | 541 (0.4%) |
| 35 to 64 Years | 4,911 (1.8%) | 3,937 (1.4%) |
| 65 to 74 Years | 6,506 (8.2%) | 3,924 (4.1%) |
| 75 Years and over | 15,997 (20.2%) | 14,925 (14.4%) |
Disability Class: Vision Difficulty
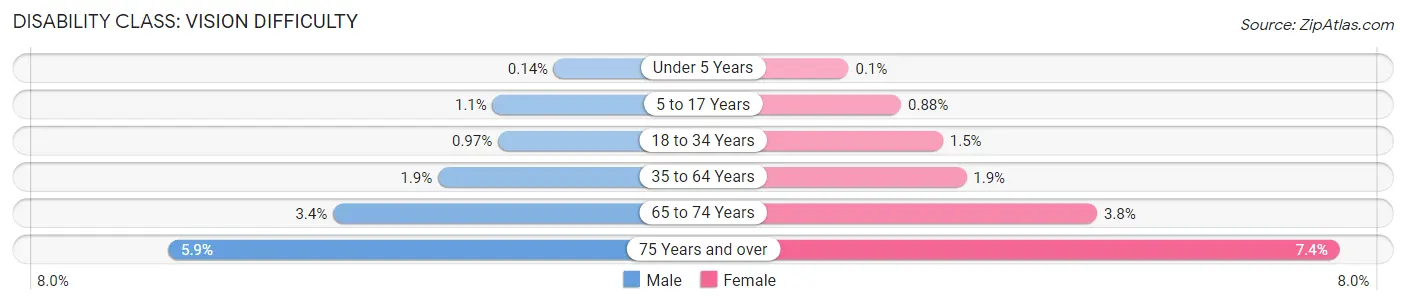
| Age Bracket | Male | Female |
| Under 5 Years | 51 (0.1%) | 36 (0.1%) |
| 5 to 17 Years | 1,112 (1.1%) | 898 (0.9%) |
| 18 to 34 Years | 1,408 (1.0%) | 2,103 (1.5%) |
| 35 to 64 Years | 5,092 (1.9%) | 5,233 (1.8%) |
| 65 to 74 Years | 2,728 (3.4%) | 3,614 (3.8%) |
| 75 Years and over | 4,665 (5.9%) | 7,631 (7.4%) |
Disability Class: Cognitive Difficulty
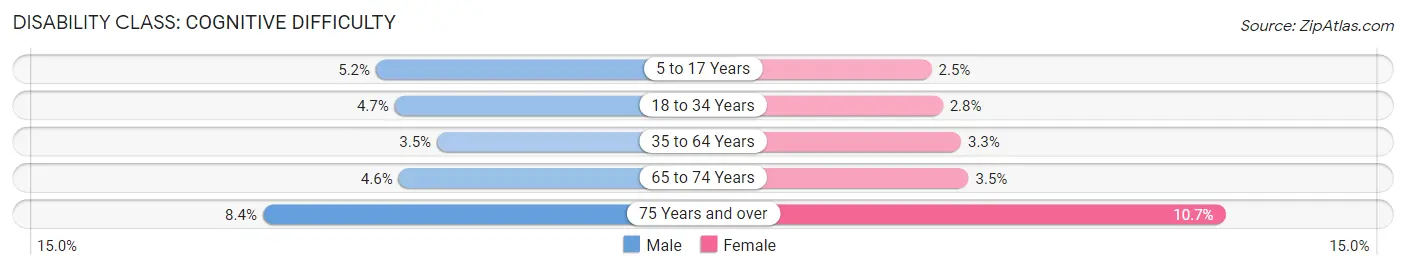
| Age Bracket | Male | Female |
| 5 to 17 Years | 5,517 (5.2%) | 2,546 (2.5%) |
| 18 to 34 Years | 6,812 (4.7%) | 3,952 (2.8%) |
| 35 to 64 Years | 9,609 (3.5%) | 9,383 (3.3%) |
| 65 to 74 Years | 3,664 (4.6%) | 3,361 (3.5%) |
| 75 Years and over | 6,649 (8.4%) | 11,038 (10.7%) |
Disability Class: Ambulatory Difficulty
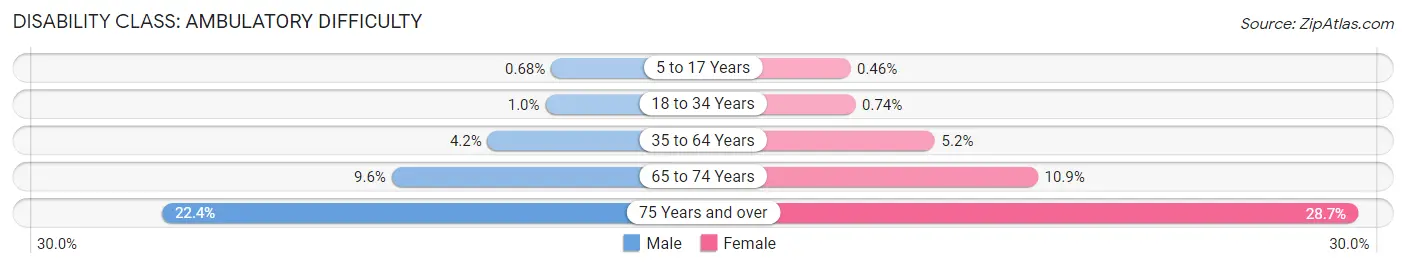
| Age Bracket | Male | Female |
| 5 to 17 Years | 716 (0.7%) | 466 (0.5%) |
| 18 to 34 Years | 1,447 (1.0%) | 1,041 (0.7%) |
| 35 to 64 Years | 11,541 (4.2%) | 14,630 (5.2%) |
| 65 to 74 Years | 7,628 (9.6%) | 10,381 (10.9%) |
| 75 Years and over | 17,751 (22.4%) | 29,698 (28.7%) |
Disability Class: Self-Care Difficulty
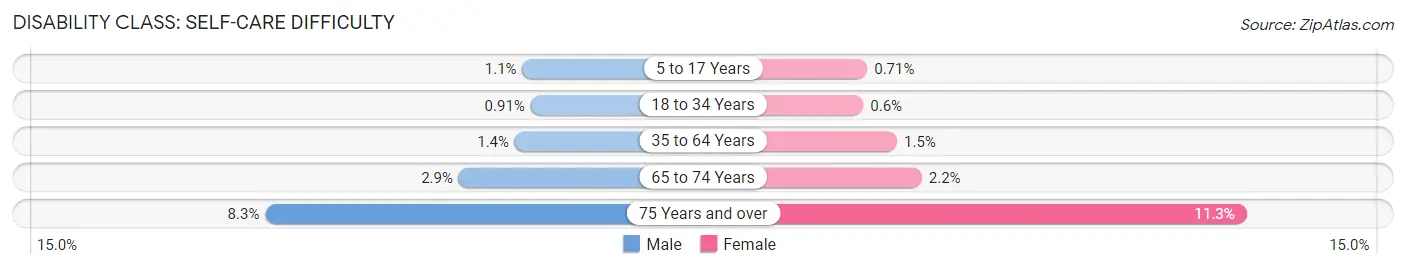
| Age Bracket | Male | Female |
| 5 to 17 Years | 1,205 (1.1%) | 718 (0.7%) |
| 18 to 34 Years | 1,320 (0.9%) | 846 (0.6%) |
| 35 to 64 Years | 3,679 (1.3%) | 4,371 (1.5%) |
| 65 to 74 Years | 2,321 (2.9%) | 2,123 (2.2%) |
| 75 Years and over | 6,588 (8.3%) | 11,643 (11.3%) |
Technology Access in Palm Beach County
Computing Device Access in Palm Beach County
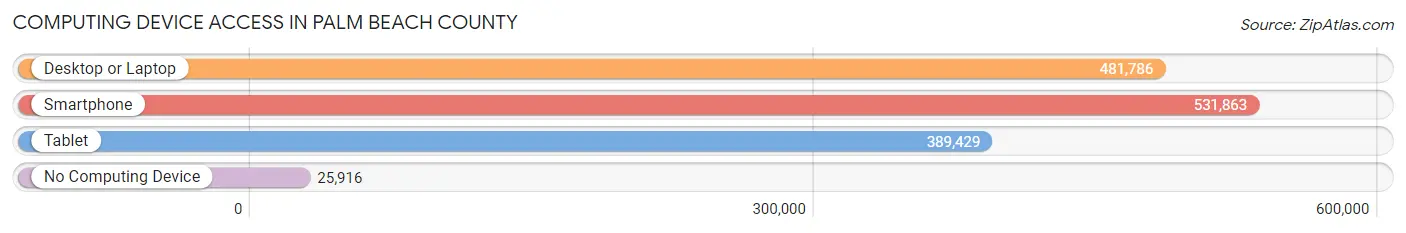
| Device Type | # Households | % Households |
| Desktop or Laptop | 481,786 | 81.7% |
| Smartphone | 531,863 | 90.2% |
| Tablet | 389,429 | 66.0% |
| No Computing Device | 25,916 | 4.4% |
| Total | 589,594 | 100.0% |
Internet Access in Palm Beach County
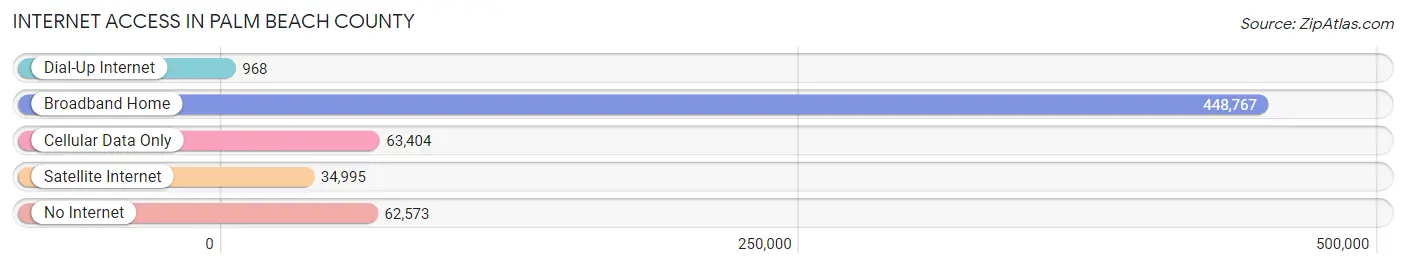
| Internet Type | # Households | % Households |
| Dial-Up Internet | 968 | 0.2% |
| Broadband Home | 448,767 | 76.1% |
| Cellular Data Only | 63,404 | 10.7% |
| Satellite Internet | 34,995 | 5.9% |
| No Internet | 62,573 | 10.6% |
| Total | 589,594 | 100.0% |
Palm Beach County Summary
Palm Beach County is located in the southeastern part of the U.S. state of Florida. It is the third most populous county in the state, with a population of 1,471,150 as of the 2020 census. The county seat is West Palm Beach. The county is bordered by Martin County to the north, St. Lucie County to the east, Broward County to the south, and Hendry County to the west.
History
Palm Beach County was created in 1909 from a portion of Dade County. The county was named for the many palm trees that line the beaches of the area. The county was originally inhabited by the Tequesta Indians, who were later displaced by the Seminole Indians. The first European settlers arrived in the area in the late 1700s.
In the early 1900s, the area began to develop as a tourist destination, with the construction of the Royal Poinciana Hotel in Palm Beach in 1894. The hotel was a popular destination for wealthy northerners, and the area soon became known as the "American Riviera."
In the 1920s, the area experienced a real estate boom, with the construction of many luxury homes and resorts. The area was also a popular destination for celebrities, including the Duke and Duchess of Windsor, who stayed at the Everglades Club in Palm Beach.
In the 1950s, the area experienced a population boom, with the construction of many new homes and businesses. The area also became a popular retirement destination for many northerners.
Geography
Palm Beach County covers an area of 2,386 square miles, making it the largest county in Florida. The county is located on the Atlantic Coast, with the Atlantic Ocean to the east and the Gulf of Mexico to the west. The county is divided into three distinct regions: the coastal region, the inland region, and the Everglades region.
The coastal region is home to many of the county's most popular beaches, including Palm Beach, Jupiter Beach, and Delray Beach. The inland region is home to many of the county's cities and towns, including West Palm Beach, Boca Raton, and Boynton Beach. The Everglades region is home to the Everglades National Park, a vast wetland area that is home to many species of wildlife.
Economy
Palm Beach County has a diverse economy, with a mix of industries including tourism, agriculture, manufacturing, and finance. The county is home to many large companies, including Office Depot, NextEra Energy, and Florida Crystals.
Tourism is a major industry in the county, with many visitors coming to the area to enjoy the beaches, golf courses, and other attractions. Agriculture is also an important industry, with the county producing a variety of crops, including sugarcane, tomatoes, and citrus fruits.
Manufacturing is also an important industry in the county, with many companies producing a variety of products, including electronics, medical equipment, and aircraft parts. The finance industry is also a major employer in the county, with many banks and other financial institutions located in the area.
Demographics
As of the 2020 census, Palm Beach County had a population of 1,471,150. The population is made up of a diverse mix of ethnicities, with the largest groups being White (63.2%), Hispanic or Latino (20.3%), and Black or African American (13.2%).
The median household income in the county is $60,945, and the median home value is $272,400. The county has a poverty rate of 11.3%, and the unemployment rate is 4.2%.
Conclusion
Palm Beach County is a vibrant and diverse county located in the southeastern part of Florida. The county has a long history, with the first European settlers arriving in the late 1700s. The county has a diverse economy, with a mix of industries including tourism, agriculture, manufacturing, and finance. The county also has a diverse population, with the largest groups being White, Hispanic or Latino, and Black or African American.
Common Questions
What is Per Capita Income in Palm Beach County?
Per Capita income in Palm Beach County is $48,121.
What is the Median Family Income in Palm Beach County?
Median Family Income in Palm Beach County is $93,221.
What is the Median Household income in Palm Beach County?
Median Household Income in Palm Beach County is $76,066.
What is Income or Wage Gap in Palm Beach County?
Income or Wage Gap in Palm Beach County is 25.4%.
Women in Palm Beach County earn 74.6 cents for every dollar earned by a man.
What is Family Income Deficit in Palm Beach County?
Family Income Deficit in Palm Beach County is $10,683.
Families that are below poverty line in Palm Beach County earn $10,683 less on average than the poverty threshold level.
What is Inequality or Gini Index in Palm Beach County?
Inequality or Gini Index in Palm Beach County is 0.52.
What is the Total Population of Palm Beach County?
Total Population of Palm Beach County is 1,494,805.
What is the Total Male Population of Palm Beach County?
Total Male Population of Palm Beach County is 729,568.
What is the Total Female Population of Palm Beach County?
Total Female Population of Palm Beach County is 765,237.
What is the Ratio of Males per 100 Females in Palm Beach County?
There are 95.34 Males per 100 Females in Palm Beach County.
What is the Ratio of Females per 100 Males in Palm Beach County?
There are 104.89 Females per 100 Males in Palm Beach County.
What is the Median Population Age in Palm Beach County?
Median Population Age in Palm Beach County is 45.2 Years.
What is the Average Family Size in Palm Beach County
Average Family Size in Palm Beach County is 3.1 People.
What is the Average Household Size in Palm Beach County
Average Household Size in Palm Beach County is 2.5 People.
How Large is the Labor Force in Palm Beach County?
There are 741,845 People in the Labor Forcein in Palm Beach County.
What is the Percentage of People in the Labor Force in Palm Beach County?
59.5% of People are in the Labor Force in Palm Beach County.
What is the Unemployment Rate in Palm Beach County?
Unemployment Rate in Palm Beach County is 5.8%.