Okaloosa County, FL Map & Demographics
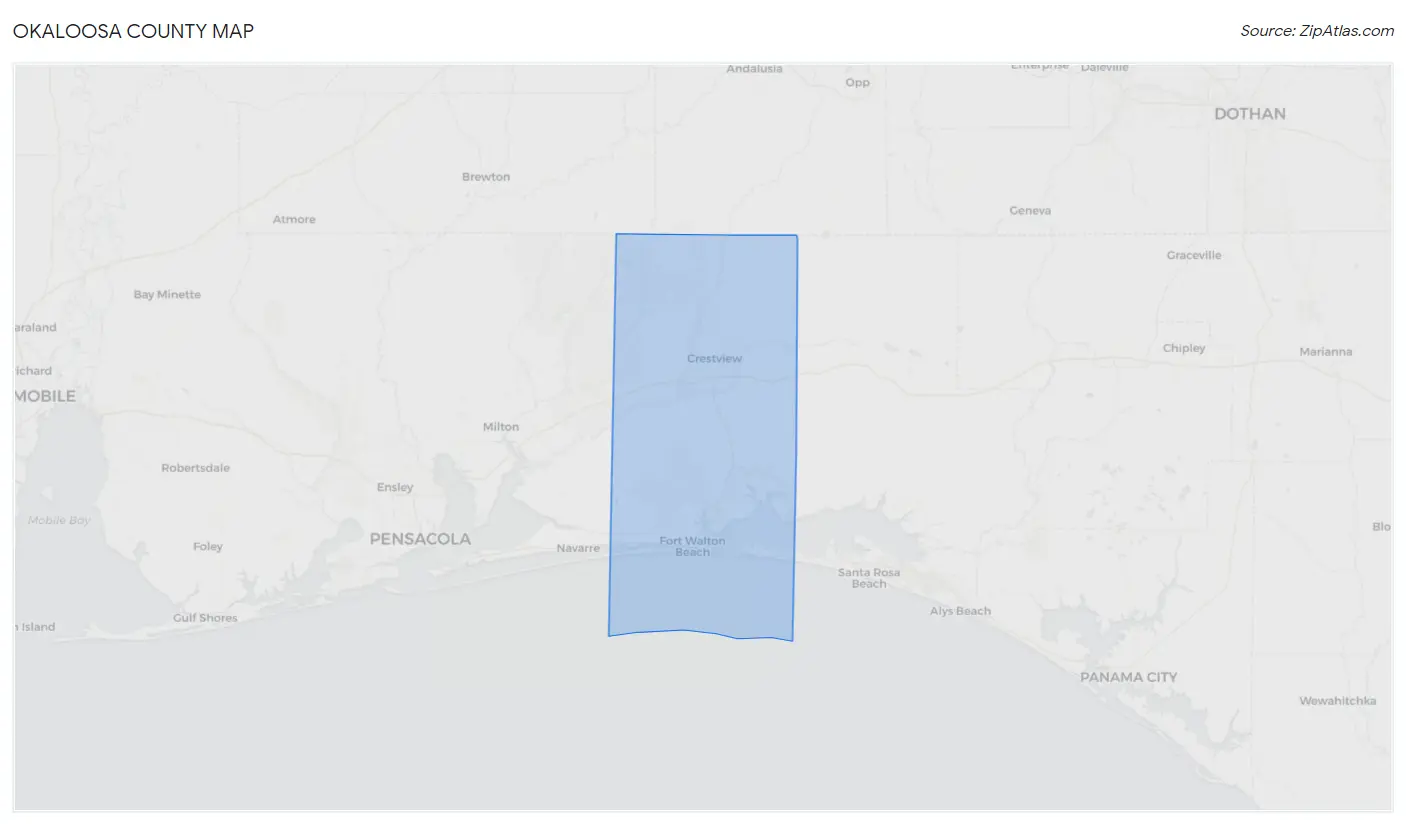
Okaloosa County Map
Okaloosa County Overview
$40,002
PER CAPITA INCOME
$91,891
AVG FAMILY INCOME
$73,988
AVG HOUSEHOLD INCOME
33.5%
WAGE / INCOME GAP [ % ]
66.5¢/ $1
WAGE / INCOME GAP [ $ ]
$9,092
FAMILY INCOME DEFICIT
0.44
INEQUALITY / GINI INDEX
212,021
TOTAL POPULATION
107,993
MALE POPULATION
104,028
FEMALE POPULATION
103.81
MALES / 100 FEMALES
96.33
FEMALES / 100 MALES
37.1
MEDIAN AGE
3.0
AVG FAMILY SIZE
2.5
AVG HOUSEHOLD SIZE
109,829
LABOR FORCE [ PEOPLE ]
64.6%
PERCENT IN LABOR FORCE
3.3%
UNEMPLOYMENT RATE
Okaloosa County Area Codes
Income in Okaloosa County
Income Overview in Okaloosa County
Per Capita Income in Okaloosa County is $40,002, while median incomes of families and households are $91,891 and $73,988 respectively.
| Characteristic | Number | Measure |
| Per Capita Income | 212,021 | $40,002 |
| Median Family Income | 54,643 | $91,891 |
| Mean Family Income | 54,643 | $115,673 |
| Median Household Income | 83,334 | $73,988 |
| Mean Household Income | 83,334 | $99,249 |
| Income Deficit | 54,643 | $9,092 |
| Wage / Income Gap (%) | 212,021 | 33.47% |
| Wage / Income Gap ($) | 212,021 | 66.53¢ per $1 |
| Gini / Inequality Index | 212,021 | 0.44 |
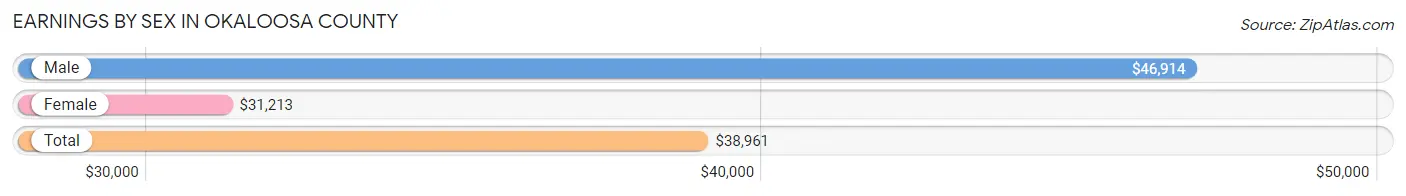
Earnings by Sex in Okaloosa County
Average Earnings in Okaloosa County are $38,961, $46,914 for men and $31,213 for women, a difference of 33.5%.
| Sex | Number | Average Earnings |
| Male | 65,527 (56.6%) | $46,914 |
| Female | 50,216 (43.4%) | $31,213 |
| Total | 115,743 (100.0%) | $38,961 |
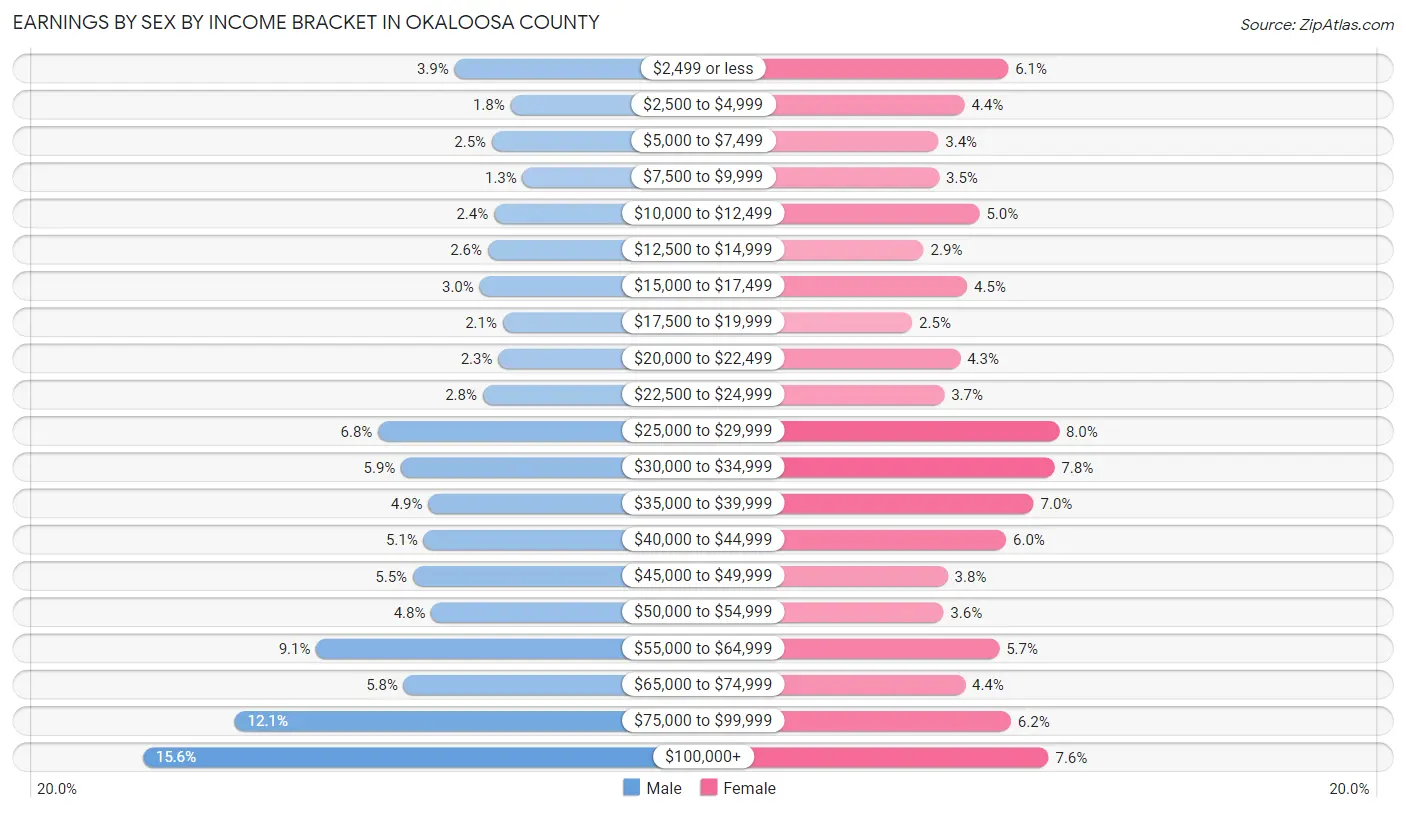
Earnings by Sex by Income Bracket in Okaloosa County
The most common earnings brackets in Okaloosa County are $100,000+ for men (10,203 | 15.6%) and $25,000 to $29,999 for women (3,992 | 8.0%).
| Income | Male | Female |
| $2,499 or less | 2,546 (3.9%) | 3,038 (6.0%) |
| $2,500 to $4,999 | 1,172 (1.8%) | 2,214 (4.4%) |
| $5,000 to $7,499 | 1,631 (2.5%) | 1,724 (3.4%) |
| $7,500 to $9,999 | 878 (1.3%) | 1,735 (3.5%) |
| $10,000 to $12,499 | 1,577 (2.4%) | 2,498 (5.0%) |
| $12,500 to $14,999 | 1,731 (2.6%) | 1,446 (2.9%) |
| $15,000 to $17,499 | 1,936 (2.9%) | 2,264 (4.5%) |
| $17,500 to $19,999 | 1,366 (2.1%) | 1,228 (2.5%) |
| $20,000 to $22,499 | 1,474 (2.2%) | 2,133 (4.3%) |
| $22,500 to $24,999 | 1,854 (2.8%) | 1,832 (3.6%) |
| $25,000 to $29,999 | 4,425 (6.8%) | 3,992 (8.0%) |
| $30,000 to $34,999 | 3,857 (5.9%) | 3,907 (7.8%) |
| $35,000 to $39,999 | 3,194 (4.9%) | 3,514 (7.0%) |
| $40,000 to $44,999 | 3,307 (5.1%) | 3,000 (6.0%) |
| $45,000 to $49,999 | 3,572 (5.4%) | 1,896 (3.8%) |
| $50,000 to $54,999 | 3,121 (4.8%) | 1,818 (3.6%) |
| $55,000 to $64,999 | 5,945 (9.1%) | 2,867 (5.7%) |
| $65,000 to $74,999 | 3,791 (5.8%) | 2,225 (4.4%) |
| $75,000 to $99,999 | 7,947 (12.1%) | 3,090 (6.1%) |
| $100,000+ | 10,203 (15.6%) | 3,795 (7.6%) |
| Total | 65,527 (100.0%) | 50,216 (100.0%) |
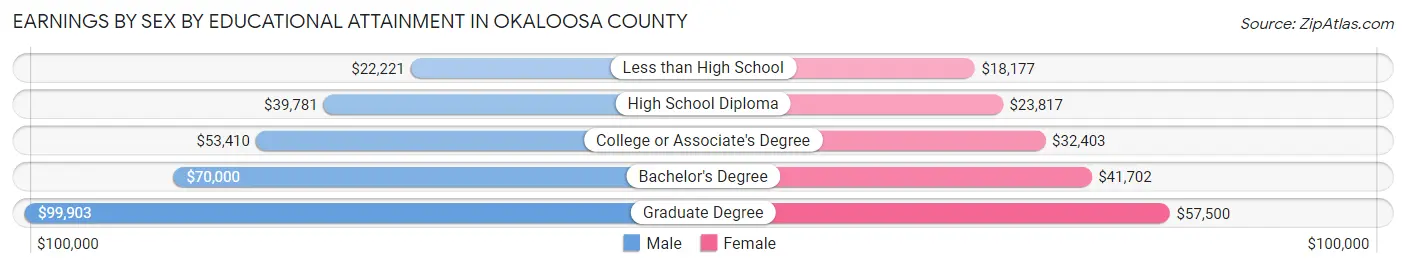
Earnings by Sex by Educational Attainment in Okaloosa County
Average earnings in Okaloosa County are $54,709 for men and $34,580 for women, a difference of 36.8%. Men with an educational attainment of graduate degree enjoy the highest average annual earnings of $99,903, while those with less than high school education earn the least with $22,221. Women with an educational attainment of graduate degree earn the most with the average annual earnings of $57,500, while those with less than high school education have the smallest earnings of $18,177.
| Educational Attainment | Male Income | Female Income |
| Less than High School | $22,221 | $18,177 |
| High School Diploma | $39,781 | $23,817 |
| College or Associate's Degree | $53,410 | $32,403 |
| Bachelor's Degree | $70,000 | $41,702 |
| Graduate Degree | $99,903 | $57,500 |
| Total | $54,709 | $34,580 |
Family Income in Okaloosa County
Family Income Brackets in Okaloosa County
According to the Okaloosa County family income data, there are 12,404 families falling into the $100,000 to $149,999 income range, which is the most common income bracket and makes up 22.7% of all families. Conversely, the $10,000 to $14,999 income bracket is the least frequent group with only 765 families (1.4%) belonging to this category.
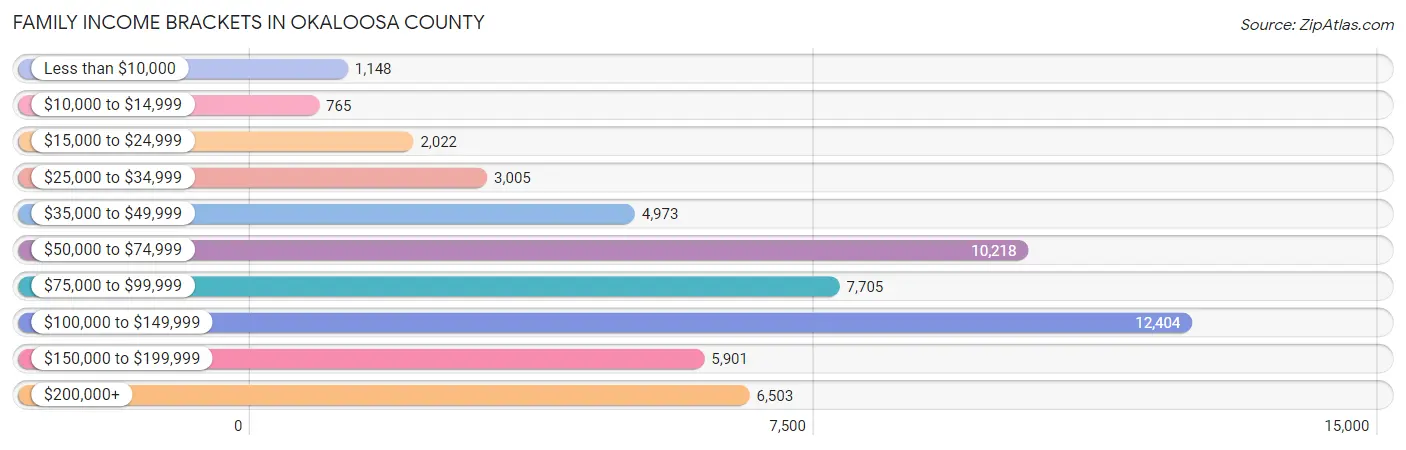
| Income Bracket | # Families | % Families |
| Less than $10,000 | 1,148 | 2.1% |
| $10,000 to $14,999 | 765 | 1.4% |
| $15,000 to $24,999 | 2,022 | 3.7% |
| $25,000 to $34,999 | 3,005 | 5.5% |
| $35,000 to $49,999 | 4,973 | 9.1% |
| $50,000 to $74,999 | 10,218 | 18.7% |
| $75,000 to $99,999 | 7,705 | 14.1% |
| $100,000 to $149,999 | 12,404 | 22.7% |
| $150,000 to $199,999 | 5,901 | 10.8% |
| $200,000+ | 6,503 | 11.9% |
Family Income by Famaliy Size in Okaloosa County
3-person families (11,863 | 21.7%) account for the highest median family income in Okaloosa County with $102,362 per family, while 2-person families (27,689 | 50.7%) have the highest median income of $41,430 per family member.
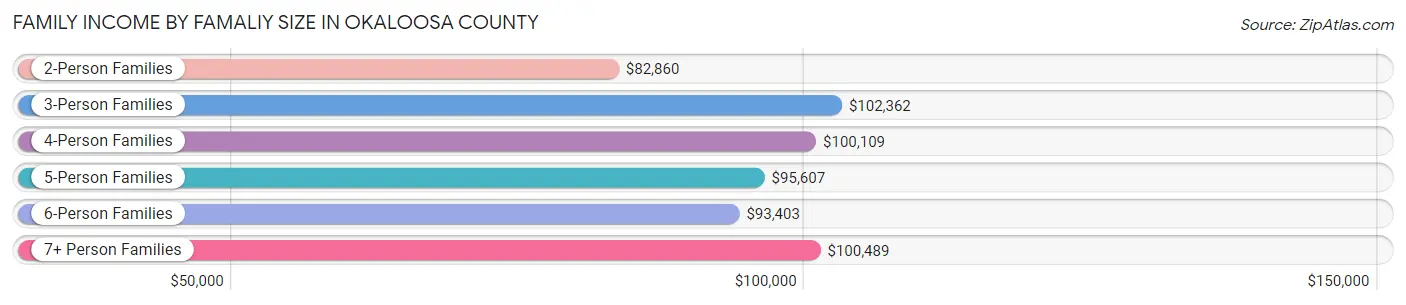
| Income Bracket | # Families | Median Income |
| 2-Person Families | 27,689 (50.7%) | $82,860 |
| 3-Person Families | 11,863 (21.7%) | $102,362 |
| 4-Person Families | 9,444 (17.3%) | $100,109 |
| 5-Person Families | 3,449 (6.3%) | $95,607 |
| 6-Person Families | 1,499 (2.7%) | $93,403 |
| 7+ Person Families | 699 (1.3%) | $100,489 |
| Total | 54,643 (100.0%) | $91,891 |
Family Income by Number of Earners in Okaloosa County
The median family income in Okaloosa County is $91,891, with families comprising 3+ earners (4,987) having the highest median family income of $133,240, while families with no earners (7,829) have the lowest median family income of $65,879, accounting for 9.1% and 14.3% of families, respectively.
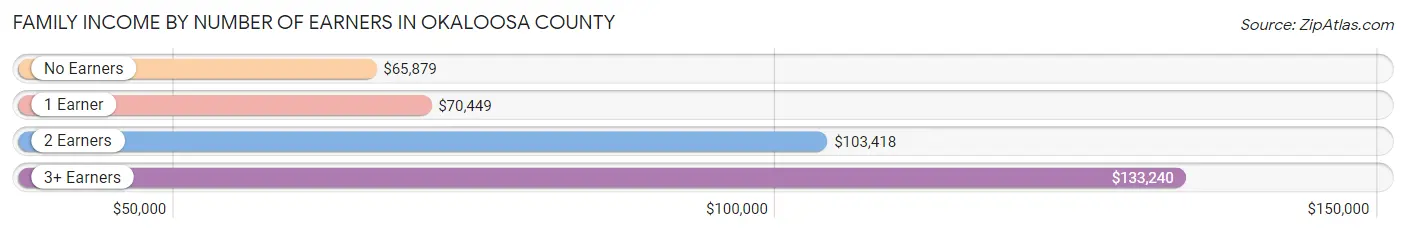
| Number of Earners | # Families | Median Income |
| No Earners | 7,829 (14.3%) | $65,879 |
| 1 Earner | 18,102 (33.1%) | $70,449 |
| 2 Earners | 23,725 (43.4%) | $103,418 |
| 3+ Earners | 4,987 (9.1%) | $133,240 |
| Total | 54,643 (100.0%) | $91,891 |
Household Income in Okaloosa County
Household Income Brackets in Okaloosa County
With 16,000 households falling in the category, the $50,000 to $74,999 income range is the most frequent in Okaloosa County, accounting for 19.2% of all households. In contrast, only 2,250 households (2.7%) fall into the $10,000 to $14,999 income bracket, making it the least populous group.
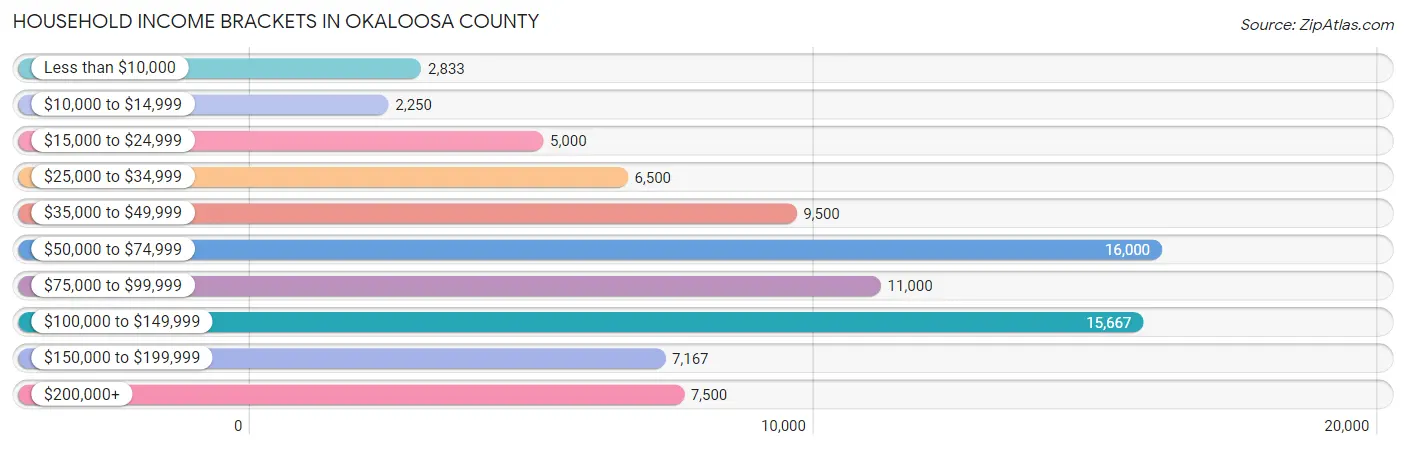
| Income Bracket | # Households | % Households |
| Less than $10,000 | 2,833 | 3.4% |
| $10,000 to $14,999 | 2,250 | 2.7% |
| $15,000 to $24,999 | 5,000 | 6.0% |
| $25,000 to $34,999 | 6,500 | 7.8% |
| $35,000 to $49,999 | 9,500 | 11.4% |
| $50,000 to $74,999 | 16,000 | 19.2% |
| $75,000 to $99,999 | 11,000 | 13.2% |
| $100,000 to $149,999 | 15,667 | 18.8% |
| $150,000 to $199,999 | 7,167 | 8.6% |
| $200,000+ | 7,500 | 9.0% |
Household Income by Householder Age in Okaloosa County
The median household income in Okaloosa County is $73,988, with the highest median household income of $94,882 found in the 45 to 64 years age bracket for the primary householder. A total of 28,662 households (34.4%) fall into this category. Meanwhile, the 15 to 24 years age bracket for the primary householder has the lowest median household income of $43,455, with 4,362 households (5.2%) in this group.
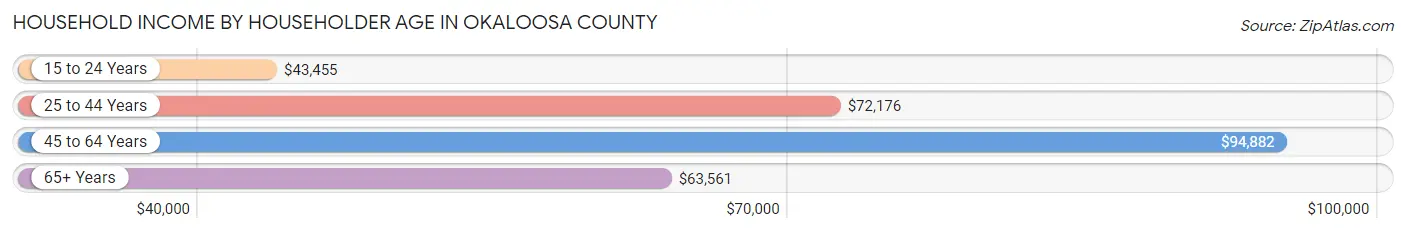
| Income Bracket | # Households | Median Income |
| 15 to 24 Years | 4,362 (5.2%) | $43,455 |
| 25 to 44 Years | 28,791 (34.5%) | $72,176 |
| 45 to 64 Years | 28,662 (34.4%) | $94,882 |
| 65+ Years | 21,519 (25.8%) | $63,561 |
| Total | 83,334 (100.0%) | $73,988 |
Poverty in Okaloosa County
Income Below Poverty by Sex and Age in Okaloosa County
With 9.7% poverty level for males and 10.6% for females among the residents of Okaloosa County, under 5 year old males and 15 year old females are the most vulnerable to poverty, with 1,747 males (26.3%) and 267 females (23.4%) in their respective age groups living below the poverty level.
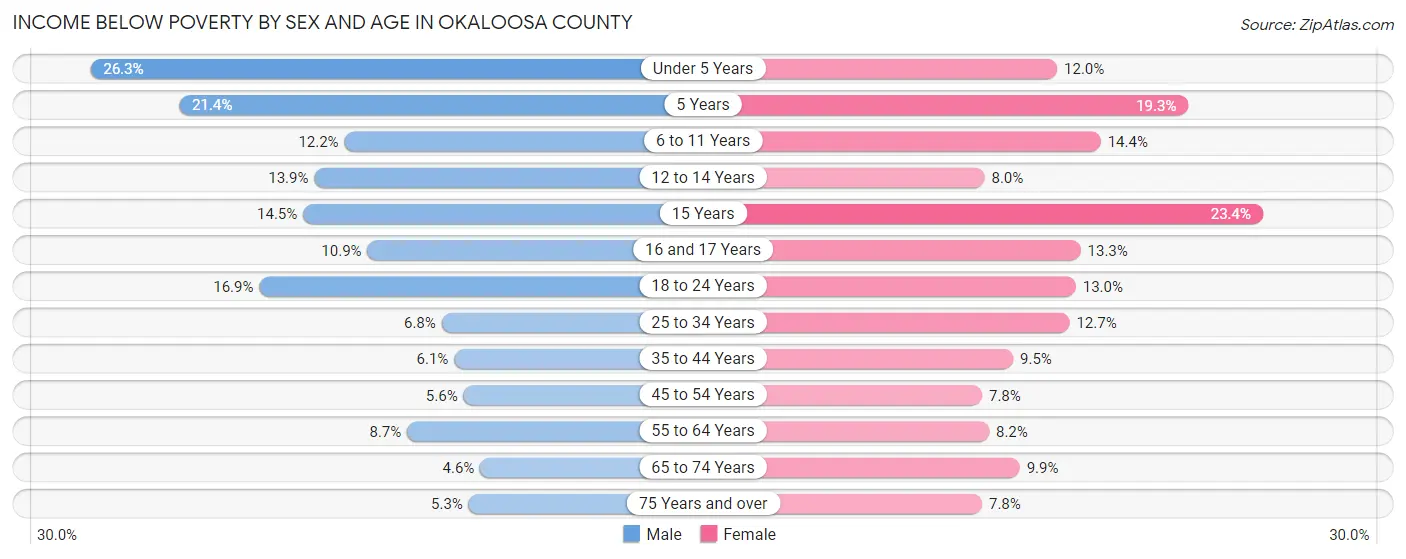
| Age Bracket | Male | Female |
| Under 5 Years | 1,747 (26.3%) | 762 (12.0%) |
| 5 Years | 312 (21.4%) | 300 (19.3%) |
| 6 to 11 Years | 964 (12.2%) | 1,102 (14.4%) |
| 12 to 14 Years | 529 (13.9%) | 279 (8.0%) |
| 15 Years | 150 (14.5%) | 267 (23.4%) |
| 16 and 17 Years | 298 (10.9%) | 333 (13.3%) |
| 18 to 24 Years | 1,517 (16.9%) | 1,019 (13.0%) |
| 25 to 34 Years | 1,138 (6.8%) | 1,911 (12.7%) |
| 35 to 44 Years | 839 (6.1%) | 1,240 (9.5%) |
| 45 to 54 Years | 620 (5.6%) | 899 (7.8%) |
| 55 to 64 Years | 1,206 (8.7%) | 1,158 (8.2%) |
| 65 to 74 Years | 459 (4.6%) | 1,035 (9.9%) |
| 75 Years and over | 305 (5.3%) | 609 (7.8%) |
| Total | 10,084 (9.7%) | 10,914 (10.6%) |
Income Above Poverty by Sex and Age in Okaloosa County
According to the poverty statistics in Okaloosa County, males aged 65 to 74 years and females aged 45 to 54 years are the age groups that are most secure financially, with 95.4% of males and 92.2% of females in these age groups living above the poverty line.
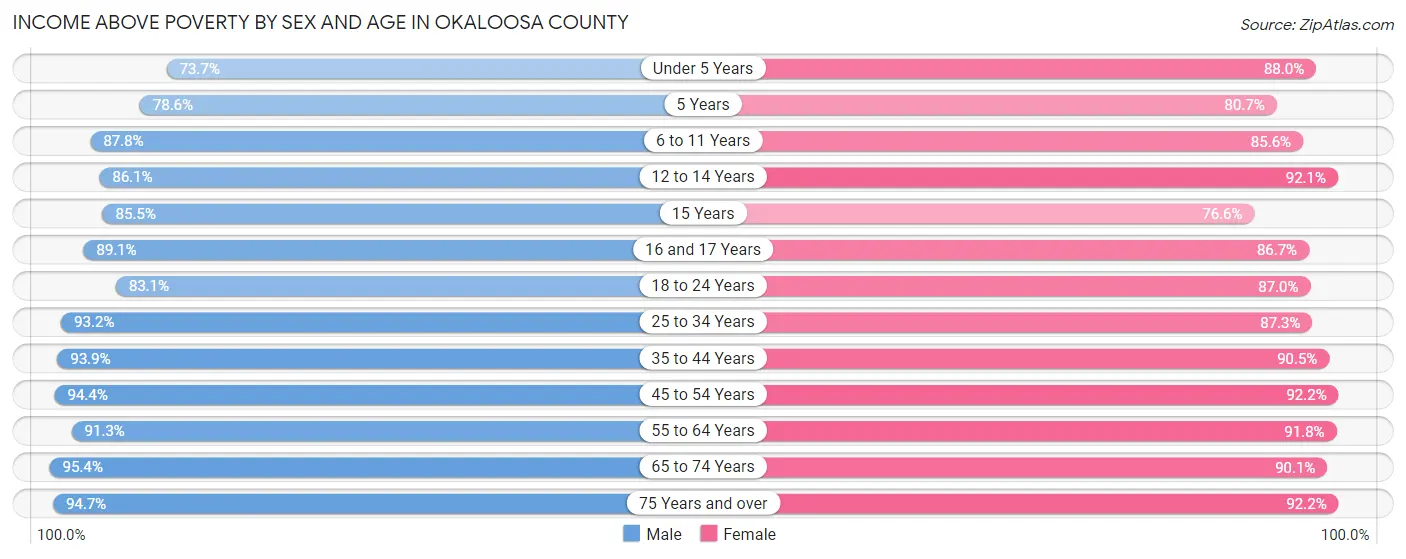
| Age Bracket | Male | Female |
| Under 5 Years | 4,886 (73.7%) | 5,592 (88.0%) |
| 5 Years | 1,146 (78.6%) | 1,255 (80.7%) |
| 6 to 11 Years | 6,943 (87.8%) | 6,540 (85.6%) |
| 12 to 14 Years | 3,284 (86.1%) | 3,231 (92.0%) |
| 15 Years | 885 (85.5%) | 872 (76.6%) |
| 16 and 17 Years | 2,434 (89.1%) | 2,170 (86.7%) |
| 18 to 24 Years | 7,444 (83.1%) | 6,802 (87.0%) |
| 25 to 34 Years | 15,638 (93.2%) | 13,156 (87.3%) |
| 35 to 44 Years | 12,966 (93.9%) | 11,758 (90.5%) |
| 45 to 54 Years | 10,530 (94.4%) | 10,614 (92.2%) |
| 55 to 64 Years | 12,659 (91.3%) | 12,972 (91.8%) |
| 65 to 74 Years | 9,451 (95.4%) | 9,404 (90.1%) |
| 75 Years and over | 5,482 (94.7%) | 7,189 (92.2%) |
| Total | 93,748 (90.3%) | 91,555 (89.3%) |
Income Below Poverty Among Married-Couple Families in Okaloosa County
The poverty statistics for married-couple families in Okaloosa County show that 3.3% or 1,426 of the total 42,966 families live below the poverty line. Families with 5 or more children have the highest poverty rate of 7.7%, comprising of 18 families. On the other hand, families with no children have the lowest poverty rate of 3.0%, which includes 786 families.
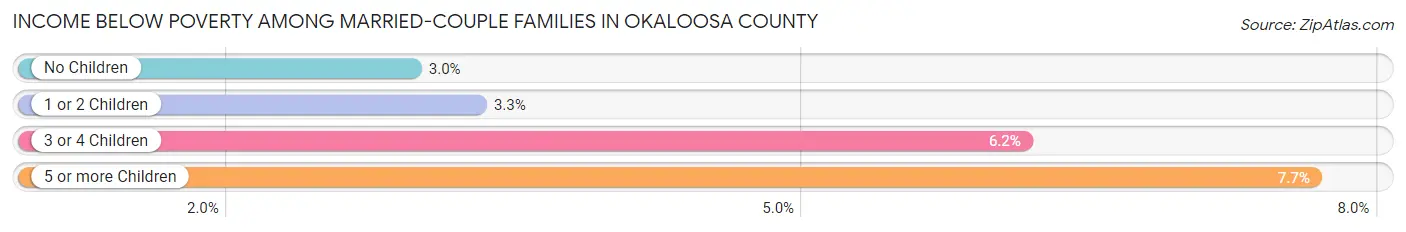
| Children | Above Poverty | Below Poverty |
| No Children | 25,777 (97.0%) | 786 (3.0%) |
| 1 or 2 Children | 12,615 (96.7%) | 430 (3.3%) |
| 3 or 4 Children | 2,931 (93.9%) | 192 (6.1%) |
| 5 or more Children | 217 (92.3%) | 18 (7.7%) |
| Total | 41,540 (96.7%) | 1,426 (3.3%) |
Income Below Poverty Among Single-Parent Households in Okaloosa County
According to the poverty data in Okaloosa County, 10.8% or 371 single-father households and 25.8% or 2,126 single-mother households are living below the poverty line. Among single-father households, those with 3 or 4 children have the highest poverty rate, with 104 households (55.3%) experiencing poverty. Likewise, among single-mother households, those with 5 or more children have the highest poverty rate, with 106 households (99.1%) falling below the poverty line.
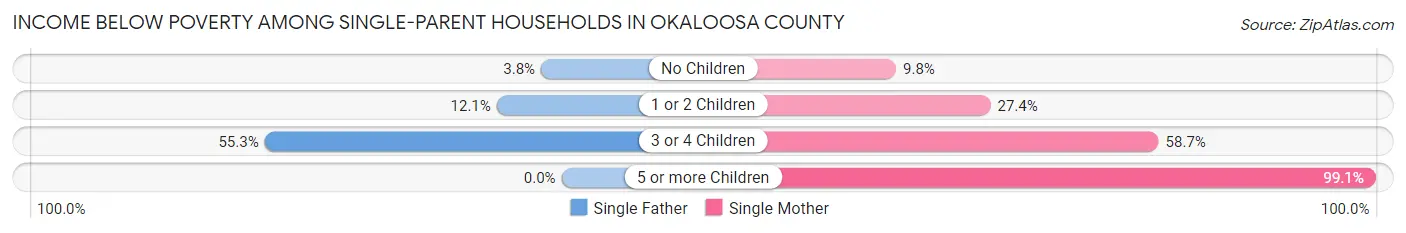
| Children | Single Father | Single Mother |
| No Children | 54 (3.8%) | 291 (9.8%) |
| 1 or 2 Children | 213 (12.1%) | 1,127 (27.4%) |
| 3 or 4 Children | 104 (55.3%) | 602 (58.7%) |
| 5 or more Children | 0 (0.0%) | 106 (99.1%) |
| Total | 371 (10.8%) | 2,126 (25.8%) |
Income Below Poverty Among Married-Couple vs Single-Parent Households in Okaloosa County
The poverty data for Okaloosa County shows that 1,426 of the married-couple family households (3.3%) and 2,497 of the single-parent households (21.4%) are living below the poverty level. Within the married-couple family households, those with 5 or more children have the highest poverty rate, with 18 households (7.7%) falling below the poverty line. Among the single-parent households, those with 3 or 4 children have the highest poverty rate, with 706 household (58.2%) living below poverty.
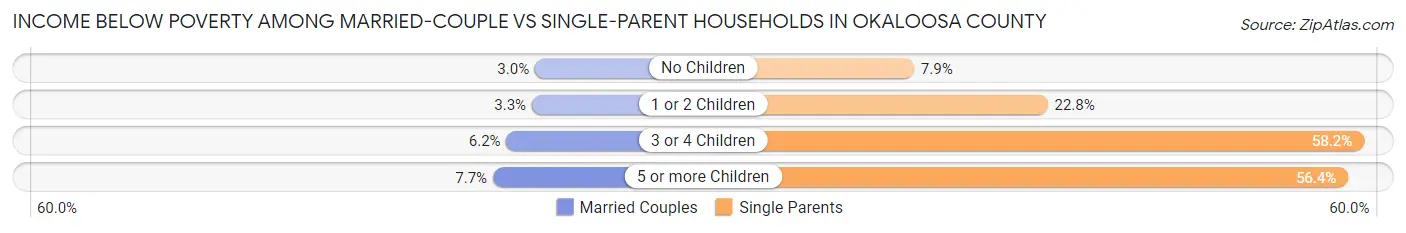
| Children | Married-Couple Families | Single-Parent Households |
| No Children | 786 (3.0%) | 345 (7.9%) |
| 1 or 2 Children | 430 (3.3%) | 1,340 (22.8%) |
| 3 or 4 Children | 192 (6.1%) | 706 (58.2%) |
| 5 or more Children | 18 (7.7%) | 106 (56.4%) |
| Total | 1,426 (3.3%) | 2,497 (21.4%) |
Race in Okaloosa County
The most populous races in Okaloosa County are White / Caucasian (158,058 | 74.6%), Hispanic or Latino (21,317 | 10.1%), and Black / African American (19,991 | 9.4%).
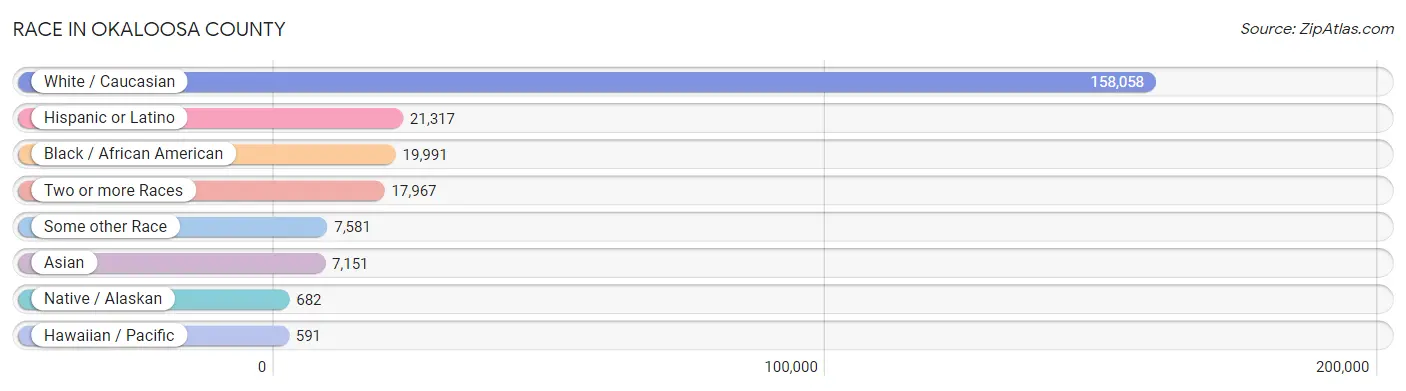
| Race | # Population | % Population |
| Asian | 7,151 | 3.4% |
| Black / African American | 19,991 | 9.4% |
| Hawaiian / Pacific | 591 | 0.3% |
| Hispanic or Latino | 21,317 | 10.1% |
| Native / Alaskan | 682 | 0.3% |
| White / Caucasian | 158,058 | 74.6% |
| Two or more Races | 17,967 | 8.5% |
| Some other Race | 7,581 | 3.6% |
| Total | 212,021 | 100.0% |
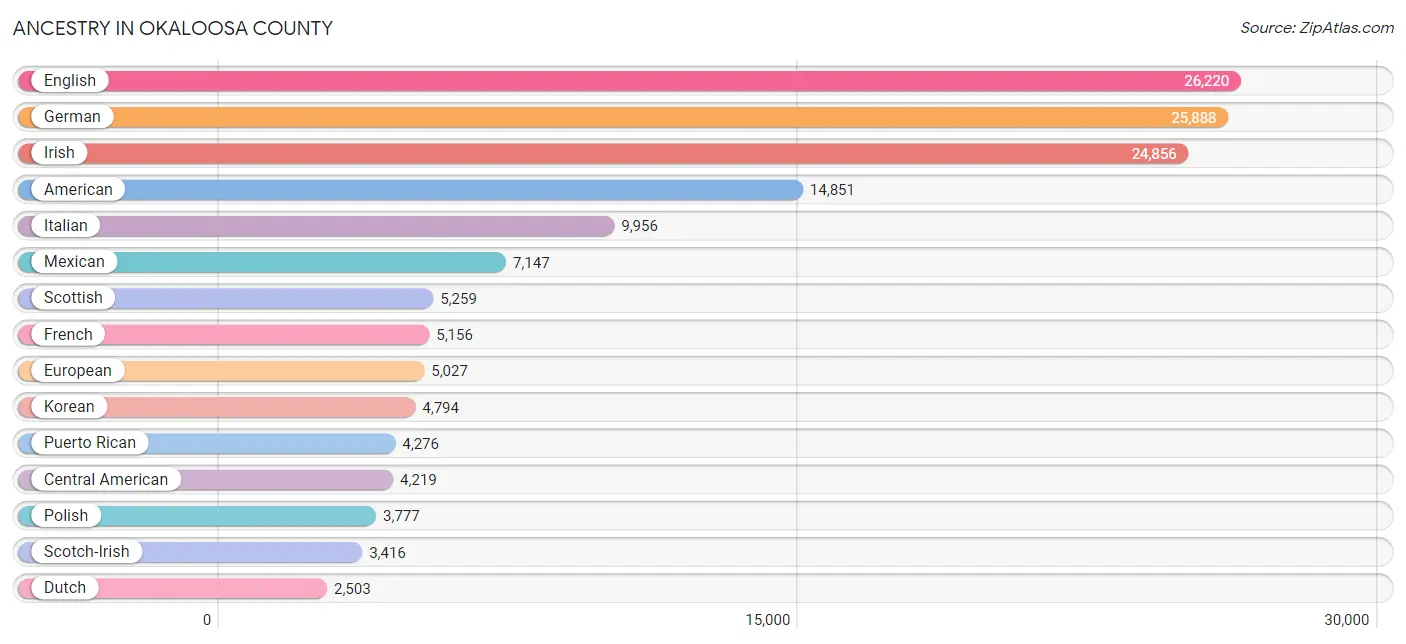
Ancestry in Okaloosa County
The most populous ancestries reported in Okaloosa County are English (26,220 | 12.4%), German (25,888 | 12.2%), Irish (24,856 | 11.7%), American (14,851 | 7.0%), and Italian (9,956 | 4.7%), together accounting for 48.0% of all Okaloosa County residents.
| Ancestry | # Population | % Population |
| African | 1,024 | 0.5% |
| Albanian | 136 | 0.1% |
| Aleut | 40 | 0.0% |
| American | 14,851 | 7.0% |
| Apache | 21 | 0.0% |
| Arab | 178 | 0.1% |
| Argentinean | 56 | 0.0% |
| Armenian | 91 | 0.0% |
| Australian | 15 | 0.0% |
| Austrian | 614 | 0.3% |
| Bahamian | 23 | 0.0% |
| Bangladeshi | 67 | 0.0% |
| Barbadian | 19 | 0.0% |
| Belgian | 115 | 0.1% |
| Belizean | 46 | 0.0% |
| Bhutanese | 718 | 0.3% |
| Blackfeet | 55 | 0.0% |
| Bolivian | 92 | 0.0% |
| Brazilian | 565 | 0.3% |
| British | 1,958 | 0.9% |
| Bulgarian | 47 | 0.0% |
| Burmese | 1,120 | 0.5% |
| Cajun | 93 | 0.0% |
| Canadian | 399 | 0.2% |
| Cape Verdean | 51 | 0.0% |
| Celtic | 13 | 0.0% |
| Central American | 4,219 | 2.0% |
| Central American Indian | 123 | 0.1% |
| Cherokee | 1,099 | 0.5% |
| Cheyenne | 33 | 0.0% |
| Chickasaw | 17 | 0.0% |
| Chilean | 42 | 0.0% |
| Chinese | 28 | 0.0% |
| Chippewa | 7 | 0.0% |
| Choctaw | 59 | 0.0% |
| Colombian | 974 | 0.5% |
| Costa Rican | 64 | 0.0% |
| Cree | 15 | 0.0% |
| Creek | 156 | 0.1% |
| Croatian | 43 | 0.0% |
| Crow | 33 | 0.0% |
| Cuban | 772 | 0.4% |
| Czech | 662 | 0.3% |
| Czechoslovakian | 100 | 0.1% |
| Danish | 457 | 0.2% |
| Dominican | 885 | 0.4% |
| Dutch | 2,503 | 1.2% |
| Dutch West Indian | 68 | 0.0% |
| Eastern European | 275 | 0.1% |
| Ecuadorian | 194 | 0.1% |
| English | 26,220 | 12.4% |
| Estonian | 17 | 0.0% |
| Ethiopian | 60 | 0.0% |
| European | 5,027 | 2.4% |
| Filipino | 81 | 0.0% |
| Finnish | 585 | 0.3% |
| French | 5,156 | 2.4% |
| French American Indian | 7 | 0.0% |
| French Canadian | 1,114 | 0.5% |
| German | 25,888 | 12.2% |
| Ghanaian | 71 | 0.0% |
| Greek | 973 | 0.5% |
| Guamanian / Chamorro | 378 | 0.2% |
| Guatemalan | 772 | 0.4% |
| Guyanese | 5 | 0.0% |
| Haitian | 124 | 0.1% |
| Honduran | 1,772 | 0.8% |
| Hungarian | 940 | 0.4% |
| Indian (Asian) | 854 | 0.4% |
| Indonesian | 12 | 0.0% |
| Iranian | 56 | 0.0% |
| Irish | 24,856 | 11.7% |
| Iroquois | 86 | 0.0% |
| Israeli | 23 | 0.0% |
| Italian | 9,956 | 4.7% |
| Jamaican | 1,228 | 0.6% |
| Kenyan | 14 | 0.0% |
| Kiowa | 23 | 0.0% |
| Korean | 4,794 | 2.3% |
| Laotian | 61 | 0.0% |
| Latvian | 8 | 0.0% |
| Lebanese | 94 | 0.0% |
| Liberian | 19 | 0.0% |
| Lithuanian | 431 | 0.2% |
| Lumbee | 69 | 0.0% |
| Luxembourger | 6 | 0.0% |
| Macedonian | 32 | 0.0% |
| Malaysian | 20 | 0.0% |
| Mexican | 7,147 | 3.4% |
| Mexican American Indian | 175 | 0.1% |
| Native Hawaiian | 431 | 0.2% |
| Navajo | 18 | 0.0% |
| Nicaraguan | 341 | 0.2% |
| Nigerian | 246 | 0.1% |
| Northern European | 182 | 0.1% |
| Norwegian | 2,149 | 1.0% |
| Osage | 23 | 0.0% |
| Pakistani | 1,465 | 0.7% |
| Panamanian | 464 | 0.2% |
| Paraguayan | 20 | 0.0% |
| Pennsylvania German | 44 | 0.0% |
| Peruvian | 394 | 0.2% |
| Pima | 31 | 0.0% |
| Polish | 3,777 | 1.8% |
| Portuguese | 663 | 0.3% |
| Potawatomi | 4 | 0.0% |
| Pueblo | 21 | 0.0% |
| Puerto Rican | 4,276 | 2.0% |
| Romanian | 202 | 0.1% |
| Russian | 1,603 | 0.8% |
| Salvadoran | 806 | 0.4% |
| Samoan | 99 | 0.1% |
| Scandinavian | 800 | 0.4% |
| Scotch-Irish | 3,416 | 1.6% |
| Scottish | 5,259 | 2.5% |
| Seminole | 23 | 0.0% |
| Serbian | 31 | 0.0% |
| Shoshone | 40 | 0.0% |
| Sioux | 117 | 0.1% |
| Slavic | 73 | 0.0% |
| Slovak | 323 | 0.2% |
| Slovene | 21 | 0.0% |
| Somali | 23 | 0.0% |
| South African | 114 | 0.1% |
| South American | 2,143 | 1.0% |
| South American Indian | 43 | 0.0% |
| Spaniard | 625 | 0.3% |
| Spanish | 547 | 0.3% |
| Spanish American Indian | 5 | 0.0% |
| Sri Lankan | 795 | 0.4% |
| Subsaharan African | 1,599 | 0.7% |
| Swedish | 1,705 | 0.8% |
| Swiss | 315 | 0.2% |
| Syrian | 40 | 0.0% |
| Thai | 1,377 | 0.6% |
| Tlingit-Haida | 27 | 0.0% |
| Tohono O'Odham | 21 | 0.0% |
| Tongan | 32 | 0.0% |
| Trinidadian and Tobagonian | 42 | 0.0% |
| Turkish | 257 | 0.1% |
| Ukrainian | 368 | 0.2% |
| Venezuelan | 371 | 0.2% |
| Vietnamese | 27 | 0.0% |
| Welsh | 1,745 | 0.8% |
| West Indian | 180 | 0.1% |
| Yugoslavian | 201 | 0.1% |
| Yup'ik | 5 | 0.0% | View All 147 Rows |
Immigrants in Okaloosa County
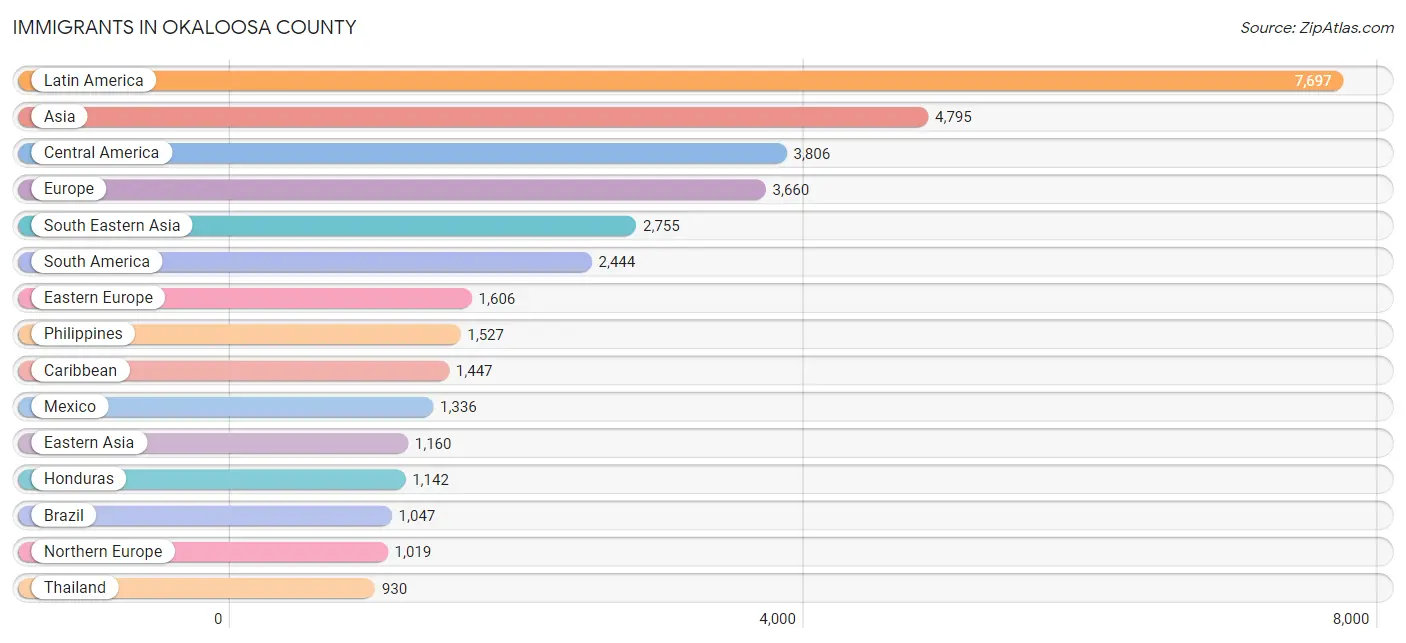
The most numerous immigrant groups reported in Okaloosa County came from Latin America (7,697 | 3.6%), Asia (4,795 | 2.3%), Central America (3,806 | 1.8%), Europe (3,660 | 1.7%), and South Eastern Asia (2,755 | 1.3%), together accounting for 10.7% of all Okaloosa County residents.
| Immigration Origin | # Population | % Population |
| Africa | 270 | 0.1% |
| Albania | 33 | 0.0% |
| Argentina | 56 | 0.0% |
| Asia | 4,795 | 2.3% |
| Australia | 44 | 0.0% |
| Austria | 9 | 0.0% |
| Bahamas | 23 | 0.0% |
| Bangladesh | 19 | 0.0% |
| Belarus | 39 | 0.0% |
| Belgium | 8 | 0.0% |
| Bolivia | 22 | 0.0% |
| Brazil | 1,047 | 0.5% |
| Bulgaria | 41 | 0.0% |
| Canada | 239 | 0.1% |
| Caribbean | 1,447 | 0.7% |
| Central America | 3,806 | 1.8% |
| China | 443 | 0.2% |
| Colombia | 724 | 0.3% |
| Costa Rica | 10 | 0.0% |
| Cuba | 324 | 0.2% |
| Czechoslovakia | 129 | 0.1% |
| Denmark | 18 | 0.0% |
| Dominican Republic | 306 | 0.1% |
| Eastern Africa | 87 | 0.0% |
| Eastern Asia | 1,160 | 0.5% |
| Eastern Europe | 1,606 | 0.8% |
| Ecuador | 162 | 0.1% |
| El Salvador | 417 | 0.2% |
| England | 469 | 0.2% |
| Ethiopia | 60 | 0.0% |
| Europe | 3,660 | 1.7% |
| France | 146 | 0.1% |
| Germany | 477 | 0.2% |
| Greece | 9 | 0.0% |
| Guatemala | 615 | 0.3% |
| Guyana | 5 | 0.0% |
| Haiti | 15 | 0.0% |
| Honduras | 1,142 | 0.5% |
| Hong Kong | 52 | 0.0% |
| Hungary | 42 | 0.0% |
| India | 559 | 0.3% |
| Indonesia | 42 | 0.0% |
| Iran | 39 | 0.0% |
| Ireland | 28 | 0.0% |
| Israel | 10 | 0.0% |
| Italy | 260 | 0.1% |
| Jamaica | 725 | 0.3% |
| Japan | 218 | 0.1% |
| Kazakhstan | 47 | 0.0% |
| Kenya | 14 | 0.0% |
| Korea | 499 | 0.2% |
| Kuwait | 7 | 0.0% |
| Latin America | 7,697 | 3.6% |
| Latvia | 8 | 0.0% |
| Lebanon | 16 | 0.0% |
| Liberia | 19 | 0.0% |
| Lithuania | 104 | 0.1% |
| Mexico | 1,336 | 0.6% |
| Middle Africa | 12 | 0.0% |
| Moldova | 26 | 0.0% |
| Morocco | 22 | 0.0% |
| Nepal | 18 | 0.0% |
| Netherlands | 24 | 0.0% |
| Nicaragua | 186 | 0.1% |
| Nigeria | 117 | 0.1% |
| Northern Africa | 22 | 0.0% |
| Northern Europe | 1,019 | 0.5% |
| Norway | 29 | 0.0% |
| Oceania | 132 | 0.1% |
| Pakistan | 22 | 0.0% |
| Panama | 100 | 0.1% |
| Peru | 205 | 0.1% |
| Philippines | 1,527 | 0.7% |
| Poland | 87 | 0.0% |
| Portugal | 14 | 0.0% |
| Romania | 203 | 0.1% |
| Russia | 646 | 0.3% |
| Scotland | 68 | 0.0% |
| Serbia | 10 | 0.0% |
| South Africa | 13 | 0.0% |
| South America | 2,444 | 1.1% |
| South Central Asia | 770 | 0.4% |
| South Eastern Asia | 2,755 | 1.3% |
| Southern Europe | 364 | 0.2% |
| Spain | 81 | 0.0% |
| Sri Lanka | 9 | 0.0% |
| Sweden | 13 | 0.0% |
| Switzerland | 7 | 0.0% |
| Taiwan | 144 | 0.1% |
| Thailand | 930 | 0.4% |
| Trinidad and Tobago | 17 | 0.0% |
| Turkey | 71 | 0.0% |
| Ukraine | 156 | 0.1% |
| Venezuela | 203 | 0.1% |
| Vietnam | 246 | 0.1% |
| Western Africa | 136 | 0.1% |
| Western Asia | 110 | 0.1% |
| Western Europe | 671 | 0.3% |
| Zaire | 12 | 0.0% | View All 99 Rows |
Sex and Age in Okaloosa County
Sex and Age in Okaloosa County
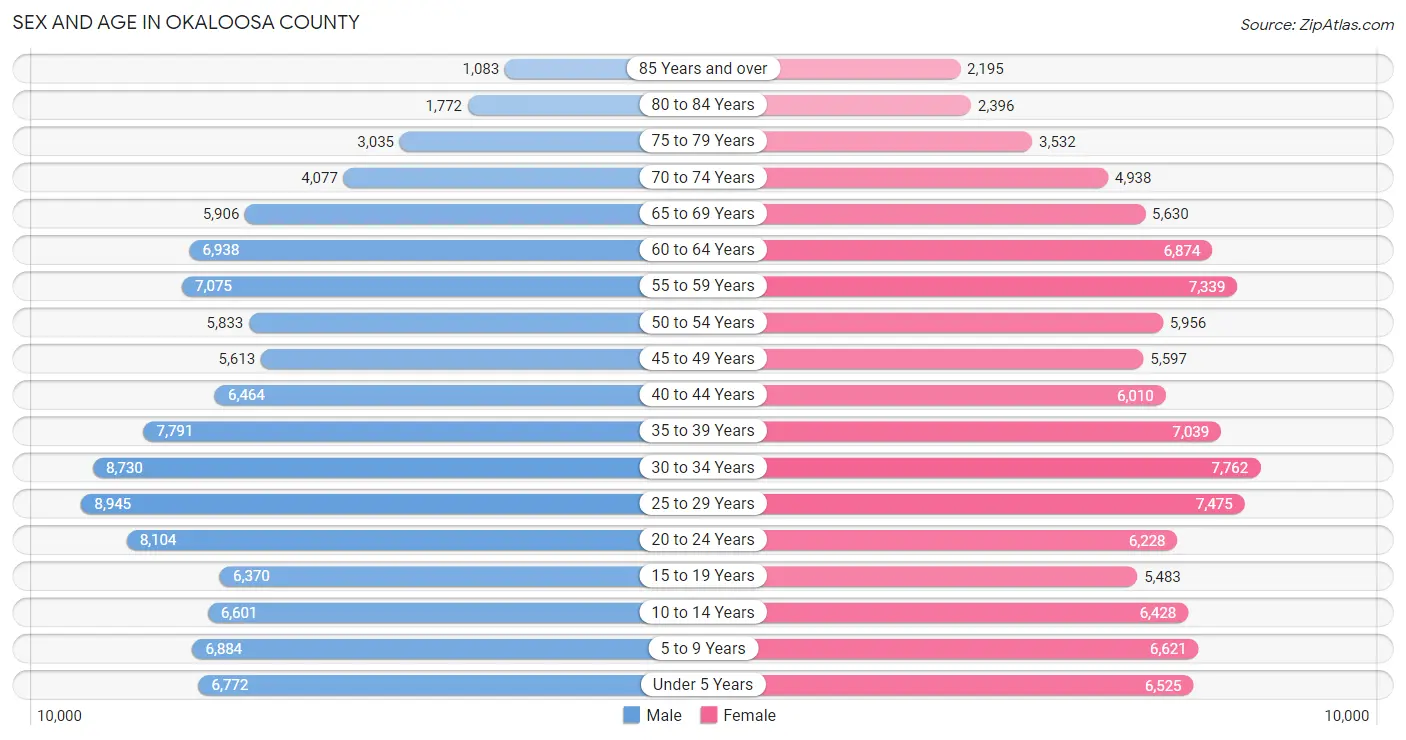
The most populous age groups in Okaloosa County are 25 to 29 Years (8,945 | 8.3%) for men and 30 to 34 Years (7,762 | 7.5%) for women.
| Age Bracket | Male | Female |
| Under 5 Years | 6,772 (6.3%) | 6,525 (6.3%) |
| 5 to 9 Years | 6,884 (6.4%) | 6,621 (6.4%) |
| 10 to 14 Years | 6,601 (6.1%) | 6,428 (6.2%) |
| 15 to 19 Years | 6,370 (5.9%) | 5,483 (5.3%) |
| 20 to 24 Years | 8,104 (7.5%) | 6,228 (6.0%) |
| 25 to 29 Years | 8,945 (8.3%) | 7,475 (7.2%) |
| 30 to 34 Years | 8,730 (8.1%) | 7,762 (7.5%) |
| 35 to 39 Years | 7,791 (7.2%) | 7,039 (6.8%) |
| 40 to 44 Years | 6,464 (6.0%) | 6,010 (5.8%) |
| 45 to 49 Years | 5,613 (5.2%) | 5,597 (5.4%) |
| 50 to 54 Years | 5,833 (5.4%) | 5,956 (5.7%) |
| 55 to 59 Years | 7,075 (6.6%) | 7,339 (7.0%) |
| 60 to 64 Years | 6,938 (6.4%) | 6,874 (6.6%) |
| 65 to 69 Years | 5,906 (5.5%) | 5,630 (5.4%) |
| 70 to 74 Years | 4,077 (3.8%) | 4,938 (4.8%) |
| 75 to 79 Years | 3,035 (2.8%) | 3,532 (3.4%) |
| 80 to 84 Years | 1,772 (1.6%) | 2,396 (2.3%) |
| 85 Years and over | 1,083 (1.0%) | 2,195 (2.1%) |
| Total | 107,993 (100.0%) | 104,028 (100.0%) |
Families and Households in Okaloosa County
Median Family Size in Okaloosa County
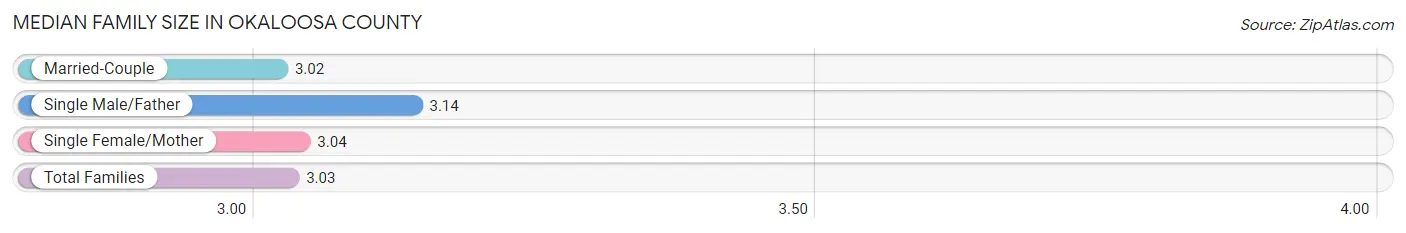
The median family size in Okaloosa County is 3.03 persons per family, with single male/father families (3,443 | 6.3%) accounting for the largest median family size of 3.14 persons per family. On the other hand, married-couple families (42,966 | 78.6%) represent the smallest median family size with 3.02 persons per family.
| Family Type | # Families | Family Size |
| Married-Couple | 42,966 (78.6%) | 3.02 |
| Single Male/Father | 3,443 (6.3%) | 3.14 |
| Single Female/Mother | 8,234 (15.1%) | 3.04 |
| Total Families | 54,643 (100.0%) | 3.03 |
Median Household Size in Okaloosa County
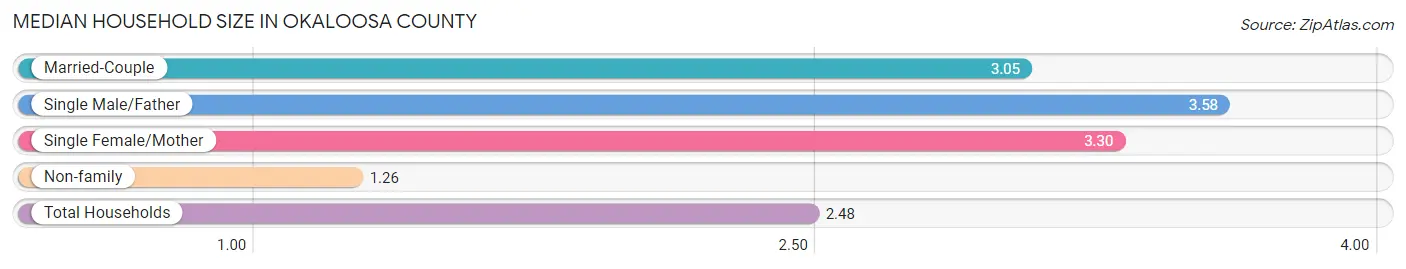
The median household size in Okaloosa County is 2.48 persons per household, with single male/father households (3,443 | 4.1%) accounting for the largest median household size of 3.58 persons per household. non-family households (28,691 | 34.4%) represent the smallest median household size with 1.26 persons per household.
| Household Type | # Households | Household Size |
| Married-Couple | 42,966 (51.6%) | 3.05 |
| Single Male/Father | 3,443 (4.1%) | 3.58 |
| Single Female/Mother | 8,234 (9.9%) | 3.30 |
| Non-family | 28,691 (34.4%) | 1.26 |
| Total Households | 83,334 (100.0%) | 2.48 |
Household Size by Marriage Status in Okaloosa County
Out of a total of 83,334 households in Okaloosa County, 54,643 (65.6%) are family households, while 28,691 (34.4%) are nonfamily households. The most numerous type of family households are 2-person households, comprising 26,183, and the most common type of nonfamily households are 1-person households, comprising 23,493.
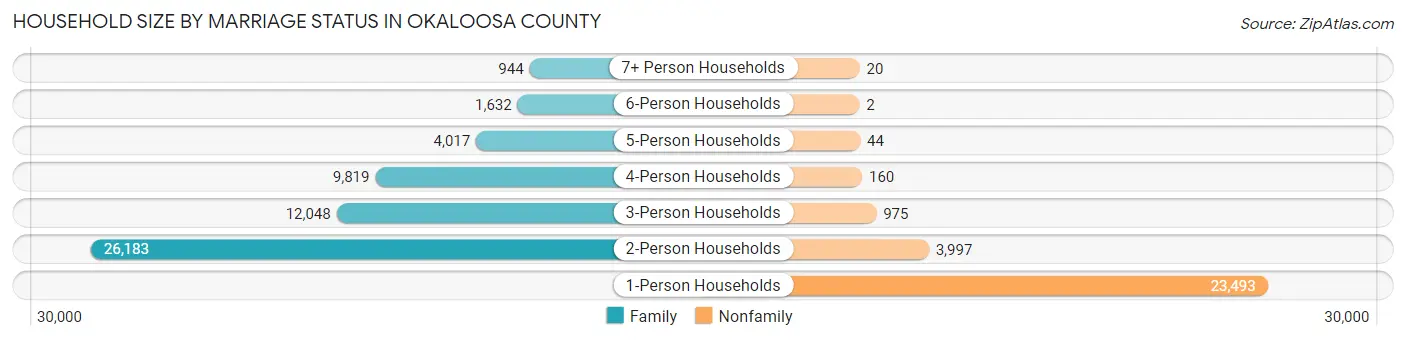
| Household Size | Family Households | Nonfamily Households |
| 1-Person Households | - | 23,493 (28.2%) |
| 2-Person Households | 26,183 (31.4%) | 3,997 (4.8%) |
| 3-Person Households | 12,048 (14.5%) | 975 (1.2%) |
| 4-Person Households | 9,819 (11.8%) | 160 (0.2%) |
| 5-Person Households | 4,017 (4.8%) | 44 (0.1%) |
| 6-Person Households | 1,632 (2.0%) | 2 (0.0%) |
| 7+ Person Households | 944 (1.1%) | 20 (0.0%) |
| Total | 54,643 (65.6%) | 28,691 (34.4%) |
Female Fertility in Okaloosa County
Fertility by Age in Okaloosa County
Average fertility rate in Okaloosa County is 73.0 births per 1,000 women. Women in the age bracket of 20 to 34 years have the highest fertility rate with 134.0 births per 1,000 women. Women in the age bracket of 20 to 34 years acount for 83.9% of all women with births.
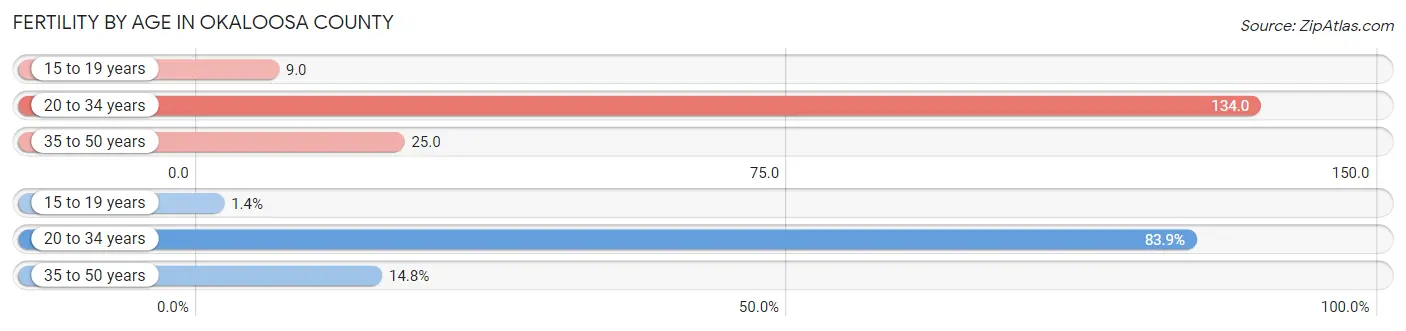
| Age Bracket | Women with Births | Births / 1,000 Women |
| 15 to 19 years | 47 (1.4%) | 9.0 |
| 20 to 34 years | 2,870 (83.9%) | 134.0 |
| 35 to 50 years | 505 (14.8%) | 25.0 |
| Total | 3,422 (100.0%) | 73.0 |
Fertility by Age by Marriage Status in Okaloosa County
71.7% of women with births (3,422) in Okaloosa County are married. The highest percentage of unmarried women with births falls into 15 to 19 years age bracket with 76.6% of them unmarried at the time of birth, while the lowest percentage of unmarried women with births belong to 35 to 50 years age bracket with 25.7% of them unmarried.
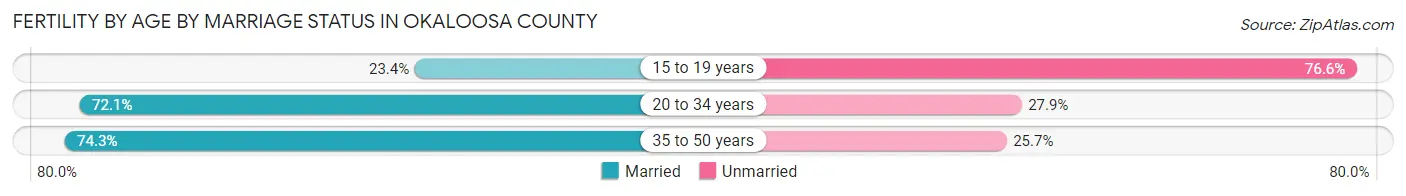
| Age Bracket | Married | Unmarried |
| 15 to 19 years | 11 (23.4%) | 36 (76.6%) |
| 20 to 34 years | 2,069 (72.1%) | 801 (27.9%) |
| 35 to 50 years | 375 (74.3%) | 130 (25.7%) |
| Total | 2,454 (71.7%) | 968 (28.3%) |
Fertility by Education in Okaloosa County
Average fertility rate in Okaloosa County is 73.0 births per 1,000 women. Women with the education attainment of bachelor's degree have the highest fertility rate of 101.0 births per 1,000 women, while women with the education attainment of graduate degree have the lowest fertility at 41.0 births per 1,000 women. Women with the education attainment of college or associate's degree represent 34.1% of all women with births.
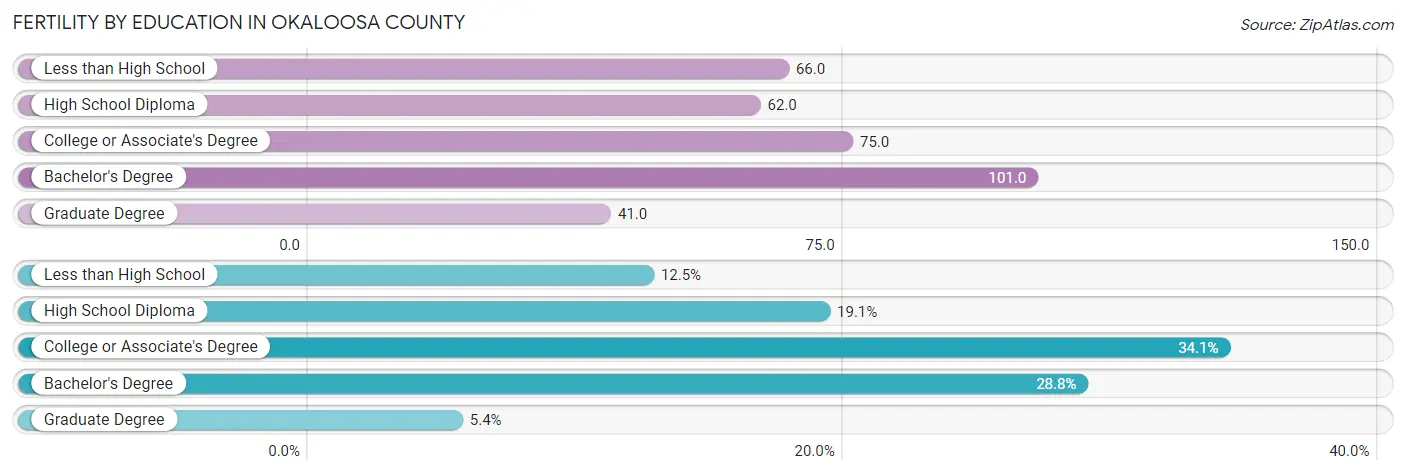
| Educational Attainment | Women with Births | Births / 1,000 Women |
| Less than High School | 429 (12.5%) | 66.0 |
| High School Diploma | 655 (19.1%) | 62.0 |
| College or Associate's Degree | 1,168 (34.1%) | 75.0 |
| Bachelor's Degree | 986 (28.8%) | 101.0 |
| Graduate Degree | 184 (5.4%) | 41.0 |
| Total | 3,422 (100.0%) | 73.0 |
Fertility by Education by Marriage Status in Okaloosa County
28.3% of women with births in Okaloosa County are unmarried. Women with the educational attainment of graduate degree are most likely to be married with 100.0% of them married at childbirth, while women with the educational attainment of less than high school are least likely to be married with 78.5% of them unmarried at childbirth.
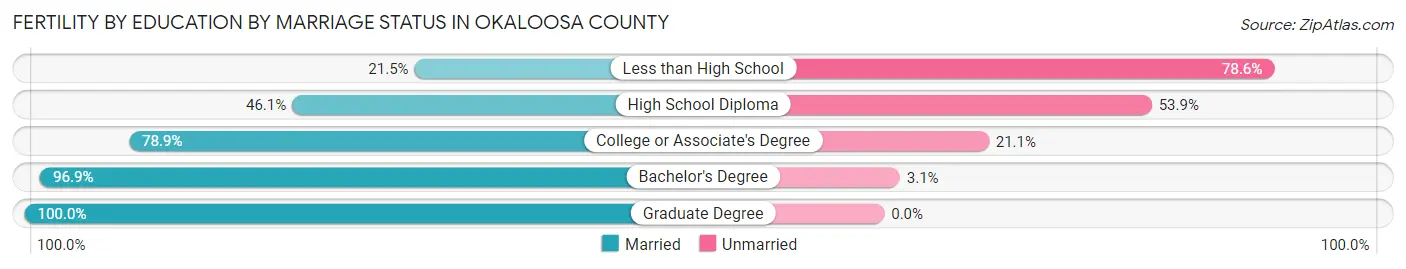
| Educational Attainment | Married | Unmarried |
| Less than High School | 92 (21.4%) | 337 (78.5%) |
| High School Diploma | 302 (46.1%) | 353 (53.9%) |
| College or Associate's Degree | 922 (78.9%) | 246 (21.1%) |
| Bachelor's Degree | 955 (96.9%) | 31 (3.1%) |
| Graduate Degree | 184 (100.0%) | 0 (0.0%) |
| Total | 2,454 (71.7%) | 968 (28.3%) |
Employment Characteristics in Okaloosa County
Employment by Class of Employer in Okaloosa County
Among the 104,566 employed individuals in Okaloosa County, private company employees (56,837 | 54.4%), federal government employees (22,217 | 21.2%), and self-employed (not incorporated) (6,999 | 6.7%) make up the most common classes of employment.
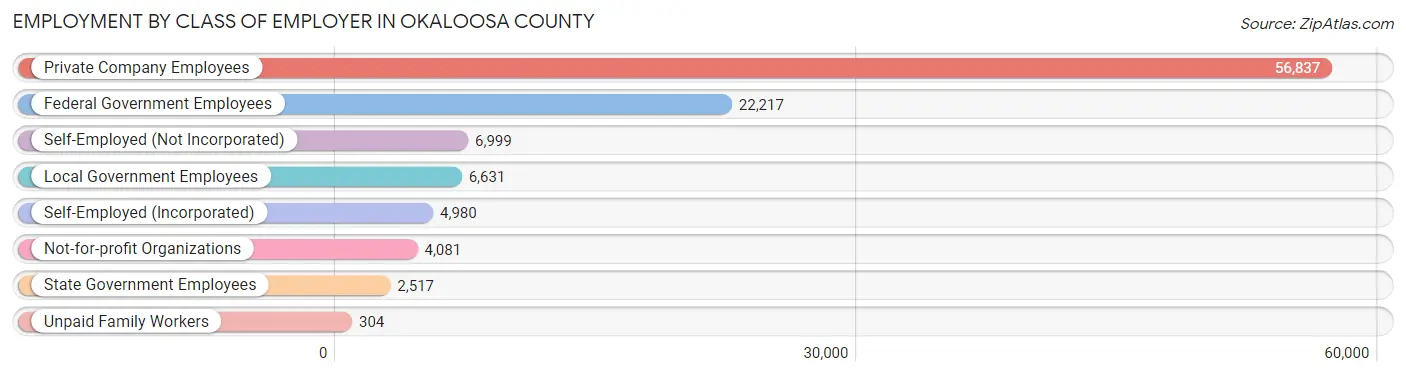
| Employer Class | # Employees | % Employees |
| Private Company Employees | 56,837 | 54.4% |
| Self-Employed (Incorporated) | 4,980 | 4.8% |
| Self-Employed (Not Incorporated) | 6,999 | 6.7% |
| Not-for-profit Organizations | 4,081 | 3.9% |
| Local Government Employees | 6,631 | 6.3% |
| State Government Employees | 2,517 | 2.4% |
| Federal Government Employees | 22,217 | 21.2% |
| Unpaid Family Workers | 304 | 0.3% |
| Total | 104,566 | 100.0% |
Employment Status by Age in Okaloosa County
According to the labor force statistics for Okaloosa County, out of the total population over 16 years of age (170,014), 64.6% or 109,829 individuals are in the labor force, with 3.3% or 3,624 of them unemployed. The age group with the highest labor force participation rate is 25 to 29 years, with 84.6% or 13,891 individuals in the labor force. Within the labor force, the 16 to 19 years age range has the highest percentage of unemployed individuals, with 6.6% or 308 of them being unemployed.
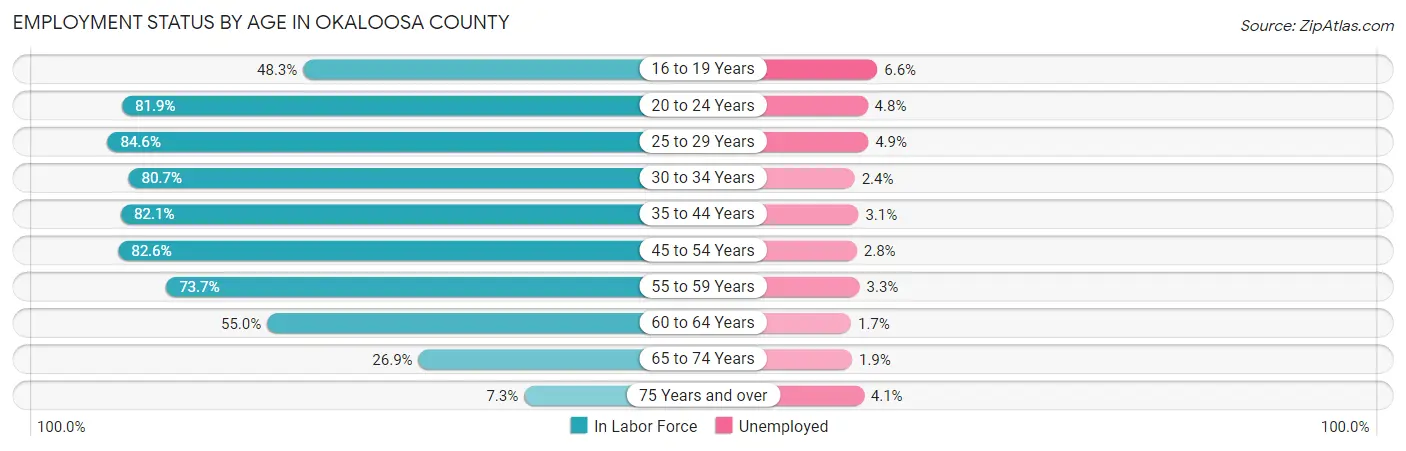
| Age Bracket | In Labor Force | Unemployed |
| 16 to 19 Years | 4,674 (48.3%) | 308 (6.6%) |
| 20 to 24 Years | 11,738 (81.9%) | 563 (4.8%) |
| 25 to 29 Years | 13,891 (84.6%) | 681 (4.9%) |
| 30 to 34 Years | 13,309 (80.7%) | 319 (2.4%) |
| 35 to 44 Years | 22,417 (82.1%) | 695 (3.1%) |
| 45 to 54 Years | 18,997 (82.6%) | 532 (2.8%) |
| 55 to 59 Years | 10,623 (73.7%) | 351 (3.3%) |
| 60 to 64 Years | 7,597 (55.0%) | 129 (1.7%) |
| 65 to 74 Years | 5,528 (26.9%) | 105 (1.9%) |
| 75 Years and over | 1,023 (7.3%) | 42 (4.1%) |
| Total | 109,829 (64.6%) | 3,624 (3.3%) |
Employment Status by Educational Attainment in Okaloosa County
According to labor force statistics for Okaloosa County, 77.9% of individuals (86,813) out of the total population between 25 and 64 years of age (111,441) are in the labor force, with 3.1% or 2,691 of them being unemployed. The group with the highest labor force participation rate are those with the educational attainment of bachelor's degree or higher, with 85.9% or 32,383 individuals in the labor force. Within the labor force, individuals with less than high school education have the highest percentage of unemployment, with 9.3% or 420 of them being unemployed.
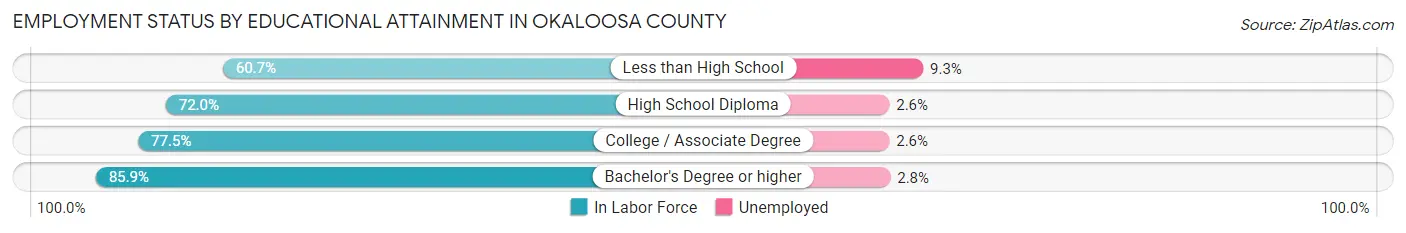
| Educational Attainment | In Labor Force | Unemployed |
| Less than High School | 4,516 (60.7%) | 692 (9.3%) |
| High School Diploma | 18,828 (72.0%) | 680 (2.6%) |
| College / Associate Degree | 31,119 (77.5%) | 1,044 (2.6%) |
| Bachelor's Degree or higher | 32,383 (85.9%) | 1,056 (2.8%) |
| Total | 86,813 (77.9%) | 3,455 (3.1%) |
Employment Occupations by Sex in Okaloosa County
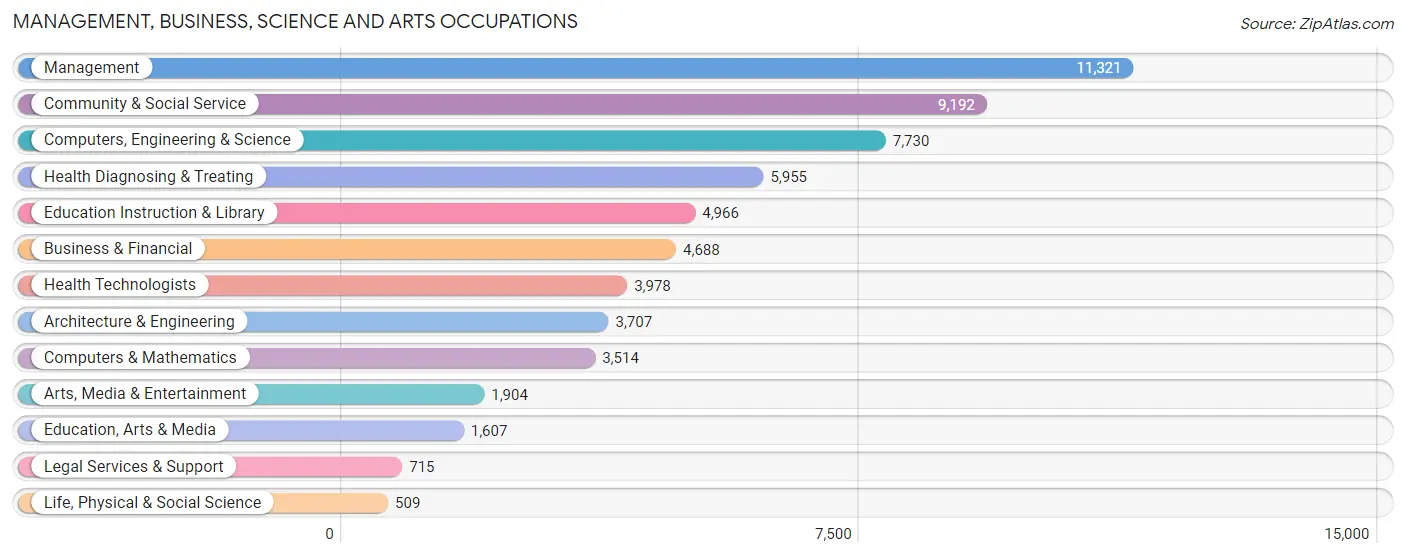
Management, Business, Science and Arts Occupations
The most common Management, Business, Science and Arts occupations in Okaloosa County are Management (11,321 | 12.0%), Community & Social Service (9,192 | 9.7%), Computers, Engineering & Science (7,730 | 8.2%), Health Diagnosing & Treating (5,955 | 6.3%), and Education Instruction & Library (4,966 | 5.2%).
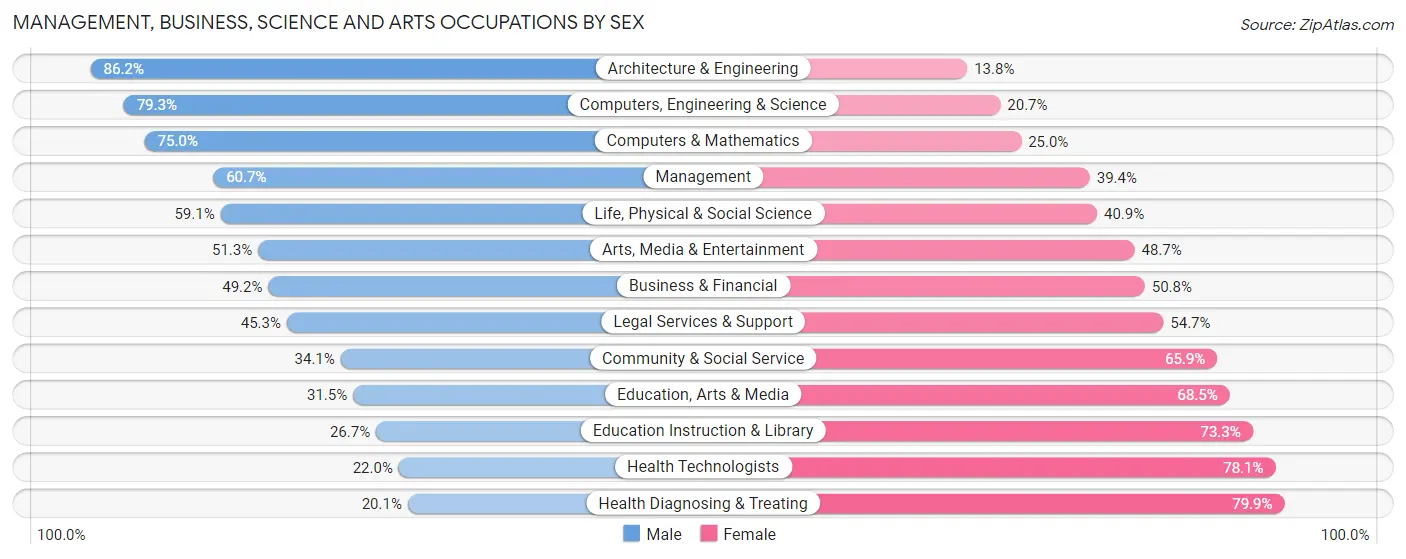
Management, Business, Science and Arts Occupations by Sex
Within the Management, Business, Science and Arts occupations in Okaloosa County, the most male-oriented occupations are Architecture & Engineering (86.2%), Computers, Engineering & Science (79.3%), and Computers & Mathematics (75.0%), while the most female-oriented occupations are Health Diagnosing & Treating (79.9%), Health Technologists (78.0%), and Education Instruction & Library (73.3%).
| Occupation | Male | Female |
| Management | 6,866 (60.7%) | 4,455 (39.4%) |
| Business & Financial | 2,305 (49.2%) | 2,383 (50.8%) |
| Computers, Engineering & Science | 6,131 (79.3%) | 1,599 (20.7%) |
| Computers & Mathematics | 2,634 (75.0%) | 880 (25.0%) |
| Architecture & Engineering | 3,196 (86.2%) | 511 (13.8%) |
| Life, Physical & Social Science | 301 (59.1%) | 208 (40.9%) |
| Community & Social Service | 3,133 (34.1%) | 6,059 (65.9%) |
| Education, Arts & Media | 506 (31.5%) | 1,101 (68.5%) |
| Legal Services & Support | 324 (45.3%) | 391 (54.7%) |
| Education Instruction & Library | 1,326 (26.7%) | 3,640 (73.3%) |
| Arts, Media & Entertainment | 977 (51.3%) | 927 (48.7%) |
| Health Diagnosing & Treating | 1,196 (20.1%) | 4,759 (79.9%) |
| Health Technologists | 873 (22.0%) | 3,105 (78.0%) |
| Total (Category) | 19,631 (50.5%) | 19,255 (49.5%) |
| Total (Overall) | 50,815 (53.7%) | 43,751 (46.3%) |
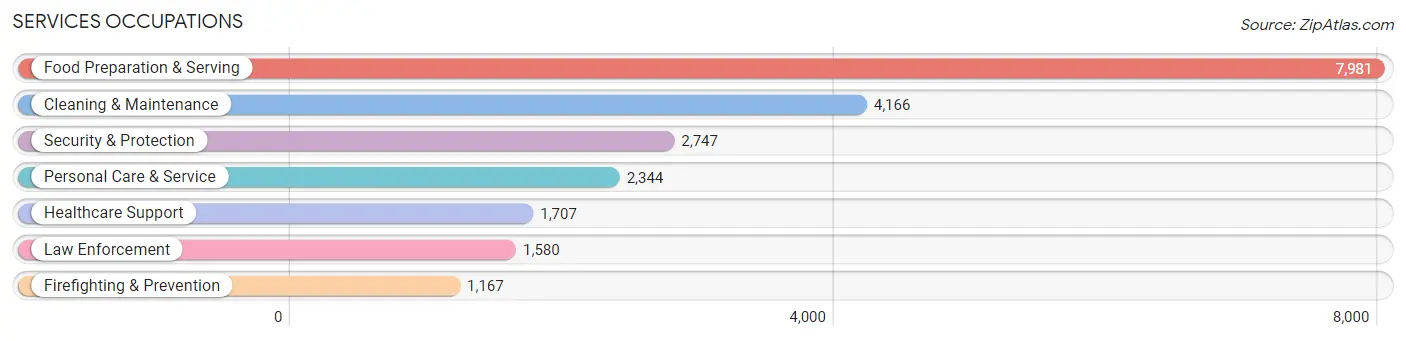
Services Occupations
The most common Services occupations in Okaloosa County are Food Preparation & Serving (7,981 | 8.4%), Cleaning & Maintenance (4,166 | 4.4%), Security & Protection (2,747 | 2.9%), Personal Care & Service (2,344 | 2.5%), and Healthcare Support (1,707 | 1.8%).
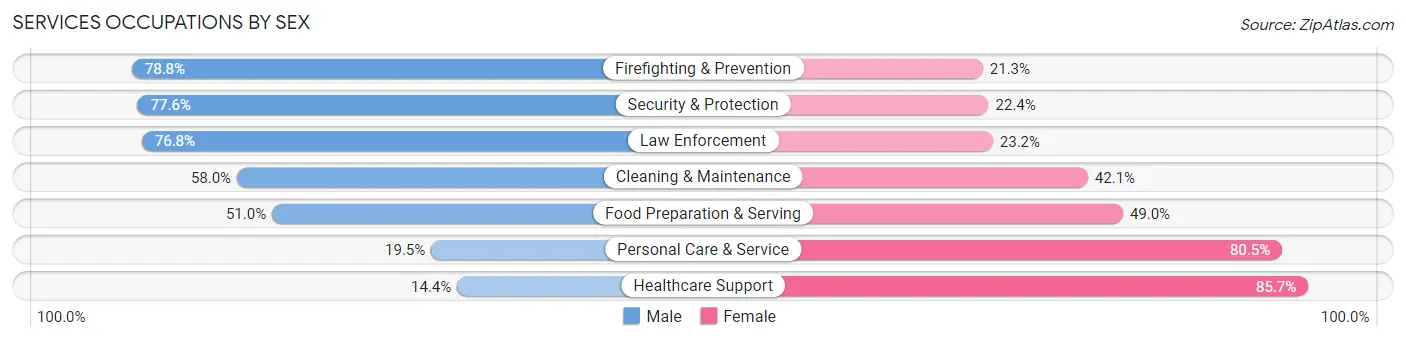
Services Occupations by Sex
Within the Services occupations in Okaloosa County, the most male-oriented occupations are Firefighting & Prevention (78.7%), Security & Protection (77.6%), and Law Enforcement (76.8%), while the most female-oriented occupations are Healthcare Support (85.7%), Personal Care & Service (80.5%), and Food Preparation & Serving (49.0%).
| Occupation | Male | Female |
| Healthcare Support | 245 (14.3%) | 1,462 (85.7%) |
| Security & Protection | 2,132 (77.6%) | 615 (22.4%) |
| Firefighting & Prevention | 919 (78.7%) | 248 (21.2%) |
| Law Enforcement | 1,213 (76.8%) | 367 (23.2%) |
| Food Preparation & Serving | 4,071 (51.0%) | 3,910 (49.0%) |
| Cleaning & Maintenance | 2,414 (58.0%) | 1,752 (42.0%) |
| Personal Care & Service | 457 (19.5%) | 1,887 (80.5%) |
| Total (Category) | 9,319 (49.2%) | 9,626 (50.8%) |
| Total (Overall) | 50,815 (53.7%) | 43,751 (46.3%) |
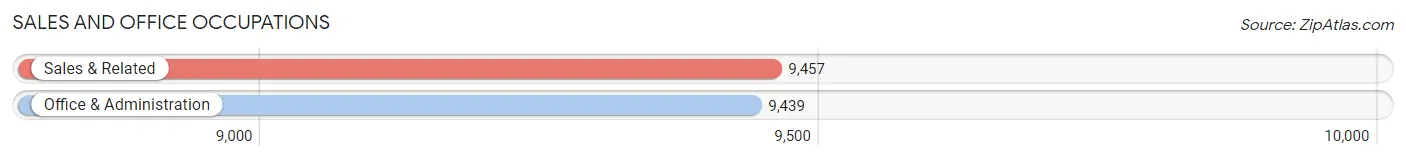
Sales and Office Occupations
The most common Sales and Office occupations in Okaloosa County are Sales & Related (9,457 | 10.0%), and Office & Administration (9,439 | 10.0%).
Sales and Office Occupations by Sex
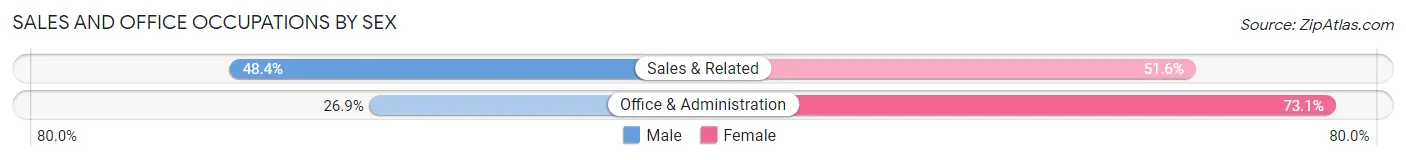
| Occupation | Male | Female |
| Sales & Related | 4,581 (48.4%) | 4,876 (51.6%) |
| Office & Administration | 2,543 (26.9%) | 6,896 (73.1%) |
| Total (Category) | 7,124 (37.7%) | 11,772 (62.3%) |
| Total (Overall) | 50,815 (53.7%) | 43,751 (46.3%) |
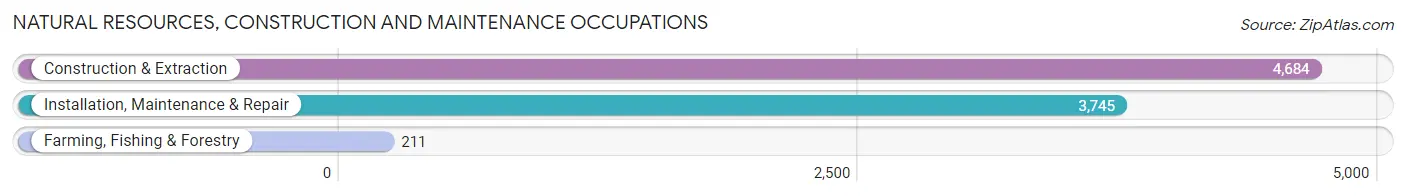
Natural Resources, Construction and Maintenance Occupations
The most common Natural Resources, Construction and Maintenance occupations in Okaloosa County are Construction & Extraction (4,684 | 5.0%), Installation, Maintenance & Repair (3,745 | 4.0%), and Farming, Fishing & Forestry (211 | 0.2%).
Natural Resources, Construction and Maintenance Occupations by Sex
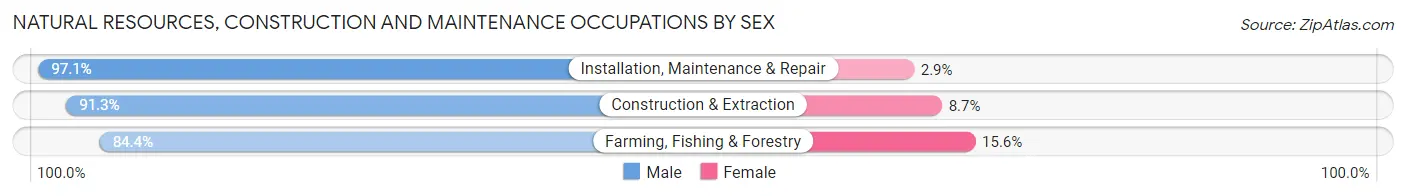
| Occupation | Male | Female |
| Farming, Fishing & Forestry | 178 (84.4%) | 33 (15.6%) |
| Construction & Extraction | 4,277 (91.3%) | 407 (8.7%) |
| Installation, Maintenance & Repair | 3,637 (97.1%) | 108 (2.9%) |
| Total (Category) | 8,092 (93.7%) | 548 (6.3%) |
| Total (Overall) | 50,815 (53.7%) | 43,751 (46.3%) |
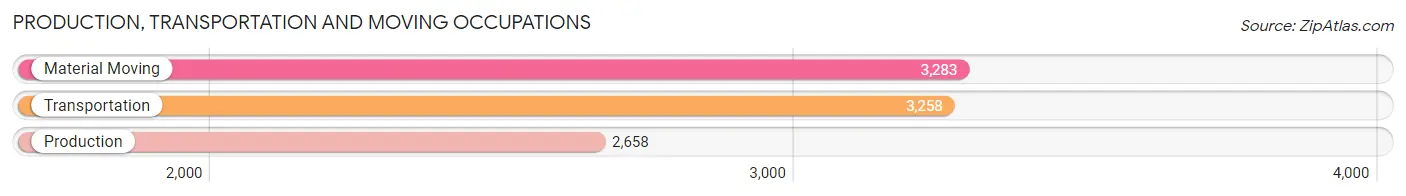
Production, Transportation and Moving Occupations
The most common Production, Transportation and Moving occupations in Okaloosa County are Material Moving (3,283 | 3.5%), Transportation (3,258 | 3.5%), and Production (2,658 | 2.8%).
Production, Transportation and Moving Occupations by Sex
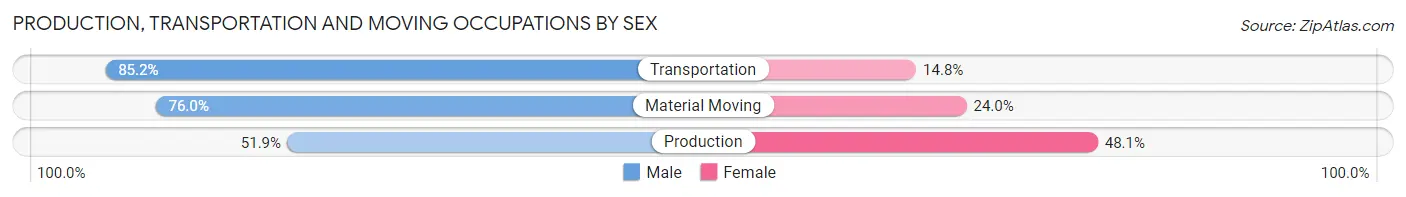
| Occupation | Male | Female |
| Production | 1,379 (51.9%) | 1,279 (48.1%) |
| Transportation | 2,776 (85.2%) | 482 (14.8%) |
| Material Moving | 2,494 (76.0%) | 789 (24.0%) |
| Total (Category) | 6,649 (72.3%) | 2,550 (27.7%) |
| Total (Overall) | 50,815 (53.7%) | 43,751 (46.3%) |
Employment Industries by Sex in Okaloosa County
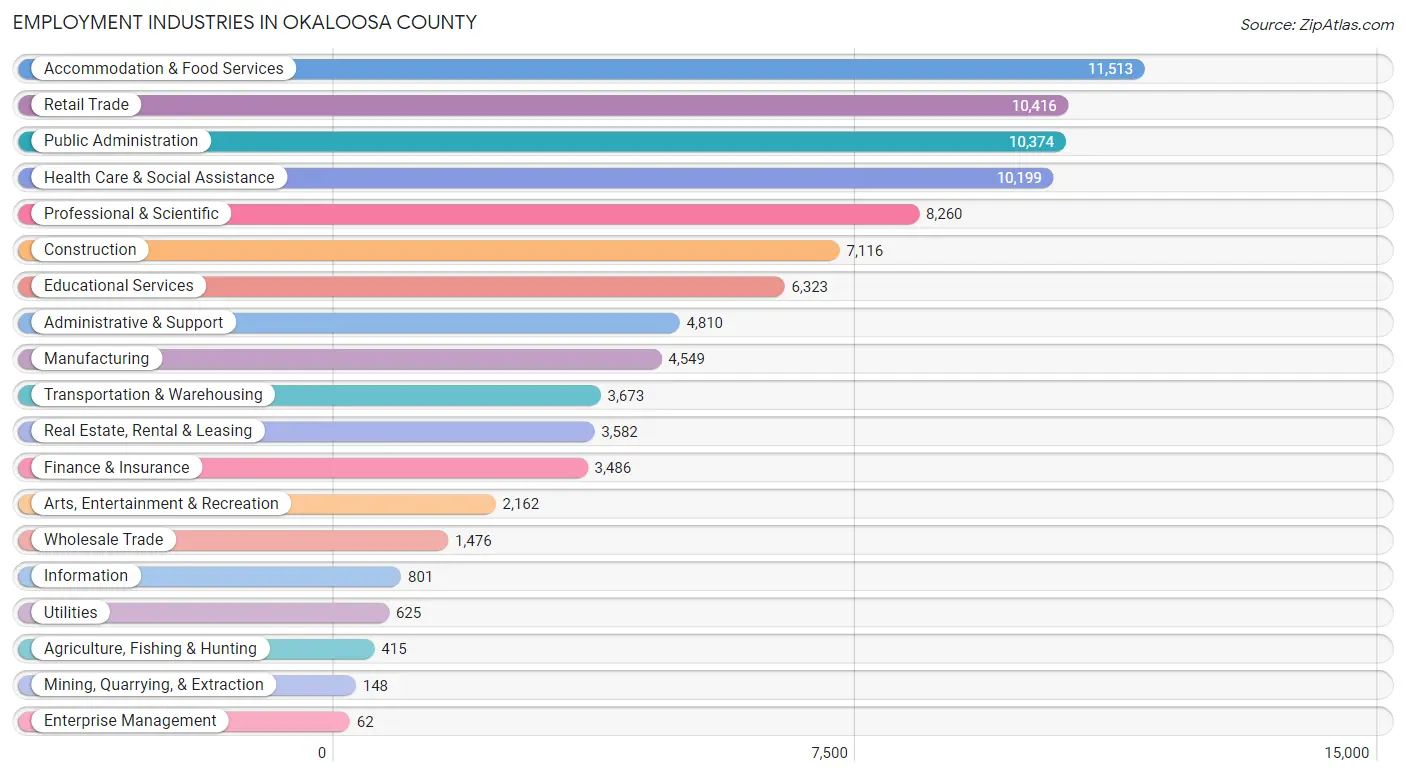
Employment Industries in Okaloosa County
The major employment industries in Okaloosa County include Accommodation & Food Services (11,513 | 12.2%), Retail Trade (10,416 | 11.0%), Public Administration (10,374 | 11.0%), Health Care & Social Assistance (10,199 | 10.8%), and Professional & Scientific (8,260 | 8.7%).
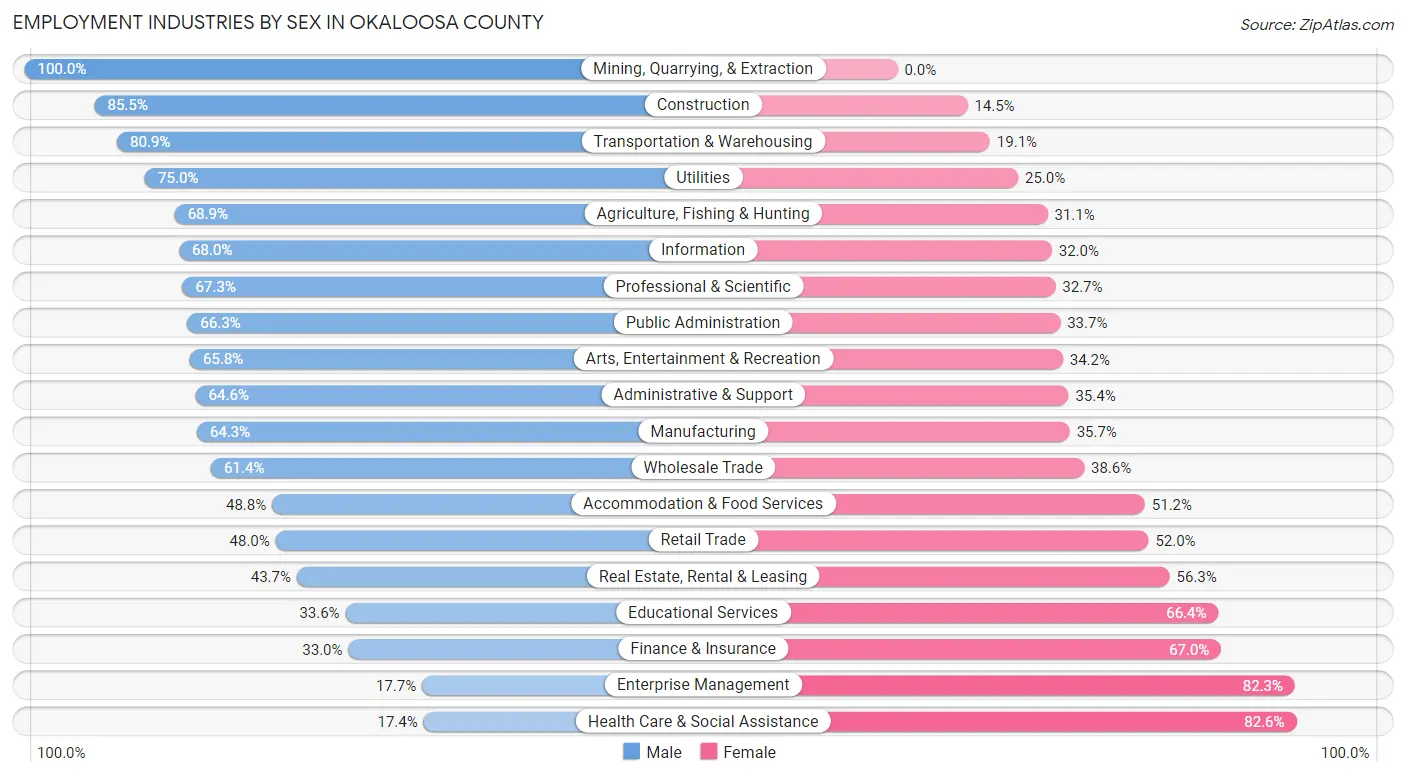
Employment Industries by Sex in Okaloosa County
The Okaloosa County industries that see more men than women are Mining, Quarrying, & Extraction (100.0%), Construction (85.5%), and Transportation & Warehousing (80.9%), whereas the industries that tend to have a higher number of women are Health Care & Social Assistance (82.6%), Enterprise Management (82.3%), and Finance & Insurance (67.0%).
| Industry | Male | Female |
| Agriculture, Fishing & Hunting | 286 (68.9%) | 129 (31.1%) |
| Mining, Quarrying, & Extraction | 148 (100.0%) | 0 (0.0%) |
| Construction | 6,085 (85.5%) | 1,031 (14.5%) |
| Manufacturing | 2,927 (64.3%) | 1,622 (35.7%) |
| Wholesale Trade | 906 (61.4%) | 570 (38.6%) |
| Retail Trade | 5,004 (48.0%) | 5,412 (52.0%) |
| Transportation & Warehousing | 2,970 (80.9%) | 703 (19.1%) |
| Utilities | 469 (75.0%) | 156 (25.0%) |
| Information | 545 (68.0%) | 256 (32.0%) |
| Finance & Insurance | 1,150 (33.0%) | 2,336 (67.0%) |
| Real Estate, Rental & Leasing | 1,564 (43.7%) | 2,018 (56.3%) |
| Professional & Scientific | 5,560 (67.3%) | 2,700 (32.7%) |
| Enterprise Management | 11 (17.7%) | 51 (82.3%) |
| Administrative & Support | 3,107 (64.6%) | 1,703 (35.4%) |
| Educational Services | 2,124 (33.6%) | 4,199 (66.4%) |
| Health Care & Social Assistance | 1,778 (17.4%) | 8,421 (82.6%) |
| Arts, Entertainment & Recreation | 1,422 (65.8%) | 740 (34.2%) |
| Accommodation & Food Services | 5,616 (48.8%) | 5,897 (51.2%) |
| Public Administration | 6,878 (66.3%) | 3,496 (33.7%) |
| Total | 50,815 (53.7%) | 43,751 (46.3%) |
Education in Okaloosa County
School Enrollment in Okaloosa County
The most common levels of schooling among the 48,373 students in Okaloosa County are middle school (10,121 | 20.9%), high school (9,919 | 20.5%), and elementary school (9,863 | 20.4%).
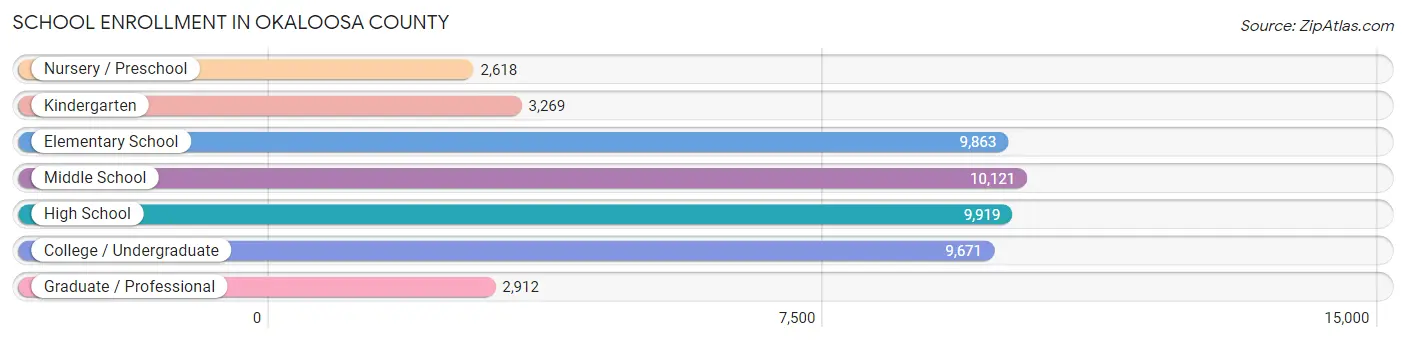
| School Level | # Students | % Students |
| Nursery / Preschool | 2,618 | 5.4% |
| Kindergarten | 3,269 | 6.8% |
| Elementary School | 9,863 | 20.4% |
| Middle School | 10,121 | 20.9% |
| High School | 9,919 | 20.5% |
| College / Undergraduate | 9,671 | 20.0% |
| Graduate / Professional | 2,912 | 6.0% |
| Total | 48,373 | 100.0% |
School Enrollment by Age by Funding Source in Okaloosa County
Out of a total of 48,373 students who are enrolled in schools in Okaloosa County, 7,498 (15.5%) attend a private institution, while the remaining 40,875 (84.5%) are enrolled in public schools. The age group of 3 to 4 year olds has the highest likelihood of being enrolled in private schools, with 714 (35.4% in the age bracket) enrolled. Conversely, the age group of 18 to 19 year olds has the lowest likelihood of being enrolled in a private school, with 2,369 (94.8% in the age bracket) attending a public institution.
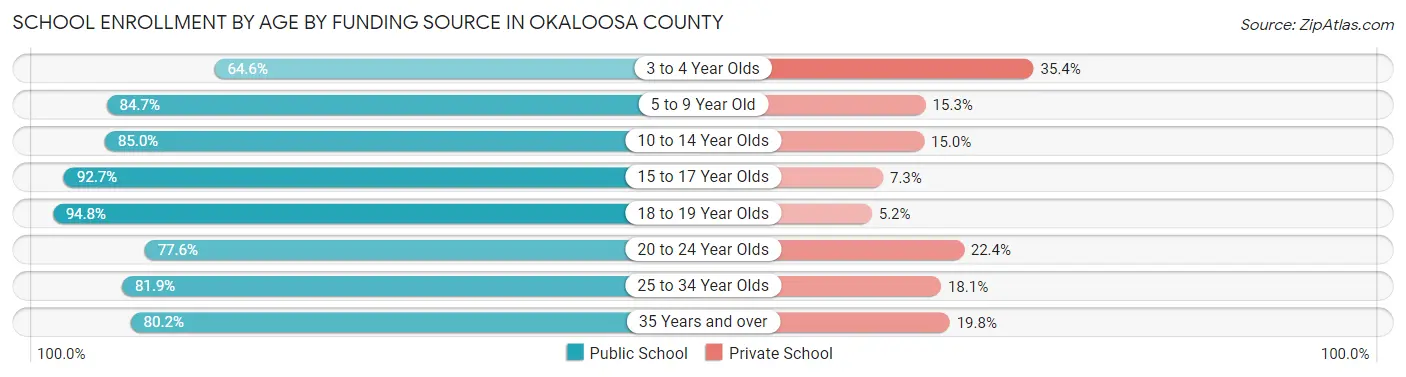
| Age Bracket | Public School | Private School |
| 3 to 4 Year Olds | 1,304 (64.6%) | 714 (35.4%) |
| 5 to 9 Year Old | 10,341 (84.7%) | 1,863 (15.3%) |
| 10 to 14 Year Olds | 10,898 (85.0%) | 1,919 (15.0%) |
| 15 to 17 Year Olds | 6,548 (92.7%) | 518 (7.3%) |
| 18 to 19 Year Olds | 2,369 (94.8%) | 131 (5.2%) |
| 20 to 24 Year Olds | 2,923 (77.6%) | 843 (22.4%) |
| 25 to 34 Year Olds | 3,634 (81.9%) | 805 (18.1%) |
| 35 Years and over | 2,859 (80.2%) | 704 (19.8%) |
| Total | 40,875 (84.5%) | 7,498 (15.5%) |
Educational Attainment by Field of Study in Okaloosa County
Business (10,773 | 21.1%), education (5,844 | 11.5%), engineering (5,685 | 11.2%), science & technology (5,475 | 10.7%), and arts & humanities (3,574 | 7.0%) are the most common fields of study among 50,979 individuals in Okaloosa County who have obtained a bachelor's degree or higher.
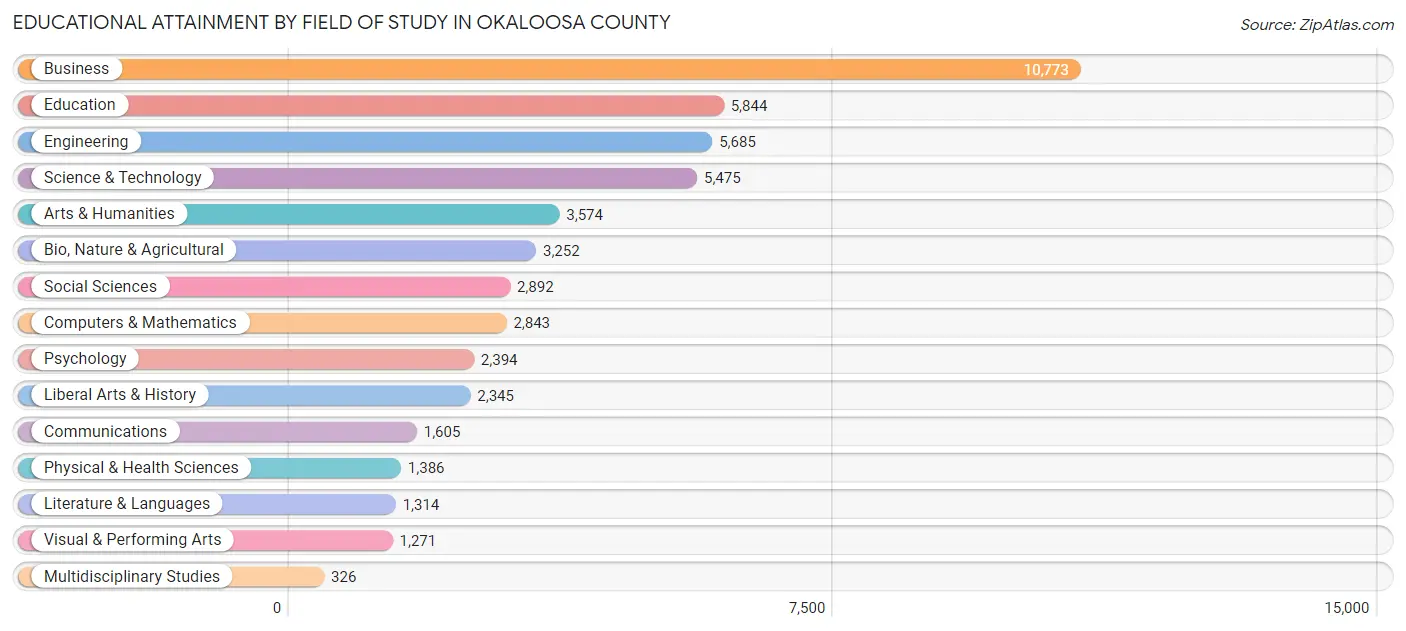
| Field of Study | # Graduates | % Graduates |
| Computers & Mathematics | 2,843 | 5.6% |
| Bio, Nature & Agricultural | 3,252 | 6.4% |
| Physical & Health Sciences | 1,386 | 2.7% |
| Psychology | 2,394 | 4.7% |
| Social Sciences | 2,892 | 5.7% |
| Engineering | 5,685 | 11.2% |
| Multidisciplinary Studies | 326 | 0.6% |
| Science & Technology | 5,475 | 10.7% |
| Business | 10,773 | 21.1% |
| Education | 5,844 | 11.5% |
| Literature & Languages | 1,314 | 2.6% |
| Liberal Arts & History | 2,345 | 4.6% |
| Visual & Performing Arts | 1,271 | 2.5% |
| Communications | 1,605 | 3.2% |
| Arts & Humanities | 3,574 | 7.0% |
| Total | 50,979 | 100.0% |
Transportation & Commute in Okaloosa County
Vehicle Availability by Sex in Okaloosa County
The most prevalent vehicle ownership categories in Okaloosa County are males with 2 vehicles (26,262, accounting for 45.2%) and females with 2 vehicles (19,241, making up 59.2%).
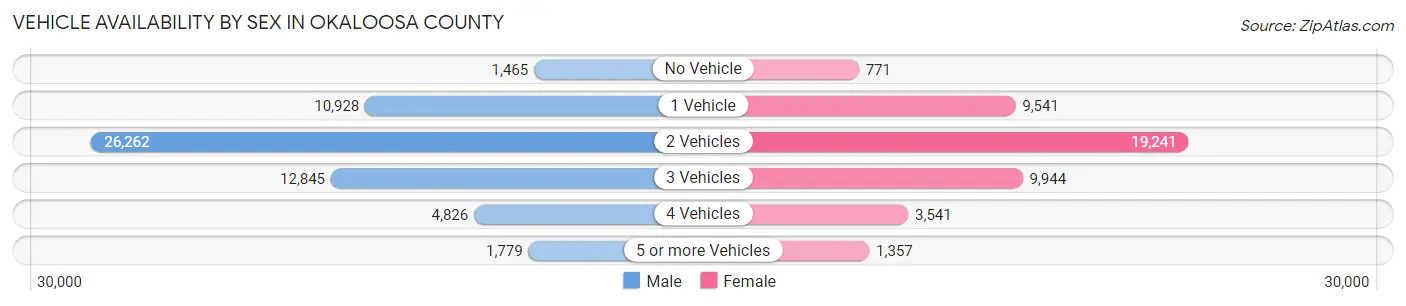
| Vehicles Available | Male | Female |
| No Vehicle | 1,465 (2.5%) | 771 (1.7%) |
| 1 Vehicle | 10,928 (18.8%) | 9,541 (21.5%) |
| 2 Vehicles | 26,262 (45.2%) | 19,241 (43.3%) |
| 3 Vehicles | 12,845 (22.1%) | 9,944 (22.4%) |
| 4 Vehicles | 4,826 (8.3%) | 3,541 (8.0%) |
| 5 or more Vehicles | 1,779 (3.1%) | 1,357 (3.1%) |
| Total | 58,105 (100.0%) | 44,395 (100.0%) |
Commute Time in Okaloosa County
The most frequently occuring commute durations in Okaloosa County are 10 to 14 minutes (14,907 commuters, 15.6%), 15 to 19 minutes (14,345 commuters, 15.0%), and 5 to 9 minutes (11,950 commuters, 12.5%).
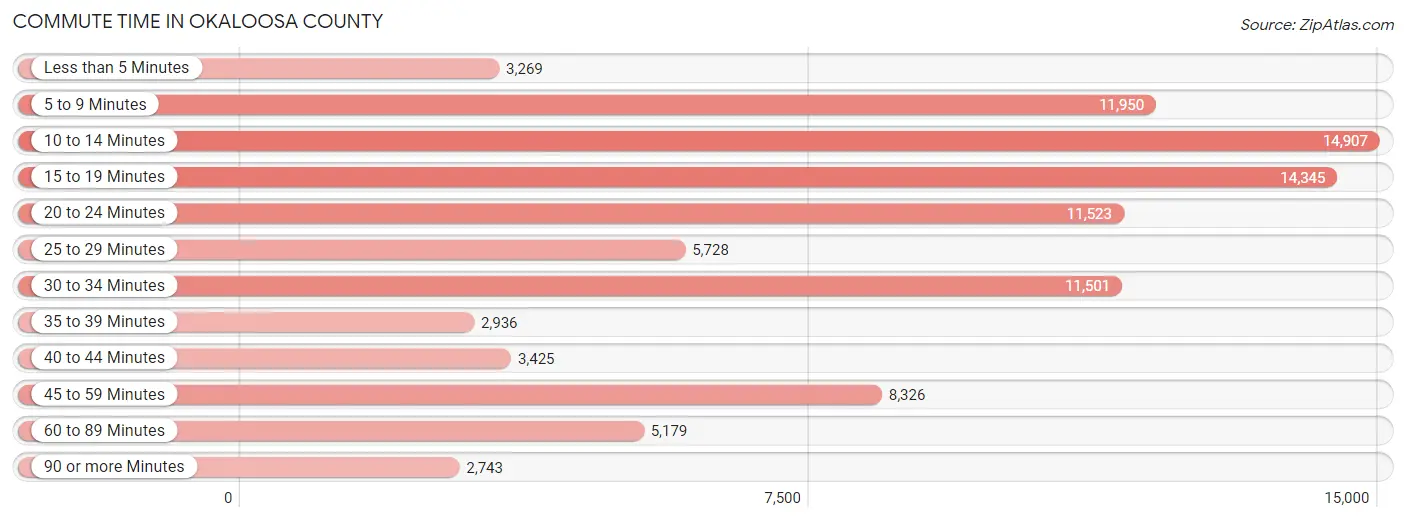
| Commute Time | # Commuters | % Commuters |
| Less than 5 Minutes | 3,269 | 3.4% |
| 5 to 9 Minutes | 11,950 | 12.5% |
| 10 to 14 Minutes | 14,907 | 15.6% |
| 15 to 19 Minutes | 14,345 | 15.0% |
| 20 to 24 Minutes | 11,523 | 12.0% |
| 25 to 29 Minutes | 5,728 | 6.0% |
| 30 to 34 Minutes | 11,501 | 12.0% |
| 35 to 39 Minutes | 2,936 | 3.1% |
| 40 to 44 Minutes | 3,425 | 3.6% |
| 45 to 59 Minutes | 8,326 | 8.7% |
| 60 to 89 Minutes | 5,179 | 5.4% |
| 90 or more Minutes | 2,743 | 2.9% |
Commute Time by Sex in Okaloosa County
The most common commute times in Okaloosa County are 10 to 14 minutes (7,900 commuters, 14.2%) for males and 10 to 14 minutes (7,007 commuters, 17.5%) for females.
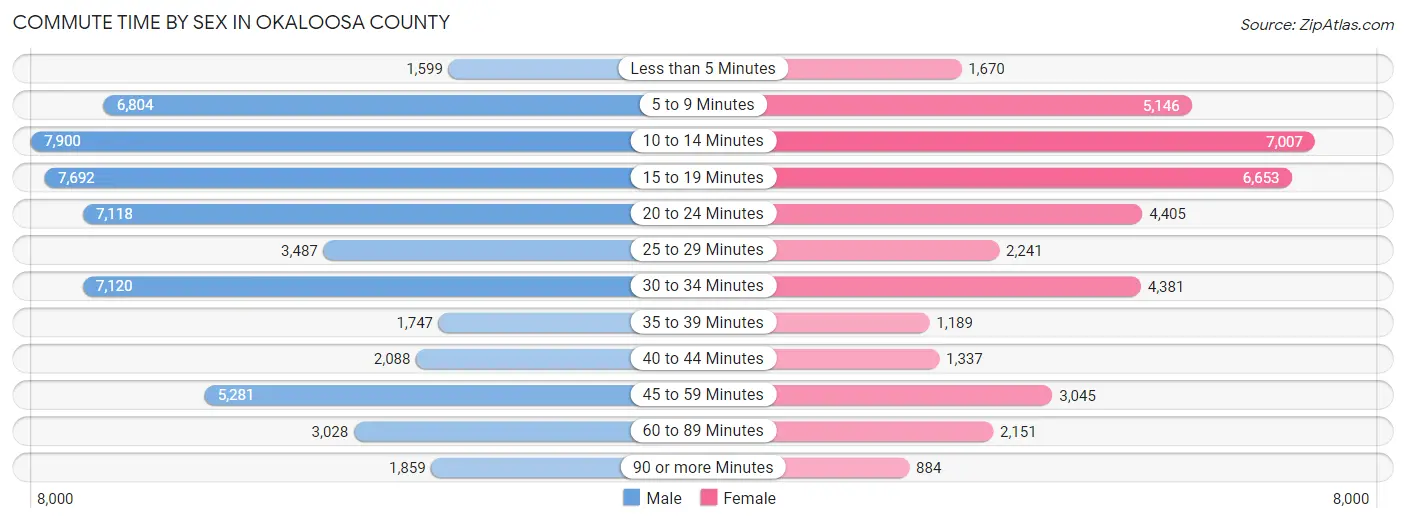
| Commute Time | Male | Female |
| Less than 5 Minutes | 1,599 (2.9%) | 1,670 (4.2%) |
| 5 to 9 Minutes | 6,804 (12.2%) | 5,146 (12.8%) |
| 10 to 14 Minutes | 7,900 (14.2%) | 7,007 (17.5%) |
| 15 to 19 Minutes | 7,692 (13.8%) | 6,653 (16.6%) |
| 20 to 24 Minutes | 7,118 (12.8%) | 4,405 (11.0%) |
| 25 to 29 Minutes | 3,487 (6.3%) | 2,241 (5.6%) |
| 30 to 34 Minutes | 7,120 (12.8%) | 4,381 (10.9%) |
| 35 to 39 Minutes | 1,747 (3.1%) | 1,189 (3.0%) |
| 40 to 44 Minutes | 2,088 (3.7%) | 1,337 (3.3%) |
| 45 to 59 Minutes | 5,281 (9.5%) | 3,045 (7.6%) |
| 60 to 89 Minutes | 3,028 (5.4%) | 2,151 (5.4%) |
| 90 or more Minutes | 1,859 (3.3%) | 884 (2.2%) |
Time of Departure to Work by Sex in Okaloosa County
The most frequent times of departure to work in Okaloosa County are 6:00 AM to 6:29 AM (7,355, 13.2%) for males and 7:00 AM to 7:29 AM (5,815, 14.5%) for females.
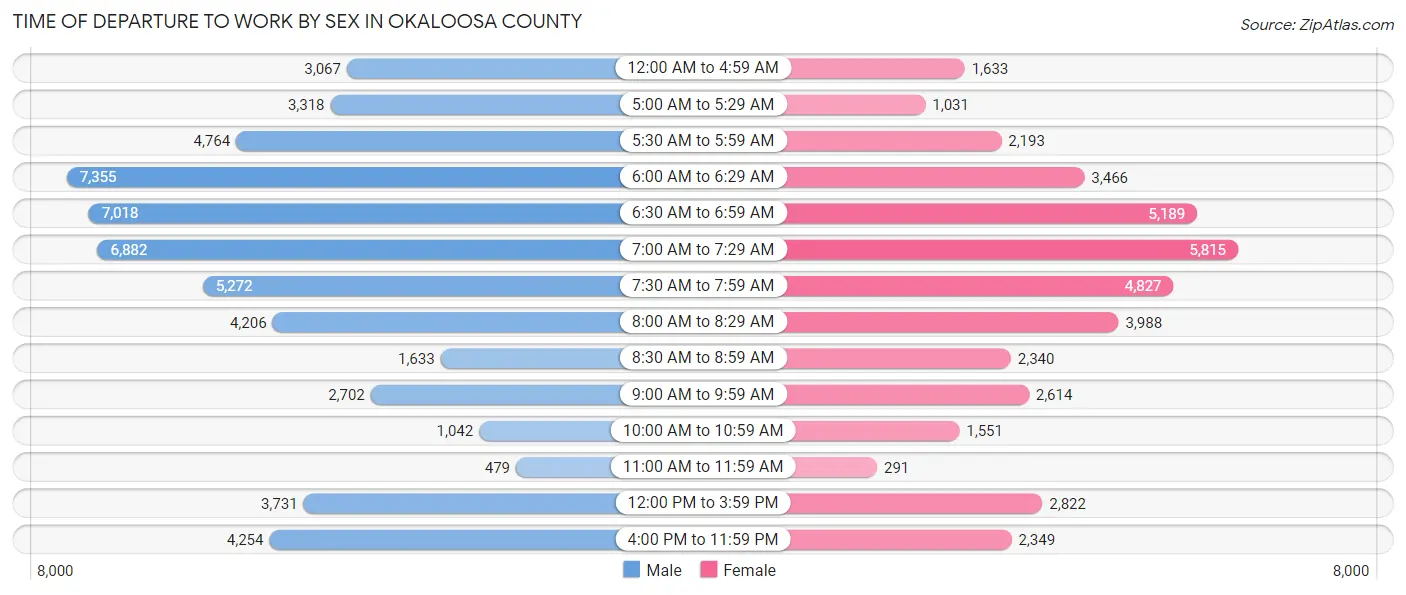
| Time of Departure | Male | Female |
| 12:00 AM to 4:59 AM | 3,067 (5.5%) | 1,633 (4.1%) |
| 5:00 AM to 5:29 AM | 3,318 (5.9%) | 1,031 (2.6%) |
| 5:30 AM to 5:59 AM | 4,764 (8.6%) | 2,193 (5.5%) |
| 6:00 AM to 6:29 AM | 7,355 (13.2%) | 3,466 (8.6%) |
| 6:30 AM to 6:59 AM | 7,018 (12.6%) | 5,189 (12.9%) |
| 7:00 AM to 7:29 AM | 6,882 (12.3%) | 5,815 (14.5%) |
| 7:30 AM to 7:59 AM | 5,272 (9.5%) | 4,827 (12.0%) |
| 8:00 AM to 8:29 AM | 4,206 (7.5%) | 3,988 (9.9%) |
| 8:30 AM to 8:59 AM | 1,633 (2.9%) | 2,340 (5.8%) |
| 9:00 AM to 9:59 AM | 2,702 (4.9%) | 2,614 (6.5%) |
| 10:00 AM to 10:59 AM | 1,042 (1.9%) | 1,551 (3.9%) |
| 11:00 AM to 11:59 AM | 479 (0.9%) | 291 (0.7%) |
| 12:00 PM to 3:59 PM | 3,731 (6.7%) | 2,822 (7.0%) |
| 4:00 PM to 11:59 PM | 4,254 (7.6%) | 2,349 (5.9%) |
| Total | 55,723 (100.0%) | 40,109 (100.0%) |
Housing Occupancy in Okaloosa County
Occupancy by Ownership in Okaloosa County
Of the total 83,334 dwellings in Okaloosa County, owner-occupied units account for 56,031 (67.2%), while renter-occupied units make up 27,303 (32.8%).
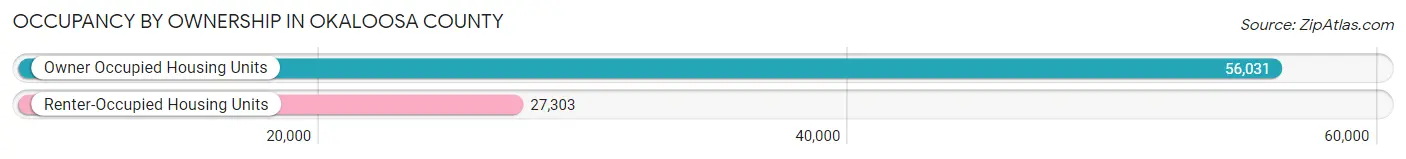
| Occupancy | # Housing Units | % Housing Units |
| Owner Occupied Housing Units | 56,031 | 67.2% |
| Renter-Occupied Housing Units | 27,303 | 32.8% |
| Total Occupied Housing Units | 83,334 | 100.0% |
Occupancy by Household Size in Okaloosa County
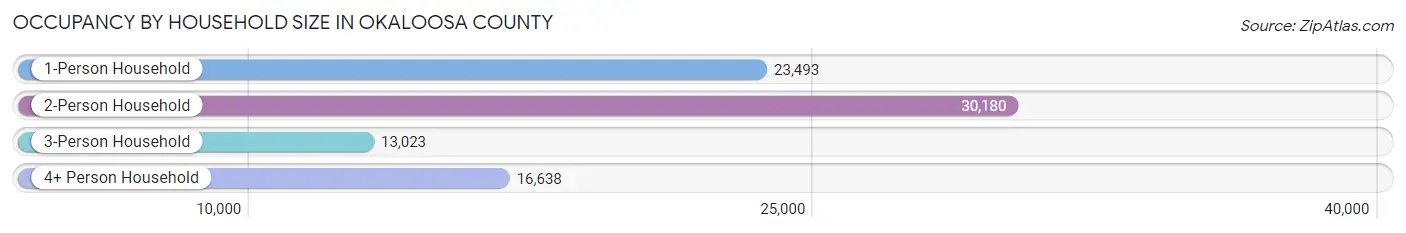
| Household Size | # Housing Units | % Housing Units |
| 1-Person Household | 23,493 | 28.2% |
| 2-Person Household | 30,180 | 36.2% |
| 3-Person Household | 13,023 | 15.6% |
| 4+ Person Household | 16,638 | 20.0% |
| Total Housing Units | 83,334 | 100.0% |
Occupancy by Ownership by Household Size in Okaloosa County
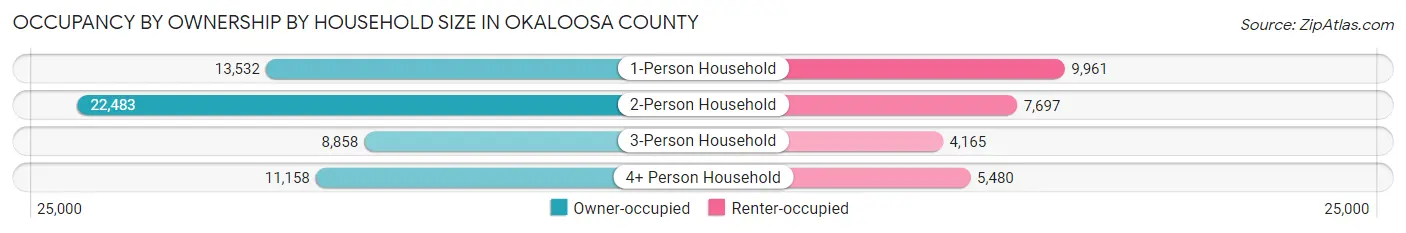
| Household Size | Owner-occupied | Renter-occupied |
| 1-Person Household | 13,532 (57.6%) | 9,961 (42.4%) |
| 2-Person Household | 22,483 (74.5%) | 7,697 (25.5%) |
| 3-Person Household | 8,858 (68.0%) | 4,165 (32.0%) |
| 4+ Person Household | 11,158 (67.1%) | 5,480 (32.9%) |
| Total Housing Units | 56,031 (67.2%) | 27,303 (32.8%) |
Occupancy by Educational Attainment in Okaloosa County
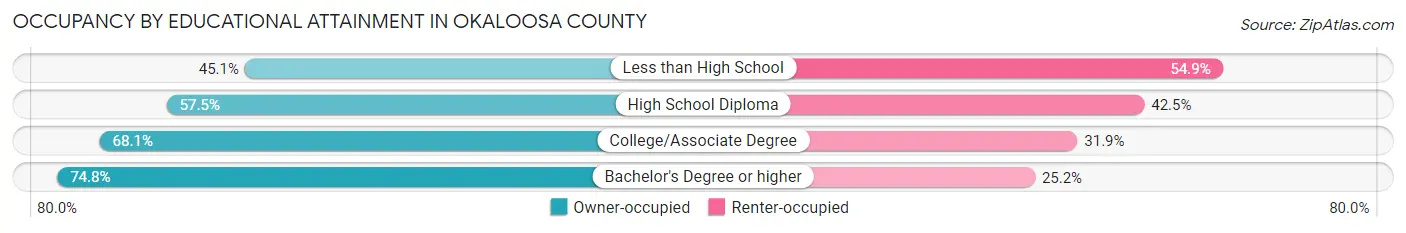
| Household Size | Owner-occupied | Renter-occupied |
| Less than High School | 1,899 (45.1%) | 2,314 (54.9%) |
| High School Diploma | 9,482 (57.5%) | 7,016 (42.5%) |
| College/Associate Degree | 22,321 (68.1%) | 10,459 (31.9%) |
| Bachelor's Degree or higher | 22,329 (74.8%) | 7,514 (25.2%) |
Occupancy by Age of Householder in Okaloosa County
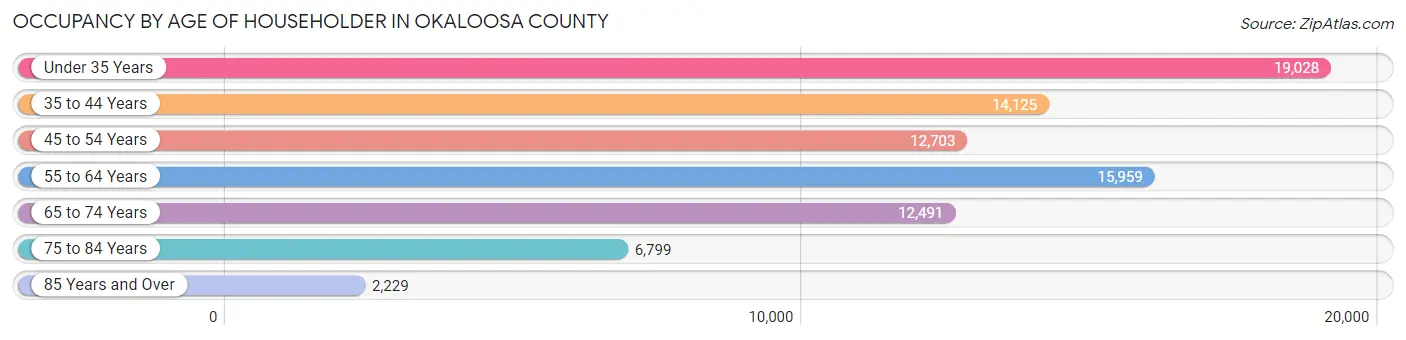
| Age Bracket | # Households | % Households |
| Under 35 Years | 19,028 | 22.8% |
| 35 to 44 Years | 14,125 | 17.0% |
| 45 to 54 Years | 12,703 | 15.2% |
| 55 to 64 Years | 15,959 | 19.2% |
| 65 to 74 Years | 12,491 | 15.0% |
| 75 to 84 Years | 6,799 | 8.2% |
| 85 Years and Over | 2,229 | 2.7% |
| Total | 83,334 | 100.0% |
Housing Finances in Okaloosa County
Median Income by Occupancy in Okaloosa County
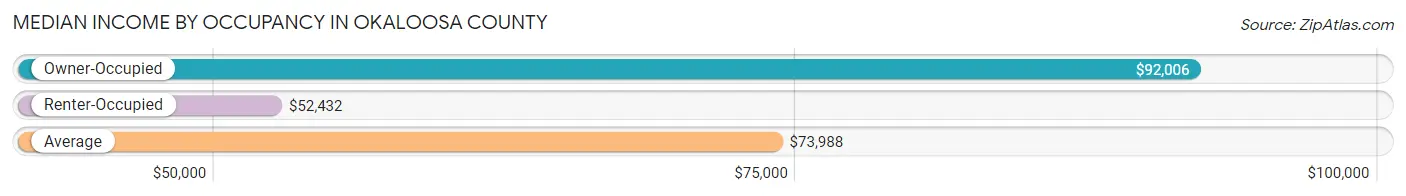
| Occupancy Type | # Households | Median Income |
| Owner-Occupied | 56,031 (67.2%) | $92,006 |
| Renter-Occupied | 27,303 (32.8%) | $52,432 |
| Average | 83,334 (100.0%) | $73,988 |
Occupancy by Householder Income Bracket in Okaloosa County
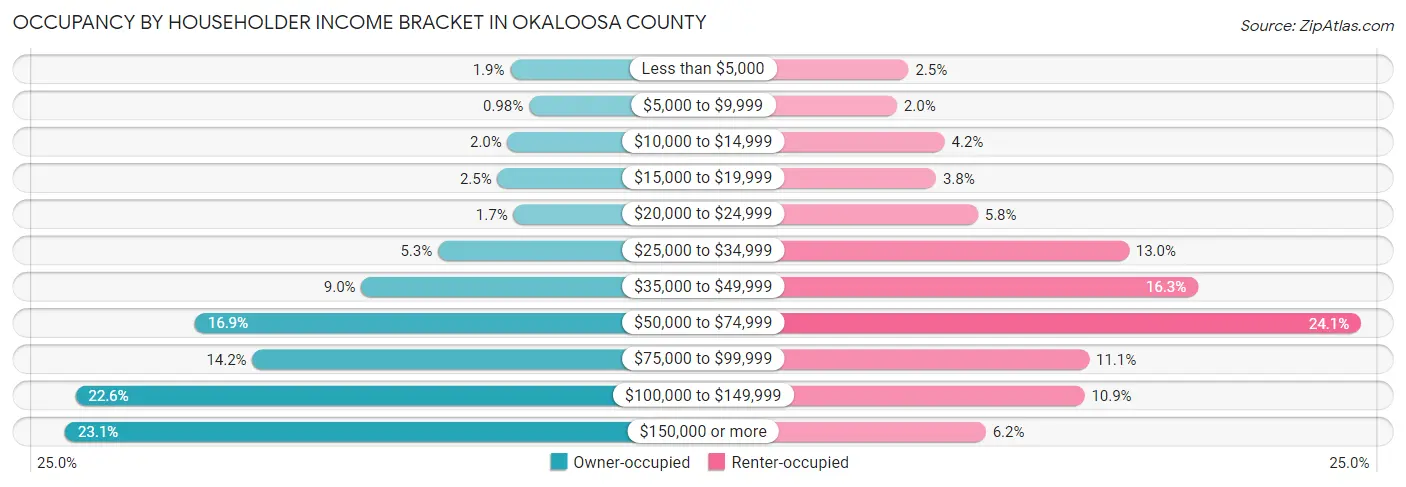
| Income Bracket | Owner-occupied | Renter-occupied |
| Less than $5,000 | 1,049 (1.9%) | 689 (2.5%) |
| $5,000 to $9,999 | 547 (1.0%) | 539 (2.0%) |
| $10,000 to $14,999 | 1,119 (2.0%) | 1,157 (4.2%) |
| $15,000 to $19,999 | 1,387 (2.5%) | 1,047 (3.8%) |
| $20,000 to $24,999 | 963 (1.7%) | 1,588 (5.8%) |
| $25,000 to $34,999 | 2,976 (5.3%) | 3,551 (13.0%) |
| $35,000 to $49,999 | 5,019 (9.0%) | 4,453 (16.3%) |
| $50,000 to $74,999 | 9,463 (16.9%) | 6,573 (24.1%) |
| $75,000 to $99,999 | 7,926 (14.1%) | 3,036 (11.1%) |
| $100,000 to $149,999 | 12,650 (22.6%) | 2,976 (10.9%) |
| $150,000 or more | 12,932 (23.1%) | 1,694 (6.2%) |
| Total | 56,031 (100.0%) | 27,303 (100.0%) |
Monthly Housing Cost Tiers in Okaloosa County
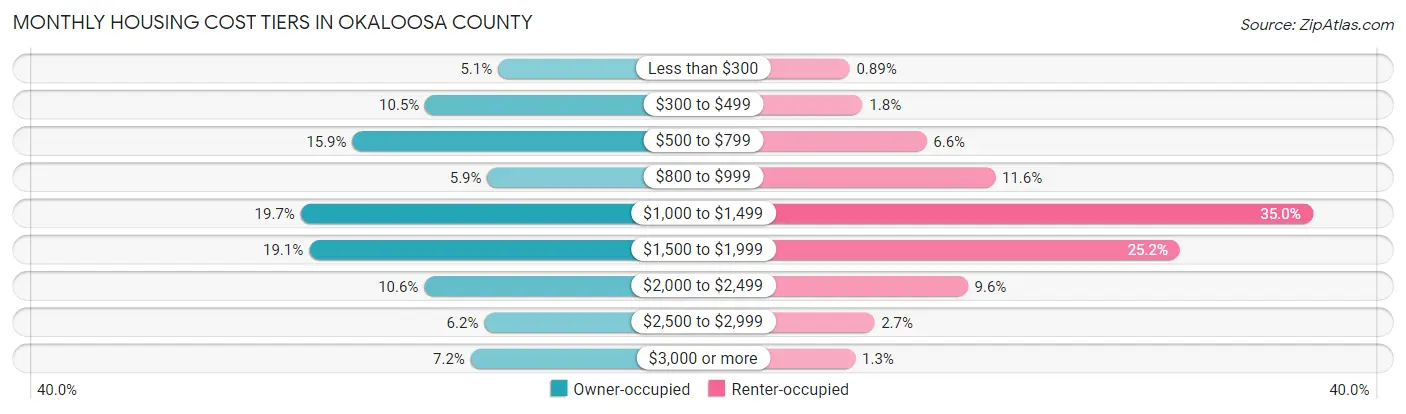
| Monthly Cost | Owner-occupied | Renter-occupied |
| Less than $300 | 2,873 (5.1%) | 243 (0.9%) |
| $300 to $499 | 5,883 (10.5%) | 502 (1.8%) |
| $500 to $799 | 8,888 (15.9%) | 1,789 (6.6%) |
| $800 to $999 | 3,315 (5.9%) | 3,169 (11.6%) |
| $1,000 to $1,499 | 11,021 (19.7%) | 9,553 (35.0%) |
| $1,500 to $1,999 | 10,672 (19.1%) | 6,884 (25.2%) |
| $2,000 to $2,499 | 5,923 (10.6%) | 2,618 (9.6%) |
| $2,500 to $2,999 | 3,447 (6.1%) | 740 (2.7%) |
| $3,000 or more | 4,009 (7.1%) | 354 (1.3%) |
| Total | 56,031 (100.0%) | 27,303 (100.0%) |
Physical Housing Characteristics in Okaloosa County
Housing Structures in Okaloosa County
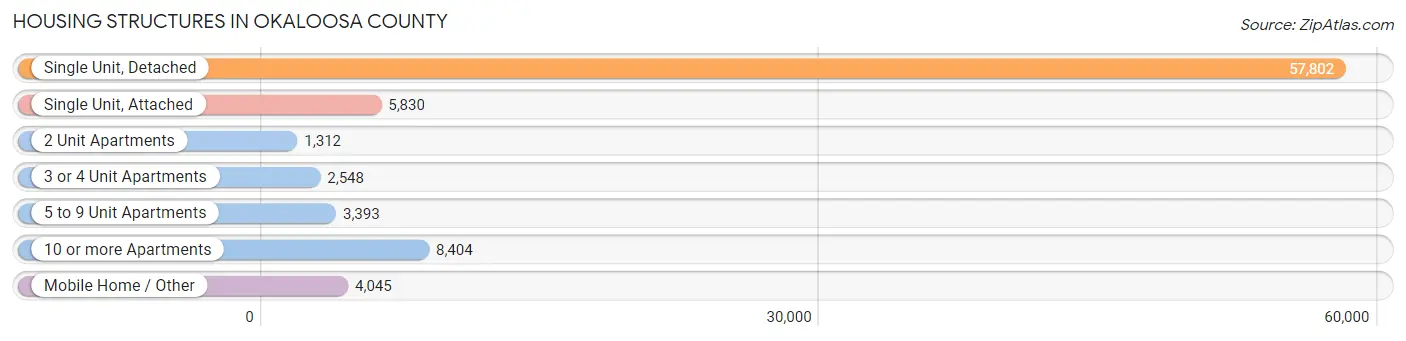
| Structure Type | # Housing Units | % Housing Units |
| Single Unit, Detached | 57,802 | 69.4% |
| Single Unit, Attached | 5,830 | 7.0% |
| 2 Unit Apartments | 1,312 | 1.6% |
| 3 or 4 Unit Apartments | 2,548 | 3.1% |
| 5 to 9 Unit Apartments | 3,393 | 4.1% |
| 10 or more Apartments | 8,404 | 10.1% |
| Mobile Home / Other | 4,045 | 4.9% |
| Total | 83,334 | 100.0% |
Housing Structures by Occupancy in Okaloosa County
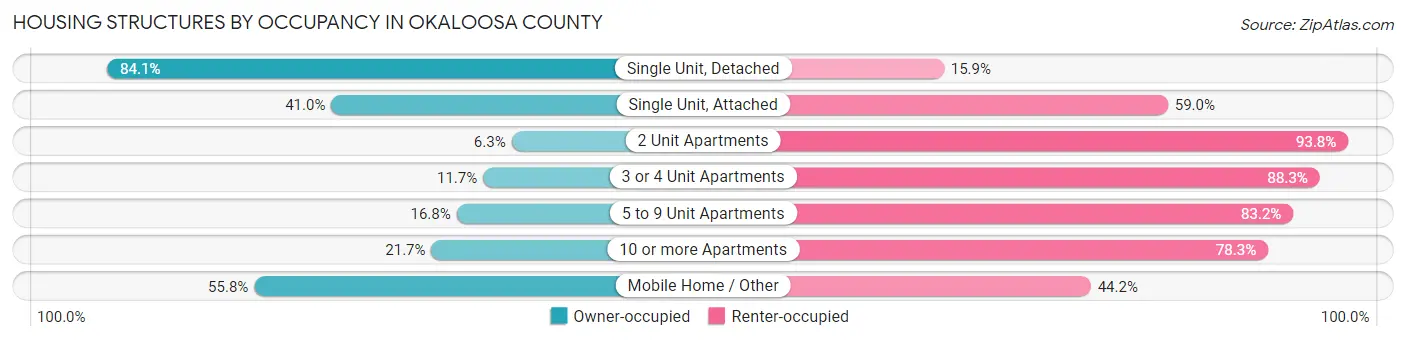
| Structure Type | Owner-occupied | Renter-occupied |
| Single Unit, Detached | 48,612 (84.1%) | 9,190 (15.9%) |
| Single Unit, Attached | 2,388 (41.0%) | 3,442 (59.0%) |
| 2 Unit Apartments | 82 (6.2%) | 1,230 (93.8%) |
| 3 or 4 Unit Apartments | 299 (11.7%) | 2,249 (88.3%) |
| 5 to 9 Unit Apartments | 571 (16.8%) | 2,822 (83.2%) |
| 10 or more Apartments | 1,822 (21.7%) | 6,582 (78.3%) |
| Mobile Home / Other | 2,257 (55.8%) | 1,788 (44.2%) |
| Total | 56,031 (67.2%) | 27,303 (32.8%) |
Housing Structures by Number of Rooms in Okaloosa County
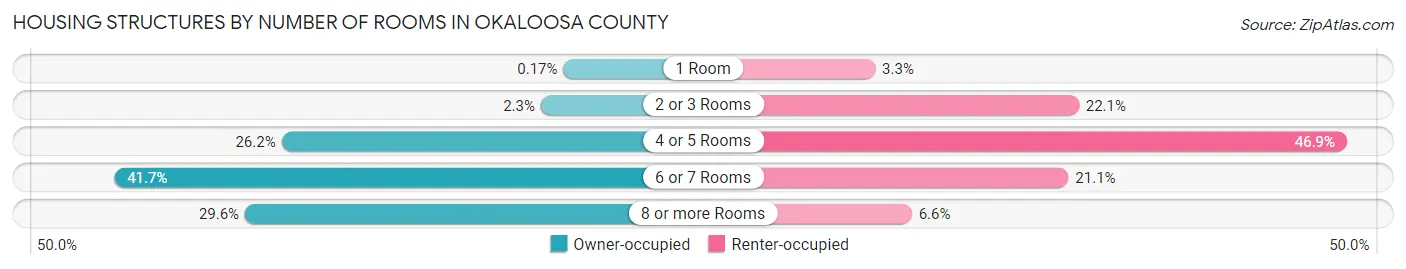
| Number of Rooms | Owner-occupied | Renter-occupied |
| 1 Room | 95 (0.2%) | 889 (3.3%) |
| 2 or 3 Rooms | 1,265 (2.3%) | 6,030 (22.1%) |
| 4 or 5 Rooms | 14,704 (26.2%) | 12,800 (46.9%) |
| 6 or 7 Rooms | 23,370 (41.7%) | 5,770 (21.1%) |
| 8 or more Rooms | 16,597 (29.6%) | 1,814 (6.6%) |
| Total | 56,031 (100.0%) | 27,303 (100.0%) |
Housing Structure by Heating Type in Okaloosa County
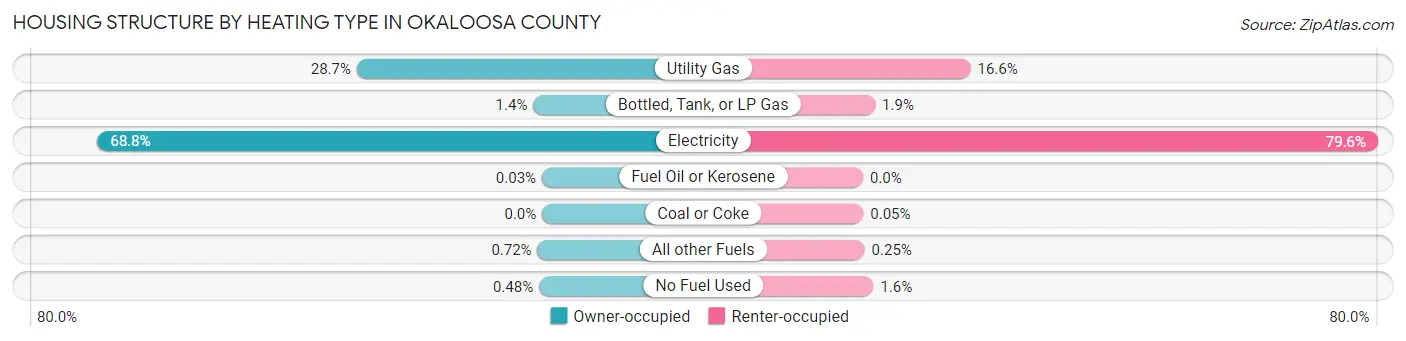
| Heating Type | Owner-occupied | Renter-occupied |
| Utility Gas | 16,053 (28.6%) | 4,539 (16.6%) |
| Bottled, Tank, or LP Gas | 765 (1.4%) | 510 (1.9%) |
| Electricity | 38,523 (68.8%) | 21,729 (79.6%) |
| Fuel Oil or Kerosene | 19 (0.0%) | 0 (0.0%) |
| Coal or Coke | 0 (0.0%) | 14 (0.1%) |
| All other Fuels | 403 (0.7%) | 68 (0.3%) |
| No Fuel Used | 268 (0.5%) | 443 (1.6%) |
| Total | 56,031 (100.0%) | 27,303 (100.0%) |
Household Vehicle Usage in Okaloosa County
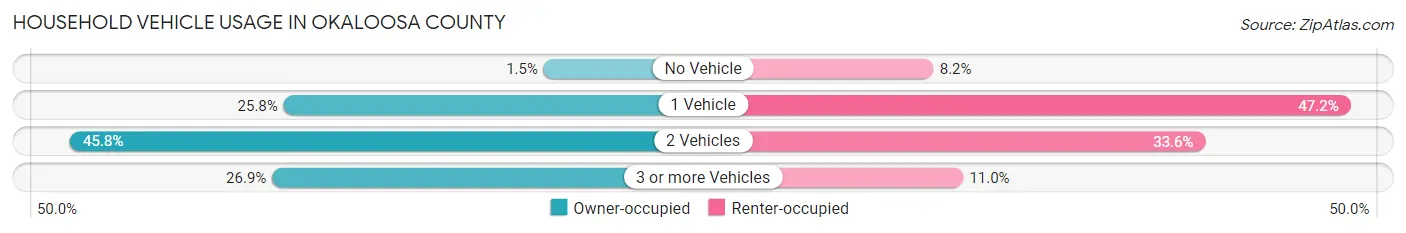
| Vehicles per Household | Owner-occupied | Renter-occupied |
| No Vehicle | 859 (1.5%) | 2,238 (8.2%) |
| 1 Vehicle | 14,470 (25.8%) | 12,885 (47.2%) |
| 2 Vehicles | 25,637 (45.8%) | 9,185 (33.6%) |
| 3 or more Vehicles | 15,065 (26.9%) | 2,995 (11.0%) |
| Total | 56,031 (100.0%) | 27,303 (100.0%) |
Real Estate & Mortgages in Okaloosa County
Real Estate and Mortgage Overview in Okaloosa County
| Characteristic | Without Mortgage | With Mortgage |
| Housing Units | 20,737 | 35,294 |
| Median Property Value | $281,300 | $301,600 |
| Median Household Income | $72,158 | $8,944 |
| Monthly Housing Costs | $561 | $3,789 |
| Real Estate Taxes | $1,624 | $1,673 |
Property Value by Mortgage Status in Okaloosa County
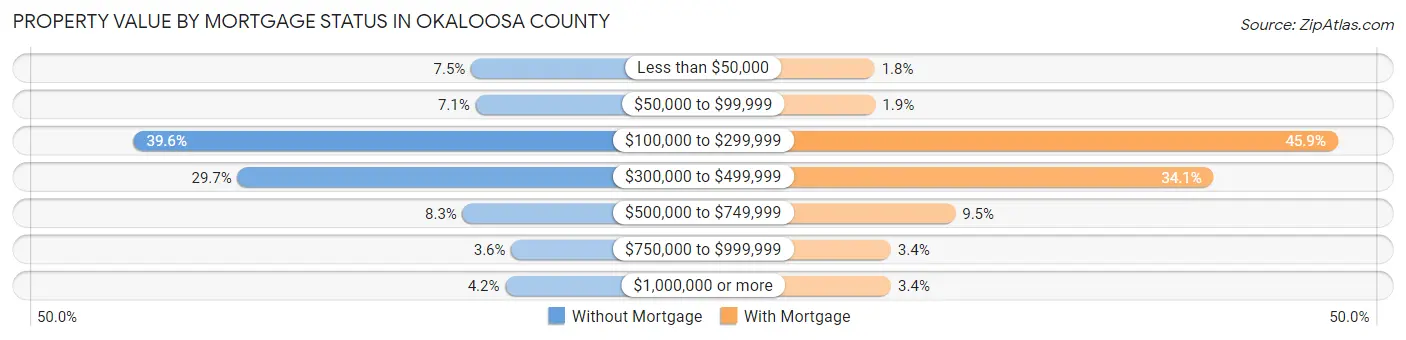
| Property Value | Without Mortgage | With Mortgage |
| Less than $50,000 | 1,550 (7.5%) | 645 (1.8%) |
| $50,000 to $99,999 | 1,462 (7.0%) | 666 (1.9%) |
| $100,000 to $299,999 | 8,217 (39.6%) | 16,207 (45.9%) |
| $300,000 to $499,999 | 6,163 (29.7%) | 12,036 (34.1%) |
| $500,000 to $749,999 | 1,716 (8.3%) | 3,353 (9.5%) |
| $750,000 to $999,999 | 754 (3.6%) | 1,190 (3.4%) |
| $1,000,000 or more | 875 (4.2%) | 1,197 (3.4%) |
| Total | 20,737 (100.0%) | 35,294 (100.0%) |
Household Income by Mortgage Status in Okaloosa County
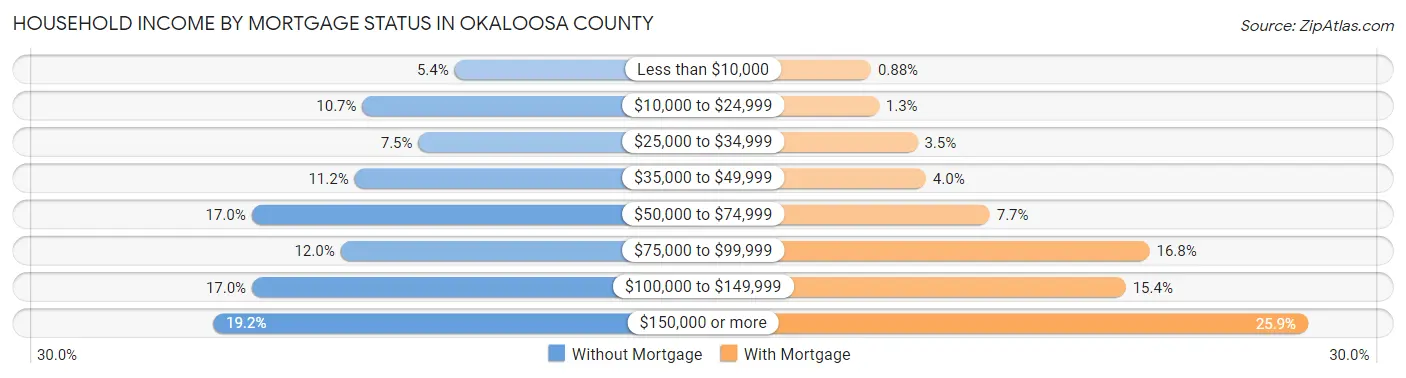
| Household Income | Without Mortgage | With Mortgage |
| Less than $10,000 | 1,125 (5.4%) | 311 (0.9%) |
| $10,000 to $24,999 | 2,218 (10.7%) | 471 (1.3%) |
| $25,000 to $34,999 | 1,556 (7.5%) | 1,251 (3.5%) |
| $35,000 to $49,999 | 2,312 (11.2%) | 1,420 (4.0%) |
| $50,000 to $74,999 | 3,532 (17.0%) | 2,707 (7.7%) |
| $75,000 to $99,999 | 2,478 (11.9%) | 5,931 (16.8%) |
| $100,000 to $149,999 | 3,528 (17.0%) | 5,448 (15.4%) |
| $150,000 or more | 3,988 (19.2%) | 9,122 (25.9%) |
| Total | 20,737 (100.0%) | 35,294 (100.0%) |
Property Value to Household Income Ratio in Okaloosa County
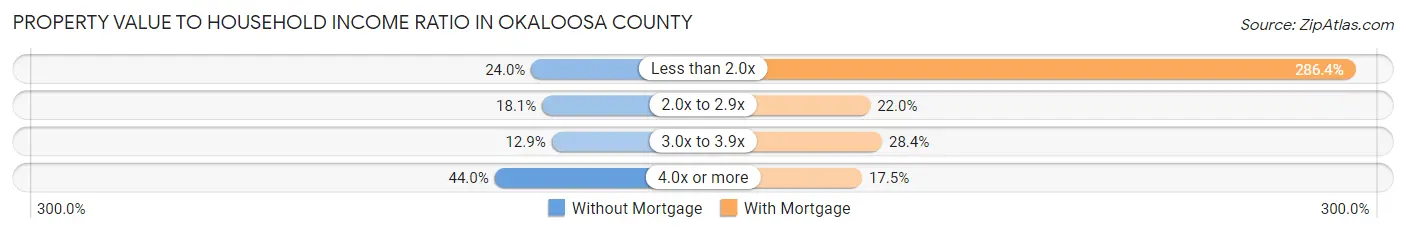
| Value-to-Income Ratio | Without Mortgage | With Mortgage |
| Less than 2.0x | 4,973 (24.0%) | 101,083 (286.4%) |
| 2.0x to 2.9x | 3,744 (18.0%) | 7,755 (22.0%) |
| 3.0x to 3.9x | 2,679 (12.9%) | 10,025 (28.4%) |
| 4.0x or more | 9,121 (44.0%) | 6,173 (17.5%) |
| Total | 20,737 (100.0%) | 35,294 (100.0%) |
Real Estate Taxes by Mortgage Status in Okaloosa County
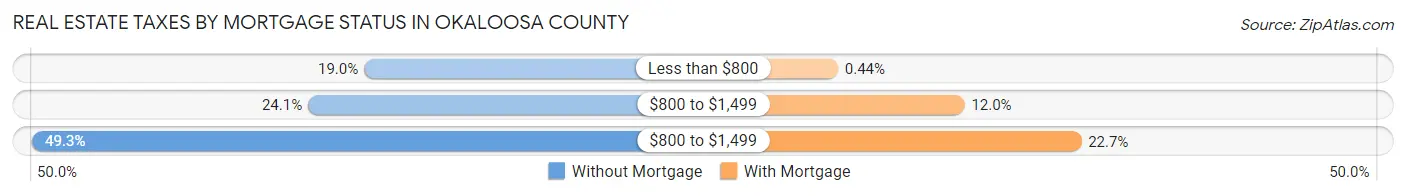
| Property Taxes | Without Mortgage | With Mortgage |
| Less than $800 | 3,940 (19.0%) | 155 (0.4%) |
| $800 to $1,499 | 5,002 (24.1%) | 4,234 (12.0%) |
| $800 to $1,499 | 10,227 (49.3%) | 7,998 (22.7%) |
| Total | 20,737 (100.0%) | 35,294 (100.0%) |
Health & Disability in Okaloosa County
Health Insurance Coverage by Age in Okaloosa County
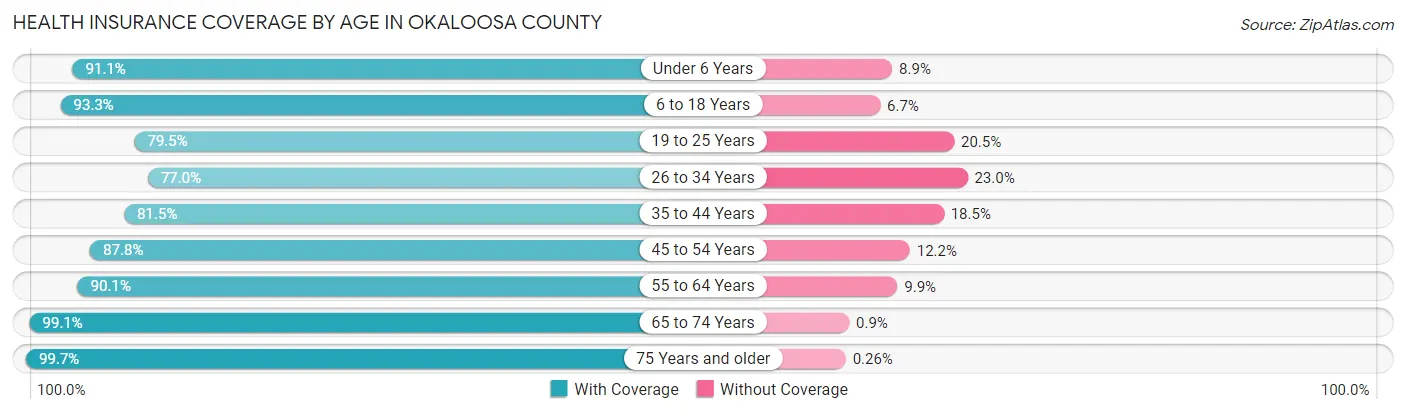
| Age Bracket | With Coverage | Without Coverage |
| Under 6 Years | 14,916 (91.1%) | 1,462 (8.9%) |
| 6 to 18 Years | 30,687 (93.3%) | 2,197 (6.7%) |
| 19 to 25 Years | 12,131 (79.5%) | 3,120 (20.5%) |
| 26 to 34 Years | 18,315 (77.0%) | 5,460 (23.0%) |
| 35 to 44 Years | 19,978 (81.5%) | 4,547 (18.5%) |
| 45 to 54 Years | 19,679 (87.8%) | 2,737 (12.2%) |
| 55 to 64 Years | 25,215 (90.1%) | 2,767 (9.9%) |
| 65 to 74 Years | 20,165 (99.1%) | 184 (0.9%) |
| 75 Years and older | 13,549 (99.7%) | 36 (0.3%) |
| Total | 174,635 (88.6%) | 22,510 (11.4%) |
Health Insurance Coverage by Citizenship Status in Okaloosa County
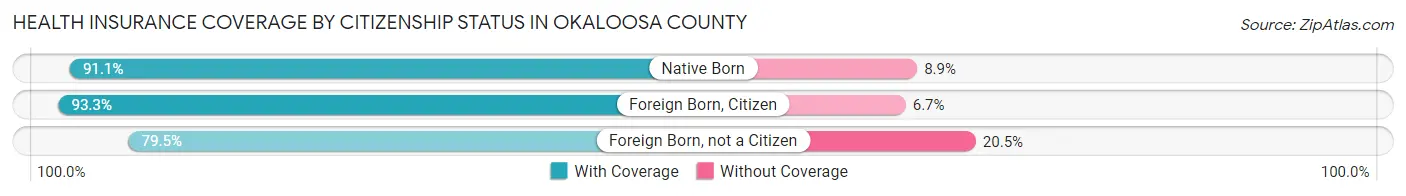
| Citizenship Status | With Coverage | Without Coverage |
| Native Born | 14,916 (91.1%) | 1,462 (8.9%) |
| Foreign Born, Citizen | 30,687 (93.3%) | 2,197 (6.7%) |
| Foreign Born, not a Citizen | 12,131 (79.5%) | 3,120 (20.5%) |
Health Insurance Coverage by Household Income in Okaloosa County
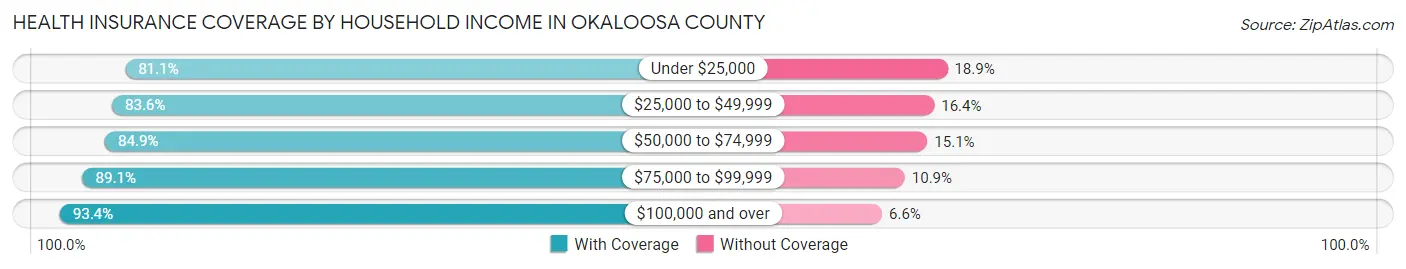
| Household Income | With Coverage | Without Coverage |
| Under $25,000 | 13,889 (81.1%) | 3,228 (18.9%) |
| $25,000 to $49,999 | 26,169 (83.6%) | 5,132 (16.4%) |
| $50,000 to $74,999 | 31,069 (84.9%) | 5,525 (15.1%) |
| $75,000 to $99,999 | 24,528 (89.1%) | 2,994 (10.9%) |
| $100,000 and over | 78,516 (93.4%) | 5,554 (6.6%) |
Public vs Private Health Insurance Coverage by Age in Okaloosa County
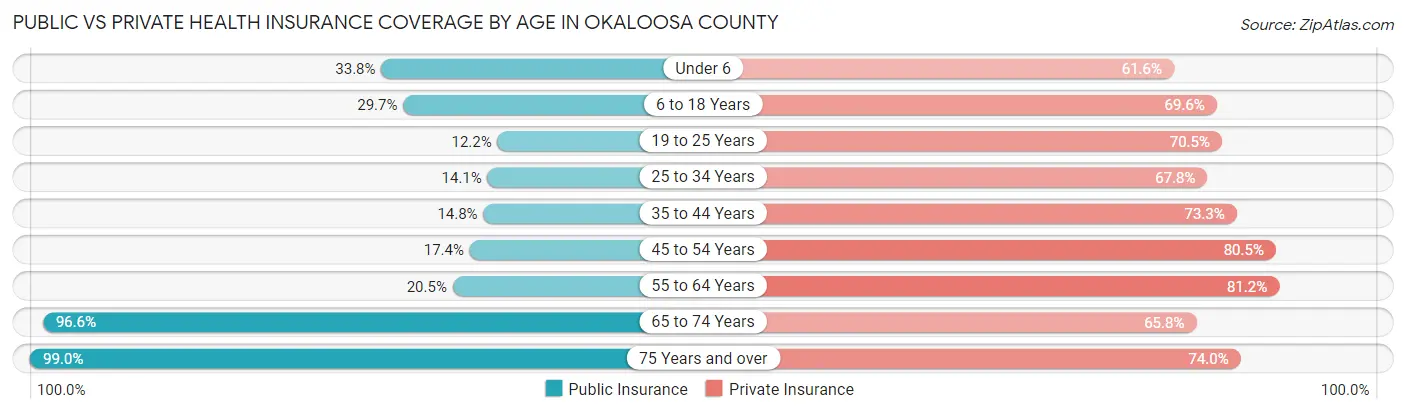
| Age Bracket | Public Insurance | Private Insurance |
| Under 6 | 5,532 (33.8%) | 10,092 (61.6%) |
| 6 to 18 Years | 9,771 (29.7%) | 22,879 (69.6%) |
| 19 to 25 Years | 1,863 (12.2%) | 10,756 (70.5%) |
| 25 to 34 Years | 3,342 (14.1%) | 16,130 (67.8%) |
| 35 to 44 Years | 3,636 (14.8%) | 17,973 (73.3%) |
| 45 to 54 Years | 3,894 (17.4%) | 18,053 (80.5%) |
| 55 to 64 Years | 5,744 (20.5%) | 22,707 (81.1%) |
| 65 to 74 Years | 19,663 (96.6%) | 13,386 (65.8%) |
| 75 Years and over | 13,447 (99.0%) | 10,054 (74.0%) |
| Total | 66,892 (33.9%) | 142,030 (72.0%) |
Disability Status by Sex by Age in Okaloosa County
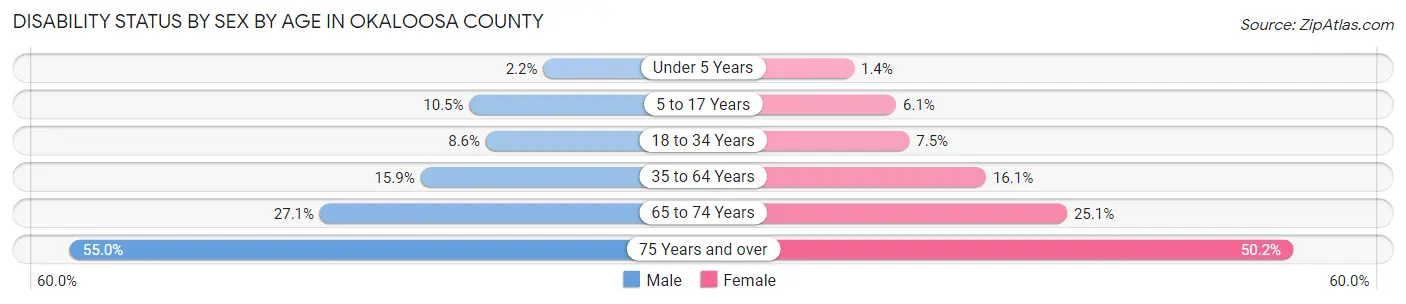
| Age Bracket | Male | Female |
| Under 5 Years | 151 (2.2%) | 89 (1.4%) |
| 5 to 17 Years | 1,806 (10.5%) | 1,010 (6.0%) |
| 18 to 34 Years | 1,645 (8.6%) | 1,653 (7.5%) |
| 35 to 64 Years | 5,838 (15.9%) | 6,142 (16.1%) |
| 65 to 74 Years | 2,688 (27.1%) | 2,618 (25.1%) |
| 75 Years and over | 3,180 (54.9%) | 3,918 (50.2%) |
Disability Class by Sex by Age in Okaloosa County
Disability Class: Hearing Difficulty
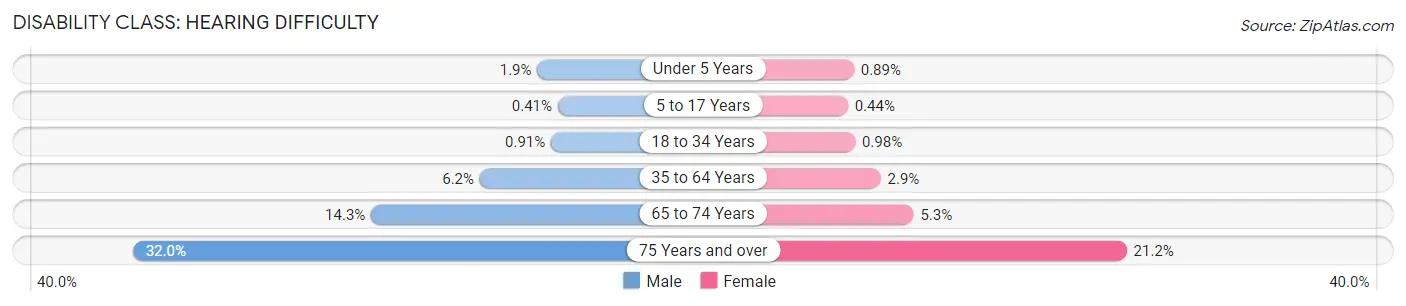
| Age Bracket | Male | Female |
| Under 5 Years | 131 (1.9%) | 58 (0.9%) |
| 5 to 17 Years | 71 (0.4%) | 73 (0.4%) |
| 18 to 34 Years | 174 (0.9%) | 216 (1.0%) |
| 35 to 64 Years | 2,274 (6.2%) | 1,101 (2.9%) |
| 65 to 74 Years | 1,414 (14.3%) | 555 (5.3%) |
| 75 Years and over | 1,850 (32.0%) | 1,649 (21.1%) |
Disability Class: Vision Difficulty
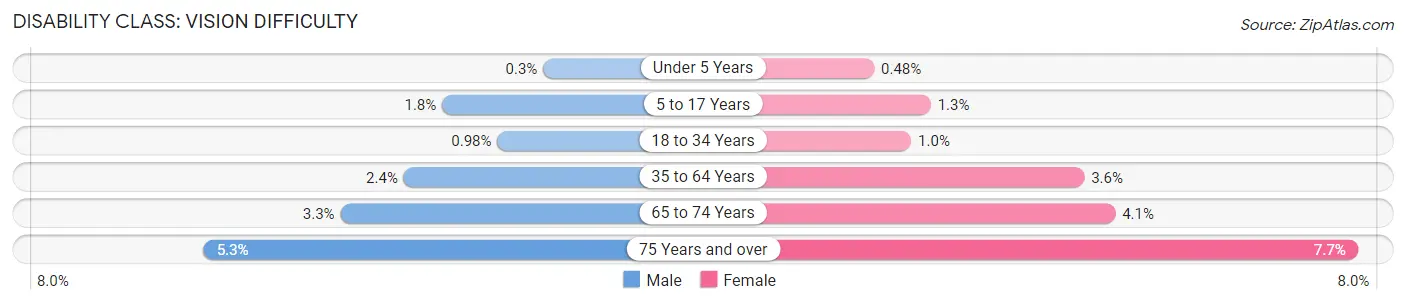
| Age Bracket | Male | Female |
| Under 5 Years | 20 (0.3%) | 31 (0.5%) |
| 5 to 17 Years | 310 (1.8%) | 220 (1.3%) |
| 18 to 34 Years | 187 (1.0%) | 227 (1.0%) |
| 35 to 64 Years | 871 (2.4%) | 1,375 (3.6%) |
| 65 to 74 Years | 328 (3.3%) | 424 (4.1%) |
| 75 Years and over | 309 (5.3%) | 597 (7.7%) |
Disability Class: Cognitive Difficulty
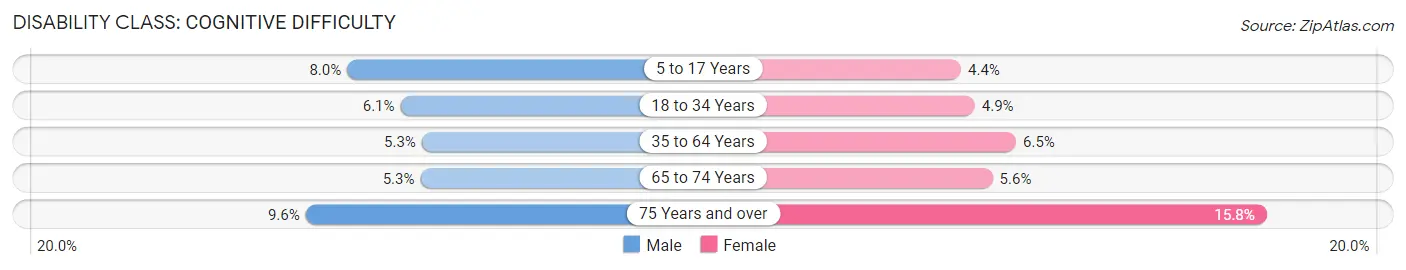
| Age Bracket | Male | Female |
| 5 to 17 Years | 1,384 (8.0%) | 739 (4.4%) |
| 18 to 34 Years | 1,154 (6.0%) | 1,086 (4.9%) |
| 35 to 64 Years | 1,931 (5.3%) | 2,472 (6.5%) |
| 65 to 74 Years | 526 (5.3%) | 585 (5.6%) |
| 75 Years and over | 554 (9.6%) | 1,230 (15.8%) |
Disability Class: Ambulatory Difficulty
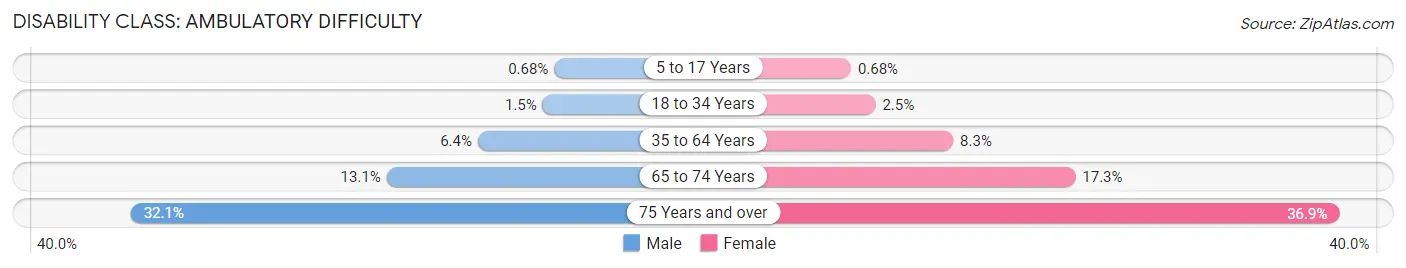
| Age Bracket | Male | Female |
| 5 to 17 Years | 118 (0.7%) | 113 (0.7%) |
| 18 to 34 Years | 293 (1.5%) | 549 (2.5%) |
| 35 to 64 Years | 2,331 (6.4%) | 3,161 (8.3%) |
| 65 to 74 Years | 1,300 (13.1%) | 1,810 (17.3%) |
| 75 Years and over | 1,859 (32.1%) | 2,880 (36.9%) |
Disability Class: Self-Care Difficulty
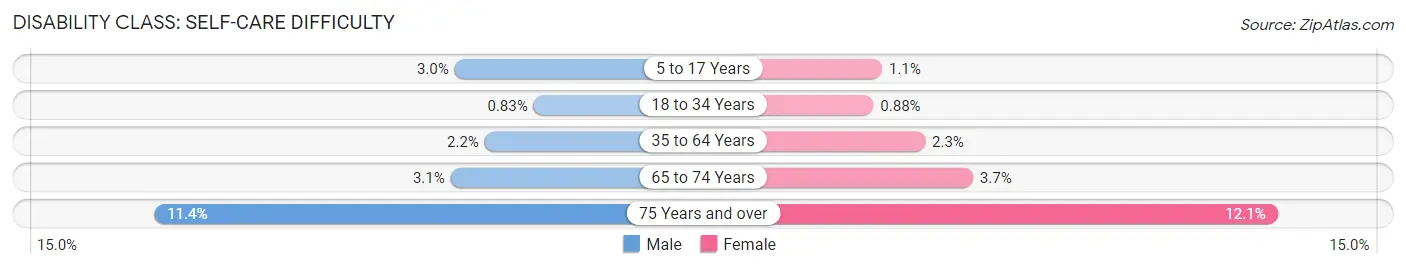
| Age Bracket | Male | Female |
| 5 to 17 Years | 523 (3.0%) | 187 (1.1%) |
| 18 to 34 Years | 158 (0.8%) | 193 (0.9%) |
| 35 to 64 Years | 804 (2.2%) | 887 (2.3%) |
| 65 to 74 Years | 311 (3.1%) | 381 (3.6%) |
| 75 Years and over | 659 (11.4%) | 946 (12.1%) |
Technology Access in Okaloosa County
Computing Device Access in Okaloosa County
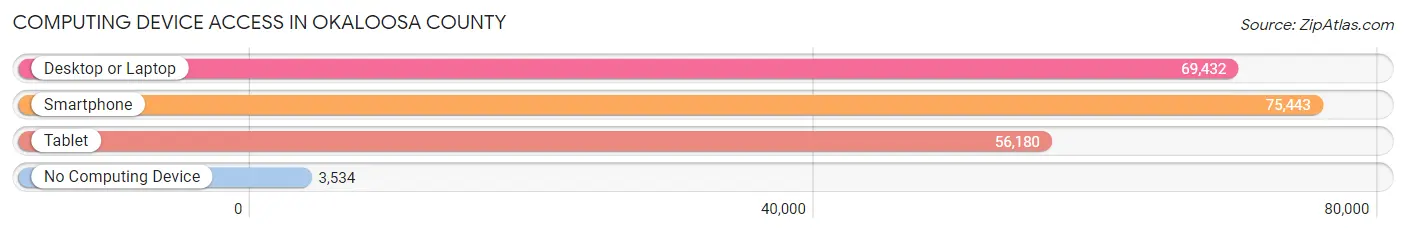
| Device Type | # Households | % Households |
| Desktop or Laptop | 69,432 | 83.3% |
| Smartphone | 75,443 | 90.5% |
| Tablet | 56,180 | 67.4% |
| No Computing Device | 3,534 | 4.2% |
| Total | 83,334 | 100.0% |
Internet Access in Okaloosa County
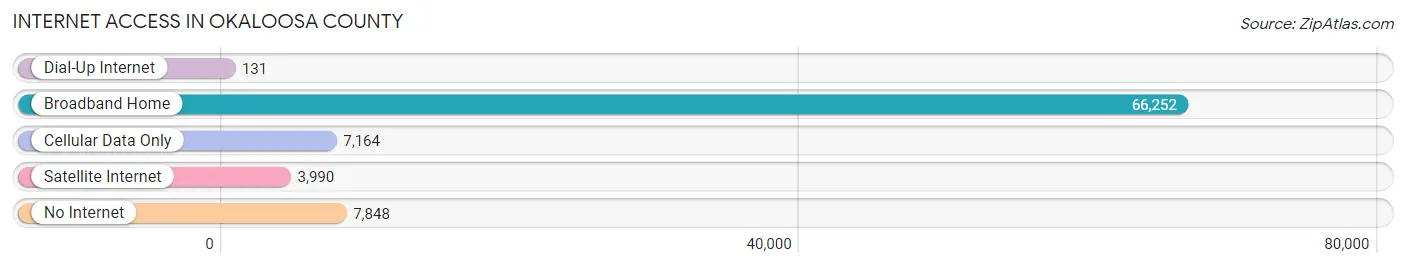
| Internet Type | # Households | % Households |
| Dial-Up Internet | 131 | 0.2% |
| Broadband Home | 66,252 | 79.5% |
| Cellular Data Only | 7,164 | 8.6% |
| Satellite Internet | 3,990 | 4.8% |
| No Internet | 7,848 | 9.4% |
| Total | 83,334 | 100.0% |
Okaloosa County Summary
Okaloosa County is located in the northwest corner of Florida, along the Gulf of Mexico. It is bordered by Walton County to the east, Santa Rosa County to the west, and Escambia County to the south. The county seat is Crestview, and the largest city is Fort Walton Beach. The county was created in 1915 from parts of Santa Rosa and Walton counties.
Geography
Okaloosa County covers an area of 576 square miles, of which 545 square miles is land and 31 square miles is water. The county is located in the Florida Panhandle, and is part of the Emerald Coast region. The county is mostly flat, with some rolling hills in the northern part. The highest point in the county is the summit of Eglin Air Force Base, which is located in the northern part of the county and is the highest point in the state of Florida. The county is home to several rivers, including the Shoal River, Yellow River, and Blackwater River.
The climate of Okaloosa County is humid subtropical, with hot, humid summers and mild winters. The average annual temperature is 72°F, and the average annual precipitation is 62 inches.
Economy
Okaloosa County has a diverse economy, with a mix of manufacturing, tourism, and military industries. The county is home to Eglin Air Force Base, which is the largest employer in the county. Other major employers include the Okaloosa County School District, the Okaloosa County government, and the tourism industry.
The county is home to several manufacturing companies, including Gulf Power, Gulfstream Aerospace, and Raytheon. The tourism industry is a major contributor to the economy, with the county being home to several popular beaches, such as Destin, Fort Walton Beach, and Okaloosa Island.
Demographics
As of the 2010 census, there were 180,822 people, 68,890 households, and 48,845 families living in Okaloosa County. The population density was 327.3 people per square mile. The racial makeup of the county was 79.2% White, 11.3% African American, 0.7% Native American, 2.3% Asian, 0.1% Pacific Islander, 4.2% from other races, and 2.2% from two or more races. Hispanic or Latino of any race were 8.7% of the population.
The median income for a household in the county was $45,890, and the median income for a family was $54,890. The per capita income for the county was $25,890. About 11.2% of families and 14.7% of the population were below the poverty line, including 19.2% of those under age 18 and 8.7% of those age 65 or over.
Conclusion
Okaloosa County is a diverse county located in the Florida Panhandle. It is home to Eglin Air Force Base, which is the largest employer in the county, as well as several manufacturing companies and a thriving tourism industry. The population of the county is diverse, with a mix of races and ethnicities. The median income for a household in the county is $45,890, and the per capita income is $25,890.
Common Questions
What is Per Capita Income in Okaloosa County?
Per Capita income in Okaloosa County is $40,002.
What is the Median Family Income in Okaloosa County?
Median Family Income in Okaloosa County is $91,891.
What is the Median Household income in Okaloosa County?
Median Household Income in Okaloosa County is $73,988.
What is Income or Wage Gap in Okaloosa County?
Income or Wage Gap in Okaloosa County is 33.5%.
Women in Okaloosa County earn 66.5 cents for every dollar earned by a man.
What is Family Income Deficit in Okaloosa County?
Family Income Deficit in Okaloosa County is $9,092.
Families that are below poverty line in Okaloosa County earn $9,092 less on average than the poverty threshold level.
What is Inequality or Gini Index in Okaloosa County?
Inequality or Gini Index in Okaloosa County is 0.44.
What is the Total Population of Okaloosa County?
Total Population of Okaloosa County is 212,021.
What is the Total Male Population of Okaloosa County?
Total Male Population of Okaloosa County is 107,993.
What is the Total Female Population of Okaloosa County?
Total Female Population of Okaloosa County is 104,028.
What is the Ratio of Males per 100 Females in Okaloosa County?
There are 103.81 Males per 100 Females in Okaloosa County.
What is the Ratio of Females per 100 Males in Okaloosa County?
There are 96.33 Females per 100 Males in Okaloosa County.
What is the Median Population Age in Okaloosa County?
Median Population Age in Okaloosa County is 37.1 Years.
What is the Average Family Size in Okaloosa County
Average Family Size in Okaloosa County is 3.0 People.
What is the Average Household Size in Okaloosa County
Average Household Size in Okaloosa County is 2.5 People.
How Large is the Labor Force in Okaloosa County?
There are 109,829 People in the Labor Forcein in Okaloosa County.
What is the Percentage of People in the Labor Force in Okaloosa County?
64.6% of People are in the Labor Force in Okaloosa County.
What is the Unemployment Rate in Okaloosa County?
Unemployment Rate in Okaloosa County is 3.3%.