Area Code 754 Map & Demographics
Area Code 754 Map
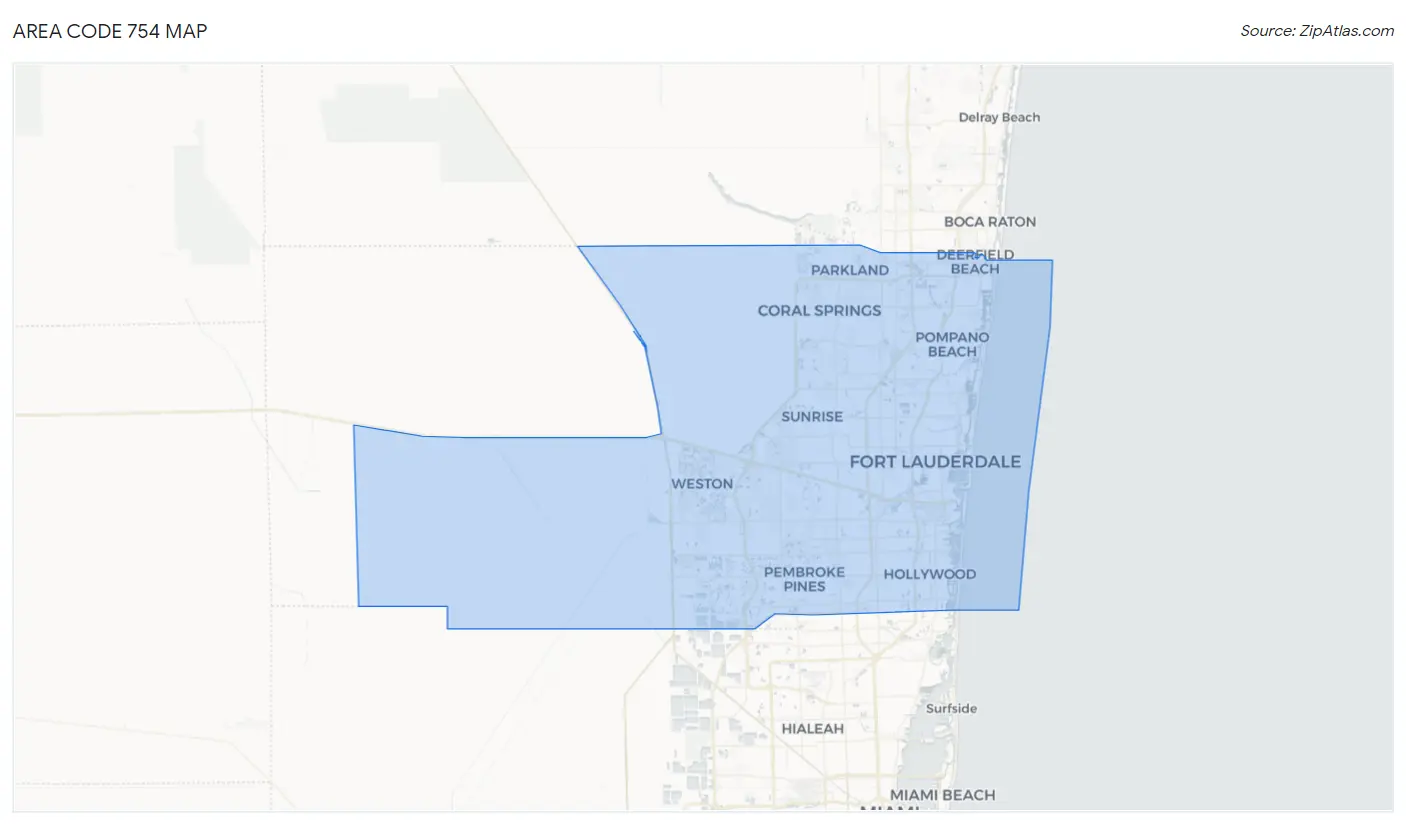
Area Code 754 Overview
$47,503
PER CAPITA INCOME
$99,768
AVG FAMILY INCOME
$84,167
AVG HOUSEHOLD INCOME
21.3%
WAGE / INCOME GAP [ % ]
78.7¢/ $1
WAGE / INCOME GAP [ $ ]
$9,994
FAMILY INCOME DEFICIT
10.20
INEQUALITY / GINI INDEX
765,992
TOTAL POPULATION
380,519
MALE POPULATION
385,473
FEMALE POPULATION
98.71
MALES / 100 FEMALES
101.30
FEMALES / 100 MALES
43.1
MEDIAN AGE
3.1
AVG FAMILY SIZE
2.5
AVG HOUSEHOLD SIZE
409,411
LABOR FORCE [ PEOPLE ]
65.2%
PERCENT IN LABOR FORCE
6.1%
UNEMPLOYMENT RATE
Income in Area Code 754
Income Overview in Area Code 754
Per Capita Income in Area Code 754 is $47,503, while median incomes of families and households are $99,768 and $84,167 respectively.
| Characteristic | Number | Measure |
| Per Capita Income | 765,992 | $47,503 |
| Median Family Income | 189,287 | $99,768 |
| Mean Family Income | 189,287 | $3,022,368 |
| Median Household Income | 301,167 | $84,167 |
| Mean Household Income | 301,167 | $2,532,114 |
| Income Deficit | 189,287 | $9,994 |
| Wage / Income Gap (%) | 765,992 | 21.31% |
| Wage / Income Gap ($) | 765,992 | 78.69¢ per $1 |
| Gini / Inequality Index | 765,992 | 10.20 |
Earnings by Sex in Area Code 754
Average Earnings in Area Code 754 are $45,474, $51,865 for men and $39,787 for women, a difference of 23.3%.
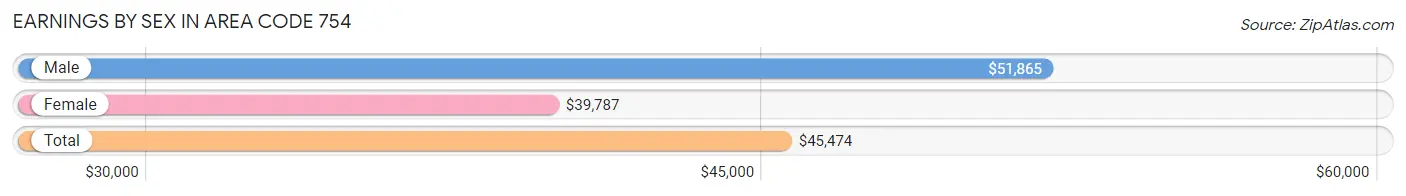
| Sex | Number | Average Earnings |
| Male | 225,555 (53.0%) | $51,865 |
| Female | 199,816 (47.0%) | $39,787 |
| Total | 425,371 (100.0%) | $45,474 |
Earnings by Sex by Income Bracket in Area Code 754
The most common earnings brackets in Area Code 754 are $100,000+ for men (43,894 | 19.5%) and $100,000+ for women (21,180 | 10.6%).
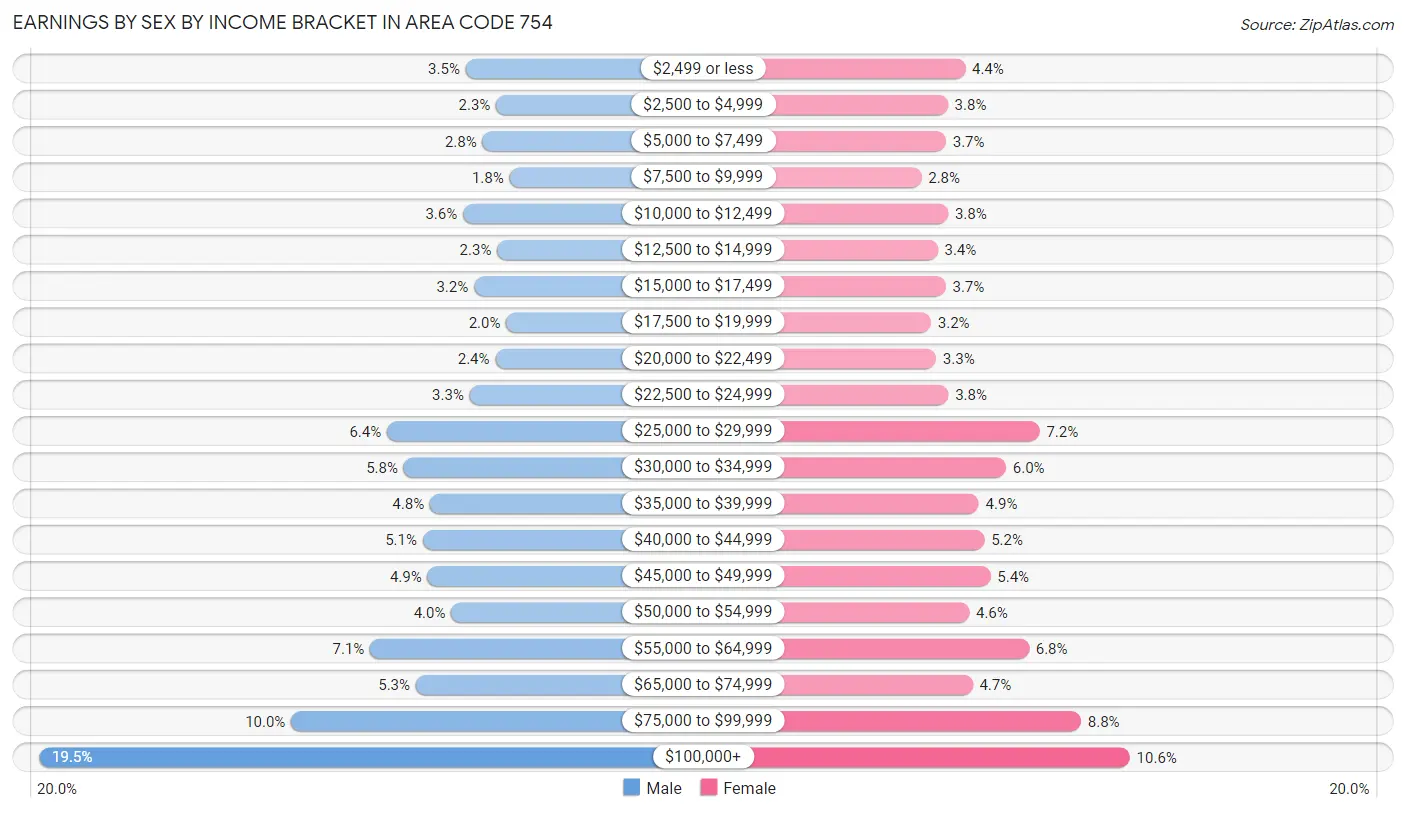
| Income | Male | Female |
| $2,499 or less | 7,834 (3.5%) | 8,848 (4.4%) |
| $2,500 to $4,999 | 5,266 (2.3%) | 7,557 (3.8%) |
| $5,000 to $7,499 | 6,416 (2.8%) | 7,415 (3.7%) |
| $7,500 to $9,999 | 4,135 (1.8%) | 5,572 (2.8%) |
| $10,000 to $12,499 | 8,057 (3.6%) | 7,566 (3.8%) |
| $12,500 to $14,999 | 5,160 (2.3%) | 6,803 (3.4%) |
| $15,000 to $17,499 | 7,118 (3.2%) | 7,392 (3.7%) |
| $17,500 to $19,999 | 4,392 (1.9%) | 6,299 (3.2%) |
| $20,000 to $22,499 | 5,313 (2.4%) | 6,671 (3.3%) |
| $22,500 to $24,999 | 7,494 (3.3%) | 7,596 (3.8%) |
| $25,000 to $29,999 | 14,474 (6.4%) | 14,420 (7.2%) |
| $30,000 to $34,999 | 13,050 (5.8%) | 11,908 (6.0%) |
| $35,000 to $39,999 | 10,852 (4.8%) | 9,863 (4.9%) |
| $40,000 to $44,999 | 11,464 (5.1%) | 10,285 (5.1%) |
| $45,000 to $49,999 | 11,055 (4.9%) | 10,744 (5.4%) |
| $50,000 to $54,999 | 9,049 (4.0%) | 9,142 (4.6%) |
| $55,000 to $64,999 | 15,901 (7.0%) | 13,624 (6.8%) |
| $65,000 to $74,999 | 12,045 (5.3%) | 9,408 (4.7%) |
| $75,000 to $99,999 | 22,586 (10.0%) | 17,523 (8.8%) |
| $100,000+ | 43,894 (19.5%) | 21,180 (10.6%) |
| Total | 225,555 (100.0%) | 199,816 (100.0%) |
Earnings by Sex by Educational Attainment in Area Code 754
Average earnings in Area Code 754 are $1,255,689 for men and $969,747 for women, a difference of 22.8%. Men with an educational attainment of graduate degree enjoy the highest average annual earnings of $1,902,838, while those with less than high school education earn the least with $652,519. Women with an educational attainment of graduate degree earn the most with the average annual earnings of $1,458,488, while those with less than high school education have the smallest earnings of $422,466.
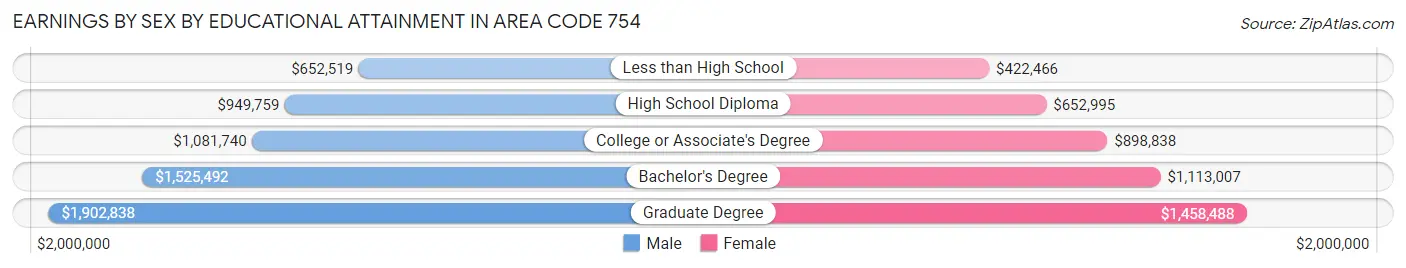
| Educational Attainment | Male Income | Female Income |
| Less than High School | $652,519 | $422,466 |
| High School Diploma | $949,759 | $652,995 |
| College or Associate's Degree | $1,081,740 | $898,838 |
| Bachelor's Degree | $1,525,492 | $1,113,007 |
| Graduate Degree | $1,902,838 | $1,458,488 |
| Total | $1,255,689 | $969,747 |
Family Income in Area Code 754
Family Income Brackets in Area Code 754
According to the Area Code 754 family income data, there are 772,480 families falling into the $100,000 to $149,999 income range, which is the most common income bracket and makes up 408.1% of all families. Conversely, the $10,000 to $14,999 income bracket is the least frequent group with only 64,925 families (34.3%) belonging to this category.
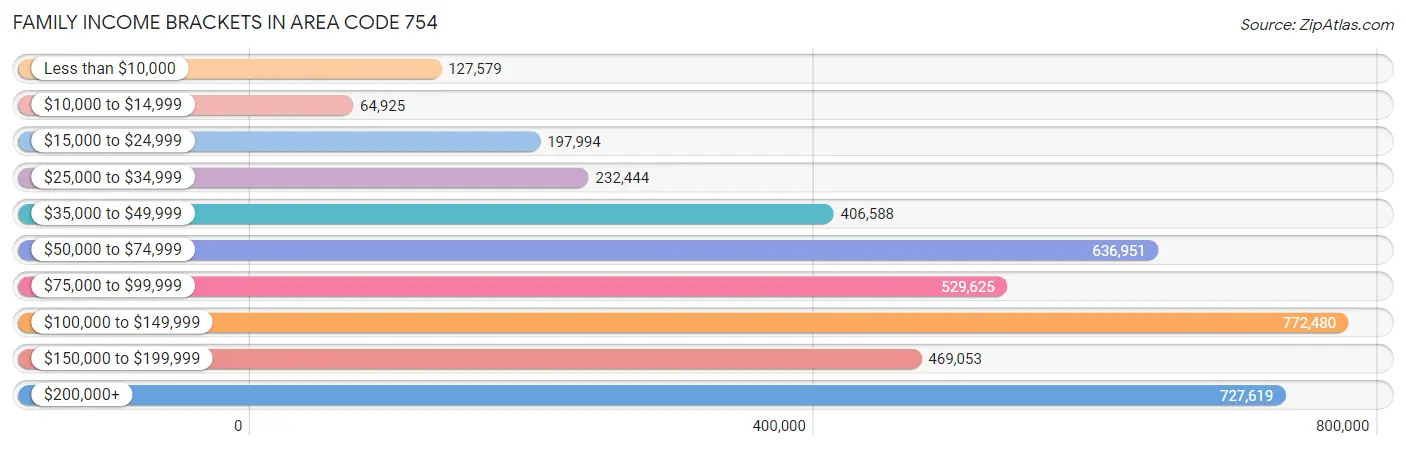
| Income Bracket | # Families | % Families |
| Less than $10,000 | 127,579 | 67.4% |
| $10,000 to $14,999 | 64,925 | 34.3% |
| $15,000 to $24,999 | 197,994 | 104.6% |
| $25,000 to $34,999 | 232,444 | 122.8% |
| $35,000 to $49,999 | 406,588 | 214.8% |
| $50,000 to $74,999 | 636,951 | 336.5% |
| $75,000 to $99,999 | 529,625 | 279.8% |
| $100,000 to $149,999 | 772,480 | 408.1% |
| $150,000 to $199,999 | 469,053 | 247.8% |
| $200,000+ | 727,619 | 384.4% |
Family Income by Famaliy Size in Area Code 754
7+ person families (2,043 | 1.1%) account for the highest median family income in Area Code 754 with $163,443 per family, while 2-person families (89,149 | 47.1%) have the highest median income of $44,519 per family member.
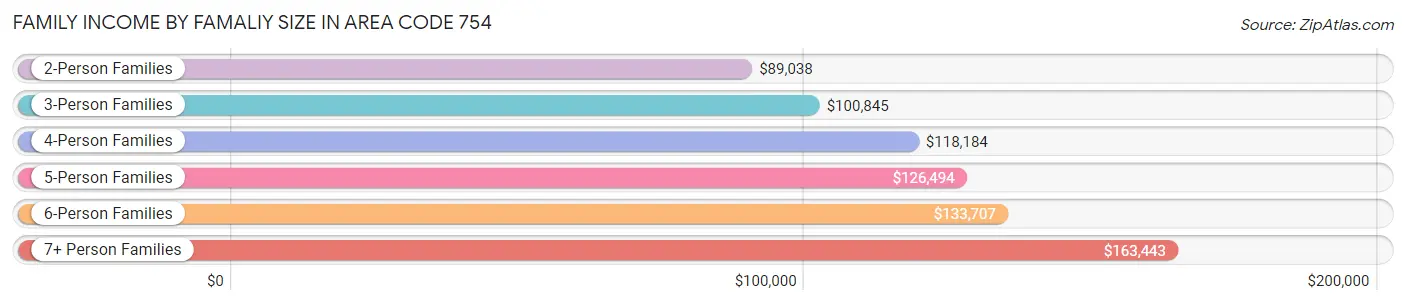
| Income Bracket | # Families | Median Income |
| 2-Person Families | 89,149 (47.1%) | $89,038 |
| 3-Person Families | 45,344 (24.0%) | $100,845 |
| 4-Person Families | 34,533 (18.2%) | $118,184 |
| 5-Person Families | 13,253 (7.0%) | $126,494 |
| 6-Person Families | 4,965 (2.6%) | $133,707 |
| 7+ Person Families | 2,043 (1.1%) | $163,443 |
| Total | 189,287 (100.0%) | $99,768 |
Family Income by Number of Earners in Area Code 754
The median family income in Area Code 754 is $99,768, with families comprising 3+ earners (24,278) having the highest median family income of $141,763, while families with no earners (24,087) have the lowest median family income of $55,337, accounting for 12.8% and 12.7% of families, respectively.
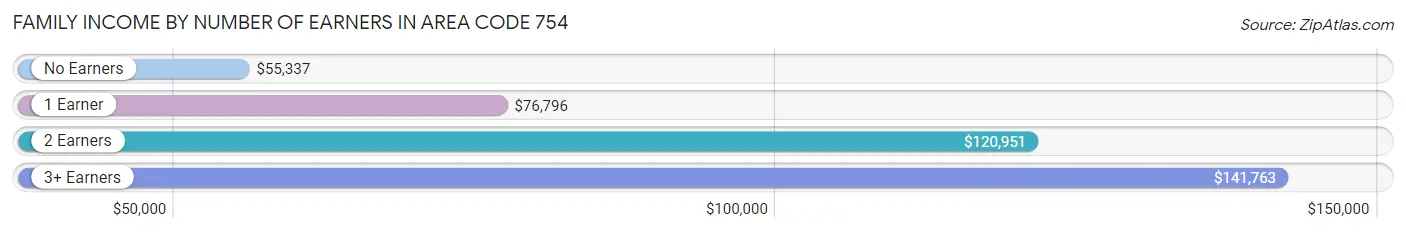
| Number of Earners | # Families | Median Income |
| No Earners | 24,087 (12.7%) | $55,337 |
| 1 Earner | 58,728 (31.0%) | $76,796 |
| 2 Earners | 82,194 (43.4%) | $120,951 |
| 3+ Earners | 24,278 (12.8%) | $141,763 |
| Total | 189,287 (100.0%) | $99,768 |
Household Income in Area Code 754
Household Income Brackets in Area Code 754
With 1,102,271 households falling in the category, the $100,000 to $149,999 income range is the most frequent in Area Code 754, accounting for 366.0% of all households. In contrast, only 206,902 households (68.7%) fall into the $10,000 to $14,999 income bracket, making it the least populous group.
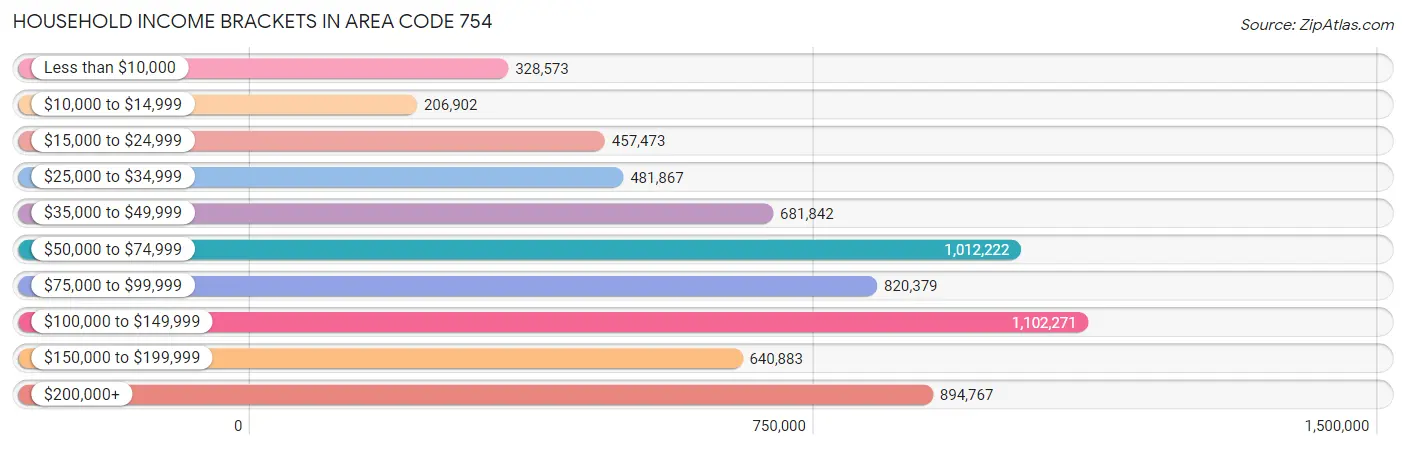
| Income Bracket | # Households | % Households |
| Less than $10,000 | 328,573 | 109.1% |
| $10,000 to $14,999 | 206,902 | 68.7% |
| $15,000 to $24,999 | 457,473 | 151.9% |
| $25,000 to $34,999 | 481,867 | 160.0% |
| $35,000 to $49,999 | 681,842 | 226.4% |
| $50,000 to $74,999 | 1,012,222 | 336.1% |
| $75,000 to $99,999 | 820,379 | 272.4% |
| $100,000 to $149,999 | 1,102,271 | 366.0% |
| $150,000 to $199,999 | 640,883 | 212.8% |
| $200,000+ | 894,767 | 297.1% |
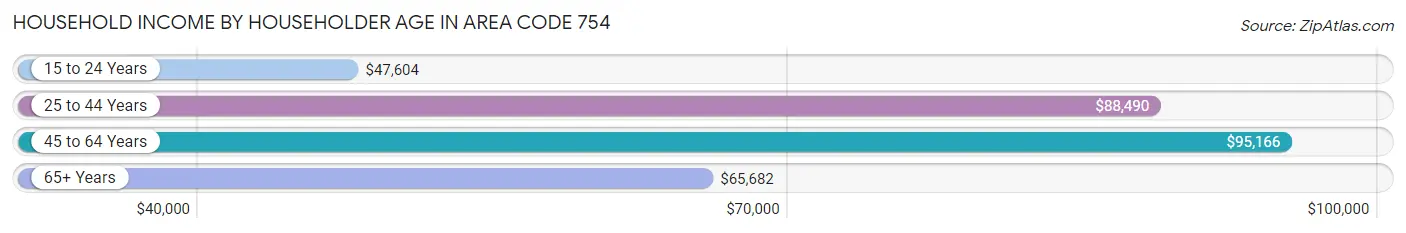
Household Income by Householder Age in Area Code 754
The median household income in Area Code 754 is $84,167, with the highest median household income of $95,166 found in the 45 to 64 years age bracket for the primary householder. A total of 121,396 households (40.3%) fall into this category. Meanwhile, the 15 to 24 years age bracket for the primary householder has the lowest median household income of $47,604, with 5,927 households (2.0%) in this group.
| Income Bracket | # Households | Median Income |
| 15 to 24 Years | 5,927 (2.0%) | $47,604 |
| 25 to 44 Years | 92,039 (30.6%) | $88,490 |
| 45 to 64 Years | 121,396 (40.3%) | $95,166 |
| 65+ Years | 81,805 (27.2%) | $65,682 |
| Total | 301,167 (100.0%) | $84,167 |
Poverty in Area Code 754
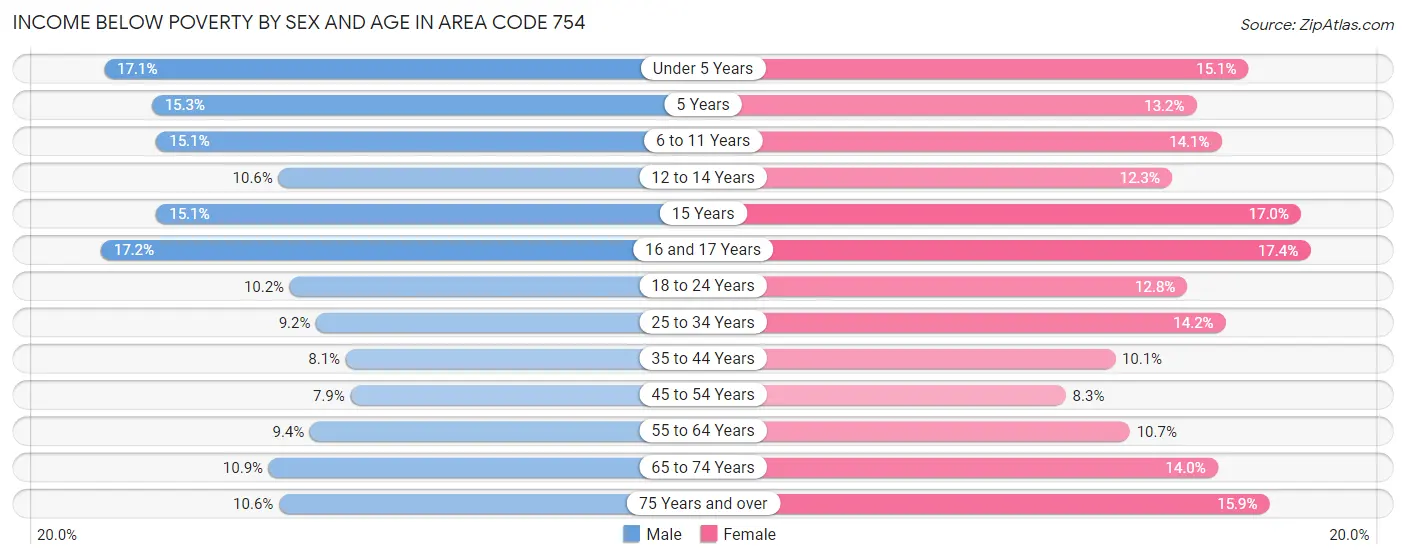
Income Below Poverty by Sex and Age in Area Code 754
With 10.4% poverty level for males and 12.4% for females among the residents of Area Code 754, 16 and 17 year old males and 16 and 17 year old females are the most vulnerable to poverty, with 1,651 males (17.2%) and 1,593 females (17.4%) in their respective age groups living below the poverty level.
| Age Bracket | Male | Female |
| Under 5 Years | 3,470 (17.1%) | 3,015 (15.1%) |
| 5 Years | 609 (15.3%) | 471 (13.2%) |
| 6 to 11 Years | 3,786 (15.1%) | 3,528 (14.1%) |
| 12 to 14 Years | 1,560 (10.6%) | 1,602 (12.2%) |
| 15 Years | 687 (15.1%) | 854 (17.0%) |
| 16 and 17 Years | 1,651 (17.2%) | 1,593 (17.4%) |
| 18 to 24 Years | 3,083 (10.2%) | 3,580 (12.8%) |
| 25 to 34 Years | 4,565 (9.2%) | 6,964 (14.2%) |
| 35 to 44 Years | 4,022 (8.1%) | 5,038 (10.1%) |
| 45 to 54 Years | 4,107 (7.9%) | 4,433 (8.3%) |
| 55 to 64 Years | 4,956 (9.4%) | 5,941 (10.7%) |
| 65 to 74 Years | 3,943 (10.9%) | 5,315 (14.0%) |
| 75 Years and over | 2,634 (10.5%) | 5,201 (15.9%) |
| Total | 39,073 (10.4%) | 47,535 (12.4%) |
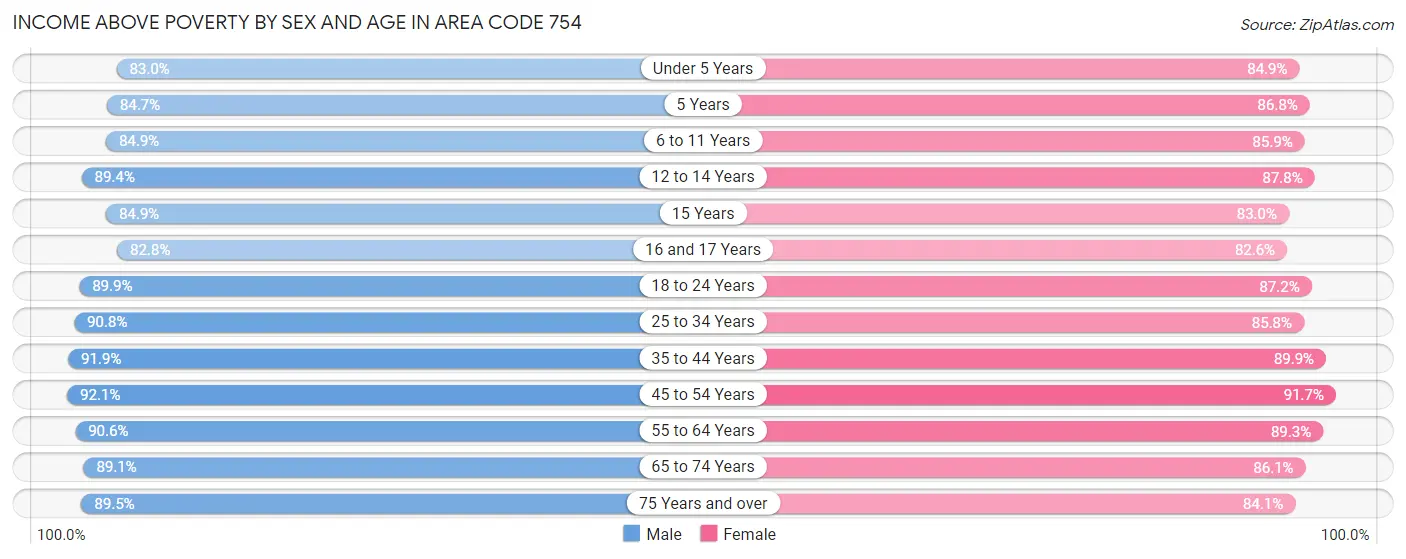
Income Above Poverty by Sex and Age in Area Code 754
According to the poverty statistics in Area Code 754, males aged 45 to 54 years and females aged 45 to 54 years are the age groups that are most secure financially, with 92.1% of males and 91.7% of females in these age groups living above the poverty line.
| Age Bracket | Male | Female |
| Under 5 Years | 16,878 (83.0%) | 16,967 (84.9%) |
| 5 Years | 3,377 (84.7%) | 3,108 (86.8%) |
| 6 to 11 Years | 21,265 (84.9%) | 21,517 (85.9%) |
| 12 to 14 Years | 13,203 (89.4%) | 11,478 (87.7%) |
| 15 Years | 3,859 (84.9%) | 4,157 (83.0%) |
| 16 and 17 Years | 7,964 (82.8%) | 7,575 (82.6%) |
| 18 to 24 Years | 27,279 (89.8%) | 24,355 (87.2%) |
| 25 to 34 Years | 45,199 (90.8%) | 41,934 (85.8%) |
| 35 to 44 Years | 45,804 (91.9%) | 44,643 (89.9%) |
| 45 to 54 Years | 47,851 (92.1%) | 48,893 (91.7%) |
| 55 to 64 Years | 47,754 (90.6%) | 49,614 (89.3%) |
| 65 to 74 Years | 32,118 (89.1%) | 32,797 (86.1%) |
| 75 Years and over | 22,332 (89.4%) | 27,577 (84.1%) |
| Total | 334,883 (89.5%) | 334,615 (87.6%) |
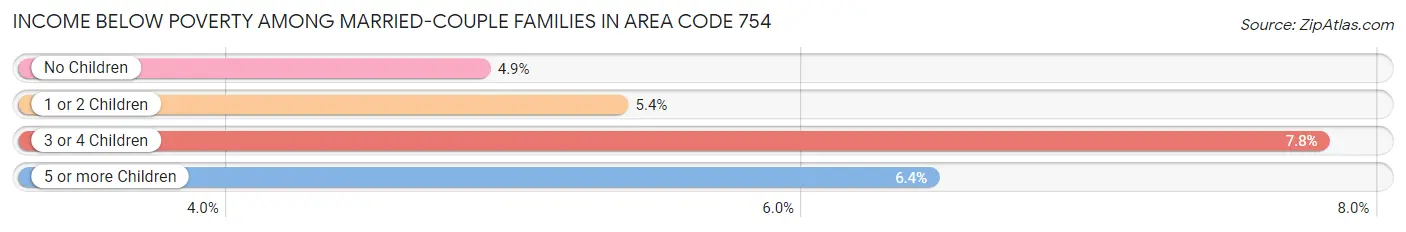
Income Below Poverty Among Married-Couple Families in Area Code 754
The poverty statistics for married-couple families in Area Code 754 show that 5.2% or 7,021 of the total 134,782 families live below the poverty line. Families with 3 or 4 children have the highest poverty rate of 7.8%, comprising of 599 families. On the other hand, families with no children have the lowest poverty rate of 4.9%, which includes 4,015 families.
| Children | Above Poverty | Below Poverty |
| No Children | 78,270 (95.1%) | 4,015 (4.9%) |
| 1 or 2 Children | 41,975 (94.6%) | 2,377 (5.4%) |
| 3 or 4 Children | 7,080 (92.2%) | 599 (7.8%) |
| 5 or more Children | 436 (93.6%) | 30 (6.4%) |
| Total | 127,761 (94.8%) | 7,021 (5.2%) |
Income Below Poverty Among Single-Parent Households in Area Code 754
According to the poverty data in Area Code 754, 10.7% or 1,723 single-father households and 19.5% or 7,488 single-mother households are living below the poverty line. Among single-father households, those with 5 or more children have the highest poverty rate, with 49 households (33.1%) experiencing poverty. Likewise, among single-mother households, those with 5 or more children have the highest poverty rate, with 213 households (88.7%) falling below the poverty line.
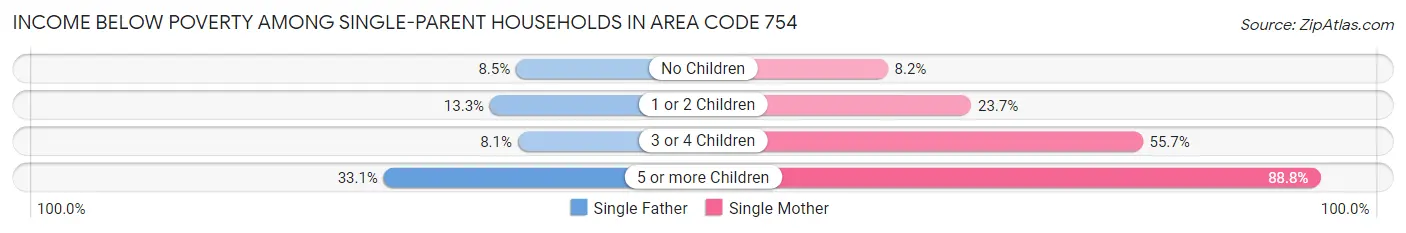
| Children | Single Father | Single Mother |
| No Children | 703 (8.5%) | 1,362 (8.2%) |
| 1 or 2 Children | 895 (13.3%) | 4,505 (23.7%) |
| 3 or 4 Children | 76 (8.1%) | 1,408 (55.7%) |
| 5 or more Children | 49 (33.1%) | 213 (88.7%) |
| Total | 1,723 (10.7%) | 7,488 (19.5%) |
Income Below Poverty Among Married-Couple vs Single-Parent Households in Area Code 754
The poverty data for Area Code 754 shows that 7,021 of the married-couple family households (5.2%) and 9,211 of the single-parent households (16.9%) are living below the poverty level. Within the married-couple family households, those with 3 or 4 children have the highest poverty rate, with 599 households (7.8%) falling below the poverty line. Among the single-parent households, those with 5 or more children have the highest poverty rate, with 262 household (67.5%) living below poverty.
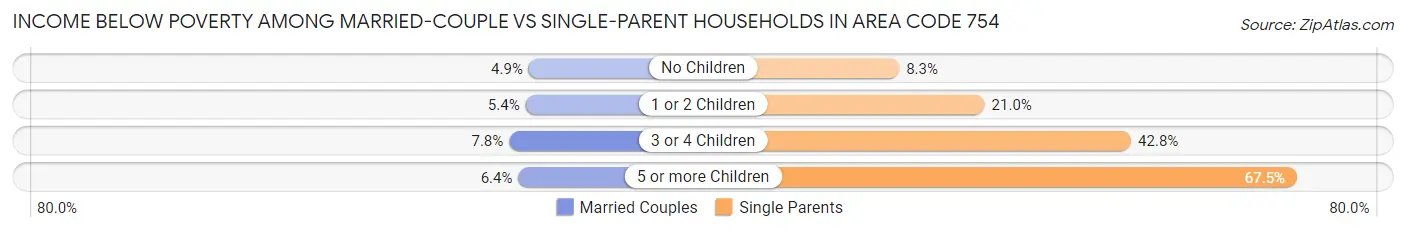
| Children | Married-Couple Families | Single-Parent Households |
| No Children | 4,015 (4.9%) | 2,065 (8.3%) |
| 1 or 2 Children | 2,377 (5.4%) | 5,400 (21.0%) |
| 3 or 4 Children | 599 (7.8%) | 1,484 (42.8%) |
| 5 or more Children | 30 (6.4%) | 262 (67.5%) |
| Total | 7,021 (5.2%) | 9,211 (16.9%) |
Race in Area Code 754
The most populous races in Area Code 754 are White / Caucasian (417,451 | 54.5%), Hispanic or Latino (230,108 | 30.0%), and Black / African American (160,606 | 21.0%).
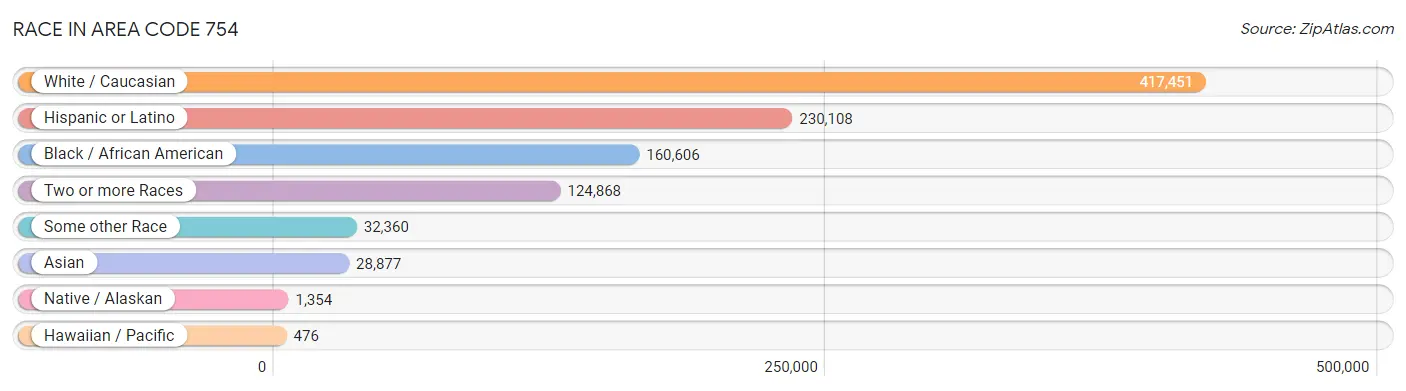
| Race | # Population | % Population |
| Asian | 28,877 | 3.8% |
| Black / African American | 160,606 | 21.0% |
| Hawaiian / Pacific | 476 | 0.1% |
| Hispanic or Latino | 230,108 | 30.0% |
| Native / Alaskan | 1,354 | 0.2% |
| White / Caucasian | 417,451 | 54.5% |
| Two or more Races | 124,868 | 16.3% |
| Some other Race | 32,360 | 4.2% |
| Total | 765,992 | 100.0% |
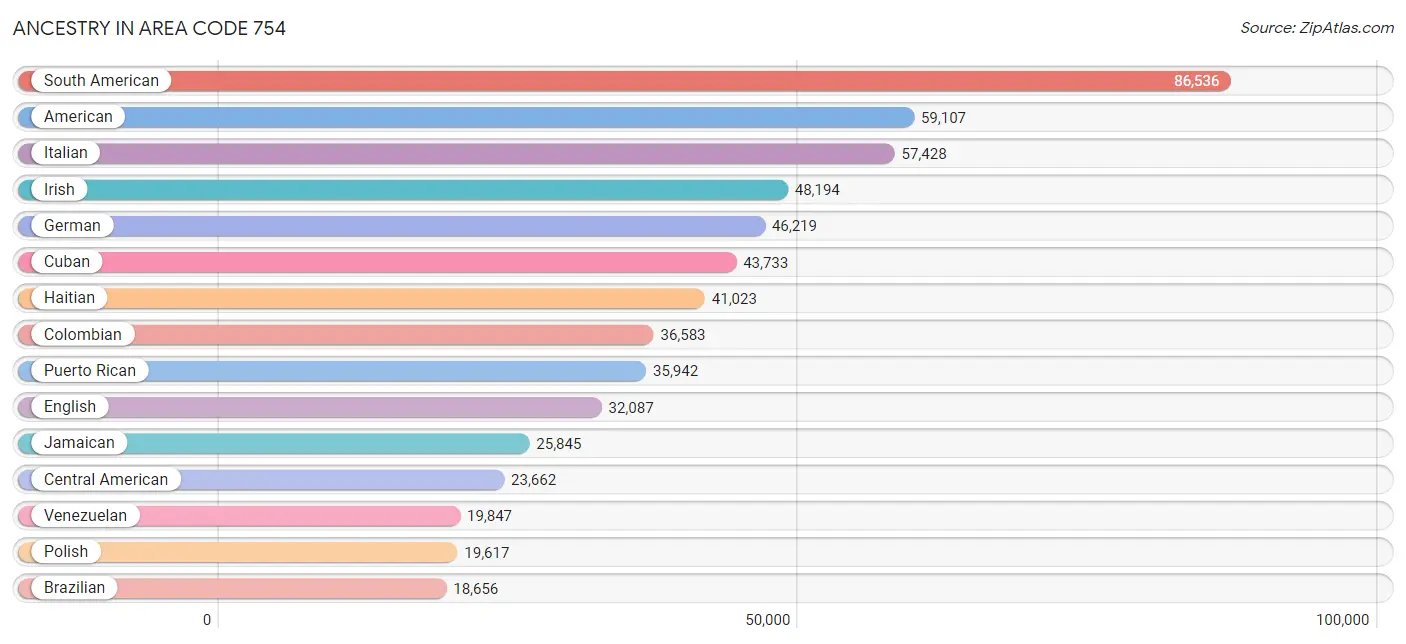
Ancestry in Area Code 754
The most populous ancestries reported in Area Code 754 are South American (86,536 | 11.3%), American (59,107 | 7.7%), Italian (57,428 | 7.5%), Irish (48,194 | 6.3%), and German (46,219 | 6.0%), together accounting for 38.8% of all Area Code 754 residents.
| Ancestry | # Population | % Population |
| Afghan | 17 | 0.0% |
| African | 3,172 | 0.4% |
| Albanian | 384 | 0.1% |
| American | 59,107 | 7.7% |
| Apache | 38 | 0.0% |
| Arab | 7,037 | 0.9% |
| Argentinean | 5,573 | 0.7% |
| Armenian | 1,207 | 0.2% |
| Assyrian / Chaldean / Syriac | 37 | 0.0% |
| Australian | 535 | 0.1% |
| Austrian | 2,064 | 0.3% |
| Bahamian | 3,792 | 0.5% |
| Barbadian | 711 | 0.1% |
| Basque | 64 | 0.0% |
| Belgian | 565 | 0.1% |
| Belizean | 194 | 0.0% |
| Bermudan | 120 | 0.0% |
| Bhutanese | 1,065 | 0.1% |
| Blackfeet | 282 | 0.0% |
| Bolivian | 1,081 | 0.1% |
| Brazilian | 18,656 | 2.4% |
| British | 3,485 | 0.4% |
| British West Indian | 1,453 | 0.2% |
| Bulgarian | 595 | 0.1% |
| Burmese | 1,291 | 0.2% |
| Cajun | 20 | 0.0% |
| Canadian | 3,766 | 0.5% |
| Cape Verdean | 37 | 0.0% |
| Celtic | 25 | 0.0% |
| Central American | 23,662 | 3.1% |
| Central American Indian | 912 | 0.1% |
| Cherokee | 862 | 0.1% |
| Chilean | 2,660 | 0.4% |
| Chippewa | 105 | 0.0% |
| Choctaw | 18 | 0.0% |
| Colombian | 36,583 | 4.8% |
| Costa Rican | 999 | 0.1% |
| Creek | 101 | 0.0% |
| Croatian | 432 | 0.1% |
| Cuban | 43,733 | 5.7% |
| Cypriot | 96 | 0.0% |
| Czech | 1,710 | 0.2% |
| Czechoslovakian | 338 | 0.0% |
| Danish | 957 | 0.1% |
| Dominican | 12,857 | 1.7% |
| Dutch | 2,983 | 0.4% |
| Dutch West Indian | 45 | 0.0% |
| Eastern European | 5,004 | 0.6% |
| Ecuadorian | 5,335 | 0.7% |
| Egyptian | 951 | 0.1% |
| English | 32,087 | 4.2% |
| Estonian | 69 | 0.0% |
| Ethiopian | 195 | 0.0% |
| European | 8,055 | 1.1% |
| Filipino | 220 | 0.0% |
| Finnish | 459 | 0.1% |
| French | 10,831 | 1.4% |
| French American Indian | 7 | 0.0% |
| French Canadian | 3,656 | 0.5% |
| German | 46,219 | 6.0% |
| Ghanaian | 79 | 0.0% |
| Greek | 3,855 | 0.5% |
| Guamanian / Chamorro | 96 | 0.0% |
| Guatemalan | 4,912 | 0.6% |
| Guyanese | 1,992 | 0.3% |
| Haitian | 41,023 | 5.4% |
| Honduran | 7,883 | 1.0% |
| Hungarian | 3,976 | 0.5% |
| Icelander | 49 | 0.0% |
| Indian (Asian) | 8,433 | 1.1% |
| Indonesian | 71 | 0.0% |
| Inupiat | 52 | 0.0% |
| Iranian | 797 | 0.1% |
| Iraqi | 114 | 0.0% |
| Irish | 48,194 | 6.3% |
| Iroquois | 111 | 0.0% |
| Israeli | 2,816 | 0.4% |
| Italian | 57,428 | 7.5% |
| Jamaican | 25,845 | 3.4% |
| Japanese | 53 | 0.0% |
| Jordanian | 48 | 0.0% |
| Korean | 5,693 | 0.7% |
| Laotian | 89 | 0.0% |
| Latvian | 160 | 0.0% |
| Lebanese | 2,534 | 0.3% |
| Liberian | 22 | 0.0% |
| Lithuanian | 2,368 | 0.3% |
| Lumbee | 45 | 0.0% |
| Luxembourger | 138 | 0.0% |
| Macedonian | 159 | 0.0% |
| Malaysian | 77 | 0.0% |
| Maltese | 37 | 0.0% |
| Mexican | 16,654 | 2.2% |
| Mexican American Indian | 150 | 0.0% |
| Mongolian | 34 | 0.0% |
| Moroccan | 969 | 0.1% |
| Native Hawaiian | 174 | 0.0% |
| Navajo | 36 | 0.0% |
| New Zealander | 75 | 0.0% |
| Nicaraguan | 4,677 | 0.6% |
| Nigerian | 742 | 0.1% |
| Northern European | 315 | 0.0% |
| Norwegian | 2,488 | 0.3% |
| Pakistani | 506 | 0.1% |
| Palestinian | 399 | 0.1% |
| Panamanian | 1,443 | 0.2% |
| Paraguayan | 55 | 0.0% |
| Pennsylvania German | 91 | 0.0% |
| Peruvian | 13,426 | 1.8% |
| Polish | 19,617 | 2.6% |
| Portuguese | 5,888 | 0.8% |
| Potawatomi | 73 | 0.0% |
| Puerto Rican | 35,942 | 4.7% |
| Romanian | 3,947 | 0.5% |
| Russian | 13,774 | 1.8% |
| Salvadoran | 3,526 | 0.5% |
| Samoan | 137 | 0.0% |
| Scandinavian | 745 | 0.1% |
| Scotch-Irish | 2,544 | 0.3% |
| Scottish | 5,933 | 0.8% |
| Seminole | 209 | 0.0% |
| Senegalese | 63 | 0.0% |
| Serbian | 499 | 0.1% |
| Sierra Leonean | 17 | 0.0% |
| Sioux | 188 | 0.0% |
| Slavic | 193 | 0.0% |
| Slovak | 752 | 0.1% |
| Slovene | 53 | 0.0% |
| South African | 455 | 0.1% |
| South American | 86,536 | 11.3% |
| South American Indian | 1,422 | 0.2% |
| Spaniard | 3,656 | 0.5% |
| Spanish | 1,940 | 0.3% |
| Spanish American | 78 | 0.0% |
| Spanish American Indian | 8 | 0.0% |
| Sri Lankan | 2,529 | 0.3% |
| Subsaharan African | 5,255 | 0.7% |
| Swedish | 3,087 | 0.4% |
| Swiss | 1,109 | 0.1% |
| Syrian | 548 | 0.1% |
| Thai | 13,308 | 1.7% |
| Tongan | 136 | 0.0% |
| Trinidadian and Tobagonian | 3,440 | 0.4% |
| Turkish | 1,492 | 0.2% |
| U.S. Virgin Islander | 207 | 0.0% |
| Ugandan | 35 | 0.0% |
| Ukrainian | 3,982 | 0.5% |
| Uruguayan | 1,440 | 0.2% |
| Venezuelan | 19,847 | 2.6% |
| Vietnamese | 41 | 0.0% |
| Welsh | 1,640 | 0.2% |
| West Indian | 1,496 | 0.2% |
| Yugoslavian | 205 | 0.0% |
| Zimbabwean | 125 | 0.0% | View All 154 Rows |
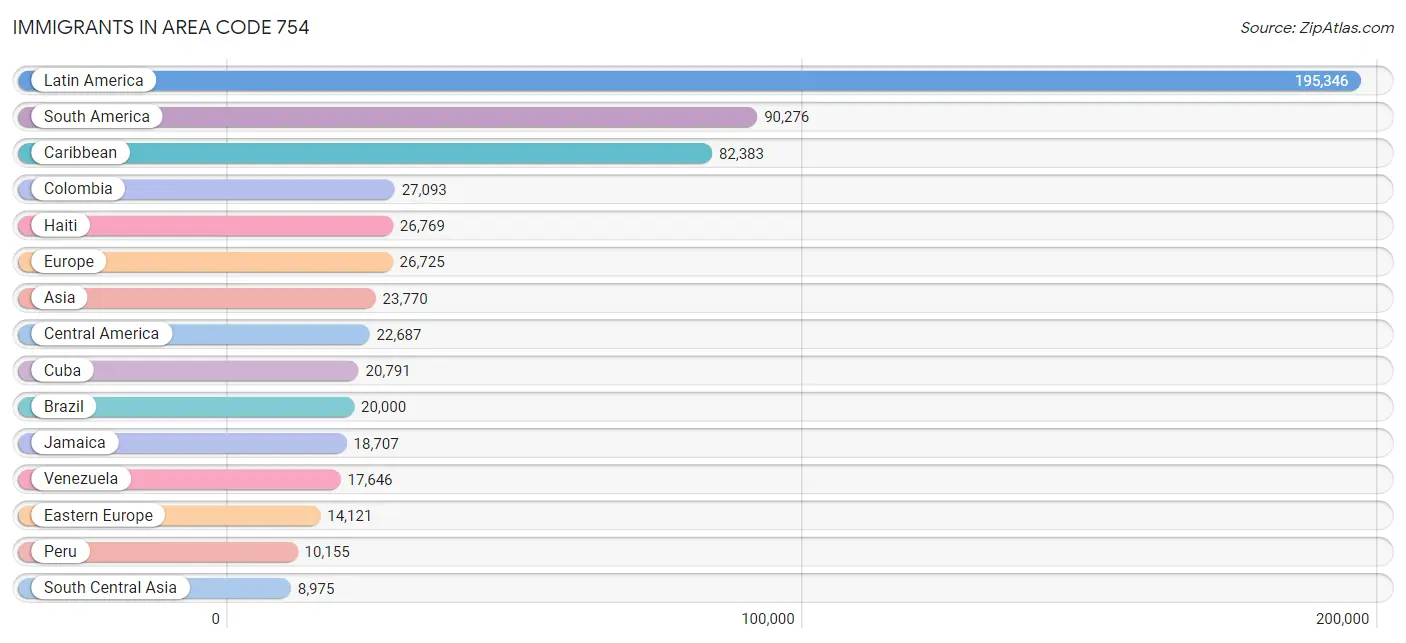
Immigrants in Area Code 754
The most numerous immigrant groups reported in Area Code 754 came from Latin America (195,346 | 25.5%), South America (90,276 | 11.8%), Caribbean (82,383 | 10.8%), Colombia (27,093 | 3.5%), and Haiti (26,769 | 3.5%), together accounting for 55.1% of all Area Code 754 residents.
| Immigration Origin | # Population | % Population |
| Africa | 3,607 | 0.5% |
| Albania | 182 | 0.0% |
| Argentina | 5,358 | 0.7% |
| Armenia | 33 | 0.0% |
| Asia | 23,770 | 3.1% |
| Australia | 135 | 0.0% |
| Austria | 82 | 0.0% |
| Bahamas | 1,177 | 0.2% |
| Bangladesh | 992 | 0.1% |
| Barbados | 275 | 0.0% |
| Belarus | 536 | 0.1% |
| Belgium | 544 | 0.1% |
| Belize | 374 | 0.1% |
| Bolivia | 397 | 0.1% |
| Bosnia and Herzegovina | 135 | 0.0% |
| Brazil | 20,000 | 2.6% |
| Bulgaria | 565 | 0.1% |
| Cambodia | 53 | 0.0% |
| Cameroon | 58 | 0.0% |
| Canada | 7,795 | 1.0% |
| Caribbean | 82,383 | 10.8% |
| Central America | 22,687 | 3.0% |
| Chile | 2,005 | 0.3% |
| China | 3,851 | 0.5% |
| Colombia | 27,093 | 3.5% |
| Congo | 19 | 0.0% |
| Costa Rica | 929 | 0.1% |
| Croatia | 145 | 0.0% |
| Cuba | 20,791 | 2.7% |
| Czechoslovakia | 528 | 0.1% |
| Denmark | 62 | 0.0% |
| Dominica | 275 | 0.0% |
| Dominican Republic | 6,886 | 0.9% |
| Eastern Africa | 391 | 0.1% |
| Eastern Asia | 4,979 | 0.6% |
| Eastern Europe | 14,121 | 1.8% |
| Ecuador | 3,694 | 0.5% |
| Egypt | 867 | 0.1% |
| El Salvador | 2,201 | 0.3% |
| England | 1,588 | 0.2% |
| Ethiopia | 233 | 0.0% |
| Europe | 26,725 | 3.5% |
| Fiji | 23 | 0.0% |
| France | 1,246 | 0.2% |
| Germany | 1,935 | 0.3% |
| Ghana | 161 | 0.0% |
| Greece | 431 | 0.1% |
| Grenada | 85 | 0.0% |
| Guatemala | 3,085 | 0.4% |
| Guyana | 2,271 | 0.3% |
| Haiti | 26,769 | 3.5% |
| Honduras | 5,411 | 0.7% |
| Hong Kong | 288 | 0.0% |
| Hungary | 923 | 0.1% |
| India | 5,028 | 0.7% |
| Indonesia | 66 | 0.0% |
| Iran | 538 | 0.1% |
| Iraq | 255 | 0.0% |
| Ireland | 366 | 0.1% |
| Israel | 2,129 | 0.3% |
| Italy | 2,317 | 0.3% |
| Jamaica | 18,707 | 2.4% |
| Japan | 253 | 0.0% |
| Jordan | 111 | 0.0% |
| Kazakhstan | 265 | 0.0% |
| Korea | 875 | 0.1% |
| Kuwait | 103 | 0.0% |
| Laos | 22 | 0.0% |
| Latin America | 195,346 | 25.5% |
| Latvia | 162 | 0.0% |
| Lebanon | 626 | 0.1% |
| Liberia | 22 | 0.0% |
| Lithuania | 306 | 0.0% |
| Malaysia | 135 | 0.0% |
| Mexico | 6,993 | 0.9% |
| Middle Africa | 88 | 0.0% |
| Moldova | 439 | 0.1% |
| Morocco | 529 | 0.1% |
| Nepal | 48 | 0.0% |
| Netherlands | 453 | 0.1% |
| Nicaragua | 2,928 | 0.4% |
| Nigeria | 476 | 0.1% |
| North Macedonia | 148 | 0.0% |
| Northern Africa | 1,695 | 0.2% |
| Northern Europe | 4,004 | 0.5% |
| Norway | 54 | 0.0% |
| Oceania | 328 | 0.0% |
| Pakistan | 1,338 | 0.2% |
| Panama | 766 | 0.1% |
| Peru | 10,155 | 1.3% |
| Philippines | 2,289 | 0.3% |
| Poland | 1,549 | 0.2% |
| Portugal | 454 | 0.1% |
| Romania | 2,222 | 0.3% |
| Russia | 3,127 | 0.4% |
| Saudi Arabia | 119 | 0.0% |
| Scotland | 153 | 0.0% |
| Senegal | 90 | 0.0% |
| Serbia | 205 | 0.0% |
| Singapore | 85 | 0.0% |
| South Africa | 591 | 0.1% |
| South America | 90,276 | 11.8% |
| South Central Asia | 8,975 | 1.2% |
| South Eastern Asia | 4,928 | 0.6% |
| Southern Europe | 3,899 | 0.5% |
| Spain | 686 | 0.1% |
| Sri Lanka | 144 | 0.0% |
| St. Vincent and the Grenadines | 253 | 0.0% |
| Sweden | 193 | 0.0% |
| Switzerland | 216 | 0.0% |
| Syria | 109 | 0.0% |
| Taiwan | 280 | 0.0% |
| Thailand | 391 | 0.1% |
| Trinidad and Tobago | 5,016 | 0.6% |
| Turkey | 737 | 0.1% |
| Ukraine | 2,138 | 0.3% |
| Uruguay | 1,396 | 0.2% |
| Uzbekistan | 257 | 0.0% |
| Venezuela | 17,646 | 2.3% |
| Vietnam | 1,771 | 0.2% |
| West Indies | 357 | 0.1% |
| Western Africa | 750 | 0.1% |
| Western Asia | 4,760 | 0.6% |
| Western Europe | 4,492 | 0.6% |
| Zimbabwe | 68 | 0.0% | View All 125 Rows |
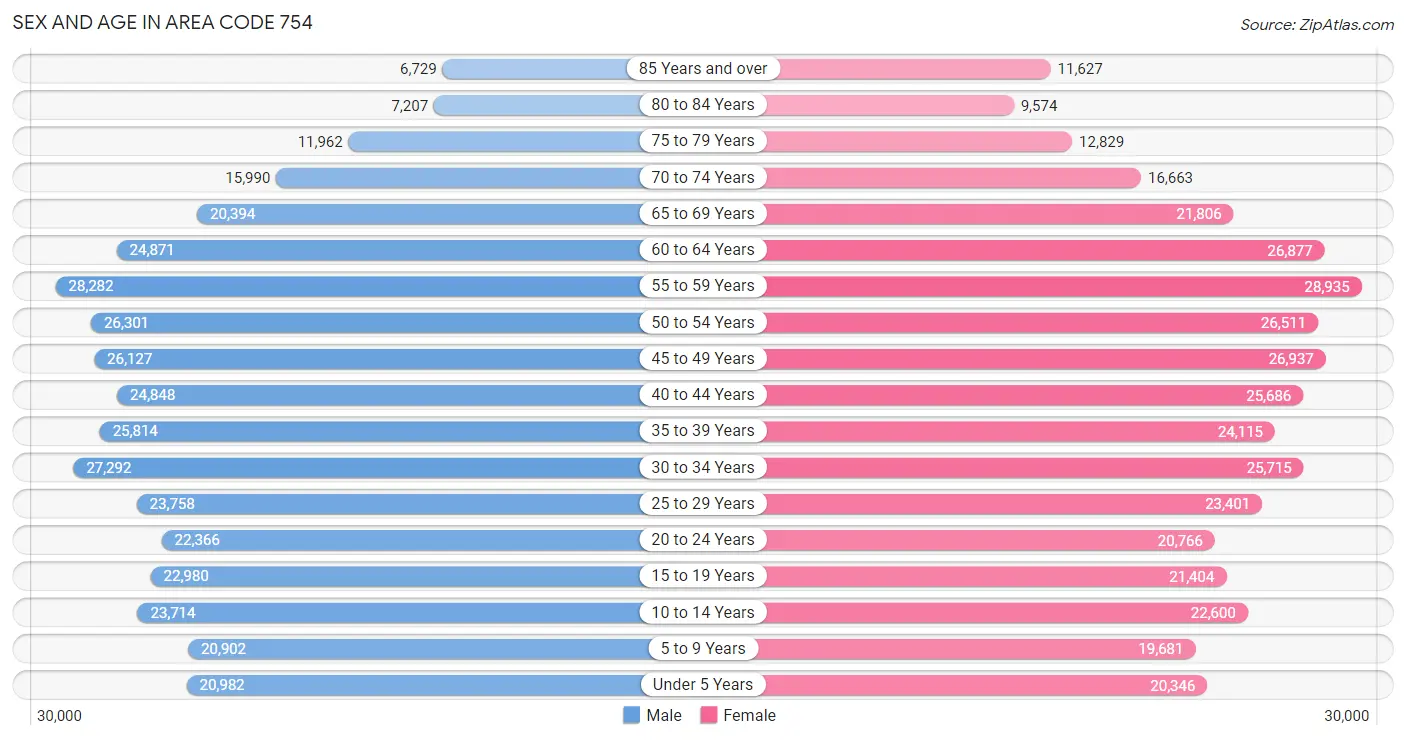
Sex and Age in Area Code 754
Sex and Age in Area Code 754
The most populous age groups in Area Code 754 are 55 to 59 Years (28,282 | 7.4%) for men and 55 to 59 Years (28,935 | 7.5%) for women.
| Age Bracket | Male | Female |
| Under 5 Years | 20,982 (5.5%) | 20,346 (5.3%) |
| 5 to 9 Years | 20,902 (5.5%) | 19,681 (5.1%) |
| 10 to 14 Years | 23,714 (6.2%) | 22,600 (5.9%) |
| 15 to 19 Years | 22,980 (6.0%) | 21,404 (5.6%) |
| 20 to 24 Years | 22,366 (5.9%) | 20,766 (5.4%) |
| 25 to 29 Years | 23,758 (6.2%) | 23,401 (6.1%) |
| 30 to 34 Years | 27,292 (7.2%) | 25,715 (6.7%) |
| 35 to 39 Years | 25,814 (6.8%) | 24,115 (6.3%) |
| 40 to 44 Years | 24,848 (6.5%) | 25,686 (6.7%) |
| 45 to 49 Years | 26,127 (6.9%) | 26,937 (7.0%) |
| 50 to 54 Years | 26,301 (6.9%) | 26,511 (6.9%) |
| 55 to 59 Years | 28,282 (7.4%) | 28,935 (7.5%) |
| 60 to 64 Years | 24,871 (6.5%) | 26,877 (7.0%) |
| 65 to 69 Years | 20,394 (5.4%) | 21,806 (5.7%) |
| 70 to 74 Years | 15,990 (4.2%) | 16,663 (4.3%) |
| 75 to 79 Years | 11,962 (3.1%) | 12,829 (3.3%) |
| 80 to 84 Years | 7,207 (1.9%) | 9,574 (2.5%) |
| 85 Years and over | 6,729 (1.8%) | 11,627 (3.0%) |
| Total | 380,519 (100.0%) | 385,473 (100.0%) |
Families and Households in Area Code 754
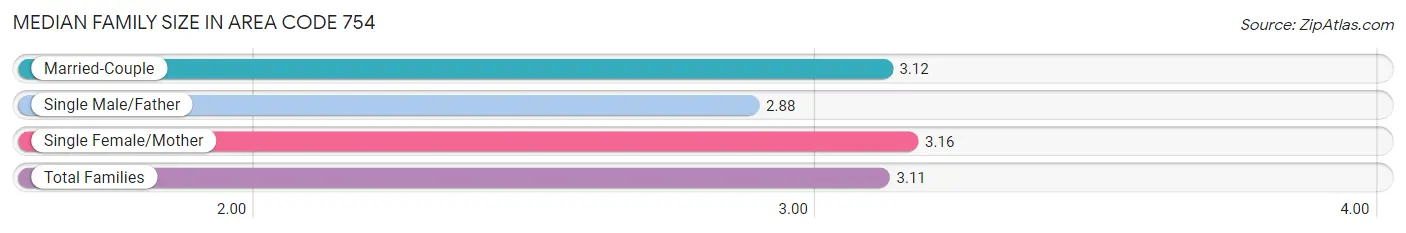
Median Family Size in Area Code 754
The median family size in Area Code 754 is 3.11 persons per family, with single female/mother families (38,401 | 20.3%) accounting for the largest median family size of 3.16409 persons per family. On the other hand, single male/father families (16,104 | 8.5%) represent the smallest median family size with 2.88 persons per family.
| Family Type | # Families | Family Size |
| Married-Couple | 134,782 (71.2%) | 3.12 |
| Single Male/Father | 16,104 (8.5%) | 2.88 |
| Single Female/Mother | 38,401 (20.3%) | 3.16 |
| Total Families | 189,287 (100.0%) | 3.11 |
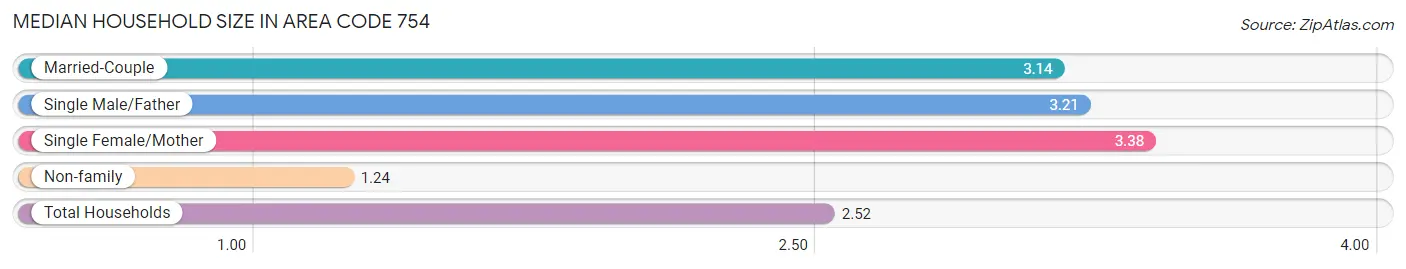
Median Household Size in Area Code 754
The median household size in Area Code 754 is 2.52 persons per household, with single female/mother households (38,401 | 12.8%) accounting for the largest median household size of 3.38227 persons per household. non-family households (111,880 | 37.1%) represent the smallest median household size with 1.24 persons per household.
| Household Type | # Households | Household Size |
| Married-Couple | 134,782 (44.8%) | 3.14 |
| Single Male/Father | 16,104 (5.3%) | 3.21 |
| Single Female/Mother | 38,401 (12.8%) | 3.38 |
| Non-family | 111,880 (37.1%) | 1.24 |
| Total Households | 301,167 (100.0%) | 2.52 |
Household Size by Marriage Status in Area Code 754
Out of a total of 301,167 households in Area Code 754, 189,287 (62.8%) are family households, while 111,880 (37.1%) are nonfamily households. The most numerous type of family households are 2-person households, comprising 82,968, and the most common type of nonfamily households are 1-person households, comprising 92,735.
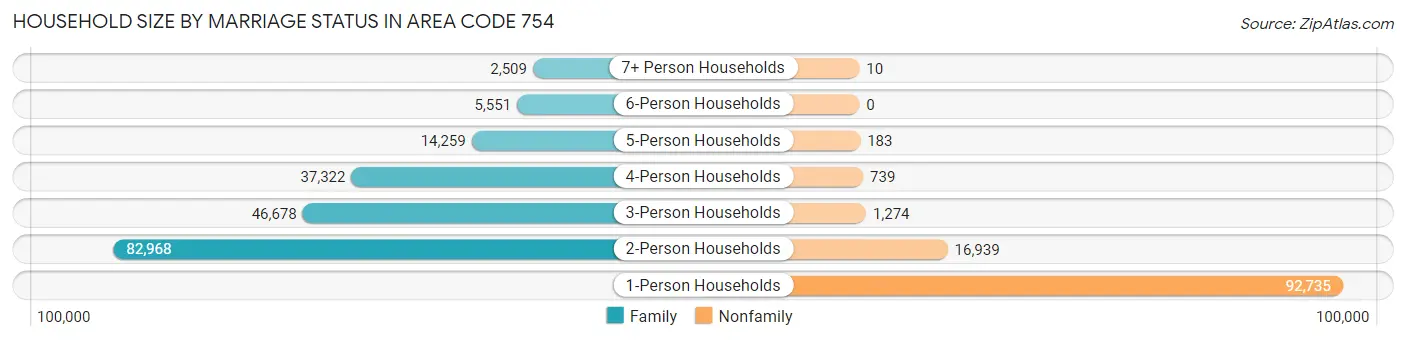
| Household Size | Family Households | Nonfamily Households |
| 1-Person Households | - | 92,735 (30.8%) |
| 2-Person Households | 82,968 (27.6%) | 16,939 (5.6%) |
| 3-Person Households | 46,678 (15.5%) | 1,274 (0.4%) |
| 4-Person Households | 37,322 (12.4%) | 739 (0.3%) |
| 5-Person Households | 14,259 (4.7%) | 183 (0.1%) |
| 6-Person Households | 5,551 (1.8%) | 0 (0.0%) |
| 7+ Person Households | 2,509 (0.8%) | 10 (0.0%) |
| Total | 189,287 (62.8%) | 111,880 (37.1%) |
Female Fertility in Area Code 754
Fertility by Age in Area Code 754
Average fertility rate in Area Code 754 is 46.7 births per 1,000 women. Women in the age bracket of 20 to 34 years have the highest fertility rate with 76.8 births per 1,000 women. Women in the age bracket of 20 to 34 years acount for 67.6% of all women with births.
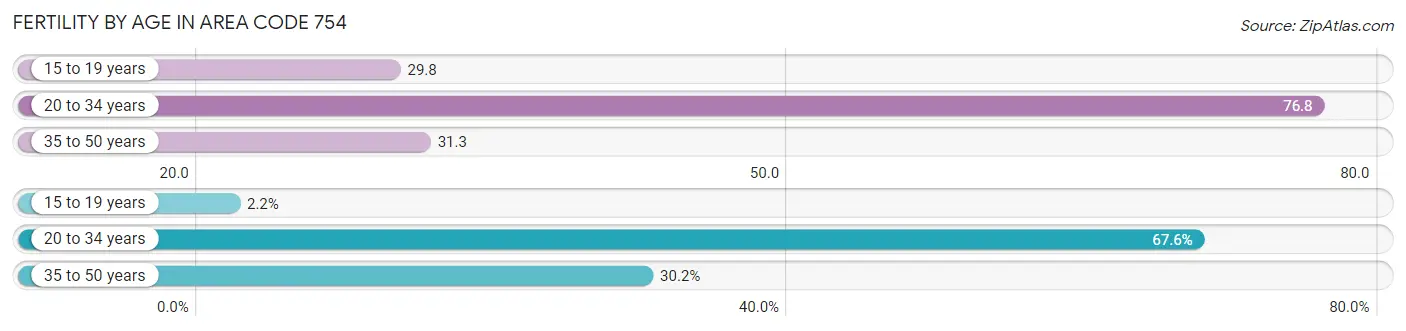
| Age Bracket | Women with Births | Births / 1,000 Women |
| 15 to 19 years | 179 (2.2%) | 29.8 |
| 20 to 34 years | 5,578 (67.6%) | 76.8 |
| 35 to 50 years | 2,492 (30.2%) | 31.3 |
| Total | 8,249 (100.0%) | 46.7 |
Fertility by Age by Marriage Status in Area Code 754
68.6% of women with births (8,249) in Area Code 754 are married. The highest percentage of unmarried women with births falls into 15 to 19 years age bracket with 100.0% of them unmarried at the time of birth, while the lowest percentage of unmarried women with births belong to 35 to 50 years age bracket with 25.1% of them unmarried.
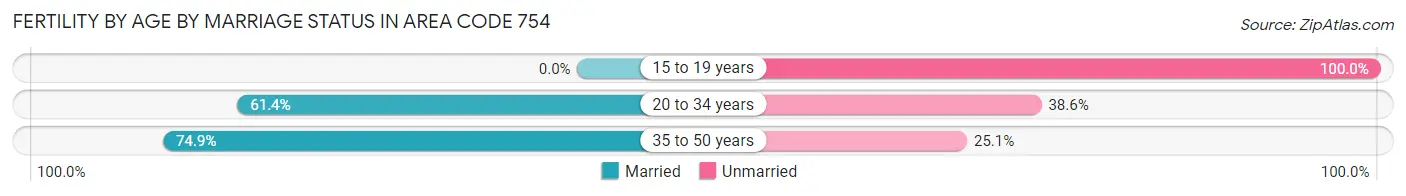
| Age Bracket | Married | Unmarried |
| 15 to 19 years | 0 (0.0%) | 179 (100.0%) |
| 20 to 34 years | 3,427 (61.4%) | 2,151 (38.6%) |
| 35 to 50 years | 1,867 (74.9%) | 625 (25.1%) |
| Total | 5,662 (68.6%) | 2,587 (31.4%) |
Fertility by Education in Area Code 754
Average fertility rate in Area Code 754 is 46.7 births per 1,000 women. Women with the education attainment of graduate degree have the highest fertility rate of 60.9 births per 1,000 women, while women with the education attainment of bachelor's degree have the lowest fertility at 51.0 births per 1,000 women. Women with the education attainment of college or associate's degree represent 29.0% of all women with births.
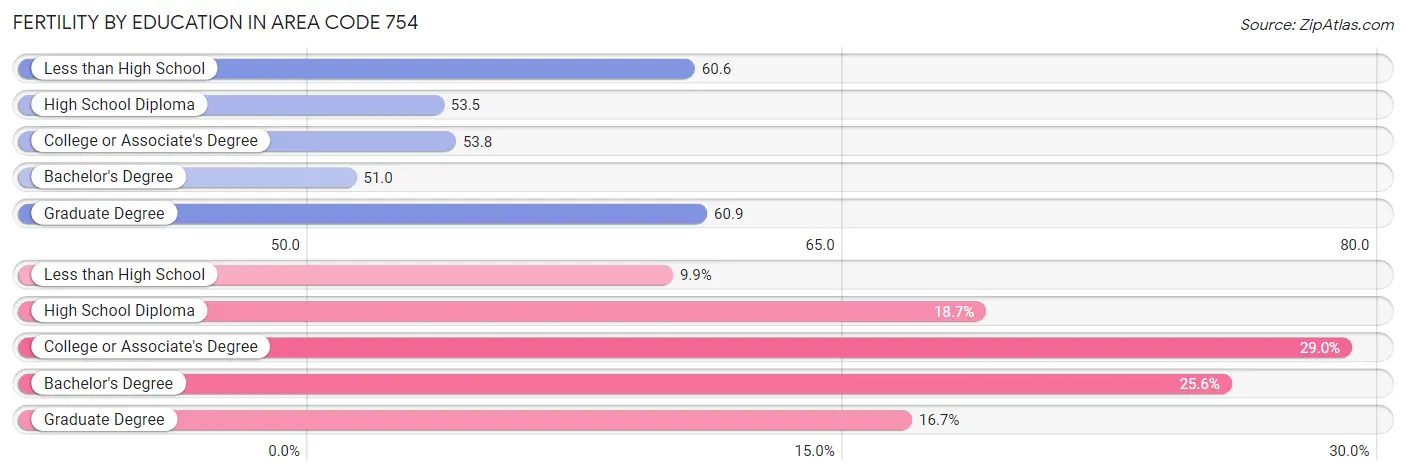
| Educational Attainment | Women with Births | Births / 1,000 Women |
| Less than High School | 820 (9.9%) | 60.6 |
| High School Diploma | 1,546 (18.7%) | 53.5 |
| College or Associate's Degree | 2,394 (29.0%) | 53.8 |
| Bachelor's Degree | 2,115 (25.6%) | 51.0 |
| Graduate Degree | 1,374 (16.7%) | 60.9 |
| Total | 8,249 (100.0%) | 46.7 |
Fertility by Education by Marriage Status in Area Code 754
31.4% of women with births in Area Code 754 are unmarried. Women with the educational attainment of bachelor's degree are most likely to be married with 60.7% of them married at childbirth, while women with the educational attainment of high school diploma are least likely to be married with 61.6% of them unmarried at childbirth.
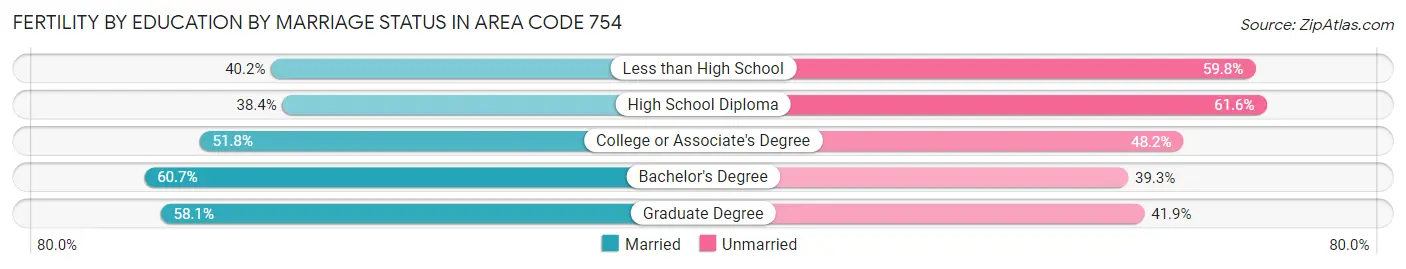
| Educational Attainment | Married | Unmarried |
| Less than High School | 330 (40.2%) | 490 (59.8%) |
| High School Diploma | 594 (38.4%) | 952 (61.6%) |
| College or Associate's Degree | 1,240 (51.8%) | 1,154 (48.2%) |
| Bachelor's Degree | 1,284 (60.7%) | 831 (39.3%) |
| Graduate Degree | 798 (58.1%) | 576 (41.9%) |
| Total | 5,662 (68.6%) | 2,587 (31.4%) |
Employment Characteristics in Area Code 754
Employment by Class of Employer in Area Code 754
Among the 381,732 employed individuals in Area Code 754, private company employees (260,572 | 68.3%), self-employed (incorporated) (31,369 | 8.2%), and self-employed (not incorporated) (26,435 | 6.9%) make up the most common classes of employment.
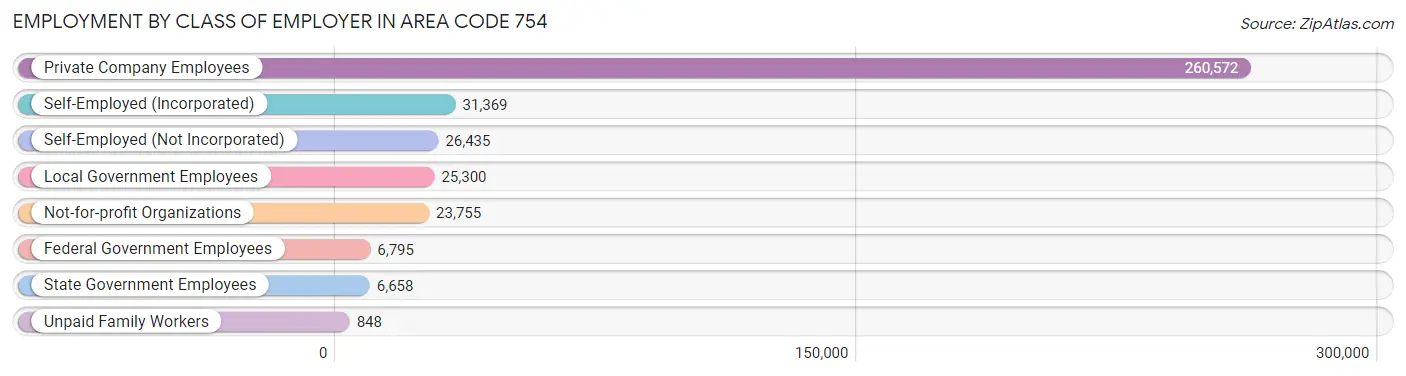
| Employer Class | # Employees | % Employees |
| Private Company Employees | 260,572 | 68.3% |
| Self-Employed (Incorporated) | 31,369 | 8.2% |
| Self-Employed (Not Incorporated) | 26,435 | 6.9% |
| Not-for-profit Organizations | 23,755 | 6.2% |
| Local Government Employees | 25,300 | 6.6% |
| State Government Employees | 6,658 | 1.7% |
| Federal Government Employees | 6,795 | 1.8% |
| Unpaid Family Workers | 848 | 0.2% |
| Total | 381,732 | 100.0% |
Employment Status by Age in Area Code 754
According to the labor force statistics for Area Code 754, out of the total population over 16 years of age (628,194), 65.2% or 409,394 individuals are in the labor force, with 6.1% or 24,891 of them unemployed. The age group with the highest labor force participation rate is 35 to 44 years, with 86.8% or 87,162 individuals in the labor force. Within the labor force, the 16 to 19 years age range has the highest percentage of unemployed individuals, with 447.1% or 48,215 of them being unemployed.
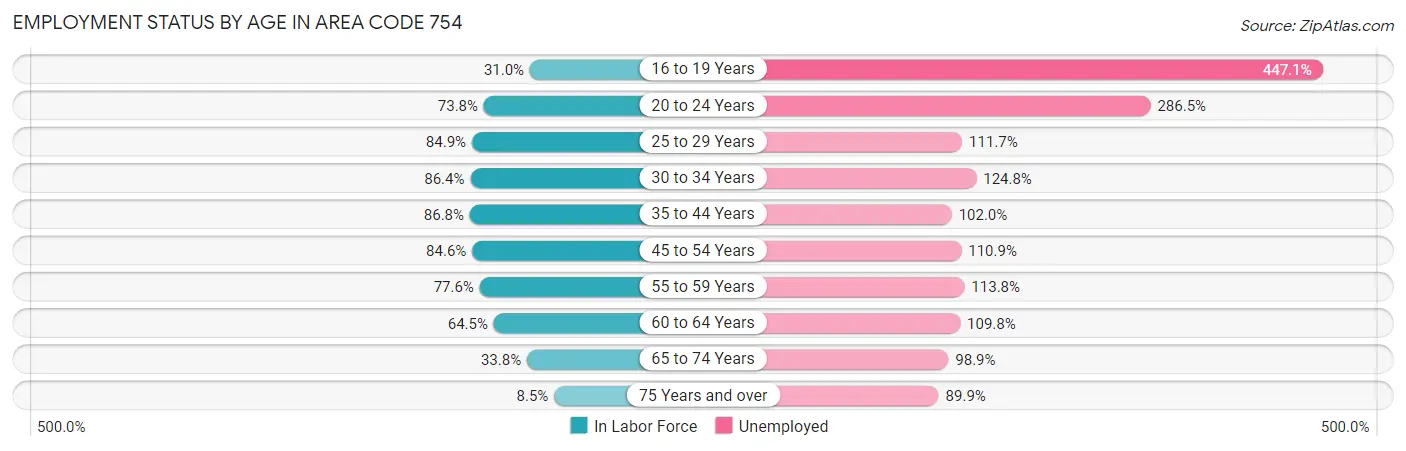
| Age Bracket | In Labor Force | Unemployed |
| 16 to 19 Years | 10,783 (31.0%) | 48,215 (447.1%) |
| 20 to 24 Years | 31,824 (73.8%) | 91,173 (286.5%) |
| 25 to 29 Years | 40,023 (84.9%) | 44,707 (111.7%) |
| 30 to 34 Years | 45,772 (86.4%) | 57,123 (124.8%) |
| 35 to 44 Years | 87,165 (86.8%) | 88,905 (102.0%) |
| 45 to 54 Years | 89,610 (84.6%) | 99,381 (110.9%) |
| 55 to 59 Years | 44,424 (77.6%) | 50,553 (113.8%) |
| 60 to 64 Years | 33,389 (64.5%) | 36,660 (109.8%) |
| 65 to 74 Years | 25,266 (33.8%) | 24,985 (98.9%) |
| 75 Years and over | 5,113 (8.5%) | 4,596 (89.9%) |
| Total | 409,411 (65.2%) | 24,899 (6.1%) |
Employment Status by Educational Attainment in Area Code 754
According to labor force statistics for Area Code 754, 81.7% of individuals (339,231) out of the total population between 25 and 64 years of age (415,470) are in the labor force, with 110.9% or 376,207 of them being unemployed. The group with the highest labor force participation rate are those with the educational attainment of bachelor's degree or higher, with 85.8% or 141,540 individuals in the labor force. Within the labor force, individuals with less than high school education have the highest percentage of unemployment, with 174.3% or 38,461 of them being unemployed.
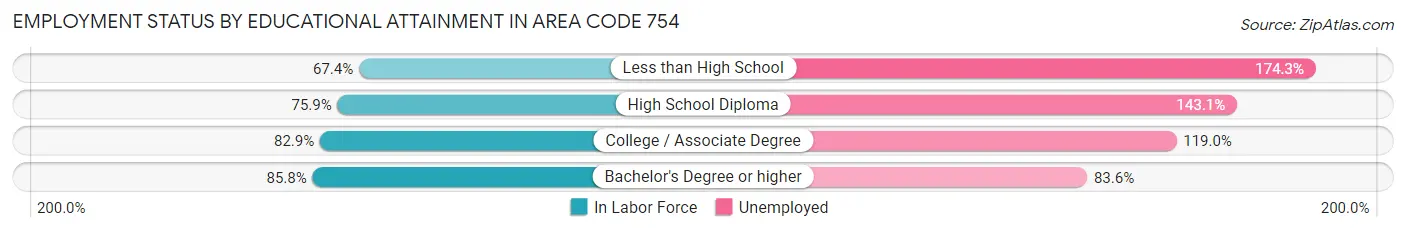
| Educational Attainment | In Labor Force | Unemployed |
| Less than High School | 22,065 (67.4%) | 57,088 (174.3%) |
| High School Diploma | 74,412 (75.9%) | 140,278 (143.1%) |
| College / Associate Degree | 99,223 (82.9%) | 142,517 (119.0%) |
| Bachelor's Degree or higher | 141,545 (85.8%) | 137,879 (83.6%) |
| Total | 339,250 (81.7%) | 460,756 (110.9%) |
Employment Occupations by Sex in Area Code 754
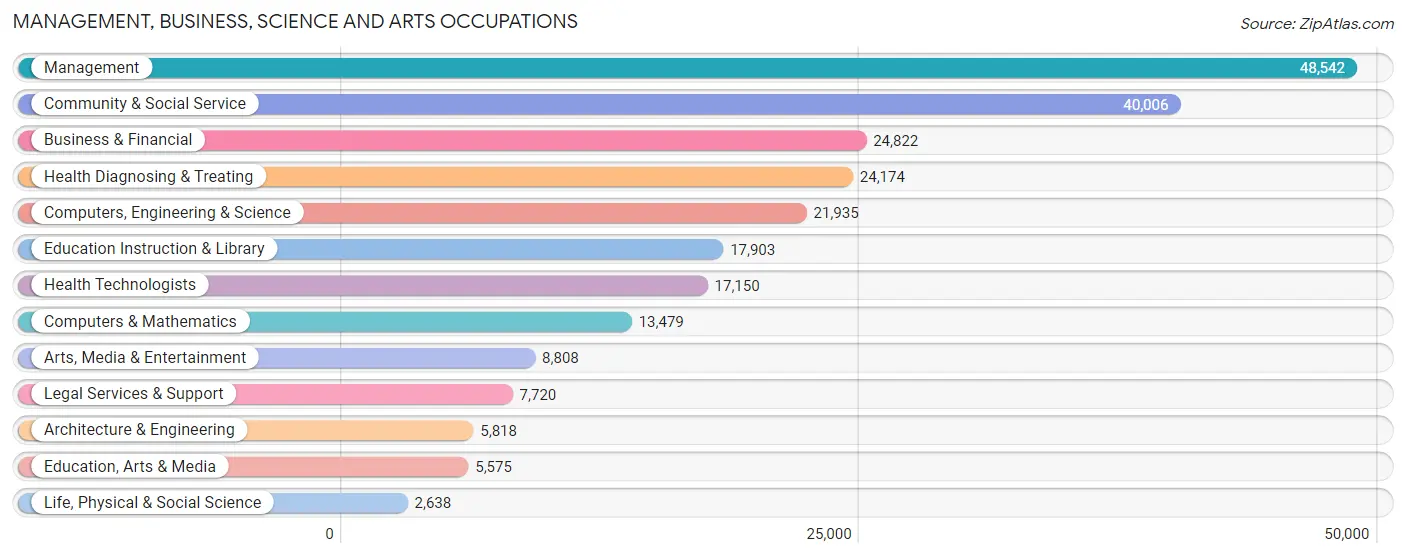
Management, Business, Science and Arts Occupations
The most common Management, Business, Science and Arts occupations in Area Code 754 are Management (48,542 | 12.5%), Community & Social Service (40,006 | 10.3%), Business & Financial (24,822 | 6.4%), Health Diagnosing & Treating (24,174 | 6.2%), and Computers, Engineering & Science (21,935 | 5.6%).
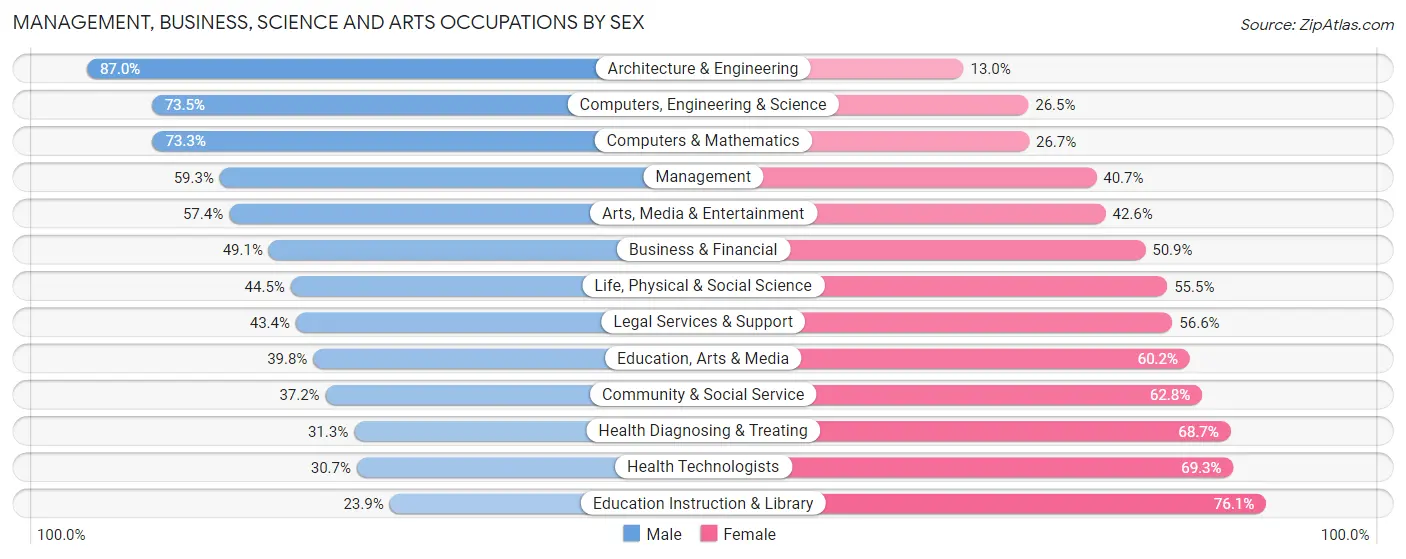
Management, Business, Science and Arts Occupations by Sex
Within the Management, Business, Science and Arts occupations in Area Code 754, the most male-oriented occupations are Architecture & Engineering (87.0%), Computers, Engineering & Science (73.5%), and Computers & Mathematics (73.3%), while the most female-oriented occupations are Education Instruction & Library (76.1%), Health Technologists (69.3%), and Health Diagnosing & Treating (68.7%).
| Occupation | Male | Female |
| Management | 28,780 (59.3%) | 19,762 (40.7%) |
| Business & Financial | 12,179 (49.1%) | 12,643 (50.9%) |
| Computers, Engineering & Science | 16,118 (73.5%) | 5,817 (26.5%) |
| Computers & Mathematics | 9,883 (73.3%) | 3,596 (26.7%) |
| Architecture & Engineering | 5,061 (87.0%) | 757 (13.0%) |
| Life, Physical & Social Science | 1,174 (44.5%) | 1,464 (55.5%) |
| Community & Social Service | 14,900 (37.2%) | 25,106 (62.8%) |
| Education, Arts & Media | 2,219 (39.8%) | 3,356 (60.2%) |
| Legal Services & Support | 3,352 (43.4%) | 4,368 (56.6%) |
| Education Instruction & Library | 4,276 (23.9%) | 13,627 (76.1%) |
| Arts, Media & Entertainment | 5,053 (57.4%) | 3,755 (42.6%) |
| Health Diagnosing & Treating | 7,563 (31.3%) | 16,611 (68.7%) |
| Health Technologists | 5,267 (30.7%) | 11,883 (69.3%) |
| Total (Category) | 79,540 (49.9%) | 79,939 (50.1%) |
| Total (Overall) | 206,223 (53.0%) | 182,522 (46.9%) |
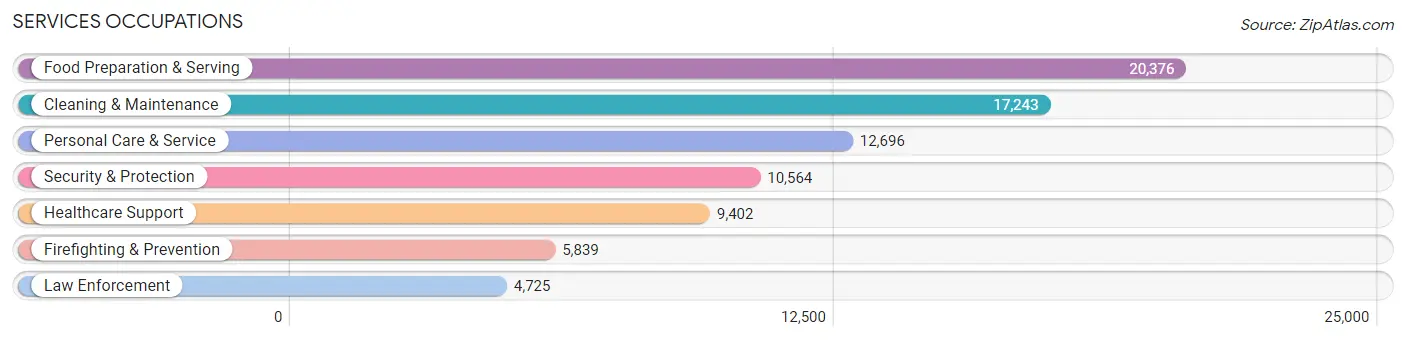
Services Occupations
The most common Services occupations in Area Code 754 are Food Preparation & Serving (20,376 | 5.2%), Cleaning & Maintenance (17,243 | 4.4%), Personal Care & Service (12,696 | 3.3%), Security & Protection (10,564 | 2.7%), and Healthcare Support (9,402 | 2.4%).
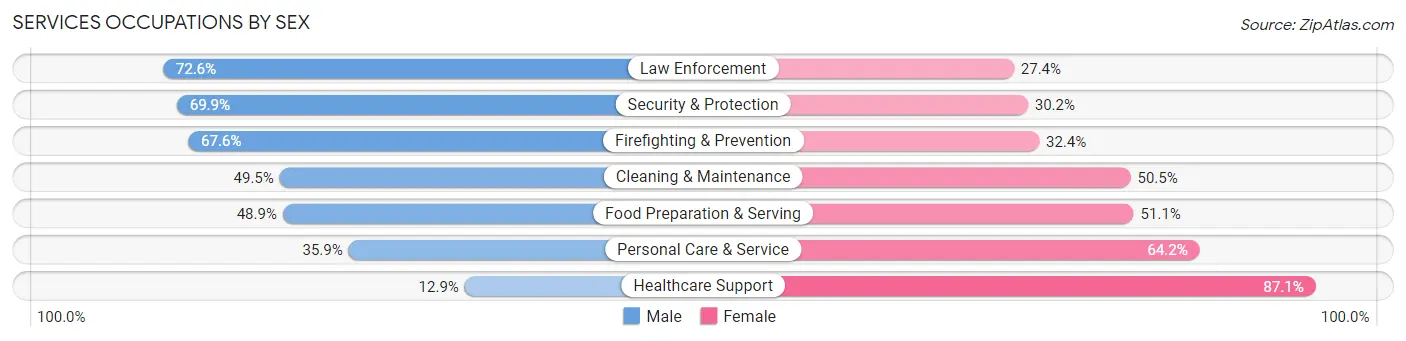
Services Occupations by Sex
Within the Services occupations in Area Code 754, the most male-oriented occupations are Law Enforcement (72.6%), Security & Protection (69.9%), and Firefighting & Prevention (67.6%), while the most female-oriented occupations are Healthcare Support (87.1%), Personal Care & Service (64.1%), and Food Preparation & Serving (51.1%).
| Occupation | Male | Female |
| Healthcare Support | 1,209 (12.9%) | 8,193 (87.1%) |
| Security & Protection | 7,379 (69.9%) | 3,185 (30.1%) |
| Firefighting & Prevention | 3,948 (67.6%) | 1,891 (32.4%) |
| Law Enforcement | 3,431 (72.6%) | 1,294 (27.4%) |
| Food Preparation & Serving | 9,962 (48.9%) | 10,414 (51.1%) |
| Cleaning & Maintenance | 8,535 (49.5%) | 8,708 (50.5%) |
| Personal Care & Service | 4,551 (35.8%) | 8,145 (64.1%) |
| Total (Category) | 31,636 (45.0%) | 38,645 (55.0%) |
| Total (Overall) | 206,223 (53.0%) | 182,522 (46.9%) |
Sales and Office Occupations
The most common Sales and Office occupations in Area Code 754 are Sales & Related (47,444 | 12.2%), and Office & Administration (43,780 | 11.3%).
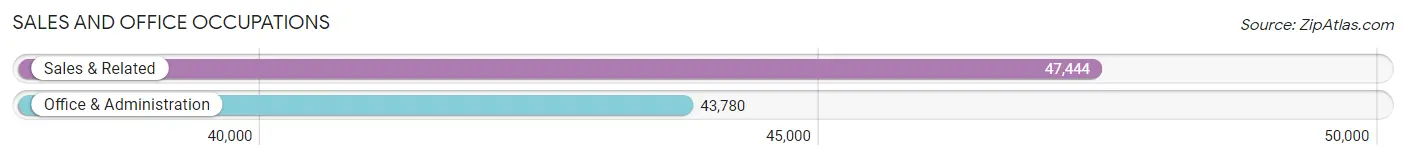
Sales and Office Occupations by Sex
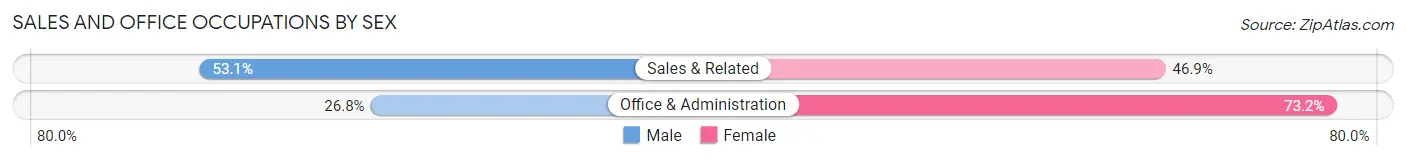
| Occupation | Male | Female |
| Sales & Related | 25,179 (53.1%) | 22,265 (46.9%) |
| Office & Administration | 11,733 (26.8%) | 32,047 (73.2%) |
| Total (Category) | 36,912 (40.5%) | 54,312 (59.5%) |
| Total (Overall) | 206,223 (53.0%) | 182,522 (46.9%) |
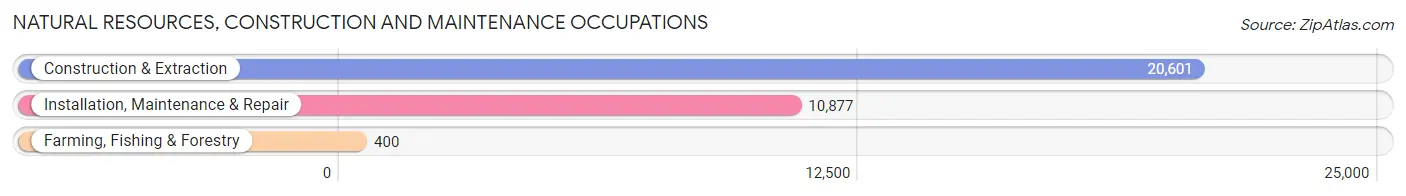
Natural Resources, Construction and Maintenance Occupations
The most common Natural Resources, Construction and Maintenance occupations in Area Code 754 are Construction & Extraction (20,601 | 5.3%), Installation, Maintenance & Repair (10,877 | 2.8%), and Farming, Fishing & Forestry (400 | 0.1%).
Natural Resources, Construction and Maintenance Occupations by Sex
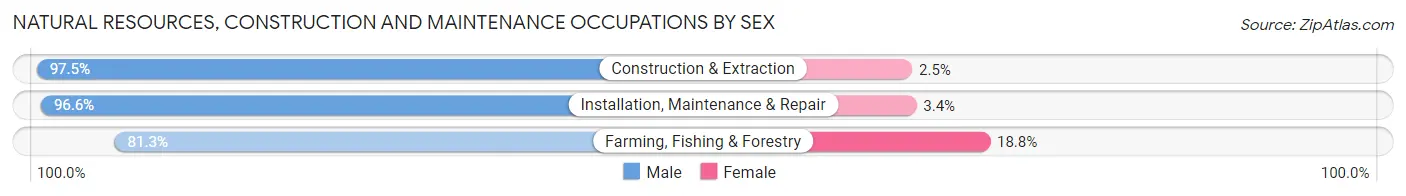
| Occupation | Male | Female |
| Farming, Fishing & Forestry | 325 (81.2%) | 75 (18.8%) |
| Construction & Extraction | 20,079 (97.5%) | 522 (2.5%) |
| Installation, Maintenance & Repair | 10,506 (96.6%) | 371 (3.4%) |
| Total (Category) | 30,910 (97.0%) | 968 (3.0%) |
| Total (Overall) | 206,223 (53.0%) | 182,522 (46.9%) |
Production, Transportation and Moving Occupations
The most common Production, Transportation and Moving occupations in Area Code 754 are Transportation (15,384 | 4.0%), Material Moving (10,513 | 2.7%), and Production (9,986 | 2.6%).
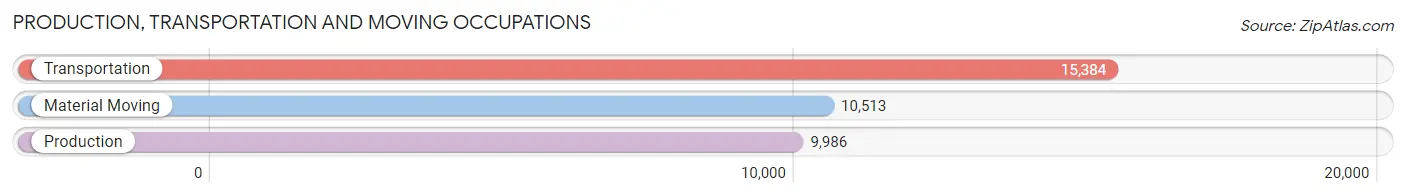
Production, Transportation and Moving Occupations by Sex
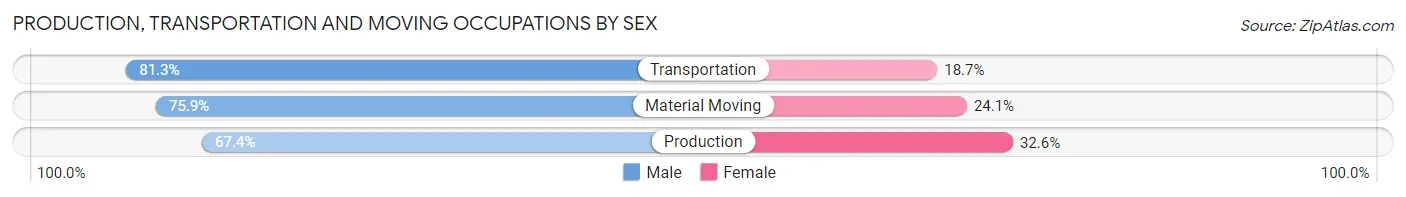
| Occupation | Male | Female |
| Production | 6,735 (67.4%) | 3,251 (32.6%) |
| Transportation | 12,512 (81.3%) | 2,872 (18.7%) |
| Material Moving | 7,978 (75.9%) | 2,535 (24.1%) |
| Total (Category) | 27,225 (75.9%) | 8,658 (24.1%) |
| Total (Overall) | 206,223 (53.0%) | 182,522 (46.9%) |
Employment Industries by Sex in Area Code 754
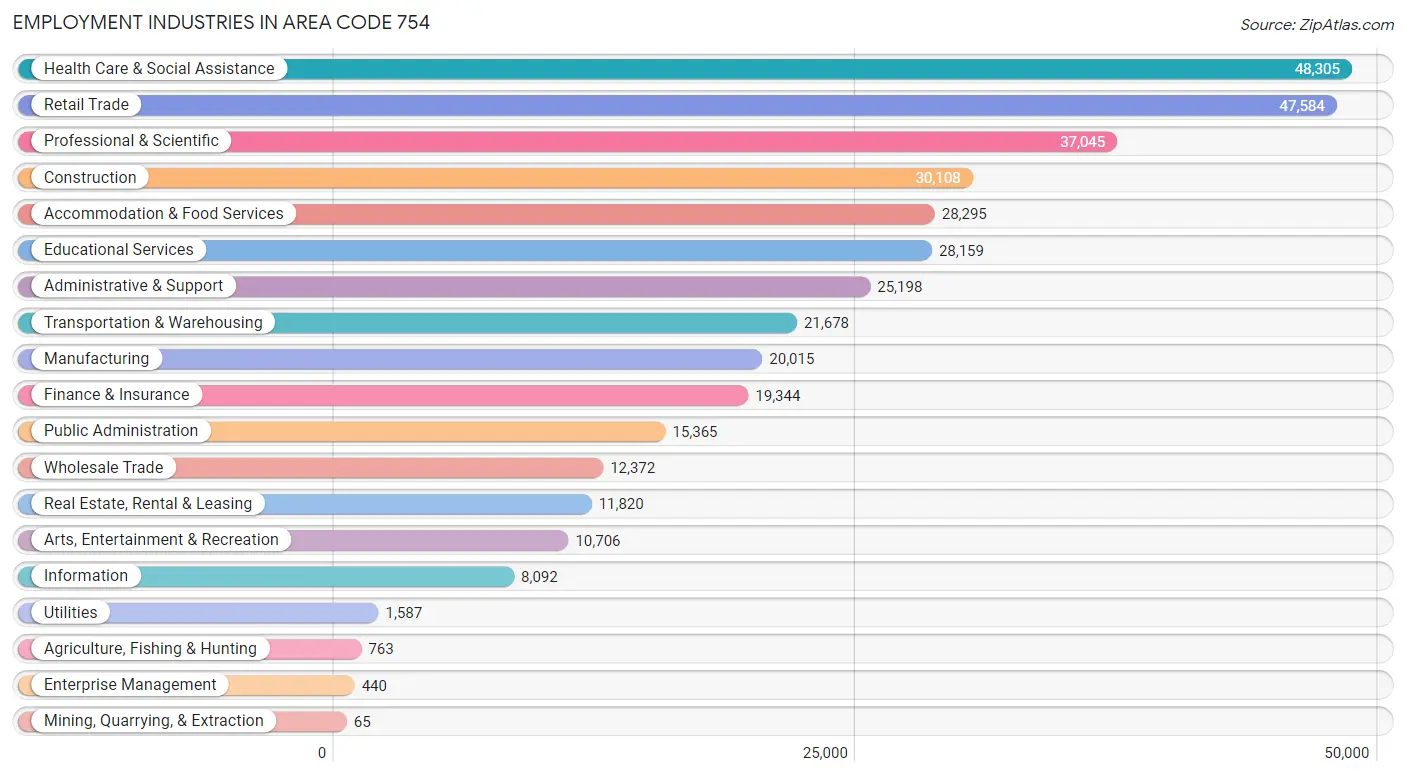
Employment Industries in Area Code 754
The major employment industries in Area Code 754 include Health Care & Social Assistance (48,305 | 12.4%), Retail Trade (47,584 | 12.2%), Professional & Scientific (37,045 | 9.5%), Construction (30,108 | 7.7%), and Accommodation & Food Services (28,295 | 7.3%).
Employment Industries by Sex in Area Code 754
The Area Code 754 industries that see more men than women are Construction (89.0%), Agriculture, Fishing & Hunting (75.6%), and Utilities (74.5%), whereas the industries that tend to have a higher number of women are Health Care & Social Assistance (74.7%), Enterprise Management (71.6%), and Educational Services (69.2%).
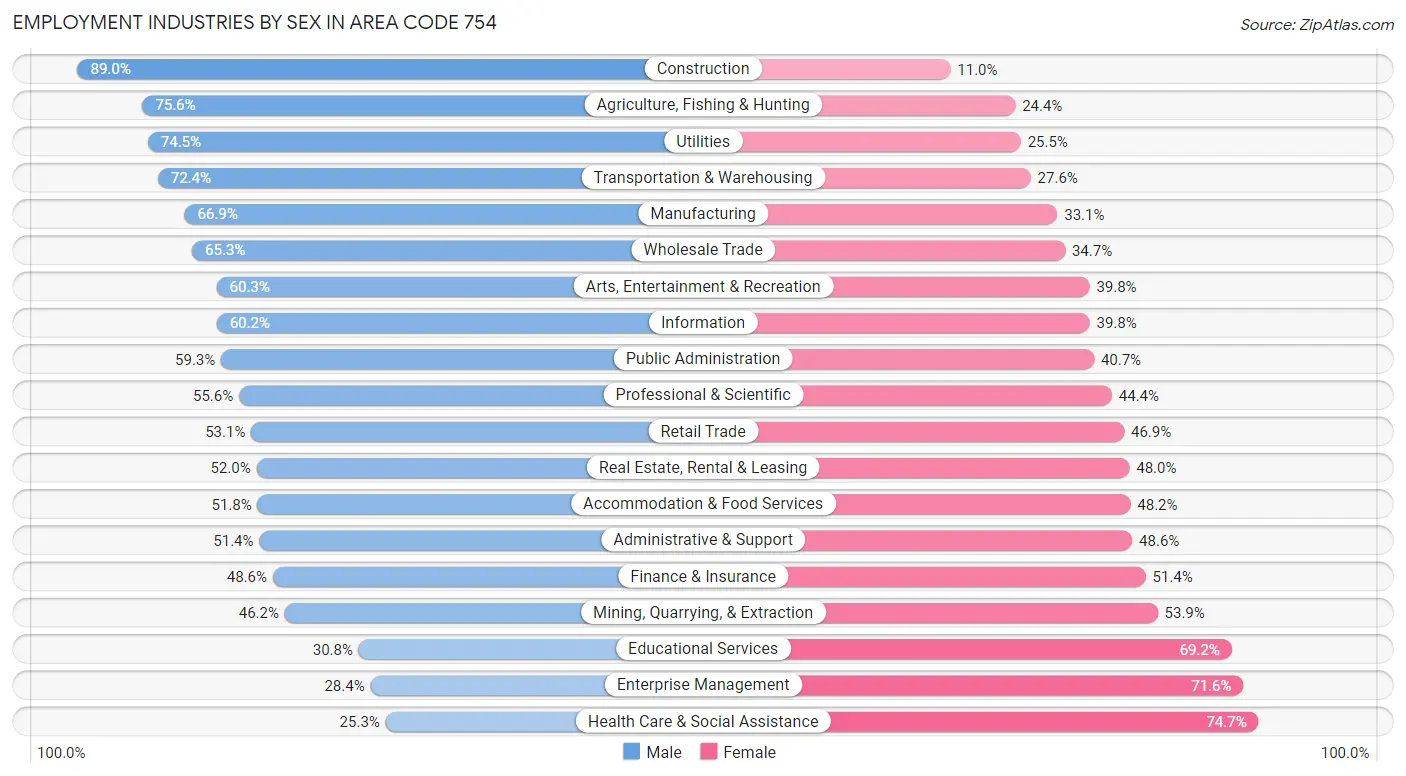
| Industry | Male | Female |
| Agriculture, Fishing & Hunting | 577 (75.6%) | 186 (24.4%) |
| Mining, Quarrying, & Extraction | 30 (46.2%) | 35 (53.8%) |
| Construction | 26,808 (89.0%) | 3,300 (11.0%) |
| Manufacturing | 13,390 (66.9%) | 6,625 (33.1%) |
| Wholesale Trade | 8,082 (65.3%) | 4,290 (34.7%) |
| Retail Trade | 25,262 (53.1%) | 22,322 (46.9%) |
| Transportation & Warehousing | 15,700 (72.4%) | 5,978 (27.6%) |
| Utilities | 1,182 (74.5%) | 405 (25.5%) |
| Information | 4,874 (60.2%) | 3,218 (39.8%) |
| Finance & Insurance | 9,407 (48.6%) | 9,937 (51.4%) |
| Real Estate, Rental & Leasing | 6,146 (52.0%) | 5,674 (48.0%) |
| Professional & Scientific | 20,600 (55.6%) | 16,445 (44.4%) |
| Enterprise Management | 125 (28.4%) | 315 (71.6%) |
| Administrative & Support | 12,955 (51.4%) | 12,243 (48.6%) |
| Educational Services | 8,679 (30.8%) | 19,480 (69.2%) |
| Health Care & Social Assistance | 12,205 (25.3%) | 36,100 (74.7%) |
| Arts, Entertainment & Recreation | 6,450 (60.3%) | 4,256 (39.8%) |
| Accommodation & Food Services | 14,653 (51.8%) | 13,642 (48.2%) |
| Public Administration | 9,115 (59.3%) | 6,250 (40.7%) |
| Total | 206,223 (53.0%) | 182,522 (46.9%) |
Education in Area Code 754
School Enrollment in Area Code 754
The most common levels of schooling among the 175,832 students in Area Code 754 are high school (38,873 | 22.1%), middle school (36,764 | 20.9%), and college / undergraduate (34,937 | 19.9%).
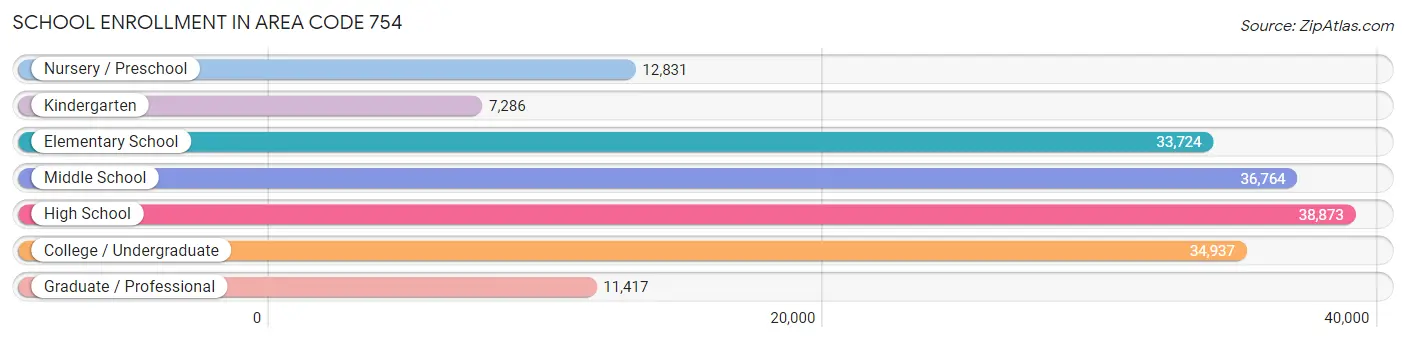
| School Level | # Students | % Students |
| Nursery / Preschool | 12,831 | 7.3% |
| Kindergarten | 7,286 | 4.1% |
| Elementary School | 33,724 | 19.2% |
| Middle School | 36,764 | 20.9% |
| High School | 38,873 | 22.1% |
| College / Undergraduate | 34,937 | 19.9% |
| Graduate / Professional | 11,417 | 6.5% |
| Total | 175,832 | 100.0% |
School Enrollment by Age by Funding Source in Area Code 754
Out of a total of 175,832 students who are enrolled in schools in Area Code 754, 40,185 (22.9%) attend a private institution, while the remaining 135,647 (77.1%) are enrolled in public schools. The age group of 3 to 4 year olds has the highest likelihood of being enrolled in private schools, with 5,550 (52.8% in the age bracket) enrolled. Conversely, the age group of 10 to 14 year olds has the lowest likelihood of being enrolled in a private school, with 38,122 (84.4% in the age bracket) attending a public institution.
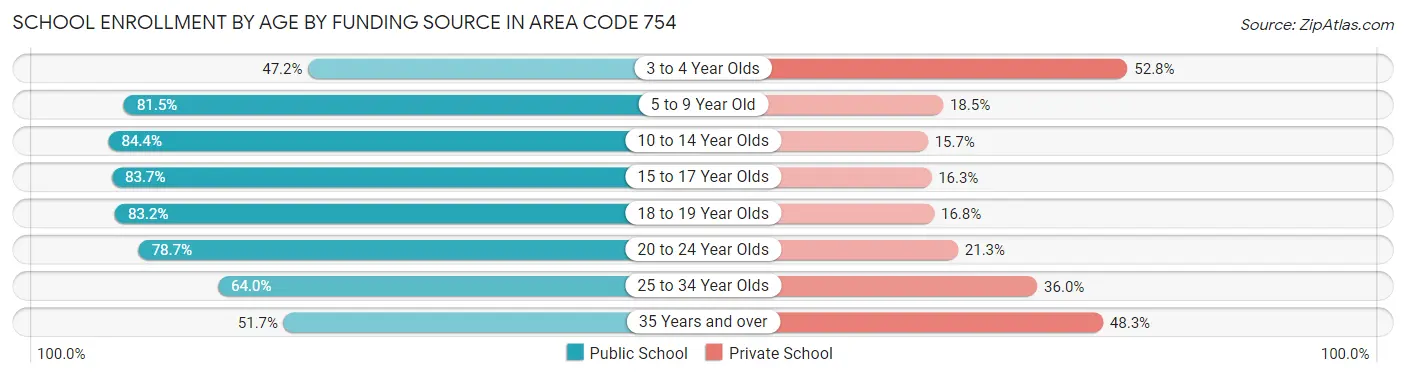
| Age Bracket | Public School | Private School |
| 3 to 4 Year Olds | 4,954 (47.2%) | 5,550 (52.8%) |
| 5 to 9 Year Old | 31,758 (81.5%) | 7,210 (18.5%) |
| 10 to 14 Year Olds | 38,122 (84.4%) | 7,074 (15.7%) |
| 15 to 17 Year Olds | 22,814 (83.7%) | 4,443 (16.3%) |
| 18 to 19 Year Olds | 10,221 (83.2%) | 2,070 (16.8%) |
| 20 to 24 Year Olds | 13,721 (78.7%) | 3,706 (21.3%) |
| 25 to 34 Year Olds | 8,181 (64.0%) | 4,609 (36.0%) |
| 35 Years and over | 5,894 (51.7%) | 5,505 (48.3%) |
| Total | 135,647 (77.1%) | 40,185 (22.9%) |
Educational Attainment by Field of Study in Area Code 754
Business (58,034 | 25.9%), science & technology (22,533 | 10.1%), education (22,155 | 9.9%), engineering (19,605 | 8.7%), and social sciences (16,607 | 7.4%) are the most common fields of study among 224,066 individuals in Area Code 754 who have obtained a bachelor's degree or higher.
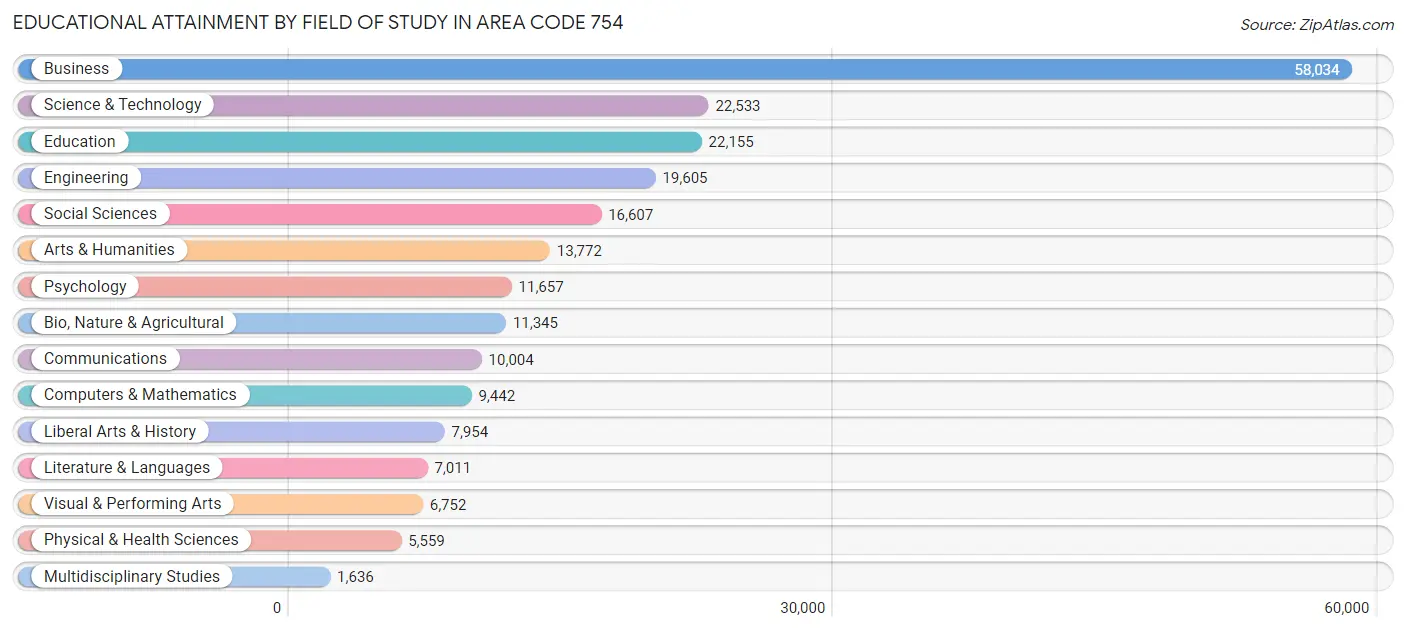
| Field of Study | # Graduates | % Graduates |
| Computers & Mathematics | 9,442 | 4.2% |
| Bio, Nature & Agricultural | 11,345 | 5.1% |
| Physical & Health Sciences | 5,559 | 2.5% |
| Psychology | 11,657 | 5.2% |
| Social Sciences | 16,607 | 7.4% |
| Engineering | 19,605 | 8.7% |
| Multidisciplinary Studies | 1,636 | 0.7% |
| Science & Technology | 22,533 | 10.1% |
| Business | 58,034 | 25.9% |
| Education | 22,155 | 9.9% |
| Literature & Languages | 7,011 | 3.1% |
| Liberal Arts & History | 7,954 | 3.5% |
| Visual & Performing Arts | 6,752 | 3.0% |
| Communications | 10,004 | 4.5% |
| Arts & Humanities | 13,772 | 6.1% |
| Total | 224,066 | 100.0% |
Transportation & Commute in Area Code 754
Vehicle Availability by Sex in Area Code 754
The most prevalent vehicle ownership categories in Area Code 754 are males with 2 vehicles (91,878, accounting for 45.3%) and females with 2 vehicles (76,681, making up 51.4%).
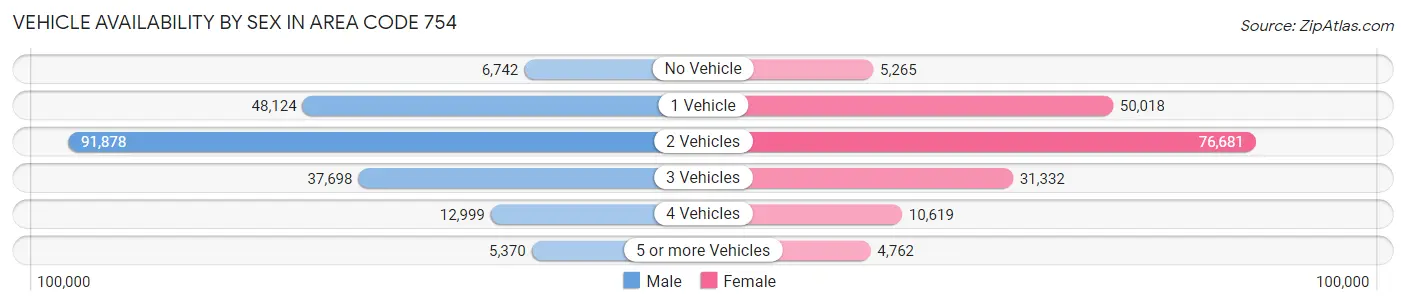
| Vehicles Available | Male | Female |
| No Vehicle | 6,742 (3.3%) | 5,265 (2.9%) |
| 1 Vehicle | 48,124 (23.7%) | 50,018 (28.0%) |
| 2 Vehicles | 91,878 (45.3%) | 76,681 (42.9%) |
| 3 Vehicles | 37,698 (18.6%) | 31,332 (17.5%) |
| 4 Vehicles | 12,999 (6.4%) | 10,619 (5.9%) |
| 5 or more Vehicles | 5,370 (2.6%) | 4,762 (2.7%) |
| Total | 202,811 (100.0%) | 178,677 (100.0%) |
Commute Time in Area Code 754
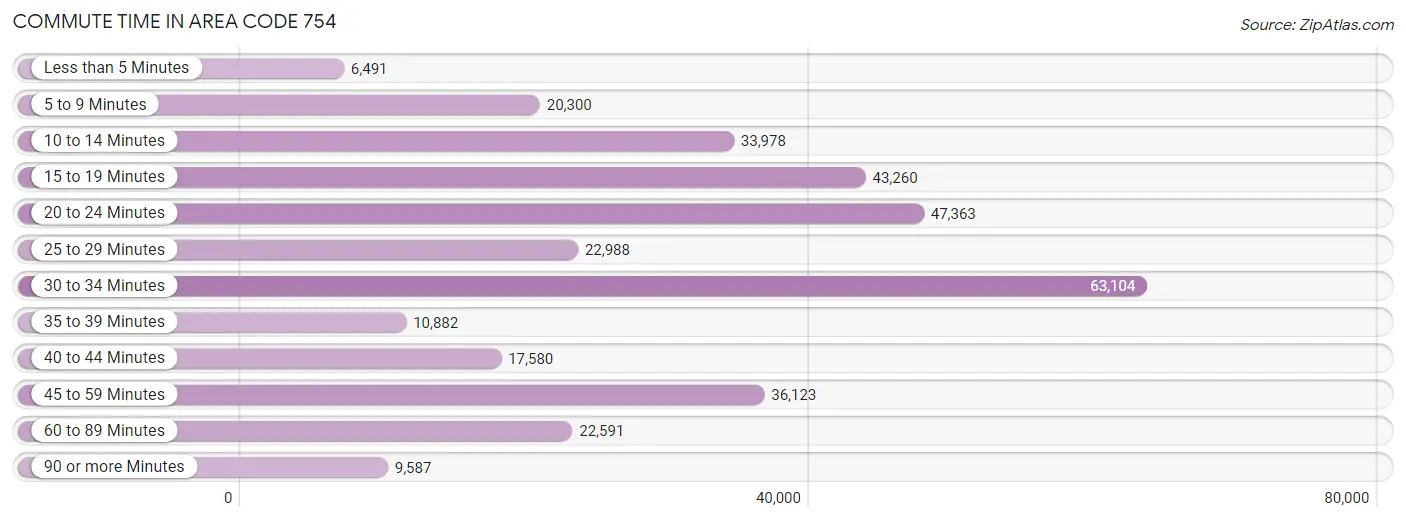
The most frequently occuring commute durations in Area Code 754 are 30 to 34 minutes (63,104 commuters, 18.9%), 20 to 24 minutes (47,363 commuters, 14.2%), and 15 to 19 minutes (43,260 commuters, 12.9%).
| Commute Time | # Commuters | % Commuters |
| Less than 5 Minutes | 6,491 | 1.9% |
| 5 to 9 Minutes | 20,300 | 6.1% |
| 10 to 14 Minutes | 33,978 | 10.2% |
| 15 to 19 Minutes | 43,260 | 12.9% |
| 20 to 24 Minutes | 47,363 | 14.2% |
| 25 to 29 Minutes | 22,988 | 6.9% |
| 30 to 34 Minutes | 63,104 | 18.9% |
| 35 to 39 Minutes | 10,882 | 3.3% |
| 40 to 44 Minutes | 17,580 | 5.3% |
| 45 to 59 Minutes | 36,123 | 10.8% |
| 60 to 89 Minutes | 22,591 | 6.8% |
| 90 or more Minutes | 9,587 | 2.9% |
Commute Time by Sex in Area Code 754
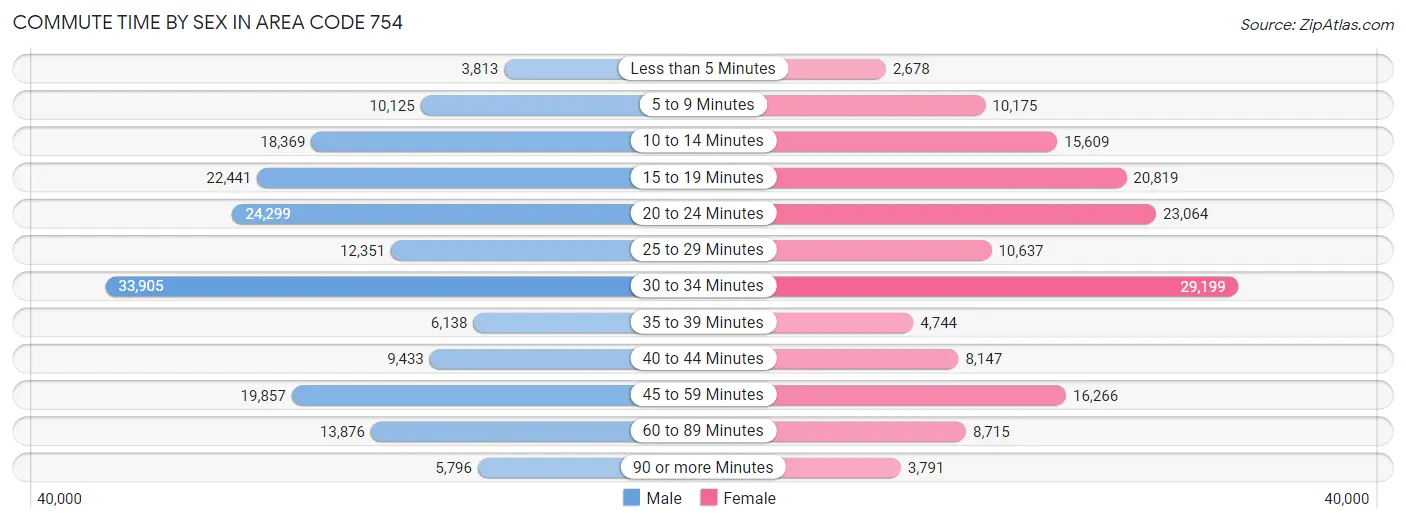
The most common commute times in Area Code 754 are 30 to 34 minutes (33,905 commuters, 18.8%) for males and 30 to 34 minutes (29,199 commuters, 19.0%) for females.
| Commute Time | Male | Female |
| Less than 5 Minutes | 3,813 (2.1%) | 2,678 (1.7%) |
| 5 to 9 Minutes | 10,125 (5.6%) | 10,175 (6.6%) |
| 10 to 14 Minutes | 18,369 (10.2%) | 15,609 (10.2%) |
| 15 to 19 Minutes | 22,441 (12.4%) | 20,819 (13.5%) |
| 20 to 24 Minutes | 24,299 (13.5%) | 23,064 (15.0%) |
| 25 to 29 Minutes | 12,351 (6.9%) | 10,637 (6.9%) |
| 30 to 34 Minutes | 33,905 (18.8%) | 29,199 (19.0%) |
| 35 to 39 Minutes | 6,138 (3.4%) | 4,744 (3.1%) |
| 40 to 44 Minutes | 9,433 (5.2%) | 8,147 (5.3%) |
| 45 to 59 Minutes | 19,857 (11.0%) | 16,266 (10.6%) |
| 60 to 89 Minutes | 13,876 (7.7%) | 8,715 (5.7%) |
| 90 or more Minutes | 5,796 (3.2%) | 3,791 (2.5%) |
Time of Departure to Work by Sex in Area Code 754
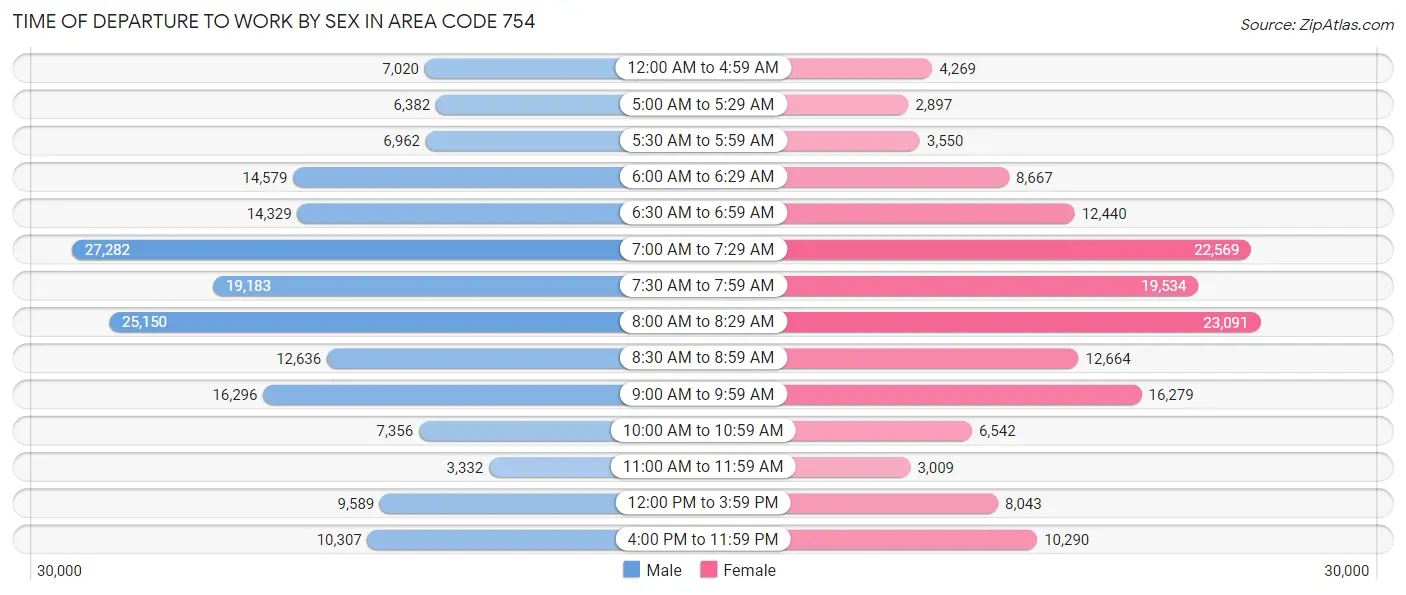
The most frequent times of departure to work in Area Code 754 are 7:00 AM to 7:29 AM (27,282, 15.1%) for males and 8:00 AM to 8:29 AM (23,091, 15.0%) for females.
| Time of Departure | Male | Female |
| 12:00 AM to 4:59 AM | 7,020 (3.9%) | 4,269 (2.8%) |
| 5:00 AM to 5:29 AM | 6,382 (3.5%) | 2,897 (1.9%) |
| 5:30 AM to 5:59 AM | 6,962 (3.9%) | 3,550 (2.3%) |
| 6:00 AM to 6:29 AM | 14,579 (8.1%) | 8,667 (5.6%) |
| 6:30 AM to 6:59 AM | 14,329 (7.9%) | 12,440 (8.1%) |
| 7:00 AM to 7:29 AM | 27,282 (15.1%) | 22,569 (14.7%) |
| 7:30 AM to 7:59 AM | 19,183 (10.6%) | 19,534 (12.7%) |
| 8:00 AM to 8:29 AM | 25,150 (13.9%) | 23,091 (15.0%) |
| 8:30 AM to 8:59 AM | 12,636 (7.0%) | 12,664 (8.2%) |
| 9:00 AM to 9:59 AM | 16,296 (9.0%) | 16,279 (10.6%) |
| 10:00 AM to 10:59 AM | 7,356 (4.1%) | 6,542 (4.3%) |
| 11:00 AM to 11:59 AM | 3,332 (1.8%) | 3,009 (2.0%) |
| 12:00 PM to 3:59 PM | 9,589 (5.3%) | 8,043 (5.2%) |
| 4:00 PM to 11:59 PM | 10,307 (5.7%) | 10,290 (6.7%) |
| Total | 180,403 (100.0%) | 153,844 (100.0%) |
Housing Occupancy in Area Code 754
Occupancy by Ownership in Area Code 754
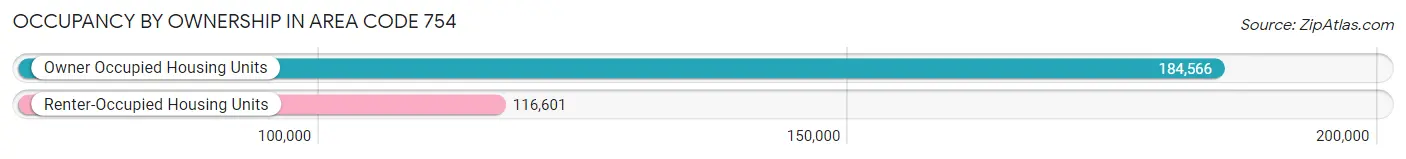
Of the total 301,167 dwellings in Area Code 754, owner-occupied units account for 184,566 (61.3%), while renter-occupied units make up 116,601 (38.7%).
| Occupancy | # Housing Units | % Housing Units |
| Owner Occupied Housing Units | 184,566 | 61.3% |
| Renter-Occupied Housing Units | 116,601 | 38.7% |
| Total Occupied Housing Units | 301,167 | 100.0% |
Occupancy by Household Size in Area Code 754
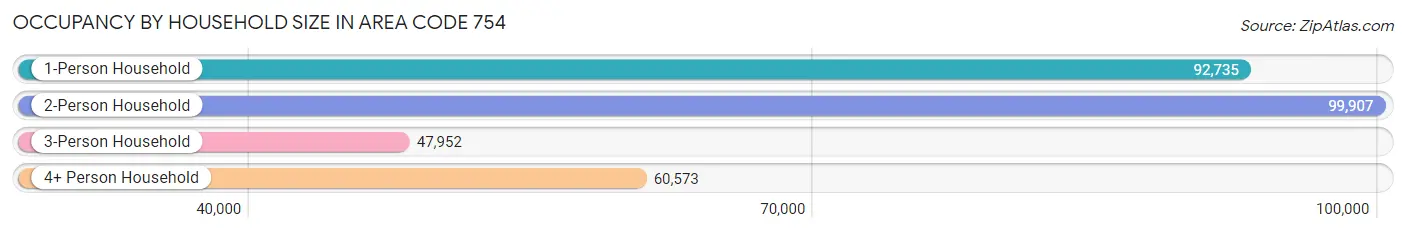
| Household Size | # Housing Units | % Housing Units |
| 1-Person Household | 92,735 | 30.8% |
| 2-Person Household | 99,907 | 33.2% |
| 3-Person Household | 47,952 | 15.9% |
| 4+ Person Household | 60,573 | 20.1% |
| Total Housing Units | 301,167 | 100.0% |
Occupancy by Ownership by Household Size in Area Code 754
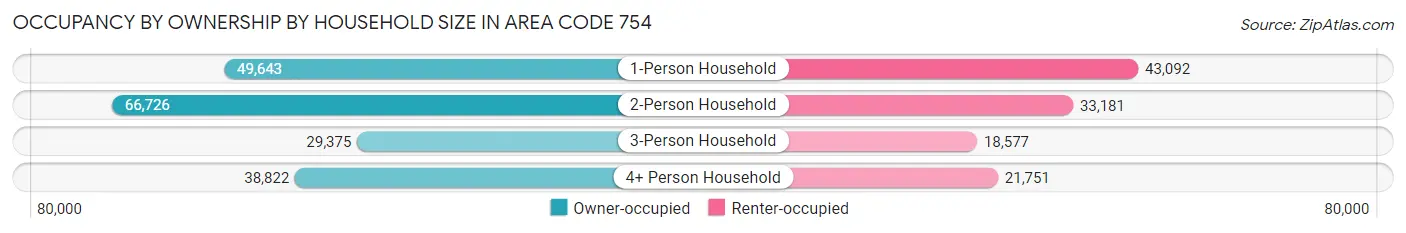
| Household Size | Owner-occupied | Renter-occupied |
| 1-Person Household | 49,643 (53.5%) | 43,092 (46.5%) |
| 2-Person Household | 66,726 (66.8%) | 33,181 (33.2%) |
| 3-Person Household | 29,375 (61.3%) | 18,577 (38.7%) |
| 4+ Person Household | 38,822 (64.1%) | 21,751 (35.9%) |
| Total Housing Units | 184,566 (61.3%) | 116,601 (38.7%) |
Occupancy by Educational Attainment in Area Code 754
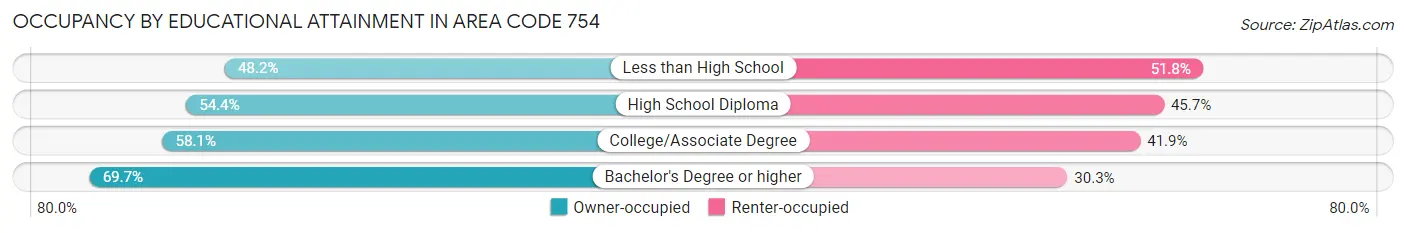
| Household Size | Owner-occupied | Renter-occupied |
| Less than High School | 11,044 (48.2%) | 11,866 (51.8%) |
| High School Diploma | 35,813 (54.3%) | 30,081 (45.7%) |
| College/Associate Degree | 51,494 (58.1%) | 37,128 (41.9%) |
| Bachelor's Degree or higher | 86,215 (69.7%) | 37,526 (30.3%) |
Occupancy by Age of Householder in Area Code 754
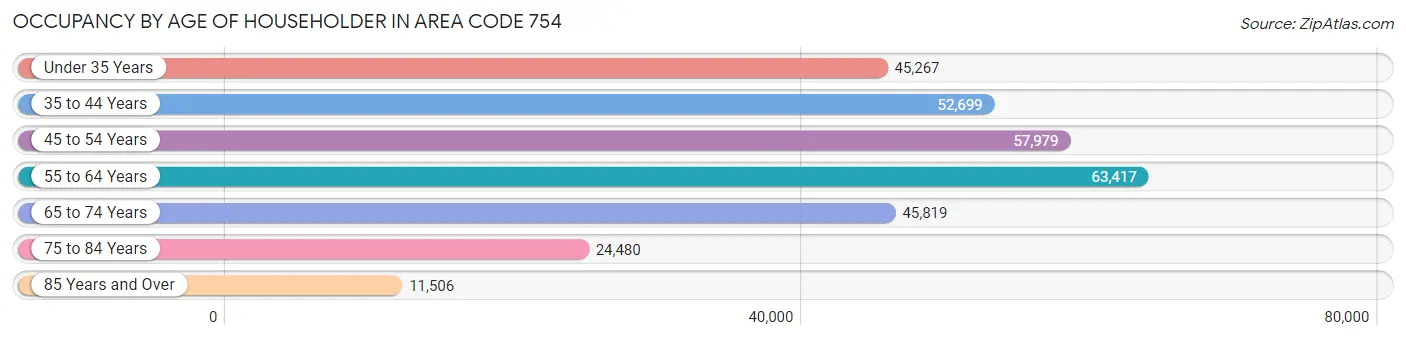
| Age Bracket | # Households | % Households |
| Under 35 Years | 45,267 | 15.0% |
| 35 to 44 Years | 52,699 | 17.5% |
| 45 to 54 Years | 57,979 | 19.3% |
| 55 to 64 Years | 63,417 | 21.1% |
| 65 to 74 Years | 45,819 | 15.2% |
| 75 to 84 Years | 24,480 | 8.1% |
| 85 Years and Over | 11,506 | 3.8% |
| Total | 301,167 | 100.0% |
Housing Finances in Area Code 754
Median Income by Occupancy in Area Code 754
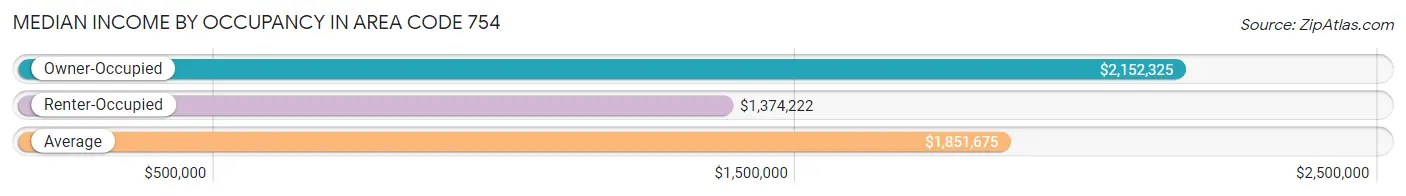
| Occupancy Type | # Households | Median Income |
| Owner-Occupied | 184,566 (61.3%) | $2,152,325 |
| Renter-Occupied | 116,601 (38.7%) | $1,374,222 |
| Average | 301,167 (100.0%) | $1,851,675 |
Occupancy by Householder Income Bracket in Area Code 754
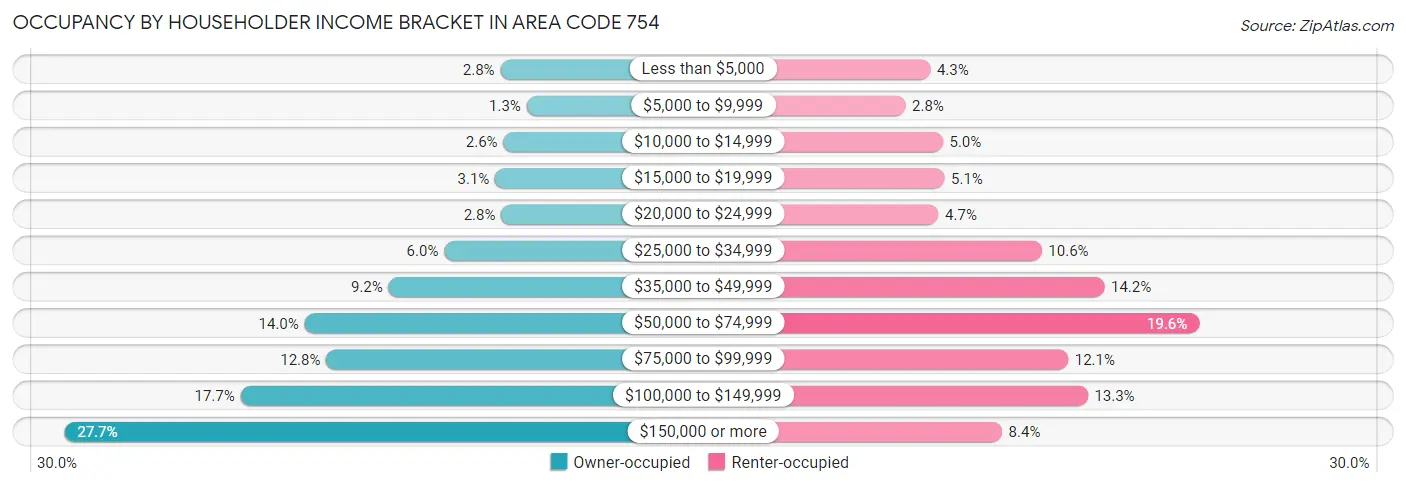
| Income Bracket | Owner-occupied | Renter-occupied |
| Less than $5,000 | 5,192 (2.8%) | 4,955 (4.3%) |
| $5,000 to $9,999 | 2,413 (1.3%) | 3,300 (2.8%) |
| $10,000 to $14,999 | 4,878 (2.6%) | 5,799 (5.0%) |
| $15,000 to $19,999 | 5,731 (3.1%) | 5,895 (5.1%) |
| $20,000 to $24,999 | 5,085 (2.8%) | 5,503 (4.7%) |
| $25,000 to $34,999 | 11,116 (6.0%) | 12,386 (10.6%) |
| $35,000 to $49,999 | 16,981 (9.2%) | 16,557 (14.2%) |
| $50,000 to $74,999 | 25,845 (14.0%) | 22,885 (19.6%) |
| $75,000 to $99,999 | 23,552 (12.8%) | 14,139 (12.1%) |
| $100,000 to $149,999 | 32,596 (17.7%) | 15,445 (13.3%) |
| $150,000 or more | 51,177 (27.7%) | 9,737 (8.4%) |
| Total | 184,566 (100.0%) | 116,601 (100.0%) |
Monthly Housing Cost Tiers in Area Code 754
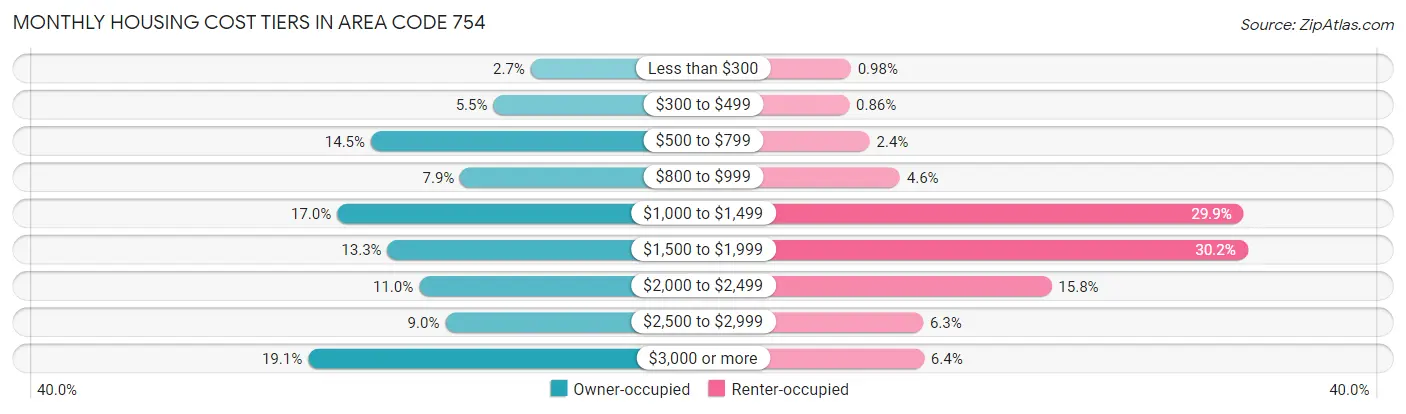
| Monthly Cost | Owner-occupied | Renter-occupied |
| Less than $300 | 5,038 (2.7%) | 1,143 (1.0%) |
| $300 to $499 | 10,112 (5.5%) | 1,007 (0.9%) |
| $500 to $799 | 26,760 (14.5%) | 2,769 (2.4%) |
| $800 to $999 | 14,609 (7.9%) | 5,364 (4.6%) |
| $1,000 to $1,499 | 31,365 (17.0%) | 34,877 (29.9%) |
| $1,500 to $1,999 | 24,515 (13.3%) | 35,217 (30.2%) |
| $2,000 to $2,499 | 20,212 (11.0%) | 18,377 (15.8%) |
| $2,500 to $2,999 | 16,656 (9.0%) | 7,349 (6.3%) |
| $3,000 or more | 35,299 (19.1%) | 7,426 (6.4%) |
| Total | 184,566 (100.0%) | 116,601 (100.0%) |
Physical Housing Characteristics in Area Code 754
Housing Structures in Area Code 754
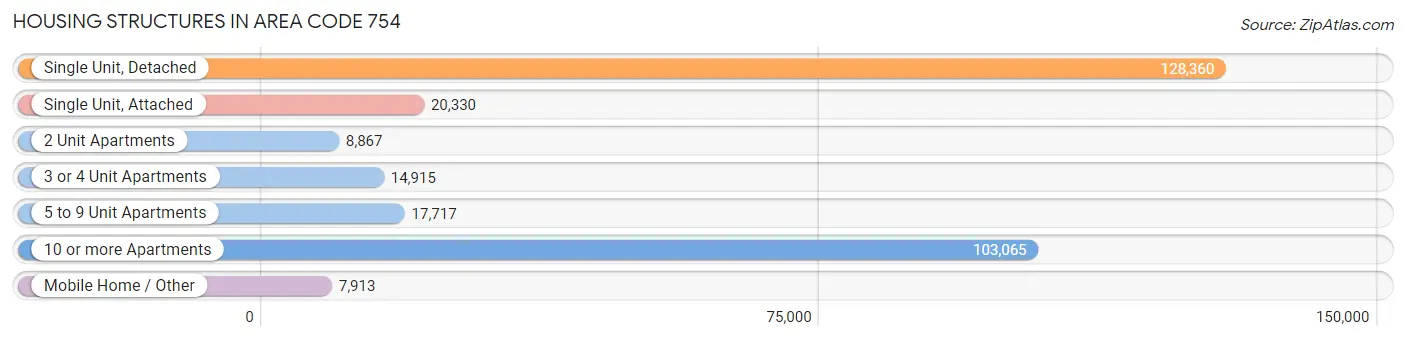
| Structure Type | # Housing Units | % Housing Units |
| Single Unit, Detached | 128,360 | 42.6% |
| Single Unit, Attached | 20,330 | 6.8% |
| 2 Unit Apartments | 8,867 | 2.9% |
| 3 or 4 Unit Apartments | 14,915 | 5.0% |
| 5 to 9 Unit Apartments | 17,717 | 5.9% |
| 10 or more Apartments | 103,065 | 34.2% |
| Mobile Home / Other | 7,913 | 2.6% |
| Total | 301,167 | 100.0% |
Housing Structures by Occupancy in Area Code 754
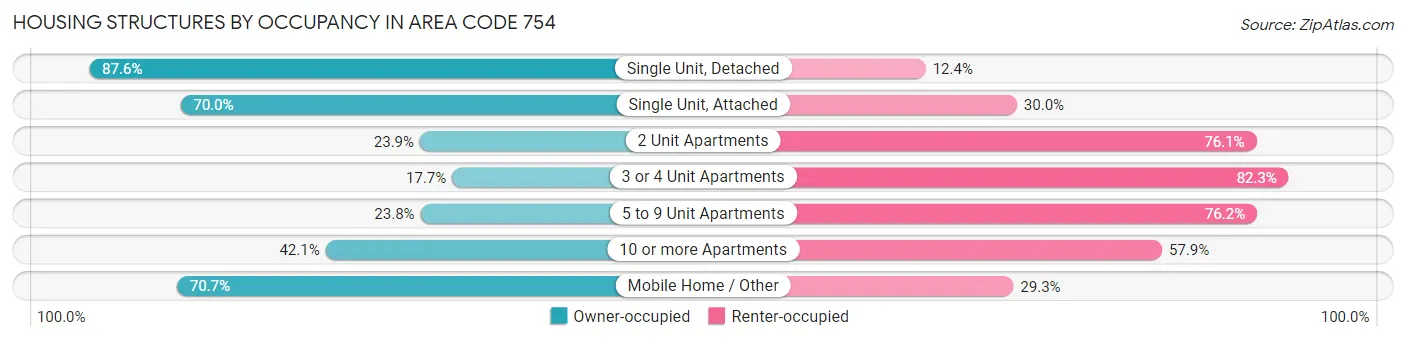
| Structure Type | Owner-occupied | Renter-occupied |
| Single Unit, Detached | 112,406 (87.6%) | 15,954 (12.4%) |
| Single Unit, Attached | 14,234 (70.0%) | 6,096 (30.0%) |
| 2 Unit Apartments | 2,119 (23.9%) | 6,748 (76.1%) |
| 3 or 4 Unit Apartments | 2,638 (17.7%) | 12,277 (82.3%) |
| 5 to 9 Unit Apartments | 4,214 (23.8%) | 13,503 (76.2%) |
| 10 or more Apartments | 43,361 (42.1%) | 59,704 (57.9%) |
| Mobile Home / Other | 5,594 (70.7%) | 2,319 (29.3%) |
| Total | 184,566 (61.3%) | 116,601 (38.7%) |
Housing Structures by Number of Rooms in Area Code 754
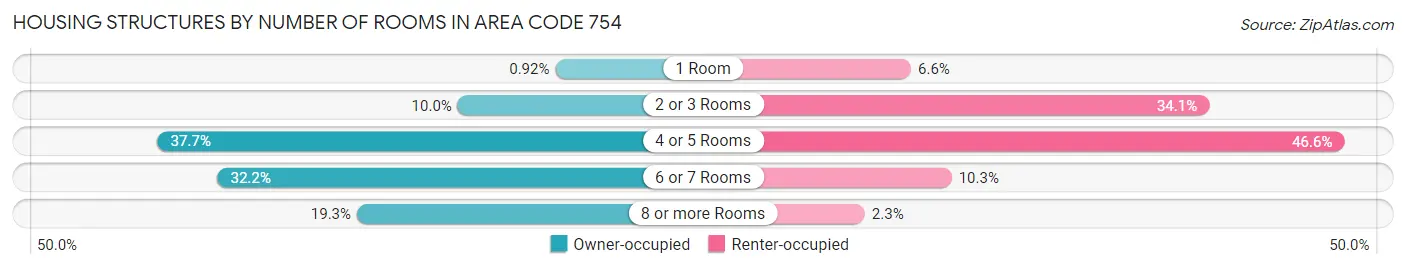
| Number of Rooms | Owner-occupied | Renter-occupied |
| 1 Room | 1,702 (0.9%) | 7,675 (6.6%) |
| 2 or 3 Rooms | 18,373 (10.0%) | 39,794 (34.1%) |
| 4 or 5 Rooms | 69,583 (37.7%) | 54,384 (46.6%) |
| 6 or 7 Rooms | 59,337 (32.2%) | 12,057 (10.3%) |
| 8 or more Rooms | 35,571 (19.3%) | 2,691 (2.3%) |
| Total | 184,566 (100.0%) | 116,601 (100.0%) |
Housing Structure by Heating Type in Area Code 754
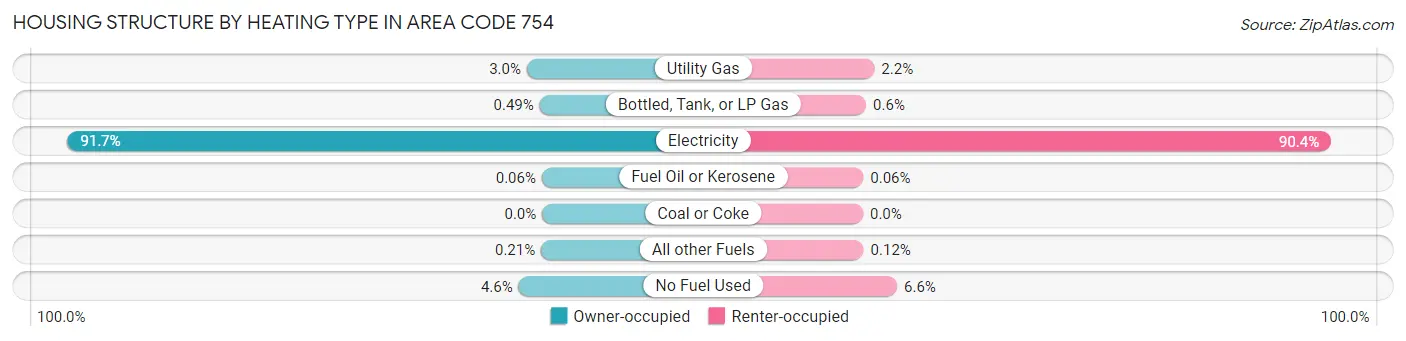
| Heating Type | Owner-occupied | Renter-occupied |
| Utility Gas | 5,458 (3.0%) | 2,569 (2.2%) |
| Bottled, Tank, or LP Gas | 906 (0.5%) | 703 (0.6%) |
| Electricity | 169,301 (91.7%) | 105,442 (90.4%) |
| Fuel Oil or Kerosene | 118 (0.1%) | 67 (0.1%) |
| Coal or Coke | 0 (0.0%) | 5 (0.0%) |
| All other Fuels | 390 (0.2%) | 145 (0.1%) |
| No Fuel Used | 8,393 (4.5%) | 7,670 (6.6%) |
| Total | 184,566 (100.0%) | 116,601 (100.0%) |
Household Vehicle Usage in Area Code 754
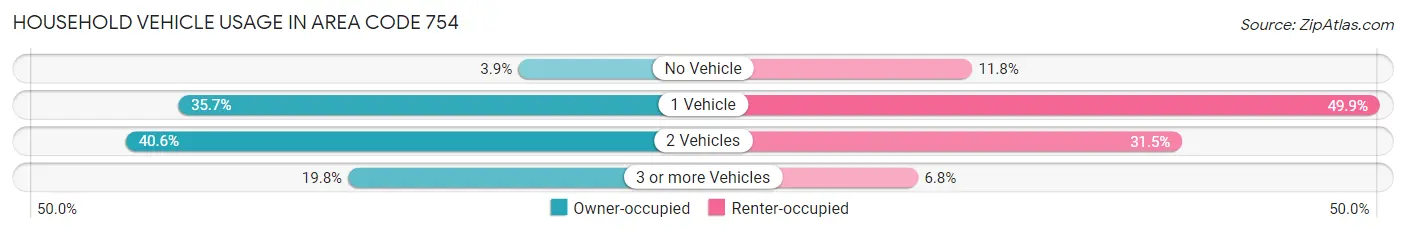
| Vehicles per Household | Owner-occupied | Renter-occupied |
| No Vehicle | 7,276 (3.9%) | 13,785 (11.8%) |
| 1 Vehicle | 65,859 (35.7%) | 58,209 (49.9%) |
| 2 Vehicles | 74,859 (40.6%) | 36,708 (31.5%) |
| 3 or more Vehicles | 36,572 (19.8%) | 7,899 (6.8%) |
| Total | 184,566 (100.0%) | 116,601 (100.0%) |
Real Estate & Mortgages in Area Code 754
Real Estate and Mortgage Overview in Area Code 754
| Characteristic | Without Mortgage | With Mortgage |
| Housing Units | 76,710 | 107,856 |
| Median Property Value | $8,557,900 | $10,048,900 |
| Median Household Income | $1,638,559 | $37,950 |
| Monthly Housing Costs | $20,262 | $33,534 |
| Real Estate Taxes | $84,902 | $3,535 |
Property Value by Mortgage Status in Area Code 754
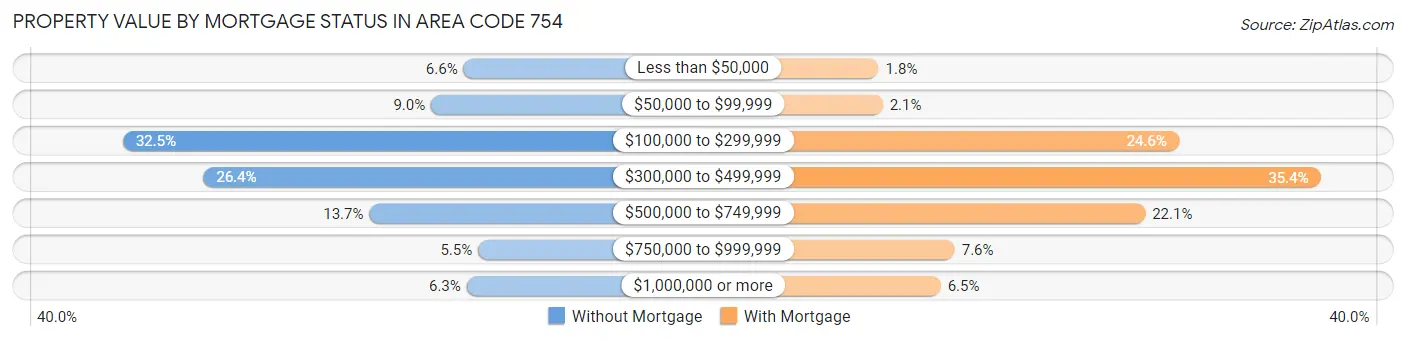
| Property Value | Without Mortgage | With Mortgage |
| Less than $50,000 | 5,032 (6.6%) | 1,901 (1.8%) |
| $50,000 to $99,999 | 6,930 (9.0%) | 2,229 (2.1%) |
| $100,000 to $299,999 | 24,946 (32.5%) | 26,558 (24.6%) |
| $300,000 to $499,999 | 20,234 (26.4%) | 38,205 (35.4%) |
| $500,000 to $749,999 | 10,538 (13.7%) | 23,806 (22.1%) |
| $750,000 to $999,999 | 4,184 (5.4%) | 8,157 (7.6%) |
| $1,000,000 or more | 4,846 (6.3%) | 7,000 (6.5%) |
| Total | 76,710 (100.0%) | 107,856 (100.0%) |
Household Income by Mortgage Status in Area Code 754
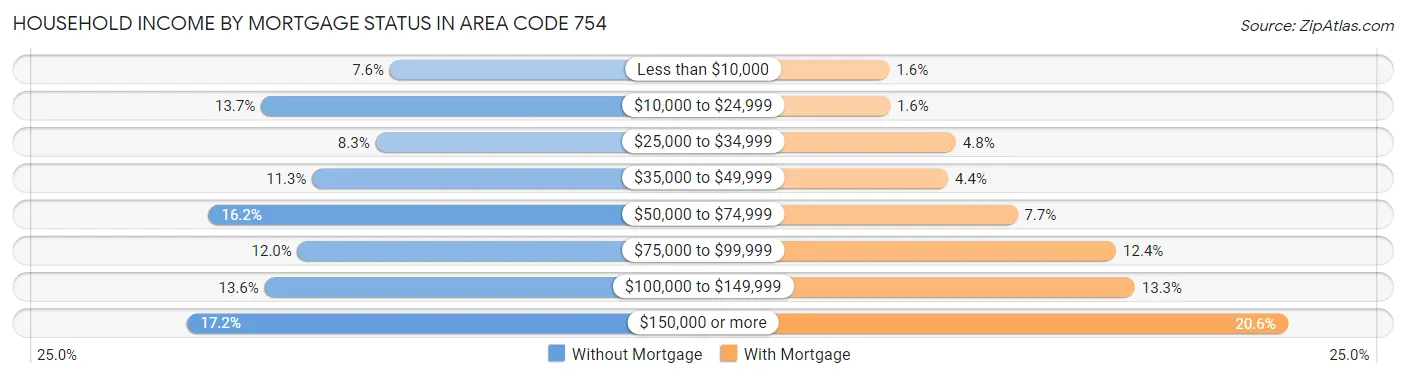
| Household Income | Without Mortgage | With Mortgage |
| Less than $10,000 | 5,839 (7.6%) | 1,742 (1.6%) |
| $10,000 to $24,999 | 10,543 (13.7%) | 1,766 (1.6%) |
| $25,000 to $34,999 | 6,358 (8.3%) | 5,151 (4.8%) |
| $35,000 to $49,999 | 8,666 (11.3%) | 4,758 (4.4%) |
| $50,000 to $74,999 | 12,459 (16.2%) | 8,315 (7.7%) |
| $75,000 to $99,999 | 9,205 (12.0%) | 13,386 (12.4%) |
| $100,000 to $149,999 | 10,413 (13.6%) | 14,347 (13.3%) |
| $150,000 or more | 13,227 (17.2%) | 22,183 (20.6%) |
| Total | 76,710 (100.0%) | 107,856 (100.0%) |
Property Value to Household Income Ratio in Area Code 754
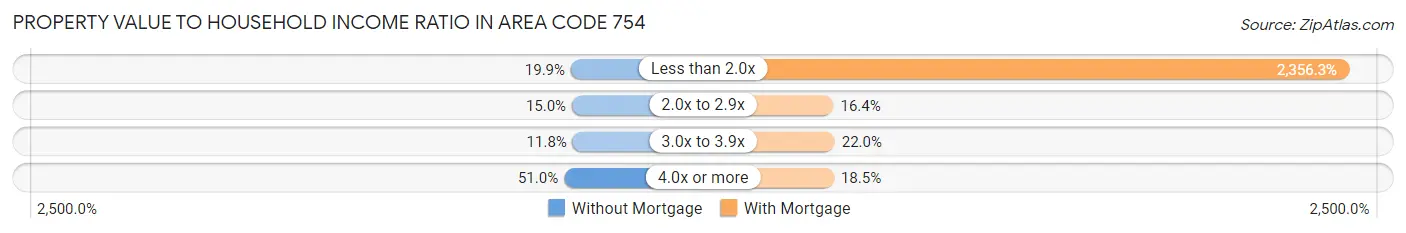
| Value-to-Income Ratio | Without Mortgage | With Mortgage |
| Less than 2.0x | 15,257 (19.9%) | 2,541,456 (2,356.3%) |
| 2.0x to 2.9x | 11,475 (15.0%) | 17,726 (16.4%) |
| 3.0x to 3.9x | 9,013 (11.7%) | 23,725 (22.0%) |
| 4.0x or more | 39,096 (51.0%) | 19,916 (18.5%) |
| Total | 76,710 (100.0%) | 107,856 (100.0%) |
Real Estate Taxes by Mortgage Status in Area Code 754
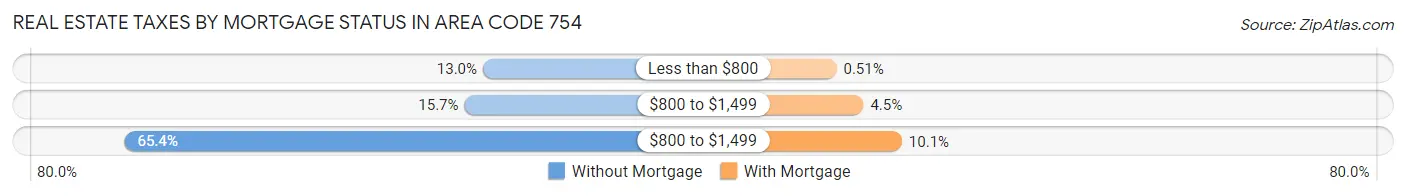
| Property Taxes | Without Mortgage | With Mortgage |
| Less than $800 | 10,005 (13.0%) | 547 (0.5%) |
| $800 to $1,499 | 12,073 (15.7%) | 4,804 (4.4%) |
| $800 to $1,499 | 50,163 (65.4%) | 10,850 (10.1%) |
| Total | 76,710 (100.0%) | 107,856 (100.0%) |
Health & Disability in Area Code 754
Health Insurance Coverage by Age in Area Code 754
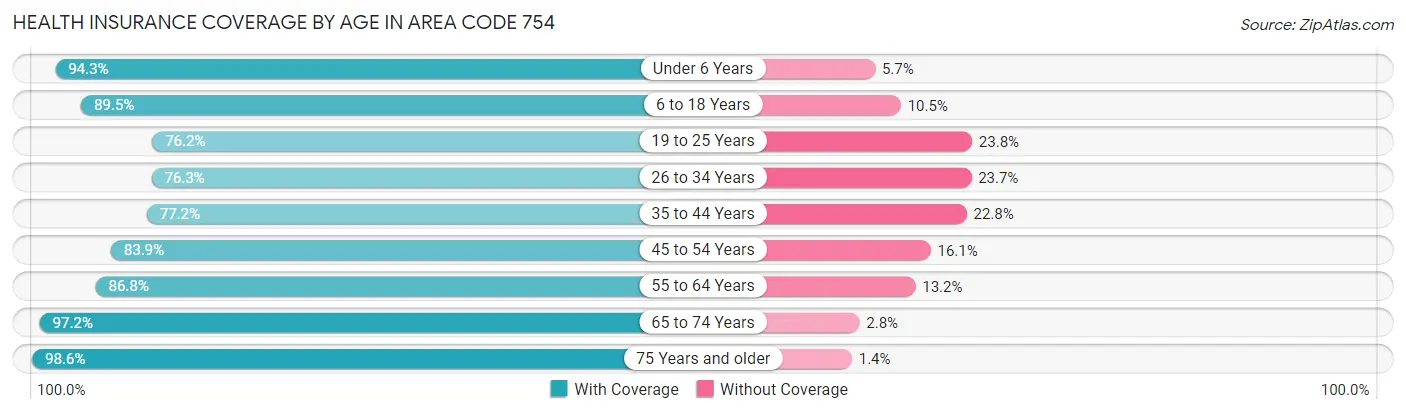
| Age Bracket | With Coverage | Without Coverage |
| Under 6 Years | 46,145 (94.3%) | 2,800 (5.7%) |
| 6 to 18 Years | 104,317 (89.5%) | 12,264 (10.5%) |
| 19 to 25 Years | 44,488 (76.2%) | 13,892 (23.8%) |
| 26 to 34 Years | 68,020 (76.3%) | 21,080 (23.7%) |
| 35 to 44 Years | 76,740 (77.2%) | 22,661 (22.8%) |
| 45 to 54 Years | 88,279 (83.9%) | 16,931 (16.1%) |
| 55 to 64 Years | 93,915 (86.8%) | 14,336 (13.2%) |
| 65 to 74 Years | 72,089 (97.2%) | 2,084 (2.8%) |
| 75 Years and older | 56,933 (98.6%) | 811 (1.4%) |
| Total | 650,926 (85.9%) | 106,859 (14.1%) |
Health Insurance Coverage by Citizenship Status in Area Code 754
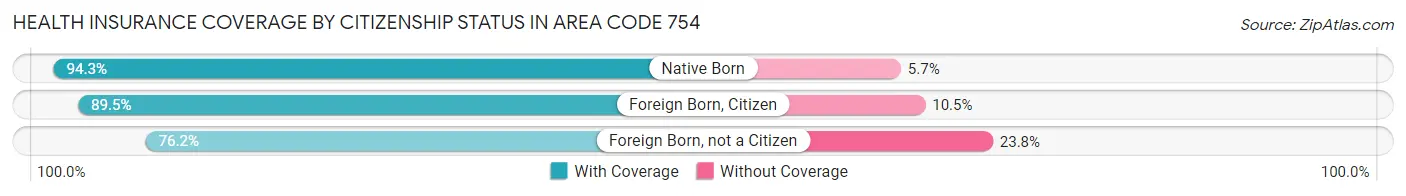
| Citizenship Status | With Coverage | Without Coverage |
| Native Born | 46,145 (94.3%) | 2,800 (5.7%) |
| Foreign Born, Citizen | 104,317 (89.5%) | 12,264 (10.5%) |
| Foreign Born, not a Citizen | 44,488 (76.2%) | 13,892 (23.8%) |
Health Insurance Coverage by Household Income in Area Code 754
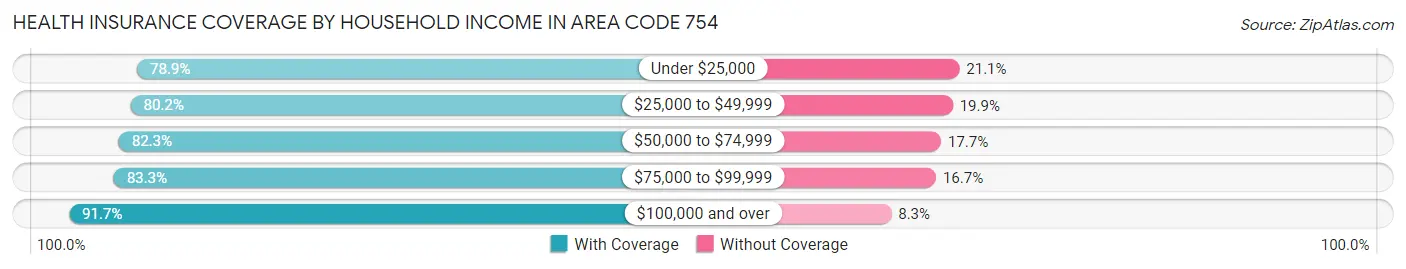
| Household Income | With Coverage | Without Coverage |
| Under $25,000 | 65,237 (78.9%) | 17,433 (21.1%) |
| $25,000 to $49,999 | 94,166 (80.1%) | 23,318 (19.9%) |
| $50,000 to $74,999 | 96,075 (82.3%) | 20,600 (17.7%) |
| $75,000 to $99,999 | 84,176 (83.3%) | 16,887 (16.7%) |
| $100,000 and over | 309,929 (91.7%) | 28,155 (8.3%) |
Public vs Private Health Insurance Coverage by Age in Area Code 754
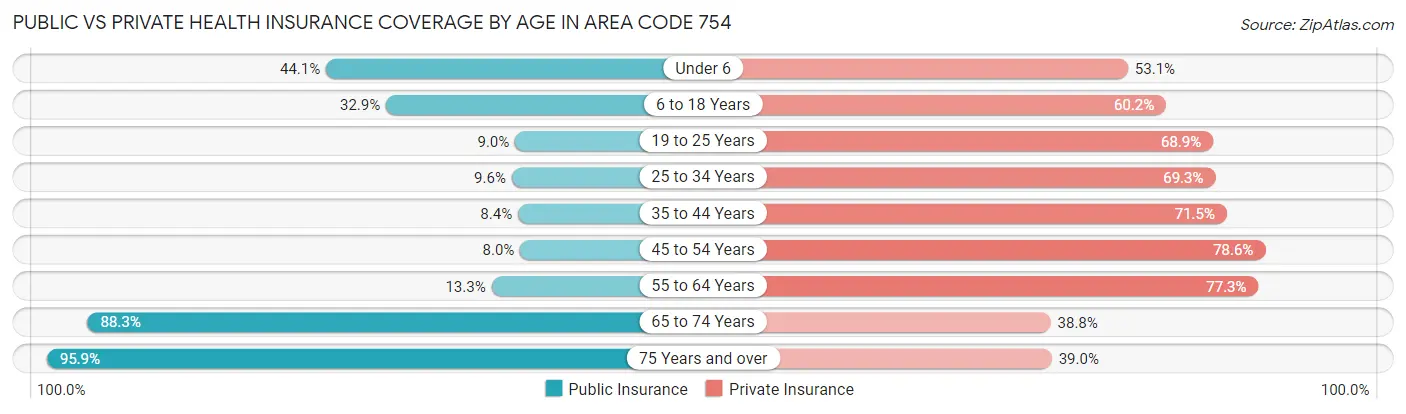
| Age Bracket | Public Insurance | Private Insurance |
| Under 6 | 21,559 (44.1%) | 25,995 (53.1%) |
| 6 to 18 Years | 38,369 (32.9%) | 70,160 (60.2%) |
| 19 to 25 Years | 5,224 (8.9%) | 40,224 (68.9%) |
| 25 to 34 Years | 8,538 (9.6%) | 61,764 (69.3%) |
| 35 to 44 Years | 8,369 (8.4%) | 71,035 (71.5%) |
| 45 to 54 Years | 8,427 (8.0%) | 82,674 (78.6%) |
| 55 to 64 Years | 14,438 (13.3%) | 83,692 (77.3%) |
| 65 to 74 Years | 65,506 (88.3%) | 28,746 (38.8%) |
| 75 Years and over | 55,359 (95.9%) | 22,502 (39.0%) |
| Total | 225,789 (29.8%) | 486,792 (64.2%) |
Disability Status by Sex by Age in Area Code 754
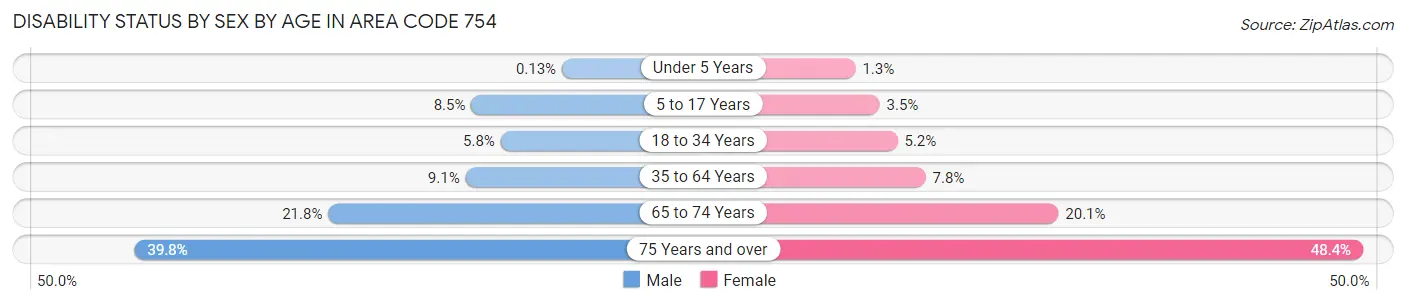
| Age Bracket | Male | Female |
| Under 5 Years | 27 (0.1%) | 259 (1.3%) |
| 5 to 17 Years | 5,017 (8.5%) | 1,979 (3.5%) |
| 18 to 34 Years | 4,650 (5.8%) | 3,964 (5.2%) |
| 35 to 64 Years | 14,003 (9.1%) | 12,329 (7.8%) |
| 65 to 74 Years | 7,867 (21.8%) | 7,659 (20.1%) |
| 75 Years and over | 9,940 (39.8%) | 15,852 (48.4%) |
Disability Class by Sex by Age in Area Code 754
Disability Class: Hearing Difficulty
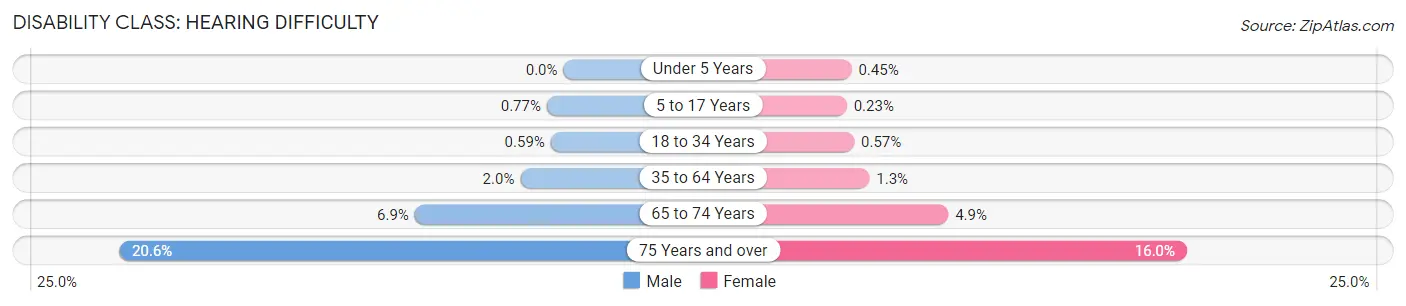
| Age Bracket | Male | Female |
| Under 5 Years | 0 (0.0%) | 91 (0.4%) |
| 5 to 17 Years | 454 (0.8%) | 127 (0.2%) |
| 18 to 34 Years | 468 (0.6%) | 439 (0.6%) |
| 35 to 64 Years | 3,091 (2.0%) | 2,028 (1.3%) |
| 65 to 74 Years | 2,488 (6.9%) | 1,884 (4.9%) |
| 75 Years and over | 5,149 (20.6%) | 5,249 (16.0%) |
Disability Class: Vision Difficulty
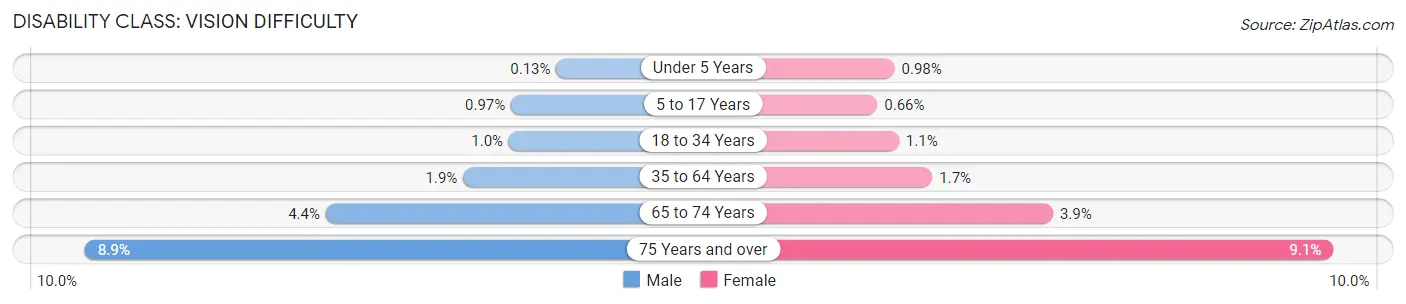
| Age Bracket | Male | Female |
| Under 5 Years | 27 (0.1%) | 199 (1.0%) |
| 5 to 17 Years | 569 (1.0%) | 374 (0.7%) |
| 18 to 34 Years | 806 (1.0%) | 811 (1.1%) |
| 35 to 64 Years | 2,873 (1.9%) | 2,664 (1.7%) |
| 65 to 74 Years | 1,592 (4.4%) | 1,494 (3.9%) |
| 75 Years and over | 2,217 (8.9%) | 2,990 (9.1%) |
Disability Class: Cognitive Difficulty
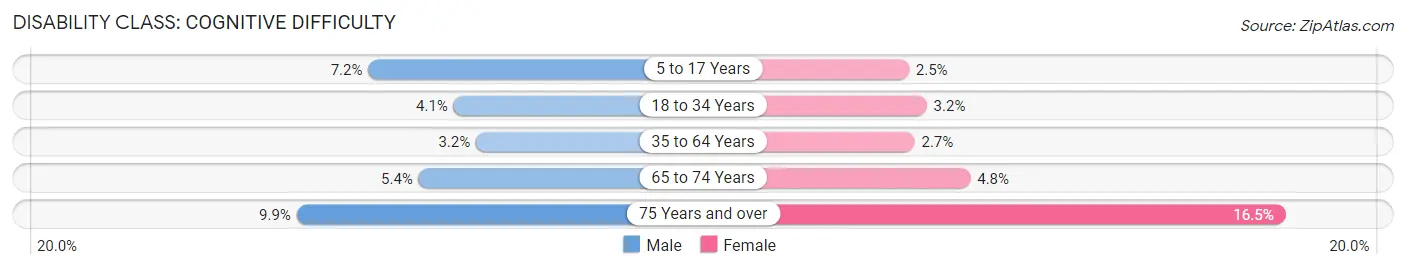
| Age Bracket | Male | Female |
| 5 to 17 Years | 4,254 (7.2%) | 1,403 (2.5%) |
| 18 to 34 Years | 3,249 (4.1%) | 2,411 (3.2%) |
| 35 to 64 Years | 5,005 (3.2%) | 4,286 (2.7%) |
| 65 to 74 Years | 1,937 (5.4%) | 1,819 (4.8%) |
| 75 Years and over | 2,472 (9.9%) | 5,398 (16.5%) |
Disability Class: Ambulatory Difficulty
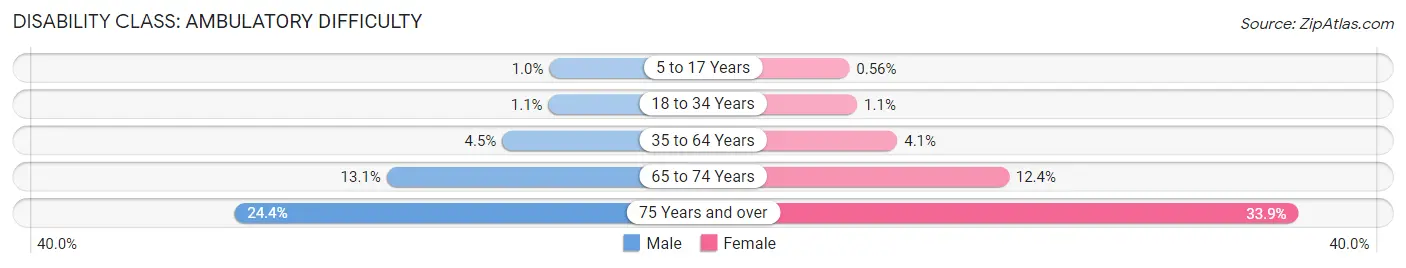
| Age Bracket | Male | Female |
| 5 to 17 Years | 613 (1.0%) | 314 (0.6%) |
| 18 to 34 Years | 883 (1.1%) | 877 (1.1%) |
| 35 to 64 Years | 7,003 (4.5%) | 6,527 (4.1%) |
| 65 to 74 Years | 4,731 (13.1%) | 4,724 (12.4%) |
| 75 Years and over | 6,100 (24.4%) | 11,113 (33.9%) |
Disability Class: Self-Care Difficulty
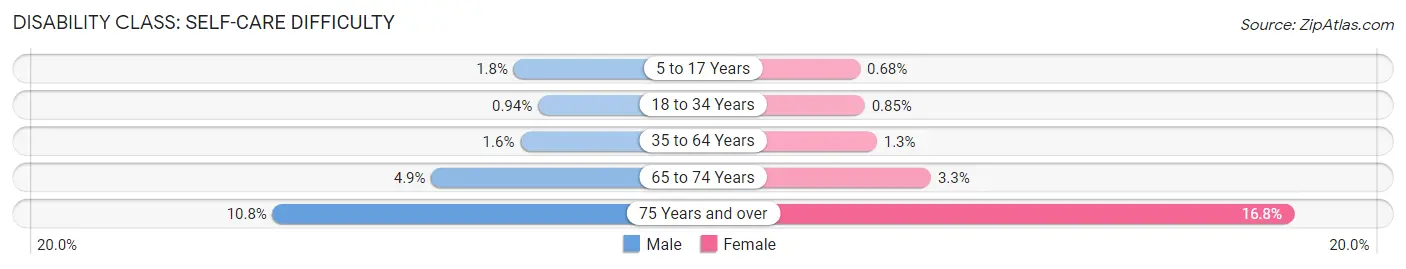
| Age Bracket | Male | Female |
| 5 to 17 Years | 1,082 (1.8%) | 383 (0.7%) |
| 18 to 34 Years | 748 (0.9%) | 650 (0.9%) |
| 35 to 64 Years | 2,472 (1.6%) | 2,054 (1.3%) |
| 65 to 74 Years | 1,768 (4.9%) | 1,262 (3.3%) |
| 75 Years and over | 2,694 (10.8%) | 5,501 (16.8%) |
Technology Access in Area Code 754
Computing Device Access in Area Code 754
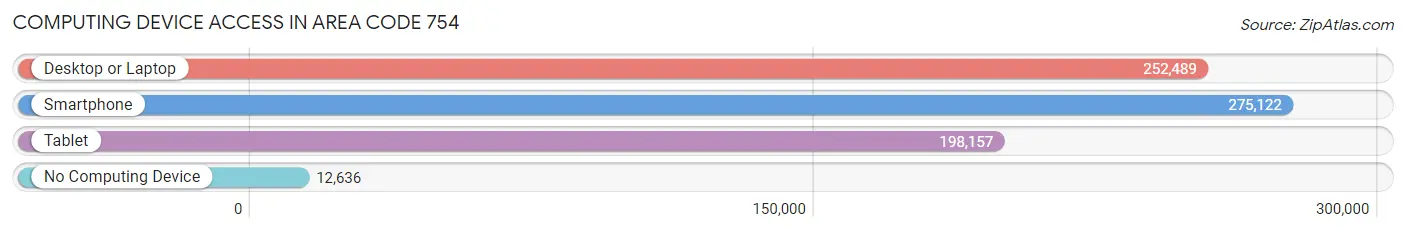
| Device Type | # Households | % Households |
| Desktop or Laptop | 252,489 | 83.8% |
| Smartphone | 275,122 | 91.3% |
| Tablet | 198,157 | 65.8% |
| No Computing Device | 12,636 | 4.2% |
| Total | 301,167 | 100.0% |
Internet Access in Area Code 754
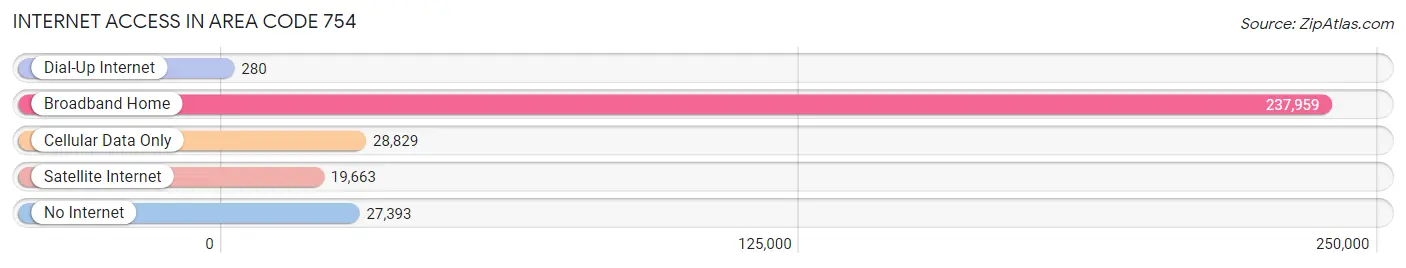
| Internet Type | # Households | % Households |
| Dial-Up Internet | 280 | 0.1% |
| Broadband Home | 237,959 | 79.0% |
| Cellular Data Only | 28,829 | 9.6% |
| Satellite Internet | 19,663 | 6.5% |
| No Internet | 27,393 | 9.1% |
| Total | 301,167 | 100.0% |
Area Code 754 Summary
Geography
Area code 754 is located in the state of Florida and covers the Fort Lauderdale metropolitan area. It includes the cities of Fort Lauderdale, Hollywood, Pompano Beach, and Davie.
Social
Area code 754 is a vibrant and diverse area with a variety of cultural attractions. The area is home to a number of museums, galleries, and performing arts venues, as well as a variety of restaurants and nightlife.
Economics
Area code 754 is a major economic hub in South Florida. The area is home to a number of large corporations, including AutoNation, Citrix Systems, and Spirit Airlines. The area also has a thriving tourism industry, with a number of popular beaches and attractions.
Demographics
Area code 754 is home to a diverse population, with a large Hispanic population and a significant African-American population. The area also has a large number of immigrants from Latin America, the Caribbean, and other parts of the world. The median household income in the area is $50,000.
Common Questions
What is Per Capita Income in Area Code 754?
Per Capita income in Area Code 754 is $47,503.
What is the Median Family Income in Area Code 754?
Median Family Income in Area Code 754 is $99,768.
What is the Median Household income in Area Code 754?
Median Household Income in Area Code 754 is $84,167.
What is Income or Wage Gap in Area Code 754?
Income or Wage Gap in Area Code 754 is 21.3%.
Women in Area Code 754 earn 78.7 cents for every dollar earned by a man.
What is Family Income Deficit in Area Code 754?
Family Income Deficit in Area Code 754 is $9,994.
Families that are below poverty line in Area Code 754 earn $9,994 less on average than the poverty threshold level.
What is Inequality or Gini Index in Area Code 754?
Inequality or Gini Index in Area Code 754 is 10.20.
What is the Total Population of Area Code 754?
Total Population of Area Code 754 is 765,992.
What is the Total Male Population of Area Code 754?
Total Male Population of Area Code 754 is 380,519.
What is the Total Female Population of Area Code 754?
Total Female Population of Area Code 754 is 385,473.
What is the Ratio of Males per 100 Females in Area Code 754?
There are 98.71 Males per 100 Females in Area Code 754.
What is the Ratio of Females per 100 Males in Area Code 754?
There are 101.30 Females per 100 Males in Area Code 754.
What is the Median Population Age in Area Code 754?
Median Population Age in Area Code 754 is 43.1 Years.
What is the Average Family Size in Area Code 754
Average Family Size in Area Code 754 is 3.1 People.
What is the Average Household Size in Area Code 754
Average Household Size in Area Code 754 is 2.5 People.
How Large is the Labor Force in Area Code 754?
There are 409,411 People in the Labor Forcein in Area Code 754.
What is the Percentage of People in the Labor Force in Area Code 754?
65.2% of People are in the Labor Force in Area Code 754.
What is the Unemployment Rate in Area Code 754?
Unemployment Rate in Area Code 754 is 6.1%.