Area Code 305 Map & Demographics
Area Code 305 Map
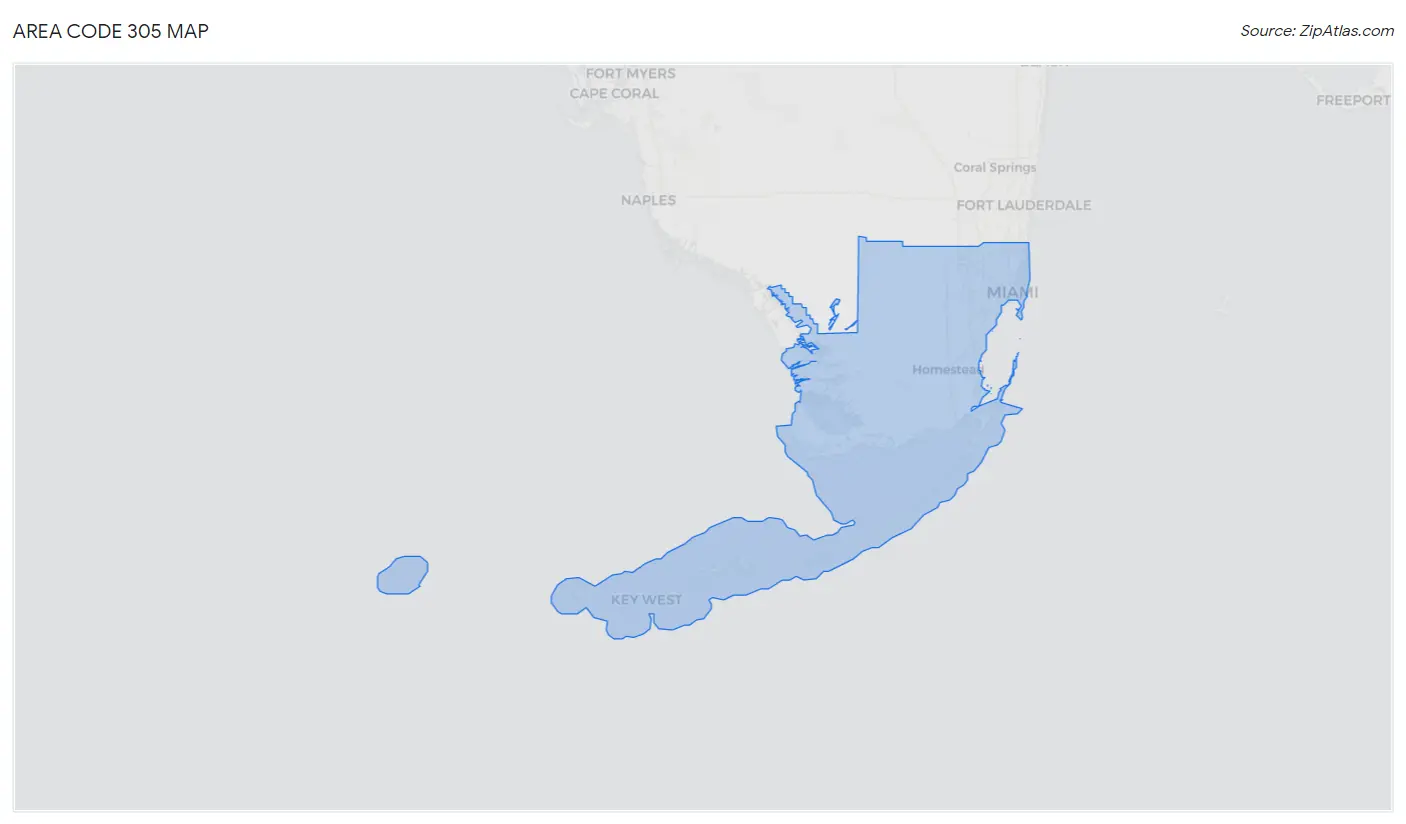
Area Code 305 Overview
$45,746
PER CAPITA INCOME
$84,362
AVG FAMILY INCOME
$71,077
AVG HOUSEHOLD INCOME
22.9%
WAGE / INCOME GAP [ % ]
77.1¢/ $1
WAGE / INCOME GAP [ $ ]
$9,856
FAMILY INCOME DEFICIT
34.75
INEQUALITY / GINI INDEX
2,325,716
TOTAL POPULATION
1,145,700
MALE POPULATION
1,180,016
FEMALE POPULATION
97.09
MALES / 100 FEMALES
103.00
FEMALES / 100 MALES
41.3
MEDIAN AGE
3.2
AVG FAMILY SIZE
2.6
AVG HOUSEHOLD SIZE
1,214,645
LABOR FORCE [ PEOPLE ]
63.3%
PERCENT IN LABOR FORCE
4.7%
UNEMPLOYMENT RATE
Income in Area Code 305
Income Overview in Area Code 305
Per Capita Income in Area Code 305 is $45,746, while median incomes of families and households are $84,362 and $71,077 respectively.
| Characteristic | Number | Measure |
| Per Capita Income | 2,325,716 | $45,746 |
| Median Family Income | 554,514 | $84,362 |
| Mean Family Income | 554,514 | $9,322,952 |
| Median Household Income | 850,995 | $71,077 |
| Mean Household Income | 850,995 | $8,055,495 |
| Income Deficit | 554,514 | $9,856 |
| Wage / Income Gap (%) | 2,325,716 | 22.95% |
| Wage / Income Gap ($) | 2,325,716 | 77.05¢ per $1 |
| Gini / Inequality Index | 2,325,716 | 34.75 |
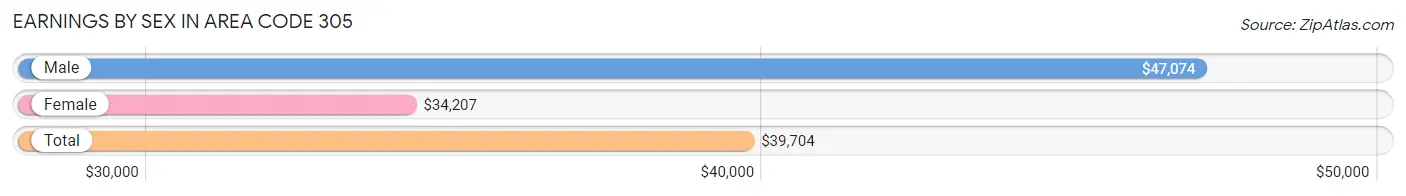
Earnings by Sex in Area Code 305
Average Earnings in Area Code 305 are $39,704, $47,074 for men and $34,207 for women, a difference of 27.3%.
| Sex | Number | Average Earnings |
| Male | 663,382 (53.4%) | $47,074 |
| Female | 579,669 (46.6%) | $34,207 |
| Total | 1,243,051 (100.0%) | $39,704 |
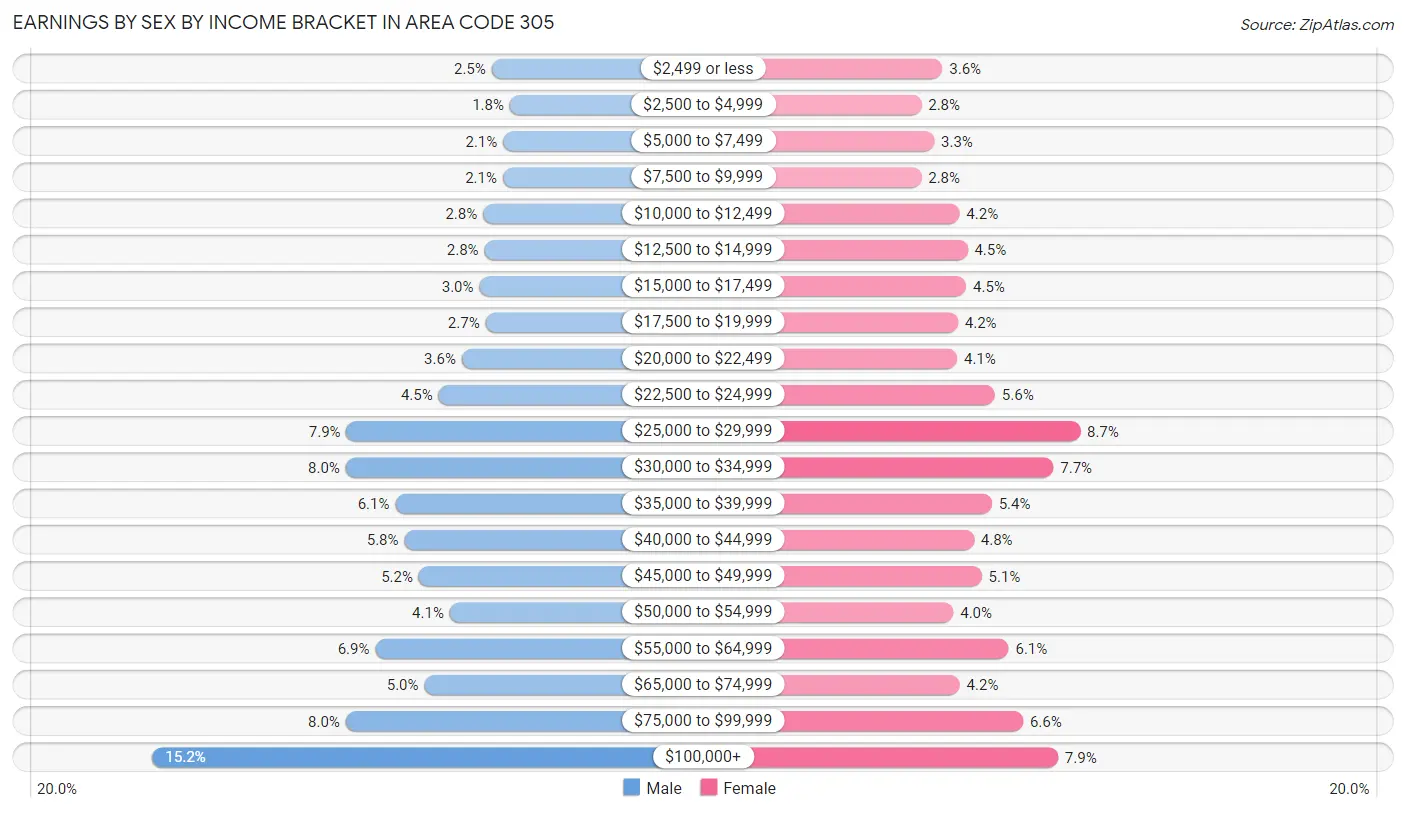
Earnings by Sex by Income Bracket in Area Code 305
The most common earnings brackets in Area Code 305 are $100,000+ for men (100,877 | 15.2%) and $25,000 to $29,999 for women (50,672 | 8.7%).
| Income | Male | Female |
| $2,499 or less | 16,567 (2.5%) | 20,777 (3.6%) |
| $2,500 to $4,999 | 12,070 (1.8%) | 16,184 (2.8%) |
| $5,000 to $7,499 | 13,718 (2.1%) | 18,983 (3.3%) |
| $7,500 to $9,999 | 13,815 (2.1%) | 16,171 (2.8%) |
| $10,000 to $12,499 | 18,711 (2.8%) | 24,479 (4.2%) |
| $12,500 to $14,999 | 18,395 (2.8%) | 26,186 (4.5%) |
| $15,000 to $17,499 | 19,633 (3.0%) | 25,891 (4.5%) |
| $17,500 to $19,999 | 18,093 (2.7%) | 24,095 (4.2%) |
| $20,000 to $22,499 | 24,009 (3.6%) | 23,967 (4.1%) |
| $22,500 to $24,999 | 29,779 (4.5%) | 32,190 (5.6%) |
| $25,000 to $29,999 | 52,658 (7.9%) | 50,672 (8.7%) |
| $30,000 to $34,999 | 52,888 (8.0%) | 44,864 (7.7%) |
| $35,000 to $39,999 | 40,538 (6.1%) | 31,470 (5.4%) |
| $40,000 to $44,999 | 38,248 (5.8%) | 27,566 (4.8%) |
| $45,000 to $49,999 | 34,718 (5.2%) | 29,276 (5.1%) |
| $50,000 to $54,999 | 26,993 (4.1%) | 23,119 (4.0%) |
| $55,000 to $64,999 | 45,517 (6.9%) | 35,144 (6.1%) |
| $65,000 to $74,999 | 33,292 (5.0%) | 24,502 (4.2%) |
| $75,000 to $99,999 | 52,863 (8.0%) | 38,260 (6.6%) |
| $100,000+ | 100,877 (15.2%) | 45,873 (7.9%) |
| Total | 663,382 (100.0%) | 579,669 (100.0%) |
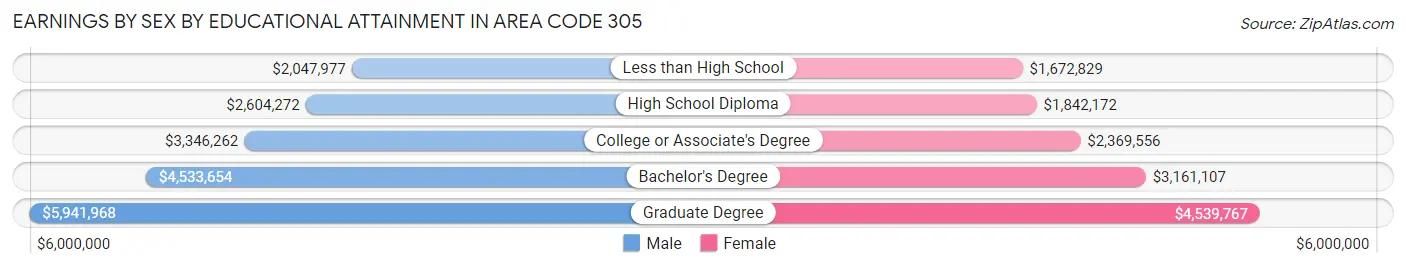
Earnings by Sex by Educational Attainment in Area Code 305
Average earnings in Area Code 305 are $3,694,758 for men and $2,622,626 for women, a difference of 29.0%. Men with an educational attainment of graduate degree enjoy the highest average annual earnings of $5,941,968, while those with less than high school education earn the least with $2,047,977. Women with an educational attainment of graduate degree earn the most with the average annual earnings of $4,539,767, while those with less than high school education have the smallest earnings of $1,672,829.
| Educational Attainment | Male Income | Female Income |
| Less than High School | $2,047,977 | $1,672,829 |
| High School Diploma | $2,604,272 | $1,842,172 |
| College or Associate's Degree | $3,346,262 | $2,369,556 |
| Bachelor's Degree | $4,533,654 | $3,161,107 |
| Graduate Degree | $5,941,968 | $4,539,767 |
| Total | $3,694,758 | $2,622,626 |
Family Income in Area Code 305
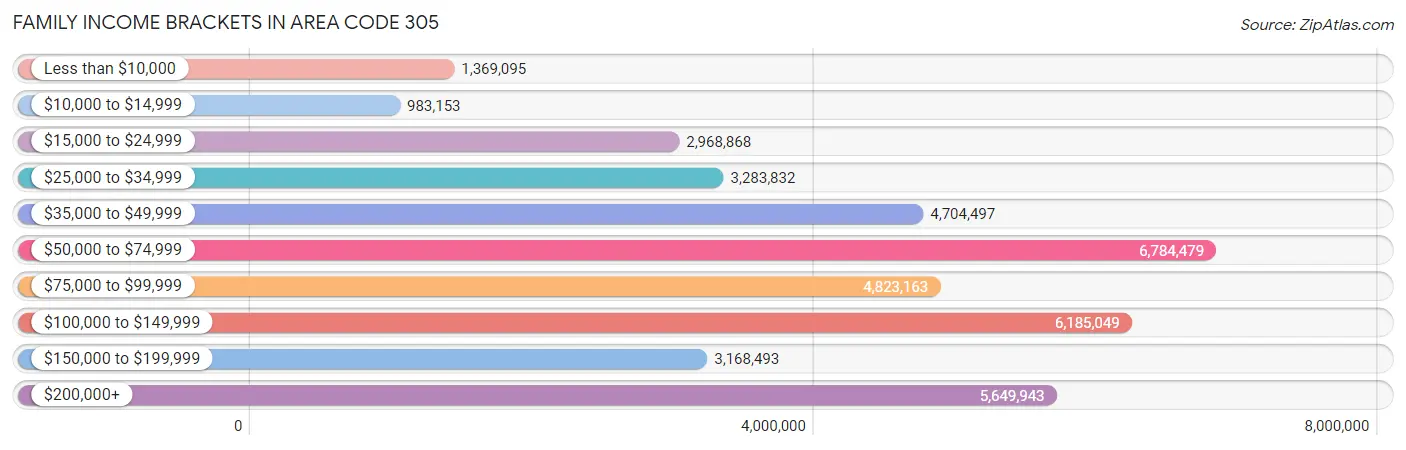
Family Income Brackets in Area Code 305
According to the Area Code 305 family income data, there are 6,784,479 families falling into the $50,000 to $74,999 income range, which is the most common income bracket and makes up 1,223.5% of all families. Conversely, the $10,000 to $14,999 income bracket is the least frequent group with only 983,153 families (177.3%) belonging to this category.
| Income Bracket | # Families | % Families |
| Less than $10,000 | 1,369,095 | 246.9% |
| $10,000 to $14,999 | 983,153 | 177.3% |
| $15,000 to $24,999 | 2,968,868 | 535.4% |
| $25,000 to $34,999 | 3,283,832 | 592.2% |
| $35,000 to $49,999 | 4,704,497 | 848.4% |
| $50,000 to $74,999 | 6,784,479 | 1,223.5% |
| $75,000 to $99,999 | 4,823,163 | 869.8% |
| $100,000 to $149,999 | 6,185,049 | 1,115.4% |
| $150,000 to $199,999 | 3,168,493 | 571.4% |
| $200,000+ | 5,649,943 | 1,018.9% |
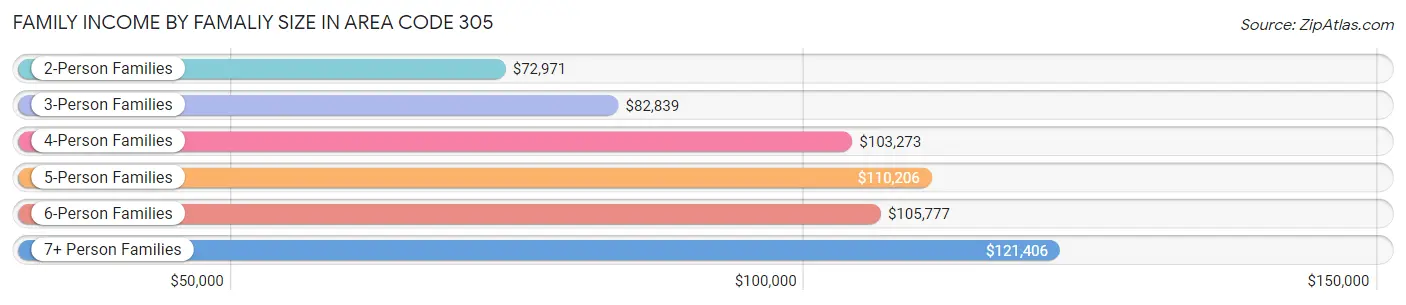
Family Income by Famaliy Size in Area Code 305
7+ person families (9,035 | 1.6%) account for the highest median family income in Area Code 305 with $121,406 per family, while 2-person families (235,654 | 42.5%) have the highest median income of $36,486 per family member.
| Income Bracket | # Families | Median Income |
| 2-Person Families | 235,654 (42.5%) | $72,971 |
| 3-Person Families | 143,728 (25.9%) | $82,839 |
| 4-Person Families | 105,918 (19.1%) | $103,273 |
| 5-Person Families | 44,223 (8.0%) | $110,206 |
| 6-Person Families | 15,956 (2.9%) | $105,777 |
| 7+ Person Families | 9,035 (1.6%) | $121,406 |
| Total | 554,514 (100.0%) | $84,362 |
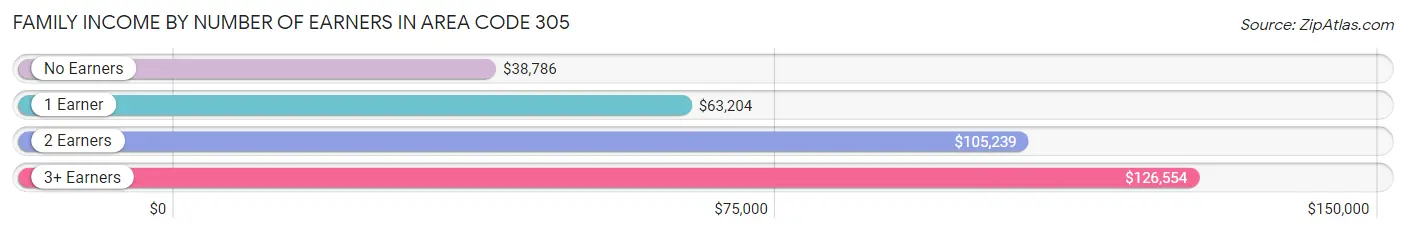
Family Income by Number of Earners in Area Code 305
The median family income in Area Code 305 is $84,362, with families comprising 3+ earners (74,023) having the highest median family income of $126,554, while families with no earners (68,358) have the lowest median family income of $38,786, accounting for 13.4% and 12.3% of families, respectively.
| Number of Earners | # Families | Median Income |
| No Earners | 68,358 (12.3%) | $38,786 |
| 1 Earner | 189,853 (34.2%) | $63,204 |
| 2 Earners | 222,280 (40.1%) | $105,239 |
| 3+ Earners | 74,023 (13.4%) | $126,554 |
| Total | 554,514 (100.0%) | $84,362 |
Household Income in Area Code 305
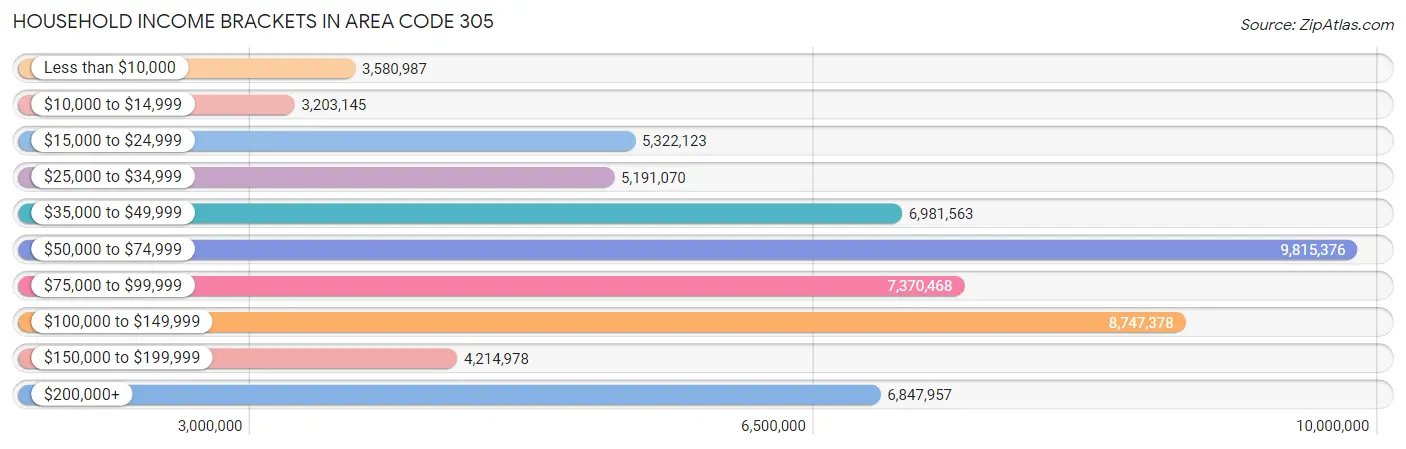
Household Income Brackets in Area Code 305
With 9,815,376 households falling in the category, the $50,000 to $74,999 income range is the most frequent in Area Code 305, accounting for 1,153.4% of all households. In contrast, only 3,203,145 households (376.4%) fall into the $10,000 to $14,999 income bracket, making it the least populous group.
| Income Bracket | # Households | % Households |
| Less than $10,000 | 3,580,987 | 420.8% |
| $10,000 to $14,999 | 3,203,145 | 376.4% |
| $15,000 to $24,999 | 5,322,123 | 625.4% |
| $25,000 to $34,999 | 5,191,070 | 610.0% |
| $35,000 to $49,999 | 6,981,563 | 820.4% |
| $50,000 to $74,999 | 9,815,376 | 1,153.4% |
| $75,000 to $99,999 | 7,370,468 | 866.1% |
| $100,000 to $149,999 | 8,747,378 | 1,027.9% |
| $150,000 to $199,999 | 4,214,978 | 495.3% |
| $200,000+ | 6,847,957 | 804.7% |
Household Income by Householder Age in Area Code 305
The median household income in Area Code 305 is $71,077, with the highest median household income of $84,524 found in the 45 to 64 years age bracket for the primary householder. A total of 338,869 households (39.8%) fall into this category. Meanwhile, the 65+ years age bracket for the primary householder has the lowest median household income of $48,828, with 218,648 households (25.7%) in this group.
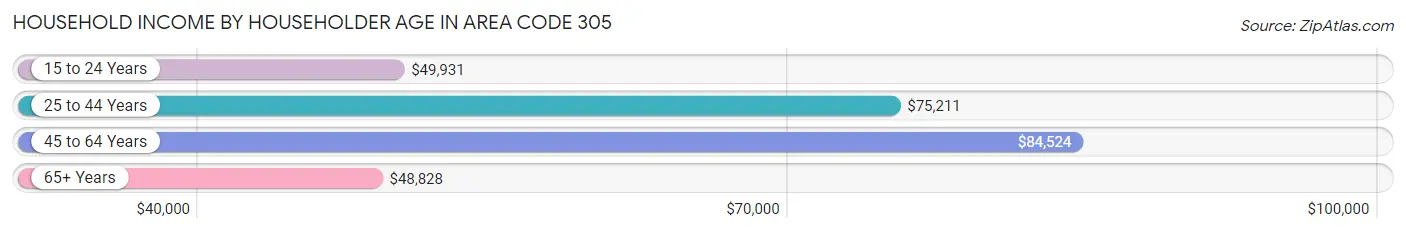
| Income Bracket | # Households | Median Income |
| 15 to 24 Years | 18,935 (2.2%) | $49,931 |
| 25 to 44 Years | 274,543 (32.3%) | $75,211 |
| 45 to 64 Years | 338,869 (39.8%) | $84,524 |
| 65+ Years | 218,648 (25.7%) | $48,828 |
| Total | 850,995 (100.0%) | $71,077 |
Poverty in Area Code 305
Income Below Poverty by Sex and Age in Area Code 305
With 14.4% poverty level for males and 17.4% for females among the residents of Area Code 305, 15 year old males and 75 year old and over females are the most vulnerable to poverty, with 3,117 males (24.8%) and 26,890 females (25.8%) in their respective age groups living below the poverty level.
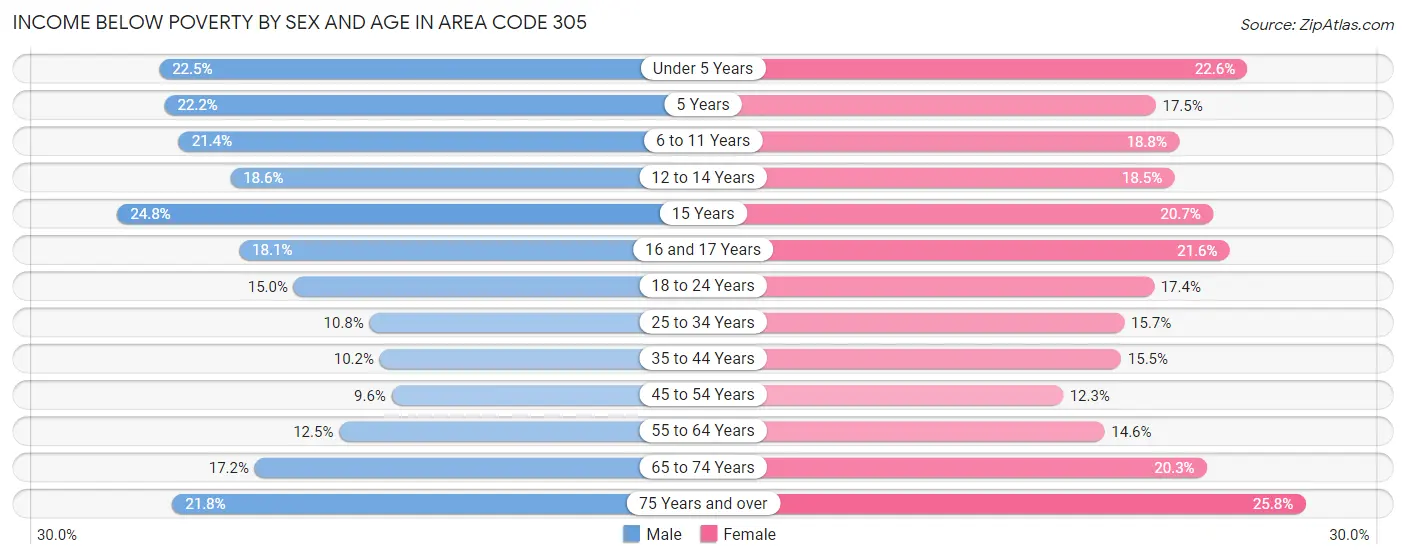
| Age Bracket | Male | Female |
| Under 5 Years | 14,725 (22.5%) | 14,310 (22.6%) |
| 5 Years | 2,732 (22.2%) | 1,974 (17.5%) |
| 6 to 11 Years | 15,993 (21.4%) | 13,586 (18.8%) |
| 12 to 14 Years | 7,485 (18.5%) | 7,065 (18.5%) |
| 15 Years | 3,117 (24.8%) | 2,496 (20.6%) |
| 16 and 17 Years | 4,778 (18.0%) | 5,540 (21.6%) |
| 18 to 24 Years | 13,771 (15.0%) | 15,438 (17.4%) |
| 25 to 34 Years | 18,092 (10.8%) | 25,180 (15.7%) |
| 35 to 44 Years | 16,497 (10.2%) | 24,155 (15.5%) |
| 45 to 54 Years | 15,795 (9.6%) | 20,020 (12.3%) |
| 55 to 64 Years | 17,916 (12.5%) | 22,400 (14.6%) |
| 65 to 74 Years | 16,263 (17.2%) | 23,273 (20.3%) |
| 75 Years and over | 14,796 (21.8%) | 26,890 (25.8%) |
| Total | 161,960 (14.4%) | 202,327 (17.4%) |
Income Above Poverty by Sex and Age in Area Code 305
According to the poverty statistics in Area Code 305, males aged 45 to 54 years and females aged 45 to 54 years are the age groups that are most secure financially, with 90.4% of males and 87.7% of females in these age groups living above the poverty line.
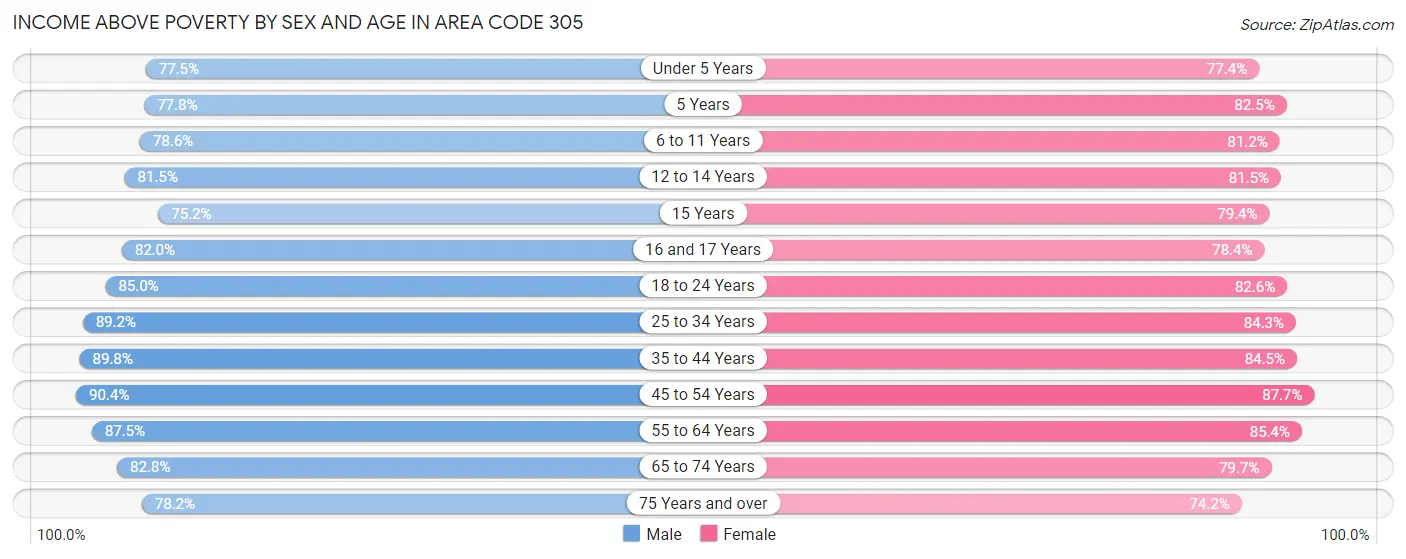
| Age Bracket | Male | Female |
| Under 5 Years | 50,724 (77.5%) | 49,113 (77.4%) |
| 5 Years | 9,566 (77.8%) | 9,323 (82.5%) |
| 6 to 11 Years | 58,723 (78.6%) | 58,833 (81.2%) |
| 12 to 14 Years | 32,872 (81.5%) | 31,134 (81.5%) |
| 15 Years | 9,435 (75.2%) | 9,593 (79.3%) |
| 16 and 17 Years | 21,687 (82.0%) | 20,137 (78.4%) |
| 18 to 24 Years | 77,988 (85.0%) | 73,431 (82.6%) |
| 25 to 34 Years | 149,582 (89.2%) | 134,973 (84.3%) |
| 35 to 44 Years | 144,961 (89.8%) | 131,254 (84.5%) |
| 45 to 54 Years | 149,478 (90.4%) | 142,789 (87.7%) |
| 55 to 64 Years | 125,637 (87.5%) | 130,808 (85.4%) |
| 65 to 74 Years | 78,376 (82.8%) | 91,391 (79.7%) |
| 75 Years and over | 53,162 (78.2%) | 77,389 (74.2%) |
| Total | 962,191 (85.6%) | 960,168 (82.6%) |
Income Below Poverty Among Married-Couple Families in Area Code 305
The poverty statistics for married-couple families in Area Code 305 show that 8.0% or 27,618 of the total 347,127 families live below the poverty line. Families with 5 or more children have the highest poverty rate of 29.7%, comprising of 342 families. On the other hand, families with no children have the lowest poverty rate of 7.1%, which includes 14,423 families.
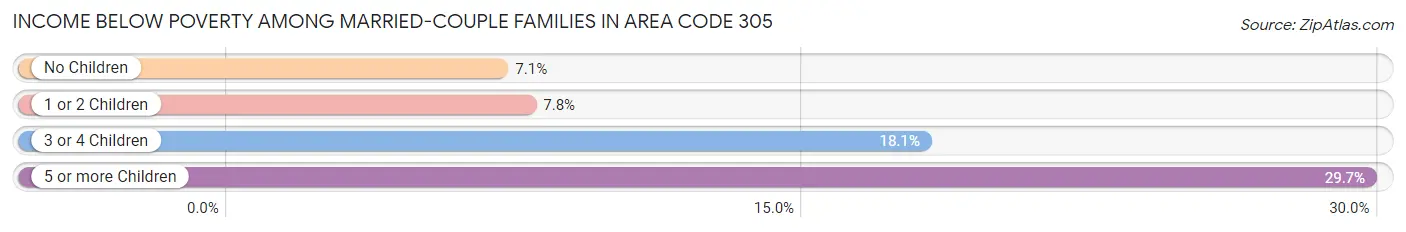
| Children | Above Poverty | Below Poverty |
| No Children | 189,917 (92.9%) | 14,423 (7.1%) |
| 1 or 2 Children | 114,309 (92.2%) | 9,652 (7.8%) |
| 3 or 4 Children | 14,475 (81.9%) | 3,201 (18.1%) |
| 5 or more Children | 808 (70.3%) | 342 (29.7%) |
| Total | 319,509 (92.0%) | 27,618 (8.0%) |
Income Below Poverty Among Single-Parent Households in Area Code 305
According to the poverty data in Area Code 305, 13.1% or 8,113 single-father households and 21.7% or 31,613 single-mother households are living below the poverty line. Among single-father households, those with 5 or more children have the highest poverty rate, with 23 households (39.0%) experiencing poverty. Likewise, among single-mother households, those with 5 or more children have the highest poverty rate, with 852 households (85.0%) falling below the poverty line.
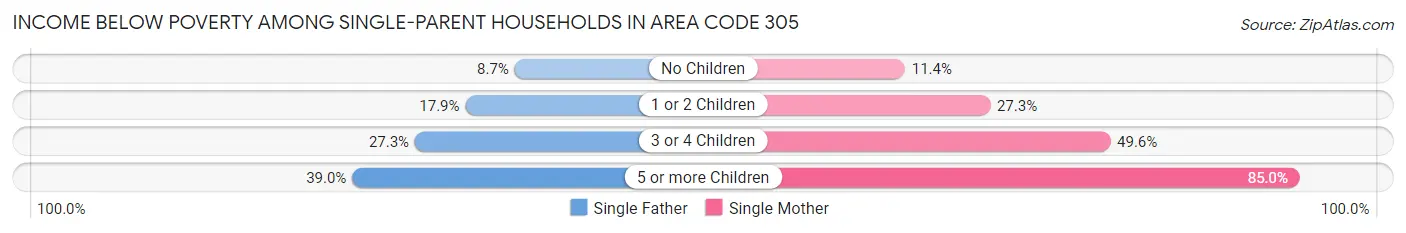
| Children | Single Father | Single Mother |
| No Children | 3,030 (8.7%) | 7,731 (11.4%) |
| 1 or 2 Children | 4,363 (17.9%) | 18,283 (27.3%) |
| 3 or 4 Children | 697 (27.3%) | 4,747 (49.6%) |
| 5 or more Children | 23 (39.0%) | 852 (85.0%) |
| Total | 8,113 (13.1%) | 31,613 (21.7%) |
Income Below Poverty Among Married-Couple vs Single-Parent Households in Area Code 305
The poverty data for Area Code 305 shows that 27,618 of the married-couple family households (8.0%) and 39,726 of the single-parent households (19.2%) are living below the poverty level. Within the married-couple family households, those with 5 or more children have the highest poverty rate, with 342 households (29.7%) falling below the poverty line. Among the single-parent households, those with 5 or more children have the highest poverty rate, with 875 household (82.4%) living below poverty.
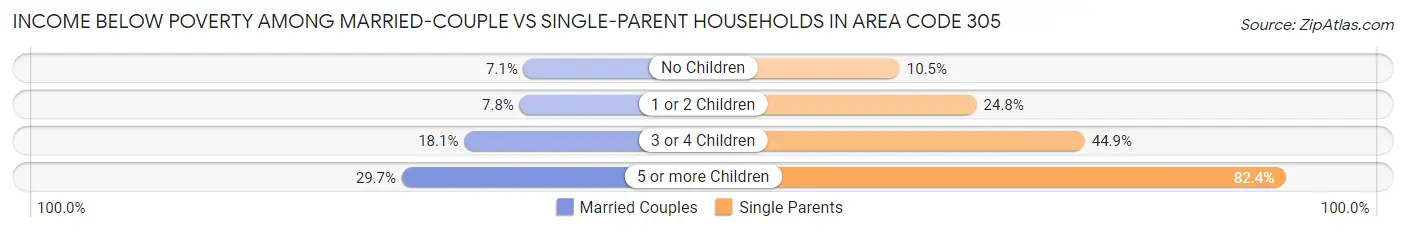
| Children | Married-Couple Families | Single-Parent Households |
| No Children | 14,423 (7.1%) | 10,761 (10.5%) |
| 1 or 2 Children | 9,652 (7.8%) | 22,646 (24.8%) |
| 3 or 4 Children | 3,201 (18.1%) | 5,444 (44.9%) |
| 5 or more Children | 342 (29.7%) | 875 (82.4%) |
| Total | 27,618 (8.0%) | 39,726 (19.2%) |
Race in Area Code 305
The most populous races in Area Code 305 are Hispanic or Latino (1,492,063 | 64.1%), White / Caucasian (1,093,454 | 47.0%), and Two or more Races (636,318 | 27.4%).
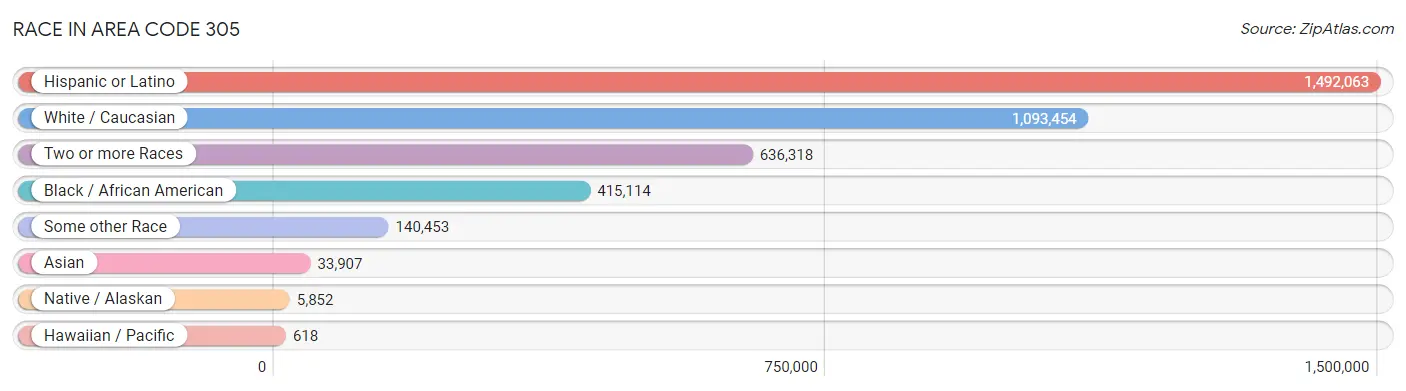
| Race | # Population | % Population |
| Asian | 33,907 | 1.5% |
| Black / African American | 415,114 | 17.8% |
| Hawaiian / Pacific | 618 | 0.0% |
| Hispanic or Latino | 1,492,063 | 64.1% |
| Native / Alaskan | 5,852 | 0.3% |
| White / Caucasian | 1,093,454 | 47.0% |
| Two or more Races | 636,318 | 27.4% |
| Some other Race | 140,453 | 6.0% |
| Total | 2,325,716 | 100.0% |
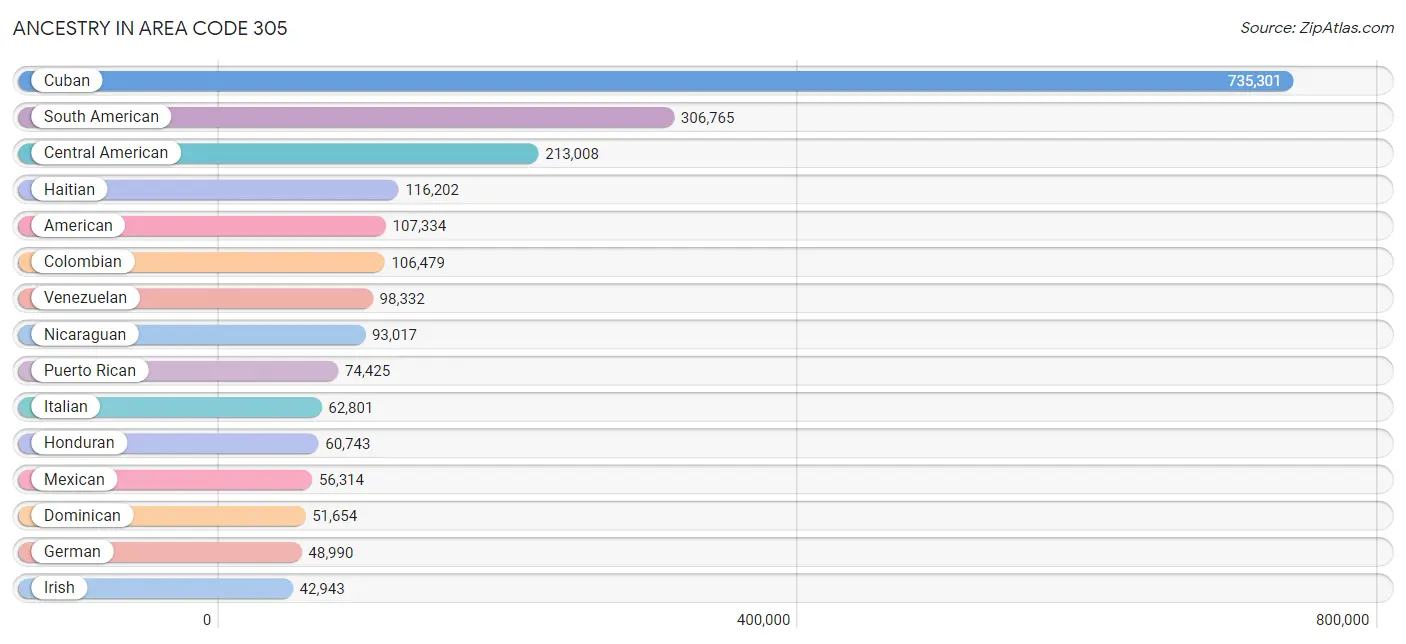
Ancestry in Area Code 305
The most populous ancestries reported in Area Code 305 are Cuban (735,301 | 31.6%), South American (306,765 | 13.2%), Central American (213,008 | 9.2%), Haitian (116,202 | 5.0%), and American (107,334 | 4.6%), together accounting for 63.6% of all Area Code 305 residents.
| Ancestry | # Population | % Population |
| Afghan | 233 | 0.0% |
| African | 7,378 | 0.3% |
| Alaska Native | 4 | 0.0% |
| Alaskan Athabascan | 5 | 0.0% |
| Albanian | 100 | 0.0% |
| Aleut | 6 | 0.0% |
| Alsatian | 55 | 0.0% |
| American | 107,334 | 4.6% |
| Apache | 39 | 0.0% |
| Arab | 16,511 | 0.7% |
| Arapaho | 131 | 0.0% |
| Argentinean | 29,935 | 1.3% |
| Armenian | 1,066 | 0.1% |
| Assyrian / Chaldean / Syriac | 17 | 0.0% |
| Australian | 829 | 0.0% |
| Austrian | 3,034 | 0.1% |
| Bahamian | 7,805 | 0.3% |
| Bangladeshi | 37 | 0.0% |
| Barbadian | 644 | 0.0% |
| Basque | 878 | 0.0% |
| Belgian | 1,304 | 0.1% |
| Belizean | 500 | 0.0% |
| Bermudan | 99 | 0.0% |
| Bhutanese | 2,342 | 0.1% |
| Blackfeet | 316 | 0.0% |
| Bolivian | 4,037 | 0.2% |
| Brazilian | 12,774 | 0.5% |
| British | 5,628 | 0.2% |
| British West Indian | 2,307 | 0.1% |
| Bulgarian | 676 | 0.0% |
| Burmese | 3,105 | 0.1% |
| Cajun | 47 | 0.0% |
| Cambodian | 38 | 0.0% |
| Canadian | 2,696 | 0.1% |
| Cape Verdean | 118 | 0.0% |
| Celtic | 40 | 0.0% |
| Central American | 213,008 | 9.2% |
| Central American Indian | 3,821 | 0.2% |
| Cherokee | 1,376 | 0.1% |
| Cheyenne | 3 | 0.0% |
| Chickasaw | 53 | 0.0% |
| Chilean | 9,992 | 0.4% |
| Chippewa | 86 | 0.0% |
| Choctaw | 55 | 0.0% |
| Colombian | 106,479 | 4.6% |
| Comanche | 33 | 0.0% |
| Costa Rican | 4,608 | 0.2% |
| Creek | 99 | 0.0% |
| Croatian | 811 | 0.0% |
| Cuban | 735,301 | 31.6% |
| Cypriot | 51 | 0.0% |
| Czech | 1,528 | 0.1% |
| Czechoslovakian | 497 | 0.0% |
| Danish | 1,497 | 0.1% |
| Dominican | 51,654 | 2.2% |
| Dutch | 4,278 | 0.2% |
| Dutch West Indian | 220 | 0.0% |
| Eastern European | 6,070 | 0.3% |
| Ecuadorian | 18,882 | 0.8% |
| Egyptian | 817 | 0.0% |
| English | 35,480 | 1.5% |
| Estonian | 186 | 0.0% |
| Ethiopian | 268 | 0.0% |
| European | 13,179 | 0.6% |
| Filipino | 586 | 0.0% |
| Finnish | 703 | 0.0% |
| French | 20,557 | 0.9% |
| French American Indian | 85 | 0.0% |
| French Canadian | 2,003 | 0.1% |
| German | 48,990 | 2.1% |
| German Russian | 8 | 0.0% |
| Ghanaian | 125 | 0.0% |
| Greek | 4,767 | 0.2% |
| Guamanian / Chamorro | 183 | 0.0% |
| Guatemalan | 26,378 | 1.1% |
| Guyanese | 1,436 | 0.1% |
| Haitian | 116,202 | 5.0% |
| Honduran | 60,743 | 2.6% |
| Hungarian | 3,827 | 0.2% |
| Icelander | 69 | 0.0% |
| Indian (Asian) | 13,404 | 0.6% |
| Indonesian | 273 | 0.0% |
| Inupiat | 13 | 0.0% |
| Iranian | 2,175 | 0.1% |
| Iraqi | 262 | 0.0% |
| Irish | 42,943 | 1.8% |
| Iroquois | 140 | 0.0% |
| Israeli | 4,427 | 0.2% |
| Italian | 62,801 | 2.7% |
| Jamaican | 32,669 | 1.4% |
| Japanese | 373 | 0.0% |
| Jordanian | 821 | 0.0% |
| Kenyan | 150 | 0.0% |
| Korean | 7,616 | 0.3% |
| Laotian | 231 | 0.0% |
| Latvian | 428 | 0.0% |
| Lebanese | 6,737 | 0.3% |
| Lithuanian | 1,699 | 0.1% |
| Lumbee | 35 | 0.0% |
| Luxembourger | 55 | 0.0% |
| Macedonian | 86 | 0.0% |
| Malaysian | 249 | 0.0% |
| Maltese | 146 | 0.0% |
| Mexican | 56,314 | 2.4% |
| Mexican American Indian | 949 | 0.0% |
| Mongolian | 98 | 0.0% |
| Moroccan | 1,496 | 0.1% |
| Native Hawaiian | 269 | 0.0% |
| Navajo | 36 | 0.0% |
| New Zealander | 105 | 0.0% |
| Nicaraguan | 93,017 | 4.0% |
| Nigerian | 2,064 | 0.1% |
| Northern European | 568 | 0.0% |
| Norwegian | 3,349 | 0.1% |
| Okinawan | 4 | 0.0% |
| Osage | 3 | 0.0% |
| Ottawa | 10 | 0.0% |
| Pakistani | 1,184 | 0.1% |
| Palestinian | 435 | 0.0% |
| Panamanian | 7,335 | 0.3% |
| Paraguayan | 1,079 | 0.1% |
| Pennsylvania German | 82 | 0.0% |
| Peruvian | 32,633 | 1.4% |
| Polish | 20,181 | 0.9% |
| Portuguese | 8,251 | 0.4% |
| Potawatomi | 48 | 0.0% |
| Pueblo | 28 | 0.0% |
| Puerto Rican | 74,425 | 3.2% |
| Romanian | 3,491 | 0.2% |
| Russian | 18,630 | 0.8% |
| Salvadoran | 20,385 | 0.9% |
| Samoan | 447 | 0.0% |
| Scandinavian | 1,143 | 0.1% |
| Scotch-Irish | 2,721 | 0.1% |
| Scottish | 7,465 | 0.3% |
| Seminole | 328 | 0.0% |
| Senegalese | 68 | 0.0% |
| Serbian | 682 | 0.0% |
| Sierra Leonean | 5 | 0.0% |
| Sioux | 64 | 0.0% |
| Slavic | 284 | 0.0% |
| Slovak | 916 | 0.0% |
| Slovene | 124 | 0.0% |
| South African | 703 | 0.0% |
| South American | 306,765 | 13.2% |
| South American Indian | 689 | 0.0% |
| Spaniard | 16,359 | 0.7% |
| Spanish | 6,185 | 0.3% |
| Spanish American | 393 | 0.0% |
| Spanish American Indian | 119 | 0.0% |
| Sri Lankan | 2,776 | 0.1% |
| Subsaharan African | 11,760 | 0.5% |
| Sudanese | 111 | 0.0% |
| Swedish | 4,805 | 0.2% |
| Swiss | 1,514 | 0.1% |
| Syrian | 1,867 | 0.1% |
| Taiwanese | 89 | 0.0% |
| Thai | 11,887 | 0.5% |
| Tongan | 137 | 0.0% |
| Trinidadian and Tobagonian | 4,290 | 0.2% |
| Turkish | 2,622 | 0.1% |
| U.S. Virgin Islander | 745 | 0.0% |
| Ugandan | 7 | 0.0% |
| Ukrainian | 4,809 | 0.2% |
| Uruguayan | 5,038 | 0.2% |
| Venezuelan | 98,332 | 4.2% |
| Vietnamese | 797 | 0.0% |
| Welsh | 1,979 | 0.1% |
| West Indian | 2,801 | 0.1% |
| Yaqui | 20 | 0.0% |
| Yugoslavian | 329 | 0.0% |
| Yuman | 12 | 0.0% |
| Yup'ik | 22 | 0.0% |
| Zimbabwean | 51 | 0.0% | View All 174 Rows |
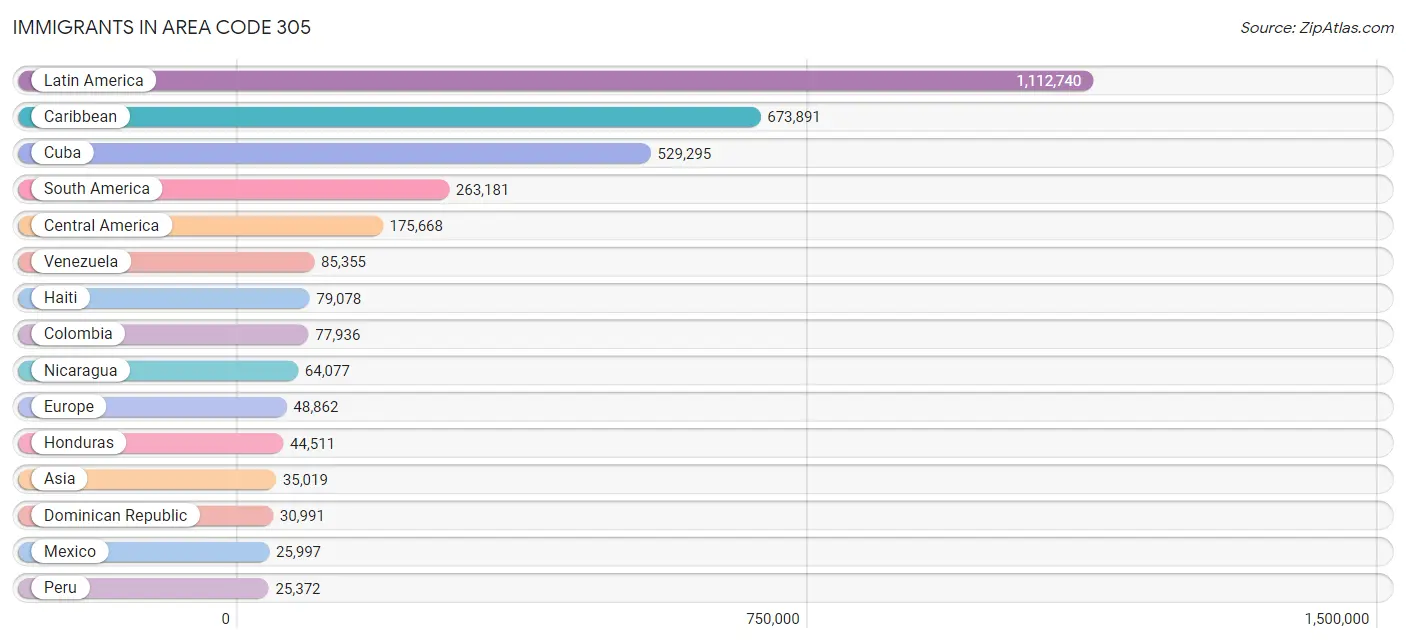
Immigrants in Area Code 305
The most numerous immigrant groups reported in Area Code 305 came from Latin America (1,112,740 | 47.8%), Caribbean (673,891 | 29.0%), Cuba (529,295 | 22.8%), South America (263,181 | 11.3%), and Central America (175,668 | 7.5%), together accounting for 118.5% of all Area Code 305 residents.
| Immigration Origin | # Population | % Population |
| Afghanistan | 165 | 0.0% |
| Africa | 7,105 | 0.3% |
| Albania | 91 | 0.0% |
| Argentina | 24,300 | 1.0% |
| Armenia | 65 | 0.0% |
| Asia | 35,019 | 1.5% |
| Australia | 610 | 0.0% |
| Austria | 369 | 0.0% |
| Bahamas | 4,213 | 0.2% |
| Bangladesh | 1,283 | 0.1% |
| Barbados | 196 | 0.0% |
| Belarus | 636 | 0.0% |
| Belgium | 493 | 0.0% |
| Belize | 348 | 0.0% |
| Bolivia | 3,414 | 0.2% |
| Bosnia and Herzegovina | 110 | 0.0% |
| Brazil | 17,183 | 0.7% |
| Bulgaria | 533 | 0.0% |
| Cambodia | 315 | 0.0% |
| Cameroon | 268 | 0.0% |
| Canada | 5,156 | 0.2% |
| Caribbean | 673,891 | 29.0% |
| Central America | 175,668 | 7.5% |
| Chile | 7,994 | 0.3% |
| China | 5,933 | 0.3% |
| Colombia | 77,936 | 3.4% |
| Costa Rica | 3,626 | 0.2% |
| Croatia | 222 | 0.0% |
| Cuba | 529,295 | 22.8% |
| Czechoslovakia | 534 | 0.0% |
| Denmark | 158 | 0.0% |
| Dominica | 846 | 0.0% |
| Dominican Republic | 30,991 | 1.3% |
| Eastern Africa | 846 | 0.0% |
| Eastern Asia | 8,121 | 0.4% |
| Eastern Europe | 15,614 | 0.7% |
| Ecuador | 13,828 | 0.6% |
| Egypt | 685 | 0.0% |
| El Salvador | 12,969 | 0.6% |
| England | 1,839 | 0.1% |
| Ethiopia | 176 | 0.0% |
| Europe | 48,862 | 2.1% |
| Fiji | 29 | 0.0% |
| France | 5,829 | 0.3% |
| Germany | 3,245 | 0.1% |
| Ghana | 51 | 0.0% |
| Greece | 667 | 0.0% |
| Grenada | 354 | 0.0% |
| Guatemala | 18,415 | 0.8% |
| Guyana | 1,925 | 0.1% |
| Haiti | 79,078 | 3.4% |
| Honduras | 44,511 | 1.9% |
| Hong Kong | 262 | 0.0% |
| Hungary | 744 | 0.0% |
| India | 5,082 | 0.2% |
| Indonesia | 182 | 0.0% |
| Iran | 1,235 | 0.1% |
| Iraq | 239 | 0.0% |
| Ireland | 549 | 0.0% |
| Israel | 2,929 | 0.1% |
| Italy | 5,425 | 0.2% |
| Jamaica | 21,830 | 0.9% |
| Japan | 852 | 0.0% |
| Jordan | 726 | 0.0% |
| Kazakhstan | 443 | 0.0% |
| Kenya | 206 | 0.0% |
| Korea | 1,317 | 0.1% |
| Kuwait | 236 | 0.0% |
| Laos | 58 | 0.0% |
| Latin America | 1,112,740 | 47.8% |
| Latvia | 252 | 0.0% |
| Lebanon | 1,123 | 0.1% |
| Liberia | 25 | 0.0% |
| Lithuania | 209 | 0.0% |
| Malaysia | 259 | 0.0% |
| Mexico | 25,997 | 1.1% |
| Micronesia | 35 | 0.0% |
| Middle Africa | 560 | 0.0% |
| Moldova | 617 | 0.0% |
| Morocco | 1,074 | 0.1% |
| Nepal | 41 | 0.0% |
| Netherlands | 471 | 0.0% |
| Nicaragua | 64,077 | 2.8% |
| Nigeria | 1,677 | 0.1% |
| North Macedonia | 9 | 0.0% |
| Northern Africa | 2,381 | 0.1% |
| Northern Europe | 5,676 | 0.2% |
| Norway | 149 | 0.0% |
| Oceania | 1,086 | 0.1% |
| Pakistan | 1,313 | 0.1% |
| Panama | 5,536 | 0.2% |
| Peru | 25,372 | 1.1% |
| Philippines | 4,292 | 0.2% |
| Poland | 1,492 | 0.1% |
| Portugal | 528 | 0.0% |
| Romania | 1,109 | 0.1% |
| Russia | 5,089 | 0.2% |
| Saudi Arabia | 736 | 0.0% |
| Scotland | 213 | 0.0% |
| Senegal | 60 | 0.0% |
| Serbia | 234 | 0.0% |
| Sierra Leone | 7 | 0.0% |
| Singapore | 138 | 0.0% |
| Somalia | 12 | 0.0% |
| South Africa | 1,145 | 0.1% |
| South America | 263,181 | 11.3% |
| South Central Asia | 10,254 | 0.4% |
| South Eastern Asia | 7,336 | 0.3% |
| Southern Europe | 16,358 | 0.7% |
| Spain | 9,722 | 0.4% |
| Sri Lanka | 240 | 0.0% |
| St. Vincent and the Grenadines | 354 | 0.0% |
| Sudan | 138 | 0.0% |
| Sweden | 567 | 0.0% |
| Switzerland | 754 | 0.0% |
| Syria | 596 | 0.0% |
| Taiwan | 455 | 0.0% |
| Thailand | 908 | 0.0% |
| Trinidad and Tobago | 4,026 | 0.2% |
| Turkey | 1,963 | 0.1% |
| Uganda | 20 | 0.0% |
| Ukraine | 2,958 | 0.1% |
| Uruguay | 4,394 | 0.2% |
| Uzbekistan | 352 | 0.0% |
| Venezuela | 85,355 | 3.7% |
| Vietnam | 1,049 | 0.1% |
| West Indies | 221 | 0.0% |
| Western Africa | 1,974 | 0.1% |
| Western Asia | 9,132 | 0.4% |
| Western Europe | 11,166 | 0.5% |
| Yemen | 9 | 0.0% |
| Zaire | 132 | 0.0% |
| Zimbabwe | 76 | 0.0% | View All 133 Rows |
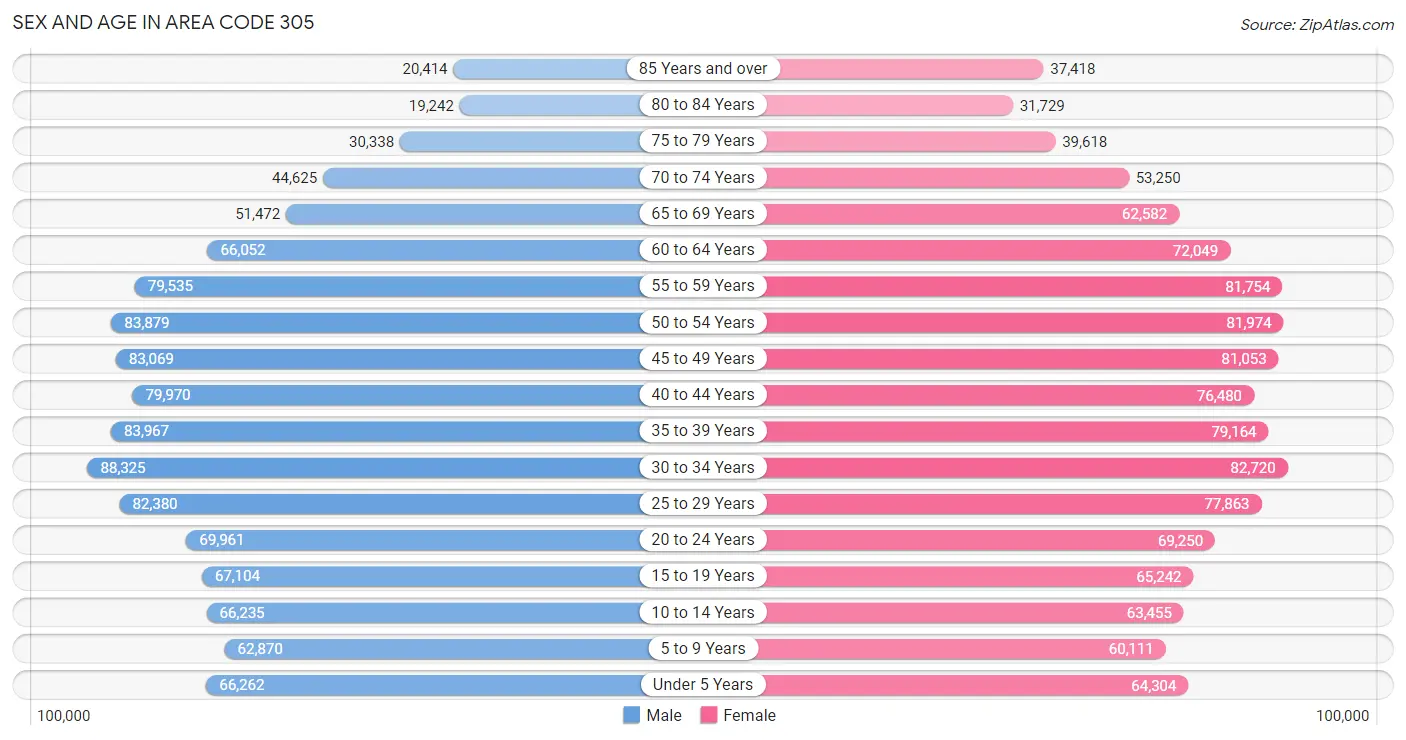
Sex and Age in Area Code 305
Sex and Age in Area Code 305
The most populous age groups in Area Code 305 are 30 to 34 Years (88,325 | 7.7%) for men and 30 to 34 Years (82,720 | 7.0%) for women.
| Age Bracket | Male | Female |
| Under 5 Years | 66,262 (5.8%) | 64,304 (5.4%) |
| 5 to 9 Years | 62,870 (5.5%) | 60,111 (5.1%) |
| 10 to 14 Years | 66,235 (5.8%) | 63,455 (5.4%) |
| 15 to 19 Years | 67,104 (5.9%) | 65,242 (5.5%) |
| 20 to 24 Years | 69,961 (6.1%) | 69,250 (5.9%) |
| 25 to 29 Years | 82,380 (7.2%) | 77,863 (6.6%) |
| 30 to 34 Years | 88,325 (7.7%) | 82,720 (7.0%) |
| 35 to 39 Years | 83,967 (7.3%) | 79,164 (6.7%) |
| 40 to 44 Years | 79,970 (7.0%) | 76,480 (6.5%) |
| 45 to 49 Years | 83,069 (7.2%) | 81,053 (6.9%) |
| 50 to 54 Years | 83,879 (7.3%) | 81,974 (7.0%) |
| 55 to 59 Years | 79,535 (6.9%) | 81,754 (6.9%) |
| 60 to 64 Years | 66,052 (5.8%) | 72,049 (6.1%) |
| 65 to 69 Years | 51,472 (4.5%) | 62,582 (5.3%) |
| 70 to 74 Years | 44,625 (3.9%) | 53,250 (4.5%) |
| 75 to 79 Years | 30,338 (2.6%) | 39,618 (3.4%) |
| 80 to 84 Years | 19,242 (1.7%) | 31,729 (2.7%) |
| 85 Years and over | 20,414 (1.8%) | 37,418 (3.2%) |
| Total | 1,145,700 (100.0%) | 1,180,016 (100.0%) |
Families and Households in Area Code 305
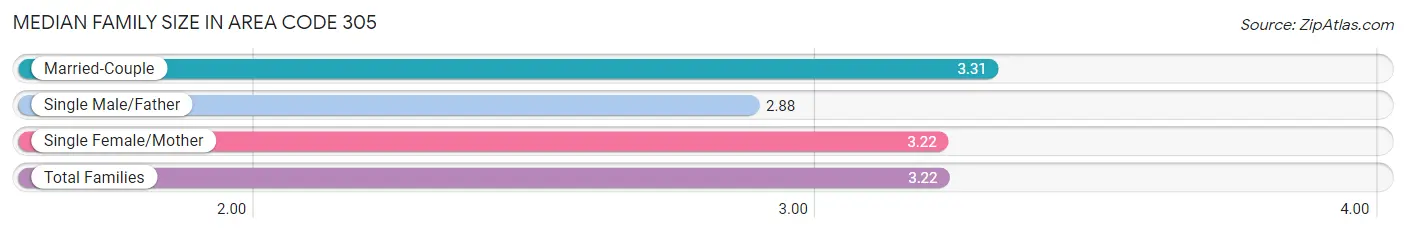
Median Family Size in Area Code 305
The median family size in Area Code 305 is 3.22 persons per family, with married-couple families (347,127 | 62.6%) accounting for the largest median family size of 3.30722 persons per family. On the other hand, single male/father families (61,780 | 11.1%) represent the smallest median family size with 2.88 persons per family.
| Family Type | # Families | Family Size |
| Married-Couple | 347,127 (62.6%) | 3.31 |
| Single Male/Father | 61,780 (11.1%) | 2.88 |
| Single Female/Mother | 145,607 (26.3%) | 3.22 |
| Total Families | 554,514 (100.0%) | 3.22 |
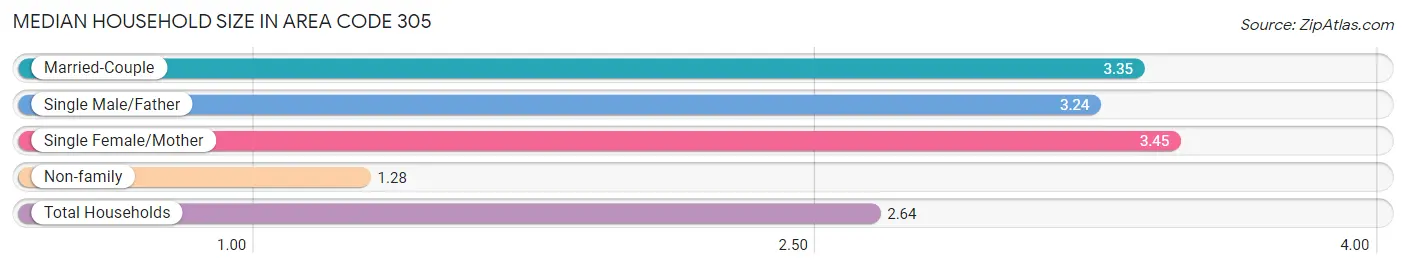
Median Household Size in Area Code 305
The median household size in Area Code 305 is 2.64 persons per household, with single female/mother households (145,607 | 17.1%) accounting for the largest median household size of 3.44942 persons per household. non-family households (296,481 | 34.8%) represent the smallest median household size with 1.28 persons per household.
| Household Type | # Households | Household Size |
| Married-Couple | 347,127 (40.8%) | 3.35 |
| Single Male/Father | 61,780 (7.3%) | 3.24 |
| Single Female/Mother | 145,607 (17.1%) | 3.45 |
| Non-family | 296,481 (34.8%) | 1.28 |
| Total Households | 850,995 (100.0%) | 2.64 |
Household Size by Marriage Status in Area Code 305
Out of a total of 850,995 households in Area Code 305, 554,514 (65.2%) are family households, while 296,481 (34.8%) are nonfamily households. The most numerous type of family households are 2-person households, comprising 209,898, and the most common type of nonfamily households are 1-person households, comprising 237,598.
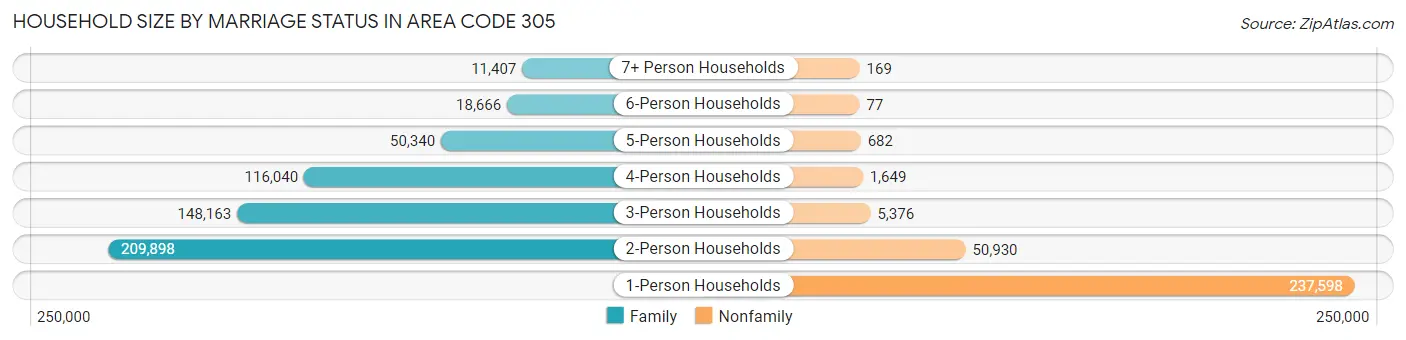
| Household Size | Family Households | Nonfamily Households |
| 1-Person Households | - | 237,598 (27.9%) |
| 2-Person Households | 209,898 (24.7%) | 50,930 (6.0%) |
| 3-Person Households | 148,163 (17.4%) | 5,376 (0.6%) |
| 4-Person Households | 116,040 (13.6%) | 1,649 (0.2%) |
| 5-Person Households | 50,340 (5.9%) | 682 (0.1%) |
| 6-Person Households | 18,666 (2.2%) | 77 (0.0%) |
| 7+ Person Households | 11,407 (1.3%) | 169 (0.0%) |
| Total | 554,514 (65.2%) | 296,481 (34.8%) |
Female Fertility in Area Code 305
Fertility by Age in Area Code 305
Average fertility rate in Area Code 305 is 45.7 births per 1,000 women. Women in the age bracket of 15 to 19 years have the highest fertility rate with 92.9 births per 1,000 women. Women in the age bracket of 20 to 34 years acount for 61.8% of all women with births.
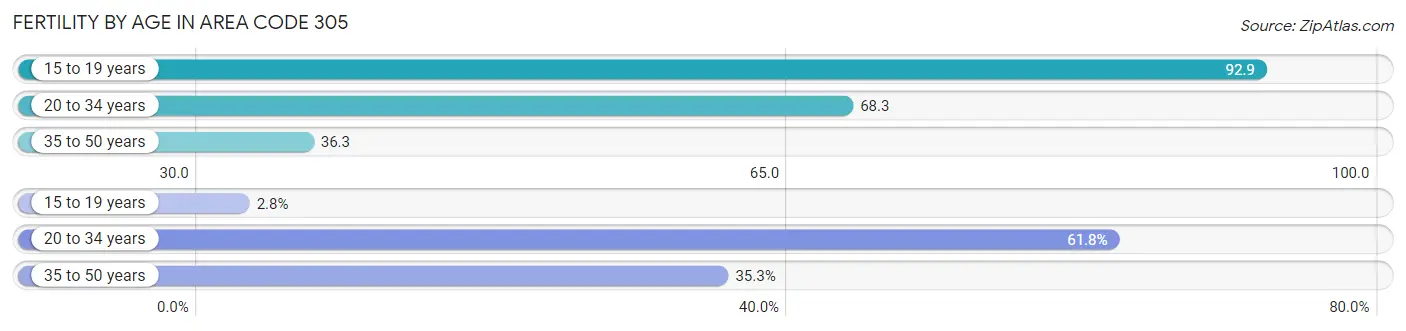
| Age Bracket | Women with Births | Births / 1,000 Women |
| 15 to 19 years | 694 (2.8%) | 92.9 |
| 20 to 34 years | 15,147 (61.8%) | 68.3 |
| 35 to 50 years | 8,651 (35.3%) | 36.3 |
| Total | 24,492 (100.0%) | 45.7 |
Fertility by Age by Marriage Status in Area Code 305
59.5% of women with births (24,492) in Area Code 305 are married. The highest percentage of unmarried women with births falls into 15 to 19 years age bracket with 100.0% of them unmarried at the time of birth, while the lowest percentage of unmarried women with births belong to 35 to 50 years age bracket with 37.4% of them unmarried.
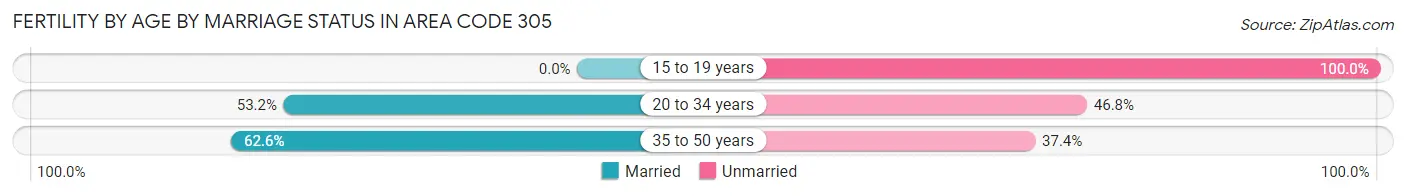
| Age Bracket | Married | Unmarried |
| 15 to 19 years | 0 (0.0%) | 694 (100.0%) |
| 20 to 34 years | 8,059 (53.2%) | 7,088 (46.8%) |
| 35 to 50 years | 5,415 (62.6%) | 3,236 (37.4%) |
| Total | 14,572 (59.5%) | 9,920 (40.5%) |
Fertility by Education in Area Code 305
Average fertility rate in Area Code 305 is 45.7 births per 1,000 women. Women with the education attainment of graduate degree have the highest fertility rate of 63.2 births per 1,000 women, while women with the education attainment of college or associate's degree have the lowest fertility at 42.5 births per 1,000 women. Women with the education attainment of high school diploma represent 26.3% of all women with births.
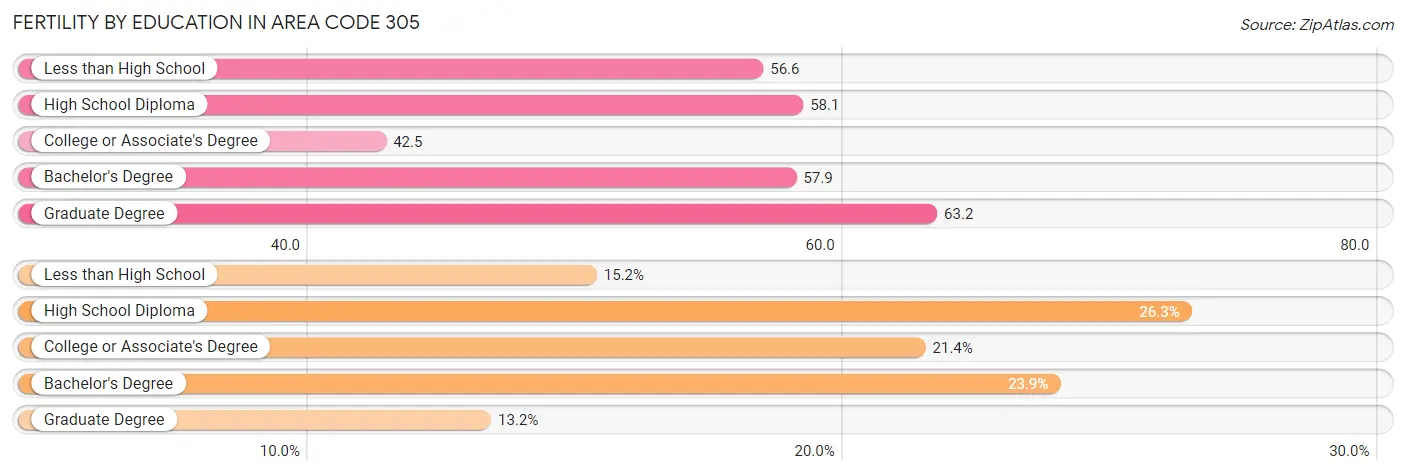
| Educational Attainment | Women with Births | Births / 1,000 Women |
| Less than High School | 3,723 (15.2%) | 56.6 |
| High School Diploma | 6,450 (26.3%) | 58.1 |
| College or Associate's Degree | 5,231 (21.4%) | 42.5 |
| Bachelor's Degree | 5,849 (23.9%) | 57.9 |
| Graduate Degree | 3,239 (13.2%) | 63.2 |
| Total | 24,492 (100.0%) | 45.7 |
Fertility by Education by Marriage Status in Area Code 305
40.5% of women with births in Area Code 305 are unmarried. Women with the educational attainment of bachelor's degree are most likely to be married with 58.6% of them married at childbirth, while women with the educational attainment of less than high school are least likely to be married with 66.0% of them unmarried at childbirth.
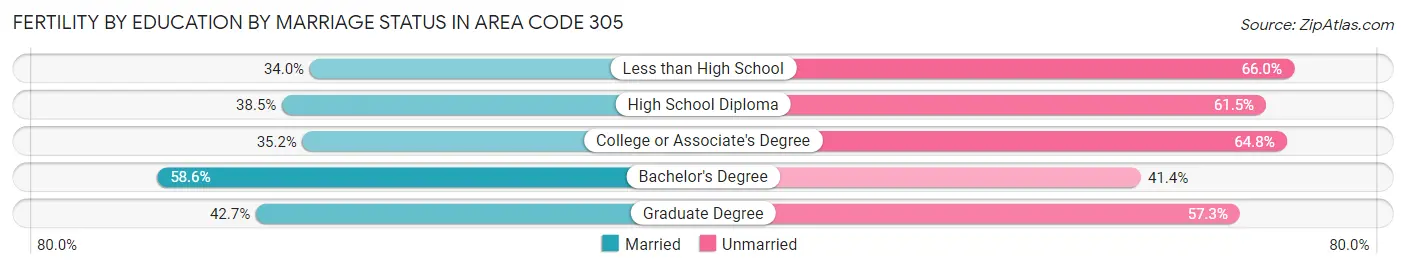
| Educational Attainment | Married | Unmarried |
| Less than High School | 1,266 (34.0%) | 2,457 (66.0%) |
| High School Diploma | 2,482 (38.5%) | 3,968 (61.5%) |
| College or Associate's Degree | 1,840 (35.2%) | 3,391 (64.8%) |
| Bachelor's Degree | 3,428 (58.6%) | 2,421 (41.4%) |
| Graduate Degree | 1,383 (42.7%) | 1,856 (57.3%) |
| Total | 14,572 (59.5%) | 9,920 (40.5%) |
Employment Characteristics in Area Code 305
Employment by Class of Employer in Area Code 305
Among the 1,141,067 employed individuals in Area Code 305, private company employees (791,791 | 69.4%), self-employed (not incorporated) (95,310 | 8.4%), and self-employed (incorporated) (80,046 | 7.0%) make up the most common classes of employment.
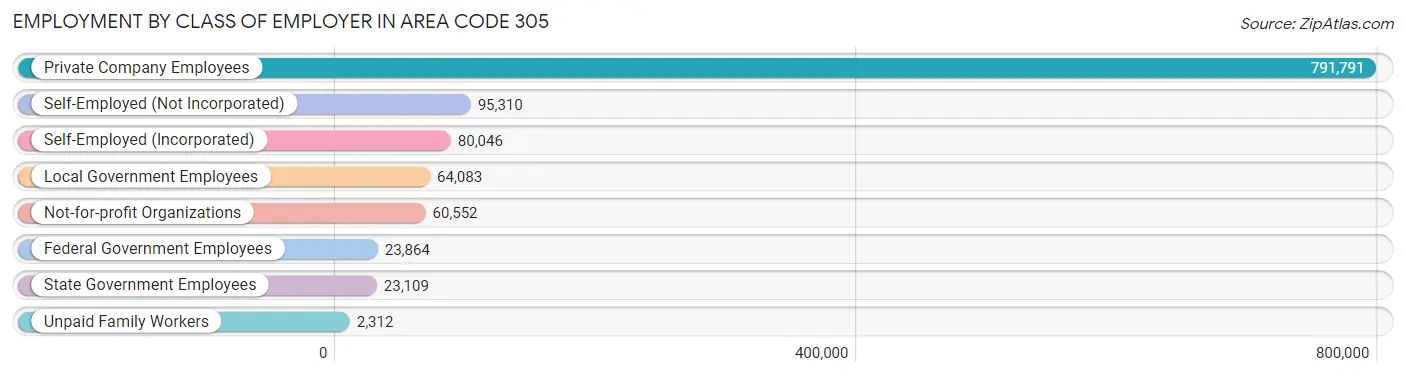
| Employer Class | # Employees | % Employees |
| Private Company Employees | 791,791 | 69.4% |
| Self-Employed (Incorporated) | 80,046 | 7.0% |
| Self-Employed (Not Incorporated) | 95,310 | 8.4% |
| Not-for-profit Organizations | 60,552 | 5.3% |
| Local Government Employees | 64,083 | 5.6% |
| State Government Employees | 23,109 | 2.0% |
| Federal Government Employees | 23,864 | 2.1% |
| Unpaid Family Workers | 2,312 | 0.2% |
| Total | 1,141,067 | 100.0% |
Employment Status by Age in Area Code 305
According to the labor force statistics for Area Code 305, out of the total population over 16 years of age (1,917,818), 63.3% or 1,214,554 individuals are in the labor force, with 4.7% or 56,720 of them unemployed. The age group with the highest labor force participation rate is 35 to 44 years, with 84.5% or 269,982 individuals in the labor force. Within the labor force, the 16 to 19 years age range has the highest percentage of unemployed individuals, with 963.1% or 264,467 of them being unemployed.
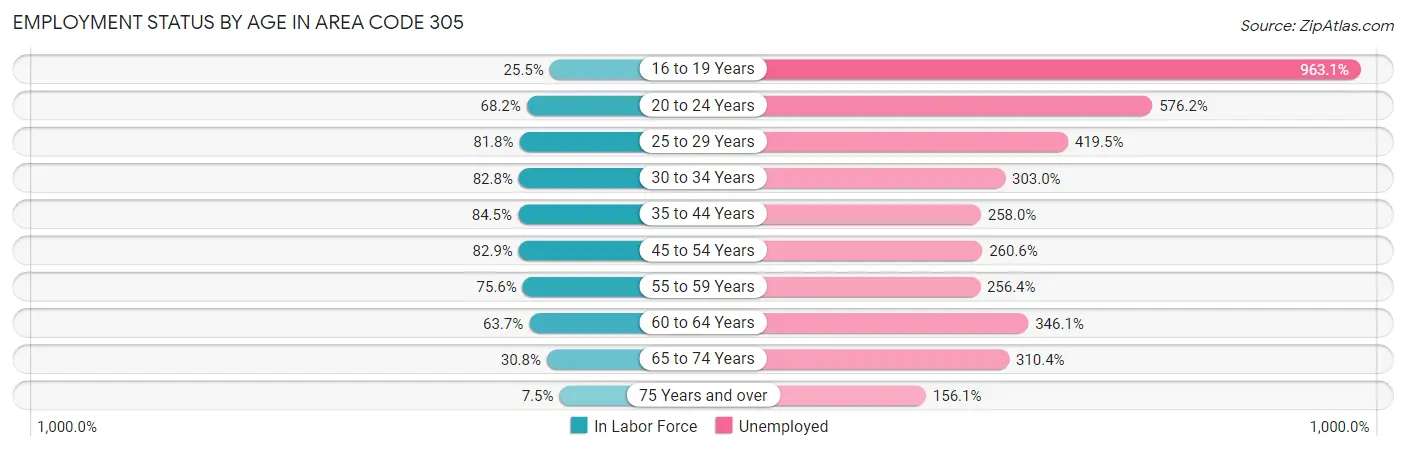
| Age Bracket | In Labor Force | Unemployed |
| 16 to 19 Years | 27,460 (25.5%) | 264,467 (963.1%) |
| 20 to 24 Years | 94,958 (68.2%) | 547,136 (576.2%) |
| 25 to 29 Years | 131,135 (81.8%) | 550,145 (419.5%) |
| 30 to 34 Years | 141,568 (82.8%) | 428,969 (303.0%) |
| 35 to 44 Years | 269,997 (84.5%) | 696,554 (258.0%) |
| 45 to 54 Years | 273,641 (82.9%) | 713,127 (260.6%) |
| 55 to 59 Years | 122,002 (75.6%) | 312,805 (256.4%) |
| 60 to 64 Years | 87,963 (63.7%) | 304,419 (346.1%) |
| 65 to 74 Years | 65,186 (30.8%) | 202,347 (310.4%) |
| 75 Years and over | 13,461 (7.5%) | 21,013 (156.1%) |
| Total | 1,214,645 (63.3%) | 56,685 (4.7%) |
Employment Status by Educational Attainment in Area Code 305
According to labor force statistics for Area Code 305, 79.9% of individuals (1,022,523) out of the total population between 25 and 64 years of age (1,280,234) are in the labor force, with 289.6% or 2,961,227 of them being unemployed. The group with the highest labor force participation rate are those with the educational attainment of bachelor's degree or higher, with 85.8% or 385,569 individuals in the labor force. Within the labor force, individuals with less than high school education have the highest percentage of unemployment, with 353.1% or 418,974 of them being unemployed.
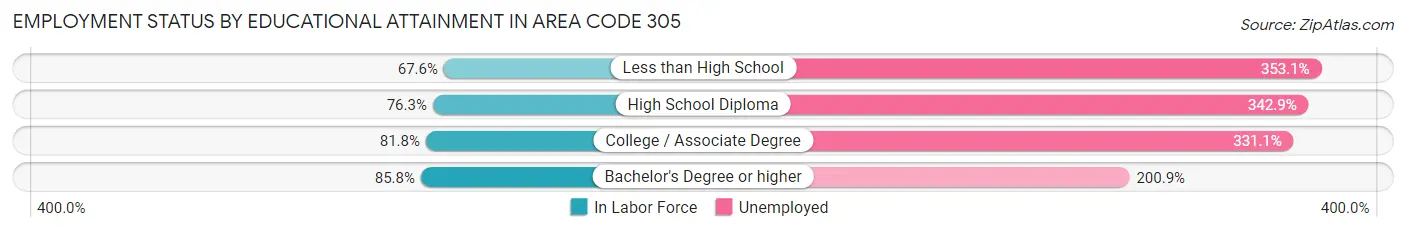
| Educational Attainment | In Labor Force | Unemployed |
| Less than High School | 118,655 (67.6%) | 620,153 (353.1%) |
| High School Diploma | 260,201 (76.3%) | 1,169,049 (342.9%) |
| College / Associate Degree | 257,273 (81.8%) | 1,040,793 (331.1%) |
| Bachelor's Degree or higher | 385,555 (85.8%) | 902,702 (200.9%) |
| Total | 1,022,534 (79.9%) | 3,707,558 (289.6%) |
Employment Occupations by Sex in Area Code 305
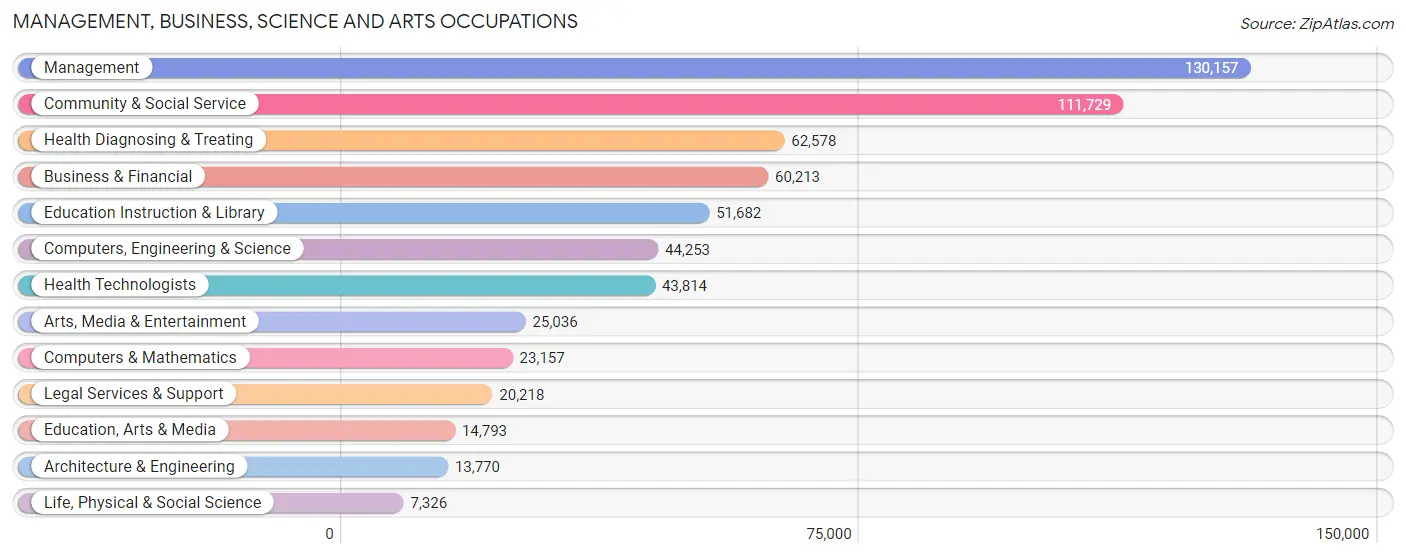
Management, Business, Science and Arts Occupations
The most common Management, Business, Science and Arts occupations in Area Code 305 are Management (130,157 | 11.2%), Community & Social Service (111,729 | 9.6%), Health Diagnosing & Treating (62,578 | 5.4%), Business & Financial (60,213 | 5.2%), and Education Instruction & Library (51,682 | 4.4%).
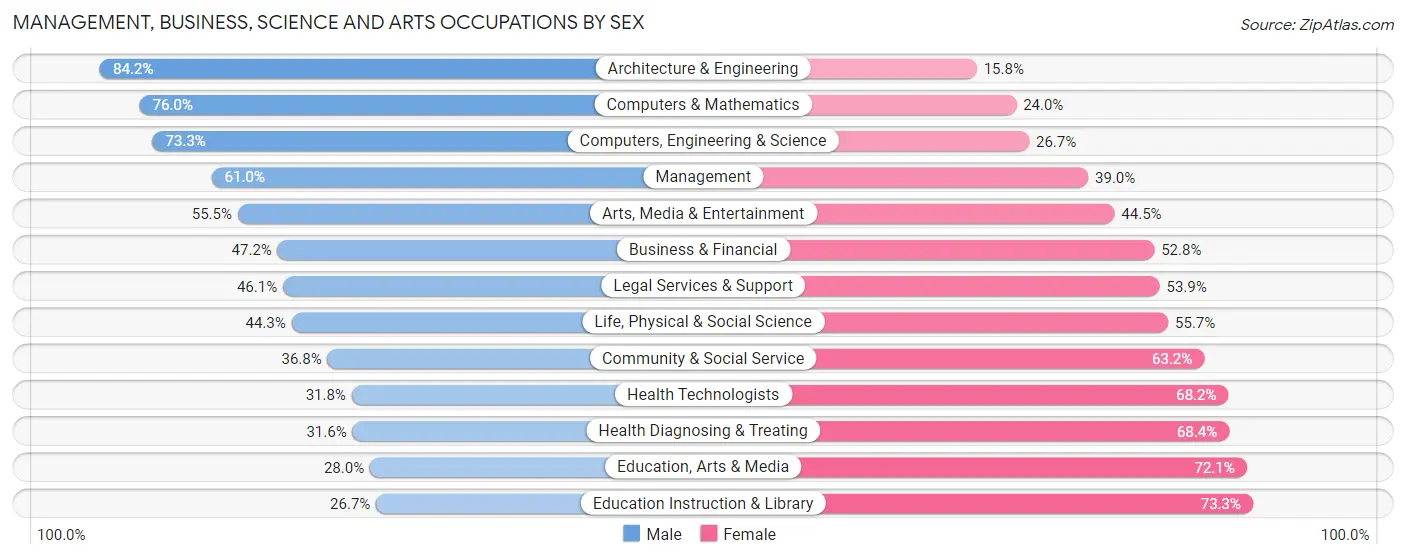
Management, Business, Science and Arts Occupations by Sex
Within the Management, Business, Science and Arts occupations in Area Code 305, the most male-oriented occupations are Architecture & Engineering (84.2%), Computers & Mathematics (76.0%), and Computers, Engineering & Science (73.3%), while the most female-oriented occupations are Education Instruction & Library (73.3%), Education, Arts & Media (72.1%), and Health Diagnosing & Treating (68.4%).
| Occupation | Male | Female |
| Management | 79,402 (61.0%) | 50,755 (39.0%) |
| Business & Financial | 28,427 (47.2%) | 31,786 (52.8%) |
| Computers, Engineering & Science | 32,449 (73.3%) | 11,804 (26.7%) |
| Computers & Mathematics | 17,602 (76.0%) | 5,555 (24.0%) |
| Architecture & Engineering | 11,600 (84.2%) | 2,170 (15.8%) |
| Life, Physical & Social Science | 3,247 (44.3%) | 4,079 (55.7%) |
| Community & Social Service | 41,130 (36.8%) | 70,599 (63.2%) |
| Education, Arts & Media | 4,134 (28.0%) | 10,659 (72.1%) |
| Legal Services & Support | 9,321 (46.1%) | 10,897 (53.9%) |
| Education Instruction & Library | 13,776 (26.7%) | 37,906 (73.3%) |
| Arts, Media & Entertainment | 13,899 (55.5%) | 11,137 (44.5%) |
| Health Diagnosing & Treating | 19,775 (31.6%) | 42,803 (68.4%) |
| Health Technologists | 13,918 (31.8%) | 29,896 (68.2%) |
| Total (Category) | 201,183 (49.2%) | 207,747 (50.8%) |
| Total (Overall) | 621,672 (53.6%) | 538,553 (46.4%) |
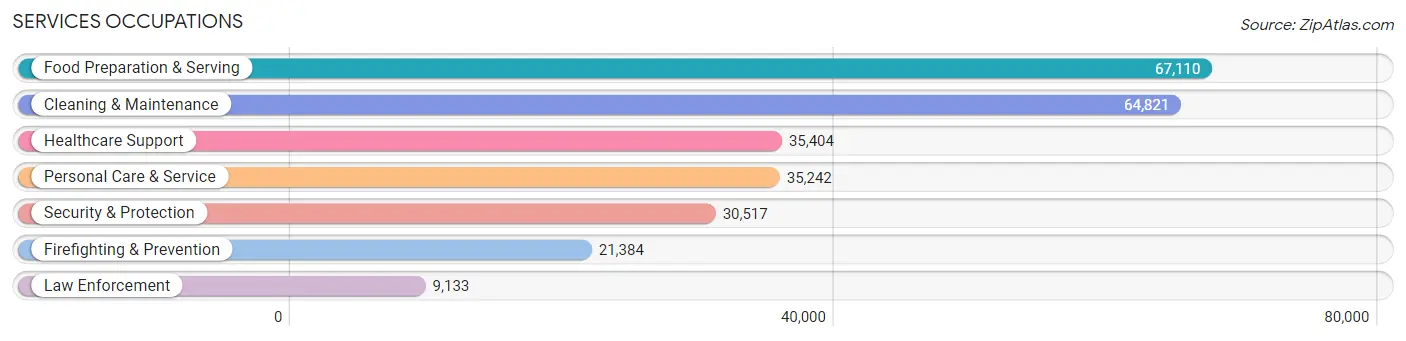
Services Occupations
The most common Services occupations in Area Code 305 are Food Preparation & Serving (67,110 | 5.8%), Cleaning & Maintenance (64,821 | 5.6%), Healthcare Support (35,404 | 3.0%), Personal Care & Service (35,242 | 3.0%), and Security & Protection (30,517 | 2.6%).
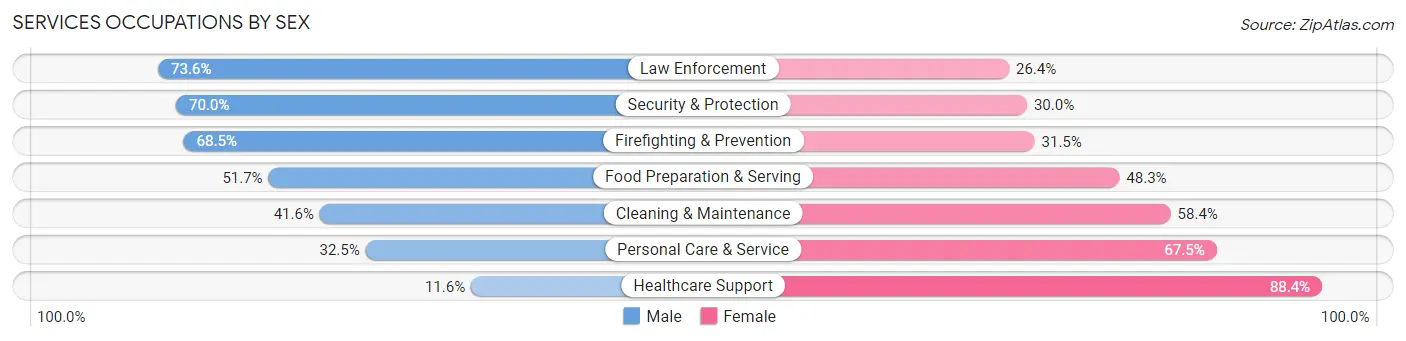
Services Occupations by Sex
Within the Services occupations in Area Code 305, the most male-oriented occupations are Law Enforcement (73.6%), Security & Protection (70.0%), and Firefighting & Prevention (68.5%), while the most female-oriented occupations are Healthcare Support (88.4%), Personal Care & Service (67.5%), and Cleaning & Maintenance (58.4%).
| Occupation | Male | Female |
| Healthcare Support | 4,109 (11.6%) | 31,295 (88.4%) |
| Security & Protection | 21,366 (70.0%) | 9,151 (30.0%) |
| Firefighting & Prevention | 14,648 (68.5%) | 6,736 (31.5%) |
| Law Enforcement | 6,718 (73.6%) | 2,415 (26.4%) |
| Food Preparation & Serving | 34,701 (51.7%) | 32,409 (48.3%) |
| Cleaning & Maintenance | 26,941 (41.6%) | 37,880 (58.4%) |
| Personal Care & Service | 11,445 (32.5%) | 23,797 (67.5%) |
| Total (Category) | 98,562 (42.3%) | 134,532 (57.7%) |
| Total (Overall) | 621,672 (53.6%) | 538,553 (46.4%) |
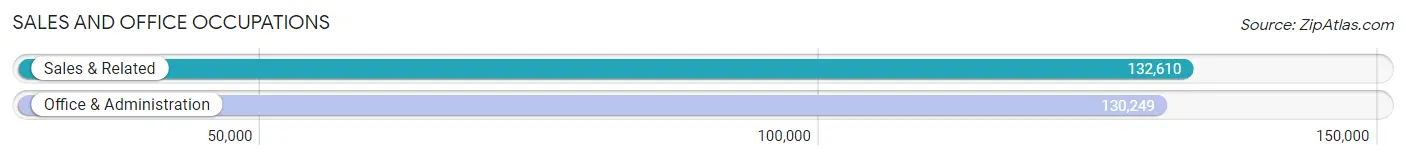
Sales and Office Occupations
The most common Sales and Office occupations in Area Code 305 are Sales & Related (132,610 | 11.4%), and Office & Administration (130,249 | 11.2%).
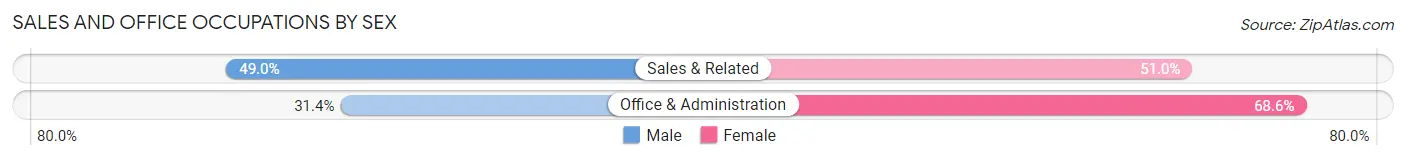
Sales and Office Occupations by Sex
| Occupation | Male | Female |
| Sales & Related | 64,920 (49.0%) | 67,690 (51.0%) |
| Office & Administration | 40,951 (31.4%) | 89,298 (68.6%) |
| Total (Category) | 105,871 (40.3%) | 156,988 (59.7%) |
| Total (Overall) | 621,672 (53.6%) | 538,553 (46.4%) |
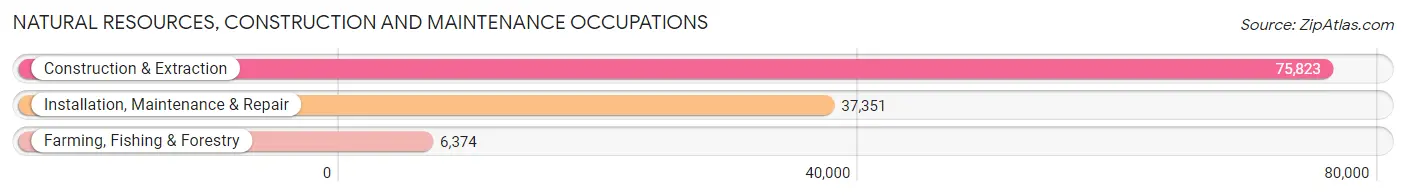
Natural Resources, Construction and Maintenance Occupations
The most common Natural Resources, Construction and Maintenance occupations in Area Code 305 are Construction & Extraction (75,823 | 6.5%), Installation, Maintenance & Repair (37,351 | 3.2%), and Farming, Fishing & Forestry (6,374 | 0.5%).
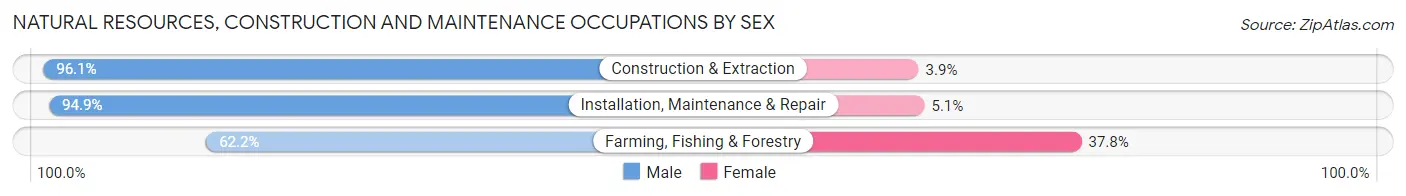
Natural Resources, Construction and Maintenance Occupations by Sex
| Occupation | Male | Female |
| Farming, Fishing & Forestry | 3,965 (62.2%) | 2,409 (37.8%) |
| Construction & Extraction | 72,865 (96.1%) | 2,958 (3.9%) |
| Installation, Maintenance & Repair | 35,439 (94.9%) | 1,912 (5.1%) |
| Total (Category) | 112,269 (93.9%) | 7,279 (6.1%) |
| Total (Overall) | 621,672 (53.6%) | 538,553 (46.4%) |
Production, Transportation and Moving Occupations
The most common Production, Transportation and Moving occupations in Area Code 305 are Transportation (63,993 | 5.5%), Production (36,398 | 3.1%), and Material Moving (35,403 | 3.0%).
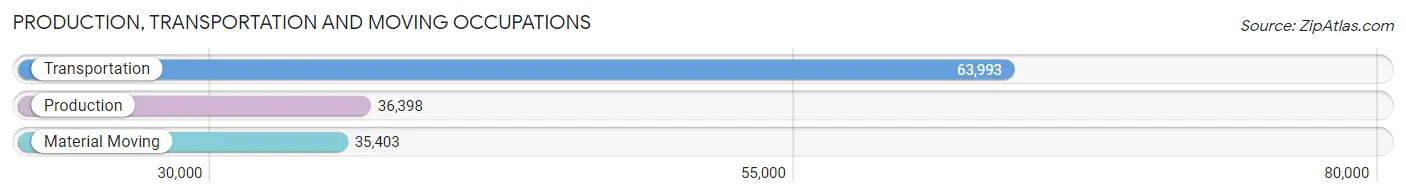
Production, Transportation and Moving Occupations by Sex
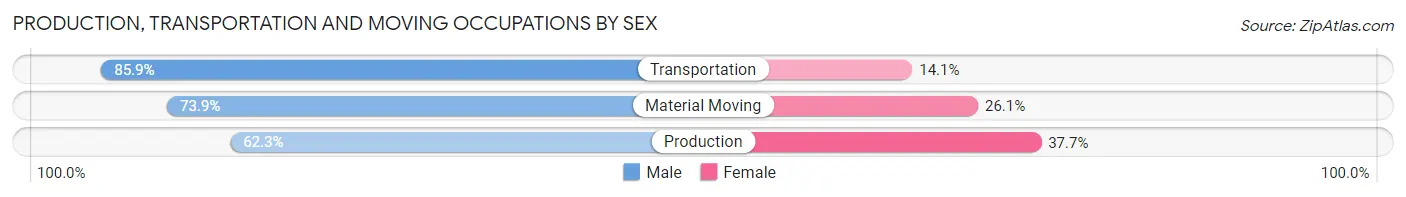
| Occupation | Male | Female |
| Production | 22,660 (62.3%) | 13,738 (37.7%) |
| Transportation | 54,980 (85.9%) | 9,013 (14.1%) |
| Material Moving | 26,147 (73.9%) | 9,256 (26.1%) |
| Total (Category) | 103,787 (76.4%) | 32,007 (23.6%) |
| Total (Overall) | 621,672 (53.6%) | 538,553 (46.4%) |
Employment Industries by Sex in Area Code 305
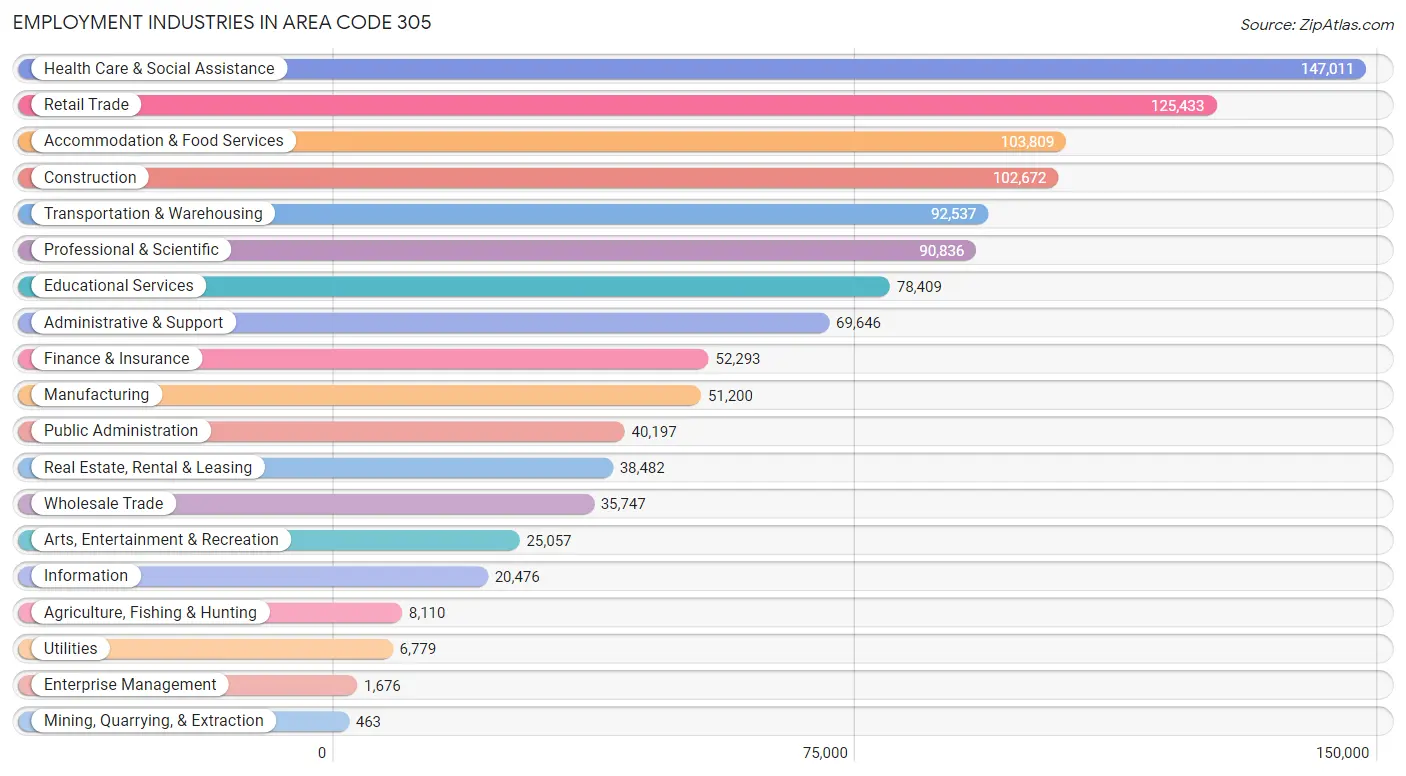
Employment Industries in Area Code 305
The major employment industries in Area Code 305 include Health Care & Social Assistance (147,011 | 12.7%), Retail Trade (125,433 | 10.8%), Accommodation & Food Services (103,809 | 8.9%), Construction (102,672 | 8.8%), and Transportation & Warehousing (92,537 | 8.0%).
Employment Industries by Sex in Area Code 305
The Area Code 305 industries that see more men than women are Mining, Quarrying, & Extraction (90.9%), Construction (89.6%), and Utilities (76.7%), whereas the industries that tend to have a higher number of women are Health Care & Social Assistance (73.8%), Educational Services (69.0%), and Enterprise Management (57.9%).
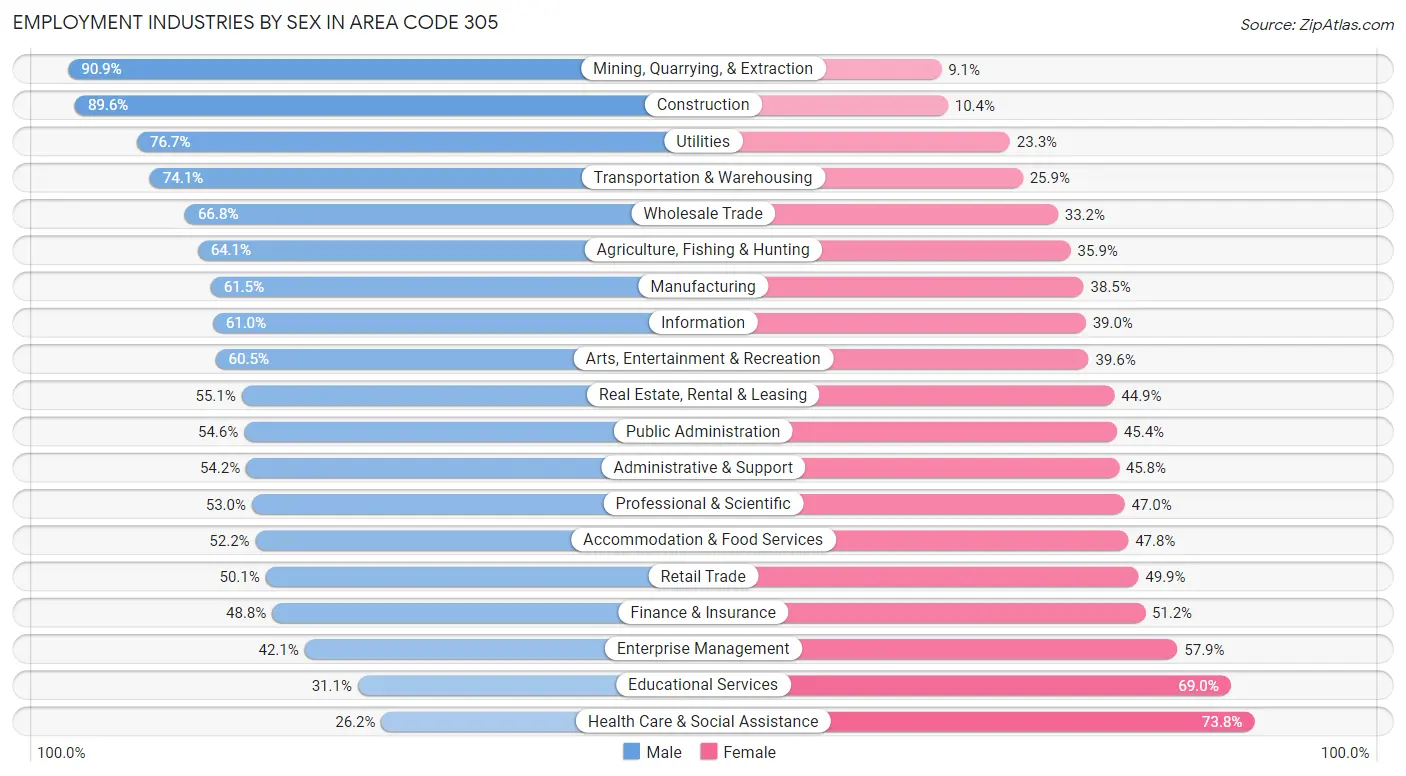
| Industry | Male | Female |
| Agriculture, Fishing & Hunting | 5,202 (64.1%) | 2,908 (35.9%) |
| Mining, Quarrying, & Extraction | 421 (90.9%) | 42 (9.1%) |
| Construction | 91,959 (89.6%) | 10,713 (10.4%) |
| Manufacturing | 31,470 (61.5%) | 19,730 (38.5%) |
| Wholesale Trade | 23,878 (66.8%) | 11,869 (33.2%) |
| Retail Trade | 62,880 (50.1%) | 62,553 (49.9%) |
| Transportation & Warehousing | 68,534 (74.1%) | 24,003 (25.9%) |
| Utilities | 5,201 (76.7%) | 1,578 (23.3%) |
| Information | 12,497 (61.0%) | 7,979 (39.0%) |
| Finance & Insurance | 25,504 (48.8%) | 26,789 (51.2%) |
| Real Estate, Rental & Leasing | 21,204 (55.1%) | 17,278 (44.9%) |
| Professional & Scientific | 48,128 (53.0%) | 42,708 (47.0%) |
| Enterprise Management | 705 (42.1%) | 971 (57.9%) |
| Administrative & Support | 37,737 (54.2%) | 31,909 (45.8%) |
| Educational Services | 24,349 (31.0%) | 54,060 (69.0%) |
| Health Care & Social Assistance | 38,475 (26.2%) | 108,536 (73.8%) |
| Arts, Entertainment & Recreation | 15,148 (60.5%) | 9,909 (39.6%) |
| Accommodation & Food Services | 54,224 (52.2%) | 49,585 (47.8%) |
| Public Administration | 21,936 (54.6%) | 18,261 (45.4%) |
| Total | 621,672 (53.6%) | 538,553 (46.4%) |
Education in Area Code 305
School Enrollment in Area Code 305
The most common levels of schooling among the 543,956 students in Area Code 305 are college / undergraduate (131,365 | 24.1%), high school (106,994 | 19.7%), and middle school (104,614 | 19.2%).
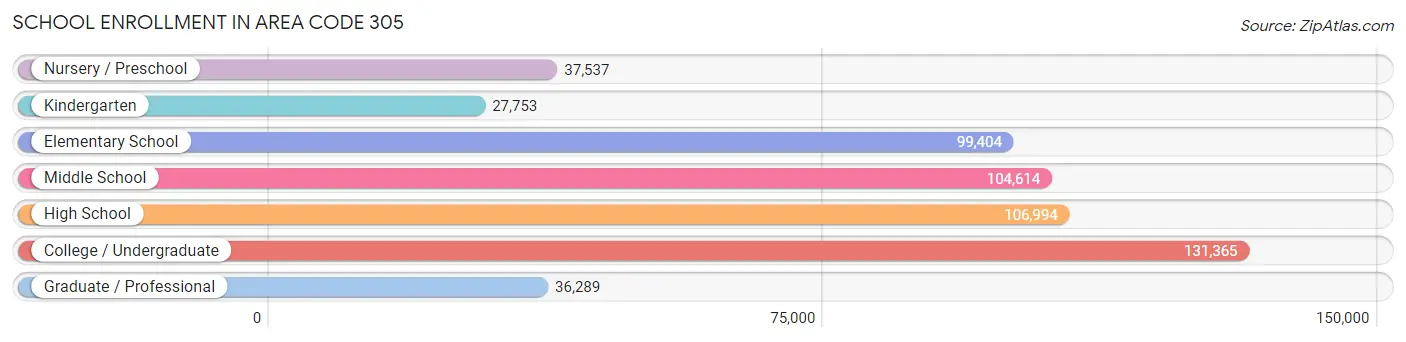
| School Level | # Students | % Students |
| Nursery / Preschool | 37,537 | 6.9% |
| Kindergarten | 27,753 | 5.1% |
| Elementary School | 99,404 | 18.3% |
| Middle School | 104,614 | 19.2% |
| High School | 106,994 | 19.7% |
| College / Undergraduate | 131,365 | 24.1% |
| Graduate / Professional | 36,289 | 6.7% |
| Total | 543,956 | 100.0% |
School Enrollment by Age by Funding Source in Area Code 305
Out of a total of 543,956 students who are enrolled in schools in Area Code 305, 117,035 (21.5%) attend a private institution, while the remaining 426,921 (78.5%) are enrolled in public schools. The age group of 3 to 4 year olds has the highest likelihood of being enrolled in private schools, with 15,201 (44.5% in the age bracket) enrolled. Conversely, the age group of 15 to 17 year olds has the lowest likelihood of being enrolled in a private school, with 63,485 (86.8% in the age bracket) attending a public institution.
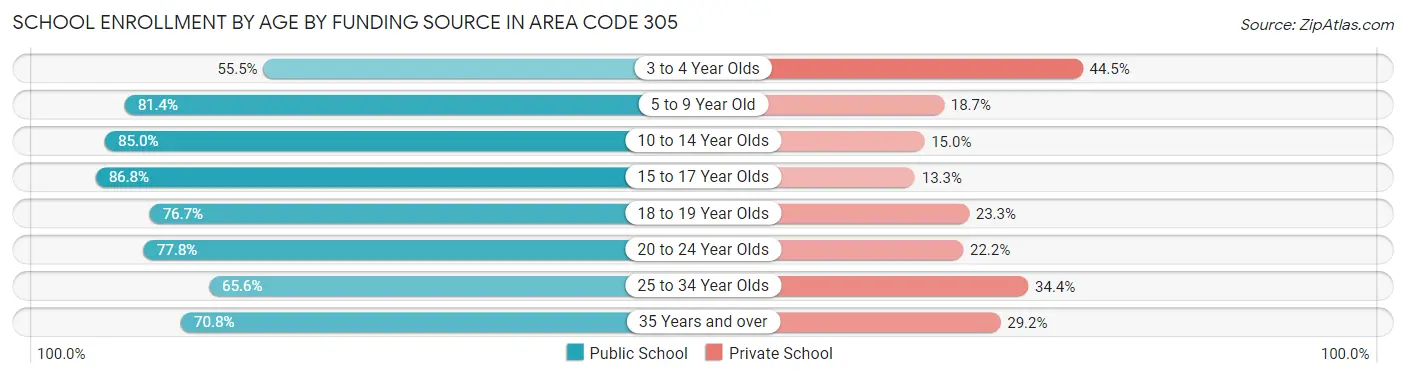
| Age Bracket | Public School | Private School |
| 3 to 4 Year Olds | 18,963 (55.5%) | 15,201 (44.5%) |
| 5 to 9 Year Old | 95,784 (81.4%) | 21,955 (18.6%) |
| 10 to 14 Year Olds | 107,373 (85.0%) | 18,968 (15.0%) |
| 15 to 17 Year Olds | 63,485 (86.8%) | 9,693 (13.3%) |
| 18 to 19 Year Olds | 33,807 (76.7%) | 10,274 (23.3%) |
| 20 to 24 Year Olds | 50,318 (77.8%) | 14,387 (22.2%) |
| 25 to 34 Year Olds | 26,962 (65.6%) | 14,114 (34.4%) |
| 35 Years and over | 30,223 (70.8%) | 12,449 (29.2%) |
| Total | 426,921 (78.5%) | 117,035 (21.5%) |
Educational Attainment by Field of Study in Area Code 305
Business (153,629 | 26.6%), science & technology (61,226 | 10.6%), education (57,563 | 10.0%), engineering (54,989 | 9.5%), and social sciences (44,792 | 7.7%) are the most common fields of study among 578,034 individuals in Area Code 305 who have obtained a bachelor's degree or higher.
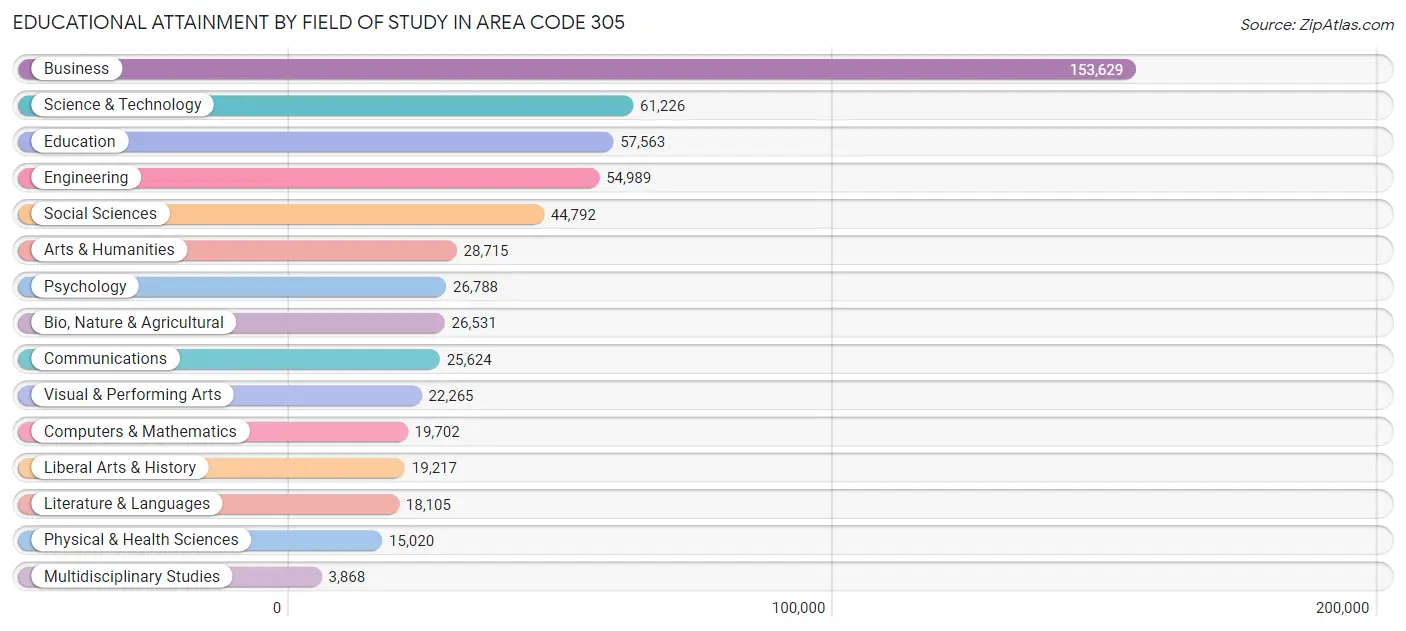
| Field of Study | # Graduates | % Graduates |
| Computers & Mathematics | 19,702 | 3.4% |
| Bio, Nature & Agricultural | 26,531 | 4.6% |
| Physical & Health Sciences | 15,020 | 2.6% |
| Psychology | 26,788 | 4.6% |
| Social Sciences | 44,792 | 7.7% |
| Engineering | 54,989 | 9.5% |
| Multidisciplinary Studies | 3,868 | 0.7% |
| Science & Technology | 61,226 | 10.6% |
| Business | 153,629 | 26.6% |
| Education | 57,563 | 10.0% |
| Literature & Languages | 18,105 | 3.1% |
| Liberal Arts & History | 19,217 | 3.3% |
| Visual & Performing Arts | 22,265 | 3.8% |
| Communications | 25,624 | 4.4% |
| Arts & Humanities | 28,715 | 5.0% |
| Total | 578,034 | 100.0% |
Transportation & Commute in Area Code 305
Vehicle Availability by Sex in Area Code 305
The most prevalent vehicle ownership categories in Area Code 305 are males with 2 vehicles (250,832, accounting for 41.0%) and females with 2 vehicles (202,998, making up 47.8%).
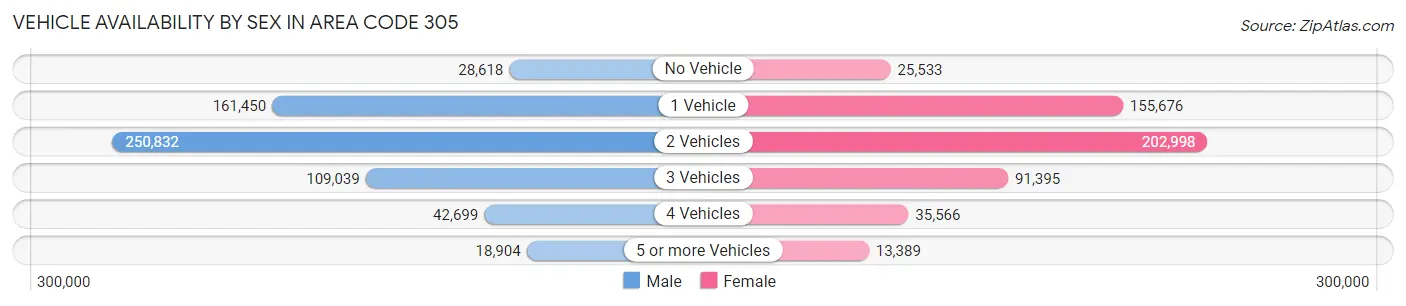
| Vehicles Available | Male | Female |
| No Vehicle | 28,618 (4.7%) | 25,533 (4.9%) |
| 1 Vehicle | 161,450 (26.4%) | 155,676 (29.7%) |
| 2 Vehicles | 250,832 (41.0%) | 202,998 (38.7%) |
| 3 Vehicles | 109,039 (17.8%) | 91,395 (17.4%) |
| 4 Vehicles | 42,699 (7.0%) | 35,566 (6.8%) |
| 5 or more Vehicles | 18,904 (3.1%) | 13,389 (2.5%) |
| Total | 611,542 (100.0%) | 524,557 (100.0%) |
Commute Time in Area Code 305
The most frequently occuring commute durations in Area Code 305 are 30 to 34 minutes (201,092 commuters, 19.7%), 20 to 24 minutes (149,050 commuters, 14.6%), and 15 to 19 minutes (122,520 commuters, 12.0%).
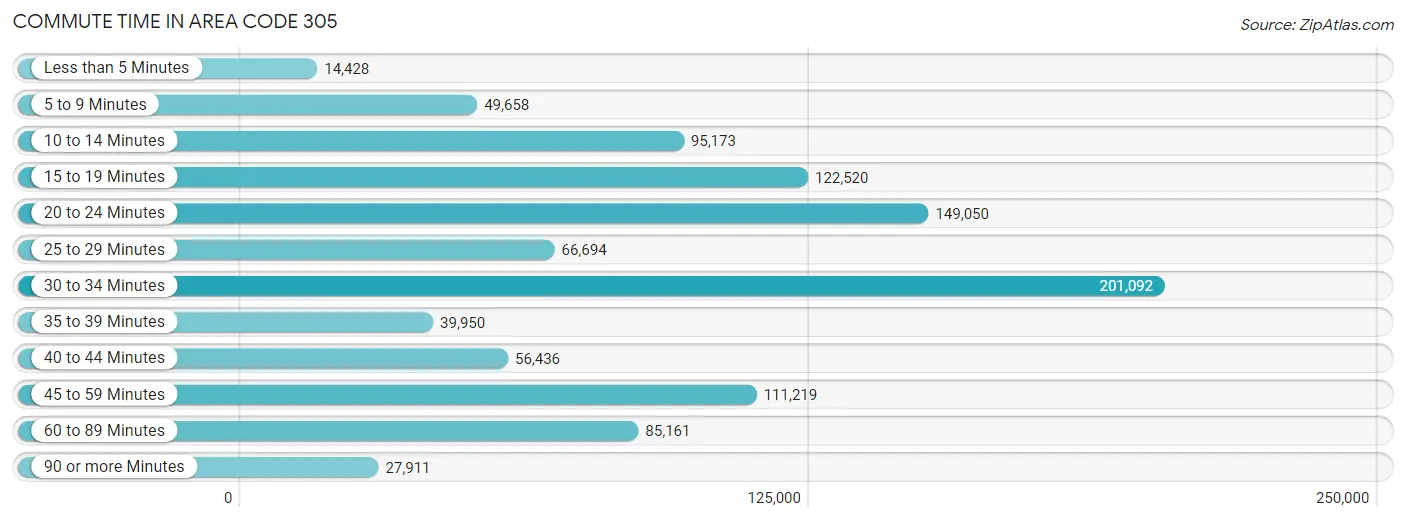
| Commute Time | # Commuters | % Commuters |
| Less than 5 Minutes | 14,428 | 1.4% |
| 5 to 9 Minutes | 49,658 | 4.9% |
| 10 to 14 Minutes | 95,173 | 9.3% |
| 15 to 19 Minutes | 122,520 | 12.0% |
| 20 to 24 Minutes | 149,050 | 14.6% |
| 25 to 29 Minutes | 66,694 | 6.5% |
| 30 to 34 Minutes | 201,092 | 19.7% |
| 35 to 39 Minutes | 39,950 | 3.9% |
| 40 to 44 Minutes | 56,436 | 5.5% |
| 45 to 59 Minutes | 111,219 | 10.9% |
| 60 to 89 Minutes | 85,161 | 8.4% |
| 90 or more Minutes | 27,911 | 2.7% |
Commute Time by Sex in Area Code 305
The most common commute times in Area Code 305 are 30 to 34 minutes (111,074 commuters, 20.2%) for males and 30 to 34 minutes (90,018 commuters, 19.2%) for females.
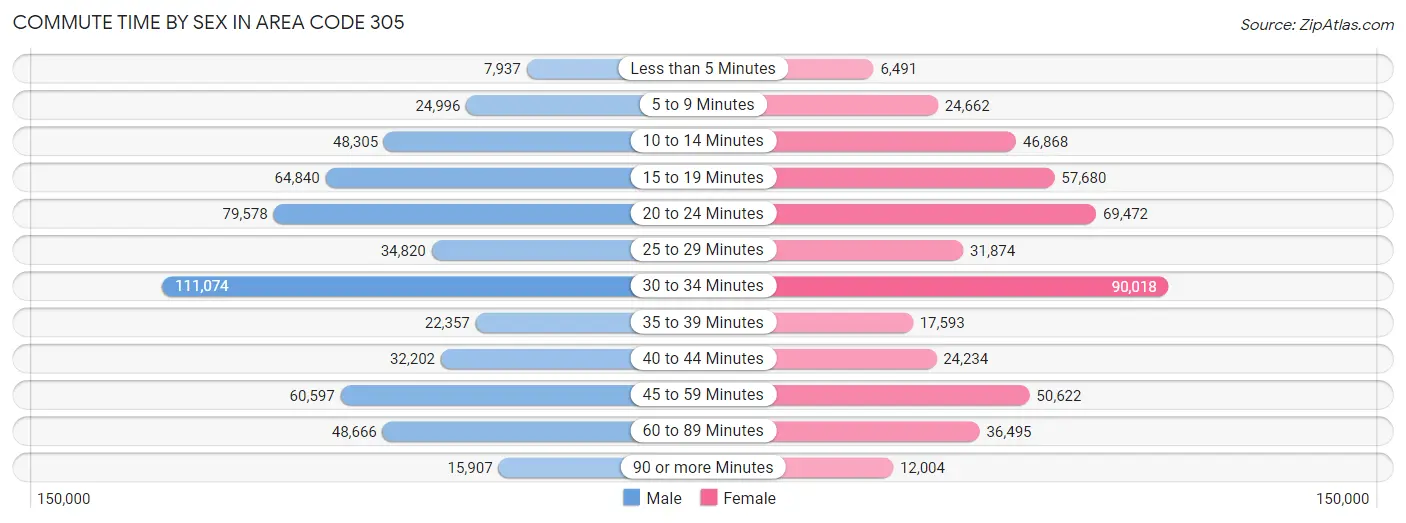
| Commute Time | Male | Female |
| Less than 5 Minutes | 7,937 (1.4%) | 6,491 (1.4%) |
| 5 to 9 Minutes | 24,996 (4.5%) | 24,662 (5.3%) |
| 10 to 14 Minutes | 48,305 (8.8%) | 46,868 (10.0%) |
| 15 to 19 Minutes | 64,840 (11.8%) | 57,680 (12.3%) |
| 20 to 24 Minutes | 79,578 (14.4%) | 69,472 (14.8%) |
| 25 to 29 Minutes | 34,820 (6.3%) | 31,874 (6.8%) |
| 30 to 34 Minutes | 111,074 (20.2%) | 90,018 (19.2%) |
| 35 to 39 Minutes | 22,357 (4.1%) | 17,593 (3.8%) |
| 40 to 44 Minutes | 32,202 (5.8%) | 24,234 (5.2%) |
| 45 to 59 Minutes | 60,597 (11.0%) | 50,622 (10.8%) |
| 60 to 89 Minutes | 48,666 (8.8%) | 36,495 (7.8%) |
| 90 or more Minutes | 15,907 (2.9%) | 12,004 (2.6%) |
Time of Departure to Work by Sex in Area Code 305
The most frequent times of departure to work in Area Code 305 are 8:00 AM to 8:29 AM (89,268, 16.2%) for males and 8:00 AM to 8:29 AM (83,447, 17.8%) for females.
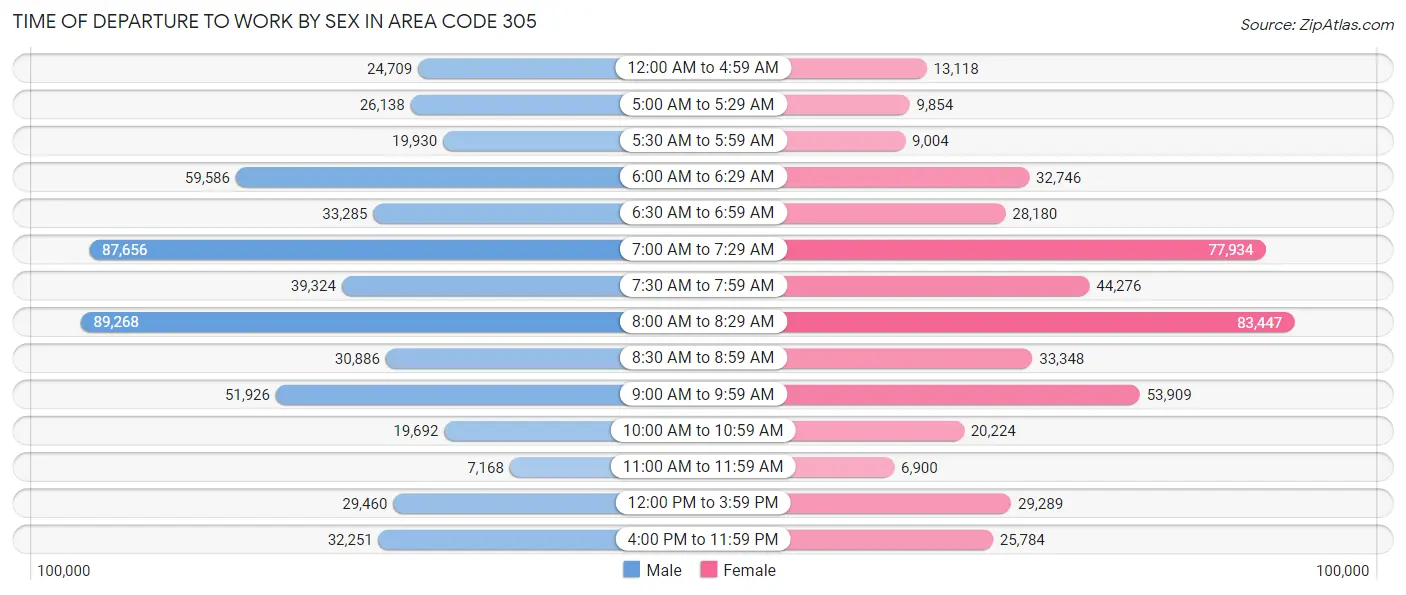
| Time of Departure | Male | Female |
| 12:00 AM to 4:59 AM | 24,709 (4.5%) | 13,118 (2.8%) |
| 5:00 AM to 5:29 AM | 26,138 (4.7%) | 9,854 (2.1%) |
| 5:30 AM to 5:59 AM | 19,930 (3.6%) | 9,004 (1.9%) |
| 6:00 AM to 6:29 AM | 59,586 (10.8%) | 32,746 (7.0%) |
| 6:30 AM to 6:59 AM | 33,285 (6.0%) | 28,180 (6.0%) |
| 7:00 AM to 7:29 AM | 87,656 (15.9%) | 77,934 (16.7%) |
| 7:30 AM to 7:59 AM | 39,324 (7.1%) | 44,276 (9.5%) |
| 8:00 AM to 8:29 AM | 89,268 (16.2%) | 83,447 (17.8%) |
| 8:30 AM to 8:59 AM | 30,886 (5.6%) | 33,348 (7.1%) |
| 9:00 AM to 9:59 AM | 51,926 (9.4%) | 53,909 (11.5%) |
| 10:00 AM to 10:59 AM | 19,692 (3.6%) | 20,224 (4.3%) |
| 11:00 AM to 11:59 AM | 7,168 (1.3%) | 6,900 (1.5%) |
| 12:00 PM to 3:59 PM | 29,460 (5.3%) | 29,289 (6.3%) |
| 4:00 PM to 11:59 PM | 32,251 (5.9%) | 25,784 (5.5%) |
| Total | 551,279 (100.0%) | 468,013 (100.0%) |
Housing Occupancy in Area Code 305
Occupancy by Ownership in Area Code 305
Of the total 850,995 dwellings in Area Code 305, owner-occupied units account for 414,806 (48.7%), while renter-occupied units make up 436,189 (51.3%).
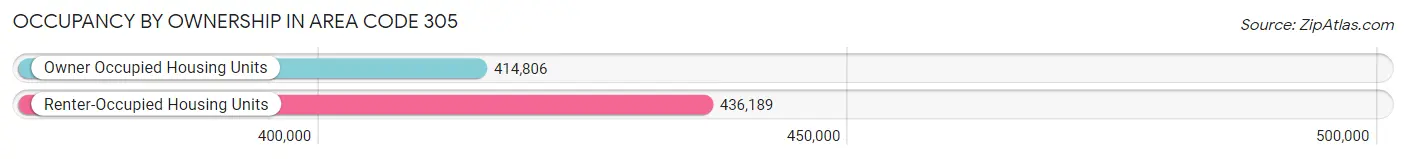
| Occupancy | # Housing Units | % Housing Units |
| Owner Occupied Housing Units | 414,806 | 48.7% |
| Renter-Occupied Housing Units | 436,189 | 51.3% |
| Total Occupied Housing Units | 850,995 | 100.0% |
Occupancy by Household Size in Area Code 305
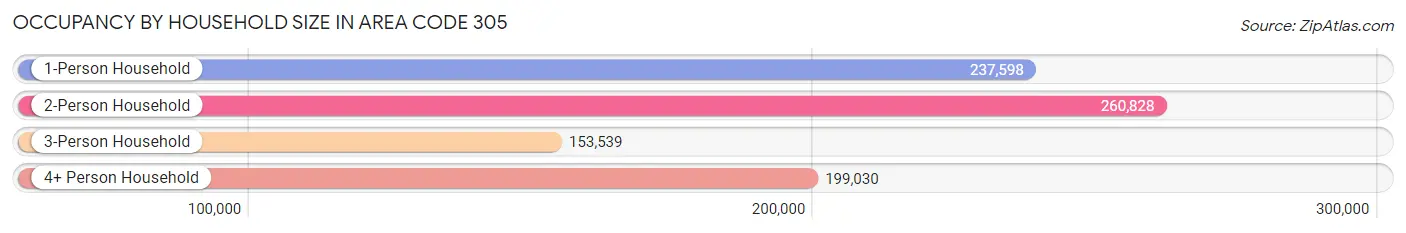
| Household Size | # Housing Units | % Housing Units |
| 1-Person Household | 237,598 | 27.9% |
| 2-Person Household | 260,828 | 30.6% |
| 3-Person Household | 153,539 | 18.0% |
| 4+ Person Household | 199,030 | 23.4% |
| Total Housing Units | 850,995 | 100.0% |
Occupancy by Ownership by Household Size in Area Code 305
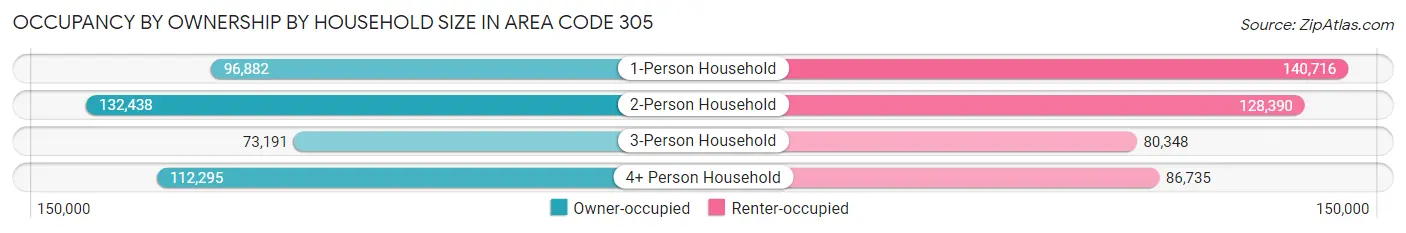
| Household Size | Owner-occupied | Renter-occupied |
| 1-Person Household | 96,882 (40.8%) | 140,716 (59.2%) |
| 2-Person Household | 132,438 (50.8%) | 128,390 (49.2%) |
| 3-Person Household | 73,191 (47.7%) | 80,348 (52.3%) |
| 4+ Person Household | 112,295 (56.4%) | 86,735 (43.6%) |
| Total Housing Units | 414,806 (48.7%) | 436,189 (51.3%) |
Occupancy by Educational Attainment in Area Code 305
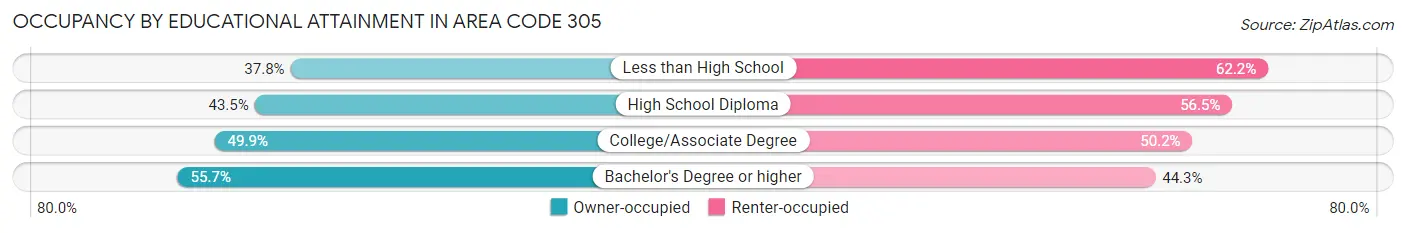
| Household Size | Owner-occupied | Renter-occupied |
| Less than High School | 49,024 (37.8%) | 80,519 (62.2%) |
| High School Diploma | 85,633 (43.5%) | 111,082 (56.5%) |
| College/Associate Degree | 104,049 (49.8%) | 104,690 (50.1%) |
| Bachelor's Degree or higher | 176,100 (55.7%) | 139,898 (44.3%) |
Occupancy by Age of Householder in Area Code 305
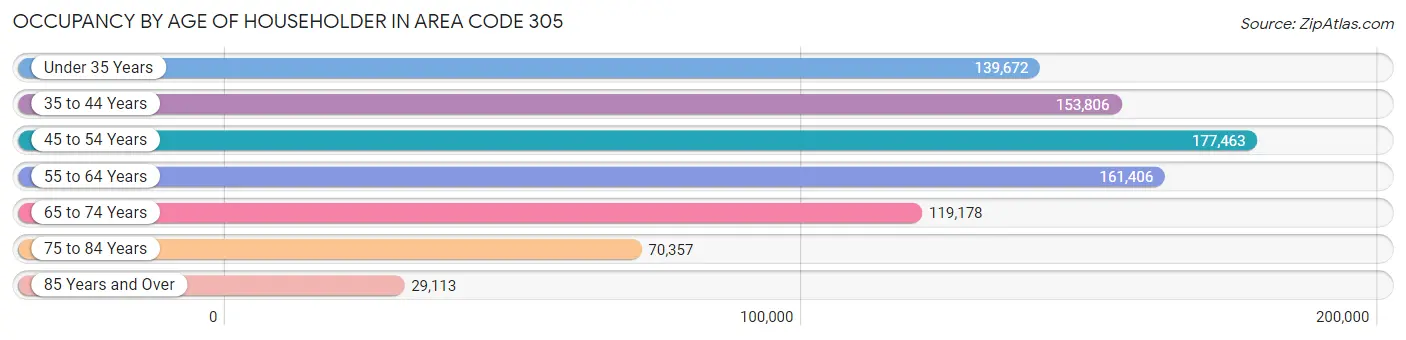
| Age Bracket | # Households | % Households |
| Under 35 Years | 139,672 | 16.4% |
| 35 to 44 Years | 153,806 | 18.1% |
| 45 to 54 Years | 177,463 | 20.8% |
| 55 to 64 Years | 161,406 | 19.0% |
| 65 to 74 Years | 119,178 | 14.0% |
| 75 to 84 Years | 70,357 | 8.3% |
| 85 Years and Over | 29,113 | 3.4% |
| Total | 850,995 | 100.0% |
Housing Finances in Area Code 305
Median Income by Occupancy in Area Code 305
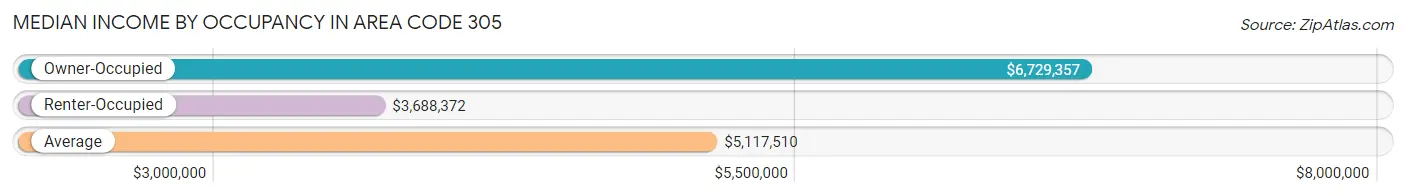
| Occupancy Type | # Households | Median Income |
| Owner-Occupied | 414,806 (48.7%) | $6,729,357 |
| Renter-Occupied | 436,189 (51.3%) | $3,688,372 |
| Average | 850,995 (100.0%) | $5,117,510 |
Occupancy by Householder Income Bracket in Area Code 305
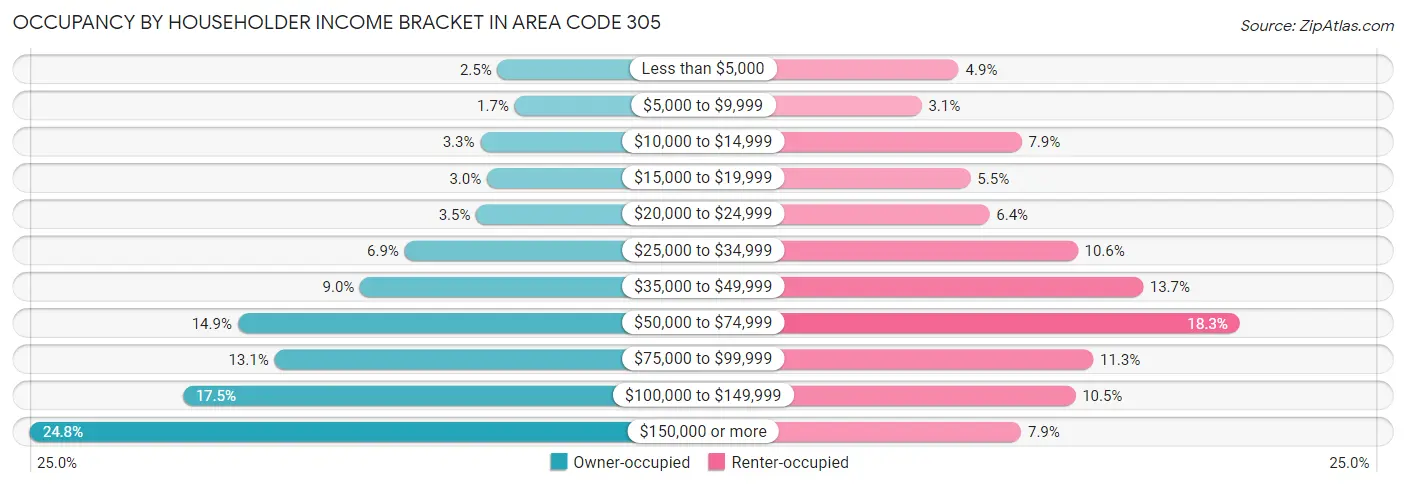
| Income Bracket | Owner-occupied | Renter-occupied |
| Less than $5,000 | 10,269 (2.5%) | 21,416 (4.9%) |
| $5,000 to $9,999 | 6,899 (1.7%) | 13,708 (3.1%) |
| $10,000 to $14,999 | 13,668 (3.3%) | 34,467 (7.9%) |
| $15,000 to $19,999 | 12,371 (3.0%) | 23,881 (5.5%) |
| $20,000 to $24,999 | 14,456 (3.5%) | 27,803 (6.4%) |
| $25,000 to $34,999 | 28,638 (6.9%) | 46,113 (10.6%) |
| $35,000 to $49,999 | 37,429 (9.0%) | 59,682 (13.7%) |
| $50,000 to $74,999 | 61,619 (14.8%) | 79,772 (18.3%) |
| $75,000 to $99,999 | 54,327 (13.1%) | 49,339 (11.3%) |
| $100,000 to $149,999 | 72,470 (17.5%) | 45,618 (10.5%) |
| $150,000 or more | 102,660 (24.7%) | 34,390 (7.9%) |
| Total | 414,806 (100.0%) | 436,189 (100.0%) |
Monthly Housing Cost Tiers in Area Code 305
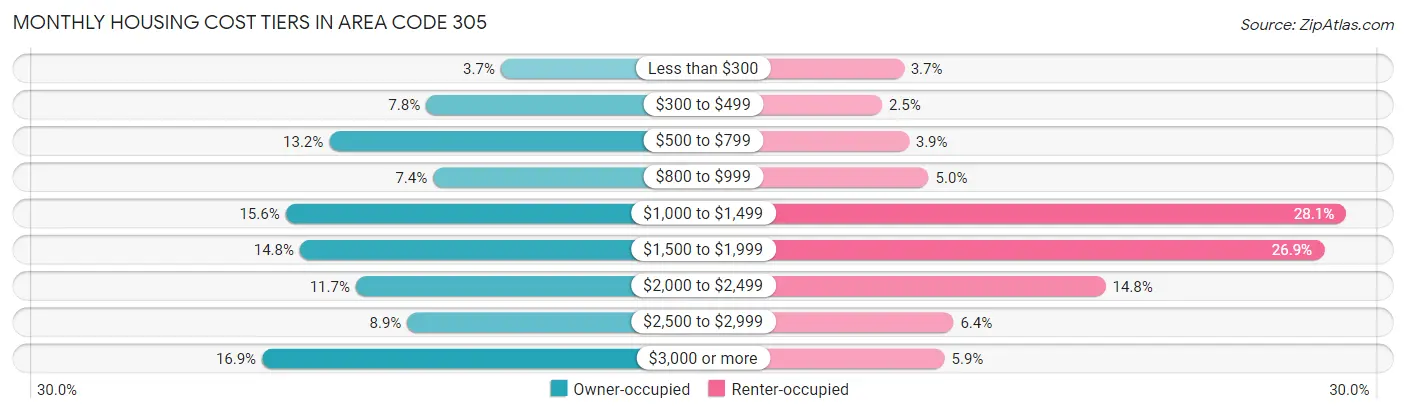
| Monthly Cost | Owner-occupied | Renter-occupied |
| Less than $300 | 15,334 (3.7%) | 15,976 (3.7%) |
| $300 to $499 | 32,496 (7.8%) | 10,740 (2.5%) |
| $500 to $799 | 54,664 (13.2%) | 17,172 (3.9%) |
| $800 to $999 | 30,848 (7.4%) | 22,000 (5.0%) |
| $1,000 to $1,499 | 64,670 (15.6%) | 122,523 (28.1%) |
| $1,500 to $1,999 | 61,374 (14.8%) | 117,206 (26.9%) |
| $2,000 to $2,499 | 48,558 (11.7%) | 64,578 (14.8%) |
| $2,500 to $2,999 | 36,796 (8.9%) | 27,954 (6.4%) |
| $3,000 or more | 70,066 (16.9%) | 25,801 (5.9%) |
| Total | 414,806 (100.0%) | 436,189 (100.0%) |
Physical Housing Characteristics in Area Code 305
Housing Structures in Area Code 305

| Structure Type | # Housing Units | % Housing Units |
| Single Unit, Detached | 335,512 | 39.4% |
| Single Unit, Attached | 79,121 | 9.3% |
| 2 Unit Apartments | 20,464 | 2.4% |
| 3 or 4 Unit Apartments | 30,474 | 3.6% |
| 5 to 9 Unit Apartments | 45,057 | 5.3% |
| 10 or more Apartments | 326,386 | 38.4% |
| Mobile Home / Other | 13,981 | 1.6% |
| Total | 850,995 | 100.0% |
Housing Structures by Occupancy in Area Code 305
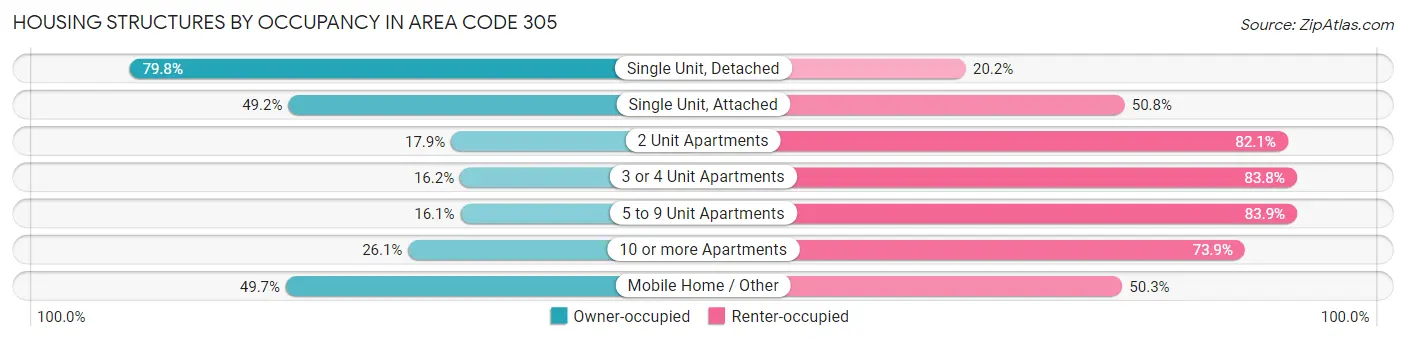
| Structure Type | Owner-occupied | Renter-occupied |
| Single Unit, Detached | 267,724 (79.8%) | 67,788 (20.2%) |
| Single Unit, Attached | 38,956 (49.2%) | 40,165 (50.8%) |
| 2 Unit Apartments | 3,661 (17.9%) | 16,803 (82.1%) |
| 3 or 4 Unit Apartments | 4,927 (16.2%) | 25,547 (83.8%) |
| 5 to 9 Unit Apartments | 7,260 (16.1%) | 37,797 (83.9%) |
| 10 or more Apartments | 85,329 (26.1%) | 241,057 (73.9%) |
| Mobile Home / Other | 6,949 (49.7%) | 7,032 (50.3%) |
| Total | 414,806 (48.7%) | 436,189 (51.3%) |
Housing Structures by Number of Rooms in Area Code 305
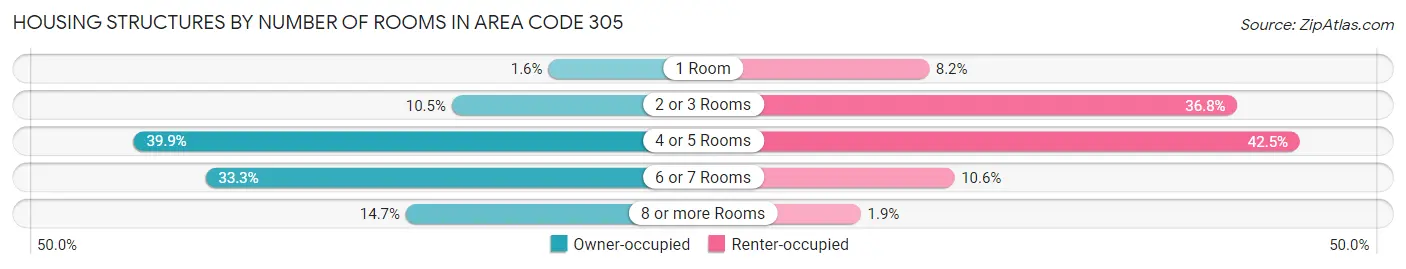
| Number of Rooms | Owner-occupied | Renter-occupied |
| 1 Room | 6,457 (1.6%) | 35,862 (8.2%) |
| 2 or 3 Rooms | 43,517 (10.5%) | 160,331 (36.8%) |
| 4 or 5 Rooms | 165,627 (39.9%) | 185,558 (42.5%) |
| 6 or 7 Rooms | 138,053 (33.3%) | 46,092 (10.6%) |
| 8 or more Rooms | 61,152 (14.7%) | 8,346 (1.9%) |
| Total | 414,806 (100.0%) | 436,189 (100.0%) |
Housing Structure by Heating Type in Area Code 305
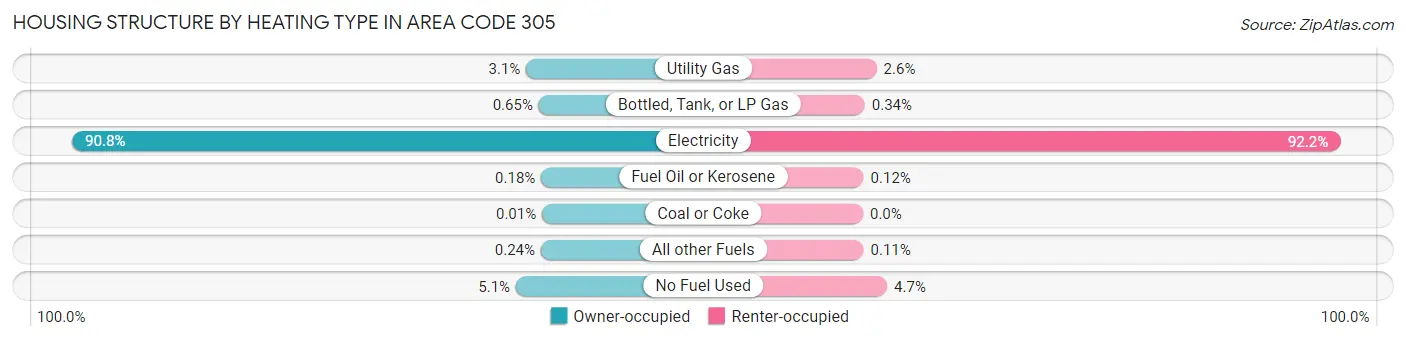
| Heating Type | Owner-occupied | Renter-occupied |
| Utility Gas | 12,753 (3.1%) | 11,452 (2.6%) |
| Bottled, Tank, or LP Gas | 2,690 (0.6%) | 1,469 (0.3%) |
| Electricity | 376,636 (90.8%) | 401,952 (92.1%) |
| Fuel Oil or Kerosene | 749 (0.2%) | 521 (0.1%) |
| Coal or Coke | 23 (0.0%) | 0 (0.0%) |
| All other Fuels | 982 (0.2%) | 469 (0.1%) |
| No Fuel Used | 20,973 (5.1%) | 20,326 (4.7%) |
| Total | 414,806 (100.0%) | 436,189 (100.0%) |
Household Vehicle Usage in Area Code 305
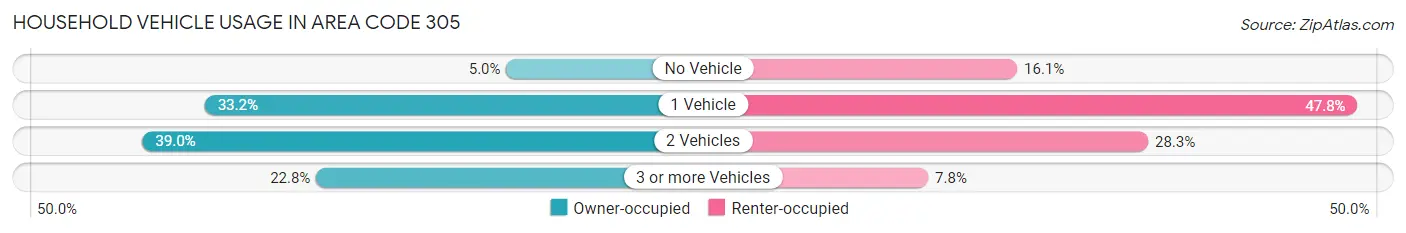
| Vehicles per Household | Owner-occupied | Renter-occupied |
| No Vehicle | 20,879 (5.0%) | 70,146 (16.1%) |
| 1 Vehicle | 137,645 (33.2%) | 208,672 (47.8%) |
| 2 Vehicles | 161,771 (39.0%) | 123,460 (28.3%) |
| 3 or more Vehicles | 94,511 (22.8%) | 33,911 (7.8%) |
| Total | 414,806 (100.0%) | 436,189 (100.0%) |
Real Estate & Mortgages in Area Code 305
Real Estate and Mortgage Overview in Area Code 305
| Characteristic | Without Mortgage | With Mortgage |
| Housing Units | 172,523 | 242,283 |
| Median Property Value | $32,740,201 | $32,643,900 |
| Median Household Income | $5,210,685 | $68,820 |
| Monthly Housing Costs | $58,545 | $63,014 |
| Real Estate Taxes | $245,603 | $6,555 |
Property Value by Mortgage Status in Area Code 305
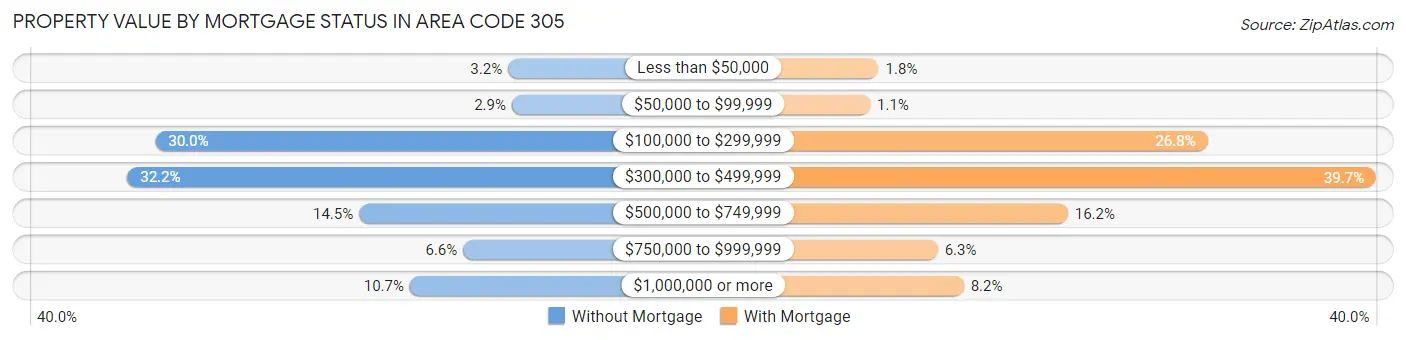
| Property Value | Without Mortgage | With Mortgage |
| Less than $50,000 | 5,462 (3.2%) | 4,261 (1.8%) |
| $50,000 to $99,999 | 4,968 (2.9%) | 2,694 (1.1%) |
| $100,000 to $299,999 | 51,820 (30.0%) | 64,946 (26.8%) |
| $300,000 to $499,999 | 55,495 (32.2%) | 96,075 (39.7%) |
| $500,000 to $749,999 | 25,042 (14.5%) | 39,178 (16.2%) |
| $750,000 to $999,999 | 11,363 (6.6%) | 15,156 (6.3%) |
| $1,000,000 or more | 18,373 (10.6%) | 19,973 (8.2%) |
| Total | 172,523 (100.0%) | 242,283 (100.0%) |
Household Income by Mortgage Status in Area Code 305
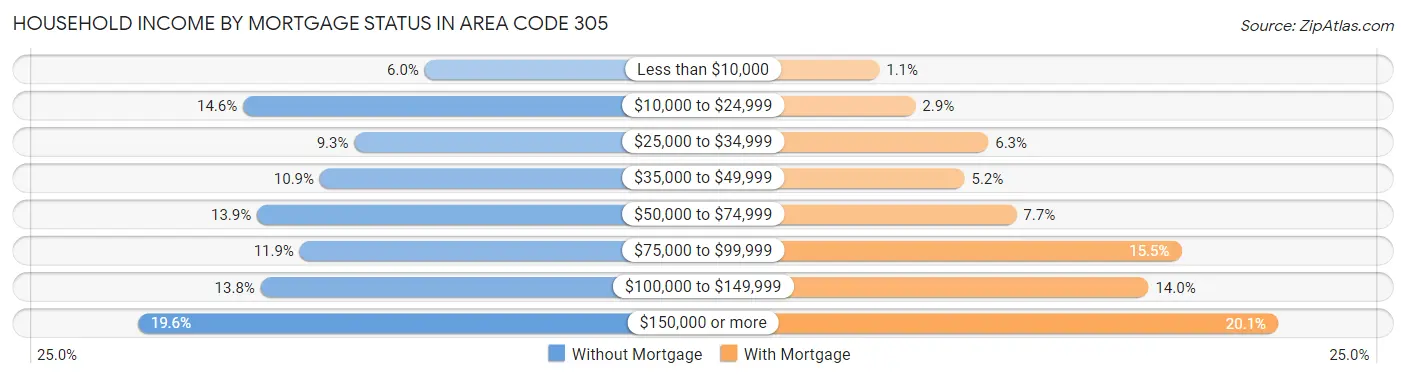
| Household Income | Without Mortgage | With Mortgage |
| Less than $10,000 | 10,273 (5.9%) | 2,743 (1.1%) |
| $10,000 to $24,999 | 25,186 (14.6%) | 6,895 (2.9%) |
| $25,000 to $34,999 | 16,053 (9.3%) | 15,309 (6.3%) |
| $35,000 to $49,999 | 18,870 (10.9%) | 12,585 (5.2%) |
| $50,000 to $74,999 | 24,041 (13.9%) | 18,559 (7.7%) |
| $75,000 to $99,999 | 20,522 (11.9%) | 37,578 (15.5%) |
| $100,000 to $149,999 | 23,738 (13.8%) | 33,805 (14.0%) |
| $150,000 or more | 33,840 (19.6%) | 48,732 (20.1%) |
| Total | 172,523 (100.0%) | 242,283 (100.0%) |
Property Value to Household Income Ratio in Area Code 305
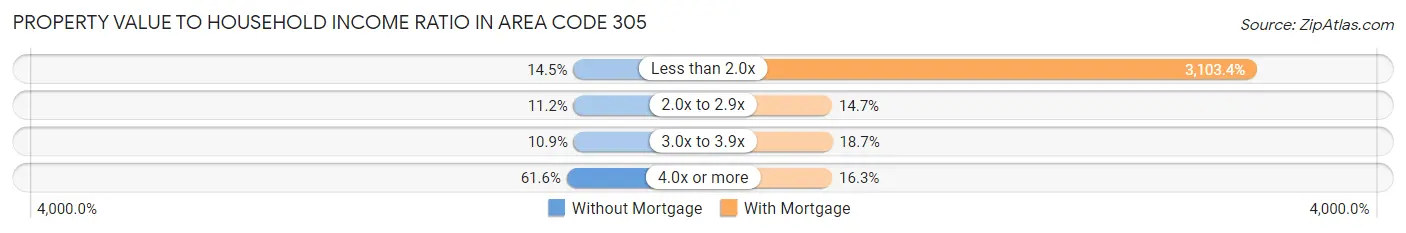
| Value-to-Income Ratio | Without Mortgage | With Mortgage |
| Less than 2.0x | 24,922 (14.4%) | 7,519,031 (3,103.4%) |
| 2.0x to 2.9x | 19,255 (11.2%) | 35,715 (14.7%) |
| 3.0x to 3.9x | 18,722 (10.8%) | 45,304 (18.7%) |
| 4.0x or more | 106,253 (61.6%) | 39,517 (16.3%) |
| Total | 172,523 (100.0%) | 242,283 (100.0%) |
Real Estate Taxes by Mortgage Status in Area Code 305
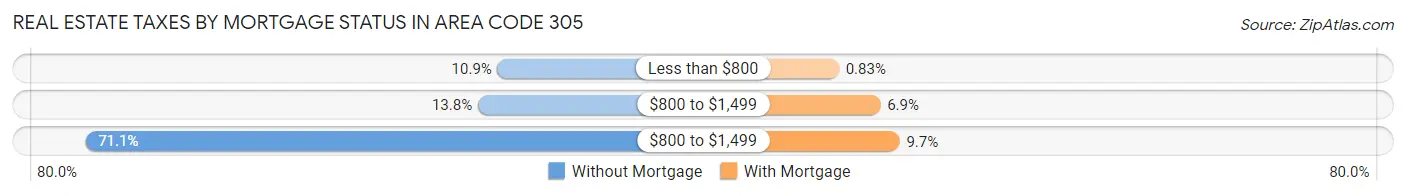
| Property Taxes | Without Mortgage | With Mortgage |
| Less than $800 | 18,764 (10.9%) | 2,009 (0.8%) |
| $800 to $1,499 | 23,719 (13.8%) | 16,699 (6.9%) |
| $800 to $1,499 | 122,729 (71.1%) | 23,526 (9.7%) |
| Total | 172,523 (100.0%) | 242,283 (100.0%) |
Health & Disability in Area Code 305
Health Insurance Coverage by Age in Area Code 305
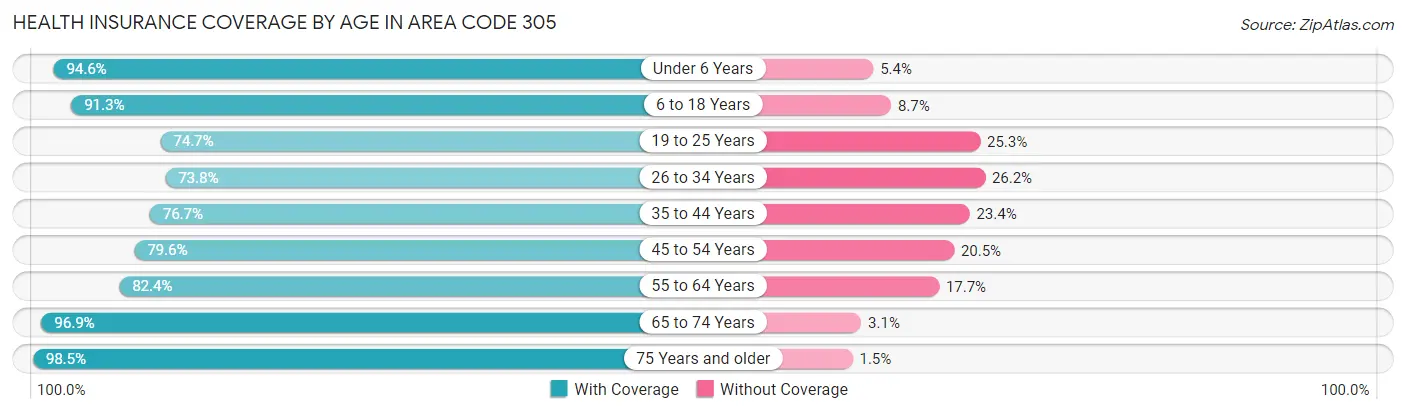
| Age Bracket | With Coverage | Without Coverage |
| Under 6 Years | 146,341 (94.6%) | 8,339 (5.4%) |
| 6 to 18 Years | 303,776 (91.3%) | 28,962 (8.7%) |
| 19 to 25 Years | 145,966 (74.7%) | 49,489 (25.3%) |
| 26 to 34 Years | 218,480 (73.8%) | 77,693 (26.2%) |
| 35 to 44 Years | 242,249 (76.6%) | 73,816 (23.4%) |
| 45 to 54 Years | 260,867 (79.5%) | 67,054 (20.4%) |
| 55 to 64 Years | 244,363 (82.4%) | 52,364 (17.6%) |
| 65 to 74 Years | 202,726 (96.9%) | 6,577 (3.1%) |
| 75 Years and older | 169,584 (98.5%) | 2,653 (1.5%) |
| Total | 1,934,352 (84.1%) | 366,947 (16.0%) |
Health Insurance Coverage by Citizenship Status in Area Code 305
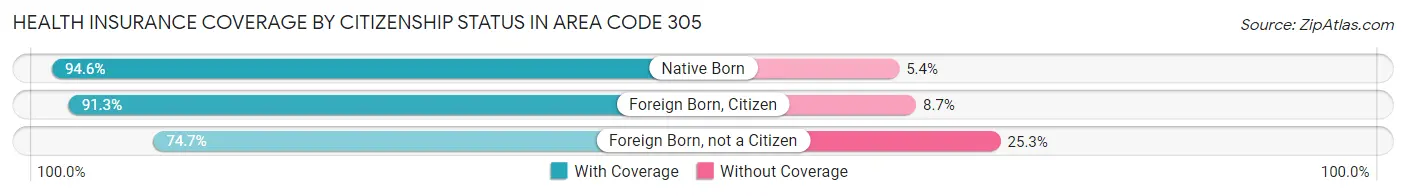
| Citizenship Status | With Coverage | Without Coverage |
| Native Born | 146,341 (94.6%) | 8,339 (5.4%) |
| Foreign Born, Citizen | 303,776 (91.3%) | 28,962 (8.7%) |
| Foreign Born, not a Citizen | 145,966 (74.7%) | 49,489 (25.3%) |
Health Insurance Coverage by Household Income in Area Code 305
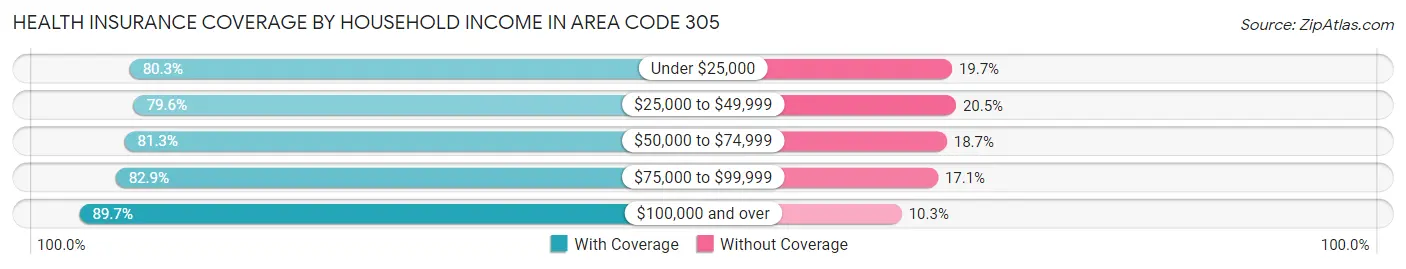
| Household Income | With Coverage | Without Coverage |
| Under $25,000 | 263,830 (80.3%) | 64,728 (19.7%) |
| $25,000 to $49,999 | 334,900 (79.5%) | 86,101 (20.4%) |
| $50,000 to $74,999 | 320,868 (81.3%) | 74,009 (18.7%) |
| $75,000 to $99,999 | 258,165 (82.9%) | 53,177 (17.1%) |
| $100,000 and over | 736,738 (89.7%) | 84,466 (10.3%) |
Public vs Private Health Insurance Coverage by Age in Area Code 305
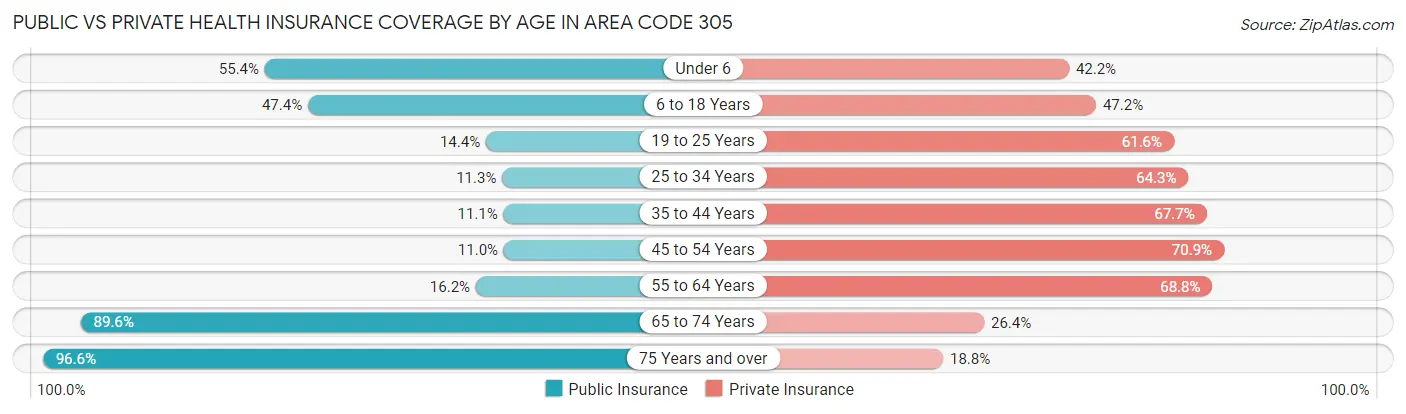
| Age Bracket | Public Insurance | Private Insurance |
| Under 6 | 85,690 (55.4%) | 65,214 (42.2%) |
| 6 to 18 Years | 157,727 (47.4%) | 156,996 (47.2%) |
| 19 to 25 Years | 28,067 (14.4%) | 120,466 (61.6%) |
| 25 to 34 Years | 33,589 (11.3%) | 190,476 (64.3%) |
| 35 to 44 Years | 35,084 (11.1%) | 213,986 (67.7%) |
| 45 to 54 Years | 36,172 (11.0%) | 232,557 (70.9%) |
| 55 to 64 Years | 48,146 (16.2%) | 204,057 (68.8%) |
| 65 to 74 Years | 187,531 (89.6%) | 55,280 (26.4%) |
| 75 Years and over | 166,433 (96.6%) | 32,359 (18.8%) |
| Total | 778,439 (33.8%) | 1,271,391 (55.2%) |
Disability Status by Sex by Age in Area Code 305
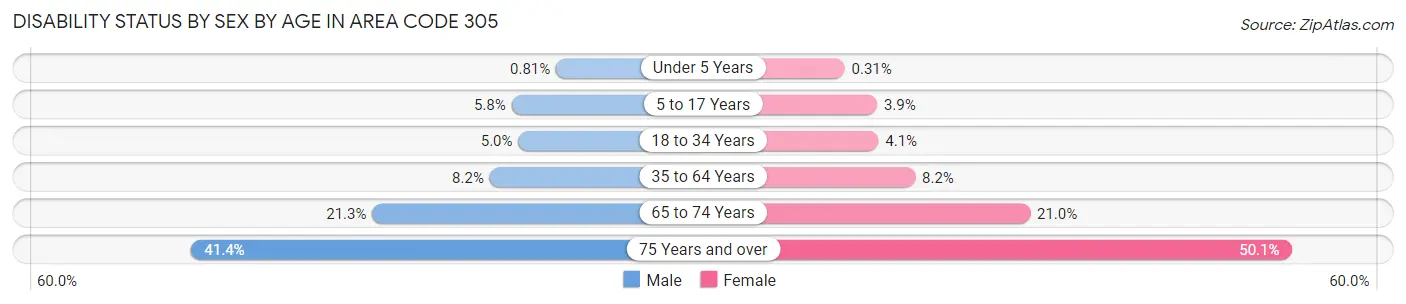
| Age Bracket | Male | Female |
| Under 5 Years | 540 (0.8%) | 197 (0.3%) |
| 5 to 17 Years | 9,710 (5.8%) | 6,325 (3.9%) |
| 18 to 34 Years | 13,150 (5.0%) | 10,441 (4.1%) |
| 35 to 64 Years | 38,481 (8.2%) | 38,460 (8.2%) |
| 65 to 74 Years | 20,139 (21.3%) | 24,034 (21.0%) |
| 75 Years and over | 28,146 (41.4%) | 52,201 (50.1%) |
Disability Class by Sex by Age in Area Code 305
Disability Class: Hearing Difficulty
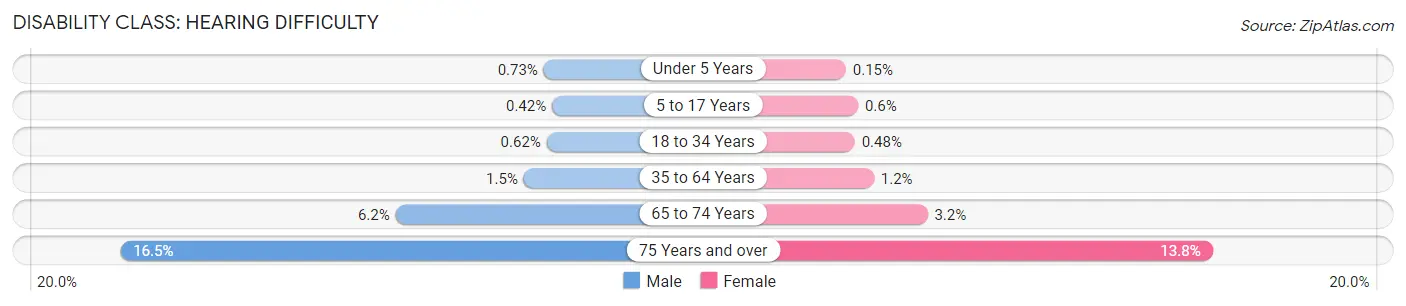
| Age Bracket | Male | Female |
| Under 5 Years | 482 (0.7%) | 99 (0.2%) |
| 5 to 17 Years | 700 (0.4%) | 972 (0.6%) |
| 18 to 34 Years | 1,619 (0.6%) | 1,244 (0.5%) |
| 35 to 64 Years | 6,922 (1.5%) | 5,620 (1.2%) |
| 65 to 74 Years | 5,894 (6.2%) | 3,647 (3.2%) |
| 75 Years and over | 11,178 (16.5%) | 14,348 (13.8%) |
Disability Class: Vision Difficulty
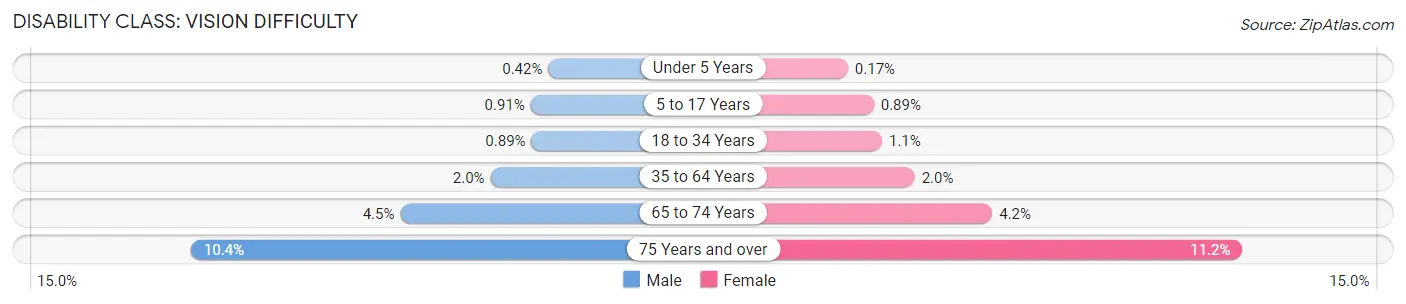
| Age Bracket | Male | Female |
| Under 5 Years | 280 (0.4%) | 108 (0.2%) |
| 5 to 17 Years | 1,533 (0.9%) | 1,439 (0.9%) |
| 18 to 34 Years | 2,324 (0.9%) | 2,869 (1.1%) |
| 35 to 64 Years | 9,530 (2.0%) | 9,545 (2.0%) |
| 65 to 74 Years | 4,297 (4.5%) | 4,799 (4.2%) |
| 75 Years and over | 7,046 (10.4%) | 11,628 (11.2%) |
Disability Class: Cognitive Difficulty
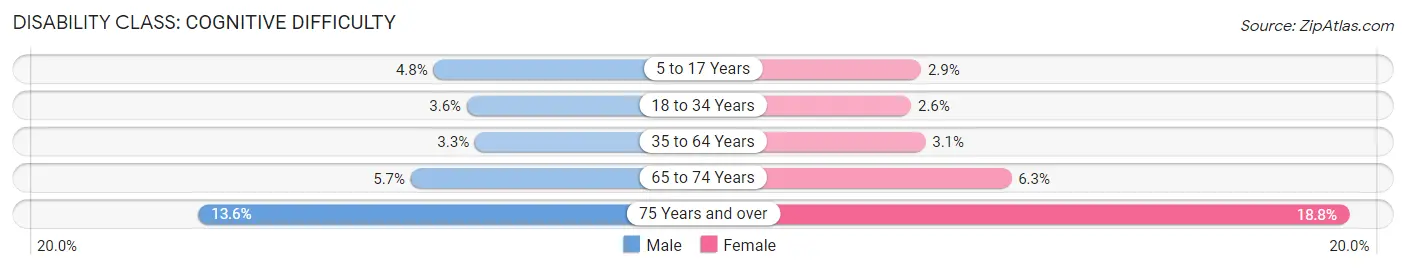
| Age Bracket | Male | Female |
| 5 to 17 Years | 8,104 (4.8%) | 4,741 (2.9%) |
| 18 to 34 Years | 9,408 (3.6%) | 6,581 (2.6%) |
| 35 to 64 Years | 15,386 (3.3%) | 14,625 (3.1%) |
| 65 to 74 Years | 5,361 (5.7%) | 7,208 (6.3%) |
| 75 Years and over | 9,211 (13.6%) | 19,625 (18.8%) |
Disability Class: Ambulatory Difficulty
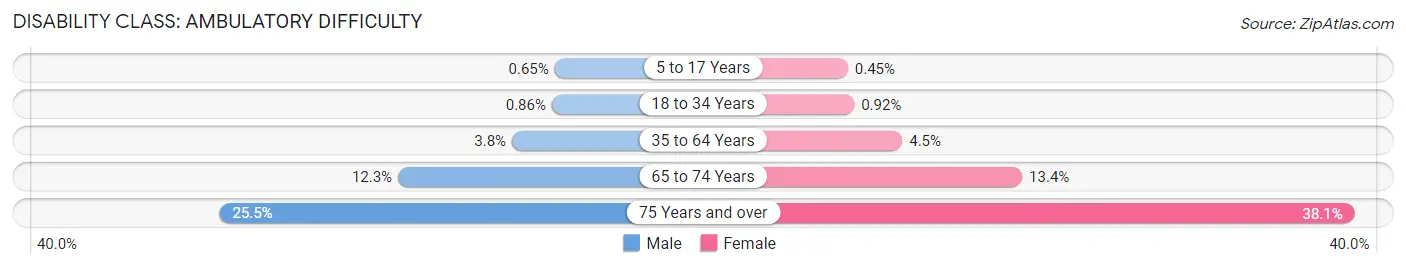
| Age Bracket | Male | Female |
| 5 to 17 Years | 1,088 (0.6%) | 726 (0.4%) |
| 18 to 34 Years | 2,248 (0.9%) | 2,351 (0.9%) |
| 35 to 64 Years | 17,954 (3.8%) | 21,161 (4.5%) |
| 65 to 74 Years | 11,622 (12.3%) | 15,352 (13.4%) |
| 75 Years and over | 17,350 (25.5%) | 39,703 (38.1%) |
Disability Class: Self-Care Difficulty
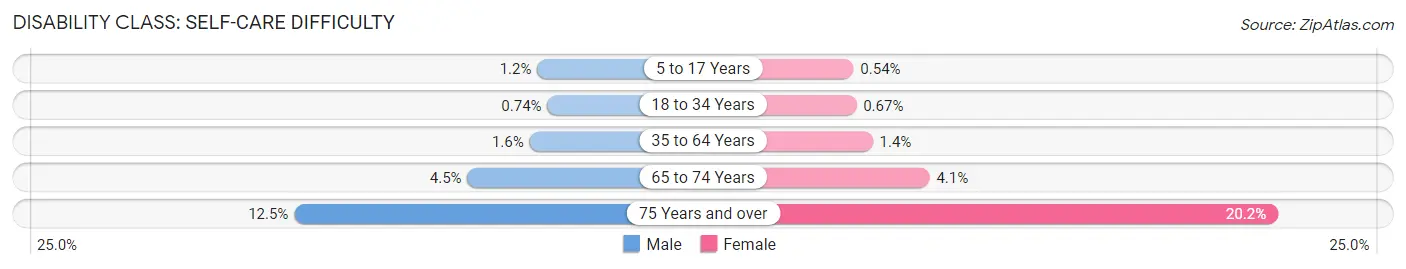
| Age Bracket | Male | Female |
| 5 to 17 Years | 2,033 (1.2%) | 874 (0.5%) |
| 18 to 34 Years | 1,939 (0.7%) | 1,726 (0.7%) |
| 35 to 64 Years | 7,378 (1.6%) | 6,747 (1.4%) |
| 65 to 74 Years | 4,212 (4.4%) | 4,670 (4.1%) |
| 75 Years and over | 8,489 (12.5%) | 21,106 (20.2%) |
Technology Access in Area Code 305
Computing Device Access in Area Code 305
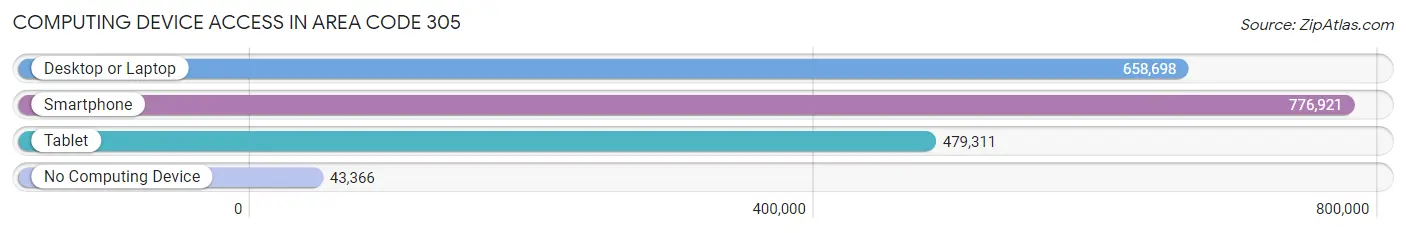
| Device Type | # Households | % Households |
| Desktop or Laptop | 658,698 | 77.4% |
| Smartphone | 776,921 | 91.3% |
| Tablet | 479,311 | 56.3% |
| No Computing Device | 43,366 | 5.1% |
| Total | 850,995 | 100.0% |
Internet Access in Area Code 305
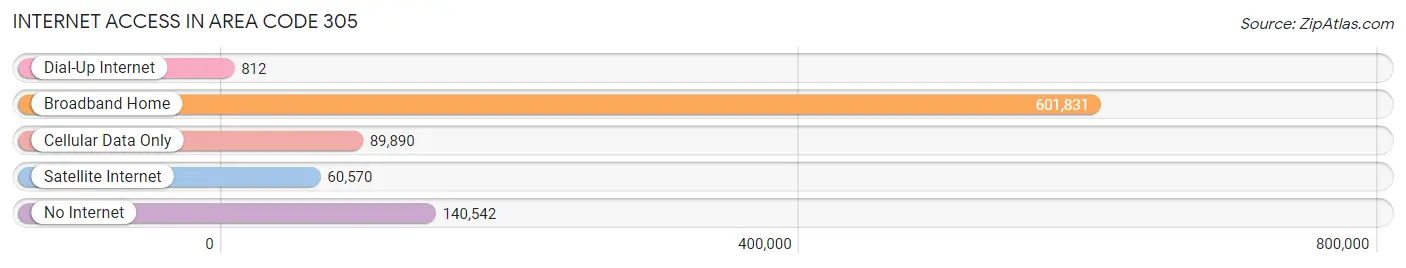
| Internet Type | # Households | % Households |
| Dial-Up Internet | 812 | 0.1% |
| Broadband Home | 601,831 | 70.7% |
| Cellular Data Only | 89,890 | 10.6% |
| Satellite Internet | 60,570 | 7.1% |
| No Internet | 140,542 | 16.5% |
| Total | 850,995 | 100.0% |
Area Code 305 Summary
Geography
Area code 305 is located in the state of Florida and covers the Miami metropolitan area. It is the area code for all of Miami-Dade County, including the cities of Miami, Miami Beach, Hialeah, and Homestead.
Social
Area code 305 is a vibrant and diverse area, with a large Hispanic population. It is home to many cultural attractions, including the Miami Art Museum, the Miami Seaquarium, and the Vizcaya Museum and Gardens.
Economics
Area code 305 is an economically prosperous area, with a strong tourism industry and a thriving business sector. It is home to many Fortune 500 companies, including Carnival Corporation, Ryder System, and Royal Caribbean International.
Demographics
Area code 305 is home to over 2.7 million people, with a population that is predominantly Hispanic. The median household income is $45,000, and the median age is 38. The area is also home to a large number of immigrants, with over 40% of the population being foreign-born.
Common Questions
What is Per Capita Income in Area Code 305?
Per Capita income in Area Code 305 is $45,746.
What is the Median Family Income in Area Code 305?
Median Family Income in Area Code 305 is $84,362.
What is the Median Household income in Area Code 305?
Median Household Income in Area Code 305 is $71,077.
What is Income or Wage Gap in Area Code 305?
Income or Wage Gap in Area Code 305 is 22.9%.
Women in Area Code 305 earn 77.1 cents for every dollar earned by a man.
What is Family Income Deficit in Area Code 305?
Family Income Deficit in Area Code 305 is $9,856.
Families that are below poverty line in Area Code 305 earn $9,856 less on average than the poverty threshold level.
What is Inequality or Gini Index in Area Code 305?
Inequality or Gini Index in Area Code 305 is 34.75.
What is the Total Population of Area Code 305?
Total Population of Area Code 305 is 2,325,716.
What is the Total Male Population of Area Code 305?
Total Male Population of Area Code 305 is 1,145,700.
What is the Total Female Population of Area Code 305?
Total Female Population of Area Code 305 is 1,180,016.
What is the Ratio of Males per 100 Females in Area Code 305?
There are 97.09 Males per 100 Females in Area Code 305.
What is the Ratio of Females per 100 Males in Area Code 305?
There are 103.00 Females per 100 Males in Area Code 305.
What is the Median Population Age in Area Code 305?
Median Population Age in Area Code 305 is 41.3 Years.
What is the Average Family Size in Area Code 305
Average Family Size in Area Code 305 is 3.2 People.
What is the Average Household Size in Area Code 305
Average Household Size in Area Code 305 is 2.6 People.
How Large is the Labor Force in Area Code 305?
There are 1,214,645 People in the Labor Forcein in Area Code 305.
What is the Percentage of People in the Labor Force in Area Code 305?
63.3% of People are in the Labor Force in Area Code 305.
What is the Unemployment Rate in Area Code 305?
Unemployment Rate in Area Code 305 is 4.7%.