Lee County, FL Map & Demographics
Lee County Map
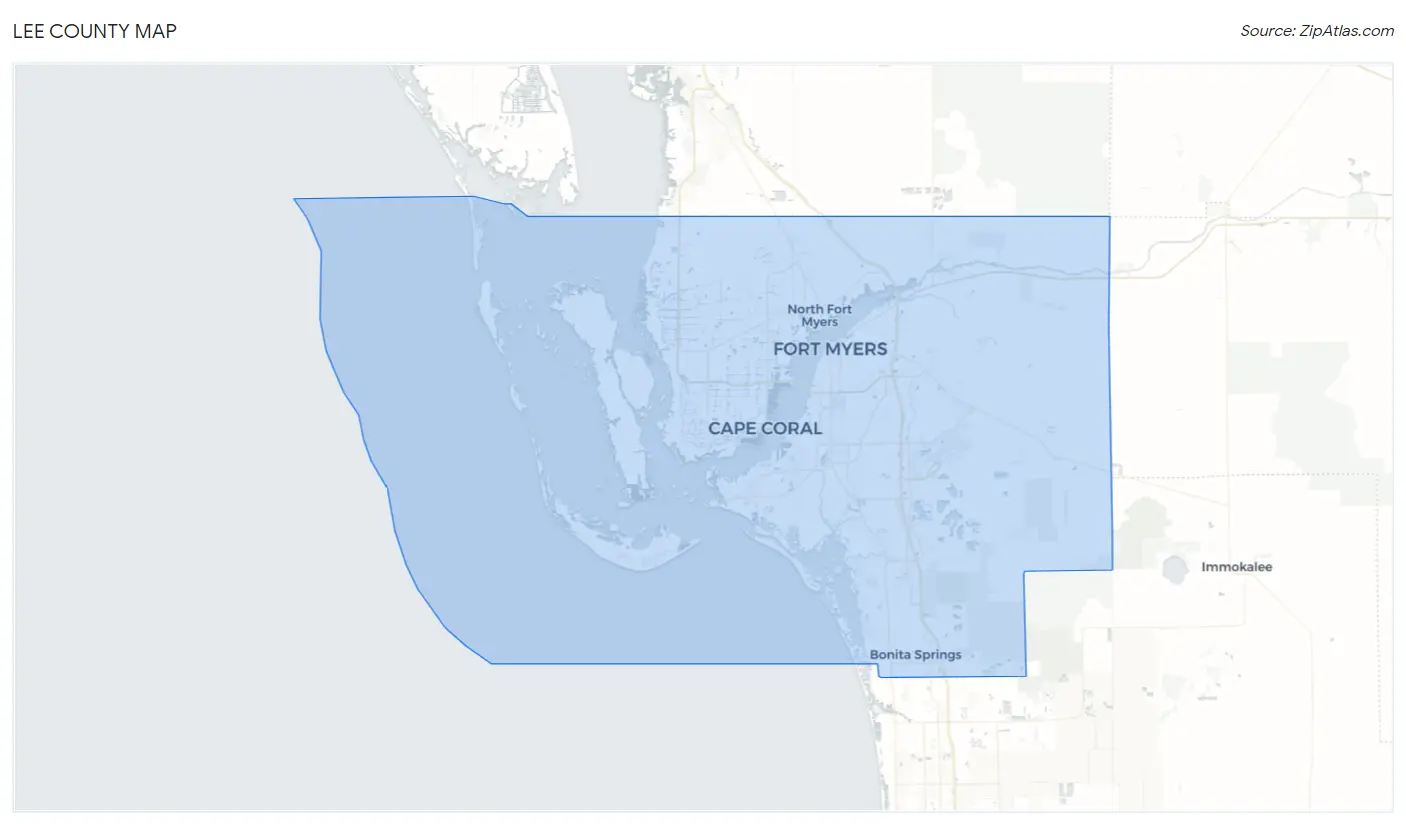
Lee County Overview
$41,332
PER CAPITA INCOME
$81,979
AVG FAMILY INCOME
$69,368
AVG HOUSEHOLD INCOME
23.8%
WAGE / INCOME GAP [ % ]
76.2¢/ $1
WAGE / INCOME GAP [ $ ]
$10,511
FAMILY INCOME DEFICIT
0.48
INEQUALITY / GINI INDEX
772,902
TOTAL POPULATION
380,685
MALE POPULATION
392,217
FEMALE POPULATION
97.06
MALES / 100 FEMALES
103.03
FEMALES / 100 MALES
49.1
MEDIAN AGE
3.0
AVG FAMILY SIZE
2.4
AVG HOUSEHOLD SIZE
348,456
LABOR FORCE [ PEOPLE ]
53.1%
PERCENT IN LABOR FORCE
4.5%
UNEMPLOYMENT RATE
Income in Lee County
Income Overview in Lee County
Per Capita Income in Lee County is $41,332, while median incomes of families and households are $81,979 and $69,368 respectively.
| Characteristic | Number | Measure |
| Per Capita Income | 772,902 | $41,332 |
| Median Family Income | 202,830 | $81,979 |
| Mean Family Income | 202,830 | $113,350 |
| Median Household Income | 311,348 | $69,368 |
| Mean Household Income | 311,348 | $97,521 |
| Income Deficit | 202,830 | $10,511 |
| Wage / Income Gap (%) | 772,902 | 23.78% |
| Wage / Income Gap ($) | 772,902 | 76.22¢ per $1 |
| Gini / Inequality Index | 772,902 | 0.48 |
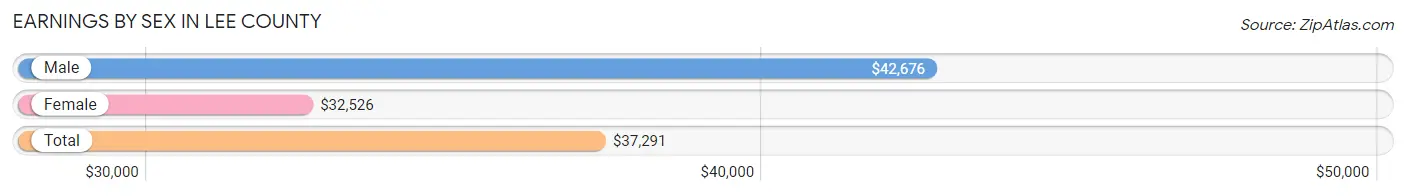
Earnings by Sex in Lee County
Average Earnings in Lee County are $37,291, $42,676 for men and $32,526 for women, a difference of 23.8%.
| Sex | Number | Average Earnings |
| Male | 190,685 (52.5%) | $42,676 |
| Female | 172,652 (47.5%) | $32,526 |
| Total | 363,337 (100.0%) | $37,291 |
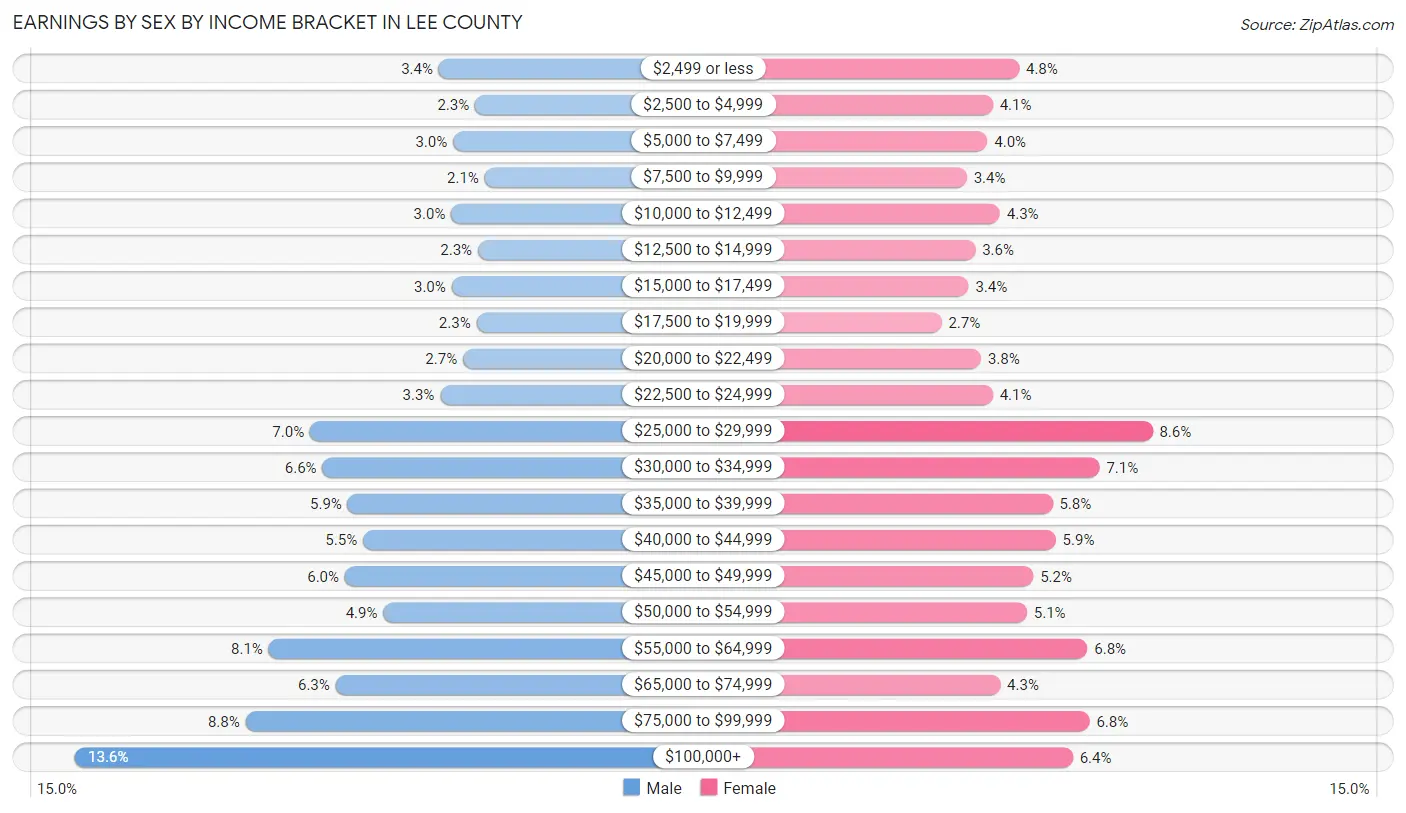
Earnings by Sex by Income Bracket in Lee County
The most common earnings brackets in Lee County are $100,000+ for men (25,890 | 13.6%) and $25,000 to $29,999 for women (14,831 | 8.6%).
| Income | Male | Female |
| $2,499 or less | 6,412 (3.4%) | 8,361 (4.8%) |
| $2,500 to $4,999 | 4,465 (2.3%) | 7,077 (4.1%) |
| $5,000 to $7,499 | 5,640 (3.0%) | 6,828 (4.0%) |
| $7,500 to $9,999 | 3,948 (2.1%) | 5,823 (3.4%) |
| $10,000 to $12,499 | 5,731 (3.0%) | 7,429 (4.3%) |
| $12,500 to $14,999 | 4,309 (2.3%) | 6,229 (3.6%) |
| $15,000 to $17,499 | 5,712 (3.0%) | 5,906 (3.4%) |
| $17,500 to $19,999 | 4,379 (2.3%) | 4,597 (2.7%) |
| $20,000 to $22,499 | 5,107 (2.7%) | 6,507 (3.8%) |
| $22,500 to $24,999 | 6,331 (3.3%) | 7,072 (4.1%) |
| $25,000 to $29,999 | 13,305 (7.0%) | 14,831 (8.6%) |
| $30,000 to $34,999 | 12,640 (6.6%) | 12,256 (7.1%) |
| $35,000 to $39,999 | 11,298 (5.9%) | 9,986 (5.8%) |
| $40,000 to $44,999 | 10,465 (5.5%) | 10,129 (5.9%) |
| $45,000 to $49,999 | 11,445 (6.0%) | 9,039 (5.2%) |
| $50,000 to $54,999 | 9,387 (4.9%) | 8,730 (5.1%) |
| $55,000 to $64,999 | 15,524 (8.1%) | 11,674 (6.8%) |
| $65,000 to $74,999 | 11,942 (6.3%) | 7,436 (4.3%) |
| $75,000 to $99,999 | 16,755 (8.8%) | 11,776 (6.8%) |
| $100,000+ | 25,890 (13.6%) | 10,966 (6.4%) |
| Total | 190,685 (100.0%) | 172,652 (100.0%) |
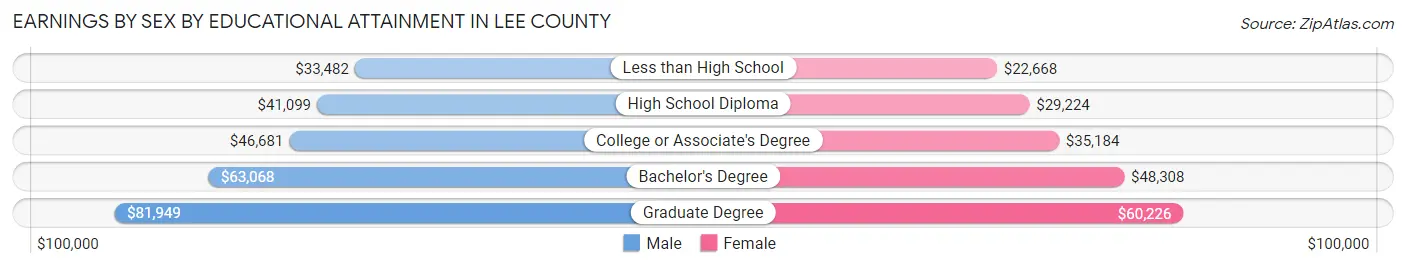
Earnings by Sex by Educational Attainment in Lee County
Average earnings in Lee County are $46,928 for men and $36,556 for women, a difference of 22.1%. Men with an educational attainment of graduate degree enjoy the highest average annual earnings of $81,949, while those with less than high school education earn the least with $33,482. Women with an educational attainment of graduate degree earn the most with the average annual earnings of $60,226, while those with less than high school education have the smallest earnings of $22,668.
| Educational Attainment | Male Income | Female Income |
| Less than High School | $33,482 | $22,668 |
| High School Diploma | $41,099 | $29,224 |
| College or Associate's Degree | $46,681 | $35,184 |
| Bachelor's Degree | $63,068 | $48,308 |
| Graduate Degree | $81,949 | $60,226 |
| Total | $46,928 | $36,556 |
Family Income in Lee County
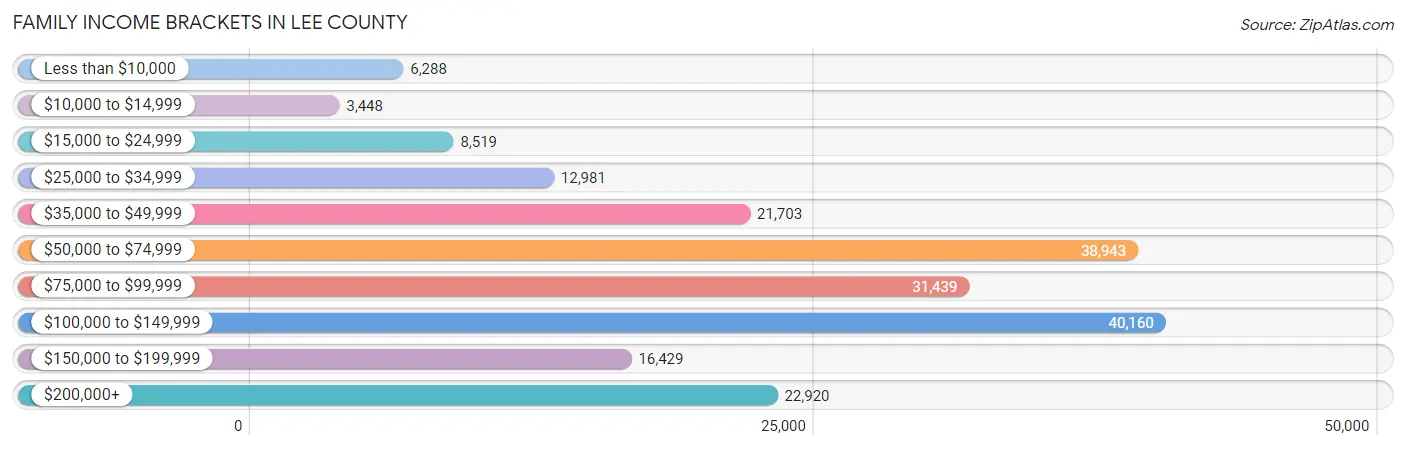
Family Income Brackets in Lee County
According to the Lee County family income data, there are 40,160 families falling into the $100,000 to $149,999 income range, which is the most common income bracket and makes up 19.8% of all families. Conversely, the $10,000 to $14,999 income bracket is the least frequent group with only 3,448 families (1.7%) belonging to this category.
| Income Bracket | # Families | % Families |
| Less than $10,000 | 6,288 | 3.1% |
| $10,000 to $14,999 | 3,448 | 1.7% |
| $15,000 to $24,999 | 8,519 | 4.2% |
| $25,000 to $34,999 | 12,981 | 6.4% |
| $35,000 to $49,999 | 21,703 | 10.7% |
| $50,000 to $74,999 | 38,943 | 19.2% |
| $75,000 to $99,999 | 31,439 | 15.5% |
| $100,000 to $149,999 | 40,160 | 19.8% |
| $150,000 to $199,999 | 16,429 | 8.1% |
| $200,000+ | 22,920 | 11.3% |
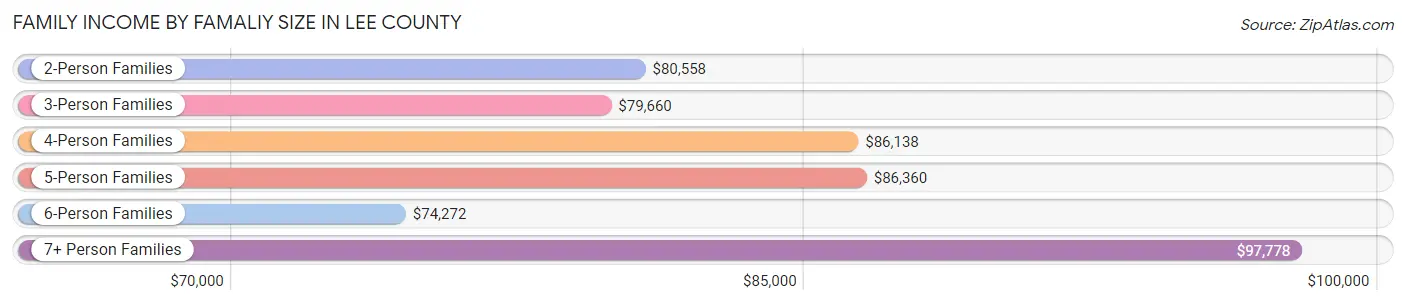
Family Income by Famaliy Size in Lee County
7+ person families (1,790 | 0.9%) account for the highest median family income in Lee County with $97,778 per family, while 2-person families (125,555 | 61.9%) have the highest median income of $40,279 per family member.
| Income Bracket | # Families | Median Income |
| 2-Person Families | 125,555 (61.9%) | $80,558 |
| 3-Person Families | 33,775 (16.7%) | $79,660 |
| 4-Person Families | 26,227 (12.9%) | $86,138 |
| 5-Person Families | 11,824 (5.8%) | $86,360 |
| 6-Person Families | 3,659 (1.8%) | $74,272 |
| 7+ Person Families | 1,790 (0.9%) | $97,778 |
| Total | 202,830 (100.0%) | $81,979 |
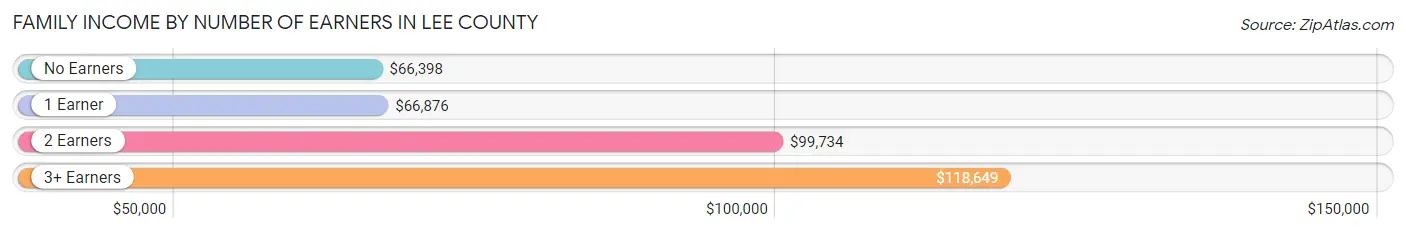
Family Income by Number of Earners in Lee County
The median family income in Lee County is $81,979, with families comprising 3+ earners (14,768) having the highest median family income of $118,649, while families with no earners (58,835) have the lowest median family income of $66,398, accounting for 7.3% and 29.0% of families, respectively.
| Number of Earners | # Families | Median Income |
| No Earners | 58,835 (29.0%) | $66,398 |
| 1 Earner | 60,942 (30.0%) | $66,876 |
| 2 Earners | 68,285 (33.7%) | $99,734 |
| 3+ Earners | 14,768 (7.3%) | $118,649 |
| Total | 202,830 (100.0%) | $81,979 |
Household Income in Lee County
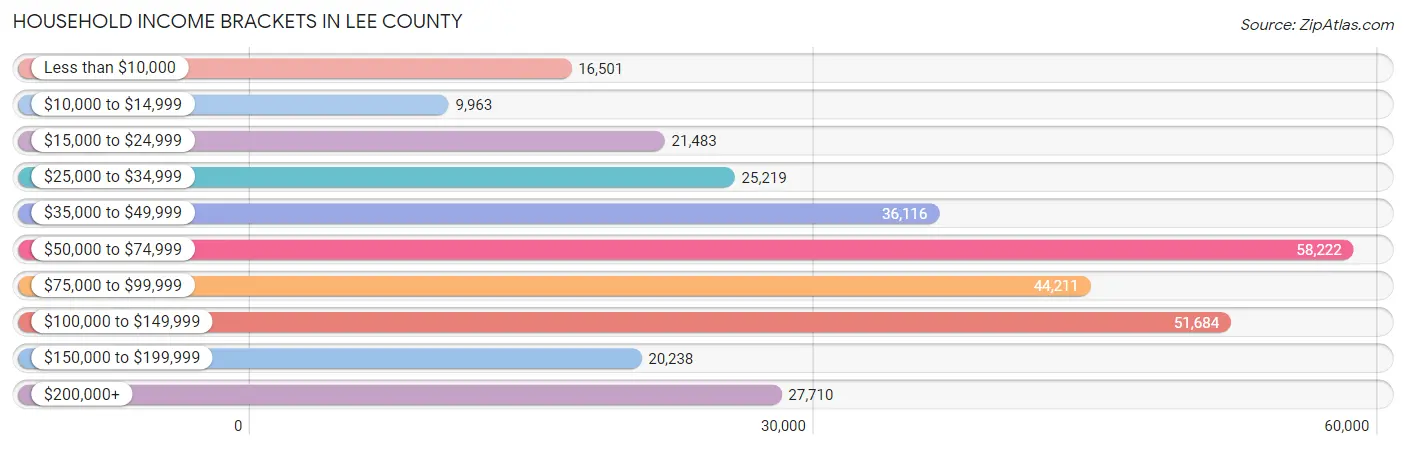
Household Income Brackets in Lee County
With 58,222 households falling in the category, the $50,000 to $74,999 income range is the most frequent in Lee County, accounting for 18.7% of all households. In contrast, only 9,963 households (3.2%) fall into the $10,000 to $14,999 income bracket, making it the least populous group.
| Income Bracket | # Households | % Households |
| Less than $10,000 | 16,501 | 5.3% |
| $10,000 to $14,999 | 9,963 | 3.2% |
| $15,000 to $24,999 | 21,483 | 6.9% |
| $25,000 to $34,999 | 25,219 | 8.1% |
| $35,000 to $49,999 | 36,116 | 11.6% |
| $50,000 to $74,999 | 58,222 | 18.7% |
| $75,000 to $99,999 | 44,211 | 14.2% |
| $100,000 to $149,999 | 51,684 | 16.6% |
| $150,000 to $199,999 | 20,238 | 6.5% |
| $200,000+ | 27,710 | 8.9% |
Household Income by Householder Age in Lee County
The median household income in Lee County is $69,368, with the highest median household income of $78,612 found in the 45 to 64 years age bracket for the primary householder. A total of 104,213 households (33.5%) fall into this category. Meanwhile, the 15 to 24 years age bracket for the primary householder has the lowest median household income of $47,198, with 5,346 households (1.7%) in this group.
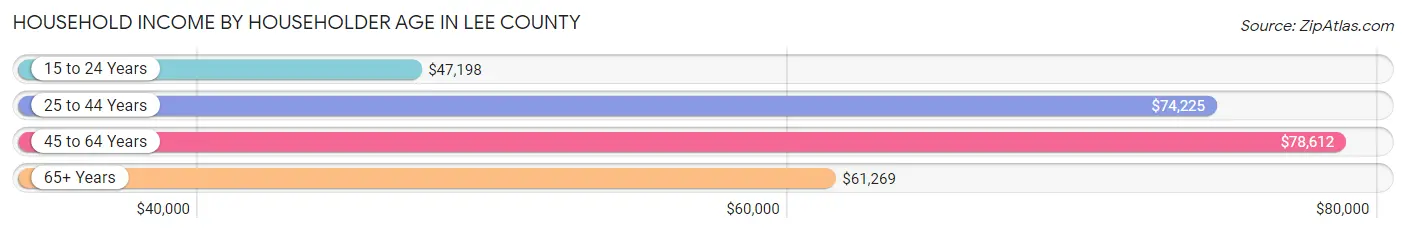
| Income Bracket | # Households | Median Income |
| 15 to 24 Years | 5,346 (1.7%) | $47,198 |
| 25 to 44 Years | 71,390 (22.9%) | $74,225 |
| 45 to 64 Years | 104,213 (33.5%) | $78,612 |
| 65+ Years | 130,399 (41.9%) | $61,269 |
| Total | 311,348 (100.0%) | $69,368 |
Poverty in Lee County
Income Below Poverty by Sex and Age in Lee County
With 10.7% poverty level for males and 12.7% for females among the residents of Lee County, under 5 year old males and 5 year old females are the most vulnerable to poverty, with 3,844 males (22.1%) and 651 females (19.4%) in their respective age groups living below the poverty level.
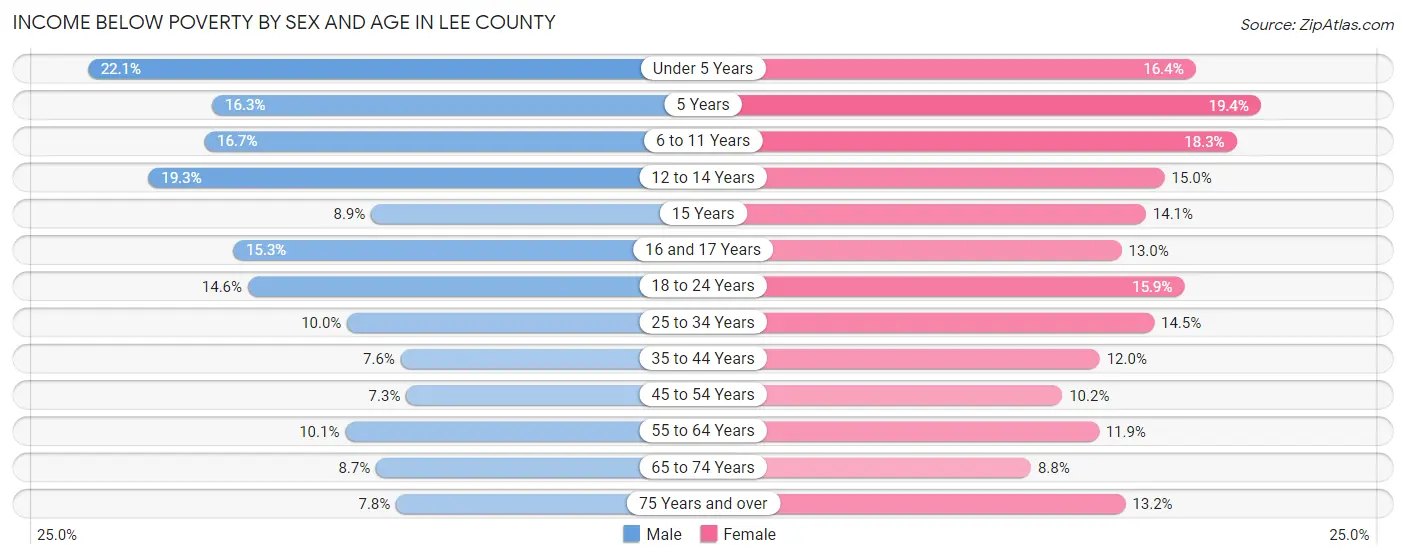
| Age Bracket | Male | Female |
| Under 5 Years | 3,844 (22.1%) | 2,725 (16.4%) |
| 5 Years | 522 (16.3%) | 651 (19.4%) |
| 6 to 11 Years | 3,639 (16.7%) | 3,917 (18.3%) |
| 12 to 14 Years | 2,490 (19.3%) | 1,673 (15.0%) |
| 15 Years | 369 (8.9%) | 481 (14.1%) |
| 16 and 17 Years | 1,241 (15.3%) | 1,041 (13.0%) |
| 18 to 24 Years | 3,810 (14.6%) | 4,052 (15.9%) |
| 25 to 34 Years | 4,155 (10.0%) | 5,892 (14.5%) |
| 35 to 44 Years | 3,048 (7.5%) | 4,767 (12.0%) |
| 45 to 54 Years | 3,147 (7.3%) | 4,522 (10.2%) |
| 55 to 64 Years | 5,203 (10.1%) | 6,822 (11.9%) |
| 65 to 74 Years | 4,870 (8.7%) | 5,467 (8.8%) |
| 75 Years and over | 3,786 (7.8%) | 7,008 (13.2%) |
| Total | 40,124 (10.7%) | 49,018 (12.7%) |
Income Above Poverty by Sex and Age in Lee County
According to the poverty statistics in Lee County, males aged 45 to 54 years and females aged 65 to 74 years are the age groups that are most secure financially, with 92.7% of males and 91.2% of females in these age groups living above the poverty line.
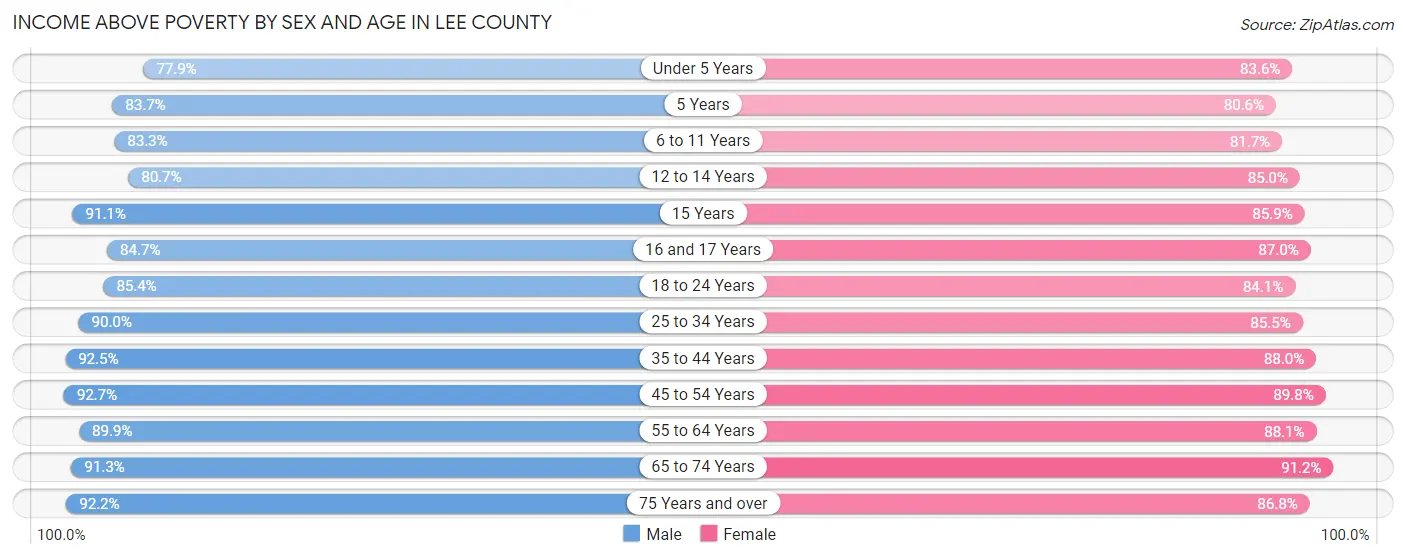
| Age Bracket | Male | Female |
| Under 5 Years | 13,573 (77.9%) | 13,881 (83.6%) |
| 5 Years | 2,680 (83.7%) | 2,698 (80.6%) |
| 6 to 11 Years | 18,188 (83.3%) | 17,470 (81.7%) |
| 12 to 14 Years | 10,437 (80.7%) | 9,498 (85.0%) |
| 15 Years | 3,769 (91.1%) | 2,929 (85.9%) |
| 16 and 17 Years | 6,853 (84.7%) | 6,980 (87.0%) |
| 18 to 24 Years | 22,220 (85.4%) | 21,454 (84.1%) |
| 25 to 34 Years | 37,254 (90.0%) | 34,773 (85.5%) |
| 35 to 44 Years | 37,346 (92.4%) | 35,060 (88.0%) |
| 45 to 54 Years | 40,049 (92.7%) | 39,672 (89.8%) |
| 55 to 64 Years | 46,201 (89.9%) | 50,420 (88.1%) |
| 65 to 74 Years | 51,200 (91.3%) | 56,799 (91.2%) |
| 75 Years and over | 45,008 (92.2%) | 46,260 (86.8%) |
| Total | 334,778 (89.3%) | 337,894 (87.3%) |
Income Below Poverty Among Married-Couple Families in Lee County
The poverty statistics for married-couple families in Lee County show that 5.2% or 8,387 of the total 159,687 families live below the poverty line. Families with 3 or 4 children have the highest poverty rate of 12.2%, comprising of 874 families. On the other hand, families with no children have the lowest poverty rate of 4.8%, which includes 5,635 families.
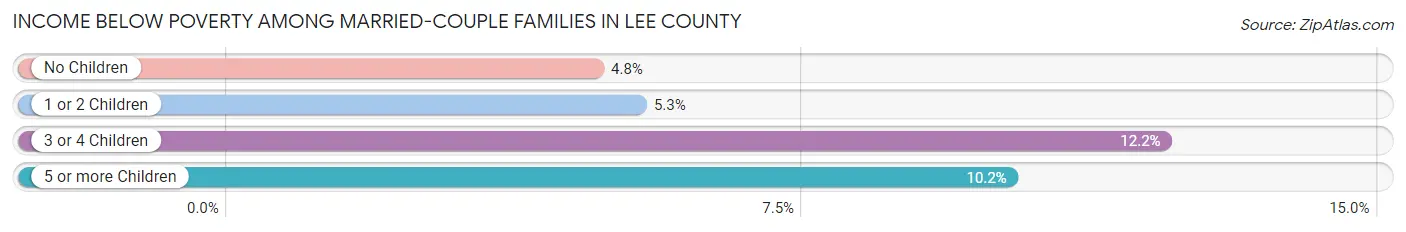
| Children | Above Poverty | Below Poverty |
| No Children | 112,261 (95.2%) | 5,635 (4.8%) |
| 1 or 2 Children | 32,218 (94.7%) | 1,818 (5.3%) |
| 3 or 4 Children | 6,292 (87.8%) | 874 (12.2%) |
| 5 or more Children | 529 (89.8%) | 60 (10.2%) |
| Total | 151,300 (94.8%) | 8,387 (5.2%) |
Income Below Poverty Among Single-Parent Households in Lee County
According to the poverty data in Lee County, 12.8% or 1,715 single-father households and 21.1% or 6,274 single-mother households are living below the poverty line. Among single-father households, those with 5 or more children have the highest poverty rate, with 73 households (44.0%) experiencing poverty. Likewise, among single-mother households, those with 5 or more children have the highest poverty rate, with 92 households (53.2%) falling below the poverty line.
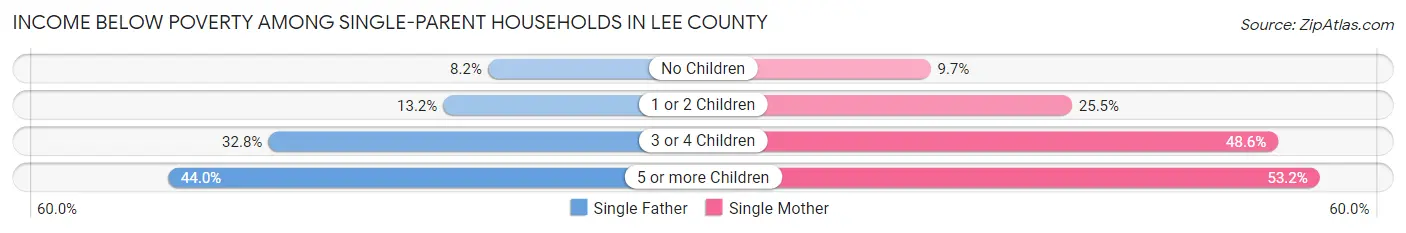
| Children | Single Father | Single Mother |
| No Children | 484 (8.2%) | 1,293 (9.7%) |
| 1 or 2 Children | 842 (13.2%) | 3,336 (25.5%) |
| 3 or 4 Children | 316 (32.8%) | 1,553 (48.5%) |
| 5 or more Children | 73 (44.0%) | 92 (53.2%) |
| Total | 1,715 (12.8%) | 6,274 (21.1%) |
Income Below Poverty Among Married-Couple vs Single-Parent Households in Lee County
The poverty data for Lee County shows that 8,387 of the married-couple family households (5.2%) and 7,989 of the single-parent households (18.5%) are living below the poverty level. Within the married-couple family households, those with 3 or 4 children have the highest poverty rate, with 874 households (12.2%) falling below the poverty line. Among the single-parent households, those with 5 or more children have the highest poverty rate, with 165 household (48.7%) living below poverty.
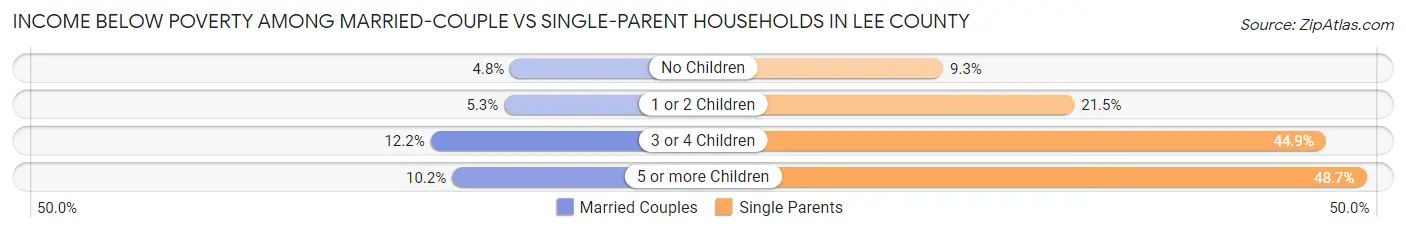
| Children | Married-Couple Families | Single-Parent Households |
| No Children | 5,635 (4.8%) | 1,777 (9.3%) |
| 1 or 2 Children | 1,818 (5.3%) | 4,178 (21.5%) |
| 3 or 4 Children | 874 (12.2%) | 1,869 (44.9%) |
| 5 or more Children | 60 (10.2%) | 165 (48.7%) |
| Total | 8,387 (5.2%) | 7,989 (18.5%) |
Race in Lee County
The most populous races in Lee County are White / Caucasian (574,580 | 74.3%), Hispanic or Latino (178,802 | 23.1%), and Two or more Races (88,932 | 11.5%).
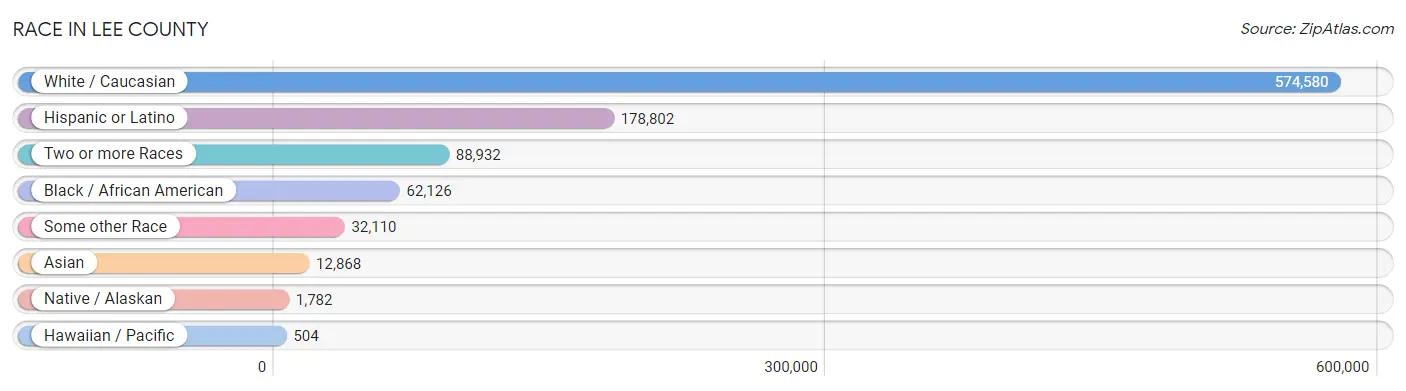
| Race | # Population | % Population |
| Asian | 12,868 | 1.7% |
| Black / African American | 62,126 | 8.0% |
| Hawaiian / Pacific | 504 | 0.1% |
| Hispanic or Latino | 178,802 | 23.1% |
| Native / Alaskan | 1,782 | 0.2% |
| White / Caucasian | 574,580 | 74.3% |
| Two or more Races | 88,932 | 11.5% |
| Some other Race | 32,110 | 4.2% |
| Total | 772,902 | 100.0% |
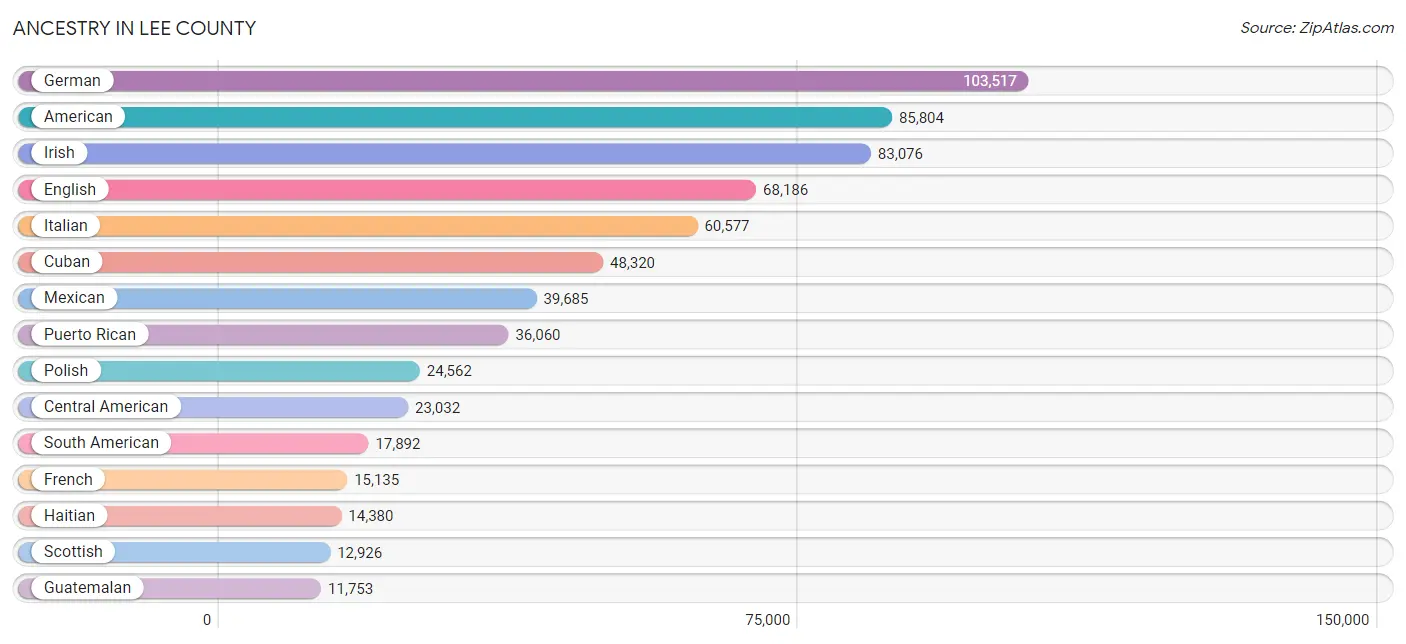
Ancestry in Lee County
The most populous ancestries reported in Lee County are German (103,517 | 13.4%), American (85,804 | 11.1%), Irish (83,076 | 10.7%), English (68,186 | 8.8%), and Italian (60,577 | 7.8%), together accounting for 51.9% of all Lee County residents.
| Ancestry | # Population | % Population |
| Afghan | 30 | 0.0% |
| African | 2,156 | 0.3% |
| Alaska Native | 38 | 0.0% |
| Albanian | 175 | 0.0% |
| American | 85,804 | 11.1% |
| Apache | 32 | 0.0% |
| Arab | 2,446 | 0.3% |
| Argentinean | 1,099 | 0.1% |
| Armenian | 730 | 0.1% |
| Australian | 120 | 0.0% |
| Austrian | 2,348 | 0.3% |
| Bahamian | 206 | 0.0% |
| Barbadian | 281 | 0.0% |
| Basque | 20 | 0.0% |
| Belgian | 890 | 0.1% |
| Belizean | 334 | 0.0% |
| Bermudan | 22 | 0.0% |
| Bhutanese | 791 | 0.1% |
| Blackfeet | 228 | 0.0% |
| Bolivian | 491 | 0.1% |
| Brazilian | 3,577 | 0.5% |
| British | 4,484 | 0.6% |
| British West Indian | 314 | 0.0% |
| Bulgarian | 72 | 0.0% |
| Burmese | 604 | 0.1% |
| Cajun | 70 | 0.0% |
| Cambodian | 22 | 0.0% |
| Canadian | 4,427 | 0.6% |
| Cape Verdean | 70 | 0.0% |
| Carpatho Rusyn | 37 | 0.0% |
| Celtic | 119 | 0.0% |
| Central American | 23,032 | 3.0% |
| Central American Indian | 1,294 | 0.2% |
| Cherokee | 993 | 0.1% |
| Cheyenne | 8 | 0.0% |
| Chickasaw | 30 | 0.0% |
| Chilean | 445 | 0.1% |
| Chippewa | 104 | 0.0% |
| Choctaw | 114 | 0.0% |
| Colombian | 7,792 | 1.0% |
| Costa Rican | 1,068 | 0.1% |
| Cree | 2 | 0.0% |
| Croatian | 1,037 | 0.1% |
| Cuban | 48,320 | 6.2% |
| Czech | 3,851 | 0.5% |
| Czechoslovakian | 1,048 | 0.1% |
| Danish | 1,849 | 0.2% |
| Delaware | 3 | 0.0% |
| Dominican | 8,363 | 1.1% |
| Dutch | 7,760 | 1.0% |
| Dutch West Indian | 53 | 0.0% |
| Eastern European | 1,919 | 0.3% |
| Ecuadorian | 2,015 | 0.3% |
| Egyptian | 217 | 0.0% |
| English | 68,186 | 8.8% |
| Estonian | 33 | 0.0% |
| Ethiopian | 21 | 0.0% |
| European | 9,768 | 1.3% |
| Filipino | 112 | 0.0% |
| Finnish | 1,462 | 0.2% |
| French | 15,135 | 2.0% |
| French American Indian | 60 | 0.0% |
| French Canadian | 4,543 | 0.6% |
| German | 103,517 | 13.4% |
| German Russian | 11 | 0.0% |
| Ghanaian | 133 | 0.0% |
| Greek | 2,918 | 0.4% |
| Guamanian / Chamorro | 35 | 0.0% |
| Guatemalan | 11,753 | 1.5% |
| Guyanese | 1,162 | 0.2% |
| Haitian | 14,380 | 1.9% |
| Honduran | 5,031 | 0.6% |
| Hungarian | 4,742 | 0.6% |
| Icelander | 54 | 0.0% |
| Indian (Asian) | 3,661 | 0.5% |
| Indonesian | 62 | 0.0% |
| Iranian | 248 | 0.0% |
| Iraqi | 52 | 0.0% |
| Irish | 83,076 | 10.7% |
| Iroquois | 112 | 0.0% |
| Israeli | 203 | 0.0% |
| Italian | 60,577 | 7.8% |
| Jamaican | 4,713 | 0.6% |
| Japanese | 183 | 0.0% |
| Jordanian | 29 | 0.0% |
| Kenyan | 28 | 0.0% |
| Kiowa | 39 | 0.0% |
| Korean | 4,332 | 0.6% |
| Laotian | 150 | 0.0% |
| Latvian | 78 | 0.0% |
| Lebanese | 1,076 | 0.1% |
| Liberian | 12 | 0.0% |
| Lithuanian | 2,294 | 0.3% |
| Lumbee | 11 | 0.0% |
| Luxembourger | 60 | 0.0% |
| Macedonian | 108 | 0.0% |
| Malaysian | 555 | 0.1% |
| Maltese | 177 | 0.0% |
| Mexican | 39,685 | 5.1% |
| Mexican American Indian | 549 | 0.1% |
| Mongolian | 41 | 0.0% |
| Moroccan | 162 | 0.0% |
| Native Hawaiian | 206 | 0.0% |
| Navajo | 25 | 0.0% |
| New Zealander | 16 | 0.0% |
| Nicaraguan | 3,218 | 0.4% |
| Nigerian | 411 | 0.1% |
| Northern European | 517 | 0.1% |
| Norwegian | 7,378 | 0.9% |
| Okinawan | 46 | 0.0% |
| Osage | 15 | 0.0% |
| Ottawa | 182 | 0.0% |
| Pakistani | 344 | 0.0% |
| Palestinian | 157 | 0.0% |
| Panamanian | 642 | 0.1% |
| Paraguayan | 45 | 0.0% |
| Pennsylvania German | 243 | 0.0% |
| Peruvian | 2,511 | 0.3% |
| Polish | 24,562 | 3.2% |
| Portuguese | 3,578 | 0.5% |
| Potawatomi | 74 | 0.0% |
| Pueblo | 21 | 0.0% |
| Puerto Rican | 36,060 | 4.7% |
| Romanian | 1,196 | 0.2% |
| Russian | 5,702 | 0.7% |
| Salvadoran | 1,320 | 0.2% |
| Samoan | 172 | 0.0% |
| Scandinavian | 1,797 | 0.2% |
| Scotch-Irish | 6,583 | 0.9% |
| Scottish | 12,926 | 1.7% |
| Seminole | 105 | 0.0% |
| Serbian | 260 | 0.0% |
| Sierra Leonean | 74 | 0.0% |
| Sioux | 44 | 0.0% |
| Slavic | 663 | 0.1% |
| Slovak | 1,959 | 0.3% |
| Slovene | 505 | 0.1% |
| South African | 262 | 0.0% |
| South American | 17,892 | 2.3% |
| South American Indian | 165 | 0.0% |
| Spaniard | 1,116 | 0.1% |
| Spanish | 972 | 0.1% |
| Spanish American Indian | 31 | 0.0% |
| Sri Lankan | 2,141 | 0.3% |
| Subsaharan African | 3,292 | 0.4% |
| Swedish | 8,697 | 1.1% |
| Swiss | 2,009 | 0.3% |
| Syrian | 417 | 0.1% |
| Thai | 3,219 | 0.4% |
| Tongan | 25 | 0.0% |
| Trinidadian and Tobagonian | 880 | 0.1% |
| Turkish | 379 | 0.1% |
| U.S. Virgin Islander | 175 | 0.0% |
| Ukrainian | 2,299 | 0.3% |
| Uruguayan | 635 | 0.1% |
| Ute | 21 | 0.0% |
| Venezuelan | 2,816 | 0.4% |
| Vietnamese | 139 | 0.0% |
| Welsh | 3,820 | 0.5% |
| West Indian | 645 | 0.1% |
| Yaqui | 49 | 0.0% |
| Yugoslavian | 645 | 0.1% |
| Zimbabwean | 73 | 0.0% | View All 163 Rows |
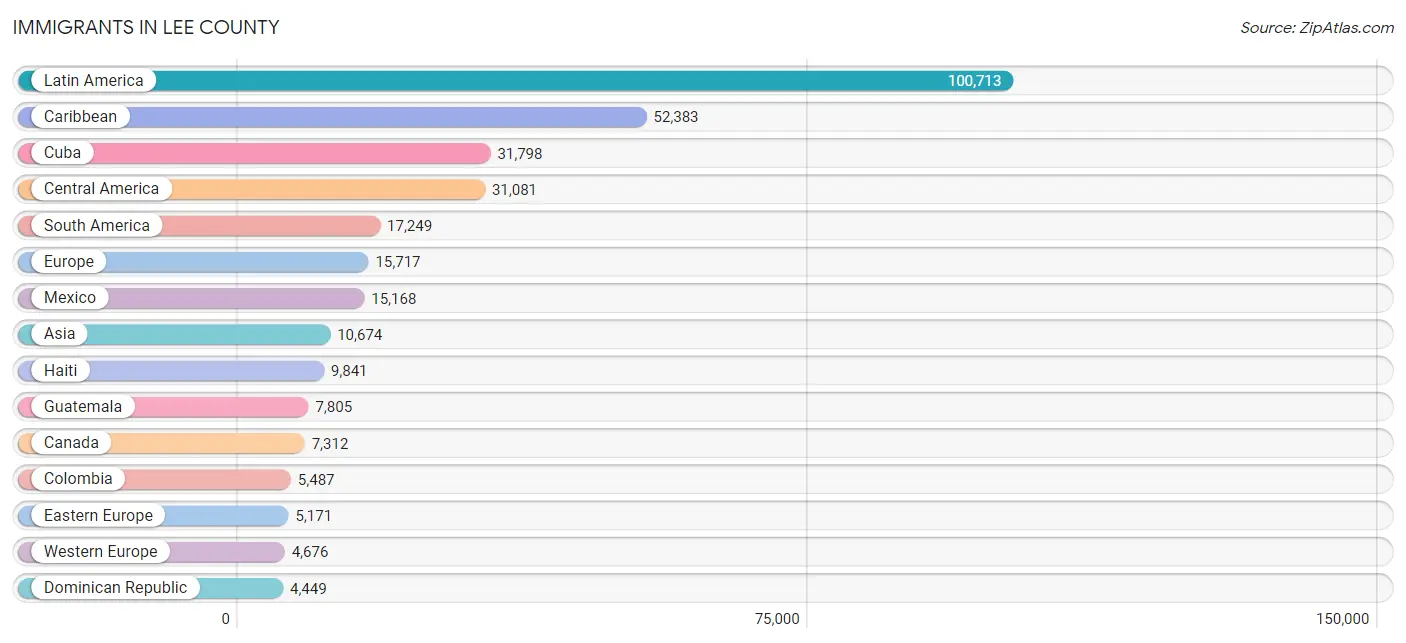
Immigrants in Lee County
The most numerous immigrant groups reported in Lee County came from Latin America (100,713 | 13.0%), Caribbean (52,383 | 6.8%), Cuba (31,798 | 4.1%), Central America (31,081 | 4.0%), and South America (17,249 | 2.2%), together accounting for 30.2% of all Lee County residents.
| Immigration Origin | # Population | % Population |
| Africa | 1,114 | 0.1% |
| Albania | 135 | 0.0% |
| Argentina | 650 | 0.1% |
| Asia | 10,674 | 1.4% |
| Australia | 35 | 0.0% |
| Austria | 224 | 0.0% |
| Azores | 5 | 0.0% |
| Bahamas | 320 | 0.0% |
| Bangladesh | 238 | 0.0% |
| Barbados | 342 | 0.0% |
| Belarus | 80 | 0.0% |
| Belgium | 56 | 0.0% |
| Belize | 134 | 0.0% |
| Bolivia | 412 | 0.1% |
| Bosnia and Herzegovina | 214 | 0.0% |
| Brazil | 3,766 | 0.5% |
| Bulgaria | 30 | 0.0% |
| Cambodia | 71 | 0.0% |
| Canada | 7,312 | 0.9% |
| Caribbean | 52,383 | 6.8% |
| Central America | 31,081 | 4.0% |
| Chile | 379 | 0.1% |
| China | 2,108 | 0.3% |
| Colombia | 5,487 | 0.7% |
| Costa Rica | 751 | 0.1% |
| Croatia | 334 | 0.0% |
| Cuba | 31,798 | 4.1% |
| Czechoslovakia | 837 | 0.1% |
| Denmark | 84 | 0.0% |
| Dominica | 131 | 0.0% |
| Dominican Republic | 4,449 | 0.6% |
| Eastern Africa | 282 | 0.0% |
| Eastern Asia | 2,485 | 0.3% |
| Eastern Europe | 5,171 | 0.7% |
| Ecuador | 1,170 | 0.2% |
| Egypt | 163 | 0.0% |
| El Salvador | 1,097 | 0.1% |
| England | 1,628 | 0.2% |
| Ethiopia | 21 | 0.0% |
| Europe | 15,717 | 2.0% |
| Fiji | 43 | 0.0% |
| France | 177 | 0.0% |
| Germany | 3,494 | 0.4% |
| Ghana | 7 | 0.0% |
| Greece | 218 | 0.0% |
| Grenada | 62 | 0.0% |
| Guatemala | 7,805 | 1.0% |
| Guyana | 971 | 0.1% |
| Haiti | 9,841 | 1.3% |
| Honduras | 3,817 | 0.5% |
| Hong Kong | 95 | 0.0% |
| Hungary | 417 | 0.1% |
| India | 1,611 | 0.2% |
| Indonesia | 15 | 0.0% |
| Iran | 287 | 0.0% |
| Iraq | 47 | 0.0% |
| Ireland | 613 | 0.1% |
| Israel | 253 | 0.0% |
| Italy | 1,147 | 0.2% |
| Jamaica | 4,043 | 0.5% |
| Japan | 86 | 0.0% |
| Jordan | 41 | 0.0% |
| Kazakhstan | 19 | 0.0% |
| Kenya | 32 | 0.0% |
| Korea | 291 | 0.0% |
| Kuwait | 17 | 0.0% |
| Laos | 325 | 0.0% |
| Latin America | 100,713 | 13.0% |
| Latvia | 86 | 0.0% |
| Lebanon | 395 | 0.1% |
| Liberia | 12 | 0.0% |
| Lithuania | 95 | 0.0% |
| Malaysia | 26 | 0.0% |
| Mexico | 15,168 | 2.0% |
| Middle Africa | 22 | 0.0% |
| Moldova | 125 | 0.0% |
| Morocco | 138 | 0.0% |
| Nepal | 72 | 0.0% |
| Netherlands | 552 | 0.1% |
| Nicaragua | 1,909 | 0.3% |
| North Macedonia | 24 | 0.0% |
| Northern Africa | 323 | 0.0% |
| Northern Europe | 4,027 | 0.5% |
| Norway | 53 | 0.0% |
| Oceania | 162 | 0.0% |
| Pakistan | 207 | 0.0% |
| Panama | 400 | 0.1% |
| Peru | 1,474 | 0.2% |
| Philippines | 2,522 | 0.3% |
| Poland | 1,285 | 0.2% |
| Portugal | 280 | 0.0% |
| Romania | 495 | 0.1% |
| Russia | 448 | 0.1% |
| Scotland | 163 | 0.0% |
| Serbia | 6 | 0.0% |
| Sierra Leone | 50 | 0.0% |
| Singapore | 19 | 0.0% |
| South Africa | 313 | 0.0% |
| South America | 17,249 | 2.2% |
| South Central Asia | 2,799 | 0.4% |
| South Eastern Asia | 4,384 | 0.6% |
| Southern Europe | 1,843 | 0.2% |
| Spain | 135 | 0.0% |
| Sri Lanka | 147 | 0.0% |
| St. Vincent and the Grenadines | 48 | 0.0% |
| Sweden | 191 | 0.0% |
| Switzerland | 111 | 0.0% |
| Syria | 54 | 0.0% |
| Taiwan | 102 | 0.0% |
| Thailand | 93 | 0.0% |
| Trinidad and Tobago | 838 | 0.1% |
| Turkey | 164 | 0.0% |
| Ukraine | 332 | 0.0% |
| Uruguay | 354 | 0.1% |
| Uzbekistan | 200 | 0.0% |
| Venezuela | 2,505 | 0.3% |
| Vietnam | 1,244 | 0.2% |
| West Indies | 10 | 0.0% |
| Western Africa | 146 | 0.0% |
| Western Asia | 982 | 0.1% |
| Western Europe | 4,676 | 0.6% |
| Zimbabwe | 55 | 0.0% | View All 122 Rows |
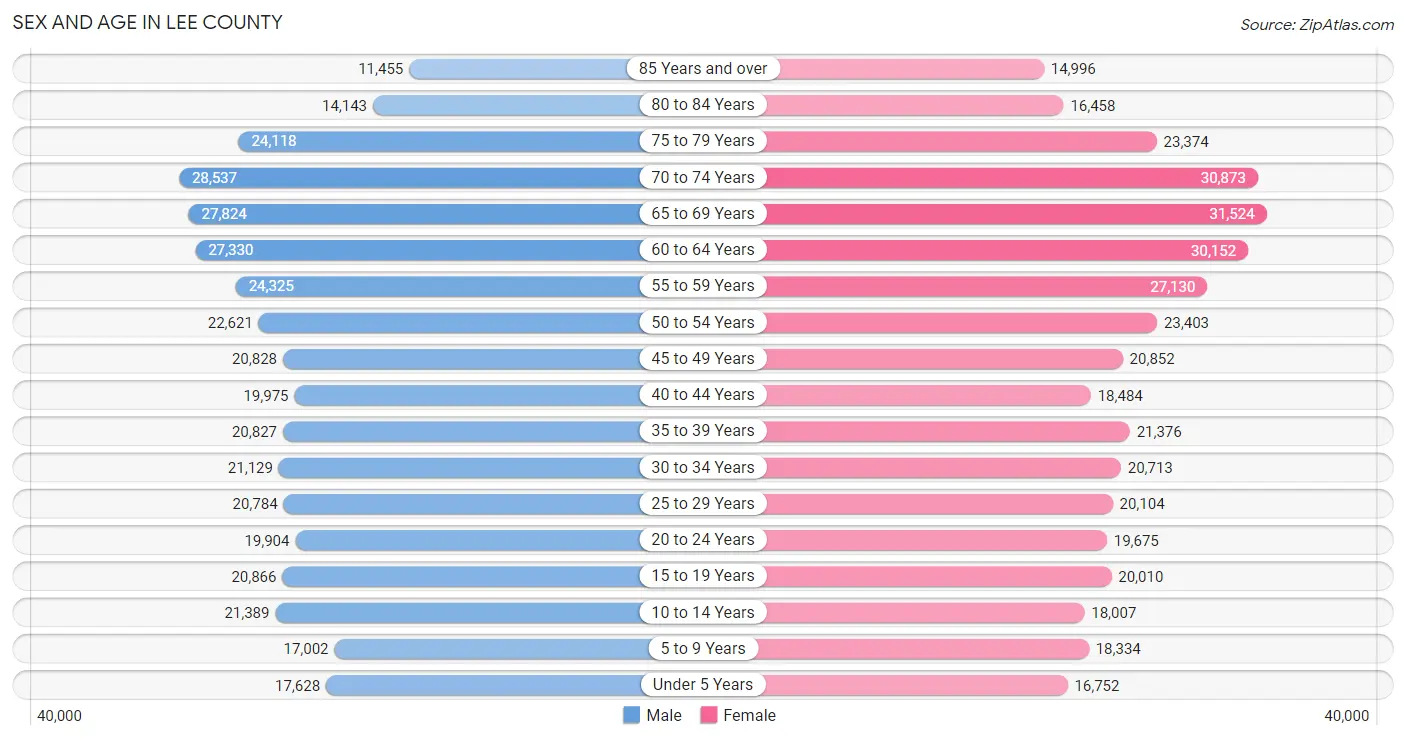
Sex and Age in Lee County
Sex and Age in Lee County
The most populous age groups in Lee County are 70 to 74 Years (28,537 | 7.5%) for men and 65 to 69 Years (31,524 | 8.0%) for women.
| Age Bracket | Male | Female |
| Under 5 Years | 17,628 (4.6%) | 16,752 (4.3%) |
| 5 to 9 Years | 17,002 (4.5%) | 18,334 (4.7%) |
| 10 to 14 Years | 21,389 (5.6%) | 18,007 (4.6%) |
| 15 to 19 Years | 20,866 (5.5%) | 20,010 (5.1%) |
| 20 to 24 Years | 19,904 (5.2%) | 19,675 (5.0%) |
| 25 to 29 Years | 20,784 (5.5%) | 20,104 (5.1%) |
| 30 to 34 Years | 21,129 (5.6%) | 20,713 (5.3%) |
| 35 to 39 Years | 20,827 (5.5%) | 21,376 (5.4%) |
| 40 to 44 Years | 19,975 (5.2%) | 18,484 (4.7%) |
| 45 to 49 Years | 20,828 (5.5%) | 20,852 (5.3%) |
| 50 to 54 Years | 22,621 (5.9%) | 23,403 (6.0%) |
| 55 to 59 Years | 24,325 (6.4%) | 27,130 (6.9%) |
| 60 to 64 Years | 27,330 (7.2%) | 30,152 (7.7%) |
| 65 to 69 Years | 27,824 (7.3%) | 31,524 (8.0%) |
| 70 to 74 Years | 28,537 (7.5%) | 30,873 (7.9%) |
| 75 to 79 Years | 24,118 (6.3%) | 23,374 (6.0%) |
| 80 to 84 Years | 14,143 (3.7%) | 16,458 (4.2%) |
| 85 Years and over | 11,455 (3.0%) | 14,996 (3.8%) |
| Total | 380,685 (100.0%) | 392,217 (100.0%) |
Families and Households in Lee County
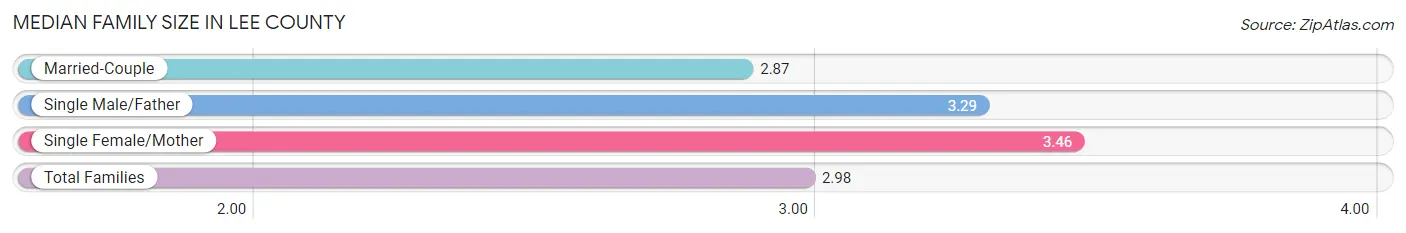
Median Family Size in Lee County
The median family size in Lee County is 2.98 persons per family, with single female/mother families (29,775 | 14.7%) accounting for the largest median family size of 3.46 persons per family. On the other hand, married-couple families (159,687 | 78.7%) represent the smallest median family size with 2.87 persons per family.
| Family Type | # Families | Family Size |
| Married-Couple | 159,687 (78.7%) | 2.87 |
| Single Male/Father | 13,368 (6.6%) | 3.29 |
| Single Female/Mother | 29,775 (14.7%) | 3.46 |
| Total Families | 202,830 (100.0%) | 2.98 |
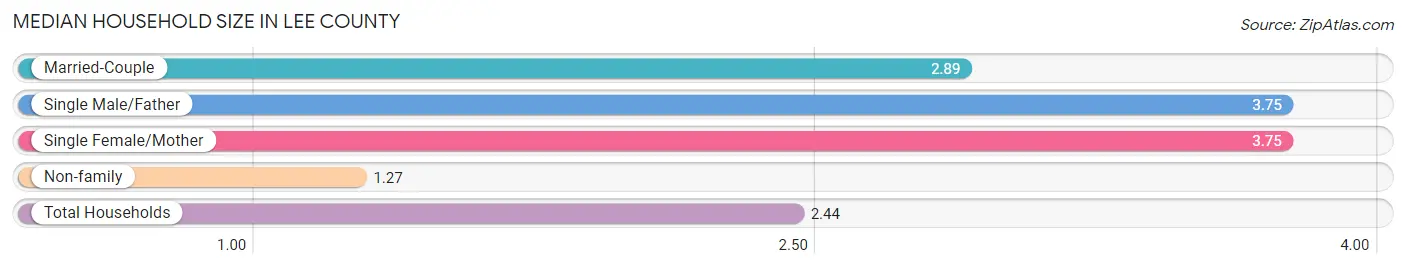
Median Household Size in Lee County
The median household size in Lee County is 2.44 persons per household, with single male/father households (13,368 | 4.3%) accounting for the largest median household size of 3.75 persons per household. non-family households (108,518 | 34.8%) represent the smallest median household size with 1.27 persons per household.
| Household Type | # Households | Household Size |
| Married-Couple | 159,687 (51.3%) | 2.89 |
| Single Male/Father | 13,368 (4.3%) | 3.75 |
| Single Female/Mother | 29,775 (9.6%) | 3.75 |
| Non-family | 108,518 (34.8%) | 1.27 |
| Total Households | 311,348 (100.0%) | 2.44 |
Household Size by Marriage Status in Lee County
Out of a total of 311,348 households in Lee County, 202,830 (65.1%) are family households, while 108,518 (34.8%) are nonfamily households. The most numerous type of family households are 2-person households, comprising 120,158, and the most common type of nonfamily households are 1-person households, comprising 88,615.
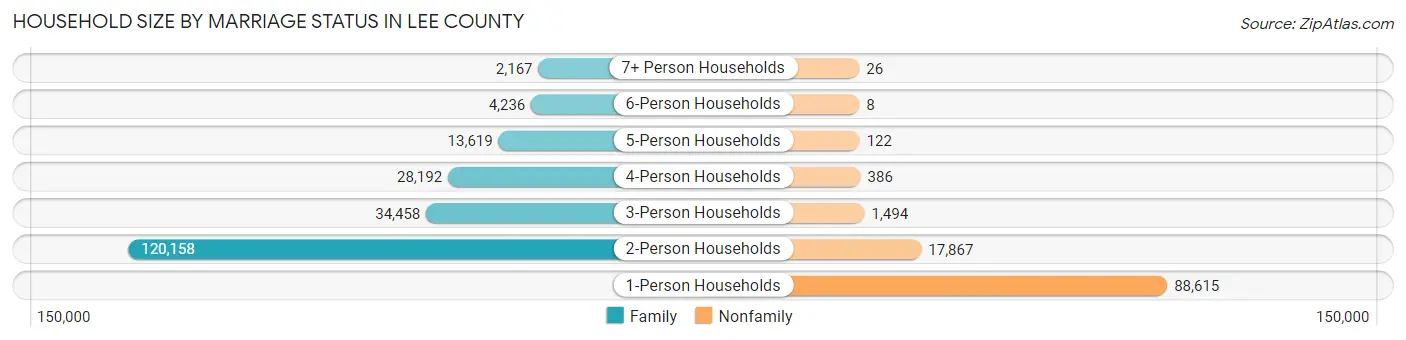
| Household Size | Family Households | Nonfamily Households |
| 1-Person Households | - | 88,615 (28.5%) |
| 2-Person Households | 120,158 (38.6%) | 17,867 (5.7%) |
| 3-Person Households | 34,458 (11.1%) | 1,494 (0.5%) |
| 4-Person Households | 28,192 (9.0%) | 386 (0.1%) |
| 5-Person Households | 13,619 (4.4%) | 122 (0.0%) |
| 6-Person Households | 4,236 (1.4%) | 8 (0.0%) |
| 7+ Person Households | 2,167 (0.7%) | 26 (0.0%) |
| Total | 202,830 (65.1%) | 108,518 (34.8%) |
Female Fertility in Lee County
Fertility by Age in Lee County
Average fertility rate in Lee County is 50.0 births per 1,000 women. Women in the age bracket of 20 to 34 years have the highest fertility rate with 94.0 births per 1,000 women. Women in the age bracket of 20 to 34 years acount for 78.2% of all women with births.
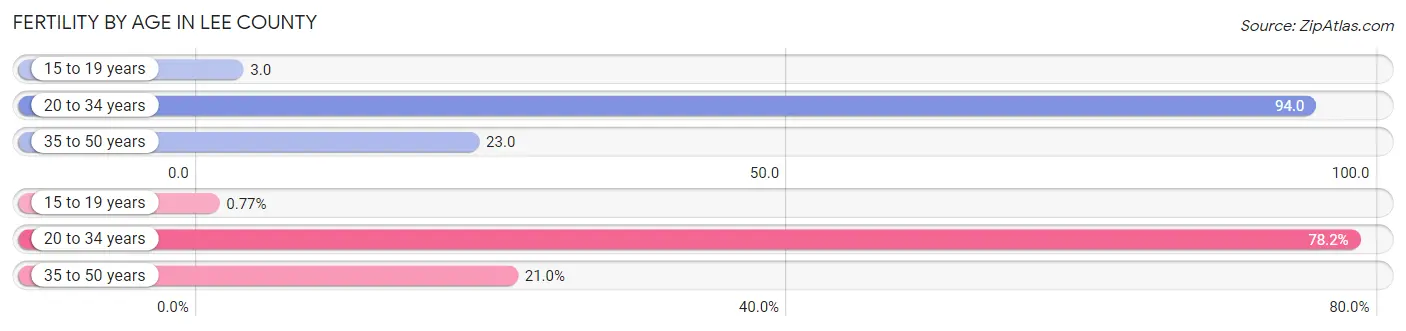
| Age Bracket | Women with Births | Births / 1,000 Women |
| 15 to 19 years | 56 (0.8%) | 3.0 |
| 20 to 34 years | 5,694 (78.2%) | 94.0 |
| 35 to 50 years | 1,530 (21.0%) | 23.0 |
| Total | 7,280 (100.0%) | 50.0 |
Fertility by Age by Marriage Status in Lee County
61.3% of women with births (7,280) in Lee County are married. The highest percentage of unmarried women with births falls into 15 to 19 years age bracket with 100.0% of them unmarried at the time of birth, while the lowest percentage of unmarried women with births belong to 35 to 50 years age bracket with 20.7% of them unmarried.
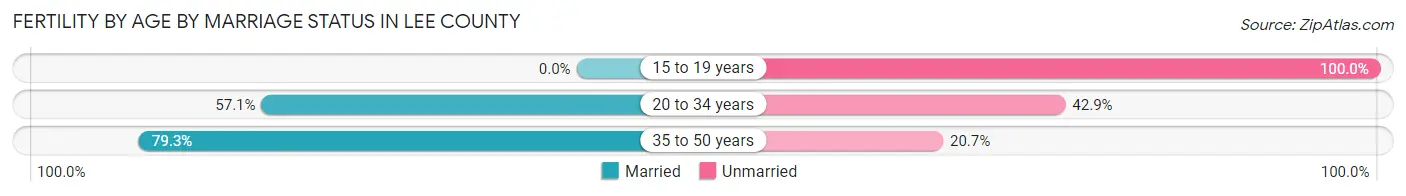
| Age Bracket | Married | Unmarried |
| 15 to 19 years | 0 (0.0%) | 56 (100.0%) |
| 20 to 34 years | 3,251 (57.1%) | 2,443 (42.9%) |
| 35 to 50 years | 1,213 (79.3%) | 317 (20.7%) |
| Total | 4,463 (61.3%) | 2,817 (38.7%) |
Fertility by Education in Lee County
Average fertility rate in Lee County is 50.0 births per 1,000 women. Women with the education attainment of graduate degree have the highest fertility rate of 55.0 births per 1,000 women, while women with the education attainment of less than high school have the lowest fertility at 47.0 births per 1,000 women. Women with the education attainment of college or associate's degree represent 32.3% of all women with births.
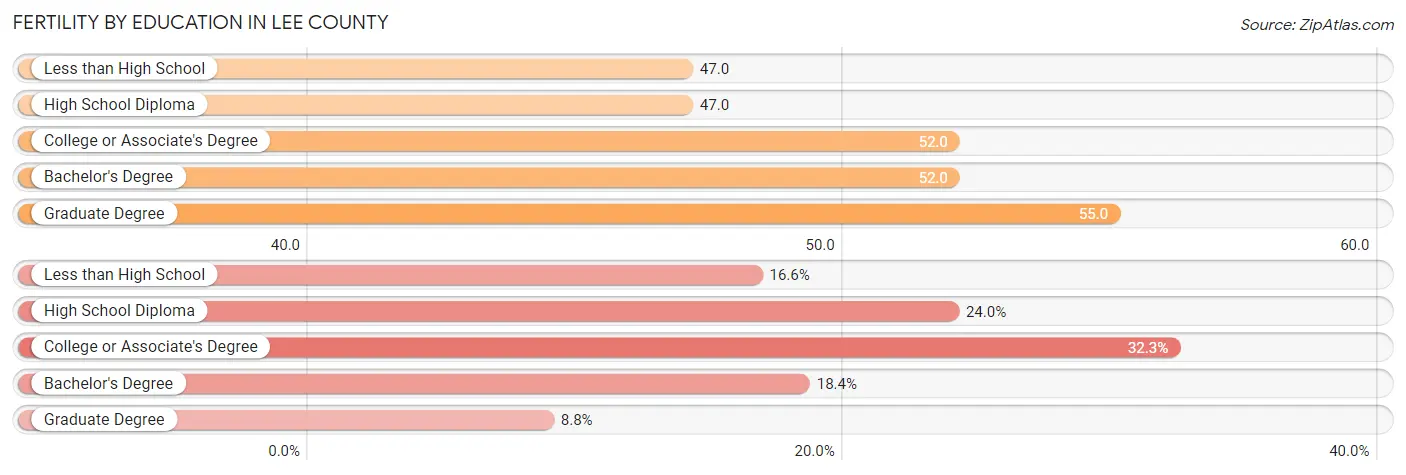
| Educational Attainment | Women with Births | Births / 1,000 Women |
| Less than High School | 1,209 (16.6%) | 47.0 |
| High School Diploma | 1,745 (24.0%) | 47.0 |
| College or Associate's Degree | 2,348 (32.3%) | 52.0 |
| Bachelor's Degree | 1,338 (18.4%) | 52.0 |
| Graduate Degree | 640 (8.8%) | 55.0 |
| Total | 7,280 (100.0%) | 50.0 |
Fertility by Education by Marriage Status in Lee County
38.7% of women with births in Lee County are unmarried. Women with the educational attainment of graduate degree are most likely to be married with 91.7% of them married at childbirth, while women with the educational attainment of high school diploma are least likely to be married with 64.5% of them unmarried at childbirth.
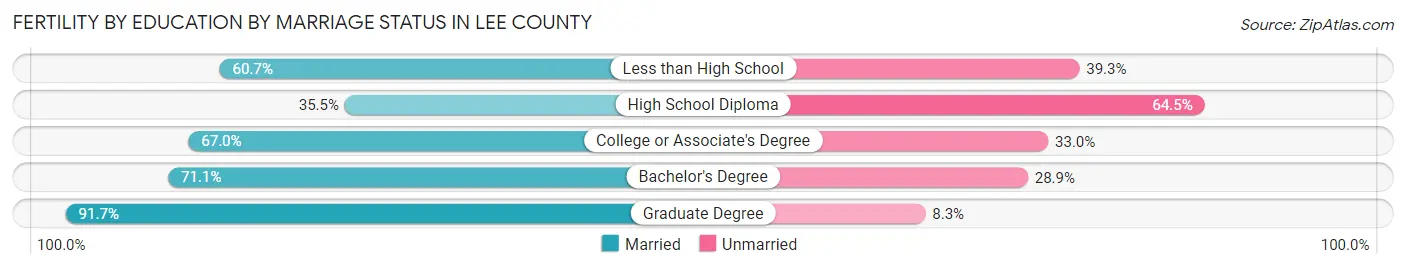
| Educational Attainment | Married | Unmarried |
| Less than High School | 734 (60.7%) | 475 (39.3%) |
| High School Diploma | 619 (35.5%) | 1,126 (64.5%) |
| College or Associate's Degree | 1,573 (67.0%) | 775 (33.0%) |
| Bachelor's Degree | 951 (71.1%) | 387 (28.9%) |
| Graduate Degree | 587 (91.7%) | 53 (8.3%) |
| Total | 4,463 (61.3%) | 2,817 (38.7%) |
Employment Characteristics in Lee County
Employment by Class of Employer in Lee County
Among the 326,302 employed individuals in Lee County, private company employees (227,000 | 69.6%), local government employees (23,247 | 7.1%), and self-employed (incorporated) (22,076 | 6.8%) make up the most common classes of employment.
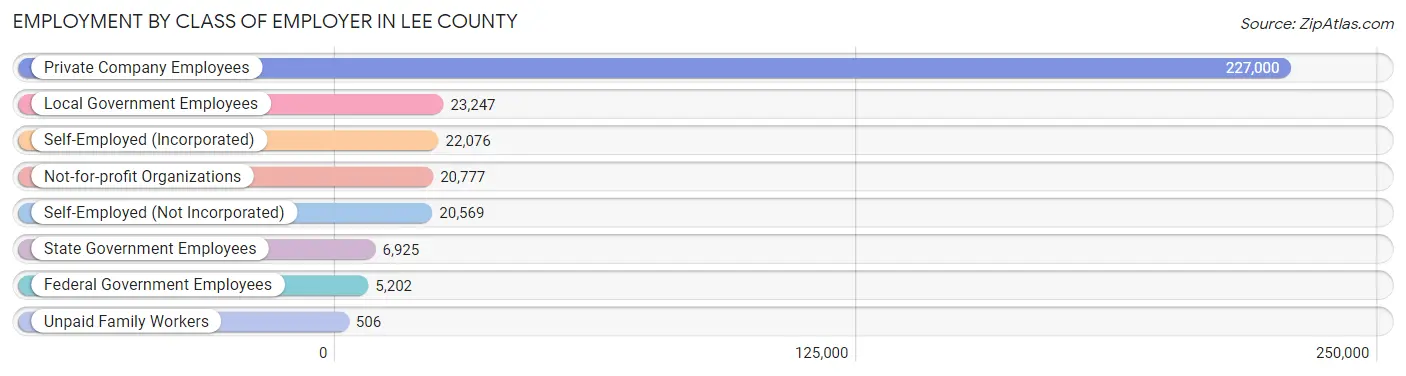
| Employer Class | # Employees | % Employees |
| Private Company Employees | 227,000 | 69.6% |
| Self-Employed (Incorporated) | 22,076 | 6.8% |
| Self-Employed (Not Incorporated) | 20,569 | 6.3% |
| Not-for-profit Organizations | 20,777 | 6.4% |
| Local Government Employees | 23,247 | 7.1% |
| State Government Employees | 6,925 | 2.1% |
| Federal Government Employees | 5,202 | 1.6% |
| Unpaid Family Workers | 506 | 0.2% |
| Total | 326,302 | 100.0% |
Employment Status by Age in Lee County
According to the labor force statistics for Lee County, out of the total population over 16 years of age (656,226), 53.1% or 348,456 individuals are in the labor force, with 4.5% or 15,681 of them unemployed. The age group with the highest labor force participation rate is 25 to 29 years, with 83.6% or 34,182 individuals in the labor force. Within the labor force, the 16 to 19 years age range has the highest percentage of unemployed individuals, with 10.2% or 1,318 of them being unemployed.
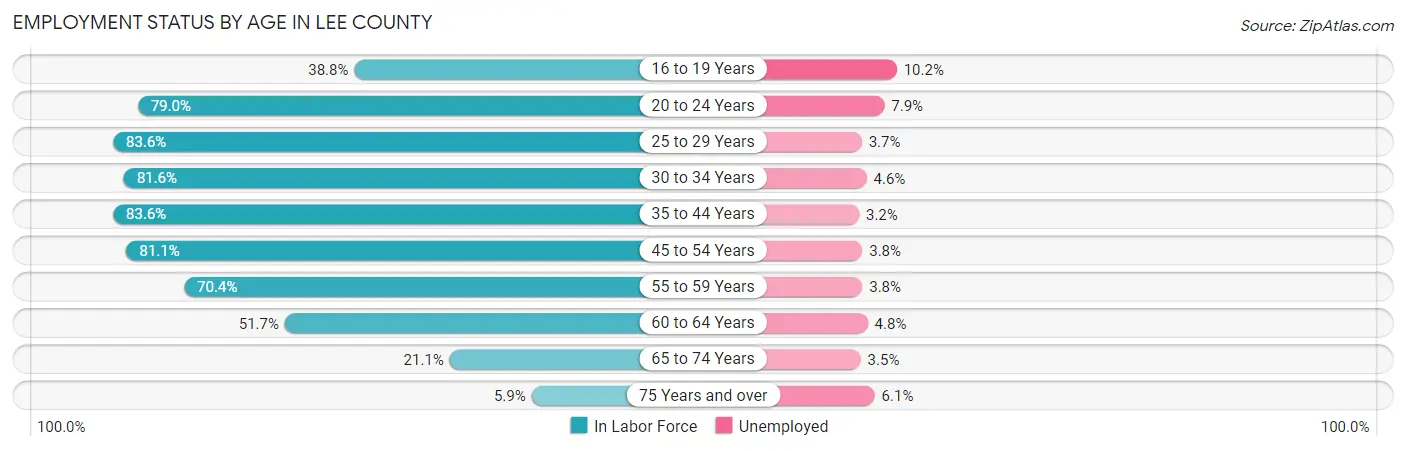
| Age Bracket | In Labor Force | Unemployed |
| 16 to 19 Years | 12,925 (38.8%) | 1,318 (10.2%) |
| 20 to 24 Years | 31,267 (79.0%) | 2,470 (7.9%) |
| 25 to 29 Years | 34,182 (83.6%) | 1,265 (3.7%) |
| 30 to 34 Years | 34,143 (81.6%) | 1,571 (4.6%) |
| 35 to 44 Years | 67,433 (83.6%) | 2,158 (3.2%) |
| 45 to 54 Years | 71,128 (81.1%) | 2,703 (3.8%) |
| 55 to 59 Years | 36,224 (70.4%) | 1,377 (3.8%) |
| 60 to 64 Years | 29,718 (51.7%) | 1,426 (4.8%) |
| 65 to 74 Years | 25,058 (21.1%) | 877 (3.5%) |
| 75 Years and over | 6,168 (5.9%) | 376 (6.1%) |
| Total | 348,456 (53.1%) | 15,681 (4.5%) |
Employment Status by Educational Attainment in Lee County
According to labor force statistics for Lee County, 75.8% of individuals (272,905) out of the total population between 25 and 64 years of age (360,033) are in the labor force, with 3.8% or 10,370 of them being unemployed. The group with the highest labor force participation rate are those with the educational attainment of bachelor's degree or higher, with 79.8% or 78,939 individuals in the labor force. Within the labor force, individuals with less than high school education have the highest percentage of unemployment, with 4.9% or 1,230 of them being unemployed.
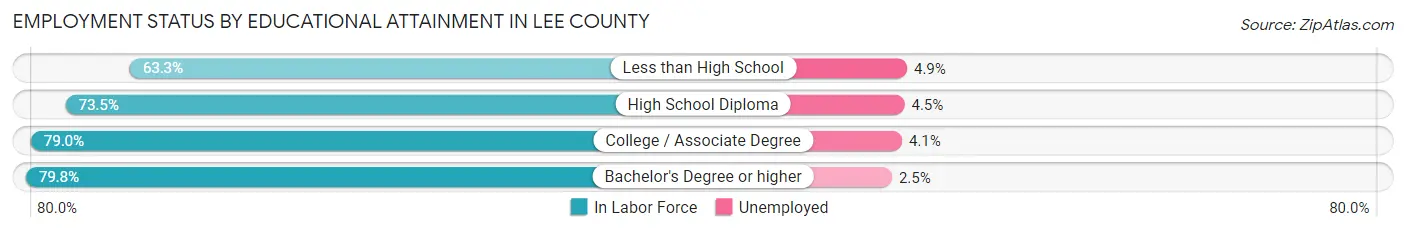
| Educational Attainment | In Labor Force | Unemployed |
| Less than High School | 25,098 (63.3%) | 1,943 (4.9%) |
| High School Diploma | 81,101 (73.5%) | 4,965 (4.5%) |
| College / Associate Degree | 87,786 (79.0%) | 4,556 (4.1%) |
| Bachelor's Degree or higher | 78,939 (79.8%) | 2,473 (2.5%) |
| Total | 272,905 (75.8%) | 13,681 (3.8%) |
Employment Occupations by Sex in Lee County
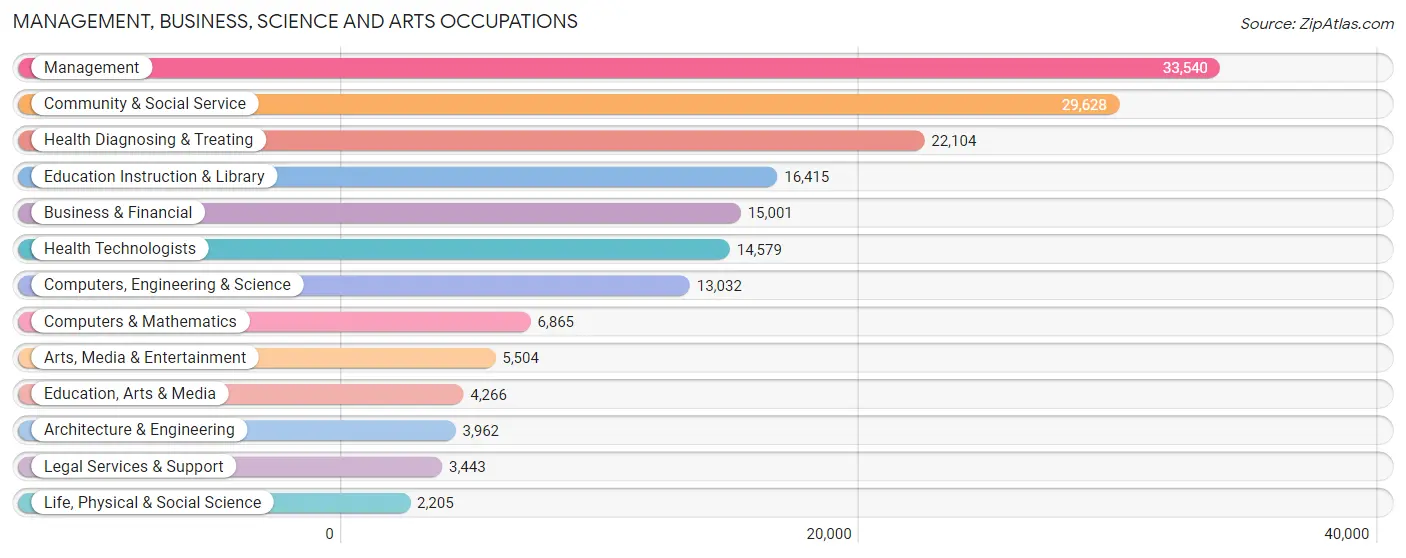
Management, Business, Science and Arts Occupations
The most common Management, Business, Science and Arts occupations in Lee County are Management (33,540 | 10.1%), Community & Social Service (29,628 | 8.9%), Health Diagnosing & Treating (22,104 | 6.7%), Education Instruction & Library (16,415 | 4.9%), and Business & Financial (15,001 | 4.5%).
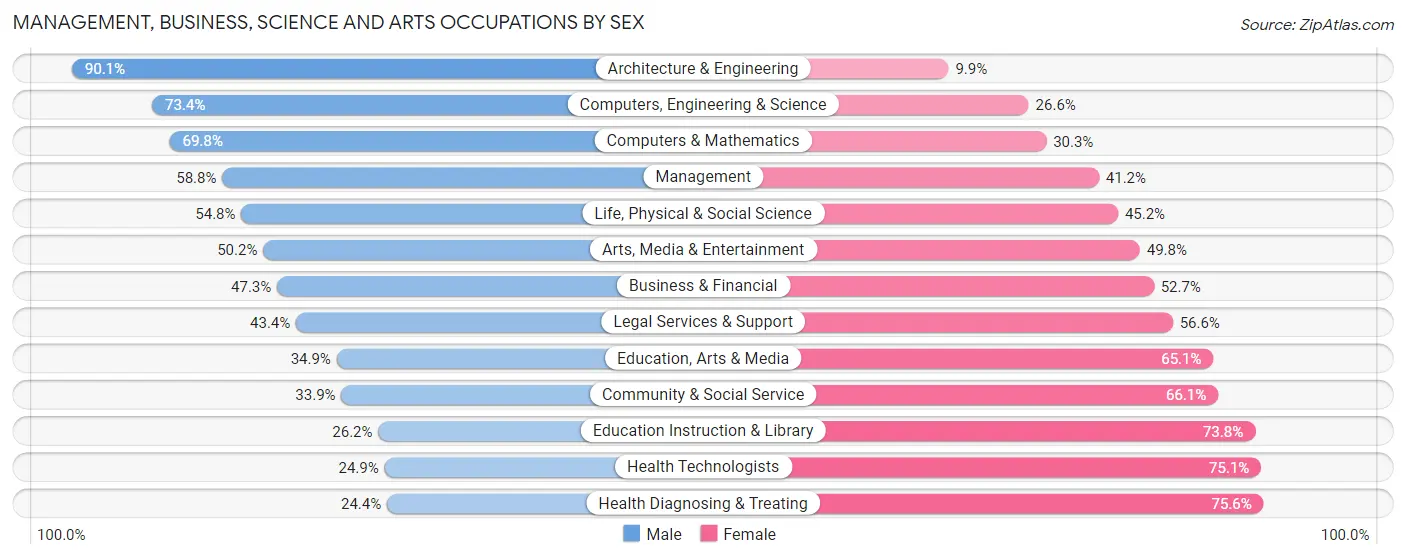
Management, Business, Science and Arts Occupations by Sex
Within the Management, Business, Science and Arts occupations in Lee County, the most male-oriented occupations are Architecture & Engineering (90.1%), Computers, Engineering & Science (73.4%), and Computers & Mathematics (69.8%), while the most female-oriented occupations are Health Diagnosing & Treating (75.6%), Health Technologists (75.1%), and Education Instruction & Library (73.8%).
| Occupation | Male | Female |
| Management | 19,707 (58.8%) | 13,833 (41.2%) |
| Business & Financial | 7,099 (47.3%) | 7,902 (52.7%) |
| Computers, Engineering & Science | 9,567 (73.4%) | 3,465 (26.6%) |
| Computers & Mathematics | 4,788 (69.8%) | 2,077 (30.2%) |
| Architecture & Engineering | 3,571 (90.1%) | 391 (9.9%) |
| Life, Physical & Social Science | 1,208 (54.8%) | 997 (45.2%) |
| Community & Social Service | 10,047 (33.9%) | 19,581 (66.1%) |
| Education, Arts & Media | 1,489 (34.9%) | 2,777 (65.1%) |
| Legal Services & Support | 1,493 (43.4%) | 1,950 (56.6%) |
| Education Instruction & Library | 4,301 (26.2%) | 12,114 (73.8%) |
| Arts, Media & Entertainment | 2,764 (50.2%) | 2,740 (49.8%) |
| Health Diagnosing & Treating | 5,394 (24.4%) | 16,710 (75.6%) |
| Health Technologists | 3,631 (24.9%) | 10,948 (75.1%) |
| Total (Category) | 51,814 (45.7%) | 61,491 (54.3%) |
| Total (Overall) | 175,553 (52.8%) | 156,954 (47.2%) |
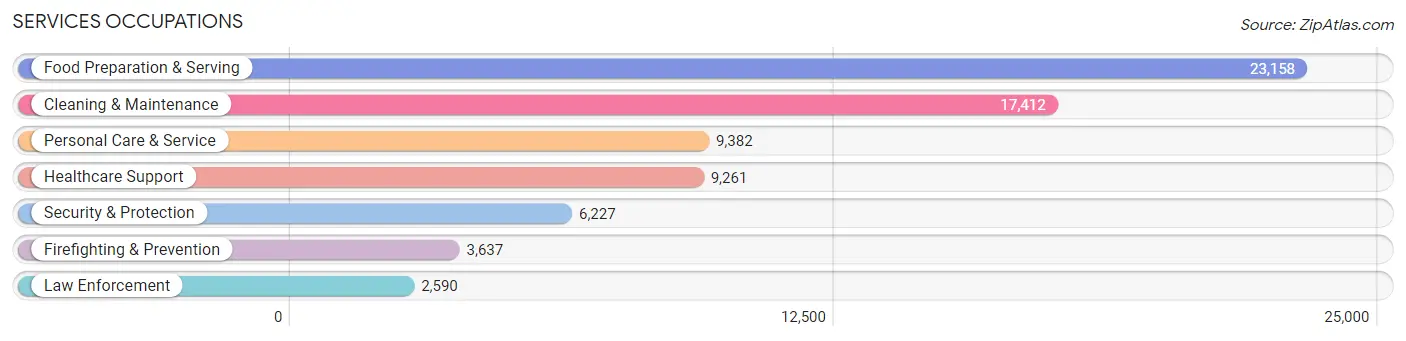
Services Occupations
The most common Services occupations in Lee County are Food Preparation & Serving (23,158 | 7.0%), Cleaning & Maintenance (17,412 | 5.2%), Personal Care & Service (9,382 | 2.8%), Healthcare Support (9,261 | 2.8%), and Security & Protection (6,227 | 1.9%).
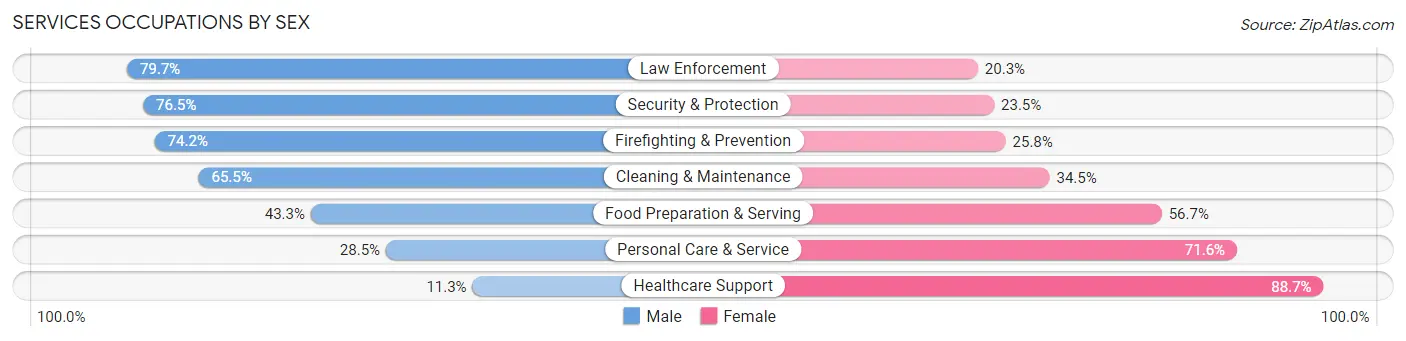
Services Occupations by Sex
Within the Services occupations in Lee County, the most male-oriented occupations are Law Enforcement (79.7%), Security & Protection (76.5%), and Firefighting & Prevention (74.2%), while the most female-oriented occupations are Healthcare Support (88.7%), Personal Care & Service (71.6%), and Food Preparation & Serving (56.7%).
| Occupation | Male | Female |
| Healthcare Support | 1,048 (11.3%) | 8,213 (88.7%) |
| Security & Protection | 4,765 (76.5%) | 1,462 (23.5%) |
| Firefighting & Prevention | 2,700 (74.2%) | 937 (25.8%) |
| Law Enforcement | 2,065 (79.7%) | 525 (20.3%) |
| Food Preparation & Serving | 10,034 (43.3%) | 13,124 (56.7%) |
| Cleaning & Maintenance | 11,412 (65.5%) | 6,000 (34.5%) |
| Personal Care & Service | 2,669 (28.4%) | 6,713 (71.6%) |
| Total (Category) | 29,928 (45.7%) | 35,512 (54.3%) |
| Total (Overall) | 175,553 (52.8%) | 156,954 (47.2%) |
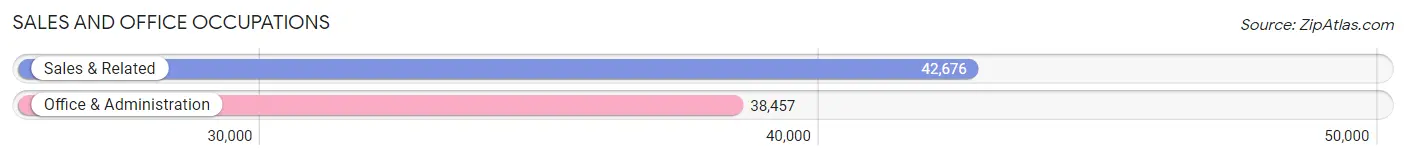
Sales and Office Occupations
The most common Sales and Office occupations in Lee County are Sales & Related (42,676 | 12.8%), and Office & Administration (38,457 | 11.6%).
Sales and Office Occupations by Sex
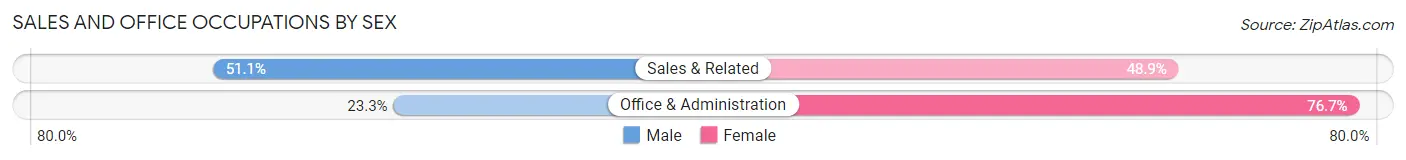
| Occupation | Male | Female |
| Sales & Related | 21,789 (51.1%) | 20,887 (48.9%) |
| Office & Administration | 8,945 (23.3%) | 29,512 (76.7%) |
| Total (Category) | 30,734 (37.9%) | 50,399 (62.1%) |
| Total (Overall) | 175,553 (52.8%) | 156,954 (47.2%) |
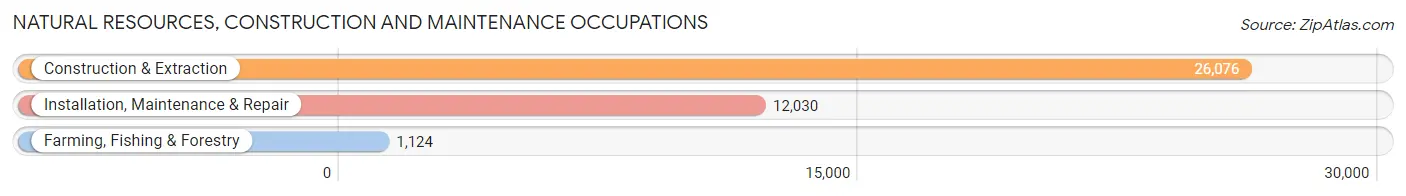
Natural Resources, Construction and Maintenance Occupations
The most common Natural Resources, Construction and Maintenance occupations in Lee County are Construction & Extraction (26,076 | 7.8%), Installation, Maintenance & Repair (12,030 | 3.6%), and Farming, Fishing & Forestry (1,124 | 0.3%).
Natural Resources, Construction and Maintenance Occupations by Sex
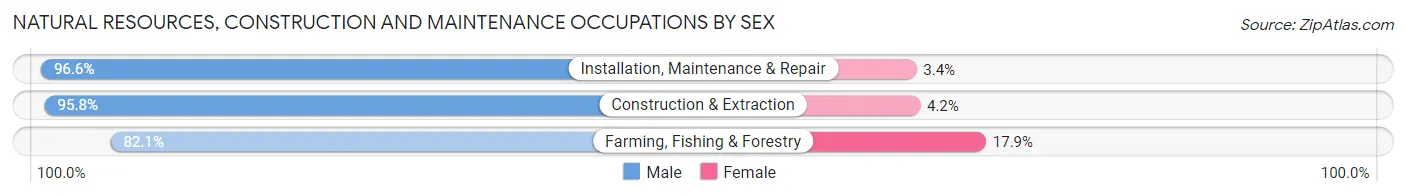
| Occupation | Male | Female |
| Farming, Fishing & Forestry | 923 (82.1%) | 201 (17.9%) |
| Construction & Extraction | 24,985 (95.8%) | 1,091 (4.2%) |
| Installation, Maintenance & Repair | 11,619 (96.6%) | 411 (3.4%) |
| Total (Category) | 37,527 (95.7%) | 1,703 (4.3%) |
| Total (Overall) | 175,553 (52.8%) | 156,954 (47.2%) |
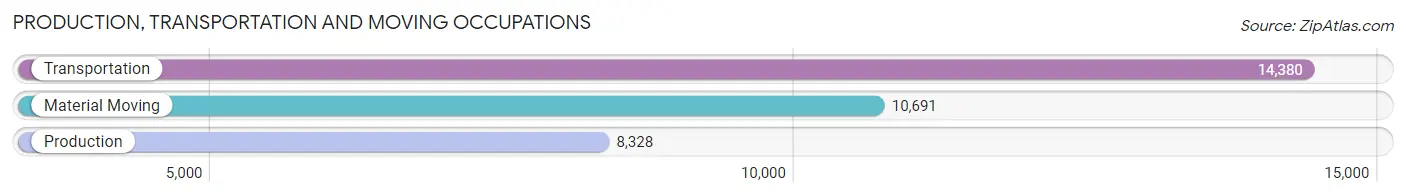
Production, Transportation and Moving Occupations
The most common Production, Transportation and Moving occupations in Lee County are Transportation (14,380 | 4.3%), Material Moving (10,691 | 3.2%), and Production (8,328 | 2.5%).
Production, Transportation and Moving Occupations by Sex
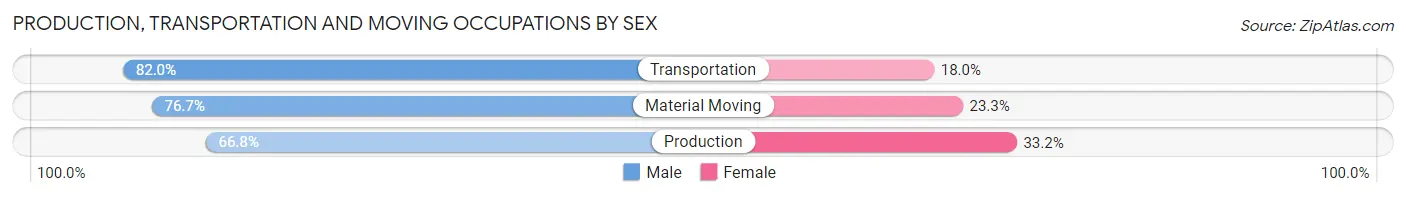
| Occupation | Male | Female |
| Production | 5,563 (66.8%) | 2,765 (33.2%) |
| Transportation | 11,787 (82.0%) | 2,593 (18.0%) |
| Material Moving | 8,200 (76.7%) | 2,491 (23.3%) |
| Total (Category) | 25,550 (76.5%) | 7,849 (23.5%) |
| Total (Overall) | 175,553 (52.8%) | 156,954 (47.2%) |
Employment Industries by Sex in Lee County
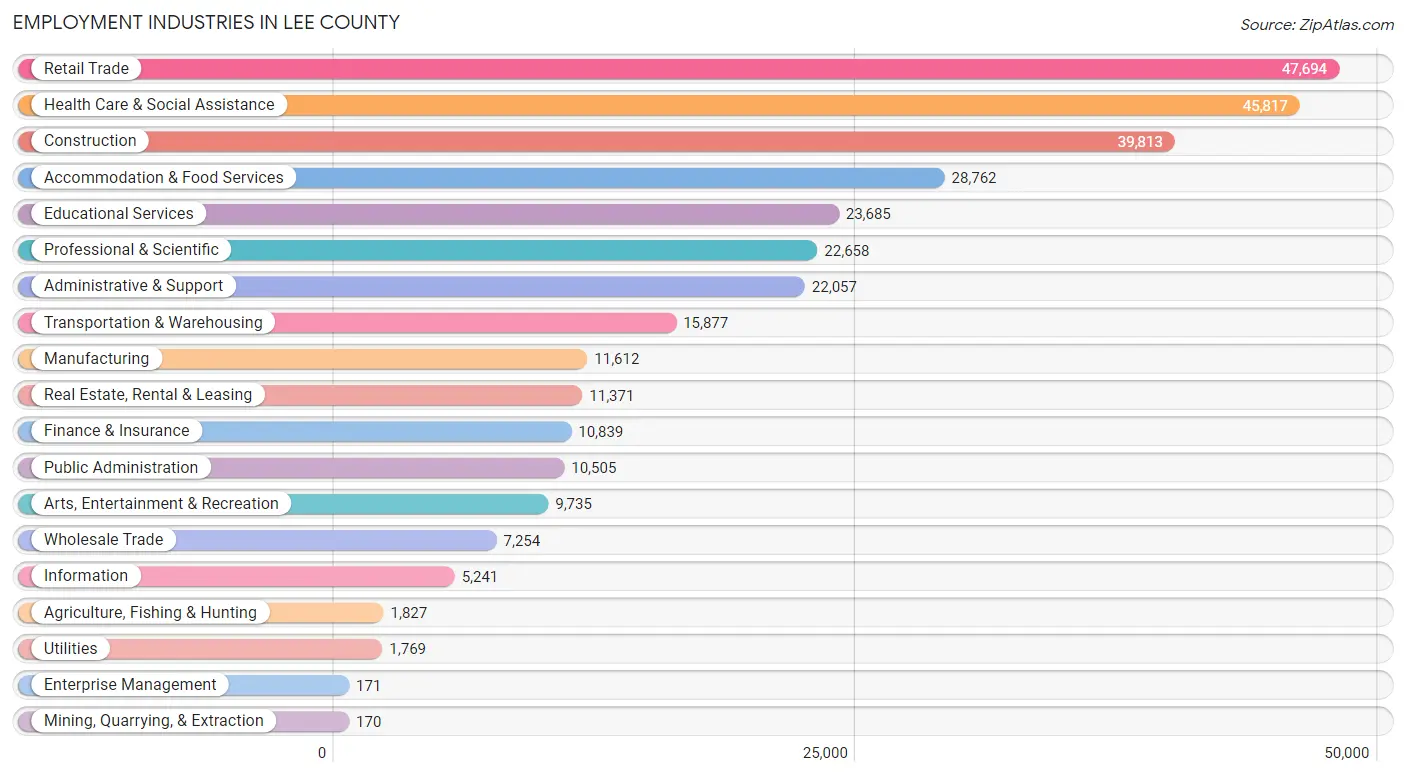
Employment Industries in Lee County
The major employment industries in Lee County include Retail Trade (47,694 | 14.3%), Health Care & Social Assistance (45,817 | 13.8%), Construction (39,813 | 12.0%), Accommodation & Food Services (28,762 | 8.6%), and Educational Services (23,685 | 7.1%).
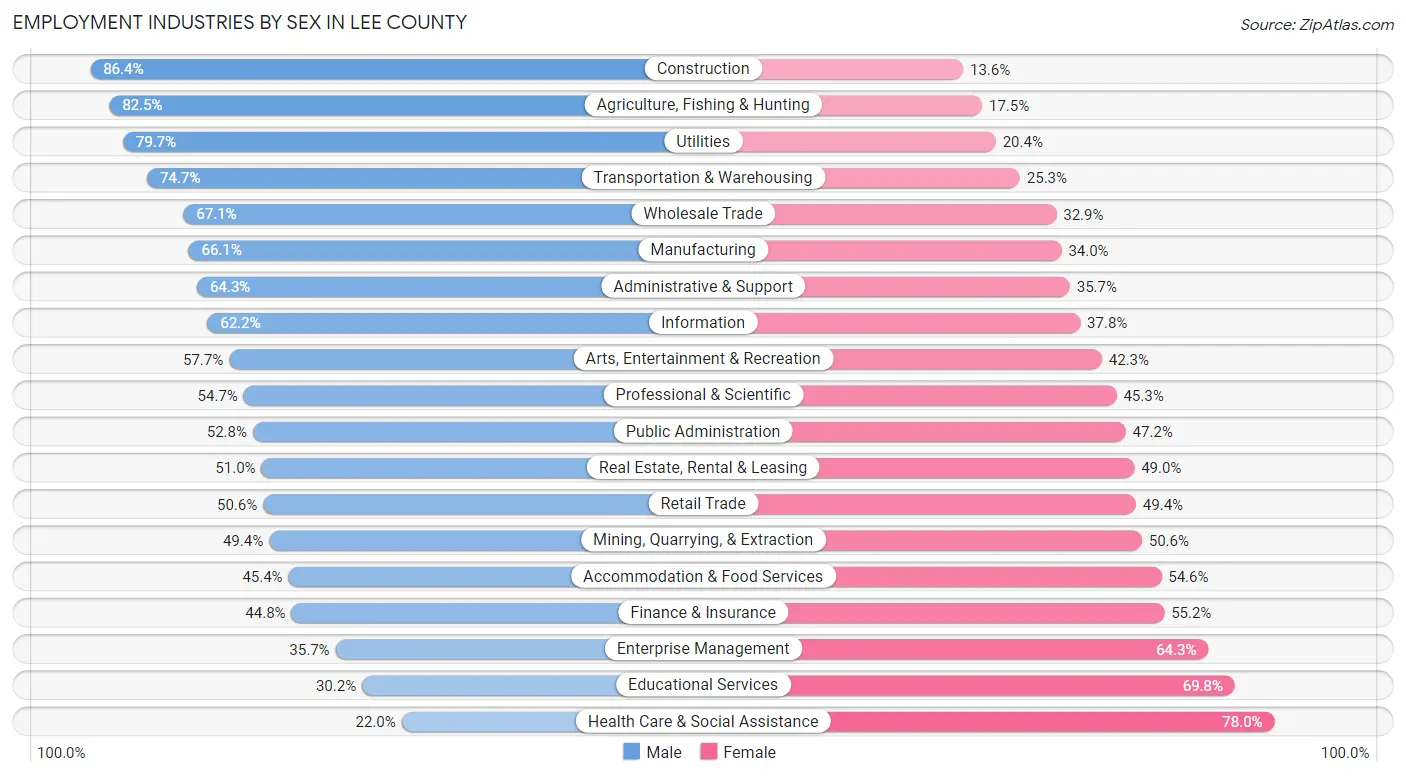
Employment Industries by Sex in Lee County
The Lee County industries that see more men than women are Construction (86.4%), Agriculture, Fishing & Hunting (82.5%), and Utilities (79.6%), whereas the industries that tend to have a higher number of women are Health Care & Social Assistance (78.0%), Educational Services (69.8%), and Enterprise Management (64.3%).
| Industry | Male | Female |
| Agriculture, Fishing & Hunting | 1,507 (82.5%) | 320 (17.5%) |
| Mining, Quarrying, & Extraction | 84 (49.4%) | 86 (50.6%) |
| Construction | 34,404 (86.4%) | 5,409 (13.6%) |
| Manufacturing | 7,670 (66.0%) | 3,942 (34.0%) |
| Wholesale Trade | 4,869 (67.1%) | 2,385 (32.9%) |
| Retail Trade | 24,150 (50.6%) | 23,544 (49.4%) |
| Transportation & Warehousing | 11,854 (74.7%) | 4,023 (25.3%) |
| Utilities | 1,409 (79.6%) | 360 (20.3%) |
| Information | 3,259 (62.2%) | 1,982 (37.8%) |
| Finance & Insurance | 4,854 (44.8%) | 5,985 (55.2%) |
| Real Estate, Rental & Leasing | 5,798 (51.0%) | 5,573 (49.0%) |
| Professional & Scientific | 12,384 (54.7%) | 10,274 (45.3%) |
| Enterprise Management | 61 (35.7%) | 110 (64.3%) |
| Administrative & Support | 14,187 (64.3%) | 7,870 (35.7%) |
| Educational Services | 7,146 (30.2%) | 16,539 (69.8%) |
| Health Care & Social Assistance | 10,069 (22.0%) | 35,748 (78.0%) |
| Arts, Entertainment & Recreation | 5,615 (57.7%) | 4,120 (42.3%) |
| Accommodation & Food Services | 13,054 (45.4%) | 15,708 (54.6%) |
| Public Administration | 5,542 (52.8%) | 4,963 (47.2%) |
| Total | 175,553 (52.8%) | 156,954 (47.2%) |
Education in Lee County
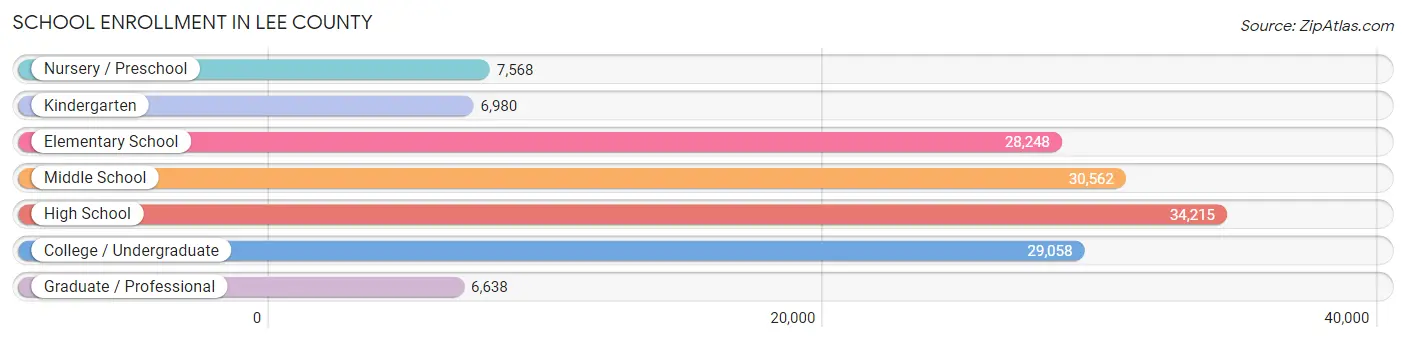
School Enrollment in Lee County
The most common levels of schooling among the 143,269 students in Lee County are high school (34,215 | 23.9%), middle school (30,562 | 21.3%), and college / undergraduate (29,058 | 20.3%).
| School Level | # Students | % Students |
| Nursery / Preschool | 7,568 | 5.3% |
| Kindergarten | 6,980 | 4.9% |
| Elementary School | 28,248 | 19.7% |
| Middle School | 30,562 | 21.3% |
| High School | 34,215 | 23.9% |
| College / Undergraduate | 29,058 | 20.3% |
| Graduate / Professional | 6,638 | 4.6% |
| Total | 143,269 | 100.0% |
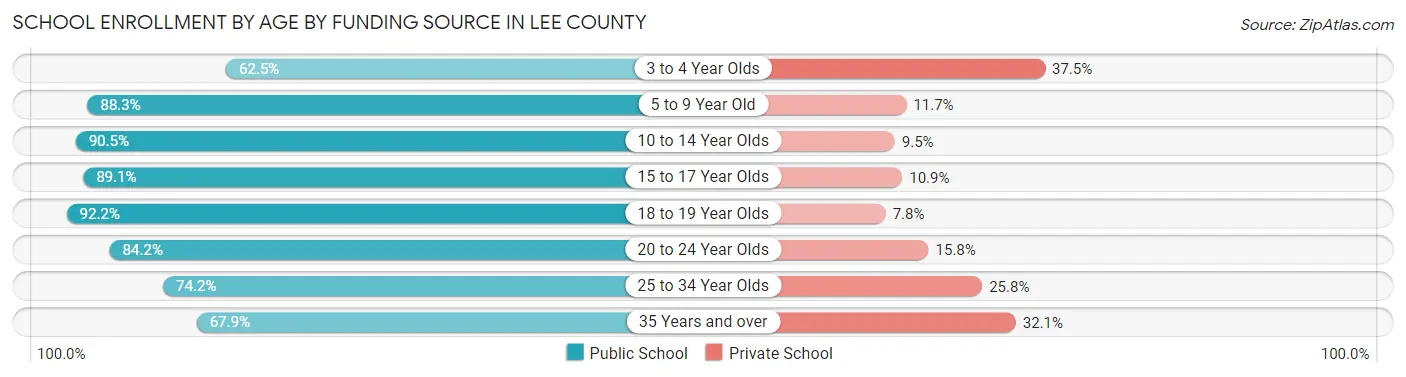
School Enrollment by Age by Funding Source in Lee County
Out of a total of 143,269 students who are enrolled in schools in Lee County, 20,344 (14.2%) attend a private institution, while the remaining 122,925 (85.8%) are enrolled in public schools. The age group of 3 to 4 year olds has the highest likelihood of being enrolled in private schools, with 2,297 (37.5% in the age bracket) enrolled. Conversely, the age group of 18 to 19 year olds has the lowest likelihood of being enrolled in a private school, with 11,214 (92.2% in the age bracket) attending a public institution.
| Age Bracket | Public School | Private School |
| 3 to 4 Year Olds | 3,826 (62.5%) | 2,297 (37.5%) |
| 5 to 9 Year Old | 28,803 (88.3%) | 3,814 (11.7%) |
| 10 to 14 Year Olds | 34,629 (90.5%) | 3,647 (9.5%) |
| 15 to 17 Year Olds | 20,441 (89.1%) | 2,506 (10.9%) |
| 18 to 19 Year Olds | 11,214 (92.2%) | 952 (7.8%) |
| 20 to 24 Year Olds | 12,544 (84.2%) | 2,358 (15.8%) |
| 25 to 34 Year Olds | 5,717 (74.2%) | 1,989 (25.8%) |
| 35 Years and over | 5,796 (67.9%) | 2,736 (32.1%) |
| Total | 122,925 (85.8%) | 20,344 (14.2%) |
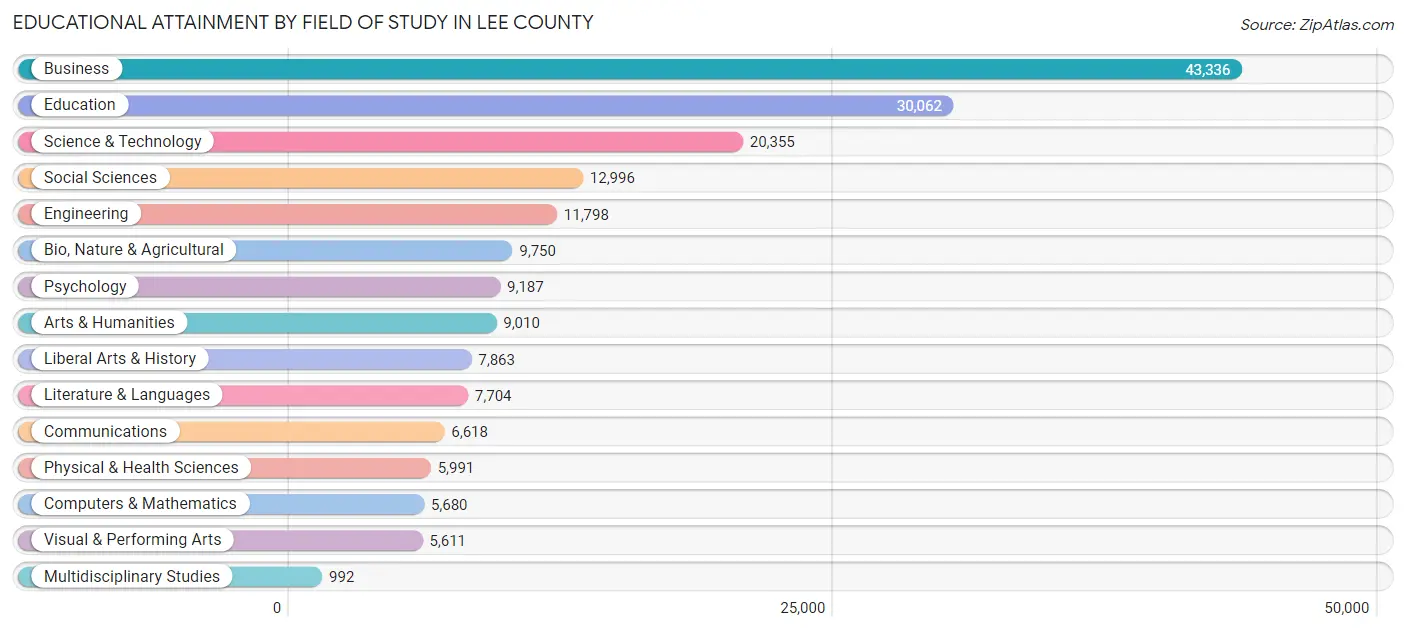
Educational Attainment by Field of Study in Lee County
Business (43,336 | 23.2%), education (30,062 | 16.1%), science & technology (20,355 | 10.9%), social sciences (12,996 | 7.0%), and engineering (11,798 | 6.3%) are the most common fields of study among 186,953 individuals in Lee County who have obtained a bachelor's degree or higher.
| Field of Study | # Graduates | % Graduates |
| Computers & Mathematics | 5,680 | 3.0% |
| Bio, Nature & Agricultural | 9,750 | 5.2% |
| Physical & Health Sciences | 5,991 | 3.2% |
| Psychology | 9,187 | 4.9% |
| Social Sciences | 12,996 | 7.0% |
| Engineering | 11,798 | 6.3% |
| Multidisciplinary Studies | 992 | 0.5% |
| Science & Technology | 20,355 | 10.9% |
| Business | 43,336 | 23.2% |
| Education | 30,062 | 16.1% |
| Literature & Languages | 7,704 | 4.1% |
| Liberal Arts & History | 7,863 | 4.2% |
| Visual & Performing Arts | 5,611 | 3.0% |
| Communications | 6,618 | 3.5% |
| Arts & Humanities | 9,010 | 4.8% |
| Total | 186,953 | 100.0% |
Transportation & Commute in Lee County
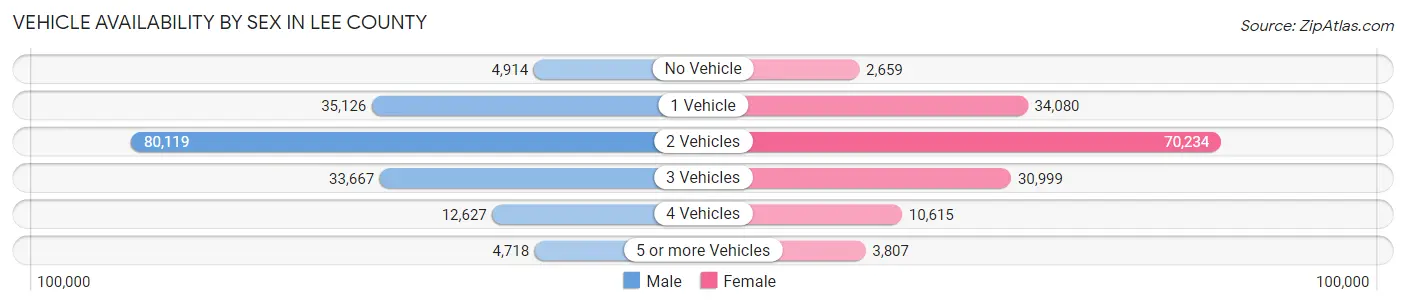
Vehicle Availability by Sex in Lee County
The most prevalent vehicle ownership categories in Lee County are males with 2 vehicles (80,119, accounting for 46.8%) and females with 2 vehicles (70,234, making up 52.6%).
| Vehicles Available | Male | Female |
| No Vehicle | 4,914 (2.9%) | 2,659 (1.7%) |
| 1 Vehicle | 35,126 (20.5%) | 34,080 (22.4%) |
| 2 Vehicles | 80,119 (46.8%) | 70,234 (46.1%) |
| 3 Vehicles | 33,667 (19.7%) | 30,999 (20.3%) |
| 4 Vehicles | 12,627 (7.4%) | 10,615 (7.0%) |
| 5 or more Vehicles | 4,718 (2.8%) | 3,807 (2.5%) |
| Total | 171,171 (100.0%) | 152,394 (100.0%) |
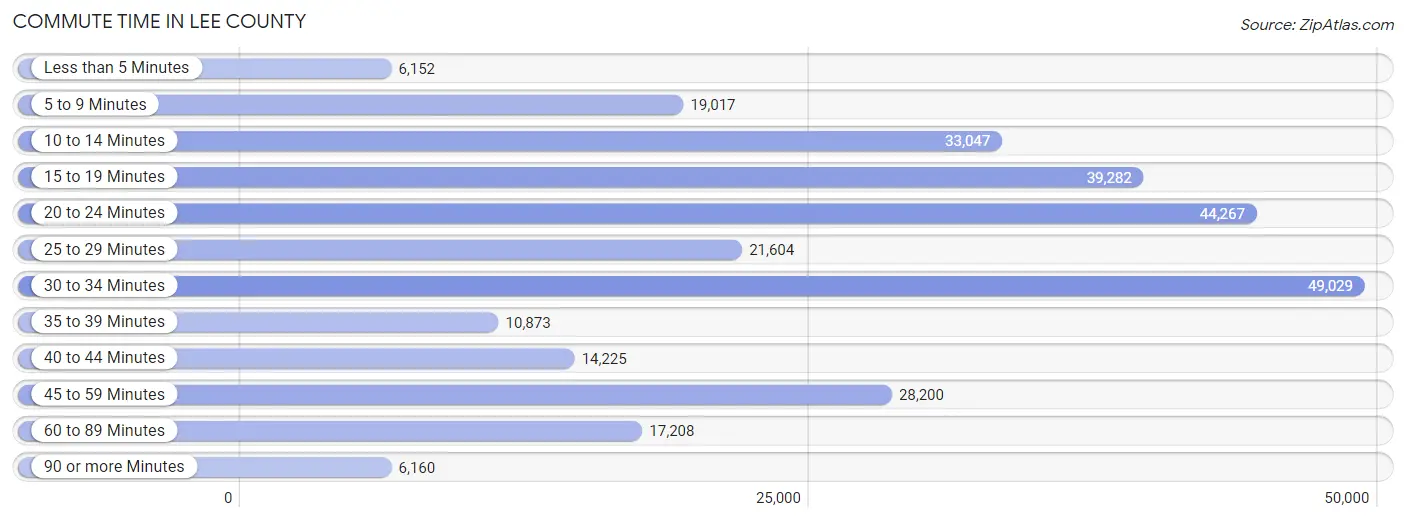
Commute Time in Lee County
The most frequently occuring commute durations in Lee County are 30 to 34 minutes (49,029 commuters, 17.0%), 20 to 24 minutes (44,267 commuters, 15.3%), and 15 to 19 minutes (39,282 commuters, 13.6%).
| Commute Time | # Commuters | % Commuters |
| Less than 5 Minutes | 6,152 | 2.1% |
| 5 to 9 Minutes | 19,017 | 6.6% |
| 10 to 14 Minutes | 33,047 | 11.4% |
| 15 to 19 Minutes | 39,282 | 13.6% |
| 20 to 24 Minutes | 44,267 | 15.3% |
| 25 to 29 Minutes | 21,604 | 7.5% |
| 30 to 34 Minutes | 49,029 | 17.0% |
| 35 to 39 Minutes | 10,873 | 3.8% |
| 40 to 44 Minutes | 14,225 | 4.9% |
| 45 to 59 Minutes | 28,200 | 9.8% |
| 60 to 89 Minutes | 17,208 | 5.9% |
| 90 or more Minutes | 6,160 | 2.1% |
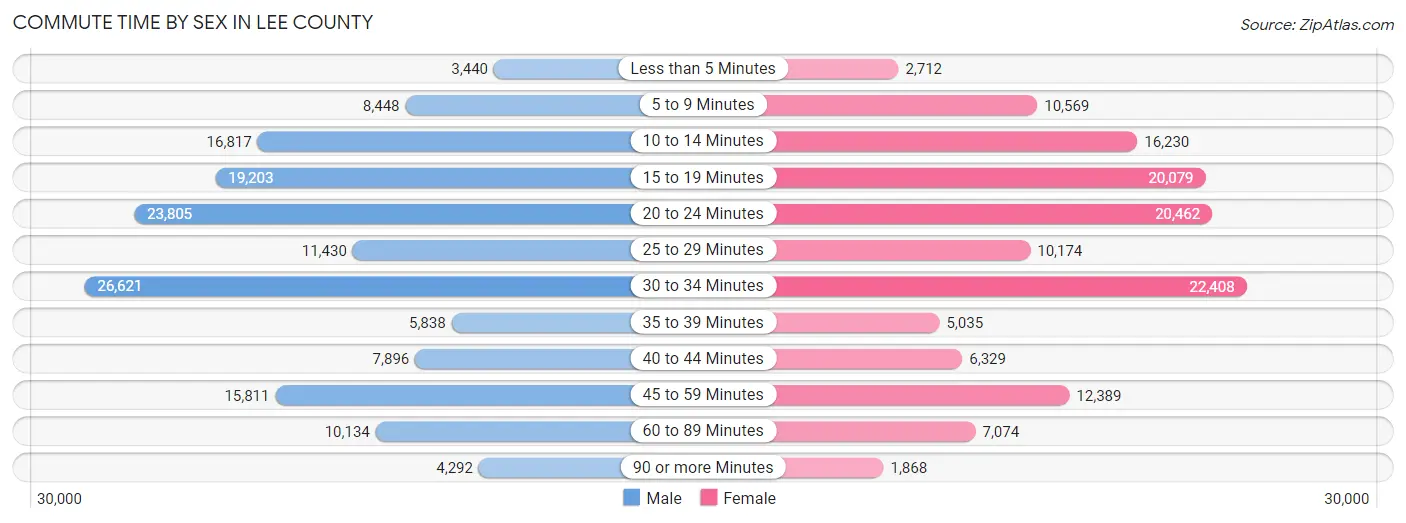
Commute Time by Sex in Lee County
The most common commute times in Lee County are 30 to 34 minutes (26,621 commuters, 17.3%) for males and 30 to 34 minutes (22,408 commuters, 16.6%) for females.
| Commute Time | Male | Female |
| Less than 5 Minutes | 3,440 (2.2%) | 2,712 (2.0%) |
| 5 to 9 Minutes | 8,448 (5.5%) | 10,569 (7.8%) |
| 10 to 14 Minutes | 16,817 (10.9%) | 16,230 (12.0%) |
| 15 to 19 Minutes | 19,203 (12.5%) | 20,079 (14.8%) |
| 20 to 24 Minutes | 23,805 (15.5%) | 20,462 (15.1%) |
| 25 to 29 Minutes | 11,430 (7.4%) | 10,174 (7.5%) |
| 30 to 34 Minutes | 26,621 (17.3%) | 22,408 (16.6%) |
| 35 to 39 Minutes | 5,838 (3.8%) | 5,035 (3.7%) |
| 40 to 44 Minutes | 7,896 (5.1%) | 6,329 (4.7%) |
| 45 to 59 Minutes | 15,811 (10.3%) | 12,389 (9.1%) |
| 60 to 89 Minutes | 10,134 (6.6%) | 7,074 (5.2%) |
| 90 or more Minutes | 4,292 (2.8%) | 1,868 (1.4%) |
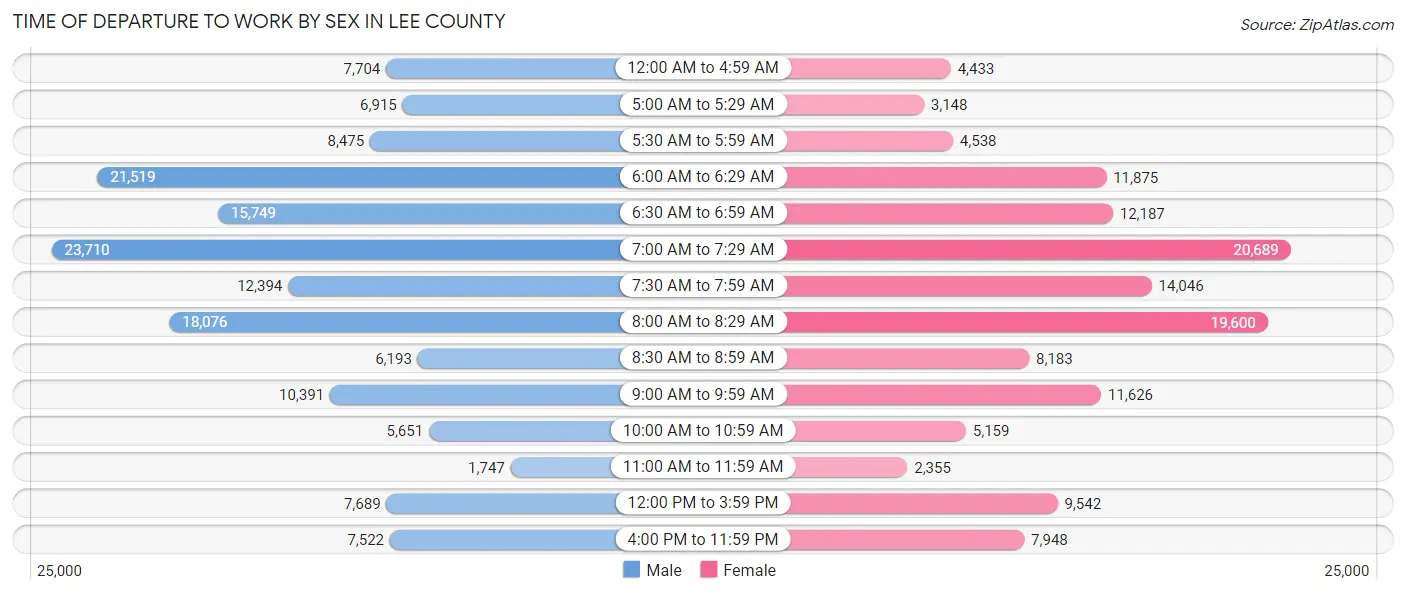
Time of Departure to Work by Sex in Lee County
The most frequent times of departure to work in Lee County are 7:00 AM to 7:29 AM (23,710, 15.4%) for males and 7:00 AM to 7:29 AM (20,689, 15.3%) for females.
| Time of Departure | Male | Female |
| 12:00 AM to 4:59 AM | 7,704 (5.0%) | 4,433 (3.3%) |
| 5:00 AM to 5:29 AM | 6,915 (4.5%) | 3,148 (2.3%) |
| 5:30 AM to 5:59 AM | 8,475 (5.5%) | 4,538 (3.4%) |
| 6:00 AM to 6:29 AM | 21,519 (14.0%) | 11,875 (8.8%) |
| 6:30 AM to 6:59 AM | 15,749 (10.2%) | 12,187 (9.0%) |
| 7:00 AM to 7:29 AM | 23,710 (15.4%) | 20,689 (15.3%) |
| 7:30 AM to 7:59 AM | 12,394 (8.1%) | 14,046 (10.4%) |
| 8:00 AM to 8:29 AM | 18,076 (11.8%) | 19,600 (14.5%) |
| 8:30 AM to 8:59 AM | 6,193 (4.0%) | 8,183 (6.0%) |
| 9:00 AM to 9:59 AM | 10,391 (6.8%) | 11,626 (8.6%) |
| 10:00 AM to 10:59 AM | 5,651 (3.7%) | 5,159 (3.8%) |
| 11:00 AM to 11:59 AM | 1,747 (1.1%) | 2,355 (1.7%) |
| 12:00 PM to 3:59 PM | 7,689 (5.0%) | 9,542 (7.0%) |
| 4:00 PM to 11:59 PM | 7,522 (4.9%) | 7,948 (5.9%) |
| Total | 153,735 (100.0%) | 135,329 (100.0%) |
Housing Occupancy in Lee County
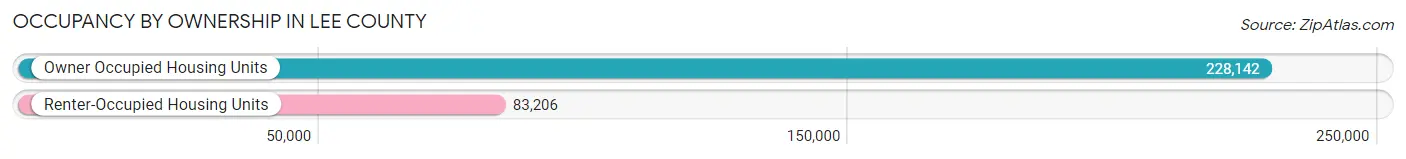
Occupancy by Ownership in Lee County
Of the total 311,348 dwellings in Lee County, owner-occupied units account for 228,142 (73.3%), while renter-occupied units make up 83,206 (26.7%).
| Occupancy | # Housing Units | % Housing Units |
| Owner Occupied Housing Units | 228,142 | 73.3% |
| Renter-Occupied Housing Units | 83,206 | 26.7% |
| Total Occupied Housing Units | 311,348 | 100.0% |
Occupancy by Household Size in Lee County
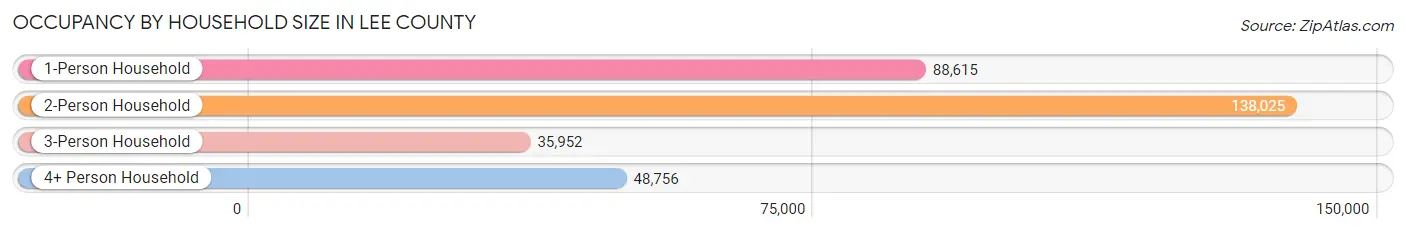
| Household Size | # Housing Units | % Housing Units |
| 1-Person Household | 88,615 | 28.5% |
| 2-Person Household | 138,025 | 44.3% |
| 3-Person Household | 35,952 | 11.6% |
| 4+ Person Household | 48,756 | 15.7% |
| Total Housing Units | 311,348 | 100.0% |
Occupancy by Ownership by Household Size in Lee County
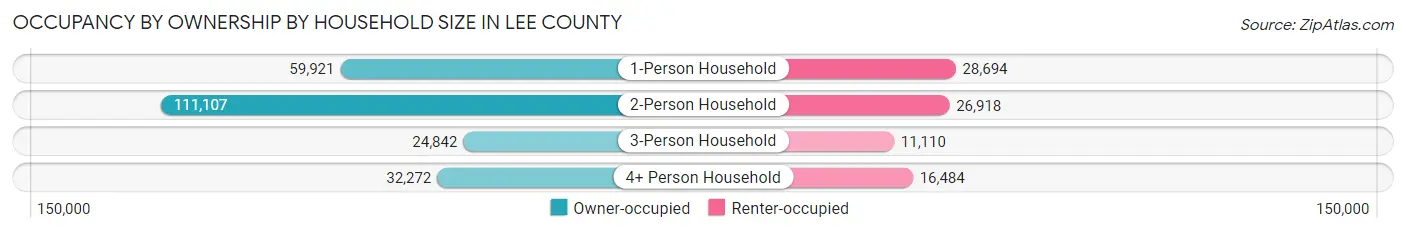
| Household Size | Owner-occupied | Renter-occupied |
| 1-Person Household | 59,921 (67.6%) | 28,694 (32.4%) |
| 2-Person Household | 111,107 (80.5%) | 26,918 (19.5%) |
| 3-Person Household | 24,842 (69.1%) | 11,110 (30.9%) |
| 4+ Person Household | 32,272 (66.2%) | 16,484 (33.8%) |
| Total Housing Units | 228,142 (73.3%) | 83,206 (26.7%) |
Occupancy by Educational Attainment in Lee County
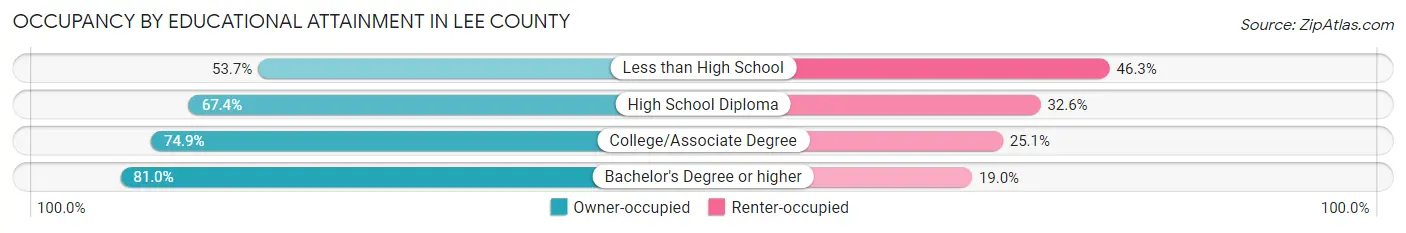
| Household Size | Owner-occupied | Renter-occupied |
| Less than High School | 13,446 (53.7%) | 11,586 (46.3%) |
| High School Diploma | 56,141 (67.4%) | 27,119 (32.6%) |
| College/Associate Degree | 72,723 (74.9%) | 24,375 (25.1%) |
| Bachelor's Degree or higher | 85,832 (81.0%) | 20,126 (19.0%) |
Occupancy by Age of Householder in Lee County
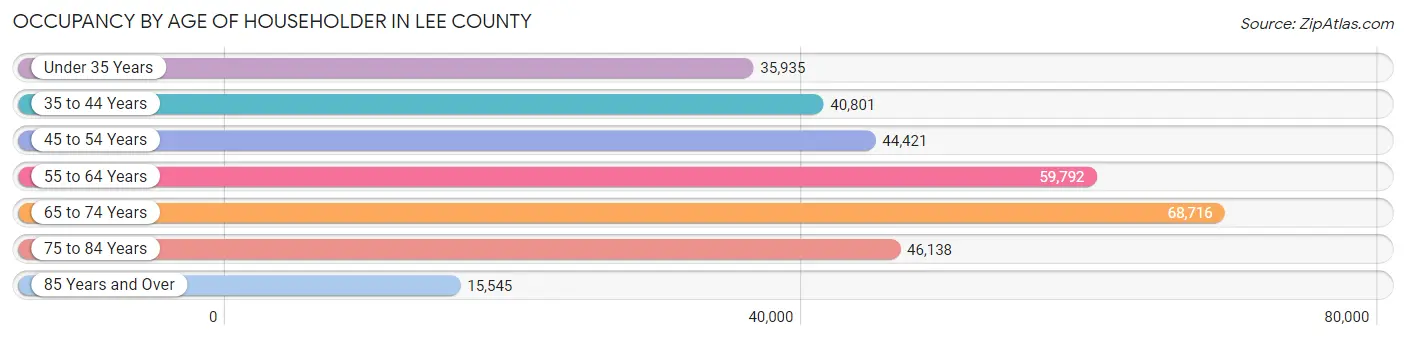
| Age Bracket | # Households | % Households |
| Under 35 Years | 35,935 | 11.5% |
| 35 to 44 Years | 40,801 | 13.1% |
| 45 to 54 Years | 44,421 | 14.3% |
| 55 to 64 Years | 59,792 | 19.2% |
| 65 to 74 Years | 68,716 | 22.1% |
| 75 to 84 Years | 46,138 | 14.8% |
| 85 Years and Over | 15,545 | 5.0% |
| Total | 311,348 | 100.0% |
Housing Finances in Lee County
Median Income by Occupancy in Lee County
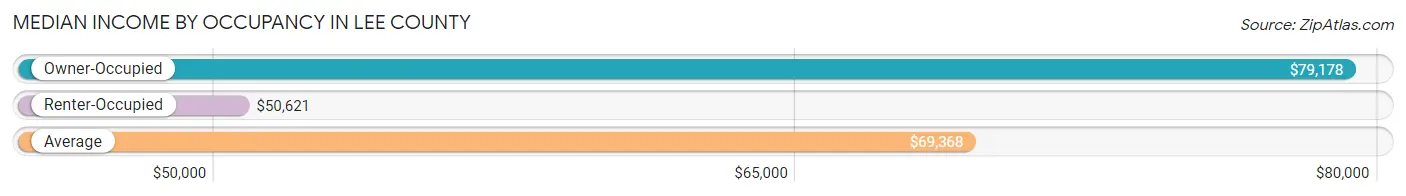
| Occupancy Type | # Households | Median Income |
| Owner-Occupied | 228,142 (73.3%) | $79,178 |
| Renter-Occupied | 83,206 (26.7%) | $50,621 |
| Average | 311,348 (100.0%) | $69,368 |
Occupancy by Householder Income Bracket in Lee County
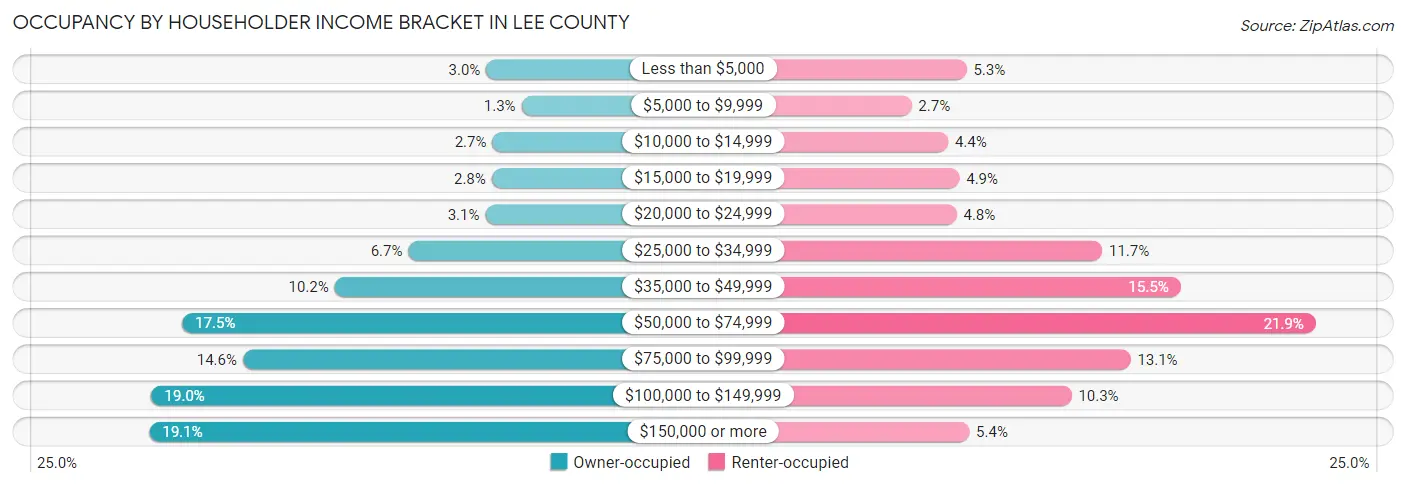
| Income Bracket | Owner-occupied | Renter-occupied |
| Less than $5,000 | 6,889 (3.0%) | 4,396 (5.3%) |
| $5,000 to $9,999 | 3,057 (1.3%) | 2,217 (2.7%) |
| $10,000 to $14,999 | 6,219 (2.7%) | 3,664 (4.4%) |
| $15,000 to $19,999 | 6,288 (2.8%) | 4,114 (4.9%) |
| $20,000 to $24,999 | 6,973 (3.1%) | 3,999 (4.8%) |
| $25,000 to $34,999 | 15,352 (6.7%) | 9,765 (11.7%) |
| $35,000 to $49,999 | 23,371 (10.2%) | 12,877 (15.5%) |
| $50,000 to $74,999 | 39,916 (17.5%) | 18,234 (21.9%) |
| $75,000 to $99,999 | 33,337 (14.6%) | 10,890 (13.1%) |
| $100,000 to $149,999 | 43,255 (19.0%) | 8,550 (10.3%) |
| $150,000 or more | 43,485 (19.1%) | 4,500 (5.4%) |
| Total | 228,142 (100.0%) | 83,206 (100.0%) |
Monthly Housing Cost Tiers in Lee County
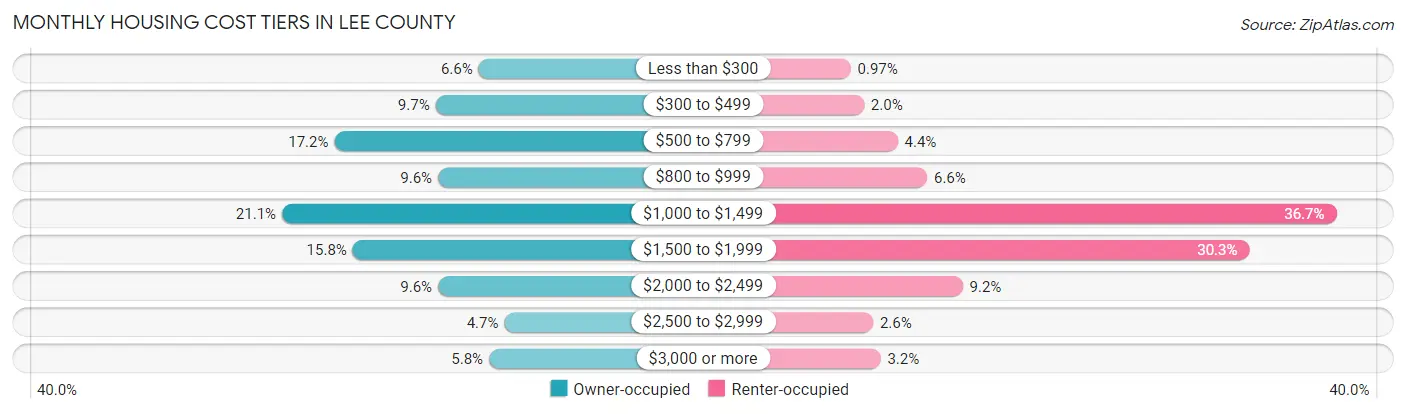
| Monthly Cost | Owner-occupied | Renter-occupied |
| Less than $300 | 14,998 (6.6%) | 805 (1.0%) |
| $300 to $499 | 22,227 (9.7%) | 1,622 (1.9%) |
| $500 to $799 | 39,229 (17.2%) | 3,685 (4.4%) |
| $800 to $999 | 21,813 (9.6%) | 5,494 (6.6%) |
| $1,000 to $1,499 | 48,034 (21.0%) | 30,574 (36.7%) |
| $1,500 to $1,999 | 36,130 (15.8%) | 25,238 (30.3%) |
| $2,000 to $2,499 | 21,820 (9.6%) | 7,671 (9.2%) |
| $2,500 to $2,999 | 10,652 (4.7%) | 2,183 (2.6%) |
| $3,000 or more | 13,239 (5.8%) | 2,639 (3.2%) |
| Total | 228,142 (100.0%) | 83,206 (100.0%) |
Physical Housing Characteristics in Lee County
Housing Structures in Lee County
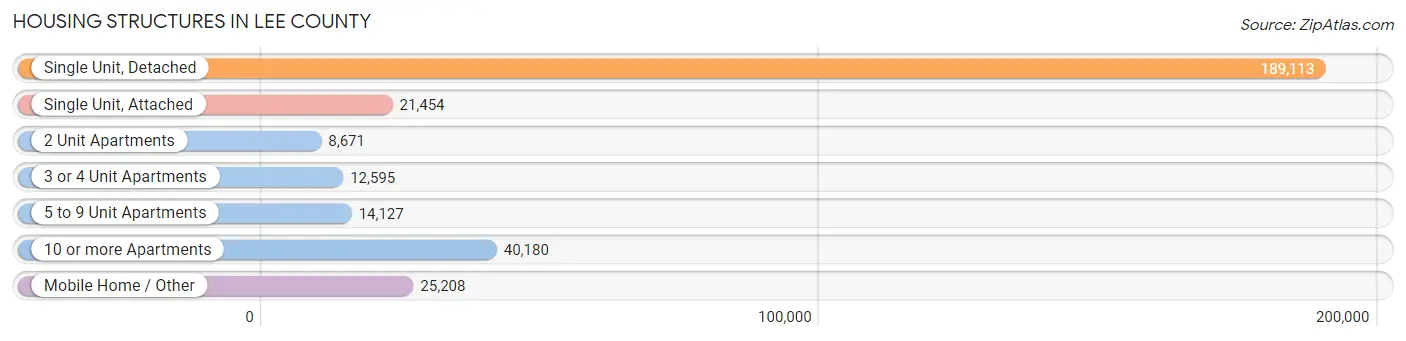
| Structure Type | # Housing Units | % Housing Units |
| Single Unit, Detached | 189,113 | 60.7% |
| Single Unit, Attached | 21,454 | 6.9% |
| 2 Unit Apartments | 8,671 | 2.8% |
| 3 or 4 Unit Apartments | 12,595 | 4.1% |
| 5 to 9 Unit Apartments | 14,127 | 4.5% |
| 10 or more Apartments | 40,180 | 12.9% |
| Mobile Home / Other | 25,208 | 8.1% |
| Total | 311,348 | 100.0% |
Housing Structures by Occupancy in Lee County
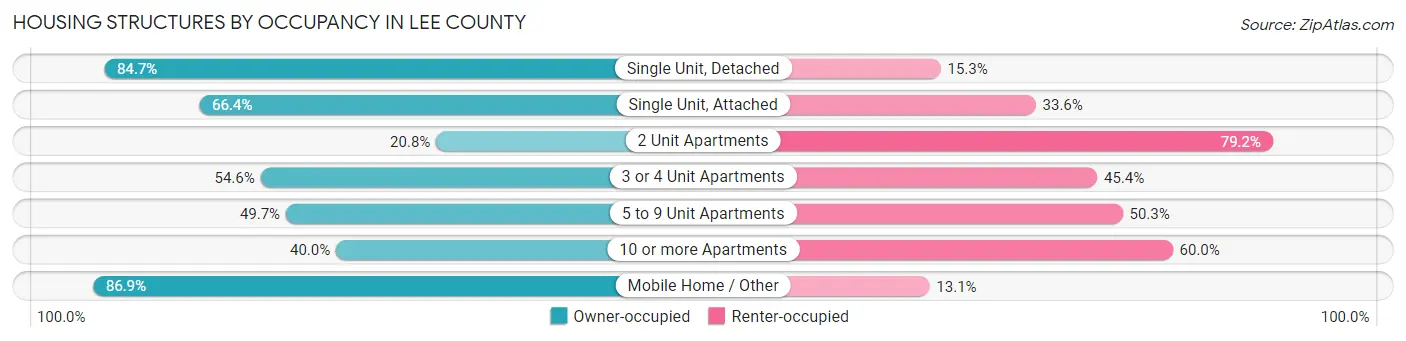
| Structure Type | Owner-occupied | Renter-occupied |
| Single Unit, Detached | 160,221 (84.7%) | 28,892 (15.3%) |
| Single Unit, Attached | 14,247 (66.4%) | 7,207 (33.6%) |
| 2 Unit Apartments | 1,800 (20.8%) | 6,871 (79.2%) |
| 3 or 4 Unit Apartments | 6,874 (54.6%) | 5,721 (45.4%) |
| 5 to 9 Unit Apartments | 7,018 (49.7%) | 7,109 (50.3%) |
| 10 or more Apartments | 16,087 (40.0%) | 24,093 (60.0%) |
| Mobile Home / Other | 21,895 (86.9%) | 3,313 (13.1%) |
| Total | 228,142 (73.3%) | 83,206 (26.7%) |
Housing Structures by Number of Rooms in Lee County
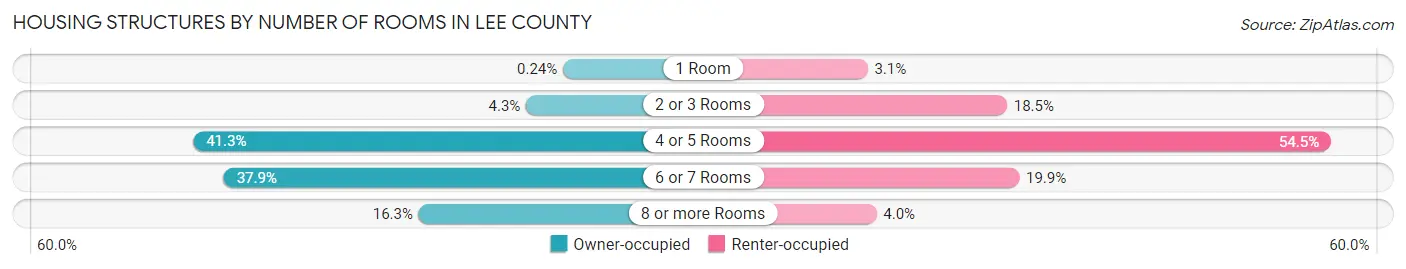
| Number of Rooms | Owner-occupied | Renter-occupied |
| 1 Room | 544 (0.2%) | 2,545 (3.1%) |
| 2 or 3 Rooms | 9,882 (4.3%) | 15,409 (18.5%) |
| 4 or 5 Rooms | 94,170 (41.3%) | 45,351 (54.5%) |
| 6 or 7 Rooms | 86,474 (37.9%) | 16,542 (19.9%) |
| 8 or more Rooms | 37,072 (16.3%) | 3,359 (4.0%) |
| Total | 228,142 (100.0%) | 83,206 (100.0%) |
Housing Structure by Heating Type in Lee County
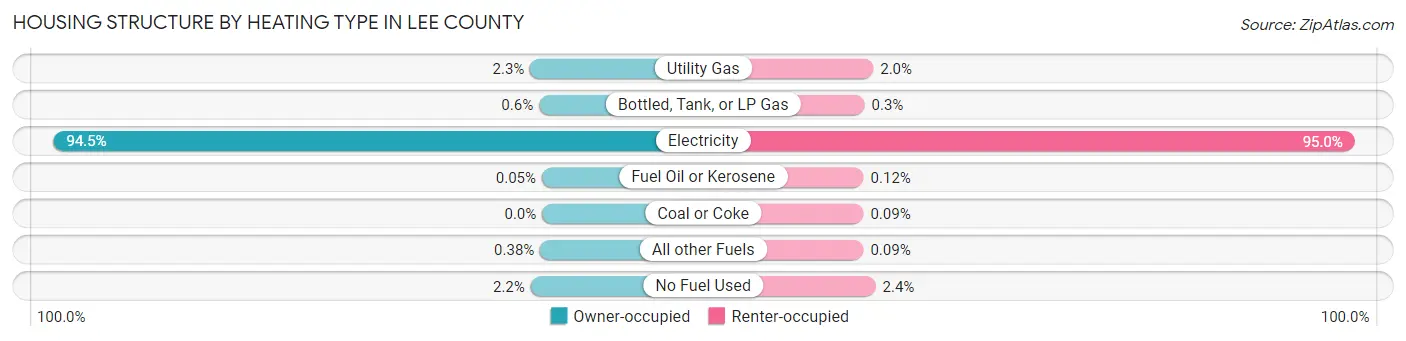
| Heating Type | Owner-occupied | Renter-occupied |
| Utility Gas | 5,249 (2.3%) | 1,644 (2.0%) |
| Bottled, Tank, or LP Gas | 1,369 (0.6%) | 250 (0.3%) |
| Electricity | 215,475 (94.5%) | 79,049 (95.0%) |
| Fuel Oil or Kerosene | 107 (0.1%) | 97 (0.1%) |
| Coal or Coke | 10 (0.0%) | 75 (0.1%) |
| All other Fuels | 865 (0.4%) | 73 (0.1%) |
| No Fuel Used | 5,067 (2.2%) | 2,018 (2.4%) |
| Total | 228,142 (100.0%) | 83,206 (100.0%) |
Household Vehicle Usage in Lee County
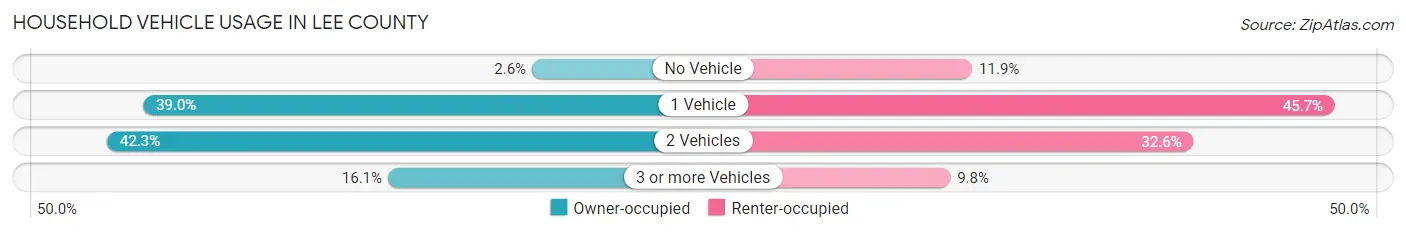
| Vehicles per Household | Owner-occupied | Renter-occupied |
| No Vehicle | 6,020 (2.6%) | 9,886 (11.9%) |
| 1 Vehicle | 88,866 (39.0%) | 38,058 (45.7%) |
| 2 Vehicles | 96,551 (42.3%) | 27,084 (32.6%) |
| 3 or more Vehicles | 36,705 (16.1%) | 8,178 (9.8%) |
| Total | 228,142 (100.0%) | 83,206 (100.0%) |
Real Estate & Mortgages in Lee County
Real Estate and Mortgage Overview in Lee County
| Characteristic | Without Mortgage | With Mortgage |
| Housing Units | 110,512 | 117,630 |
| Median Property Value | $271,200 | $304,900 |
| Median Household Income | $66,064 | $25,557 |
| Monthly Housing Costs | $657 | $12,127 |
| Real Estate Taxes | $2,434 | $2,573 |
Property Value by Mortgage Status in Lee County
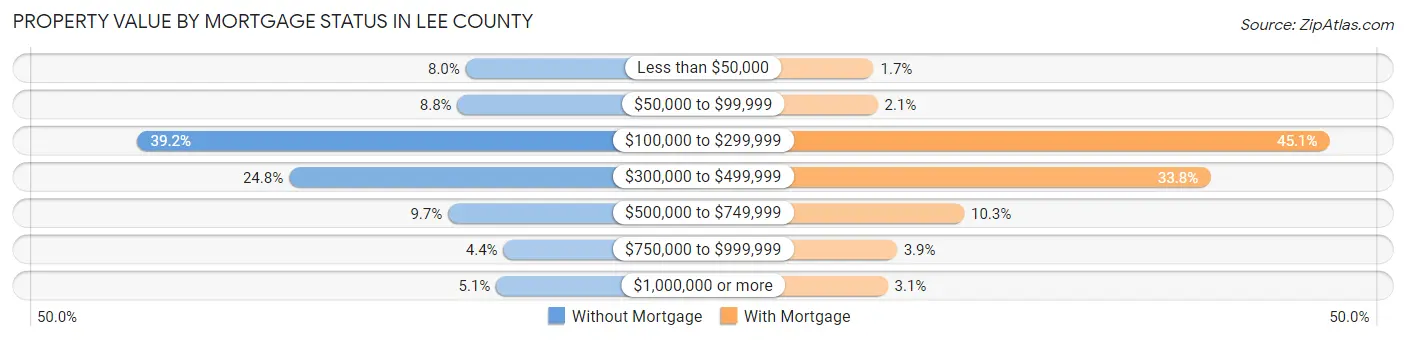
| Property Value | Without Mortgage | With Mortgage |
| Less than $50,000 | 8,838 (8.0%) | 2,026 (1.7%) |
| $50,000 to $99,999 | 9,701 (8.8%) | 2,467 (2.1%) |
| $100,000 to $299,999 | 43,352 (39.2%) | 53,078 (45.1%) |
| $300,000 to $499,999 | 27,434 (24.8%) | 39,707 (33.8%) |
| $500,000 to $749,999 | 10,692 (9.7%) | 12,149 (10.3%) |
| $750,000 to $999,999 | 4,865 (4.4%) | 4,613 (3.9%) |
| $1,000,000 or more | 5,630 (5.1%) | 3,590 (3.0%) |
| Total | 110,512 (100.0%) | 117,630 (100.0%) |
Household Income by Mortgage Status in Lee County
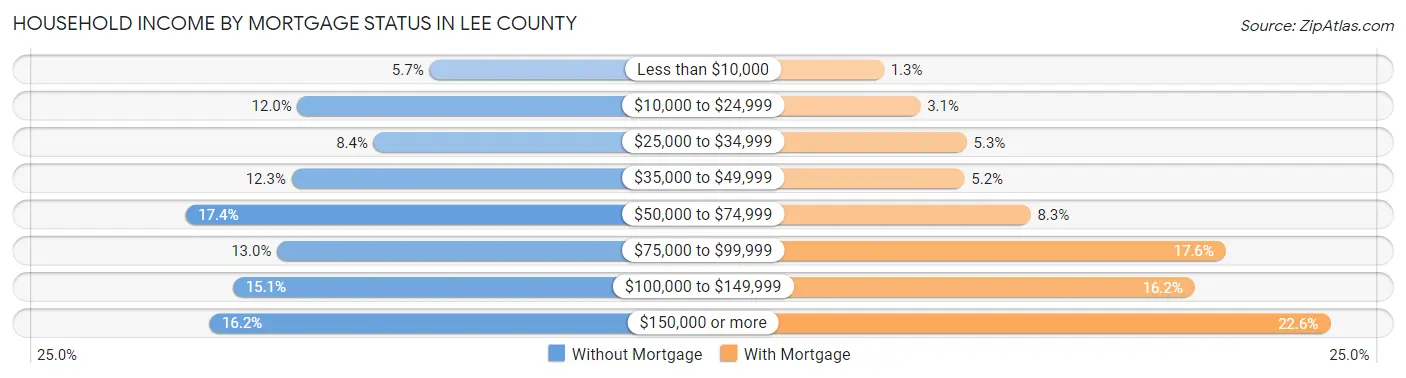
| Household Income | Without Mortgage | With Mortgage |
| Less than $10,000 | 6,319 (5.7%) | 1,577 (1.3%) |
| $10,000 to $24,999 | 13,262 (12.0%) | 3,627 (3.1%) |
| $25,000 to $34,999 | 9,255 (8.4%) | 6,218 (5.3%) |
| $35,000 to $49,999 | 13,567 (12.3%) | 6,097 (5.2%) |
| $50,000 to $74,999 | 19,172 (17.3%) | 9,804 (8.3%) |
| $75,000 to $99,999 | 14,336 (13.0%) | 20,744 (17.6%) |
| $100,000 to $149,999 | 16,673 (15.1%) | 19,001 (16.2%) |
| $150,000 or more | 17,928 (16.2%) | 26,582 (22.6%) |
| Total | 110,512 (100.0%) | 117,630 (100.0%) |
Property Value to Household Income Ratio in Lee County
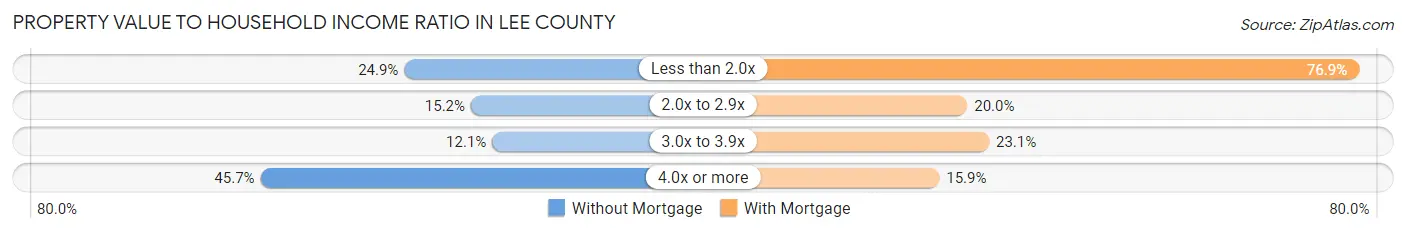
| Value-to-Income Ratio | Without Mortgage | With Mortgage |
| Less than 2.0x | 27,460 (24.8%) | 90,426 (76.9%) |
| 2.0x to 2.9x | 16,753 (15.2%) | 23,479 (20.0%) |
| 3.0x to 3.9x | 13,335 (12.1%) | 27,200 (23.1%) |
| 4.0x or more | 50,549 (45.7%) | 18,687 (15.9%) |
| Total | 110,512 (100.0%) | 117,630 (100.0%) |
Real Estate Taxes by Mortgage Status in Lee County
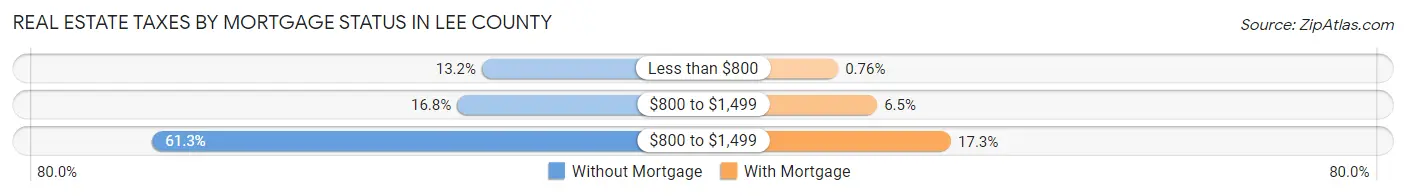
| Property Taxes | Without Mortgage | With Mortgage |
| Less than $800 | 14,589 (13.2%) | 899 (0.8%) |
| $800 to $1,499 | 18,572 (16.8%) | 7,584 (6.5%) |
| $800 to $1,499 | 67,768 (61.3%) | 20,286 (17.2%) |
| Total | 110,512 (100.0%) | 117,630 (100.0%) |
Health & Disability in Lee County
Health Insurance Coverage by Age in Lee County
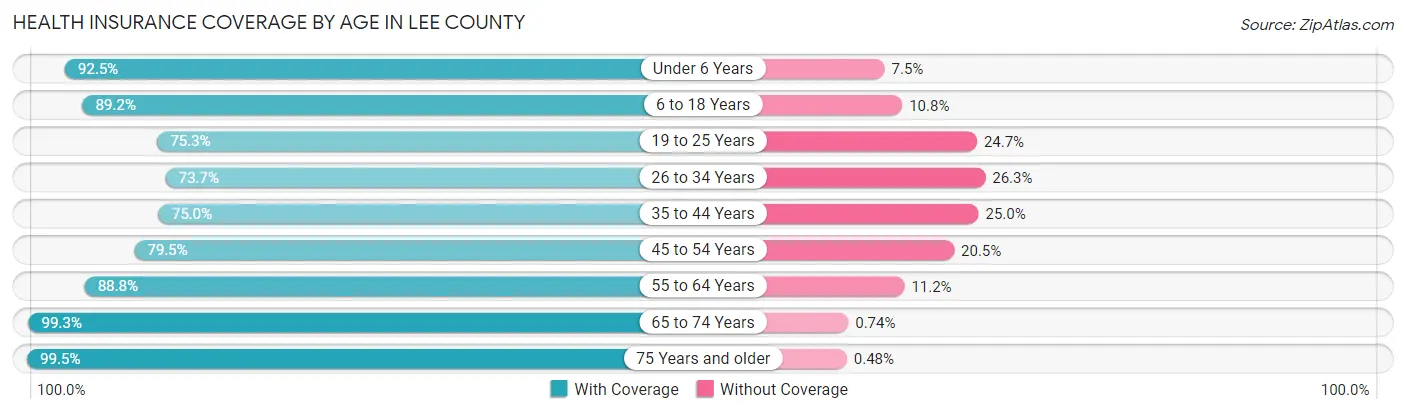
| Age Bracket | With Coverage | Without Coverage |
| Under 6 Years | 37,894 (92.5%) | 3,081 (7.5%) |
| 6 to 18 Years | 89,934 (89.2%) | 10,884 (10.8%) |
| 19 to 25 Years | 41,164 (75.3%) | 13,530 (24.7%) |
| 26 to 34 Years | 55,042 (73.7%) | 19,633 (26.3%) |
| 35 to 44 Years | 60,109 (75.0%) | 20,069 (25.0%) |
| 45 to 54 Years | 69,456 (79.5%) | 17,888 (20.5%) |
| 55 to 64 Years | 96,455 (88.8%) | 12,191 (11.2%) |
| 65 to 74 Years | 117,458 (99.3%) | 878 (0.7%) |
| 75 Years and older | 101,574 (99.5%) | 488 (0.5%) |
| Total | 669,086 (87.2%) | 98,642 (12.9%) |
Health Insurance Coverage by Citizenship Status in Lee County
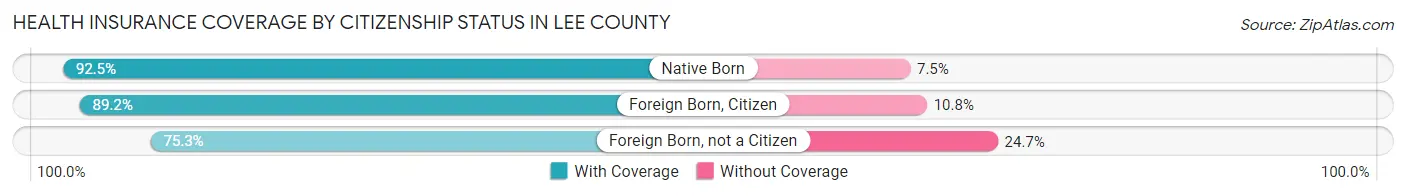
| Citizenship Status | With Coverage | Without Coverage |
| Native Born | 37,894 (92.5%) | 3,081 (7.5%) |
| Foreign Born, Citizen | 89,934 (89.2%) | 10,884 (10.8%) |
| Foreign Born, not a Citizen | 41,164 (75.3%) | 13,530 (24.7%) |
Health Insurance Coverage by Household Income in Lee County
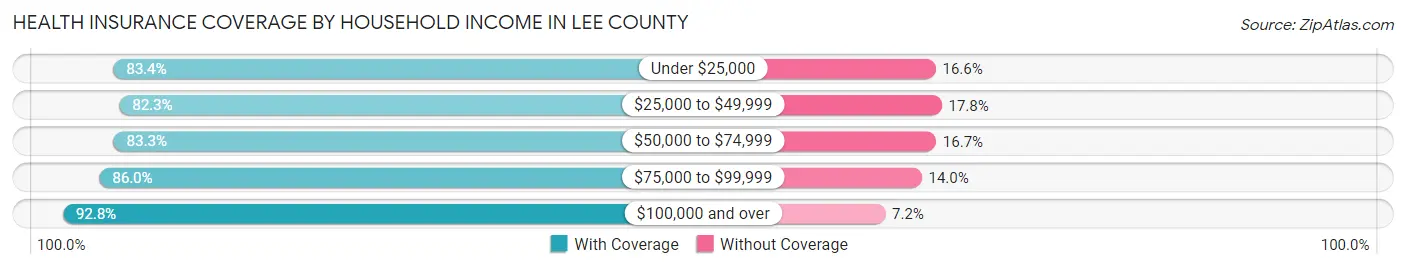
| Household Income | With Coverage | Without Coverage |
| Under $25,000 | 67,497 (83.4%) | 13,467 (16.6%) |
| $25,000 to $49,999 | 106,378 (82.3%) | 22,961 (17.7%) |
| $50,000 to $74,999 | 119,369 (83.3%) | 23,919 (16.7%) |
| $75,000 to $99,999 | 106,203 (86.0%) | 17,297 (14.0%) |
| $100,000 and over | 263,334 (92.8%) | 20,359 (7.2%) |
Public vs Private Health Insurance Coverage by Age in Lee County
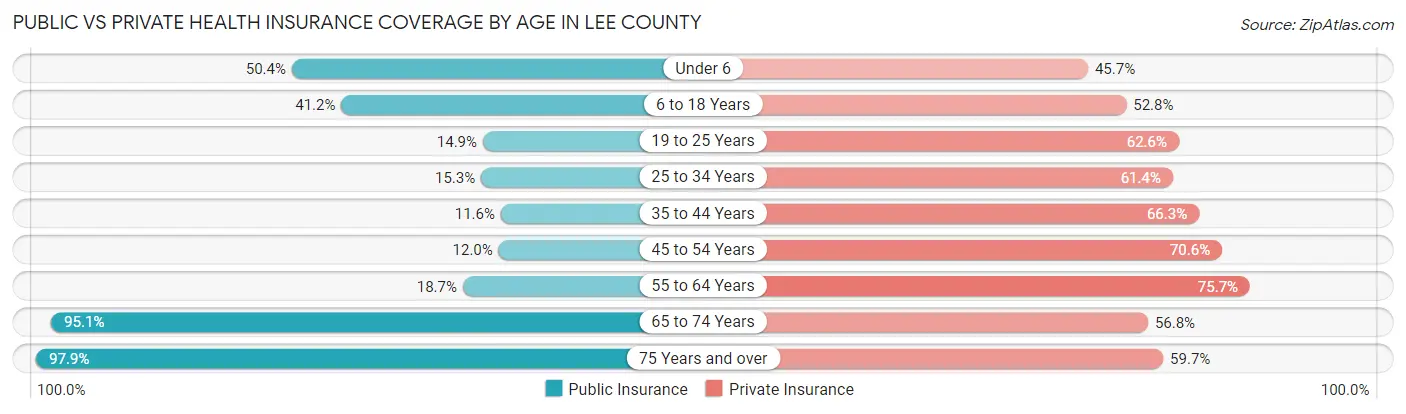
| Age Bracket | Public Insurance | Private Insurance |
| Under 6 | 20,652 (50.4%) | 18,725 (45.7%) |
| 6 to 18 Years | 41,554 (41.2%) | 53,243 (52.8%) |
| 19 to 25 Years | 8,169 (14.9%) | 34,213 (62.5%) |
| 25 to 34 Years | 11,404 (15.3%) | 45,866 (61.4%) |
| 35 to 44 Years | 9,307 (11.6%) | 53,148 (66.3%) |
| 45 to 54 Years | 10,501 (12.0%) | 61,627 (70.6%) |
| 55 to 64 Years | 20,274 (18.7%) | 82,284 (75.7%) |
| 65 to 74 Years | 112,487 (95.1%) | 67,251 (56.8%) |
| 75 Years and over | 99,893 (97.9%) | 60,878 (59.7%) |
| Total | 334,241 (43.5%) | 477,235 (62.2%) |
Disability Status by Sex by Age in Lee County
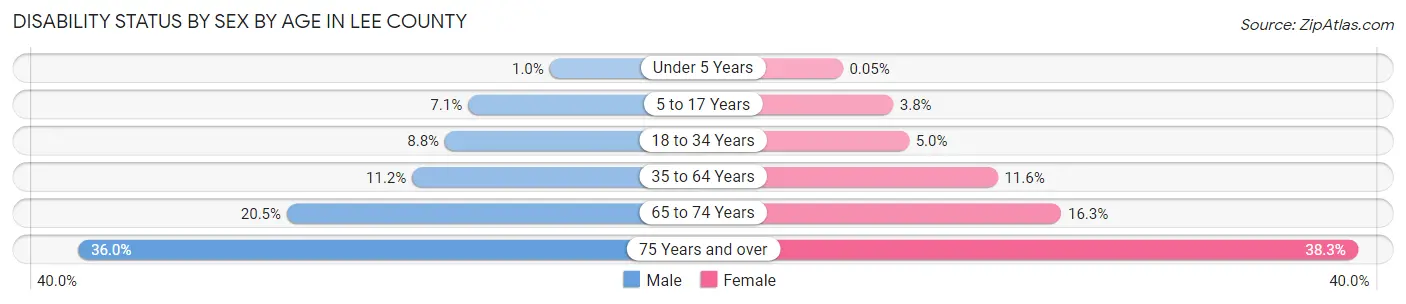
| Age Bracket | Male | Female |
| Under 5 Years | 180 (1.0%) | 8 (0.1%) |
| 5 to 17 Years | 3,585 (7.1%) | 1,810 (3.8%) |
| 18 to 34 Years | 6,110 (8.8%) | 3,421 (5.0%) |
| 35 to 64 Years | 15,158 (11.2%) | 16,321 (11.6%) |
| 65 to 74 Years | 11,509 (20.5%) | 10,137 (16.3%) |
| 75 Years and over | 17,581 (36.0%) | 20,395 (38.3%) |
Disability Class by Sex by Age in Lee County
Disability Class: Hearing Difficulty
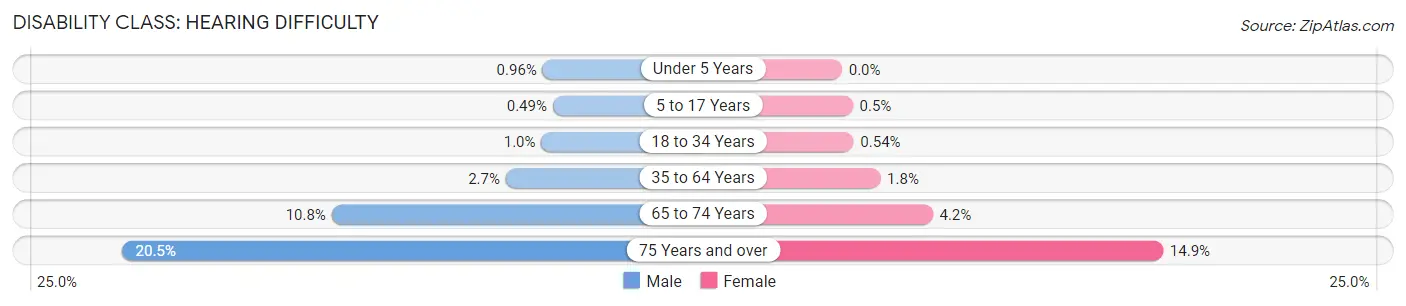
| Age Bracket | Male | Female |
| Under 5 Years | 169 (1.0%) | 0 (0.0%) |
| 5 to 17 Years | 246 (0.5%) | 238 (0.5%) |
| 18 to 34 Years | 708 (1.0%) | 373 (0.5%) |
| 35 to 64 Years | 3,607 (2.7%) | 2,518 (1.8%) |
| 65 to 74 Years | 6,030 (10.7%) | 2,624 (4.2%) |
| 75 Years and over | 9,980 (20.4%) | 7,939 (14.9%) |
Disability Class: Vision Difficulty
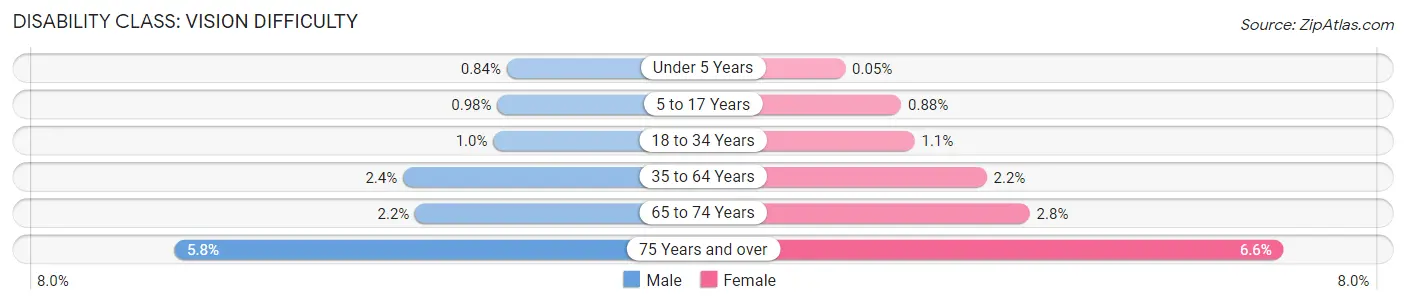
| Age Bracket | Male | Female |
| Under 5 Years | 148 (0.8%) | 8 (0.1%) |
| 5 to 17 Years | 494 (1.0%) | 422 (0.9%) |
| 18 to 34 Years | 721 (1.0%) | 747 (1.1%) |
| 35 to 64 Years | 3,207 (2.4%) | 3,030 (2.1%) |
| 65 to 74 Years | 1,235 (2.2%) | 1,739 (2.8%) |
| 75 Years and over | 2,820 (5.8%) | 3,494 (6.6%) |
Disability Class: Cognitive Difficulty
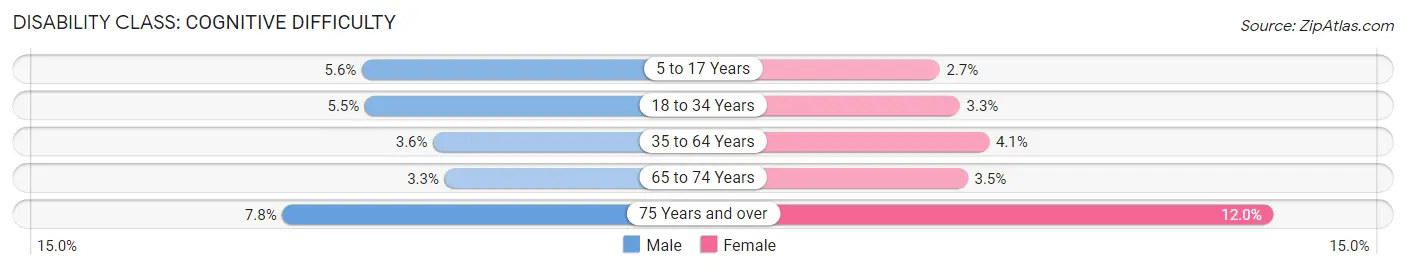
| Age Bracket | Male | Female |
| 5 to 17 Years | 2,835 (5.6%) | 1,300 (2.7%) |
| 18 to 34 Years | 3,836 (5.5%) | 2,257 (3.3%) |
| 35 to 64 Years | 4,881 (3.6%) | 5,792 (4.1%) |
| 65 to 74 Years | 1,848 (3.3%) | 2,180 (3.5%) |
| 75 Years and over | 3,814 (7.8%) | 6,401 (12.0%) |
Disability Class: Ambulatory Difficulty
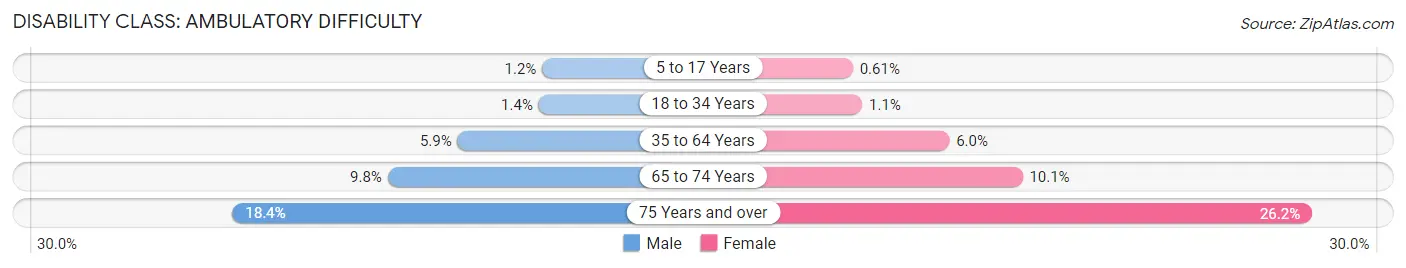
| Age Bracket | Male | Female |
| 5 to 17 Years | 597 (1.2%) | 292 (0.6%) |
| 18 to 34 Years | 952 (1.4%) | 778 (1.1%) |
| 35 to 64 Years | 7,946 (5.9%) | 8,441 (6.0%) |
| 65 to 74 Years | 5,485 (9.8%) | 6,265 (10.1%) |
| 75 Years and over | 8,994 (18.4%) | 13,945 (26.2%) |
Disability Class: Self-Care Difficulty
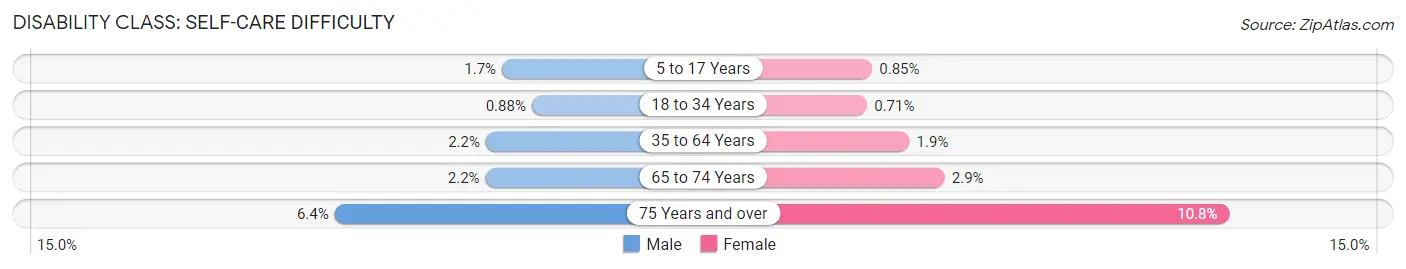
| Age Bracket | Male | Female |
| 5 to 17 Years | 867 (1.7%) | 406 (0.9%) |
| 18 to 34 Years | 611 (0.9%) | 489 (0.7%) |
| 35 to 64 Years | 2,909 (2.2%) | 2,673 (1.9%) |
| 65 to 74 Years | 1,214 (2.2%) | 1,786 (2.9%) |
| 75 Years and over | 3,107 (6.4%) | 5,745 (10.8%) |
Technology Access in Lee County
Computing Device Access in Lee County
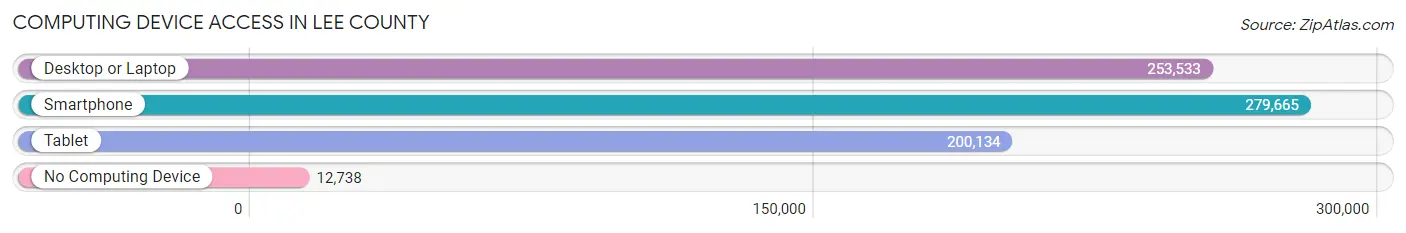
| Device Type | # Households | % Households |
| Desktop or Laptop | 253,533 | 81.4% |
| Smartphone | 279,665 | 89.8% |
| Tablet | 200,134 | 64.3% |
| No Computing Device | 12,738 | 4.1% |
| Total | 311,348 | 100.0% |
Internet Access in Lee County
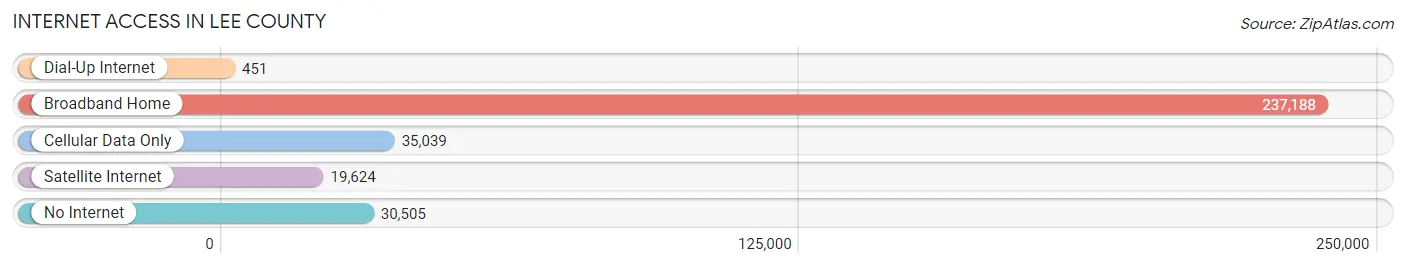
| Internet Type | # Households | % Households |
| Dial-Up Internet | 451 | 0.1% |
| Broadband Home | 237,188 | 76.2% |
| Cellular Data Only | 35,039 | 11.3% |
| Satellite Internet | 19,624 | 6.3% |
| No Internet | 30,505 | 9.8% |
| Total | 311,348 | 100.0% |
Lee County Summary
Lee County, Florida is located in the southwestern part of the state and is bordered by Charlotte, Collier, Hendry, and Glades counties. It is the second most populous county in the state, with a population of 618,754 as of the 2019 census. The county seat is Fort Myers, and the largest city is Cape Coral.
History
Lee County was created in 1887 from parts of Monroe and Hillsborough counties. It was named for Robert E. Lee, the Confederate general. The county was originally part of Monroe County, but was split off in 1887. The county was sparsely populated until the 1950s, when the population began to grow rapidly due to the development of the area.
Geography
Lee County covers an area of 1,214 square miles, making it the largest county in the state. The county is located on the Gulf of Mexico and is home to many beaches, including Sanibel Island, Captiva Island, and Fort Myers Beach. The county is also home to the Caloosahatchee River, which flows through the county and empties into the Gulf of Mexico. The county is mostly flat, with some rolling hills in the northern part of the county.
Economy
Lee County has a diverse economy, with a mix of agriculture, tourism, manufacturing, and services. Agriculture is the largest industry in the county, with citrus, vegetables, and cattle being the main crops. Tourism is also a major industry, with the county being home to many beaches and resorts. Manufacturing is also a major industry, with many companies located in the county. The service industry is also a major part of the economy, with many businesses providing services to the county's residents.
Demographics
As of the 2019 census, Lee County had a population of 618,754. The population is made up of a diverse mix of people, with the largest ethnic group being White (63.3%), followed by Hispanic or Latino (20.2%), African American (10.7%), and Asian (3.7%). The median household income in the county is $50,945, and the median age is 42.7.
Lee County is a diverse and vibrant county with a strong economy and a growing population. It is home to many beaches and resorts, as well as a variety of industries. The county is also home to a diverse population, with a mix of ethnicities and backgrounds. Lee County is an ideal place to live, work, and play.
Common Questions
What is Per Capita Income in Lee County?
Per Capita income in Lee County is $41,332.
What is the Median Family Income in Lee County?
Median Family Income in Lee County is $81,979.
What is the Median Household income in Lee County?
Median Household Income in Lee County is $69,368.
What is Income or Wage Gap in Lee County?
Income or Wage Gap in Lee County is 23.8%.
Women in Lee County earn 76.2 cents for every dollar earned by a man.
What is Family Income Deficit in Lee County?
Family Income Deficit in Lee County is $10,511.
Families that are below poverty line in Lee County earn $10,511 less on average than the poverty threshold level.
What is Inequality or Gini Index in Lee County?
Inequality or Gini Index in Lee County is 0.48.
What is the Total Population of Lee County?
Total Population of Lee County is 772,902.
What is the Total Male Population of Lee County?
Total Male Population of Lee County is 380,685.
What is the Total Female Population of Lee County?
Total Female Population of Lee County is 392,217.
What is the Ratio of Males per 100 Females in Lee County?
There are 97.06 Males per 100 Females in Lee County.
What is the Ratio of Females per 100 Males in Lee County?
There are 103.03 Females per 100 Males in Lee County.
What is the Median Population Age in Lee County?
Median Population Age in Lee County is 49.1 Years.
What is the Average Family Size in Lee County
Average Family Size in Lee County is 3.0 People.
What is the Average Household Size in Lee County
Average Household Size in Lee County is 2.4 People.
How Large is the Labor Force in Lee County?
There are 348,456 People in the Labor Forcein in Lee County.
What is the Percentage of People in the Labor Force in Lee County?
53.1% of People are in the Labor Force in Lee County.
What is the Unemployment Rate in Lee County?
Unemployment Rate in Lee County is 4.5%.