Santa Rosa County, FL Map & Demographics
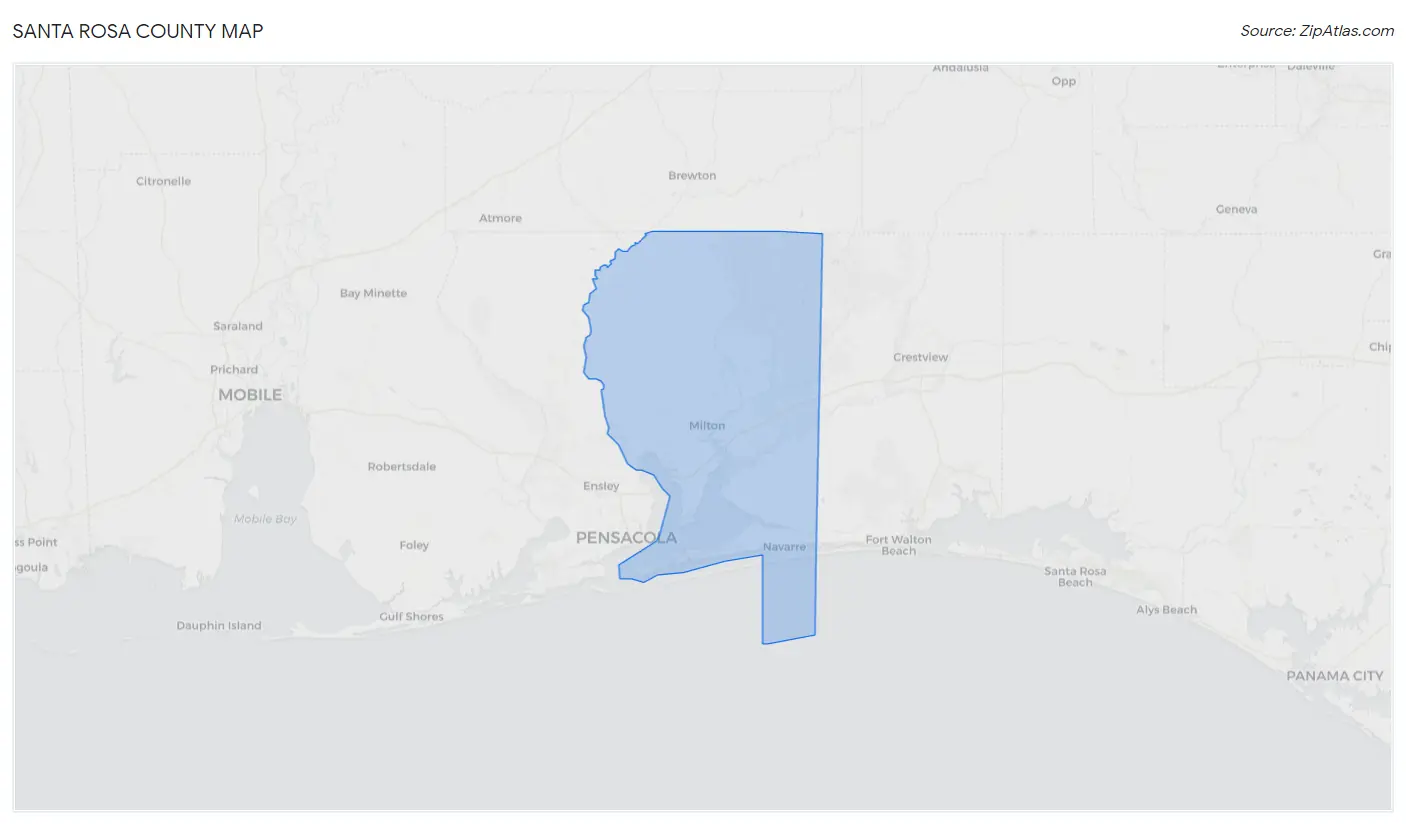
Santa Rosa County Map
Santa Rosa County Overview
$39,143
PER CAPITA INCOME
$98,722
AVG FAMILY INCOME
$84,715
AVG HOUSEHOLD INCOME
34.7%
WAGE / INCOME GAP [ % ]
65.3¢/ $1
WAGE / INCOME GAP [ $ ]
$11,809
FAMILY INCOME DEFICIT
0.42
INEQUALITY / GINI INDEX
188,994
TOTAL POPULATION
97,011
MALE POPULATION
91,983
FEMALE POPULATION
105.47
MALES / 100 FEMALES
94.82
FEMALES / 100 MALES
40.0
MEDIAN AGE
3.1
AVG FAMILY SIZE
2.6
AVG HOUSEHOLD SIZE
90,262
LABOR FORCE [ PEOPLE ]
59.1%
PERCENT IN LABOR FORCE
4.7%
UNEMPLOYMENT RATE
Santa Rosa County Area Codes
Income in Santa Rosa County
Income Overview in Santa Rosa County
Per Capita Income in Santa Rosa County is $39,143, while median incomes of families and households are $98,722 and $84,715 respectively.
| Characteristic | Number | Measure |
| Per Capita Income | 188,994 | $39,143 |
| Median Family Income | 50,623 | $98,722 |
| Mean Family Income | 50,623 | $116,929 |
| Median Household Income | 69,524 | $84,715 |
| Mean Household Income | 69,524 | $104,371 |
| Income Deficit | 50,623 | $11,809 |
| Wage / Income Gap (%) | 188,994 | 34.68% |
| Wage / Income Gap ($) | 188,994 | 65.32¢ per $1 |
| Gini / Inequality Index | 188,994 | 0.42 |
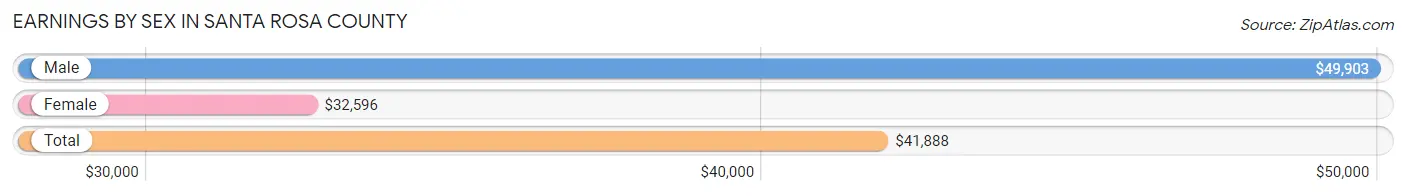
Earnings by Sex in Santa Rosa County
Average Earnings in Santa Rosa County are $41,888, $49,903 for men and $32,596 for women, a difference of 34.7%.
| Sex | Number | Average Earnings |
| Male | 53,233 (55.5%) | $49,903 |
| Female | 42,728 (44.5%) | $32,596 |
| Total | 95,961 (100.0%) | $41,888 |
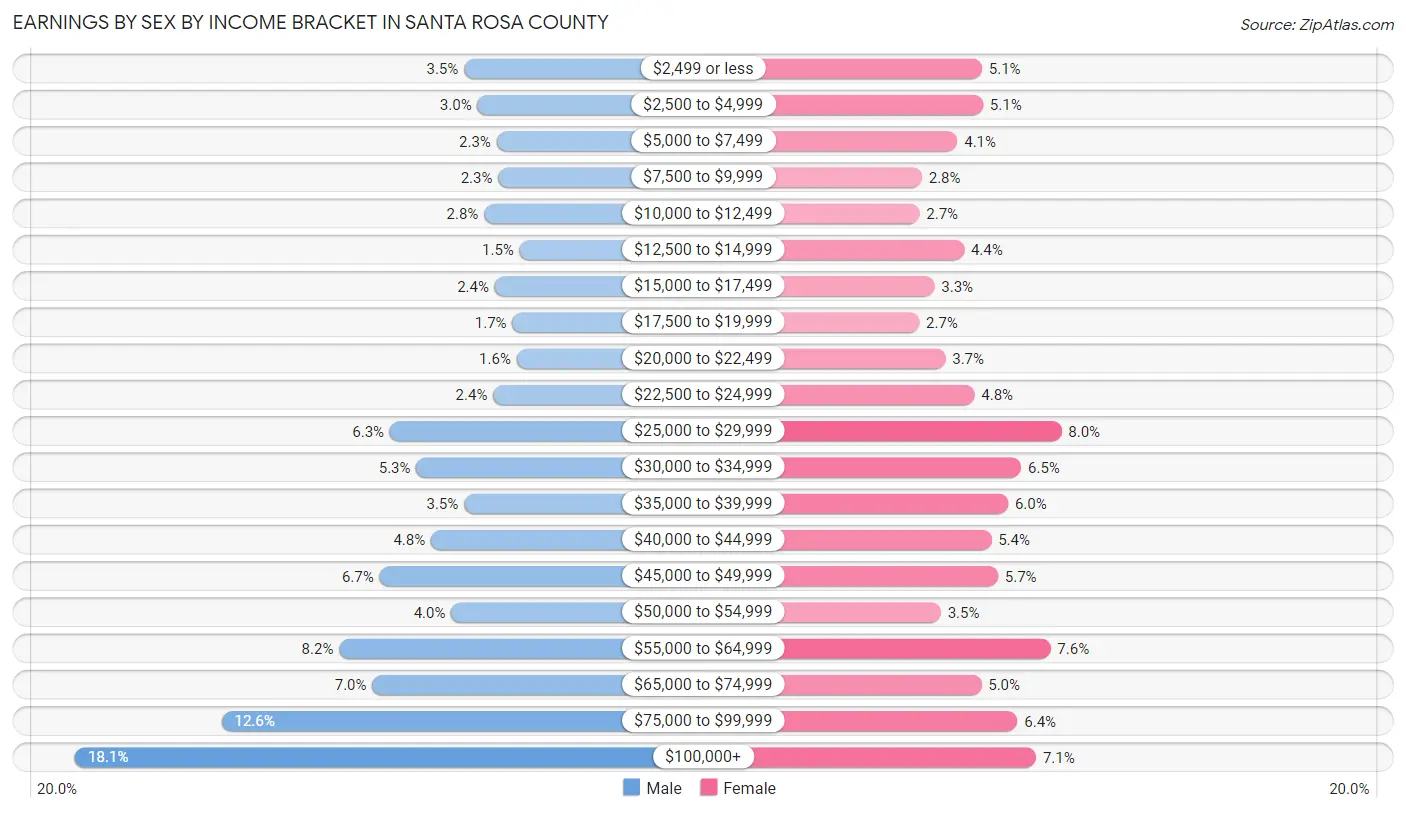
Earnings by Sex by Income Bracket in Santa Rosa County
The most common earnings brackets in Santa Rosa County are $100,000+ for men (9,643 | 18.1%) and $25,000 to $29,999 for women (3,435 | 8.0%).
| Income | Male | Female |
| $2,499 or less | 1,881 (3.5%) | 2,160 (5.1%) |
| $2,500 to $4,999 | 1,613 (3.0%) | 2,177 (5.1%) |
| $5,000 to $7,499 | 1,232 (2.3%) | 1,767 (4.1%) |
| $7,500 to $9,999 | 1,199 (2.2%) | 1,202 (2.8%) |
| $10,000 to $12,499 | 1,478 (2.8%) | 1,161 (2.7%) |
| $12,500 to $14,999 | 771 (1.5%) | 1,876 (4.4%) |
| $15,000 to $17,499 | 1,265 (2.4%) | 1,401 (3.3%) |
| $17,500 to $19,999 | 914 (1.7%) | 1,158 (2.7%) |
| $20,000 to $22,499 | 833 (1.6%) | 1,575 (3.7%) |
| $22,500 to $24,999 | 1,298 (2.4%) | 2,042 (4.8%) |
| $25,000 to $29,999 | 3,361 (6.3%) | 3,435 (8.0%) |
| $30,000 to $34,999 | 2,831 (5.3%) | 2,790 (6.5%) |
| $35,000 to $39,999 | 1,879 (3.5%) | 2,579 (6.0%) |
| $40,000 to $44,999 | 2,537 (4.8%) | 2,310 (5.4%) |
| $45,000 to $49,999 | 3,567 (6.7%) | 2,418 (5.7%) |
| $50,000 to $54,999 | 2,135 (4.0%) | 1,505 (3.5%) |
| $55,000 to $64,999 | 4,371 (8.2%) | 3,259 (7.6%) |
| $65,000 to $74,999 | 3,709 (7.0%) | 2,152 (5.0%) |
| $75,000 to $99,999 | 6,716 (12.6%) | 2,732 (6.4%) |
| $100,000+ | 9,643 (18.1%) | 3,029 (7.1%) |
| Total | 53,233 (100.0%) | 42,728 (100.0%) |
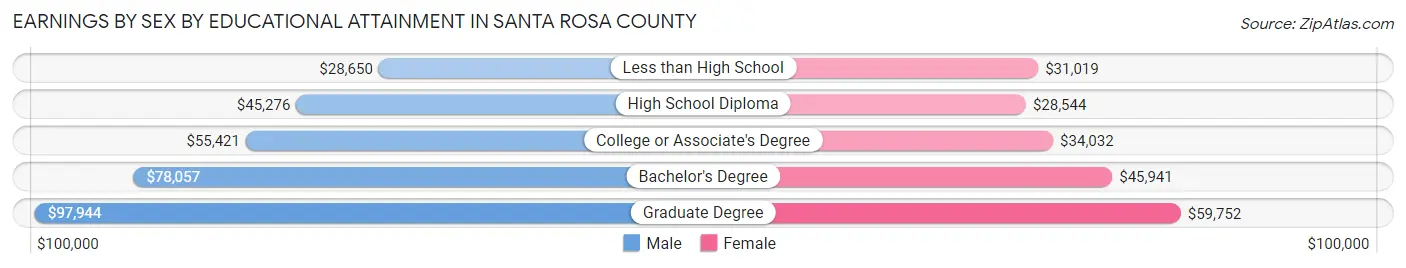
Earnings by Sex by Educational Attainment in Santa Rosa County
Average earnings in Santa Rosa County are $57,573 for men and $37,100 for women, a difference of 35.6%. Men with an educational attainment of graduate degree enjoy the highest average annual earnings of $97,944, while those with less than high school education earn the least with $28,650. Women with an educational attainment of graduate degree earn the most with the average annual earnings of $59,752, while those with high school diploma education have the smallest earnings of $28,544.
| Educational Attainment | Male Income | Female Income |
| Less than High School | $28,650 | $31,019 |
| High School Diploma | $45,276 | $28,544 |
| College or Associate's Degree | $55,421 | $34,032 |
| Bachelor's Degree | $78,057 | $45,941 |
| Graduate Degree | $97,944 | $59,752 |
| Total | $57,573 | $37,100 |
Family Income in Santa Rosa County
Family Income Brackets in Santa Rosa County
According to the Santa Rosa County family income data, there are 13,010 families falling into the $100,000 to $149,999 income range, which is the most common income bracket and makes up 25.7% of all families. Conversely, the $10,000 to $14,999 income bracket is the least frequent group with only 709 families (1.4%) belonging to this category.
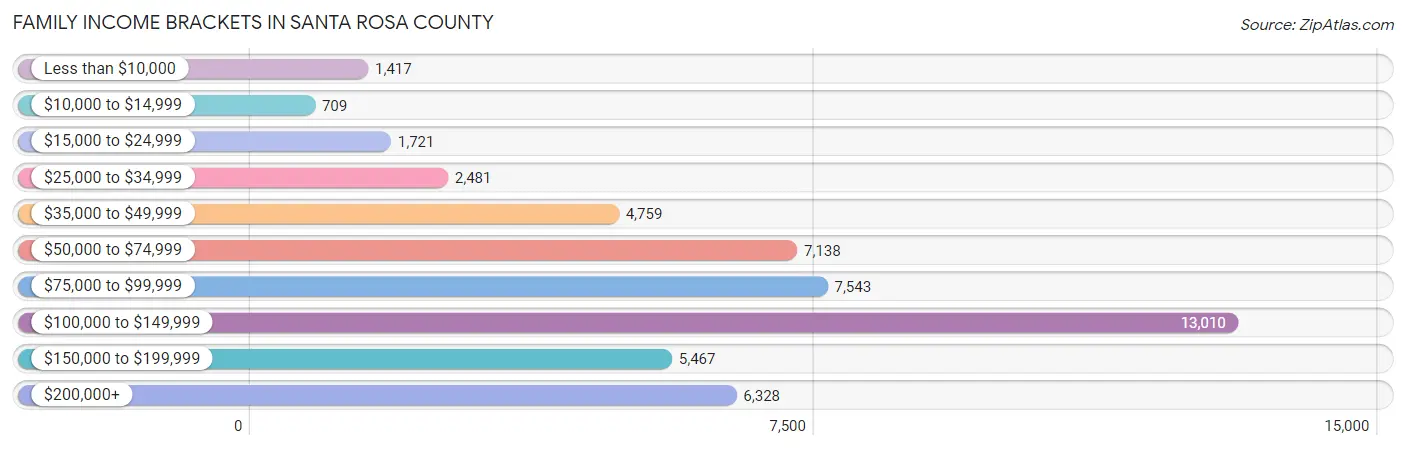
| Income Bracket | # Families | % Families |
| Less than $10,000 | 1,417 | 2.8% |
| $10,000 to $14,999 | 709 | 1.4% |
| $15,000 to $24,999 | 1,721 | 3.4% |
| $25,000 to $34,999 | 2,481 | 4.9% |
| $35,000 to $49,999 | 4,759 | 9.4% |
| $50,000 to $74,999 | 7,138 | 14.1% |
| $75,000 to $99,999 | 7,543 | 14.9% |
| $100,000 to $149,999 | 13,010 | 25.7% |
| $150,000 to $199,999 | 5,467 | 10.8% |
| $200,000+ | 6,328 | 12.5% |
Family Income by Famaliy Size in Santa Rosa County
6-person families (1,583 | 3.1%) account for the highest median family income in Santa Rosa County with $125,313 per family, while 2-person families (23,427 | 46.3%) have the highest median income of $42,296 per family member.
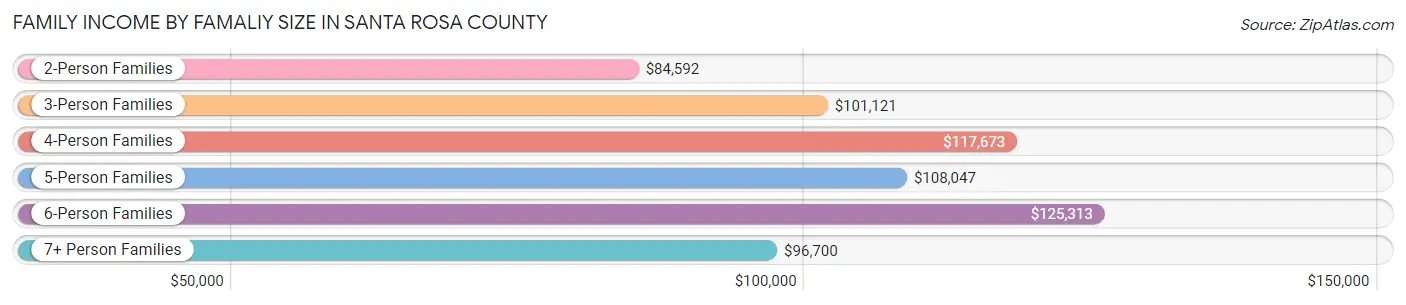
| Income Bracket | # Families | Median Income |
| 2-Person Families | 23,427 (46.3%) | $84,592 |
| 3-Person Families | 11,130 (22.0%) | $101,121 |
| 4-Person Families | 9,385 (18.5%) | $117,673 |
| 5-Person Families | 4,530 (8.9%) | $108,047 |
| 6-Person Families | 1,583 (3.1%) | $125,313 |
| 7+ Person Families | 568 (1.1%) | $96,700 |
| Total | 50,623 (100.0%) | $98,722 |
Family Income by Number of Earners in Santa Rosa County
The median family income in Santa Rosa County is $98,722, with families comprising 3+ earners (5,578) having the highest median family income of $134,298, while families with no earners (8,048) have the lowest median family income of $50,597, accounting for 11.0% and 15.9% of families, respectively.
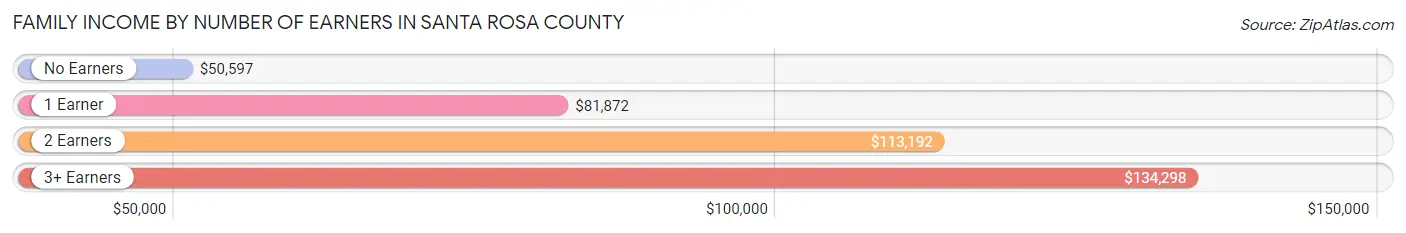
| Number of Earners | # Families | Median Income |
| No Earners | 8,048 (15.9%) | $50,597 |
| 1 Earner | 15,638 (30.9%) | $81,872 |
| 2 Earners | 21,359 (42.2%) | $113,192 |
| 3+ Earners | 5,578 (11.0%) | $134,298 |
| Total | 50,623 (100.0%) | $98,722 |
Household Income in Santa Rosa County
Household Income Brackets in Santa Rosa County
With 15,226 households falling in the category, the $100,000 to $149,999 income range is the most frequent in Santa Rosa County, accounting for 21.9% of all households. In contrast, only 1,669 households (2.4%) fall into the $10,000 to $14,999 income bracket, making it the least populous group.
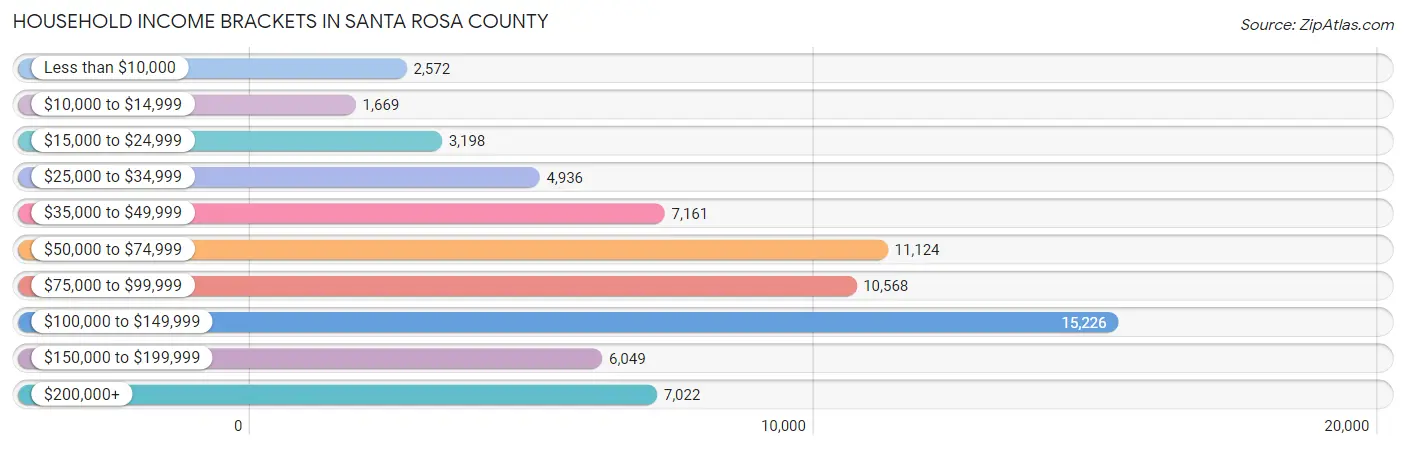
| Income Bracket | # Households | % Households |
| Less than $10,000 | 2,572 | 3.7% |
| $10,000 to $14,999 | 1,669 | 2.4% |
| $15,000 to $24,999 | 3,198 | 4.6% |
| $25,000 to $34,999 | 4,936 | 7.1% |
| $35,000 to $49,999 | 7,161 | 10.3% |
| $50,000 to $74,999 | 11,124 | 16.0% |
| $75,000 to $99,999 | 10,568 | 15.2% |
| $100,000 to $149,999 | 15,226 | 21.9% |
| $150,000 to $199,999 | 6,049 | 8.7% |
| $200,000+ | 7,022 | 10.1% |
Household Income by Householder Age in Santa Rosa County
The median household income in Santa Rosa County is $84,715, with the highest median household income of $98,124 found in the 45 to 64 years age bracket for the primary householder. A total of 27,040 households (38.9%) fall into this category. Meanwhile, the 65+ years age bracket for the primary householder has the lowest median household income of $62,021, with 18,496 households (26.6%) in this group.
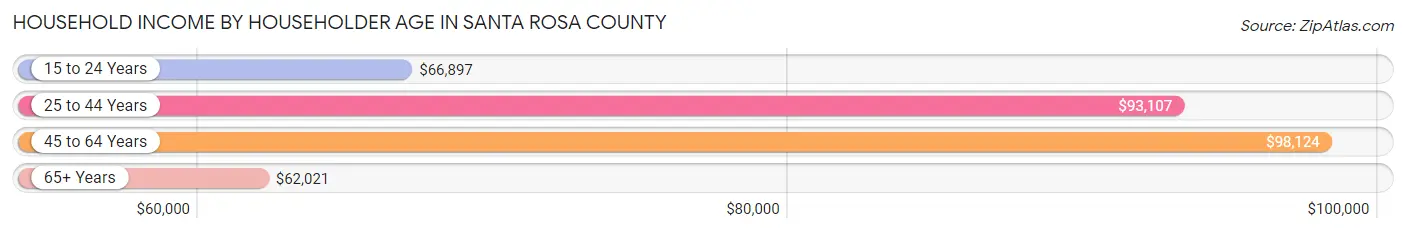
| Income Bracket | # Households | Median Income |
| 15 to 24 Years | 1,910 (2.8%) | $66,897 |
| 25 to 44 Years | 22,078 (31.8%) | $93,107 |
| 45 to 64 Years | 27,040 (38.9%) | $98,124 |
| 65+ Years | 18,496 (26.6%) | $62,021 |
| Total | 69,524 (100.0%) | $84,715 |
Poverty in Santa Rosa County
Income Below Poverty by Sex and Age in Santa Rosa County
With 8.1% poverty level for males and 9.9% for females among the residents of Santa Rosa County, under 5 year old males and 15 year old females are the most vulnerable to poverty, with 786 males (15.4%) and 190 females (16.9%) in their respective age groups living below the poverty level.
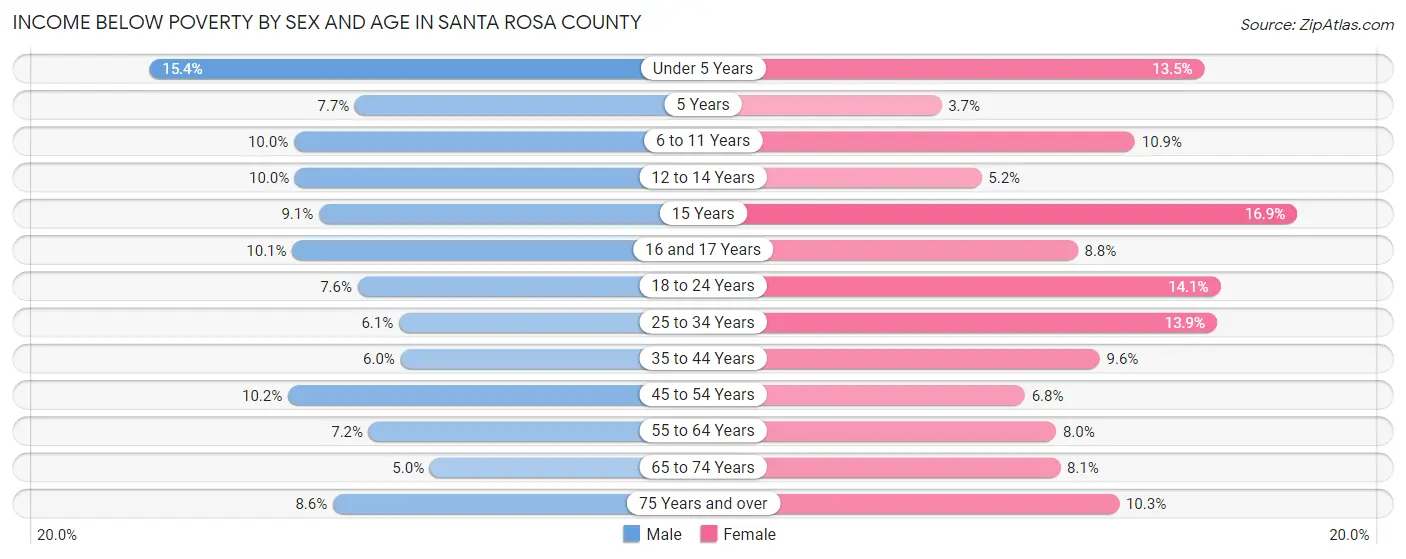
| Age Bracket | Male | Female |
| Under 5 Years | 786 (15.4%) | 654 (13.5%) |
| 5 Years | 95 (7.7%) | 41 (3.7%) |
| 6 to 11 Years | 768 (10.0%) | 719 (10.9%) |
| 12 to 14 Years | 305 (10.0%) | 187 (5.2%) |
| 15 Years | 118 (9.1%) | 190 (16.9%) |
| 16 and 17 Years | 265 (10.1%) | 201 (8.7%) |
| 18 to 24 Years | 596 (7.6%) | 894 (14.1%) |
| 25 to 34 Years | 749 (6.1%) | 1,587 (13.9%) |
| 35 to 44 Years | 756 (6.0%) | 1,192 (9.6%) |
| 45 to 54 Years | 1,194 (10.2%) | 815 (6.8%) |
| 55 to 64 Years | 912 (7.2%) | 1,062 (8.0%) |
| 65 to 74 Years | 459 (5.0%) | 780 (8.1%) |
| 75 Years and over | 418 (8.6%) | 664 (10.3%) |
| Total | 7,421 (8.1%) | 8,986 (9.9%) |
Income Above Poverty by Sex and Age in Santa Rosa County
According to the poverty statistics in Santa Rosa County, males aged 65 to 74 years and females aged 5 years are the age groups that are most secure financially, with 95.1% of males and 96.3% of females in these age groups living above the poverty line.
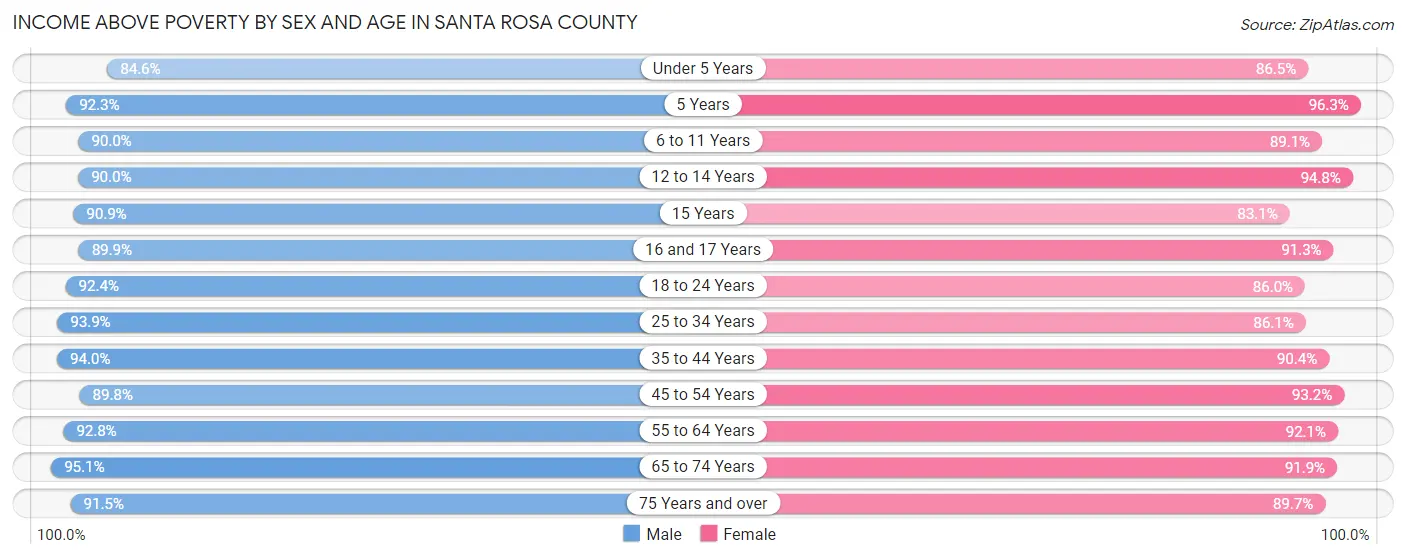
| Age Bracket | Male | Female |
| Under 5 Years | 4,327 (84.6%) | 4,205 (86.5%) |
| 5 Years | 1,134 (92.3%) | 1,071 (96.3%) |
| 6 to 11 Years | 6,910 (90.0%) | 5,888 (89.1%) |
| 12 to 14 Years | 2,756 (90.0%) | 3,421 (94.8%) |
| 15 Years | 1,183 (90.9%) | 934 (83.1%) |
| 16 and 17 Years | 2,368 (89.9%) | 2,097 (91.2%) |
| 18 to 24 Years | 7,212 (92.4%) | 5,470 (86.0%) |
| 25 to 34 Years | 11,536 (93.9%) | 9,815 (86.1%) |
| 35 to 44 Years | 11,766 (94.0%) | 11,263 (90.4%) |
| 45 to 54 Years | 10,485 (89.8%) | 11,188 (93.2%) |
| 55 to 64 Years | 11,712 (92.8%) | 12,295 (92.0%) |
| 65 to 74 Years | 8,818 (95.1%) | 8,846 (91.9%) |
| 75 Years and over | 4,469 (91.4%) | 5,791 (89.7%) |
| Total | 84,676 (91.9%) | 82,284 (90.1%) |
Income Below Poverty Among Married-Couple Families in Santa Rosa County
The poverty statistics for married-couple families in Santa Rosa County show that 4.6% or 1,851 of the total 40,507 families live below the poverty line. Families with 5 or more children have the highest poverty rate of 24.1%, comprising of 41 families. On the other hand, families with 1 or 2 children have the lowest poverty rate of 3.9%, which includes 500 families.
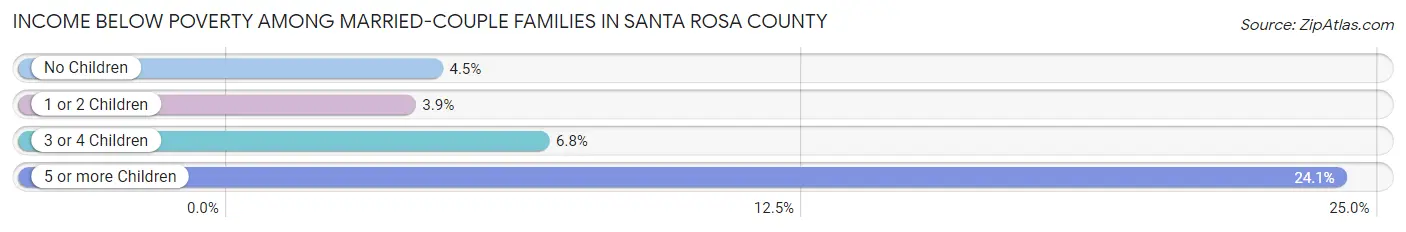
| Children | Above Poverty | Below Poverty |
| No Children | 22,348 (95.6%) | 1,040 (4.4%) |
| 1 or 2 Children | 12,462 (96.1%) | 500 (3.9%) |
| 3 or 4 Children | 3,717 (93.2%) | 270 (6.8%) |
| 5 or more Children | 129 (75.9%) | 41 (24.1%) |
| Total | 38,656 (95.4%) | 1,851 (4.6%) |
Income Below Poverty Among Single-Parent Households in Santa Rosa County
According to the poverty data in Santa Rosa County, 8.0% or 258 single-father households and 18.8% or 1,298 single-mother households are living below the poverty line. Among single-father households, those with 1 or 2 children have the highest poverty rate, with 160 households (10.1%) experiencing poverty. Likewise, among single-mother households, those with 5 or more children have the highest poverty rate, with 53 households (100.0%) falling below the poverty line.
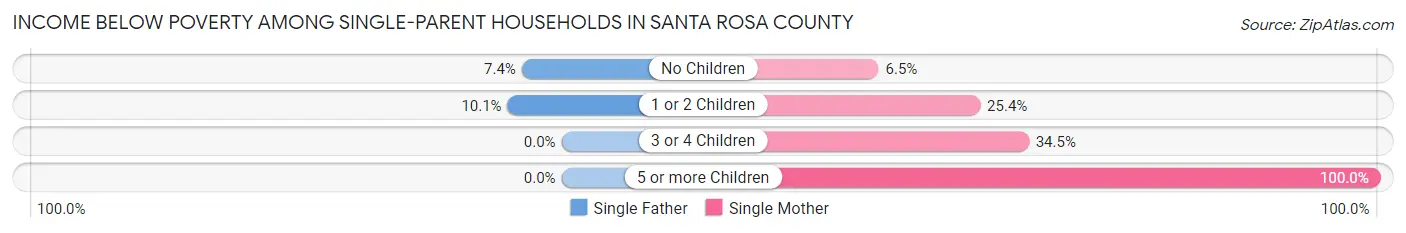
| Children | Single Father | Single Mother |
| No Children | 98 (7.4%) | 186 (6.5%) |
| 1 or 2 Children | 160 (10.1%) | 877 (25.4%) |
| 3 or 4 Children | 0 (0.0%) | 182 (34.5%) |
| 5 or more Children | 0 (0.0%) | 53 (100.0%) |
| Total | 258 (8.0%) | 1,298 (18.8%) |
Income Below Poverty Among Married-Couple vs Single-Parent Households in Santa Rosa County
The poverty data for Santa Rosa County shows that 1,851 of the married-couple family households (4.6%) and 1,556 of the single-parent households (15.4%) are living below the poverty level. Within the married-couple family households, those with 5 or more children have the highest poverty rate, with 41 households (24.1%) falling below the poverty line. Among the single-parent households, those with 5 or more children have the highest poverty rate, with 53 household (31.0%) living below poverty.
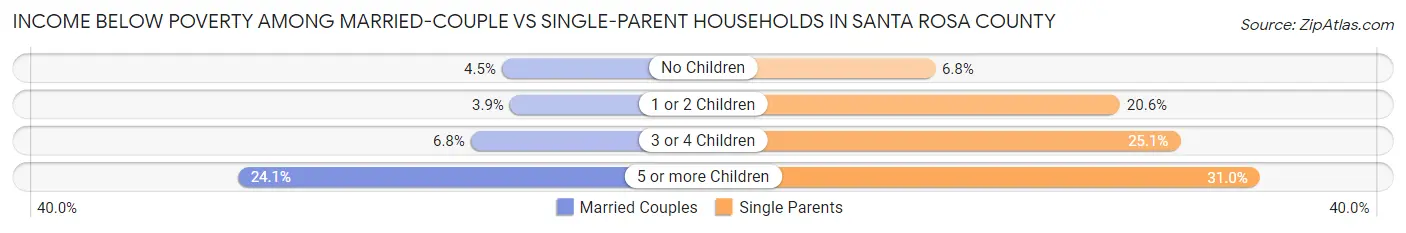
| Children | Married-Couple Families | Single-Parent Households |
| No Children | 1,040 (4.4%) | 284 (6.8%) |
| 1 or 2 Children | 500 (3.9%) | 1,037 (20.6%) |
| 3 or 4 Children | 270 (6.8%) | 182 (25.1%) |
| 5 or more Children | 41 (24.1%) | 53 (31.0%) |
| Total | 1,851 (4.6%) | 1,556 (15.4%) |
Race in Santa Rosa County
The most populous races in Santa Rosa County are White / Caucasian (155,936 | 82.5%), Two or more Races (13,510 | 7.1%), and Hispanic or Latino (11,652 | 6.2%).
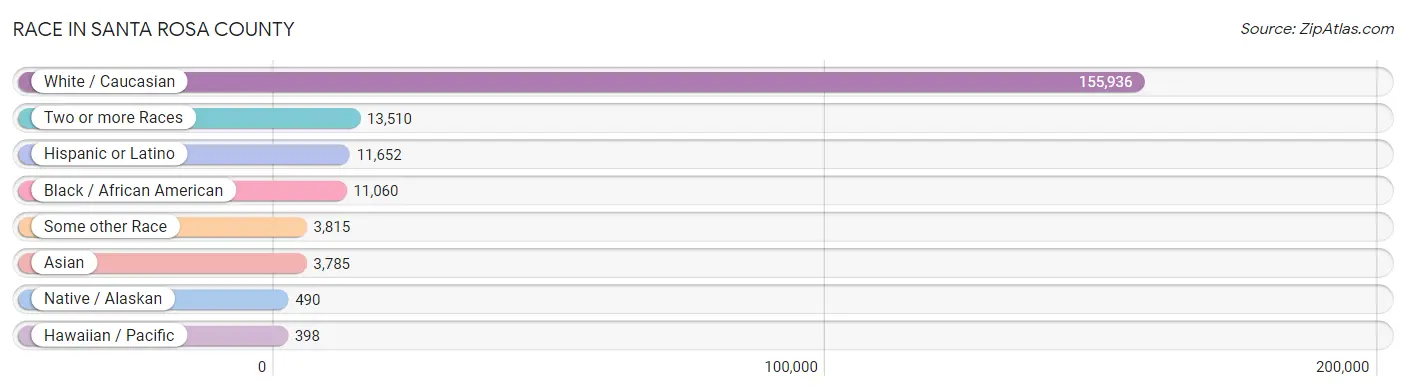
| Race | # Population | % Population |
| Asian | 3,785 | 2.0% |
| Black / African American | 11,060 | 5.9% |
| Hawaiian / Pacific | 398 | 0.2% |
| Hispanic or Latino | 11,652 | 6.2% |
| Native / Alaskan | 490 | 0.3% |
| White / Caucasian | 155,936 | 82.5% |
| Two or more Races | 13,510 | 7.1% |
| Some other Race | 3,815 | 2.0% |
| Total | 188,994 | 100.0% |
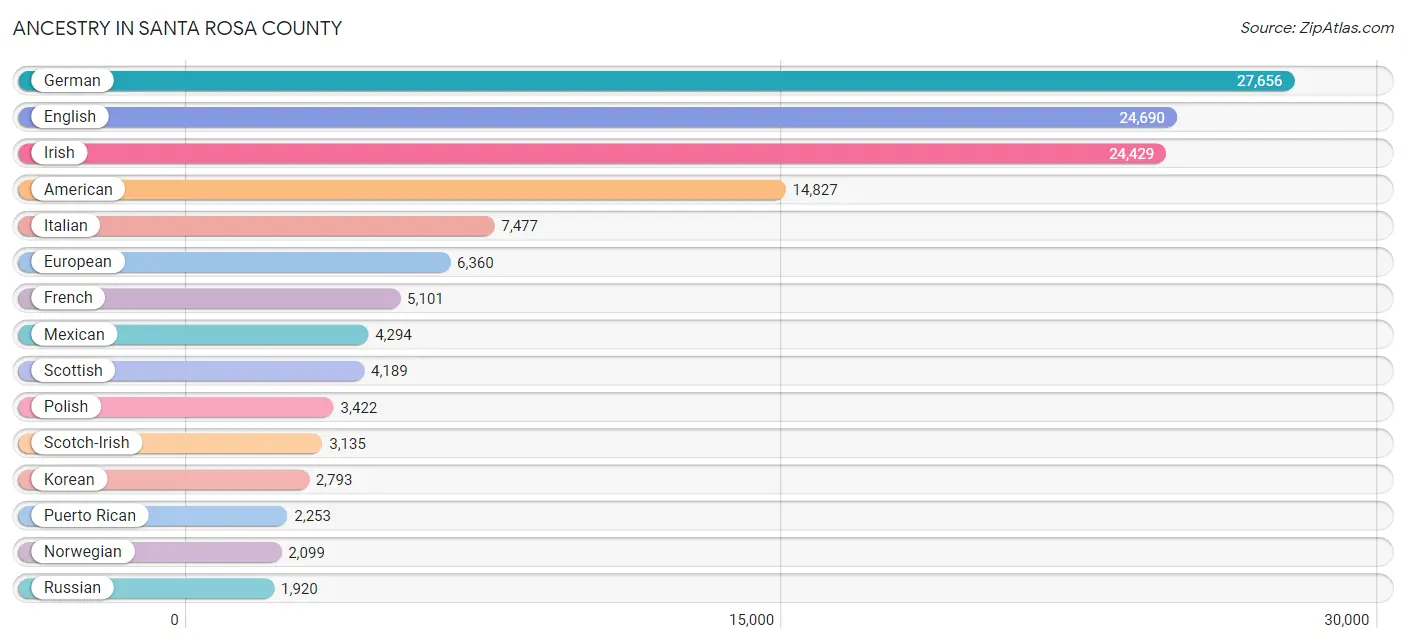
Ancestry in Santa Rosa County
The most populous ancestries reported in Santa Rosa County are German (27,656 | 14.6%), English (24,690 | 13.1%), Irish (24,429 | 12.9%), American (14,827 | 7.9%), and Italian (7,477 | 4.0%), together accounting for 52.4% of all Santa Rosa County residents.
| Ancestry | # Population | % Population |
| African | 374 | 0.2% |
| Alaska Native | 12 | 0.0% |
| Albanian | 6 | 0.0% |
| American | 14,827 | 7.9% |
| Apache | 237 | 0.1% |
| Arab | 395 | 0.2% |
| Argentinean | 41 | 0.0% |
| Armenian | 171 | 0.1% |
| Australian | 47 | 0.0% |
| Austrian | 356 | 0.2% |
| Bahamian | 18 | 0.0% |
| Barbadian | 6 | 0.0% |
| Belgian | 15 | 0.0% |
| Belizean | 54 | 0.0% |
| Bhutanese | 1,088 | 0.6% |
| Blackfeet | 126 | 0.1% |
| Brazilian | 160 | 0.1% |
| British | 1,694 | 0.9% |
| British West Indian | 42 | 0.0% |
| Bulgarian | 2 | 0.0% |
| Burmese | 1,375 | 0.7% |
| Cajun | 39 | 0.0% |
| Cambodian | 49 | 0.0% |
| Canadian | 203 | 0.1% |
| Cape Verdean | 24 | 0.0% |
| Celtic | 30 | 0.0% |
| Central American | 1,550 | 0.8% |
| Central American Indian | 43 | 0.0% |
| Cherokee | 1,123 | 0.6% |
| Chilean | 15 | 0.0% |
| Chippewa | 82 | 0.0% |
| Choctaw | 92 | 0.1% |
| Colombian | 518 | 0.3% |
| Costa Rican | 67 | 0.0% |
| Cree | 34 | 0.0% |
| Creek | 801 | 0.4% |
| Croatian | 94 | 0.1% |
| Cuban | 1,085 | 0.6% |
| Czech | 444 | 0.2% |
| Czechoslovakian | 119 | 0.1% |
| Danish | 538 | 0.3% |
| Delaware | 29 | 0.0% |
| Dominican | 356 | 0.2% |
| Dutch | 1,365 | 0.7% |
| Dutch West Indian | 14 | 0.0% |
| Eastern European | 655 | 0.4% |
| Ecuadorian | 155 | 0.1% |
| Egyptian | 55 | 0.0% |
| English | 24,690 | 13.1% |
| European | 6,360 | 3.4% |
| Filipino | 26 | 0.0% |
| Finnish | 518 | 0.3% |
| French | 5,101 | 2.7% |
| French Canadian | 1,463 | 0.8% |
| German | 27,656 | 14.6% |
| Greek | 656 | 0.4% |
| Guamanian / Chamorro | 28 | 0.0% |
| Guatemalan | 97 | 0.1% |
| Guyanese | 21 | 0.0% |
| Haitian | 164 | 0.1% |
| Honduran | 552 | 0.3% |
| Hungarian | 497 | 0.3% |
| Icelander | 30 | 0.0% |
| Indian (Asian) | 539 | 0.3% |
| Indonesian | 18 | 0.0% |
| Inupiat | 21 | 0.0% |
| Iranian | 29 | 0.0% |
| Irish | 24,429 | 12.9% |
| Iroquois | 23 | 0.0% |
| Italian | 7,477 | 4.0% |
| Jamaican | 1,319 | 0.7% |
| Japanese | 72 | 0.0% |
| Korean | 2,793 | 1.5% |
| Lebanese | 118 | 0.1% |
| Lithuanian | 251 | 0.1% |
| Lumbee | 16 | 0.0% |
| Luxembourger | 29 | 0.0% |
| Malaysian | 105 | 0.1% |
| Mexican | 4,294 | 2.3% |
| Mexican American Indian | 136 | 0.1% |
| Mongolian | 27 | 0.0% |
| Moroccan | 38 | 0.0% |
| Native Hawaiian | 267 | 0.1% |
| Navajo | 255 | 0.1% |
| Nicaraguan | 148 | 0.1% |
| Nigerian | 113 | 0.1% |
| Northern European | 723 | 0.4% |
| Norwegian | 2,099 | 1.1% |
| Pakistani | 382 | 0.2% |
| Panamanian | 553 | 0.3% |
| Pennsylvania German | 15 | 0.0% |
| Peruvian | 191 | 0.1% |
| Polish | 3,422 | 1.8% |
| Portuguese | 383 | 0.2% |
| Potawatomi | 13 | 0.0% |
| Pueblo | 12 | 0.0% |
| Puerto Rican | 2,253 | 1.2% |
| Romanian | 64 | 0.0% |
| Russian | 1,920 | 1.0% |
| Salvadoran | 133 | 0.1% |
| Scandinavian | 891 | 0.5% |
| Scotch-Irish | 3,135 | 1.7% |
| Scottish | 4,189 | 2.2% |
| Seminole | 7 | 0.0% |
| Serbian | 35 | 0.0% |
| Sioux | 19 | 0.0% |
| Slavic | 176 | 0.1% |
| Slovak | 140 | 0.1% |
| Slovene | 46 | 0.0% |
| South African | 98 | 0.1% |
| South American | 951 | 0.5% |
| Spaniard | 197 | 0.1% |
| Spanish | 527 | 0.3% |
| Sri Lankan | 506 | 0.3% |
| Subsaharan African | 665 | 0.4% |
| Swedish | 1,854 | 1.0% |
| Swiss | 330 | 0.2% |
| Syrian | 174 | 0.1% |
| Thai | 297 | 0.2% |
| Trinidadian and Tobagonian | 155 | 0.1% |
| Turkish | 126 | 0.1% |
| Ukrainian | 209 | 0.1% |
| Uruguayan | 14 | 0.0% |
| Venezuelan | 17 | 0.0% |
| Welsh | 967 | 0.5% |
| West Indian | 294 | 0.2% |
| Yugoslavian | 49 | 0.0% |
| Yup'ik | 4 | 0.0% | View All 128 Rows |
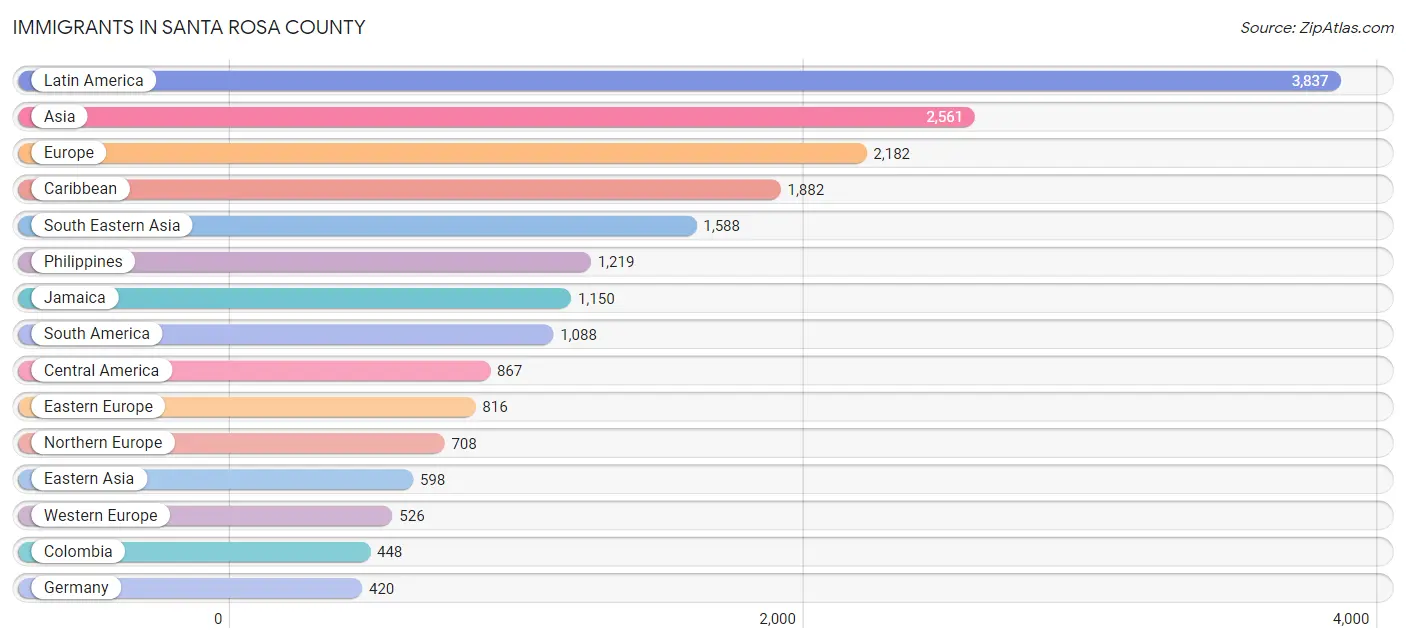
Immigrants in Santa Rosa County
The most numerous immigrant groups reported in Santa Rosa County came from Latin America (3,837 | 2.0%), Asia (2,561 | 1.4%), Europe (2,182 | 1.1%), Caribbean (1,882 | 1.0%), and South Eastern Asia (1,588 | 0.8%), together accounting for 6.4% of all Santa Rosa County residents.
| Immigration Origin | # Population | % Population |
| Africa | 269 | 0.1% |
| Argentina | 41 | 0.0% |
| Asia | 2,561 | 1.4% |
| Australia | 11 | 0.0% |
| Austria | 10 | 0.0% |
| Bahamas | 6 | 0.0% |
| Bangladesh | 137 | 0.1% |
| Barbados | 130 | 0.1% |
| Belgium | 15 | 0.0% |
| Brazil | 124 | 0.1% |
| Bulgaria | 2 | 0.0% |
| Cabo Verde | 24 | 0.0% |
| Cambodia | 33 | 0.0% |
| Canada | 259 | 0.1% |
| Caribbean | 1,882 | 1.0% |
| Central America | 867 | 0.5% |
| China | 183 | 0.1% |
| Colombia | 448 | 0.2% |
| Costa Rica | 81 | 0.0% |
| Cuba | 207 | 0.1% |
| Czechoslovakia | 129 | 0.1% |
| Denmark | 14 | 0.0% |
| Dominica | 28 | 0.0% |
| Dominican Republic | 30 | 0.0% |
| Eastern Africa | 71 | 0.0% |
| Eastern Asia | 598 | 0.3% |
| Eastern Europe | 816 | 0.4% |
| El Salvador | 26 | 0.0% |
| England | 187 | 0.1% |
| Europe | 2,182 | 1.1% |
| France | 46 | 0.0% |
| Germany | 420 | 0.2% |
| Greece | 14 | 0.0% |
| Guatemala | 72 | 0.0% |
| Guyana | 329 | 0.2% |
| Haiti | 59 | 0.0% |
| Honduras | 70 | 0.0% |
| Hungary | 26 | 0.0% |
| India | 25 | 0.0% |
| Iran | 29 | 0.0% |
| Ireland | 96 | 0.1% |
| Israel | 19 | 0.0% |
| Italy | 86 | 0.1% |
| Jamaica | 1,150 | 0.6% |
| Japan | 133 | 0.1% |
| Korea | 282 | 0.2% |
| Laos | 4 | 0.0% |
| Latin America | 3,837 | 2.0% |
| Lebanon | 82 | 0.0% |
| Malaysia | 27 | 0.0% |
| Mexico | 350 | 0.2% |
| Micronesia | 243 | 0.1% |
| Netherlands | 31 | 0.0% |
| Nicaragua | 52 | 0.0% |
| Nigeria | 81 | 0.0% |
| Northern Europe | 708 | 0.4% |
| Oceania | 264 | 0.1% |
| Pakistan | 24 | 0.0% |
| Panama | 216 | 0.1% |
| Peru | 75 | 0.0% |
| Philippines | 1,219 | 0.6% |
| Poland | 55 | 0.0% |
| Romania | 42 | 0.0% |
| Russia | 366 | 0.2% |
| Scotland | 13 | 0.0% |
| South Africa | 47 | 0.0% |
| South America | 1,088 | 0.6% |
| South Central Asia | 215 | 0.1% |
| South Eastern Asia | 1,588 | 0.8% |
| Southern Europe | 132 | 0.1% |
| Spain | 32 | 0.0% |
| Sweden | 61 | 0.0% |
| Switzerland | 2 | 0.0% |
| Syria | 38 | 0.0% |
| Taiwan | 10 | 0.0% |
| Thailand | 12 | 0.0% |
| Trinidad and Tobago | 216 | 0.1% |
| Turkey | 15 | 0.0% |
| Ukraine | 26 | 0.0% |
| Uruguay | 14 | 0.0% |
| Venezuela | 57 | 0.0% |
| Vietnam | 275 | 0.2% |
| Western Africa | 151 | 0.1% |
| Western Asia | 154 | 0.1% |
| Western Europe | 526 | 0.3% | View All 85 Rows |
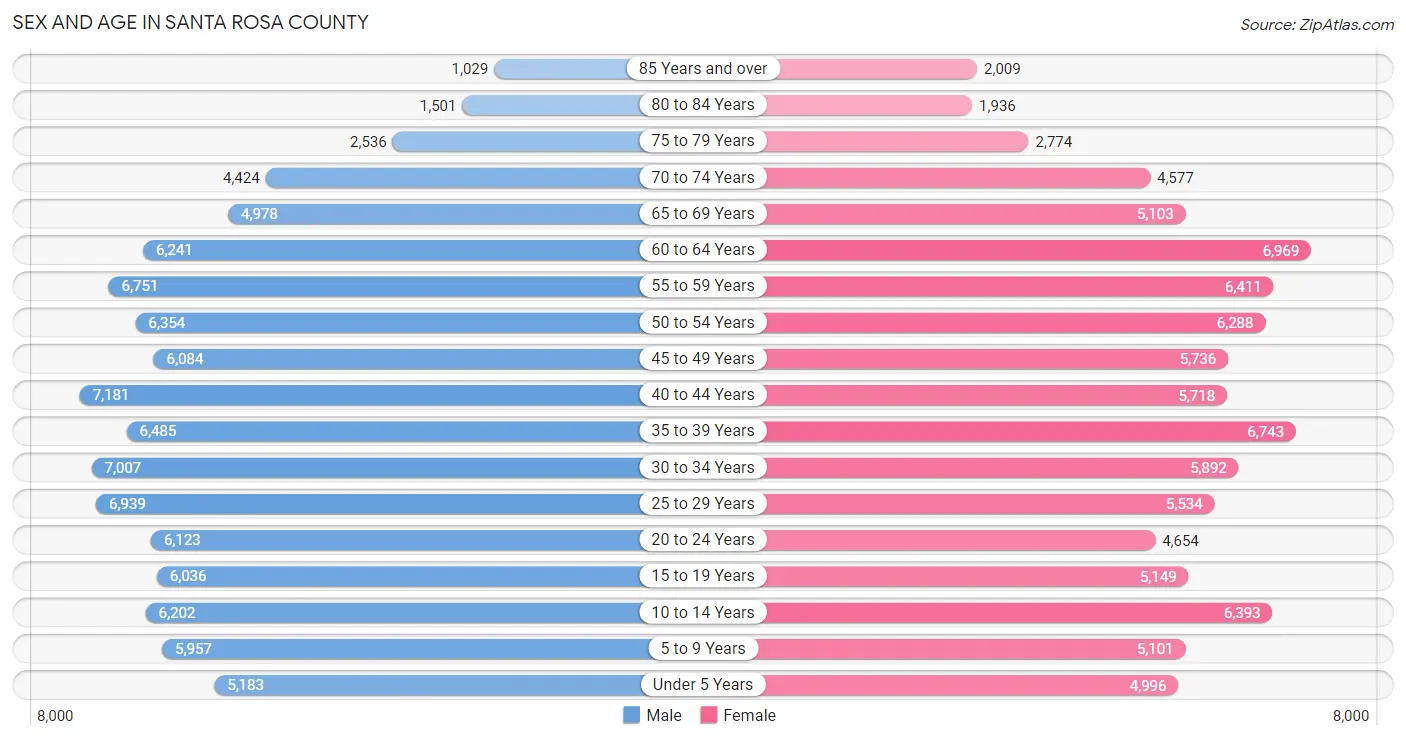
Sex and Age in Santa Rosa County
Sex and Age in Santa Rosa County
The most populous age groups in Santa Rosa County are 40 to 44 Years (7,181 | 7.4%) for men and 60 to 64 Years (6,969 | 7.6%) for women.
| Age Bracket | Male | Female |
| Under 5 Years | 5,183 (5.3%) | 4,996 (5.4%) |
| 5 to 9 Years | 5,957 (6.1%) | 5,101 (5.6%) |
| 10 to 14 Years | 6,202 (6.4%) | 6,393 (7.0%) |
| 15 to 19 Years | 6,036 (6.2%) | 5,149 (5.6%) |
| 20 to 24 Years | 6,123 (6.3%) | 4,654 (5.1%) |
| 25 to 29 Years | 6,939 (7.1%) | 5,534 (6.0%) |
| 30 to 34 Years | 7,007 (7.2%) | 5,892 (6.4%) |
| 35 to 39 Years | 6,485 (6.7%) | 6,743 (7.3%) |
| 40 to 44 Years | 7,181 (7.4%) | 5,718 (6.2%) |
| 45 to 49 Years | 6,084 (6.3%) | 5,736 (6.2%) |
| 50 to 54 Years | 6,354 (6.6%) | 6,288 (6.8%) |
| 55 to 59 Years | 6,751 (7.0%) | 6,411 (7.0%) |
| 60 to 64 Years | 6,241 (6.4%) | 6,969 (7.6%) |
| 65 to 69 Years | 4,978 (5.1%) | 5,103 (5.6%) |
| 70 to 74 Years | 4,424 (4.6%) | 4,577 (5.0%) |
| 75 to 79 Years | 2,536 (2.6%) | 2,774 (3.0%) |
| 80 to 84 Years | 1,501 (1.5%) | 1,936 (2.1%) |
| 85 Years and over | 1,029 (1.1%) | 2,009 (2.2%) |
| Total | 97,011 (100.0%) | 91,983 (100.0%) |
Families and Households in Santa Rosa County
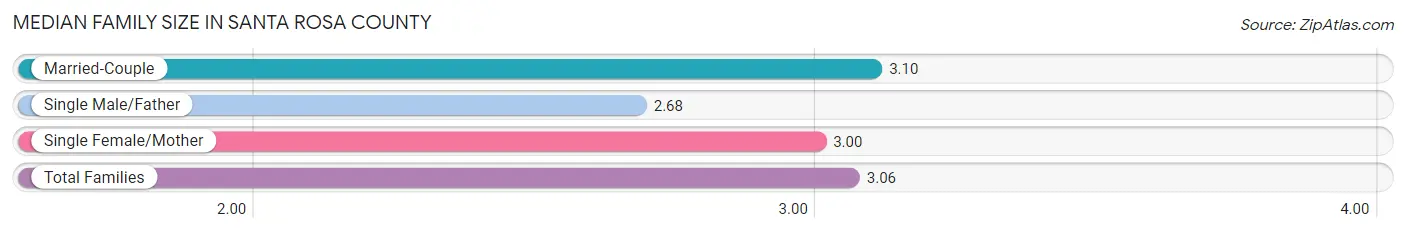
Median Family Size in Santa Rosa County
The median family size in Santa Rosa County is 3.06 persons per family, with married-couple families (40,507 | 80.0%) accounting for the largest median family size of 3.1 persons per family. On the other hand, single male/father families (3,228 | 6.4%) represent the smallest median family size with 2.68 persons per family.
| Family Type | # Families | Family Size |
| Married-Couple | 40,507 (80.0%) | 3.10 |
| Single Male/Father | 3,228 (6.4%) | 2.68 |
| Single Female/Mother | 6,888 (13.6%) | 3.00 |
| Total Families | 50,623 (100.0%) | 3.06 |
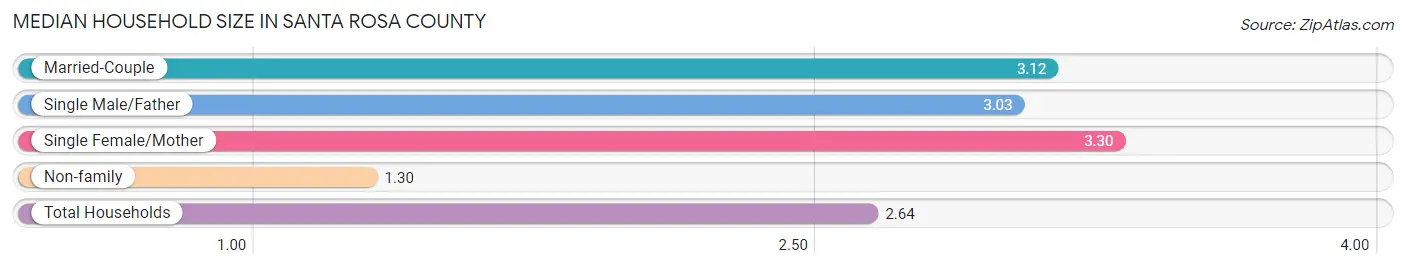
Median Household Size in Santa Rosa County
The median household size in Santa Rosa County is 2.64 persons per household, with single female/mother households (6,888 | 9.9%) accounting for the largest median household size of 3.3 persons per household. non-family households (18,901 | 27.2%) represent the smallest median household size with 1.30 persons per household.
| Household Type | # Households | Household Size |
| Married-Couple | 40,507 (58.3%) | 3.12 |
| Single Male/Father | 3,228 (4.6%) | 3.03 |
| Single Female/Mother | 6,888 (9.9%) | 3.30 |
| Non-family | 18,901 (27.2%) | 1.30 |
| Total Households | 69,524 (100.0%) | 2.64 |
Household Size by Marriage Status in Santa Rosa County
Out of a total of 69,524 households in Santa Rosa County, 50,623 (72.8%) are family households, while 18,901 (27.2%) are nonfamily households. The most numerous type of family households are 2-person households, comprising 22,460, and the most common type of nonfamily households are 1-person households, comprising 14,512.
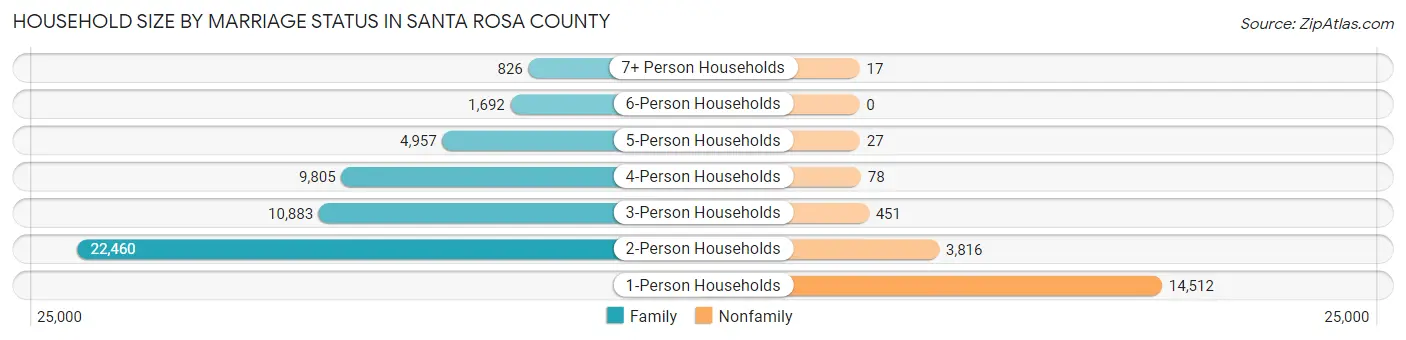
| Household Size | Family Households | Nonfamily Households |
| 1-Person Households | - | 14,512 (20.9%) |
| 2-Person Households | 22,460 (32.3%) | 3,816 (5.5%) |
| 3-Person Households | 10,883 (15.7%) | 451 (0.6%) |
| 4-Person Households | 9,805 (14.1%) | 78 (0.1%) |
| 5-Person Households | 4,957 (7.1%) | 27 (0.0%) |
| 6-Person Households | 1,692 (2.4%) | 0 (0.0%) |
| 7+ Person Households | 826 (1.2%) | 17 (0.0%) |
| Total | 50,623 (72.8%) | 18,901 (27.2%) |
Female Fertility in Santa Rosa County
Fertility by Age in Santa Rosa County
Average fertility rate in Santa Rosa County is 56.0 births per 1,000 women. Women in the age bracket of 20 to 34 years have the highest fertility rate with 105.0 births per 1,000 women. Women in the age bracket of 20 to 34 years acount for 74.6% of all women with births.
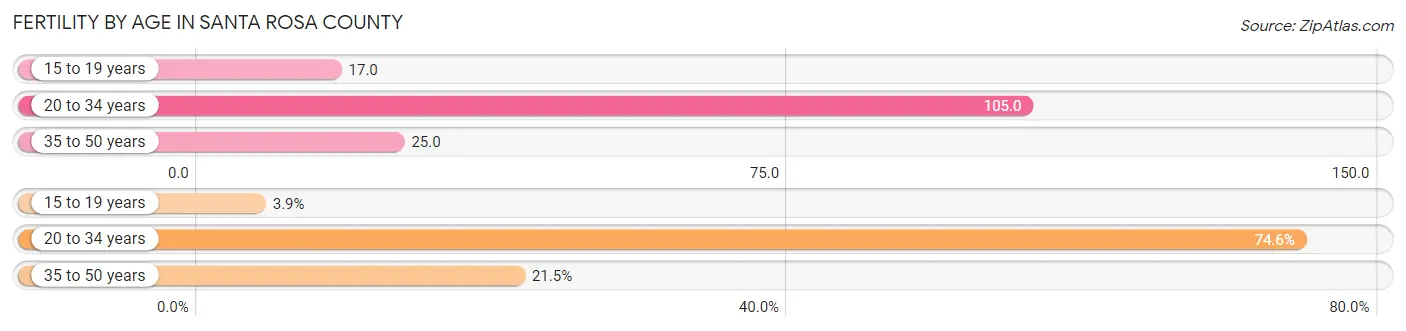
| Age Bracket | Women with Births | Births / 1,000 Women |
| 15 to 19 years | 89 (3.9%) | 17.0 |
| 20 to 34 years | 1,692 (74.6%) | 105.0 |
| 35 to 50 years | 488 (21.5%) | 25.0 |
| Total | 2,269 (100.0%) | 56.0 |
Fertility by Age by Marriage Status in Santa Rosa County
71.9% of women with births (2,269) in Santa Rosa County are married. The highest percentage of unmarried women with births falls into 15 to 19 years age bracket with 73.0% of them unmarried at the time of birth, while the lowest percentage of unmarried women with births belong to 35 to 50 years age bracket with 12.1% of them unmarried.
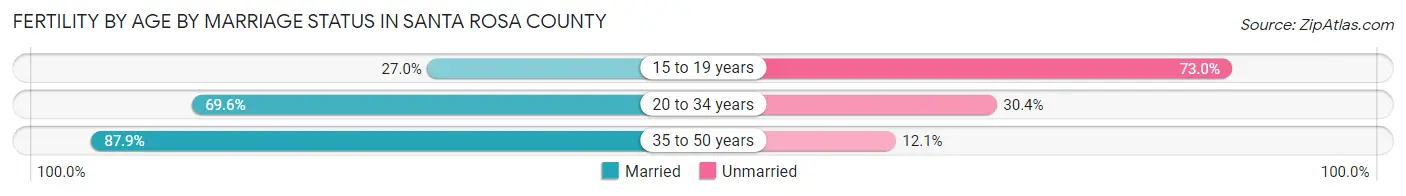
| Age Bracket | Married | Unmarried |
| 15 to 19 years | 24 (27.0%) | 65 (73.0%) |
| 20 to 34 years | 1,178 (69.6%) | 514 (30.4%) |
| 35 to 50 years | 429 (87.9%) | 59 (12.1%) |
| Total | 1,631 (71.9%) | 638 (28.1%) |
Fertility by Education in Santa Rosa County
Average fertility rate in Santa Rosa County is 56.0 births per 1,000 women. Women with the education attainment of graduate degree have the highest fertility rate of 77.0 births per 1,000 women, while women with the education attainment of less than high school have the lowest fertility at 37.0 births per 1,000 women. Women with the education attainment of college or associate's degree represent 32.3% of all women with births.
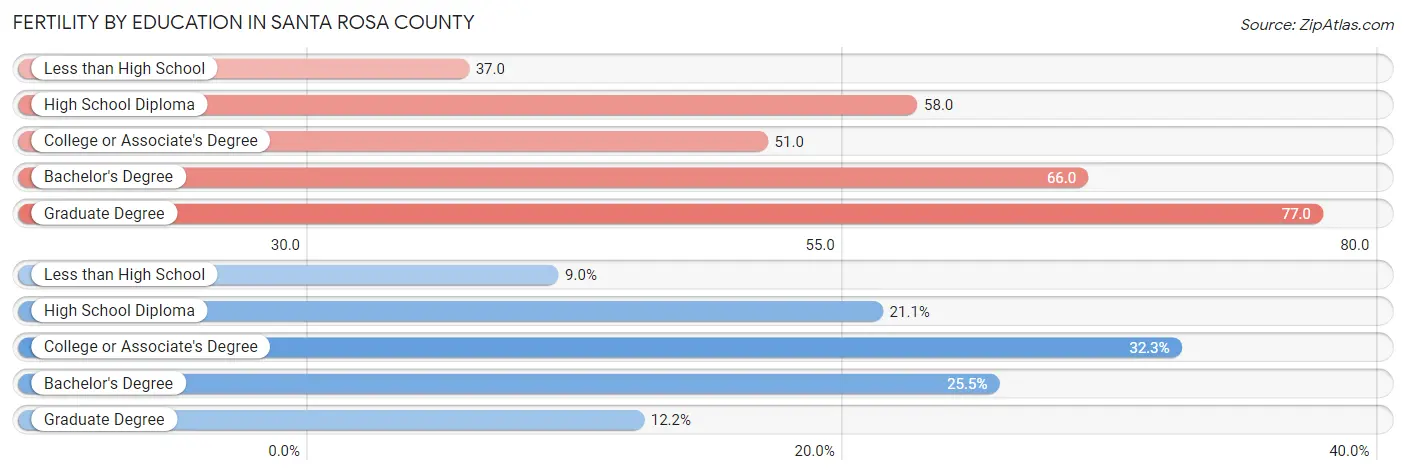
| Educational Attainment | Women with Births | Births / 1,000 Women |
| Less than High School | 203 (8.9%) | 37.0 |
| High School Diploma | 479 (21.1%) | 58.0 |
| College or Associate's Degree | 733 (32.3%) | 51.0 |
| Bachelor's Degree | 578 (25.5%) | 66.0 |
| Graduate Degree | 276 (12.2%) | 77.0 |
| Total | 2,269 (100.0%) | 56.0 |
Fertility by Education by Marriage Status in Santa Rosa County
28.1% of women with births in Santa Rosa County are unmarried. Women with the educational attainment of graduate degree are most likely to be married with 100.0% of them married at childbirth, while women with the educational attainment of less than high school are least likely to be married with 94.6% of them unmarried at childbirth.
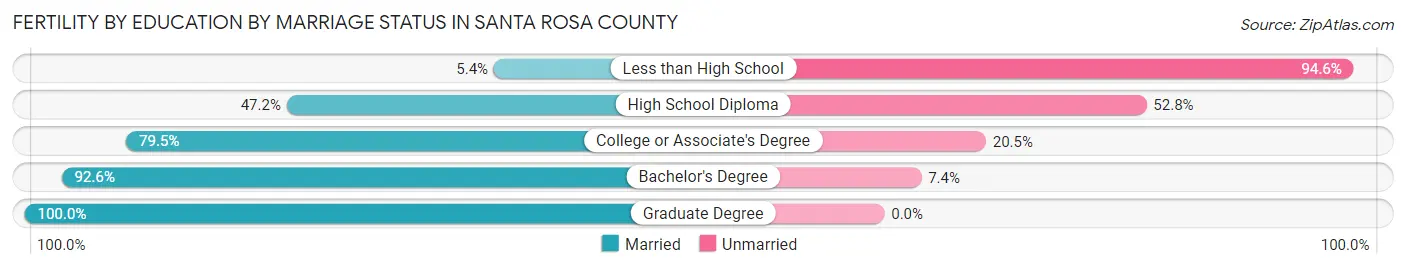
| Educational Attainment | Married | Unmarried |
| Less than High School | 11 (5.4%) | 192 (94.6%) |
| High School Diploma | 226 (47.2%) | 253 (52.8%) |
| College or Associate's Degree | 583 (79.5%) | 150 (20.5%) |
| Bachelor's Degree | 535 (92.6%) | 43 (7.4%) |
| Graduate Degree | 276 (100.0%) | 0 (0.0%) |
| Total | 1,631 (71.9%) | 638 (28.1%) |
Employment Characteristics in Santa Rosa County
Employment by Class of Employer in Santa Rosa County
Among the 83,822 employed individuals in Santa Rosa County, private company employees (50,206 | 59.9%), federal government employees (10,698 | 12.8%), and not-for-profit organizations (6,873 | 8.2%) make up the most common classes of employment.
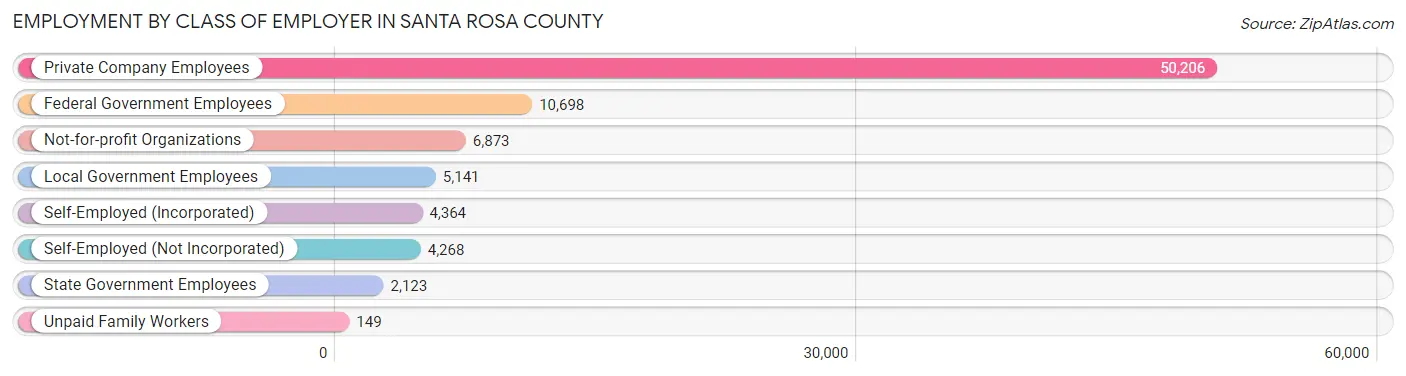
| Employer Class | # Employees | % Employees |
| Private Company Employees | 50,206 | 59.9% |
| Self-Employed (Incorporated) | 4,364 | 5.2% |
| Self-Employed (Not Incorporated) | 4,268 | 5.1% |
| Not-for-profit Organizations | 6,873 | 8.2% |
| Local Government Employees | 5,141 | 6.1% |
| State Government Employees | 2,123 | 2.5% |
| Federal Government Employees | 10,698 | 12.8% |
| Unpaid Family Workers | 149 | 0.2% |
| Total | 83,822 | 100.0% |
Employment Status by Age in Santa Rosa County
According to the labor force statistics for Santa Rosa County, out of the total population over 16 years of age (152,728), 59.1% or 90,262 individuals are in the labor force, with 4.7% or 4,242 of them unemployed. The age group with the highest labor force participation rate is 20 to 24 years, with 80.3% or 8,654 individuals in the labor force. Within the labor force, the 16 to 19 years age range has the highest percentage of unemployed individuals, with 11.1% or 436 of them being unemployed.
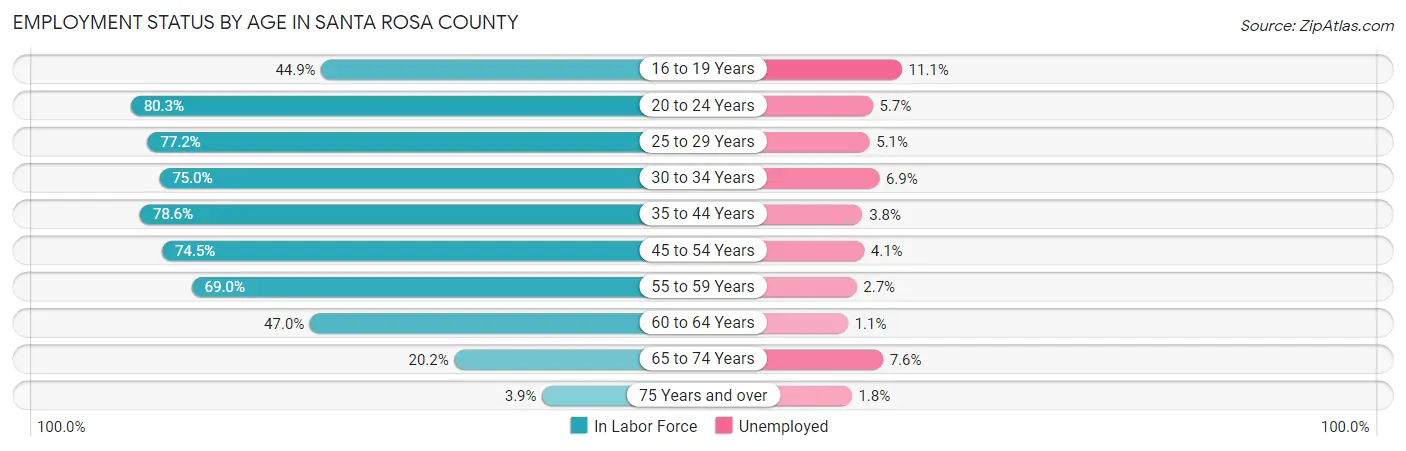
| Age Bracket | In Labor Force | Unemployed |
| 16 to 19 Years | 3,929 (44.9%) | 436 (11.1%) |
| 20 to 24 Years | 8,654 (80.3%) | 493 (5.7%) |
| 25 to 29 Years | 9,629 (77.2%) | 491 (5.1%) |
| 30 to 34 Years | 9,674 (75.0%) | 668 (6.9%) |
| 35 to 44 Years | 20,536 (78.6%) | 780 (3.8%) |
| 45 to 54 Years | 18,224 (74.5%) | 747 (4.1%) |
| 55 to 59 Years | 9,082 (69.0%) | 245 (2.7%) |
| 60 to 64 Years | 6,209 (47.0%) | 68 (1.1%) |
| 65 to 74 Years | 3,855 (20.2%) | 293 (7.6%) |
| 75 Years and over | 460 (3.9%) | 8 (1.8%) |
| Total | 90,262 (59.1%) | 4,242 (4.7%) |
Employment Status by Educational Attainment in Santa Rosa County
According to labor force statistics for Santa Rosa County, 71.7% of individuals (73,373) out of the total population between 25 and 64 years of age (102,333) are in the labor force, with 4.1% or 3,008 of them being unemployed. The group with the highest labor force participation rate are those with the educational attainment of bachelor's degree or higher, with 80.5% or 25,155 individuals in the labor force. Within the labor force, individuals with less than high school education have the highest percentage of unemployment, with 5.3% or 196 of them being unemployed.
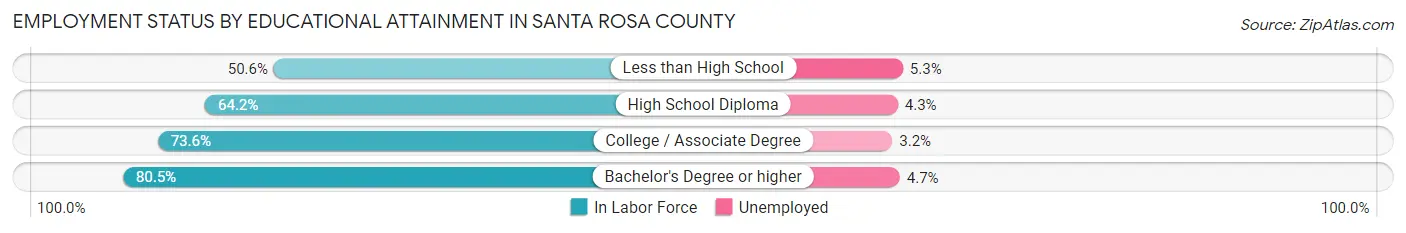
| Educational Attainment | In Labor Force | Unemployed |
| Less than High School | 3,690 (50.6%) | 386 (5.3%) |
| High School Diploma | 16,677 (64.2%) | 1,117 (4.3%) |
| College / Associate Degree | 27,833 (73.6%) | 1,210 (3.2%) |
| Bachelor's Degree or higher | 25,155 (80.5%) | 1,469 (4.7%) |
| Total | 73,373 (71.7%) | 4,196 (4.1%) |
Employment Occupations by Sex in Santa Rosa County
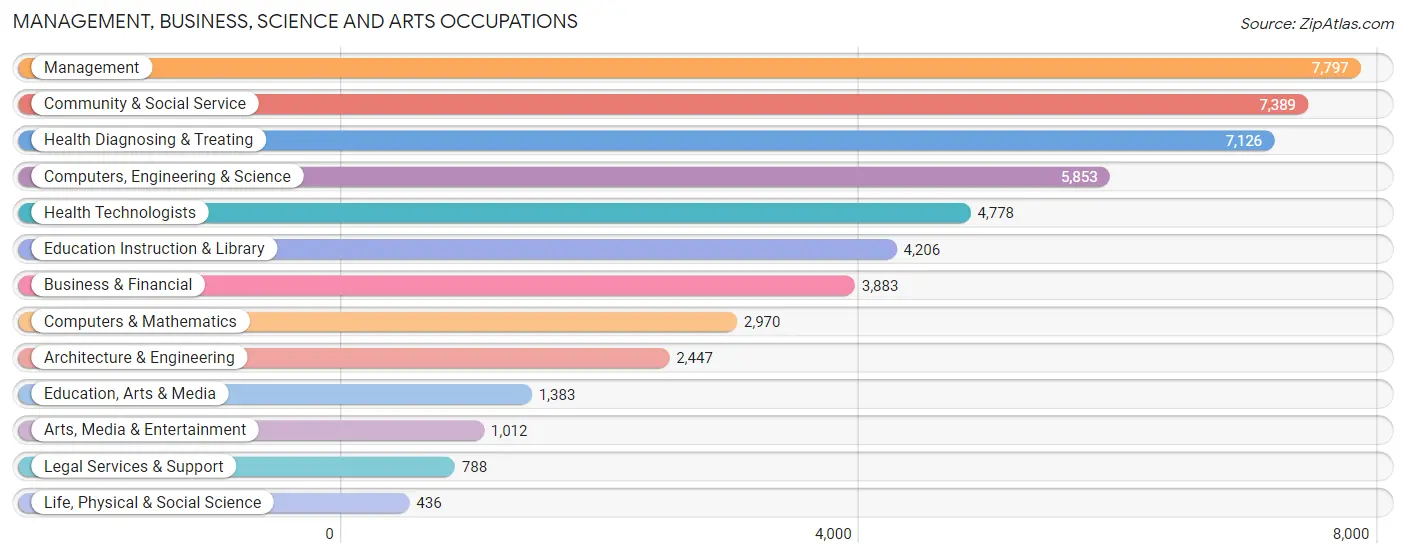
Management, Business, Science and Arts Occupations
The most common Management, Business, Science and Arts occupations in Santa Rosa County are Management (7,797 | 9.6%), Community & Social Service (7,389 | 9.1%), Health Diagnosing & Treating (7,126 | 8.8%), Computers, Engineering & Science (5,853 | 7.2%), and Health Technologists (4,778 | 5.9%).
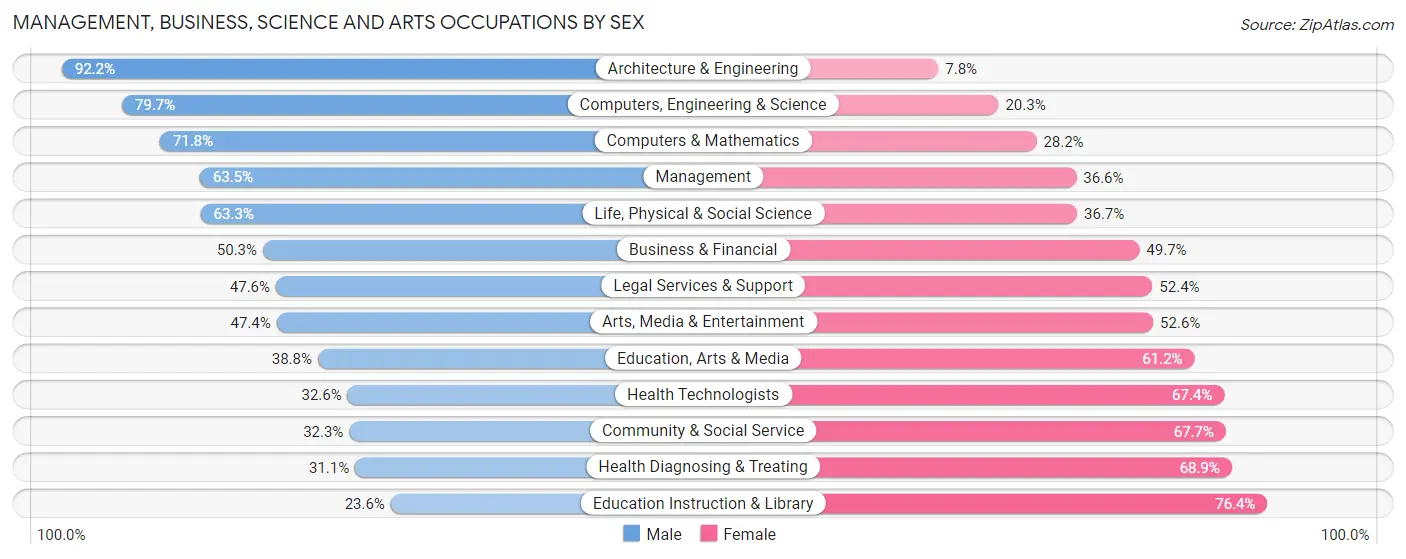
Management, Business, Science and Arts Occupations by Sex
Within the Management, Business, Science and Arts occupations in Santa Rosa County, the most male-oriented occupations are Architecture & Engineering (92.2%), Computers, Engineering & Science (79.7%), and Computers & Mathematics (71.8%), while the most female-oriented occupations are Education Instruction & Library (76.4%), Health Diagnosing & Treating (68.9%), and Community & Social Service (67.7%).
| Occupation | Male | Female |
| Management | 4,947 (63.4%) | 2,850 (36.5%) |
| Business & Financial | 1,953 (50.3%) | 1,930 (49.7%) |
| Computers, Engineering & Science | 4,665 (79.7%) | 1,188 (20.3%) |
| Computers & Mathematics | 2,132 (71.8%) | 838 (28.2%) |
| Architecture & Engineering | 2,257 (92.2%) | 190 (7.8%) |
| Life, Physical & Social Science | 276 (63.3%) | 160 (36.7%) |
| Community & Social Service | 2,386 (32.3%) | 5,003 (67.7%) |
| Education, Arts & Media | 537 (38.8%) | 846 (61.2%) |
| Legal Services & Support | 375 (47.6%) | 413 (52.4%) |
| Education Instruction & Library | 994 (23.6%) | 3,212 (76.4%) |
| Arts, Media & Entertainment | 480 (47.4%) | 532 (52.6%) |
| Health Diagnosing & Treating | 2,213 (31.1%) | 4,913 (68.9%) |
| Health Technologists | 1,559 (32.6%) | 3,219 (67.4%) |
| Total (Category) | 16,164 (50.4%) | 15,884 (49.6%) |
| Total (Overall) | 43,810 (54.1%) | 37,140 (45.9%) |
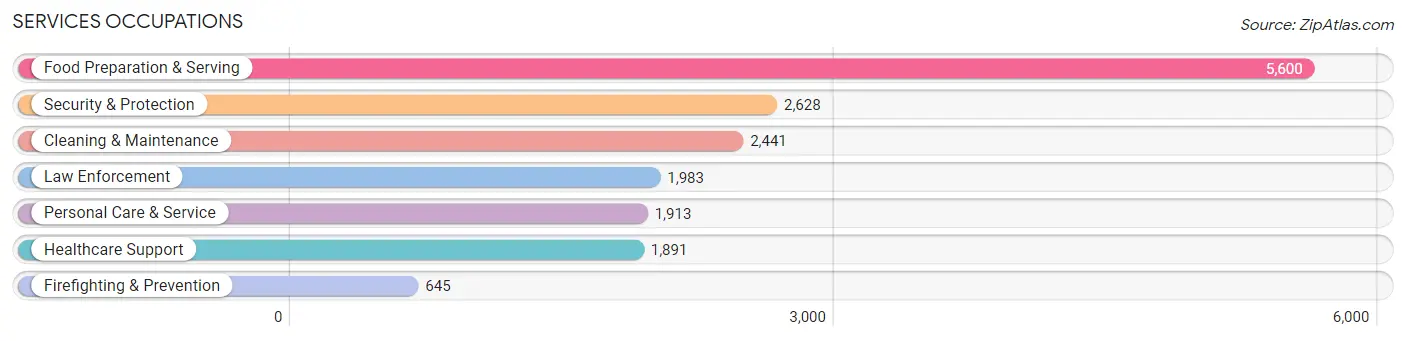
Services Occupations
The most common Services occupations in Santa Rosa County are Food Preparation & Serving (5,600 | 6.9%), Security & Protection (2,628 | 3.3%), Cleaning & Maintenance (2,441 | 3.0%), Law Enforcement (1,983 | 2.5%), and Personal Care & Service (1,913 | 2.4%).
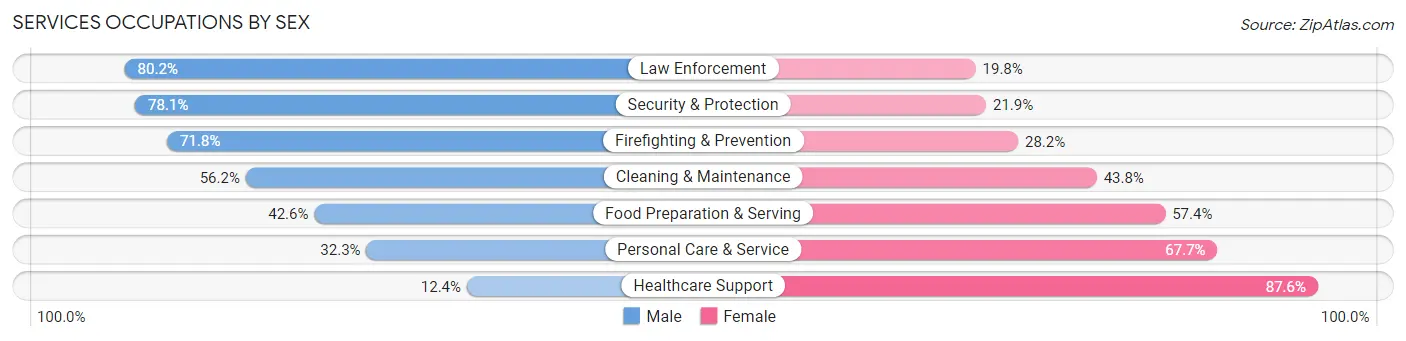
Services Occupations by Sex
Within the Services occupations in Santa Rosa County, the most male-oriented occupations are Law Enforcement (80.2%), Security & Protection (78.1%), and Firefighting & Prevention (71.8%), while the most female-oriented occupations are Healthcare Support (87.6%), Personal Care & Service (67.7%), and Food Preparation & Serving (57.4%).
| Occupation | Male | Female |
| Healthcare Support | 235 (12.4%) | 1,656 (87.6%) |
| Security & Protection | 2,053 (78.1%) | 575 (21.9%) |
| Firefighting & Prevention | 463 (71.8%) | 182 (28.2%) |
| Law Enforcement | 1,590 (80.2%) | 393 (19.8%) |
| Food Preparation & Serving | 2,388 (42.6%) | 3,212 (57.4%) |
| Cleaning & Maintenance | 1,372 (56.2%) | 1,069 (43.8%) |
| Personal Care & Service | 618 (32.3%) | 1,295 (67.7%) |
| Total (Category) | 6,666 (46.1%) | 7,807 (53.9%) |
| Total (Overall) | 43,810 (54.1%) | 37,140 (45.9%) |
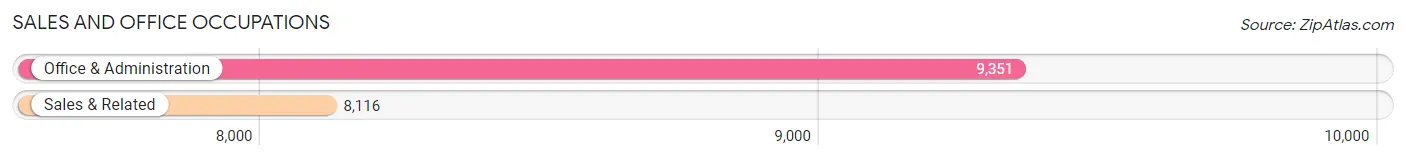
Sales and Office Occupations
The most common Sales and Office occupations in Santa Rosa County are Office & Administration (9,351 | 11.6%), and Sales & Related (8,116 | 10.0%).
Sales and Office Occupations by Sex
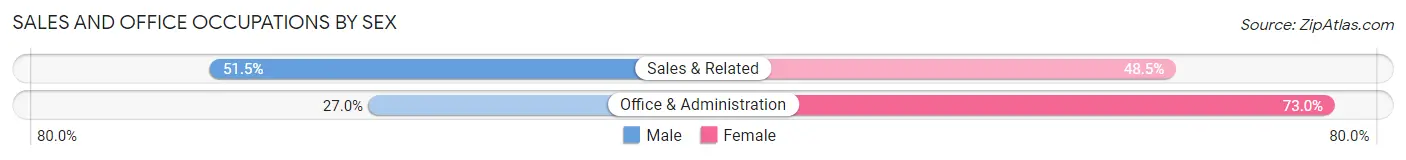
| Occupation | Male | Female |
| Sales & Related | 4,177 (51.5%) | 3,939 (48.5%) |
| Office & Administration | 2,528 (27.0%) | 6,823 (73.0%) |
| Total (Category) | 6,705 (38.4%) | 10,762 (61.6%) |
| Total (Overall) | 43,810 (54.1%) | 37,140 (45.9%) |
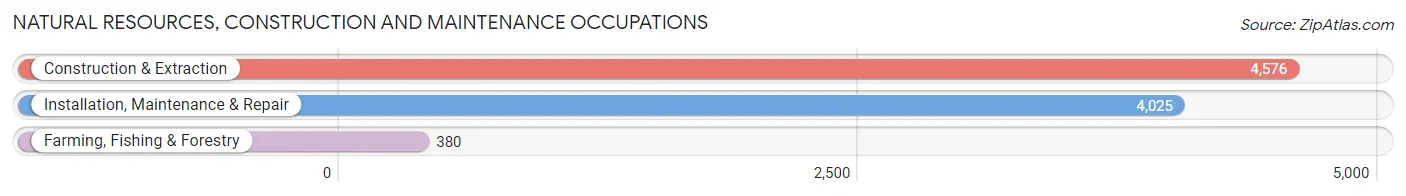
Natural Resources, Construction and Maintenance Occupations
The most common Natural Resources, Construction and Maintenance occupations in Santa Rosa County are Construction & Extraction (4,576 | 5.7%), Installation, Maintenance & Repair (4,025 | 5.0%), and Farming, Fishing & Forestry (380 | 0.5%).
Natural Resources, Construction and Maintenance Occupations by Sex
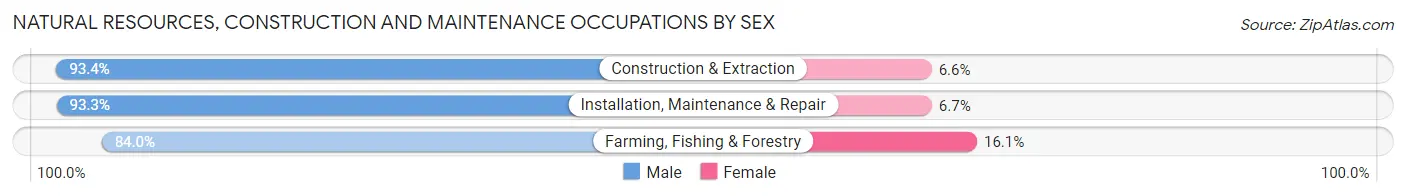
| Occupation | Male | Female |
| Farming, Fishing & Forestry | 319 (84.0%) | 61 (16.1%) |
| Construction & Extraction | 4,273 (93.4%) | 303 (6.6%) |
| Installation, Maintenance & Repair | 3,757 (93.3%) | 268 (6.7%) |
| Total (Category) | 8,349 (93.0%) | 632 (7.0%) |
| Total (Overall) | 43,810 (54.1%) | 37,140 (45.9%) |
Production, Transportation and Moving Occupations
The most common Production, Transportation and Moving occupations in Santa Rosa County are Transportation (3,488 | 4.3%), Production (2,276 | 2.8%), and Material Moving (2,217 | 2.7%).
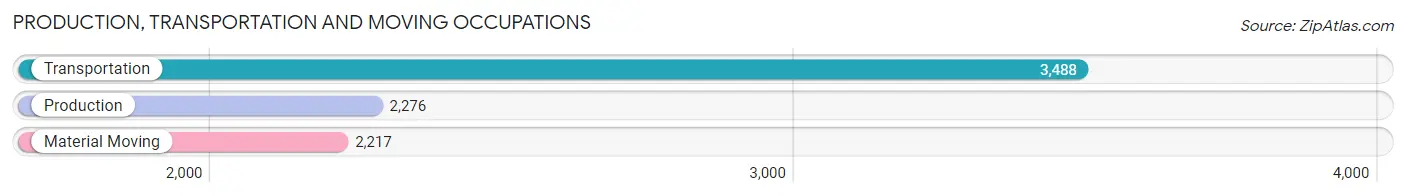
Production, Transportation and Moving Occupations by Sex
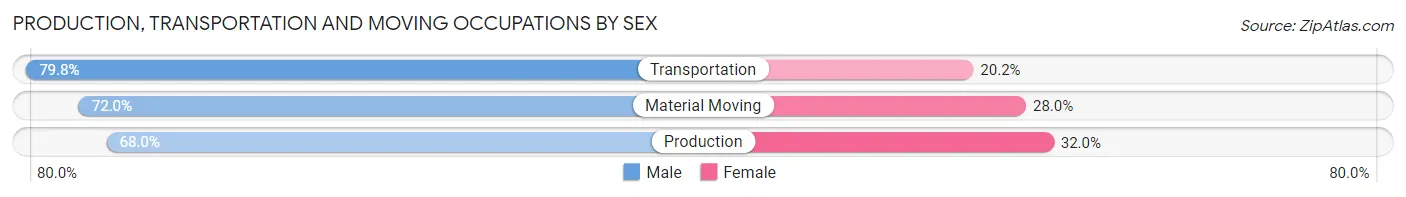
| Occupation | Male | Female |
| Production | 1,547 (68.0%) | 729 (32.0%) |
| Transportation | 2,782 (79.8%) | 706 (20.2%) |
| Material Moving | 1,597 (72.0%) | 620 (28.0%) |
| Total (Category) | 5,926 (74.3%) | 2,055 (25.8%) |
| Total (Overall) | 43,810 (54.1%) | 37,140 (45.9%) |
Employment Industries by Sex in Santa Rosa County
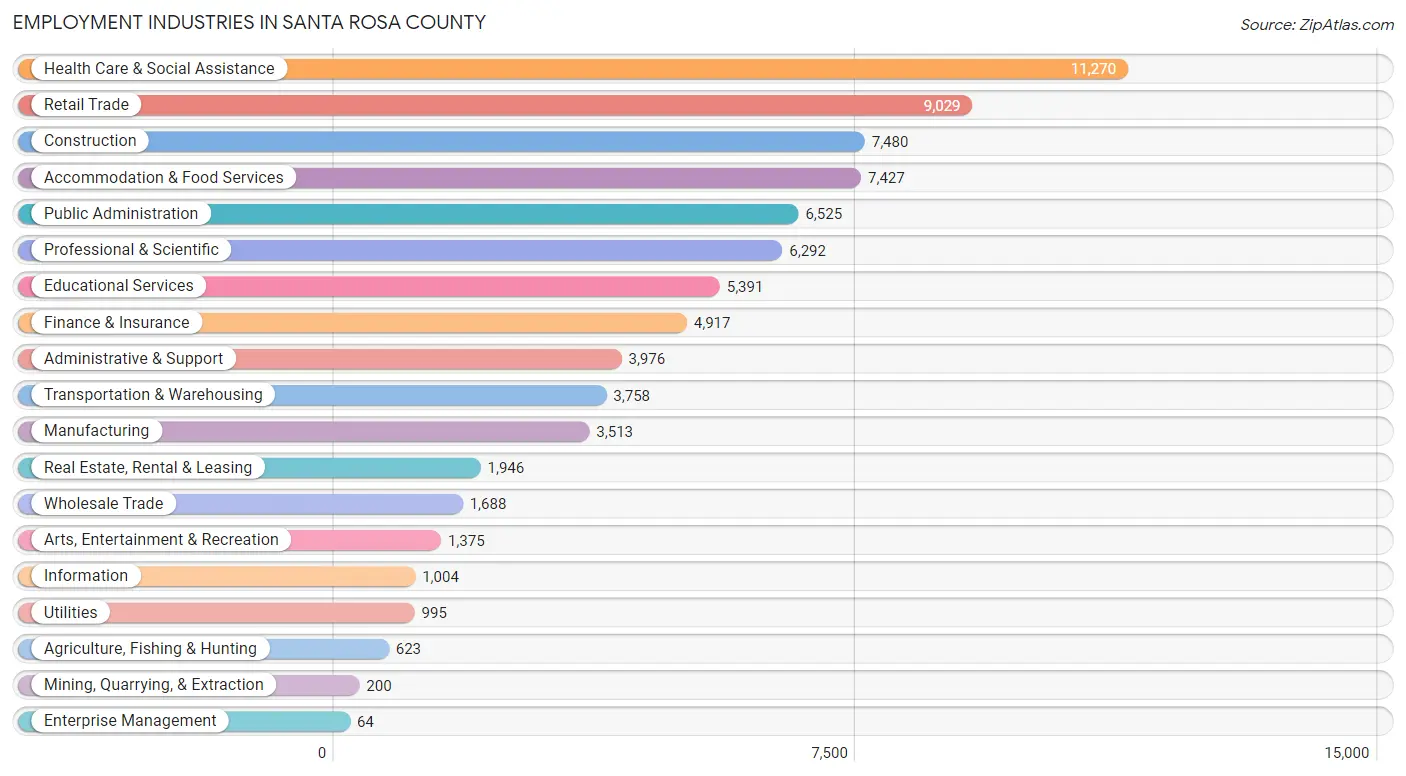
Employment Industries in Santa Rosa County
The major employment industries in Santa Rosa County include Health Care & Social Assistance (11,270 | 13.9%), Retail Trade (9,029 | 11.2%), Construction (7,480 | 9.2%), Accommodation & Food Services (7,427 | 9.2%), and Public Administration (6,525 | 8.1%).
Employment Industries by Sex in Santa Rosa County
The Santa Rosa County industries that see more men than women are Mining, Quarrying, & Extraction (100.0%), Construction (89.2%), and Utilities (84.6%), whereas the industries that tend to have a higher number of women are Enterprise Management (84.4%), Health Care & Social Assistance (77.6%), and Educational Services (74.4%).
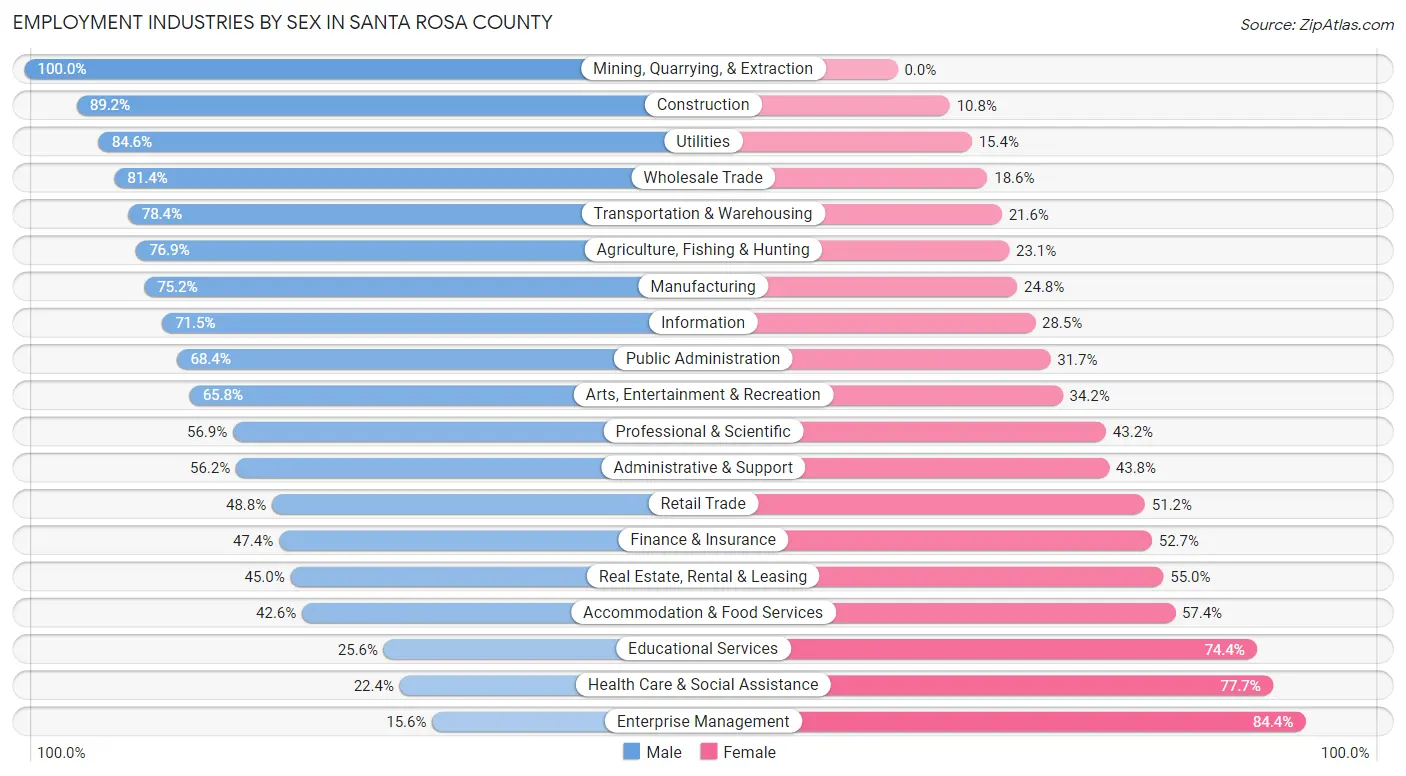
| Industry | Male | Female |
| Agriculture, Fishing & Hunting | 479 (76.9%) | 144 (23.1%) |
| Mining, Quarrying, & Extraction | 200 (100.0%) | 0 (0.0%) |
| Construction | 6,670 (89.2%) | 810 (10.8%) |
| Manufacturing | 2,643 (75.2%) | 870 (24.8%) |
| Wholesale Trade | 1,374 (81.4%) | 314 (18.6%) |
| Retail Trade | 4,404 (48.8%) | 4,625 (51.2%) |
| Transportation & Warehousing | 2,947 (78.4%) | 811 (21.6%) |
| Utilities | 842 (84.6%) | 153 (15.4%) |
| Information | 718 (71.5%) | 286 (28.5%) |
| Finance & Insurance | 2,328 (47.3%) | 2,589 (52.6%) |
| Real Estate, Rental & Leasing | 875 (45.0%) | 1,071 (55.0%) |
| Professional & Scientific | 3,577 (56.9%) | 2,715 (43.1%) |
| Enterprise Management | 10 (15.6%) | 54 (84.4%) |
| Administrative & Support | 2,236 (56.2%) | 1,740 (43.8%) |
| Educational Services | 1,382 (25.6%) | 4,009 (74.4%) |
| Health Care & Social Assistance | 2,519 (22.4%) | 8,751 (77.6%) |
| Arts, Entertainment & Recreation | 905 (65.8%) | 470 (34.2%) |
| Accommodation & Food Services | 3,161 (42.6%) | 4,266 (57.4%) |
| Public Administration | 4,460 (68.3%) | 2,065 (31.7%) |
| Total | 43,810 (54.1%) | 37,140 (45.9%) |
Education in Santa Rosa County
School Enrollment in Santa Rosa County
The most common levels of schooling among the 42,754 students in Santa Rosa County are high school (9,872 | 23.1%), middle school (9,642 | 22.6%), and elementary school (8,952 | 20.9%).
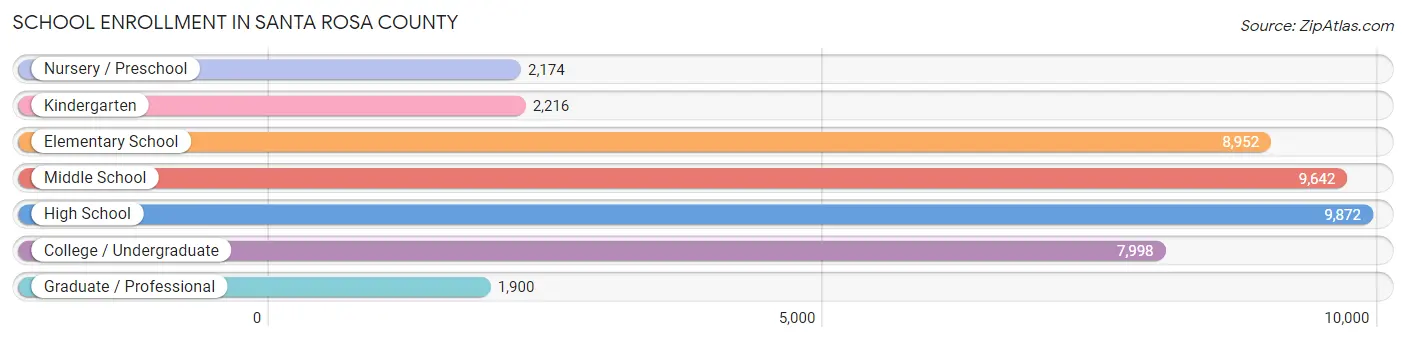
| School Level | # Students | % Students |
| Nursery / Preschool | 2,174 | 5.1% |
| Kindergarten | 2,216 | 5.2% |
| Elementary School | 8,952 | 20.9% |
| Middle School | 9,642 | 22.6% |
| High School | 9,872 | 23.1% |
| College / Undergraduate | 7,998 | 18.7% |
| Graduate / Professional | 1,900 | 4.4% |
| Total | 42,754 | 100.0% |
School Enrollment by Age by Funding Source in Santa Rosa County
Out of a total of 42,754 students who are enrolled in schools in Santa Rosa County, 7,183 (16.8%) attend a private institution, while the remaining 35,571 (83.2%) are enrolled in public schools. The age group of 3 to 4 year olds has the highest likelihood of being enrolled in private schools, with 891 (62.5% in the age bracket) enrolled. Conversely, the age group of 15 to 17 year olds has the lowest likelihood of being enrolled in a private school, with 6,574 (92.1% in the age bracket) attending a public institution.
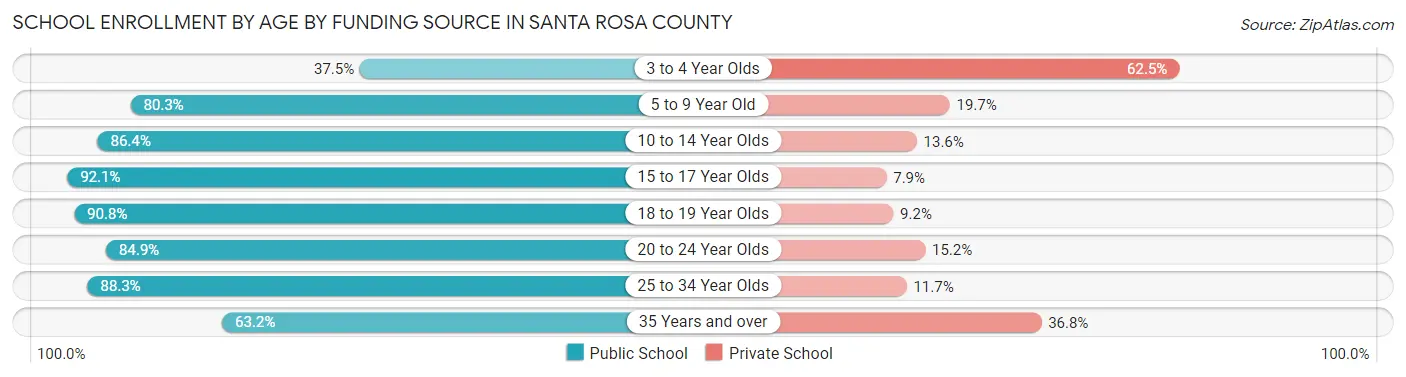
| Age Bracket | Public School | Private School |
| 3 to 4 Year Olds | 535 (37.5%) | 891 (62.5%) |
| 5 to 9 Year Old | 8,422 (80.3%) | 2,069 (19.7%) |
| 10 to 14 Year Olds | 10,660 (86.4%) | 1,676 (13.6%) |
| 15 to 17 Year Olds | 6,574 (92.1%) | 567 (7.9%) |
| 18 to 19 Year Olds | 2,049 (90.8%) | 208 (9.2%) |
| 20 to 24 Year Olds | 2,766 (84.9%) | 494 (15.1%) |
| 25 to 34 Year Olds | 2,997 (88.3%) | 397 (11.7%) |
| 35 Years and over | 1,548 (63.2%) | 901 (36.8%) |
| Total | 35,571 (83.2%) | 7,183 (16.8%) |
Educational Attainment by Field of Study in Santa Rosa County
Business (9,879 | 23.3%), science & technology (5,708 | 13.4%), education (4,885 | 11.5%), arts & humanities (3,830 | 9.0%), and engineering (2,647 | 6.2%) are the most common fields of study among 42,490 individuals in Santa Rosa County who have obtained a bachelor's degree or higher.
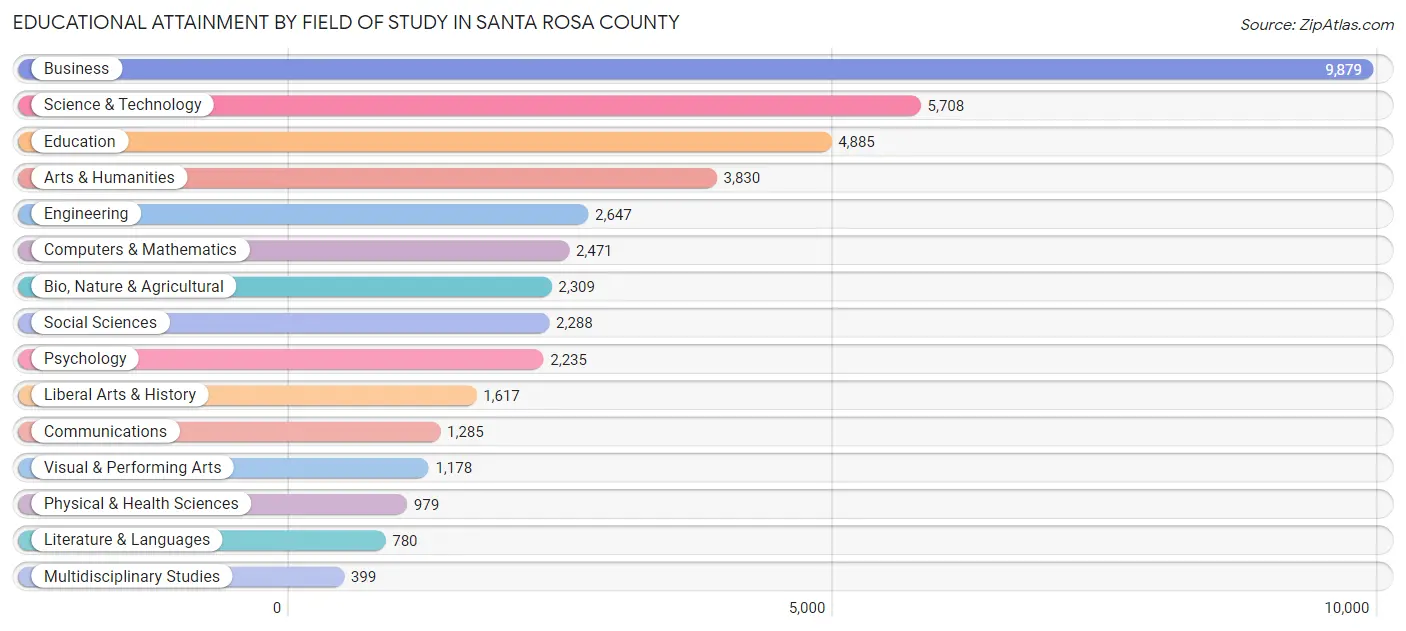
| Field of Study | # Graduates | % Graduates |
| Computers & Mathematics | 2,471 | 5.8% |
| Bio, Nature & Agricultural | 2,309 | 5.4% |
| Physical & Health Sciences | 979 | 2.3% |
| Psychology | 2,235 | 5.3% |
| Social Sciences | 2,288 | 5.4% |
| Engineering | 2,647 | 6.2% |
| Multidisciplinary Studies | 399 | 0.9% |
| Science & Technology | 5,708 | 13.4% |
| Business | 9,879 | 23.3% |
| Education | 4,885 | 11.5% |
| Literature & Languages | 780 | 1.8% |
| Liberal Arts & History | 1,617 | 3.8% |
| Visual & Performing Arts | 1,178 | 2.8% |
| Communications | 1,285 | 3.0% |
| Arts & Humanities | 3,830 | 9.0% |
| Total | 42,490 | 100.0% |
Transportation & Commute in Santa Rosa County
Vehicle Availability by Sex in Santa Rosa County
The most prevalent vehicle ownership categories in Santa Rosa County are males with 2 vehicles (22,194, accounting for 46.8%) and females with 2 vehicles (14,874, making up 61.1%).
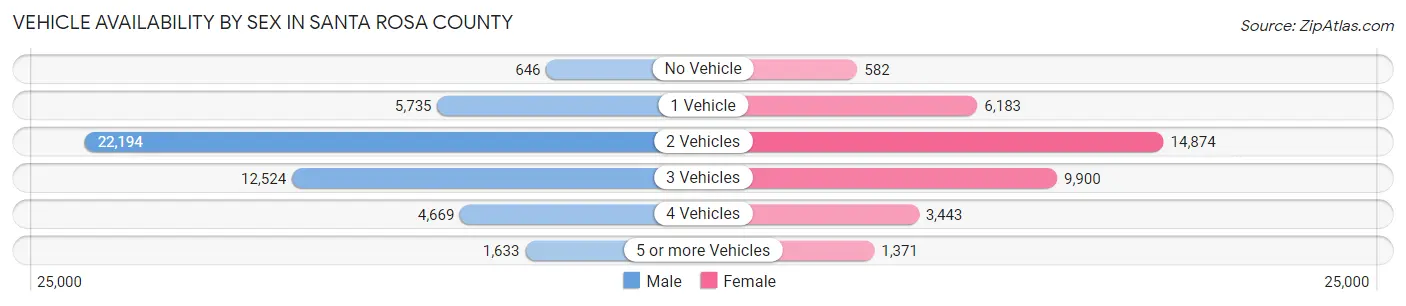
| Vehicles Available | Male | Female |
| No Vehicle | 646 (1.4%) | 582 (1.6%) |
| 1 Vehicle | 5,735 (12.1%) | 6,183 (17.0%) |
| 2 Vehicles | 22,194 (46.8%) | 14,874 (40.9%) |
| 3 Vehicles | 12,524 (26.4%) | 9,900 (27.2%) |
| 4 Vehicles | 4,669 (9.9%) | 3,443 (9.5%) |
| 5 or more Vehicles | 1,633 (3.5%) | 1,371 (3.8%) |
| Total | 47,401 (100.0%) | 36,353 (100.0%) |
Commute Time in Santa Rosa County
The most frequently occuring commute durations in Santa Rosa County are 30 to 34 minutes (13,419 commuters, 17.9%), 45 to 59 minutes (10,250 commuters, 13.7%), and 15 to 19 minutes (9,068 commuters, 12.1%).
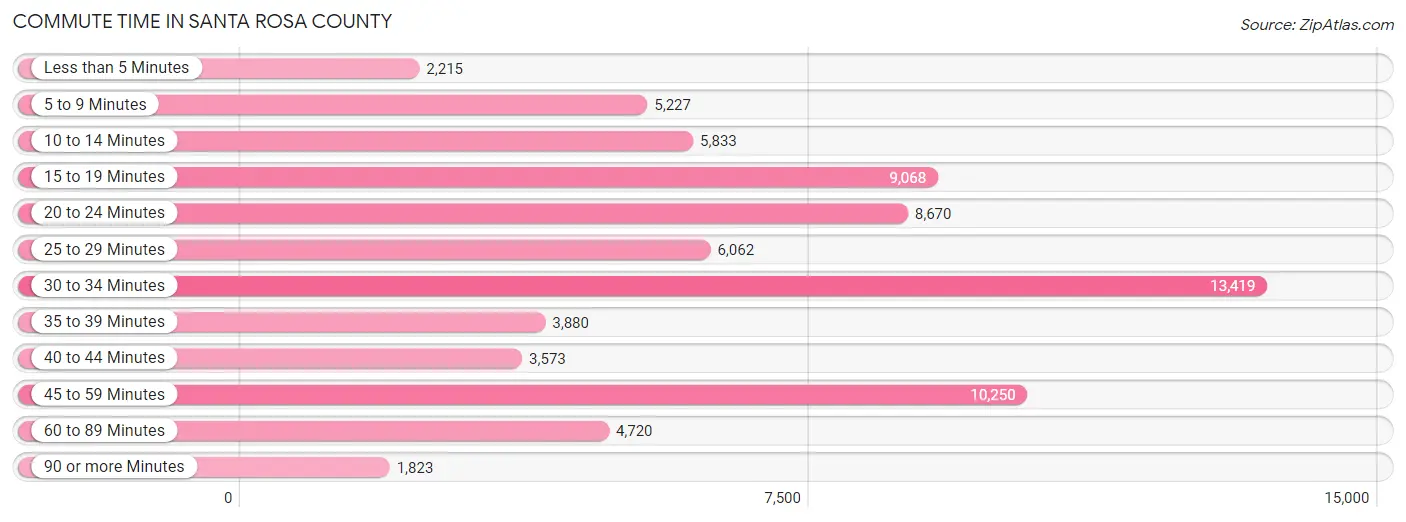
| Commute Time | # Commuters | % Commuters |
| Less than 5 Minutes | 2,215 | 3.0% |
| 5 to 9 Minutes | 5,227 | 7.0% |
| 10 to 14 Minutes | 5,833 | 7.8% |
| 15 to 19 Minutes | 9,068 | 12.1% |
| 20 to 24 Minutes | 8,670 | 11.6% |
| 25 to 29 Minutes | 6,062 | 8.1% |
| 30 to 34 Minutes | 13,419 | 17.9% |
| 35 to 39 Minutes | 3,880 | 5.2% |
| 40 to 44 Minutes | 3,573 | 4.8% |
| 45 to 59 Minutes | 10,250 | 13.7% |
| 60 to 89 Minutes | 4,720 | 6.3% |
| 90 or more Minutes | 1,823 | 2.4% |
Commute Time by Sex in Santa Rosa County
The most common commute times in Santa Rosa County are 30 to 34 minutes (8,332 commuters, 19.3%) for males and 30 to 34 minutes (5,087 commuters, 16.2%) for females.
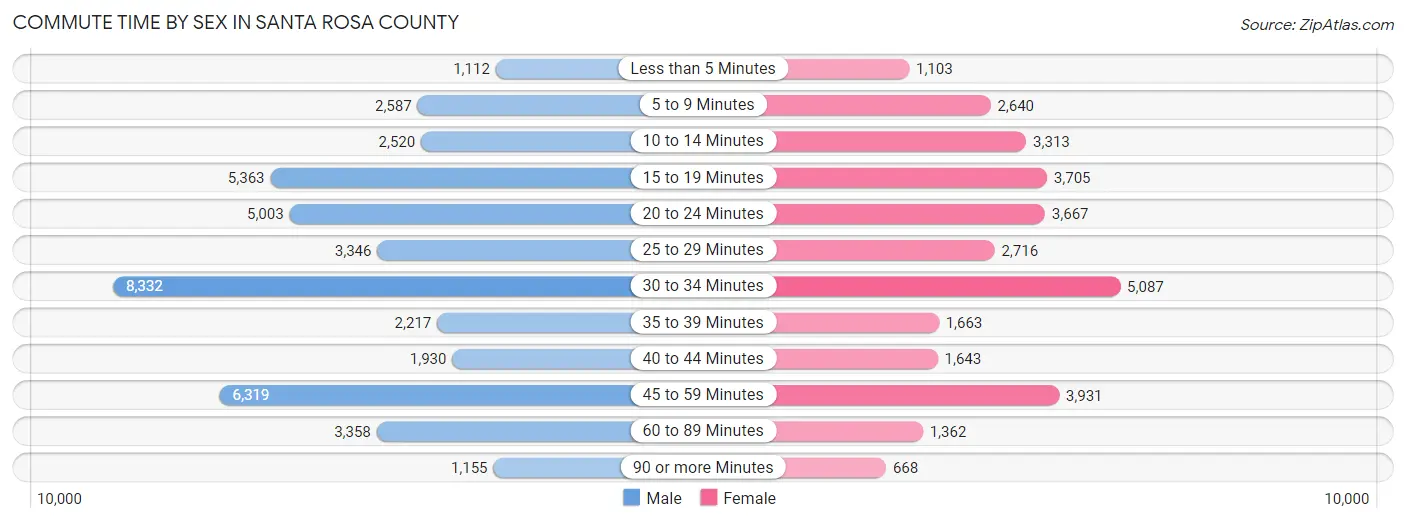
| Commute Time | Male | Female |
| Less than 5 Minutes | 1,112 (2.6%) | 1,103 (3.5%) |
| 5 to 9 Minutes | 2,587 (6.0%) | 2,640 (8.4%) |
| 10 to 14 Minutes | 2,520 (5.8%) | 3,313 (10.5%) |
| 15 to 19 Minutes | 5,363 (12.4%) | 3,705 (11.8%) |
| 20 to 24 Minutes | 5,003 (11.6%) | 3,667 (11.6%) |
| 25 to 29 Minutes | 3,346 (7.7%) | 2,716 (8.6%) |
| 30 to 34 Minutes | 8,332 (19.3%) | 5,087 (16.2%) |
| 35 to 39 Minutes | 2,217 (5.1%) | 1,663 (5.3%) |
| 40 to 44 Minutes | 1,930 (4.5%) | 1,643 (5.2%) |
| 45 to 59 Minutes | 6,319 (14.6%) | 3,931 (12.5%) |
| 60 to 89 Minutes | 3,358 (7.8%) | 1,362 (4.3%) |
| 90 or more Minutes | 1,155 (2.7%) | 668 (2.1%) |
Time of Departure to Work by Sex in Santa Rosa County
The most frequent times of departure to work in Santa Rosa County are 7:00 AM to 7:29 AM (6,450, 14.9%) for males and 7:00 AM to 7:29 AM (5,031, 16.0%) for females.
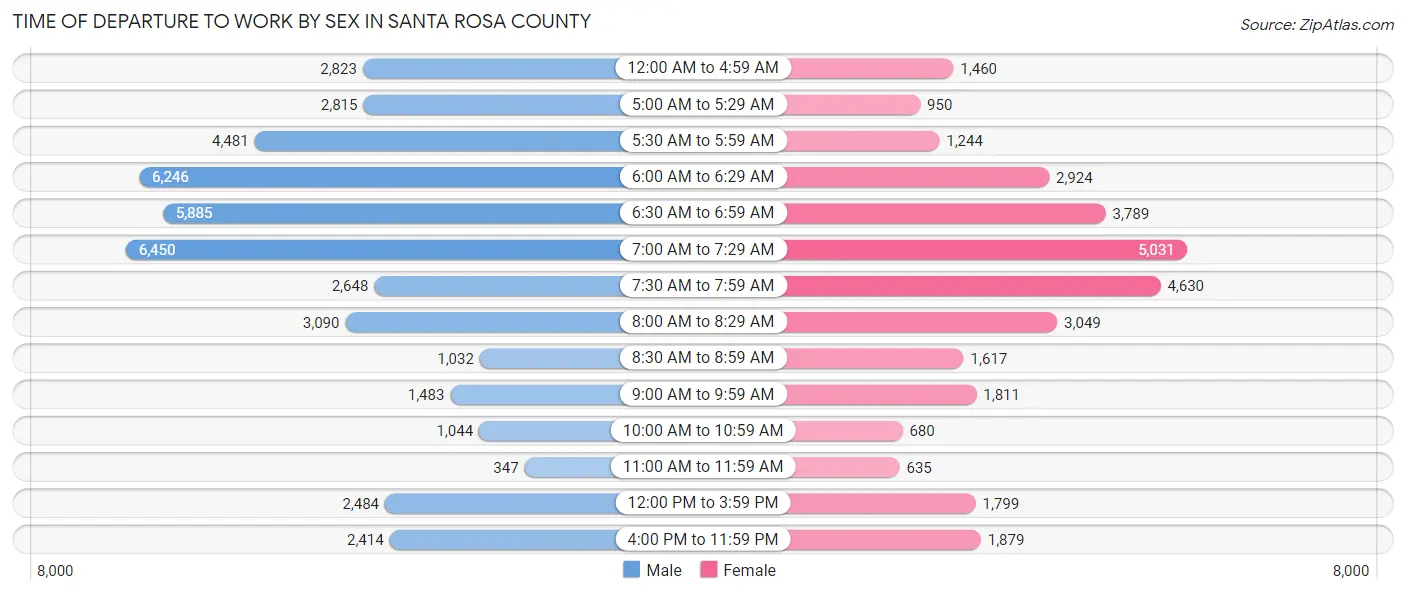
| Time of Departure | Male | Female |
| 12:00 AM to 4:59 AM | 2,823 (6.5%) | 1,460 (4.6%) |
| 5:00 AM to 5:29 AM | 2,815 (6.5%) | 950 (3.0%) |
| 5:30 AM to 5:59 AM | 4,481 (10.4%) | 1,244 (4.0%) |
| 6:00 AM to 6:29 AM | 6,246 (14.4%) | 2,924 (9.3%) |
| 6:30 AM to 6:59 AM | 5,885 (13.6%) | 3,789 (12.0%) |
| 7:00 AM to 7:29 AM | 6,450 (14.9%) | 5,031 (16.0%) |
| 7:30 AM to 7:59 AM | 2,648 (6.1%) | 4,630 (14.7%) |
| 8:00 AM to 8:29 AM | 3,090 (7.1%) | 3,049 (9.7%) |
| 8:30 AM to 8:59 AM | 1,032 (2.4%) | 1,617 (5.1%) |
| 9:00 AM to 9:59 AM | 1,483 (3.4%) | 1,811 (5.8%) |
| 10:00 AM to 10:59 AM | 1,044 (2.4%) | 680 (2.2%) |
| 11:00 AM to 11:59 AM | 347 (0.8%) | 635 (2.0%) |
| 12:00 PM to 3:59 PM | 2,484 (5.7%) | 1,799 (5.7%) |
| 4:00 PM to 11:59 PM | 2,414 (5.6%) | 1,879 (6.0%) |
| Total | 43,242 (100.0%) | 31,498 (100.0%) |
Housing Occupancy in Santa Rosa County
Occupancy by Ownership in Santa Rosa County
Of the total 69,524 dwellings in Santa Rosa County, owner-occupied units account for 54,478 (78.4%), while renter-occupied units make up 15,046 (21.6%).
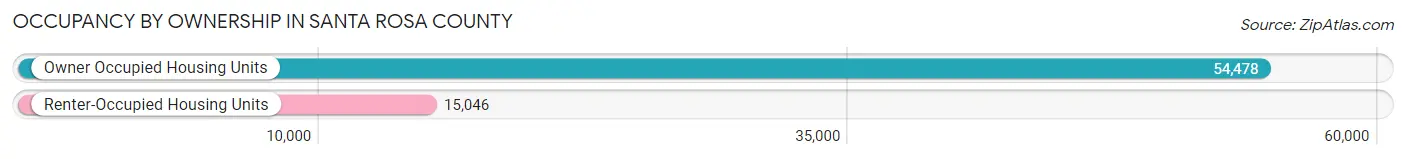
| Occupancy | # Housing Units | % Housing Units |
| Owner Occupied Housing Units | 54,478 | 78.4% |
| Renter-Occupied Housing Units | 15,046 | 21.6% |
| Total Occupied Housing Units | 69,524 | 100.0% |
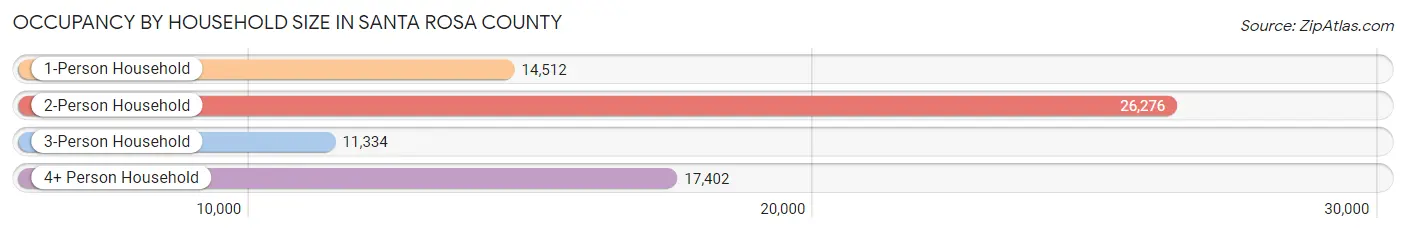
Occupancy by Household Size in Santa Rosa County
| Household Size | # Housing Units | % Housing Units |
| 1-Person Household | 14,512 | 20.9% |
| 2-Person Household | 26,276 | 37.8% |
| 3-Person Household | 11,334 | 16.3% |
| 4+ Person Household | 17,402 | 25.0% |
| Total Housing Units | 69,524 | 100.0% |
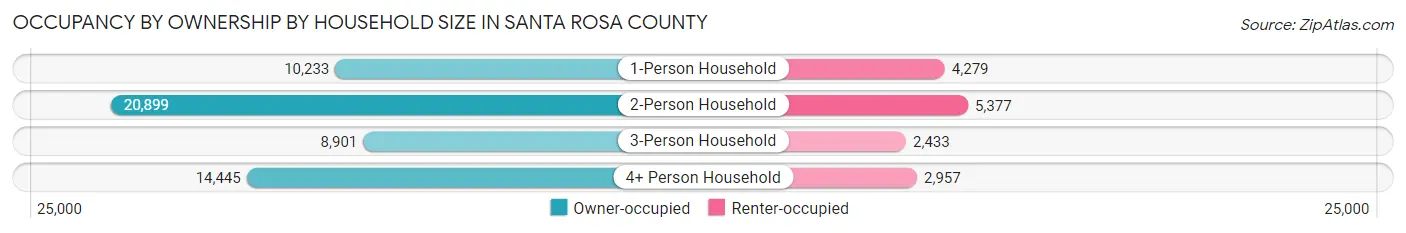
Occupancy by Ownership by Household Size in Santa Rosa County
| Household Size | Owner-occupied | Renter-occupied |
| 1-Person Household | 10,233 (70.5%) | 4,279 (29.5%) |
| 2-Person Household | 20,899 (79.5%) | 5,377 (20.5%) |
| 3-Person Household | 8,901 (78.5%) | 2,433 (21.5%) |
| 4+ Person Household | 14,445 (83.0%) | 2,957 (17.0%) |
| Total Housing Units | 54,478 (78.4%) | 15,046 (21.6%) |
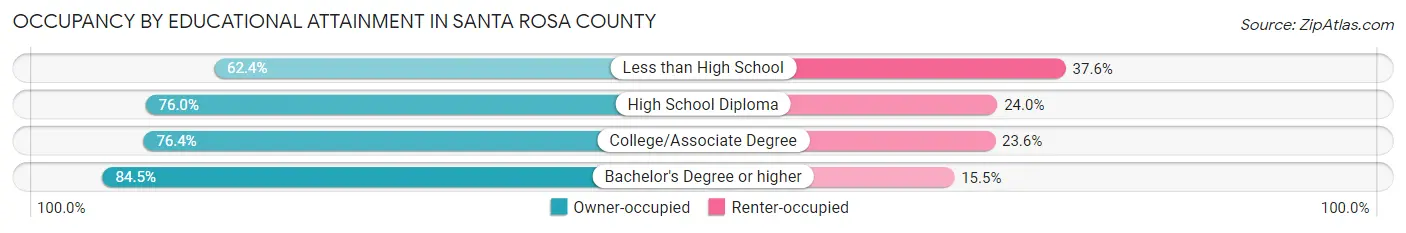
Occupancy by Educational Attainment in Santa Rosa County
| Household Size | Owner-occupied | Renter-occupied |
| Less than High School | 2,351 (62.4%) | 1,415 (37.6%) |
| High School Diploma | 11,344 (76.0%) | 3,583 (24.0%) |
| College/Associate Degree | 20,591 (76.4%) | 6,351 (23.6%) |
| Bachelor's Degree or higher | 20,192 (84.5%) | 3,697 (15.5%) |
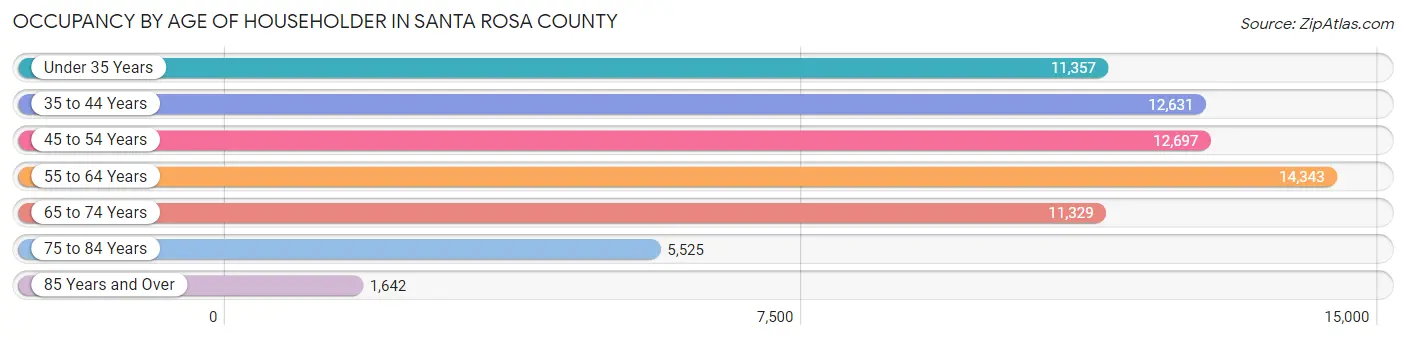
Occupancy by Age of Householder in Santa Rosa County
| Age Bracket | # Households | % Households |
| Under 35 Years | 11,357 | 16.3% |
| 35 to 44 Years | 12,631 | 18.2% |
| 45 to 54 Years | 12,697 | 18.3% |
| 55 to 64 Years | 14,343 | 20.6% |
| 65 to 74 Years | 11,329 | 16.3% |
| 75 to 84 Years | 5,525 | 8.0% |
| 85 Years and Over | 1,642 | 2.4% |
| Total | 69,524 | 100.0% |
Housing Finances in Santa Rosa County
Median Income by Occupancy in Santa Rosa County
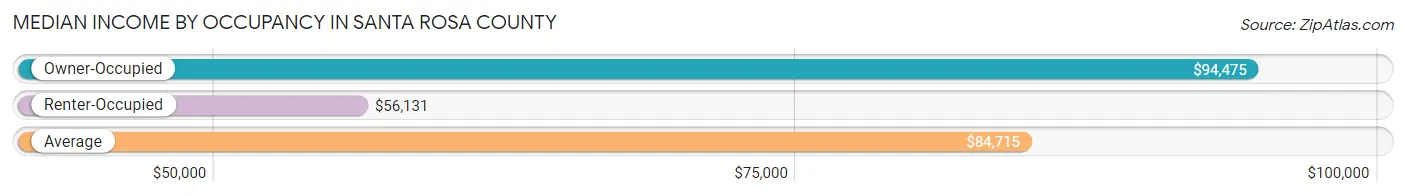
| Occupancy Type | # Households | Median Income |
| Owner-Occupied | 54,478 (78.4%) | $94,475 |
| Renter-Occupied | 15,046 (21.6%) | $56,131 |
| Average | 69,524 (100.0%) | $84,715 |
Occupancy by Householder Income Bracket in Santa Rosa County
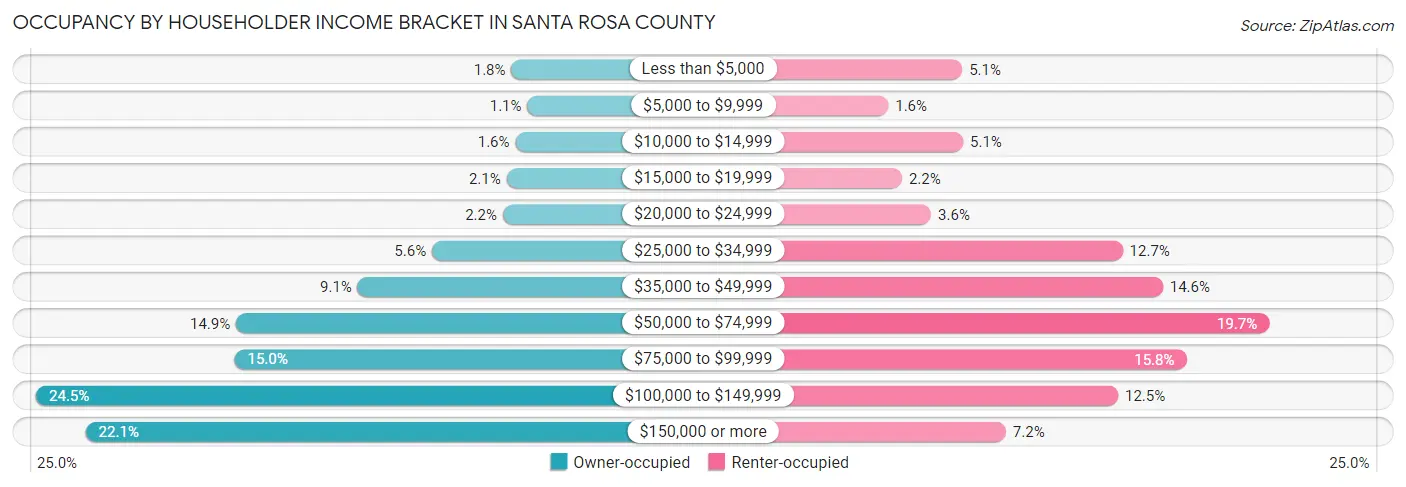
| Income Bracket | Owner-occupied | Renter-occupied |
| Less than $5,000 | 990 (1.8%) | 765 (5.1%) |
| $5,000 to $9,999 | 575 (1.1%) | 234 (1.6%) |
| $10,000 to $14,999 | 888 (1.6%) | 770 (5.1%) |
| $15,000 to $19,999 | 1,116 (2.1%) | 332 (2.2%) |
| $20,000 to $24,999 | 1,217 (2.2%) | 541 (3.6%) |
| $25,000 to $34,999 | 3,053 (5.6%) | 1,914 (12.7%) |
| $35,000 to $49,999 | 4,979 (9.1%) | 2,201 (14.6%) |
| $50,000 to $74,999 | 8,135 (14.9%) | 2,963 (19.7%) |
| $75,000 to $99,999 | 8,169 (15.0%) | 2,369 (15.8%) |
| $100,000 to $149,999 | 13,321 (24.4%) | 1,880 (12.5%) |
| $150,000 or more | 12,035 (22.1%) | 1,077 (7.2%) |
| Total | 54,478 (100.0%) | 15,046 (100.0%) |
Monthly Housing Cost Tiers in Santa Rosa County
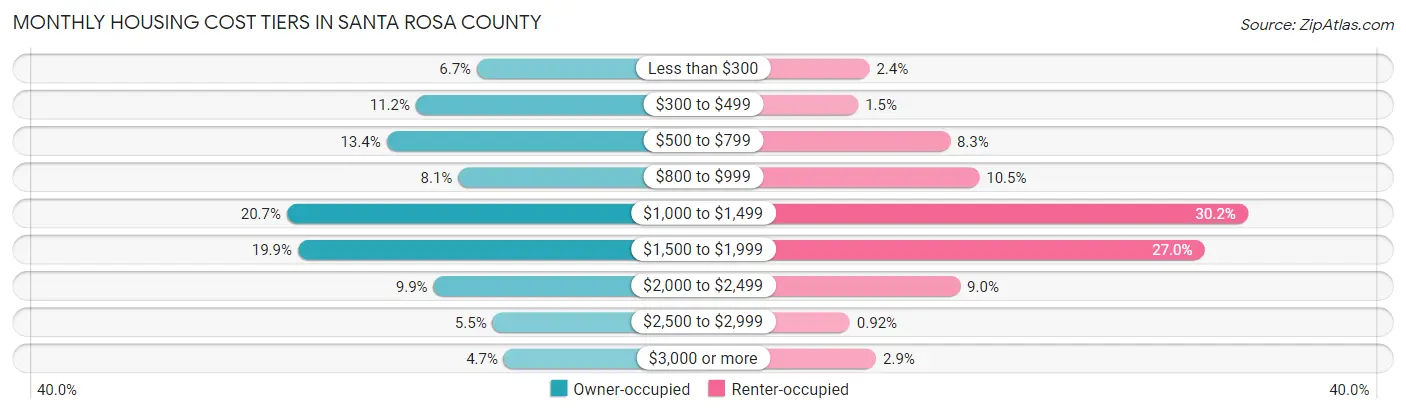
| Monthly Cost | Owner-occupied | Renter-occupied |
| Less than $300 | 3,642 (6.7%) | 355 (2.4%) |
| $300 to $499 | 6,096 (11.2%) | 230 (1.5%) |
| $500 to $799 | 7,275 (13.4%) | 1,248 (8.3%) |
| $800 to $999 | 4,396 (8.1%) | 1,572 (10.4%) |
| $1,000 to $1,499 | 11,269 (20.7%) | 4,546 (30.2%) |
| $1,500 to $1,999 | 10,832 (19.9%) | 4,065 (27.0%) |
| $2,000 to $2,499 | 5,388 (9.9%) | 1,360 (9.0%) |
| $2,500 to $2,999 | 3,016 (5.5%) | 138 (0.9%) |
| $3,000 or more | 2,564 (4.7%) | 429 (2.9%) |
| Total | 54,478 (100.0%) | 15,046 (100.0%) |
Physical Housing Characteristics in Santa Rosa County
Housing Structures in Santa Rosa County
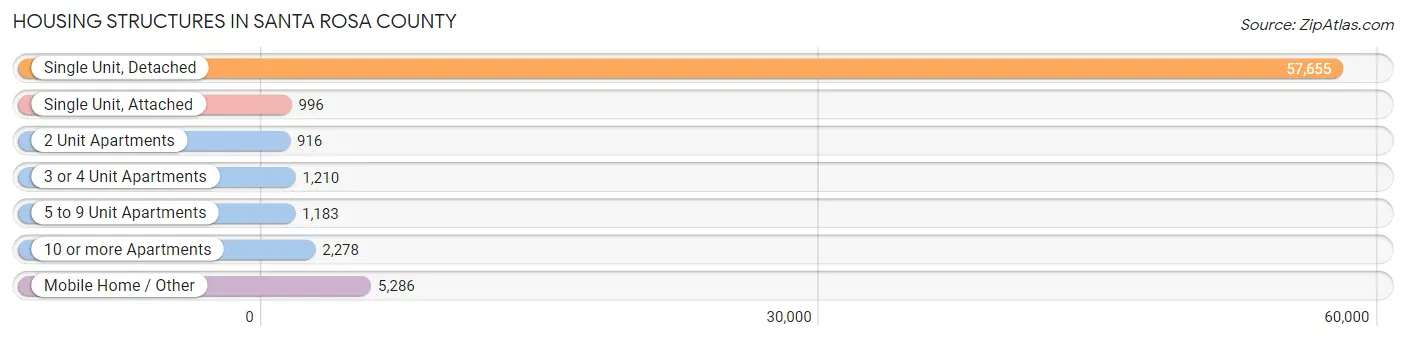
| Structure Type | # Housing Units | % Housing Units |
| Single Unit, Detached | 57,655 | 82.9% |
| Single Unit, Attached | 996 | 1.4% |
| 2 Unit Apartments | 916 | 1.3% |
| 3 or 4 Unit Apartments | 1,210 | 1.7% |
| 5 to 9 Unit Apartments | 1,183 | 1.7% |
| 10 or more Apartments | 2,278 | 3.3% |
| Mobile Home / Other | 5,286 | 7.6% |
| Total | 69,524 | 100.0% |
Housing Structures by Occupancy in Santa Rosa County
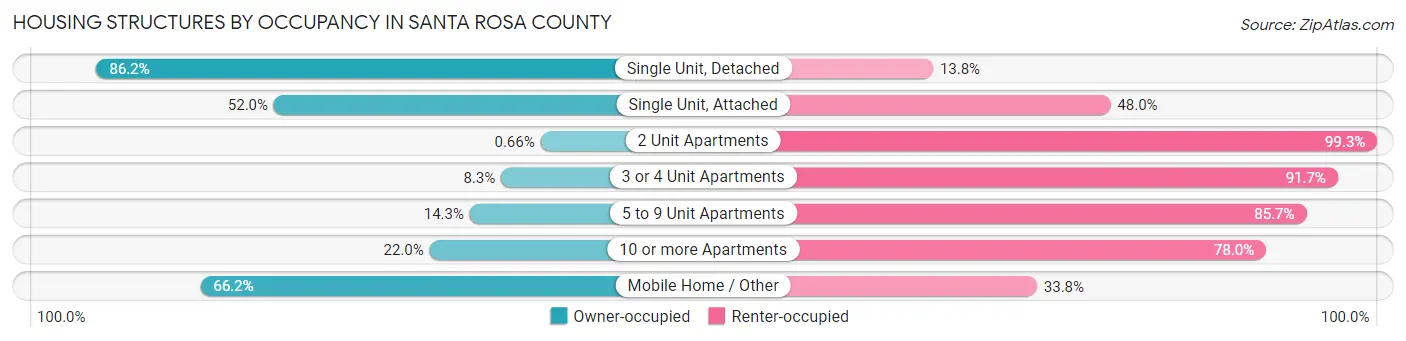
| Structure Type | Owner-occupied | Renter-occupied |
| Single Unit, Detached | 49,685 (86.2%) | 7,970 (13.8%) |
| Single Unit, Attached | 518 (52.0%) | 478 (48.0%) |
| 2 Unit Apartments | 6 (0.7%) | 910 (99.3%) |
| 3 or 4 Unit Apartments | 100 (8.3%) | 1,110 (91.7%) |
| 5 to 9 Unit Apartments | 169 (14.3%) | 1,014 (85.7%) |
| 10 or more Apartments | 502 (22.0%) | 1,776 (78.0%) |
| Mobile Home / Other | 3,498 (66.2%) | 1,788 (33.8%) |
| Total | 54,478 (78.4%) | 15,046 (21.6%) |
Housing Structures by Number of Rooms in Santa Rosa County
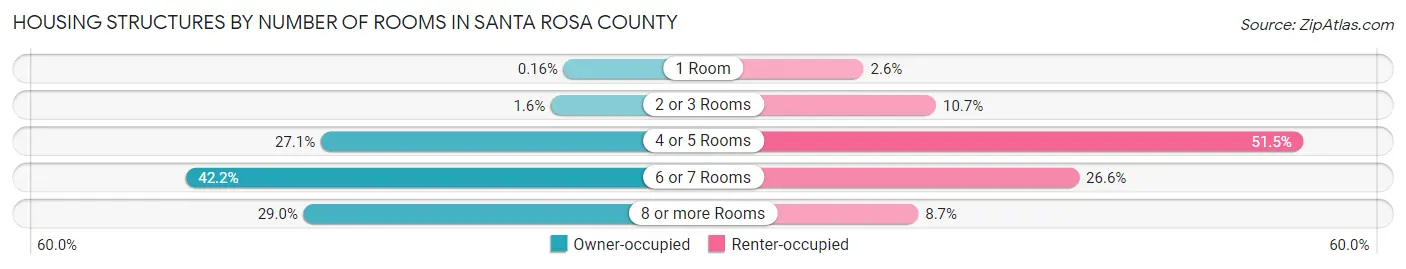
| Number of Rooms | Owner-occupied | Renter-occupied |
| 1 Room | 87 (0.2%) | 395 (2.6%) |
| 2 or 3 Rooms | 853 (1.6%) | 1,605 (10.7%) |
| 4 or 5 Rooms | 14,762 (27.1%) | 7,742 (51.5%) |
| 6 or 7 Rooms | 22,969 (42.2%) | 3,995 (26.6%) |
| 8 or more Rooms | 15,807 (29.0%) | 1,309 (8.7%) |
| Total | 54,478 (100.0%) | 15,046 (100.0%) |
Housing Structure by Heating Type in Santa Rosa County
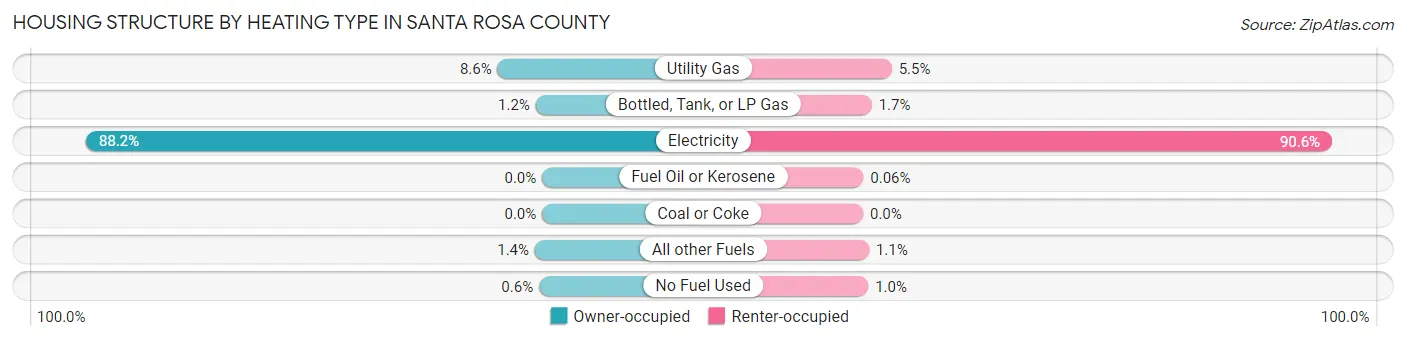
| Heating Type | Owner-occupied | Renter-occupied |
| Utility Gas | 4,689 (8.6%) | 834 (5.5%) |
| Bottled, Tank, or LP Gas | 673 (1.2%) | 251 (1.7%) |
| Electricity | 48,027 (88.2%) | 13,631 (90.6%) |
| Fuel Oil or Kerosene | 0 (0.0%) | 9 (0.1%) |
| Coal or Coke | 0 (0.0%) | 0 (0.0%) |
| All other Fuels | 764 (1.4%) | 171 (1.1%) |
| No Fuel Used | 325 (0.6%) | 150 (1.0%) |
| Total | 54,478 (100.0%) | 15,046 (100.0%) |
Household Vehicle Usage in Santa Rosa County
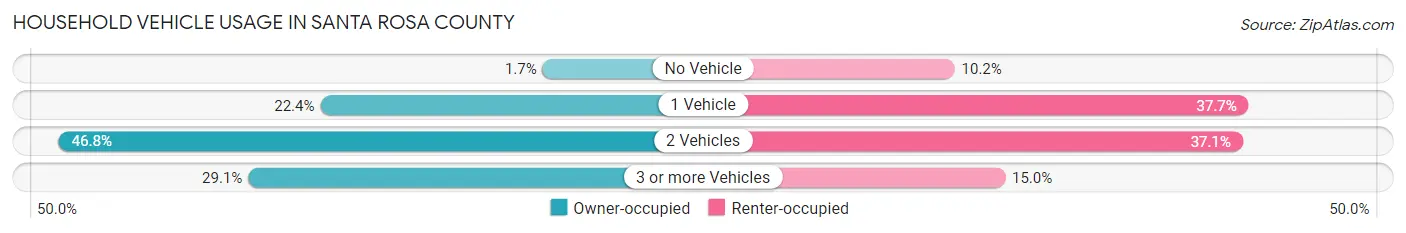
| Vehicles per Household | Owner-occupied | Renter-occupied |
| No Vehicle | 899 (1.7%) | 1,540 (10.2%) |
| 1 Vehicle | 12,203 (22.4%) | 5,670 (37.7%) |
| 2 Vehicles | 25,507 (46.8%) | 5,586 (37.1%) |
| 3 or more Vehicles | 15,869 (29.1%) | 2,250 (14.9%) |
| Total | 54,478 (100.0%) | 15,046 (100.0%) |
Real Estate & Mortgages in Santa Rosa County
Real Estate and Mortgage Overview in Santa Rosa County
| Characteristic | Without Mortgage | With Mortgage |
| Housing Units | 19,147 | 35,331 |
| Median Property Value | $242,400 | $287,200 |
| Median Household Income | $72,427 | $8,887 |
| Monthly Housing Costs | $506 | $2,512 |
| Real Estate Taxes | $1,441 | $1,713 |
Property Value by Mortgage Status in Santa Rosa County
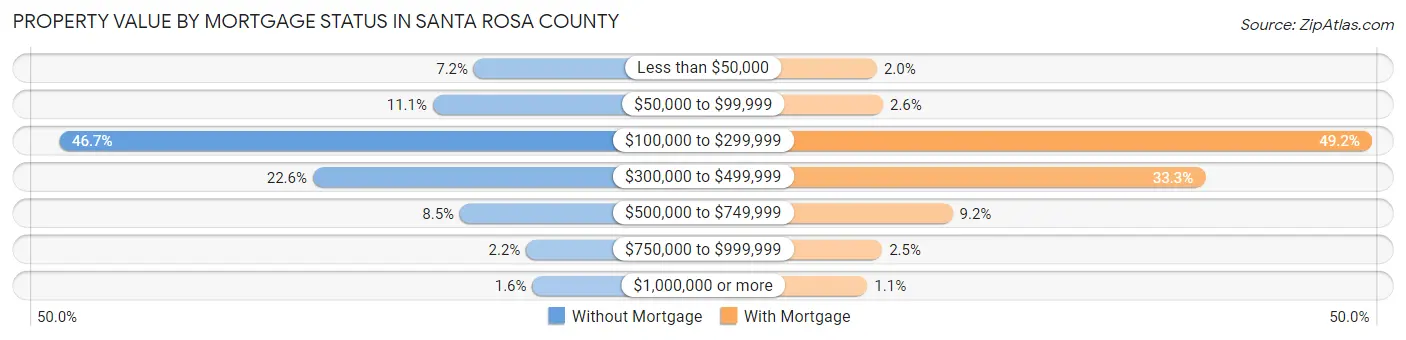
| Property Value | Without Mortgage | With Mortgage |
| Less than $50,000 | 1,381 (7.2%) | 722 (2.0%) |
| $50,000 to $99,999 | 2,129 (11.1%) | 926 (2.6%) |
| $100,000 to $299,999 | 8,944 (46.7%) | 17,364 (49.1%) |
| $300,000 to $499,999 | 4,317 (22.6%) | 11,758 (33.3%) |
| $500,000 to $749,999 | 1,635 (8.5%) | 3,266 (9.2%) |
| $750,000 to $999,999 | 427 (2.2%) | 896 (2.5%) |
| $1,000,000 or more | 314 (1.6%) | 399 (1.1%) |
| Total | 19,147 (100.0%) | 35,331 (100.0%) |
Household Income by Mortgage Status in Santa Rosa County
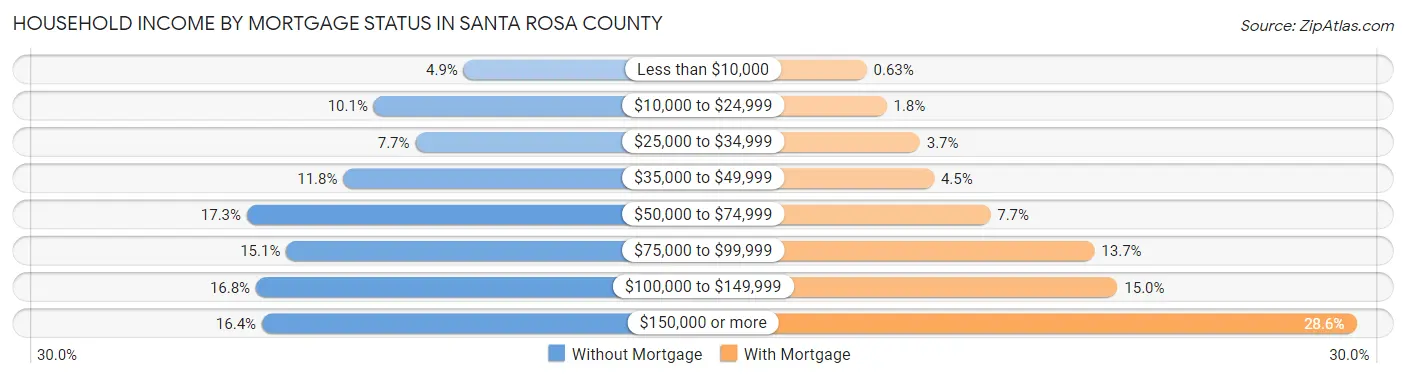
| Household Income | Without Mortgage | With Mortgage |
| Less than $10,000 | 941 (4.9%) | 224 (0.6%) |
| $10,000 to $24,999 | 1,925 (10.1%) | 624 (1.8%) |
| $25,000 to $34,999 | 1,469 (7.7%) | 1,296 (3.7%) |
| $35,000 to $49,999 | 2,257 (11.8%) | 1,584 (4.5%) |
| $50,000 to $74,999 | 3,313 (17.3%) | 2,722 (7.7%) |
| $75,000 to $99,999 | 2,882 (15.0%) | 4,822 (13.7%) |
| $100,000 to $149,999 | 3,212 (16.8%) | 5,287 (15.0%) |
| $150,000 or more | 3,148 (16.4%) | 10,109 (28.6%) |
| Total | 19,147 (100.0%) | 35,331 (100.0%) |
Property Value to Household Income Ratio in Santa Rosa County
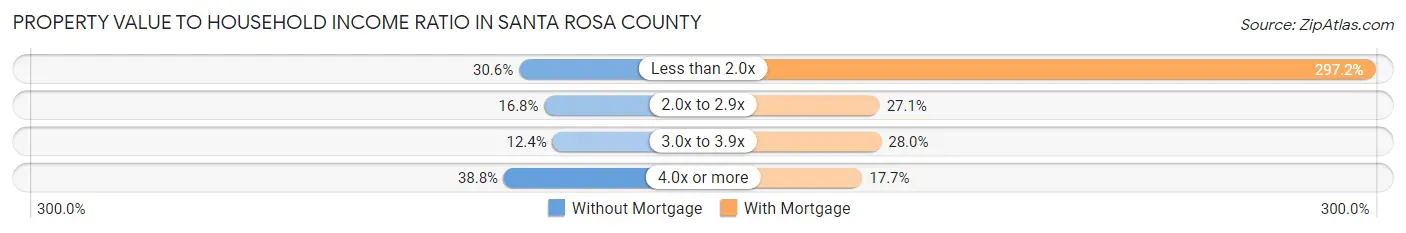
| Value-to-Income Ratio | Without Mortgage | With Mortgage |
| Less than 2.0x | 5,861 (30.6%) | 104,995 (297.2%) |
| 2.0x to 2.9x | 3,221 (16.8%) | 9,581 (27.1%) |
| 3.0x to 3.9x | 2,369 (12.4%) | 9,884 (28.0%) |
| 4.0x or more | 7,437 (38.8%) | 6,242 (17.7%) |
| Total | 19,147 (100.0%) | 35,331 (100.0%) |
Real Estate Taxes by Mortgage Status in Santa Rosa County
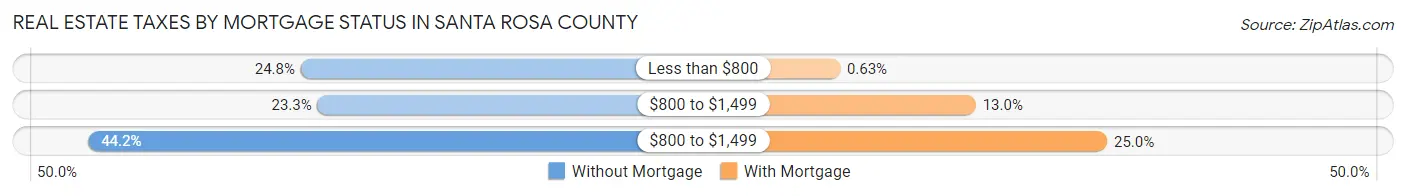
| Property Taxes | Without Mortgage | With Mortgage |
| Less than $800 | 4,745 (24.8%) | 223 (0.6%) |
| $800 to $1,499 | 4,451 (23.3%) | 4,602 (13.0%) |
| $800 to $1,499 | 8,462 (44.2%) | 8,841 (25.0%) |
| Total | 19,147 (100.0%) | 35,331 (100.0%) |
Health & Disability in Santa Rosa County
Health Insurance Coverage by Age in Santa Rosa County
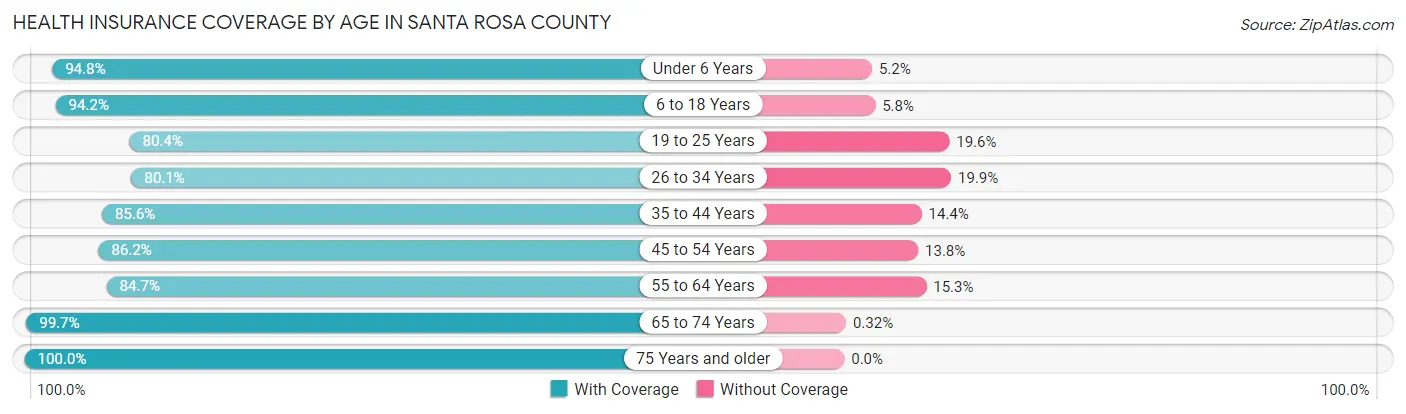
| Age Bracket | With Coverage | Without Coverage |
| Under 6 Years | 11,881 (94.8%) | 646 (5.2%) |
| 6 to 18 Years | 28,826 (94.2%) | 1,766 (5.8%) |
| 19 to 25 Years | 10,455 (80.4%) | 2,545 (19.6%) |
| 26 to 34 Years | 15,492 (80.1%) | 3,853 (19.9%) |
| 35 to 44 Years | 20,289 (85.6%) | 3,418 (14.4%) |
| 45 to 54 Years | 20,060 (86.2%) | 3,203 (13.8%) |
| 55 to 64 Years | 21,974 (84.7%) | 3,965 (15.3%) |
| 65 to 74 Years | 18,842 (99.7%) | 61 (0.3%) |
| 75 Years and older | 11,342 (100.0%) | 0 (0.0%) |
| Total | 159,161 (89.1%) | 19,457 (10.9%) |
Health Insurance Coverage by Citizenship Status in Santa Rosa County
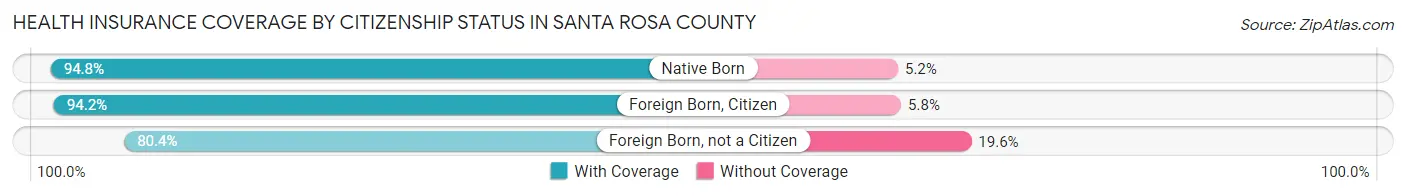
| Citizenship Status | With Coverage | Without Coverage |
| Native Born | 11,881 (94.8%) | 646 (5.2%) |
| Foreign Born, Citizen | 28,826 (94.2%) | 1,766 (5.8%) |
| Foreign Born, not a Citizen | 10,455 (80.4%) | 2,545 (19.6%) |
Health Insurance Coverage by Household Income in Santa Rosa County
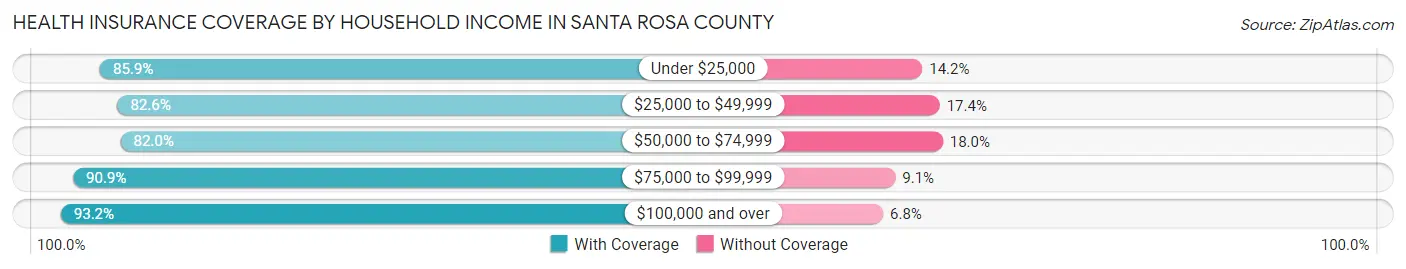
| Household Income | With Coverage | Without Coverage |
| Under $25,000 | 11,228 (85.9%) | 1,851 (14.1%) |
| $25,000 to $49,999 | 20,743 (82.6%) | 4,373 (17.4%) |
| $50,000 to $74,999 | 21,960 (82.0%) | 4,813 (18.0%) |
| $75,000 to $99,999 | 25,468 (90.9%) | 2,545 (9.1%) |
| $100,000 and over | 79,597 (93.2%) | 5,804 (6.8%) |
Public vs Private Health Insurance Coverage by Age in Santa Rosa County
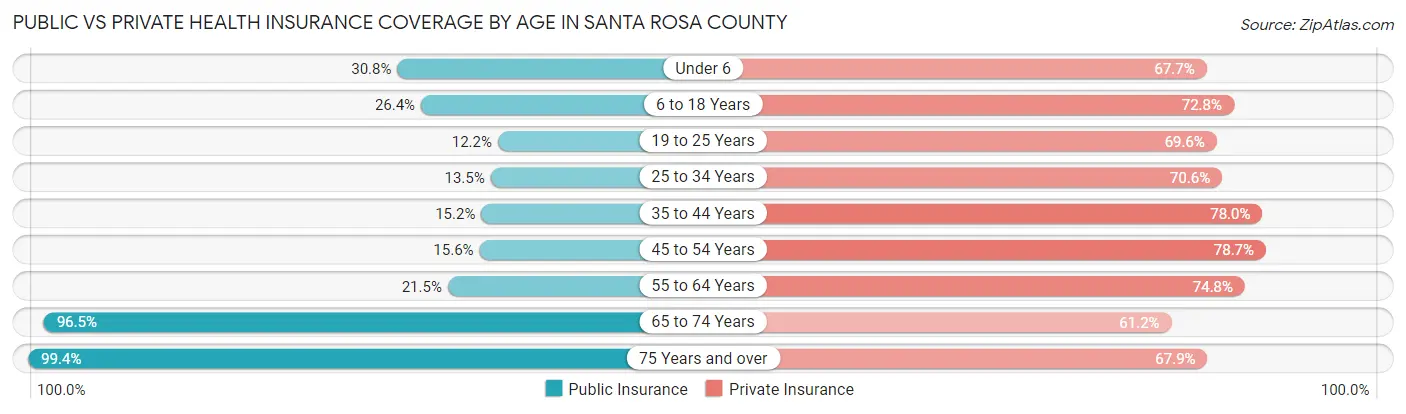
| Age Bracket | Public Insurance | Private Insurance |
| Under 6 | 3,861 (30.8%) | 8,481 (67.7%) |
| 6 to 18 Years | 8,084 (26.4%) | 22,257 (72.8%) |
| 19 to 25 Years | 1,581 (12.2%) | 9,046 (69.6%) |
| 25 to 34 Years | 2,616 (13.5%) | 13,654 (70.6%) |
| 35 to 44 Years | 3,613 (15.2%) | 18,502 (78.0%) |
| 45 to 54 Years | 3,625 (15.6%) | 18,311 (78.7%) |
| 55 to 64 Years | 5,566 (21.5%) | 19,404 (74.8%) |
| 65 to 74 Years | 18,231 (96.5%) | 11,563 (61.2%) |
| 75 Years and over | 11,268 (99.4%) | 7,697 (67.9%) |
| Total | 58,445 (32.7%) | 128,915 (72.2%) |
Disability Status by Sex by Age in Santa Rosa County
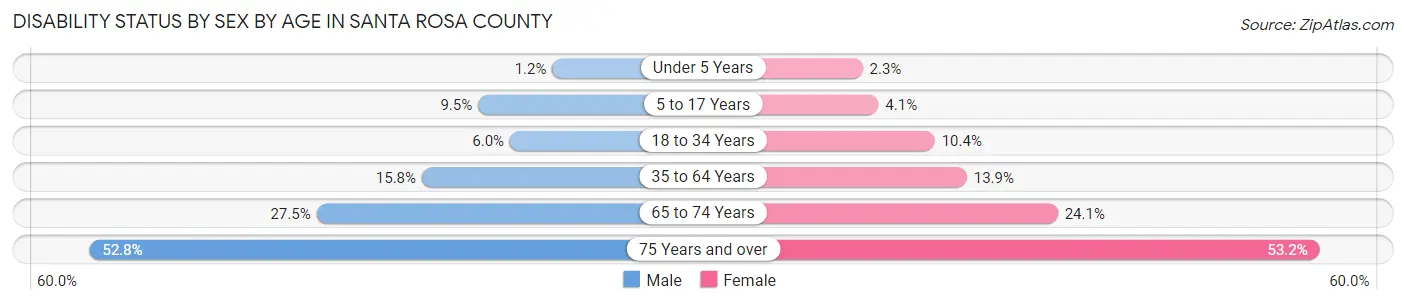
| Age Bracket | Male | Female |
| Under 5 Years | 64 (1.2%) | 116 (2.3%) |
| 5 to 17 Years | 1,529 (9.5%) | 608 (4.1%) |
| 18 to 34 Years | 1,000 (5.9%) | 1,810 (10.3%) |
| 35 to 64 Years | 5,545 (15.8%) | 5,253 (13.9%) |
| 65 to 74 Years | 2,550 (27.5%) | 2,315 (24.0%) |
| 75 Years and over | 2,580 (52.8%) | 3,434 (53.2%) |
Disability Class by Sex by Age in Santa Rosa County
Disability Class: Hearing Difficulty
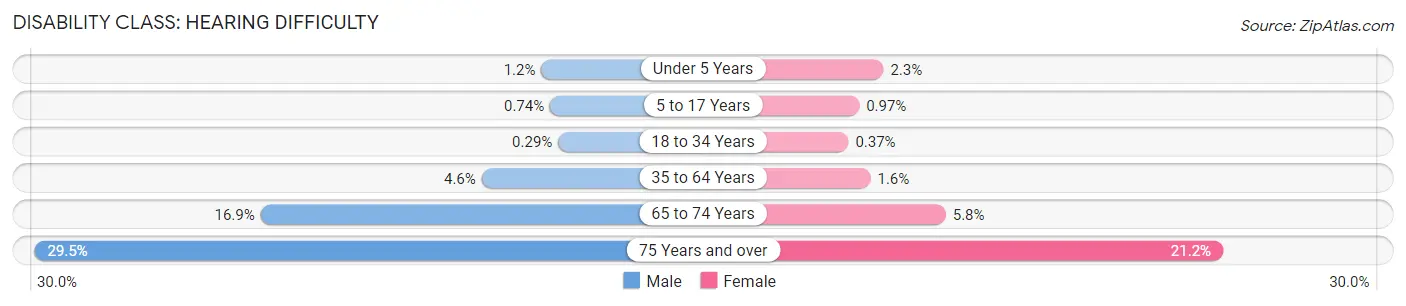
| Age Bracket | Male | Female |
| Under 5 Years | 64 (1.2%) | 116 (2.3%) |
| 5 to 17 Years | 119 (0.7%) | 145 (1.0%) |
| 18 to 34 Years | 49 (0.3%) | 65 (0.4%) |
| 35 to 64 Years | 1,599 (4.5%) | 605 (1.6%) |
| 65 to 74 Years | 1,564 (16.9%) | 557 (5.8%) |
| 75 Years and over | 1,439 (29.4%) | 1,370 (21.2%) |
Disability Class: Vision Difficulty
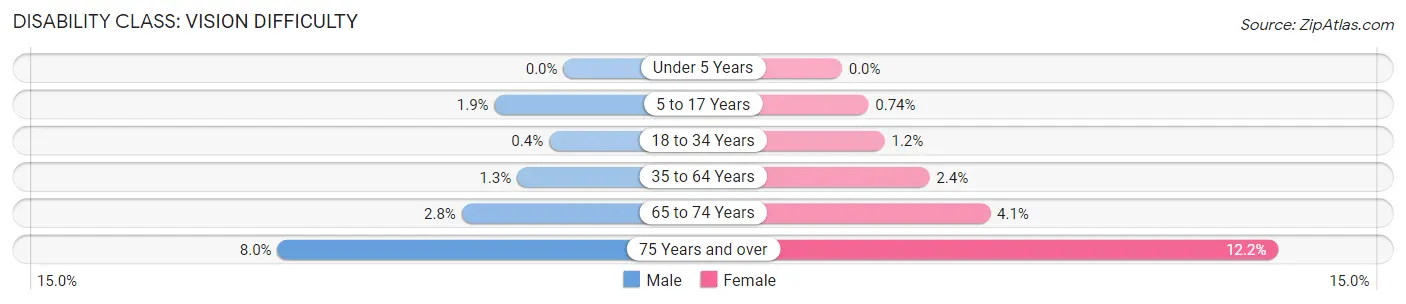
| Age Bracket | Male | Female |
| Under 5 Years | 0 (0.0%) | 0 (0.0%) |
| 5 to 17 Years | 309 (1.9%) | 110 (0.7%) |
| 18 to 34 Years | 67 (0.4%) | 209 (1.2%) |
| 35 to 64 Years | 453 (1.3%) | 920 (2.4%) |
| 65 to 74 Years | 263 (2.8%) | 398 (4.1%) |
| 75 Years and over | 389 (8.0%) | 784 (12.1%) |
Disability Class: Cognitive Difficulty
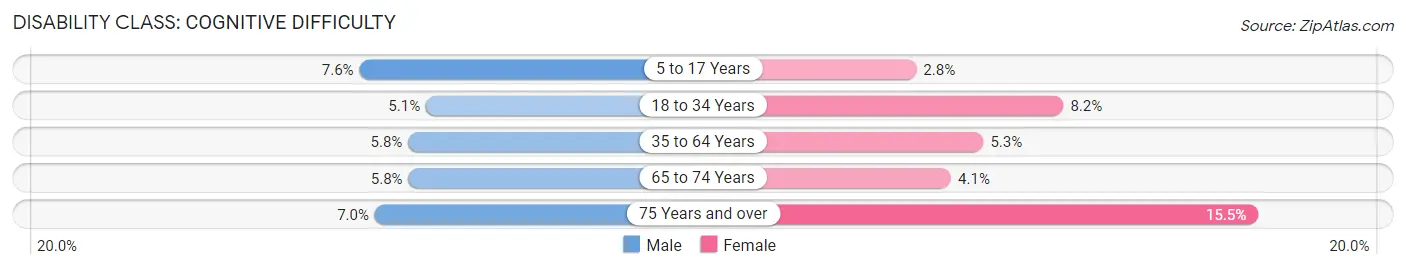
| Age Bracket | Male | Female |
| 5 to 17 Years | 1,218 (7.6%) | 413 (2.8%) |
| 18 to 34 Years | 856 (5.1%) | 1,440 (8.2%) |
| 35 to 64 Years | 2,026 (5.8%) | 1,985 (5.3%) |
| 65 to 74 Years | 533 (5.8%) | 391 (4.1%) |
| 75 Years and over | 342 (7.0%) | 997 (15.4%) |
Disability Class: Ambulatory Difficulty
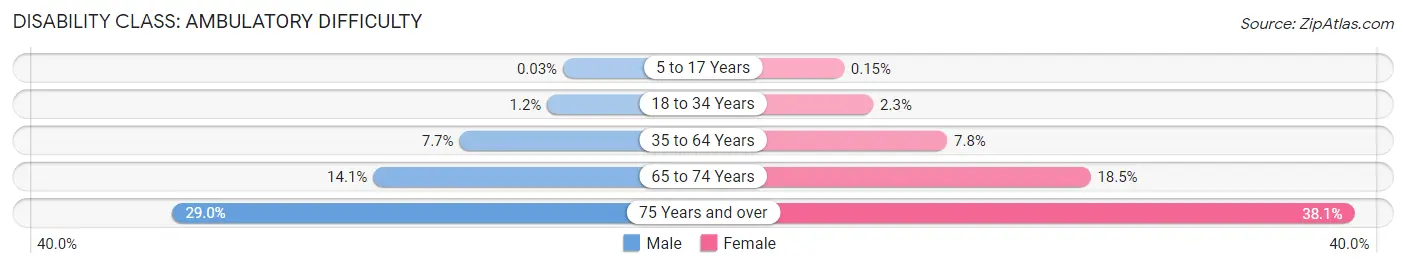
| Age Bracket | Male | Female |
| 5 to 17 Years | 5 (0.0%) | 23 (0.2%) |
| 18 to 34 Years | 202 (1.2%) | 408 (2.3%) |
| 35 to 64 Years | 2,717 (7.7%) | 2,951 (7.8%) |
| 65 to 74 Years | 1,310 (14.1%) | 1,777 (18.5%) |
| 75 Years and over | 1,418 (29.0%) | 2,456 (38.1%) |
Disability Class: Self-Care Difficulty
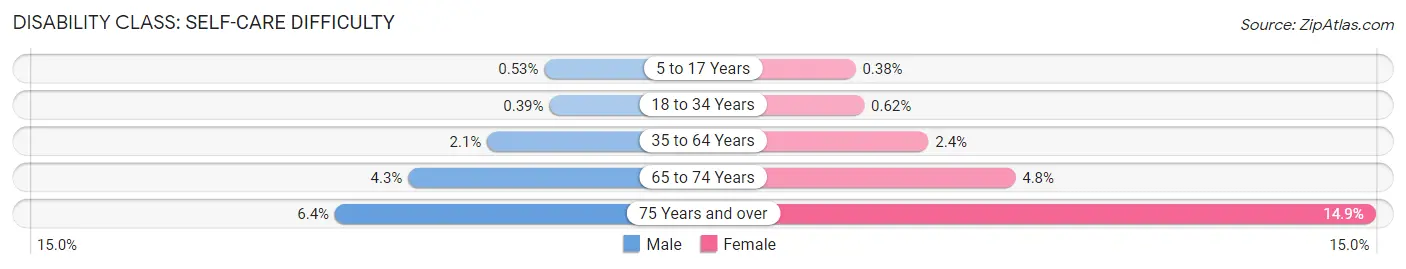
| Age Bracket | Male | Female |
| 5 to 17 Years | 86 (0.5%) | 57 (0.4%) |
| 18 to 34 Years | 65 (0.4%) | 109 (0.6%) |
| 35 to 64 Years | 745 (2.1%) | 910 (2.4%) |
| 65 to 74 Years | 401 (4.3%) | 465 (4.8%) |
| 75 Years and over | 311 (6.4%) | 959 (14.9%) |
Technology Access in Santa Rosa County
Computing Device Access in Santa Rosa County
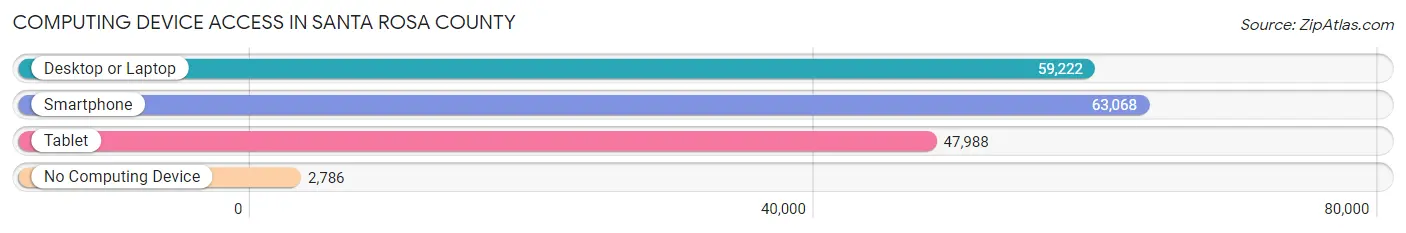
| Device Type | # Households | % Households |
| Desktop or Laptop | 59,222 | 85.2% |
| Smartphone | 63,068 | 90.7% |
| Tablet | 47,988 | 69.0% |
| No Computing Device | 2,786 | 4.0% |
| Total | 69,524 | 100.0% |
Internet Access in Santa Rosa County
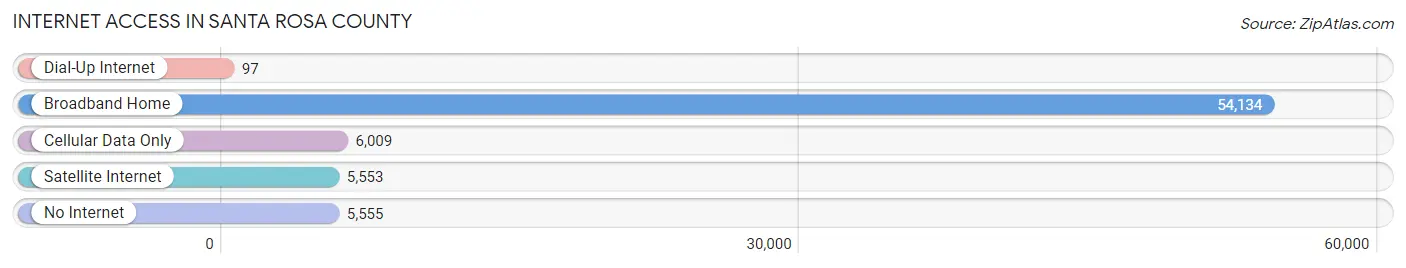
| Internet Type | # Households | % Households |
| Dial-Up Internet | 97 | 0.1% |
| Broadband Home | 54,134 | 77.9% |
| Cellular Data Only | 6,009 | 8.6% |
| Satellite Internet | 5,553 | 8.0% |
| No Internet | 5,555 | 8.0% |
| Total | 69,524 | 100.0% |
Santa Rosa County Summary
Santa Rosa County is located in the northwest corner of Florida, along the Gulf of Mexico. It is bordered by Escambia County to the east, Okaloosa County to the west, and Walton County to the south. The county seat is Milton, and the largest city is Navarre. Santa Rosa County is part of the Pensacola-Ferry Pass-Brent Metropolitan Statistical Area.
History
Santa Rosa County was established in 1842, and was named for the Spanish name for Saint Rose of Lima. The county was originally part of Escambia County, but was split off in 1846. The county was largely rural until the 1950s, when the population began to grow rapidly due to the influx of military personnel and retirees.
Geography
Santa Rosa County covers an area of 1,092 square miles, of which 1,072 square miles is land and 20 square miles is water. The county is located in the Florida Panhandle, and is bordered by Escambia County to the east, Okaloosa County to the west, and Walton County to the south. The county is divided into two distinct regions: the northern part is mostly rural, while the southern part is more developed. The county is home to several rivers, including the Blackwater River, the Yellow River, and the Escambia River.
Economy
Santa Rosa County has a diverse economy, with a mix of manufacturing, tourism, and agriculture. The county is home to several large employers, including the Whiting Field Naval Air Station, the Santa Rosa County School District, and the Santa Rosa County Sheriff's Office. The county is also home to several large manufacturing companies, including Gulf Power, International Paper, and Raytheon. Tourism is also an important part of the economy, with visitors coming to the area to enjoy the beaches, fishing, and other outdoor activities.
Demographics
As of the 2010 census, Santa Rosa County had a population of 152,413. The population was 53.2% White, 34.2% Hispanic or Latino, 8.3% African American, 2.2% Asian, and 2.1% from other races. The median household income was $48,845, and the median family income was $58,945. The per capita income was $25,945. The unemployment rate was 6.2%.
Conclusion
Santa Rosa County is a diverse and vibrant county located in the Florida Panhandle. It has a rich history, and a diverse economy that includes manufacturing, tourism, and agriculture. The population is diverse, with a mix of White, Hispanic or Latino, African American, Asian, and other races. The county has a strong economy, with several large employers, and a median household income that is higher than the state average.
Common Questions
What is Per Capita Income in Santa Rosa County?
Per Capita income in Santa Rosa County is $39,143.
What is the Median Family Income in Santa Rosa County?
Median Family Income in Santa Rosa County is $98,722.
What is the Median Household income in Santa Rosa County?
Median Household Income in Santa Rosa County is $84,715.
What is Income or Wage Gap in Santa Rosa County?
Income or Wage Gap in Santa Rosa County is 34.7%.
Women in Santa Rosa County earn 65.3 cents for every dollar earned by a man.
What is Family Income Deficit in Santa Rosa County?
Family Income Deficit in Santa Rosa County is $11,809.
Families that are below poverty line in Santa Rosa County earn $11,809 less on average than the poverty threshold level.
What is Inequality or Gini Index in Santa Rosa County?
Inequality or Gini Index in Santa Rosa County is 0.42.
What is the Total Population of Santa Rosa County?
Total Population of Santa Rosa County is 188,994.
What is the Total Male Population of Santa Rosa County?
Total Male Population of Santa Rosa County is 97,011.
What is the Total Female Population of Santa Rosa County?
Total Female Population of Santa Rosa County is 91,983.
What is the Ratio of Males per 100 Females in Santa Rosa County?
There are 105.47 Males per 100 Females in Santa Rosa County.
What is the Ratio of Females per 100 Males in Santa Rosa County?
There are 94.82 Females per 100 Males in Santa Rosa County.
What is the Median Population Age in Santa Rosa County?
Median Population Age in Santa Rosa County is 40.0 Years.
What is the Average Family Size in Santa Rosa County
Average Family Size in Santa Rosa County is 3.1 People.
What is the Average Household Size in Santa Rosa County
Average Household Size in Santa Rosa County is 2.6 People.
How Large is the Labor Force in Santa Rosa County?
There are 90,262 People in the Labor Forcein in Santa Rosa County.
What is the Percentage of People in the Labor Force in Santa Rosa County?
59.1% of People are in the Labor Force in Santa Rosa County.
What is the Unemployment Rate in Santa Rosa County?
Unemployment Rate in Santa Rosa County is 4.7%.