Area Code 321 Map & Demographics
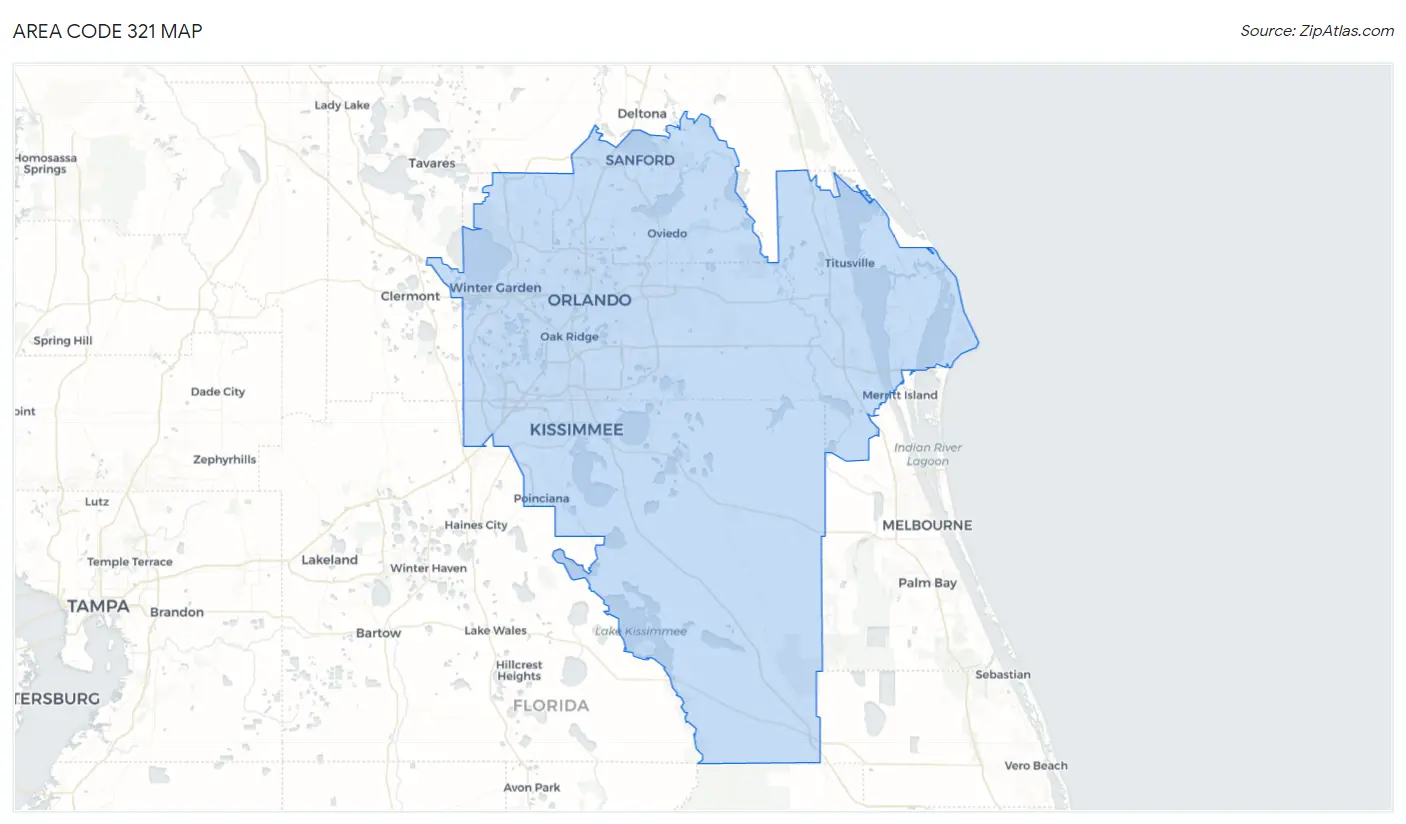
Area Code 321 Map
Area Code 321 Overview
$40,237
PER CAPITA INCOME
$91,546
AVG FAMILY INCOME
$77,072
AVG HOUSEHOLD INCOME
22.9%
WAGE / INCOME GAP [ % ]
77.1¢/ $1
WAGE / INCOME GAP [ $ ]
$10,303
FAMILY INCOME DEFICIT
27.48
INEQUALITY / GINI INDEX
1,976,339
TOTAL POPULATION
978,773
MALE POPULATION
997,566
FEMALE POPULATION
98.12
MALES / 100 FEMALES
101.92
FEMALES / 100 MALES
40.7
MEDIAN AGE
3.2
AVG FAMILY SIZE
2.7
AVG HOUSEHOLD SIZE
1,032,560
LABOR FORCE [ PEOPLE ]
63.9%
PERCENT IN LABOR FORCE
4.8%
UNEMPLOYMENT RATE
Income in Area Code 321
Income Overview in Area Code 321
Per Capita Income in Area Code 321 is $40,237, while median incomes of families and households are $91,546 and $77,072 respectively.
| Characteristic | Number | Measure |
| Per Capita Income | 1,976,339 | $40,237 |
| Median Family Income | 465,503 | $91,546 |
| Mean Family Income | 465,503 | $7,405,256 |
| Median Household Income | 717,511 | $77,072 |
| Mean Household Income | 717,511 | $6,381,203 |
| Income Deficit | 465,503 | $10,303 |
| Wage / Income Gap (%) | 1,976,339 | 22.95% |
| Wage / Income Gap ($) | 1,976,339 | 77.05¢ per $1 |
| Gini / Inequality Index | 1,976,339 | 27.48 |
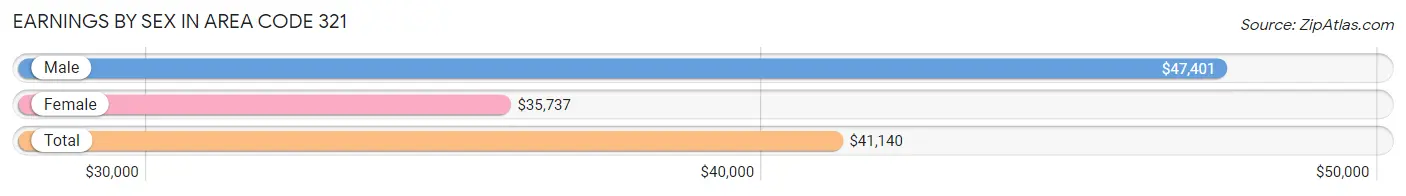
Earnings by Sex in Area Code 321
Average Earnings in Area Code 321 are $41,140, $47,401 for men and $35,737 for women, a difference of 24.6%.
| Sex | Number | Average Earnings |
| Male | 559,728 (52.8%) | $47,401 |
| Female | 499,443 (47.1%) | $35,737 |
| Total | 1,059,171 (100.0%) | $41,140 |
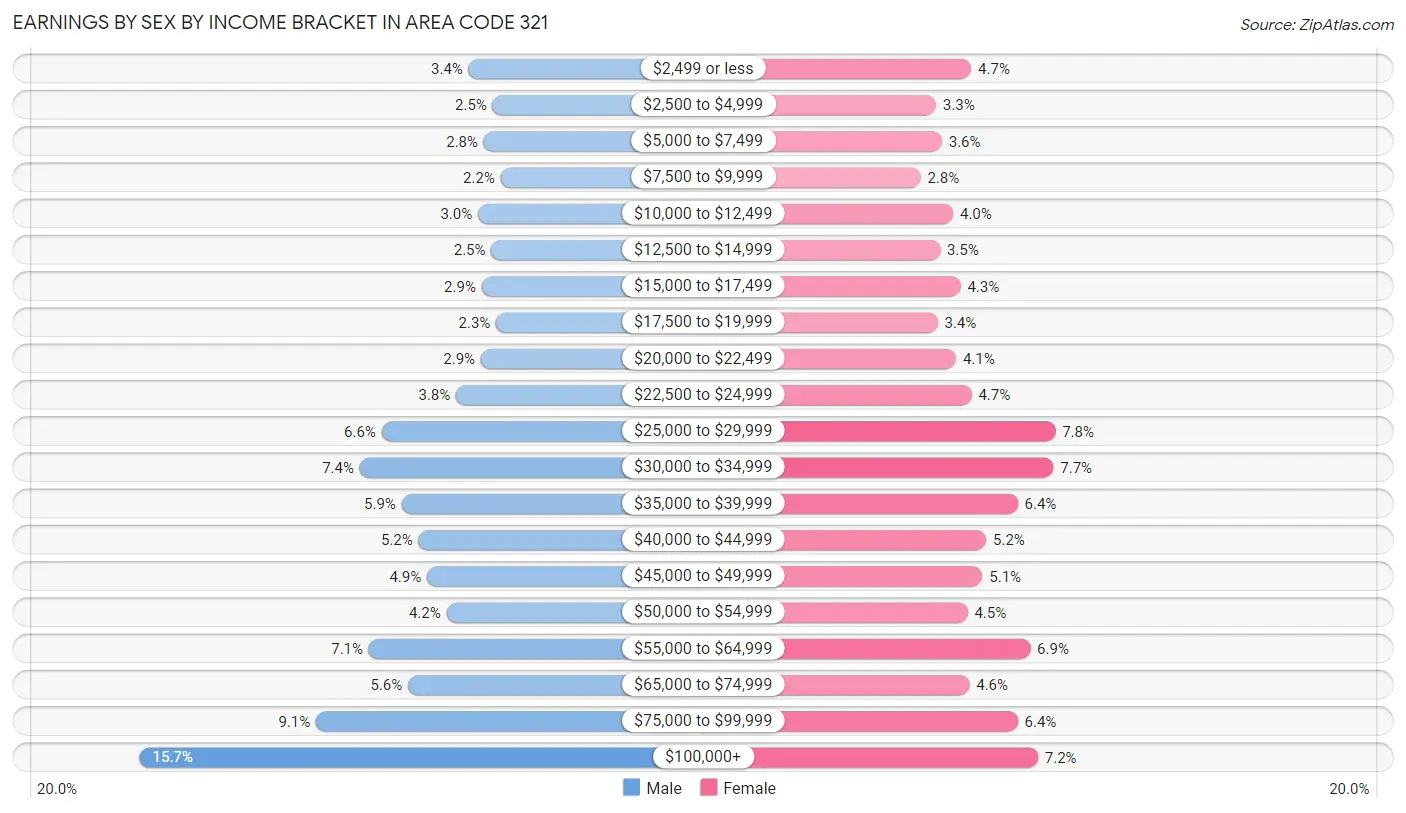
Earnings by Sex by Income Bracket in Area Code 321
The most common earnings brackets in Area Code 321 are $100,000+ for men (87,794 | 15.7%) and $25,000 to $29,999 for women (39,008 | 7.8%).
| Income | Male | Female |
| $2,499 or less | 18,811 (3.4%) | 23,294 (4.7%) |
| $2,500 to $4,999 | 13,784 (2.5%) | 16,672 (3.3%) |
| $5,000 to $7,499 | 15,589 (2.8%) | 17,798 (3.6%) |
| $7,500 to $9,999 | 12,102 (2.2%) | 13,762 (2.8%) |
| $10,000 to $12,499 | 16,867 (3.0%) | 19,871 (4.0%) |
| $12,500 to $14,999 | 14,034 (2.5%) | 17,428 (3.5%) |
| $15,000 to $17,499 | 16,084 (2.9%) | 21,273 (4.3%) |
| $17,500 to $19,999 | 13,054 (2.3%) | 16,983 (3.4%) |
| $20,000 to $22,499 | 16,214 (2.9%) | 20,449 (4.1%) |
| $22,500 to $24,999 | 21,450 (3.8%) | 23,308 (4.7%) |
| $25,000 to $29,999 | 37,040 (6.6%) | 39,008 (7.8%) |
| $30,000 to $34,999 | 41,637 (7.4%) | 38,644 (7.7%) |
| $35,000 to $39,999 | 32,876 (5.9%) | 31,965 (6.4%) |
| $40,000 to $44,999 | 29,302 (5.2%) | 26,057 (5.2%) |
| $45,000 to $49,999 | 27,565 (4.9%) | 25,357 (5.1%) |
| $50,000 to $54,999 | 23,436 (4.2%) | 22,588 (4.5%) |
| $55,000 to $64,999 | 39,762 (7.1%) | 34,335 (6.9%) |
| $65,000 to $74,999 | 31,508 (5.6%) | 22,909 (4.6%) |
| $75,000 to $99,999 | 50,819 (9.1%) | 31,967 (6.4%) |
| $100,000+ | 87,794 (15.7%) | 35,775 (7.2%) |
| Total | 559,728 (100.0%) | 499,443 (100.0%) |
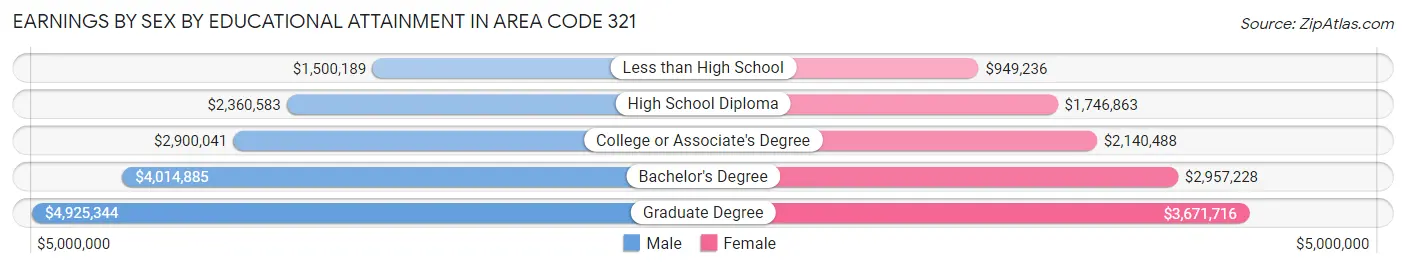
Earnings by Sex by Educational Attainment in Area Code 321
Average earnings in Area Code 321 are $3,304,102 for men and $2,476,917 for women, a difference of 25.0%. Men with an educational attainment of graduate degree enjoy the highest average annual earnings of $4,925,344, while those with less than high school education earn the least with $1,500,189. Women with an educational attainment of graduate degree earn the most with the average annual earnings of $3,671,716, while those with less than high school education have the smallest earnings of $949,236.
| Educational Attainment | Male Income | Female Income |
| Less than High School | $1,500,189 | $949,236 |
| High School Diploma | $2,360,583 | $1,746,863 |
| College or Associate's Degree | $2,900,041 | $2,140,488 |
| Bachelor's Degree | $4,014,885 | $2,957,228 |
| Graduate Degree | $4,925,344 | $3,671,716 |
| Total | $3,304,102 | $2,476,917 |
Family Income in Area Code 321
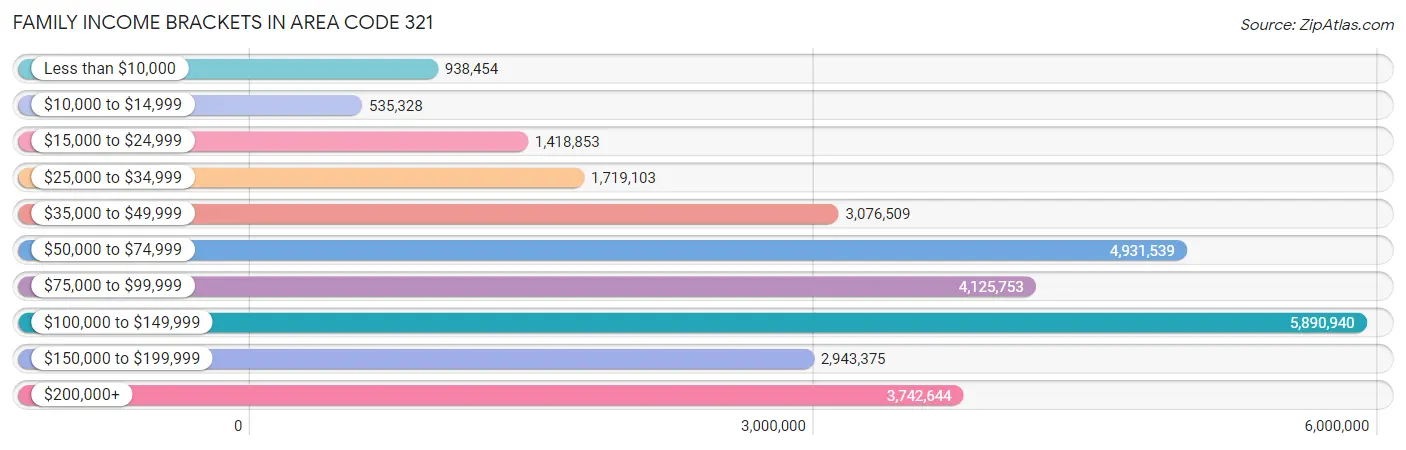
Family Income Brackets in Area Code 321
According to the Area Code 321 family income data, there are 5,890,940 families falling into the $100,000 to $149,999 income range, which is the most common income bracket and makes up 1,265.5% of all families. Conversely, the $10,000 to $14,999 income bracket is the least frequent group with only 535,328 families (115.0%) belonging to this category.
| Income Bracket | # Families | % Families |
| Less than $10,000 | 938,454 | 201.6% |
| $10,000 to $14,999 | 535,328 | 115.0% |
| $15,000 to $24,999 | 1,418,853 | 304.8% |
| $25,000 to $34,999 | 1,719,103 | 369.3% |
| $35,000 to $49,999 | 3,076,509 | 660.9% |
| $50,000 to $74,999 | 4,931,539 | 1,059.4% |
| $75,000 to $99,999 | 4,125,753 | 886.3% |
| $100,000 to $149,999 | 5,890,940 | 1,265.5% |
| $150,000 to $199,999 | 2,943,375 | 632.3% |
| $200,000+ | 3,742,644 | 804.0% |
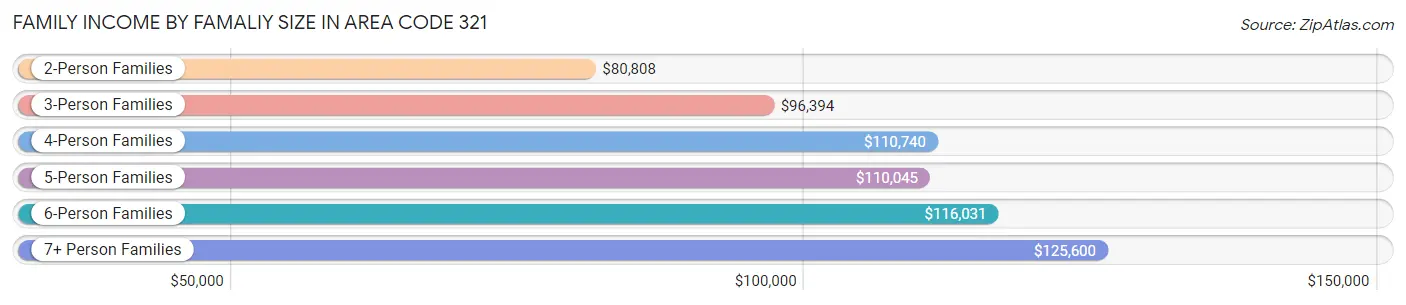
Family Income by Famaliy Size in Area Code 321
7+ person families (7,190 | 1.5%) account for the highest median family income in Area Code 321 with $125,600 per family, while 2-person families (214,947 | 46.2%) have the highest median income of $40,404 per family member.
| Income Bracket | # Families | Median Income |
| 2-Person Families | 214,947 (46.2%) | $80,808 |
| 3-Person Families | 111,693 (24.0%) | $96,394 |
| 4-Person Families | 80,754 (17.3%) | $110,740 |
| 5-Person Families | 37,843 (8.1%) | $110,045 |
| 6-Person Families | 13,076 (2.8%) | $116,031 |
| 7+ Person Families | 7,190 (1.5%) | $125,600 |
| Total | 465,503 (100.0%) | $91,546 |
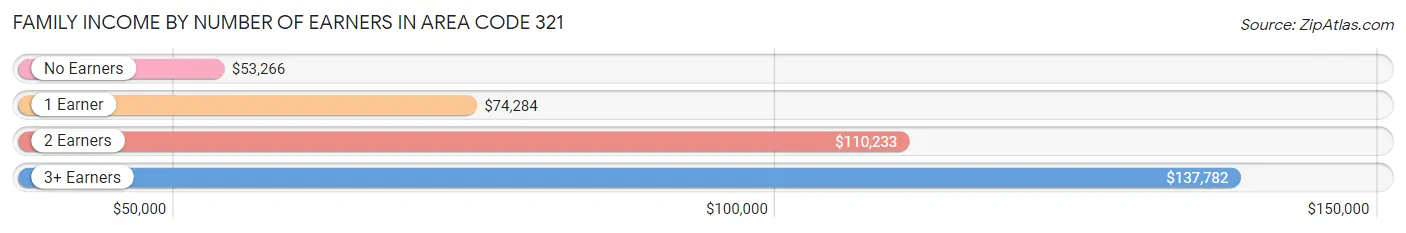
Family Income by Number of Earners in Area Code 321
The median family income in Area Code 321 is $91,546, with families comprising 3+ earners (56,256) having the highest median family income of $137,782, while families with no earners (69,390) have the lowest median family income of $53,266, accounting for 12.1% and 14.9% of families, respectively.
| Number of Earners | # Families | Median Income |
| No Earners | 69,390 (14.9%) | $53,266 |
| 1 Earner | 154,315 (33.2%) | $74,284 |
| 2 Earners | 185,542 (39.9%) | $110,233 |
| 3+ Earners | 56,256 (12.1%) | $137,782 |
| Total | 465,503 (100.0%) | $91,546 |
Household Income in Area Code 321
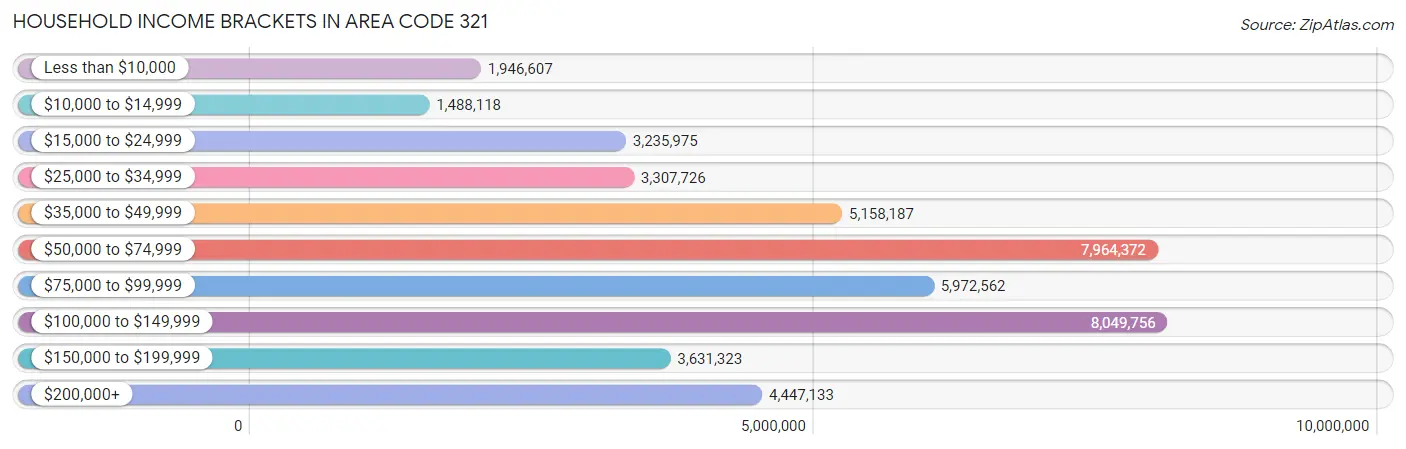
Household Income Brackets in Area Code 321
With 8,049,756 households falling in the category, the $100,000 to $149,999 income range is the most frequent in Area Code 321, accounting for 1,121.9% of all households. In contrast, only 1,488,118 households (207.4%) fall into the $10,000 to $14,999 income bracket, making it the least populous group.
| Income Bracket | # Households | % Households |
| Less than $10,000 | 1,946,607 | 271.3% |
| $10,000 to $14,999 | 1,488,118 | 207.4% |
| $15,000 to $24,999 | 3,235,975 | 451.0% |
| $25,000 to $34,999 | 3,307,726 | 461.0% |
| $35,000 to $49,999 | 5,158,187 | 718.9% |
| $50,000 to $74,999 | 7,964,372 | 1,110.0% |
| $75,000 to $99,999 | 5,972,562 | 832.4% |
| $100,000 to $149,999 | 8,049,756 | 1,121.9% |
| $150,000 to $199,999 | 3,631,323 | 506.1% |
| $200,000+ | 4,447,133 | 619.8% |
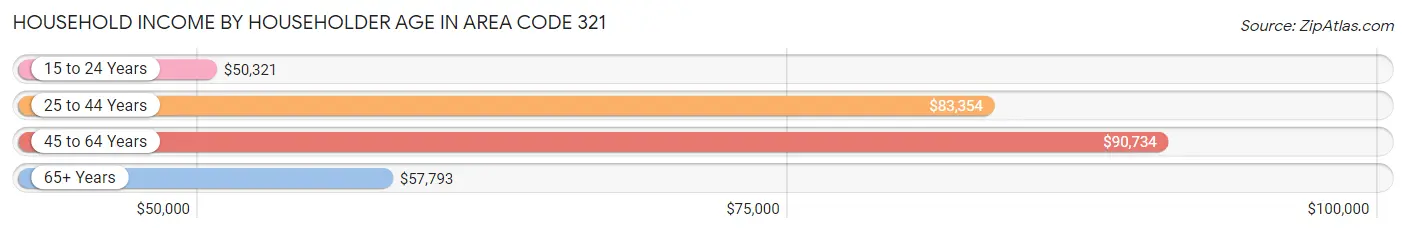
Household Income by Householder Age in Area Code 321
The median household income in Area Code 321 is $77,072, with the highest median household income of $90,734 found in the 45 to 64 years age bracket for the primary householder. A total of 273,118 households (38.1%) fall into this category. Meanwhile, the 15 to 24 years age bracket for the primary householder has the lowest median household income of $50,321, with 22,270 households (3.1%) in this group.
| Income Bracket | # Households | Median Income |
| 15 to 24 Years | 22,270 (3.1%) | $50,321 |
| 25 to 44 Years | 241,504 (33.7%) | $83,354 |
| 45 to 64 Years | 273,118 (38.1%) | $90,734 |
| 65+ Years | 180,619 (25.2%) | $57,793 |
| Total | 717,511 (100.0%) | $77,072 |
Poverty in Area Code 321
Income Below Poverty by Sex and Age in Area Code 321
With 11.8% poverty level for males and 13.6% for females among the residents of Area Code 321, 6 to 11 year old males and under 5 year old females are the most vulnerable to poverty, with 13,593 males (19.3%) and 9,474 females (19.0%) in their respective age groups living below the poverty level.
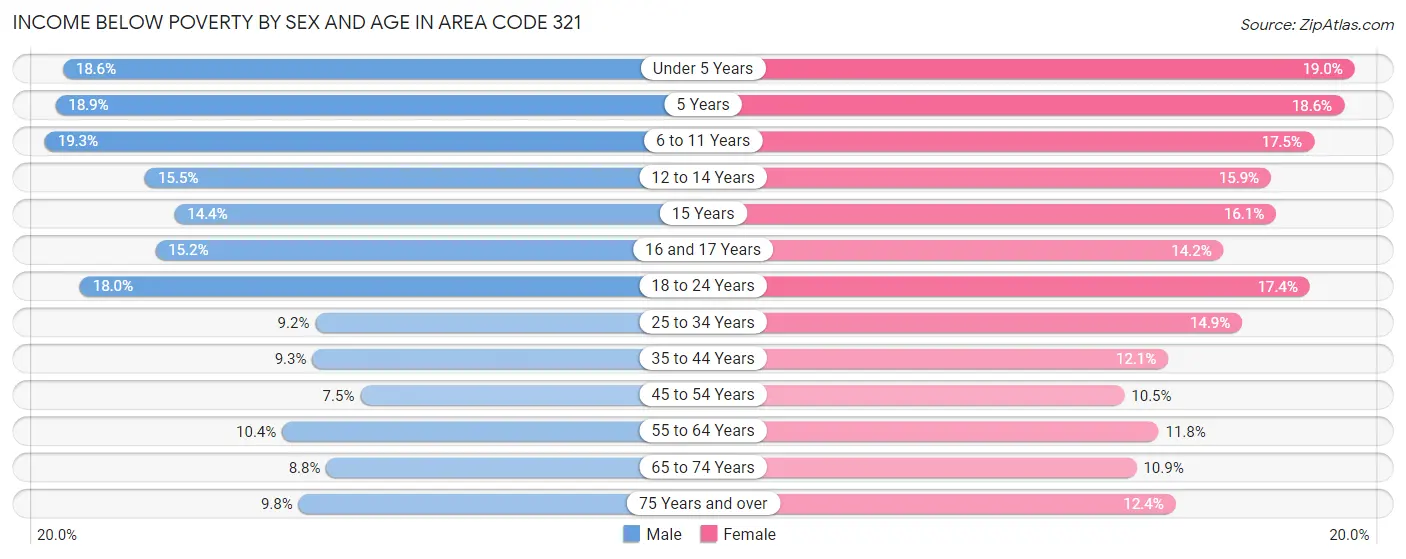
| Age Bracket | Male | Female |
| Under 5 Years | 9,794 (18.6%) | 9,474 (19.0%) |
| 5 Years | 2,037 (18.9%) | 1,883 (18.6%) |
| 6 to 11 Years | 13,593 (19.3%) | 11,496 (17.5%) |
| 12 to 14 Years | 5,782 (15.5%) | 5,545 (15.9%) |
| 15 Years | 1,879 (14.4%) | 1,703 (16.1%) |
| 16 and 17 Years | 3,774 (15.1%) | 3,416 (14.2%) |
| 18 to 24 Years | 15,440 (17.9%) | 14,073 (17.4%) |
| 25 to 34 Years | 13,778 (9.2%) | 21,617 (14.9%) |
| 35 to 44 Years | 12,247 (9.3%) | 16,074 (12.1%) |
| 45 to 54 Years | 9,459 (7.5%) | 13,443 (10.5%) |
| 55 to 64 Years | 13,009 (10.4%) | 15,378 (11.8%) |
| 65 to 74 Years | 7,477 (8.8%) | 10,711 (10.9%) |
| 75 Years and over | 5,285 (9.8%) | 9,210 (12.4%) |
| Total | 113,554 (11.8%) | 134,023 (13.6%) |
Income Above Poverty by Sex and Age in Area Code 321
According to the poverty statistics in Area Code 321, males aged 45 to 54 years and females aged 45 to 54 years are the age groups that are most secure financially, with 92.5% of males and 89.5% of females in these age groups living above the poverty line.
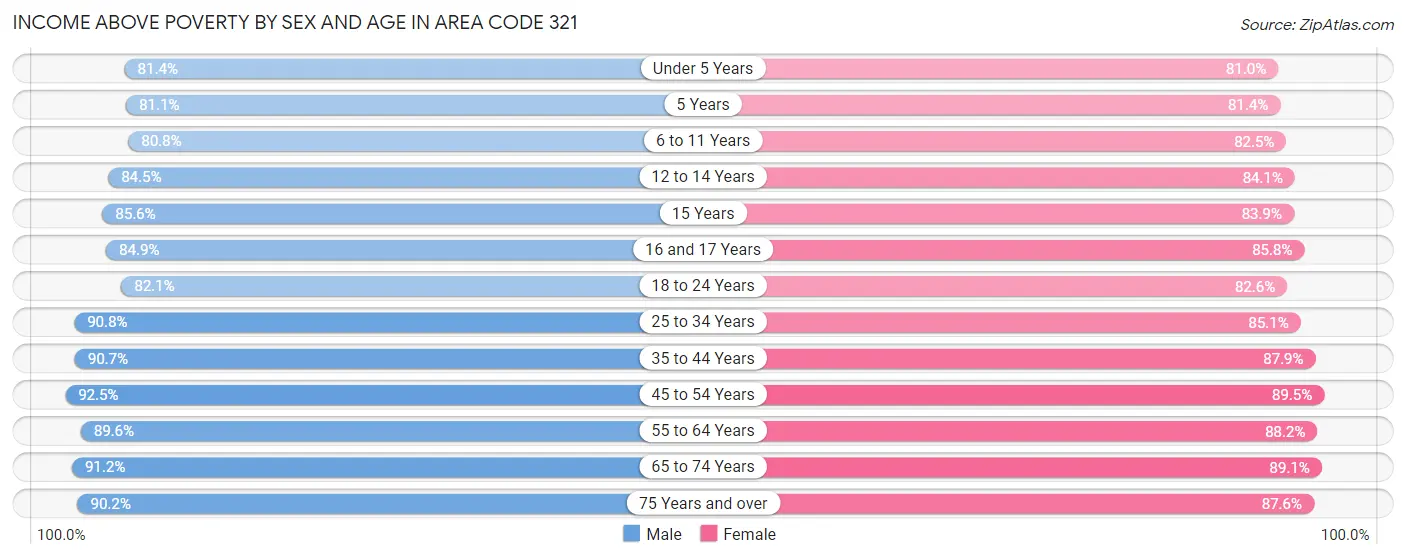
| Age Bracket | Male | Female |
| Under 5 Years | 42,929 (81.4%) | 40,287 (81.0%) |
| 5 Years | 8,766 (81.1%) | 8,220 (81.4%) |
| 6 to 11 Years | 57,006 (80.7%) | 54,136 (82.5%) |
| 12 to 14 Years | 31,454 (84.5%) | 29,256 (84.1%) |
| 15 Years | 11,134 (85.6%) | 8,863 (83.9%) |
| 16 and 17 Years | 21,131 (84.9%) | 20,693 (85.8%) |
| 18 to 24 Years | 70,561 (82.1%) | 66,937 (82.6%) |
| 25 to 34 Years | 135,894 (90.8%) | 123,886 (85.1%) |
| 35 to 44 Years | 119,140 (90.7%) | 116,675 (87.9%) |
| 45 to 54 Years | 115,924 (92.5%) | 114,723 (89.5%) |
| 55 to 64 Years | 111,556 (89.6%) | 115,421 (88.2%) |
| 65 to 74 Years | 77,533 (91.2%) | 87,177 (89.1%) |
| 75 Years and over | 48,467 (90.2%) | 65,097 (87.6%) |
| Total | 851,495 (88.2%) | 851,371 (86.4%) |
Income Below Poverty Among Married-Couple Families in Area Code 321
The poverty statistics for married-couple families in Area Code 321 show that 5.6% or 18,695 of the total 331,890 families live below the poverty line. Families with 5 or more children have the highest poverty rate of 21.5%, comprising of 275 families. On the other hand, families with no children have the lowest poverty rate of 4.7%, which includes 9,514 families.
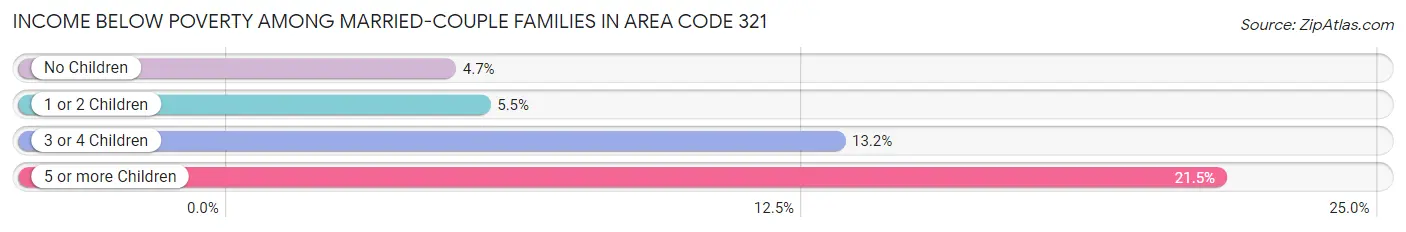
| Children | Above Poverty | Below Poverty |
| No Children | 191,231 (95.3%) | 9,514 (4.7%) |
| 1 or 2 Children | 100,929 (94.5%) | 5,858 (5.5%) |
| 3 or 4 Children | 20,032 (86.8%) | 3,048 (13.2%) |
| 5 or more Children | 1,003 (78.5%) | 275 (21.5%) |
| Total | 313,195 (94.4%) | 18,695 (5.6%) |
Income Below Poverty Among Single-Parent Households in Area Code 321
According to the poverty data in Area Code 321, 11.8% or 4,426 single-father households and 21.5% or 20,640 single-mother households are living below the poverty line. Among single-father households, those with 3 or 4 children have the highest poverty rate, with 542 households (24.3%) experiencing poverty. Likewise, among single-mother households, those with 5 or more children have the highest poverty rate, with 555 households (60.9%) falling below the poverty line.
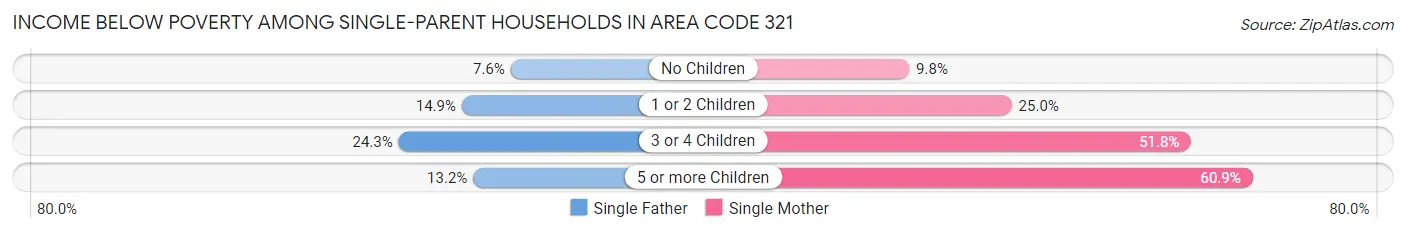
| Children | Single Father | Single Mother |
| No Children | 1,416 (7.6%) | 3,897 (9.8%) |
| 1 or 2 Children | 2,463 (14.9%) | 11,624 (25.0%) |
| 3 or 4 Children | 542 (24.3%) | 4,564 (51.8%) |
| 5 or more Children | 5 (13.2%) | 555 (60.9%) |
| Total | 4,426 (11.8%) | 20,640 (21.5%) |
Income Below Poverty Among Married-Couple vs Single-Parent Households in Area Code 321
The poverty data for Area Code 321 shows that 18,695 of the married-couple family households (5.6%) and 25,066 of the single-parent households (18.8%) are living below the poverty level. Within the married-couple family households, those with 5 or more children have the highest poverty rate, with 275 households (21.5%) falling below the poverty line. Among the single-parent households, those with 5 or more children have the highest poverty rate, with 560 household (59.0%) living below poverty.
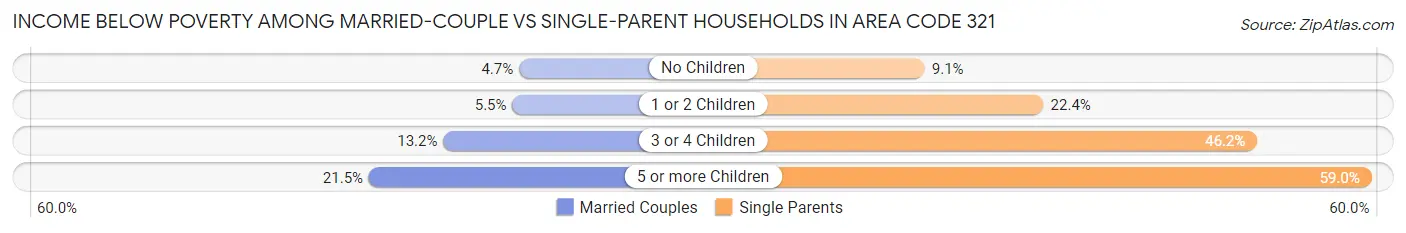
| Children | Married-Couple Families | Single-Parent Households |
| No Children | 9,514 (4.7%) | 5,313 (9.1%) |
| 1 or 2 Children | 5,858 (5.5%) | 14,087 (22.4%) |
| 3 or 4 Children | 3,048 (13.2%) | 5,106 (46.2%) |
| 5 or more Children | 275 (21.5%) | 560 (59.0%) |
| Total | 18,695 (5.6%) | 25,066 (18.8%) |
Race in Area Code 321
The most populous races in Area Code 321 are White / Caucasian (1,165,776 | 59.0%), Hispanic or Latino (618,603 | 31.3%), and Black / African American (293,979 | 14.9%).
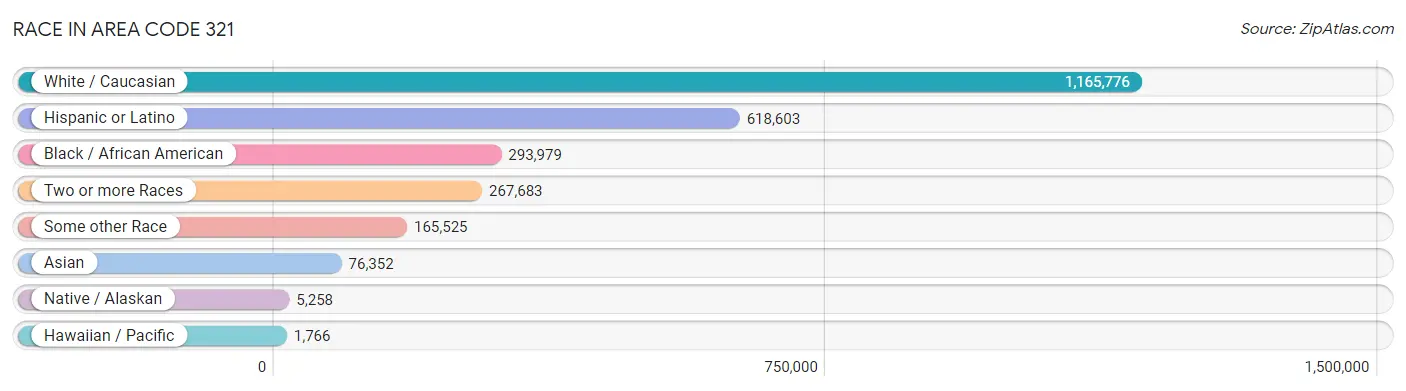
| Race | # Population | % Population |
| Asian | 76,352 | 3.9% |
| Black / African American | 293,979 | 14.9% |
| Hawaiian / Pacific | 1,766 | 0.1% |
| Hispanic or Latino | 618,603 | 31.3% |
| Native / Alaskan | 5,258 | 0.3% |
| White / Caucasian | 1,165,776 | 59.0% |
| Two or more Races | 267,683 | 13.5% |
| Some other Race | 165,525 | 8.4% |
| Total | 1,976,339 | 100.0% |
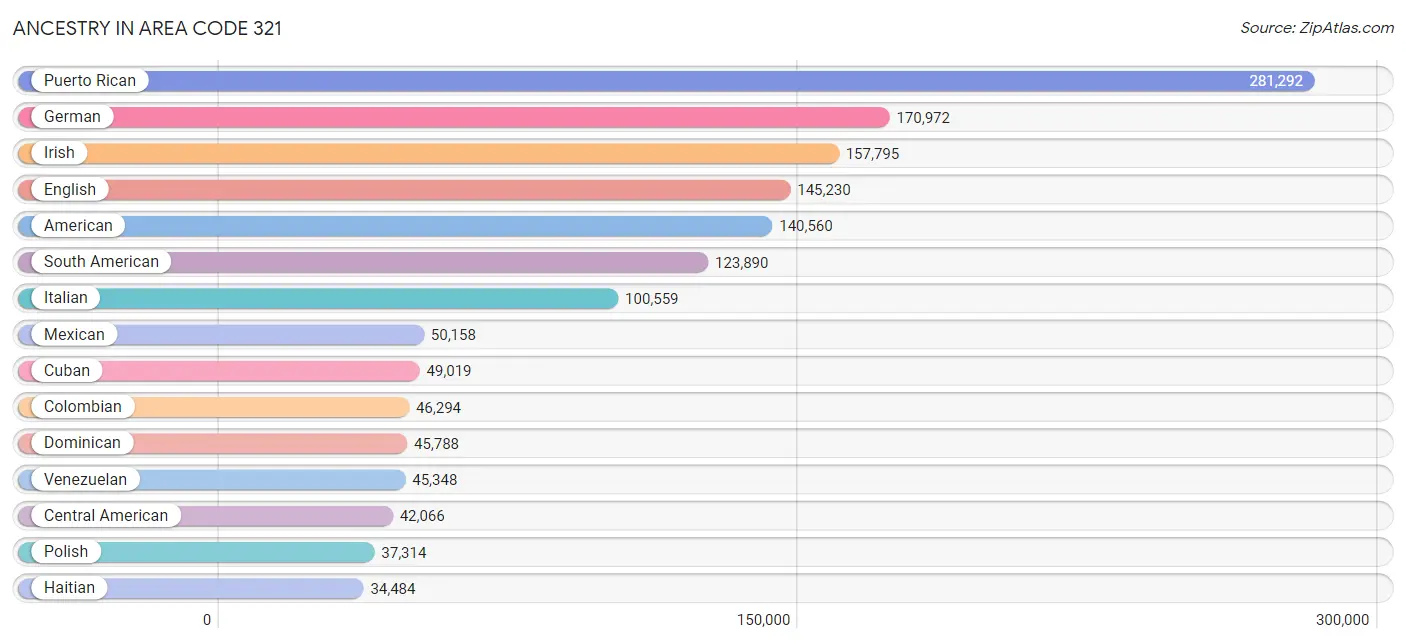
Ancestry in Area Code 321
The most populous ancestries reported in Area Code 321 are Puerto Rican (281,292 | 14.2%), German (170,972 | 8.6%), Irish (157,795 | 8.0%), English (145,230 | 7.3%), and American (140,560 | 7.1%), together accounting for 45.3% of all Area Code 321 residents.
| Ancestry | # Population | % Population |
| Afghan | 18 | 0.0% |
| African | 11,727 | 0.6% |
| Alaska Native | 7 | 0.0% |
| Albanian | 853 | 0.0% |
| Alsatian | 10 | 0.0% |
| American | 140,560 | 7.1% |
| Apache | 177 | 0.0% |
| Arab | 15,596 | 0.8% |
| Arapaho | 10 | 0.0% |
| Argentinean | 3,735 | 0.2% |
| Armenian | 667 | 0.0% |
| Australian | 532 | 0.0% |
| Austrian | 3,404 | 0.2% |
| Bahamian | 1,859 | 0.1% |
| Bangladeshi | 12 | 0.0% |
| Barbadian | 1,195 | 0.1% |
| Basque | 267 | 0.0% |
| Belgian | 1,146 | 0.1% |
| Belizean | 246 | 0.0% |
| Bermudan | 23 | 0.0% |
| Bhutanese | 4,752 | 0.2% |
| Blackfeet | 1,114 | 0.1% |
| Bolivian | 747 | 0.0% |
| Brazilian | 9,288 | 0.5% |
| British | 11,206 | 0.6% |
| British West Indian | 2,455 | 0.1% |
| Bulgarian | 1,245 | 0.1% |
| Burmese | 4,608 | 0.2% |
| Cajun | 254 | 0.0% |
| Canadian | 3,970 | 0.2% |
| Cape Verdean | 515 | 0.0% |
| Carpatho Rusyn | 35 | 0.0% |
| Celtic | 280 | 0.0% |
| Central American | 42,066 | 2.1% |
| Central American Indian | 5,072 | 0.3% |
| Cherokee | 4,776 | 0.2% |
| Chickasaw | 37 | 0.0% |
| Chilean | 2,669 | 0.1% |
| Chinese | 288 | 0.0% |
| Chippewa | 197 | 0.0% |
| Choctaw | 467 | 0.0% |
| Colombian | 46,294 | 2.3% |
| Comanche | 49 | 0.0% |
| Costa Rican | 2,577 | 0.1% |
| Cree | 3 | 0.0% |
| Creek | 291 | 0.0% |
| Croatian | 1,058 | 0.1% |
| Crow | 23 | 0.0% |
| Cuban | 49,019 | 2.5% |
| Cypriot | 96 | 0.0% |
| Czech | 3,814 | 0.2% |
| Czechoslovakian | 1,132 | 0.1% |
| Danish | 3,274 | 0.2% |
| Delaware | 113 | 0.0% |
| Dominican | 45,788 | 2.3% |
| Dutch | 12,779 | 0.6% |
| Dutch West Indian | 85 | 0.0% |
| Eastern European | 4,002 | 0.2% |
| Ecuadorian | 10,630 | 0.5% |
| Egyptian | 1,979 | 0.1% |
| English | 145,230 | 7.3% |
| Estonian | 119 | 0.0% |
| Ethiopian | 534 | 0.0% |
| European | 20,970 | 1.1% |
| Fijian | 262 | 0.0% |
| Filipino | 1,058 | 0.1% |
| Finnish | 1,835 | 0.1% |
| French | 33,845 | 1.7% |
| French American Indian | 271 | 0.0% |
| French Canadian | 9,123 | 0.5% |
| German | 170,972 | 8.6% |
| German Russian | 24 | 0.0% |
| Ghanaian | 235 | 0.0% |
| Greek | 6,069 | 0.3% |
| Guamanian / Chamorro | 559 | 0.0% |
| Guatemalan | 12,455 | 0.6% |
| Guyanese | 3,544 | 0.2% |
| Haitian | 34,484 | 1.7% |
| Honduran | 9,004 | 0.5% |
| Hopi | 10 | 0.0% |
| Hungarian | 6,318 | 0.3% |
| Icelander | 522 | 0.0% |
| Indian (Asian) | 16,889 | 0.9% |
| Indonesian | 592 | 0.0% |
| Inupiat | 64 | 0.0% |
| Iranian | 1,246 | 0.1% |
| Iraqi | 773 | 0.0% |
| Irish | 157,795 | 8.0% |
| Iroquois | 416 | 0.0% |
| Israeli | 1,058 | 0.1% |
| Italian | 100,559 | 5.1% |
| Jamaican | 26,475 | 1.3% |
| Japanese | 438 | 0.0% |
| Jordanian | 423 | 0.0% |
| Kenyan | 436 | 0.0% |
| Kiowa | 11 | 0.0% |
| Korean | 21,353 | 1.1% |
| Laotian | 542 | 0.0% |
| Latvian | 233 | 0.0% |
| Lebanese | 3,859 | 0.2% |
| Liberian | 27 | 0.0% |
| Lithuanian | 3,077 | 0.2% |
| Lumbee | 130 | 0.0% |
| Luxembourger | 37 | 0.0% |
| Macedonian | 364 | 0.0% |
| Malaysian | 531 | 0.0% |
| Maltese | 253 | 0.0% |
| Menominee | 58 | 0.0% |
| Mexican | 50,158 | 2.5% |
| Mexican American Indian | 919 | 0.1% |
| Mongolian | 175 | 0.0% |
| Moroccan | 2,772 | 0.1% |
| Native Hawaiian | 1,241 | 0.1% |
| Navajo | 234 | 0.0% |
| New Zealander | 194 | 0.0% |
| Nicaraguan | 5,614 | 0.3% |
| Nigerian | 1,469 | 0.1% |
| Northern European | 2,034 | 0.1% |
| Norwegian | 11,058 | 0.6% |
| Okinawan | 40 | 0.0% |
| Osage | 63 | 0.0% |
| Ottawa | 9 | 0.0% |
| Paiute | 17 | 0.0% |
| Pakistani | 1,974 | 0.1% |
| Palestinian | 1,267 | 0.1% |
| Panamanian | 5,289 | 0.3% |
| Paraguayan | 164 | 0.0% |
| Pennsylvania German | 561 | 0.0% |
| Peruvian | 12,285 | 0.6% |
| Pima | 37 | 0.0% |
| Polish | 37,314 | 1.9% |
| Portuguese | 10,055 | 0.5% |
| Potawatomi | 14 | 0.0% |
| Pueblo | 10 | 0.0% |
| Puerto Rican | 281,292 | 14.2% |
| Romanian | 2,605 | 0.1% |
| Russian | 11,107 | 0.6% |
| Salvadoran | 6,863 | 0.4% |
| Samoan | 503 | 0.0% |
| Scandinavian | 4,895 | 0.3% |
| Scotch-Irish | 12,759 | 0.6% |
| Scottish | 24,748 | 1.3% |
| Seminole | 426 | 0.0% |
| Senegalese | 18 | 0.0% |
| Serbian | 449 | 0.0% |
| Sierra Leonean | 6 | 0.0% |
| Sioux | 207 | 0.0% |
| Slavic | 621 | 0.0% |
| Slovak | 2,800 | 0.1% |
| Slovene | 510 | 0.0% |
| Somali | 54 | 0.0% |
| South African | 330 | 0.0% |
| South American | 123,890 | 6.3% |
| South American Indian | 895 | 0.1% |
| Spaniard | 5,344 | 0.3% |
| Spanish | 3,246 | 0.2% |
| Spanish American | 706 | 0.0% |
| Spanish American Indian | 90 | 0.0% |
| Sri Lankan | 14,133 | 0.7% |
| Subsaharan African | 17,103 | 0.9% |
| Sudanese | 26 | 0.0% |
| Swedish | 12,607 | 0.6% |
| Swiss | 2,567 | 0.1% |
| Syrian | 1,096 | 0.1% |
| Thai | 27,407 | 1.4% |
| Tlingit-Haida | 27 | 0.0% |
| Tohono O'Odham | 11 | 0.0% |
| Tongan | 12 | 0.0% |
| Trinidadian and Tobagonian | 4,596 | 0.2% |
| Turkish | 1,770 | 0.1% |
| U.S. Virgin Islander | 2,018 | 0.1% |
| Ukrainian | 3,541 | 0.2% |
| Uruguayan | 1,562 | 0.1% |
| Venezuelan | 45,348 | 2.3% |
| Vietnamese | 870 | 0.0% |
| Welsh | 10,055 | 0.5% |
| West Indian | 3,923 | 0.2% |
| Yaqui | 18 | 0.0% |
| Yugoslavian | 714 | 0.0% |
| Zimbabwean | 53 | 0.0% | View All 180 Rows |
Immigrants in Area Code 321
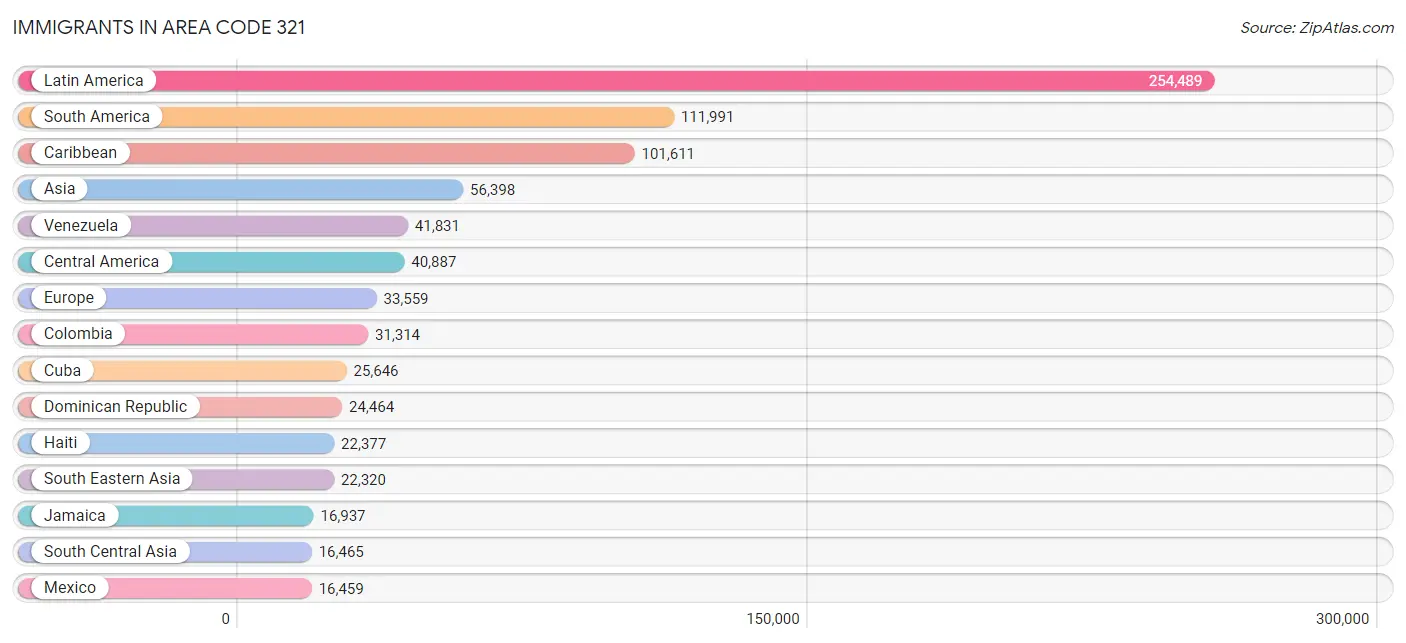
The most numerous immigrant groups reported in Area Code 321 came from Latin America (254,489 | 12.9%), South America (111,991 | 5.7%), Caribbean (101,611 | 5.1%), Asia (56,398 | 2.9%), and Venezuela (41,831 | 2.1%), together accounting for 28.7% of all Area Code 321 residents.
| Immigration Origin | # Population | % Population |
| Afghanistan | 8 | 0.0% |
| Africa | 10,364 | 0.5% |
| Albania | 393 | 0.0% |
| Argentina | 2,491 | 0.1% |
| Armenia | 85 | 0.0% |
| Asia | 56,398 | 2.9% |
| Australia | 459 | 0.0% |
| Austria | 147 | 0.0% |
| Azores | 93 | 0.0% |
| Bahamas | 1,172 | 0.1% |
| Bangladesh | 1,518 | 0.1% |
| Barbados | 710 | 0.0% |
| Belarus | 179 | 0.0% |
| Belgium | 303 | 0.0% |
| Belize | 309 | 0.0% |
| Bolivia | 590 | 0.0% |
| Bosnia and Herzegovina | 316 | 0.0% |
| Brazil | 12,660 | 0.6% |
| Bulgaria | 795 | 0.0% |
| Cabo Verde | 116 | 0.0% |
| Cambodia | 180 | 0.0% |
| Cameroon | 33 | 0.0% |
| Canada | 5,374 | 0.3% |
| Caribbean | 101,611 | 5.1% |
| Central America | 40,887 | 2.1% |
| Chile | 1,472 | 0.1% |
| China | 7,861 | 0.4% |
| Colombia | 31,314 | 1.6% |
| Congo | 82 | 0.0% |
| Costa Rica | 1,352 | 0.1% |
| Croatia | 100 | 0.0% |
| Cuba | 25,646 | 1.3% |
| Czechoslovakia | 615 | 0.0% |
| Denmark | 93 | 0.0% |
| Dominica | 290 | 0.0% |
| Dominican Republic | 24,464 | 1.2% |
| Eastern Africa | 2,851 | 0.1% |
| Eastern Asia | 11,169 | 0.6% |
| Eastern Europe | 10,514 | 0.5% |
| Ecuador | 6,204 | 0.3% |
| Egypt | 1,482 | 0.1% |
| El Salvador | 4,313 | 0.2% |
| England | 3,940 | 0.2% |
| Eritrea | 162 | 0.0% |
| Ethiopia | 192 | 0.0% |
| Europe | 33,559 | 1.7% |
| Fiji | 133 | 0.0% |
| France | 1,980 | 0.1% |
| Germany | 4,841 | 0.2% |
| Ghana | 486 | 0.0% |
| Greece | 332 | 0.0% |
| Grenada | 889 | 0.0% |
| Guatemala | 7,694 | 0.4% |
| Guyana | 4,982 | 0.3% |
| Haiti | 22,377 | 1.1% |
| Honduras | 4,861 | 0.3% |
| Hong Kong | 294 | 0.0% |
| Hungary | 331 | 0.0% |
| India | 10,437 | 0.5% |
| Indonesia | 323 | 0.0% |
| Iran | 1,206 | 0.1% |
| Iraq | 811 | 0.0% |
| Ireland | 737 | 0.0% |
| Israel | 737 | 0.0% |
| Italy | 1,898 | 0.1% |
| Jamaica | 16,937 | 0.9% |
| Japan | 927 | 0.1% |
| Jordan | 359 | 0.0% |
| Kazakhstan | 340 | 0.0% |
| Kenya | 1,063 | 0.1% |
| Korea | 2,381 | 0.1% |
| Kuwait | 269 | 0.0% |
| Laos | 122 | 0.0% |
| Latin America | 254,489 | 12.9% |
| Latvia | 92 | 0.0% |
| Lebanon | 720 | 0.0% |
| Liberia | 27 | 0.0% |
| Lithuania | 253 | 0.0% |
| Malaysia | 243 | 0.0% |
| Mexico | 16,459 | 0.8% |
| Micronesia | 208 | 0.0% |
| Middle Africa | 322 | 0.0% |
| Moldova | 515 | 0.0% |
| Morocco | 2,498 | 0.1% |
| Nepal | 104 | 0.0% |
| Netherlands | 533 | 0.0% |
| Nicaragua | 3,159 | 0.2% |
| Nigeria | 872 | 0.0% |
| North Macedonia | 167 | 0.0% |
| Northern Africa | 4,694 | 0.2% |
| Northern Europe | 11,178 | 0.6% |
| Norway | 226 | 0.0% |
| Oceania | 1,271 | 0.1% |
| Pakistan | 2,324 | 0.1% |
| Panama | 2,710 | 0.1% |
| Peru | 8,951 | 0.4% |
| Philippines | 10,507 | 0.5% |
| Poland | 2,095 | 0.1% |
| Portugal | 477 | 0.0% |
| Romania | 1,037 | 0.1% |
| Russia | 1,879 | 0.1% |
| Saudi Arabia | 471 | 0.0% |
| Scotland | 561 | 0.0% |
| Senegal | 135 | 0.0% |
| Serbia | 174 | 0.0% |
| Sierra Leone | 65 | 0.0% |
| Singapore | 467 | 0.0% |
| Somalia | 42 | 0.0% |
| South Africa | 411 | 0.0% |
| South America | 111,991 | 5.7% |
| South Central Asia | 16,465 | 0.8% |
| South Eastern Asia | 22,320 | 1.1% |
| Southern Europe | 3,771 | 0.2% |
| Spain | 1,013 | 0.1% |
| Sri Lanka | 30 | 0.0% |
| St. Vincent and the Grenadines | 414 | 0.0% |
| Sudan | 123 | 0.0% |
| Sweden | 281 | 0.0% |
| Switzerland | 203 | 0.0% |
| Syria | 678 | 0.0% |
| Taiwan | 1,325 | 0.1% |
| Thailand | 713 | 0.0% |
| Trinidad and Tobago | 5,222 | 0.3% |
| Turkey | 1,141 | 0.1% |
| Uganda | 27 | 0.0% |
| Ukraine | 1,193 | 0.1% |
| Uruguay | 901 | 0.1% |
| Uzbekistan | 166 | 0.0% |
| Venezuela | 41,831 | 2.1% |
| Vietnam | 9,304 | 0.5% |
| West Indies | 333 | 0.0% |
| Western Africa | 1,955 | 0.1% |
| Western Asia | 5,836 | 0.3% |
| Western Europe | 8,007 | 0.4% |
| Yemen | 21 | 0.0% |
| Zaire | 141 | 0.0% |
| Zimbabwe | 394 | 0.0% | View All 137 Rows |
Sex and Age in Area Code 321
Sex and Age in Area Code 321
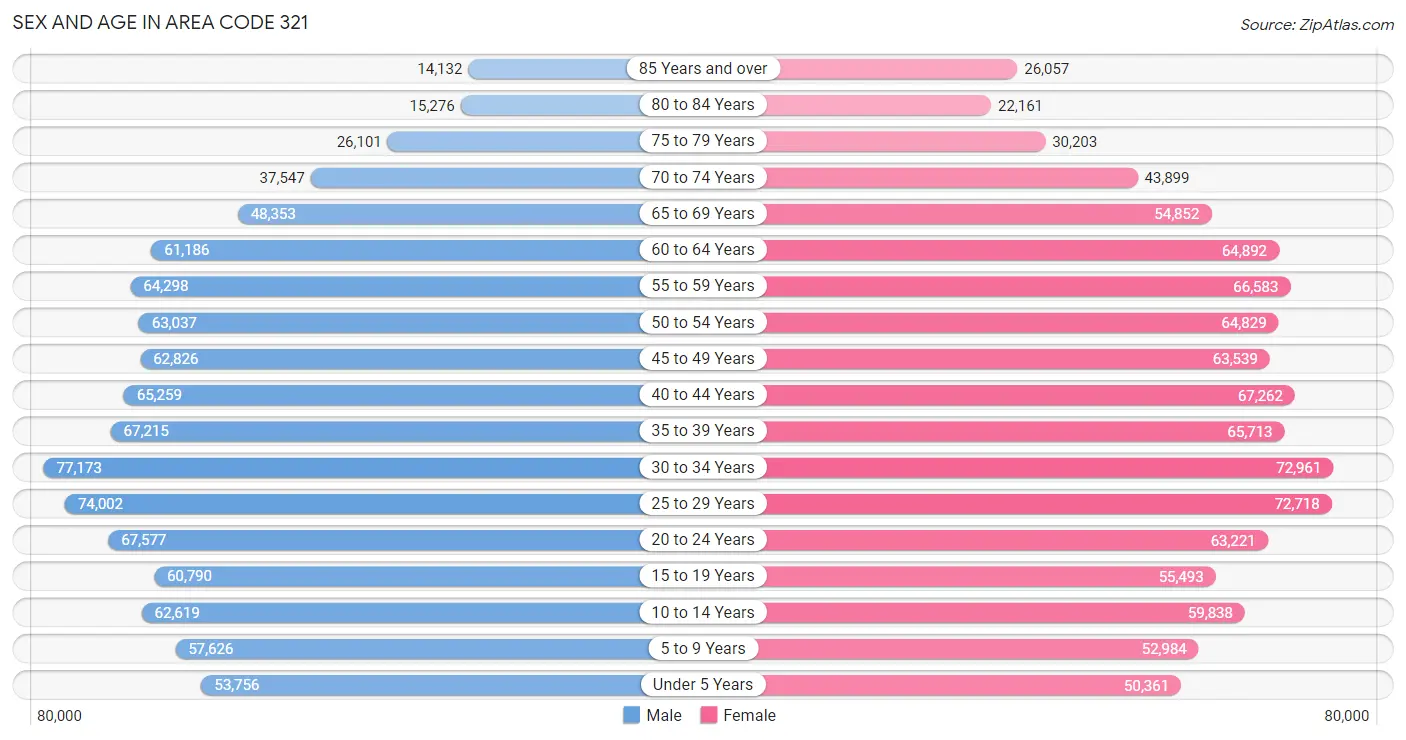
The most populous age groups in Area Code 321 are 30 to 34 Years (77,173 | 7.9%) for men and 30 to 34 Years (72,961 | 7.3%) for women.
| Age Bracket | Male | Female |
| Under 5 Years | 53,756 (5.5%) | 50,361 (5.1%) |
| 5 to 9 Years | 57,626 (5.9%) | 52,984 (5.3%) |
| 10 to 14 Years | 62,619 (6.4%) | 59,838 (6.0%) |
| 15 to 19 Years | 60,790 (6.2%) | 55,493 (5.6%) |
| 20 to 24 Years | 67,577 (6.9%) | 63,221 (6.3%) |
| 25 to 29 Years | 74,002 (7.6%) | 72,718 (7.3%) |
| 30 to 34 Years | 77,173 (7.9%) | 72,961 (7.3%) |
| 35 to 39 Years | 67,215 (6.9%) | 65,713 (6.6%) |
| 40 to 44 Years | 65,259 (6.7%) | 67,262 (6.7%) |
| 45 to 49 Years | 62,826 (6.4%) | 63,539 (6.4%) |
| 50 to 54 Years | 63,037 (6.4%) | 64,829 (6.5%) |
| 55 to 59 Years | 64,298 (6.6%) | 66,583 (6.7%) |
| 60 to 64 Years | 61,186 (6.2%) | 64,892 (6.5%) |
| 65 to 69 Years | 48,353 (4.9%) | 54,852 (5.5%) |
| 70 to 74 Years | 37,547 (3.8%) | 43,899 (4.4%) |
| 75 to 79 Years | 26,101 (2.7%) | 30,203 (3.0%) |
| 80 to 84 Years | 15,276 (1.6%) | 22,161 (2.2%) |
| 85 Years and over | 14,132 (1.4%) | 26,057 (2.6%) |
| Total | 978,773 (100.0%) | 997,566 (100.0%) |
Families and Households in Area Code 321
Median Family Size in Area Code 321
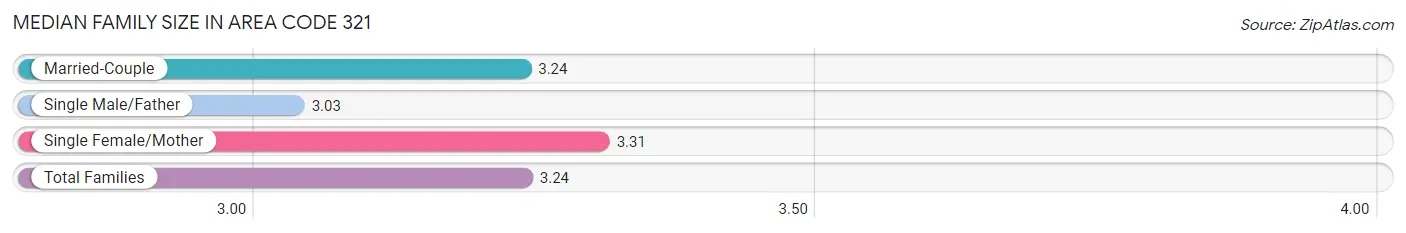
The median family size in Area Code 321 is 3.24 persons per family, with single female/mother families (96,084 | 20.6%) accounting for the largest median family size of 3.30693 persons per family. On the other hand, single male/father families (37,529 | 8.1%) represent the smallest median family size with 3.03 persons per family.
| Family Type | # Families | Family Size |
| Married-Couple | 331,890 (71.3%) | 3.24 |
| Single Male/Father | 37,529 (8.1%) | 3.03 |
| Single Female/Mother | 96,084 (20.6%) | 3.31 |
| Total Families | 465,503 (100.0%) | 3.24 |
Median Household Size in Area Code 321
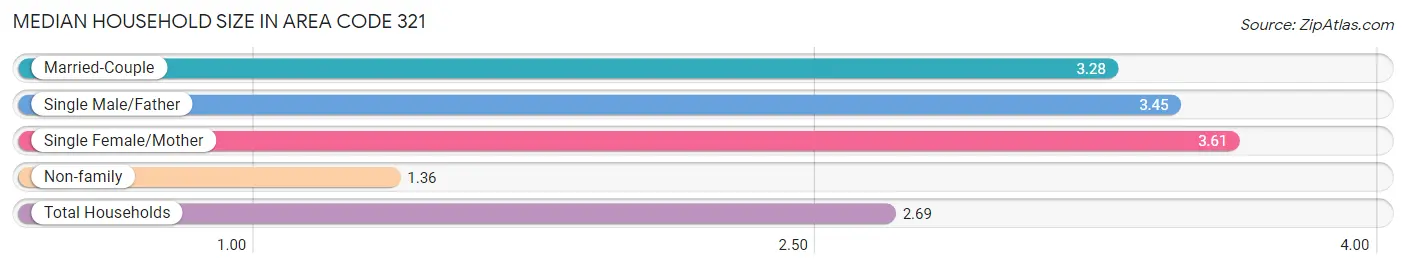
The median household size in Area Code 321 is 2.69 persons per household, with single female/mother households (96,084 | 13.4%) accounting for the largest median household size of 3.605 persons per household. non-family households (252,008 | 35.1%) represent the smallest median household size with 1.36 persons per household.
| Household Type | # Households | Household Size |
| Married-Couple | 331,890 (46.3%) | 3.28 |
| Single Male/Father | 37,529 (5.2%) | 3.45 |
| Single Female/Mother | 96,084 (13.4%) | 3.60 |
| Non-family | 252,008 (35.1%) | 1.36 |
| Total Households | 717,511 (100.0%) | 2.69 |
Household Size by Marriage Status in Area Code 321
Out of a total of 717,511 households in Area Code 321, 465,503 (64.9%) are family households, while 252,008 (35.1%) are nonfamily households. The most numerous type of family households are 2-person households, comprising 199,045, and the most common type of nonfamily households are 1-person households, comprising 191,277.
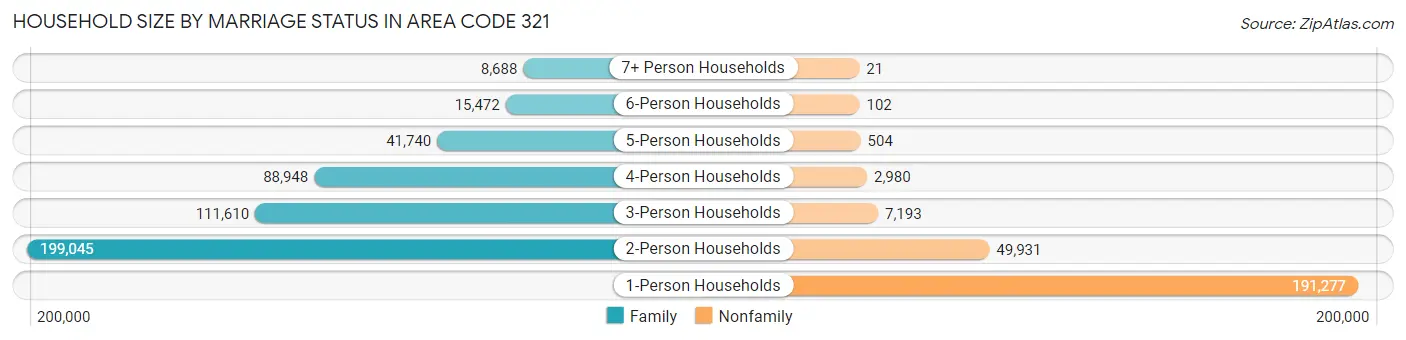
| Household Size | Family Households | Nonfamily Households |
| 1-Person Households | - | 191,277 (26.7%) |
| 2-Person Households | 199,045 (27.7%) | 49,931 (7.0%) |
| 3-Person Households | 111,610 (15.6%) | 7,193 (1.0%) |
| 4-Person Households | 88,948 (12.4%) | 2,980 (0.4%) |
| 5-Person Households | 41,740 (5.8%) | 504 (0.1%) |
| 6-Person Households | 15,472 (2.2%) | 102 (0.0%) |
| 7+ Person Households | 8,688 (1.2%) | 21 (0.0%) |
| Total | 465,503 (64.9%) | 252,008 (35.1%) |
Female Fertility in Area Code 321
Fertility by Age in Area Code 321
Average fertility rate in Area Code 321 is 45.2 births per 1,000 women. Women in the age bracket of 20 to 34 years have the highest fertility rate with 80.5 births per 1,000 women. Women in the age bracket of 20 to 34 years acount for 72.2% of all women with births.
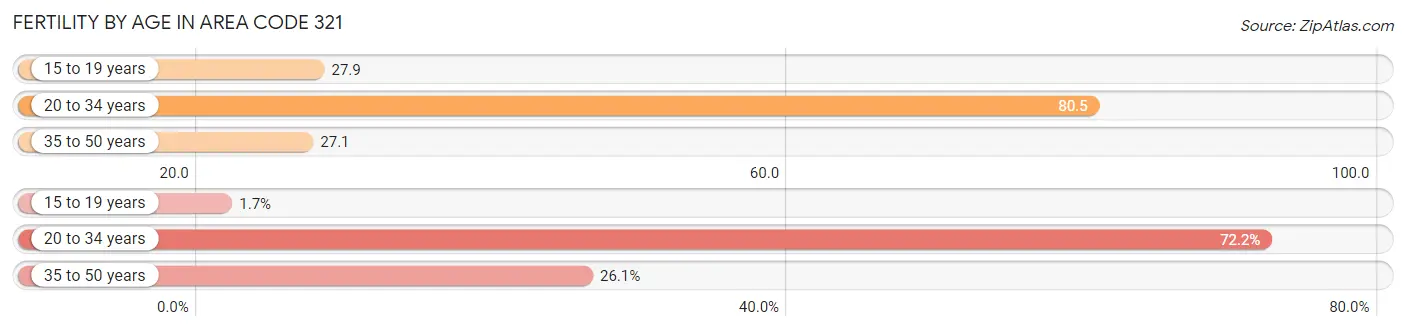
| Age Bracket | Women with Births | Births / 1,000 Women |
| 15 to 19 years | 357 (1.7%) | 27.9 |
| 20 to 34 years | 15,598 (72.2%) | 80.5 |
| 35 to 50 years | 5,644 (26.1%) | 27.1 |
| Total | 21,599 (100.0%) | 45.2 |
Fertility by Age by Marriage Status in Area Code 321
61.6% of women with births (21,599) in Area Code 321 are married. The highest percentage of unmarried women with births falls into 15 to 19 years age bracket with 96.6% of them unmarried at the time of birth, while the lowest percentage of unmarried women with births belong to 35 to 50 years age bracket with 40.4% of them unmarried.
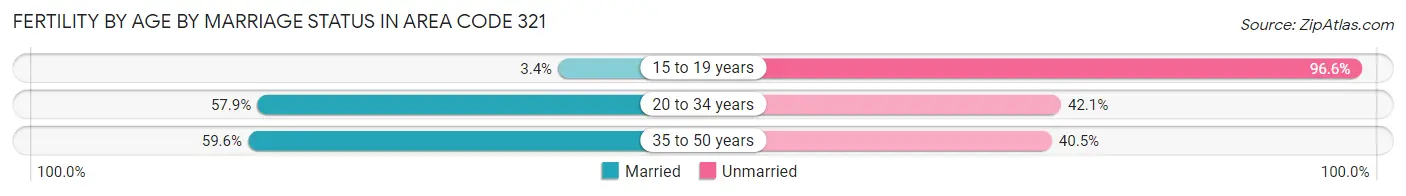
| Age Bracket | Married | Unmarried |
| 15 to 19 years | 12 (3.4%) | 345 (96.6%) |
| 20 to 34 years | 9,030 (57.9%) | 6,568 (42.1%) |
| 35 to 50 years | 3,361 (59.6%) | 2,283 (40.5%) |
| Total | 13,300 (61.6%) | 8,299 (38.4%) |
Fertility by Education in Area Code 321
Average fertility rate in Area Code 321 is 45.2 births per 1,000 women. Women with the education attainment of graduate degree have the highest fertility rate of 61.7 births per 1,000 women, while women with the education attainment of less than high school have the lowest fertility at 33.7 births per 1,000 women. Women with the education attainment of college or associate's degree represent 33.7% of all women with births.
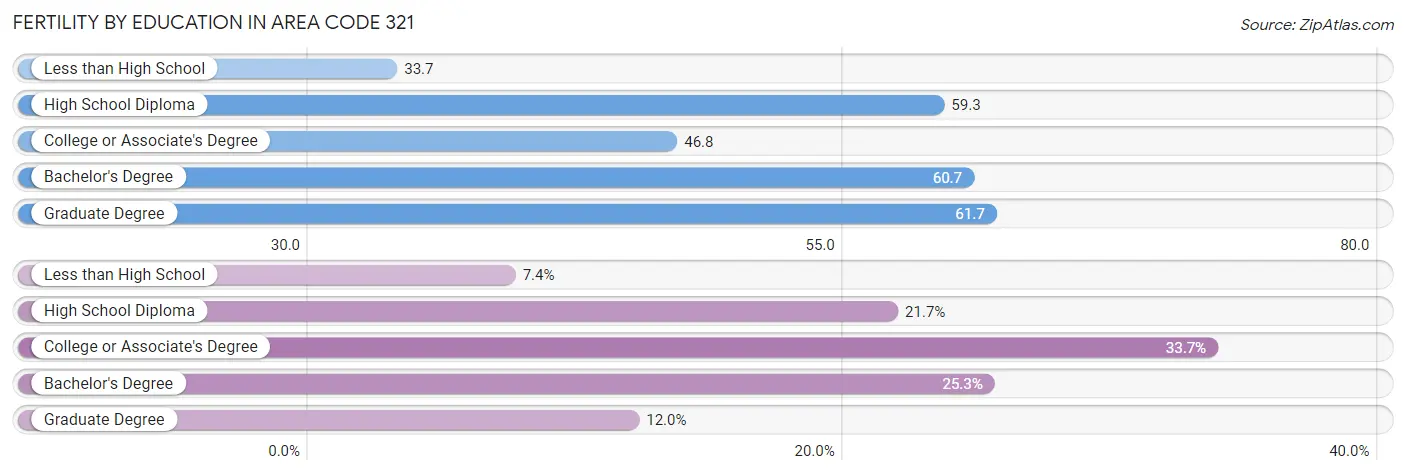
| Educational Attainment | Women with Births | Births / 1,000 Women |
| Less than High School | 1,590 (7.4%) | 33.7 |
| High School Diploma | 4,684 (21.7%) | 59.3 |
| College or Associate's Degree | 7,272 (33.7%) | 46.8 |
| Bachelor's Degree | 5,464 (25.3%) | 60.7 |
| Graduate Degree | 2,589 (12.0%) | 61.7 |
| Total | 21,599 (100.0%) | 45.2 |
Fertility by Education by Marriage Status in Area Code 321
38.4% of women with births in Area Code 321 are unmarried. Women with the educational attainment of bachelor's degree are most likely to be married with 61.4% of them married at childbirth, while women with the educational attainment of less than high school are least likely to be married with 74.7% of them unmarried at childbirth.
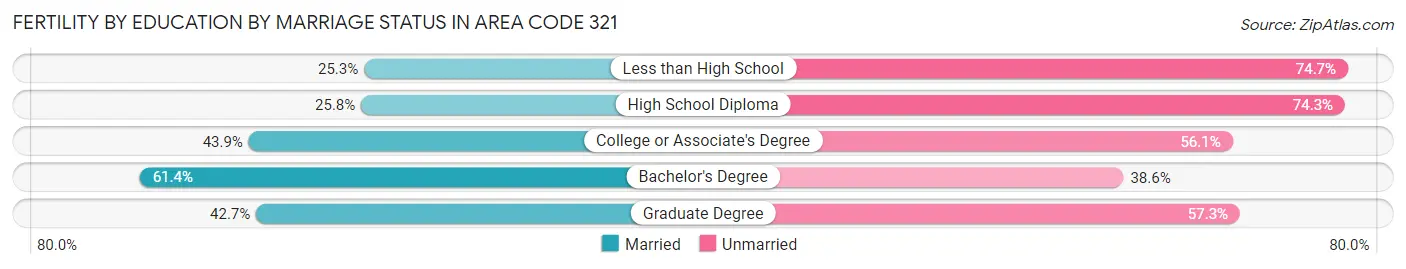
| Educational Attainment | Married | Unmarried |
| Less than High School | 402 (25.3%) | 1,188 (74.7%) |
| High School Diploma | 1,206 (25.8%) | 3,478 (74.3%) |
| College or Associate's Degree | 3,190 (43.9%) | 4,082 (56.1%) |
| Bachelor's Degree | 3,357 (61.4%) | 2,107 (38.6%) |
| Graduate Degree | 1,105 (42.7%) | 1,484 (57.3%) |
| Total | 13,300 (61.6%) | 8,299 (38.4%) |
Employment Characteristics in Area Code 321
Employment by Class of Employer in Area Code 321
Among the 964,918 employed individuals in Area Code 321, private company employees (694,128 | 71.9%), not-for-profit organizations (66,218 | 6.9%), and local government employees (59,988 | 6.2%) make up the most common classes of employment.
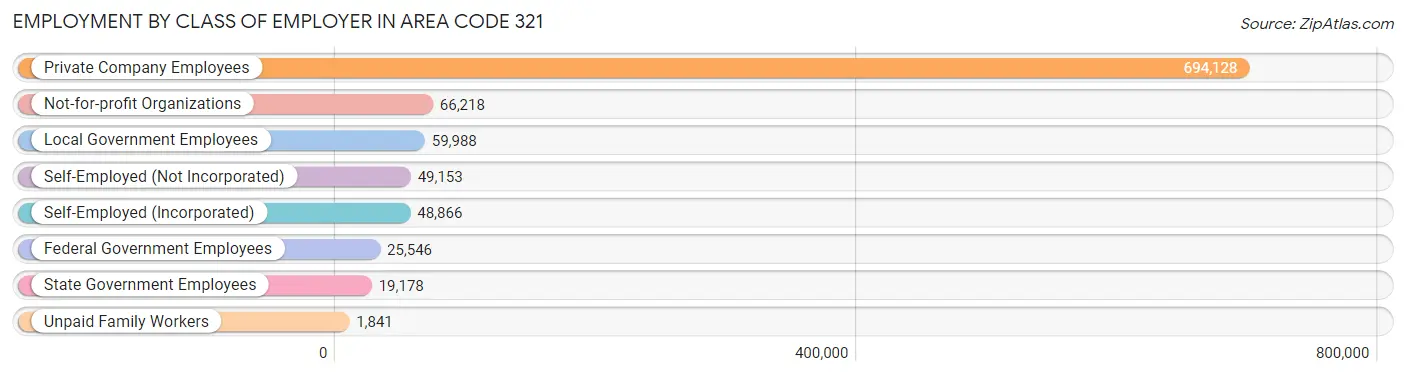
| Employer Class | # Employees | % Employees |
| Private Company Employees | 694,128 | 71.9% |
| Self-Employed (Incorporated) | 48,866 | 5.1% |
| Self-Employed (Not Incorporated) | 49,153 | 5.1% |
| Not-for-profit Organizations | 66,218 | 6.9% |
| Local Government Employees | 59,988 | 6.2% |
| State Government Employees | 19,178 | 2.0% |
| Federal Government Employees | 25,546 | 2.6% |
| Unpaid Family Workers | 1,841 | 0.2% |
| Total | 964,918 | 100.0% |
Employment Status by Age in Area Code 321
According to the labor force statistics for Area Code 321, out of the total population over 16 years of age (1,615,498), 63.9% or 1,032,626 individuals are in the labor force, with 4.8% or 49,669 of them unemployed. The age group with the highest labor force participation rate is 25 to 29 years, with 85.2% or 125,049 individuals in the labor force. Within the labor force, the 16 to 19 years age range has the highest percentage of unemployed individuals, with 830.4% or 265,288 of them being unemployed.
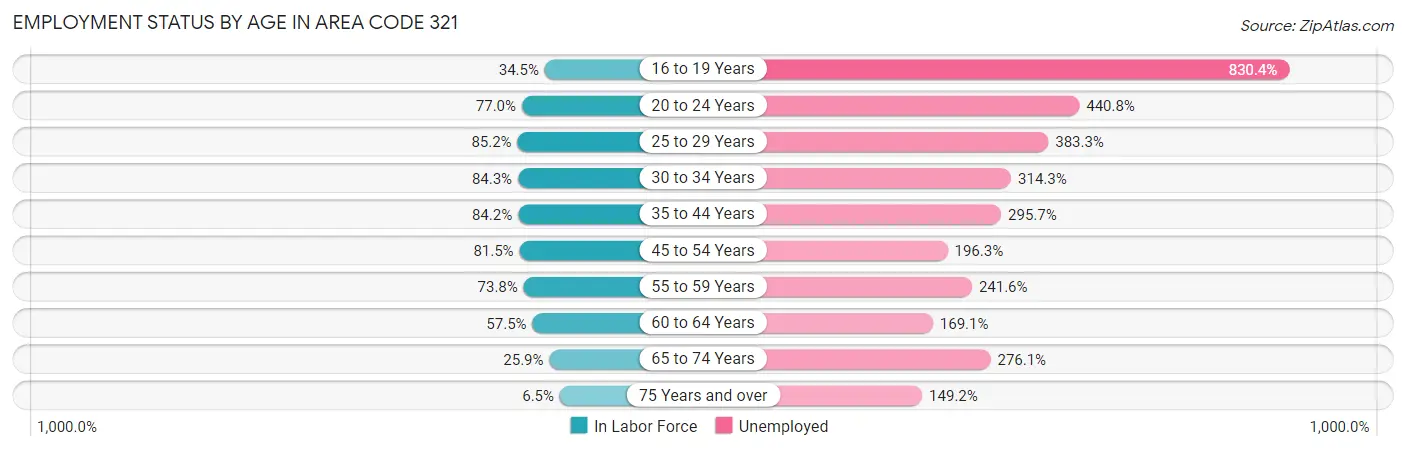
| Age Bracket | In Labor Force | Unemployed |
| 16 to 19 Years | 31,944 (34.5%) | 265,288 (830.4%) |
| 20 to 24 Years | 100,721 (77.0%) | 443,947 (440.8%) |
| 25 to 29 Years | 125,048 (85.2%) | 479,313 (383.3%) |
| 30 to 34 Years | 126,558 (84.3%) | 397,788 (314.3%) |
| 35 to 44 Years | 223,559 (84.2%) | 661,070 (295.7%) |
| 45 to 54 Years | 207,122 (81.5%) | 406,580 (196.3%) |
| 55 to 59 Years | 96,540 (73.8%) | 233,236 (241.6%) |
| 60 to 64 Years | 72,448 (57.5%) | 122,503 (169.1%) |
| 65 to 74 Years | 47,890 (25.9%) | 132,246 (276.1%) |
| 75 Years and over | 8,653 (6.5%) | 12,909 (149.2%) |
| Total | 1,032,560 (63.9%) | 49,633 (4.8%) |
Employment Status by Educational Attainment in Area Code 321
According to labor force statistics for Area Code 321, 78.9% of individuals (847,523) out of the total population between 25 and 64 years of age (1,073,493) are in the labor force, with 264.2% or 2,239,156 of them being unemployed. The group with the highest labor force participation rate are those with the educational attainment of bachelor's degree or higher, with 85.4% or 325,441 individuals in the labor force. Within the labor force, individuals with less than high school education have the highest percentage of unemployment, with 444.3% or 257,383 of them being unemployed.
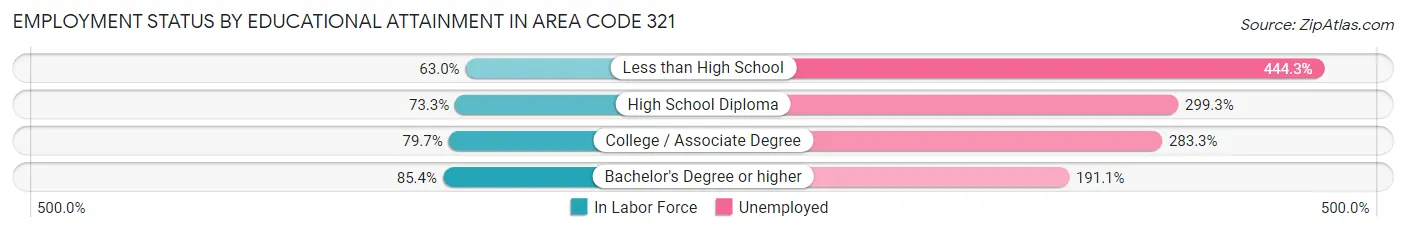
| Educational Attainment | In Labor Force | Unemployed |
| Less than High School | 57,927 (63.0%) | 408,347 (444.3%) |
| High School Diploma | 196,633 (73.3%) | 802,738 (299.3%) |
| College / Associate Degree | 265,071 (79.7%) | 941,916 (283.3%) |
| Bachelor's Degree or higher | 325,452 (85.4%) | 727,900 (191.1%) |
| Total | 847,514 (78.9%) | 2,836,169 (264.2%) |
Employment Occupations by Sex in Area Code 321
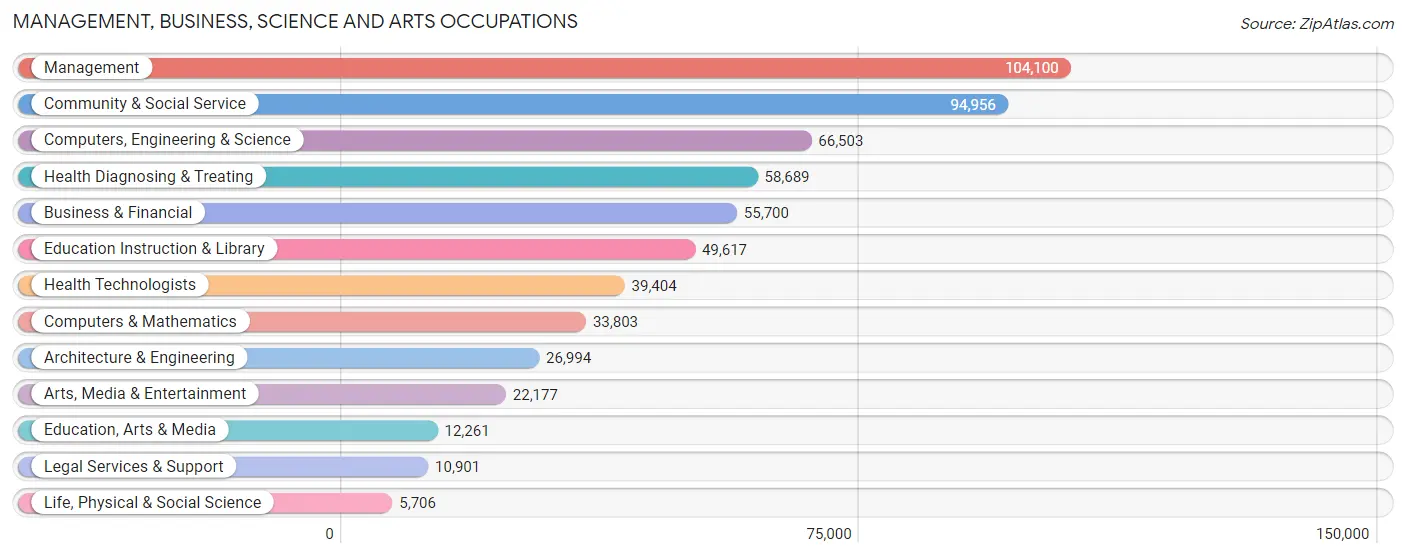
Management, Business, Science and Arts Occupations
The most common Management, Business, Science and Arts occupations in Area Code 321 are Management (104,100 | 10.6%), Community & Social Service (94,956 | 9.7%), Computers, Engineering & Science (66,503 | 6.8%), Health Diagnosing & Treating (58,689 | 6.0%), and Business & Financial (55,700 | 5.7%).
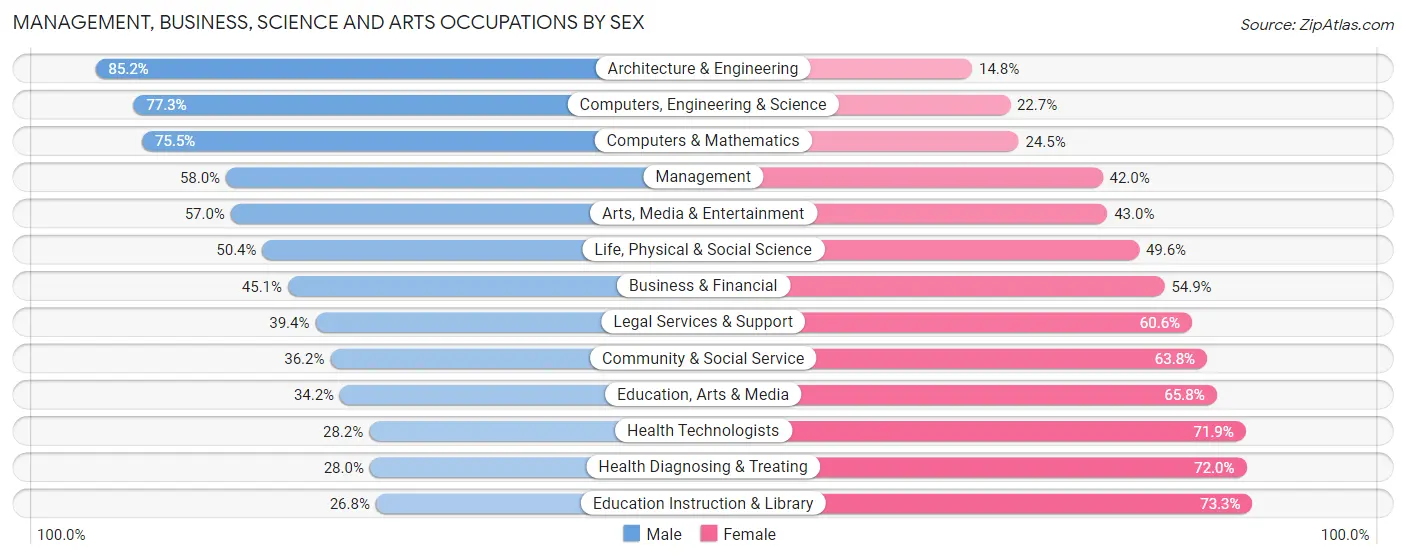
Management, Business, Science and Arts Occupations by Sex
Within the Management, Business, Science and Arts occupations in Area Code 321, the most male-oriented occupations are Architecture & Engineering (85.2%), Computers, Engineering & Science (77.3%), and Computers & Mathematics (75.5%), while the most female-oriented occupations are Education Instruction & Library (73.3%), Health Diagnosing & Treating (72.0%), and Health Technologists (71.9%).
| Occupation | Male | Female |
| Management | 60,373 (58.0%) | 43,727 (42.0%) |
| Business & Financial | 25,112 (45.1%) | 30,588 (54.9%) |
| Computers, Engineering & Science | 51,407 (77.3%) | 15,096 (22.7%) |
| Computers & Mathematics | 25,526 (75.5%) | 8,277 (24.5%) |
| Architecture & Engineering | 23,005 (85.2%) | 3,989 (14.8%) |
| Life, Physical & Social Science | 2,876 (50.4%) | 2,830 (49.6%) |
| Community & Social Service | 34,403 (36.2%) | 60,553 (63.8%) |
| Education, Arts & Media | 4,196 (34.2%) | 8,065 (65.8%) |
| Legal Services & Support | 4,291 (39.4%) | 6,610 (60.6%) |
| Education Instruction & Library | 13,273 (26.8%) | 36,344 (73.3%) |
| Arts, Media & Entertainment | 12,643 (57.0%) | 9,534 (43.0%) |
| Health Diagnosing & Treating | 16,430 (28.0%) | 42,259 (72.0%) |
| Health Technologists | 11,092 (28.1%) | 28,312 (71.9%) |
| Total (Category) | 187,725 (49.4%) | 192,223 (50.6%) |
| Total (Overall) | 519,820 (53.0%) | 460,123 (46.9%) |
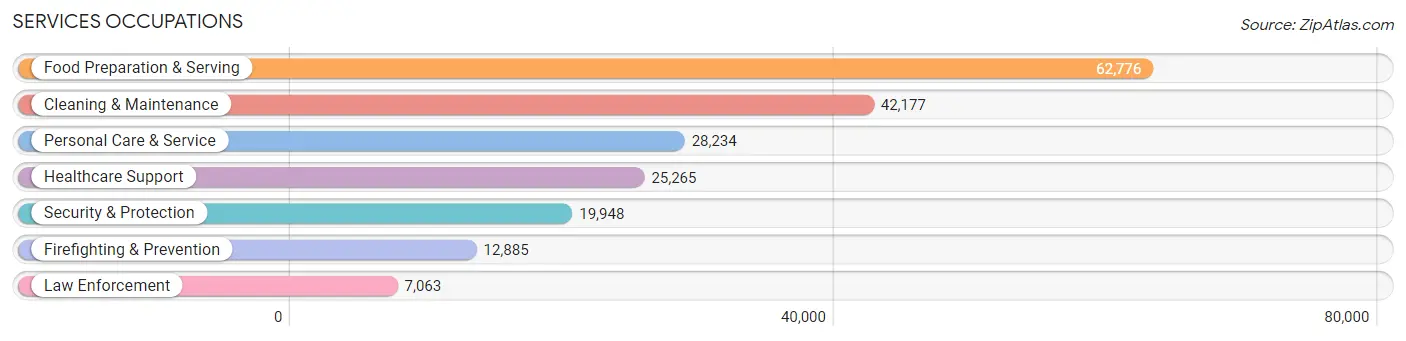
Services Occupations
The most common Services occupations in Area Code 321 are Food Preparation & Serving (62,776 | 6.4%), Cleaning & Maintenance (42,177 | 4.3%), Personal Care & Service (28,234 | 2.9%), Healthcare Support (25,265 | 2.6%), and Security & Protection (19,948 | 2.0%).
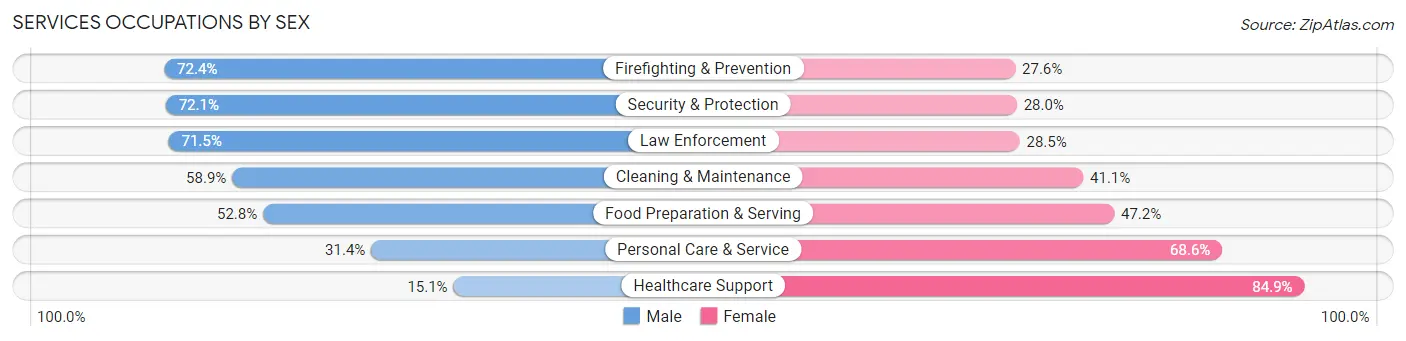
Services Occupations by Sex
Within the Services occupations in Area Code 321, the most male-oriented occupations are Firefighting & Prevention (72.4%), Security & Protection (72.1%), and Law Enforcement (71.5%), while the most female-oriented occupations are Healthcare Support (84.9%), Personal Care & Service (68.6%), and Food Preparation & Serving (47.2%).
| Occupation | Male | Female |
| Healthcare Support | 3,811 (15.1%) | 21,454 (84.9%) |
| Security & Protection | 14,372 (72.1%) | 5,576 (28.0%) |
| Firefighting & Prevention | 9,323 (72.4%) | 3,562 (27.6%) |
| Law Enforcement | 5,049 (71.5%) | 2,014 (28.5%) |
| Food Preparation & Serving | 33,132 (52.8%) | 29,644 (47.2%) |
| Cleaning & Maintenance | 24,843 (58.9%) | 17,334 (41.1%) |
| Personal Care & Service | 8,858 (31.4%) | 19,376 (68.6%) |
| Total (Category) | 85,016 (47.6%) | 93,384 (52.3%) |
| Total (Overall) | 519,820 (53.0%) | 460,123 (46.9%) |
Sales and Office Occupations
The most common Sales and Office occupations in Area Code 321 are Office & Administration (118,796 | 12.1%), and Sales & Related (106,889 | 10.9%).
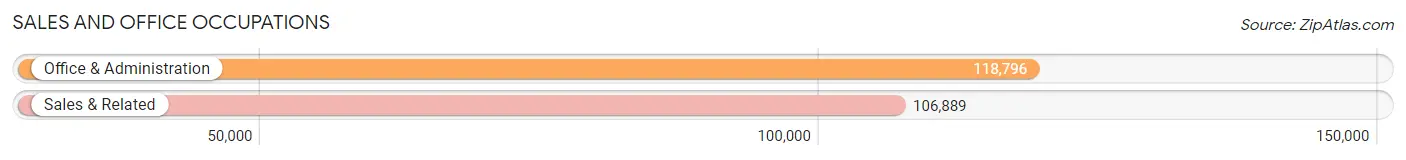
Sales and Office Occupations by Sex
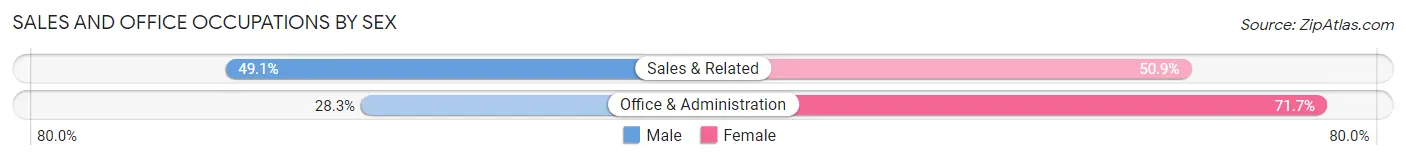
| Occupation | Male | Female |
| Sales & Related | 52,499 (49.1%) | 54,390 (50.9%) |
| Office & Administration | 33,572 (28.3%) | 85,224 (71.7%) |
| Total (Category) | 86,071 (38.1%) | 139,614 (61.9%) |
| Total (Overall) | 519,820 (53.0%) | 460,123 (46.9%) |
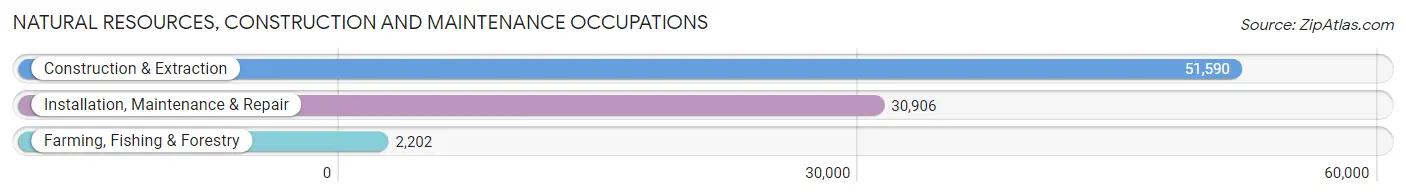
Natural Resources, Construction and Maintenance Occupations
The most common Natural Resources, Construction and Maintenance occupations in Area Code 321 are Construction & Extraction (51,590 | 5.3%), Installation, Maintenance & Repair (30,906 | 3.2%), and Farming, Fishing & Forestry (2,202 | 0.2%).
Natural Resources, Construction and Maintenance Occupations by Sex
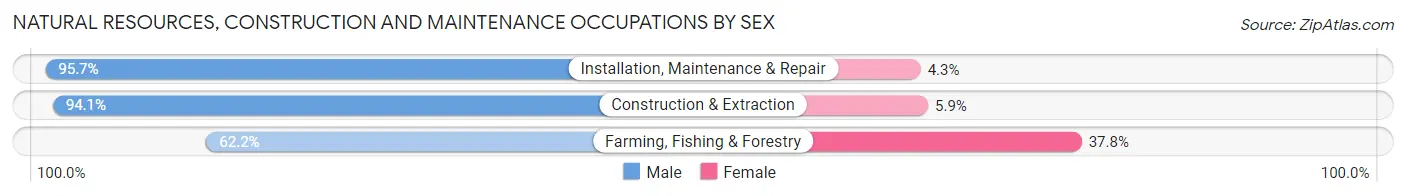
| Occupation | Male | Female |
| Farming, Fishing & Forestry | 1,369 (62.2%) | 833 (37.8%) |
| Construction & Extraction | 48,563 (94.1%) | 3,027 (5.9%) |
| Installation, Maintenance & Repair | 29,568 (95.7%) | 1,338 (4.3%) |
| Total (Category) | 79,500 (93.9%) | 5,198 (6.1%) |
| Total (Overall) | 519,820 (53.0%) | 460,123 (46.9%) |
Production, Transportation and Moving Occupations
The most common Production, Transportation and Moving occupations in Area Code 321 are Transportation (43,740 | 4.5%), Production (34,807 | 3.5%), and Material Moving (32,665 | 3.3%).
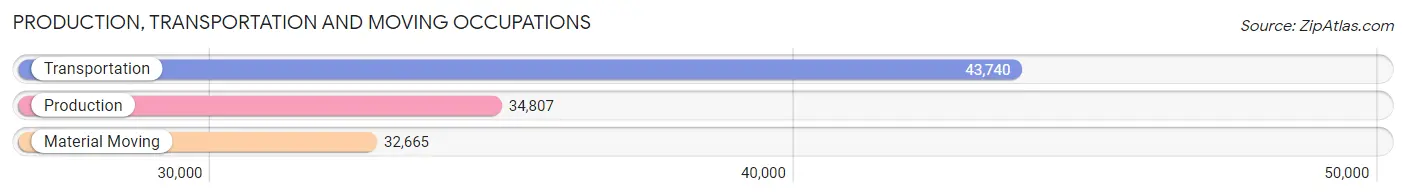
Production, Transportation and Moving Occupations by Sex
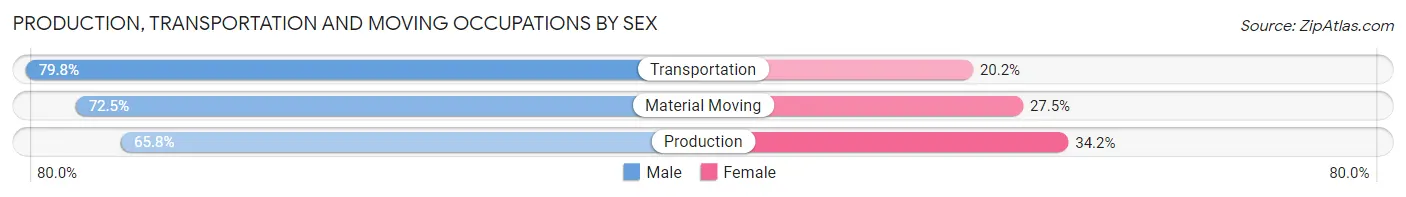
| Occupation | Male | Female |
| Production | 22,913 (65.8%) | 11,894 (34.2%) |
| Transportation | 34,917 (79.8%) | 8,823 (20.2%) |
| Material Moving | 23,678 (72.5%) | 8,987 (27.5%) |
| Total (Category) | 81,508 (73.3%) | 29,704 (26.7%) |
| Total (Overall) | 519,820 (53.0%) | 460,123 (46.9%) |
Employment Industries by Sex in Area Code 321
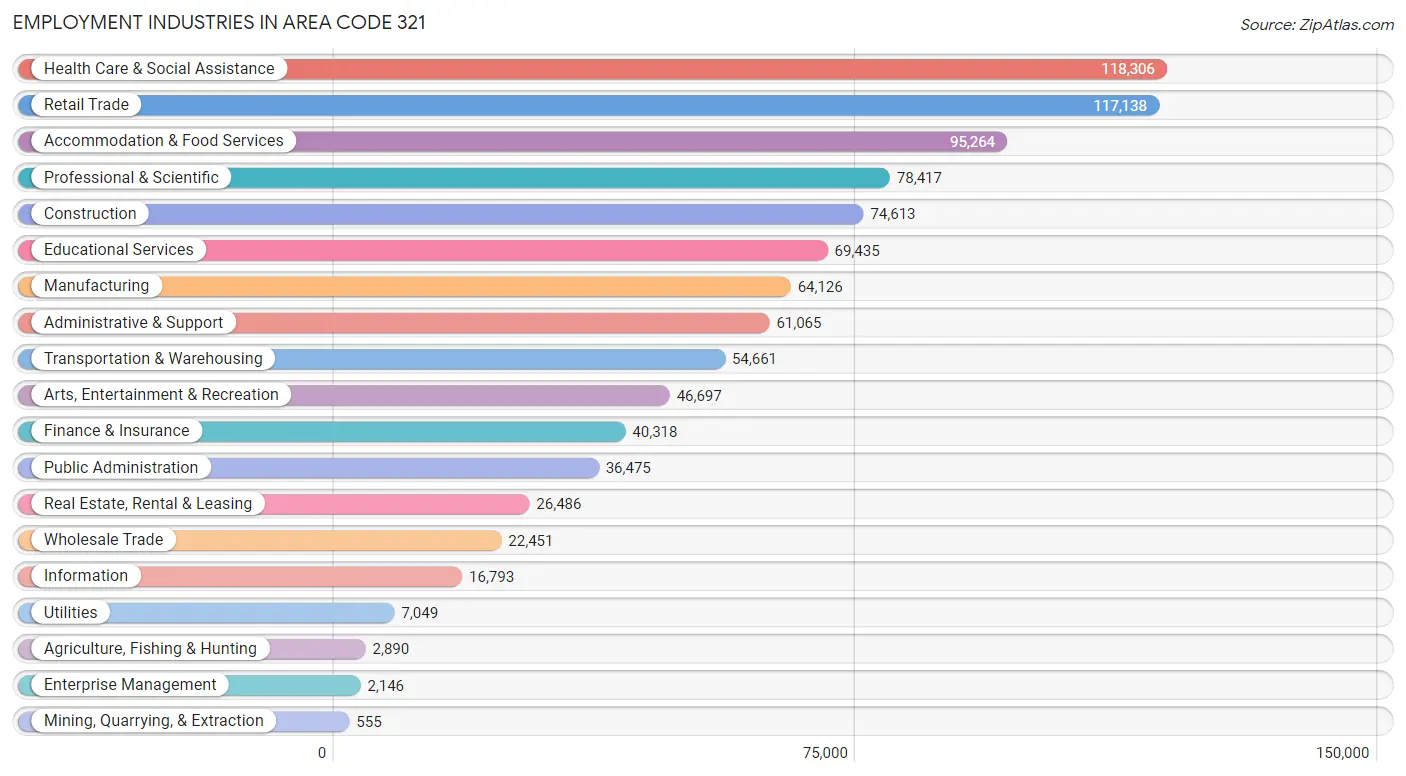
Employment Industries in Area Code 321
The major employment industries in Area Code 321 include Health Care & Social Assistance (118,306 | 12.1%), Retail Trade (117,138 | 11.9%), Accommodation & Food Services (95,264 | 9.7%), Professional & Scientific (78,417 | 8.0%), and Construction (74,613 | 7.6%).
Employment Industries by Sex in Area Code 321
The Area Code 321 industries that see more men than women are Mining, Quarrying, & Extraction (93.3%), Construction (85.7%), and Utilities (75.8%), whereas the industries that tend to have a higher number of women are Health Care & Social Assistance (76.0%), Educational Services (67.8%), and Enterprise Management (61.1%).

| Industry | Male | Female |
| Agriculture, Fishing & Hunting | 1,742 (60.3%) | 1,148 (39.7%) |
| Mining, Quarrying, & Extraction | 518 (93.3%) | 37 (6.7%) |
| Construction | 63,944 (85.7%) | 10,669 (14.3%) |
| Manufacturing | 45,548 (71.0%) | 18,578 (29.0%) |
| Wholesale Trade | 15,637 (69.7%) | 6,814 (30.3%) |
| Retail Trade | 60,632 (51.8%) | 56,506 (48.2%) |
| Transportation & Warehousing | 39,463 (72.2%) | 15,198 (27.8%) |
| Utilities | 5,347 (75.8%) | 1,702 (24.1%) |
| Information | 10,053 (59.9%) | 6,740 (40.1%) |
| Finance & Insurance | 17,363 (43.1%) | 22,955 (56.9%) |
| Real Estate, Rental & Leasing | 13,896 (52.5%) | 12,590 (47.5%) |
| Professional & Scientific | 44,966 (57.3%) | 33,451 (42.7%) |
| Enterprise Management | 835 (38.9%) | 1,311 (61.1%) |
| Administrative & Support | 34,072 (55.8%) | 26,993 (44.2%) |
| Educational Services | 22,384 (32.2%) | 47,051 (67.8%) |
| Health Care & Social Assistance | 28,400 (24.0%) | 89,906 (76.0%) |
| Arts, Entertainment & Recreation | 25,141 (53.8%) | 21,556 (46.2%) |
| Accommodation & Food Services | 46,739 (49.1%) | 48,525 (50.9%) |
| Public Administration | 20,027 (54.9%) | 16,448 (45.1%) |
| Total | 519,820 (53.0%) | 460,123 (46.9%) |
Education in Area Code 321
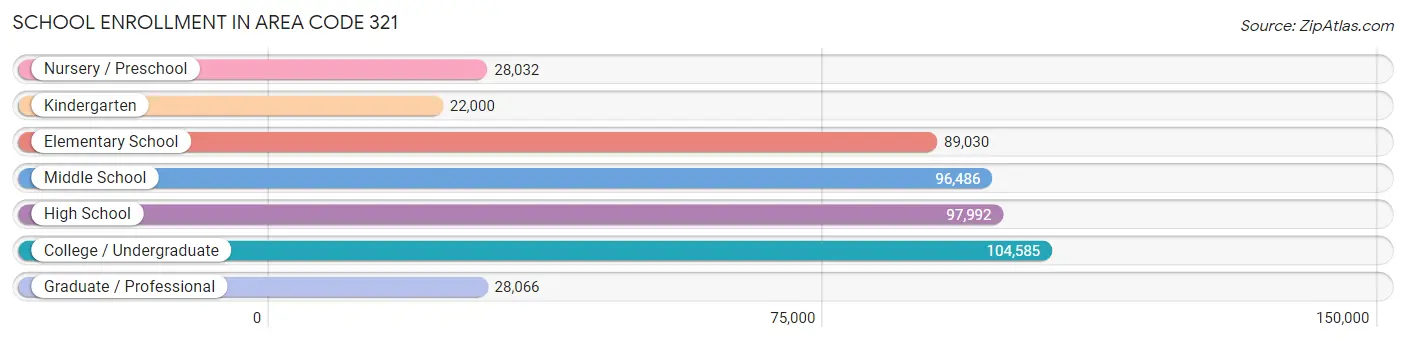
School Enrollment in Area Code 321
The most common levels of schooling among the 466,191 students in Area Code 321 are college / undergraduate (104,585 | 22.4%), high school (97,992 | 21.0%), and middle school (96,486 | 20.7%).
| School Level | # Students | % Students |
| Nursery / Preschool | 28,032 | 6.0% |
| Kindergarten | 22,000 | 4.7% |
| Elementary School | 89,030 | 19.1% |
| Middle School | 96,486 | 20.7% |
| High School | 97,992 | 21.0% |
| College / Undergraduate | 104,585 | 22.4% |
| Graduate / Professional | 28,066 | 6.0% |
| Total | 466,191 | 100.0% |
School Enrollment by Age by Funding Source in Area Code 321
Out of a total of 466,191 students who are enrolled in schools in Area Code 321, 93,823 (20.1%) attend a private institution, while the remaining 372,368 (79.9%) are enrolled in public schools. The age group of 3 to 4 year olds has the highest likelihood of being enrolled in private schools, with 9,755 (45.8% in the age bracket) enrolled. Conversely, the age group of 15 to 17 year olds has the lowest likelihood of being enrolled in a private school, with 62,023 (87.2% in the age bracket) attending a public institution.
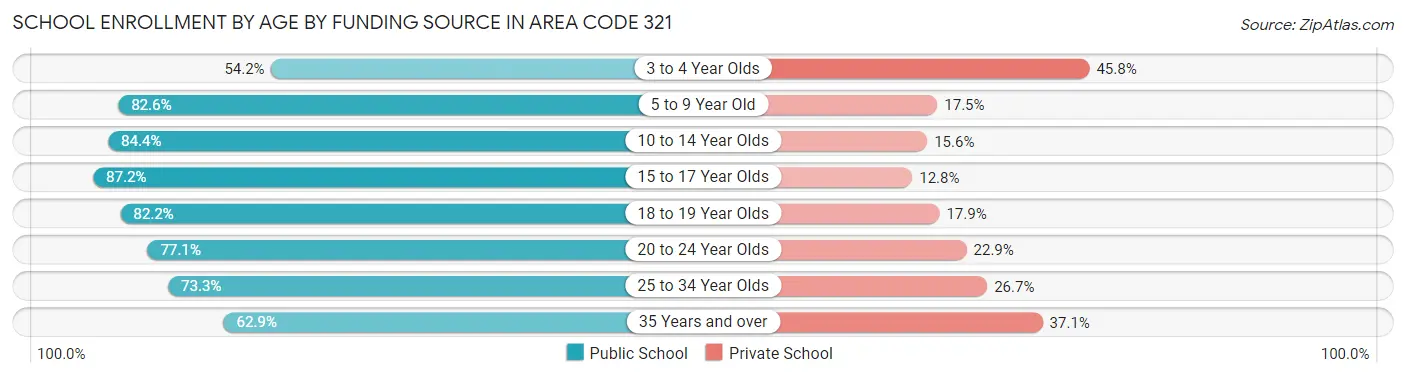
| Age Bracket | Public School | Private School |
| 3 to 4 Year Olds | 11,547 (54.2%) | 9,755 (45.8%) |
| 5 to 9 Year Old | 87,725 (82.6%) | 18,538 (17.4%) |
| 10 to 14 Year Olds | 101,234 (84.4%) | 18,652 (15.6%) |
| 15 to 17 Year Olds | 62,023 (87.2%) | 9,086 (12.8%) |
| 18 to 19 Year Olds | 25,448 (82.2%) | 5,530 (17.8%) |
| 20 to 24 Year Olds | 40,297 (77.1%) | 11,972 (22.9%) |
| 25 to 34 Year Olds | 25,314 (73.3%) | 9,242 (26.7%) |
| 35 Years and over | 18,775 (62.9%) | 11,053 (37.1%) |
| Total | 372,368 (79.9%) | 93,823 (20.1%) |
Educational Attainment by Field of Study in Area Code 321
Business (118,312 | 23.5%), science & technology (55,739 | 11.1%), engineering (52,197 | 10.4%), education (51,278 | 10.2%), and arts & humanities (32,414 | 6.4%) are the most common fields of study among 503,063 individuals in Area Code 321 who have obtained a bachelor's degree or higher.
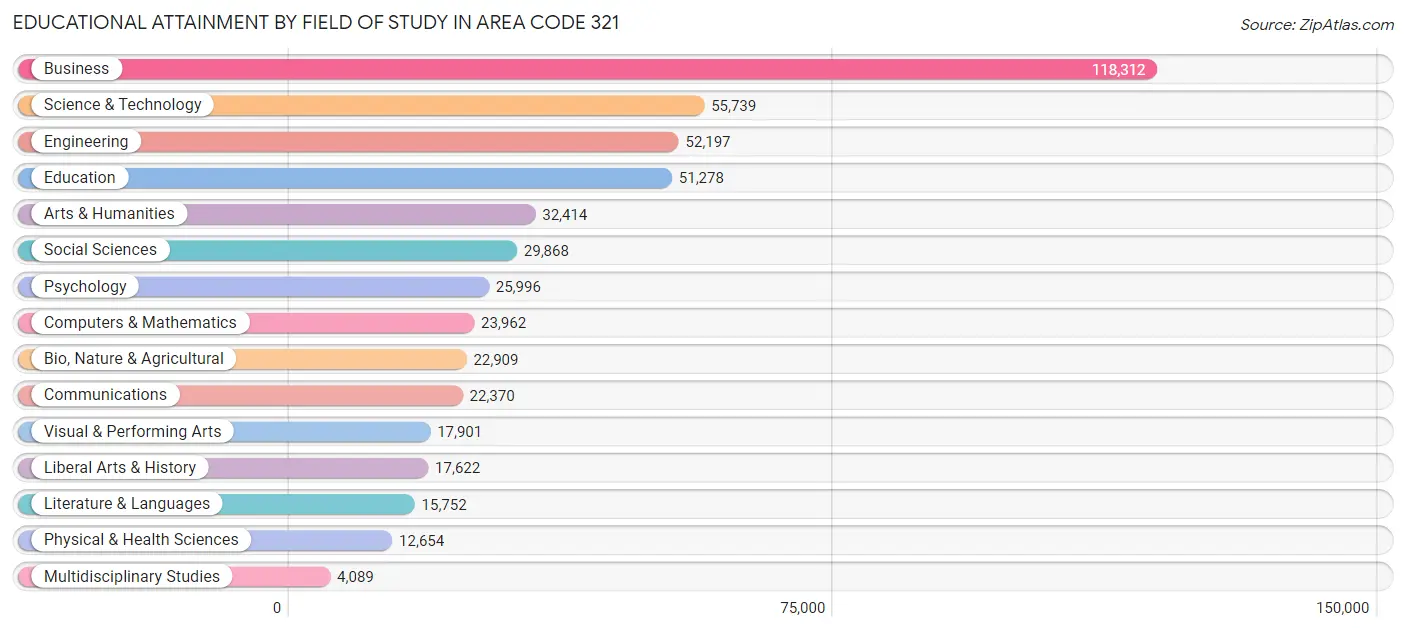
| Field of Study | # Graduates | % Graduates |
| Computers & Mathematics | 23,962 | 4.8% |
| Bio, Nature & Agricultural | 22,909 | 4.5% |
| Physical & Health Sciences | 12,654 | 2.5% |
| Psychology | 25,996 | 5.2% |
| Social Sciences | 29,868 | 5.9% |
| Engineering | 52,197 | 10.4% |
| Multidisciplinary Studies | 4,089 | 0.8% |
| Science & Technology | 55,739 | 11.1% |
| Business | 118,312 | 23.5% |
| Education | 51,278 | 10.2% |
| Literature & Languages | 15,752 | 3.1% |
| Liberal Arts & History | 17,622 | 3.5% |
| Visual & Performing Arts | 17,901 | 3.6% |
| Communications | 22,370 | 4.4% |
| Arts & Humanities | 32,414 | 6.4% |
| Total | 503,063 | 100.0% |
Transportation & Commute in Area Code 321
Vehicle Availability by Sex in Area Code 321
The most prevalent vehicle ownership categories in Area Code 321 are males with 2 vehicles (229,604, accounting for 44.7%) and females with 2 vehicles (190,529, making up 51.1%).
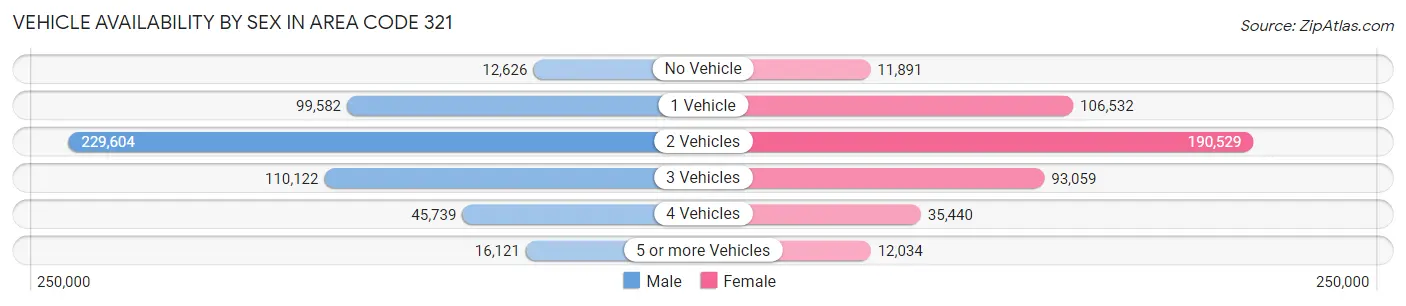
| Vehicles Available | Male | Female |
| No Vehicle | 12,626 (2.5%) | 11,891 (2.6%) |
| 1 Vehicle | 99,582 (19.4%) | 106,532 (23.7%) |
| 2 Vehicles | 229,604 (44.7%) | 190,529 (42.4%) |
| 3 Vehicles | 110,122 (21.4%) | 93,059 (20.7%) |
| 4 Vehicles | 45,739 (8.9%) | 35,440 (7.9%) |
| 5 or more Vehicles | 16,121 (3.1%) | 12,034 (2.7%) |
| Total | 513,794 (100.0%) | 449,485 (100.0%) |
Commute Time in Area Code 321
The most frequently occuring commute durations in Area Code 321 are 30 to 34 minutes (151,503 commuters, 17.9%), 20 to 24 minutes (134,152 commuters, 15.8%), and 15 to 19 minutes (122,242 commuters, 14.4%).
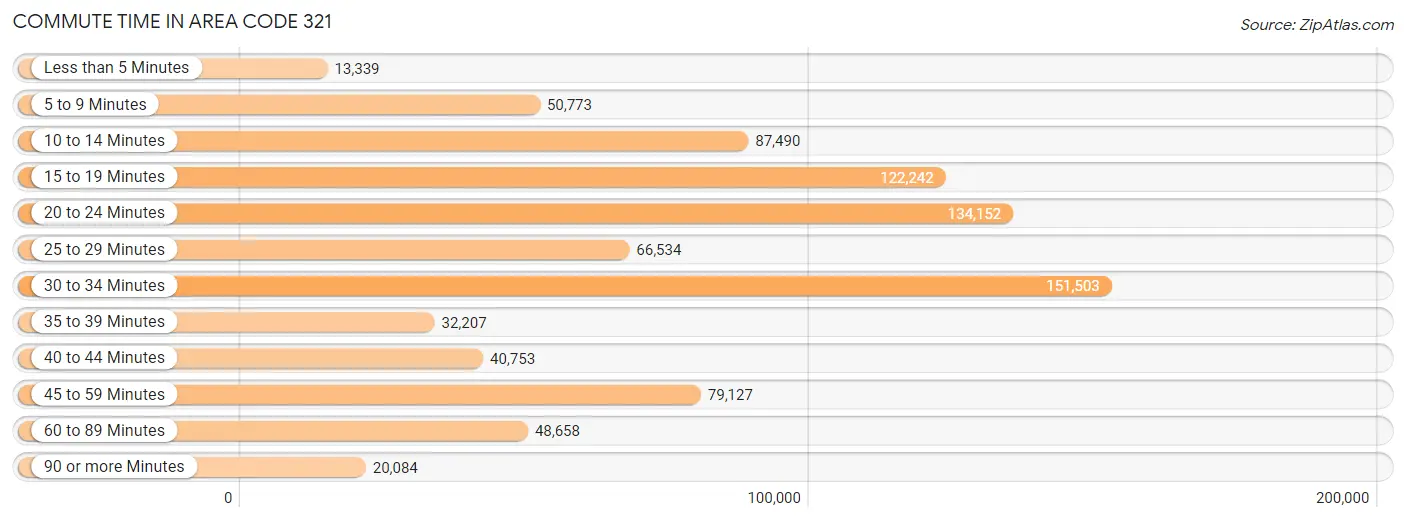
| Commute Time | # Commuters | % Commuters |
| Less than 5 Minutes | 13,339 | 1.6% |
| 5 to 9 Minutes | 50,773 | 6.0% |
| 10 to 14 Minutes | 87,490 | 10.3% |
| 15 to 19 Minutes | 122,242 | 14.4% |
| 20 to 24 Minutes | 134,152 | 15.8% |
| 25 to 29 Minutes | 66,534 | 7.9% |
| 30 to 34 Minutes | 151,503 | 17.9% |
| 35 to 39 Minutes | 32,207 | 3.8% |
| 40 to 44 Minutes | 40,753 | 4.8% |
| 45 to 59 Minutes | 79,127 | 9.3% |
| 60 to 89 Minutes | 48,658 | 5.8% |
| 90 or more Minutes | 20,084 | 2.4% |
Commute Time by Sex in Area Code 321
The most common commute times in Area Code 321 are 30 to 34 minutes (82,580 commuters, 18.1%) for males and 30 to 34 minutes (68,923 commuters, 17.6%) for females.
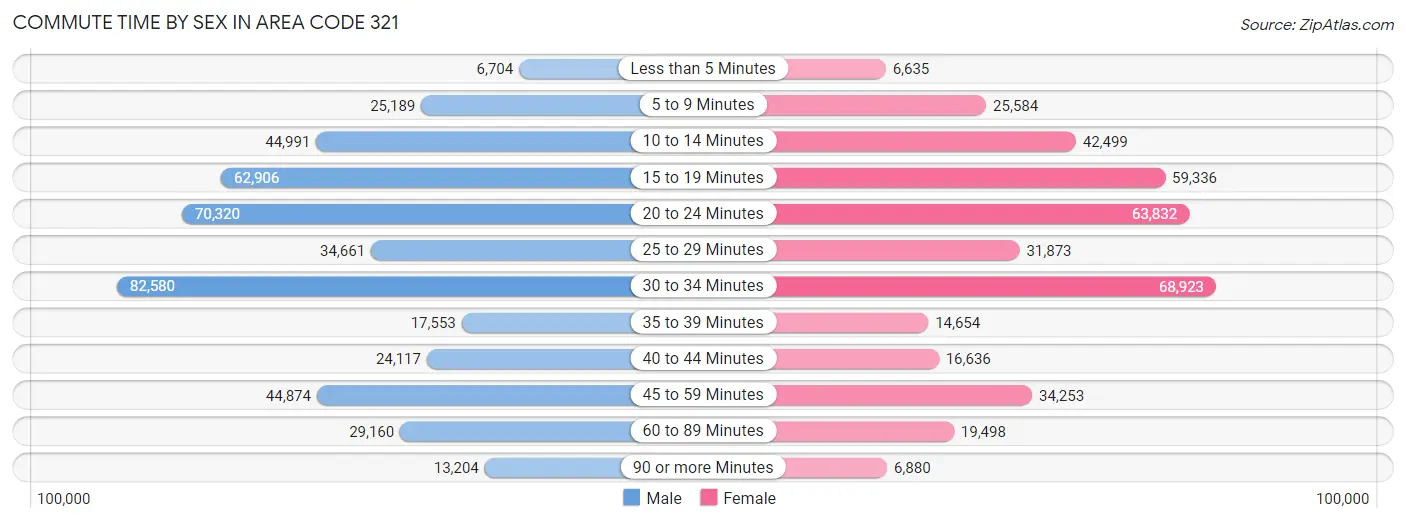
| Commute Time | Male | Female |
| Less than 5 Minutes | 6,704 (1.5%) | 6,635 (1.7%) |
| 5 to 9 Minutes | 25,189 (5.5%) | 25,584 (6.6%) |
| 10 to 14 Minutes | 44,991 (9.9%) | 42,499 (10.9%) |
| 15 to 19 Minutes | 62,906 (13.8%) | 59,336 (15.2%) |
| 20 to 24 Minutes | 70,320 (15.4%) | 63,832 (16.3%) |
| 25 to 29 Minutes | 34,661 (7.6%) | 31,873 (8.2%) |
| 30 to 34 Minutes | 82,580 (18.1%) | 68,923 (17.6%) |
| 35 to 39 Minutes | 17,553 (3.8%) | 14,654 (3.7%) |
| 40 to 44 Minutes | 24,117 (5.3%) | 16,636 (4.3%) |
| 45 to 59 Minutes | 44,874 (9.8%) | 34,253 (8.8%) |
| 60 to 89 Minutes | 29,160 (6.4%) | 19,498 (5.0%) |
| 90 or more Minutes | 13,204 (2.9%) | 6,880 (1.8%) |
Time of Departure to Work by Sex in Area Code 321
The most frequent times of departure to work in Area Code 321 are 7:00 AM to 7:29 AM (66,891, 14.7%) for males and 7:00 AM to 7:29 AM (59,002, 15.1%) for females.
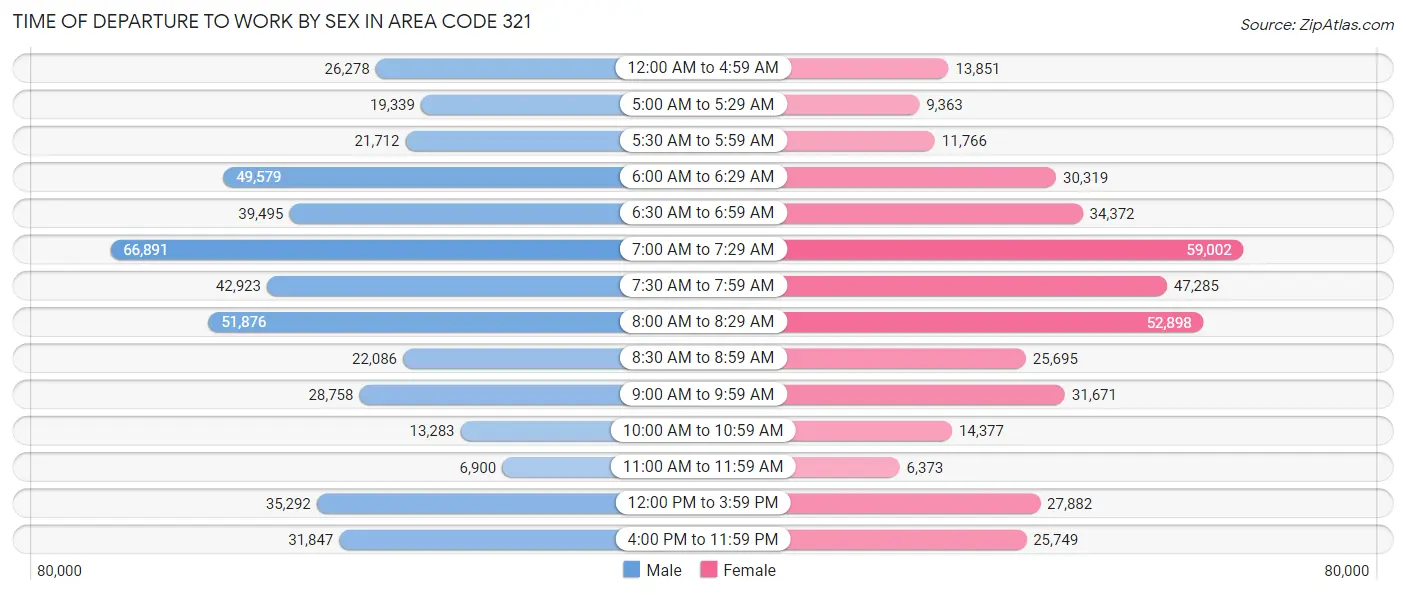
| Time of Departure | Male | Female |
| 12:00 AM to 4:59 AM | 26,278 (5.8%) | 13,851 (3.5%) |
| 5:00 AM to 5:29 AM | 19,339 (4.2%) | 9,363 (2.4%) |
| 5:30 AM to 5:59 AM | 21,712 (4.8%) | 11,766 (3.0%) |
| 6:00 AM to 6:29 AM | 49,579 (10.9%) | 30,319 (7.8%) |
| 6:30 AM to 6:59 AM | 39,495 (8.7%) | 34,372 (8.8%) |
| 7:00 AM to 7:29 AM | 66,891 (14.7%) | 59,002 (15.1%) |
| 7:30 AM to 7:59 AM | 42,923 (9.4%) | 47,285 (12.1%) |
| 8:00 AM to 8:29 AM | 51,876 (11.4%) | 52,898 (13.5%) |
| 8:30 AM to 8:59 AM | 22,086 (4.8%) | 25,695 (6.6%) |
| 9:00 AM to 9:59 AM | 28,758 (6.3%) | 31,671 (8.1%) |
| 10:00 AM to 10:59 AM | 13,283 (2.9%) | 14,377 (3.7%) |
| 11:00 AM to 11:59 AM | 6,900 (1.5%) | 6,373 (1.6%) |
| 12:00 PM to 3:59 PM | 35,292 (7.7%) | 27,882 (7.1%) |
| 4:00 PM to 11:59 PM | 31,847 (7.0%) | 25,749 (6.6%) |
| Total | 456,259 (100.0%) | 390,603 (100.0%) |
Housing Occupancy in Area Code 321
Occupancy by Ownership in Area Code 321
Of the total 717,511 dwellings in Area Code 321, owner-occupied units account for 457,026 (63.7%), while renter-occupied units make up 260,485 (36.3%).
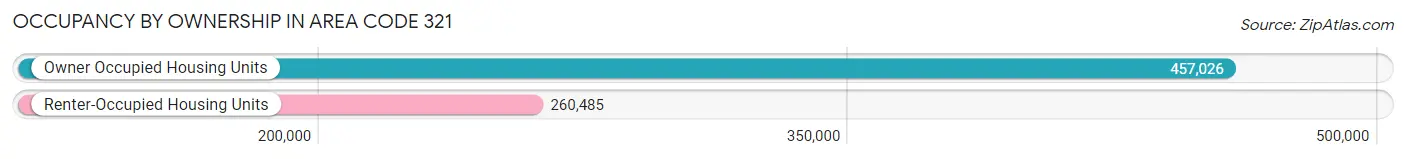
| Occupancy | # Housing Units | % Housing Units |
| Owner Occupied Housing Units | 457,026 | 63.7% |
| Renter-Occupied Housing Units | 260,485 | 36.3% |
| Total Occupied Housing Units | 717,511 | 100.0% |
Occupancy by Household Size in Area Code 321
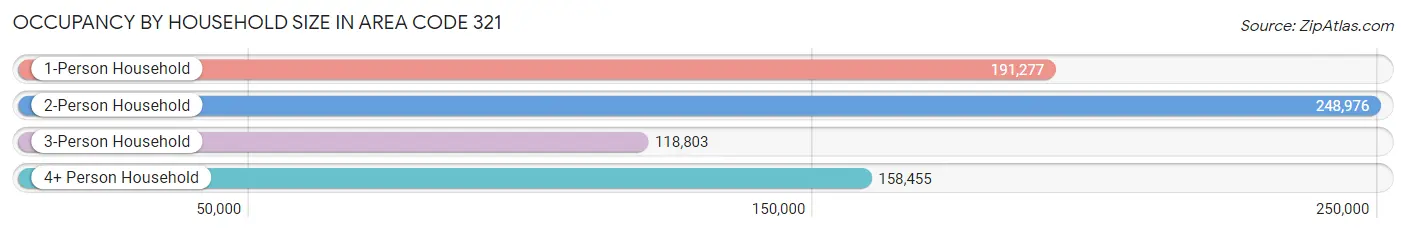
| Household Size | # Housing Units | % Housing Units |
| 1-Person Household | 191,277 | 26.7% |
| 2-Person Household | 248,976 | 34.7% |
| 3-Person Household | 118,803 | 16.6% |
| 4+ Person Household | 158,455 | 22.1% |
| Total Housing Units | 717,511 | 100.0% |
Occupancy by Ownership by Household Size in Area Code 321
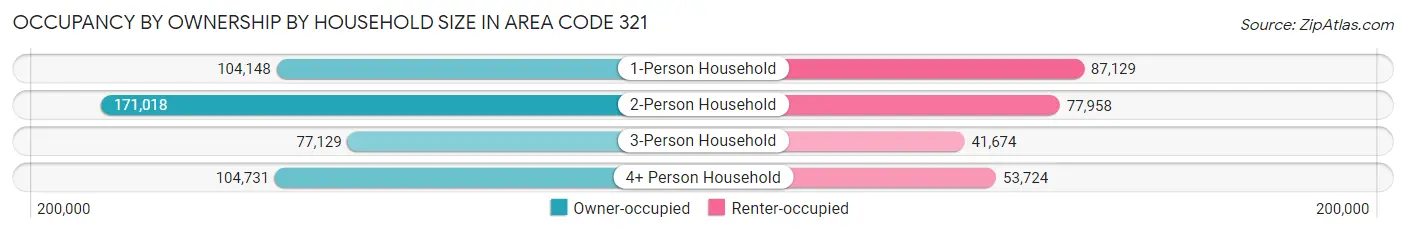
| Household Size | Owner-occupied | Renter-occupied |
| 1-Person Household | 104,148 (54.4%) | 87,129 (45.6%) |
| 2-Person Household | 171,018 (68.7%) | 77,958 (31.3%) |
| 3-Person Household | 77,129 (64.9%) | 41,674 (35.1%) |
| 4+ Person Household | 104,731 (66.1%) | 53,724 (33.9%) |
| Total Housing Units | 457,026 (63.7%) | 260,485 (36.3%) |
Occupancy by Educational Attainment in Area Code 321
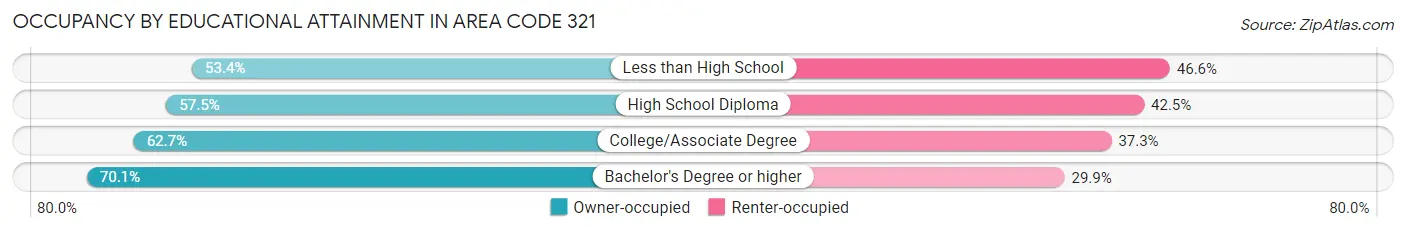
| Household Size | Owner-occupied | Renter-occupied |
| Less than High School | 28,507 (53.4%) | 24,861 (46.6%) |
| High School Diploma | 92,066 (57.5%) | 68,058 (42.5%) |
| College/Associate Degree | 143,089 (62.7%) | 85,178 (37.3%) |
| Bachelor's Degree or higher | 193,364 (70.1%) | 82,388 (29.9%) |
Occupancy by Age of Householder in Area Code 321
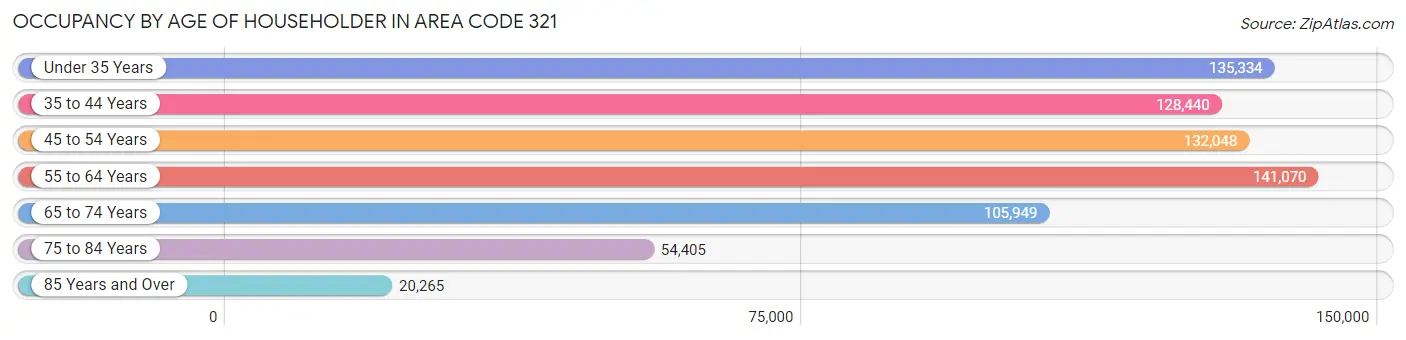
| Age Bracket | # Households | % Households |
| Under 35 Years | 135,334 | 18.9% |
| 35 to 44 Years | 128,440 | 17.9% |
| 45 to 54 Years | 132,048 | 18.4% |
| 55 to 64 Years | 141,070 | 19.7% |
| 65 to 74 Years | 105,949 | 14.8% |
| 75 to 84 Years | 54,405 | 7.6% |
| 85 Years and Over | 20,265 | 2.8% |
| Total | 717,511 | 100.0% |
Housing Finances in Area Code 321
Median Income by Occupancy in Area Code 321
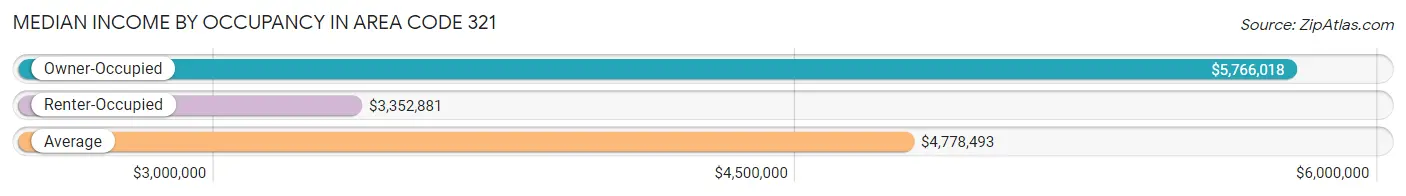
| Occupancy Type | # Households | Median Income |
| Owner-Occupied | 457,026 (63.7%) | $5,766,018 |
| Renter-Occupied | 260,485 (36.3%) | $3,352,881 |
| Average | 717,511 (100.0%) | $4,778,493 |
Occupancy by Householder Income Bracket in Area Code 321
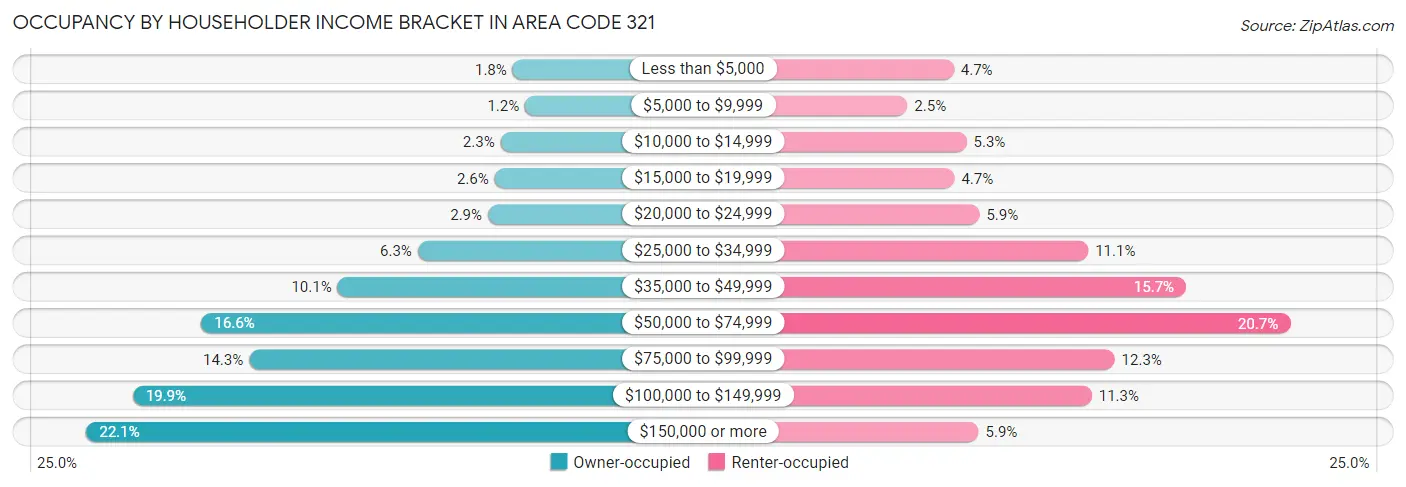
| Income Bracket | Owner-occupied | Renter-occupied |
| Less than $5,000 | 8,034 (1.8%) | 12,195 (4.7%) |
| $5,000 to $9,999 | 5,369 (1.2%) | 6,428 (2.5%) |
| $10,000 to $14,999 | 10,679 (2.3%) | 13,775 (5.3%) |
| $15,000 to $19,999 | 11,986 (2.6%) | 12,278 (4.7%) |
| $20,000 to $24,999 | 13,449 (2.9%) | 15,372 (5.9%) |
| $25,000 to $34,999 | 28,706 (6.3%) | 28,849 (11.1%) |
| $35,000 to $49,999 | 46,138 (10.1%) | 40,987 (15.7%) |
| $50,000 to $74,999 | 75,766 (16.6%) | 53,887 (20.7%) |
| $75,000 to $99,999 | 65,382 (14.3%) | 32,149 (12.3%) |
| $100,000 to $149,999 | 90,698 (19.9%) | 29,297 (11.3%) |
| $150,000 or more | 100,819 (22.1%) | 15,268 (5.9%) |
| Total | 457,026 (100.0%) | 260,485 (100.0%) |
Monthly Housing Cost Tiers in Area Code 321
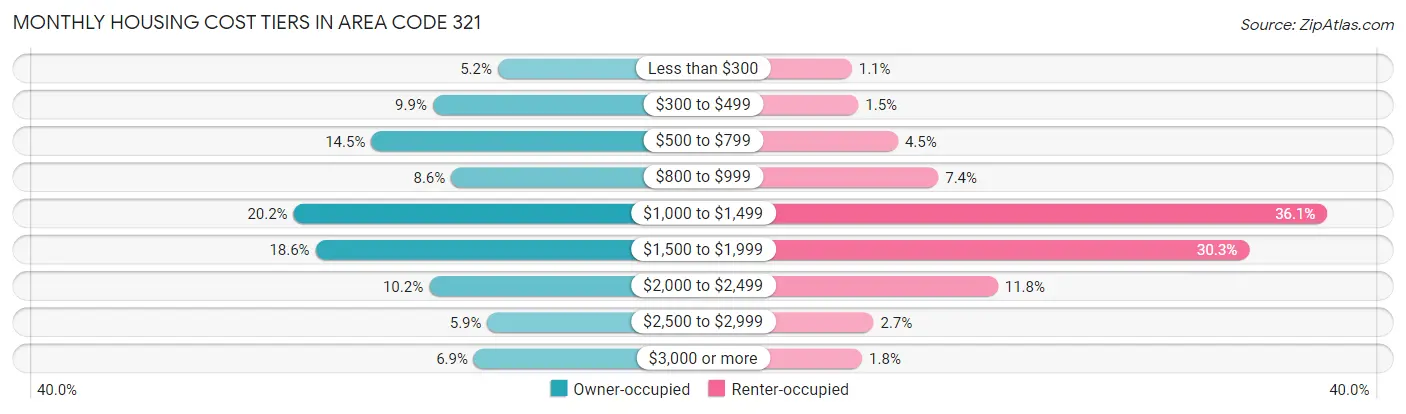
| Monthly Cost | Owner-occupied | Renter-occupied |
| Less than $300 | 23,557 (5.1%) | 2,762 (1.1%) |
| $300 to $499 | 45,439 (9.9%) | 4,007 (1.5%) |
| $500 to $799 | 66,119 (14.5%) | 11,618 (4.5%) |
| $800 to $999 | 39,272 (8.6%) | 19,349 (7.4%) |
| $1,000 to $1,499 | 92,309 (20.2%) | 93,969 (36.1%) |
| $1,500 to $1,999 | 84,918 (18.6%) | 78,973 (30.3%) |
| $2,000 to $2,499 | 46,711 (10.2%) | 30,769 (11.8%) |
| $2,500 to $2,999 | 27,061 (5.9%) | 6,935 (2.7%) |
| $3,000 or more | 31,640 (6.9%) | 4,741 (1.8%) |
| Total | 457,026 (100.0%) | 260,485 (100.0%) |
Physical Housing Characteristics in Area Code 321
Housing Structures in Area Code 321
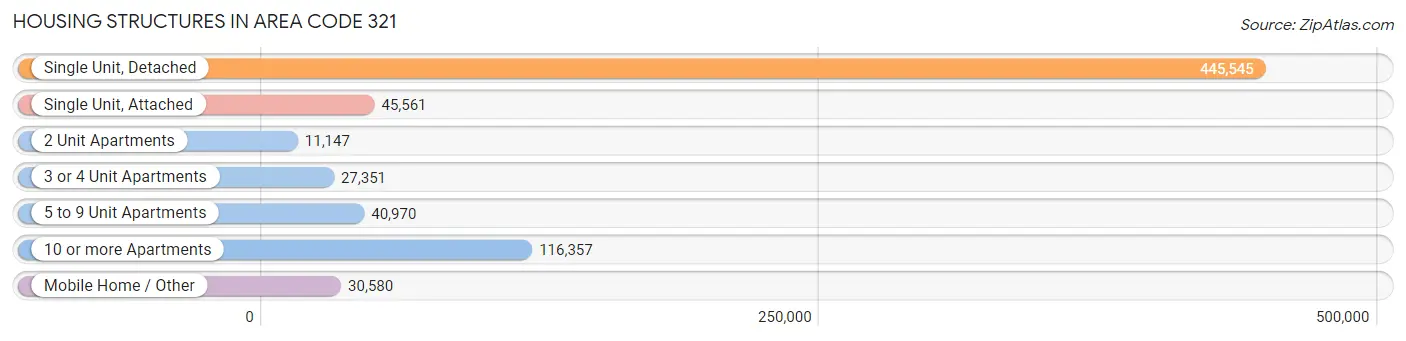
| Structure Type | # Housing Units | % Housing Units |
| Single Unit, Detached | 445,545 | 62.1% |
| Single Unit, Attached | 45,561 | 6.4% |
| 2 Unit Apartments | 11,147 | 1.5% |
| 3 or 4 Unit Apartments | 27,351 | 3.8% |
| 5 to 9 Unit Apartments | 40,970 | 5.7% |
| 10 or more Apartments | 116,357 | 16.2% |
| Mobile Home / Other | 30,580 | 4.3% |
| Total | 717,511 | 100.0% |
Housing Structures by Occupancy in Area Code 321
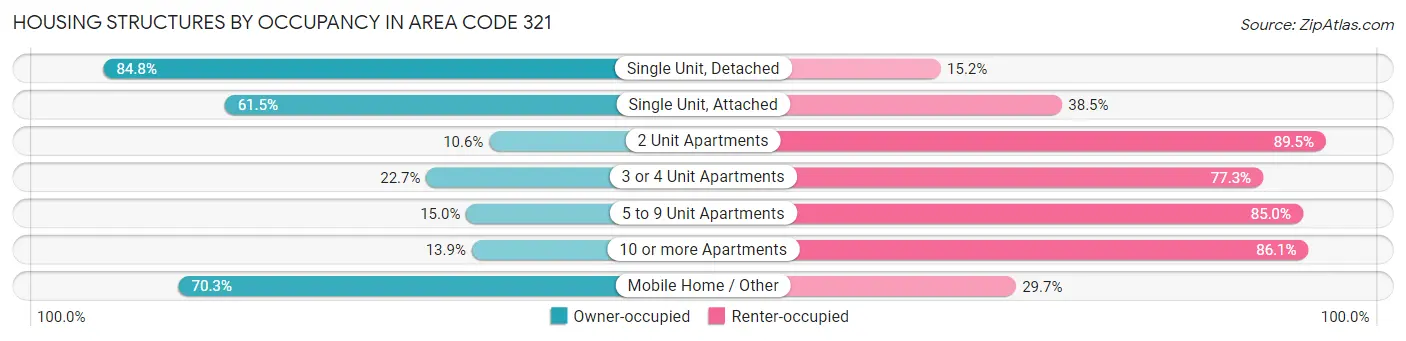
| Structure Type | Owner-occupied | Renter-occupied |
| Single Unit, Detached | 377,826 (84.8%) | 67,719 (15.2%) |
| Single Unit, Attached | 28,001 (61.5%) | 17,560 (38.5%) |
| 2 Unit Apartments | 1,176 (10.5%) | 9,971 (89.4%) |
| 3 or 4 Unit Apartments | 6,198 (22.7%) | 21,153 (77.3%) |
| 5 to 9 Unit Apartments | 6,134 (15.0%) | 34,836 (85.0%) |
| 10 or more Apartments | 16,180 (13.9%) | 100,177 (86.1%) |
| Mobile Home / Other | 21,511 (70.3%) | 9,069 (29.7%) |
| Total | 457,026 (63.7%) | 260,485 (36.3%) |
Housing Structures by Number of Rooms in Area Code 321
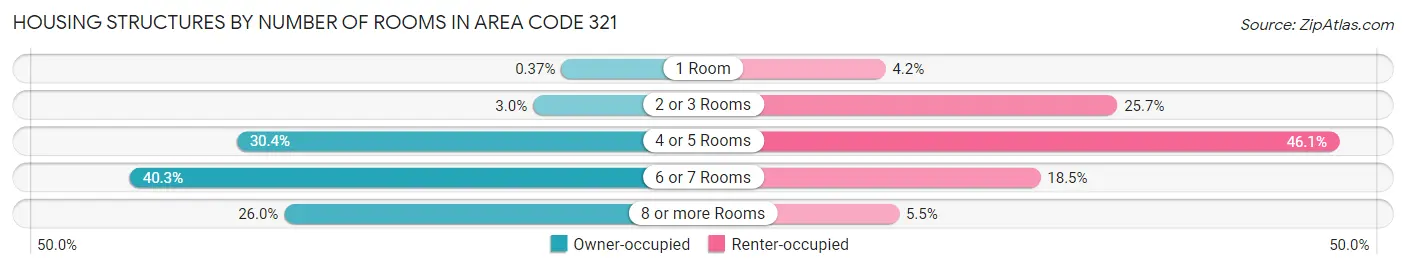
| Number of Rooms | Owner-occupied | Renter-occupied |
| 1 Room | 1,694 (0.4%) | 10,962 (4.2%) |
| 2 or 3 Rooms | 13,642 (3.0%) | 66,827 (25.7%) |
| 4 or 5 Rooms | 138,866 (30.4%) | 120,172 (46.1%) |
| 6 or 7 Rooms | 184,027 (40.3%) | 48,291 (18.5%) |
| 8 or more Rooms | 118,797 (26.0%) | 14,233 (5.5%) |
| Total | 457,026 (100.0%) | 260,485 (100.0%) |
Housing Structure by Heating Type in Area Code 321
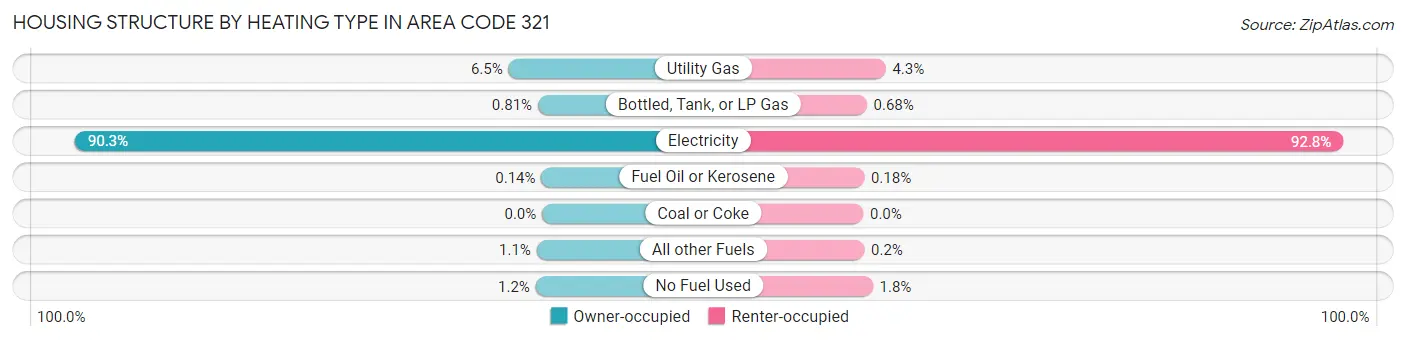
| Heating Type | Owner-occupied | Renter-occupied |
| Utility Gas | 29,602 (6.5%) | 11,308 (4.3%) |
| Bottled, Tank, or LP Gas | 3,683 (0.8%) | 1,759 (0.7%) |
| Electricity | 412,618 (90.3%) | 241,621 (92.8%) |
| Fuel Oil or Kerosene | 632 (0.1%) | 471 (0.2%) |
| Coal or Coke | 19 (0.0%) | 11 (0.0%) |
| All other Fuels | 4,805 (1.1%) | 521 (0.2%) |
| No Fuel Used | 5,667 (1.2%) | 4,794 (1.8%) |
| Total | 457,026 (100.0%) | 260,485 (100.0%) |
Household Vehicle Usage in Area Code 321
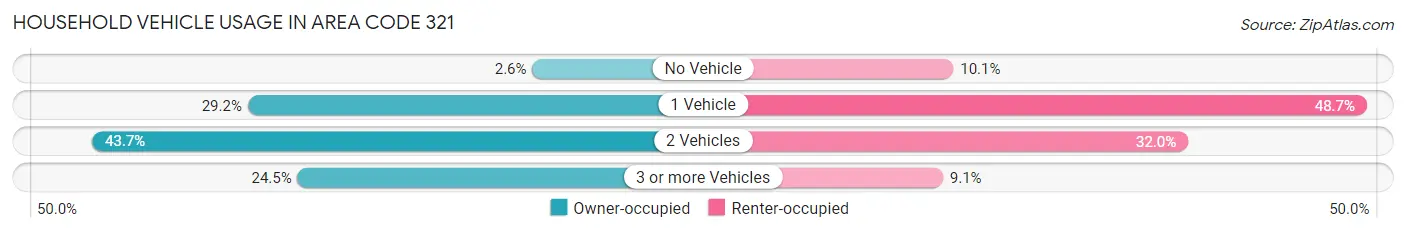
| Vehicles per Household | Owner-occupied | Renter-occupied |
| No Vehicle | 11,902 (2.6%) | 26,356 (10.1%) |
| 1 Vehicle | 133,334 (29.2%) | 126,889 (48.7%) |
| 2 Vehicles | 199,750 (43.7%) | 83,430 (32.0%) |
| 3 or more Vehicles | 112,040 (24.5%) | 23,810 (9.1%) |
| Total | 457,026 (100.0%) | 260,485 (100.0%) |
Real Estate & Mortgages in Area Code 321
Real Estate and Mortgage Overview in Area Code 321
| Characteristic | Without Mortgage | With Mortgage |
| Housing Units | 162,940 | 294,086 |
| Median Property Value | $18,765,500 | $21,119,600 |
| Median Household Income | $4,564,021 | $74,782 |
| Monthly Housing Costs | $38,082 | $30,581 |
| Real Estate Taxes | $143,629 | $9,091 |
Property Value by Mortgage Status in Area Code 321
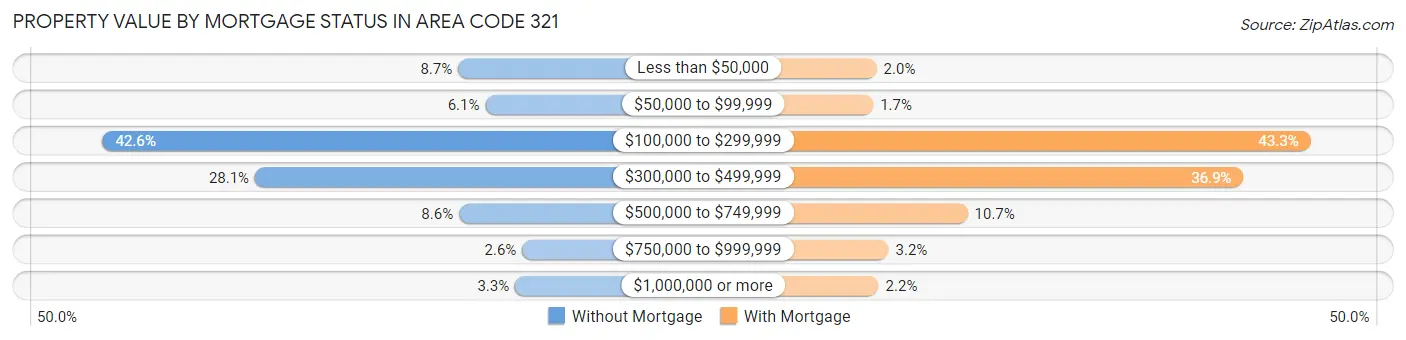
| Property Value | Without Mortgage | With Mortgage |
| Less than $50,000 | 14,202 (8.7%) | 5,918 (2.0%) |
| $50,000 to $99,999 | 9,970 (6.1%) | 4,949 (1.7%) |
| $100,000 to $299,999 | 69,384 (42.6%) | 127,464 (43.3%) |
| $300,000 to $499,999 | 45,720 (28.1%) | 108,647 (36.9%) |
| $500,000 to $749,999 | 14,056 (8.6%) | 31,372 (10.7%) |
| $750,000 to $999,999 | 4,245 (2.6%) | 9,278 (3.2%) |
| $1,000,000 or more | 5,363 (3.3%) | 6,458 (2.2%) |
| Total | 162,940 (100.0%) | 294,086 (100.0%) |
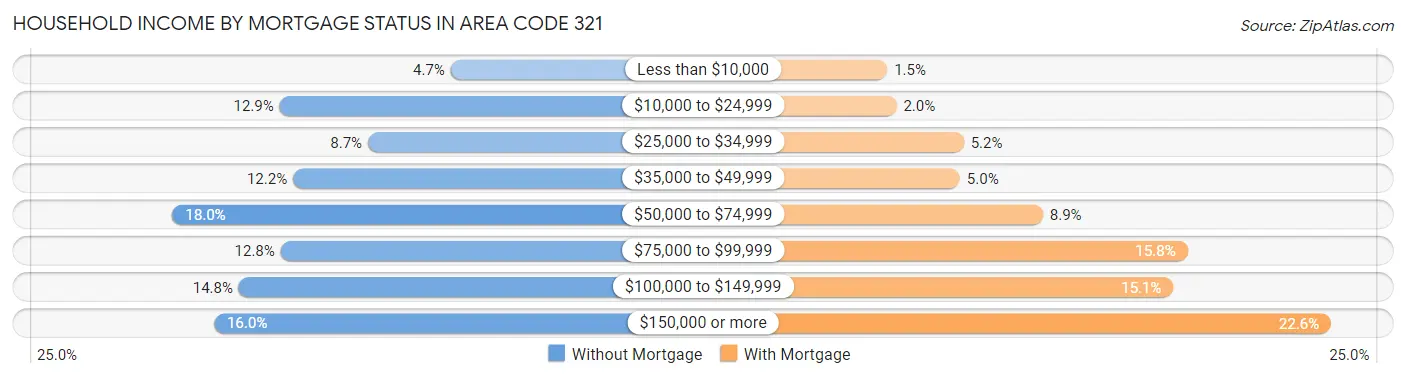
Household Income by Mortgage Status in Area Code 321
| Household Income | Without Mortgage | With Mortgage |
| Less than $10,000 | 7,680 (4.7%) | 4,439 (1.5%) |
| $10,000 to $24,999 | 20,958 (12.9%) | 5,723 (1.9%) |
| $25,000 to $34,999 | 14,096 (8.6%) | 15,156 (5.1%) |
| $35,000 to $49,999 | 19,915 (12.2%) | 14,610 (5.0%) |
| $50,000 to $74,999 | 29,263 (18.0%) | 26,223 (8.9%) |
| $75,000 to $99,999 | 20,880 (12.8%) | 46,503 (15.8%) |
| $100,000 to $149,999 | 24,111 (14.8%) | 44,502 (15.1%) |
| $150,000 or more | 26,037 (16.0%) | 66,587 (22.6%) |
| Total | 162,940 (100.0%) | 294,086 (100.0%) |
Property Value to Household Income Ratio in Area Code 321

| Value-to-Income Ratio | Without Mortgage | With Mortgage |
| Less than 2.0x | 40,134 (24.6%) | 6,449,839 (2,193.2%) |
| 2.0x to 2.9x | 25,425 (15.6%) | 63,544 (21.6%) |
| 3.0x to 3.9x | 21,048 (12.9%) | 70,795 (24.1%) |
| 4.0x or more | 74,036 (45.4%) | 51,517 (17.5%) |
| Total | 162,940 (100.0%) | 294,086 (100.0%) |
Real Estate Taxes by Mortgage Status in Area Code 321
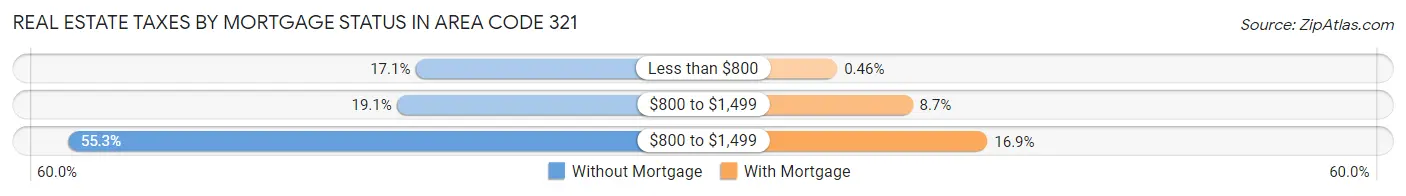
| Property Taxes | Without Mortgage | With Mortgage |
| Less than $800 | 27,826 (17.1%) | 1,355 (0.5%) |
| $800 to $1,499 | 31,176 (19.1%) | 25,629 (8.7%) |
| $800 to $1,499 | 90,044 (55.3%) | 49,722 (16.9%) |
| Total | 162,940 (100.0%) | 294,086 (100.0%) |
Health & Disability in Area Code 321
Health Insurance Coverage by Age in Area Code 321
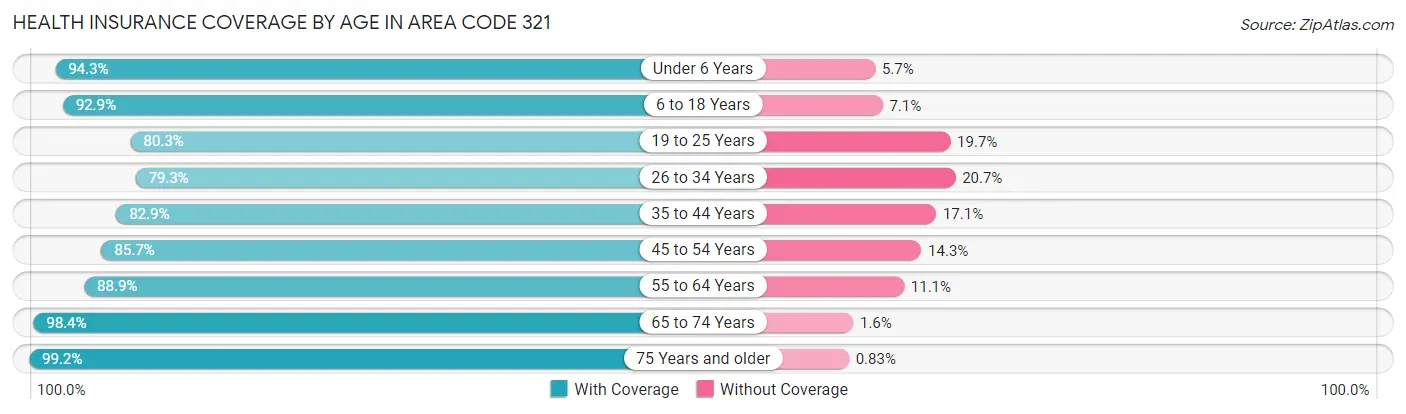
| Age Bracket | With Coverage | Without Coverage |
| Under 6 Years | 118,310 (94.3%) | 7,172 (5.7%) |
| 6 to 18 Years | 285,451 (92.9%) | 21,872 (7.1%) |
| 19 to 25 Years | 146,375 (80.3%) | 36,001 (19.7%) |
| 26 to 34 Years | 206,928 (79.3%) | 53,943 (20.7%) |
| 35 to 44 Years | 218,101 (82.9%) | 44,981 (17.1%) |
| 45 to 54 Years | 216,885 (85.7%) | 36,280 (14.3%) |
| 55 to 64 Years | 226,908 (88.9%) | 28,369 (11.1%) |
| 65 to 74 Years | 179,915 (98.4%) | 2,983 (1.6%) |
| 75 Years and older | 126,995 (99.2%) | 1,064 (0.8%) |
| Total | 1,725,868 (88.1%) | 232,665 (11.9%) |
Health Insurance Coverage by Citizenship Status in Area Code 321
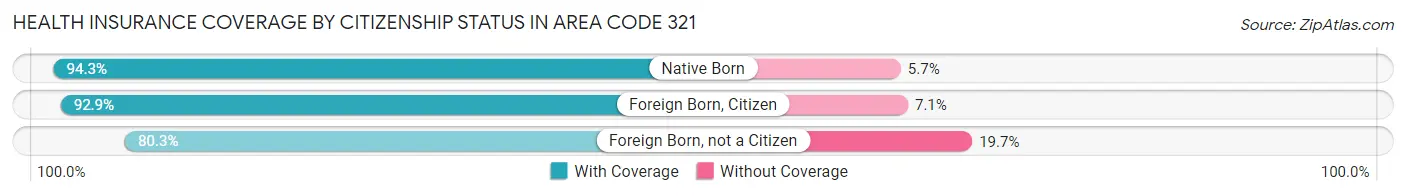
| Citizenship Status | With Coverage | Without Coverage |
| Native Born | 118,310 (94.3%) | 7,172 (5.7%) |
| Foreign Born, Citizen | 285,451 (92.9%) | 21,872 (7.1%) |
| Foreign Born, not a Citizen | 146,375 (80.3%) | 36,001 (19.7%) |
Health Insurance Coverage by Household Income in Area Code 321
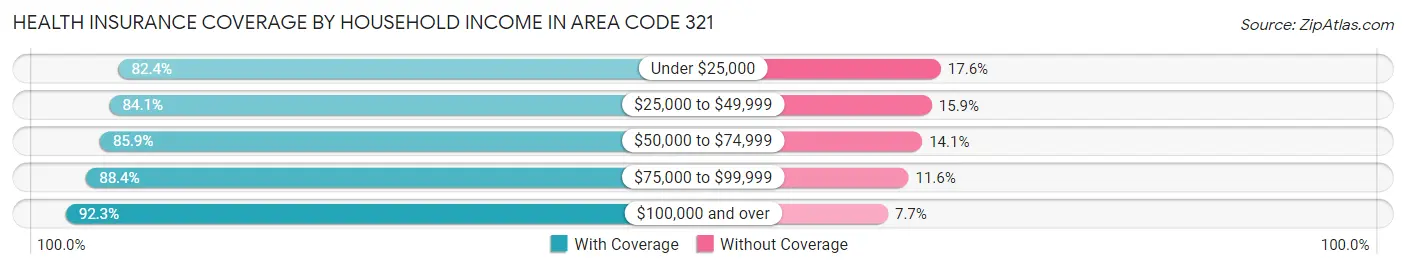
| Household Income | With Coverage | Without Coverage |
| Under $25,000 | 171,106 (82.4%) | 36,616 (17.6%) |
| $25,000 to $49,999 | 283,754 (84.1%) | 53,814 (15.9%) |
| $50,000 to $74,999 | 293,303 (85.9%) | 48,253 (14.1%) |
| $75,000 to $99,999 | 254,104 (88.4%) | 33,231 (11.6%) |
| $100,000 and over | 715,012 (92.3%) | 59,914 (7.7%) |
Public vs Private Health Insurance Coverage by Age in Area Code 321
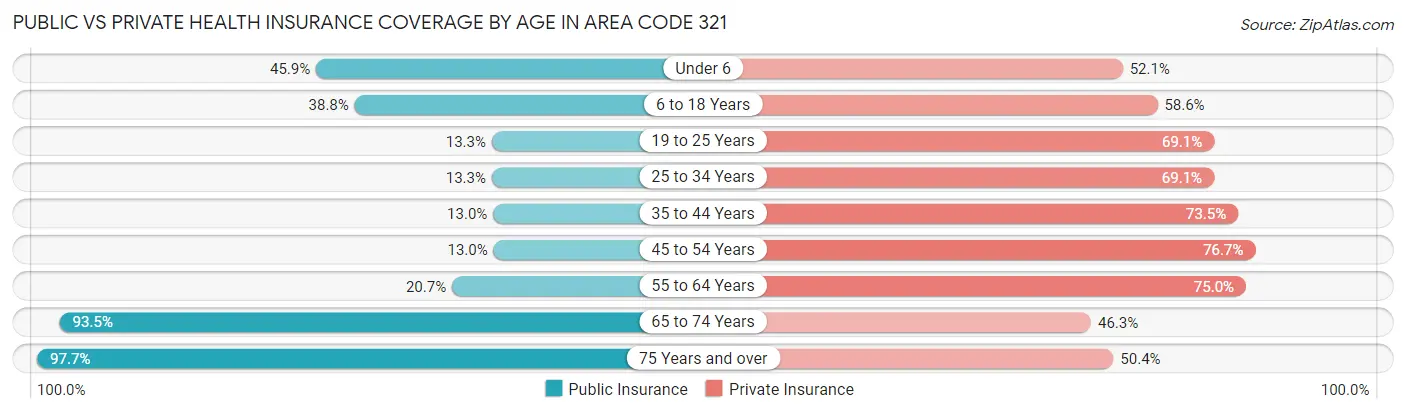
| Age Bracket | Public Insurance | Private Insurance |
| Under 6 | 57,606 (45.9%) | 65,423 (52.1%) |
| 6 to 18 Years | 119,088 (38.8%) | 180,073 (58.6%) |
| 19 to 25 Years | 24,216 (13.3%) | 125,980 (69.1%) |
| 25 to 34 Years | 34,655 (13.3%) | 180,164 (69.1%) |
| 35 to 44 Years | 34,287 (13.0%) | 193,476 (73.5%) |
| 45 to 54 Years | 32,785 (13.0%) | 194,255 (76.7%) |
| 55 to 64 Years | 52,763 (20.7%) | 191,456 (75.0%) |
| 65 to 74 Years | 171,039 (93.5%) | 84,632 (46.3%) |
| 75 Years and over | 125,057 (97.7%) | 64,561 (50.4%) |
| Total | 651,496 (33.3%) | 1,280,020 (65.4%) |
Disability Status by Sex by Age in Area Code 321
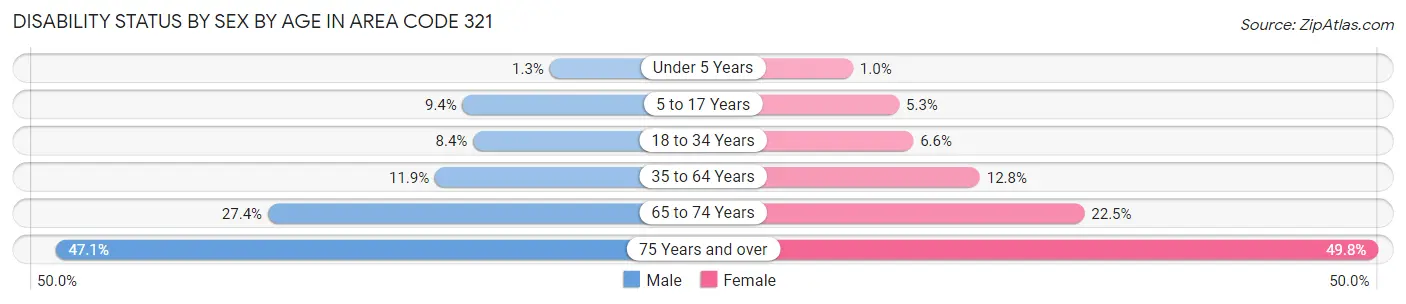
| Age Bracket | Male | Female |
| Under 5 Years | 683 (1.3%) | 521 (1.0%) |
| 5 to 17 Years | 14,803 (9.3%) | 7,849 (5.3%) |
| 18 to 34 Years | 19,845 (8.4%) | 15,169 (6.6%) |
| 35 to 64 Years | 45,262 (11.9%) | 50,169 (12.8%) |
| 65 to 74 Years | 23,313 (27.4%) | 22,036 (22.5%) |
| 75 Years and over | 25,335 (47.1%) | 36,988 (49.8%) |
Disability Class by Sex by Age in Area Code 321
Disability Class: Hearing Difficulty
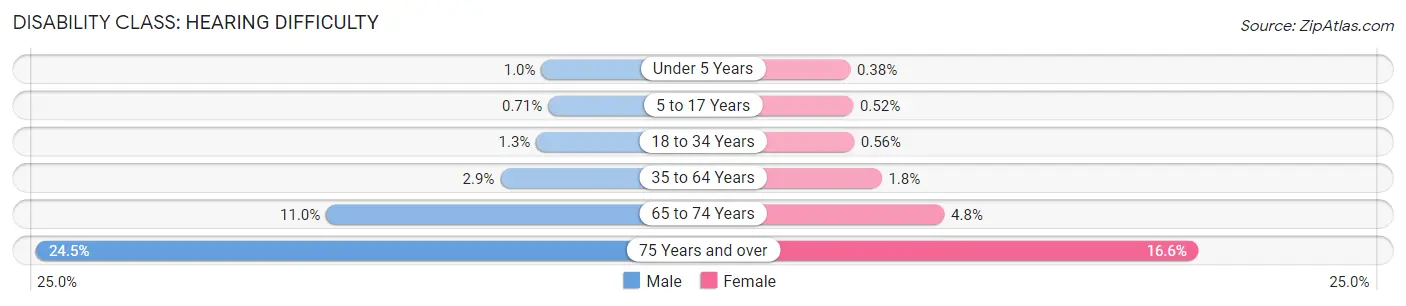
| Age Bracket | Male | Female |
| Under 5 Years | 549 (1.0%) | 190 (0.4%) |
| 5 to 17 Years | 1,125 (0.7%) | 762 (0.5%) |
| 18 to 34 Years | 2,992 (1.3%) | 1,271 (0.6%) |
| 35 to 64 Years | 11,127 (2.9%) | 7,190 (1.8%) |
| 65 to 74 Years | 9,361 (11.0%) | 4,649 (4.8%) |
| 75 Years and over | 13,153 (24.5%) | 12,308 (16.6%) |
Disability Class: Vision Difficulty
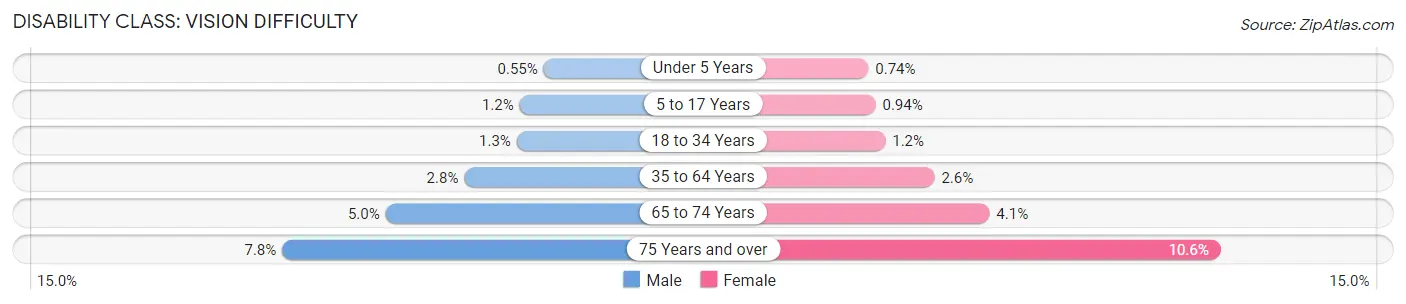
| Age Bracket | Male | Female |
| Under 5 Years | 297 (0.5%) | 374 (0.7%) |
| 5 to 17 Years | 1,935 (1.2%) | 1,380 (0.9%) |
| 18 to 34 Years | 3,094 (1.3%) | 2,771 (1.2%) |
| 35 to 64 Years | 10,495 (2.8%) | 10,099 (2.6%) |
| 65 to 74 Years | 4,209 (5.0%) | 4,020 (4.1%) |
| 75 Years and over | 4,207 (7.8%) | 7,841 (10.5%) |
Disability Class: Cognitive Difficulty
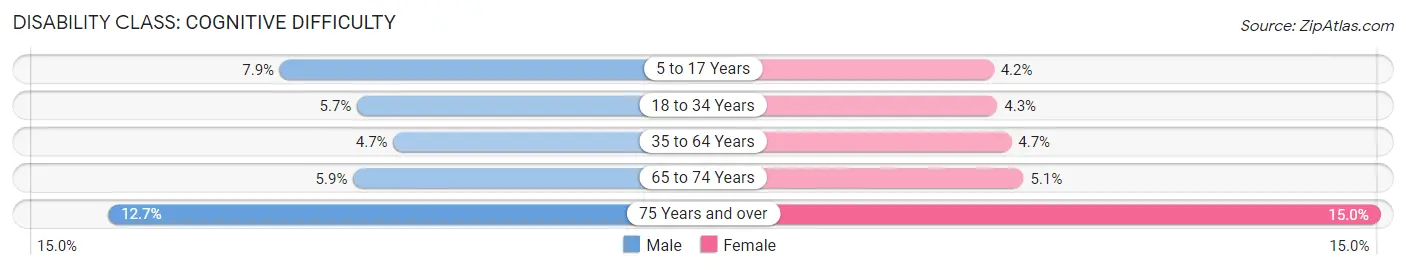
| Age Bracket | Male | Female |
| 5 to 17 Years | 12,497 (7.9%) | 6,236 (4.2%) |
| 18 to 34 Years | 13,627 (5.7%) | 9,914 (4.3%) |
| 35 to 64 Years | 17,978 (4.7%) | 18,481 (4.7%) |
| 65 to 74 Years | 4,969 (5.9%) | 4,958 (5.1%) |
| 75 Years and over | 6,813 (12.7%) | 11,147 (15.0%) |
Disability Class: Ambulatory Difficulty
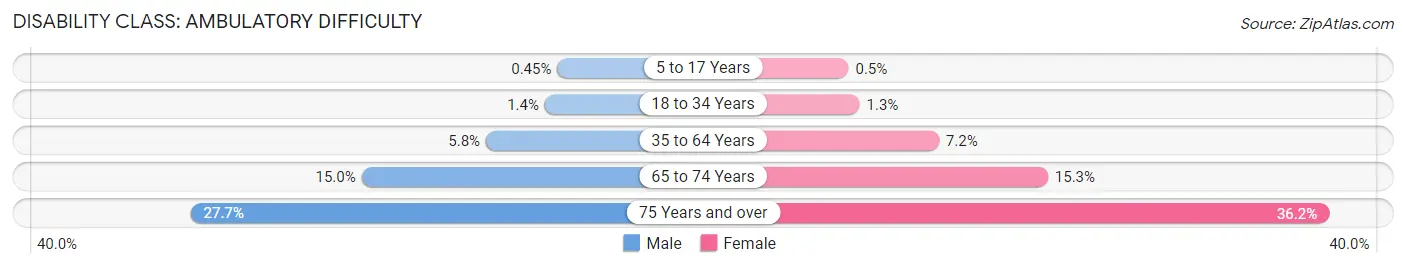
| Age Bracket | Male | Female |
| 5 to 17 Years | 719 (0.4%) | 733 (0.5%) |
| 18 to 34 Years | 3,282 (1.4%) | 3,028 (1.3%) |
| 35 to 64 Years | 21,837 (5.8%) | 28,212 (7.2%) |
| 65 to 74 Years | 12,732 (15.0%) | 14,978 (15.3%) |
| 75 Years and over | 14,871 (27.7%) | 26,878 (36.2%) |
Disability Class: Self-Care Difficulty
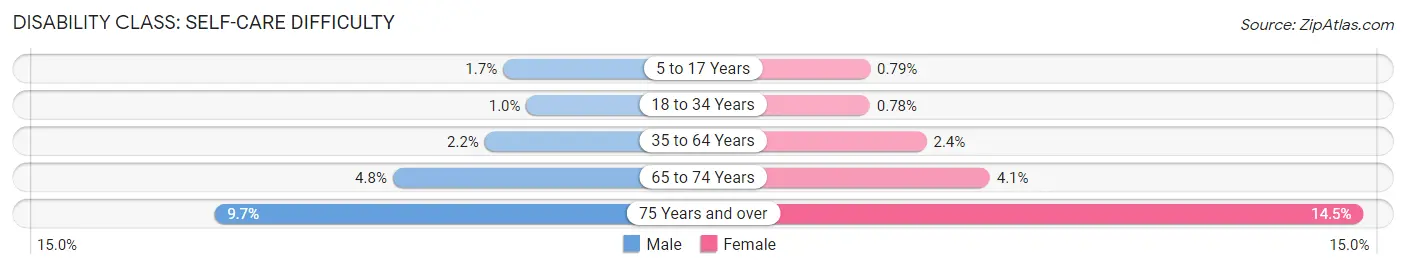
| Age Bracket | Male | Female |
| 5 to 17 Years | 2,657 (1.7%) | 1,168 (0.8%) |
| 18 to 34 Years | 2,451 (1.0%) | 1,795 (0.8%) |
| 35 to 64 Years | 8,328 (2.2%) | 9,235 (2.4%) |
| 65 to 74 Years | 4,040 (4.8%) | 4,036 (4.1%) |
| 75 Years and over | 5,226 (9.7%) | 10,790 (14.5%) |
Technology Access in Area Code 321
Computing Device Access in Area Code 321
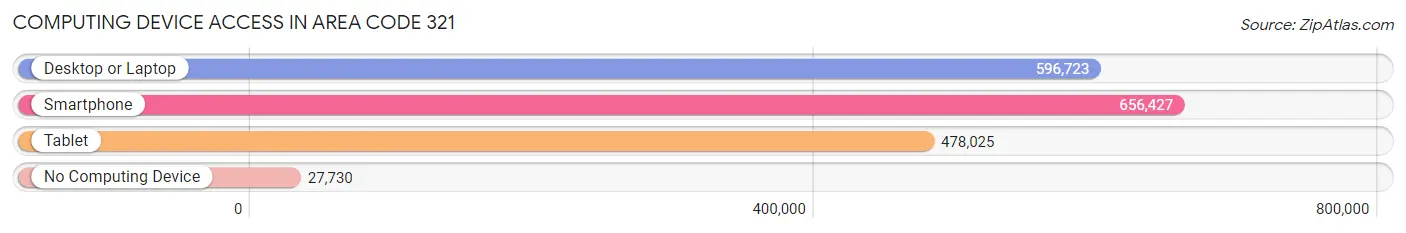
| Device Type | # Households | % Households |
| Desktop or Laptop | 596,723 | 83.2% |
| Smartphone | 656,427 | 91.5% |
| Tablet | 478,025 | 66.6% |
| No Computing Device | 27,730 | 3.9% |
| Total | 717,511 | 100.0% |
Internet Access in Area Code 321
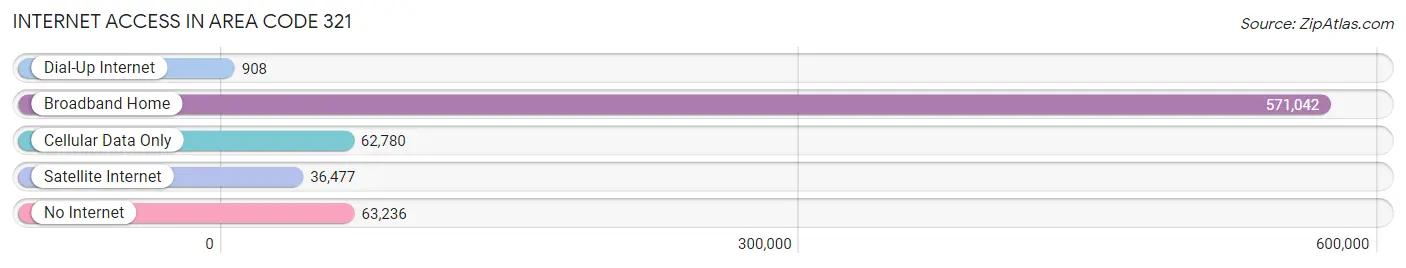
| Internet Type | # Households | % Households |
| Dial-Up Internet | 908 | 0.1% |
| Broadband Home | 571,042 | 79.6% |
| Cellular Data Only | 62,780 | 8.7% |
| Satellite Internet | 36,477 | 5.1% |
| No Internet | 63,236 | 8.8% |
| Total | 717,511 | 100.0% |
Area Code 321 Summary
Geography
Area code 321 is located in the state of Florida and covers the Space Coast, which includes the cities of Melbourne, Titusville, and Cocoa. It also includes parts of Orange, Osceola, and Seminole counties.
Social
The Space Coast is known for its beautiful beaches, and the area code 321 is home to many popular tourist attractions, such as the Kennedy Space Center, the Brevard Zoo, and the Merritt Island National Wildlife Refuge.
Economics
The Space Coast is home to many aerospace and defense companies, such as Boeing, Lockheed Martin, and Northrop Grumman. The area code 321 is also home to many technology companies, such as Harris Corporation and Embraer.
Demographics
The population of area code 321 is diverse, with a mix of people from different backgrounds and cultures. The median age is 40.5, and the median household income is $50,890. The population is also growing, with a population growth rate of 2.3%.
Common Questions
What is Per Capita Income in Area Code 321?
Per Capita income in Area Code 321 is $40,237.
What is the Median Family Income in Area Code 321?
Median Family Income in Area Code 321 is $91,546.
What is the Median Household income in Area Code 321?
Median Household Income in Area Code 321 is $77,072.
What is Income or Wage Gap in Area Code 321?
Income or Wage Gap in Area Code 321 is 22.9%.
Women in Area Code 321 earn 77.1 cents for every dollar earned by a man.
What is Family Income Deficit in Area Code 321?
Family Income Deficit in Area Code 321 is $10,303.
Families that are below poverty line in Area Code 321 earn $10,303 less on average than the poverty threshold level.
What is Inequality or Gini Index in Area Code 321?
Inequality or Gini Index in Area Code 321 is 27.48.
What is the Total Population of Area Code 321?
Total Population of Area Code 321 is 1,976,339.
What is the Total Male Population of Area Code 321?
Total Male Population of Area Code 321 is 978,773.
What is the Total Female Population of Area Code 321?
Total Female Population of Area Code 321 is 997,566.
What is the Ratio of Males per 100 Females in Area Code 321?
There are 98.12 Males per 100 Females in Area Code 321.
What is the Ratio of Females per 100 Males in Area Code 321?
There are 101.92 Females per 100 Males in Area Code 321.
What is the Median Population Age in Area Code 321?
Median Population Age in Area Code 321 is 40.7 Years.
What is the Average Family Size in Area Code 321
Average Family Size in Area Code 321 is 3.2 People.
What is the Average Household Size in Area Code 321
Average Household Size in Area Code 321 is 2.7 People.
How Large is the Labor Force in Area Code 321?
There are 1,032,560 People in the Labor Forcein in Area Code 321.
What is the Percentage of People in the Labor Force in Area Code 321?
63.9% of People are in the Labor Force in Area Code 321.
What is the Unemployment Rate in Area Code 321?
Unemployment Rate in Area Code 321 is 4.8%.