Pasco County, FL Map & Demographics
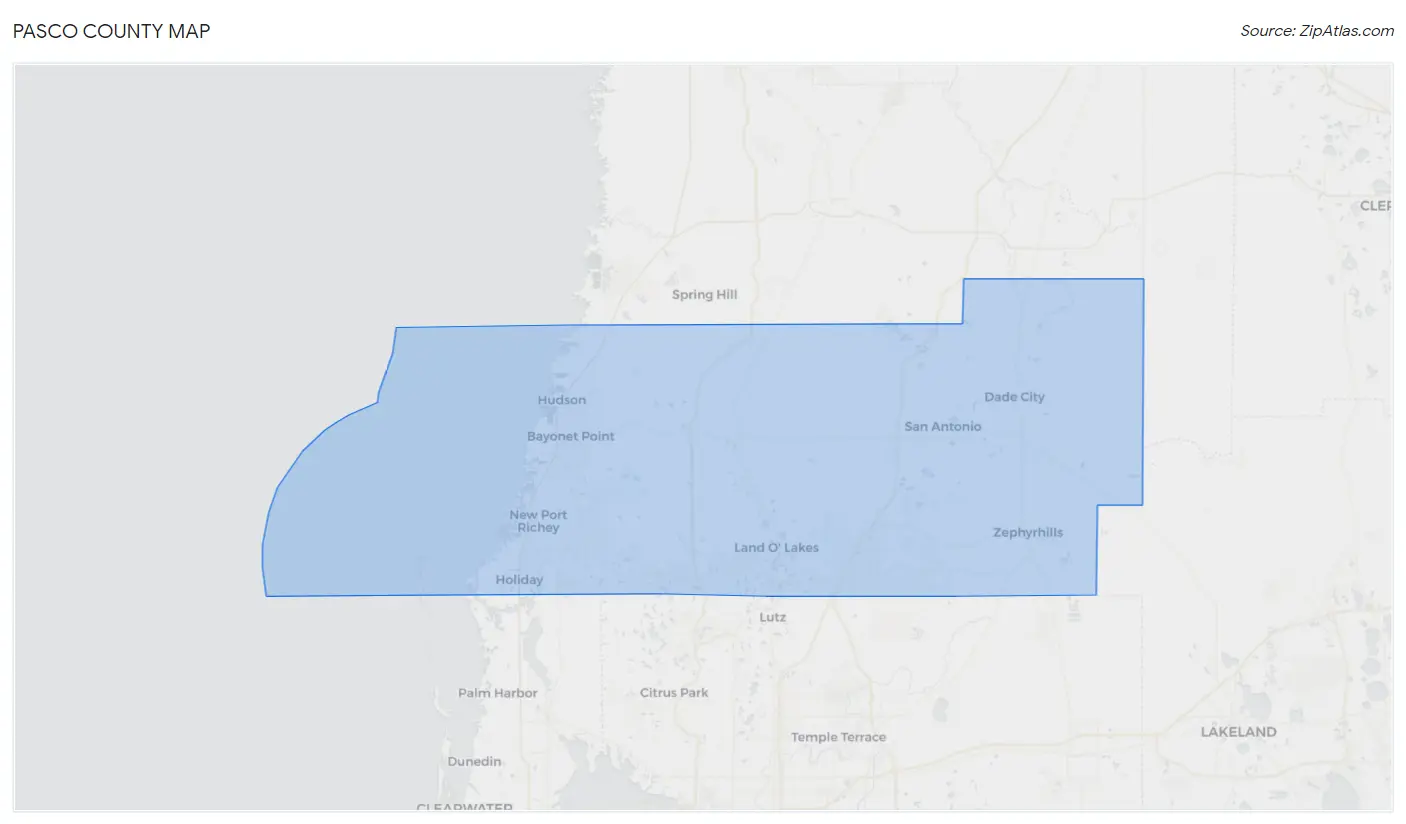
Pasco County Map
Pasco County Overview
$35,201
PER CAPITA INCOME
$80,612
AVG FAMILY INCOME
$63,187
AVG HOUSEHOLD INCOME
24.9%
WAGE / INCOME GAP [ % ]
75.1¢/ $1
WAGE / INCOME GAP [ $ ]
$10,761
FAMILY INCOME DEFICIT
0.46
INEQUALITY / GINI INDEX
569,211
TOTAL POPULATION
278,905
MALE POPULATION
290,306
FEMALE POPULATION
96.07
MALES / 100 FEMALES
104.09
FEMALES / 100 MALES
43.9
MEDIAN AGE
3.1
AVG FAMILY SIZE
2.5
AVG HOUSEHOLD SIZE
261,209
LABOR FORCE [ PEOPLE ]
55.8%
PERCENT IN LABOR FORCE
5.3%
UNEMPLOYMENT RATE
Income in Pasco County
Income Overview in Pasco County
Per Capita Income in Pasco County is $35,201, while median incomes of families and households are $80,612 and $63,187 respectively.
| Characteristic | Number | Measure |
| Per Capita Income | 569,211 | $35,201 |
| Median Family Income | 146,049 | $80,612 |
| Mean Family Income | 146,049 | $102,674 |
| Median Household Income | 223,385 | $63,187 |
| Mean Household Income | 223,385 | $86,348 |
| Income Deficit | 146,049 | $10,761 |
| Wage / Income Gap (%) | 569,211 | 24.88% |
| Wage / Income Gap ($) | 569,211 | 75.12¢ per $1 |
| Gini / Inequality Index | 569,211 | 0.46 |
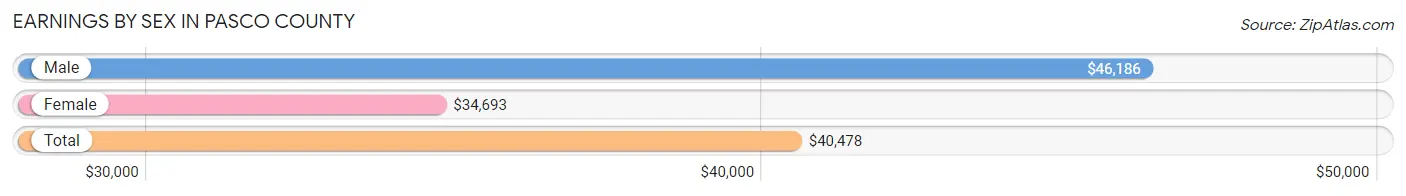
Earnings by Sex in Pasco County
Average Earnings in Pasco County are $40,478, $46,186 for men and $34,693 for women, a difference of 24.9%.
| Sex | Number | Average Earnings |
| Male | 139,692 (52.2%) | $46,186 |
| Female | 127,807 (47.8%) | $34,693 |
| Total | 267,499 (100.0%) | $40,478 |
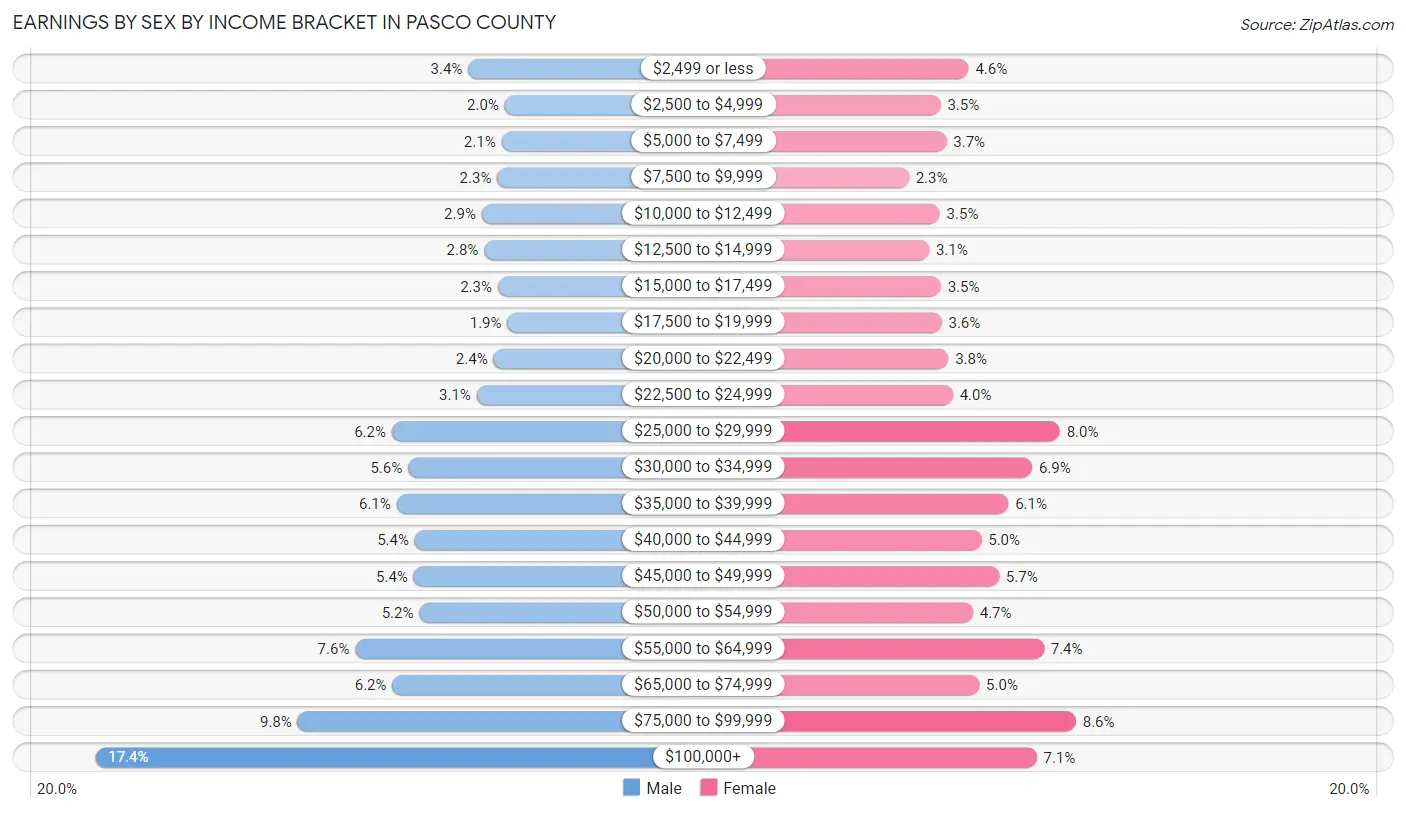
Earnings by Sex by Income Bracket in Pasco County
The most common earnings brackets in Pasco County are $100,000+ for men (24,231 | 17.3%) and $75,000 to $99,999 for women (10,972 | 8.6%).
| Income | Male | Female |
| $2,499 or less | 4,726 (3.4%) | 5,828 (4.6%) |
| $2,500 to $4,999 | 2,807 (2.0%) | 4,487 (3.5%) |
| $5,000 to $7,499 | 2,970 (2.1%) | 4,773 (3.7%) |
| $7,500 to $9,999 | 3,193 (2.3%) | 2,962 (2.3%) |
| $10,000 to $12,499 | 4,006 (2.9%) | 4,446 (3.5%) |
| $12,500 to $14,999 | 3,889 (2.8%) | 3,931 (3.1%) |
| $15,000 to $17,499 | 3,170 (2.3%) | 4,504 (3.5%) |
| $17,500 to $19,999 | 2,671 (1.9%) | 4,538 (3.5%) |
| $20,000 to $22,499 | 3,399 (2.4%) | 4,861 (3.8%) |
| $22,500 to $24,999 | 4,272 (3.1%) | 5,079 (4.0%) |
| $25,000 to $29,999 | 8,719 (6.2%) | 10,200 (8.0%) |
| $30,000 to $34,999 | 7,858 (5.6%) | 8,876 (6.9%) |
| $35,000 to $39,999 | 8,468 (6.1%) | 7,731 (6.0%) |
| $40,000 to $44,999 | 7,514 (5.4%) | 6,436 (5.0%) |
| $45,000 to $49,999 | 7,567 (5.4%) | 7,279 (5.7%) |
| $50,000 to $54,999 | 7,273 (5.2%) | 6,035 (4.7%) |
| $55,000 to $64,999 | 10,629 (7.6%) | 9,433 (7.4%) |
| $65,000 to $74,999 | 8,682 (6.2%) | 6,344 (5.0%) |
| $75,000 to $99,999 | 13,648 (9.8%) | 10,972 (8.6%) |
| $100,000+ | 24,231 (17.3%) | 9,092 (7.1%) |
| Total | 139,692 (100.0%) | 127,807 (100.0%) |
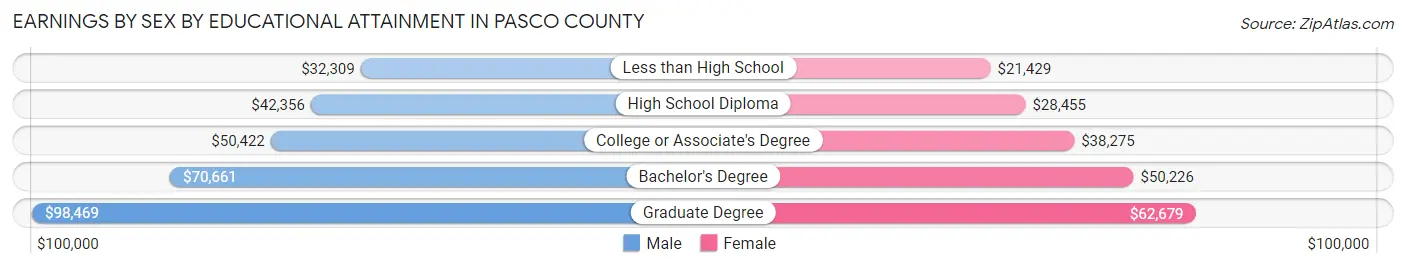
Earnings by Sex by Educational Attainment in Pasco County
Average earnings in Pasco County are $51,324 for men and $39,305 for women, a difference of 23.4%. Men with an educational attainment of graduate degree enjoy the highest average annual earnings of $98,469, while those with less than high school education earn the least with $32,309. Women with an educational attainment of graduate degree earn the most with the average annual earnings of $62,679, while those with less than high school education have the smallest earnings of $21,429.
| Educational Attainment | Male Income | Female Income |
| Less than High School | $32,309 | $21,429 |
| High School Diploma | $42,356 | $28,455 |
| College or Associate's Degree | $50,422 | $38,275 |
| Bachelor's Degree | $70,661 | $50,226 |
| Graduate Degree | $98,469 | $62,679 |
| Total | $51,324 | $39,305 |
Family Income in Pasco County
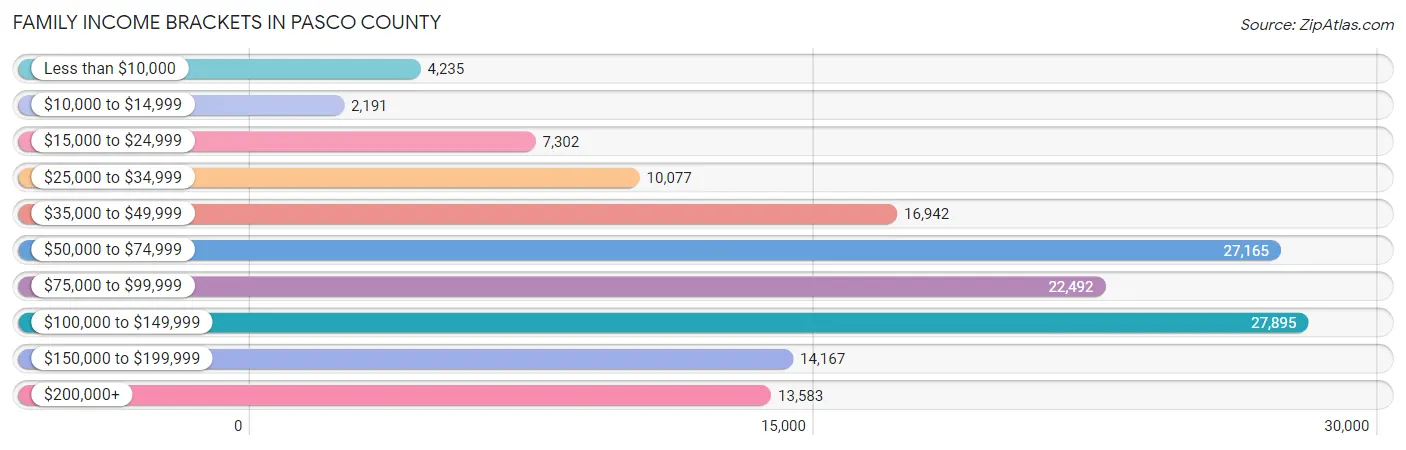
Family Income Brackets in Pasco County
According to the Pasco County family income data, there are 27,895 families falling into the $100,000 to $149,999 income range, which is the most common income bracket and makes up 19.1% of all families. Conversely, the $10,000 to $14,999 income bracket is the least frequent group with only 2,191 families (1.5%) belonging to this category.
| Income Bracket | # Families | % Families |
| Less than $10,000 | 4,235 | 2.9% |
| $10,000 to $14,999 | 2,191 | 1.5% |
| $15,000 to $24,999 | 7,302 | 5.0% |
| $25,000 to $34,999 | 10,077 | 6.9% |
| $35,000 to $49,999 | 16,942 | 11.6% |
| $50,000 to $74,999 | 27,165 | 18.6% |
| $75,000 to $99,999 | 22,492 | 15.4% |
| $100,000 to $149,999 | 27,895 | 19.1% |
| $150,000 to $199,999 | 14,167 | 9.7% |
| $200,000+ | 13,583 | 9.3% |
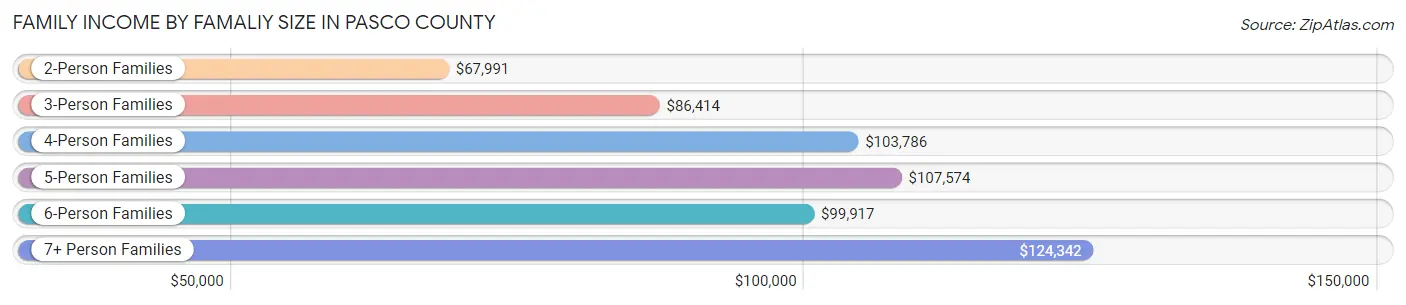
Family Income by Famaliy Size in Pasco County
7+ person families (1,778 | 1.2%) account for the highest median family income in Pasco County with $124,342 per family, while 2-person families (73,039 | 50.0%) have the highest median income of $33,996 per family member.
| Income Bracket | # Families | Median Income |
| 2-Person Families | 73,039 (50.0%) | $67,991 |
| 3-Person Families | 31,818 (21.8%) | $86,414 |
| 4-Person Families | 24,788 (17.0%) | $103,786 |
| 5-Person Families | 11,410 (7.8%) | $107,574 |
| 6-Person Families | 3,216 (2.2%) | $99,917 |
| 7+ Person Families | 1,778 (1.2%) | $124,342 |
| Total | 146,049 (100.0%) | $80,612 |
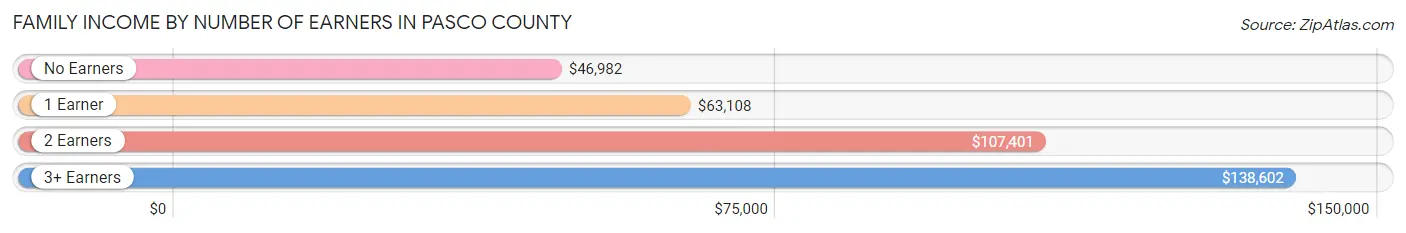
Family Income by Number of Earners in Pasco County
The median family income in Pasco County is $80,612, with families comprising 3+ earners (13,557) having the highest median family income of $138,602, while families with no earners (32,945) have the lowest median family income of $46,982, accounting for 9.3% and 22.6% of families, respectively.
| Number of Earners | # Families | Median Income |
| No Earners | 32,945 (22.6%) | $46,982 |
| 1 Earner | 46,356 (31.7%) | $63,108 |
| 2 Earners | 53,191 (36.4%) | $107,401 |
| 3+ Earners | 13,557 (9.3%) | $138,602 |
| Total | 146,049 (100.0%) | $80,612 |
Household Income in Pasco County
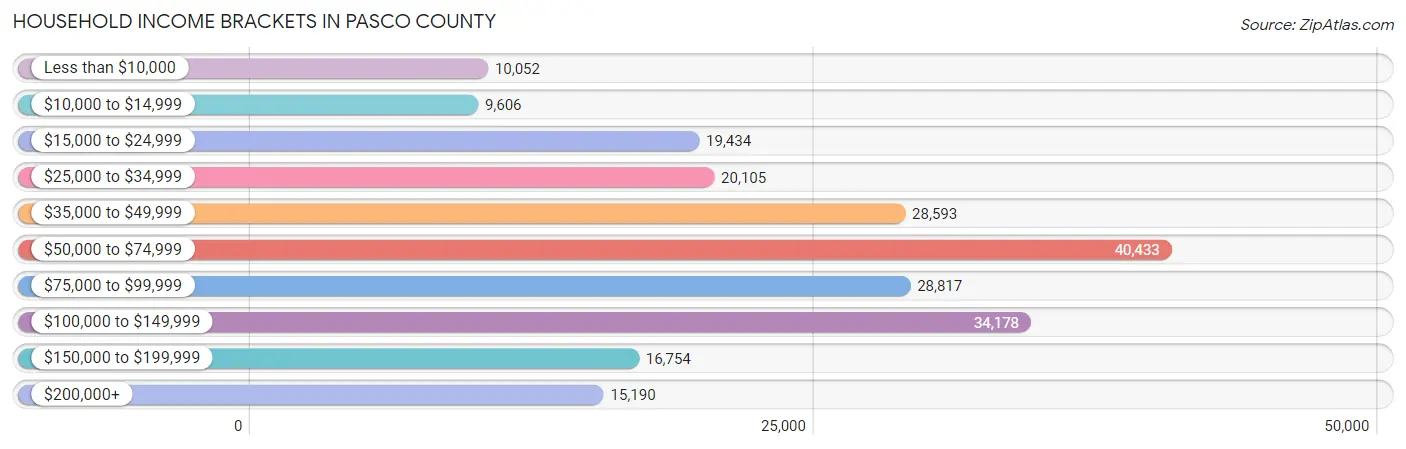
Household Income Brackets in Pasco County
With 40,433 households falling in the category, the $50,000 to $74,999 income range is the most frequent in Pasco County, accounting for 18.1% of all households. In contrast, only 9,606 households (4.3%) fall into the $10,000 to $14,999 income bracket, making it the least populous group.
| Income Bracket | # Households | % Households |
| Less than $10,000 | 10,052 | 4.5% |
| $10,000 to $14,999 | 9,606 | 4.3% |
| $15,000 to $24,999 | 19,434 | 8.7% |
| $25,000 to $34,999 | 20,105 | 9.0% |
| $35,000 to $49,999 | 28,593 | 12.8% |
| $50,000 to $74,999 | 40,433 | 18.1% |
| $75,000 to $99,999 | 28,817 | 12.9% |
| $100,000 to $149,999 | 34,178 | 15.3% |
| $150,000 to $199,999 | 16,754 | 7.5% |
| $200,000+ | 15,190 | 6.8% |
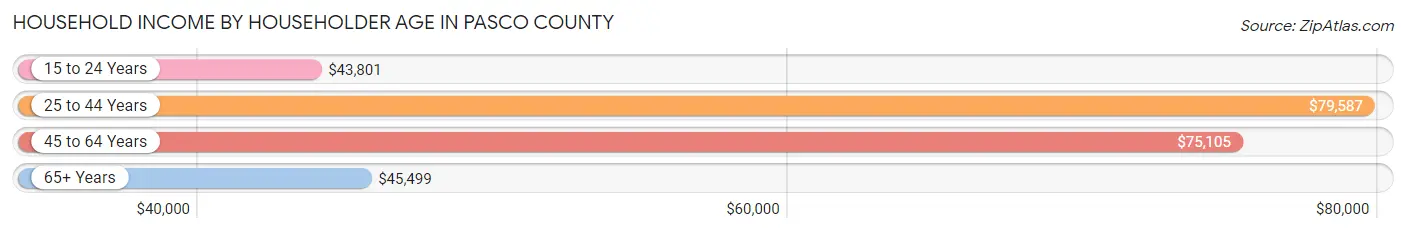
Household Income by Householder Age in Pasco County
The median household income in Pasco County is $63,187, with the highest median household income of $79,587 found in the 25 to 44 years age bracket for the primary householder. A total of 59,692 households (26.7%) fall into this category. Meanwhile, the 15 to 24 years age bracket for the primary householder has the lowest median household income of $43,801, with 4,563 households (2.0%) in this group.
| Income Bracket | # Households | Median Income |
| 15 to 24 Years | 4,563 (2.0%) | $43,801 |
| 25 to 44 Years | 59,692 (26.7%) | $79,587 |
| 45 to 64 Years | 84,300 (37.7%) | $75,105 |
| 65+ Years | 74,830 (33.5%) | $45,499 |
| Total | 223,385 (100.0%) | $63,187 |
Poverty in Pasco County
Income Below Poverty by Sex and Age in Pasco County
With 10.7% poverty level for males and 12.9% for females among the residents of Pasco County, under 5 year old males and under 5 year old females are the most vulnerable to poverty, with 3,031 males (21.8%) and 2,740 females (20.3%) in their respective age groups living below the poverty level.
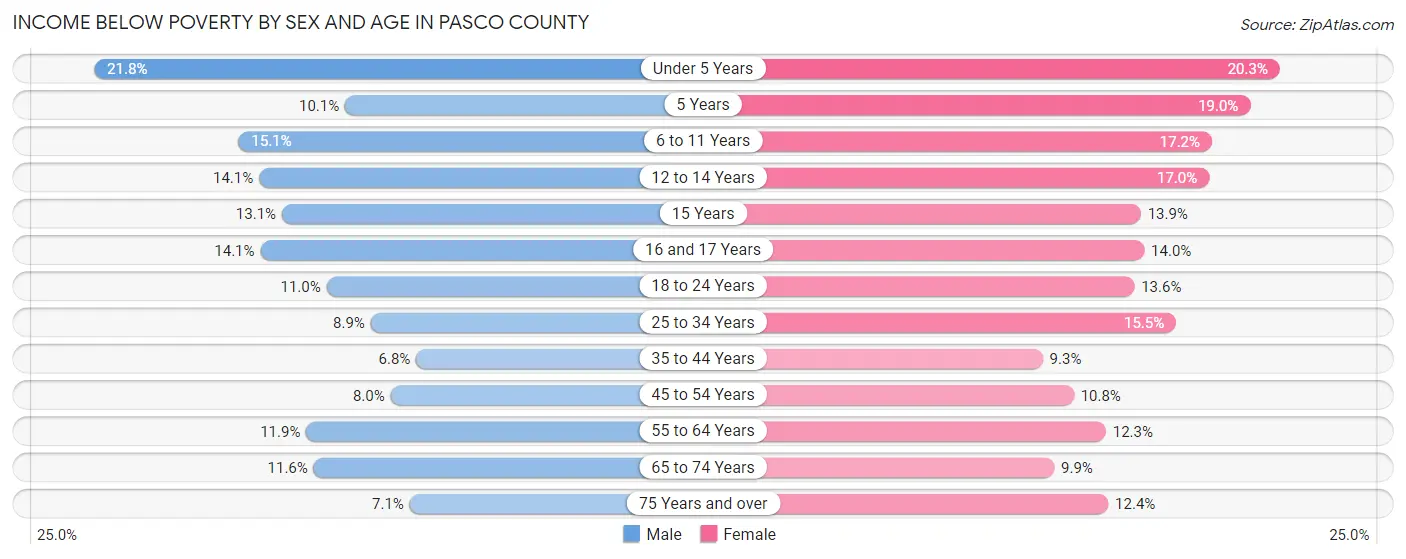
| Age Bracket | Male | Female |
| Under 5 Years | 3,031 (21.8%) | 2,740 (20.3%) |
| 5 Years | 314 (10.1%) | 503 (19.0%) |
| 6 to 11 Years | 3,026 (15.1%) | 3,183 (17.2%) |
| 12 to 14 Years | 1,454 (14.1%) | 1,782 (17.0%) |
| 15 Years | 427 (13.1%) | 485 (13.9%) |
| 16 and 17 Years | 1,011 (14.1%) | 916 (14.0%) |
| 18 to 24 Years | 2,268 (11.0%) | 2,695 (13.6%) |
| 25 to 34 Years | 2,767 (8.9%) | 4,962 (15.5%) |
| 35 to 44 Years | 2,371 (6.8%) | 3,358 (9.3%) |
| 45 to 54 Years | 2,936 (8.0%) | 3,973 (10.8%) |
| 55 to 64 Years | 4,388 (11.9%) | 4,811 (12.2%) |
| 65 to 74 Years | 3,638 (11.6%) | 3,612 (9.9%) |
| 75 Years and over | 1,786 (7.1%) | 3,760 (12.4%) |
| Total | 29,417 (10.7%) | 36,780 (12.9%) |
Income Above Poverty by Sex and Age in Pasco County
According to the poverty statistics in Pasco County, males aged 35 to 44 years and females aged 35 to 44 years are the age groups that are most secure financially, with 93.2% of males and 90.7% of females in these age groups living above the poverty line.
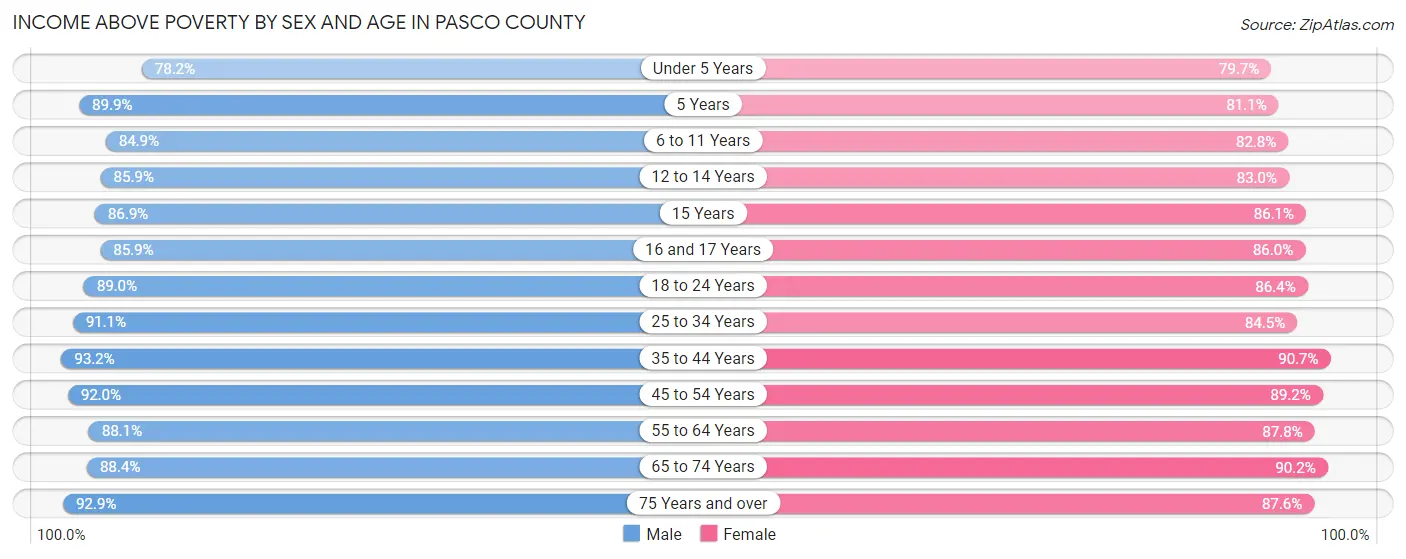
| Age Bracket | Male | Female |
| Under 5 Years | 10,893 (78.2%) | 10,745 (79.7%) |
| 5 Years | 2,785 (89.9%) | 2,152 (81.0%) |
| 6 to 11 Years | 17,039 (84.9%) | 15,359 (82.8%) |
| 12 to 14 Years | 8,844 (85.9%) | 8,673 (83.0%) |
| 15 Years | 2,842 (86.9%) | 3,013 (86.1%) |
| 16 and 17 Years | 6,178 (85.9%) | 5,611 (86.0%) |
| 18 to 24 Years | 18,362 (89.0%) | 17,166 (86.4%) |
| 25 to 34 Years | 28,168 (91.1%) | 27,030 (84.5%) |
| 35 to 44 Years | 32,332 (93.2%) | 32,684 (90.7%) |
| 45 to 54 Years | 33,658 (92.0%) | 32,934 (89.2%) |
| 55 to 64 Years | 32,388 (88.1%) | 34,451 (87.7%) |
| 65 to 74 Years | 27,762 (88.4%) | 33,046 (90.1%) |
| 75 Years and over | 23,262 (92.9%) | 26,667 (87.6%) |
| Total | 244,513 (89.3%) | 249,531 (87.2%) |
Income Below Poverty Among Married-Couple Families in Pasco County
The poverty statistics for married-couple families in Pasco County show that 4.7% or 5,230 of the total 111,363 families live below the poverty line. Families with 5 or more children have the highest poverty rate of 27.0%, comprising of 167 families. On the other hand, families with 1 or 2 children have the lowest poverty rate of 3.9%, which includes 1,293 families.
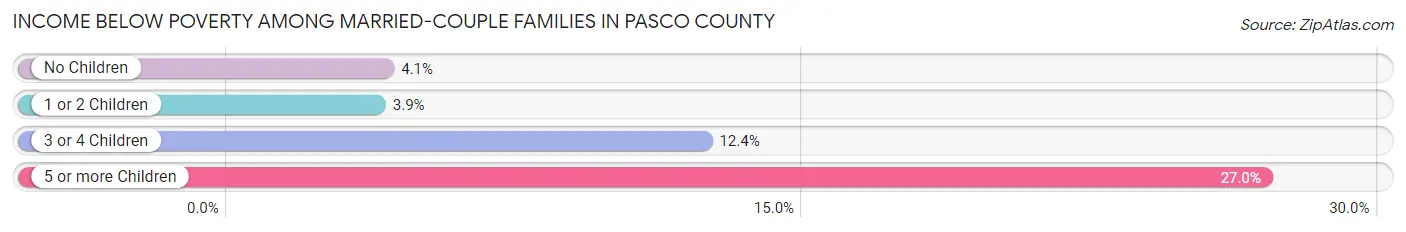
| Children | Above Poverty | Below Poverty |
| No Children | 66,917 (95.9%) | 2,844 (4.1%) |
| 1 or 2 Children | 32,219 (96.1%) | 1,293 (3.9%) |
| 3 or 4 Children | 6,546 (87.6%) | 926 (12.4%) |
| 5 or more Children | 451 (73.0%) | 167 (27.0%) |
| Total | 106,133 (95.3%) | 5,230 (4.7%) |
Income Below Poverty Among Single-Parent Households in Pasco County
According to the poverty data in Pasco County, 12.8% or 1,233 single-father households and 22.1% or 5,522 single-mother households are living below the poverty line. Among single-father households, those with 3 or 4 children have the highest poverty rate, with 151 households (28.8%) experiencing poverty. Likewise, among single-mother households, those with 3 or 4 children have the highest poverty rate, with 1,487 households (53.8%) falling below the poverty line.
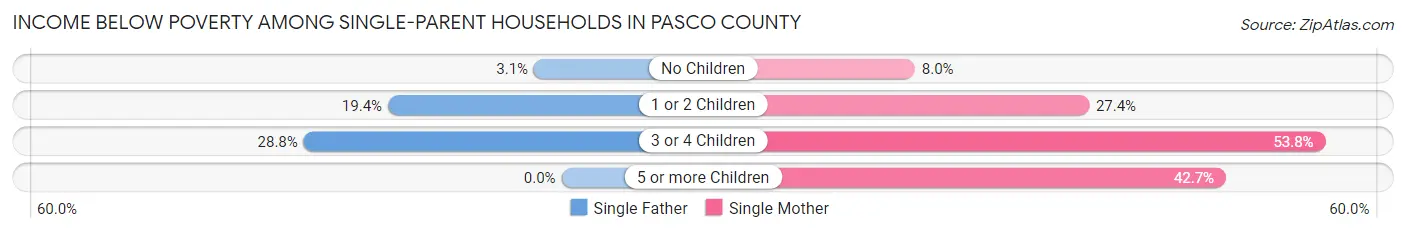
| Children | Single Father | Single Mother |
| No Children | 129 (3.1%) | 856 (8.0%) |
| 1 or 2 Children | 953 (19.4%) | 3,091 (27.4%) |
| 3 or 4 Children | 151 (28.8%) | 1,487 (53.8%) |
| 5 or more Children | 0 (0.0%) | 88 (42.7%) |
| Total | 1,233 (12.8%) | 5,522 (22.1%) |
Income Below Poverty Among Married-Couple vs Single-Parent Households in Pasco County
The poverty data for Pasco County shows that 5,230 of the married-couple family households (4.7%) and 6,755 of the single-parent households (19.5%) are living below the poverty level. Within the married-couple family households, those with 5 or more children have the highest poverty rate, with 167 households (27.0%) falling below the poverty line. Among the single-parent households, those with 3 or 4 children have the highest poverty rate, with 1,638 household (49.8%) living below poverty.
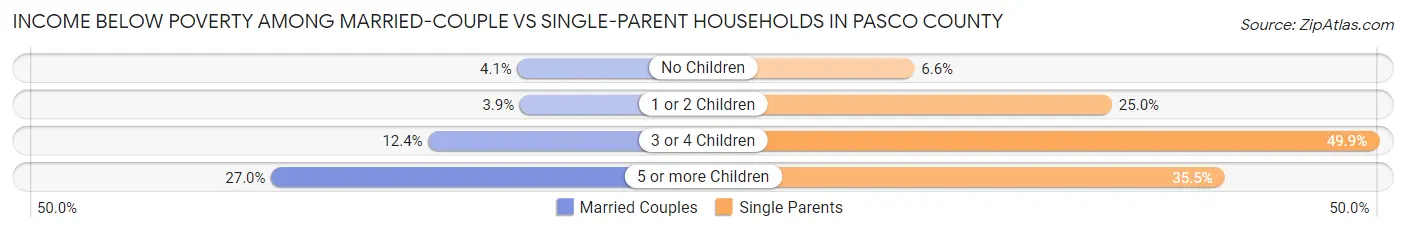
| Children | Married-Couple Families | Single-Parent Households |
| No Children | 2,844 (4.1%) | 985 (6.6%) |
| 1 or 2 Children | 1,293 (3.9%) | 4,044 (25.0%) |
| 3 or 4 Children | 926 (12.4%) | 1,638 (49.8%) |
| 5 or more Children | 167 (27.0%) | 88 (35.5%) |
| Total | 5,230 (4.7%) | 6,755 (19.5%) |
Race in Pasco County
The most populous races in Pasco County are White / Caucasian (444,803 | 78.1%), Hispanic or Latino (99,192 | 17.4%), and Two or more Races (52,981 | 9.3%).
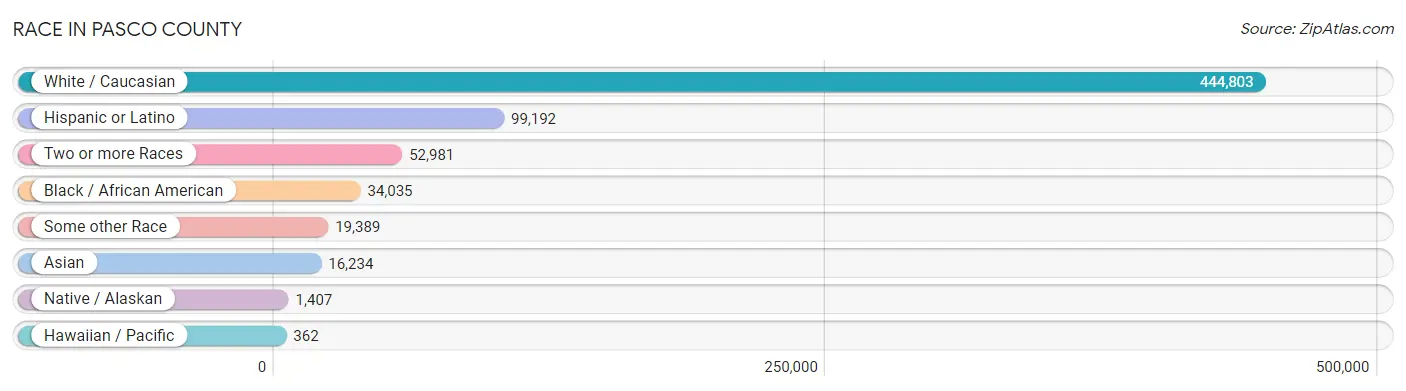
| Race | # Population | % Population |
| Asian | 16,234 | 2.9% |
| Black / African American | 34,035 | 6.0% |
| Hawaiian / Pacific | 362 | 0.1% |
| Hispanic or Latino | 99,192 | 17.4% |
| Native / Alaskan | 1,407 | 0.3% |
| White / Caucasian | 444,803 | 78.1% |
| Two or more Races | 52,981 | 9.3% |
| Some other Race | 19,389 | 3.4% |
| Total | 569,211 | 100.0% |
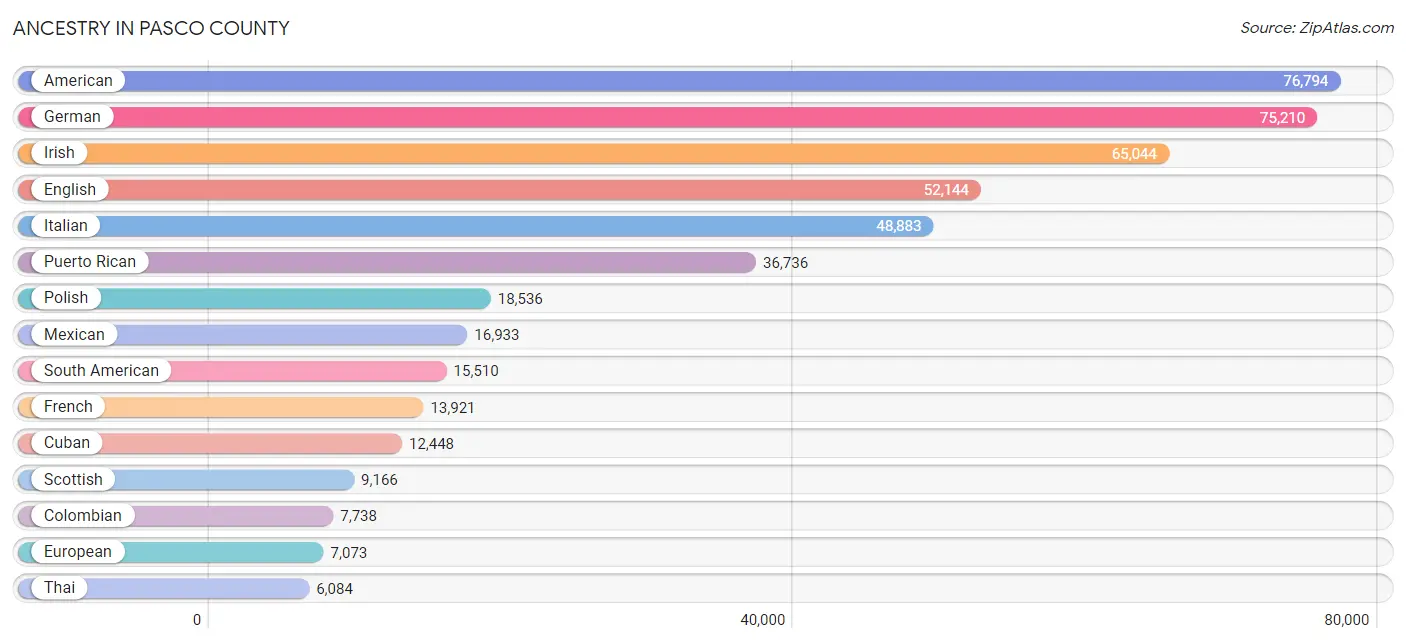
Ancestry in Pasco County
The most populous ancestries reported in Pasco County are American (76,794 | 13.5%), German (75,210 | 13.2%), Irish (65,044 | 11.4%), English (52,144 | 9.2%), and Italian (48,883 | 8.6%), together accounting for 55.9% of all Pasco County residents.
| Ancestry | # Population | % Population |
| Afghan | 39 | 0.0% |
| African | 1,678 | 0.3% |
| Alaska Native | 12 | 0.0% |
| Albanian | 652 | 0.1% |
| Aleut | 33 | 0.0% |
| American | 76,794 | 13.5% |
| Apache | 107 | 0.0% |
| Arab | 5,332 | 0.9% |
| Argentinean | 571 | 0.1% |
| Armenian | 310 | 0.1% |
| Australian | 142 | 0.0% |
| Austrian | 1,121 | 0.2% |
| Bahamian | 270 | 0.1% |
| Bangladeshi | 123 | 0.0% |
| Barbadian | 242 | 0.0% |
| Belgian | 356 | 0.1% |
| Belizean | 79 | 0.0% |
| Bermudan | 63 | 0.0% |
| Bhutanese | 1,421 | 0.3% |
| Blackfeet | 332 | 0.1% |
| Bolivian | 83 | 0.0% |
| Brazilian | 1,092 | 0.2% |
| British | 3,250 | 0.6% |
| British West Indian | 161 | 0.0% |
| Bulgarian | 162 | 0.0% |
| Burmese | 1,068 | 0.2% |
| Cajun | 159 | 0.0% |
| Cambodian | 52 | 0.0% |
| Canadian | 1,972 | 0.4% |
| Cape Verdean | 126 | 0.0% |
| Carpatho Rusyn | 15 | 0.0% |
| Celtic | 26 | 0.0% |
| Central American | 5,792 | 1.0% |
| Central American Indian | 836 | 0.2% |
| Cherokee | 1,614 | 0.3% |
| Chilean | 101 | 0.0% |
| Chinese | 17 | 0.0% |
| Chippewa | 172 | 0.0% |
| Choctaw | 88 | 0.0% |
| Colombian | 7,738 | 1.4% |
| Comanche | 31 | 0.0% |
| Costa Rican | 700 | 0.1% |
| Cree | 6 | 0.0% |
| Creek | 189 | 0.0% |
| Croatian | 738 | 0.1% |
| Cuban | 12,448 | 2.2% |
| Cypriot | 36 | 0.0% |
| Czech | 1,477 | 0.3% |
| Czechoslovakian | 520 | 0.1% |
| Danish | 1,549 | 0.3% |
| Delaware | 76 | 0.0% |
| Dominican | 5,342 | 0.9% |
| Dutch | 5,770 | 1.0% |
| Dutch West Indian | 47 | 0.0% |
| Eastern European | 1,210 | 0.2% |
| Ecuadorian | 1,865 | 0.3% |
| Egyptian | 1,370 | 0.2% |
| English | 52,144 | 9.2% |
| Estonian | 20 | 0.0% |
| Ethiopian | 95 | 0.0% |
| European | 7,073 | 1.2% |
| Fijian | 78 | 0.0% |
| Filipino | 52 | 0.0% |
| Finnish | 1,109 | 0.2% |
| French | 13,921 | 2.5% |
| French American Indian | 42 | 0.0% |
| French Canadian | 4,066 | 0.7% |
| German | 75,210 | 13.2% |
| Ghanaian | 21 | 0.0% |
| Greek | 4,804 | 0.8% |
| Guamanian / Chamorro | 50 | 0.0% |
| Guatemalan | 1,125 | 0.2% |
| Guyanese | 416 | 0.1% |
| Haitian | 1,783 | 0.3% |
| Honduran | 1,312 | 0.2% |
| Hopi | 35 | 0.0% |
| Hungarian | 3,097 | 0.5% |
| Icelander | 48 | 0.0% |
| Indian (Asian) | 3,541 | 0.6% |
| Indonesian | 67 | 0.0% |
| Inupiat | 29 | 0.0% |
| Iranian | 206 | 0.0% |
| Iraqi | 15 | 0.0% |
| Irish | 65,044 | 11.4% |
| Iroquois | 239 | 0.0% |
| Israeli | 58 | 0.0% |
| Italian | 48,883 | 8.6% |
| Jamaican | 2,888 | 0.5% |
| Japanese | 9 | 0.0% |
| Jordanian | 430 | 0.1% |
| Kenyan | 11 | 0.0% |
| Korean | 4,806 | 0.8% |
| Laotian | 228 | 0.0% |
| Latvian | 55 | 0.0% |
| Lebanese | 987 | 0.2% |
| Lithuanian | 1,244 | 0.2% |
| Lumbee | 31 | 0.0% |
| Luxembourger | 9 | 0.0% |
| Macedonian | 98 | 0.0% |
| Malaysian | 378 | 0.1% |
| Maltese | 48 | 0.0% |
| Menominee | 31 | 0.0% |
| Mexican | 16,933 | 3.0% |
| Mexican American Indian | 154 | 0.0% |
| Moroccan | 1,178 | 0.2% |
| Native Hawaiian | 343 | 0.1% |
| Navajo | 52 | 0.0% |
| New Zealander | 4 | 0.0% |
| Nicaraguan | 913 | 0.2% |
| Nigerian | 342 | 0.1% |
| Northern European | 381 | 0.1% |
| Norwegian | 3,580 | 0.6% |
| Osage | 4 | 0.0% |
| Pakistani | 526 | 0.1% |
| Palestinian | 841 | 0.2% |
| Panamanian | 998 | 0.2% |
| Paraguayan | 14 | 0.0% |
| Pennsylvania German | 377 | 0.1% |
| Peruvian | 2,116 | 0.4% |
| Polish | 18,536 | 3.3% |
| Portuguese | 2,911 | 0.5% |
| Potawatomi | 3 | 0.0% |
| Pueblo | 23 | 0.0% |
| Puerto Rican | 36,736 | 6.5% |
| Romanian | 650 | 0.1% |
| Russian | 3,164 | 0.6% |
| Salvadoran | 645 | 0.1% |
| Samoan | 111 | 0.0% |
| Scandinavian | 1,119 | 0.2% |
| Scotch-Irish | 4,726 | 0.8% |
| Scottish | 9,166 | 1.6% |
| Seminole | 123 | 0.0% |
| Senegalese | 14 | 0.0% |
| Serbian | 340 | 0.1% |
| Shoshone | 23 | 0.0% |
| Sioux | 259 | 0.1% |
| Slavic | 377 | 0.1% |
| Slovak | 1,147 | 0.2% |
| Slovene | 221 | 0.0% |
| South African | 215 | 0.0% |
| South American | 15,510 | 2.7% |
| South American Indian | 101 | 0.0% |
| Spaniard | 2,860 | 0.5% |
| Spanish | 1,288 | 0.2% |
| Spanish American Indian | 26 | 0.0% |
| Sri Lankan | 2,550 | 0.4% |
| Subsaharan African | 2,729 | 0.5% |
| Sudanese | 35 | 0.0% |
| Swedish | 5,558 | 1.0% |
| Swiss | 966 | 0.2% |
| Syrian | 231 | 0.0% |
| Thai | 6,084 | 1.1% |
| Tongan | 6 | 0.0% |
| Trinidadian and Tobagonian | 763 | 0.1% |
| Turkish | 514 | 0.1% |
| U.S. Virgin Islander | 26 | 0.0% |
| Ukrainian | 2,300 | 0.4% |
| Uruguayan | 540 | 0.1% |
| Ute | 11 | 0.0% |
| Venezuelan | 2,479 | 0.4% |
| Vietnamese | 44 | 0.0% |
| Welsh | 3,823 | 0.7% |
| West Indian | 1,065 | 0.2% |
| Yaqui | 9 | 0.0% |
| Yugoslavian | 787 | 0.1% |
| Zimbabwean | 75 | 0.0% | View All 166 Rows |
Immigrants in Pasco County
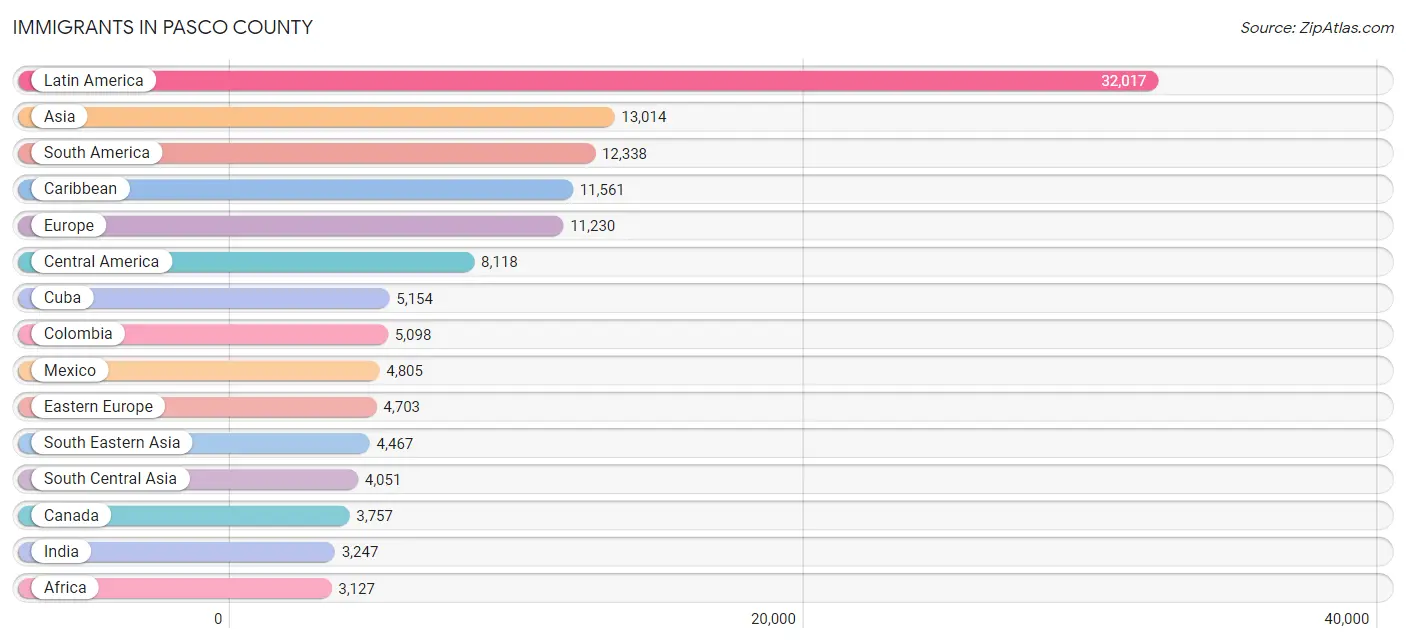
The most numerous immigrant groups reported in Pasco County came from Latin America (32,017 | 5.6%), Asia (13,014 | 2.3%), South America (12,338 | 2.2%), Caribbean (11,561 | 2.0%), and Europe (11,230 | 2.0%), together accounting for 14.1% of all Pasco County residents.
| Immigration Origin | # Population | % Population |
| Afghanistan | 14 | 0.0% |
| Africa | 3,127 | 0.5% |
| Albania | 111 | 0.0% |
| Argentina | 283 | 0.1% |
| Armenia | 6 | 0.0% |
| Asia | 13,014 | 2.3% |
| Australia | 78 | 0.0% |
| Austria | 94 | 0.0% |
| Azores | 65 | 0.0% |
| Bahamas | 283 | 0.1% |
| Bangladesh | 45 | 0.0% |
| Barbados | 99 | 0.0% |
| Belarus | 120 | 0.0% |
| Belgium | 40 | 0.0% |
| Belize | 37 | 0.0% |
| Bolivia | 66 | 0.0% |
| Bosnia and Herzegovina | 289 | 0.1% |
| Brazil | 1,098 | 0.2% |
| Bulgaria | 180 | 0.0% |
| Cambodia | 3 | 0.0% |
| Cameroon | 25 | 0.0% |
| Canada | 3,757 | 0.7% |
| Caribbean | 11,561 | 2.0% |
| Central America | 8,118 | 1.4% |
| Chile | 55 | 0.0% |
| China | 1,896 | 0.3% |
| Colombia | 5,098 | 0.9% |
| Costa Rica | 419 | 0.1% |
| Croatia | 168 | 0.0% |
| Cuba | 5,154 | 0.9% |
| Czechoslovakia | 109 | 0.0% |
| Denmark | 85 | 0.0% |
| Dominica | 138 | 0.0% |
| Dominican Republic | 1,772 | 0.3% |
| Eastern Africa | 133 | 0.0% |
| Eastern Asia | 2,389 | 0.4% |
| Eastern Europe | 4,703 | 0.8% |
| Ecuador | 1,096 | 0.2% |
| Egypt | 1,797 | 0.3% |
| El Salvador | 312 | 0.1% |
| England | 983 | 0.2% |
| Ethiopia | 32 | 0.0% |
| Europe | 11,230 | 2.0% |
| Fiji | 6 | 0.0% |
| France | 386 | 0.1% |
| Germany | 1,434 | 0.3% |
| Ghana | 51 | 0.0% |
| Greece | 746 | 0.1% |
| Grenada | 37 | 0.0% |
| Guatemala | 499 | 0.1% |
| Guyana | 726 | 0.1% |
| Haiti | 752 | 0.1% |
| Honduras | 920 | 0.2% |
| Hong Kong | 56 | 0.0% |
| Hungary | 307 | 0.1% |
| India | 3,247 | 0.6% |
| Indonesia | 27 | 0.0% |
| Iran | 104 | 0.0% |
| Iraq | 32 | 0.0% |
| Ireland | 272 | 0.1% |
| Israel | 539 | 0.1% |
| Italy | 845 | 0.2% |
| Jamaica | 2,145 | 0.4% |
| Japan | 101 | 0.0% |
| Jordan | 97 | 0.0% |
| Kenya | 16 | 0.0% |
| Korea | 392 | 0.1% |
| Kuwait | 96 | 0.0% |
| Laos | 238 | 0.0% |
| Latin America | 32,017 | 5.6% |
| Latvia | 47 | 0.0% |
| Lebanon | 263 | 0.1% |
| Lithuania | 171 | 0.0% |
| Malaysia | 23 | 0.0% |
| Mexico | 4,805 | 0.8% |
| Micronesia | 18 | 0.0% |
| Middle Africa | 90 | 0.0% |
| Morocco | 419 | 0.1% |
| Nepal | 23 | 0.0% |
| Netherlands | 147 | 0.0% |
| Nicaragua | 548 | 0.1% |
| Nigeria | 64 | 0.0% |
| North Macedonia | 20 | 0.0% |
| Northern Africa | 2,286 | 0.4% |
| Northern Europe | 2,416 | 0.4% |
| Norway | 58 | 0.0% |
| Oceania | 145 | 0.0% |
| Pakistan | 455 | 0.1% |
| Panama | 578 | 0.1% |
| Peru | 1,512 | 0.3% |
| Philippines | 2,439 | 0.4% |
| Poland | 861 | 0.2% |
| Portugal | 212 | 0.0% |
| Romania | 223 | 0.0% |
| Russia | 784 | 0.1% |
| Saudi Arabia | 271 | 0.1% |
| Scotland | 181 | 0.0% |
| Senegal | 17 | 0.0% |
| Serbia | 123 | 0.0% |
| Sierra Leone | 40 | 0.0% |
| Singapore | 5 | 0.0% |
| South Africa | 237 | 0.0% |
| South America | 12,338 | 2.2% |
| South Central Asia | 4,051 | 0.7% |
| South Eastern Asia | 4,467 | 0.8% |
| Southern Europe | 1,989 | 0.4% |
| Spain | 163 | 0.0% |
| Sri Lanka | 126 | 0.0% |
| Sudan | 19 | 0.0% |
| Sweden | 35 | 0.0% |
| Switzerland | 21 | 0.0% |
| Syria | 379 | 0.1% |
| Taiwan | 154 | 0.0% |
| Thailand | 256 | 0.0% |
| Trinidad and Tobago | 961 | 0.2% |
| Turkey | 349 | 0.1% |
| Ukraine | 831 | 0.2% |
| Uruguay | 208 | 0.0% |
| Uzbekistan | 15 | 0.0% |
| Venezuela | 2,064 | 0.4% |
| Vietnam | 1,464 | 0.3% |
| West Indies | 13 | 0.0% |
| Western Africa | 275 | 0.1% |
| Western Asia | 2,094 | 0.4% |
| Western Europe | 2,122 | 0.4% |
| Zaire | 65 | 0.0% |
| Zimbabwe | 63 | 0.0% | View All 127 Rows |
Sex and Age in Pasco County
Sex and Age in Pasco County
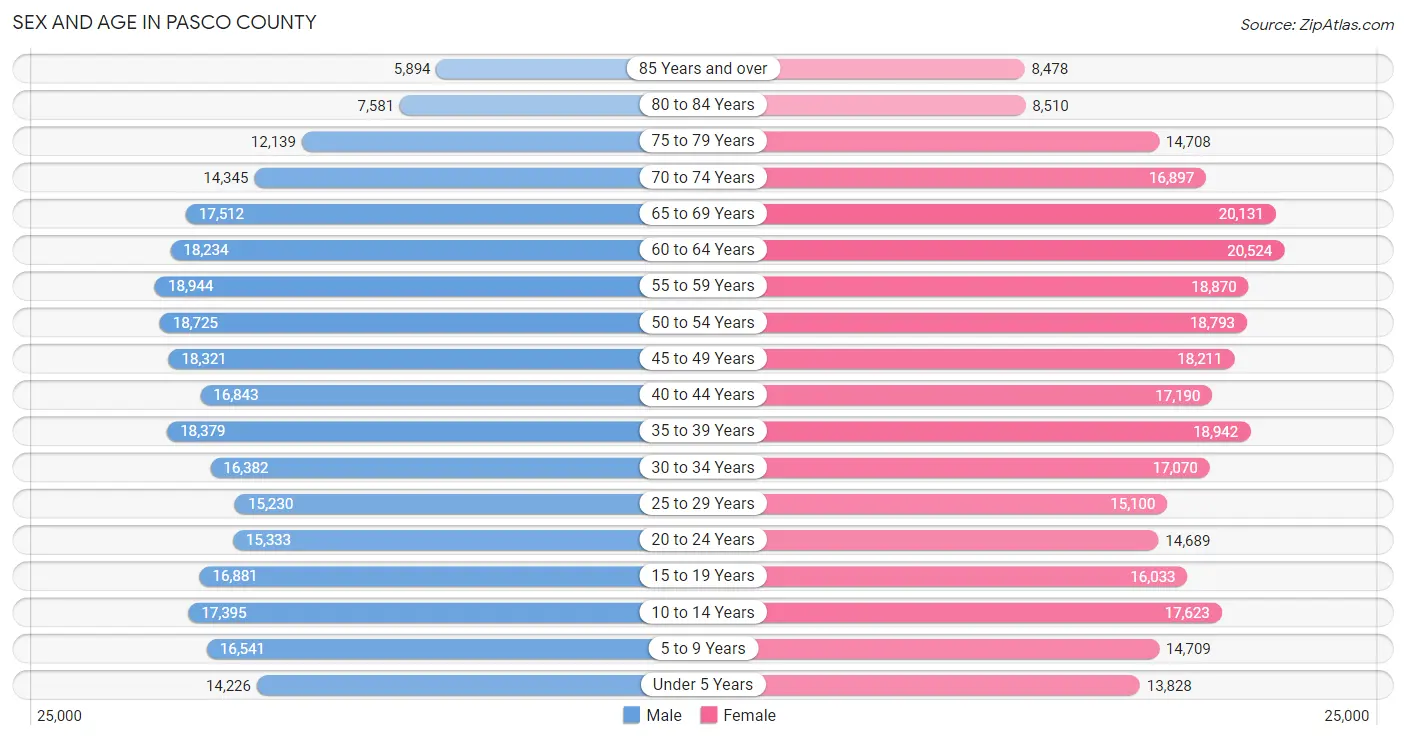
The most populous age groups in Pasco County are 55 to 59 Years (18,944 | 6.8%) for men and 60 to 64 Years (20,524 | 7.1%) for women.
| Age Bracket | Male | Female |
| Under 5 Years | 14,226 (5.1%) | 13,828 (4.8%) |
| 5 to 9 Years | 16,541 (5.9%) | 14,709 (5.1%) |
| 10 to 14 Years | 17,395 (6.2%) | 17,623 (6.1%) |
| 15 to 19 Years | 16,881 (6.0%) | 16,033 (5.5%) |
| 20 to 24 Years | 15,333 (5.5%) | 14,689 (5.1%) |
| 25 to 29 Years | 15,230 (5.5%) | 15,100 (5.2%) |
| 30 to 34 Years | 16,382 (5.9%) | 17,070 (5.9%) |
| 35 to 39 Years | 18,379 (6.6%) | 18,942 (6.5%) |
| 40 to 44 Years | 16,843 (6.0%) | 17,190 (5.9%) |
| 45 to 49 Years | 18,321 (6.6%) | 18,211 (6.3%) |
| 50 to 54 Years | 18,725 (6.7%) | 18,793 (6.5%) |
| 55 to 59 Years | 18,944 (6.8%) | 18,870 (6.5%) |
| 60 to 64 Years | 18,234 (6.5%) | 20,524 (7.1%) |
| 65 to 69 Years | 17,512 (6.3%) | 20,131 (6.9%) |
| 70 to 74 Years | 14,345 (5.1%) | 16,897 (5.8%) |
| 75 to 79 Years | 12,139 (4.3%) | 14,708 (5.1%) |
| 80 to 84 Years | 7,581 (2.7%) | 8,510 (2.9%) |
| 85 Years and over | 5,894 (2.1%) | 8,478 (2.9%) |
| Total | 278,905 (100.0%) | 290,306 (100.0%) |
Families and Households in Pasco County
Median Family Size in Pasco County
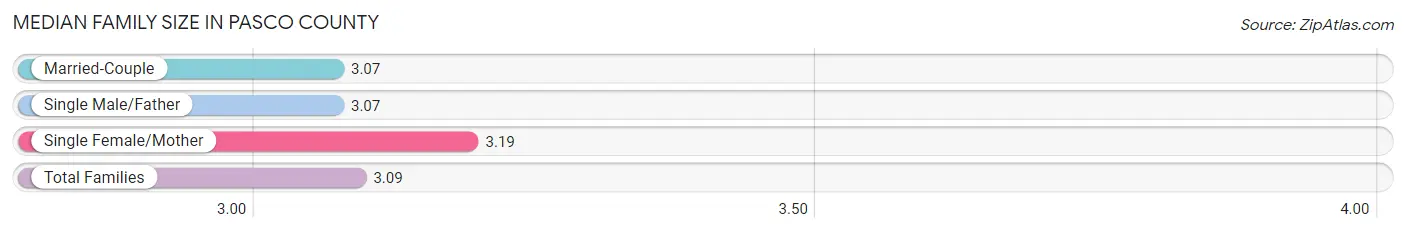
The median family size in Pasco County is 3.09 persons per family, with single female/mother families (25,018 | 17.1%) accounting for the largest median family size of 3.19 persons per family. On the other hand, married-couple families (111,363 | 76.2%) represent the smallest median family size with 3.07 persons per family.
| Family Type | # Families | Family Size |
| Married-Couple | 111,363 (76.2%) | 3.07 |
| Single Male/Father | 9,668 (6.6%) | 3.07 |
| Single Female/Mother | 25,018 (17.1%) | 3.19 |
| Total Families | 146,049 (100.0%) | 3.09 |
Median Household Size in Pasco County
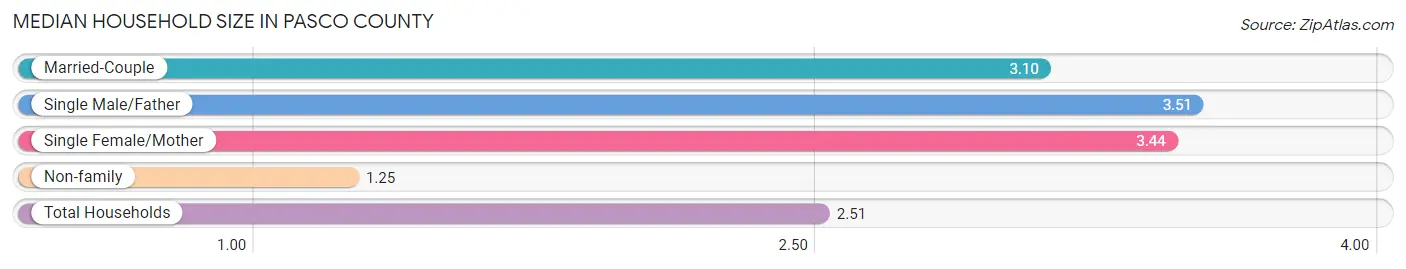
The median household size in Pasco County is 2.51 persons per household, with single male/father households (9,668 | 4.3%) accounting for the largest median household size of 3.51 persons per household. non-family households (77,336 | 34.6%) represent the smallest median household size with 1.25 persons per household.
| Household Type | # Households | Household Size |
| Married-Couple | 111,363 (49.8%) | 3.10 |
| Single Male/Father | 9,668 (4.3%) | 3.51 |
| Single Female/Mother | 25,018 (11.2%) | 3.44 |
| Non-family | 77,336 (34.6%) | 1.25 |
| Total Households | 223,385 (100.0%) | 2.51 |
Household Size by Marriage Status in Pasco County
Out of a total of 223,385 households in Pasco County, 146,049 (65.4%) are family households, while 77,336 (34.6%) are nonfamily households. The most numerous type of family households are 2-person households, comprising 69,262, and the most common type of nonfamily households are 1-person households, comprising 63,837.
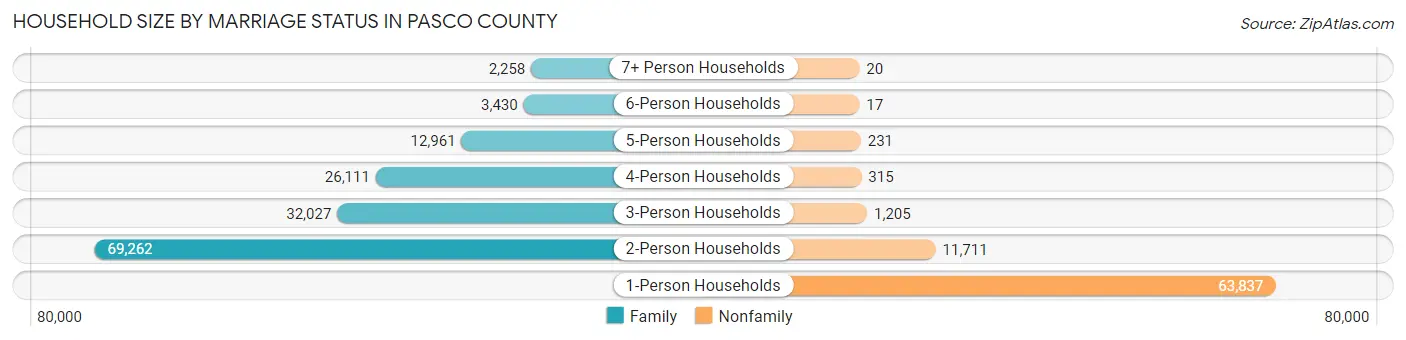
| Household Size | Family Households | Nonfamily Households |
| 1-Person Households | - | 63,837 (28.6%) |
| 2-Person Households | 69,262 (31.0%) | 11,711 (5.2%) |
| 3-Person Households | 32,027 (14.3%) | 1,205 (0.5%) |
| 4-Person Households | 26,111 (11.7%) | 315 (0.1%) |
| 5-Person Households | 12,961 (5.8%) | 231 (0.1%) |
| 6-Person Households | 3,430 (1.5%) | 17 (0.0%) |
| 7+ Person Households | 2,258 (1.0%) | 20 (0.0%) |
| Total | 146,049 (65.4%) | 77,336 (34.6%) |
Female Fertility in Pasco County
Fertility by Age in Pasco County
Average fertility rate in Pasco County is 43.0 births per 1,000 women. Women in the age bracket of 20 to 34 years have the highest fertility rate with 81.0 births per 1,000 women. Women in the age bracket of 20 to 34 years acount for 72.4% of all women with births.
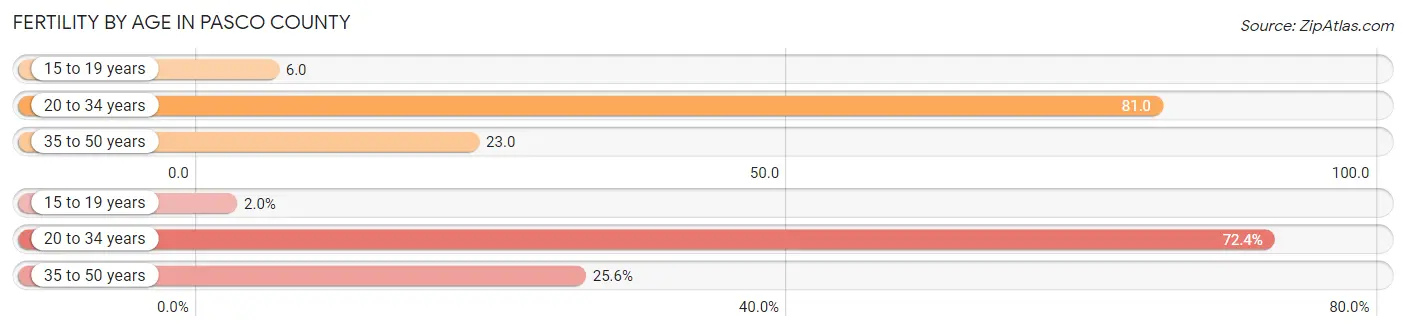
| Age Bracket | Women with Births | Births / 1,000 Women |
| 15 to 19 years | 103 (2.0%) | 6.0 |
| 20 to 34 years | 3,783 (72.4%) | 81.0 |
| 35 to 50 years | 1,340 (25.6%) | 23.0 |
| Total | 5,226 (100.0%) | 43.0 |
Fertility by Age by Marriage Status in Pasco County
60.9% of women with births (5,226) in Pasco County are married. The highest percentage of unmarried women with births falls into 15 to 19 years age bracket with 100.0% of them unmarried at the time of birth, while the lowest percentage of unmarried women with births belong to 35 to 50 years age bracket with 30.4% of them unmarried.
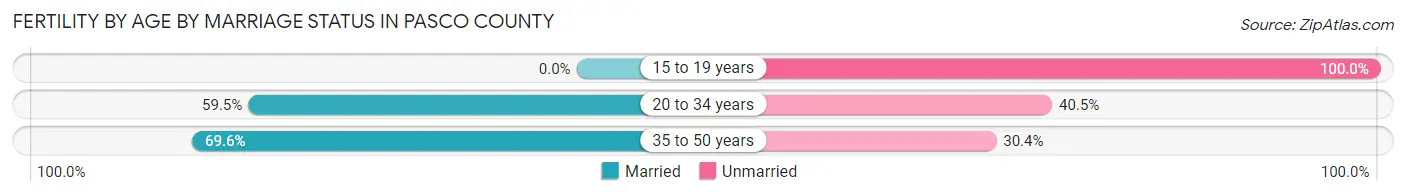
| Age Bracket | Married | Unmarried |
| 15 to 19 years | 0 (0.0%) | 103 (100.0%) |
| 20 to 34 years | 2,251 (59.5%) | 1,532 (40.5%) |
| 35 to 50 years | 933 (69.6%) | 407 (30.4%) |
| Total | 3,183 (60.9%) | 2,043 (39.1%) |
Fertility by Education in Pasco County
Average fertility rate in Pasco County is 43.0 births per 1,000 women. Women with the education attainment of bachelor's degree have the highest fertility rate of 54.0 births per 1,000 women, while women with the education attainment of less than high school have the lowest fertility at 22.0 births per 1,000 women. Women with the education attainment of college or associate's degree represent 37.3% of all women with births.
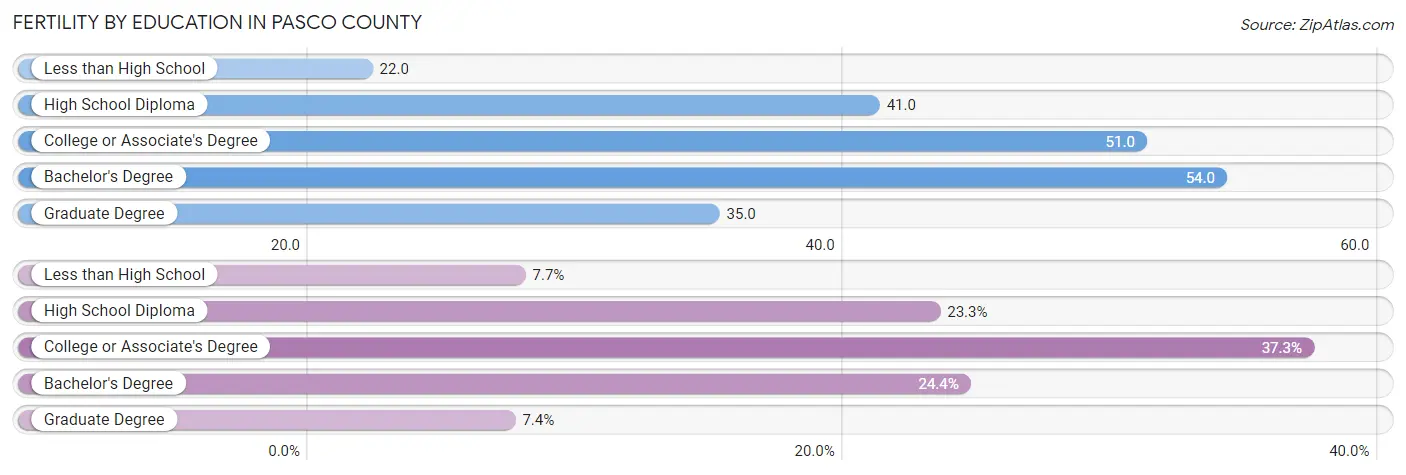
| Educational Attainment | Women with Births | Births / 1,000 Women |
| Less than High School | 404 (7.7%) | 22.0 |
| High School Diploma | 1,216 (23.3%) | 41.0 |
| College or Associate's Degree | 1,947 (37.3%) | 51.0 |
| Bachelor's Degree | 1,275 (24.4%) | 54.0 |
| Graduate Degree | 384 (7.3%) | 35.0 |
| Total | 5,226 (100.0%) | 43.0 |
Fertility by Education by Marriage Status in Pasco County
39.1% of women with births in Pasco County are unmarried. Women with the educational attainment of graduate degree are most likely to be married with 96.4% of them married at childbirth, while women with the educational attainment of less than high school are least likely to be married with 71.3% of them unmarried at childbirth.
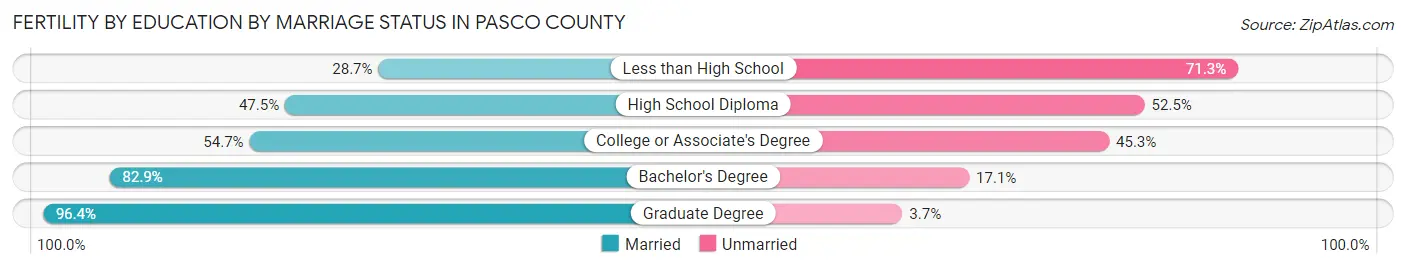
| Educational Attainment | Married | Unmarried |
| Less than High School | 116 (28.7%) | 288 (71.3%) |
| High School Diploma | 578 (47.5%) | 638 (52.5%) |
| College or Associate's Degree | 1,065 (54.7%) | 882 (45.3%) |
| Bachelor's Degree | 1,057 (82.9%) | 218 (17.1%) |
| Graduate Degree | 370 (96.4%) | 14 (3.6%) |
| Total | 3,183 (60.9%) | 2,043 (39.1%) |
Employment Characteristics in Pasco County
Employment by Class of Employer in Pasco County
Among the 242,883 employed individuals in Pasco County, private company employees (168,631 | 69.4%), local government employees (19,549 | 8.1%), and not-for-profit organizations (16,362 | 6.7%) make up the most common classes of employment.
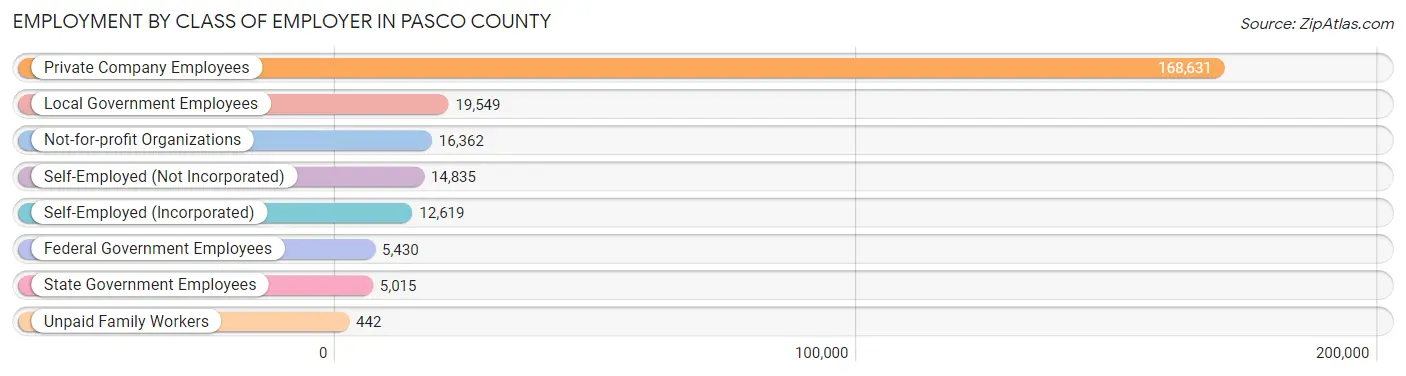
| Employer Class | # Employees | % Employees |
| Private Company Employees | 168,631 | 69.4% |
| Self-Employed (Incorporated) | 12,619 | 5.2% |
| Self-Employed (Not Incorporated) | 14,835 | 6.1% |
| Not-for-profit Organizations | 16,362 | 6.7% |
| Local Government Employees | 19,549 | 8.1% |
| State Government Employees | 5,015 | 2.1% |
| Federal Government Employees | 5,430 | 2.2% |
| Unpaid Family Workers | 442 | 0.2% |
| Total | 242,883 | 100.0% |
Employment Status by Age in Pasco County
According to the labor force statistics for Pasco County, out of the total population over 16 years of age (468,117), 55.8% or 261,209 individuals are in the labor force, with 5.3% or 13,844 of them unemployed. The age group with the highest labor force participation rate is 35 to 44 years, with 82.3% or 58,724 individuals in the labor force. Within the labor force, the 16 to 19 years age range has the highest percentage of unemployed individuals, with 14.8% or 1,521 of them being unemployed.
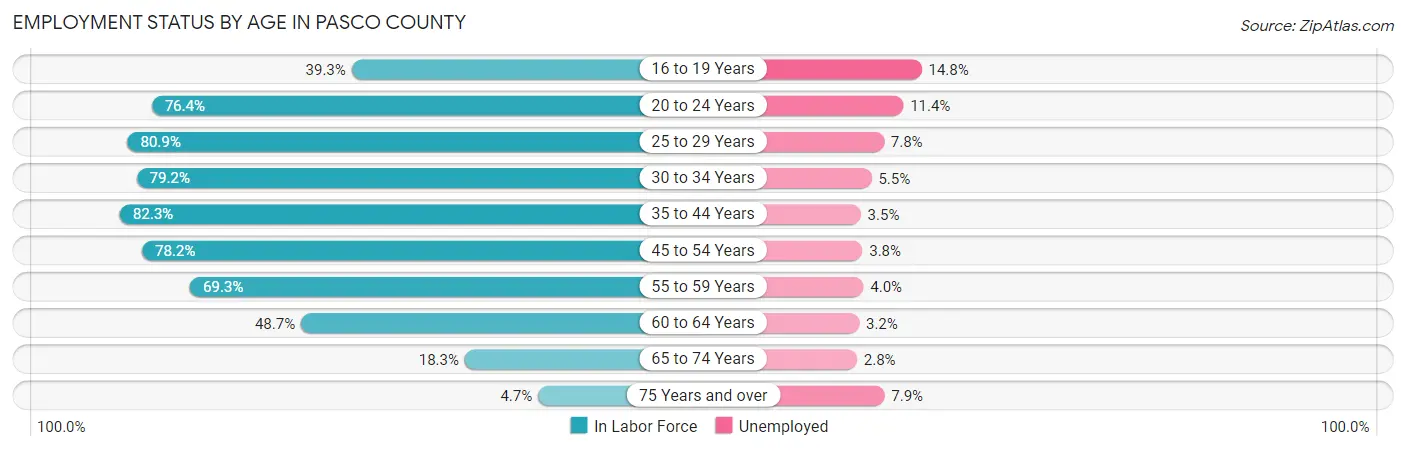
| Age Bracket | In Labor Force | Unemployed |
| 16 to 19 Years | 10,274 (39.3%) | 1,521 (14.8%) |
| 20 to 24 Years | 22,937 (76.4%) | 2,615 (11.4%) |
| 25 to 29 Years | 24,537 (80.9%) | 1,914 (7.8%) |
| 30 to 34 Years | 26,494 (79.2%) | 1,457 (5.5%) |
| 35 to 44 Years | 58,724 (82.3%) | 2,055 (3.5%) |
| 45 to 54 Years | 57,907 (78.2%) | 2,200 (3.8%) |
| 55 to 59 Years | 26,205 (69.3%) | 1,048 (4.0%) |
| 60 to 64 Years | 18,875 (48.7%) | 604 (3.2%) |
| 65 to 74 Years | 12,606 (18.3%) | 353 (2.8%) |
| 75 Years and over | 2,694 (4.7%) | 213 (7.9%) |
| Total | 261,209 (55.8%) | 13,844 (5.3%) |
Employment Status by Educational Attainment in Pasco County
According to labor force statistics for Pasco County, 74.4% of individuals (212,604) out of the total population between 25 and 64 years of age (285,758) are in the labor force, with 4.4% or 9,355 of them being unemployed. The group with the highest labor force participation rate are those with the educational attainment of bachelor's degree or higher, with 85.9% or 72,688 individuals in the labor force. Within the labor force, individuals with less than high school education have the highest percentage of unemployment, with 10.3% or 1,440 of them being unemployed.
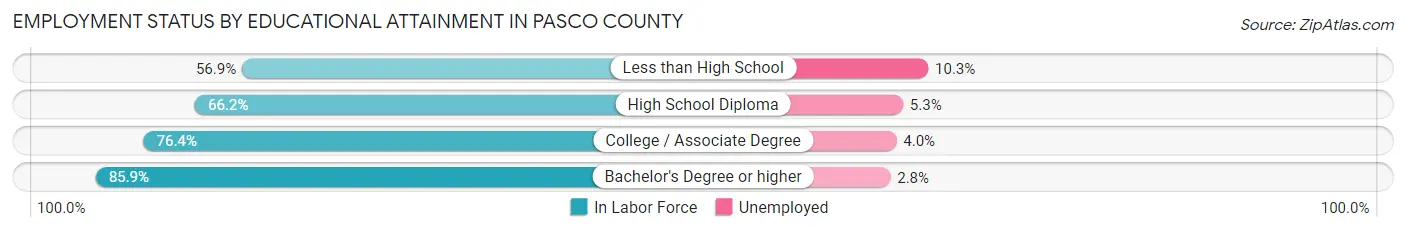
| Educational Attainment | In Labor Force | Unemployed |
| Less than High School | 13,984 (56.9%) | 2,531 (10.3%) |
| High School Diploma | 57,509 (66.2%) | 4,604 (5.3%) |
| College / Associate Degree | 68,523 (76.4%) | 3,588 (4.0%) |
| Bachelor's Degree or higher | 72,688 (85.9%) | 2,369 (2.8%) |
| Total | 212,604 (74.4%) | 12,573 (4.4%) |
Employment Occupations by Sex in Pasco County
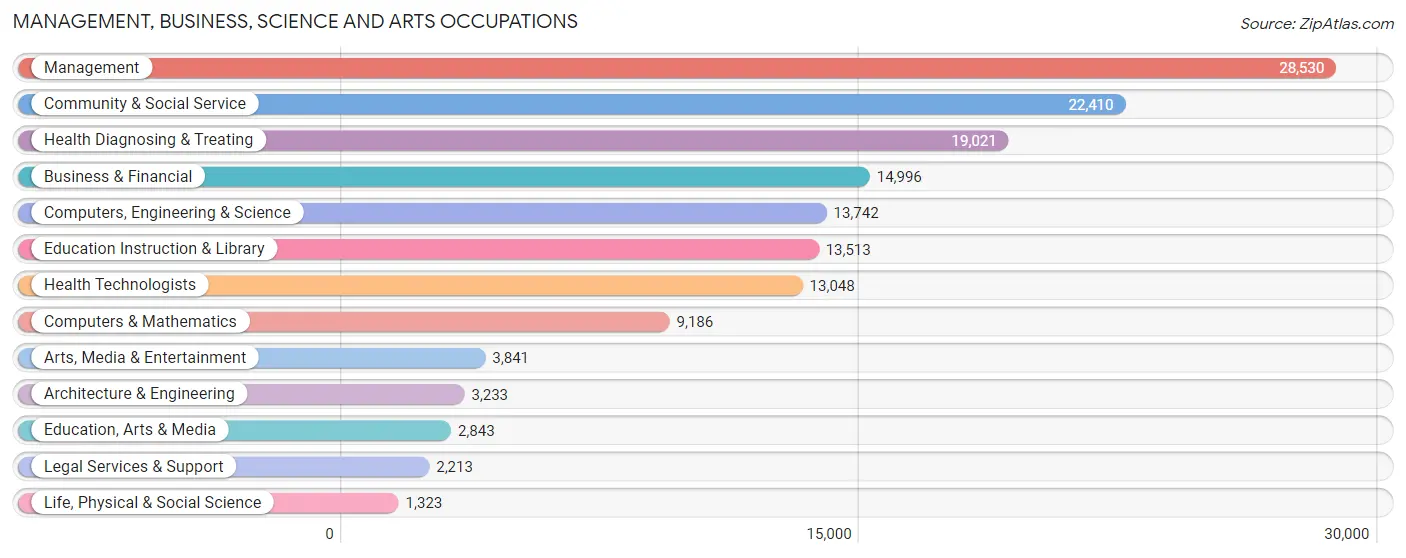
Management, Business, Science and Arts Occupations
The most common Management, Business, Science and Arts occupations in Pasco County are Management (28,530 | 11.6%), Community & Social Service (22,410 | 9.1%), Health Diagnosing & Treating (19,021 | 7.7%), Business & Financial (14,996 | 6.1%), and Computers, Engineering & Science (13,742 | 5.6%).
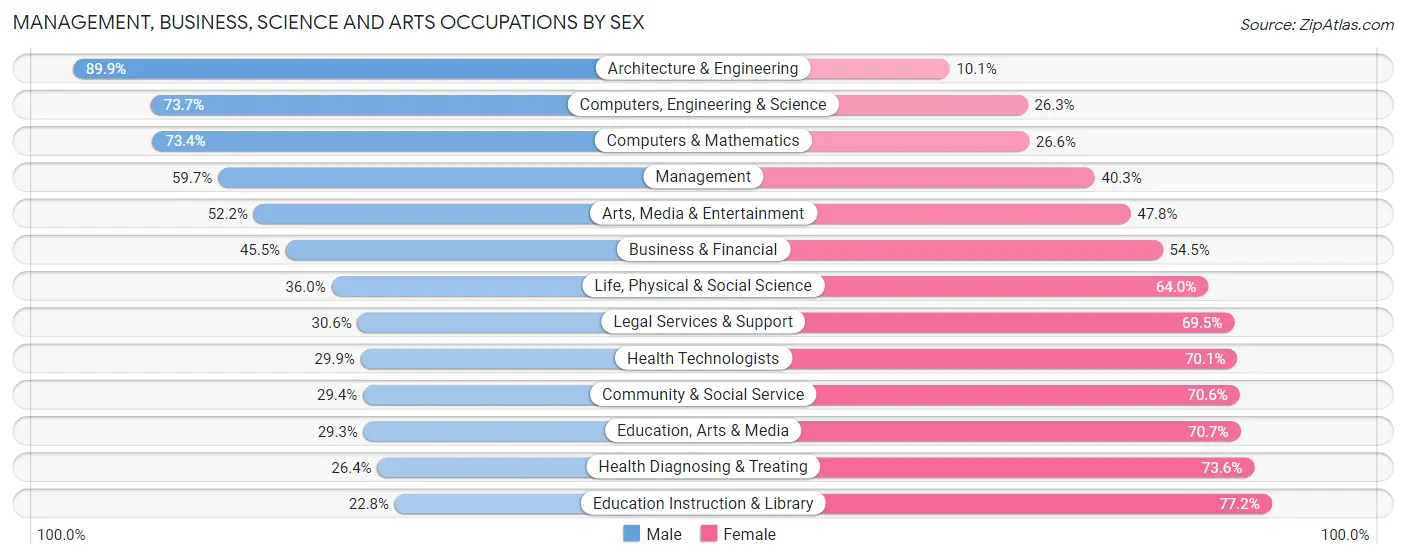
Management, Business, Science and Arts Occupations by Sex
Within the Management, Business, Science and Arts occupations in Pasco County, the most male-oriented occupations are Architecture & Engineering (89.9%), Computers, Engineering & Science (73.7%), and Computers & Mathematics (73.4%), while the most female-oriented occupations are Education Instruction & Library (77.2%), Health Diagnosing & Treating (73.6%), and Education, Arts & Media (70.7%).
| Occupation | Male | Female |
| Management | 17,020 (59.7%) | 11,510 (40.3%) |
| Business & Financial | 6,820 (45.5%) | 8,176 (54.5%) |
| Computers, Engineering & Science | 10,122 (73.7%) | 3,620 (26.3%) |
| Computers & Mathematics | 6,739 (73.4%) | 2,447 (26.6%) |
| Architecture & Engineering | 2,907 (89.9%) | 326 (10.1%) |
| Life, Physical & Social Science | 476 (36.0%) | 847 (64.0%) |
| Community & Social Service | 6,589 (29.4%) | 15,821 (70.6%) |
| Education, Arts & Media | 832 (29.3%) | 2,011 (70.7%) |
| Legal Services & Support | 676 (30.5%) | 1,537 (69.5%) |
| Education Instruction & Library | 3,076 (22.8%) | 10,437 (77.2%) |
| Arts, Media & Entertainment | 2,005 (52.2%) | 1,836 (47.8%) |
| Health Diagnosing & Treating | 5,021 (26.4%) | 14,000 (73.6%) |
| Health Technologists | 3,902 (29.9%) | 9,146 (70.1%) |
| Total (Category) | 45,572 (46.2%) | 53,127 (53.8%) |
| Total (Overall) | 128,868 (52.3%) | 117,583 (47.7%) |
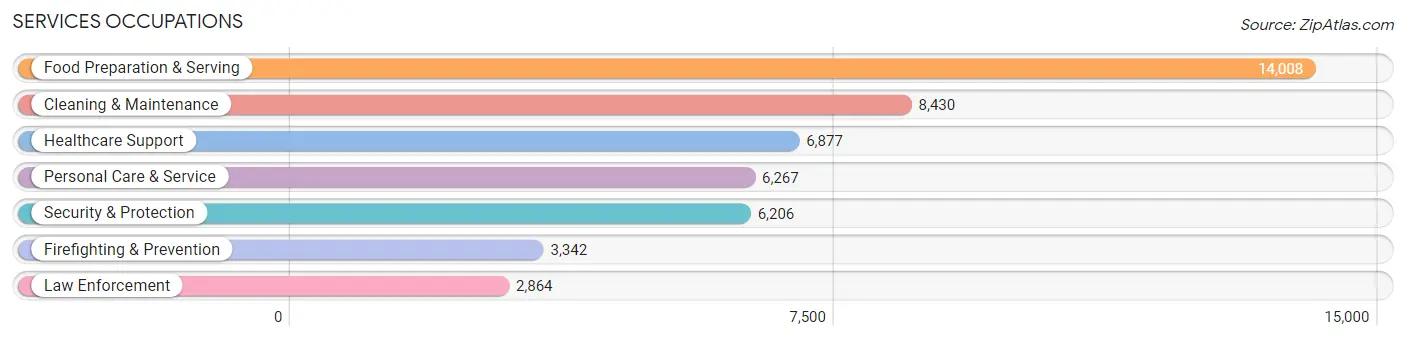
Services Occupations
The most common Services occupations in Pasco County are Food Preparation & Serving (14,008 | 5.7%), Cleaning & Maintenance (8,430 | 3.4%), Healthcare Support (6,877 | 2.8%), Personal Care & Service (6,267 | 2.5%), and Security & Protection (6,206 | 2.5%).
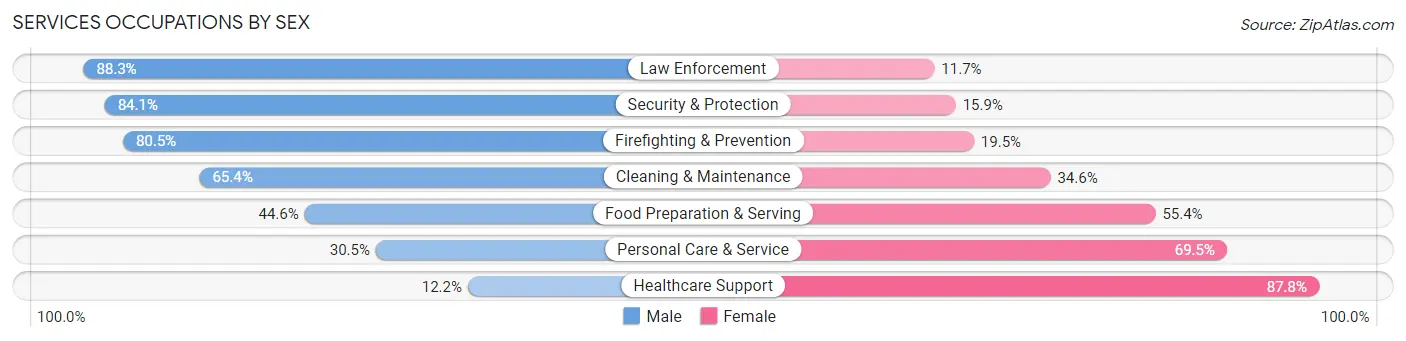
Services Occupations by Sex
Within the Services occupations in Pasco County, the most male-oriented occupations are Law Enforcement (88.3%), Security & Protection (84.1%), and Firefighting & Prevention (80.5%), while the most female-oriented occupations are Healthcare Support (87.8%), Personal Care & Service (69.5%), and Food Preparation & Serving (55.4%).
| Occupation | Male | Female |
| Healthcare Support | 841 (12.2%) | 6,036 (87.8%) |
| Security & Protection | 5,221 (84.1%) | 985 (15.9%) |
| Firefighting & Prevention | 2,691 (80.5%) | 651 (19.5%) |
| Law Enforcement | 2,530 (88.3%) | 334 (11.7%) |
| Food Preparation & Serving | 6,244 (44.6%) | 7,764 (55.4%) |
| Cleaning & Maintenance | 5,510 (65.4%) | 2,920 (34.6%) |
| Personal Care & Service | 1,909 (30.5%) | 4,358 (69.5%) |
| Total (Category) | 19,725 (47.2%) | 22,063 (52.8%) |
| Total (Overall) | 128,868 (52.3%) | 117,583 (47.7%) |
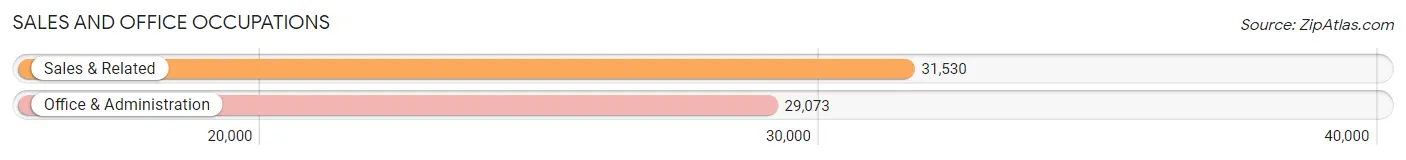
Sales and Office Occupations
The most common Sales and Office occupations in Pasco County are Sales & Related (31,530 | 12.8%), and Office & Administration (29,073 | 11.8%).
Sales and Office Occupations by Sex
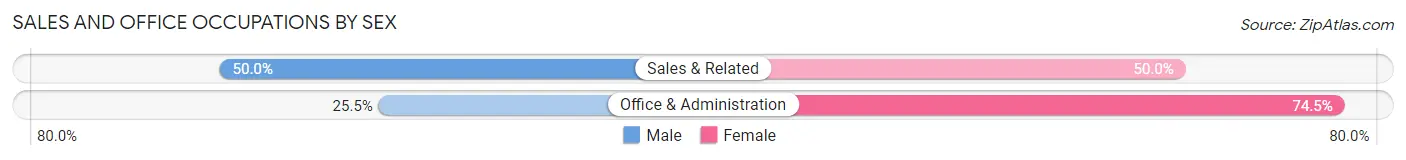
| Occupation | Male | Female |
| Sales & Related | 15,762 (50.0%) | 15,768 (50.0%) |
| Office & Administration | 7,421 (25.5%) | 21,652 (74.5%) |
| Total (Category) | 23,183 (38.3%) | 37,420 (61.8%) |
| Total (Overall) | 128,868 (52.3%) | 117,583 (47.7%) |
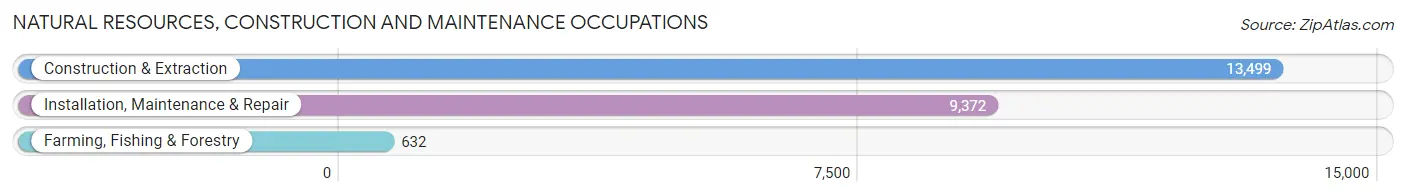
Natural Resources, Construction and Maintenance Occupations
The most common Natural Resources, Construction and Maintenance occupations in Pasco County are Construction & Extraction (13,499 | 5.5%), Installation, Maintenance & Repair (9,372 | 3.8%), and Farming, Fishing & Forestry (632 | 0.3%).
Natural Resources, Construction and Maintenance Occupations by Sex
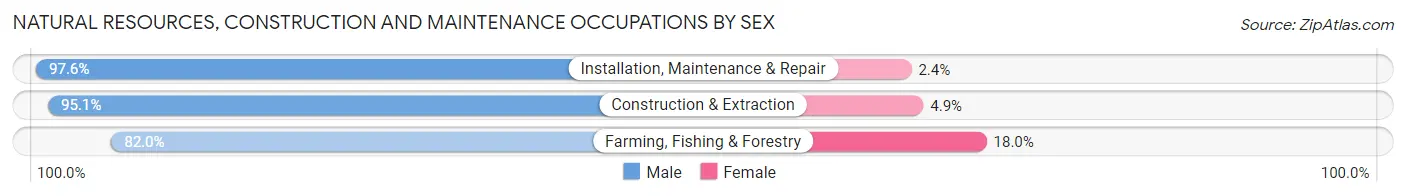
| Occupation | Male | Female |
| Farming, Fishing & Forestry | 518 (82.0%) | 114 (18.0%) |
| Construction & Extraction | 12,840 (95.1%) | 659 (4.9%) |
| Installation, Maintenance & Repair | 9,147 (97.6%) | 225 (2.4%) |
| Total (Category) | 22,505 (95.8%) | 998 (4.3%) |
| Total (Overall) | 128,868 (52.3%) | 117,583 (47.7%) |
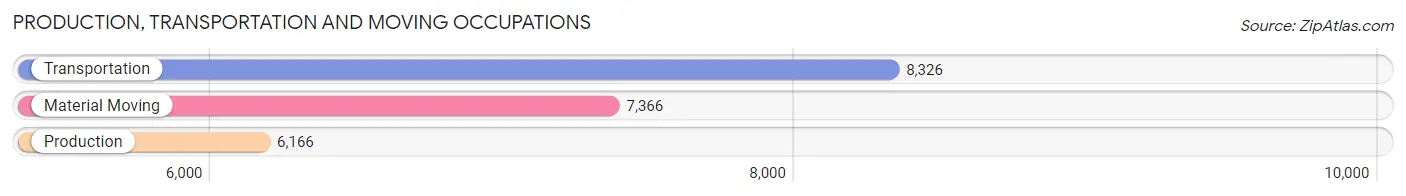
Production, Transportation and Moving Occupations
The most common Production, Transportation and Moving occupations in Pasco County are Transportation (8,326 | 3.4%), Material Moving (7,366 | 3.0%), and Production (6,166 | 2.5%).
Production, Transportation and Moving Occupations by Sex
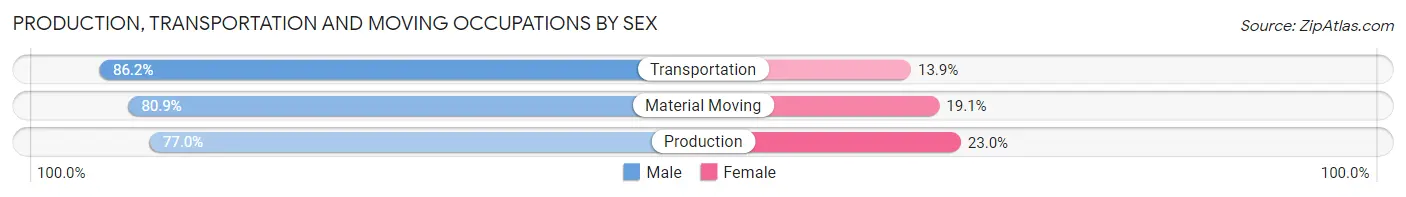
| Occupation | Male | Female |
| Production | 4,748 (77.0%) | 1,418 (23.0%) |
| Transportation | 7,173 (86.2%) | 1,153 (13.9%) |
| Material Moving | 5,962 (80.9%) | 1,404 (19.1%) |
| Total (Category) | 17,883 (81.8%) | 3,975 (18.2%) |
| Total (Overall) | 128,868 (52.3%) | 117,583 (47.7%) |
Employment Industries by Sex in Pasco County
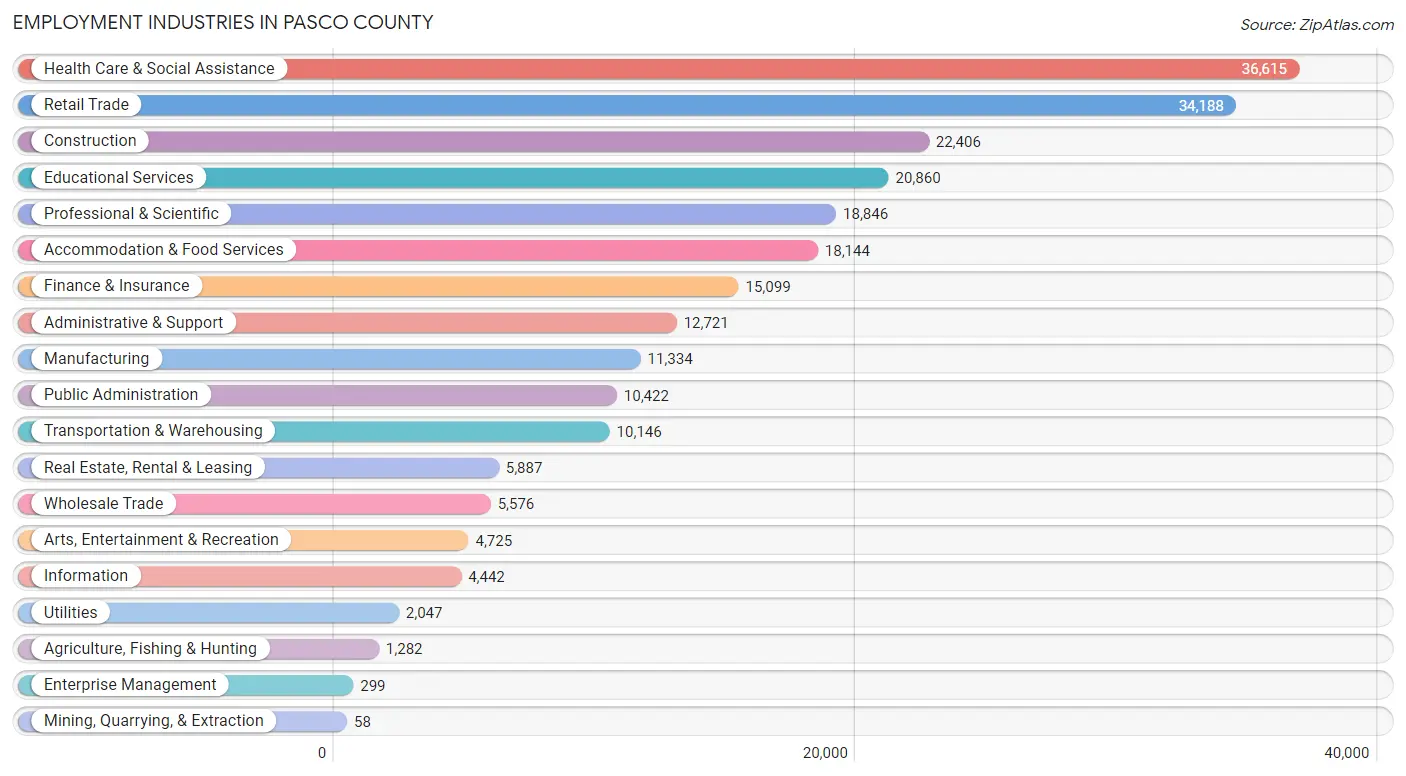
Employment Industries in Pasco County
The major employment industries in Pasco County include Health Care & Social Assistance (36,615 | 14.9%), Retail Trade (34,188 | 13.9%), Construction (22,406 | 9.1%), Educational Services (20,860 | 8.5%), and Professional & Scientific (18,846 | 7.6%).
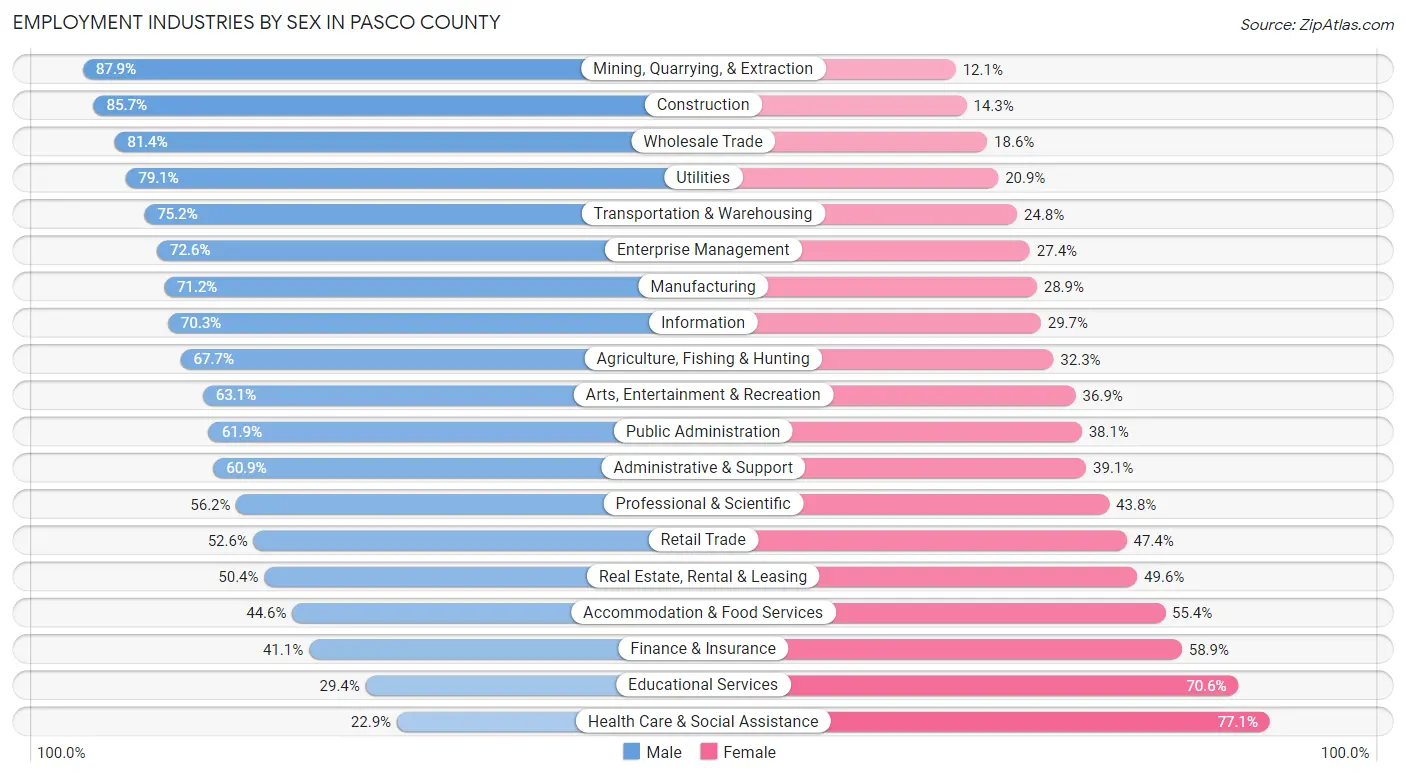
Employment Industries by Sex in Pasco County
The Pasco County industries that see more men than women are Mining, Quarrying, & Extraction (87.9%), Construction (85.7%), and Wholesale Trade (81.4%), whereas the industries that tend to have a higher number of women are Health Care & Social Assistance (77.1%), Educational Services (70.6%), and Finance & Insurance (58.9%).
| Industry | Male | Female |
| Agriculture, Fishing & Hunting | 868 (67.7%) | 414 (32.3%) |
| Mining, Quarrying, & Extraction | 51 (87.9%) | 7 (12.1%) |
| Construction | 19,201 (85.7%) | 3,205 (14.3%) |
| Manufacturing | 8,064 (71.2%) | 3,270 (28.8%) |
| Wholesale Trade | 4,540 (81.4%) | 1,036 (18.6%) |
| Retail Trade | 17,976 (52.6%) | 16,212 (47.4%) |
| Transportation & Warehousing | 7,633 (75.2%) | 2,513 (24.8%) |
| Utilities | 1,620 (79.1%) | 427 (20.9%) |
| Information | 3,124 (70.3%) | 1,318 (29.7%) |
| Finance & Insurance | 6,211 (41.1%) | 8,888 (58.9%) |
| Real Estate, Rental & Leasing | 2,966 (50.4%) | 2,921 (49.6%) |
| Professional & Scientific | 10,585 (56.2%) | 8,261 (43.8%) |
| Enterprise Management | 217 (72.6%) | 82 (27.4%) |
| Administrative & Support | 7,752 (60.9%) | 4,969 (39.1%) |
| Educational Services | 6,136 (29.4%) | 14,724 (70.6%) |
| Health Care & Social Assistance | 8,398 (22.9%) | 28,217 (77.1%) |
| Arts, Entertainment & Recreation | 2,982 (63.1%) | 1,743 (36.9%) |
| Accommodation & Food Services | 8,091 (44.6%) | 10,053 (55.4%) |
| Public Administration | 6,447 (61.9%) | 3,975 (38.1%) |
| Total | 128,868 (52.3%) | 117,583 (47.7%) |
Education in Pasco County
School Enrollment in Pasco County
The most common levels of schooling among the 121,011 students in Pasco County are middle school (27,086 | 22.4%), high school (26,573 | 22.0%), and elementary school (25,304 | 20.9%).
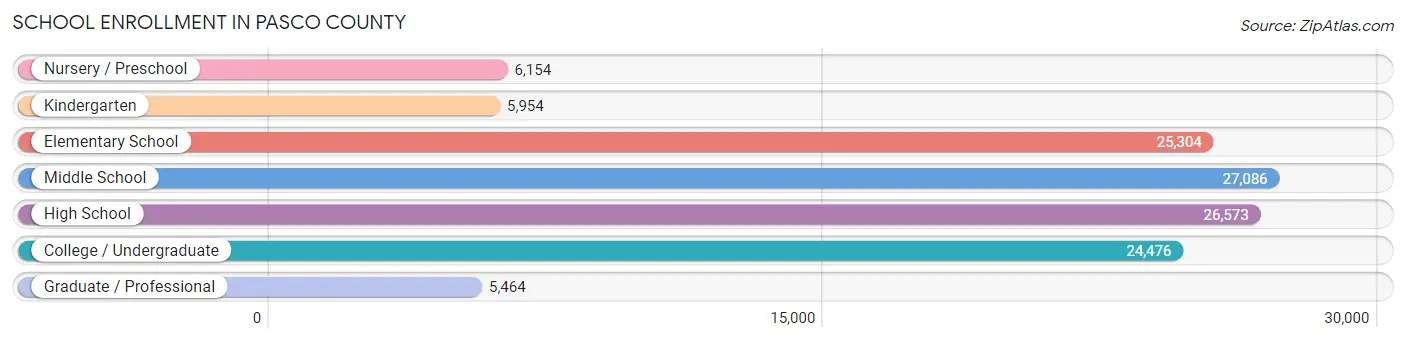
| School Level | # Students | % Students |
| Nursery / Preschool | 6,154 | 5.1% |
| Kindergarten | 5,954 | 4.9% |
| Elementary School | 25,304 | 20.9% |
| Middle School | 27,086 | 22.4% |
| High School | 26,573 | 22.0% |
| College / Undergraduate | 24,476 | 20.2% |
| Graduate / Professional | 5,464 | 4.5% |
| Total | 121,011 | 100.0% |
School Enrollment by Age by Funding Source in Pasco County
Out of a total of 121,011 students who are enrolled in schools in Pasco County, 23,113 (19.1%) attend a private institution, while the remaining 97,898 (80.9%) are enrolled in public schools. The age group of 3 to 4 year olds has the highest likelihood of being enrolled in private schools, with 2,039 (44.4% in the age bracket) enrolled. Conversely, the age group of 15 to 17 year olds has the lowest likelihood of being enrolled in a private school, with 17,548 (88.5% in the age bracket) attending a public institution.
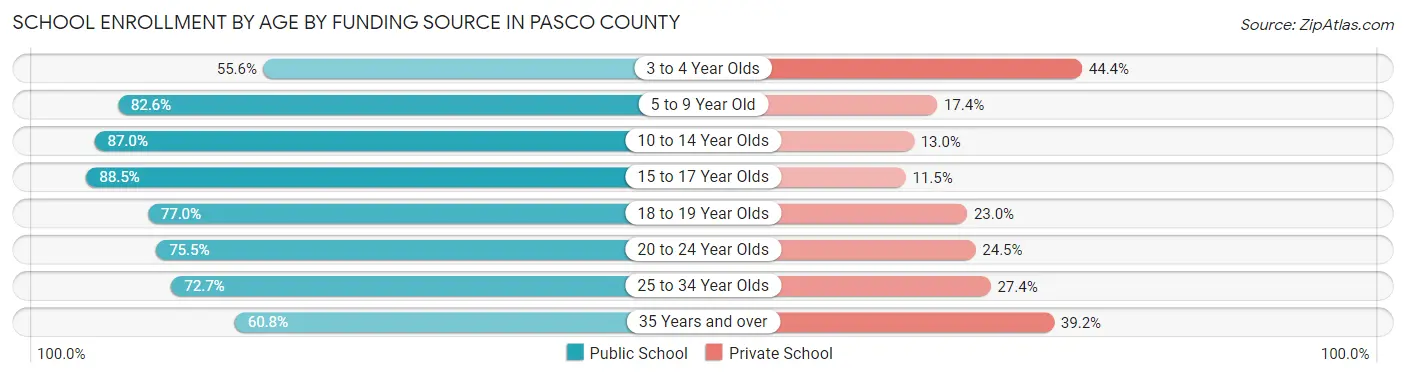
| Age Bracket | Public School | Private School |
| 3 to 4 Year Olds | 2,556 (55.6%) | 2,039 (44.4%) |
| 5 to 9 Year Old | 24,082 (82.6%) | 5,066 (17.4%) |
| 10 to 14 Year Olds | 29,348 (87.0%) | 4,399 (13.0%) |
| 15 to 17 Year Olds | 17,548 (88.5%) | 2,285 (11.5%) |
| 18 to 19 Year Olds | 6,758 (77.0%) | 2,014 (23.0%) |
| 20 to 24 Year Olds | 8,665 (75.5%) | 2,816 (24.5%) |
| 25 to 34 Year Olds | 4,561 (72.7%) | 1,717 (27.4%) |
| 35 Years and over | 4,354 (60.8%) | 2,803 (39.2%) |
| Total | 97,898 (80.9%) | 23,113 (19.1%) |
Educational Attainment by Field of Study in Pasco County
Business (29,494 | 24.9%), education (15,213 | 12.8%), science & technology (14,968 | 12.6%), social sciences (7,667 | 6.5%), and arts & humanities (7,142 | 6.0%) are the most common fields of study among 118,498 individuals in Pasco County who have obtained a bachelor's degree or higher.
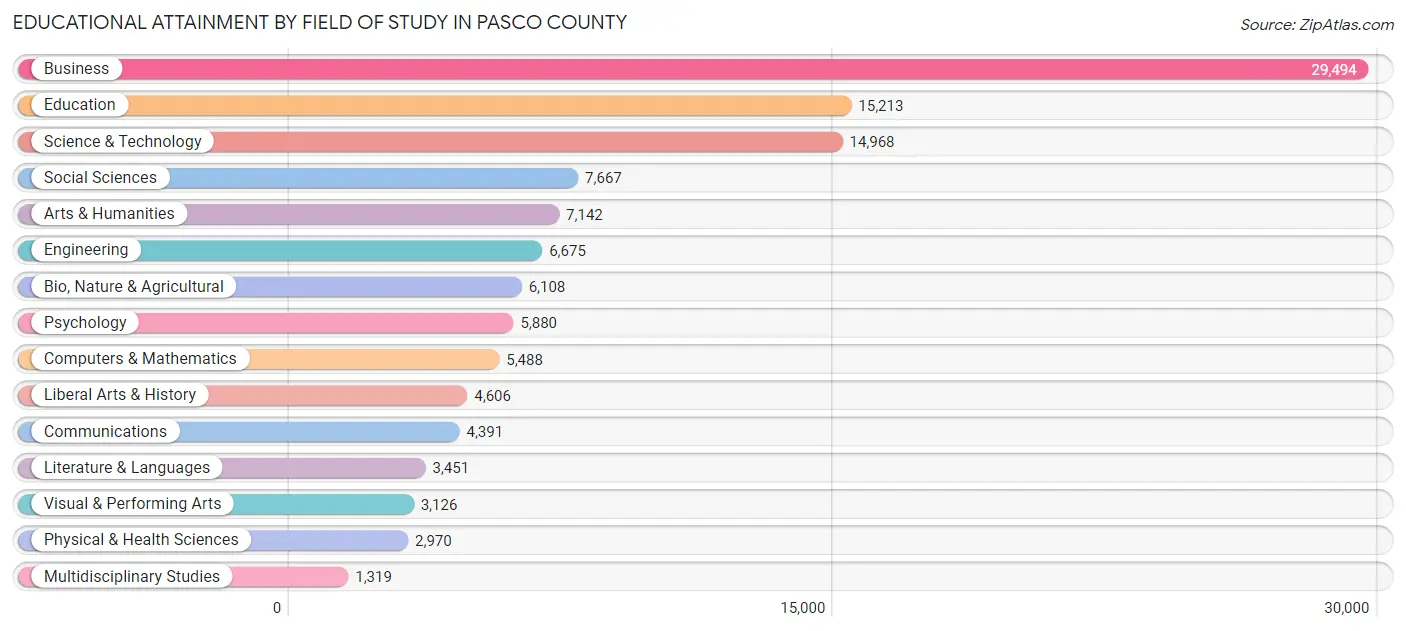
| Field of Study | # Graduates | % Graduates |
| Computers & Mathematics | 5,488 | 4.6% |
| Bio, Nature & Agricultural | 6,108 | 5.1% |
| Physical & Health Sciences | 2,970 | 2.5% |
| Psychology | 5,880 | 5.0% |
| Social Sciences | 7,667 | 6.5% |
| Engineering | 6,675 | 5.6% |
| Multidisciplinary Studies | 1,319 | 1.1% |
| Science & Technology | 14,968 | 12.6% |
| Business | 29,494 | 24.9% |
| Education | 15,213 | 12.8% |
| Literature & Languages | 3,451 | 2.9% |
| Liberal Arts & History | 4,606 | 3.9% |
| Visual & Performing Arts | 3,126 | 2.6% |
| Communications | 4,391 | 3.7% |
| Arts & Humanities | 7,142 | 6.0% |
| Total | 118,498 | 100.0% |
Transportation & Commute in Pasco County
Vehicle Availability by Sex in Pasco County
The most prevalent vehicle ownership categories in Pasco County are males with 2 vehicles (59,406, accounting for 46.9%) and females with 2 vehicles (50,948, making up 51.4%).
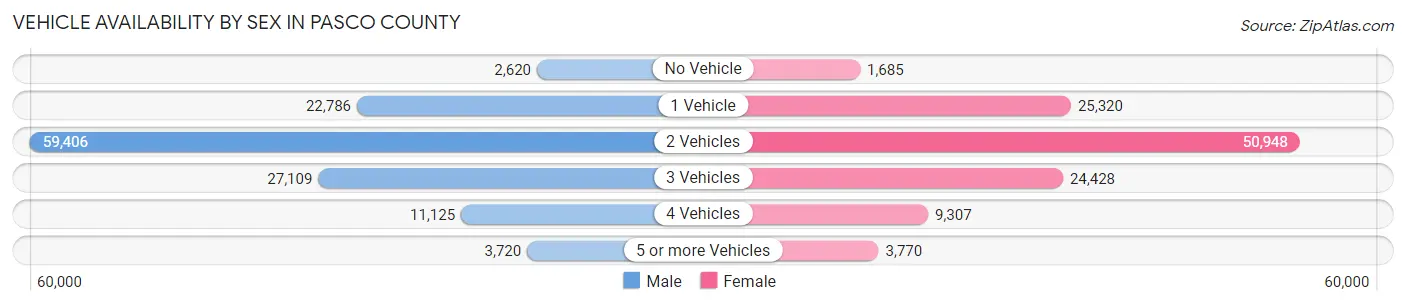
| Vehicles Available | Male | Female |
| No Vehicle | 2,620 (2.1%) | 1,685 (1.5%) |
| 1 Vehicle | 22,786 (18.0%) | 25,320 (21.9%) |
| 2 Vehicles | 59,406 (46.9%) | 50,948 (44.1%) |
| 3 Vehicles | 27,109 (21.4%) | 24,428 (21.2%) |
| 4 Vehicles | 11,125 (8.8%) | 9,307 (8.1%) |
| 5 or more Vehicles | 3,720 (2.9%) | 3,770 (3.3%) |
| Total | 126,766 (100.0%) | 115,458 (100.0%) |
Commute Time in Pasco County
The most frequently occuring commute durations in Pasco County are 45 to 59 minutes (28,818 commuters, 14.1%), 30 to 34 minutes (28,503 commuters, 14.0%), and 20 to 24 minutes (26,446 commuters, 13.0%).
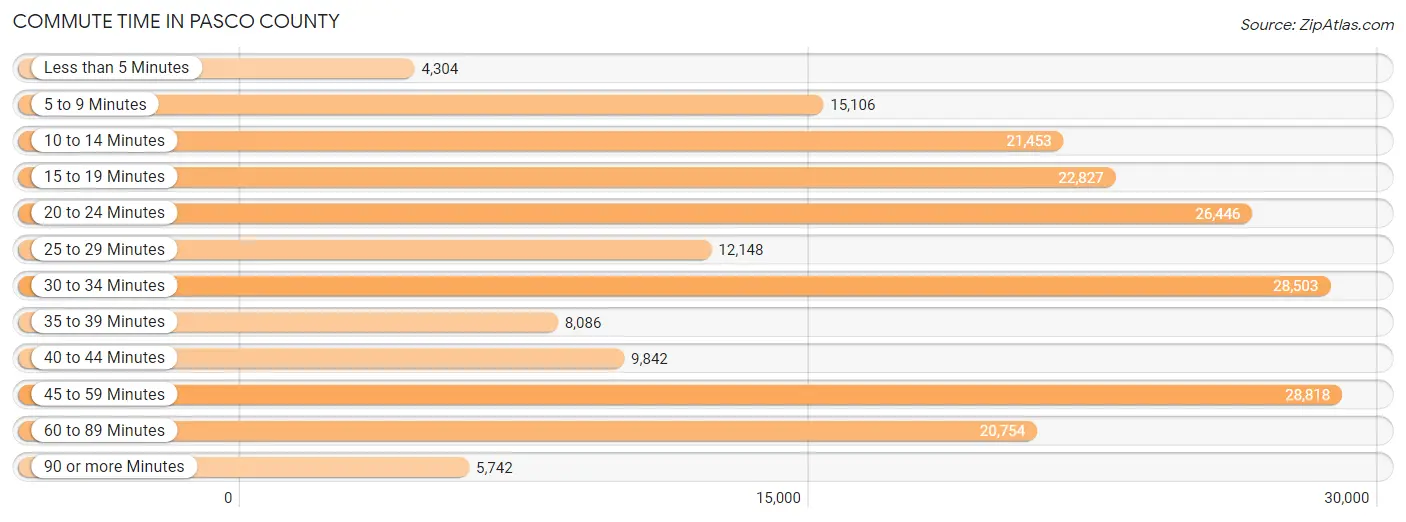
| Commute Time | # Commuters | % Commuters |
| Less than 5 Minutes | 4,304 | 2.1% |
| 5 to 9 Minutes | 15,106 | 7.4% |
| 10 to 14 Minutes | 21,453 | 10.5% |
| 15 to 19 Minutes | 22,827 | 11.2% |
| 20 to 24 Minutes | 26,446 | 13.0% |
| 25 to 29 Minutes | 12,148 | 5.9% |
| 30 to 34 Minutes | 28,503 | 14.0% |
| 35 to 39 Minutes | 8,086 | 4.0% |
| 40 to 44 Minutes | 9,842 | 4.8% |
| 45 to 59 Minutes | 28,818 | 14.1% |
| 60 to 89 Minutes | 20,754 | 10.2% |
| 90 or more Minutes | 5,742 | 2.8% |
Commute Time by Sex in Pasco County
The most common commute times in Pasco County are 45 to 59 minutes (17,732 commuters, 16.3%) for males and 20 to 24 minutes (14,355 commuters, 15.0%) for females.
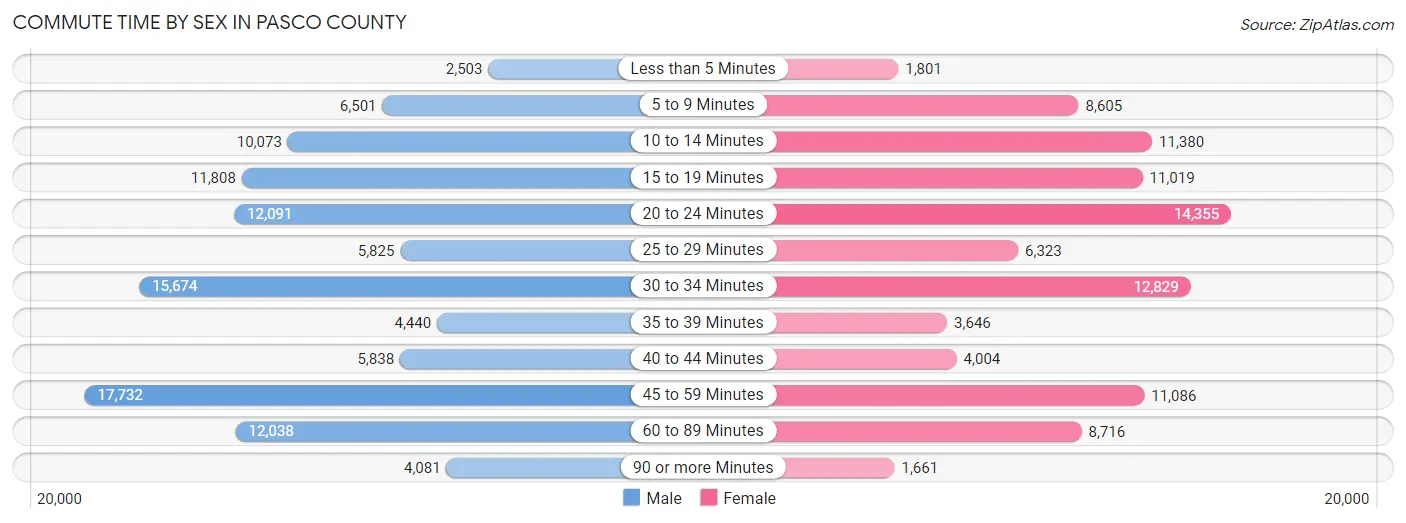
| Commute Time | Male | Female |
| Less than 5 Minutes | 2,503 (2.3%) | 1,801 (1.9%) |
| 5 to 9 Minutes | 6,501 (6.0%) | 8,605 (9.0%) |
| 10 to 14 Minutes | 10,073 (9.3%) | 11,380 (11.9%) |
| 15 to 19 Minutes | 11,808 (10.9%) | 11,019 (11.6%) |
| 20 to 24 Minutes | 12,091 (11.1%) | 14,355 (15.0%) |
| 25 to 29 Minutes | 5,825 (5.4%) | 6,323 (6.6%) |
| 30 to 34 Minutes | 15,674 (14.4%) | 12,829 (13.4%) |
| 35 to 39 Minutes | 4,440 (4.1%) | 3,646 (3.8%) |
| 40 to 44 Minutes | 5,838 (5.4%) | 4,004 (4.2%) |
| 45 to 59 Minutes | 17,732 (16.3%) | 11,086 (11.6%) |
| 60 to 89 Minutes | 12,038 (11.1%) | 8,716 (9.1%) |
| 90 or more Minutes | 4,081 (3.8%) | 1,661 (1.7%) |
Time of Departure to Work by Sex in Pasco County
The most frequent times of departure to work in Pasco County are 7:00 AM to 7:29 AM (15,306, 14.1%) for males and 7:00 AM to 7:29 AM (14,049, 14.7%) for females.
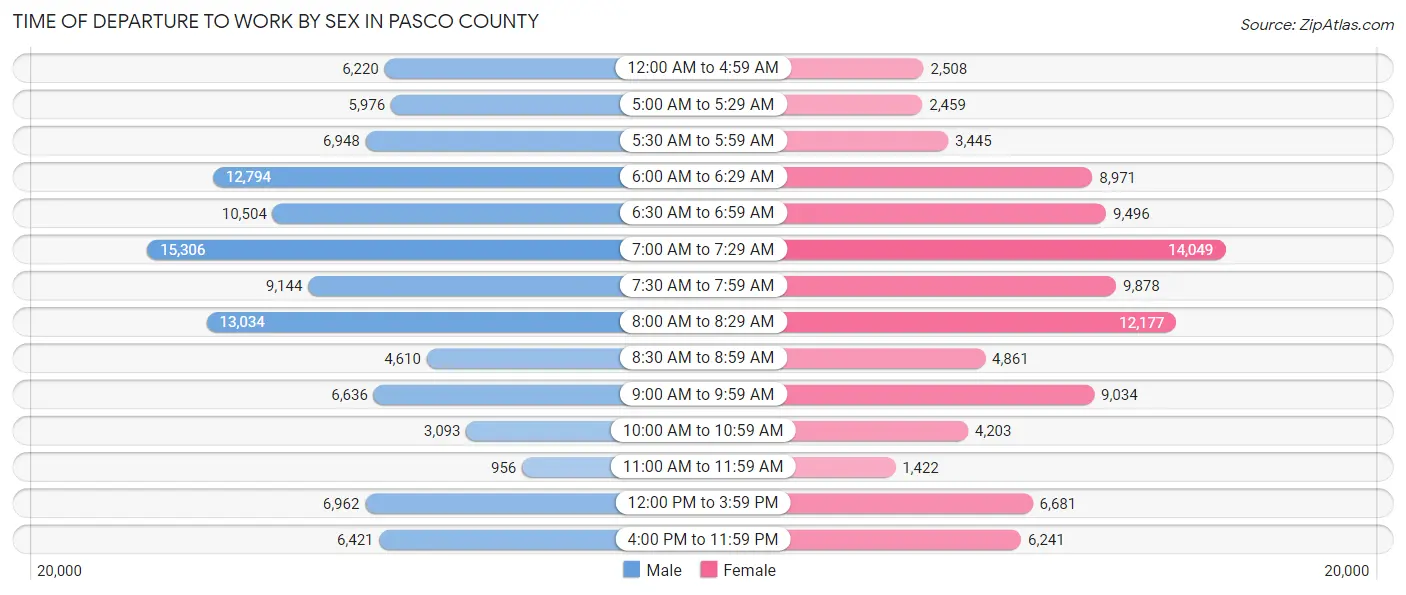
| Time of Departure | Male | Female |
| 12:00 AM to 4:59 AM | 6,220 (5.7%) | 2,508 (2.6%) |
| 5:00 AM to 5:29 AM | 5,976 (5.5%) | 2,459 (2.6%) |
| 5:30 AM to 5:59 AM | 6,948 (6.4%) | 3,445 (3.6%) |
| 6:00 AM to 6:29 AM | 12,794 (11.8%) | 8,971 (9.4%) |
| 6:30 AM to 6:59 AM | 10,504 (9.7%) | 9,496 (10.0%) |
| 7:00 AM to 7:29 AM | 15,306 (14.1%) | 14,049 (14.7%) |
| 7:30 AM to 7:59 AM | 9,144 (8.4%) | 9,878 (10.3%) |
| 8:00 AM to 8:29 AM | 13,034 (12.0%) | 12,177 (12.8%) |
| 8:30 AM to 8:59 AM | 4,610 (4.2%) | 4,861 (5.1%) |
| 9:00 AM to 9:59 AM | 6,636 (6.1%) | 9,034 (9.5%) |
| 10:00 AM to 10:59 AM | 3,093 (2.9%) | 4,203 (4.4%) |
| 11:00 AM to 11:59 AM | 956 (0.9%) | 1,422 (1.5%) |
| 12:00 PM to 3:59 PM | 6,962 (6.4%) | 6,681 (7.0%) |
| 4:00 PM to 11:59 PM | 6,421 (5.9%) | 6,241 (6.5%) |
| Total | 108,604 (100.0%) | 95,425 (100.0%) |
Housing Occupancy in Pasco County
Occupancy by Ownership in Pasco County
Of the total 223,385 dwellings in Pasco County, owner-occupied units account for 166,566 (74.6%), while renter-occupied units make up 56,819 (25.4%).
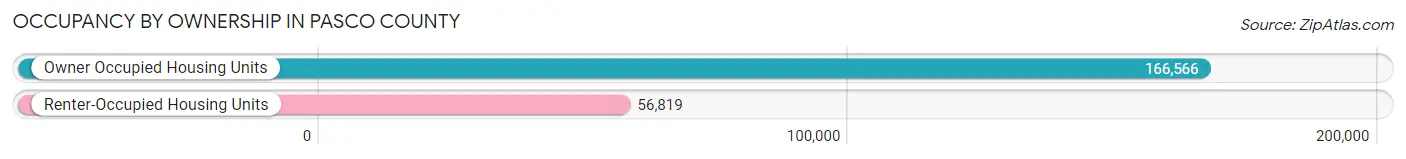
| Occupancy | # Housing Units | % Housing Units |
| Owner Occupied Housing Units | 166,566 | 74.6% |
| Renter-Occupied Housing Units | 56,819 | 25.4% |
| Total Occupied Housing Units | 223,385 | 100.0% |
Occupancy by Household Size in Pasco County
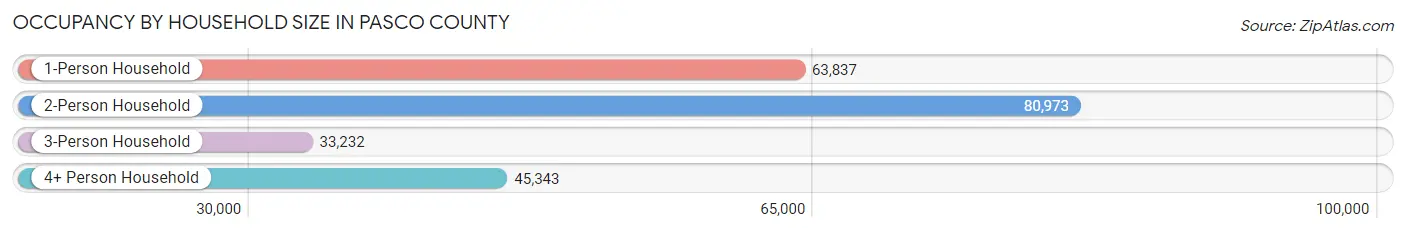
| Household Size | # Housing Units | % Housing Units |
| 1-Person Household | 63,837 | 28.6% |
| 2-Person Household | 80,973 | 36.2% |
| 3-Person Household | 33,232 | 14.9% |
| 4+ Person Household | 45,343 | 20.3% |
| Total Housing Units | 223,385 | 100.0% |
Occupancy by Ownership by Household Size in Pasco County
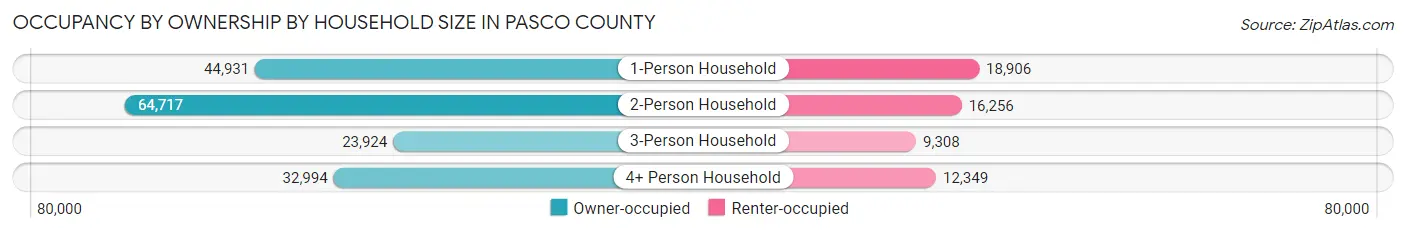
| Household Size | Owner-occupied | Renter-occupied |
| 1-Person Household | 44,931 (70.4%) | 18,906 (29.6%) |
| 2-Person Household | 64,717 (79.9%) | 16,256 (20.1%) |
| 3-Person Household | 23,924 (72.0%) | 9,308 (28.0%) |
| 4+ Person Household | 32,994 (72.8%) | 12,349 (27.2%) |
| Total Housing Units | 166,566 (74.6%) | 56,819 (25.4%) |
Occupancy by Educational Attainment in Pasco County
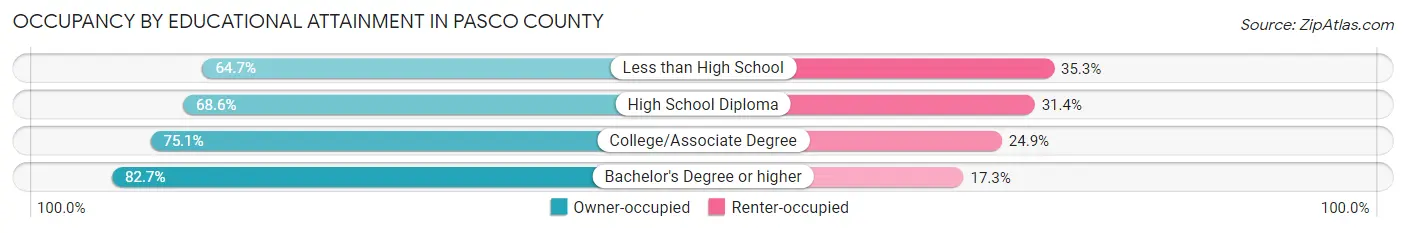
| Household Size | Owner-occupied | Renter-occupied |
| Less than High School | 10,713 (64.7%) | 5,838 (35.3%) |
| High School Diploma | 46,640 (68.6%) | 21,391 (31.4%) |
| College/Associate Degree | 54,697 (75.1%) | 18,161 (24.9%) |
| Bachelor's Degree or higher | 54,516 (82.7%) | 11,429 (17.3%) |
Occupancy by Age of Householder in Pasco County
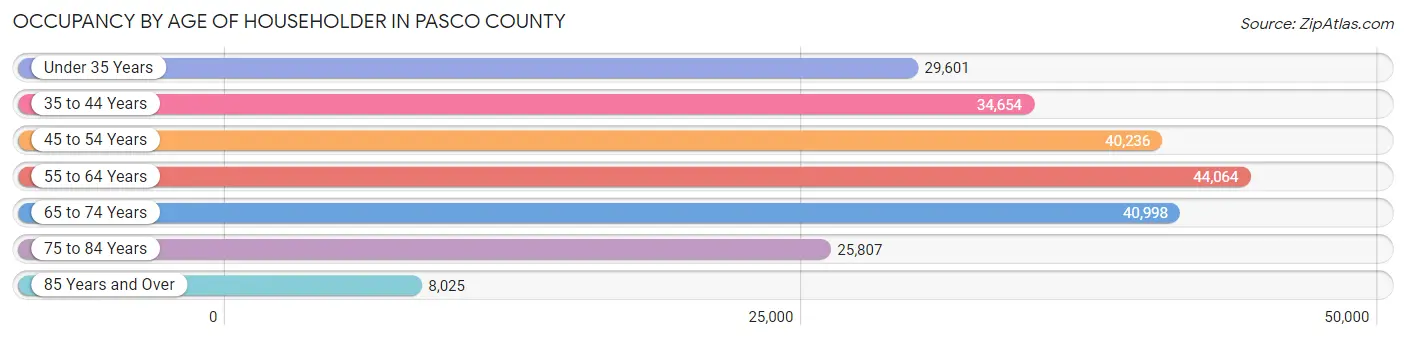
| Age Bracket | # Households | % Households |
| Under 35 Years | 29,601 | 13.3% |
| 35 to 44 Years | 34,654 | 15.5% |
| 45 to 54 Years | 40,236 | 18.0% |
| 55 to 64 Years | 44,064 | 19.7% |
| 65 to 74 Years | 40,998 | 18.3% |
| 75 to 84 Years | 25,807 | 11.6% |
| 85 Years and Over | 8,025 | 3.6% |
| Total | 223,385 | 100.0% |
Housing Finances in Pasco County
Median Income by Occupancy in Pasco County
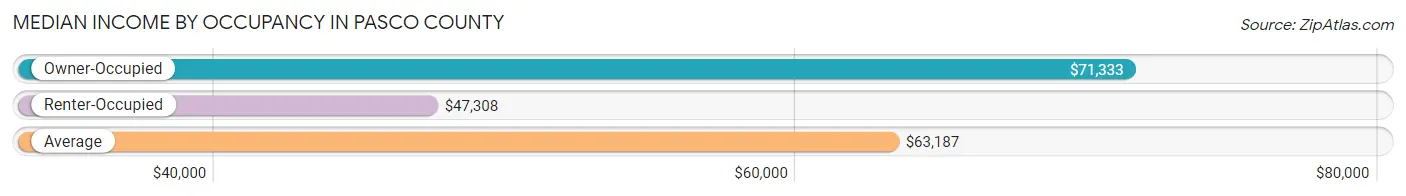
| Occupancy Type | # Households | Median Income |
| Owner-Occupied | 166,566 (74.6%) | $71,333 |
| Renter-Occupied | 56,819 (25.4%) | $47,308 |
| Average | 223,385 (100.0%) | $63,187 |
Occupancy by Householder Income Bracket in Pasco County
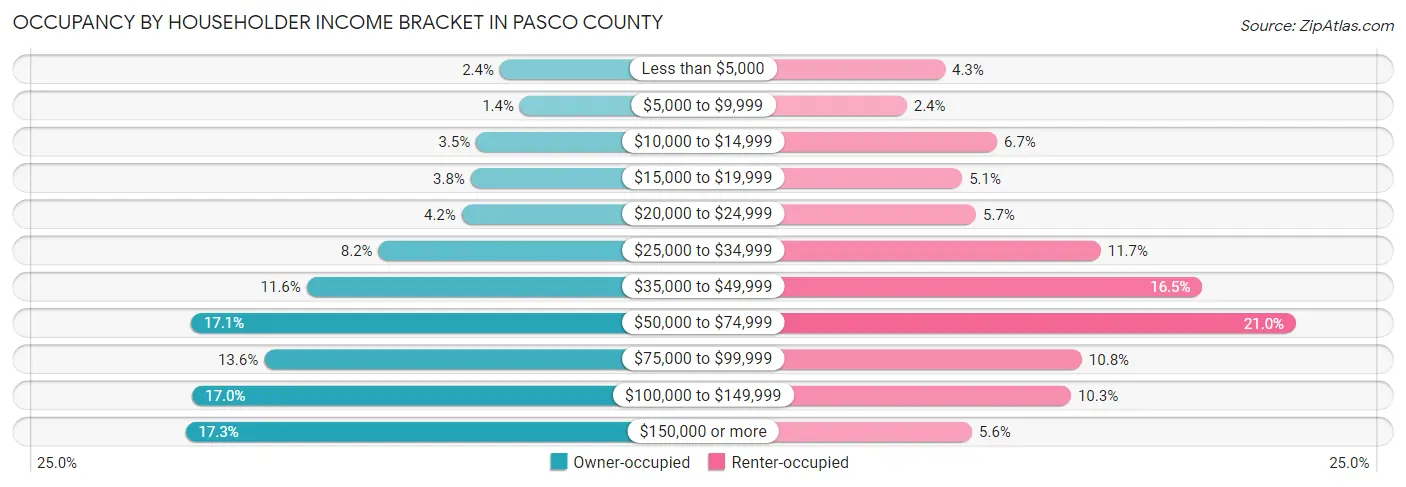
| Income Bracket | Owner-occupied | Renter-occupied |
| Less than $5,000 | 3,955 (2.4%) | 2,418 (4.3%) |
| $5,000 to $9,999 | 2,368 (1.4%) | 1,388 (2.4%) |
| $10,000 to $14,999 | 5,825 (3.5%) | 3,831 (6.7%) |
| $15,000 to $19,999 | 6,263 (3.8%) | 2,888 (5.1%) |
| $20,000 to $24,999 | 6,972 (4.2%) | 3,260 (5.7%) |
| $25,000 to $34,999 | 13,568 (8.2%) | 6,634 (11.7%) |
| $35,000 to $49,999 | 19,275 (11.6%) | 9,383 (16.5%) |
| $50,000 to $74,999 | 28,447 (17.1%) | 11,915 (21.0%) |
| $75,000 to $99,999 | 22,658 (13.6%) | 6,123 (10.8%) |
| $100,000 to $149,999 | 28,346 (17.0%) | 5,828 (10.3%) |
| $150,000 or more | 28,889 (17.3%) | 3,151 (5.6%) |
| Total | 166,566 (100.0%) | 56,819 (100.0%) |
Monthly Housing Cost Tiers in Pasco County
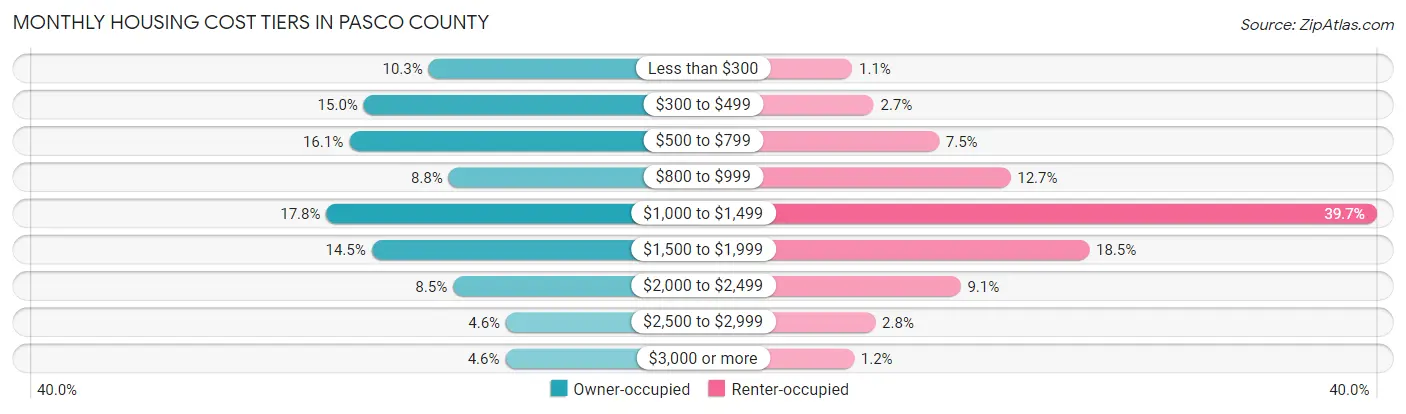
| Monthly Cost | Owner-occupied | Renter-occupied |
| Less than $300 | 17,080 (10.2%) | 613 (1.1%) |
| $300 to $499 | 25,028 (15.0%) | 1,513 (2.7%) |
| $500 to $799 | 26,833 (16.1%) | 4,242 (7.5%) |
| $800 to $999 | 14,630 (8.8%) | 7,235 (12.7%) |
| $1,000 to $1,499 | 29,618 (17.8%) | 22,557 (39.7%) |
| $1,500 to $1,999 | 24,067 (14.4%) | 10,527 (18.5%) |
| $2,000 to $2,499 | 14,067 (8.5%) | 5,148 (9.1%) |
| $2,500 to $2,999 | 7,580 (4.5%) | 1,582 (2.8%) |
| $3,000 or more | 7,663 (4.6%) | 685 (1.2%) |
| Total | 166,566 (100.0%) | 56,819 (100.0%) |
Physical Housing Characteristics in Pasco County
Housing Structures in Pasco County
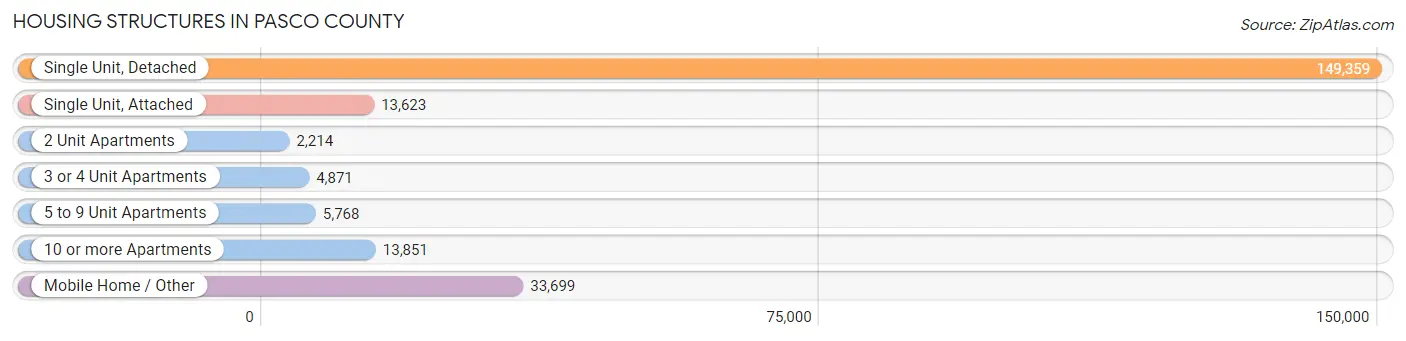
| Structure Type | # Housing Units | % Housing Units |
| Single Unit, Detached | 149,359 | 66.9% |
| Single Unit, Attached | 13,623 | 6.1% |
| 2 Unit Apartments | 2,214 | 1.0% |
| 3 or 4 Unit Apartments | 4,871 | 2.2% |
| 5 to 9 Unit Apartments | 5,768 | 2.6% |
| 10 or more Apartments | 13,851 | 6.2% |
| Mobile Home / Other | 33,699 | 15.1% |
| Total | 223,385 | 100.0% |
Housing Structures by Occupancy in Pasco County
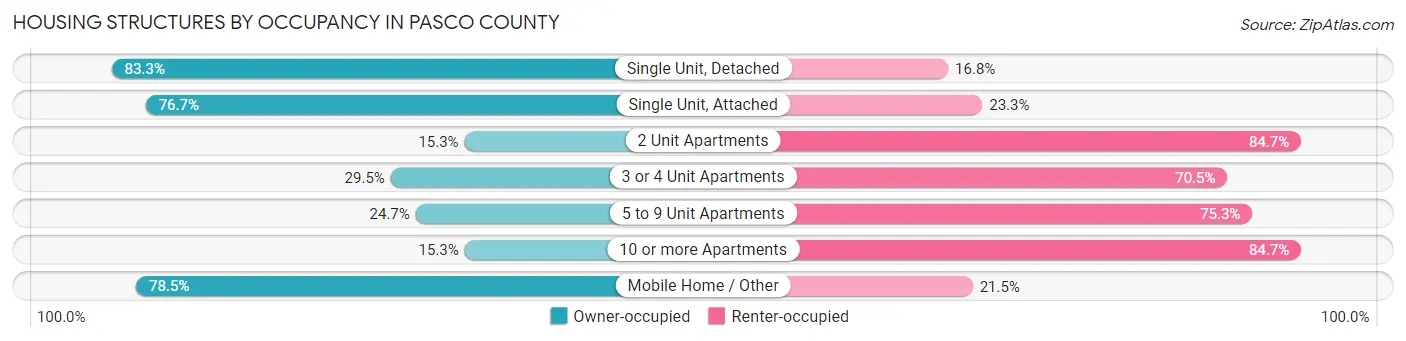
| Structure Type | Owner-occupied | Renter-occupied |
| Single Unit, Detached | 124,335 (83.3%) | 25,024 (16.8%) |
| Single Unit, Attached | 10,446 (76.7%) | 3,177 (23.3%) |
| 2 Unit Apartments | 339 (15.3%) | 1,875 (84.7%) |
| 3 or 4 Unit Apartments | 1,438 (29.5%) | 3,433 (70.5%) |
| 5 to 9 Unit Apartments | 1,426 (24.7%) | 4,342 (75.3%) |
| 10 or more Apartments | 2,118 (15.3%) | 11,733 (84.7%) |
| Mobile Home / Other | 26,464 (78.5%) | 7,235 (21.5%) |
| Total | 166,566 (74.6%) | 56,819 (25.4%) |
Housing Structures by Number of Rooms in Pasco County
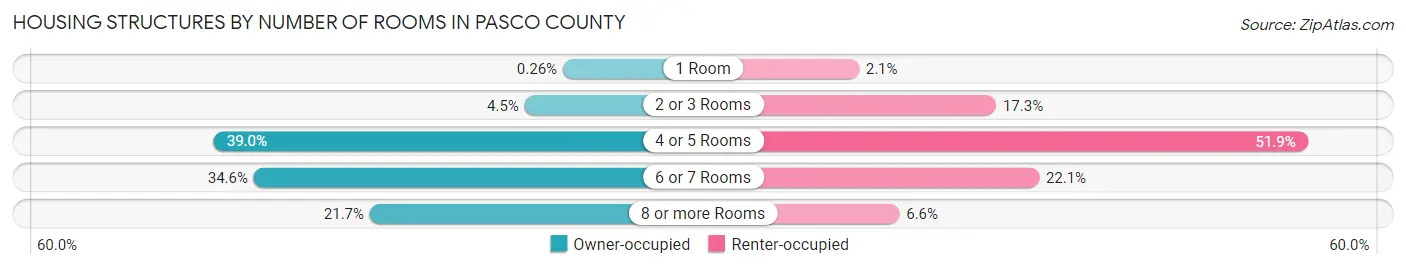
| Number of Rooms | Owner-occupied | Renter-occupied |
| 1 Room | 431 (0.3%) | 1,190 (2.1%) |
| 2 or 3 Rooms | 7,498 (4.5%) | 9,840 (17.3%) |
| 4 or 5 Rooms | 64,961 (39.0%) | 29,490 (51.9%) |
| 6 or 7 Rooms | 57,570 (34.6%) | 12,554 (22.1%) |
| 8 or more Rooms | 36,106 (21.7%) | 3,745 (6.6%) |
| Total | 166,566 (100.0%) | 56,819 (100.0%) |
Housing Structure by Heating Type in Pasco County
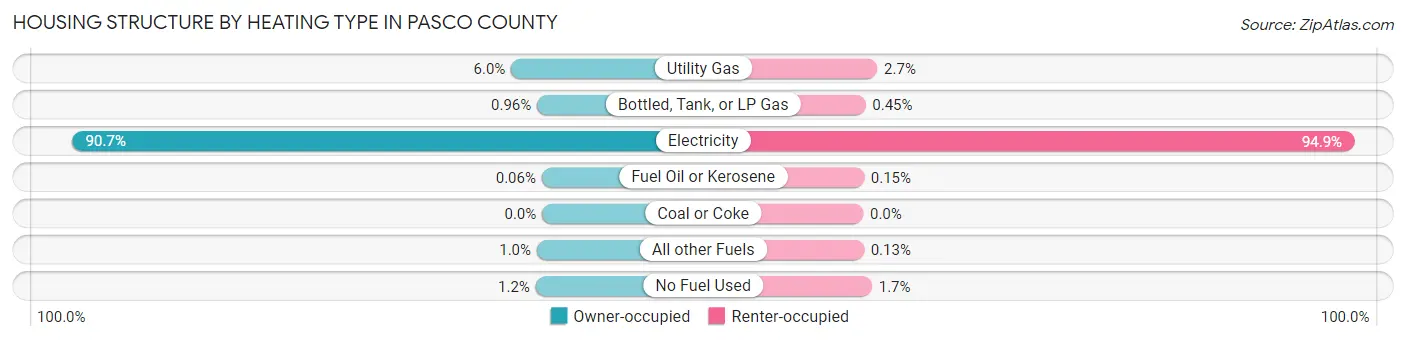
| Heating Type | Owner-occupied | Renter-occupied |
| Utility Gas | 9,961 (6.0%) | 1,549 (2.7%) |
| Bottled, Tank, or LP Gas | 1,606 (1.0%) | 258 (0.4%) |
| Electricity | 151,148 (90.7%) | 53,891 (94.9%) |
| Fuel Oil or Kerosene | 103 (0.1%) | 83 (0.2%) |
| Coal or Coke | 6 (0.0%) | 0 (0.0%) |
| All other Fuels | 1,674 (1.0%) | 76 (0.1%) |
| No Fuel Used | 2,068 (1.2%) | 962 (1.7%) |
| Total | 166,566 (100.0%) | 56,819 (100.0%) |
Household Vehicle Usage in Pasco County
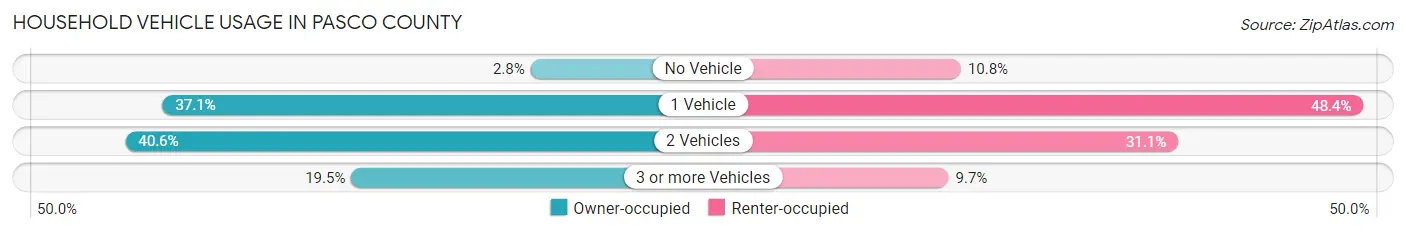
| Vehicles per Household | Owner-occupied | Renter-occupied |
| No Vehicle | 4,614 (2.8%) | 6,155 (10.8%) |
| 1 Vehicle | 61,842 (37.1%) | 27,497 (48.4%) |
| 2 Vehicles | 67,608 (40.6%) | 17,668 (31.1%) |
| 3 or more Vehicles | 32,502 (19.5%) | 5,499 (9.7%) |
| Total | 166,566 (100.0%) | 56,819 (100.0%) |
Real Estate & Mortgages in Pasco County
Real Estate and Mortgage Overview in Pasco County
| Characteristic | Without Mortgage | With Mortgage |
| Housing Units | 73,459 | 93,107 |
| Median Property Value | $164,400 | $279,500 |
| Median Household Income | $49,916 | $22,578 |
| Monthly Housing Costs | $463 | $7,490 |
| Real Estate Taxes | $1,263 | $2,527 |
Property Value by Mortgage Status in Pasco County
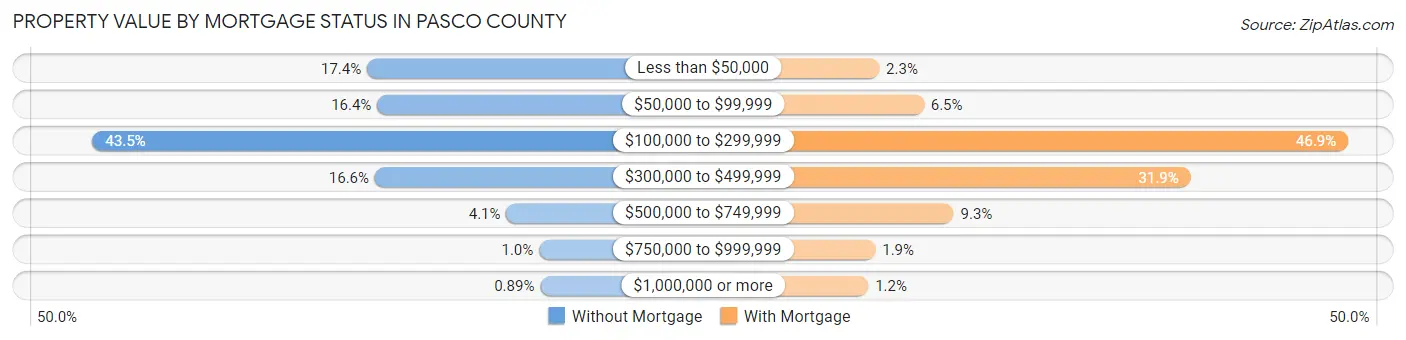
| Property Value | Without Mortgage | With Mortgage |
| Less than $50,000 | 12,777 (17.4%) | 2,098 (2.2%) |
| $50,000 to $99,999 | 12,063 (16.4%) | 6,054 (6.5%) |
| $100,000 to $299,999 | 31,985 (43.5%) | 43,672 (46.9%) |
| $300,000 to $499,999 | 12,224 (16.6%) | 29,710 (31.9%) |
| $500,000 to $749,999 | 3,024 (4.1%) | 8,696 (9.3%) |
| $750,000 to $999,999 | 733 (1.0%) | 1,750 (1.9%) |
| $1,000,000 or more | 653 (0.9%) | 1,127 (1.2%) |
| Total | 73,459 (100.0%) | 93,107 (100.0%) |
Household Income by Mortgage Status in Pasco County
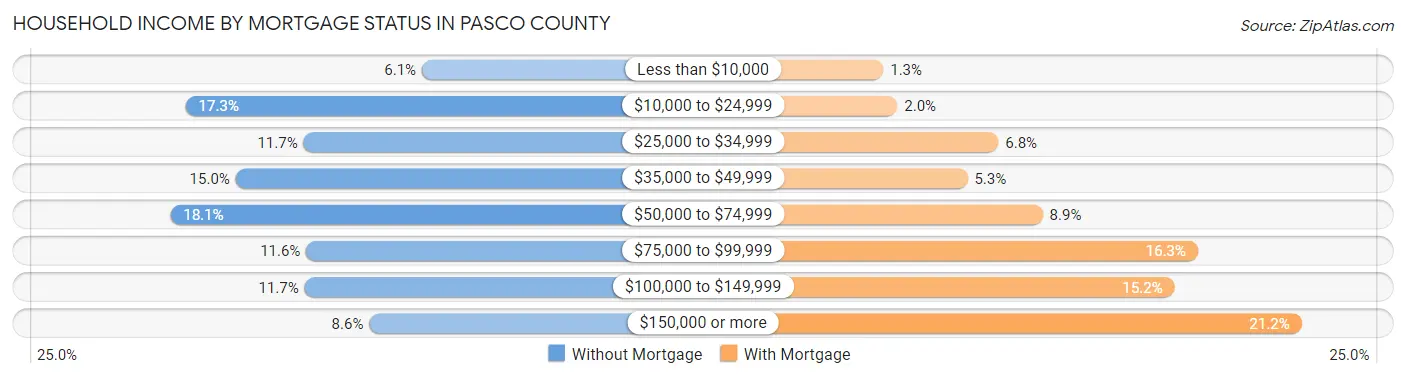
| Household Income | Without Mortgage | With Mortgage |
| Less than $10,000 | 4,469 (6.1%) | 1,228 (1.3%) |
| $10,000 to $24,999 | 12,733 (17.3%) | 1,854 (2.0%) |
| $25,000 to $34,999 | 8,606 (11.7%) | 6,327 (6.8%) |
| $35,000 to $49,999 | 10,983 (14.9%) | 4,962 (5.3%) |
| $50,000 to $74,999 | 13,267 (18.1%) | 8,292 (8.9%) |
| $75,000 to $99,999 | 8,516 (11.6%) | 15,180 (16.3%) |
| $100,000 to $149,999 | 8,574 (11.7%) | 14,142 (15.2%) |
| $150,000 or more | 6,311 (8.6%) | 19,772 (21.2%) |
| Total | 73,459 (100.0%) | 93,107 (100.0%) |
Property Value to Household Income Ratio in Pasco County
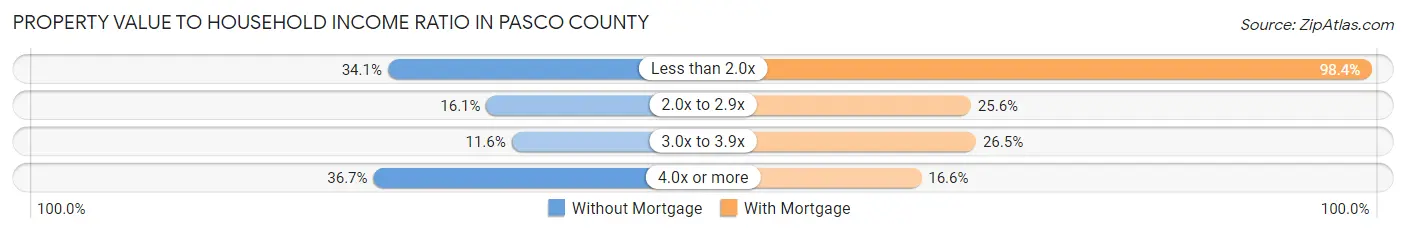
| Value-to-Income Ratio | Without Mortgage | With Mortgage |
| Less than 2.0x | 25,011 (34.1%) | 91,657 (98.4%) |
| 2.0x to 2.9x | 11,859 (16.1%) | 23,831 (25.6%) |
| 3.0x to 3.9x | 8,496 (11.6%) | 24,699 (26.5%) |
| 4.0x or more | 26,927 (36.7%) | 15,455 (16.6%) |
| Total | 73,459 (100.0%) | 93,107 (100.0%) |
Real Estate Taxes by Mortgage Status in Pasco County
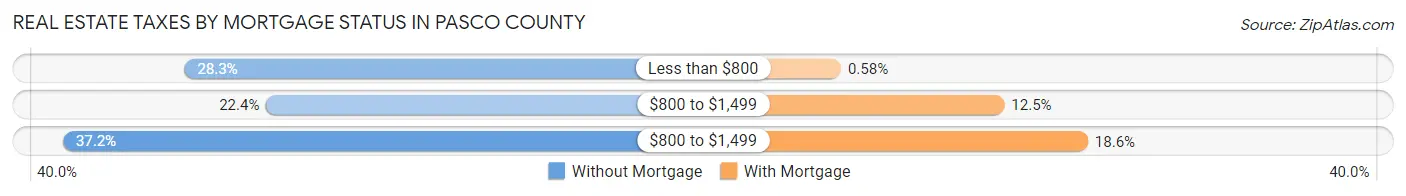
| Property Taxes | Without Mortgage | With Mortgage |
| Less than $800 | 20,803 (28.3%) | 536 (0.6%) |
| $800 to $1,499 | 16,471 (22.4%) | 11,656 (12.5%) |
| $800 to $1,499 | 27,326 (37.2%) | 17,334 (18.6%) |
| Total | 73,459 (100.0%) | 93,107 (100.0%) |
Health & Disability in Pasco County
Health Insurance Coverage by Age in Pasco County
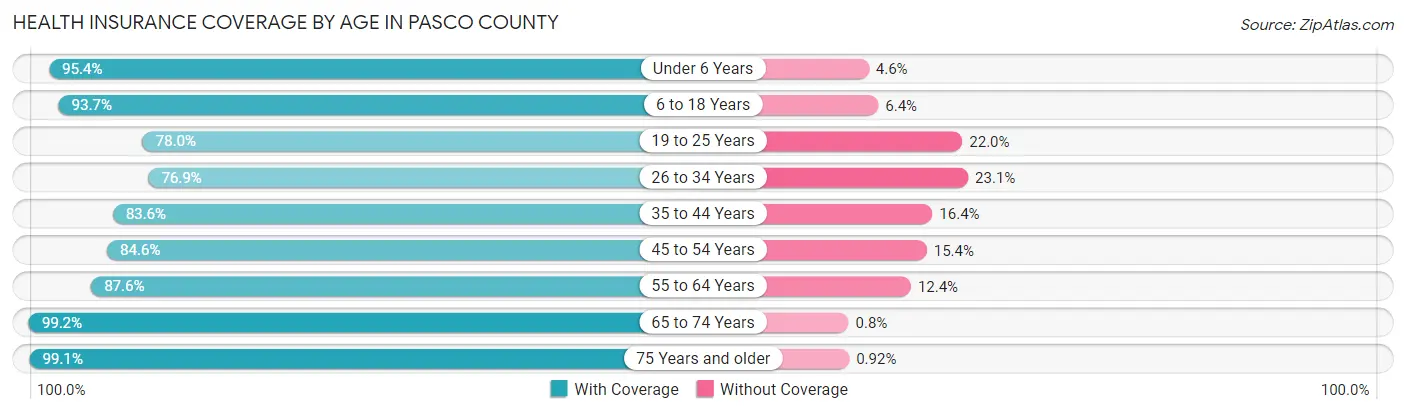
| Age Bracket | With Coverage | Without Coverage |
| Under 6 Years | 32,373 (95.4%) | 1,555 (4.6%) |
| 6 to 18 Years | 81,370 (93.6%) | 5,520 (6.4%) |
| 19 to 25 Years | 32,688 (78.0%) | 9,233 (22.0%) |
| 26 to 34 Years | 43,578 (76.9%) | 13,092 (23.1%) |
| 35 to 44 Years | 59,012 (83.6%) | 11,600 (16.4%) |
| 45 to 54 Years | 61,981 (84.6%) | 11,263 (15.4%) |
| 55 to 64 Years | 66,585 (87.6%) | 9,453 (12.4%) |
| 65 to 74 Years | 67,512 (99.2%) | 546 (0.8%) |
| 75 Years and older | 54,963 (99.1%) | 512 (0.9%) |
| Total | 500,062 (88.8%) | 62,774 (11.2%) |
Health Insurance Coverage by Citizenship Status in Pasco County
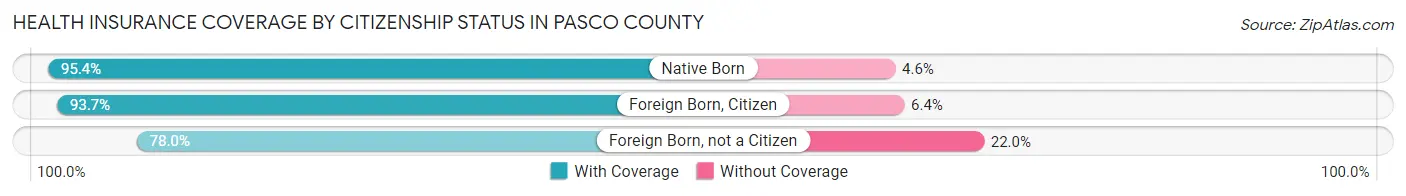
| Citizenship Status | With Coverage | Without Coverage |
| Native Born | 32,373 (95.4%) | 1,555 (4.6%) |
| Foreign Born, Citizen | 81,370 (93.6%) | 5,520 (6.4%) |
| Foreign Born, not a Citizen | 32,688 (78.0%) | 9,233 (22.0%) |
Health Insurance Coverage by Household Income in Pasco County
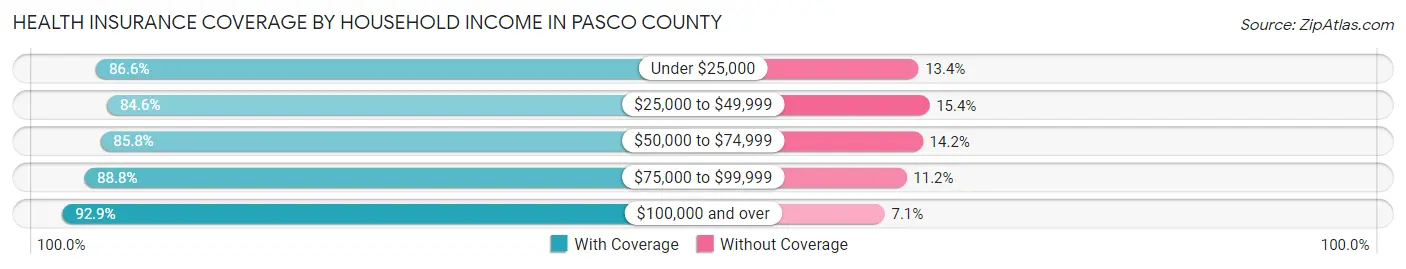
| Household Income | With Coverage | Without Coverage |
| Under $25,000 | 56,985 (86.6%) | 8,804 (13.4%) |
| $25,000 to $49,999 | 84,358 (84.6%) | 15,402 (15.4%) |
| $50,000 to $74,999 | 84,353 (85.8%) | 13,974 (14.2%) |
| $75,000 to $99,999 | 72,183 (88.8%) | 9,072 (11.2%) |
| $100,000 and over | 199,889 (92.9%) | 15,204 (7.1%) |
Public vs Private Health Insurance Coverage by Age in Pasco County
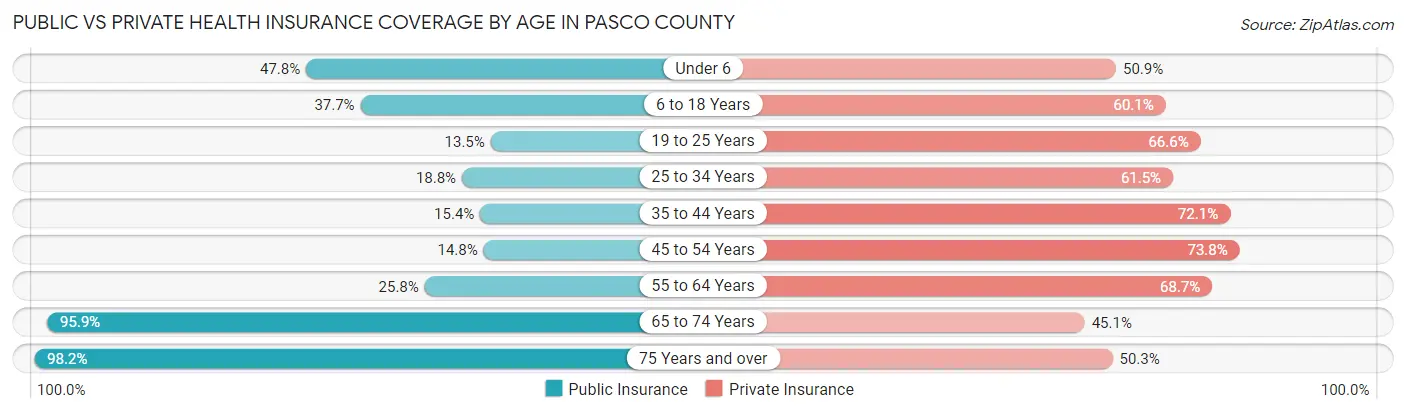
| Age Bracket | Public Insurance | Private Insurance |
| Under 6 | 16,205 (47.8%) | 17,272 (50.9%) |
| 6 to 18 Years | 32,727 (37.7%) | 52,205 (60.1%) |
| 19 to 25 Years | 5,659 (13.5%) | 27,907 (66.6%) |
| 25 to 34 Years | 10,668 (18.8%) | 34,832 (61.5%) |
| 35 to 44 Years | 10,899 (15.4%) | 50,875 (72.1%) |
| 45 to 54 Years | 10,851 (14.8%) | 54,072 (73.8%) |
| 55 to 64 Years | 19,578 (25.8%) | 52,265 (68.7%) |
| 65 to 74 Years | 65,235 (95.9%) | 30,687 (45.1%) |
| 75 Years and over | 54,491 (98.2%) | 27,880 (50.3%) |
| Total | 226,313 (40.2%) | 347,995 (61.8%) |
Disability Status by Sex by Age in Pasco County
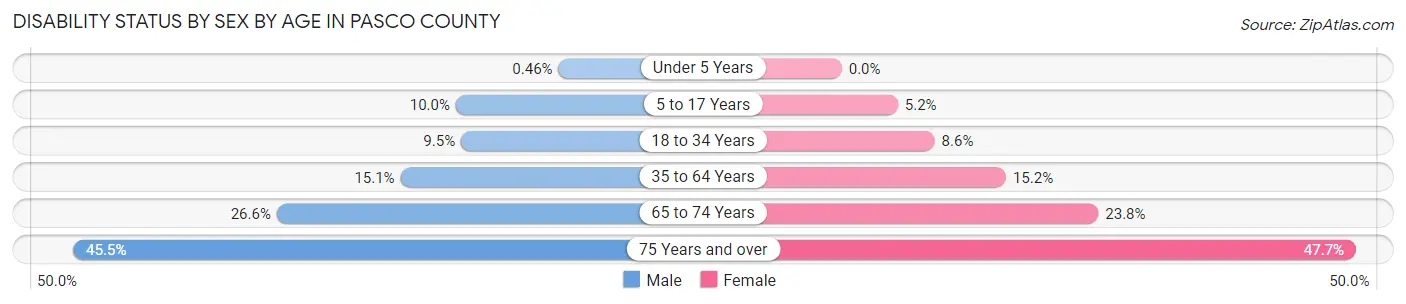
| Age Bracket | Male | Female |
| Under 5 Years | 66 (0.5%) | 0 (0.0%) |
| 5 to 17 Years | 4,432 (10.0%) | 2,203 (5.2%) |
| 18 to 34 Years | 4,946 (9.5%) | 4,532 (8.6%) |
| 35 to 64 Years | 16,283 (15.1%) | 17,099 (15.2%) |
| 65 to 74 Years | 8,352 (26.6%) | 8,729 (23.8%) |
| 75 Years and over | 11,398 (45.5%) | 14,518 (47.7%) |
Disability Class by Sex by Age in Pasco County
Disability Class: Hearing Difficulty
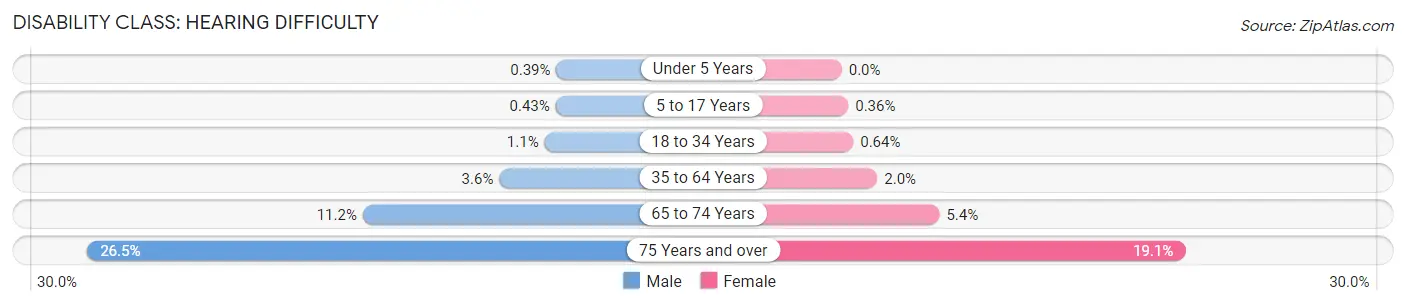
| Age Bracket | Male | Female |
| Under 5 Years | 55 (0.4%) | 0 (0.0%) |
| 5 to 17 Years | 191 (0.4%) | 152 (0.4%) |
| 18 to 34 Years | 545 (1.1%) | 337 (0.6%) |
| 35 to 64 Years | 3,847 (3.6%) | 2,220 (2.0%) |
| 65 to 74 Years | 3,508 (11.2%) | 1,995 (5.4%) |
| 75 Years and over | 6,639 (26.5%) | 5,819 (19.1%) |
Disability Class: Vision Difficulty
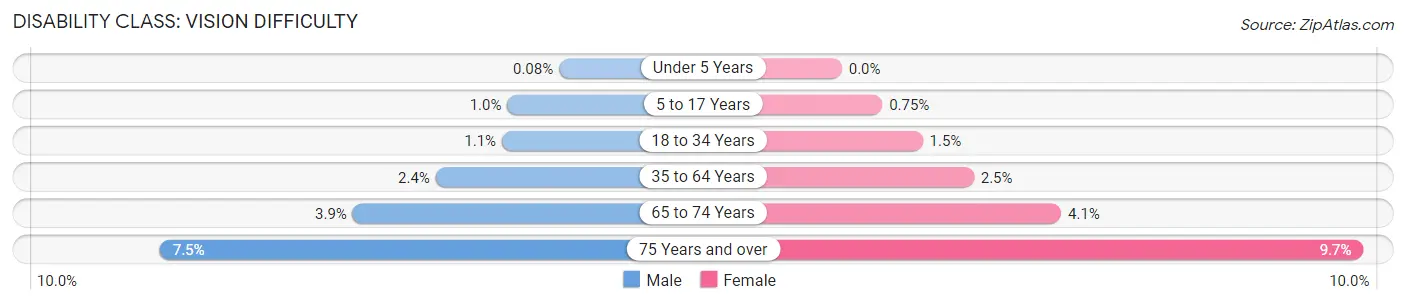
| Age Bracket | Male | Female |
| Under 5 Years | 11 (0.1%) | 0 (0.0%) |
| 5 to 17 Years | 460 (1.0%) | 318 (0.7%) |
| 18 to 34 Years | 592 (1.1%) | 791 (1.5%) |
| 35 to 64 Years | 2,556 (2.4%) | 2,747 (2.5%) |
| 65 to 74 Years | 1,228 (3.9%) | 1,491 (4.1%) |
| 75 Years and over | 1,875 (7.5%) | 2,946 (9.7%) |
Disability Class: Cognitive Difficulty
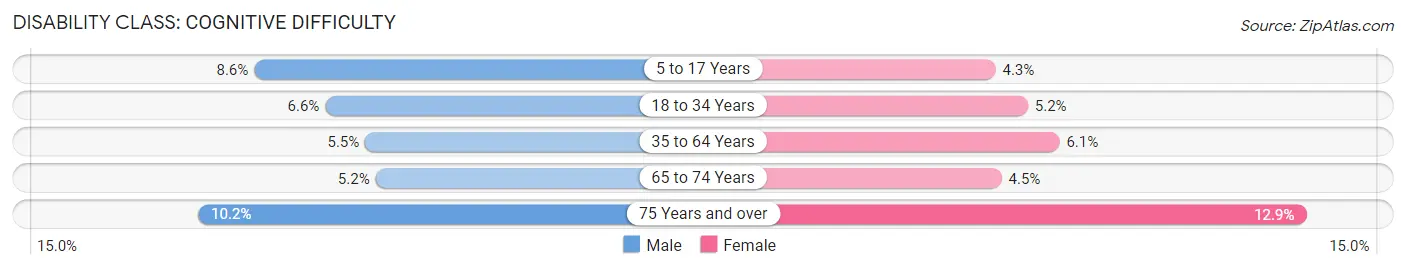
| Age Bracket | Male | Female |
| 5 to 17 Years | 3,821 (8.6%) | 1,813 (4.3%) |
| 18 to 34 Years | 3,448 (6.6%) | 2,725 (5.2%) |
| 35 to 64 Years | 5,945 (5.5%) | 6,802 (6.1%) |
| 65 to 74 Years | 1,643 (5.2%) | 1,633 (4.4%) |
| 75 Years and over | 2,548 (10.2%) | 3,933 (12.9%) |
Disability Class: Ambulatory Difficulty
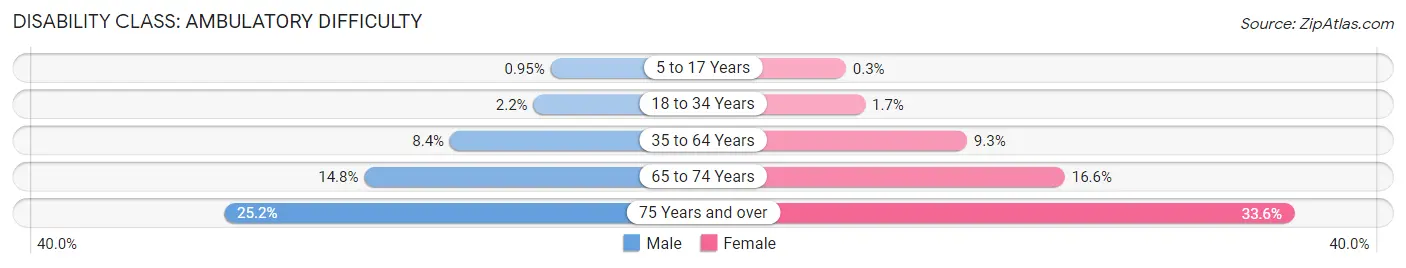
| Age Bracket | Male | Female |
| 5 to 17 Years | 422 (0.9%) | 127 (0.3%) |
| 18 to 34 Years | 1,156 (2.2%) | 908 (1.7%) |
| 35 to 64 Years | 9,067 (8.4%) | 10,419 (9.3%) |
| 65 to 74 Years | 4,642 (14.8%) | 6,070 (16.6%) |
| 75 Years and over | 6,308 (25.2%) | 10,210 (33.6%) |
Disability Class: Self-Care Difficulty
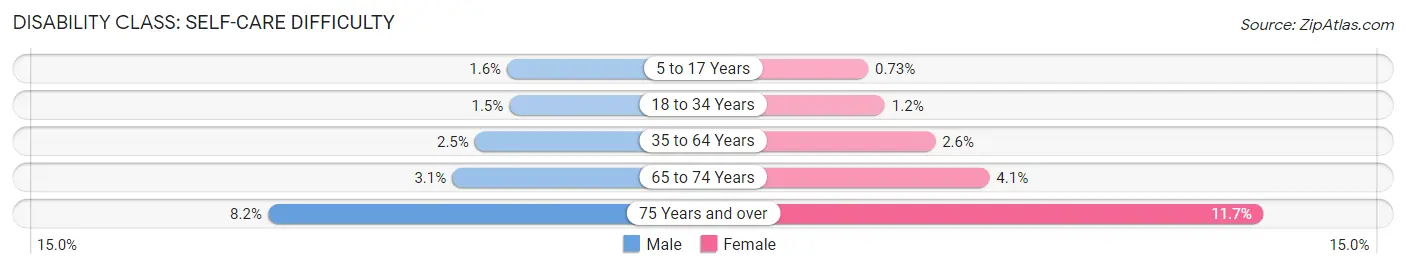
| Age Bracket | Male | Female |
| 5 to 17 Years | 698 (1.6%) | 310 (0.7%) |
| 18 to 34 Years | 784 (1.5%) | 633 (1.2%) |
| 35 to 64 Years | 2,656 (2.5%) | 2,917 (2.6%) |
| 65 to 74 Years | 974 (3.1%) | 1,507 (4.1%) |
| 75 Years and over | 2,061 (8.2%) | 3,572 (11.7%) |
Technology Access in Pasco County
Computing Device Access in Pasco County
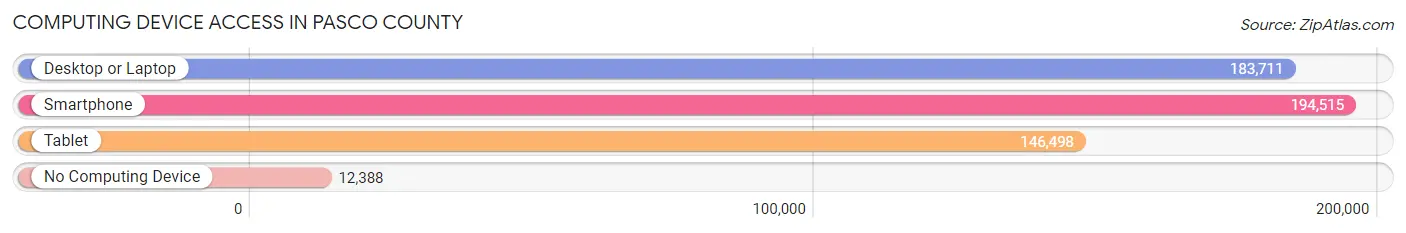
| Device Type | # Households | % Households |
| Desktop or Laptop | 183,711 | 82.2% |
| Smartphone | 194,515 | 87.1% |
| Tablet | 146,498 | 65.6% |
| No Computing Device | 12,388 | 5.6% |
| Total | 223,385 | 100.0% |
Internet Access in Pasco County
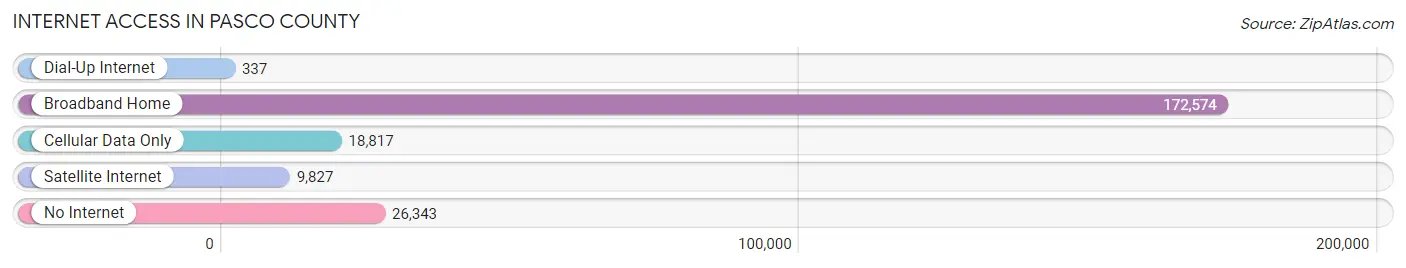
| Internet Type | # Households | % Households |
| Dial-Up Internet | 337 | 0.2% |
| Broadband Home | 172,574 | 77.2% |
| Cellular Data Only | 18,817 | 8.4% |
| Satellite Internet | 9,827 | 4.4% |
| No Internet | 26,343 | 11.8% |
| Total | 223,385 | 100.0% |
Pasco County Summary
Pasco County, Florida is located in the west-central part of the state, and is part of the Tampa Bay metropolitan area. It is bordered by Hernando County to the north, Hillsborough County to the east, Polk County to the south, and the Gulf of Mexico to the west. Pasco County is the third most populous county in the state, with an estimated population of 517,837 in 2019.
History
Pasco County was created in 1887 from parts of Hernando and Hillsborough Counties. It was named for Samuel Pasco, a Confederate soldier and Florida senator. The county seat is Dade City, which was founded in 1885.
The area was originally inhabited by the Tocobaga people, who were part of the larger Timucua tribe. The first European settlers arrived in the area in the late 1700s, and the county was officially established in 1887.
Geography
Pasco County covers an area of 868 square miles, making it the 11th largest county in Florida. It is located in the west-central part of the state, and is part of the Tampa Bay metropolitan area. It is bordered by Hernando County to the north, Hillsborough County to the east, Polk County to the south, and the Gulf of Mexico to the west.
The county is mostly flat, with some rolling hills in the northern part. The highest point in the county is the summit of Trilby Hill, which is located in the northeast corner of the county and has an elevation of 140 feet. The county is home to several rivers, including the Anclote River, the Pithlachascotee River, and the Hillsborough River.
Economy
Pasco County has a diverse economy, with a mix of agriculture, manufacturing, and services. The county is home to several large employers, including the Pasco County School Board, the Pasco County Sheriff’s Office, and the Pasco County Government.
Agriculture is an important part of the county’s economy, with crops such as citrus, strawberries, and tomatoes being grown in the area. The county is also home to several manufacturing companies, including the Anclote Power Plant, which produces electricity for the region.
The county is also home to several tourist attractions, including the Pasco County Fairgrounds, the Dade City Wild Things Zoo, and the Pasco County Historical Museum.
Demographics
As of 2019, Pasco County had an estimated population of 517,837. The population is racially and ethnically diverse, with the largest racial group being White (63.3%), followed by Hispanic or Latino (20.2%), Black or African American (11.2%), and Asian (3.2%).
The median household income in the county is $54,845, and the median home value is $179,400. The poverty rate is 11.3%, and the unemployment rate is 4.2%.
Conclusion
Pasco County, Florida is located in the west-central part of the state, and is part of the Tampa Bay metropolitan area. It is bordered by Hernando County to the north, Hillsborough County to the east, Polk County to the south, and the Gulf of Mexico to the west. Pasco County has a diverse economy, with a mix of agriculture, manufacturing, and services. The county is racially and ethnically diverse, with the largest racial group being White (63.3%), followed by Hispanic or Latino (20.2%), Black or African American (11.2%), and Asian (3.2%). The median household income in the county is $54,845, and the median home value is $179,400. The poverty rate is 11.3%, and the unemployment rate is 4.2%.
Common Questions
What is Per Capita Income in Pasco County?
Per Capita income in Pasco County is $35,201.
What is the Median Family Income in Pasco County?
Median Family Income in Pasco County is $80,612.
What is the Median Household income in Pasco County?
Median Household Income in Pasco County is $63,187.
What is Income or Wage Gap in Pasco County?
Income or Wage Gap in Pasco County is 24.9%.
Women in Pasco County earn 75.1 cents for every dollar earned by a man.
What is Family Income Deficit in Pasco County?
Family Income Deficit in Pasco County is $10,761.
Families that are below poverty line in Pasco County earn $10,761 less on average than the poverty threshold level.
What is Inequality or Gini Index in Pasco County?
Inequality or Gini Index in Pasco County is 0.46.
What is the Total Population of Pasco County?
Total Population of Pasco County is 569,211.
What is the Total Male Population of Pasco County?
Total Male Population of Pasco County is 278,905.
What is the Total Female Population of Pasco County?
Total Female Population of Pasco County is 290,306.
What is the Ratio of Males per 100 Females in Pasco County?
There are 96.07 Males per 100 Females in Pasco County.
What is the Ratio of Females per 100 Males in Pasco County?
There are 104.09 Females per 100 Males in Pasco County.
What is the Median Population Age in Pasco County?
Median Population Age in Pasco County is 43.9 Years.
What is the Average Family Size in Pasco County
Average Family Size in Pasco County is 3.1 People.
What is the Average Household Size in Pasco County
Average Household Size in Pasco County is 2.5 People.
How Large is the Labor Force in Pasco County?
There are 261,209 People in the Labor Forcein in Pasco County.
What is the Percentage of People in the Labor Force in Pasco County?
55.8% of People are in the Labor Force in Pasco County.
What is the Unemployment Rate in Pasco County?
Unemployment Rate in Pasco County is 5.3%.