Sarasota County, FL Map & Demographics
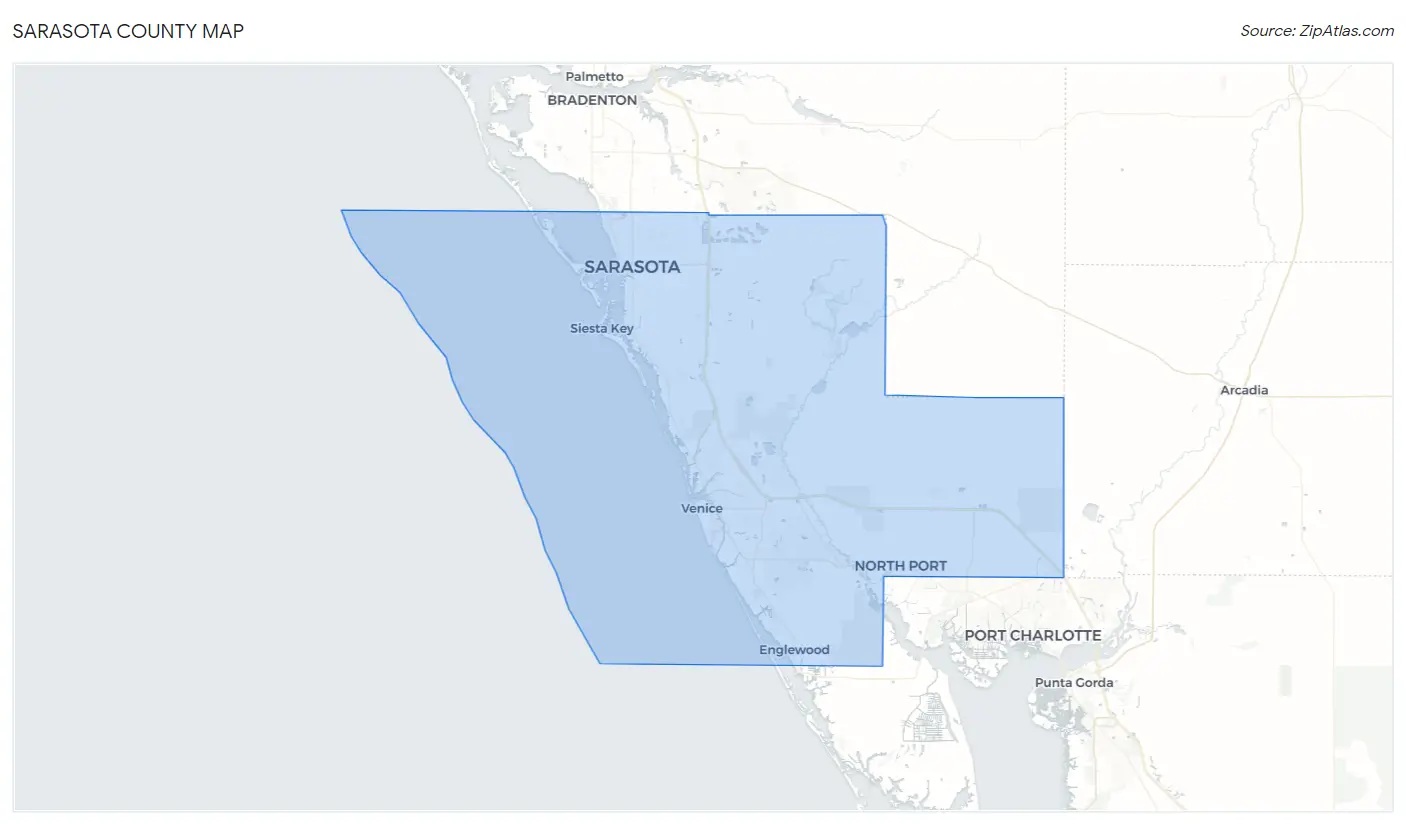
Sarasota County Map
Sarasota County Overview
$53,149
PER CAPITA INCOME
$94,139
AVG FAMILY INCOME
$77,213
AVG HOUSEHOLD INCOME
27.1%
WAGE / INCOME GAP [ % ]
72.9¢/ $1
WAGE / INCOME GAP [ $ ]
$10,661
FAMILY INCOME DEFICIT
0.50
INEQUALITY / GINI INDEX
439,392
TOTAL POPULATION
210,554
MALE POPULATION
228,838
FEMALE POPULATION
92.01
MALES / 100 FEMALES
108.68
FEMALES / 100 MALES
57.1
MEDIAN AGE
2.7
AVG FAMILY SIZE
2.2
AVG HOUSEHOLD SIZE
189,225
LABOR FORCE [ PEOPLE ]
49.0%
PERCENT IN LABOR FORCE
3.4%
UNEMPLOYMENT RATE
Sarasota County Area Codes
Income in Sarasota County
Income Overview in Sarasota County
Per Capita Income in Sarasota County is $53,149, while median incomes of families and households are $94,139 and $77,213 respectively.
| Characteristic | Number | Measure |
| Per Capita Income | 439,392 | $53,149 |
| Median Family Income | 124,636 | $94,139 |
| Mean Family Income | 124,636 | $135,248 |
| Median Household Income | 199,345 | $77,213 |
| Mean Household Income | 199,345 | $115,389 |
| Income Deficit | 124,636 | $10,661 |
| Wage / Income Gap (%) | 439,392 | 27.12% |
| Wage / Income Gap ($) | 439,392 | 72.88¢ per $1 |
| Gini / Inequality Index | 439,392 | 0.50 |
Earnings by Sex in Sarasota County
Average Earnings in Sarasota County are $39,956, $46,306 for men and $33,749 for women, a difference of 27.1%.
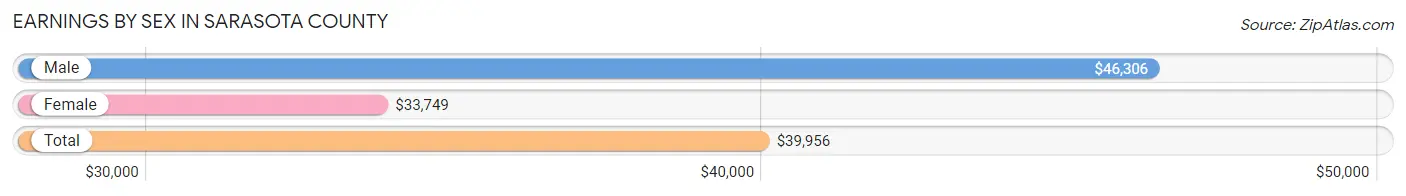
| Sex | Number | Average Earnings |
| Male | 104,446 (51.9%) | $46,306 |
| Female | 96,702 (48.1%) | $33,749 |
| Total | 201,148 (100.0%) | $39,956 |
Earnings by Sex by Income Bracket in Sarasota County
The most common earnings brackets in Sarasota County are $100,000+ for men (19,239 | 18.4%) and $100,000+ for women (7,885 | 8.2%).
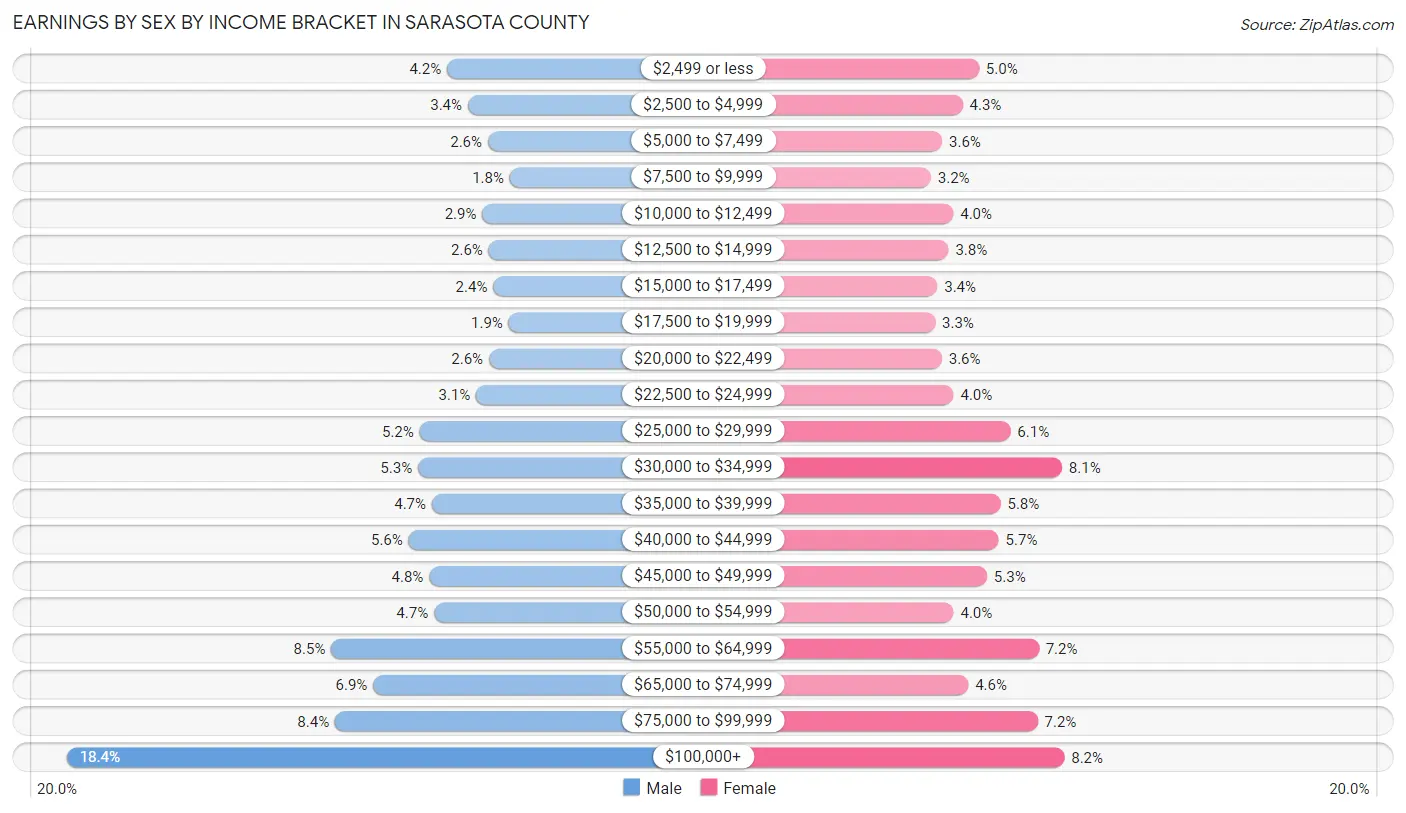
| Income | Male | Female |
| $2,499 or less | 4,355 (4.2%) | 4,789 (5.0%) |
| $2,500 to $4,999 | 3,536 (3.4%) | 4,195 (4.3%) |
| $5,000 to $7,499 | 2,753 (2.6%) | 3,455 (3.6%) |
| $7,500 to $9,999 | 1,906 (1.8%) | 3,044 (3.2%) |
| $10,000 to $12,499 | 2,976 (2.9%) | 3,856 (4.0%) |
| $12,500 to $14,999 | 2,721 (2.6%) | 3,687 (3.8%) |
| $15,000 to $17,499 | 2,549 (2.4%) | 3,278 (3.4%) |
| $17,500 to $19,999 | 1,946 (1.9%) | 3,203 (3.3%) |
| $20,000 to $22,499 | 2,716 (2.6%) | 3,439 (3.6%) |
| $22,500 to $24,999 | 3,217 (3.1%) | 3,867 (4.0%) |
| $25,000 to $29,999 | 5,430 (5.2%) | 5,926 (6.1%) |
| $30,000 to $34,999 | 5,497 (5.3%) | 7,792 (8.1%) |
| $35,000 to $39,999 | 4,953 (4.7%) | 5,566 (5.8%) |
| $40,000 to $44,999 | 5,859 (5.6%) | 5,499 (5.7%) |
| $45,000 to $49,999 | 5,053 (4.8%) | 5,080 (5.2%) |
| $50,000 to $54,999 | 4,864 (4.7%) | 3,870 (4.0%) |
| $55,000 to $64,999 | 8,887 (8.5%) | 6,952 (7.2%) |
| $65,000 to $74,999 | 7,251 (6.9%) | 4,402 (4.5%) |
| $75,000 to $99,999 | 8,738 (8.4%) | 6,917 (7.1%) |
| $100,000+ | 19,239 (18.4%) | 7,885 (8.2%) |
| Total | 104,446 (100.0%) | 96,702 (100.0%) |
Earnings by Sex by Educational Attainment in Sarasota County
Average earnings in Sarasota County are $51,995 for men and $37,025 for women, a difference of 28.8%. Men with an educational attainment of graduate degree enjoy the highest average annual earnings of $81,185, while those with less than high school education earn the least with $34,963. Women with an educational attainment of graduate degree earn the most with the average annual earnings of $58,730, while those with less than high school education have the smallest earnings of $22,664.
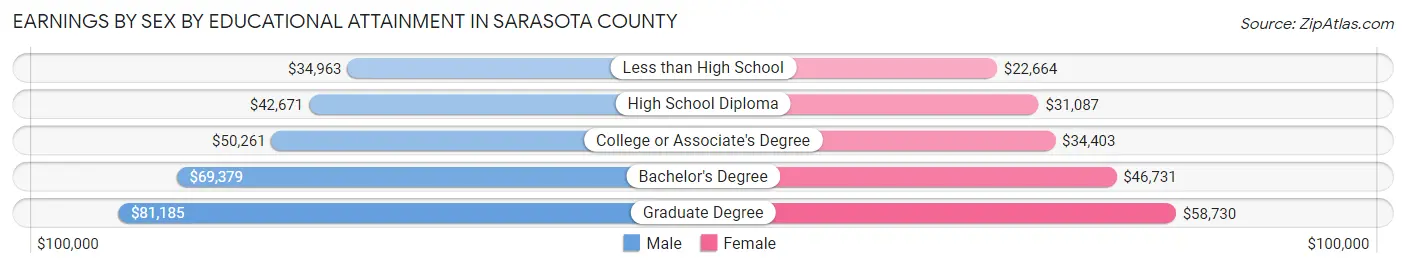
| Educational Attainment | Male Income | Female Income |
| Less than High School | $34,963 | $22,664 |
| High School Diploma | $42,671 | $31,087 |
| College or Associate's Degree | $50,261 | $34,403 |
| Bachelor's Degree | $69,379 | $46,731 |
| Graduate Degree | $81,185 | $58,730 |
| Total | $51,995 | $37,025 |
Family Income in Sarasota County
Family Income Brackets in Sarasota County
According to the Sarasota County family income data, there are 27,046 families falling into the $100,000 to $149,999 income range, which is the most common income bracket and makes up 21.7% of all families. Conversely, the $10,000 to $14,999 income bracket is the least frequent group with only 1,496 families (1.2%) belonging to this category.
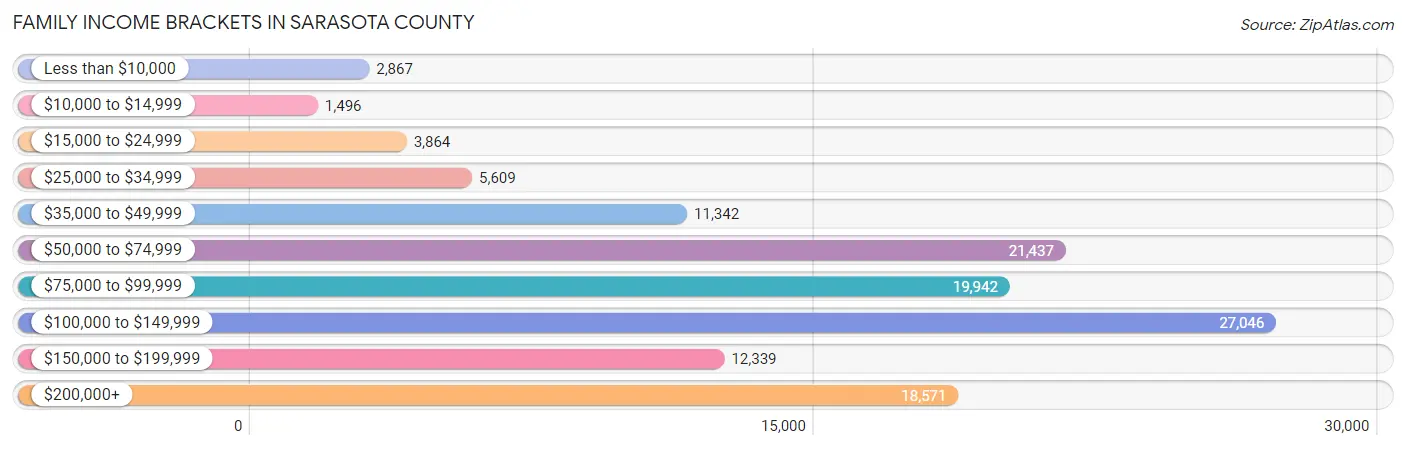
| Income Bracket | # Families | % Families |
| Less than $10,000 | 2,867 | 2.3% |
| $10,000 to $14,999 | 1,496 | 1.2% |
| $15,000 to $24,999 | 3,864 | 3.1% |
| $25,000 to $34,999 | 5,609 | 4.5% |
| $35,000 to $49,999 | 11,342 | 9.1% |
| $50,000 to $74,999 | 21,437 | 17.2% |
| $75,000 to $99,999 | 19,942 | 16.0% |
| $100,000 to $149,999 | 27,046 | 21.7% |
| $150,000 to $199,999 | 12,339 | 9.9% |
| $200,000+ | 18,571 | 14.9% |
Family Income by Famaliy Size in Sarasota County
7+ person families (741 | 0.6%) account for the highest median family income in Sarasota County with $140,848 per family, while 2-person families (84,158 | 67.5%) have the highest median income of $45,144 per family member.
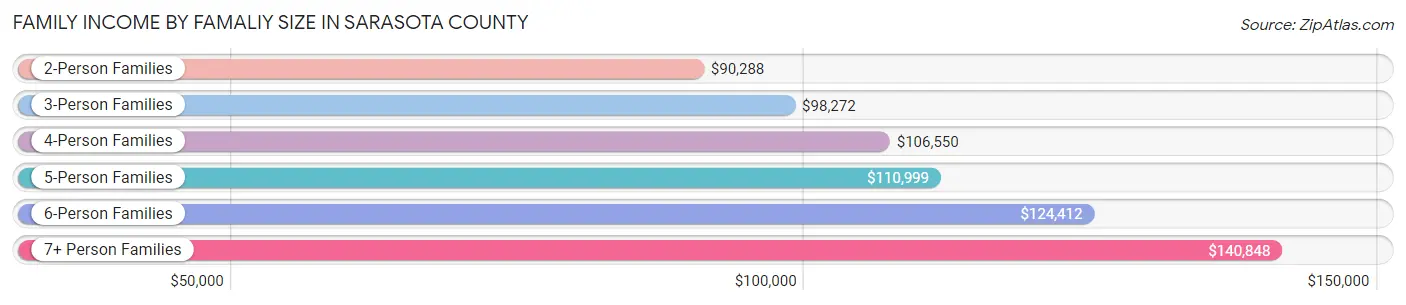
| Income Bracket | # Families | Median Income |
| 2-Person Families | 84,158 (67.5%) | $90,288 |
| 3-Person Families | 20,465 (16.4%) | $98,272 |
| 4-Person Families | 12,951 (10.4%) | $106,550 |
| 5-Person Families | 4,973 (4.0%) | $110,999 |
| 6-Person Families | 1,348 (1.1%) | $124,412 |
| 7+ Person Families | 741 (0.6%) | $140,848 |
| Total | 124,636 (100.0%) | $94,139 |
Family Income by Number of Earners in Sarasota County
The median family income in Sarasota County is $94,139, with families comprising 3+ earners (10,268) having the highest median family income of $130,960, while families with no earners (41,075) have the lowest median family income of $77,947, accounting for 8.2% and 33.0% of families, respectively.
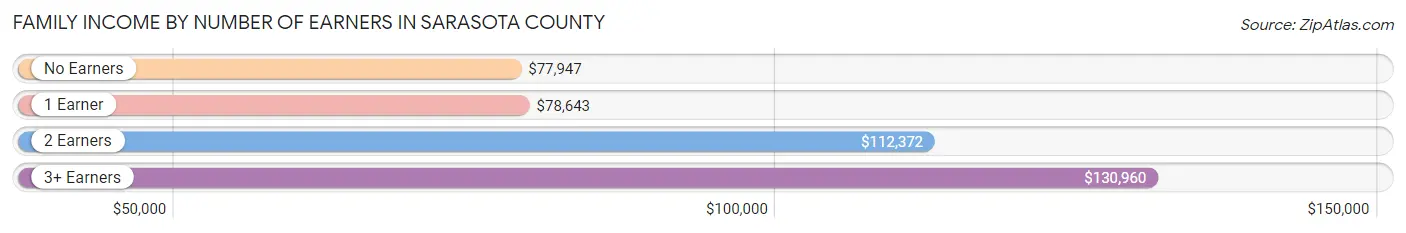
| Number of Earners | # Families | Median Income |
| No Earners | 41,075 (33.0%) | $77,947 |
| 1 Earner | 34,505 (27.7%) | $78,643 |
| 2 Earners | 38,788 (31.1%) | $112,372 |
| 3+ Earners | 10,268 (8.2%) | $130,960 |
| Total | 124,636 (100.0%) | $94,139 |
Household Income in Sarasota County
Household Income Brackets in Sarasota County
With 36,281 households falling in the category, the $100,000 to $149,999 income range is the most frequent in Sarasota County, accounting for 18.2% of all households. In contrast, only 5,183 households (2.6%) fall into the $10,000 to $14,999 income bracket, making it the least populous group.
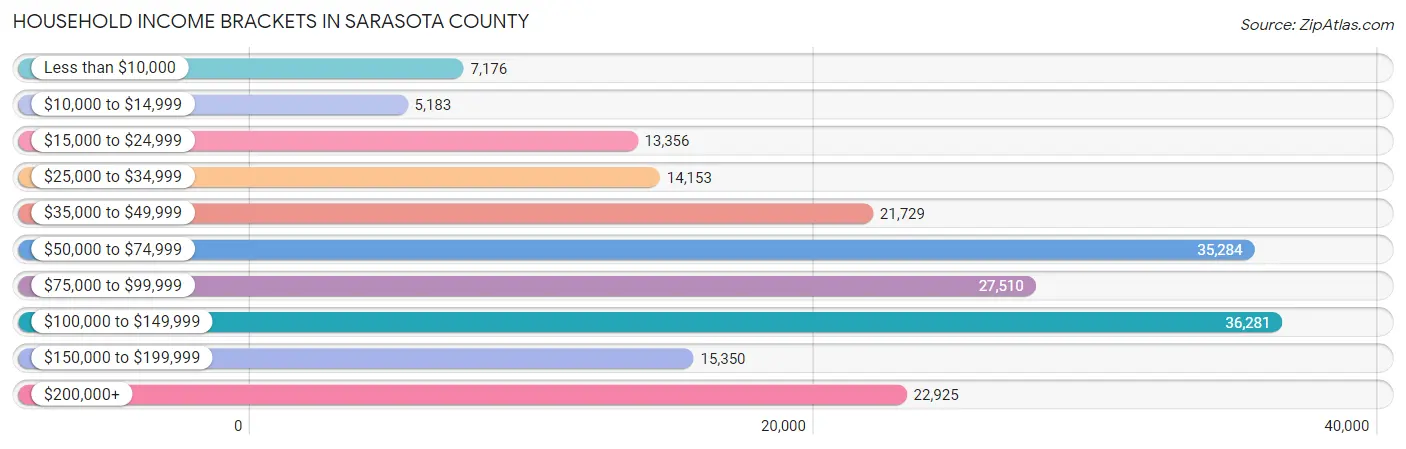
| Income Bracket | # Households | % Households |
| Less than $10,000 | 7,176 | 3.6% |
| $10,000 to $14,999 | 5,183 | 2.6% |
| $15,000 to $24,999 | 13,356 | 6.7% |
| $25,000 to $34,999 | 14,153 | 7.1% |
| $35,000 to $49,999 | 21,729 | 10.9% |
| $50,000 to $74,999 | 35,284 | 17.7% |
| $75,000 to $99,999 | 27,510 | 13.8% |
| $100,000 to $149,999 | 36,281 | 18.2% |
| $150,000 to $199,999 | 15,350 | 7.7% |
| $200,000+ | 22,925 | 11.5% |
Household Income by Householder Age in Sarasota County
The median household income in Sarasota County is $77,213, with the highest median household income of $88,758 found in the 45 to 64 years age bracket for the primary householder. A total of 63,347 households (31.8%) fall into this category. Meanwhile, the 15 to 24 years age bracket for the primary householder has the lowest median household income of $57,158, with 2,657 households (1.3%) in this group.
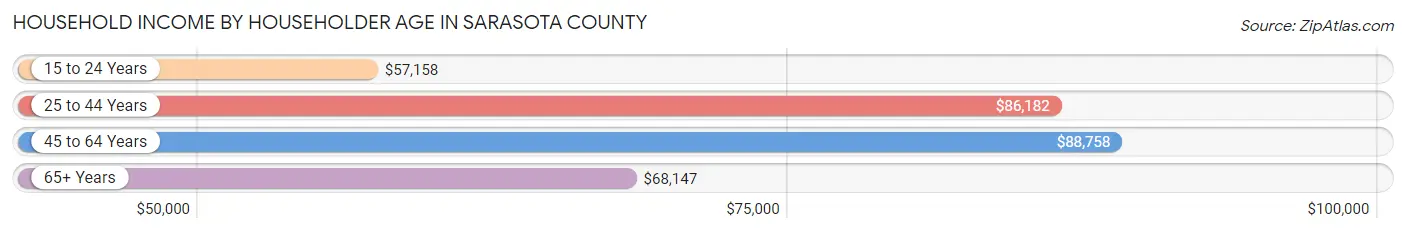
| Income Bracket | # Households | Median Income |
| 15 to 24 Years | 2,657 (1.3%) | $57,158 |
| 25 to 44 Years | 33,185 (16.7%) | $86,182 |
| 45 to 64 Years | 63,347 (31.8%) | $88,758 |
| 65+ Years | 100,156 (50.2%) | $68,147 |
| Total | 199,345 (100.0%) | $77,213 |
Poverty in Sarasota County
Income Below Poverty by Sex and Age in Sarasota County
With 7.2% poverty level for males and 9.0% for females among the residents of Sarasota County, 15 year old males and 5 year old females are the most vulnerable to poverty, with 324 males (15.6%) and 268 females (15.1%) in their respective age groups living below the poverty level.
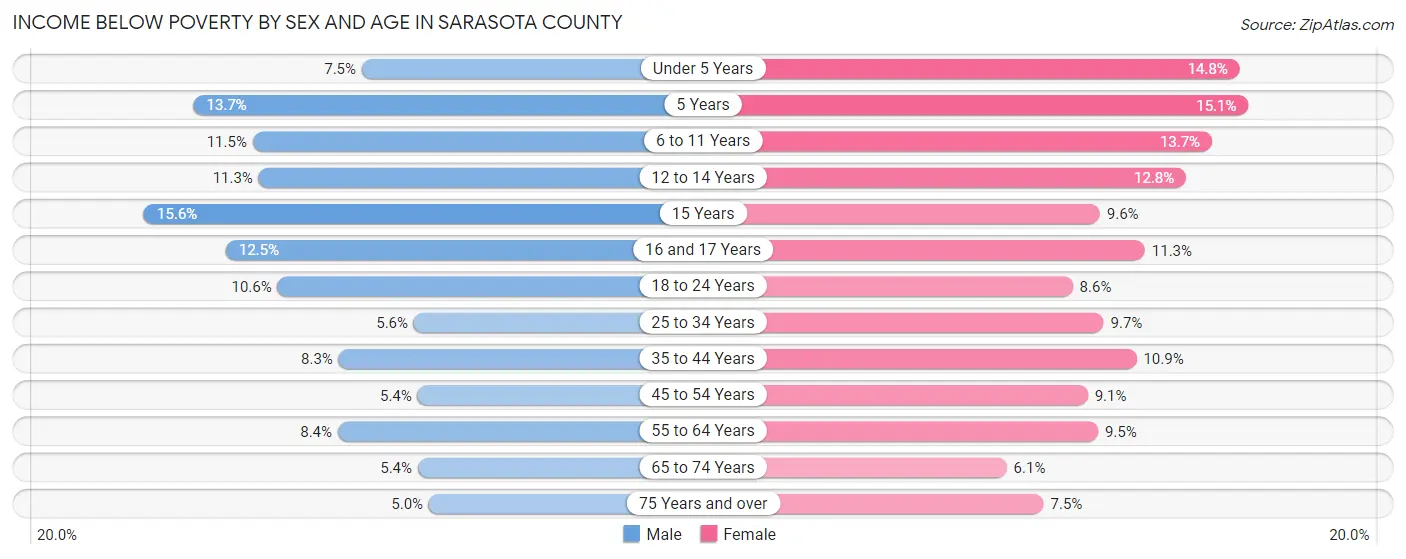
| Age Bracket | Male | Female |
| Under 5 Years | 532 (7.5%) | 1,030 (14.8%) |
| 5 Years | 198 (13.7%) | 268 (15.1%) |
| 6 to 11 Years | 1,070 (11.5%) | 1,302 (13.7%) |
| 12 to 14 Years | 791 (11.3%) | 676 (12.8%) |
| 15 Years | 324 (15.6%) | 155 (9.6%) |
| 16 and 17 Years | 502 (12.5%) | 454 (11.3%) |
| 18 to 24 Years | 1,297 (10.6%) | 997 (8.6%) |
| 25 to 34 Years | 1,014 (5.6%) | 1,728 (9.7%) |
| 35 to 44 Years | 1,513 (8.3%) | 2,064 (10.9%) |
| 45 to 54 Years | 1,204 (5.4%) | 2,216 (9.1%) |
| 55 to 64 Years | 2,631 (8.4%) | 3,466 (9.5%) |
| 65 to 74 Years | 2,014 (5.4%) | 2,661 (6.1%) |
| 75 Years and over | 1,822 (5.0%) | 3,193 (7.5%) |
| Total | 14,912 (7.2%) | 20,210 (9.0%) |
Income Above Poverty by Sex and Age in Sarasota County
According to the poverty statistics in Sarasota County, males aged 75 years and over and females aged 65 to 74 years are the age groups that are most secure financially, with 95.0% of males and 93.9% of females in these age groups living above the poverty line.
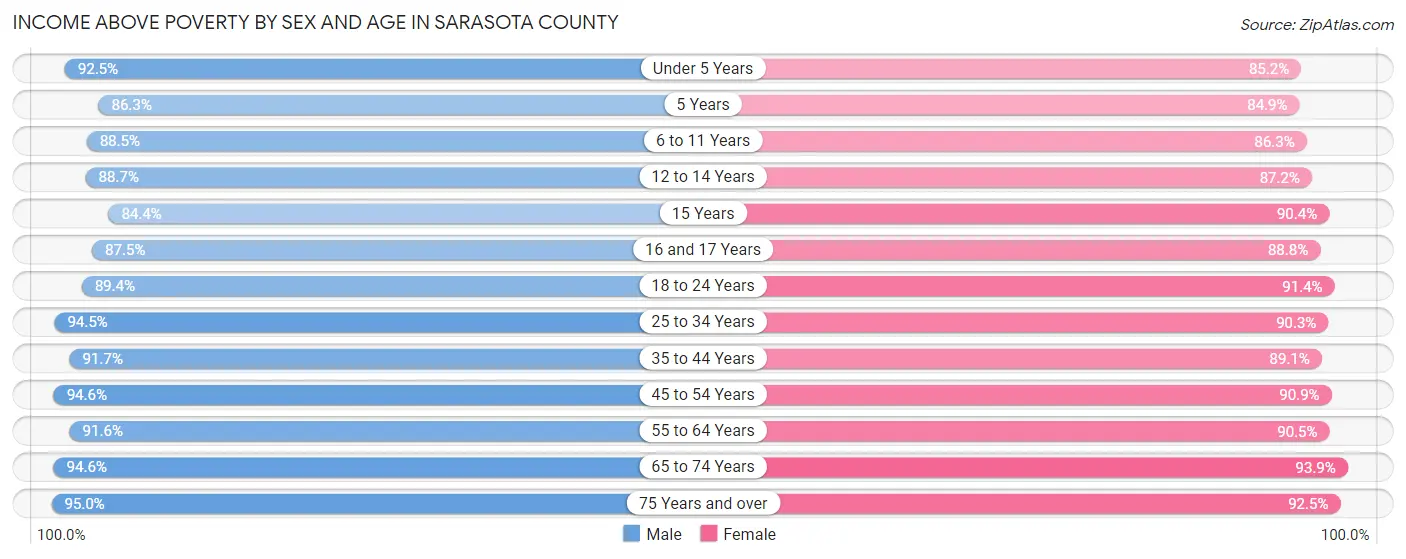
| Age Bracket | Male | Female |
| Under 5 Years | 6,576 (92.5%) | 5,943 (85.2%) |
| 5 Years | 1,244 (86.3%) | 1,508 (84.9%) |
| 6 to 11 Years | 8,214 (88.5%) | 8,173 (86.3%) |
| 12 to 14 Years | 6,200 (88.7%) | 4,614 (87.2%) |
| 15 Years | 1,757 (84.4%) | 1,463 (90.4%) |
| 16 and 17 Years | 3,505 (87.5%) | 3,583 (88.7%) |
| 18 to 24 Years | 10,925 (89.4%) | 10,639 (91.4%) |
| 25 to 34 Years | 17,269 (94.5%) | 16,044 (90.3%) |
| 35 to 44 Years | 16,633 (91.7%) | 16,801 (89.1%) |
| 45 to 54 Years | 21,067 (94.6%) | 22,050 (90.9%) |
| 55 to 64 Years | 28,815 (91.6%) | 32,965 (90.5%) |
| 65 to 74 Years | 35,286 (94.6%) | 40,789 (93.9%) |
| 75 Years and over | 34,693 (95.0%) | 39,457 (92.5%) |
| Total | 192,184 (92.8%) | 204,029 (91.0%) |
Income Below Poverty Among Married-Couple Families in Sarasota County
The poverty statistics for married-couple families in Sarasota County show that 3.5% or 3,563 of the total 102,547 families live below the poverty line. Families with 3 or 4 children have the highest poverty rate of 5.9%, comprising of 182 families. On the other hand, families with 5 or more children have the lowest poverty rate of 0.0%, which includes 0 families.
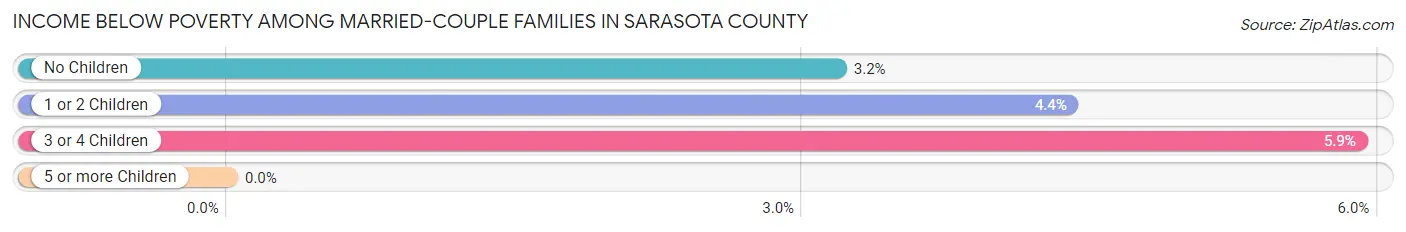
| Children | Above Poverty | Below Poverty |
| No Children | 78,363 (96.8%) | 2,575 (3.2%) |
| 1 or 2 Children | 17,566 (95.6%) | 806 (4.4%) |
| 3 or 4 Children | 2,903 (94.1%) | 182 (5.9%) |
| 5 or more Children | 152 (100.0%) | 0 (0.0%) |
| Total | 98,984 (96.5%) | 3,563 (3.5%) |
Income Below Poverty Among Single-Parent Households in Sarasota County
According to the poverty data in Sarasota County, 6.3% or 353 single-father households and 15.8% or 2,595 single-mother households are living below the poverty line. Among single-father households, those with 3 or 4 children have the highest poverty rate, with 52 households (21.4%) experiencing poverty. Likewise, among single-mother households, those with 5 or more children have the highest poverty rate, with 67 households (51.1%) falling below the poverty line.
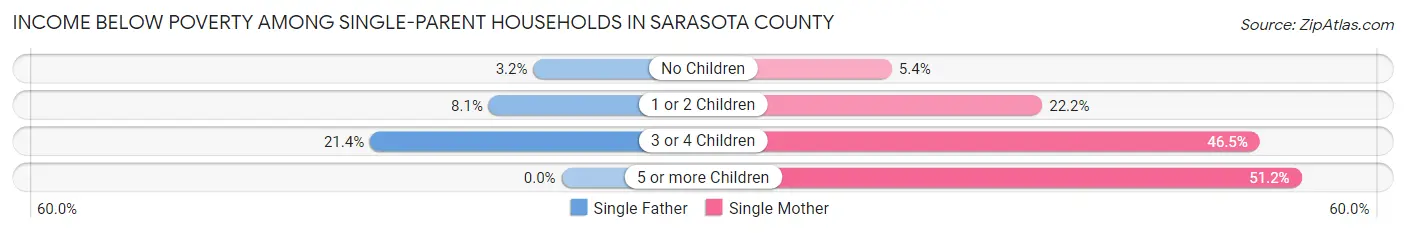
| Children | Single Father | Single Mother |
| No Children | 86 (3.2%) | 415 (5.4%) |
| 1 or 2 Children | 215 (8.1%) | 1,743 (22.2%) |
| 3 or 4 Children | 52 (21.4%) | 370 (46.5%) |
| 5 or more Children | 0 (0.0%) | 67 (51.1%) |
| Total | 353 (6.3%) | 2,595 (15.8%) |
Income Below Poverty Among Married-Couple vs Single-Parent Households in Sarasota County
The poverty data for Sarasota County shows that 3,563 of the married-couple family households (3.5%) and 2,948 of the single-parent households (13.4%) are living below the poverty level. Within the married-couple family households, those with 3 or 4 children have the highest poverty rate, with 182 households (5.9%) falling below the poverty line. Among the single-parent households, those with 5 or more children have the highest poverty rate, with 67 household (51.1%) living below poverty.
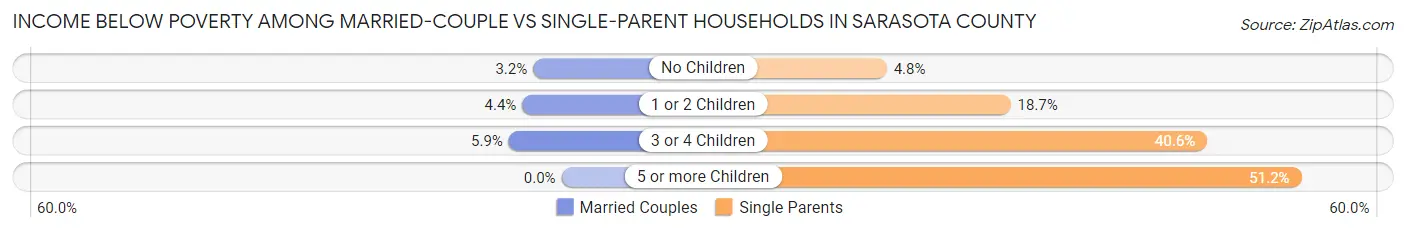
| Children | Married-Couple Families | Single-Parent Households |
| No Children | 2,575 (3.2%) | 501 (4.8%) |
| 1 or 2 Children | 806 (4.4%) | 1,958 (18.7%) |
| 3 or 4 Children | 182 (5.9%) | 422 (40.6%) |
| 5 or more Children | 0 (0.0%) | 67 (51.1%) |
| Total | 3,563 (3.5%) | 2,948 (13.4%) |
Race in Sarasota County
The most populous races in Sarasota County are White / Caucasian (378,003 | 86.0%), Hispanic or Latino (43,353 | 9.9%), and Two or more Races (25,879 | 5.9%).
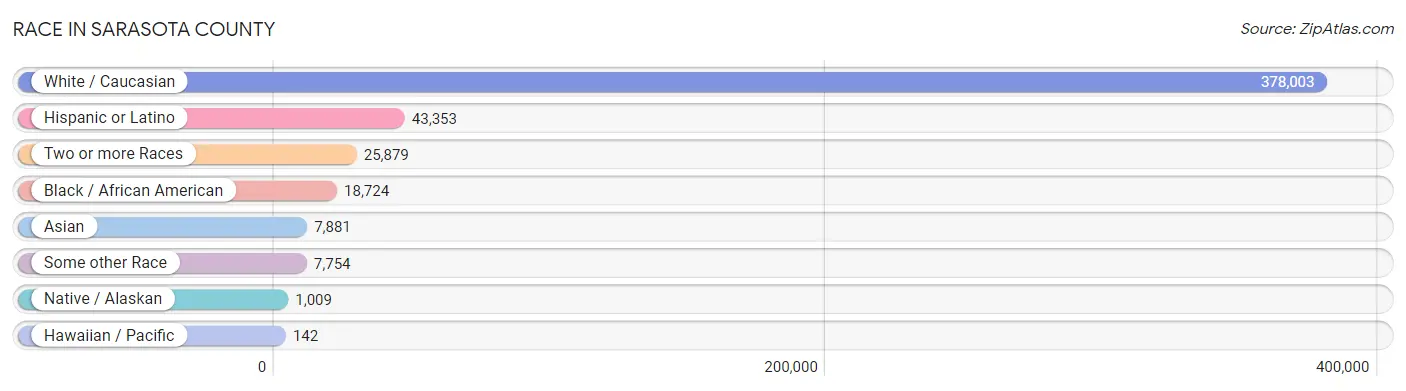
| Race | # Population | % Population |
| Asian | 7,881 | 1.8% |
| Black / African American | 18,724 | 4.3% |
| Hawaiian / Pacific | 142 | 0.0% |
| Hispanic or Latino | 43,353 | 9.9% |
| Native / Alaskan | 1,009 | 0.2% |
| White / Caucasian | 378,003 | 86.0% |
| Two or more Races | 25,879 | 5.9% |
| Some other Race | 7,754 | 1.8% |
| Total | 439,392 | 100.0% |
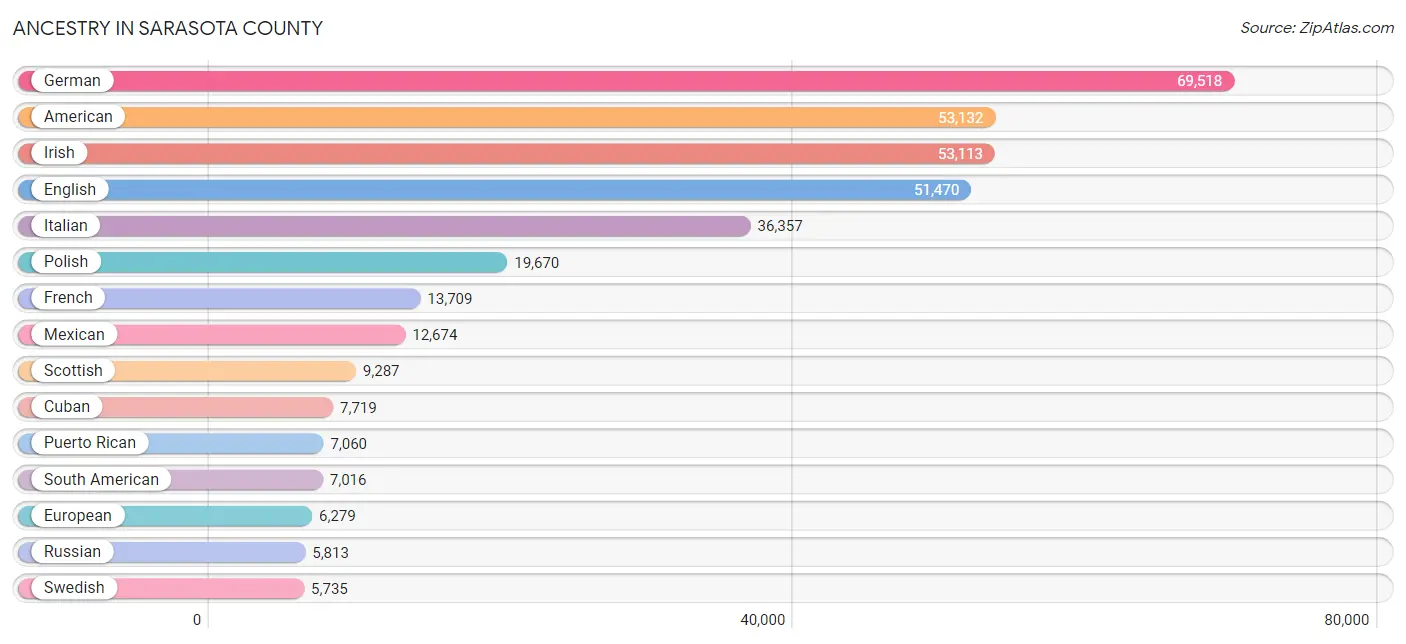
Ancestry in Sarasota County
The most populous ancestries reported in Sarasota County are German (69,518 | 15.8%), American (53,132 | 12.1%), Irish (53,113 | 12.1%), English (51,470 | 11.7%), and Italian (36,357 | 8.3%), together accounting for 60.0% of all Sarasota County residents.
| Ancestry | # Population | % Population |
| African | 625 | 0.1% |
| Albanian | 56 | 0.0% |
| Alsatian | 27 | 0.0% |
| American | 53,132 | 12.1% |
| Apache | 54 | 0.0% |
| Arab | 2,606 | 0.6% |
| Argentinean | 530 | 0.1% |
| Armenian | 431 | 0.1% |
| Assyrian / Chaldean / Syriac | 23 | 0.0% |
| Australian | 269 | 0.1% |
| Austrian | 1,609 | 0.4% |
| Bahamian | 157 | 0.0% |
| Bangladeshi | 67 | 0.0% |
| Barbadian | 18 | 0.0% |
| Basque | 74 | 0.0% |
| Belgian | 572 | 0.1% |
| Bermudan | 19 | 0.0% |
| Bhutanese | 451 | 0.1% |
| Blackfeet | 61 | 0.0% |
| Bolivian | 51 | 0.0% |
| Brazilian | 734 | 0.2% |
| British | 3,891 | 0.9% |
| Bulgarian | 307 | 0.1% |
| Burmese | 679 | 0.2% |
| Canadian | 2,254 | 0.5% |
| Cape Verdean | 26 | 0.0% |
| Carpatho Rusyn | 79 | 0.0% |
| Celtic | 98 | 0.0% |
| Central American | 4,083 | 0.9% |
| Central American Indian | 506 | 0.1% |
| Cherokee | 1,116 | 0.3% |
| Chickasaw | 9 | 0.0% |
| Chilean | 248 | 0.1% |
| Chippewa | 136 | 0.0% |
| Choctaw | 45 | 0.0% |
| Colombian | 1,998 | 0.4% |
| Costa Rican | 153 | 0.0% |
| Cree | 6 | 0.0% |
| Creek | 52 | 0.0% |
| Croatian | 840 | 0.2% |
| Cuban | 7,719 | 1.8% |
| Czech | 2,200 | 0.5% |
| Czechoslovakian | 512 | 0.1% |
| Danish | 1,267 | 0.3% |
| Delaware | 1 | 0.0% |
| Dominican | 769 | 0.2% |
| Dutch | 5,235 | 1.2% |
| Dutch West Indian | 26 | 0.0% |
| Eastern European | 1,831 | 0.4% |
| Ecuadorian | 602 | 0.1% |
| Egyptian | 247 | 0.1% |
| English | 51,470 | 11.7% |
| Estonian | 63 | 0.0% |
| Ethiopian | 18 | 0.0% |
| European | 6,279 | 1.4% |
| Filipino | 39 | 0.0% |
| Finnish | 1,072 | 0.2% |
| French | 13,709 | 3.1% |
| French American Indian | 32 | 0.0% |
| French Canadian | 4,235 | 1.0% |
| German | 69,518 | 15.8% |
| German Russian | 10 | 0.0% |
| Ghanaian | 64 | 0.0% |
| Greek | 2,105 | 0.5% |
| Guamanian / Chamorro | 76 | 0.0% |
| Guatemalan | 1,727 | 0.4% |
| Guyanese | 408 | 0.1% |
| Haitian | 1,439 | 0.3% |
| Honduran | 537 | 0.1% |
| Hungarian | 3,705 | 0.8% |
| Icelander | 27 | 0.0% |
| Indian (Asian) | 2,222 | 0.5% |
| Indonesian | 191 | 0.0% |
| Iranian | 545 | 0.1% |
| Irish | 53,113 | 12.1% |
| Iroquois | 132 | 0.0% |
| Israeli | 154 | 0.0% |
| Italian | 36,357 | 8.3% |
| Jamaican | 1,738 | 0.4% |
| Japanese | 38 | 0.0% |
| Jordanian | 31 | 0.0% |
| Korean | 2,053 | 0.5% |
| Laotian | 170 | 0.0% |
| Latvian | 196 | 0.0% |
| Lebanese | 1,300 | 0.3% |
| Lithuanian | 1,791 | 0.4% |
| Lumbee | 5 | 0.0% |
| Luxembourger | 15 | 0.0% |
| Macedonian | 111 | 0.0% |
| Malaysian | 39 | 0.0% |
| Maltese | 76 | 0.0% |
| Menominee | 6 | 0.0% |
| Mexican | 12,674 | 2.9% |
| Mexican American Indian | 102 | 0.0% |
| Mongolian | 68 | 0.0% |
| Moroccan | 51 | 0.0% |
| Native Hawaiian | 134 | 0.0% |
| Navajo | 10 | 0.0% |
| New Zealander | 24 | 0.0% |
| Nicaraguan | 897 | 0.2% |
| Nigerian | 46 | 0.0% |
| Northern European | 749 | 0.2% |
| Norwegian | 3,849 | 0.9% |
| Osage | 144 | 0.0% |
| Pakistani | 901 | 0.2% |
| Palestinian | 215 | 0.1% |
| Panamanian | 213 | 0.1% |
| Paraguayan | 22 | 0.0% |
| Pennsylvania German | 221 | 0.1% |
| Peruvian | 2,277 | 0.5% |
| Polish | 19,670 | 4.5% |
| Portuguese | 2,686 | 0.6% |
| Potawatomi | 33 | 0.0% |
| Pueblo | 12 | 0.0% |
| Puerto Rican | 7,060 | 1.6% |
| Romanian | 1,009 | 0.2% |
| Russian | 5,813 | 1.3% |
| Salvadoran | 556 | 0.1% |
| Samoan | 10 | 0.0% |
| Scandinavian | 917 | 0.2% |
| Scotch-Irish | 4,146 | 0.9% |
| Scottish | 9,287 | 2.1% |
| Seminole | 21 | 0.0% |
| Serbian | 766 | 0.2% |
| Sioux | 21 | 0.0% |
| Slavic | 330 | 0.1% |
| Slovak | 1,914 | 0.4% |
| Slovene | 171 | 0.0% |
| Somali | 12 | 0.0% |
| South African | 323 | 0.1% |
| South American | 7,016 | 1.6% |
| South American Indian | 73 | 0.0% |
| Spaniard | 1,069 | 0.2% |
| Spanish | 653 | 0.2% |
| Sri Lankan | 1,546 | 0.4% |
| Subsaharan African | 1,249 | 0.3% |
| Swedish | 5,735 | 1.3% |
| Swiss | 1,745 | 0.4% |
| Syrian | 380 | 0.1% |
| Thai | 1,331 | 0.3% |
| Trinidadian and Tobagonian | 108 | 0.0% |
| Turkish | 359 | 0.1% |
| Ugandan | 9 | 0.0% |
| Ukrainian | 2,686 | 0.6% |
| Venezuelan | 1,288 | 0.3% |
| Vietnamese | 11 | 0.0% |
| Welsh | 3,503 | 0.8% |
| West Indian | 42 | 0.0% |
| Yugoslavian | 334 | 0.1% |
| Zimbabwean | 12 | 0.0% | View All 150 Rows |
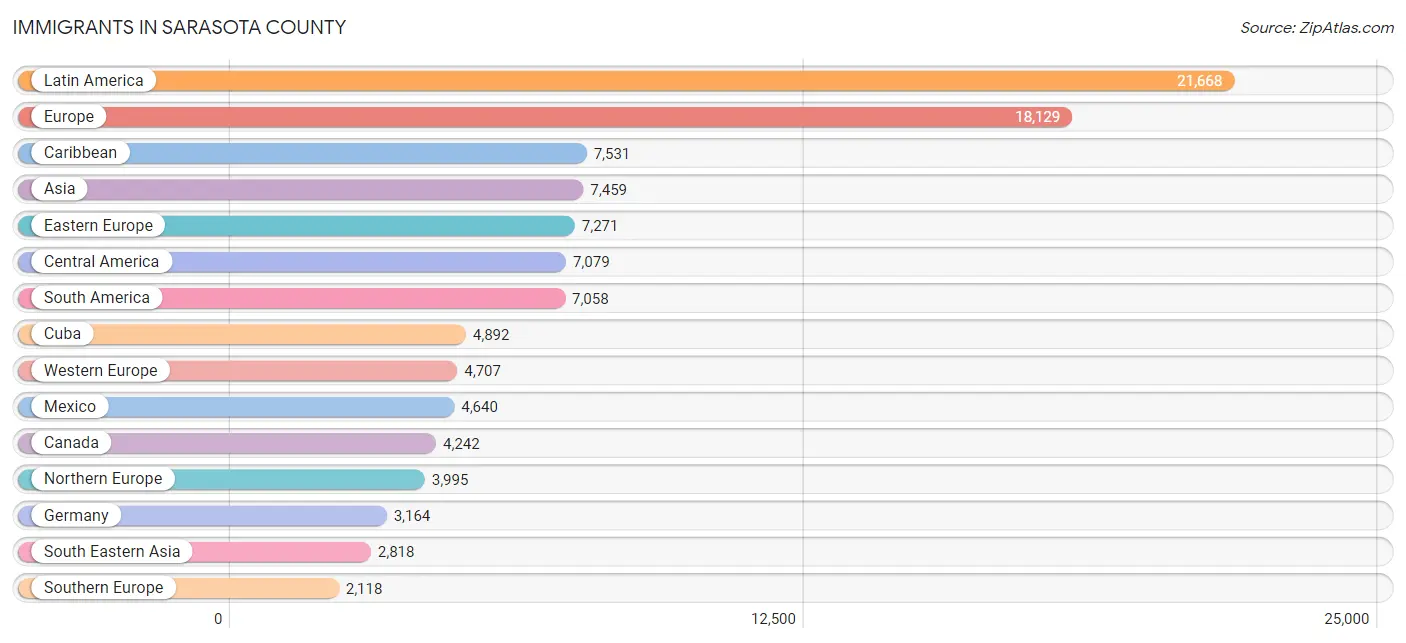
Immigrants in Sarasota County
The most numerous immigrant groups reported in Sarasota County came from Latin America (21,668 | 4.9%), Europe (18,129 | 4.1%), Caribbean (7,531 | 1.7%), Asia (7,459 | 1.7%), and Eastern Europe (7,271 | 1.7%), together accounting for 14.1% of all Sarasota County residents.
| Immigration Origin | # Population | % Population |
| Africa | 1,230 | 0.3% |
| Albania | 16 | 0.0% |
| Argentina | 297 | 0.1% |
| Armenia | 28 | 0.0% |
| Asia | 7,459 | 1.7% |
| Australia | 191 | 0.0% |
| Austria | 325 | 0.1% |
| Azores | 9 | 0.0% |
| Bahamas | 134 | 0.0% |
| Bangladesh | 11 | 0.0% |
| Barbados | 31 | 0.0% |
| Belarus | 189 | 0.0% |
| Belgium | 186 | 0.0% |
| Belize | 8 | 0.0% |
| Bolivia | 232 | 0.1% |
| Bosnia and Herzegovina | 164 | 0.0% |
| Brazil | 664 | 0.2% |
| Bulgaria | 259 | 0.1% |
| Cabo Verde | 33 | 0.0% |
| Canada | 4,242 | 1.0% |
| Caribbean | 7,531 | 1.7% |
| Central America | 7,079 | 1.6% |
| Chile | 361 | 0.1% |
| China | 1,419 | 0.3% |
| Colombia | 1,492 | 0.3% |
| Costa Rica | 36 | 0.0% |
| Croatia | 54 | 0.0% |
| Cuba | 4,892 | 1.1% |
| Czechoslovakia | 590 | 0.1% |
| Denmark | 58 | 0.0% |
| Dominican Republic | 460 | 0.1% |
| Eastern Africa | 354 | 0.1% |
| Eastern Asia | 1,977 | 0.4% |
| Eastern Europe | 7,271 | 1.7% |
| Ecuador | 437 | 0.1% |
| Egypt | 201 | 0.1% |
| El Salvador | 368 | 0.1% |
| England | 1,602 | 0.4% |
| Eritrea | 14 | 0.0% |
| Ethiopia | 29 | 0.0% |
| Europe | 18,129 | 4.1% |
| France | 559 | 0.1% |
| Germany | 3,164 | 0.7% |
| Ghana | 94 | 0.0% |
| Greece | 231 | 0.1% |
| Guatemala | 1,107 | 0.3% |
| Guyana | 241 | 0.1% |
| Haiti | 813 | 0.2% |
| Honduras | 207 | 0.1% |
| Hong Kong | 95 | 0.0% |
| Hungary | 716 | 0.2% |
| India | 873 | 0.2% |
| Indonesia | 144 | 0.0% |
| Iran | 286 | 0.1% |
| Iraq | 20 | 0.0% |
| Ireland | 297 | 0.1% |
| Israel | 271 | 0.1% |
| Italy | 1,199 | 0.3% |
| Jamaica | 908 | 0.2% |
| Japan | 184 | 0.0% |
| Jordan | 105 | 0.0% |
| Kazakhstan | 152 | 0.0% |
| Kenya | 64 | 0.0% |
| Korea | 374 | 0.1% |
| Kuwait | 6 | 0.0% |
| Laos | 64 | 0.0% |
| Latin America | 21,668 | 4.9% |
| Latvia | 44 | 0.0% |
| Lebanon | 223 | 0.1% |
| Lithuania | 273 | 0.1% |
| Malaysia | 52 | 0.0% |
| Mexico | 4,640 | 1.1% |
| Moldova | 177 | 0.0% |
| Morocco | 88 | 0.0% |
| Nepal | 27 | 0.0% |
| Netherlands | 350 | 0.1% |
| Nicaragua | 664 | 0.2% |
| Nigeria | 10 | 0.0% |
| North Macedonia | 43 | 0.0% |
| Northern Africa | 350 | 0.1% |
| Northern Europe | 3,995 | 0.9% |
| Norway | 65 | 0.0% |
| Oceania | 216 | 0.1% |
| Pakistan | 56 | 0.0% |
| Panama | 49 | 0.0% |
| Peru | 1,961 | 0.4% |
| Philippines | 905 | 0.2% |
| Poland | 1,406 | 0.3% |
| Portugal | 434 | 0.1% |
| Romania | 460 | 0.1% |
| Russia | 984 | 0.2% |
| Saudi Arabia | 7 | 0.0% |
| Scotland | 252 | 0.1% |
| Serbia | 183 | 0.0% |
| South Africa | 332 | 0.1% |
| South America | 7,058 | 1.6% |
| South Central Asia | 1,500 | 0.3% |
| South Eastern Asia | 2,818 | 0.6% |
| Southern Europe | 2,118 | 0.5% |
| Spain | 247 | 0.1% |
| Sri Lanka | 52 | 0.0% |
| Sweden | 520 | 0.1% |
| Switzerland | 123 | 0.0% |
| Syria | 114 | 0.0% |
| Taiwan | 84 | 0.0% |
| Thailand | 506 | 0.1% |
| Trinidad and Tobago | 279 | 0.1% |
| Turkey | 242 | 0.1% |
| Uganda | 31 | 0.0% |
| Ukraine | 1,222 | 0.3% |
| Uzbekistan | 28 | 0.0% |
| Venezuela | 1,349 | 0.3% |
| Vietnam | 1,009 | 0.2% |
| West Indies | 14 | 0.0% |
| Western Africa | 153 | 0.0% |
| Western Asia | 1,043 | 0.2% |
| Western Europe | 4,707 | 1.1% |
| Zimbabwe | 121 | 0.0% | View All 118 Rows |
Sex and Age in Sarasota County
Sex and Age in Sarasota County
The most populous age groups in Sarasota County are 65 to 69 Years (19,073 | 9.1%) for men and 65 to 69 Years (22,703 | 9.9%) for women.
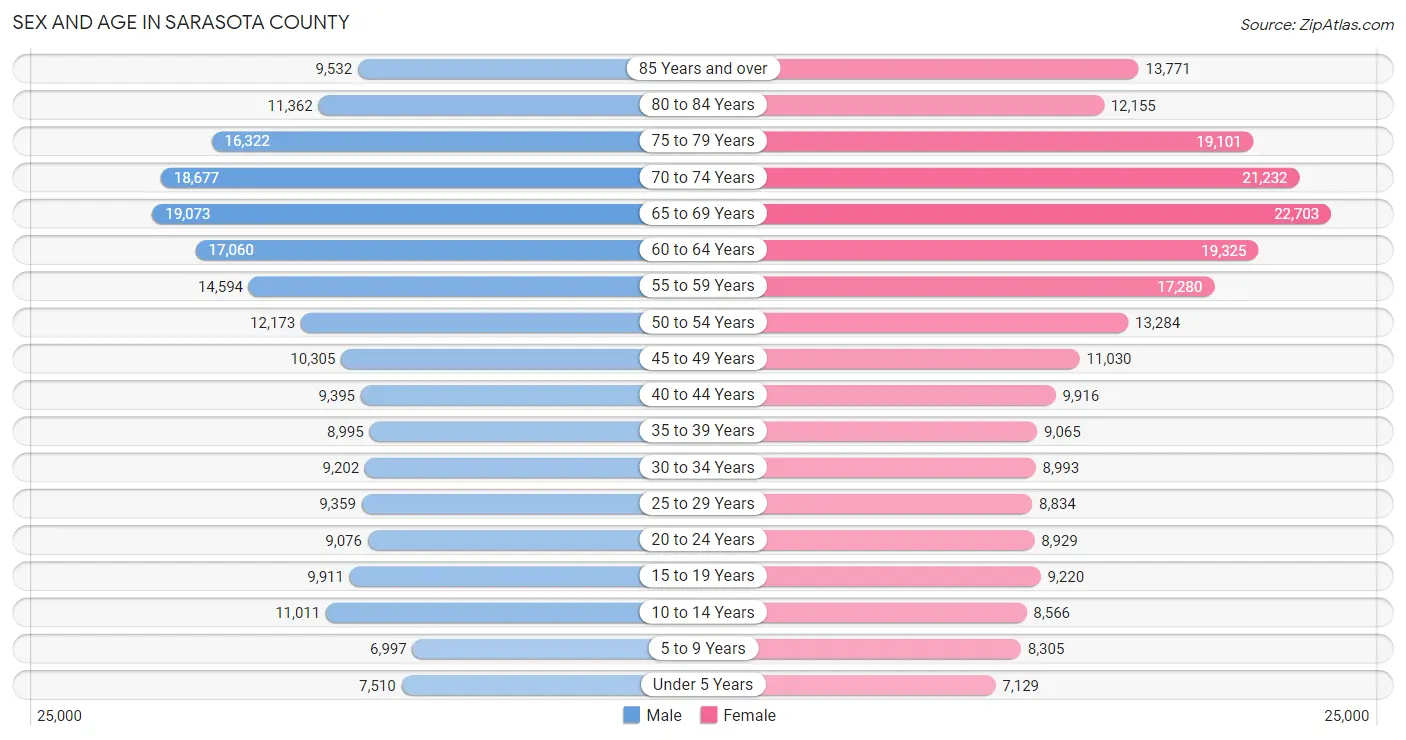
| Age Bracket | Male | Female |
| Under 5 Years | 7,510 (3.6%) | 7,129 (3.1%) |
| 5 to 9 Years | 6,997 (3.3%) | 8,305 (3.6%) |
| 10 to 14 Years | 11,011 (5.2%) | 8,566 (3.7%) |
| 15 to 19 Years | 9,911 (4.7%) | 9,220 (4.0%) |
| 20 to 24 Years | 9,076 (4.3%) | 8,929 (3.9%) |
| 25 to 29 Years | 9,359 (4.4%) | 8,834 (3.9%) |
| 30 to 34 Years | 9,202 (4.4%) | 8,993 (3.9%) |
| 35 to 39 Years | 8,995 (4.3%) | 9,065 (4.0%) |
| 40 to 44 Years | 9,395 (4.5%) | 9,916 (4.3%) |
| 45 to 49 Years | 10,305 (4.9%) | 11,030 (4.8%) |
| 50 to 54 Years | 12,173 (5.8%) | 13,284 (5.8%) |
| 55 to 59 Years | 14,594 (6.9%) | 17,280 (7.5%) |
| 60 to 64 Years | 17,060 (8.1%) | 19,325 (8.4%) |
| 65 to 69 Years | 19,073 (9.1%) | 22,703 (9.9%) |
| 70 to 74 Years | 18,677 (8.9%) | 21,232 (9.3%) |
| 75 to 79 Years | 16,322 (7.7%) | 19,101 (8.4%) |
| 80 to 84 Years | 11,362 (5.4%) | 12,155 (5.3%) |
| 85 Years and over | 9,532 (4.5%) | 13,771 (6.0%) |
| Total | 210,554 (100.0%) | 228,838 (100.0%) |
Families and Households in Sarasota County
Median Family Size in Sarasota County
The median family size in Sarasota County is 2.66 persons per family, with single female/mother families (16,476 | 13.2%) accounting for the largest median family size of 2.89 persons per family. On the other hand, married-couple families (102,547 | 82.3%) represent the smallest median family size with 2.62 persons per family.
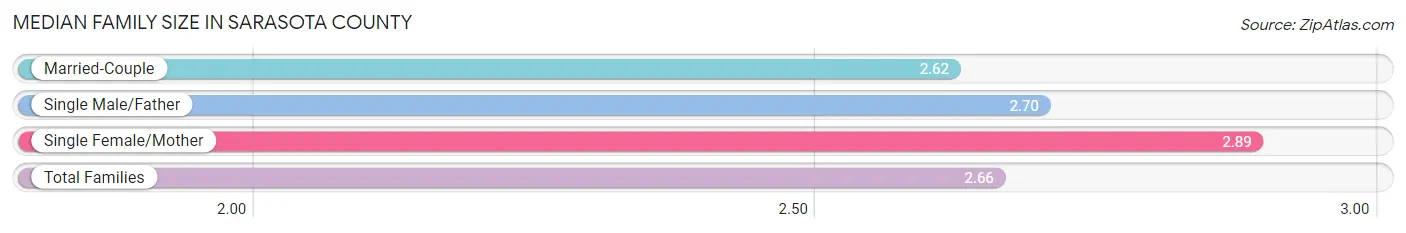
| Family Type | # Families | Family Size |
| Married-Couple | 102,547 (82.3%) | 2.62 |
| Single Male/Father | 5,613 (4.5%) | 2.70 |
| Single Female/Mother | 16,476 (13.2%) | 2.89 |
| Total Families | 124,636 (100.0%) | 2.66 |
Median Household Size in Sarasota County
The median household size in Sarasota County is 2.17 persons per household, with single female/mother households (16,476 | 8.3%) accounting for the largest median household size of 3.12 persons per household. non-family households (74,709 | 37.5%) represent the smallest median household size with 1.23 persons per household.
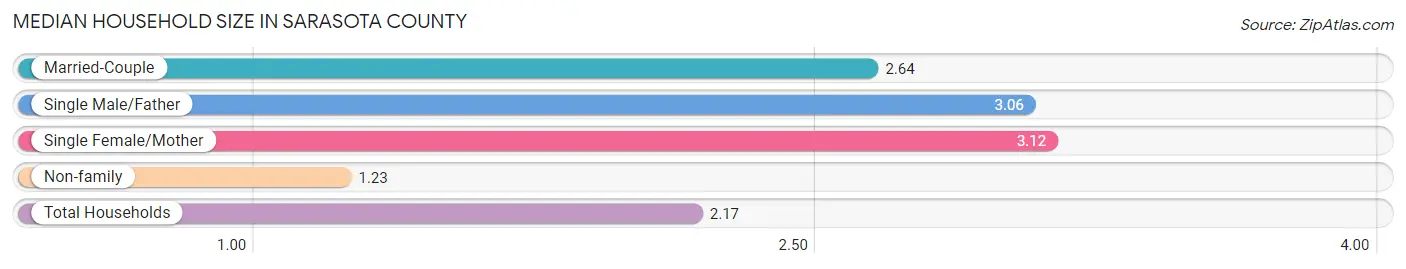
| Household Type | # Households | Household Size |
| Married-Couple | 102,547 (51.4%) | 2.64 |
| Single Male/Father | 5,613 (2.8%) | 3.06 |
| Single Female/Mother | 16,476 (8.3%) | 3.12 |
| Non-family | 74,709 (37.5%) | 1.23 |
| Total Households | 199,345 (100.0%) | 2.17 |
Household Size by Marriage Status in Sarasota County
Out of a total of 199,345 households in Sarasota County, 124,636 (62.5%) are family households, while 74,709 (37.5%) are nonfamily households. The most numerous type of family households are 2-person households, comprising 81,235, and the most common type of nonfamily households are 1-person households, comprising 60,257.
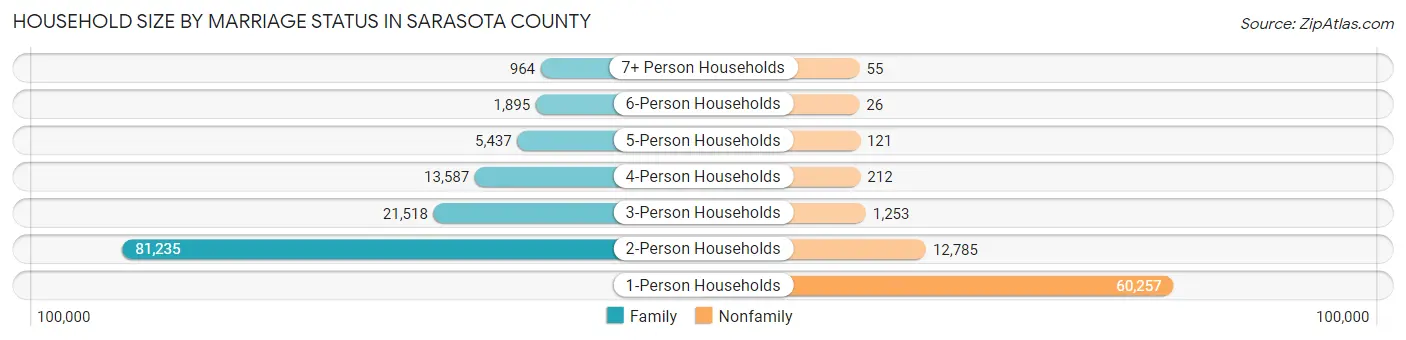
| Household Size | Family Households | Nonfamily Households |
| 1-Person Households | - | 60,257 (30.2%) |
| 2-Person Households | 81,235 (40.7%) | 12,785 (6.4%) |
| 3-Person Households | 21,518 (10.8%) | 1,253 (0.6%) |
| 4-Person Households | 13,587 (6.8%) | 212 (0.1%) |
| 5-Person Households | 5,437 (2.7%) | 121 (0.1%) |
| 6-Person Households | 1,895 (0.9%) | 26 (0.0%) |
| 7+ Person Households | 964 (0.5%) | 55 (0.0%) |
| Total | 124,636 (62.5%) | 74,709 (37.5%) |
Female Fertility in Sarasota County
Fertility by Age in Sarasota County
Average fertility rate in Sarasota County is 39.0 births per 1,000 women. Women in the age bracket of 20 to 34 years have the highest fertility rate with 76.0 births per 1,000 women. Women in the age bracket of 20 to 34 years acount for 74.9% of all women with births.
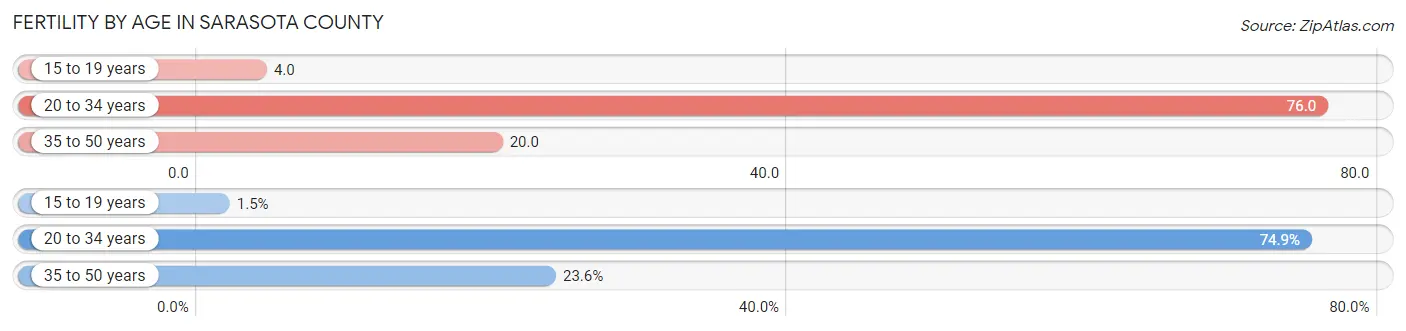
| Age Bracket | Women with Births | Births / 1,000 Women |
| 15 to 19 years | 40 (1.5%) | 4.0 |
| 20 to 34 years | 2,026 (74.9%) | 76.0 |
| 35 to 50 years | 639 (23.6%) | 20.0 |
| Total | 2,705 (100.0%) | 39.0 |
Fertility by Age by Marriage Status in Sarasota County
69.2% of women with births (2,705) in Sarasota County are married. The highest percentage of unmarried women with births falls into 15 to 19 years age bracket with 100.0% of them unmarried at the time of birth, while the lowest percentage of unmarried women with births belong to 35 to 50 years age bracket with 16.3% of them unmarried.
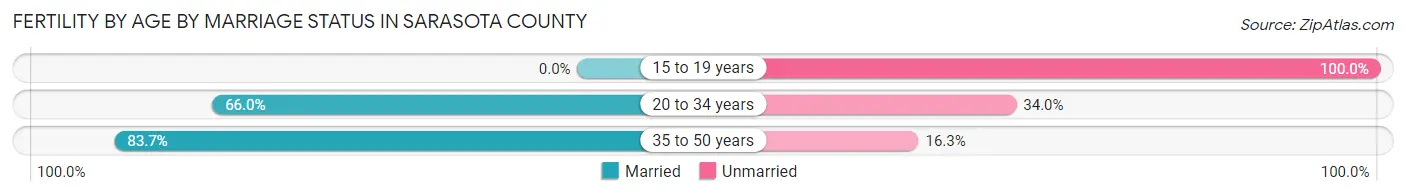
| Age Bracket | Married | Unmarried |
| 15 to 19 years | 0 (0.0%) | 40 (100.0%) |
| 20 to 34 years | 1,337 (66.0%) | 689 (34.0%) |
| 35 to 50 years | 535 (83.7%) | 104 (16.3%) |
| Total | 1,872 (69.2%) | 833 (30.8%) |
Fertility by Education in Sarasota County
Average fertility rate in Sarasota County is 39.0 births per 1,000 women. Women with the education attainment of college or associate's degree have the highest fertility rate of 51.0 births per 1,000 women, while women with the education attainment of less than high school have the lowest fertility at 21.0 births per 1,000 women. Women with the education attainment of college or associate's degree represent 38.8% of all women with births.
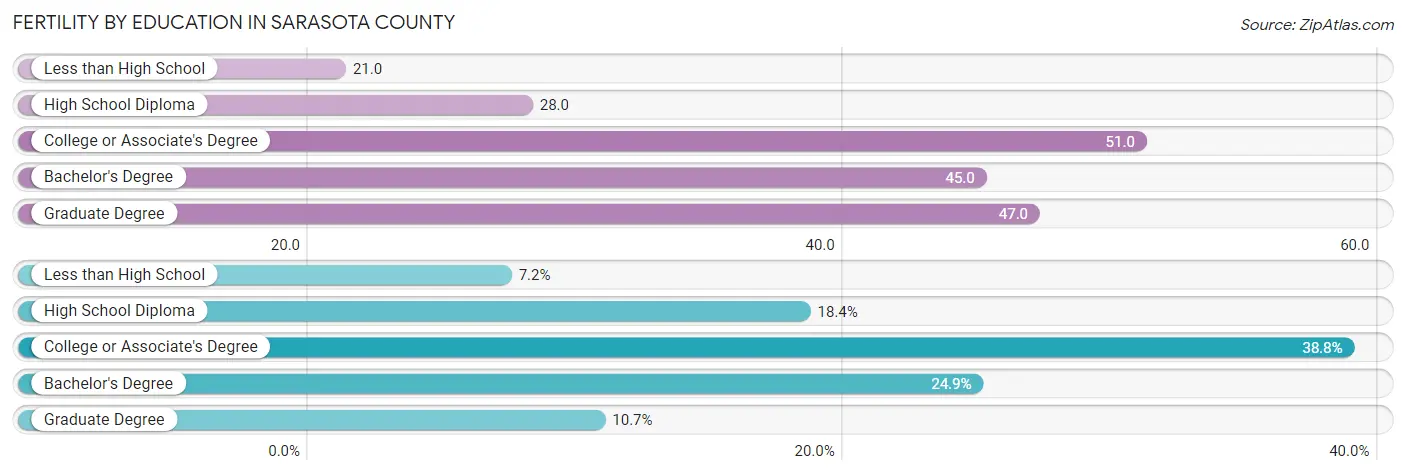
| Educational Attainment | Women with Births | Births / 1,000 Women |
| Less than High School | 195 (7.2%) | 21.0 |
| High School Diploma | 498 (18.4%) | 28.0 |
| College or Associate's Degree | 1,049 (38.8%) | 51.0 |
| Bachelor's Degree | 673 (24.9%) | 45.0 |
| Graduate Degree | 290 (10.7%) | 47.0 |
| Total | 2,705 (100.0%) | 39.0 |
Fertility by Education by Marriage Status in Sarasota County
30.8% of women with births in Sarasota County are unmarried. Women with the educational attainment of graduate degree are most likely to be married with 93.8% of them married at childbirth, while women with the educational attainment of high school diploma are least likely to be married with 71.7% of them unmarried at childbirth.
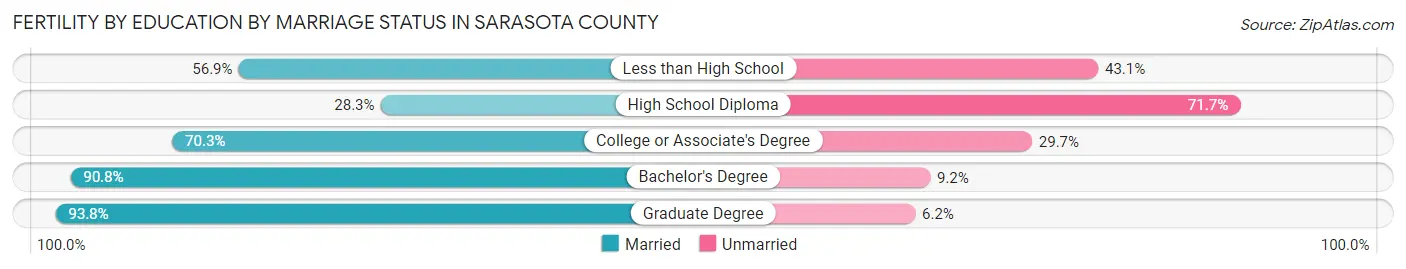
| Educational Attainment | Married | Unmarried |
| Less than High School | 111 (56.9%) | 84 (43.1%) |
| High School Diploma | 141 (28.3%) | 357 (71.7%) |
| College or Associate's Degree | 737 (70.3%) | 312 (29.7%) |
| Bachelor's Degree | 611 (90.8%) | 62 (9.2%) |
| Graduate Degree | 272 (93.8%) | 18 (6.2%) |
| Total | 1,872 (69.2%) | 833 (30.8%) |
Employment Characteristics in Sarasota County
Employment by Class of Employer in Sarasota County
Among the 178,719 employed individuals in Sarasota County, private company employees (120,291 | 67.3%), self-employed (not incorporated) (14,668 | 8.2%), and self-employed (incorporated) (14,607 | 8.2%) make up the most common classes of employment.
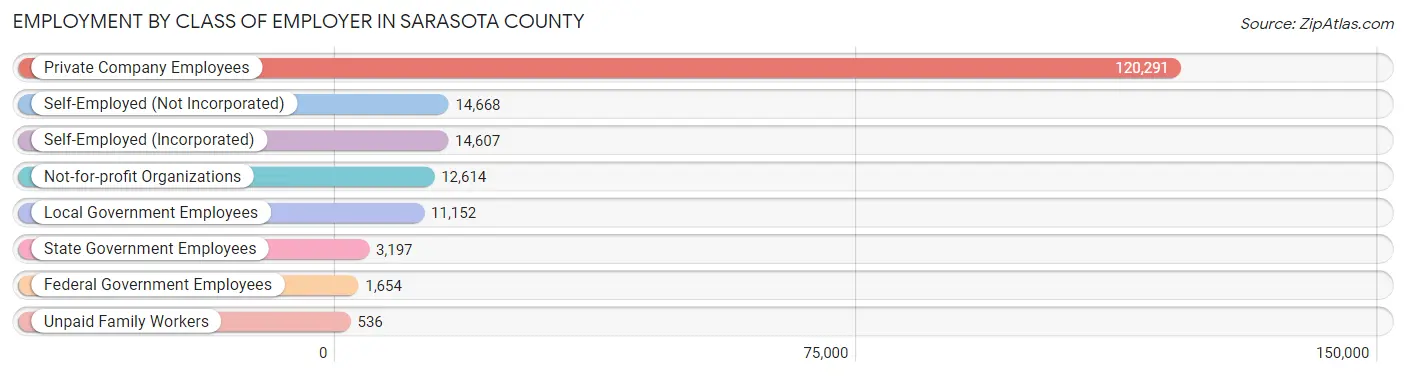
| Employer Class | # Employees | % Employees |
| Private Company Employees | 120,291 | 67.3% |
| Self-Employed (Incorporated) | 14,607 | 8.2% |
| Self-Employed (Not Incorporated) | 14,668 | 8.2% |
| Not-for-profit Organizations | 12,614 | 7.1% |
| Local Government Employees | 11,152 | 6.2% |
| State Government Employees | 3,197 | 1.8% |
| Federal Government Employees | 1,654 | 0.9% |
| Unpaid Family Workers | 536 | 0.3% |
| Total | 178,719 | 100.0% |
Employment Status by Age in Sarasota County
According to the labor force statistics for Sarasota County, out of the total population over 16 years of age (386,174), 49.0% or 189,225 individuals are in the labor force, with 3.4% or 6,434 of them unemployed. The age group with the highest labor force participation rate is 25 to 29 years, with 88.3% or 16,064 individuals in the labor force. Within the labor force, the 16 to 19 years age range has the highest percentage of unemployed individuals, with 6.6% or 488 of them being unemployed.
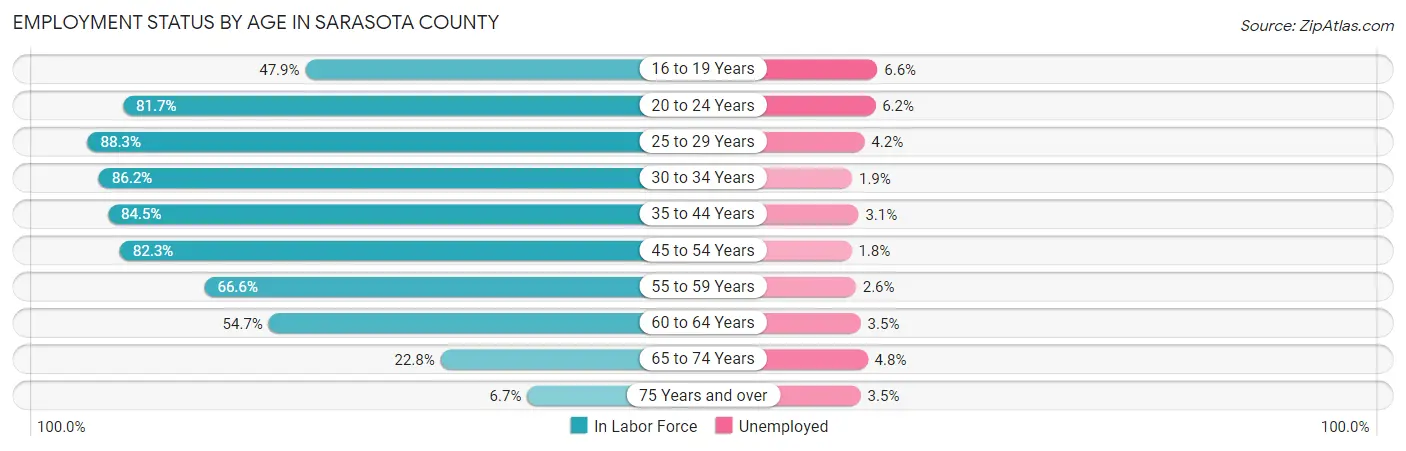
| Age Bracket | In Labor Force | Unemployed |
| 16 to 19 Years | 7,391 (47.9%) | 488 (6.6%) |
| 20 to 24 Years | 14,710 (81.7%) | 912 (6.2%) |
| 25 to 29 Years | 16,064 (88.3%) | 675 (4.2%) |
| 30 to 34 Years | 15,684 (86.2%) | 298 (1.9%) |
| 35 to 44 Years | 31,578 (84.5%) | 979 (3.1%) |
| 45 to 54 Years | 38,510 (82.3%) | 693 (1.8%) |
| 55 to 59 Years | 21,228 (66.6%) | 552 (2.6%) |
| 60 to 64 Years | 19,903 (54.7%) | 697 (3.5%) |
| 65 to 74 Years | 18,624 (22.8%) | 894 (4.8%) |
| 75 Years and over | 5,510 (6.7%) | 193 (3.5%) |
| Total | 189,225 (49.0%) | 6,434 (3.4%) |
Employment Status by Educational Attainment in Sarasota County
According to labor force statistics for Sarasota County, 75.7% of individuals (142,929) out of the total population between 25 and 64 years of age (188,810) are in the labor force, with 2.7% or 3,859 of them being unemployed. The group with the highest labor force participation rate are those with the educational attainment of bachelor's degree or higher, with 78.2% or 52,347 individuals in the labor force. Within the labor force, individuals with college / associate degree education have the highest percentage of unemployment, with 3.6% or 1,605 of them being unemployed.
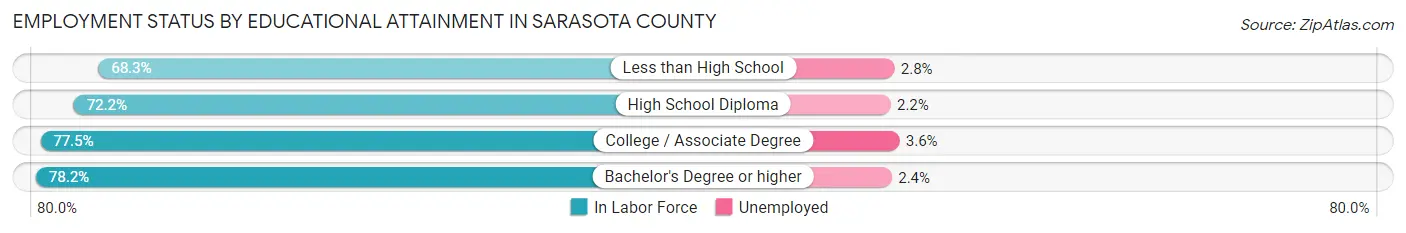
| Educational Attainment | In Labor Force | Unemployed |
| Less than High School | 8,145 (68.3%) | 334 (2.8%) |
| High School Diploma | 37,841 (72.2%) | 1,153 (2.2%) |
| College / Associate Degree | 44,589 (77.5%) | 2,071 (3.6%) |
| Bachelor's Degree or higher | 52,347 (78.2%) | 1,607 (2.4%) |
| Total | 142,929 (75.7%) | 5,098 (2.7%) |
Employment Occupations by Sex in Sarasota County
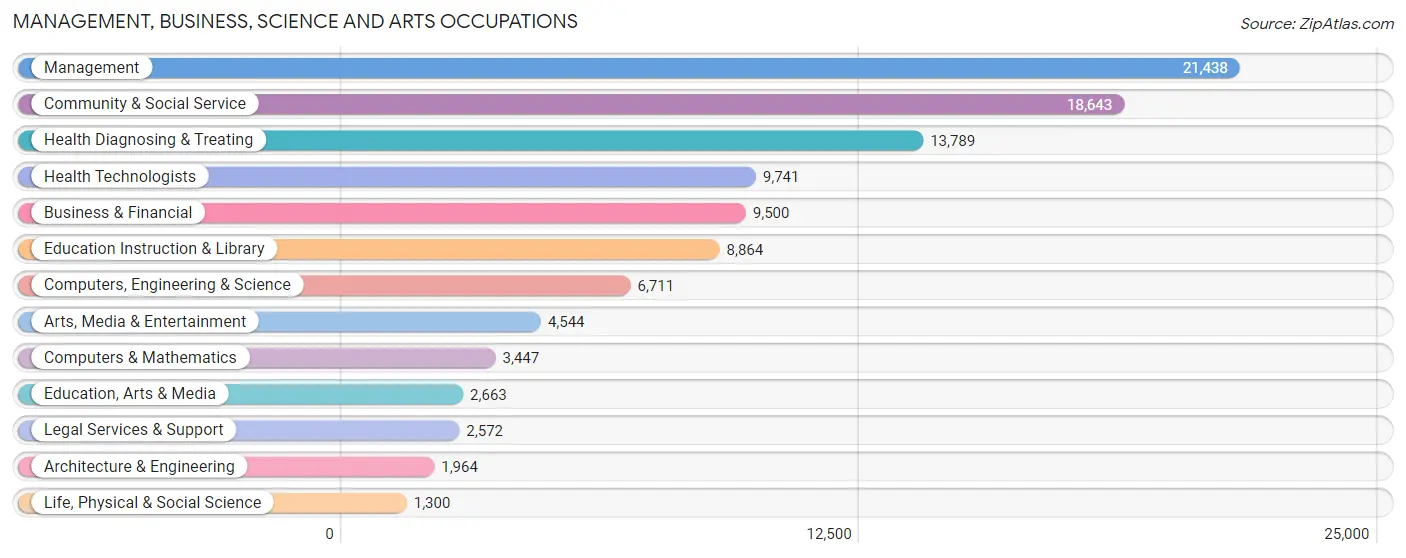
Management, Business, Science and Arts Occupations
The most common Management, Business, Science and Arts occupations in Sarasota County are Management (21,438 | 11.7%), Community & Social Service (18,643 | 10.2%), Health Diagnosing & Treating (13,789 | 7.6%), Health Technologists (9,741 | 5.3%), and Business & Financial (9,500 | 5.2%).
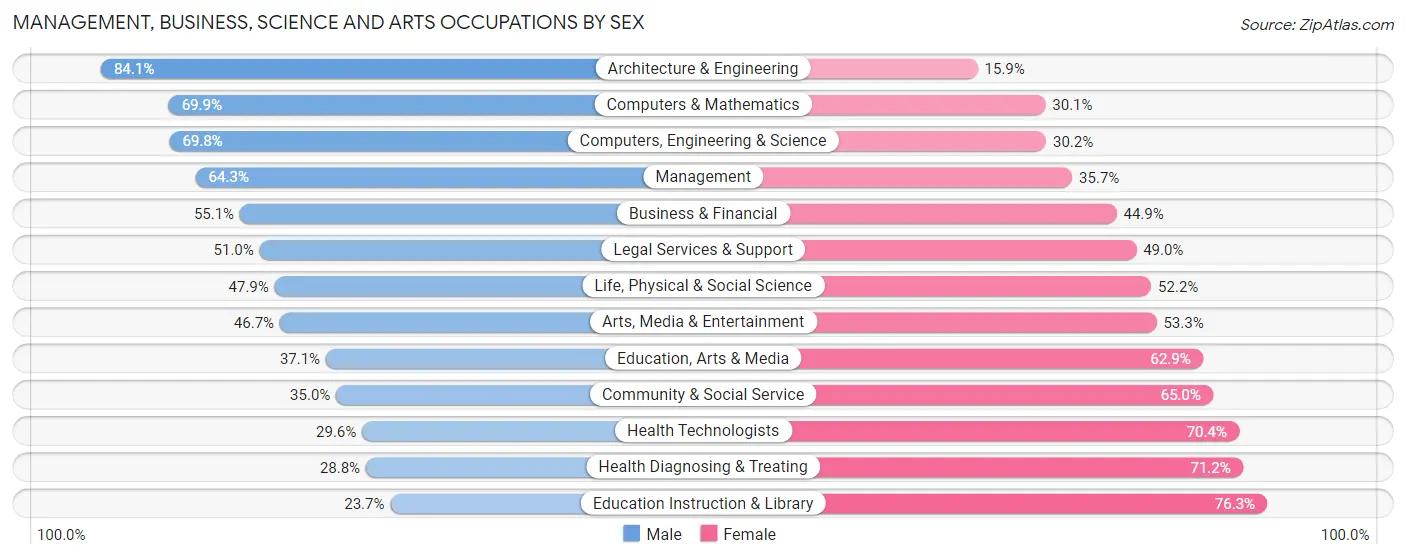
Management, Business, Science and Arts Occupations by Sex
Within the Management, Business, Science and Arts occupations in Sarasota County, the most male-oriented occupations are Architecture & Engineering (84.1%), Computers & Mathematics (69.9%), and Computers, Engineering & Science (69.8%), while the most female-oriented occupations are Education Instruction & Library (76.3%), Health Diagnosing & Treating (71.2%), and Health Technologists (70.4%).
| Occupation | Male | Female |
| Management | 13,790 (64.3%) | 7,648 (35.7%) |
| Business & Financial | 5,233 (55.1%) | 4,267 (44.9%) |
| Computers, Engineering & Science | 4,683 (69.8%) | 2,028 (30.2%) |
| Computers & Mathematics | 2,410 (69.9%) | 1,037 (30.1%) |
| Architecture & Engineering | 1,651 (84.1%) | 313 (15.9%) |
| Life, Physical & Social Science | 622 (47.8%) | 678 (52.1%) |
| Community & Social Service | 6,526 (35.0%) | 12,117 (65.0%) |
| Education, Arts & Media | 989 (37.1%) | 1,674 (62.9%) |
| Legal Services & Support | 1,311 (51.0%) | 1,261 (49.0%) |
| Education Instruction & Library | 2,102 (23.7%) | 6,762 (76.3%) |
| Arts, Media & Entertainment | 2,124 (46.7%) | 2,420 (53.3%) |
| Health Diagnosing & Treating | 3,970 (28.8%) | 9,819 (71.2%) |
| Health Technologists | 2,882 (29.6%) | 6,859 (70.4%) |
| Total (Category) | 34,202 (48.8%) | 35,879 (51.2%) |
| Total (Overall) | 94,615 (51.8%) | 87,870 (48.1%) |
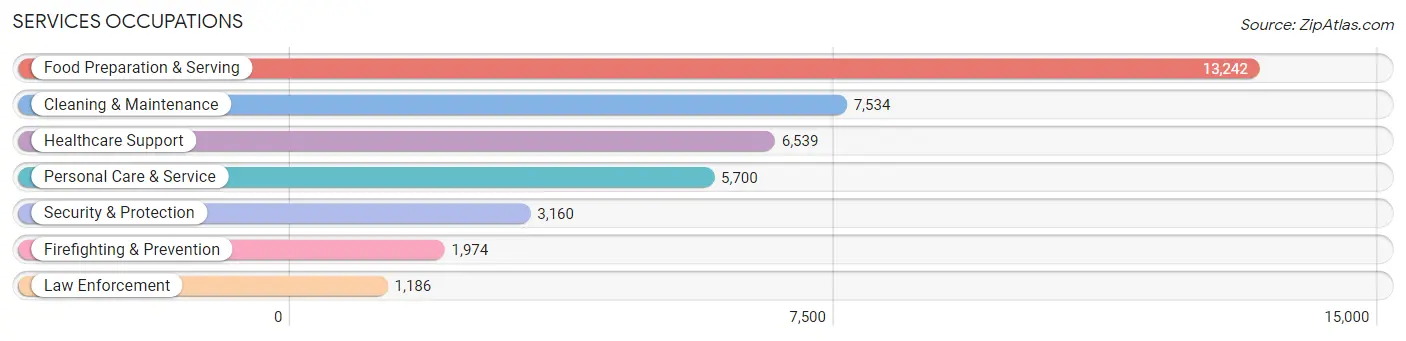
Services Occupations
The most common Services occupations in Sarasota County are Food Preparation & Serving (13,242 | 7.3%), Cleaning & Maintenance (7,534 | 4.1%), Healthcare Support (6,539 | 3.6%), Personal Care & Service (5,700 | 3.1%), and Security & Protection (3,160 | 1.7%).
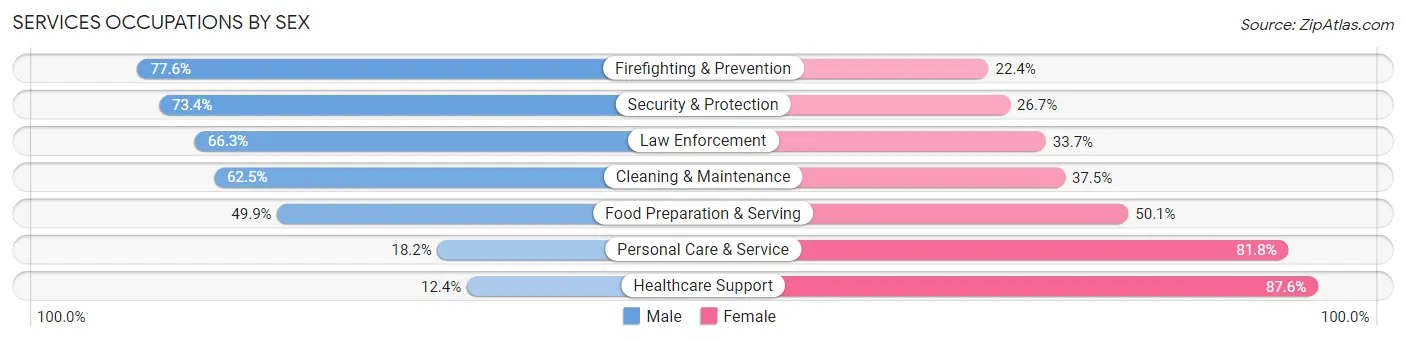
Services Occupations by Sex
Within the Services occupations in Sarasota County, the most male-oriented occupations are Firefighting & Prevention (77.6%), Security & Protection (73.4%), and Law Enforcement (66.3%), while the most female-oriented occupations are Healthcare Support (87.6%), Personal Care & Service (81.8%), and Food Preparation & Serving (50.1%).
| Occupation | Male | Female |
| Healthcare Support | 810 (12.4%) | 5,729 (87.6%) |
| Security & Protection | 2,318 (73.4%) | 842 (26.7%) |
| Firefighting & Prevention | 1,532 (77.6%) | 442 (22.4%) |
| Law Enforcement | 786 (66.3%) | 400 (33.7%) |
| Food Preparation & Serving | 6,613 (49.9%) | 6,629 (50.1%) |
| Cleaning & Maintenance | 4,708 (62.5%) | 2,826 (37.5%) |
| Personal Care & Service | 1,039 (18.2%) | 4,661 (81.8%) |
| Total (Category) | 15,488 (42.8%) | 20,687 (57.2%) |
| Total (Overall) | 94,615 (51.8%) | 87,870 (48.1%) |
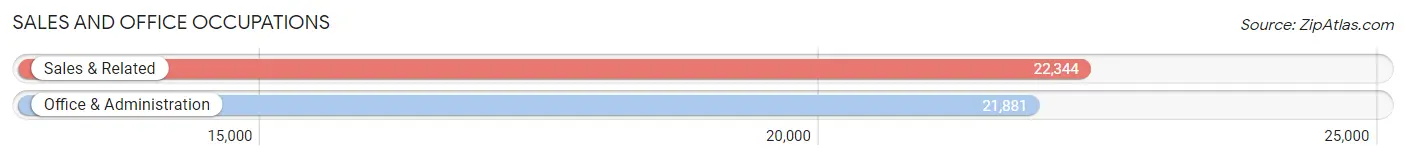
Sales and Office Occupations
The most common Sales and Office occupations in Sarasota County are Sales & Related (22,344 | 12.2%), and Office & Administration (21,881 | 12.0%).
Sales and Office Occupations by Sex
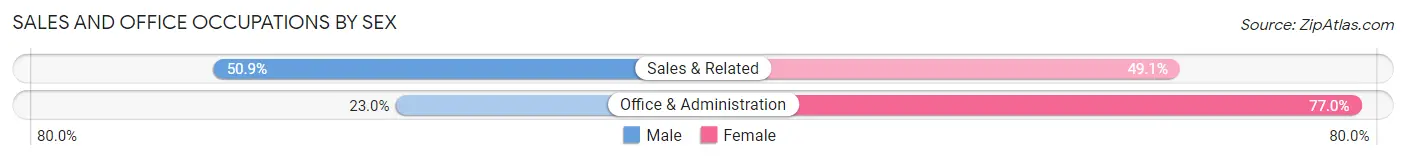
| Occupation | Male | Female |
| Sales & Related | 11,373 (50.9%) | 10,971 (49.1%) |
| Office & Administration | 5,025 (23.0%) | 16,856 (77.0%) |
| Total (Category) | 16,398 (37.1%) | 27,827 (62.9%) |
| Total (Overall) | 94,615 (51.8%) | 87,870 (48.1%) |
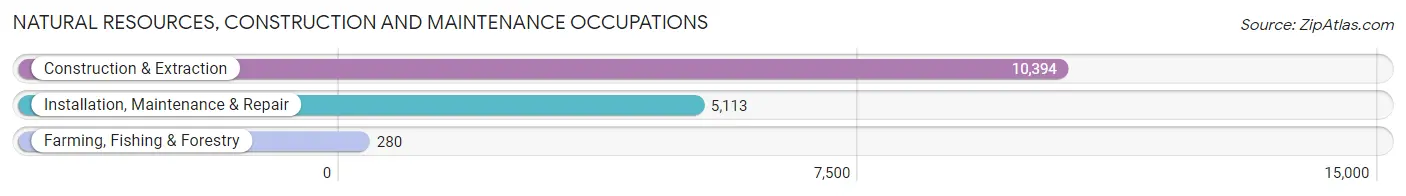
Natural Resources, Construction and Maintenance Occupations
The most common Natural Resources, Construction and Maintenance occupations in Sarasota County are Construction & Extraction (10,394 | 5.7%), Installation, Maintenance & Repair (5,113 | 2.8%), and Farming, Fishing & Forestry (280 | 0.2%).
Natural Resources, Construction and Maintenance Occupations by Sex
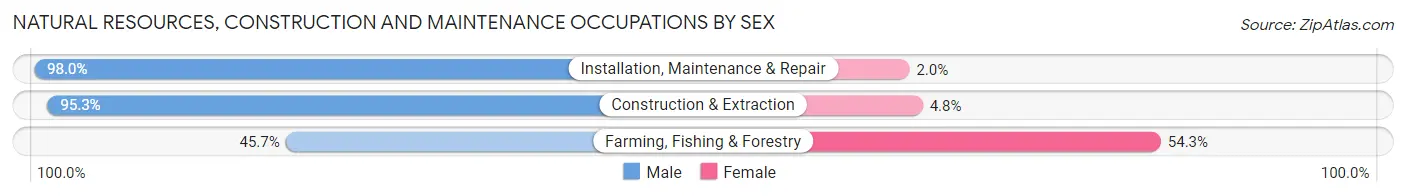
| Occupation | Male | Female |
| Farming, Fishing & Forestry | 128 (45.7%) | 152 (54.3%) |
| Construction & Extraction | 9,900 (95.3%) | 494 (4.8%) |
| Installation, Maintenance & Repair | 5,012 (98.0%) | 101 (2.0%) |
| Total (Category) | 15,040 (95.3%) | 747 (4.7%) |
| Total (Overall) | 94,615 (51.8%) | 87,870 (48.1%) |
Production, Transportation and Moving Occupations
The most common Production, Transportation and Moving occupations in Sarasota County are Production (6,314 | 3.5%), Transportation (5,483 | 3.0%), and Material Moving (4,420 | 2.4%).
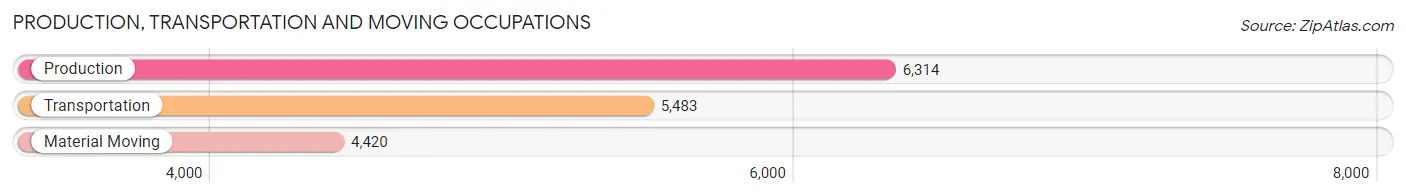
Production, Transportation and Moving Occupations by Sex
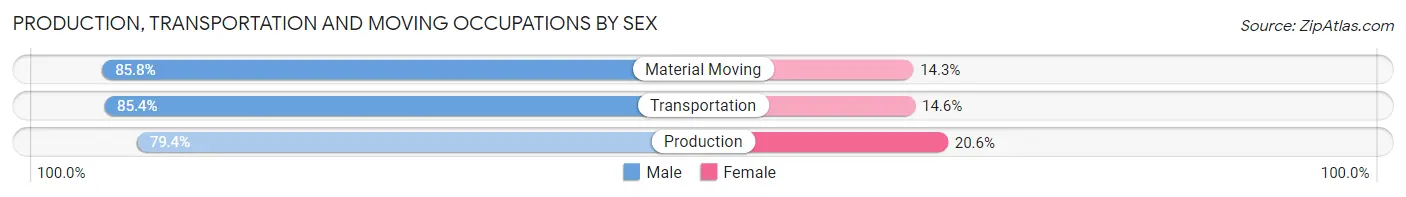
| Occupation | Male | Female |
| Production | 5,014 (79.4%) | 1,300 (20.6%) |
| Transportation | 4,683 (85.4%) | 800 (14.6%) |
| Material Moving | 3,790 (85.8%) | 630 (14.2%) |
| Total (Category) | 13,487 (83.2%) | 2,730 (16.8%) |
| Total (Overall) | 94,615 (51.8%) | 87,870 (48.1%) |
Employment Industries by Sex in Sarasota County
Employment Industries in Sarasota County
The major employment industries in Sarasota County include Health Care & Social Assistance (27,575 | 15.1%), Retail Trade (23,335 | 12.8%), Construction (16,918 | 9.3%), Accommodation & Food Services (15,581 | 8.5%), and Professional & Scientific (14,848 | 8.1%).
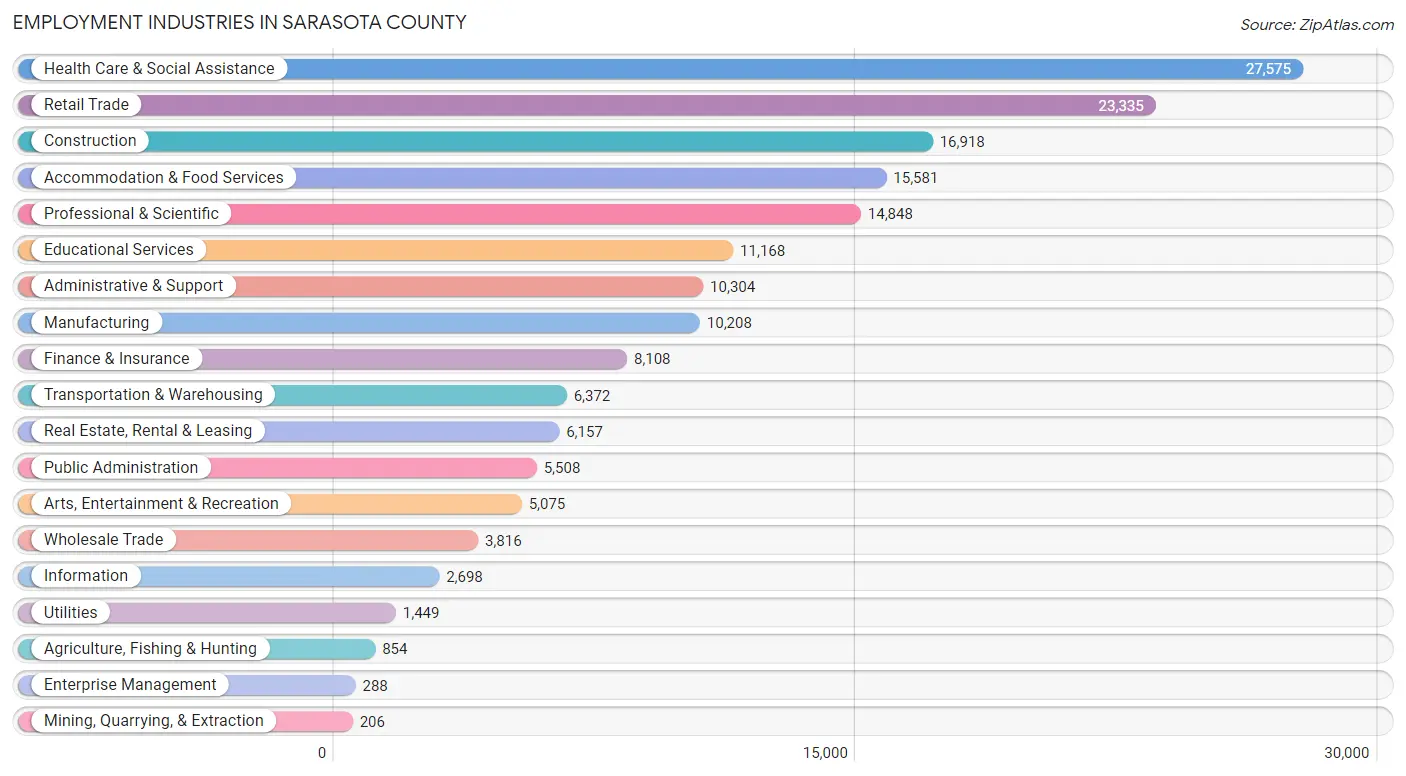
Employment Industries by Sex in Sarasota County
The Sarasota County industries that see more men than women are Mining, Quarrying, & Extraction (100.0%), Construction (84.8%), and Transportation & Warehousing (77.4%), whereas the industries that tend to have a higher number of women are Health Care & Social Assistance (77.4%), Educational Services (70.4%), and Accommodation & Food Services (51.2%).
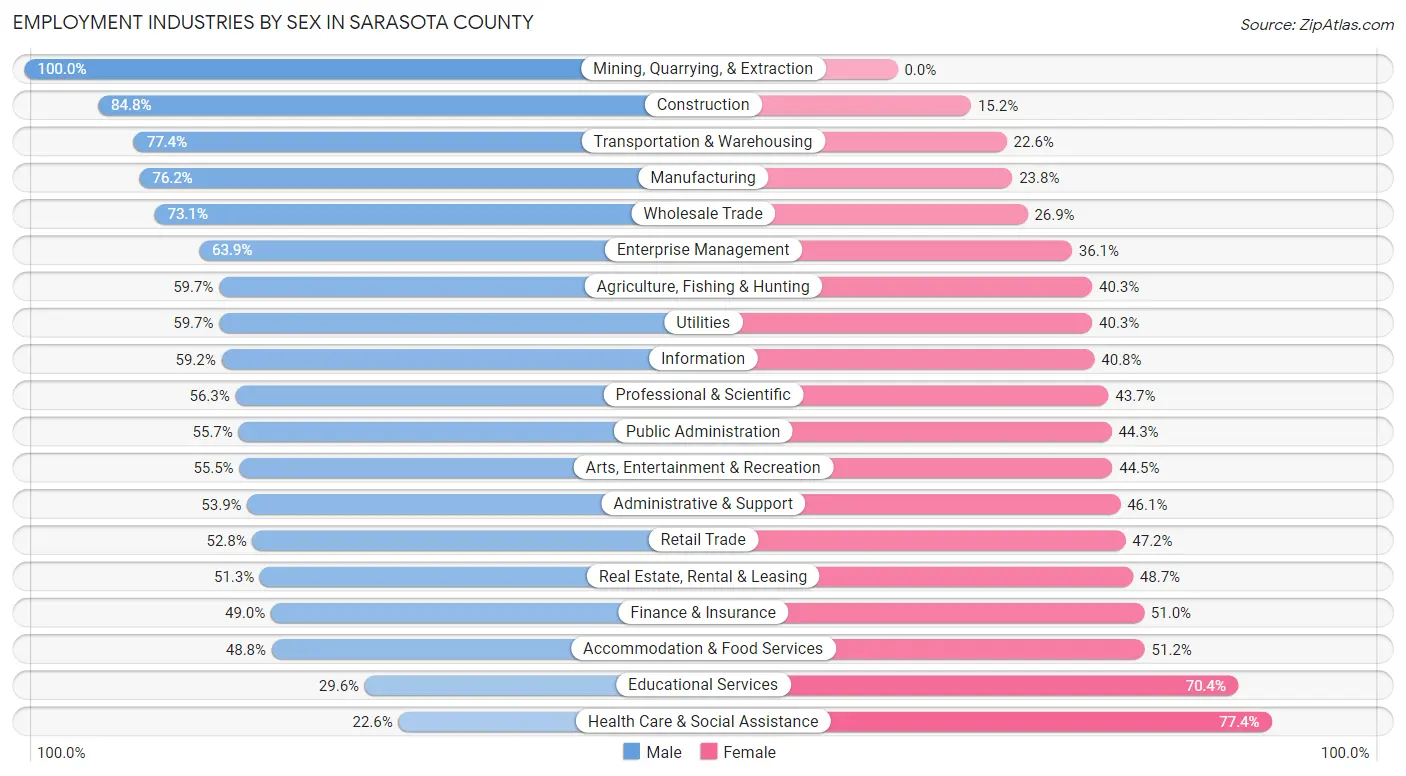
| Industry | Male | Female |
| Agriculture, Fishing & Hunting | 510 (59.7%) | 344 (40.3%) |
| Mining, Quarrying, & Extraction | 206 (100.0%) | 0 (0.0%) |
| Construction | 14,342 (84.8%) | 2,576 (15.2%) |
| Manufacturing | 7,782 (76.2%) | 2,426 (23.8%) |
| Wholesale Trade | 2,789 (73.1%) | 1,027 (26.9%) |
| Retail Trade | 12,325 (52.8%) | 11,010 (47.2%) |
| Transportation & Warehousing | 4,931 (77.4%) | 1,441 (22.6%) |
| Utilities | 865 (59.7%) | 584 (40.3%) |
| Information | 1,598 (59.2%) | 1,100 (40.8%) |
| Finance & Insurance | 3,971 (49.0%) | 4,137 (51.0%) |
| Real Estate, Rental & Leasing | 3,156 (51.3%) | 3,001 (48.7%) |
| Professional & Scientific | 8,365 (56.3%) | 6,483 (43.7%) |
| Enterprise Management | 184 (63.9%) | 104 (36.1%) |
| Administrative & Support | 5,552 (53.9%) | 4,752 (46.1%) |
| Educational Services | 3,301 (29.6%) | 7,867 (70.4%) |
| Health Care & Social Assistance | 6,232 (22.6%) | 21,343 (77.4%) |
| Arts, Entertainment & Recreation | 2,818 (55.5%) | 2,257 (44.5%) |
| Accommodation & Food Services | 7,606 (48.8%) | 7,975 (51.2%) |
| Public Administration | 3,068 (55.7%) | 2,440 (44.3%) |
| Total | 94,615 (51.8%) | 87,870 (48.1%) |
Education in Sarasota County
School Enrollment in Sarasota County
The most common levels of schooling among the 66,382 students in Sarasota County are high school (15,812 | 23.8%), middle school (15,238 | 23.0%), and college / undergraduate (13,975 | 21.0%).
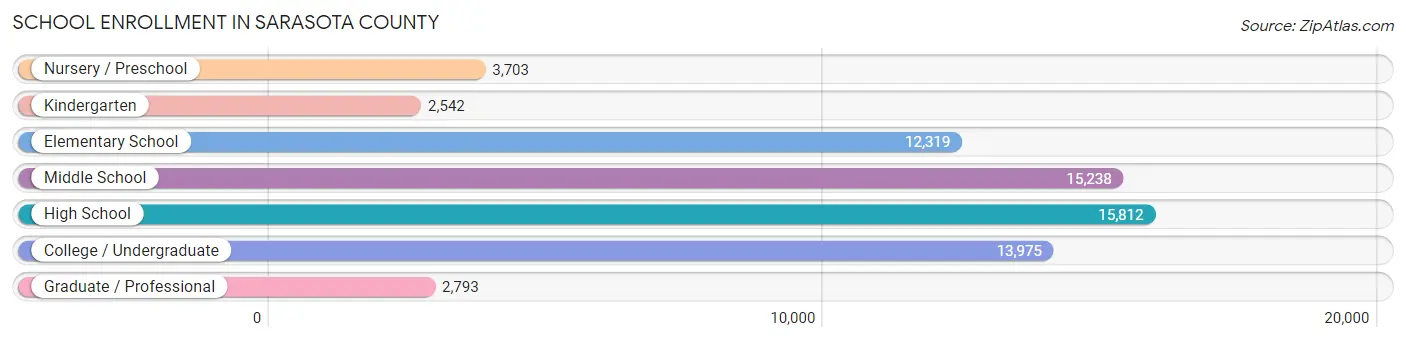
| School Level | # Students | % Students |
| Nursery / Preschool | 3,703 | 5.6% |
| Kindergarten | 2,542 | 3.8% |
| Elementary School | 12,319 | 18.6% |
| Middle School | 15,238 | 23.0% |
| High School | 15,812 | 23.8% |
| College / Undergraduate | 13,975 | 21.0% |
| Graduate / Professional | 2,793 | 4.2% |
| Total | 66,382 | 100.0% |
School Enrollment by Age by Funding Source in Sarasota County
Out of a total of 66,382 students who are enrolled in schools in Sarasota County, 11,617 (17.5%) attend a private institution, while the remaining 54,765 (82.5%) are enrolled in public schools. The age group of 3 to 4 year olds has the highest likelihood of being enrolled in private schools, with 1,354 (56.9% in the age bracket) enrolled. Conversely, the age group of 15 to 17 year olds has the lowest likelihood of being enrolled in a private school, with 10,091 (87.2% in the age bracket) attending a public institution.
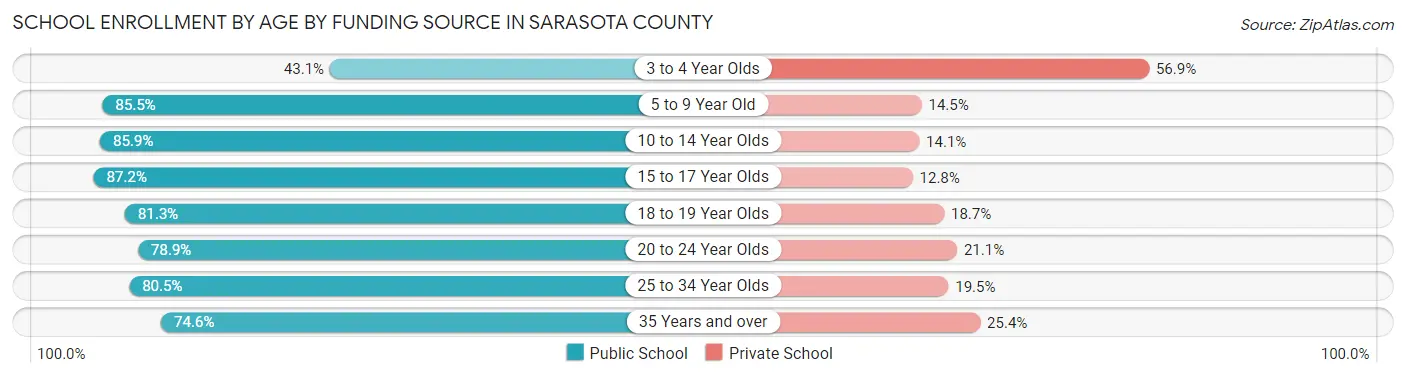
| Age Bracket | Public School | Private School |
| 3 to 4 Year Olds | 1,027 (43.1%) | 1,354 (56.9%) |
| 5 to 9 Year Old | 12,198 (85.5%) | 2,069 (14.5%) |
| 10 to 14 Year Olds | 16,267 (85.9%) | 2,661 (14.1%) |
| 15 to 17 Year Olds | 10,091 (87.2%) | 1,486 (12.8%) |
| 18 to 19 Year Olds | 3,889 (81.3%) | 894 (18.7%) |
| 20 to 24 Year Olds | 5,024 (78.9%) | 1,344 (21.1%) |
| 25 to 34 Year Olds | 3,004 (80.5%) | 727 (19.5%) |
| 35 Years and over | 3,242 (74.6%) | 1,105 (25.4%) |
| Total | 54,765 (82.5%) | 11,617 (17.5%) |
Educational Attainment by Field of Study in Sarasota County
Business (31,188 | 21.4%), education (22,469 | 15.4%), science & technology (15,098 | 10.4%), social sciences (12,120 | 8.3%), and engineering (9,522 | 6.5%) are the most common fields of study among 145,724 individuals in Sarasota County who have obtained a bachelor's degree or higher.
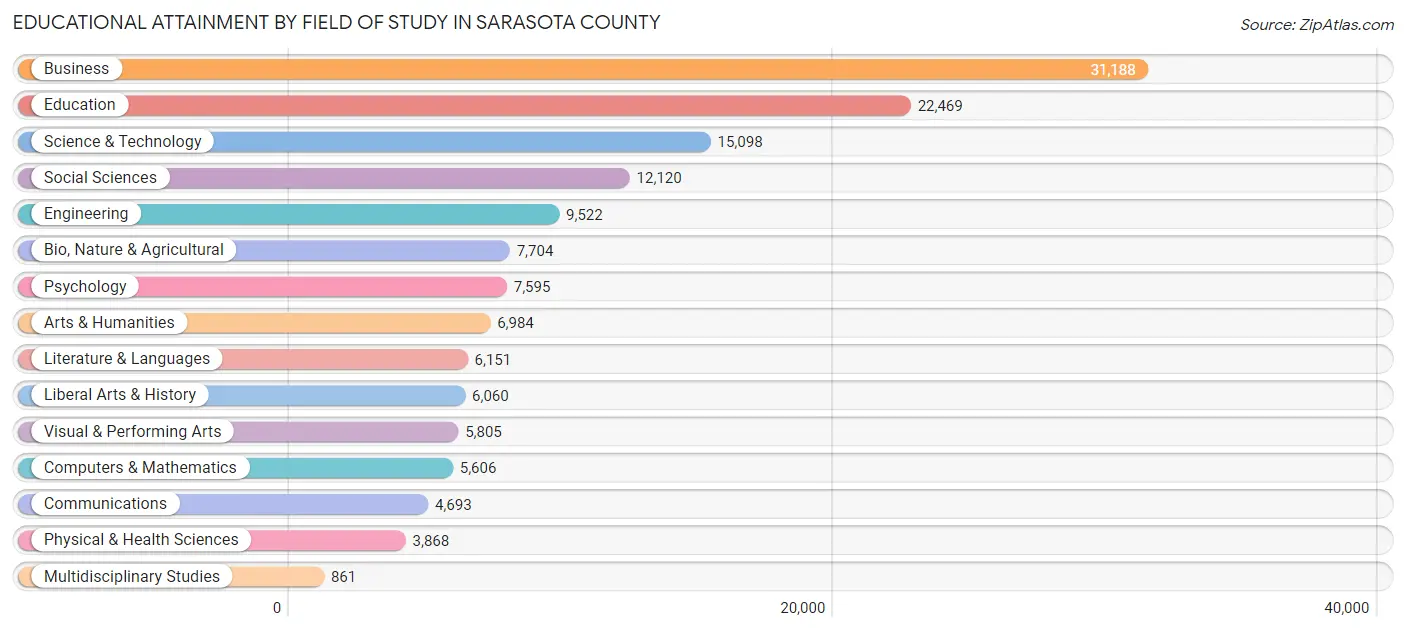
| Field of Study | # Graduates | % Graduates |
| Computers & Mathematics | 5,606 | 3.8% |
| Bio, Nature & Agricultural | 7,704 | 5.3% |
| Physical & Health Sciences | 3,868 | 2.6% |
| Psychology | 7,595 | 5.2% |
| Social Sciences | 12,120 | 8.3% |
| Engineering | 9,522 | 6.5% |
| Multidisciplinary Studies | 861 | 0.6% |
| Science & Technology | 15,098 | 10.4% |
| Business | 31,188 | 21.4% |
| Education | 22,469 | 15.4% |
| Literature & Languages | 6,151 | 4.2% |
| Liberal Arts & History | 6,060 | 4.2% |
| Visual & Performing Arts | 5,805 | 4.0% |
| Communications | 4,693 | 3.2% |
| Arts & Humanities | 6,984 | 4.8% |
| Total | 145,724 | 100.0% |
Transportation & Commute in Sarasota County
Vehicle Availability by Sex in Sarasota County
The most prevalent vehicle ownership categories in Sarasota County are males with 2 vehicles (44,145, accounting for 47.8%) and females with 2 vehicles (38,469, making up 51.5%).
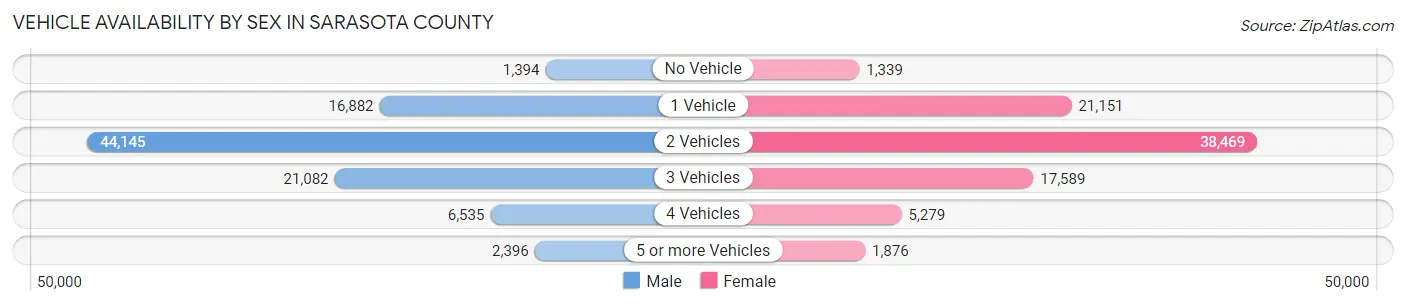
| Vehicles Available | Male | Female |
| No Vehicle | 1,394 (1.5%) | 1,339 (1.6%) |
| 1 Vehicle | 16,882 (18.3%) | 21,151 (24.7%) |
| 2 Vehicles | 44,145 (47.8%) | 38,469 (44.9%) |
| 3 Vehicles | 21,082 (22.8%) | 17,589 (20.5%) |
| 4 Vehicles | 6,535 (7.1%) | 5,279 (6.2%) |
| 5 or more Vehicles | 2,396 (2.6%) | 1,876 (2.2%) |
| Total | 92,434 (100.0%) | 85,703 (100.0%) |
Commute Time in Sarasota County
The most frequently occuring commute durations in Sarasota County are 20 to 24 minutes (34,316 commuters, 22.3%), 30 to 34 minutes (28,202 commuters, 18.4%), and 15 to 19 minutes (23,434 commuters, 15.3%).
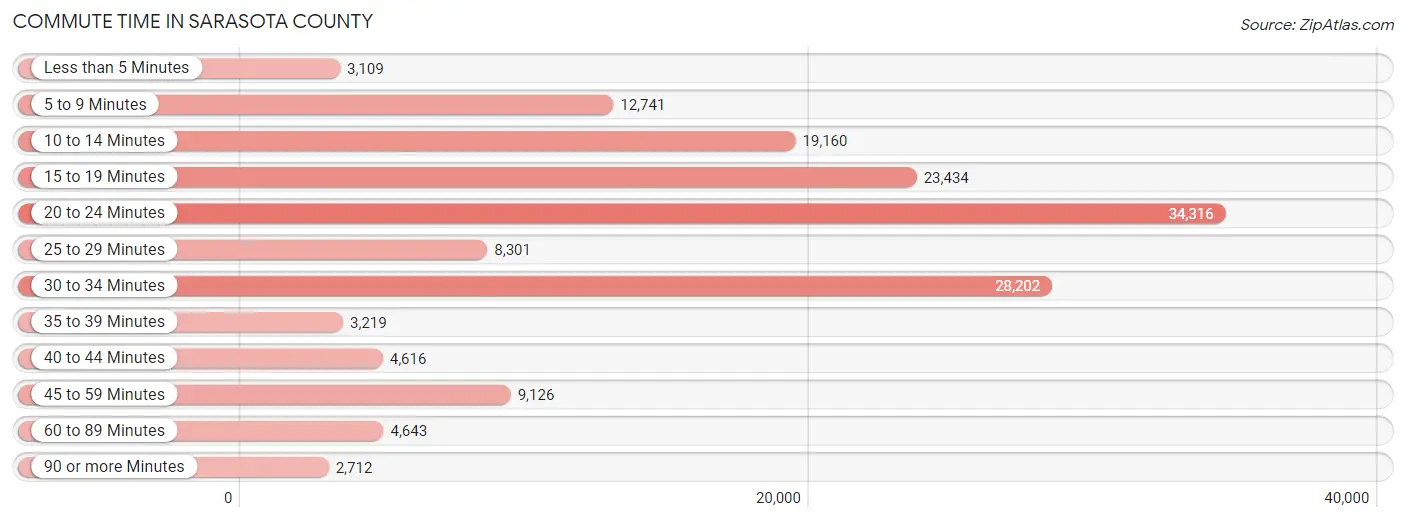
| Commute Time | # Commuters | % Commuters |
| Less than 5 Minutes | 3,109 | 2.0% |
| 5 to 9 Minutes | 12,741 | 8.3% |
| 10 to 14 Minutes | 19,160 | 12.5% |
| 15 to 19 Minutes | 23,434 | 15.3% |
| 20 to 24 Minutes | 34,316 | 22.3% |
| 25 to 29 Minutes | 8,301 | 5.4% |
| 30 to 34 Minutes | 28,202 | 18.4% |
| 35 to 39 Minutes | 3,219 | 2.1% |
| 40 to 44 Minutes | 4,616 | 3.0% |
| 45 to 59 Minutes | 9,126 | 5.9% |
| 60 to 89 Minutes | 4,643 | 3.0% |
| 90 or more Minutes | 2,712 | 1.8% |
Commute Time by Sex in Sarasota County
The most common commute times in Sarasota County are 20 to 24 minutes (16,770 commuters, 21.2%) for males and 20 to 24 minutes (17,546 commuters, 23.6%) for females.
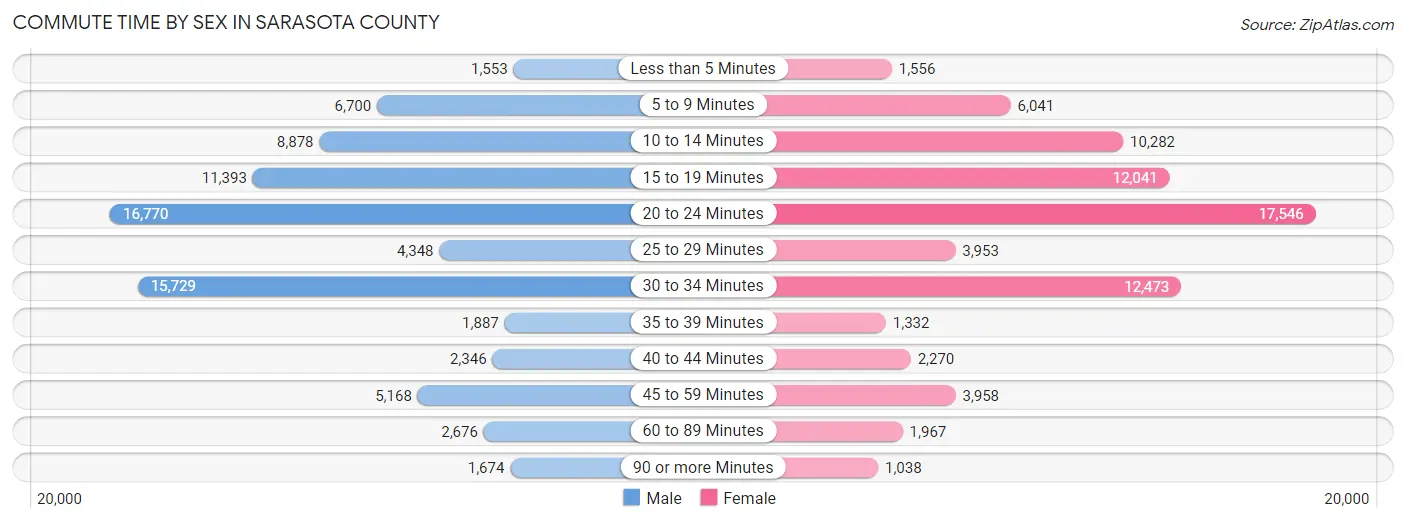
| Commute Time | Male | Female |
| Less than 5 Minutes | 1,553 (2.0%) | 1,556 (2.1%) |
| 5 to 9 Minutes | 6,700 (8.5%) | 6,041 (8.1%) |
| 10 to 14 Minutes | 8,878 (11.2%) | 10,282 (13.8%) |
| 15 to 19 Minutes | 11,393 (14.4%) | 12,041 (16.2%) |
| 20 to 24 Minutes | 16,770 (21.2%) | 17,546 (23.6%) |
| 25 to 29 Minutes | 4,348 (5.5%) | 3,953 (5.3%) |
| 30 to 34 Minutes | 15,729 (19.9%) | 12,473 (16.8%) |
| 35 to 39 Minutes | 1,887 (2.4%) | 1,332 (1.8%) |
| 40 to 44 Minutes | 2,346 (3.0%) | 2,270 (3.0%) |
| 45 to 59 Minutes | 5,168 (6.5%) | 3,958 (5.3%) |
| 60 to 89 Minutes | 2,676 (3.4%) | 1,967 (2.6%) |
| 90 or more Minutes | 1,674 (2.1%) | 1,038 (1.4%) |
Time of Departure to Work by Sex in Sarasota County
The most frequent times of departure to work in Sarasota County are 7:00 AM to 7:29 AM (12,166, 15.4%) for males and 8:00 AM to 8:29 AM (11,080, 14.9%) for females.
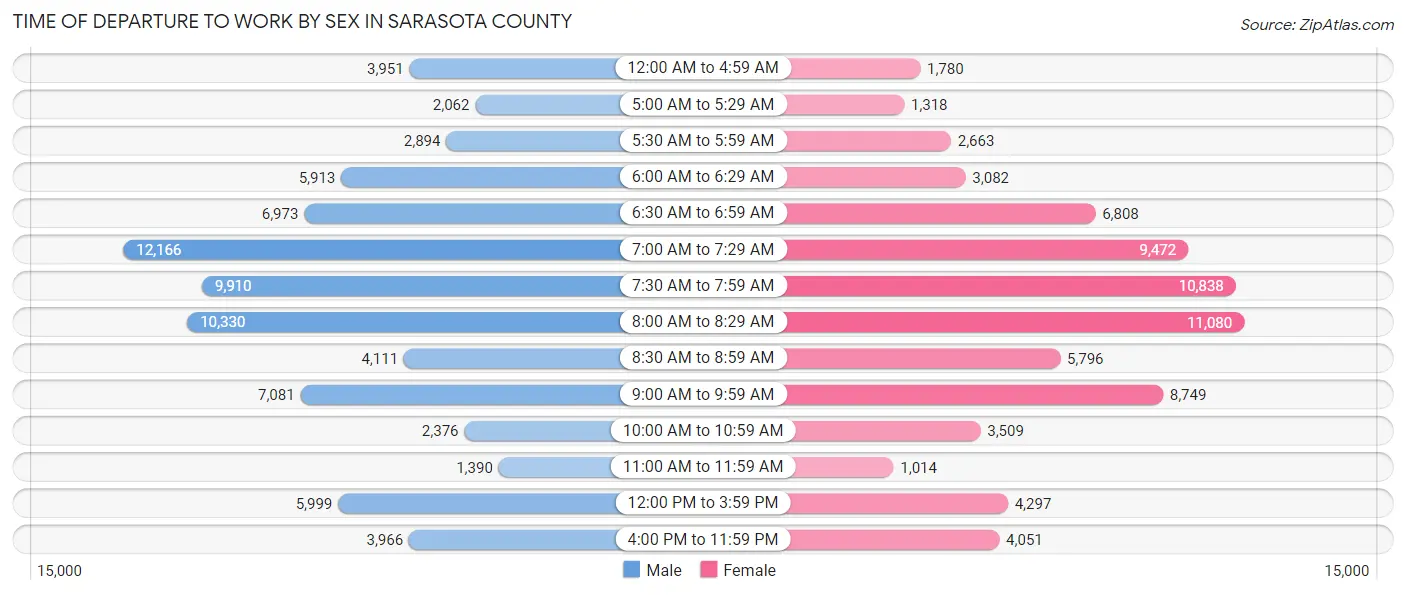
| Time of Departure | Male | Female |
| 12:00 AM to 4:59 AM | 3,951 (5.0%) | 1,780 (2.4%) |
| 5:00 AM to 5:29 AM | 2,062 (2.6%) | 1,318 (1.8%) |
| 5:30 AM to 5:59 AM | 2,894 (3.7%) | 2,663 (3.6%) |
| 6:00 AM to 6:29 AM | 5,913 (7.5%) | 3,082 (4.1%) |
| 6:30 AM to 6:59 AM | 6,973 (8.8%) | 6,808 (9.1%) |
| 7:00 AM to 7:29 AM | 12,166 (15.4%) | 9,472 (12.7%) |
| 7:30 AM to 7:59 AM | 9,910 (12.5%) | 10,838 (14.6%) |
| 8:00 AM to 8:29 AM | 10,330 (13.1%) | 11,080 (14.9%) |
| 8:30 AM to 8:59 AM | 4,111 (5.2%) | 5,796 (7.8%) |
| 9:00 AM to 9:59 AM | 7,081 (8.9%) | 8,749 (11.7%) |
| 10:00 AM to 10:59 AM | 2,376 (3.0%) | 3,509 (4.7%) |
| 11:00 AM to 11:59 AM | 1,390 (1.8%) | 1,014 (1.4%) |
| 12:00 PM to 3:59 PM | 5,999 (7.6%) | 4,297 (5.8%) |
| 4:00 PM to 11:59 PM | 3,966 (5.0%) | 4,051 (5.4%) |
| Total | 79,122 (100.0%) | 74,457 (100.0%) |
Housing Occupancy in Sarasota County
Occupancy by Ownership in Sarasota County
Of the total 199,345 dwellings in Sarasota County, owner-occupied units account for 151,538 (76.0%), while renter-occupied units make up 47,807 (24.0%).
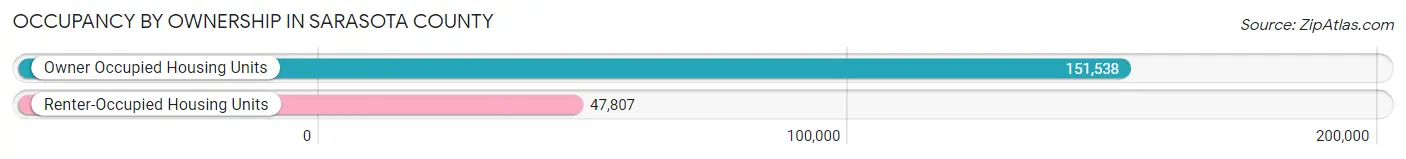
| Occupancy | # Housing Units | % Housing Units |
| Owner Occupied Housing Units | 151,538 | 76.0% |
| Renter-Occupied Housing Units | 47,807 | 24.0% |
| Total Occupied Housing Units | 199,345 | 100.0% |
Occupancy by Household Size in Sarasota County
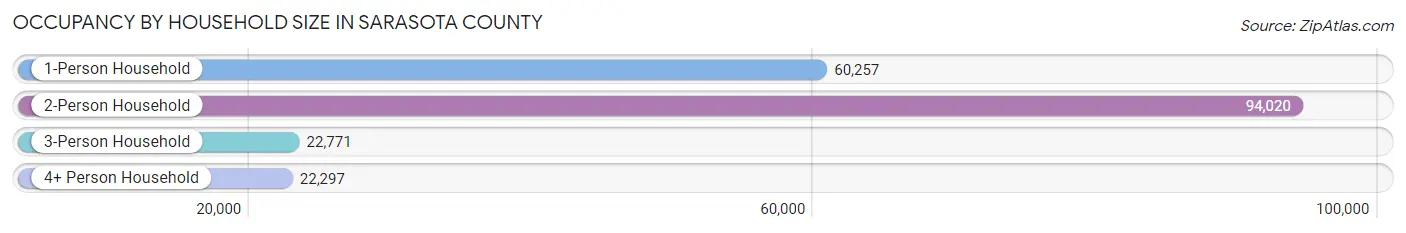
| Household Size | # Housing Units | % Housing Units |
| 1-Person Household | 60,257 | 30.2% |
| 2-Person Household | 94,020 | 47.2% |
| 3-Person Household | 22,771 | 11.4% |
| 4+ Person Household | 22,297 | 11.2% |
| Total Housing Units | 199,345 | 100.0% |
Occupancy by Ownership by Household Size in Sarasota County
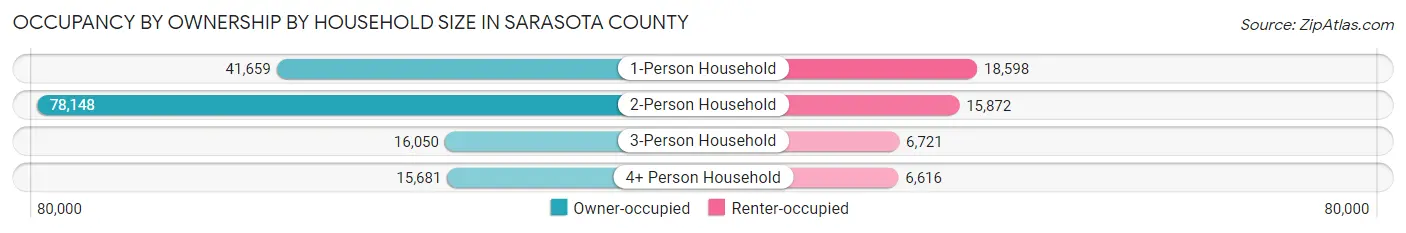
| Household Size | Owner-occupied | Renter-occupied |
| 1-Person Household | 41,659 (69.1%) | 18,598 (30.9%) |
| 2-Person Household | 78,148 (83.1%) | 15,872 (16.9%) |
| 3-Person Household | 16,050 (70.5%) | 6,721 (29.5%) |
| 4+ Person Household | 15,681 (70.3%) | 6,616 (29.7%) |
| Total Housing Units | 151,538 (76.0%) | 47,807 (24.0%) |
Occupancy by Educational Attainment in Sarasota County
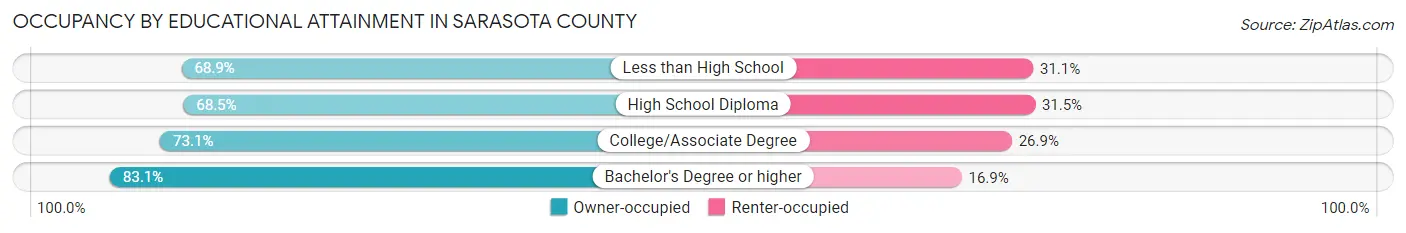
| Household Size | Owner-occupied | Renter-occupied |
| Less than High School | 6,424 (68.9%) | 2,899 (31.1%) |
| High School Diploma | 31,006 (68.5%) | 14,242 (31.5%) |
| College/Associate Degree | 45,308 (73.1%) | 16,652 (26.9%) |
| Bachelor's Degree or higher | 68,800 (83.1%) | 14,014 (16.9%) |
Occupancy by Age of Householder in Sarasota County
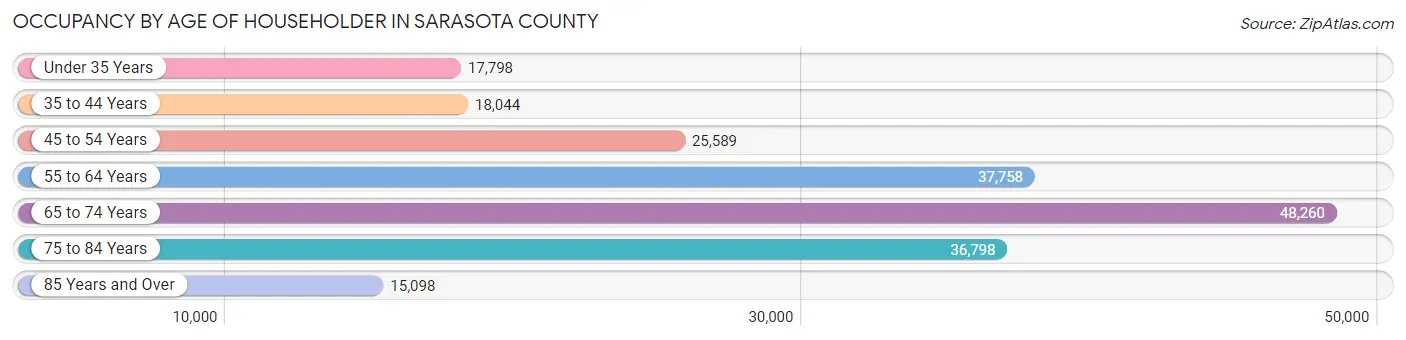
| Age Bracket | # Households | % Households |
| Under 35 Years | 17,798 | 8.9% |
| 35 to 44 Years | 18,044 | 9.0% |
| 45 to 54 Years | 25,589 | 12.8% |
| 55 to 64 Years | 37,758 | 18.9% |
| 65 to 74 Years | 48,260 | 24.2% |
| 75 to 84 Years | 36,798 | 18.5% |
| 85 Years and Over | 15,098 | 7.6% |
| Total | 199,345 | 100.0% |
Housing Finances in Sarasota County
Median Income by Occupancy in Sarasota County
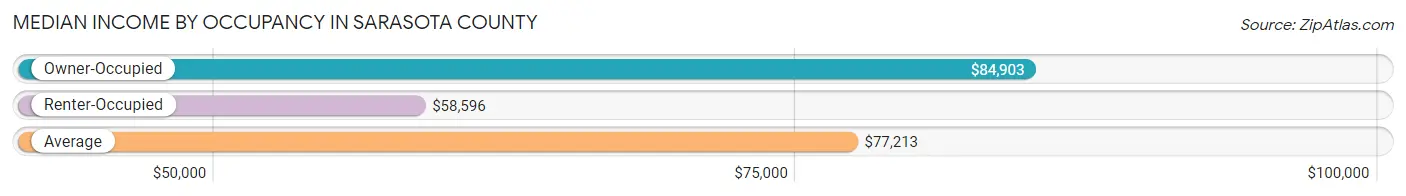
| Occupancy Type | # Households | Median Income |
| Owner-Occupied | 151,538 (76.0%) | $84,903 |
| Renter-Occupied | 47,807 (24.0%) | $58,596 |
| Average | 199,345 (100.0%) | $77,213 |
Occupancy by Householder Income Bracket in Sarasota County
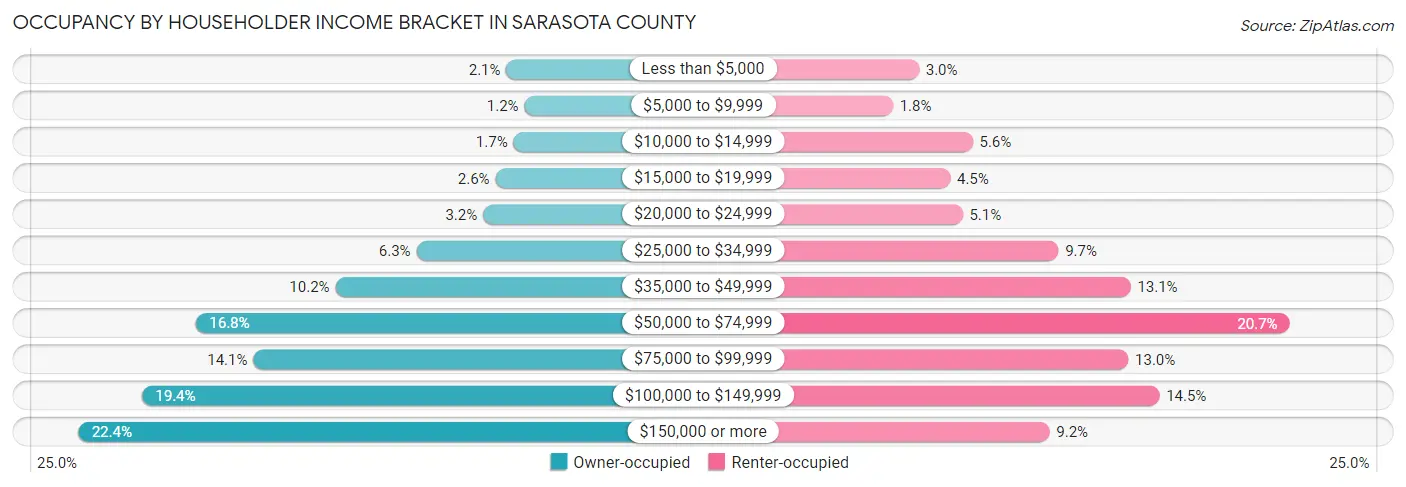
| Income Bracket | Owner-occupied | Renter-occupied |
| Less than $5,000 | 3,121 (2.1%) | 1,437 (3.0%) |
| $5,000 to $9,999 | 1,820 (1.2%) | 844 (1.8%) |
| $10,000 to $14,999 | 2,601 (1.7%) | 2,661 (5.6%) |
| $15,000 to $19,999 | 3,914 (2.6%) | 2,152 (4.5%) |
| $20,000 to $24,999 | 4,801 (3.2%) | 2,432 (5.1%) |
| $25,000 to $34,999 | 9,606 (6.3%) | 4,614 (9.7%) |
| $35,000 to $49,999 | 15,453 (10.2%) | 6,260 (13.1%) |
| $50,000 to $74,999 | 25,490 (16.8%) | 9,876 (20.7%) |
| $75,000 to $99,999 | 21,376 (14.1%) | 6,206 (13.0%) |
| $100,000 to $149,999 | 29,380 (19.4%) | 6,914 (14.5%) |
| $150,000 or more | 33,976 (22.4%) | 4,411 (9.2%) |
| Total | 151,538 (100.0%) | 47,807 (100.0%) |
Monthly Housing Cost Tiers in Sarasota County
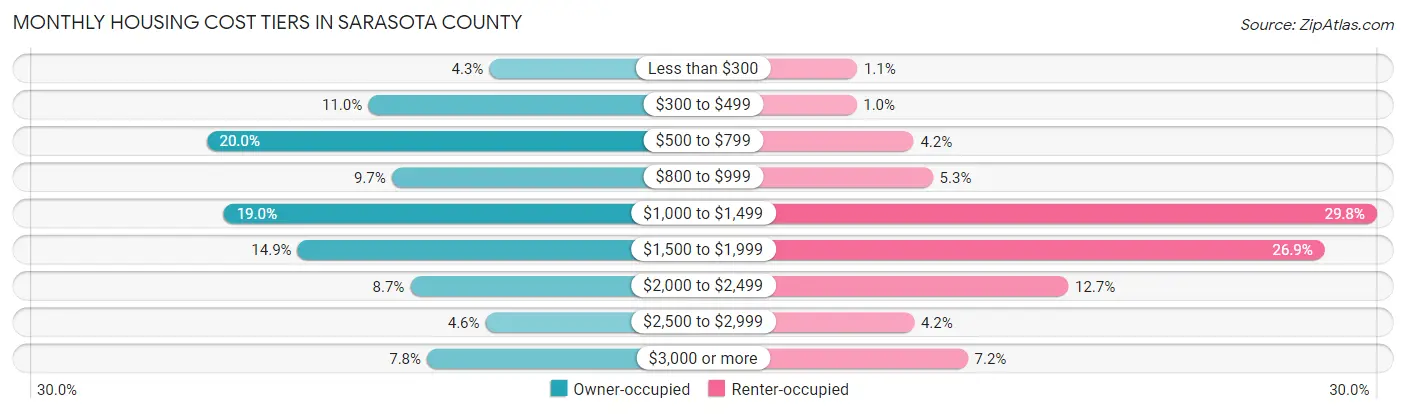
| Monthly Cost | Owner-occupied | Renter-occupied |
| Less than $300 | 6,582 (4.3%) | 517 (1.1%) |
| $300 to $499 | 16,720 (11.0%) | 499 (1.0%) |
| $500 to $799 | 30,227 (20.0%) | 2,008 (4.2%) |
| $800 to $999 | 14,738 (9.7%) | 2,516 (5.3%) |
| $1,000 to $1,499 | 28,785 (19.0%) | 14,243 (29.8%) |
| $1,500 to $1,999 | 22,621 (14.9%) | 12,863 (26.9%) |
| $2,000 to $2,499 | 13,181 (8.7%) | 6,090 (12.7%) |
| $2,500 to $2,999 | 6,889 (4.5%) | 2,020 (4.2%) |
| $3,000 or more | 11,795 (7.8%) | 3,436 (7.2%) |
| Total | 151,538 (100.0%) | 47,807 (100.0%) |
Physical Housing Characteristics in Sarasota County
Housing Structures in Sarasota County
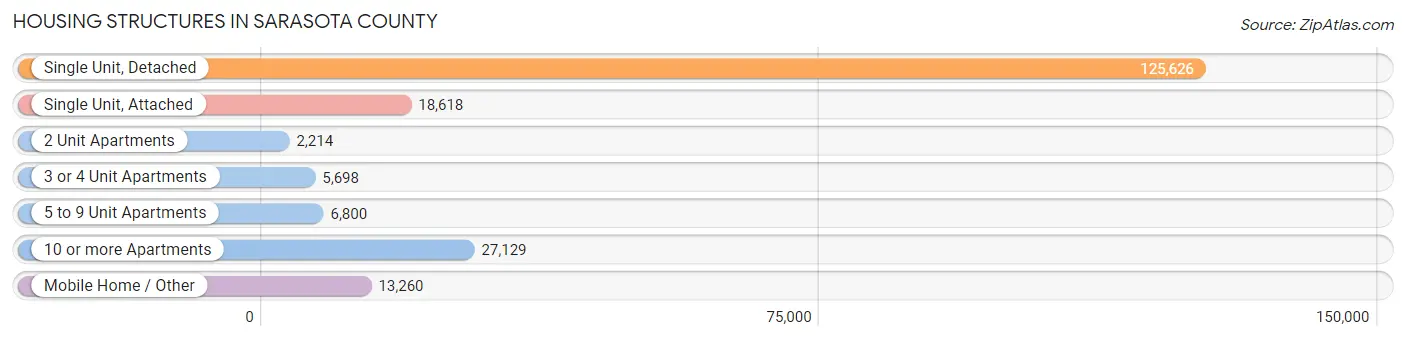
| Structure Type | # Housing Units | % Housing Units |
| Single Unit, Detached | 125,626 | 63.0% |
| Single Unit, Attached | 18,618 | 9.3% |
| 2 Unit Apartments | 2,214 | 1.1% |
| 3 or 4 Unit Apartments | 5,698 | 2.9% |
| 5 to 9 Unit Apartments | 6,800 | 3.4% |
| 10 or more Apartments | 27,129 | 13.6% |
| Mobile Home / Other | 13,260 | 6.7% |
| Total | 199,345 | 100.0% |
Housing Structures by Occupancy in Sarasota County
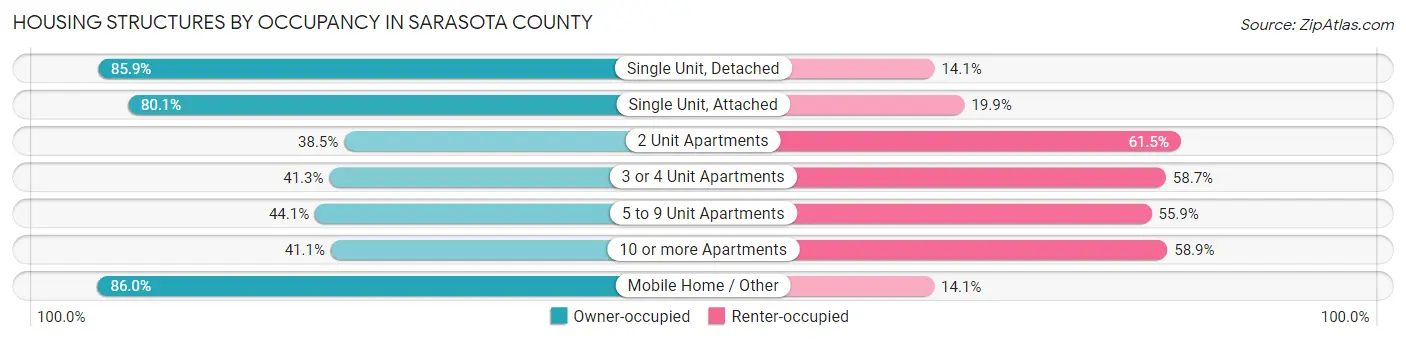
| Structure Type | Owner-occupied | Renter-occupied |
| Single Unit, Detached | 107,883 (85.9%) | 17,743 (14.1%) |
| Single Unit, Attached | 14,914 (80.1%) | 3,704 (19.9%) |
| 2 Unit Apartments | 852 (38.5%) | 1,362 (61.5%) |
| 3 or 4 Unit Apartments | 2,355 (41.3%) | 3,343 (58.7%) |
| 5 to 9 Unit Apartments | 2,998 (44.1%) | 3,802 (55.9%) |
| 10 or more Apartments | 11,139 (41.1%) | 15,990 (58.9%) |
| Mobile Home / Other | 11,397 (86.0%) | 1,863 (14.1%) |
| Total | 151,538 (76.0%) | 47,807 (24.0%) |
Housing Structures by Number of Rooms in Sarasota County
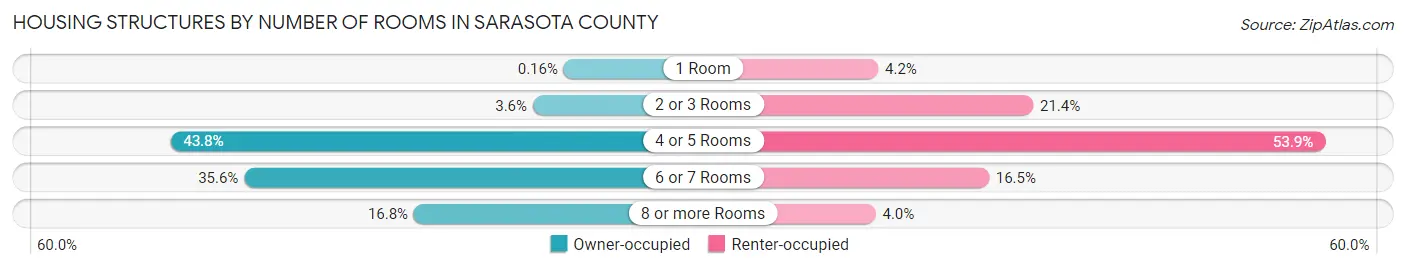
| Number of Rooms | Owner-occupied | Renter-occupied |
| 1 Room | 242 (0.2%) | 2,029 (4.2%) |
| 2 or 3 Rooms | 5,434 (3.6%) | 10,247 (21.4%) |
| 4 or 5 Rooms | 66,419 (43.8%) | 25,745 (53.8%) |
| 6 or 7 Rooms | 53,998 (35.6%) | 7,900 (16.5%) |
| 8 or more Rooms | 25,445 (16.8%) | 1,886 (4.0%) |
| Total | 151,538 (100.0%) | 47,807 (100.0%) |
Housing Structure by Heating Type in Sarasota County
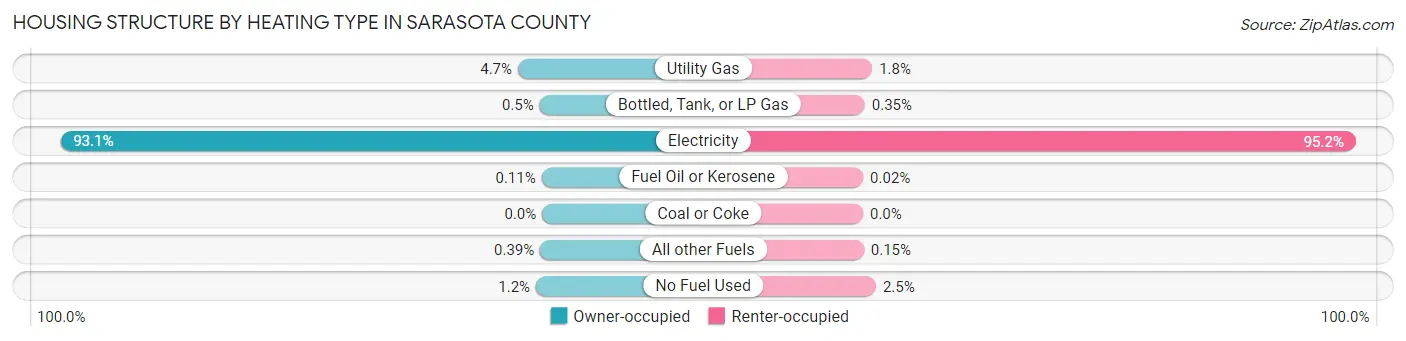
| Heating Type | Owner-occupied | Renter-occupied |
| Utility Gas | 7,091 (4.7%) | 848 (1.8%) |
| Bottled, Tank, or LP Gas | 762 (0.5%) | 168 (0.4%) |
| Electricity | 141,098 (93.1%) | 45,514 (95.2%) |
| Fuel Oil or Kerosene | 164 (0.1%) | 9 (0.0%) |
| Coal or Coke | 0 (0.0%) | 0 (0.0%) |
| All other Fuels | 597 (0.4%) | 71 (0.2%) |
| No Fuel Used | 1,826 (1.2%) | 1,197 (2.5%) |
| Total | 151,538 (100.0%) | 47,807 (100.0%) |
Household Vehicle Usage in Sarasota County
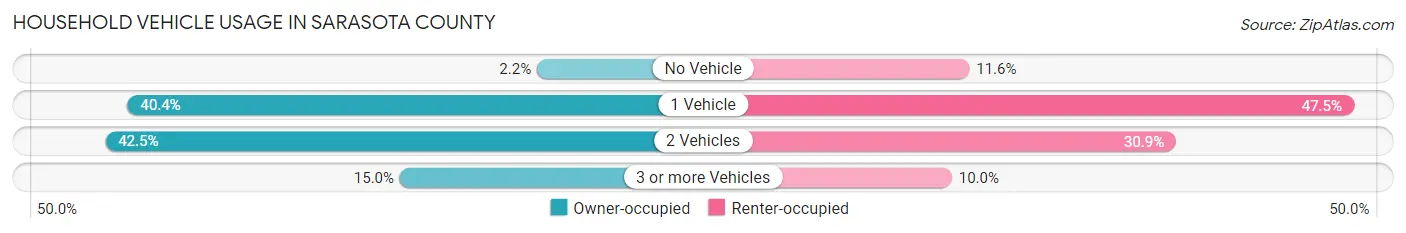
| Vehicles per Household | Owner-occupied | Renter-occupied |
| No Vehicle | 3,285 (2.2%) | 5,552 (11.6%) |
| 1 Vehicle | 61,216 (40.4%) | 22,707 (47.5%) |
| 2 Vehicles | 64,356 (42.5%) | 14,775 (30.9%) |
| 3 or more Vehicles | 22,681 (15.0%) | 4,773 (10.0%) |
| Total | 151,538 (100.0%) | 47,807 (100.0%) |
Real Estate & Mortgages in Sarasota County
Real Estate and Mortgage Overview in Sarasota County
| Characteristic | Without Mortgage | With Mortgage |
| Housing Units | 79,968 | 71,570 |
| Median Property Value | $332,900 | $344,200 |
| Median Household Income | $71,144 | $17,692 |
| Monthly Housing Costs | $674 | $9,940 |
| Real Estate Taxes | $2,657 | $906 |
Property Value by Mortgage Status in Sarasota County
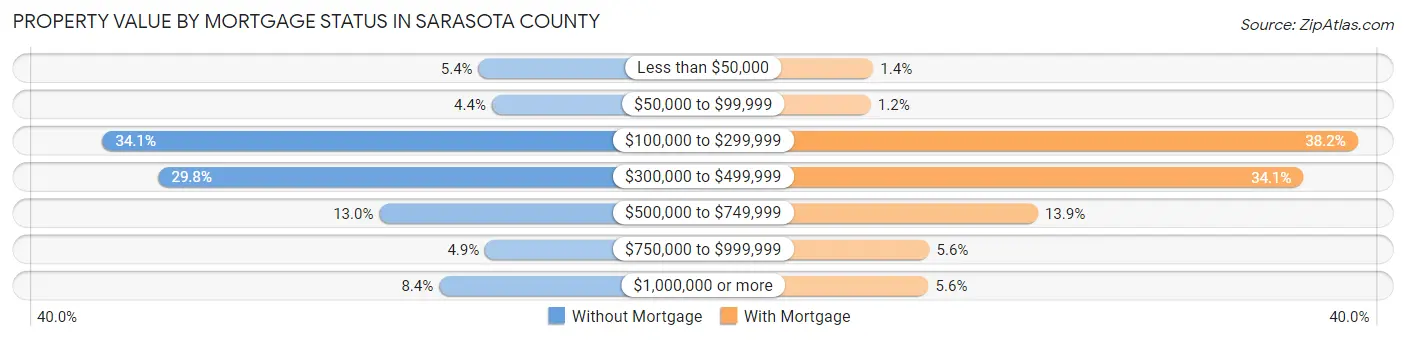
| Property Value | Without Mortgage | With Mortgage |
| Less than $50,000 | 4,334 (5.4%) | 976 (1.4%) |
| $50,000 to $99,999 | 3,527 (4.4%) | 839 (1.2%) |
| $100,000 to $299,999 | 27,235 (34.1%) | 27,367 (38.2%) |
| $300,000 to $499,999 | 23,820 (29.8%) | 24,415 (34.1%) |
| $500,000 to $749,999 | 10,381 (13.0%) | 9,947 (13.9%) |
| $750,000 to $999,999 | 3,937 (4.9%) | 4,038 (5.6%) |
| $1,000,000 or more | 6,734 (8.4%) | 3,988 (5.6%) |
| Total | 79,968 (100.0%) | 71,570 (100.0%) |
Household Income by Mortgage Status in Sarasota County
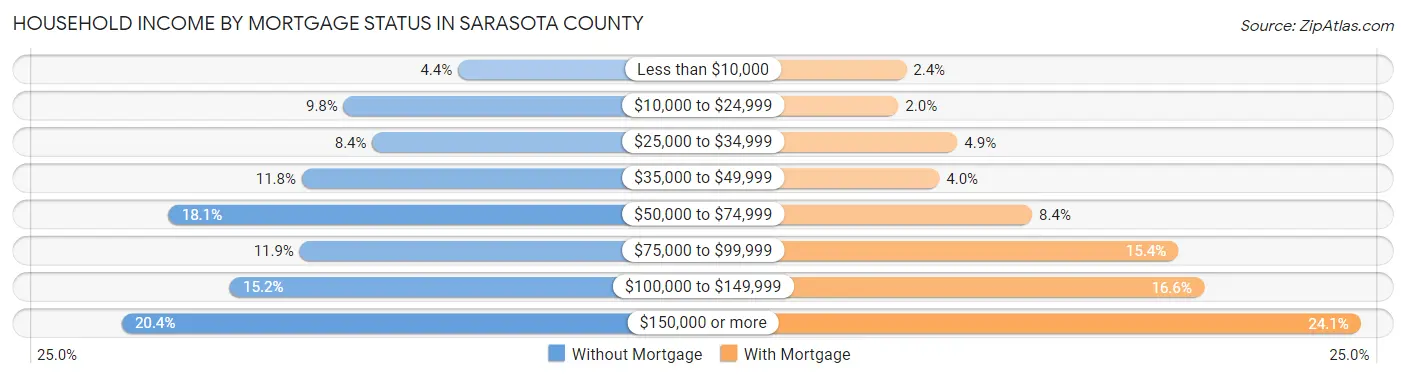
| Household Income | Without Mortgage | With Mortgage |
| Less than $10,000 | 3,483 (4.4%) | 1,730 (2.4%) |
| $10,000 to $24,999 | 7,842 (9.8%) | 1,458 (2.0%) |
| $25,000 to $34,999 | 6,749 (8.4%) | 3,474 (4.9%) |
| $35,000 to $49,999 | 9,434 (11.8%) | 2,857 (4.0%) |
| $50,000 to $74,999 | 14,497 (18.1%) | 6,019 (8.4%) |
| $75,000 to $99,999 | 9,513 (11.9%) | 10,993 (15.4%) |
| $100,000 to $149,999 | 12,166 (15.2%) | 11,863 (16.6%) |
| $150,000 or more | 16,284 (20.4%) | 17,214 (24.0%) |
| Total | 79,968 (100.0%) | 71,570 (100.0%) |
Property Value to Household Income Ratio in Sarasota County
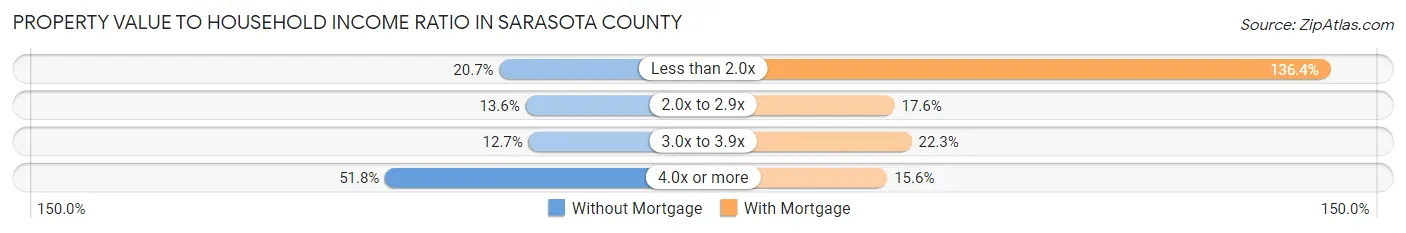
| Value-to-Income Ratio | Without Mortgage | With Mortgage |
| Less than 2.0x | 16,513 (20.6%) | 97,622 (136.4%) |
| 2.0x to 2.9x | 10,836 (13.6%) | 12,594 (17.6%) |
| 3.0x to 3.9x | 10,159 (12.7%) | 15,932 (22.3%) |
| 4.0x or more | 41,396 (51.8%) | 11,173 (15.6%) |
| Total | 79,968 (100.0%) | 71,570 (100.0%) |
Real Estate Taxes by Mortgage Status in Sarasota County
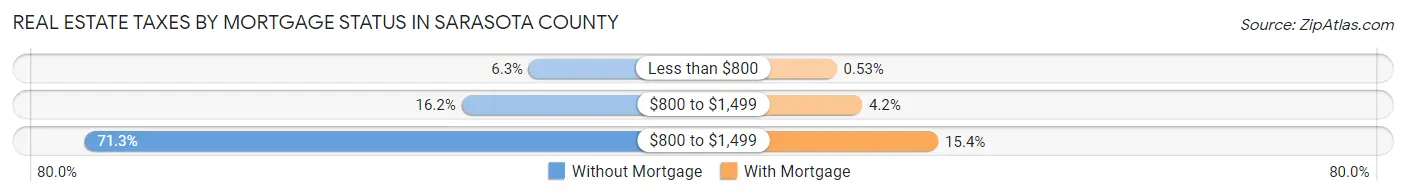
| Property Taxes | Without Mortgage | With Mortgage |
| Less than $800 | 5,049 (6.3%) | 378 (0.5%) |
| $800 to $1,499 | 12,912 (16.2%) | 3,031 (4.2%) |
| $800 to $1,499 | 56,993 (71.3%) | 10,994 (15.4%) |
| Total | 79,968 (100.0%) | 71,570 (100.0%) |
Health & Disability in Sarasota County
Health Insurance Coverage by Age in Sarasota County
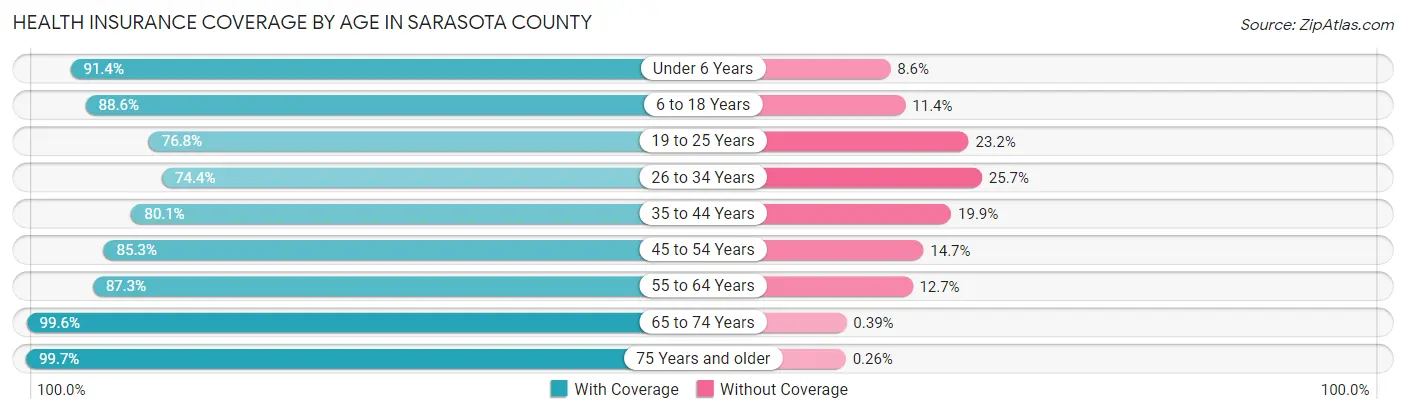
| Age Bracket | With Coverage | Without Coverage |
| Under 6 Years | 16,344 (91.4%) | 1,534 (8.6%) |
| 6 to 18 Years | 41,441 (88.6%) | 5,325 (11.4%) |
| 19 to 25 Years | 19,710 (76.8%) | 5,943 (23.2%) |
| 26 to 34 Years | 23,951 (74.4%) | 8,261 (25.7%) |
| 35 to 44 Years | 29,597 (80.1%) | 7,363 (19.9%) |
| 45 to 54 Years | 39,637 (85.3%) | 6,851 (14.7%) |
| 55 to 64 Years | 59,253 (87.3%) | 8,624 (12.7%) |
| 65 to 74 Years | 80,433 (99.6%) | 317 (0.4%) |
| 75 Years and older | 78,959 (99.7%) | 206 (0.3%) |
| Total | 389,325 (89.8%) | 44,424 (10.2%) |
Health Insurance Coverage by Citizenship Status in Sarasota County
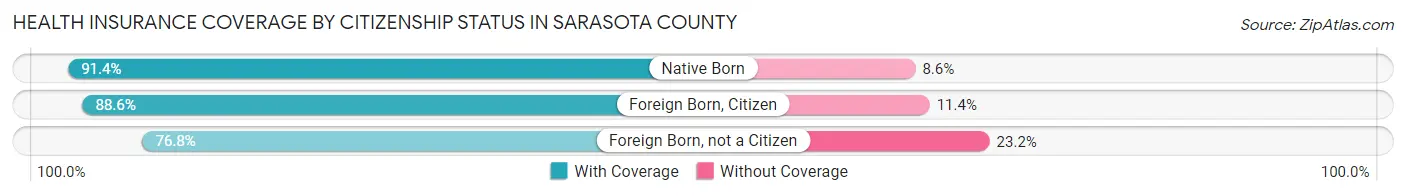
| Citizenship Status | With Coverage | Without Coverage |
| Native Born | 16,344 (91.4%) | 1,534 (8.6%) |
| Foreign Born, Citizen | 41,441 (88.6%) | 5,325 (11.4%) |
| Foreign Born, not a Citizen | 19,710 (76.8%) | 5,943 (23.2%) |
Health Insurance Coverage by Household Income in Sarasota County
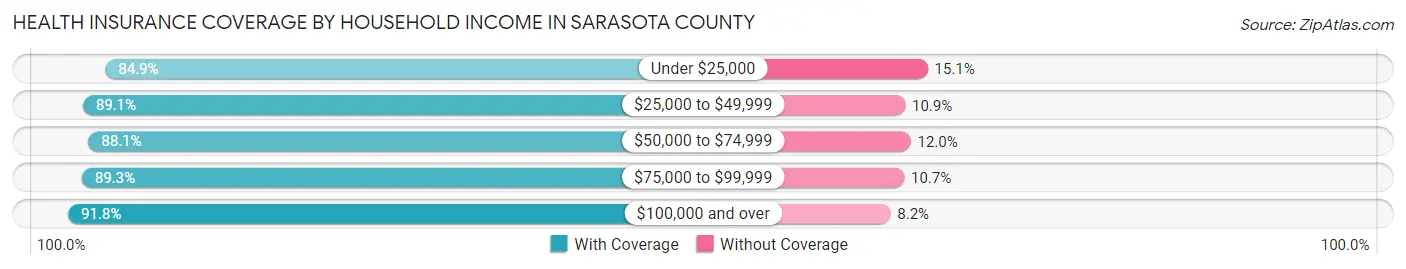
| Household Income | With Coverage | Without Coverage |
| Under $25,000 | 32,862 (84.9%) | 5,863 (15.1%) |
| $25,000 to $49,999 | 55,805 (89.1%) | 6,836 (10.9%) |
| $50,000 to $74,999 | 63,773 (88.0%) | 8,654 (11.9%) |
| $75,000 to $99,999 | 58,038 (89.3%) | 6,966 (10.7%) |
| $100,000 and over | 176,892 (91.8%) | 15,716 (8.2%) |
Public vs Private Health Insurance Coverage by Age in Sarasota County
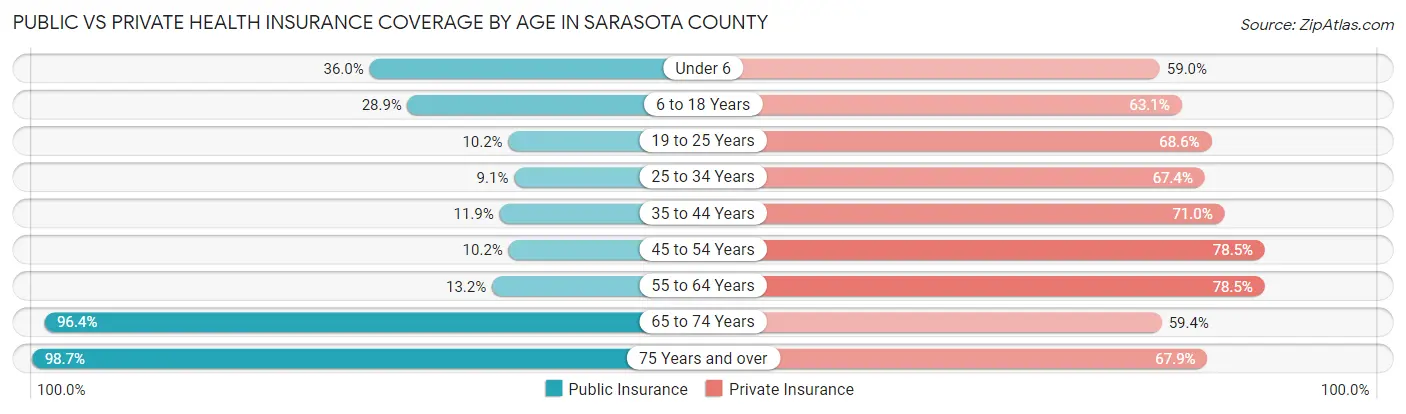
| Age Bracket | Public Insurance | Private Insurance |
| Under 6 | 6,432 (36.0%) | 10,556 (59.0%) |
| 6 to 18 Years | 13,510 (28.9%) | 29,489 (63.1%) |
| 19 to 25 Years | 2,615 (10.2%) | 17,599 (68.6%) |
| 25 to 34 Years | 2,937 (9.1%) | 21,702 (67.4%) |
| 35 to 44 Years | 4,380 (11.8%) | 26,252 (71.0%) |
| 45 to 54 Years | 4,718 (10.2%) | 36,507 (78.5%) |
| 55 to 64 Years | 8,981 (13.2%) | 53,280 (78.5%) |
| 65 to 74 Years | 77,839 (96.4%) | 47,952 (59.4%) |
| 75 Years and over | 78,123 (98.7%) | 53,722 (67.9%) |
| Total | 199,535 (46.0%) | 297,059 (68.5%) |
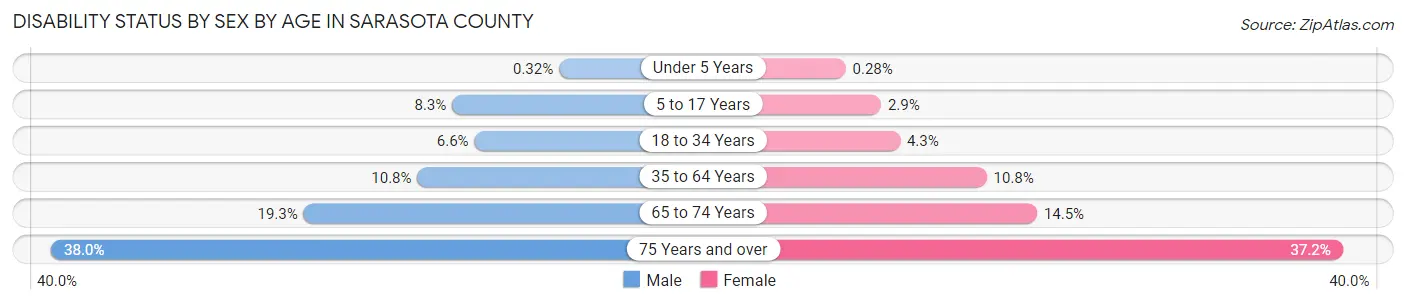
Disability Status by Sex by Age in Sarasota County
| Age Bracket | Male | Female |
| Under 5 Years | 24 (0.3%) | 20 (0.3%) |
| 5 to 17 Years | 1,990 (8.3%) | 656 (2.9%) |
| 18 to 34 Years | 2,043 (6.6%) | 1,307 (4.3%) |
| 35 to 64 Years | 7,783 (10.8%) | 8,555 (10.7%) |
| 65 to 74 Years | 7,196 (19.3%) | 6,296 (14.5%) |
| 75 Years and over | 13,887 (38.0%) | 15,858 (37.2%) |
Disability Class by Sex by Age in Sarasota County
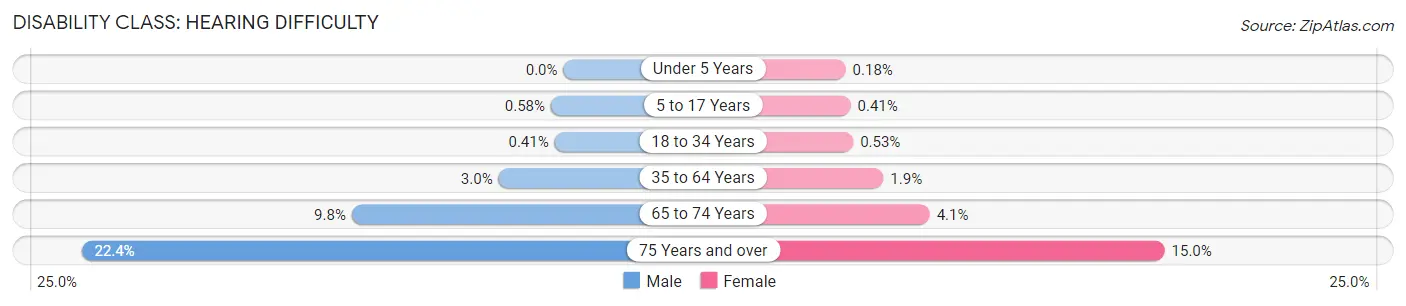
Disability Class: Hearing Difficulty
| Age Bracket | Male | Female |
| Under 5 Years | 0 (0.0%) | 13 (0.2%) |
| 5 to 17 Years | 139 (0.6%) | 92 (0.4%) |
| 18 to 34 Years | 127 (0.4%) | 159 (0.5%) |
| 35 to 64 Years | 2,158 (3.0%) | 1,534 (1.9%) |
| 65 to 74 Years | 3,661 (9.8%) | 1,774 (4.1%) |
| 75 Years and over | 8,165 (22.4%) | 6,390 (15.0%) |
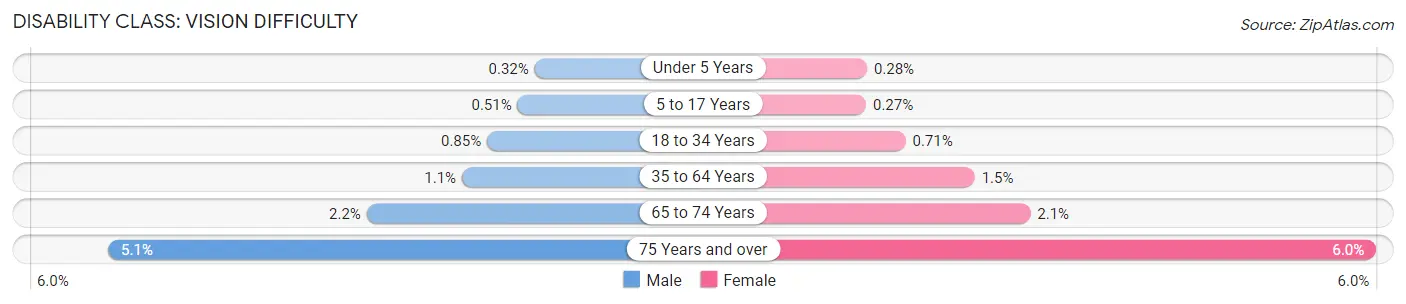
Disability Class: Vision Difficulty
| Age Bracket | Male | Female |
| Under 5 Years | 24 (0.3%) | 20 (0.3%) |
| 5 to 17 Years | 123 (0.5%) | 60 (0.3%) |
| 18 to 34 Years | 263 (0.9%) | 216 (0.7%) |
| 35 to 64 Years | 811 (1.1%) | 1,178 (1.5%) |
| 65 to 74 Years | 817 (2.2%) | 913 (2.1%) |
| 75 Years and over | 1,850 (5.1%) | 2,539 (5.9%) |
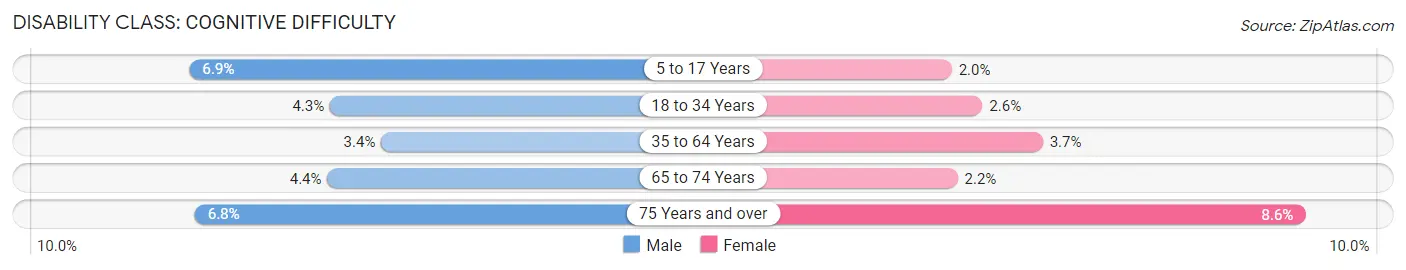
Disability Class: Cognitive Difficulty
| Age Bracket | Male | Female |
| 5 to 17 Years | 1,671 (6.9%) | 460 (2.0%) |
| 18 to 34 Years | 1,341 (4.3%) | 789 (2.6%) |
| 35 to 64 Years | 2,425 (3.4%) | 2,969 (3.7%) |
| 65 to 74 Years | 1,635 (4.4%) | 934 (2.1%) |
| 75 Years and over | 2,498 (6.8%) | 3,667 (8.6%) |
Disability Class: Ambulatory Difficulty
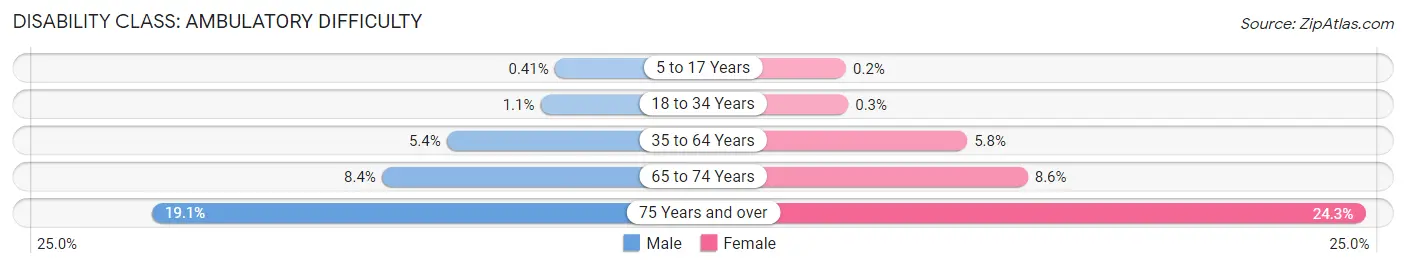
| Age Bracket | Male | Female |
| 5 to 17 Years | 98 (0.4%) | 45 (0.2%) |
| 18 to 34 Years | 331 (1.1%) | 91 (0.3%) |
| 35 to 64 Years | 3,892 (5.4%) | 4,628 (5.8%) |
| 65 to 74 Years | 3,145 (8.4%) | 3,748 (8.6%) |
| 75 Years and over | 6,972 (19.1%) | 10,357 (24.3%) |
Disability Class: Self-Care Difficulty
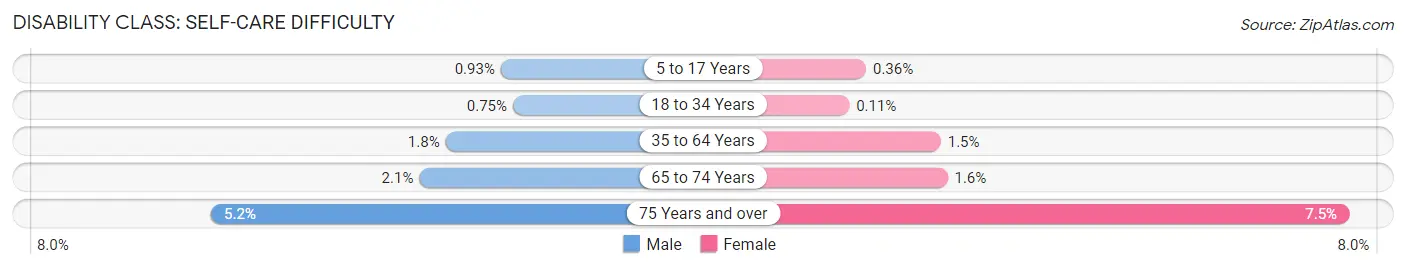
| Age Bracket | Male | Female |
| 5 to 17 Years | 223 (0.9%) | 81 (0.4%) |
| 18 to 34 Years | 233 (0.7%) | 34 (0.1%) |
| 35 to 64 Years | 1,255 (1.8%) | 1,173 (1.5%) |
| 65 to 74 Years | 799 (2.1%) | 684 (1.6%) |
| 75 Years and over | 1,909 (5.2%) | 3,212 (7.5%) |
Technology Access in Sarasota County
Computing Device Access in Sarasota County
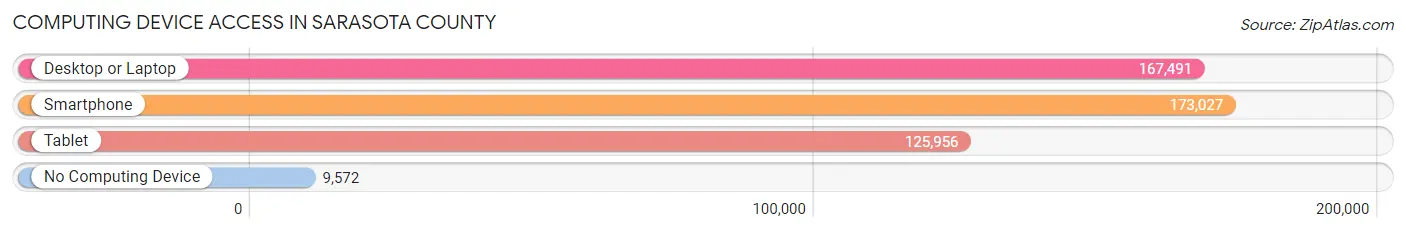
| Device Type | # Households | % Households |
| Desktop or Laptop | 167,491 | 84.0% |
| Smartphone | 173,027 | 86.8% |
| Tablet | 125,956 | 63.2% |
| No Computing Device | 9,572 | 4.8% |
| Total | 199,345 | 100.0% |
Internet Access in Sarasota County
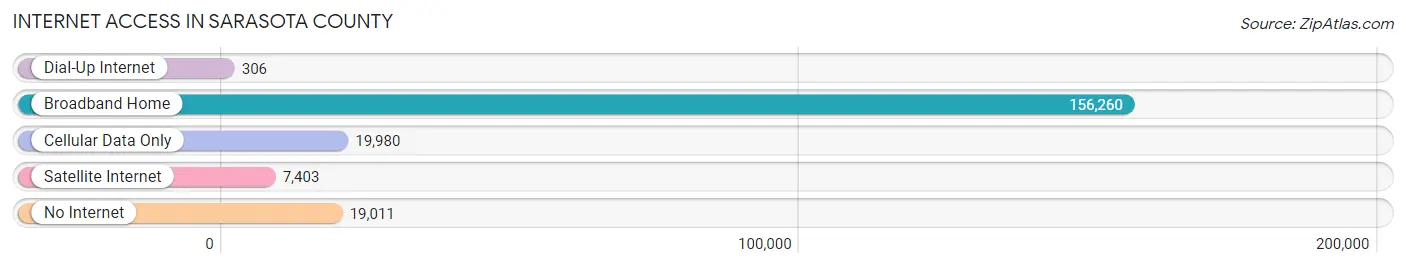
| Internet Type | # Households | % Households |
| Dial-Up Internet | 306 | 0.2% |
| Broadband Home | 156,260 | 78.4% |
| Cellular Data Only | 19,980 | 10.0% |
| Satellite Internet | 7,403 | 3.7% |
| No Internet | 19,011 | 9.5% |
| Total | 199,345 | 100.0% |
Sarasota County Summary
Sarasota County is located in the southwestern region of Florida, along the Gulf of Mexico. It is part of the Tampa Bay Area and is bordered by Manatee County to the north, Charlotte County to the south, and DeSoto County to the east. The county seat is Sarasota, and the largest city is North Port. The county has a total area of 725 square miles, of which 645 square miles is land and 80 square miles is water.
History
The area that is now Sarasota County was originally inhabited by the Calusa Indians. The first European to explore the area was Spanish explorer Hernando de Soto in 1539. The area was later explored by the Spanish in the late 1700s and early 1800s. The first permanent settlement in the area was established in 1842 by William H. Whitaker, who established a trading post near the mouth of the Manatee River.
In the late 1800s, the area began to attract settlers from the northern United States, and the population began to grow. The area was officially incorporated as Sarasota County in 1921. The county was named after the city of Sarasota, which was named after the Spanish explorer Hernando de Soto.
Geography
Sarasota County is located in the southwestern region of Florida, along the Gulf of Mexico. It is part of the Tampa Bay Area and is bordered by Manatee County to the north, Charlotte County to the south, and DeSoto County to the east. The county has a total area of 725 square miles, of which 645 square miles is land and 80 square miles is water.
The county is home to several islands, including Siesta Key, Longboat Key, Casey Key, and Lido Key. The county also includes several barrier islands, such as Manasota Key, Stump Pass, and Don Pedro Island. The county is also home to several rivers, including the Myakka River, the Manatee River, and the Little Manatee River.
Economy
Sarasota County has a diverse economy, with a mix of industries including tourism, manufacturing, healthcare, and finance. The county is home to several major employers, including Sarasota Memorial Hospital, Sarasota County Schools, and the University of South Florida Sarasota-Manatee.
Tourism is a major industry in the county, with visitors drawn to the area’s beaches, golf courses, and cultural attractions. The county is also home to several major shopping centers, including the Mall at University Town Center and the Westfield Sarasota Square Mall.
The county is also home to several major manufacturing companies, including Tropicana Products, Inc., and the John Ringling Estates. The county is also home to several major financial institutions, including SunTrust Bank and Bank of America.
Demographics
As of the 2010 census, Sarasota County had a population of 379,448. The population was estimated to be 397,867 in 2019. The population is composed of a mix of races and ethnicities, with the largest group being White (78.2%), followed by Hispanic or Latino (14.2%), African American (5.2%), and Asian (2.2%).
The median household income in the county is $54,845, and the median home value is $239,400. The county has a poverty rate of 11.2%, and the unemployment rate is 3.7%.
Conclusion
Sarasota County is located in the southwestern region of Florida, along the Gulf of Mexico. It is part of the Tampa Bay Area and is bordered by Manatee County to the north, Charlotte County to the south, and DeSoto County to the east. The county has a total area of 725 square miles, of which 645 square miles is land and 80 square miles is water. The county has a diverse economy, with a mix of industries including tourism, manufacturing, healthcare, and finance. As of the 2010 census, Sarasota County had a population of 379,448. The population is composed of a mix of races and ethnicities, with the largest group being White (78.2%), followed by Hispanic or Latino (14.2%), African American (5.2%), and Asian (2.2%). The median household income in the county is $54,845, and the median home value is $239,400. The county has a poverty rate of 11.2%, and the unemployment rate is 3.7%.
Common Questions
What is Per Capita Income in Sarasota County?
Per Capita income in Sarasota County is $53,149.
What is the Median Family Income in Sarasota County?
Median Family Income in Sarasota County is $94,139.
What is the Median Household income in Sarasota County?
Median Household Income in Sarasota County is $77,213.
What is Income or Wage Gap in Sarasota County?
Income or Wage Gap in Sarasota County is 27.1%.
Women in Sarasota County earn 72.9 cents for every dollar earned by a man.
What is Family Income Deficit in Sarasota County?
Family Income Deficit in Sarasota County is $10,661.
Families that are below poverty line in Sarasota County earn $10,661 less on average than the poverty threshold level.
What is Inequality or Gini Index in Sarasota County?
Inequality or Gini Index in Sarasota County is 0.50.
What is the Total Population of Sarasota County?
Total Population of Sarasota County is 439,392.
What is the Total Male Population of Sarasota County?
Total Male Population of Sarasota County is 210,554.
What is the Total Female Population of Sarasota County?
Total Female Population of Sarasota County is 228,838.
What is the Ratio of Males per 100 Females in Sarasota County?
There are 92.01 Males per 100 Females in Sarasota County.
What is the Ratio of Females per 100 Males in Sarasota County?
There are 108.68 Females per 100 Males in Sarasota County.
What is the Median Population Age in Sarasota County?
Median Population Age in Sarasota County is 57.1 Years.
What is the Average Family Size in Sarasota County
Average Family Size in Sarasota County is 2.7 People.
What is the Average Household Size in Sarasota County
Average Household Size in Sarasota County is 2.2 People.
How Large is the Labor Force in Sarasota County?
There are 189,225 People in the Labor Forcein in Sarasota County.
What is the Percentage of People in the Labor Force in Sarasota County?
49.0% of People are in the Labor Force in Sarasota County.
What is the Unemployment Rate in Sarasota County?
Unemployment Rate in Sarasota County is 3.4%.