Clay County, FL Map & Demographics
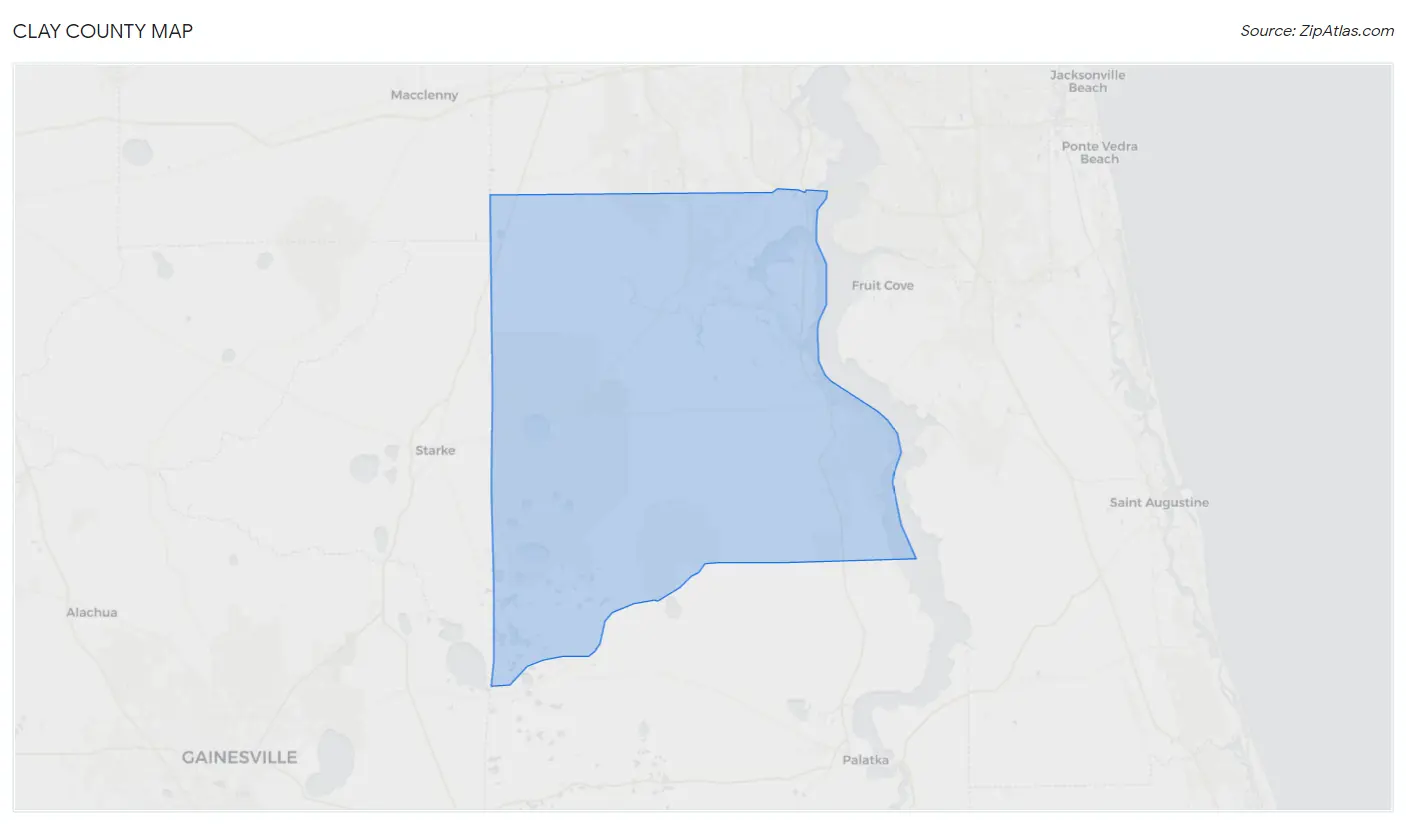
Clay County Map
Clay County Overview
$37,334
PER CAPITA INCOME
$92,384
AVG FAMILY INCOME
$82,242
AVG HOUSEHOLD INCOME
28.8%
WAGE / INCOME GAP [ % ]
71.2¢/ $1
WAGE / INCOME GAP [ $ ]
$12,764
FAMILY INCOME DEFICIT
0.41
INEQUALITY / GINI INDEX
219,650
TOTAL POPULATION
108,845
MALE POPULATION
110,805
FEMALE POPULATION
98.23
MALES / 100 FEMALES
101.80
FEMALES / 100 MALES
39.9
MEDIAN AGE
3.1
AVG FAMILY SIZE
2.7
AVG HOUSEHOLD SIZE
110,605
LABOR FORCE [ PEOPLE ]
63.0%
PERCENT IN LABOR FORCE
4.3%
UNEMPLOYMENT RATE
Income in Clay County
Income Overview in Clay County
Per Capita Income in Clay County is $37,334, while median incomes of families and households are $92,384 and $82,242 respectively.
| Characteristic | Number | Measure |
| Per Capita Income | 219,650 | $37,334 |
| Median Family Income | 60,623 | $92,384 |
| Mean Family Income | 60,623 | $108,130 |
| Median Household Income | 79,704 | $82,242 |
| Mean Household Income | 79,704 | $100,855 |
| Income Deficit | 60,623 | $12,764 |
| Wage / Income Gap (%) | 219,650 | 28.76% |
| Wage / Income Gap ($) | 219,650 | 71.24¢ per $1 |
| Gini / Inequality Index | 219,650 | 0.41 |
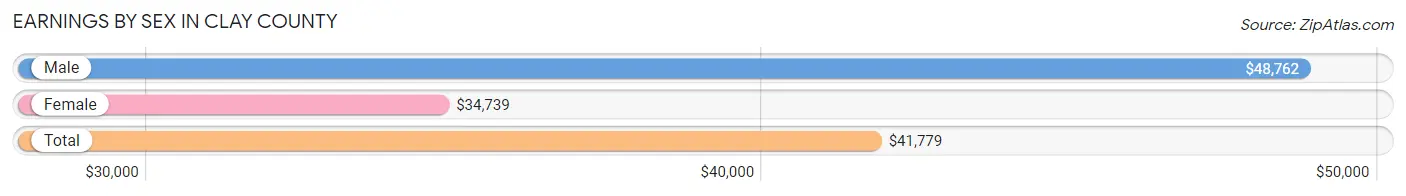
Earnings by Sex in Clay County
Average Earnings in Clay County are $41,779, $48,762 for men and $34,739 for women, a difference of 28.8%.
| Sex | Number | Average Earnings |
| Male | 59,878 (52.6%) | $48,762 |
| Female | 53,872 (47.4%) | $34,739 |
| Total | 113,750 (100.0%) | $41,779 |
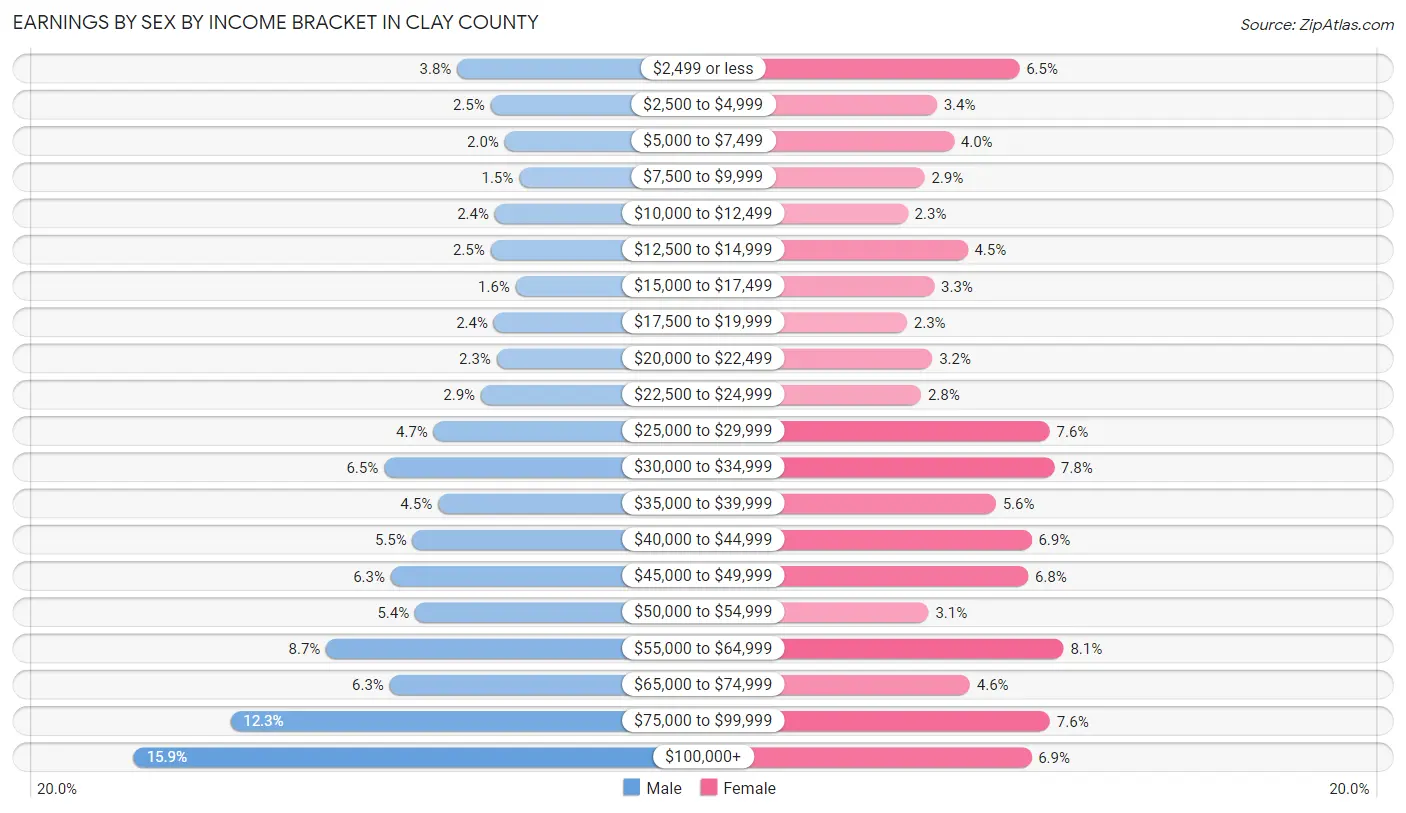
Earnings by Sex by Income Bracket in Clay County
The most common earnings brackets in Clay County are $100,000+ for men (9,526 | 15.9%) and $55,000 to $64,999 for women (4,376 | 8.1%).
| Income | Male | Female |
| $2,499 or less | 2,269 (3.8%) | 3,481 (6.5%) |
| $2,500 to $4,999 | 1,521 (2.5%) | 1,818 (3.4%) |
| $5,000 to $7,499 | 1,204 (2.0%) | 2,161 (4.0%) |
| $7,500 to $9,999 | 880 (1.5%) | 1,568 (2.9%) |
| $10,000 to $12,499 | 1,424 (2.4%) | 1,227 (2.3%) |
| $12,500 to $14,999 | 1,522 (2.5%) | 2,433 (4.5%) |
| $15,000 to $17,499 | 959 (1.6%) | 1,760 (3.3%) |
| $17,500 to $19,999 | 1,447 (2.4%) | 1,211 (2.2%) |
| $20,000 to $22,499 | 1,383 (2.3%) | 1,722 (3.2%) |
| $22,500 to $24,999 | 1,738 (2.9%) | 1,498 (2.8%) |
| $25,000 to $29,999 | 2,795 (4.7%) | 4,094 (7.6%) |
| $30,000 to $34,999 | 3,910 (6.5%) | 4,181 (7.8%) |
| $35,000 to $39,999 | 2,703 (4.5%) | 3,005 (5.6%) |
| $40,000 to $44,999 | 3,271 (5.5%) | 3,727 (6.9%) |
| $45,000 to $49,999 | 3,762 (6.3%) | 3,656 (6.8%) |
| $50,000 to $54,999 | 3,218 (5.4%) | 1,646 (3.1%) |
| $55,000 to $64,999 | 5,207 (8.7%) | 4,376 (8.1%) |
| $65,000 to $74,999 | 3,782 (6.3%) | 2,486 (4.6%) |
| $75,000 to $99,999 | 7,357 (12.3%) | 4,102 (7.6%) |
| $100,000+ | 9,526 (15.9%) | 3,720 (6.9%) |
| Total | 59,878 (100.0%) | 53,872 (100.0%) |
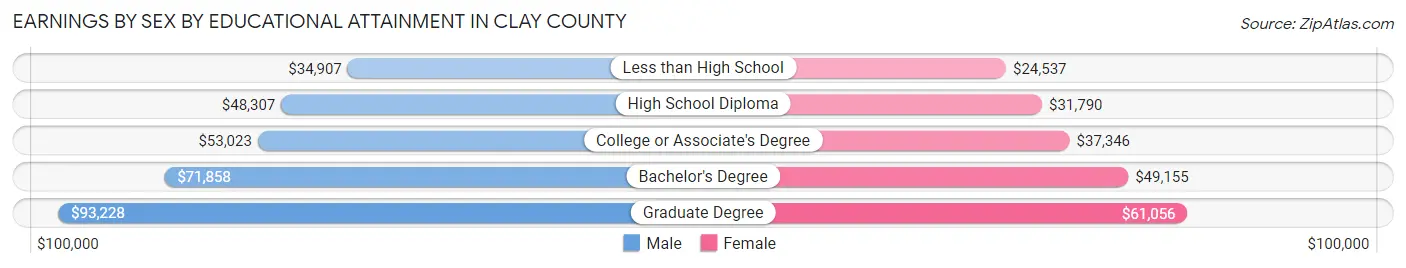
Earnings by Sex by Educational Attainment in Clay County
Average earnings in Clay County are $53,937 for men and $39,560 for women, a difference of 26.7%. Men with an educational attainment of graduate degree enjoy the highest average annual earnings of $93,228, while those with less than high school education earn the least with $34,907. Women with an educational attainment of graduate degree earn the most with the average annual earnings of $61,056, while those with less than high school education have the smallest earnings of $24,537.
| Educational Attainment | Male Income | Female Income |
| Less than High School | $34,907 | $24,537 |
| High School Diploma | $48,307 | $31,790 |
| College or Associate's Degree | $53,023 | $37,346 |
| Bachelor's Degree | $71,858 | $49,155 |
| Graduate Degree | $93,228 | $61,056 |
| Total | $53,937 | $39,560 |
Family Income in Clay County
Family Income Brackets in Clay County
According to the Clay County family income data, there are 14,731 families falling into the $100,000 to $149,999 income range, which is the most common income bracket and makes up 24.3% of all families. Conversely, the $10,000 to $14,999 income bracket is the least frequent group with only 727 families (1.2%) belonging to this category.
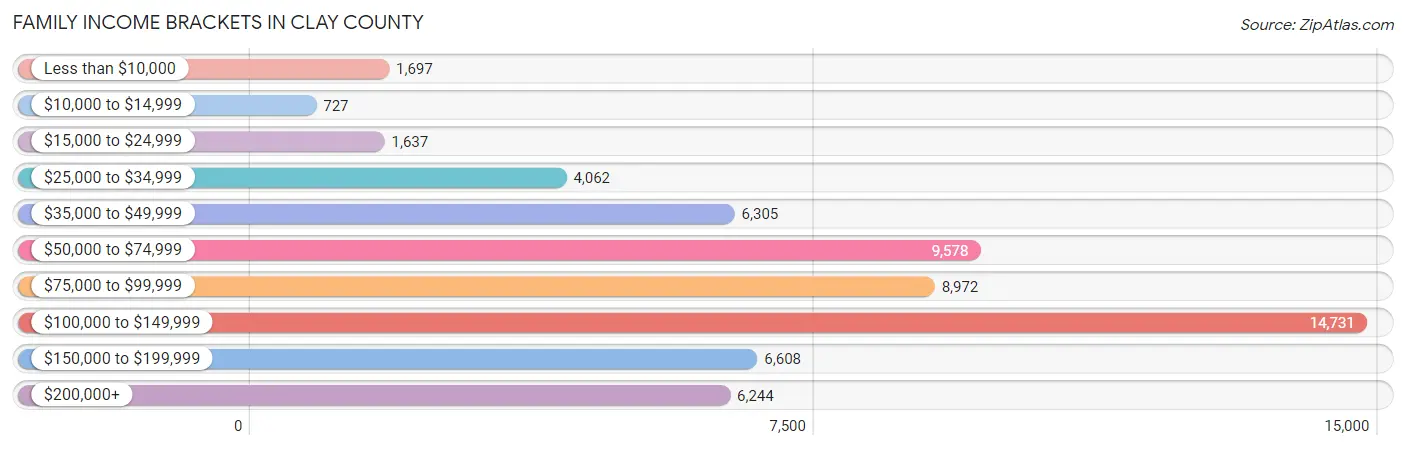
| Income Bracket | # Families | % Families |
| Less than $10,000 | 1,697 | 2.8% |
| $10,000 to $14,999 | 727 | 1.2% |
| $15,000 to $24,999 | 1,637 | 2.7% |
| $25,000 to $34,999 | 4,062 | 6.7% |
| $35,000 to $49,999 | 6,305 | 10.4% |
| $50,000 to $74,999 | 9,578 | 15.8% |
| $75,000 to $99,999 | 8,972 | 14.8% |
| $100,000 to $149,999 | 14,731 | 24.3% |
| $150,000 to $199,999 | 6,608 | 10.9% |
| $200,000+ | 6,244 | 10.3% |
Family Income by Famaliy Size in Clay County
4-person families (10,696 | 17.6%) account for the highest median family income in Clay County with $111,500 per family, while 2-person families (26,974 | 44.5%) have the highest median income of $40,411 per family member.
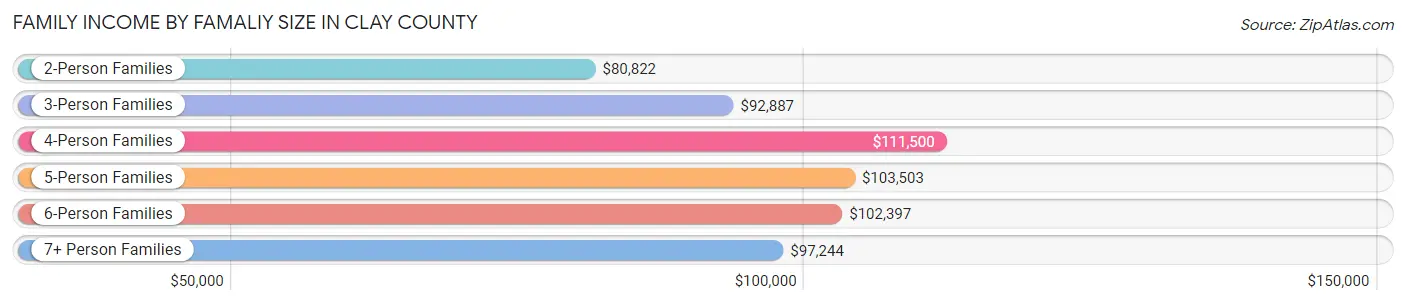
| Income Bracket | # Families | Median Income |
| 2-Person Families | 26,974 (44.5%) | $80,822 |
| 3-Person Families | 14,070 (23.2%) | $92,887 |
| 4-Person Families | 10,696 (17.6%) | $111,500 |
| 5-Person Families | 5,912 (9.8%) | $103,503 |
| 6-Person Families | 1,882 (3.1%) | $102,397 |
| 7+ Person Families | 1,089 (1.8%) | $97,244 |
| Total | 60,623 (100.0%) | $92,384 |
Family Income by Number of Earners in Clay County
The median family income in Clay County is $92,384, with families comprising 3+ earners (6,987) having the highest median family income of $139,432, while families with no earners (10,022) have the lowest median family income of $56,446, accounting for 11.5% and 16.5% of families, respectively.
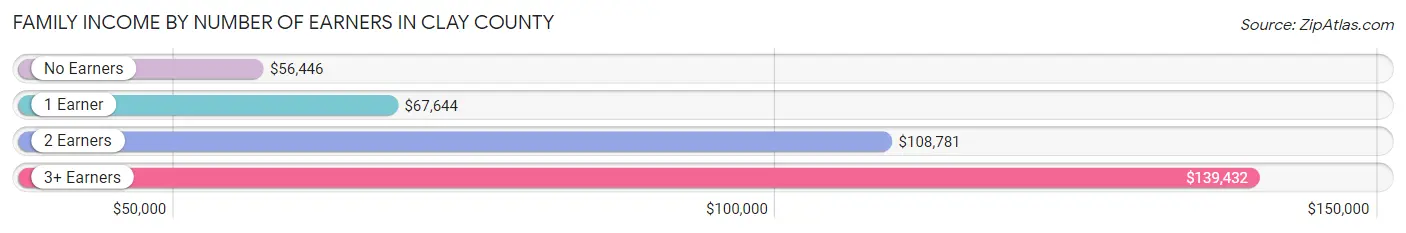
| Number of Earners | # Families | Median Income |
| No Earners | 10,022 (16.5%) | $56,446 |
| 1 Earner | 19,248 (31.8%) | $67,644 |
| 2 Earners | 24,366 (40.2%) | $108,781 |
| 3+ Earners | 6,987 (11.5%) | $139,432 |
| Total | 60,623 (100.0%) | $92,384 |
Household Income in Clay County
Household Income Brackets in Clay County
With 17,774 households falling in the category, the $100,000 to $149,999 income range is the most frequent in Clay County, accounting for 22.3% of all households. In contrast, only 1,435 households (1.8%) fall into the $10,000 to $14,999 income bracket, making it the least populous group.
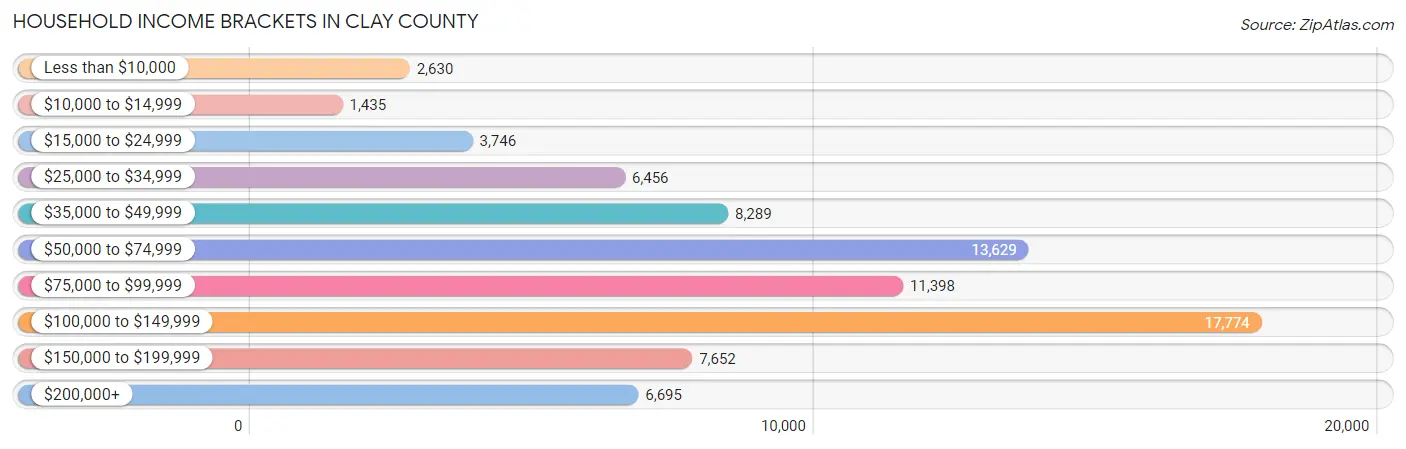
| Income Bracket | # Households | % Households |
| Less than $10,000 | 2,630 | 3.3% |
| $10,000 to $14,999 | 1,435 | 1.8% |
| $15,000 to $24,999 | 3,746 | 4.7% |
| $25,000 to $34,999 | 6,456 | 8.1% |
| $35,000 to $49,999 | 8,289 | 10.4% |
| $50,000 to $74,999 | 13,629 | 17.1% |
| $75,000 to $99,999 | 11,398 | 14.3% |
| $100,000 to $149,999 | 17,774 | 22.3% |
| $150,000 to $199,999 | 7,652 | 9.6% |
| $200,000+ | 6,695 | 8.4% |
Household Income by Householder Age in Clay County
The median household income in Clay County is $82,242, with the highest median household income of $97,705 found in the 45 to 64 years age bracket for the primary householder. A total of 32,684 households (41.0%) fall into this category. Meanwhile, the 15 to 24 years age bracket for the primary householder has the lowest median household income of $37,091, with 1,491 households (1.9%) in this group.
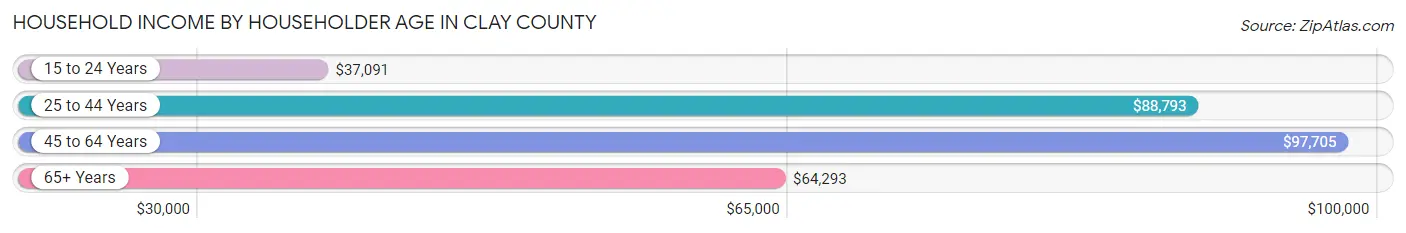
| Income Bracket | # Households | Median Income |
| 15 to 24 Years | 1,491 (1.9%) | $37,091 |
| 25 to 44 Years | 24,654 (30.9%) | $88,793 |
| 45 to 64 Years | 32,684 (41.0%) | $97,705 |
| 65+ Years | 20,875 (26.2%) | $64,293 |
| Total | 79,704 (100.0%) | $82,242 |
Poverty in Clay County
Income Below Poverty by Sex and Age in Clay County
With 8.6% poverty level for males and 10.1% for females among the residents of Clay County, 15 year old males and 6 to 11 year old females are the most vulnerable to poverty, with 449 males (23.5%) and 1,198 females (15.5%) in their respective age groups living below the poverty level.
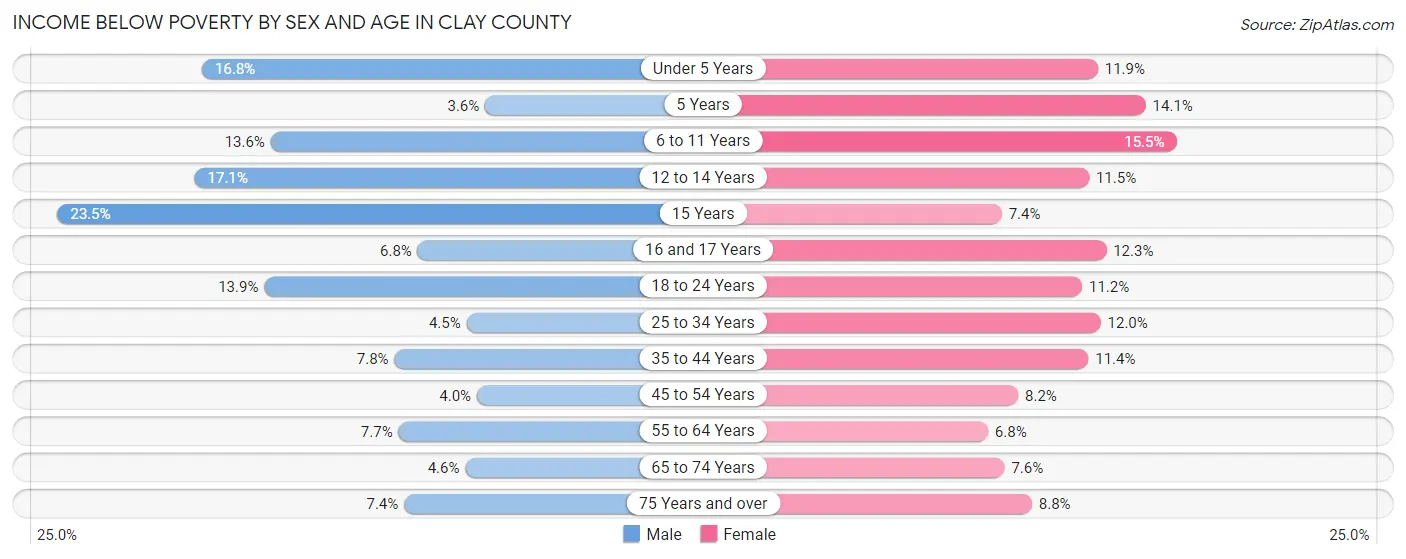
| Age Bracket | Male | Female |
| Under 5 Years | 965 (16.8%) | 665 (11.9%) |
| 5 Years | 48 (3.6%) | 192 (14.1%) |
| 6 to 11 Years | 1,184 (13.6%) | 1,198 (15.5%) |
| 12 to 14 Years | 808 (17.1%) | 531 (11.5%) |
| 15 Years | 449 (23.5%) | 107 (7.4%) |
| 16 and 17 Years | 198 (6.8%) | 408 (12.3%) |
| 18 to 24 Years | 1,257 (13.9%) | 935 (11.2%) |
| 25 to 34 Years | 608 (4.5%) | 1,579 (12.0%) |
| 35 to 44 Years | 1,113 (7.8%) | 1,700 (11.4%) |
| 45 to 54 Years | 571 (4.0%) | 1,208 (8.2%) |
| 55 to 64 Years | 1,145 (7.6%) | 1,030 (6.8%) |
| 65 to 74 Years | 483 (4.5%) | 876 (7.5%) |
| 75 Years and over | 416 (7.4%) | 678 (8.8%) |
| Total | 9,245 (8.6%) | 11,107 (10.1%) |
Income Above Poverty by Sex and Age in Clay County
According to the poverty statistics in Clay County, males aged 5 years and females aged 55 to 64 years are the age groups that are most secure financially, with 96.4% of males and 93.2% of females in these age groups living above the poverty line.
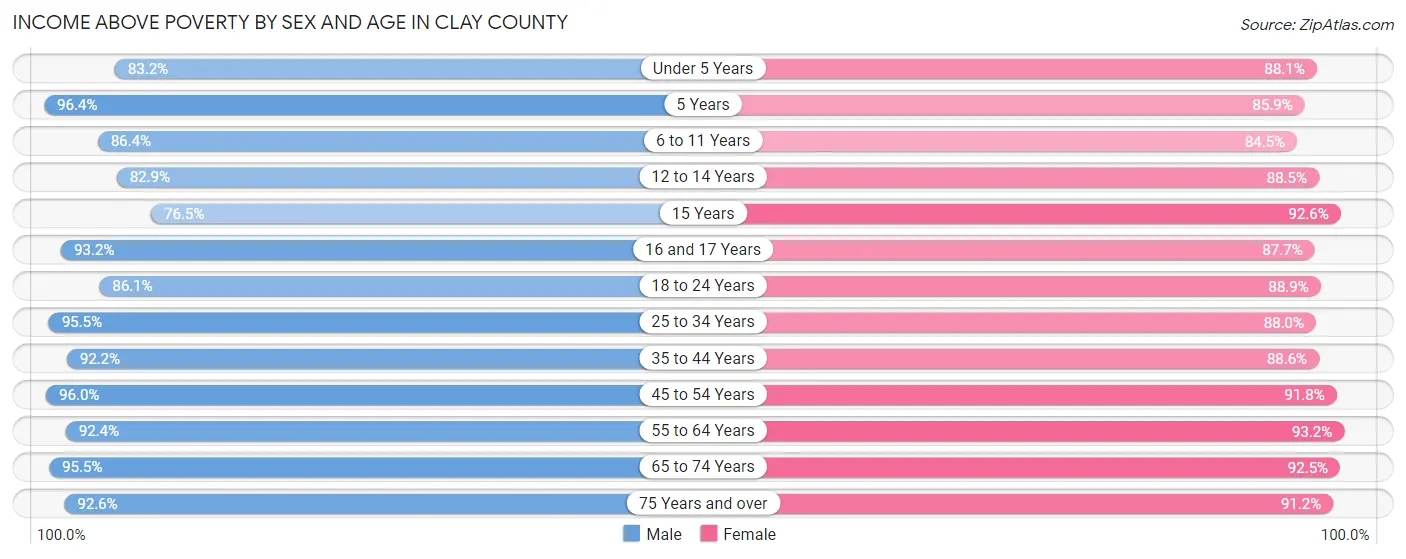
| Age Bracket | Male | Female |
| Under 5 Years | 4,788 (83.2%) | 4,933 (88.1%) |
| 5 Years | 1,273 (96.4%) | 1,170 (85.9%) |
| 6 to 11 Years | 7,533 (86.4%) | 6,521 (84.5%) |
| 12 to 14 Years | 3,914 (82.9%) | 4,100 (88.5%) |
| 15 Years | 1,463 (76.5%) | 1,335 (92.6%) |
| 16 and 17 Years | 2,731 (93.2%) | 2,917 (87.7%) |
| 18 to 24 Years | 7,798 (86.1%) | 7,449 (88.8%) |
| 25 to 34 Years | 12,923 (95.5%) | 11,571 (88.0%) |
| 35 to 44 Years | 13,076 (92.2%) | 13,165 (88.6%) |
| 45 to 54 Years | 13,677 (96.0%) | 13,561 (91.8%) |
| 55 to 64 Years | 13,831 (92.3%) | 14,165 (93.2%) |
| 65 to 74 Years | 10,127 (95.5%) | 10,721 (92.4%) |
| 75 Years and over | 5,213 (92.6%) | 7,007 (91.2%) |
| Total | 98,347 (91.4%) | 98,615 (89.9%) |
Income Below Poverty Among Married-Couple Families in Clay County
The poverty statistics for married-couple families in Clay County show that 4.7% or 2,155 of the total 46,124 families live below the poverty line. Families with 3 or 4 children have the highest poverty rate of 18.5%, comprising of 850 families. On the other hand, families with 1 or 2 children have the lowest poverty rate of 2.6%, which includes 368 families.
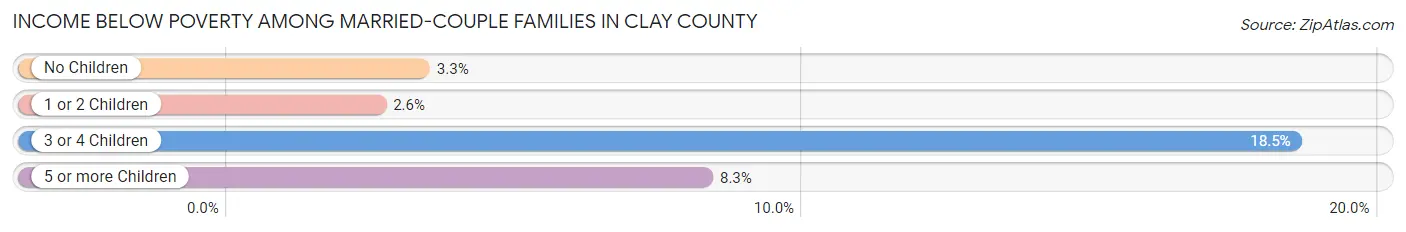
| Children | Above Poverty | Below Poverty |
| No Children | 25,804 (96.7%) | 891 (3.3%) |
| 1 or 2 Children | 13,917 (97.4%) | 368 (2.6%) |
| 3 or 4 Children | 3,738 (81.5%) | 850 (18.5%) |
| 5 or more Children | 510 (91.7%) | 46 (8.3%) |
| Total | 43,969 (95.3%) | 2,155 (4.7%) |
Income Below Poverty Among Single-Parent Households in Clay County
According to the poverty data in Clay County, 4.2% or 153 single-father households and 19.0% or 2,053 single-mother households are living below the poverty line. Among single-father households, those with 1 or 2 children have the highest poverty rate, with 113 households (6.5%) experiencing poverty. Likewise, among single-mother households, those with 5 or more children have the highest poverty rate, with 79 households (70.5%) falling below the poverty line.
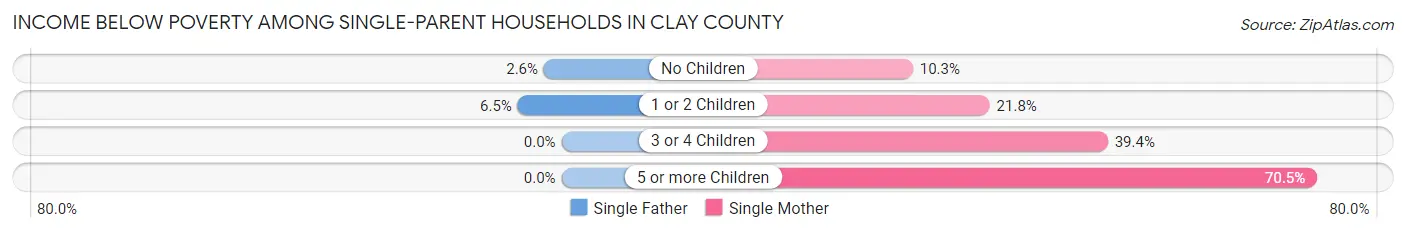
| Children | Single Father | Single Mother |
| No Children | 40 (2.6%) | 495 (10.3%) |
| 1 or 2 Children | 113 (6.5%) | 1,045 (21.7%) |
| 3 or 4 Children | 0 (0.0%) | 434 (39.4%) |
| 5 or more Children | 0 (0.0%) | 79 (70.5%) |
| Total | 153 (4.2%) | 2,053 (19.0%) |
Income Below Poverty Among Married-Couple vs Single-Parent Households in Clay County
The poverty data for Clay County shows that 2,155 of the married-couple family households (4.7%) and 2,206 of the single-parent households (15.2%) are living below the poverty level. Within the married-couple family households, those with 3 or 4 children have the highest poverty rate, with 850 households (18.5%) falling below the poverty line. Among the single-parent households, those with 5 or more children have the highest poverty rate, with 79 household (70.5%) living below poverty.
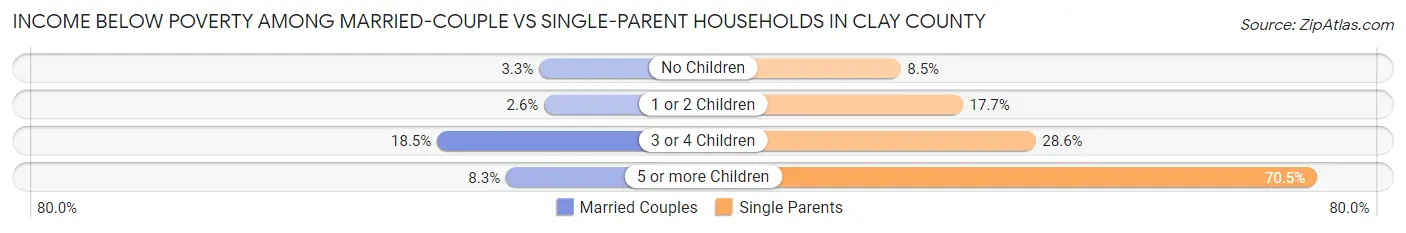
| Children | Married-Couple Families | Single-Parent Households |
| No Children | 891 (3.3%) | 535 (8.5%) |
| 1 or 2 Children | 368 (2.6%) | 1,158 (17.7%) |
| 3 or 4 Children | 850 (18.5%) | 434 (28.6%) |
| 5 or more Children | 46 (8.3%) | 79 (70.5%) |
| Total | 2,155 (4.7%) | 2,206 (15.2%) |
Race in Clay County
The most populous races in Clay County are White / Caucasian (162,097 | 73.8%), Black / African American (25,218 | 11.5%), and Hispanic or Latino (23,711 | 10.8%).
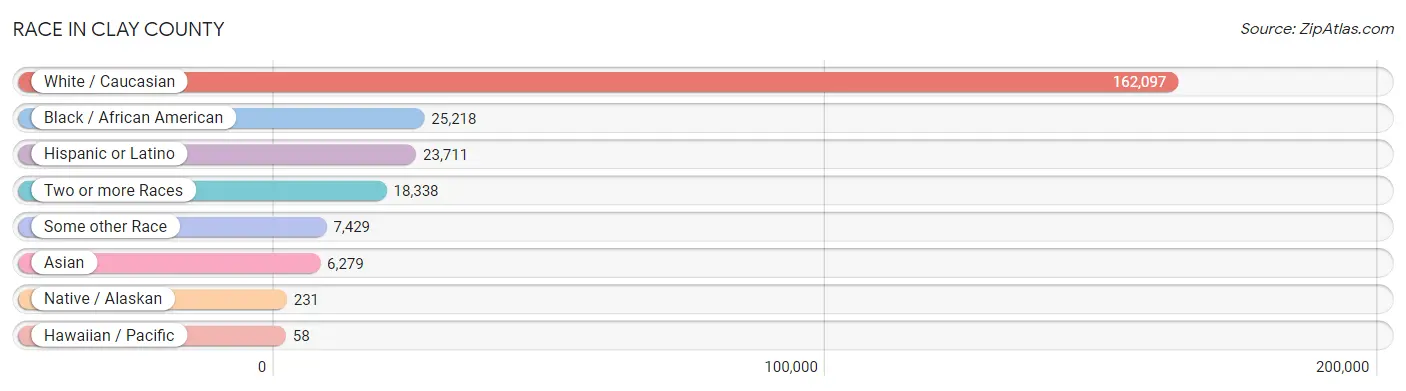
| Race | # Population | % Population |
| Asian | 6,279 | 2.9% |
| Black / African American | 25,218 | 11.5% |
| Hawaiian / Pacific | 58 | 0.0% |
| Hispanic or Latino | 23,711 | 10.8% |
| Native / Alaskan | 231 | 0.1% |
| White / Caucasian | 162,097 | 73.8% |
| Two or more Races | 18,338 | 8.4% |
| Some other Race | 7,429 | 3.4% |
| Total | 219,650 | 100.0% |
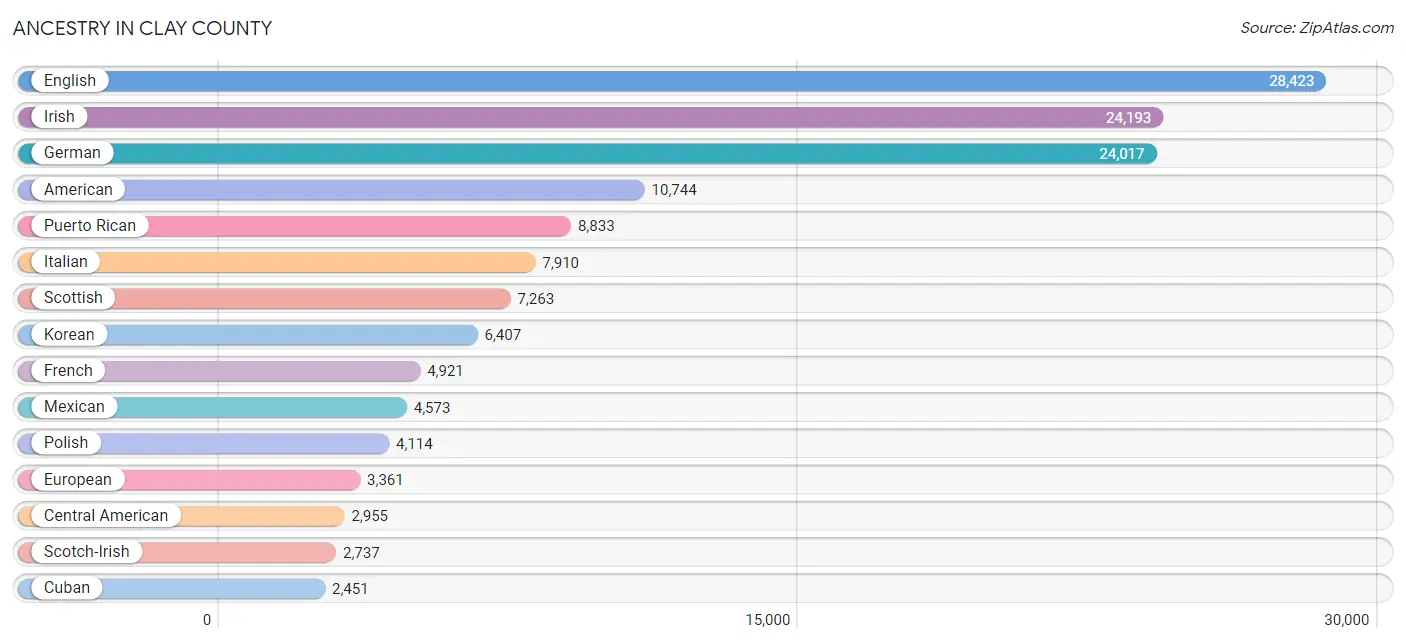
Ancestry in Clay County
The most populous ancestries reported in Clay County are English (28,423 | 12.9%), Irish (24,193 | 11.0%), German (24,017 | 10.9%), American (10,744 | 4.9%), and Puerto Rican (8,833 | 4.0%), together accounting for 43.8% of all Clay County residents.
| Ancestry | # Population | % Population |
| African | 729 | 0.3% |
| Albanian | 62 | 0.0% |
| American | 10,744 | 4.9% |
| Apache | 65 | 0.0% |
| Arab | 819 | 0.4% |
| Argentinean | 141 | 0.1% |
| Armenian | 86 | 0.0% |
| Australian | 35 | 0.0% |
| Austrian | 483 | 0.2% |
| Bahamian | 35 | 0.0% |
| Belgian | 28 | 0.0% |
| Belizean | 49 | 0.0% |
| Bhutanese | 821 | 0.4% |
| Blackfeet | 248 | 0.1% |
| Bolivian | 101 | 0.1% |
| Brazilian | 300 | 0.1% |
| British | 1,462 | 0.7% |
| Burmese | 291 | 0.1% |
| Cajun | 96 | 0.0% |
| Cambodian | 38 | 0.0% |
| Canadian | 415 | 0.2% |
| Celtic | 44 | 0.0% |
| Central American | 2,955 | 1.3% |
| Central American Indian | 233 | 0.1% |
| Cherokee | 1,237 | 0.6% |
| Cheyenne | 29 | 0.0% |
| Chickasaw | 17 | 0.0% |
| Chilean | 202 | 0.1% |
| Choctaw | 81 | 0.0% |
| Colombian | 788 | 0.4% |
| Costa Rican | 139 | 0.1% |
| Cree | 19 | 0.0% |
| Creek | 142 | 0.1% |
| Croatian | 133 | 0.1% |
| Crow | 18 | 0.0% |
| Cuban | 2,451 | 1.1% |
| Czech | 394 | 0.2% |
| Czechoslovakian | 235 | 0.1% |
| Danish | 176 | 0.1% |
| Dominican | 694 | 0.3% |
| Dutch | 1,663 | 0.8% |
| Dutch West Indian | 24 | 0.0% |
| Eastern European | 149 | 0.1% |
| Ecuadorian | 139 | 0.1% |
| Egyptian | 48 | 0.0% |
| English | 28,423 | 12.9% |
| Estonian | 95 | 0.0% |
| European | 3,361 | 1.5% |
| Filipino | 77 | 0.0% |
| Finnish | 357 | 0.2% |
| French | 4,921 | 2.2% |
| French Canadian | 1,211 | 0.5% |
| German | 24,017 | 10.9% |
| Greek | 568 | 0.3% |
| Guamanian / Chamorro | 227 | 0.1% |
| Guatemalan | 1,042 | 0.5% |
| Guyanese | 235 | 0.1% |
| Haitian | 1,278 | 0.6% |
| Honduran | 299 | 0.1% |
| Hungarian | 970 | 0.4% |
| Indian (Asian) | 606 | 0.3% |
| Iranian | 8 | 0.0% |
| Irish | 24,193 | 11.0% |
| Iroquois | 38 | 0.0% |
| Israeli | 179 | 0.1% |
| Italian | 7,910 | 3.6% |
| Jamaican | 560 | 0.3% |
| Japanese | 23 | 0.0% |
| Jordanian | 37 | 0.0% |
| Korean | 6,407 | 2.9% |
| Laotian | 29 | 0.0% |
| Latvian | 45 | 0.0% |
| Lebanese | 272 | 0.1% |
| Lithuanian | 277 | 0.1% |
| Lumbee | 3 | 0.0% |
| Malaysian | 22 | 0.0% |
| Maltese | 18 | 0.0% |
| Mexican | 4,573 | 2.1% |
| Mexican American Indian | 33 | 0.0% |
| Mongolian | 202 | 0.1% |
| Moroccan | 12 | 0.0% |
| Native Hawaiian | 345 | 0.2% |
| Navajo | 47 | 0.0% |
| Nicaraguan | 557 | 0.3% |
| Nigerian | 111 | 0.1% |
| Northern European | 264 | 0.1% |
| Norwegian | 2,222 | 1.0% |
| Pakistani | 157 | 0.1% |
| Palestinian | 263 | 0.1% |
| Panamanian | 209 | 0.1% |
| Pennsylvania German | 63 | 0.0% |
| Peruvian | 252 | 0.1% |
| Polish | 4,114 | 1.9% |
| Portuguese | 849 | 0.4% |
| Pueblo | 10 | 0.0% |
| Puerto Rican | 8,833 | 4.0% |
| Romanian | 421 | 0.2% |
| Russian | 750 | 0.3% |
| Salvadoran | 704 | 0.3% |
| Scandinavian | 664 | 0.3% |
| Scotch-Irish | 2,737 | 1.3% |
| Scottish | 7,263 | 3.3% |
| Seminole | 13 | 0.0% |
| Sioux | 3 | 0.0% |
| Slavic | 45 | 0.0% |
| Slovak | 282 | 0.1% |
| South African | 9 | 0.0% |
| South American | 1,995 | 0.9% |
| South American Indian | 23 | 0.0% |
| Spaniard | 718 | 0.3% |
| Spanish | 846 | 0.4% |
| Sri Lankan | 459 | 0.2% |
| Subsaharan African | 889 | 0.4% |
| Swedish | 1,388 | 0.6% |
| Swiss | 210 | 0.1% |
| Syrian | 70 | 0.0% |
| Thai | 542 | 0.3% |
| Trinidadian and Tobagonian | 145 | 0.1% |
| Turkish | 127 | 0.1% |
| U.S. Virgin Islander | 69 | 0.0% |
| Ugandan | 11 | 0.0% |
| Ukrainian | 279 | 0.1% |
| Uruguayan | 99 | 0.1% |
| Venezuelan | 273 | 0.1% |
| Welsh | 1,823 | 0.8% |
| West Indian | 191 | 0.1% | View All 126 Rows |
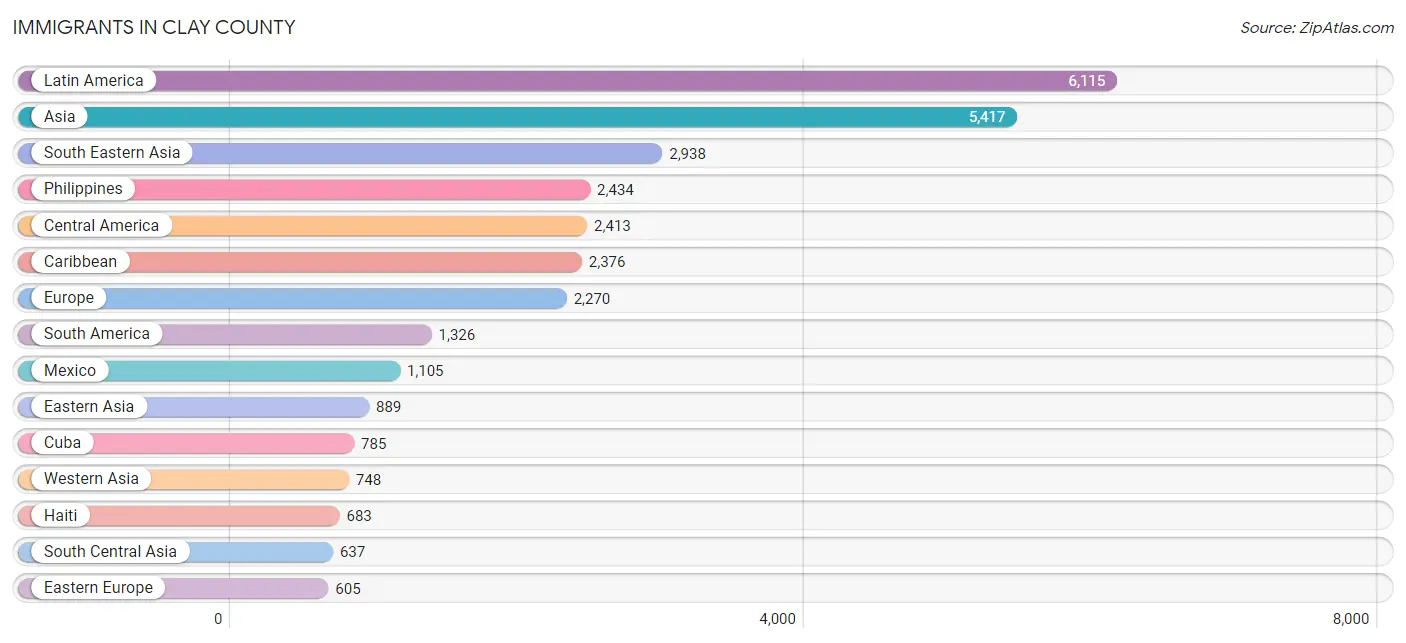
Immigrants in Clay County
The most numerous immigrant groups reported in Clay County came from Latin America (6,115 | 2.8%), Asia (5,417 | 2.5%), South Eastern Asia (2,938 | 1.3%), Philippines (2,434 | 1.1%), and Central America (2,413 | 1.1%), together accounting for 8.8% of all Clay County residents.
| Immigration Origin | # Population | % Population |
| Africa | 208 | 0.1% |
| Albania | 104 | 0.1% |
| Argentina | 161 | 0.1% |
| Asia | 5,417 | 2.5% |
| Australia | 15 | 0.0% |
| Azores | 53 | 0.0% |
| Bahamas | 31 | 0.0% |
| Belarus | 46 | 0.0% |
| Belize | 52 | 0.0% |
| Bolivia | 21 | 0.0% |
| Brazil | 203 | 0.1% |
| Cameroon | 49 | 0.0% |
| Canada | 443 | 0.2% |
| Caribbean | 2,376 | 1.1% |
| Central America | 2,413 | 1.1% |
| Chile | 59 | 0.0% |
| China | 520 | 0.2% |
| Colombia | 374 | 0.2% |
| Costa Rica | 1 | 0.0% |
| Cuba | 785 | 0.4% |
| Czechoslovakia | 13 | 0.0% |
| Dominican Republic | 315 | 0.1% |
| Eastern Africa | 34 | 0.0% |
| Eastern Asia | 889 | 0.4% |
| Eastern Europe | 605 | 0.3% |
| Ecuador | 46 | 0.0% |
| Egypt | 16 | 0.0% |
| El Salvador | 441 | 0.2% |
| England | 295 | 0.1% |
| Europe | 2,270 | 1.0% |
| France | 79 | 0.0% |
| Germany | 457 | 0.2% |
| Guatemala | 414 | 0.2% |
| Guyana | 75 | 0.0% |
| Haiti | 683 | 0.3% |
| Honduras | 66 | 0.0% |
| Hungary | 47 | 0.0% |
| India | 411 | 0.2% |
| Indonesia | 10 | 0.0% |
| Ireland | 15 | 0.0% |
| Israel | 24 | 0.0% |
| Italy | 324 | 0.2% |
| Jamaica | 350 | 0.2% |
| Japan | 323 | 0.2% |
| Jordan | 454 | 0.2% |
| Kazakhstan | 64 | 0.0% |
| Kenya | 23 | 0.0% |
| Korea | 46 | 0.0% |
| Latin America | 6,115 | 2.8% |
| Latvia | 19 | 0.0% |
| Lebanon | 10 | 0.0% |
| Malaysia | 48 | 0.0% |
| Mexico | 1,105 | 0.5% |
| Middle Africa | 49 | 0.0% |
| Morocco | 29 | 0.0% |
| Netherlands | 10 | 0.0% |
| Nicaragua | 235 | 0.1% |
| Nigeria | 7 | 0.0% |
| Northern Africa | 56 | 0.0% |
| Northern Europe | 526 | 0.2% |
| Oceania | 18 | 0.0% |
| Pakistan | 44 | 0.0% |
| Panama | 99 | 0.1% |
| Peru | 204 | 0.1% |
| Philippines | 2,434 | 1.1% |
| Poland | 213 | 0.1% |
| Portugal | 61 | 0.0% |
| Romania | 97 | 0.0% |
| Russia | 48 | 0.0% |
| Saudi Arabia | 165 | 0.1% |
| Scotland | 98 | 0.0% |
| South Africa | 62 | 0.0% |
| South America | 1,326 | 0.6% |
| South Central Asia | 637 | 0.3% |
| South Eastern Asia | 2,938 | 1.3% |
| Southern Europe | 593 | 0.3% |
| Spain | 208 | 0.1% |
| Sri Lanka | 118 | 0.1% |
| Sweden | 3 | 0.0% |
| Syria | 9 | 0.0% |
| Taiwan | 77 | 0.0% |
| Thailand | 85 | 0.0% |
| Trinidad and Tobago | 185 | 0.1% |
| Turkey | 86 | 0.0% |
| Uganda | 11 | 0.0% |
| Uruguay | 107 | 0.1% |
| Venezuela | 76 | 0.0% |
| Vietnam | 361 | 0.2% |
| Western Africa | 7 | 0.0% |
| Western Asia | 748 | 0.3% |
| Western Europe | 546 | 0.3% | View All 91 Rows |
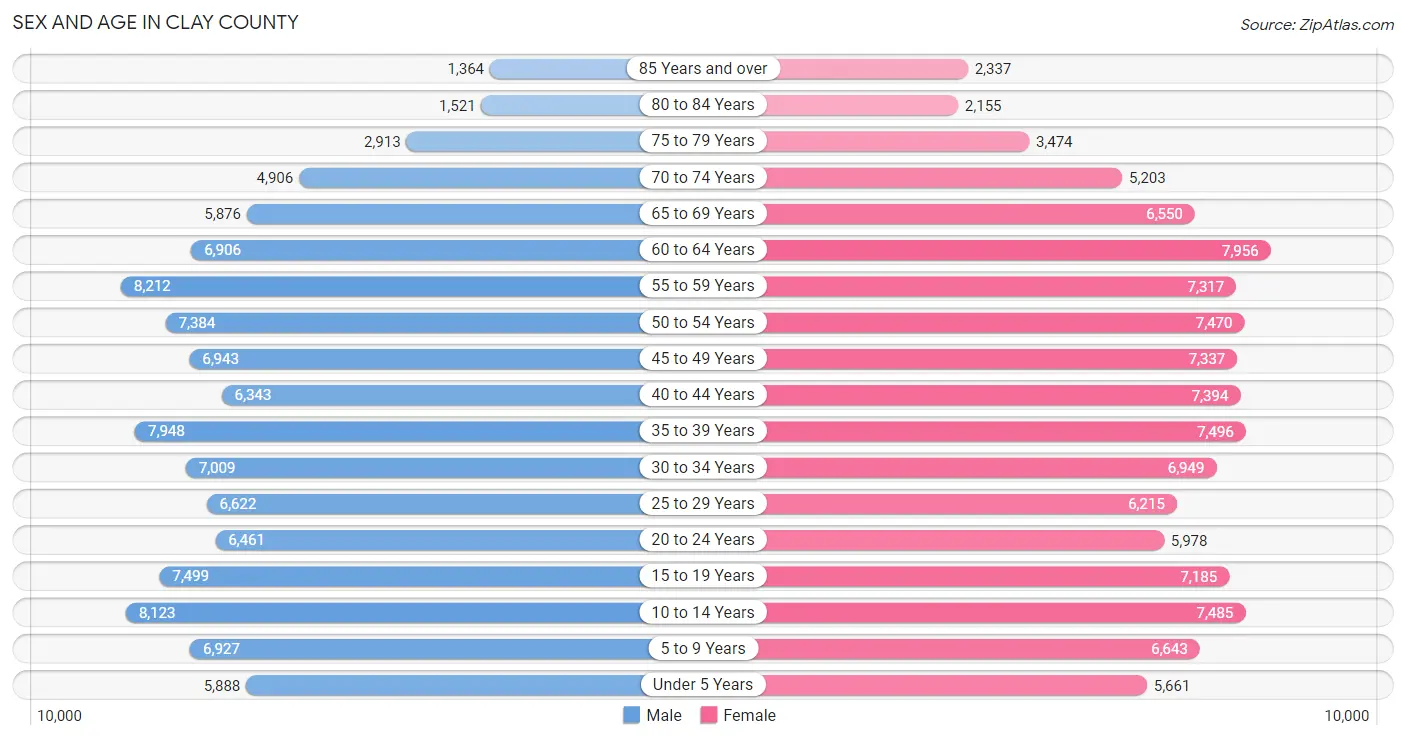
Sex and Age in Clay County
Sex and Age in Clay County
The most populous age groups in Clay County are 55 to 59 Years (8,212 | 7.5%) for men and 60 to 64 Years (7,956 | 7.2%) for women.
| Age Bracket | Male | Female |
| Under 5 Years | 5,888 (5.4%) | 5,661 (5.1%) |
| 5 to 9 Years | 6,927 (6.4%) | 6,643 (6.0%) |
| 10 to 14 Years | 8,123 (7.5%) | 7,485 (6.8%) |
| 15 to 19 Years | 7,499 (6.9%) | 7,185 (6.5%) |
| 20 to 24 Years | 6,461 (5.9%) | 5,978 (5.4%) |
| 25 to 29 Years | 6,622 (6.1%) | 6,215 (5.6%) |
| 30 to 34 Years | 7,009 (6.4%) | 6,949 (6.3%) |
| 35 to 39 Years | 7,948 (7.3%) | 7,496 (6.8%) |
| 40 to 44 Years | 6,343 (5.8%) | 7,394 (6.7%) |
| 45 to 49 Years | 6,943 (6.4%) | 7,337 (6.6%) |
| 50 to 54 Years | 7,384 (6.8%) | 7,470 (6.7%) |
| 55 to 59 Years | 8,212 (7.5%) | 7,317 (6.6%) |
| 60 to 64 Years | 6,906 (6.3%) | 7,956 (7.2%) |
| 65 to 69 Years | 5,876 (5.4%) | 6,550 (5.9%) |
| 70 to 74 Years | 4,906 (4.5%) | 5,203 (4.7%) |
| 75 to 79 Years | 2,913 (2.7%) | 3,474 (3.1%) |
| 80 to 84 Years | 1,521 (1.4%) | 2,155 (1.9%) |
| 85 Years and over | 1,364 (1.3%) | 2,337 (2.1%) |
| Total | 108,845 (100.0%) | 110,805 (100.0%) |
Families and Households in Clay County
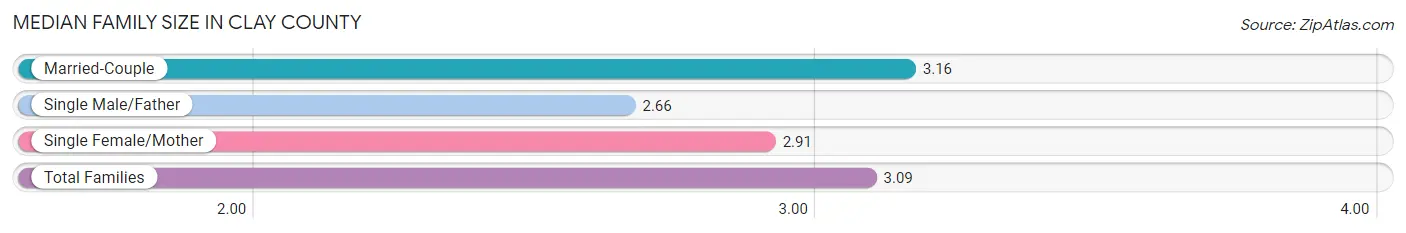
Median Family Size in Clay County
The median family size in Clay County is 3.09 persons per family, with married-couple families (46,124 | 76.1%) accounting for the largest median family size of 3.16 persons per family. On the other hand, single male/father families (3,674 | 6.1%) represent the smallest median family size with 2.66 persons per family.
| Family Type | # Families | Family Size |
| Married-Couple | 46,124 (76.1%) | 3.16 |
| Single Male/Father | 3,674 (6.1%) | 2.66 |
| Single Female/Mother | 10,825 (17.9%) | 2.91 |
| Total Families | 60,623 (100.0%) | 3.09 |
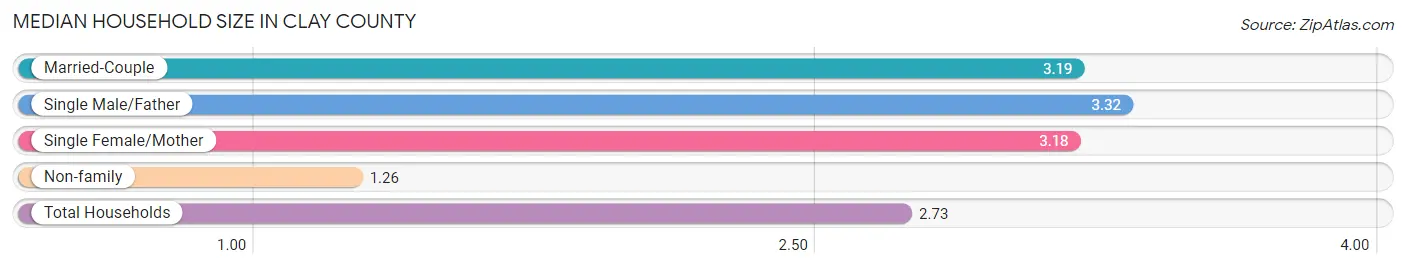
Median Household Size in Clay County
The median household size in Clay County is 2.73 persons per household, with single male/father households (3,674 | 4.6%) accounting for the largest median household size of 3.32 persons per household. non-family households (19,081 | 23.9%) represent the smallest median household size with 1.26 persons per household.
| Household Type | # Households | Household Size |
| Married-Couple | 46,124 (57.9%) | 3.19 |
| Single Male/Father | 3,674 (4.6%) | 3.32 |
| Single Female/Mother | 10,825 (13.6%) | 3.18 |
| Non-family | 19,081 (23.9%) | 1.26 |
| Total Households | 79,704 (100.0%) | 2.73 |
Household Size by Marriage Status in Clay County
Out of a total of 79,704 households in Clay County, 60,623 (76.1%) are family households, while 19,081 (23.9%) are nonfamily households. The most numerous type of family households are 2-person households, comprising 25,342, and the most common type of nonfamily households are 1-person households, comprising 15,858.
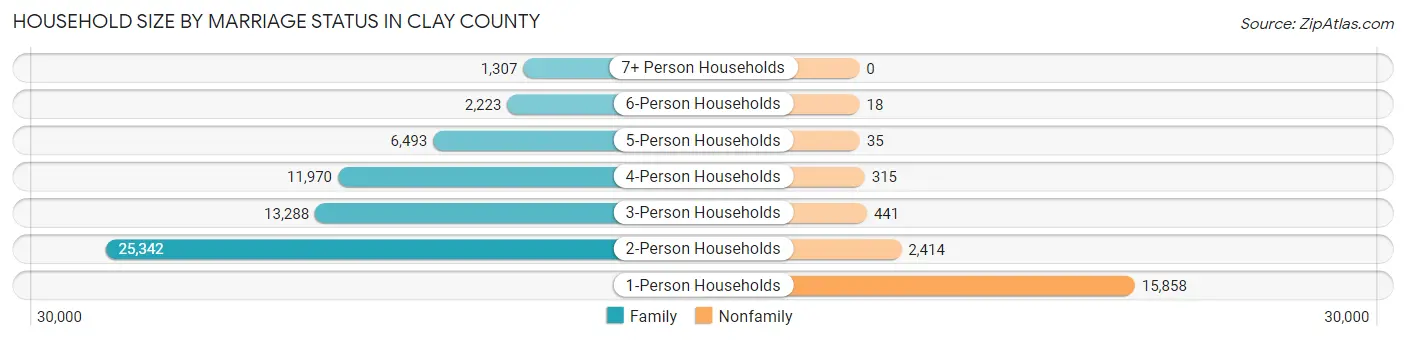
| Household Size | Family Households | Nonfamily Households |
| 1-Person Households | - | 15,858 (19.9%) |
| 2-Person Households | 25,342 (31.8%) | 2,414 (3.0%) |
| 3-Person Households | 13,288 (16.7%) | 441 (0.5%) |
| 4-Person Households | 11,970 (15.0%) | 315 (0.4%) |
| 5-Person Households | 6,493 (8.2%) | 35 (0.0%) |
| 6-Person Households | 2,223 (2.8%) | 18 (0.0%) |
| 7+ Person Households | 1,307 (1.6%) | 0 (0.0%) |
| Total | 60,623 (76.1%) | 19,081 (23.9%) |
Female Fertility in Clay County
Fertility by Age in Clay County
Average fertility rate in Clay County is 56.0 births per 1,000 women. Women in the age bracket of 20 to 34 years have the highest fertility rate with 100.0 births per 1,000 women. Women in the age bracket of 20 to 34 years acount for 68.3% of all women with births.
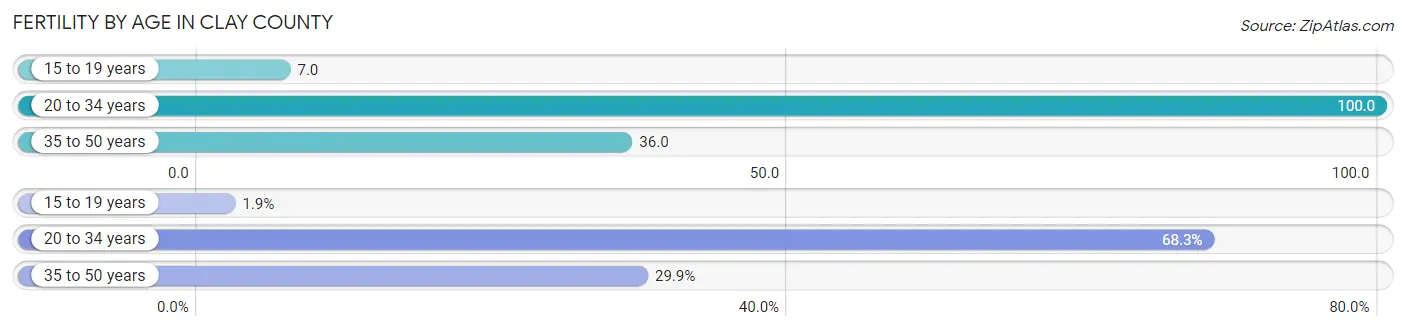
| Age Bracket | Women with Births | Births / 1,000 Women |
| 15 to 19 years | 52 (1.9%) | 7.0 |
| 20 to 34 years | 1,905 (68.3%) | 100.0 |
| 35 to 50 years | 833 (29.9%) | 36.0 |
| Total | 2,790 (100.0%) | 56.0 |
Fertility by Age by Marriage Status in Clay County
73.3% of women with births (2,790) in Clay County are married. The highest percentage of unmarried women with births falls into 15 to 19 years age bracket with 100.0% of them unmarried at the time of birth, while the lowest percentage of unmarried women with births belong to 20 to 34 years age bracket with 22.4% of them unmarried.
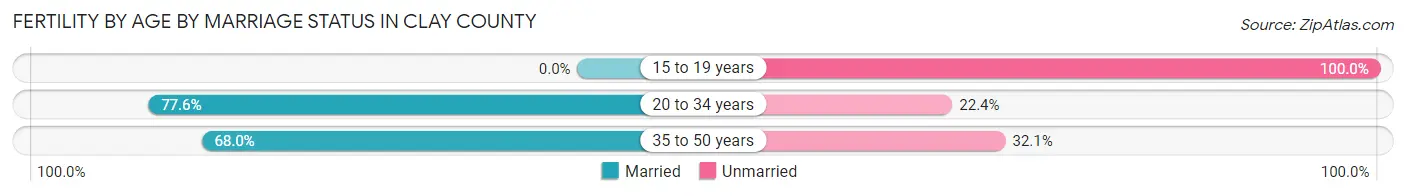
| Age Bracket | Married | Unmarried |
| 15 to 19 years | 0 (0.0%) | 52 (100.0%) |
| 20 to 34 years | 1,478 (77.6%) | 427 (22.4%) |
| 35 to 50 years | 566 (67.9%) | 267 (32.1%) |
| Total | 2,045 (73.3%) | 745 (26.7%) |
Fertility by Education in Clay County
Average fertility rate in Clay County is 56.0 births per 1,000 women. Women with the education attainment of graduate degree have the highest fertility rate of 97.0 births per 1,000 women, while women with the education attainment of less than high school have the lowest fertility at 20.0 births per 1,000 women. Women with the education attainment of college or associate's degree represent 36.9% of all women with births.
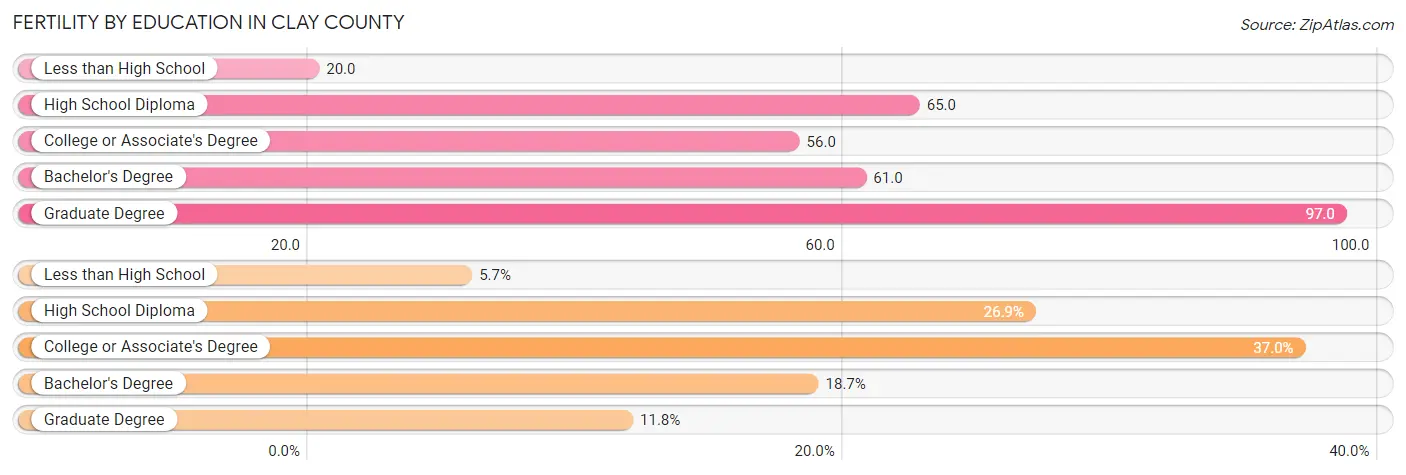
| Educational Attainment | Women with Births | Births / 1,000 Women |
| Less than High School | 160 (5.7%) | 20.0 |
| High School Diploma | 749 (26.9%) | 65.0 |
| College or Associate's Degree | 1,031 (36.9%) | 56.0 |
| Bachelor's Degree | 522 (18.7%) | 61.0 |
| Graduate Degree | 328 (11.8%) | 97.0 |
| Total | 2,790 (100.0%) | 56.0 |
Fertility by Education by Marriage Status in Clay County
26.7% of women with births in Clay County are unmarried. Women with the educational attainment of college or associate's degree are most likely to be married with 83.8% of them married at childbirth, while women with the educational attainment of high school diploma are least likely to be married with 43.4% of them unmarried at childbirth.
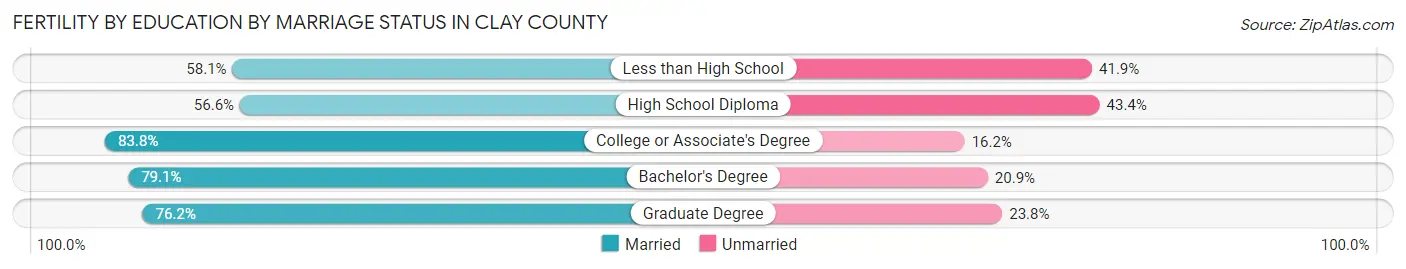
| Educational Attainment | Married | Unmarried |
| Less than High School | 93 (58.1%) | 67 (41.9%) |
| High School Diploma | 424 (56.6%) | 325 (43.4%) |
| College or Associate's Degree | 864 (83.8%) | 167 (16.2%) |
| Bachelor's Degree | 413 (79.1%) | 109 (20.9%) |
| Graduate Degree | 250 (76.2%) | 78 (23.8%) |
| Total | 2,045 (73.3%) | 745 (26.7%) |
Employment Characteristics in Clay County
Employment by Class of Employer in Clay County
Among the 103,613 employed individuals in Clay County, private company employees (70,456 | 68.0%), not-for-profit organizations (7,952 | 7.7%), and federal government employees (7,191 | 6.9%) make up the most common classes of employment.
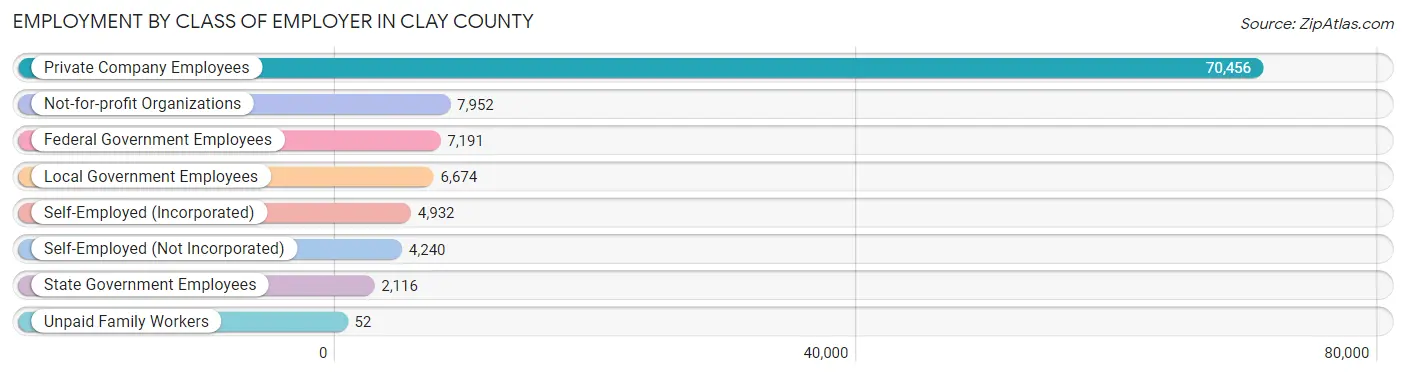
| Employer Class | # Employees | % Employees |
| Private Company Employees | 70,456 | 68.0% |
| Self-Employed (Incorporated) | 4,932 | 4.8% |
| Self-Employed (Not Incorporated) | 4,240 | 4.1% |
| Not-for-profit Organizations | 7,952 | 7.7% |
| Local Government Employees | 6,674 | 6.4% |
| State Government Employees | 2,116 | 2.0% |
| Federal Government Employees | 7,191 | 6.9% |
| Unpaid Family Workers | 52 | 0.1% |
| Total | 103,613 | 100.0% |
Employment Status by Age in Clay County
According to the labor force statistics for Clay County, out of the total population over 16 years of age (175,564), 63.0% or 110,605 individuals are in the labor force, with 4.3% or 4,756 of them unemployed. The age group with the highest labor force participation rate is 30 to 34 years, with 86.9% or 12,130 individuals in the labor force. Within the labor force, the 16 to 19 years age range has the highest percentage of unemployed individuals, with 19.5% or 848 of them being unemployed.
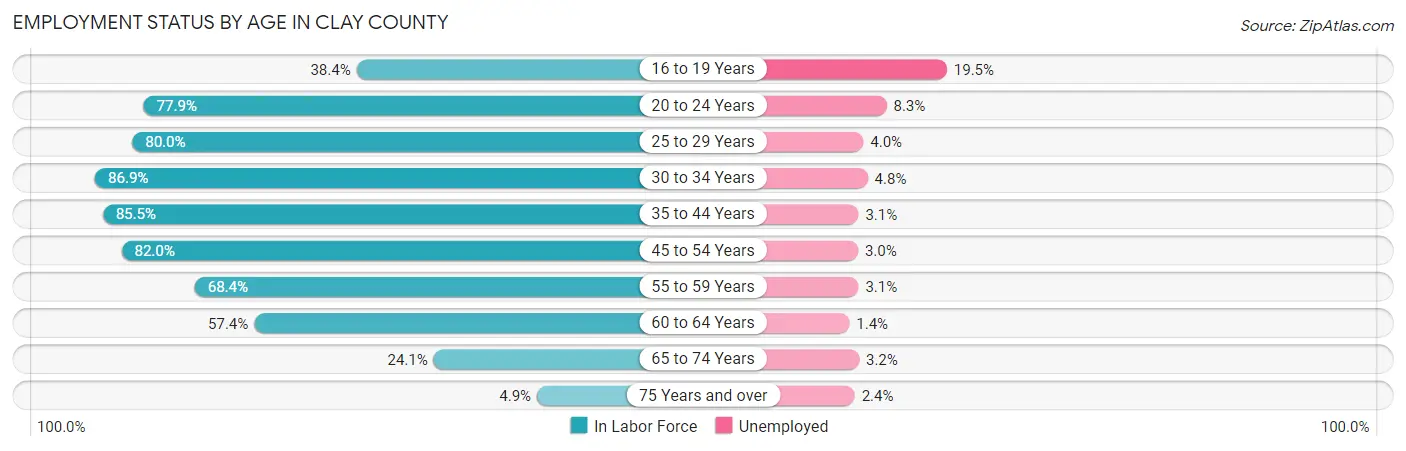
| Age Bracket | In Labor Force | Unemployed |
| 16 to 19 Years | 4,349 (38.4%) | 848 (19.5%) |
| 20 to 24 Years | 9,690 (77.9%) | 804 (8.3%) |
| 25 to 29 Years | 10,270 (80.0%) | 411 (4.0%) |
| 30 to 34 Years | 12,130 (86.9%) | 582 (4.8%) |
| 35 to 44 Years | 24,950 (85.5%) | 773 (3.1%) |
| 45 to 54 Years | 23,890 (82.0%) | 717 (3.0%) |
| 55 to 59 Years | 10,622 (68.4%) | 329 (3.1%) |
| 60 to 64 Years | 8,531 (57.4%) | 119 (1.4%) |
| 65 to 74 Years | 5,431 (24.1%) | 174 (3.2%) |
| 75 Years and over | 674 (4.9%) | 16 (2.4%) |
| Total | 110,605 (63.0%) | 4,756 (4.3%) |
Employment Status by Educational Attainment in Clay County
According to labor force statistics for Clay County, 78.3% of individuals (90,437) out of the total population between 25 and 64 years of age (115,501) are in the labor force, with 3.2% or 2,894 of them being unemployed. The group with the highest labor force participation rate are those with the educational attainment of bachelor's degree or higher, with 86.5% or 27,608 individuals in the labor force. Within the labor force, individuals with less than high school education have the highest percentage of unemployment, with 4.3% or 216 of them being unemployed.
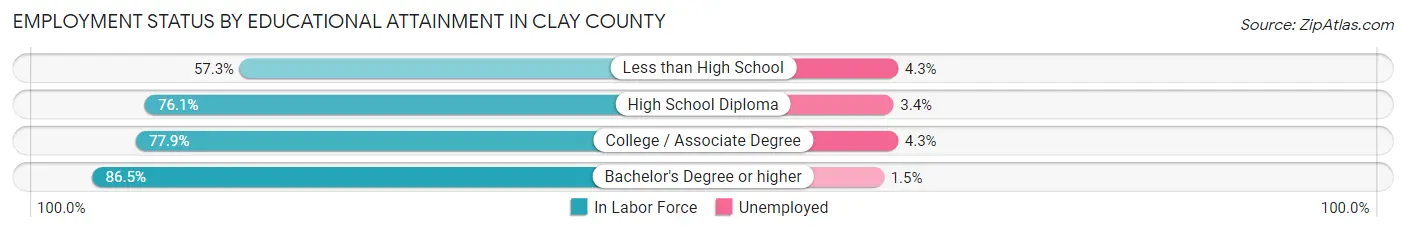
| Educational Attainment | In Labor Force | Unemployed |
| Less than High School | 5,016 (57.3%) | 376 (4.3%) |
| High School Diploma | 22,943 (76.1%) | 1,025 (3.4%) |
| College / Associate Degree | 34,806 (77.9%) | 1,921 (4.3%) |
| Bachelor's Degree or higher | 27,608 (86.5%) | 479 (1.5%) |
| Total | 90,437 (78.3%) | 3,696 (3.2%) |
Employment Occupations by Sex in Clay County
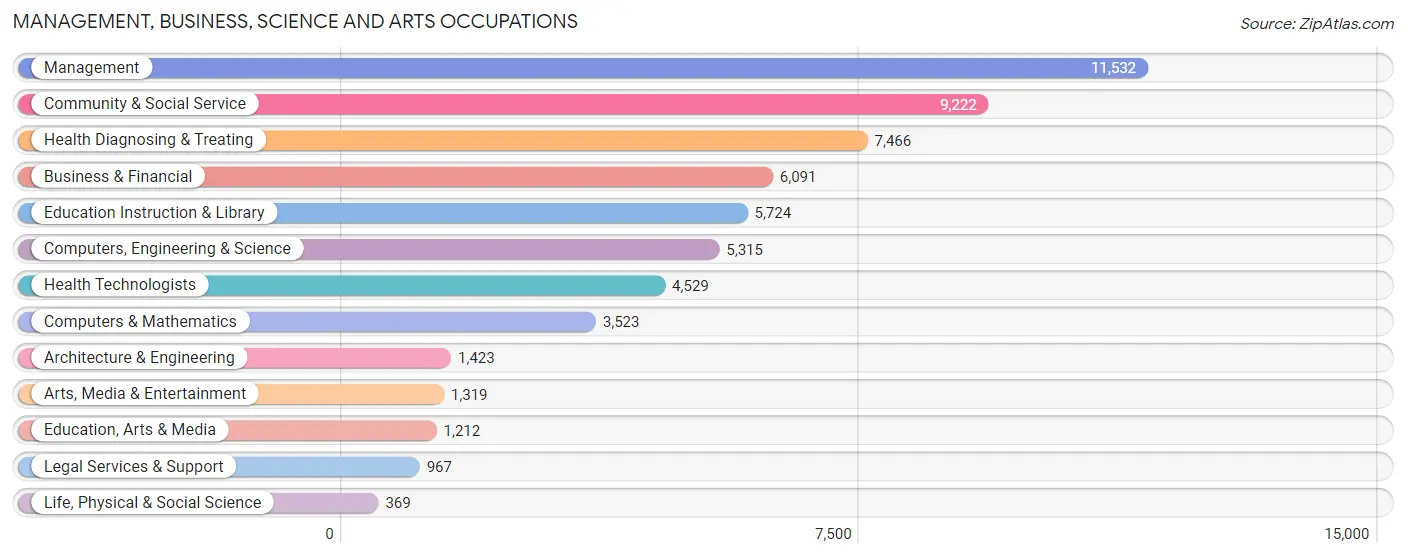
Management, Business, Science and Arts Occupations
The most common Management, Business, Science and Arts occupations in Clay County are Management (11,532 | 11.1%), Community & Social Service (9,222 | 8.9%), Health Diagnosing & Treating (7,466 | 7.2%), Business & Financial (6,091 | 5.9%), and Education Instruction & Library (5,724 | 5.5%).
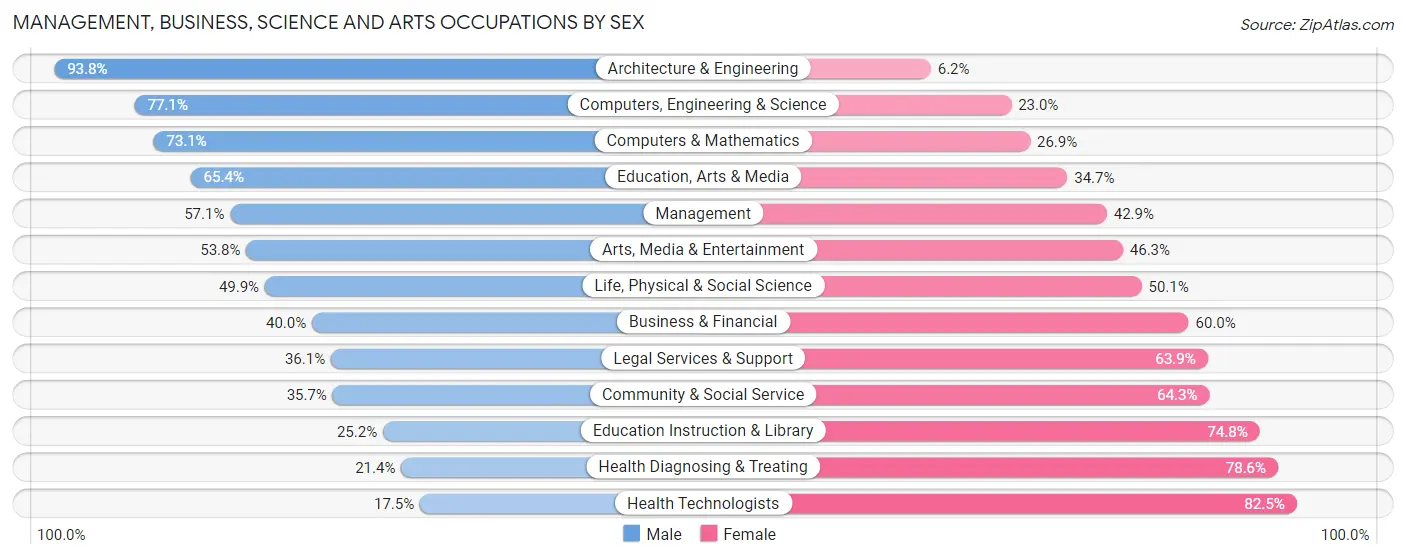
Management, Business, Science and Arts Occupations by Sex
Within the Management, Business, Science and Arts occupations in Clay County, the most male-oriented occupations are Architecture & Engineering (93.8%), Computers, Engineering & Science (77.0%), and Computers & Mathematics (73.1%), while the most female-oriented occupations are Health Technologists (82.5%), Health Diagnosing & Treating (78.6%), and Education Instruction & Library (74.8%).
| Occupation | Male | Female |
| Management | 6,585 (57.1%) | 4,947 (42.9%) |
| Business & Financial | 2,439 (40.0%) | 3,652 (60.0%) |
| Computers, Engineering & Science | 4,095 (77.0%) | 1,220 (23.0%) |
| Computers & Mathematics | 2,576 (73.1%) | 947 (26.9%) |
| Architecture & Engineering | 1,335 (93.8%) | 88 (6.2%) |
| Life, Physical & Social Science | 184 (49.9%) | 185 (50.1%) |
| Community & Social Service | 3,295 (35.7%) | 5,927 (64.3%) |
| Education, Arts & Media | 792 (65.3%) | 420 (34.6%) |
| Legal Services & Support | 349 (36.1%) | 618 (63.9%) |
| Education Instruction & Library | 1,445 (25.2%) | 4,279 (74.8%) |
| Arts, Media & Entertainment | 709 (53.7%) | 610 (46.3%) |
| Health Diagnosing & Treating | 1,600 (21.4%) | 5,866 (78.6%) |
| Health Technologists | 793 (17.5%) | 3,736 (82.5%) |
| Total (Category) | 18,014 (45.5%) | 21,612 (54.5%) |
| Total (Overall) | 53,688 (51.8%) | 49,935 (48.2%) |
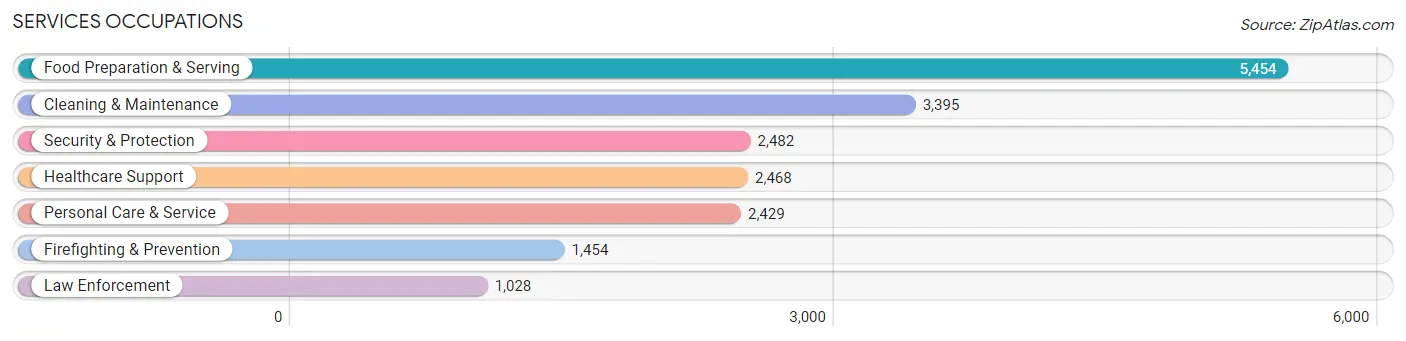
Services Occupations
The most common Services occupations in Clay County are Food Preparation & Serving (5,454 | 5.3%), Cleaning & Maintenance (3,395 | 3.3%), Security & Protection (2,482 | 2.4%), Healthcare Support (2,468 | 2.4%), and Personal Care & Service (2,429 | 2.3%).
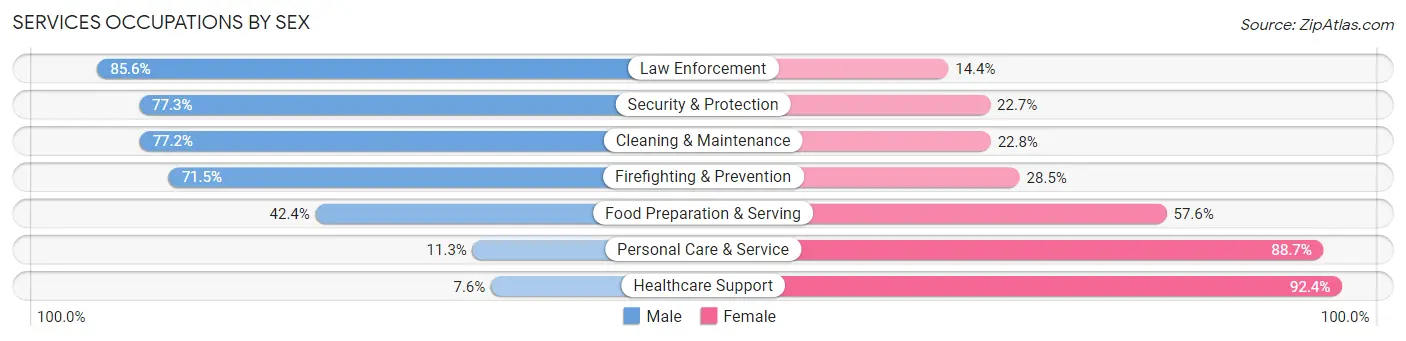
Services Occupations by Sex
Within the Services occupations in Clay County, the most male-oriented occupations are Law Enforcement (85.6%), Security & Protection (77.3%), and Cleaning & Maintenance (77.2%), while the most female-oriented occupations are Healthcare Support (92.4%), Personal Care & Service (88.7%), and Food Preparation & Serving (57.6%).
| Occupation | Male | Female |
| Healthcare Support | 188 (7.6%) | 2,280 (92.4%) |
| Security & Protection | 1,919 (77.3%) | 563 (22.7%) |
| Firefighting & Prevention | 1,039 (71.5%) | 415 (28.5%) |
| Law Enforcement | 880 (85.6%) | 148 (14.4%) |
| Food Preparation & Serving | 2,311 (42.4%) | 3,143 (57.6%) |
| Cleaning & Maintenance | 2,621 (77.2%) | 774 (22.8%) |
| Personal Care & Service | 274 (11.3%) | 2,155 (88.7%) |
| Total (Category) | 7,313 (45.1%) | 8,915 (54.9%) |
| Total (Overall) | 53,688 (51.8%) | 49,935 (48.2%) |
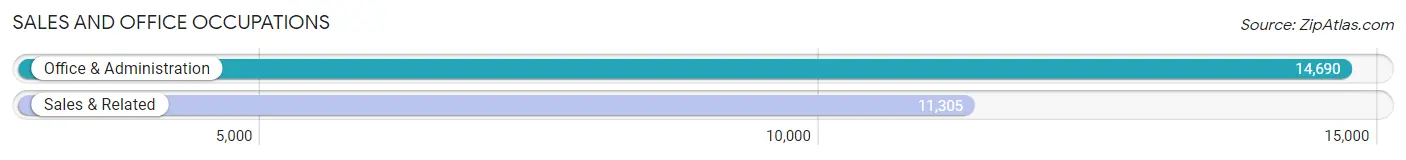
Sales and Office Occupations
The most common Sales and Office occupations in Clay County are Office & Administration (14,690 | 14.2%), and Sales & Related (11,305 | 10.9%).
Sales and Office Occupations by Sex
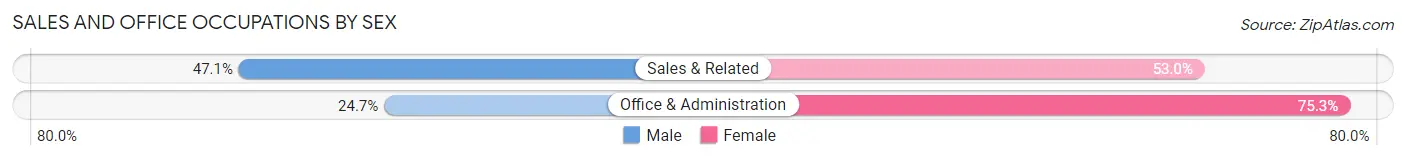
| Occupation | Male | Female |
| Sales & Related | 5,319 (47.0%) | 5,986 (52.9%) |
| Office & Administration | 3,627 (24.7%) | 11,063 (75.3%) |
| Total (Category) | 8,946 (34.4%) | 17,049 (65.6%) |
| Total (Overall) | 53,688 (51.8%) | 49,935 (48.2%) |
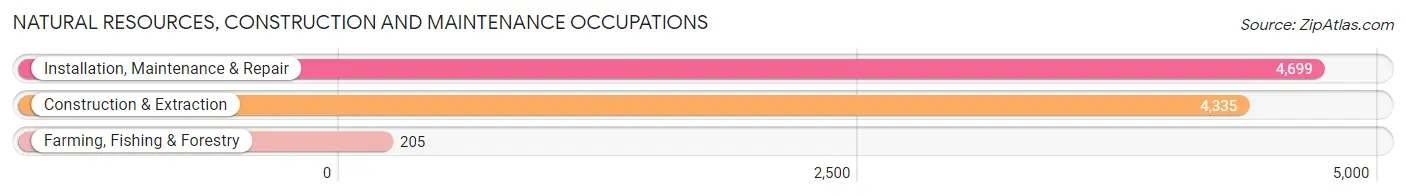
Natural Resources, Construction and Maintenance Occupations
The most common Natural Resources, Construction and Maintenance occupations in Clay County are Installation, Maintenance & Repair (4,699 | 4.5%), Construction & Extraction (4,335 | 4.2%), and Farming, Fishing & Forestry (205 | 0.2%).
Natural Resources, Construction and Maintenance Occupations by Sex
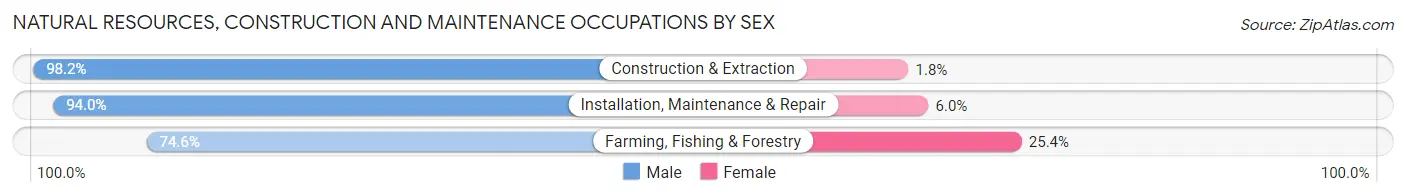
| Occupation | Male | Female |
| Farming, Fishing & Forestry | 153 (74.6%) | 52 (25.4%) |
| Construction & Extraction | 4,257 (98.2%) | 78 (1.8%) |
| Installation, Maintenance & Repair | 4,419 (94.0%) | 280 (6.0%) |
| Total (Category) | 8,829 (95.6%) | 410 (4.4%) |
| Total (Overall) | 53,688 (51.8%) | 49,935 (48.2%) |
Production, Transportation and Moving Occupations
The most common Production, Transportation and Moving occupations in Clay County are Transportation (5,159 | 5.0%), Material Moving (4,027 | 3.9%), and Production (3,349 | 3.2%).
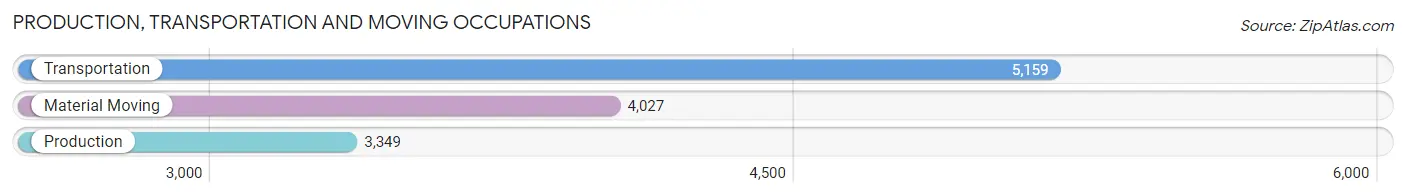
Production, Transportation and Moving Occupations by Sex
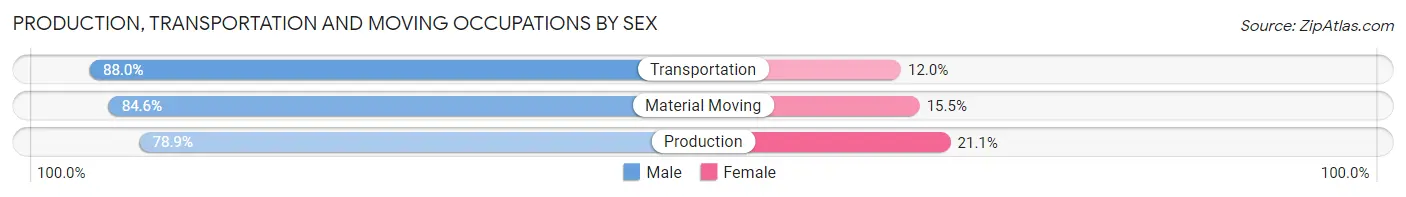
| Occupation | Male | Female |
| Production | 2,642 (78.9%) | 707 (21.1%) |
| Transportation | 4,539 (88.0%) | 620 (12.0%) |
| Material Moving | 3,405 (84.6%) | 622 (15.4%) |
| Total (Category) | 10,586 (84.5%) | 1,949 (15.5%) |
| Total (Overall) | 53,688 (51.8%) | 49,935 (48.2%) |
Employment Industries by Sex in Clay County
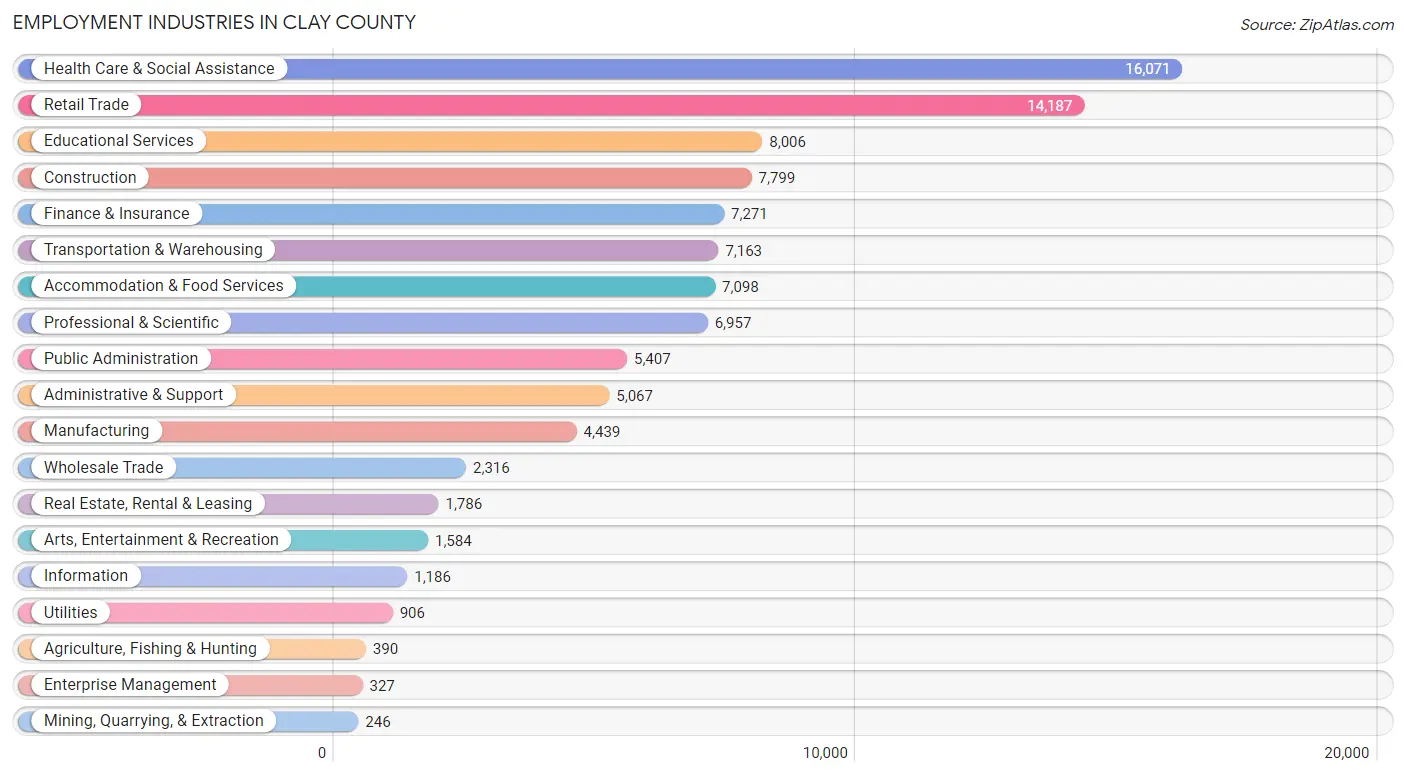
Employment Industries in Clay County
The major employment industries in Clay County include Health Care & Social Assistance (16,071 | 15.5%), Retail Trade (14,187 | 13.7%), Educational Services (8,006 | 7.7%), Construction (7,799 | 7.5%), and Finance & Insurance (7,271 | 7.0%).
Employment Industries by Sex in Clay County
The Clay County industries that see more men than women are Utilities (85.0%), Agriculture, Fishing & Hunting (81.0%), and Construction (78.1%), whereas the industries that tend to have a higher number of women are Health Care & Social Assistance (78.5%), Mining, Quarrying, & Extraction (77.6%), and Educational Services (65.5%).
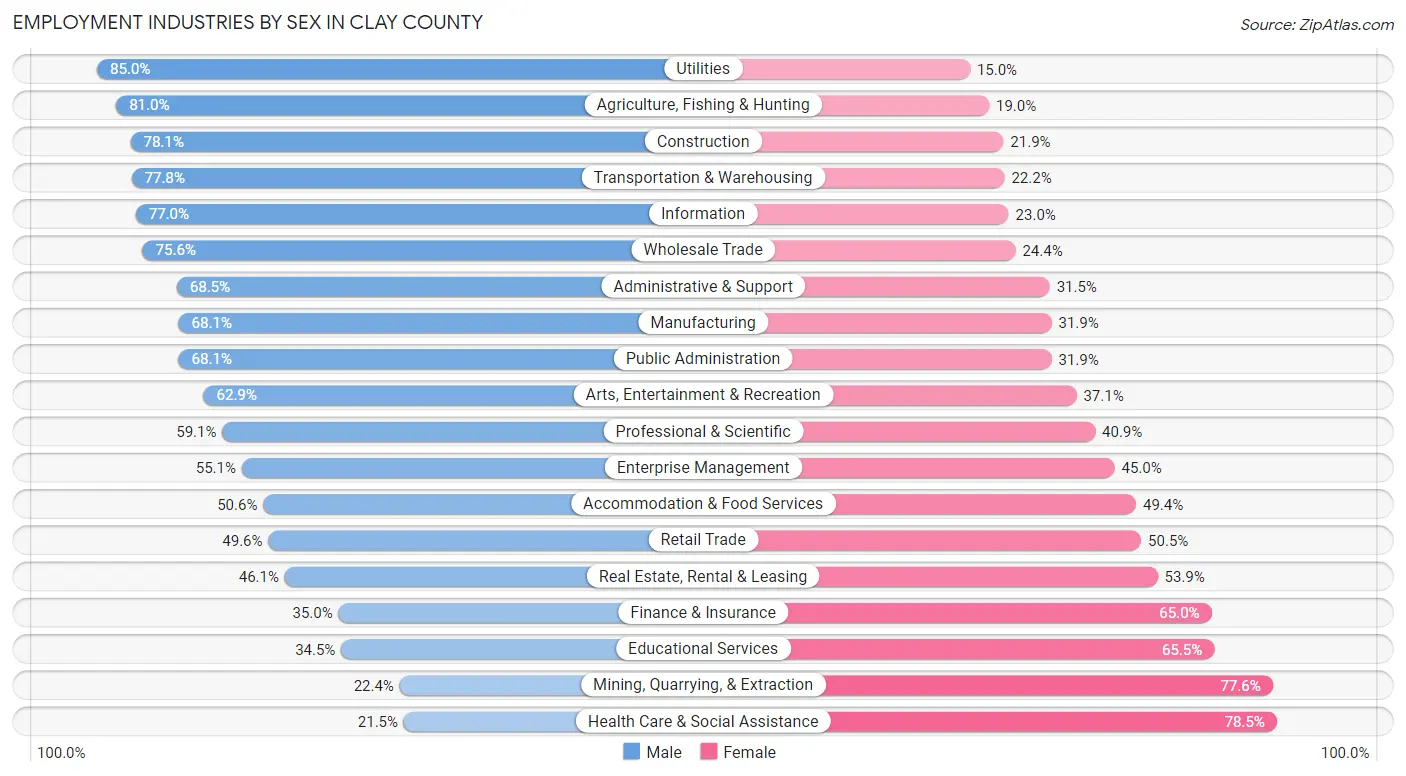
| Industry | Male | Female |
| Agriculture, Fishing & Hunting | 316 (81.0%) | 74 (19.0%) |
| Mining, Quarrying, & Extraction | 55 (22.4%) | 191 (77.6%) |
| Construction | 6,088 (78.1%) | 1,711 (21.9%) |
| Manufacturing | 3,023 (68.1%) | 1,416 (31.9%) |
| Wholesale Trade | 1,750 (75.6%) | 566 (24.4%) |
| Retail Trade | 7,029 (49.5%) | 7,158 (50.4%) |
| Transportation & Warehousing | 5,576 (77.8%) | 1,587 (22.2%) |
| Utilities | 770 (85.0%) | 136 (15.0%) |
| Information | 913 (77.0%) | 273 (23.0%) |
| Finance & Insurance | 2,546 (35.0%) | 4,725 (65.0%) |
| Real Estate, Rental & Leasing | 824 (46.1%) | 962 (53.9%) |
| Professional & Scientific | 4,110 (59.1%) | 2,847 (40.9%) |
| Enterprise Management | 180 (55.0%) | 147 (45.0%) |
| Administrative & Support | 3,470 (68.5%) | 1,597 (31.5%) |
| Educational Services | 2,760 (34.5%) | 5,246 (65.5%) |
| Health Care & Social Assistance | 3,456 (21.5%) | 12,615 (78.5%) |
| Arts, Entertainment & Recreation | 997 (62.9%) | 587 (37.1%) |
| Accommodation & Food Services | 3,592 (50.6%) | 3,506 (49.4%) |
| Public Administration | 3,682 (68.1%) | 1,725 (31.9%) |
| Total | 53,688 (51.8%) | 49,935 (48.2%) |
Education in Clay County
School Enrollment in Clay County
The most common levels of schooling among the 54,608 students in Clay County are high school (13,676 | 25.0%), middle school (12,165 | 22.3%), and elementary school (10,530 | 19.3%).

| School Level | # Students | % Students |
| Nursery / Preschool | 3,119 | 5.7% |
| Kindergarten | 2,782 | 5.1% |
| Elementary School | 10,530 | 19.3% |
| Middle School | 12,165 | 22.3% |
| High School | 13,676 | 25.0% |
| College / Undergraduate | 10,116 | 18.5% |
| Graduate / Professional | 2,220 | 4.1% |
| Total | 54,608 | 100.0% |
School Enrollment by Age by Funding Source in Clay County
Out of a total of 54,608 students who are enrolled in schools in Clay County, 8,519 (15.6%) attend a private institution, while the remaining 46,089 (84.4%) are enrolled in public schools. The age group of 3 to 4 year olds has the highest likelihood of being enrolled in private schools, with 944 (42.7% in the age bracket) enrolled. Conversely, the age group of 10 to 14 year olds has the lowest likelihood of being enrolled in a private school, with 13,821 (89.6% in the age bracket) attending a public institution.
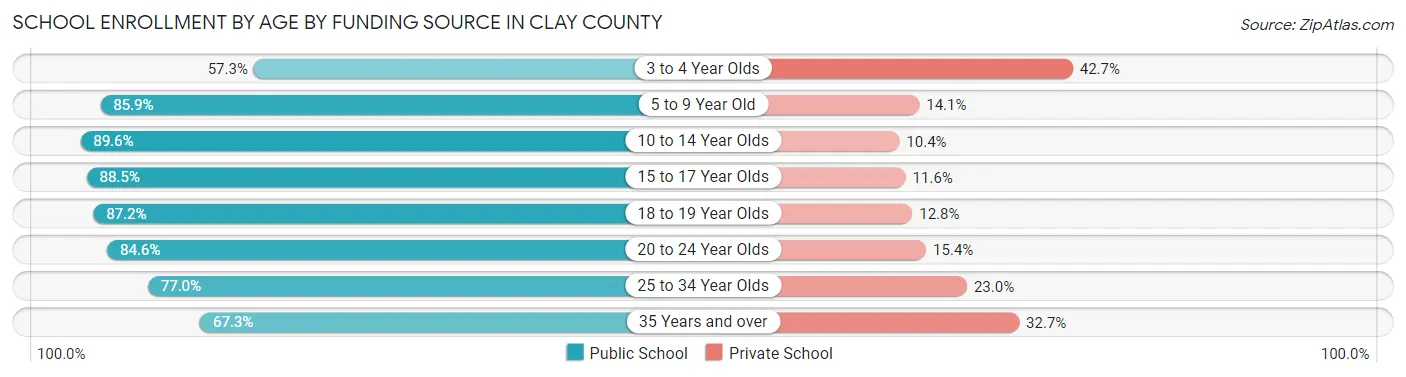
| Age Bracket | Public School | Private School |
| 3 to 4 Year Olds | 1,268 (57.3%) | 944 (42.7%) |
| 5 to 9 Year Old | 10,851 (85.9%) | 1,779 (14.1%) |
| 10 to 14 Year Olds | 13,821 (89.6%) | 1,601 (10.4%) |
| 15 to 17 Year Olds | 8,410 (88.4%) | 1,098 (11.6%) |
| 18 to 19 Year Olds | 2,796 (87.2%) | 410 (12.8%) |
| 20 to 24 Year Olds | 3,598 (84.6%) | 653 (15.4%) |
| 25 to 34 Year Olds | 3,132 (77.0%) | 934 (23.0%) |
| 35 Years and over | 2,230 (67.3%) | 1,083 (32.7%) |
| Total | 46,089 (84.4%) | 8,519 (15.6%) |
Educational Attainment by Field of Study in Clay County
Business (9,855 | 22.1%), education (6,579 | 14.8%), science & technology (6,125 | 13.8%), arts & humanities (3,183 | 7.1%), and engineering (3,118 | 7.0%) are the most common fields of study among 44,515 individuals in Clay County who have obtained a bachelor's degree or higher.
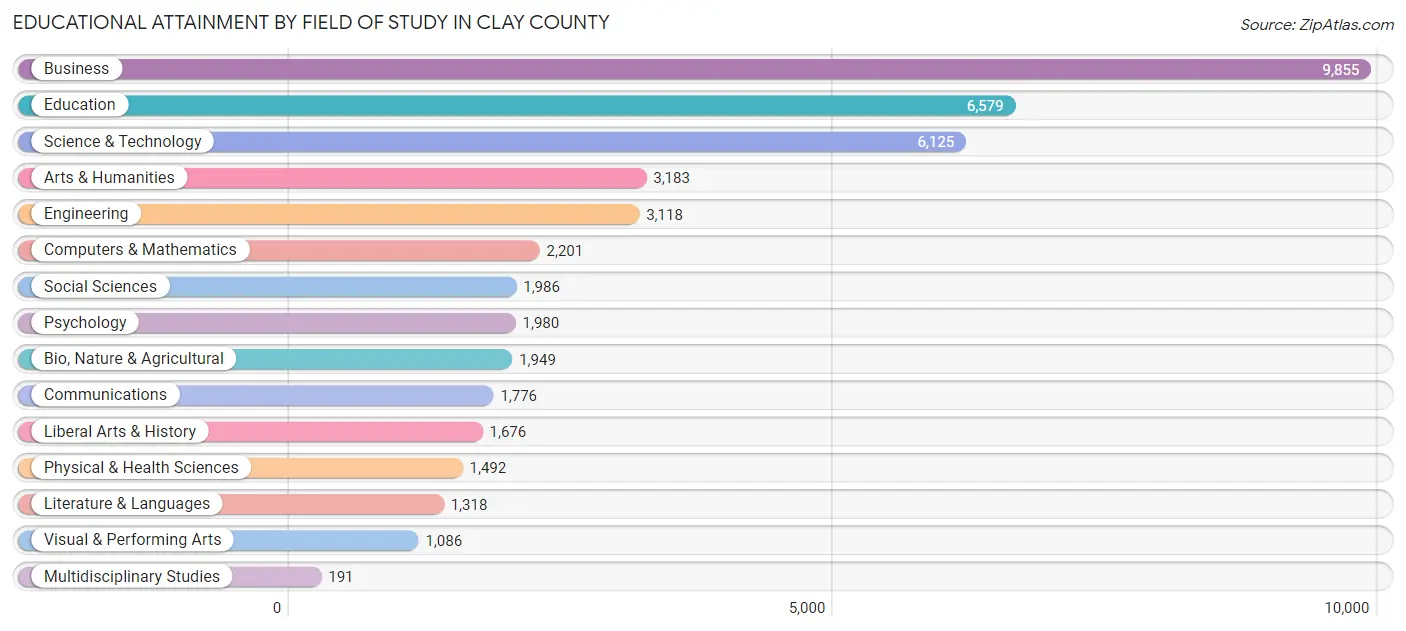
| Field of Study | # Graduates | % Graduates |
| Computers & Mathematics | 2,201 | 4.9% |
| Bio, Nature & Agricultural | 1,949 | 4.4% |
| Physical & Health Sciences | 1,492 | 3.4% |
| Psychology | 1,980 | 4.4% |
| Social Sciences | 1,986 | 4.5% |
| Engineering | 3,118 | 7.0% |
| Multidisciplinary Studies | 191 | 0.4% |
| Science & Technology | 6,125 | 13.8% |
| Business | 9,855 | 22.1% |
| Education | 6,579 | 14.8% |
| Literature & Languages | 1,318 | 3.0% |
| Liberal Arts & History | 1,676 | 3.8% |
| Visual & Performing Arts | 1,086 | 2.4% |
| Communications | 1,776 | 4.0% |
| Arts & Humanities | 3,183 | 7.1% |
| Total | 44,515 | 100.0% |
Transportation & Commute in Clay County
Vehicle Availability by Sex in Clay County
The most prevalent vehicle ownership categories in Clay County are males with 2 vehicles (24,897, accounting for 45.4%) and females with 2 vehicles (19,475, making up 51.0%).
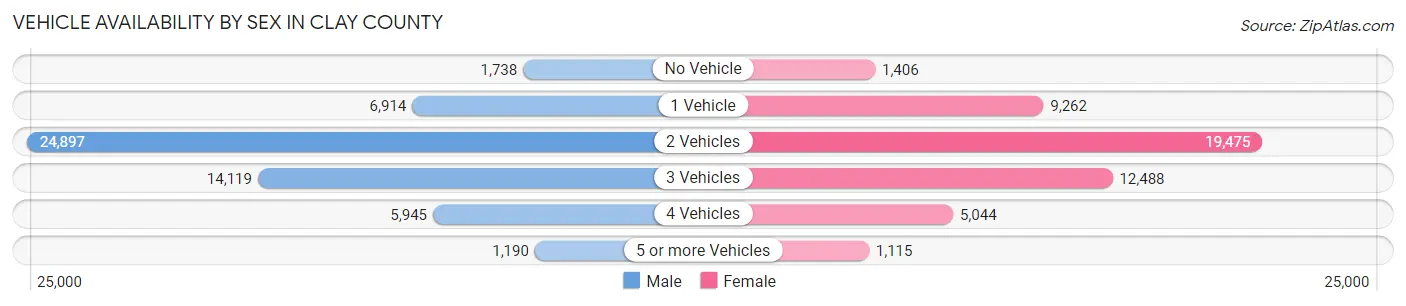
| Vehicles Available | Male | Female |
| No Vehicle | 1,738 (3.2%) | 1,406 (2.9%) |
| 1 Vehicle | 6,914 (12.6%) | 9,262 (19.0%) |
| 2 Vehicles | 24,897 (45.4%) | 19,475 (39.9%) |
| 3 Vehicles | 14,119 (25.8%) | 12,488 (25.6%) |
| 4 Vehicles | 5,945 (10.8%) | 5,044 (10.3%) |
| 5 or more Vehicles | 1,190 (2.2%) | 1,115 (2.3%) |
| Total | 54,803 (100.0%) | 48,790 (100.0%) |
Commute Time in Clay County
The most frequently occuring commute durations in Clay County are 30 to 34 minutes (15,927 commuters, 17.6%), 45 to 59 minutes (14,065 commuters, 15.5%), and 20 to 24 minutes (10,696 commuters, 11.8%).
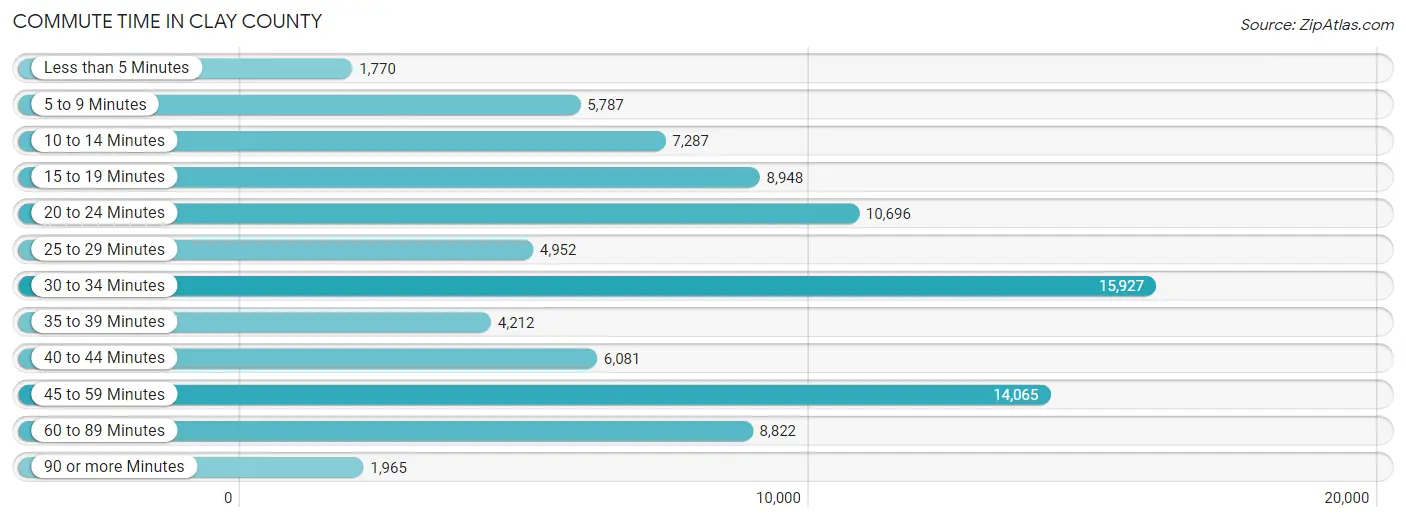
| Commute Time | # Commuters | % Commuters |
| Less than 5 Minutes | 1,770 | 2.0% |
| 5 to 9 Minutes | 5,787 | 6.4% |
| 10 to 14 Minutes | 7,287 | 8.1% |
| 15 to 19 Minutes | 8,948 | 9.9% |
| 20 to 24 Minutes | 10,696 | 11.8% |
| 25 to 29 Minutes | 4,952 | 5.5% |
| 30 to 34 Minutes | 15,927 | 17.6% |
| 35 to 39 Minutes | 4,212 | 4.6% |
| 40 to 44 Minutes | 6,081 | 6.7% |
| 45 to 59 Minutes | 14,065 | 15.5% |
| 60 to 89 Minutes | 8,822 | 9.8% |
| 90 or more Minutes | 1,965 | 2.2% |
Commute Time by Sex in Clay County
The most common commute times in Clay County are 30 to 34 minutes (9,567 commuters, 19.4%) for males and 30 to 34 minutes (6,360 commuters, 15.5%) for females.
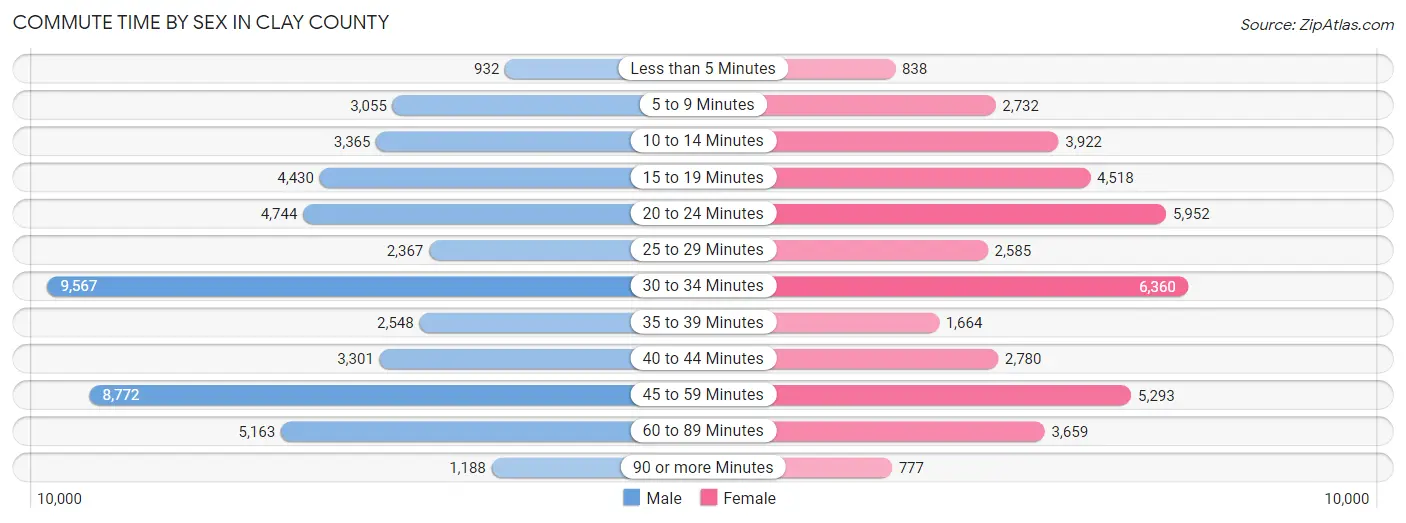
| Commute Time | Male | Female |
| Less than 5 Minutes | 932 (1.9%) | 838 (2.0%) |
| 5 to 9 Minutes | 3,055 (6.2%) | 2,732 (6.7%) |
| 10 to 14 Minutes | 3,365 (6.8%) | 3,922 (9.6%) |
| 15 to 19 Minutes | 4,430 (9.0%) | 4,518 (11.0%) |
| 20 to 24 Minutes | 4,744 (9.6%) | 5,952 (14.5%) |
| 25 to 29 Minutes | 2,367 (4.8%) | 2,585 (6.3%) |
| 30 to 34 Minutes | 9,567 (19.4%) | 6,360 (15.5%) |
| 35 to 39 Minutes | 2,548 (5.1%) | 1,664 (4.1%) |
| 40 to 44 Minutes | 3,301 (6.7%) | 2,780 (6.8%) |
| 45 to 59 Minutes | 8,772 (17.7%) | 5,293 (12.9%) |
| 60 to 89 Minutes | 5,163 (10.4%) | 3,659 (8.9%) |
| 90 or more Minutes | 1,188 (2.4%) | 777 (1.9%) |
Time of Departure to Work by Sex in Clay County
The most frequent times of departure to work in Clay County are 6:00 AM to 6:29 AM (6,646, 13.4%) for males and 7:00 AM to 7:29 AM (6,808, 16.6%) for females.
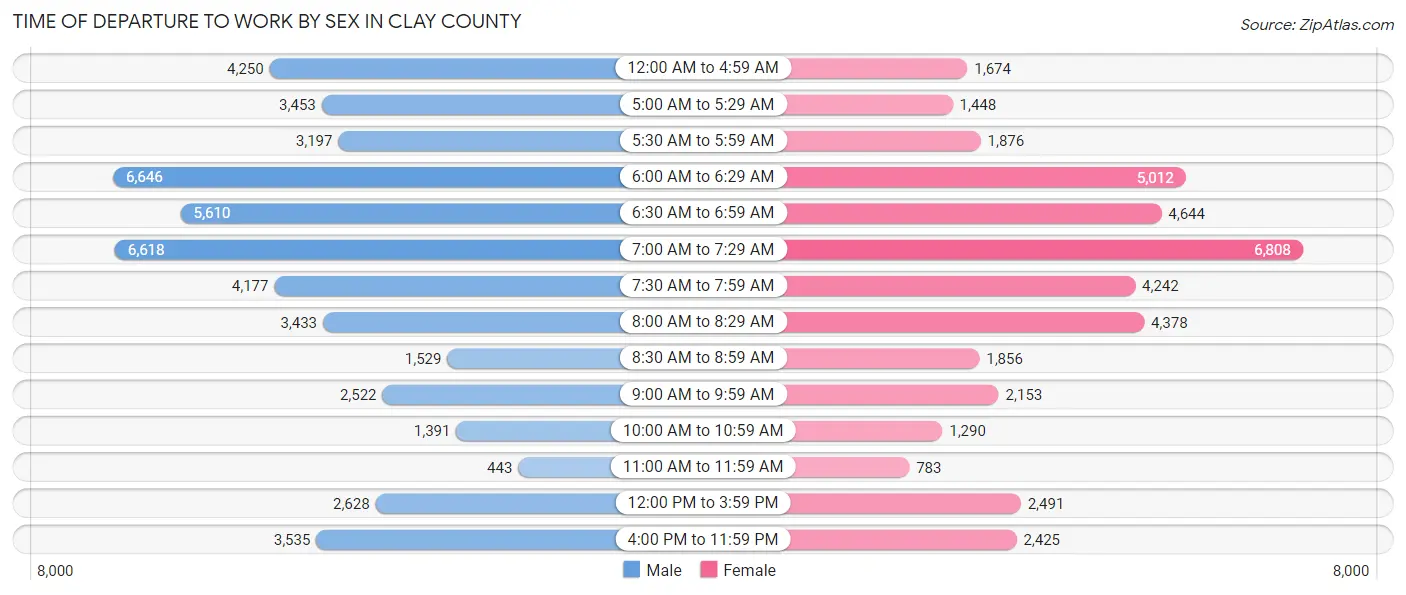
| Time of Departure | Male | Female |
| 12:00 AM to 4:59 AM | 4,250 (8.6%) | 1,674 (4.1%) |
| 5:00 AM to 5:29 AM | 3,453 (7.0%) | 1,448 (3.5%) |
| 5:30 AM to 5:59 AM | 3,197 (6.5%) | 1,876 (4.6%) |
| 6:00 AM to 6:29 AM | 6,646 (13.4%) | 5,012 (12.2%) |
| 6:30 AM to 6:59 AM | 5,610 (11.4%) | 4,644 (11.3%) |
| 7:00 AM to 7:29 AM | 6,618 (13.4%) | 6,808 (16.6%) |
| 7:30 AM to 7:59 AM | 4,177 (8.5%) | 4,242 (10.3%) |
| 8:00 AM to 8:29 AM | 3,433 (6.9%) | 4,378 (10.7%) |
| 8:30 AM to 8:59 AM | 1,529 (3.1%) | 1,856 (4.5%) |
| 9:00 AM to 9:59 AM | 2,522 (5.1%) | 2,153 (5.2%) |
| 10:00 AM to 10:59 AM | 1,391 (2.8%) | 1,290 (3.1%) |
| 11:00 AM to 11:59 AM | 443 (0.9%) | 783 (1.9%) |
| 12:00 PM to 3:59 PM | 2,628 (5.3%) | 2,491 (6.1%) |
| 4:00 PM to 11:59 PM | 3,535 (7.1%) | 2,425 (5.9%) |
| Total | 49,432 (100.0%) | 41,080 (100.0%) |
Housing Occupancy in Clay County
Occupancy by Ownership in Clay County
Of the total 79,704 dwellings in Clay County, owner-occupied units account for 61,040 (76.6%), while renter-occupied units make up 18,664 (23.4%).
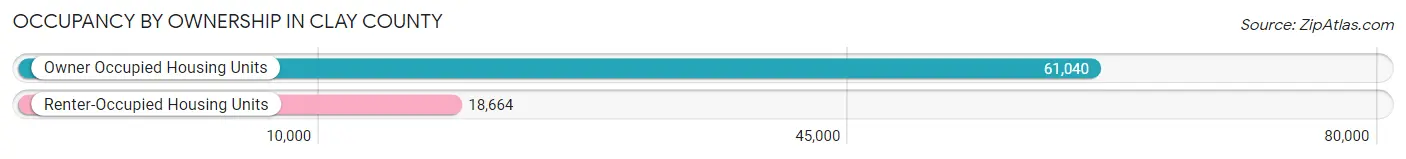
| Occupancy | # Housing Units | % Housing Units |
| Owner Occupied Housing Units | 61,040 | 76.6% |
| Renter-Occupied Housing Units | 18,664 | 23.4% |
| Total Occupied Housing Units | 79,704 | 100.0% |
Occupancy by Household Size in Clay County
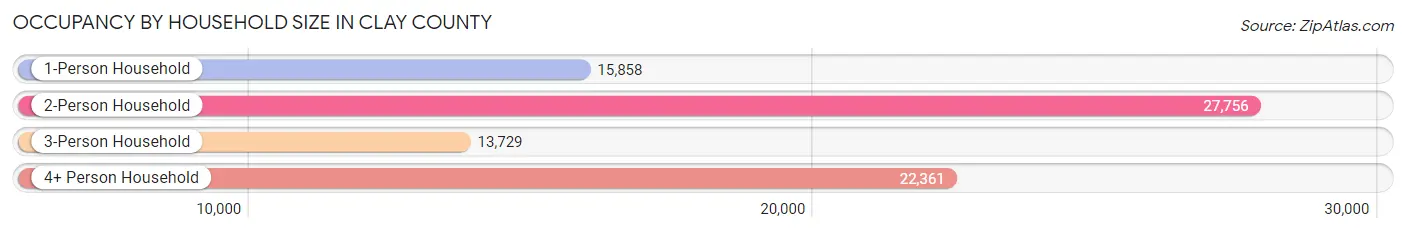
| Household Size | # Housing Units | % Housing Units |
| 1-Person Household | 15,858 | 19.9% |
| 2-Person Household | 27,756 | 34.8% |
| 3-Person Household | 13,729 | 17.2% |
| 4+ Person Household | 22,361 | 28.1% |
| Total Housing Units | 79,704 | 100.0% |
Occupancy by Ownership by Household Size in Clay County
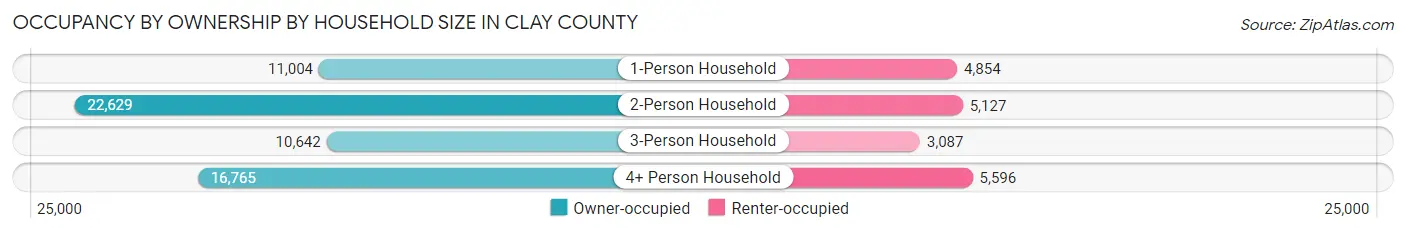
| Household Size | Owner-occupied | Renter-occupied |
| 1-Person Household | 11,004 (69.4%) | 4,854 (30.6%) |
| 2-Person Household | 22,629 (81.5%) | 5,127 (18.5%) |
| 3-Person Household | 10,642 (77.5%) | 3,087 (22.5%) |
| 4+ Person Household | 16,765 (75.0%) | 5,596 (25.0%) |
| Total Housing Units | 61,040 (76.6%) | 18,664 (23.4%) |
Occupancy by Educational Attainment in Clay County
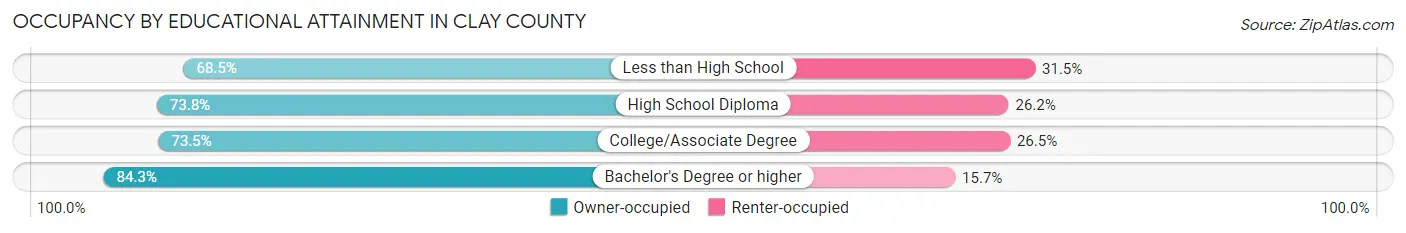
| Household Size | Owner-occupied | Renter-occupied |
| Less than High School | 3,175 (68.5%) | 1,461 (31.5%) |
| High School Diploma | 14,458 (73.8%) | 5,144 (26.2%) |
| College/Associate Degree | 22,812 (73.5%) | 8,236 (26.5%) |
| Bachelor's Degree or higher | 20,595 (84.3%) | 3,823 (15.7%) |
Occupancy by Age of Householder in Clay County
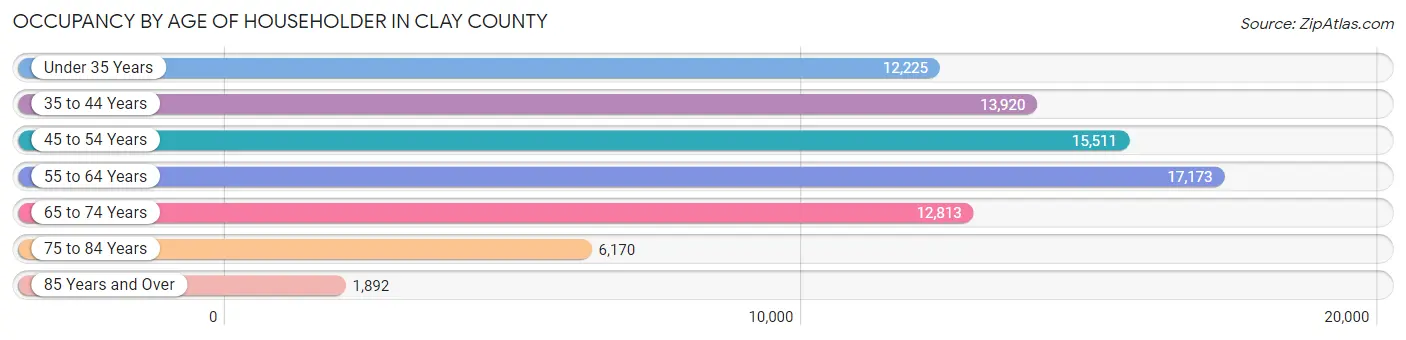
| Age Bracket | # Households | % Households |
| Under 35 Years | 12,225 | 15.3% |
| 35 to 44 Years | 13,920 | 17.5% |
| 45 to 54 Years | 15,511 | 19.5% |
| 55 to 64 Years | 17,173 | 21.5% |
| 65 to 74 Years | 12,813 | 16.1% |
| 75 to 84 Years | 6,170 | 7.7% |
| 85 Years and Over | 1,892 | 2.4% |
| Total | 79,704 | 100.0% |
Housing Finances in Clay County
Median Income by Occupancy in Clay County
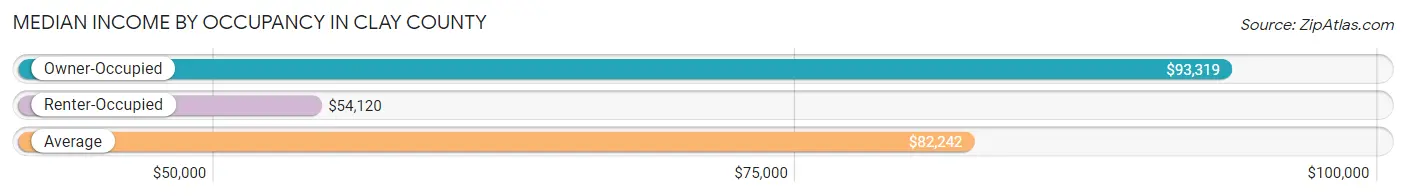
| Occupancy Type | # Households | Median Income |
| Owner-Occupied | 61,040 (76.6%) | $93,319 |
| Renter-Occupied | 18,664 (23.4%) | $54,120 |
| Average | 79,704 (100.0%) | $82,242 |
Occupancy by Householder Income Bracket in Clay County
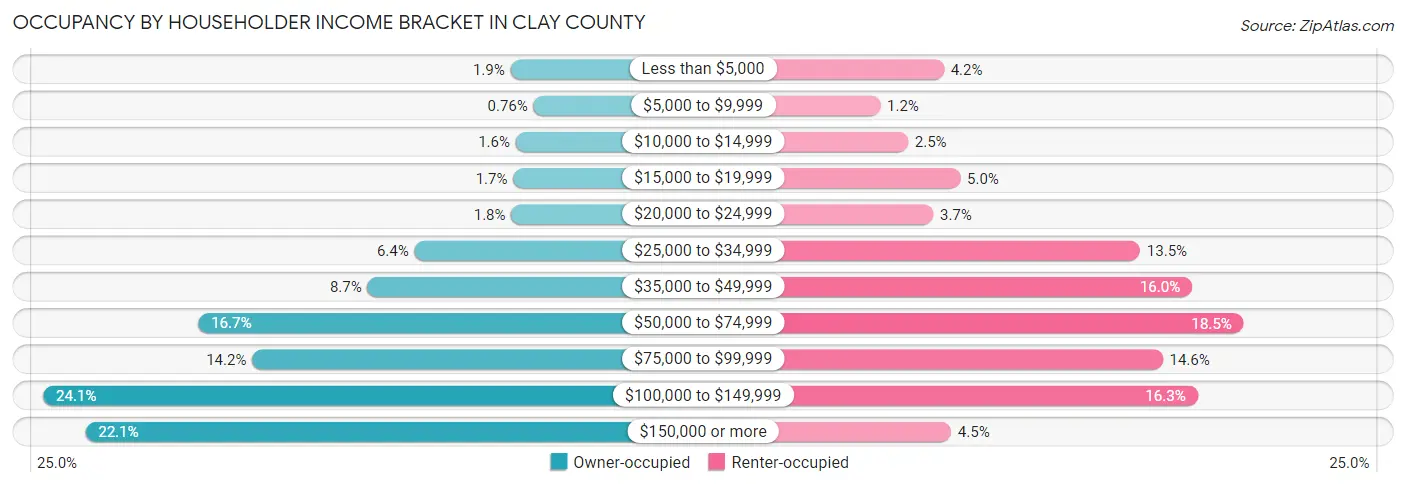
| Income Bracket | Owner-occupied | Renter-occupied |
| Less than $5,000 | 1,136 (1.9%) | 783 (4.2%) |
| $5,000 to $9,999 | 464 (0.8%) | 218 (1.2%) |
| $10,000 to $14,999 | 985 (1.6%) | 464 (2.5%) |
| $15,000 to $19,999 | 1,056 (1.7%) | 929 (5.0%) |
| $20,000 to $24,999 | 1,108 (1.8%) | 688 (3.7%) |
| $25,000 to $34,999 | 3,926 (6.4%) | 2,528 (13.5%) |
| $35,000 to $49,999 | 5,293 (8.7%) | 2,990 (16.0%) |
| $50,000 to $74,999 | 10,209 (16.7%) | 3,449 (18.5%) |
| $75,000 to $99,999 | 8,643 (14.2%) | 2,729 (14.6%) |
| $100,000 to $149,999 | 14,725 (24.1%) | 3,038 (16.3%) |
| $150,000 or more | 13,495 (22.1%) | 848 (4.5%) |
| Total | 61,040 (100.0%) | 18,664 (100.0%) |
Monthly Housing Cost Tiers in Clay County
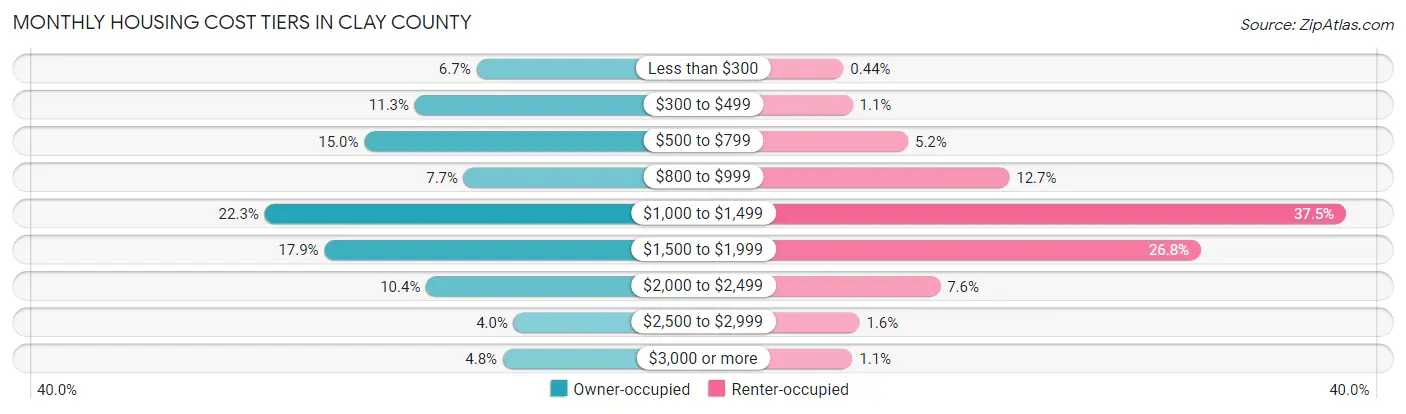
| Monthly Cost | Owner-occupied | Renter-occupied |
| Less than $300 | 4,099 (6.7%) | 83 (0.4%) |
| $300 to $499 | 6,872 (11.3%) | 209 (1.1%) |
| $500 to $799 | 9,144 (15.0%) | 970 (5.2%) |
| $800 to $999 | 4,671 (7.6%) | 2,362 (12.7%) |
| $1,000 to $1,499 | 13,622 (22.3%) | 6,990 (37.4%) |
| $1,500 to $1,999 | 10,936 (17.9%) | 4,996 (26.8%) |
| $2,000 to $2,499 | 6,361 (10.4%) | 1,413 (7.6%) |
| $2,500 to $2,999 | 2,426 (4.0%) | 304 (1.6%) |
| $3,000 or more | 2,909 (4.8%) | 206 (1.1%) |
| Total | 61,040 (100.0%) | 18,664 (100.0%) |
Physical Housing Characteristics in Clay County
Housing Structures in Clay County
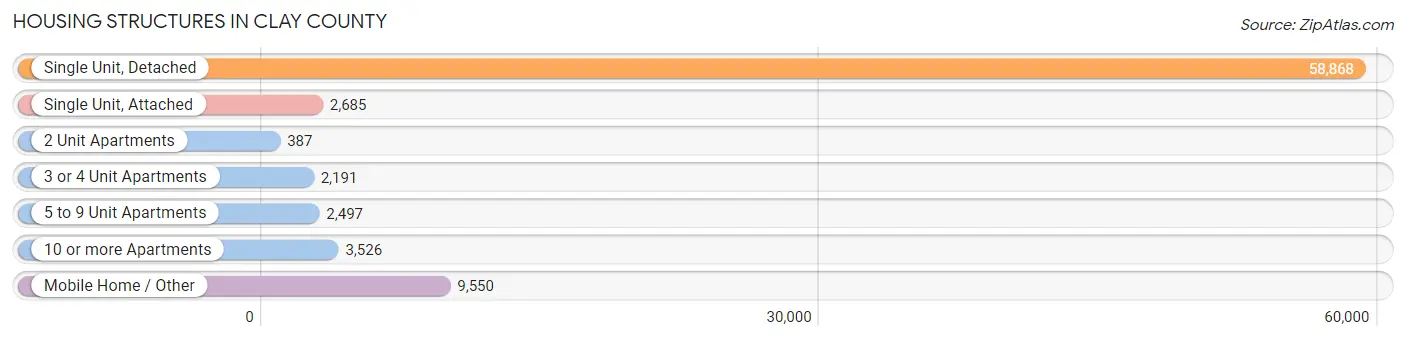
| Structure Type | # Housing Units | % Housing Units |
| Single Unit, Detached | 58,868 | 73.9% |
| Single Unit, Attached | 2,685 | 3.4% |
| 2 Unit Apartments | 387 | 0.5% |
| 3 or 4 Unit Apartments | 2,191 | 2.8% |
| 5 to 9 Unit Apartments | 2,497 | 3.1% |
| 10 or more Apartments | 3,526 | 4.4% |
| Mobile Home / Other | 9,550 | 12.0% |
| Total | 79,704 | 100.0% |
Housing Structures by Occupancy in Clay County
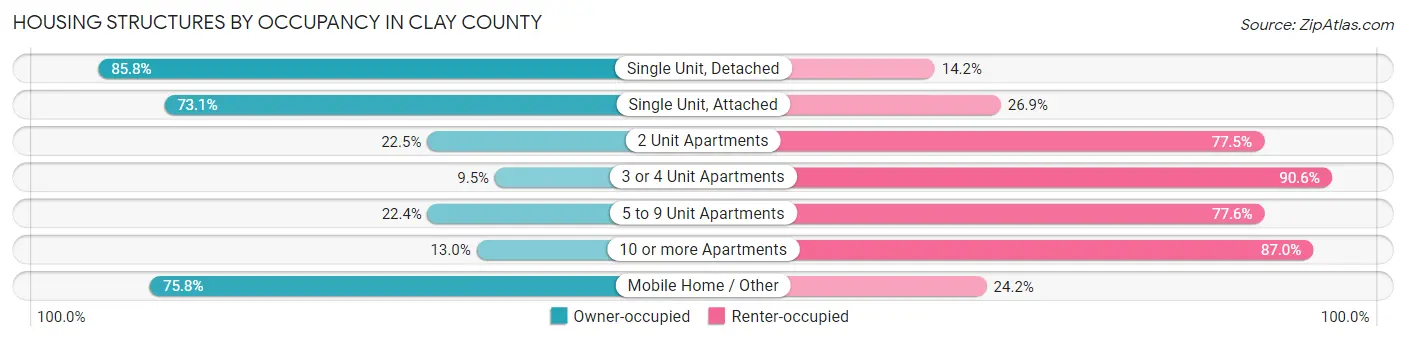
| Structure Type | Owner-occupied | Renter-occupied |
| Single Unit, Detached | 50,523 (85.8%) | 8,345 (14.2%) |
| Single Unit, Attached | 1,963 (73.1%) | 722 (26.9%) |
| 2 Unit Apartments | 87 (22.5%) | 300 (77.5%) |
| 3 or 4 Unit Apartments | 207 (9.5%) | 1,984 (90.5%) |
| 5 to 9 Unit Apartments | 559 (22.4%) | 1,938 (77.6%) |
| 10 or more Apartments | 458 (13.0%) | 3,068 (87.0%) |
| Mobile Home / Other | 7,243 (75.8%) | 2,307 (24.2%) |
| Total | 61,040 (76.6%) | 18,664 (23.4%) |
Housing Structures by Number of Rooms in Clay County
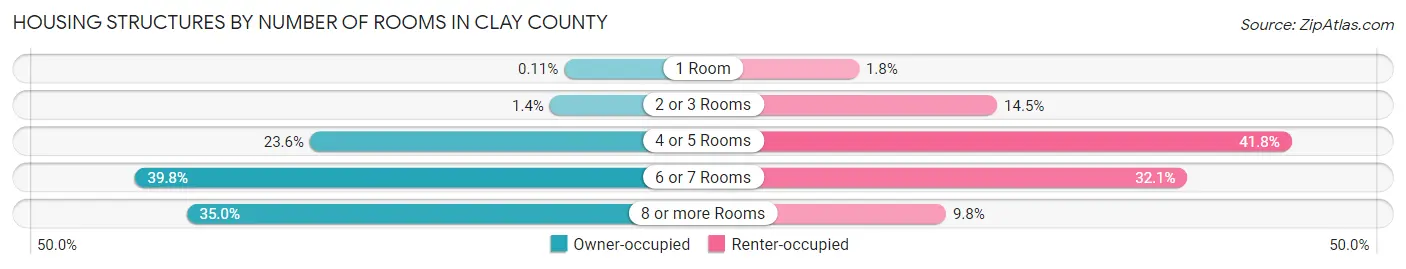
| Number of Rooms | Owner-occupied | Renter-occupied |
| 1 Room | 66 (0.1%) | 329 (1.8%) |
| 2 or 3 Rooms | 877 (1.4%) | 2,713 (14.5%) |
| 4 or 5 Rooms | 14,416 (23.6%) | 7,795 (41.8%) |
| 6 or 7 Rooms | 24,304 (39.8%) | 5,996 (32.1%) |
| 8 or more Rooms | 21,377 (35.0%) | 1,831 (9.8%) |
| Total | 61,040 (100.0%) | 18,664 (100.0%) |
Housing Structure by Heating Type in Clay County
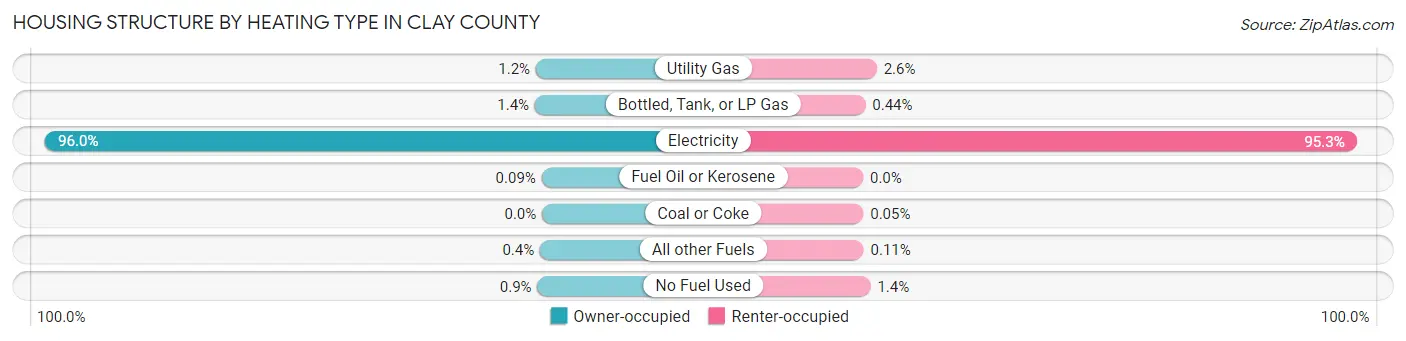
| Heating Type | Owner-occupied | Renter-occupied |
| Utility Gas | 728 (1.2%) | 493 (2.6%) |
| Bottled, Tank, or LP Gas | 850 (1.4%) | 82 (0.4%) |
| Electricity | 58,614 (96.0%) | 17,794 (95.3%) |
| Fuel Oil or Kerosene | 55 (0.1%) | 0 (0.0%) |
| Coal or Coke | 0 (0.0%) | 9 (0.1%) |
| All other Fuels | 243 (0.4%) | 20 (0.1%) |
| No Fuel Used | 550 (0.9%) | 266 (1.4%) |
| Total | 61,040 (100.0%) | 18,664 (100.0%) |
Household Vehicle Usage in Clay County
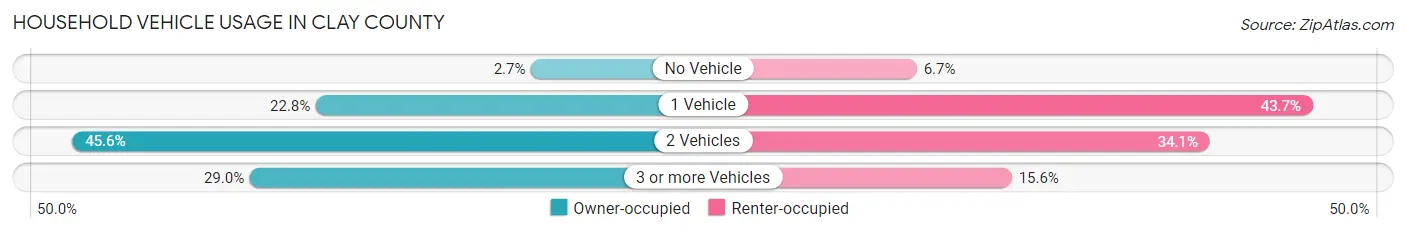
| Vehicles per Household | Owner-occupied | Renter-occupied |
| No Vehicle | 1,647 (2.7%) | 1,251 (6.7%) |
| 1 Vehicle | 13,910 (22.8%) | 8,150 (43.7%) |
| 2 Vehicles | 27,805 (45.6%) | 6,357 (34.1%) |
| 3 or more Vehicles | 17,678 (29.0%) | 2,906 (15.6%) |
| Total | 61,040 (100.0%) | 18,664 (100.0%) |
Real Estate & Mortgages in Clay County
Real Estate and Mortgage Overview in Clay County
| Characteristic | Without Mortgage | With Mortgage |
| Housing Units | 19,824 | 41,216 |
| Median Property Value | $228,400 | $264,500 |
| Median Household Income | $70,048 | $10,598 |
| Monthly Housing Costs | $478 | $2,888 |
| Real Estate Taxes | $1,714 | $1,952 |
Property Value by Mortgage Status in Clay County
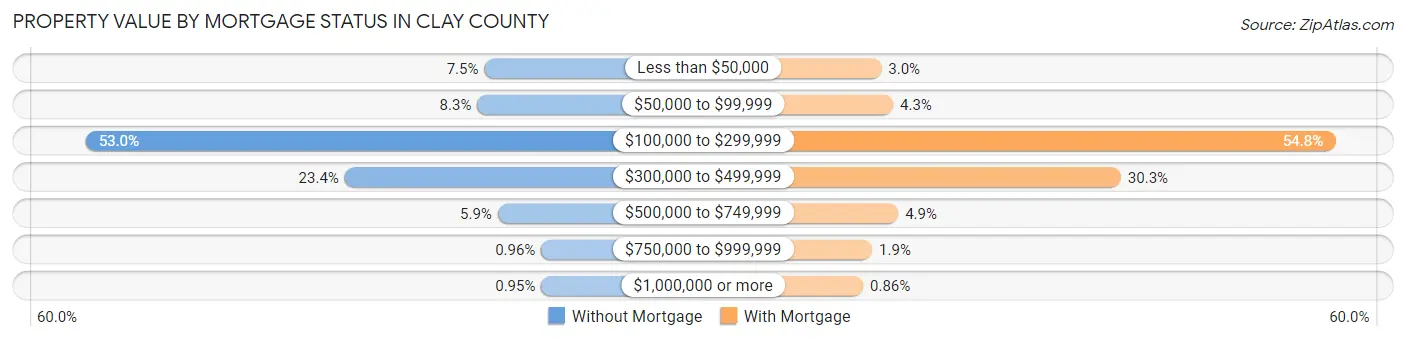
| Property Value | Without Mortgage | With Mortgage |
| Less than $50,000 | 1,479 (7.5%) | 1,216 (2.9%) |
| $50,000 to $99,999 | 1,639 (8.3%) | 1,769 (4.3%) |
| $100,000 to $299,999 | 10,508 (53.0%) | 22,582 (54.8%) |
| $300,000 to $499,999 | 4,643 (23.4%) | 12,499 (30.3%) |
| $500,000 to $749,999 | 1,175 (5.9%) | 2,013 (4.9%) |
| $750,000 to $999,999 | 191 (1.0%) | 783 (1.9%) |
| $1,000,000 or more | 189 (0.9%) | 354 (0.9%) |
| Total | 19,824 (100.0%) | 41,216 (100.0%) |
Household Income by Mortgage Status in Clay County
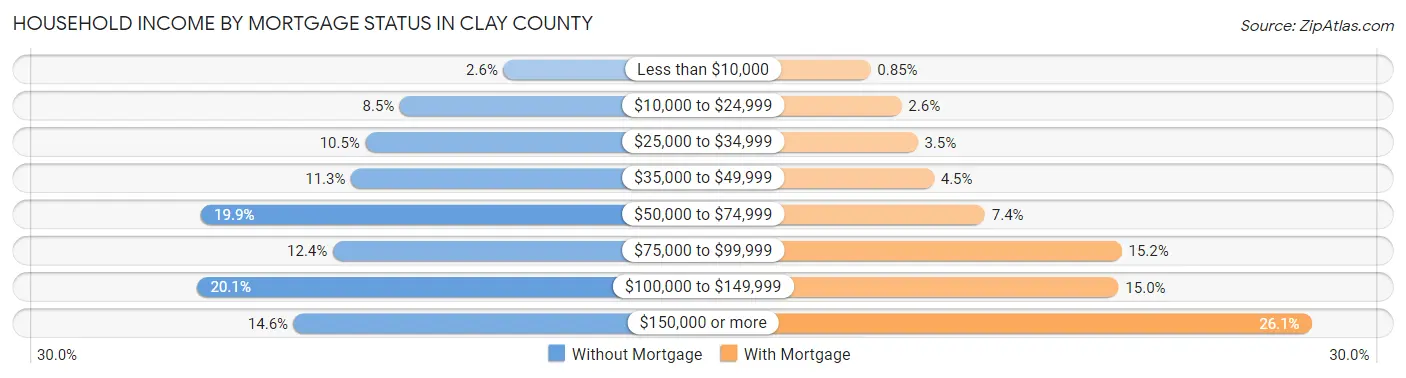
| Household Income | Without Mortgage | With Mortgage |
| Less than $10,000 | 519 (2.6%) | 349 (0.9%) |
| $10,000 to $24,999 | 1,692 (8.5%) | 1,081 (2.6%) |
| $25,000 to $34,999 | 2,083 (10.5%) | 1,457 (3.5%) |
| $35,000 to $49,999 | 2,247 (11.3%) | 1,843 (4.5%) |
| $50,000 to $74,999 | 3,946 (19.9%) | 3,046 (7.4%) |
| $75,000 to $99,999 | 2,452 (12.4%) | 6,263 (15.2%) |
| $100,000 to $149,999 | 3,988 (20.1%) | 6,191 (15.0%) |
| $150,000 or more | 2,897 (14.6%) | 10,737 (26.1%) |
| Total | 19,824 (100.0%) | 41,216 (100.0%) |
Property Value to Household Income Ratio in Clay County
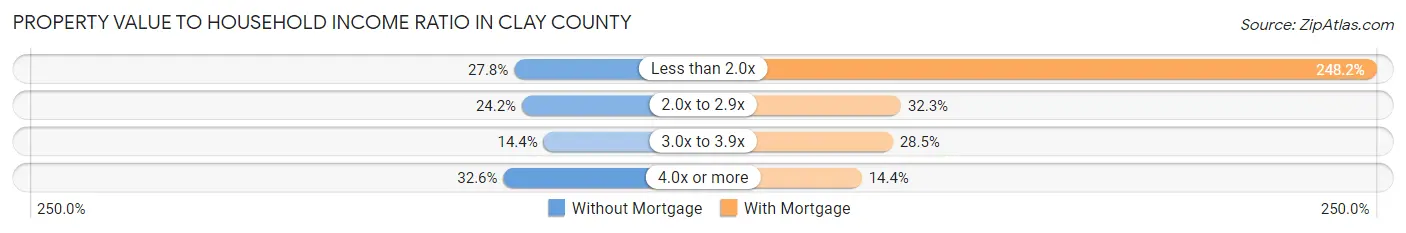
| Value-to-Income Ratio | Without Mortgage | With Mortgage |
| Less than 2.0x | 5,501 (27.8%) | 102,312 (248.2%) |
| 2.0x to 2.9x | 4,797 (24.2%) | 13,291 (32.3%) |
| 3.0x to 3.9x | 2,849 (14.4%) | 11,745 (28.5%) |
| 4.0x or more | 6,466 (32.6%) | 5,948 (14.4%) |
| Total | 19,824 (100.0%) | 41,216 (100.0%) |
Real Estate Taxes by Mortgage Status in Clay County
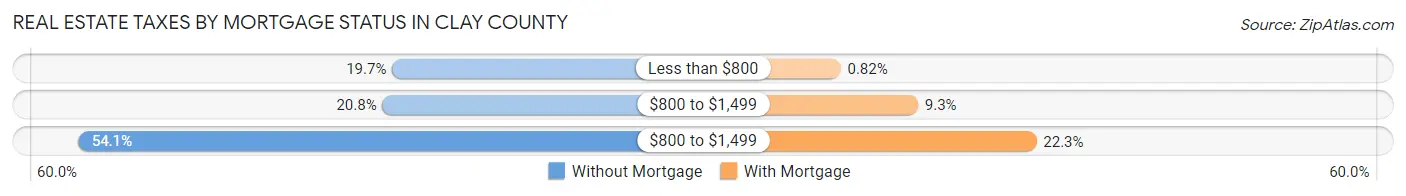
| Property Taxes | Without Mortgage | With Mortgage |
| Less than $800 | 3,907 (19.7%) | 340 (0.8%) |
| $800 to $1,499 | 4,119 (20.8%) | 3,831 (9.3%) |
| $800 to $1,499 | 10,717 (54.1%) | 9,184 (22.3%) |
| Total | 19,824 (100.0%) | 41,216 (100.0%) |
Health & Disability in Clay County
Health Insurance Coverage by Age in Clay County
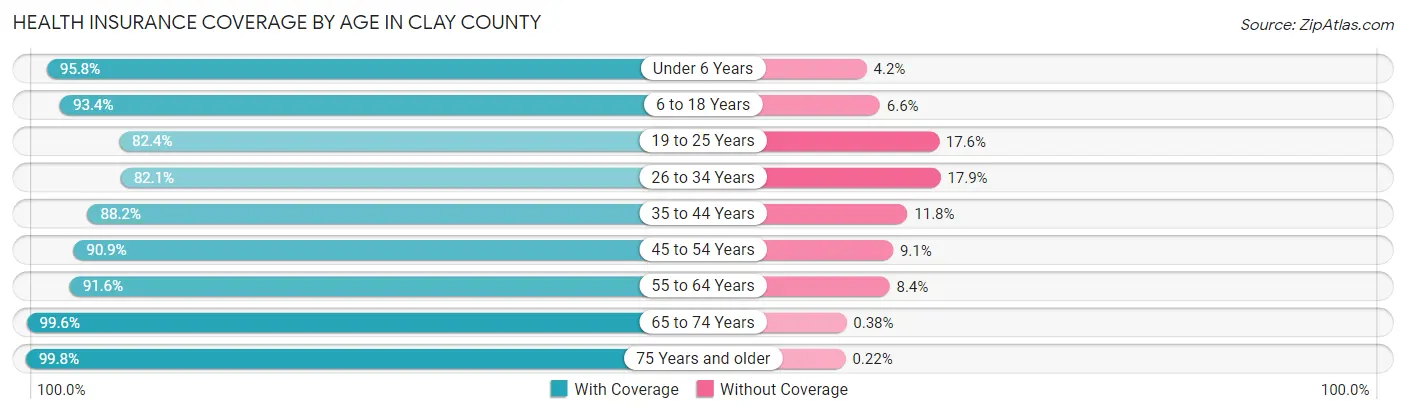
| Age Bracket | With Coverage | Without Coverage |
| Under 6 Years | 13,693 (95.8%) | 595 (4.2%) |
| 6 to 18 Years | 36,420 (93.4%) | 2,585 (6.6%) |
| 19 to 25 Years | 13,258 (82.4%) | 2,838 (17.6%) |
| 26 to 34 Years | 19,492 (82.1%) | 4,259 (17.9%) |
| 35 to 44 Years | 24,982 (88.2%) | 3,329 (11.8%) |
| 45 to 54 Years | 26,220 (90.9%) | 2,619 (9.1%) |
| 55 to 64 Years | 27,626 (91.6%) | 2,545 (8.4%) |
| 65 to 74 Years | 22,123 (99.6%) | 84 (0.4%) |
| 75 Years and older | 13,285 (99.8%) | 29 (0.2%) |
| Total | 197,099 (91.3%) | 18,883 (8.7%) |
Health Insurance Coverage by Citizenship Status in Clay County
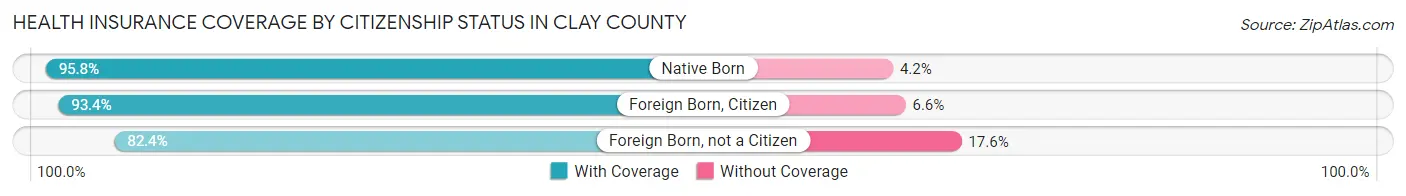
| Citizenship Status | With Coverage | Without Coverage |
| Native Born | 13,693 (95.8%) | 595 (4.2%) |
| Foreign Born, Citizen | 36,420 (93.4%) | 2,585 (6.6%) |
| Foreign Born, not a Citizen | 13,258 (82.4%) | 2,838 (17.6%) |
Health Insurance Coverage by Household Income in Clay County
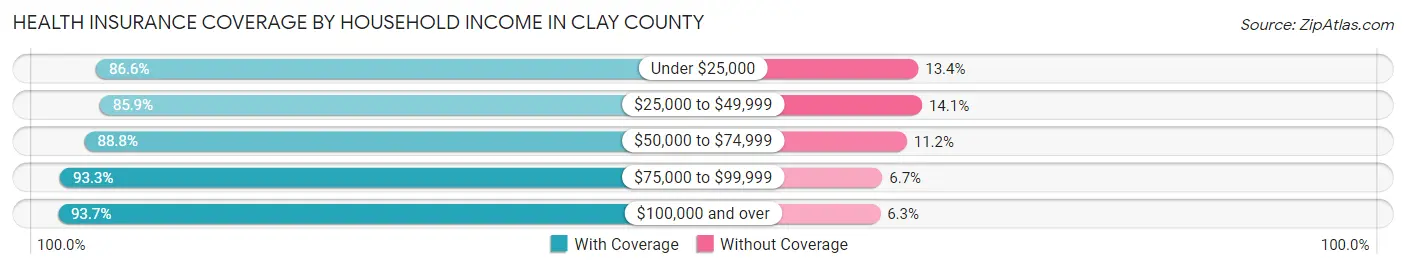
| Household Income | With Coverage | Without Coverage |
| Under $25,000 | 13,315 (86.6%) | 2,061 (13.4%) |
| $25,000 to $49,999 | 27,257 (85.9%) | 4,470 (14.1%) |
| $50,000 to $74,999 | 29,341 (88.8%) | 3,716 (11.2%) |
| $75,000 to $99,999 | 29,288 (93.3%) | 2,090 (6.7%) |
| $100,000 and over | 97,633 (93.7%) | 6,515 (6.3%) |
Public vs Private Health Insurance Coverage by Age in Clay County
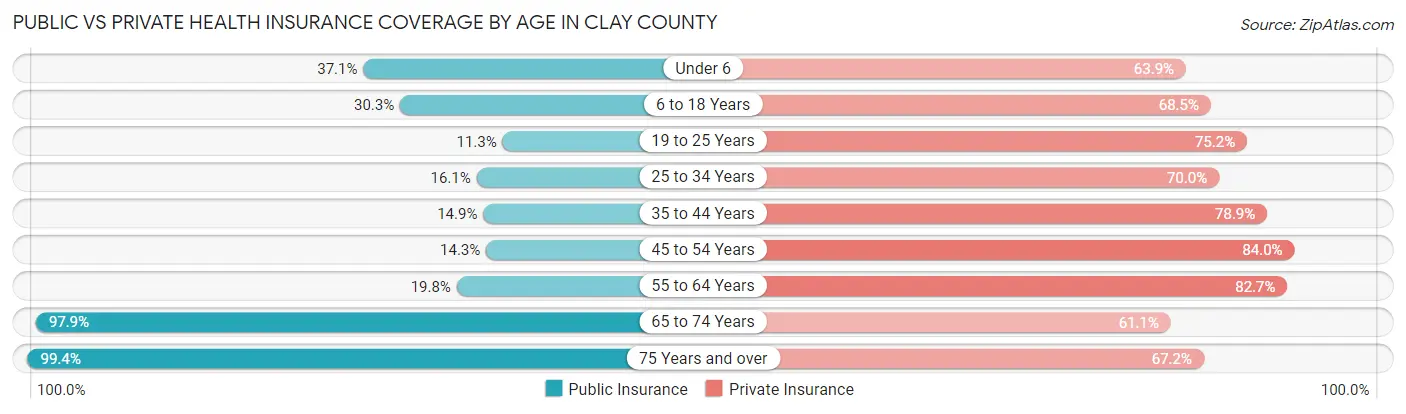
| Age Bracket | Public Insurance | Private Insurance |
| Under 6 | 5,307 (37.1%) | 9,126 (63.9%) |
| 6 to 18 Years | 11,822 (30.3%) | 26,713 (68.5%) |
| 19 to 25 Years | 1,815 (11.3%) | 12,104 (75.2%) |
| 25 to 34 Years | 3,827 (16.1%) | 16,628 (70.0%) |
| 35 to 44 Years | 4,209 (14.9%) | 22,349 (78.9%) |
| 45 to 54 Years | 4,136 (14.3%) | 24,228 (84.0%) |
| 55 to 64 Years | 5,974 (19.8%) | 24,946 (82.7%) |
| 65 to 74 Years | 21,746 (97.9%) | 13,560 (61.1%) |
| 75 Years and over | 13,239 (99.4%) | 8,946 (67.2%) |
| Total | 72,075 (33.4%) | 158,600 (73.4%) |
Disability Status by Sex by Age in Clay County
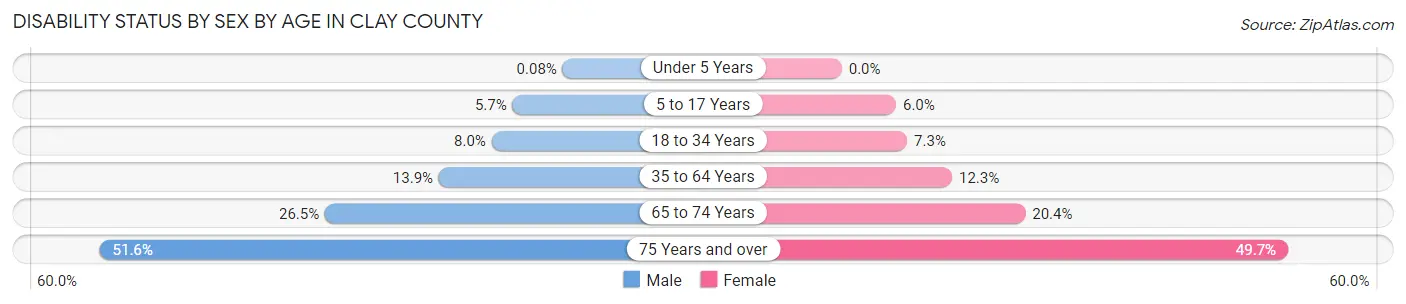
| Age Bracket | Male | Female |
| Under 5 Years | 5 (0.1%) | 0 (0.0%) |
| 5 to 17 Years | 1,126 (5.7%) | 1,142 (6.0%) |
| 18 to 34 Years | 1,708 (8.0%) | 1,560 (7.3%) |
| 35 to 64 Years | 5,896 (13.9%) | 5,500 (12.3%) |
| 65 to 74 Years | 2,816 (26.5%) | 2,371 (20.4%) |
| 75 Years and over | 2,907 (51.6%) | 3,818 (49.7%) |
Disability Class by Sex by Age in Clay County
Disability Class: Hearing Difficulty
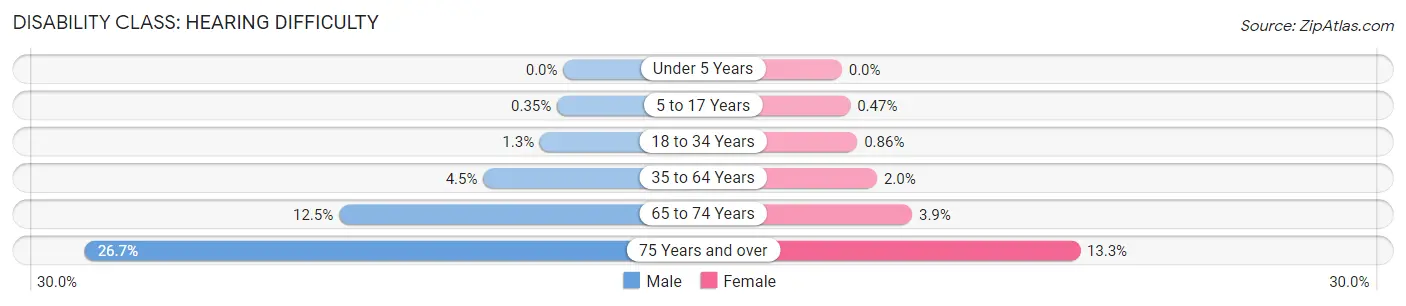
| Age Bracket | Male | Female |
| Under 5 Years | 0 (0.0%) | 0 (0.0%) |
| 5 to 17 Years | 70 (0.4%) | 89 (0.5%) |
| 18 to 34 Years | 278 (1.3%) | 185 (0.9%) |
| 35 to 64 Years | 1,899 (4.5%) | 879 (2.0%) |
| 65 to 74 Years | 1,325 (12.5%) | 453 (3.9%) |
| 75 Years and over | 1,500 (26.7%) | 1,019 (13.3%) |
Disability Class: Vision Difficulty
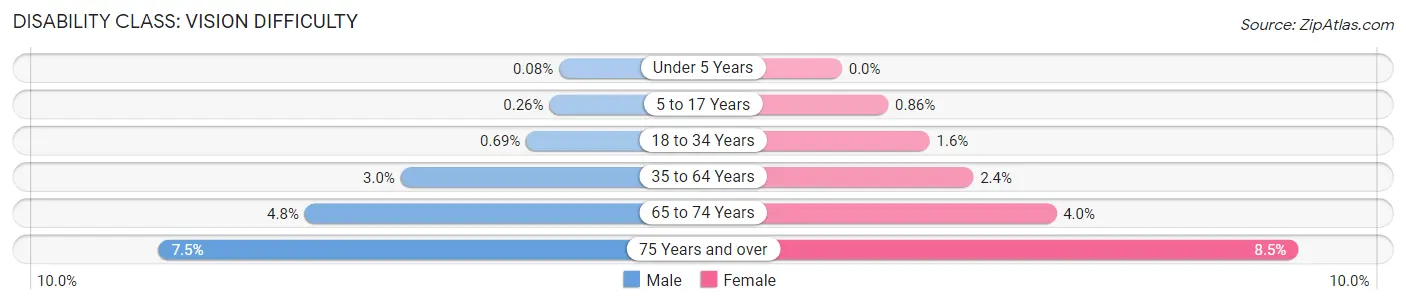
| Age Bracket | Male | Female |
| Under 5 Years | 5 (0.1%) | 0 (0.0%) |
| 5 to 17 Years | 52 (0.3%) | 163 (0.9%) |
| 18 to 34 Years | 148 (0.7%) | 349 (1.6%) |
| 35 to 64 Years | 1,283 (3.0%) | 1,092 (2.4%) |
| 65 to 74 Years | 509 (4.8%) | 462 (4.0%) |
| 75 Years and over | 423 (7.5%) | 651 (8.5%) |
Disability Class: Cognitive Difficulty
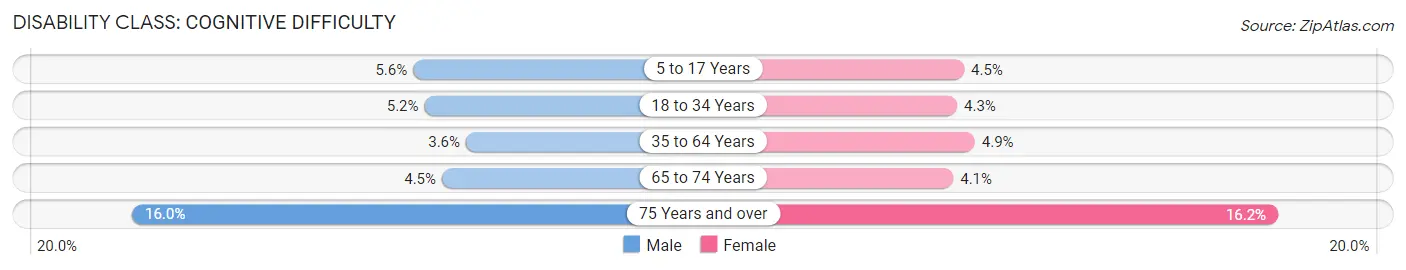
| Age Bracket | Male | Female |
| 5 to 17 Years | 1,110 (5.6%) | 857 (4.5%) |
| 18 to 34 Years | 1,105 (5.2%) | 917 (4.3%) |
| 35 to 64 Years | 1,540 (3.6%) | 2,213 (4.9%) |
| 65 to 74 Years | 479 (4.5%) | 480 (4.1%) |
| 75 Years and over | 901 (16.0%) | 1,244 (16.2%) |
Disability Class: Ambulatory Difficulty
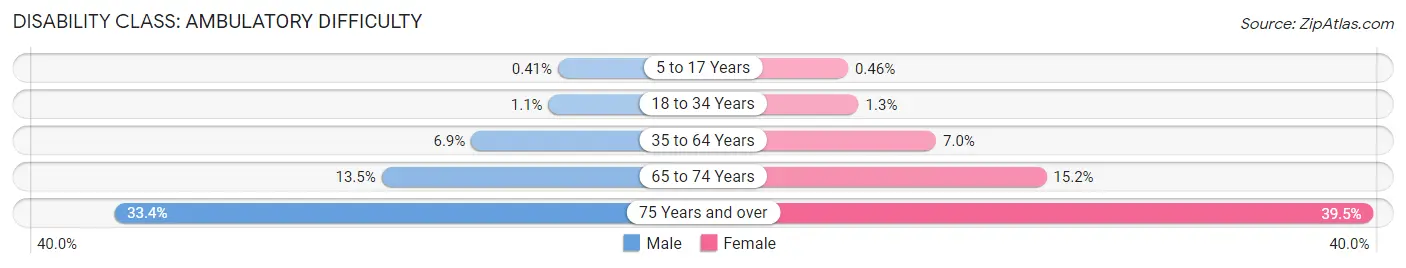
| Age Bracket | Male | Female |
| 5 to 17 Years | 81 (0.4%) | 87 (0.5%) |
| 18 to 34 Years | 238 (1.1%) | 267 (1.3%) |
| 35 to 64 Years | 2,914 (6.9%) | 3,134 (7.0%) |
| 65 to 74 Years | 1,432 (13.5%) | 1,762 (15.2%) |
| 75 Years and over | 1,877 (33.4%) | 3,033 (39.5%) |
Disability Class: Self-Care Difficulty
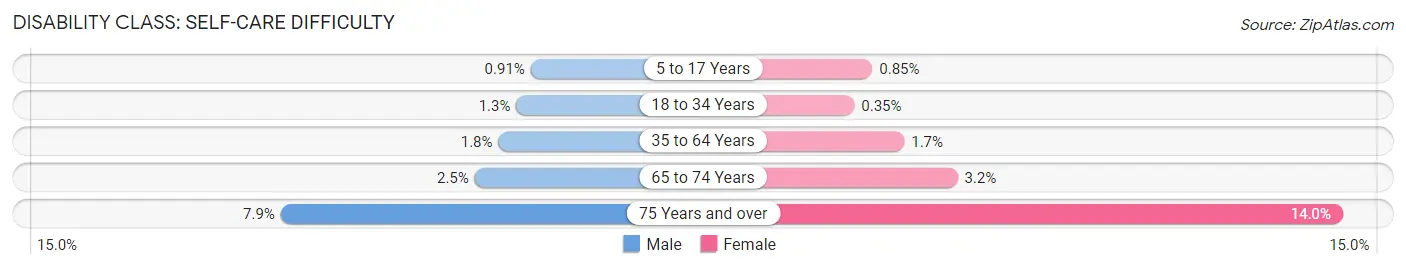
| Age Bracket | Male | Female |
| 5 to 17 Years | 180 (0.9%) | 160 (0.9%) |
| 18 to 34 Years | 280 (1.3%) | 74 (0.4%) |
| 35 to 64 Years | 768 (1.8%) | 779 (1.7%) |
| 65 to 74 Years | 262 (2.5%) | 374 (3.2%) |
| 75 Years and over | 443 (7.9%) | 1,072 (14.0%) |
Technology Access in Clay County
Computing Device Access in Clay County
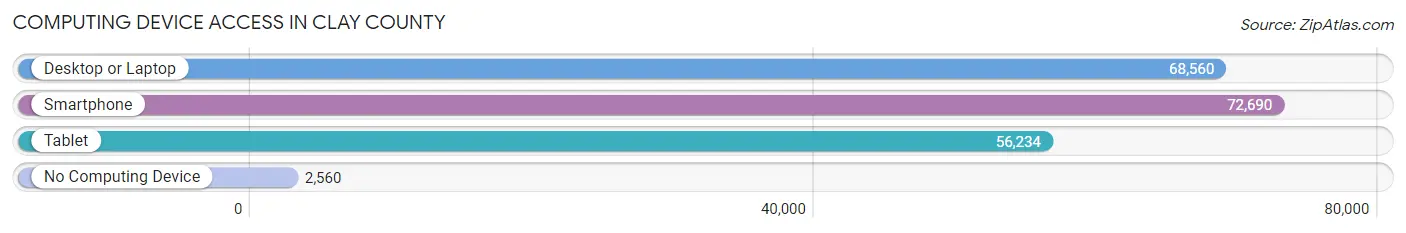
| Device Type | # Households | % Households |
| Desktop or Laptop | 68,560 | 86.0% |
| Smartphone | 72,690 | 91.2% |
| Tablet | 56,234 | 70.6% |
| No Computing Device | 2,560 | 3.2% |
| Total | 79,704 | 100.0% |
Internet Access in Clay County
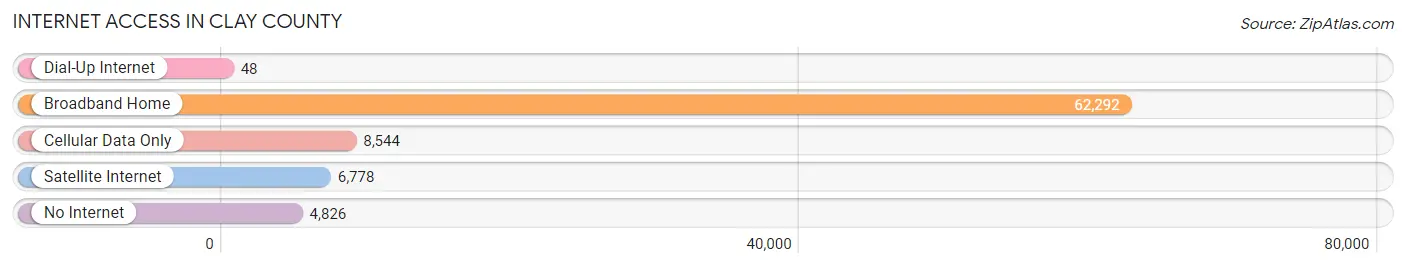
| Internet Type | # Households | % Households |
| Dial-Up Internet | 48 | 0.1% |
| Broadband Home | 62,292 | 78.1% |
| Cellular Data Only | 8,544 | 10.7% |
| Satellite Internet | 6,778 | 8.5% |
| No Internet | 4,826 | 6.0% |
| Total | 79,704 | 100.0% |
Clay County Summary
Clay County is located in the northeastern part of the state of Florida, and is part of the Jacksonville metropolitan area. It is bordered by Duval County to the north, Putnam County to the west, St. Johns County to the south, and the Atlantic Ocean to the east. The county seat is Green Cove Springs, and the largest city is Orange Park.
History
Clay County was created in 1858 from parts of Duval and St. Johns counties. It was named for Henry Clay, a prominent statesman and senator from Kentucky. The county was originally divided into four townships: Clay, Middleburg, Penney Farms, and Green Cove Springs.
The county was largely rural until the 1950s, when the population began to grow rapidly due to the influx of people from other parts of the state and country. The county's population doubled between 1950 and 1960, and tripled between 1960 and 1970.
Geography
Clay County covers an area of 644 square miles, making it the 15th largest county in Florida. It is mostly flat, with some rolling hills in the northern part of the county. The highest point in the county is the summit of Kingsley Lake, which is located in the northern part of the county and is the source of the St. Johns River.
The county is home to several natural areas, including Camp Blanding Wildlife Management Area, Jennings State Forest, and the Lake Asbury Conservation Area.
Economy
Clay County's economy is largely based on agriculture, manufacturing, and tourism. The county is home to several large agricultural operations, including the Clay County Cattle Company, which is the largest cattle operation in the state.
Manufacturing is also an important part of the county's economy. The county is home to several large manufacturing companies, including the Clay County Plastics Company, which produces plastic products for the automotive and medical industries.
Tourism is also an important part of the county's economy. The county is home to several popular attractions, including the Clay County Fairgrounds, the Orange Park Mall, and the Orange Park Raceway.
Demographics
As of the 2010 census, Clay County had a population of 190,865. The population was 54.3% White, 28.2% African American, 0.5% Native American, 2.3% Asian, 0.1% Pacific Islander, 11.7% from other races, and 2.9% from two or more races. Hispanic or Latino of any race were 20.2% of the population.
The median household income was $50,890, and the median family income was $60,890. The per capita income was $25,945. About 11.2% of the population was below the poverty line.
Clay County is home to several large military installations, including Camp Blanding, Naval Air Station Jacksonville, and Naval Station Mayport. The county is also home to several colleges and universities, including St. Johns River State College and the University of North Florida.
Common Questions
What is Per Capita Income in Clay County?
Per Capita income in Clay County is $37,334.
What is the Median Family Income in Clay County?
Median Family Income in Clay County is $92,384.
What is the Median Household income in Clay County?
Median Household Income in Clay County is $82,242.
What is Income or Wage Gap in Clay County?
Income or Wage Gap in Clay County is 28.8%.
Women in Clay County earn 71.2 cents for every dollar earned by a man.
What is Family Income Deficit in Clay County?
Family Income Deficit in Clay County is $12,764.
Families that are below poverty line in Clay County earn $12,764 less on average than the poverty threshold level.
What is Inequality or Gini Index in Clay County?
Inequality or Gini Index in Clay County is 0.41.
What is the Total Population of Clay County?
Total Population of Clay County is 219,650.
What is the Total Male Population of Clay County?
Total Male Population of Clay County is 108,845.
What is the Total Female Population of Clay County?
Total Female Population of Clay County is 110,805.
What is the Ratio of Males per 100 Females in Clay County?
There are 98.23 Males per 100 Females in Clay County.
What is the Ratio of Females per 100 Males in Clay County?
There are 101.80 Females per 100 Males in Clay County.
What is the Median Population Age in Clay County?
Median Population Age in Clay County is 39.9 Years.
What is the Average Family Size in Clay County
Average Family Size in Clay County is 3.1 People.
What is the Average Household Size in Clay County
Average Household Size in Clay County is 2.7 People.
How Large is the Labor Force in Clay County?
There are 110,605 People in the Labor Forcein in Clay County.
What is the Percentage of People in the Labor Force in Clay County?
63.0% of People are in the Labor Force in Clay County.
What is the Unemployment Rate in Clay County?
Unemployment Rate in Clay County is 4.3%.