Osceola County, FL Map & Demographics
Osceola County Map
Osceola County Overview
$28,690
PER CAPITA INCOME
$71,239
AVG FAMILY INCOME
$64,312
AVG HOUSEHOLD INCOME
18.6%
WAGE / INCOME GAP [ % ]
81.4¢/ $1
WAGE / INCOME GAP [ $ ]
$9,942
FAMILY INCOME DEFICIT
0.44
INEQUALITY / GINI INDEX
393,745
TOTAL POPULATION
195,519
MALE POPULATION
198,226
FEMALE POPULATION
98.63
MALES / 100 FEMALES
101.38
FEMALES / 100 MALES
36.6
MEDIAN AGE
3.8
AVG FAMILY SIZE
3.3
AVG HOUSEHOLD SIZE
202,148
LABOR FORCE [ PEOPLE ]
65.0%
PERCENT IN LABOR FORCE
5.3%
UNEMPLOYMENT RATE
Income in Osceola County
Income Overview in Osceola County
Per Capita Income in Osceola County is $28,690, while median incomes of families and households are $71,239 and $64,312 respectively.
| Characteristic | Number | Measure |
| Per Capita Income | 393,745 | $28,690 |
| Median Family Income | 86,960 | $71,239 |
| Mean Family Income | 86,960 | $91,020 |
| Median Household Income | 119,817 | $64,312 |
| Mean Household Income | 119,817 | $83,692 |
| Income Deficit | 86,960 | $9,942 |
| Wage / Income Gap (%) | 393,745 | 18.58% |
| Wage / Income Gap ($) | 393,745 | 81.42¢ per $1 |
| Gini / Inequality Index | 393,745 | 0.44 |
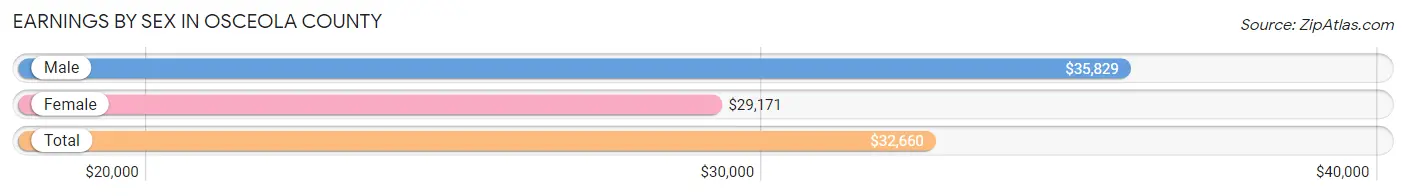
Earnings by Sex in Osceola County
Average Earnings in Osceola County are $32,660, $35,829 for men and $29,171 for women, a difference of 18.6%.
| Sex | Number | Average Earnings |
| Male | 108,515 (52.9%) | $35,829 |
| Female | 96,516 (47.1%) | $29,171 |
| Total | 205,031 (100.0%) | $32,660 |
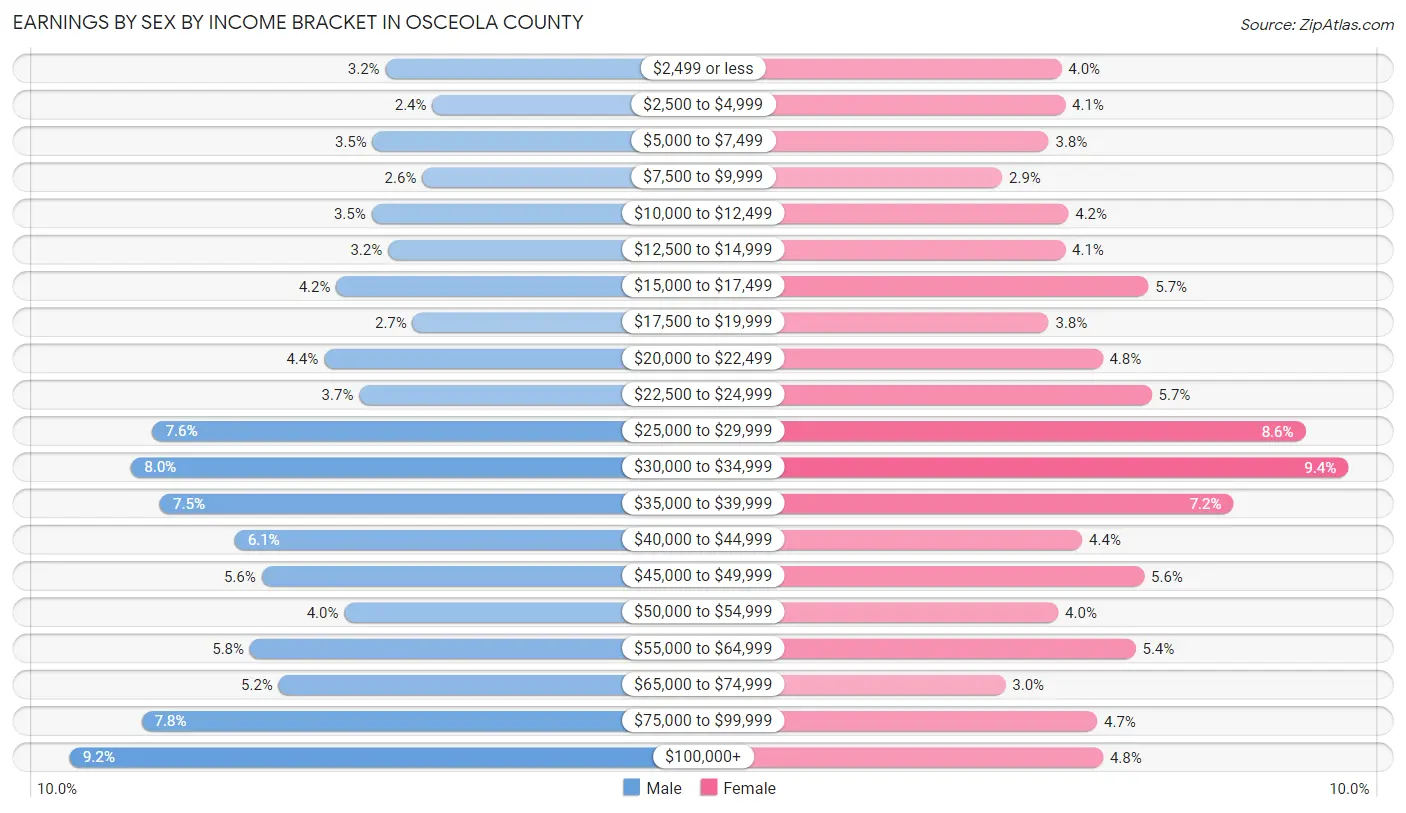
Earnings by Sex by Income Bracket in Osceola County
The most common earnings brackets in Osceola County are $100,000+ for men (9,926 | 9.1%) and $30,000 to $34,999 for women (9,064 | 9.4%).
| Income | Male | Female |
| $2,499 or less | 3,521 (3.2%) | 3,881 (4.0%) |
| $2,500 to $4,999 | 2,556 (2.4%) | 3,943 (4.1%) |
| $5,000 to $7,499 | 3,781 (3.5%) | 3,645 (3.8%) |
| $7,500 to $9,999 | 2,765 (2.5%) | 2,812 (2.9%) |
| $10,000 to $12,499 | 3,802 (3.5%) | 4,007 (4.2%) |
| $12,500 to $14,999 | 3,462 (3.2%) | 3,948 (4.1%) |
| $15,000 to $17,499 | 4,510 (4.2%) | 5,452 (5.7%) |
| $17,500 to $19,999 | 2,959 (2.7%) | 3,648 (3.8%) |
| $20,000 to $22,499 | 4,761 (4.4%) | 4,626 (4.8%) |
| $22,500 to $24,999 | 4,052 (3.7%) | 5,508 (5.7%) |
| $25,000 to $29,999 | 8,252 (7.6%) | 8,294 (8.6%) |
| $30,000 to $34,999 | 8,676 (8.0%) | 9,064 (9.4%) |
| $35,000 to $39,999 | 8,098 (7.5%) | 6,991 (7.2%) |
| $40,000 to $44,999 | 6,580 (6.1%) | 4,261 (4.4%) |
| $45,000 to $49,999 | 6,029 (5.6%) | 5,374 (5.6%) |
| $50,000 to $54,999 | 4,351 (4.0%) | 3,825 (4.0%) |
| $55,000 to $64,999 | 6,275 (5.8%) | 5,222 (5.4%) |
| $65,000 to $74,999 | 5,686 (5.2%) | 2,862 (3.0%) |
| $75,000 to $99,999 | 8,473 (7.8%) | 4,522 (4.7%) |
| $100,000+ | 9,926 (9.1%) | 4,631 (4.8%) |
| Total | 108,515 (100.0%) | 96,516 (100.0%) |
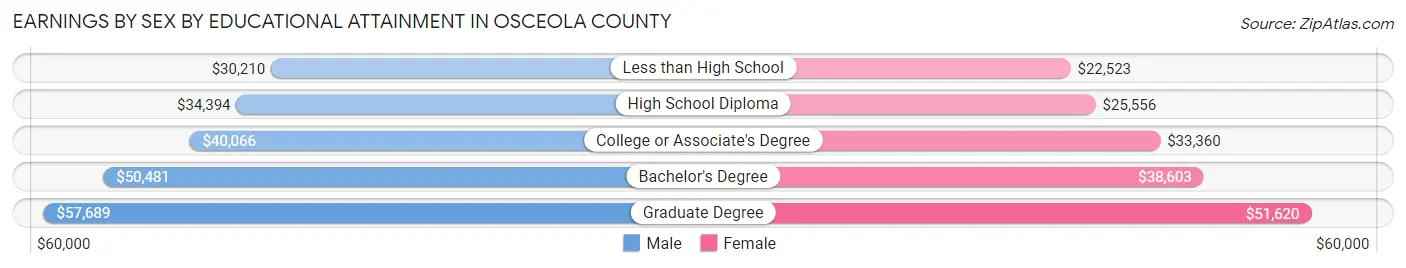
Earnings by Sex by Educational Attainment in Osceola County
Average earnings in Osceola County are $39,347 for men and $32,667 for women, a difference of 17.0%. Men with an educational attainment of graduate degree enjoy the highest average annual earnings of $57,689, while those with less than high school education earn the least with $30,210. Women with an educational attainment of graduate degree earn the most with the average annual earnings of $51,620, while those with less than high school education have the smallest earnings of $22,523.
| Educational Attainment | Male Income | Female Income |
| Less than High School | $30,210 | $22,523 |
| High School Diploma | $34,394 | $25,556 |
| College or Associate's Degree | $40,066 | $33,360 |
| Bachelor's Degree | $50,481 | $38,603 |
| Graduate Degree | $57,689 | $51,620 |
| Total | $39,347 | $32,667 |
Family Income in Osceola County
Family Income Brackets in Osceola County
According to the Osceola County family income data, there are 17,131 families falling into the $50,000 to $74,999 income range, which is the most common income bracket and makes up 19.7% of all families. Conversely, the $10,000 to $14,999 income bracket is the least frequent group with only 1,913 families (2.2%) belonging to this category.
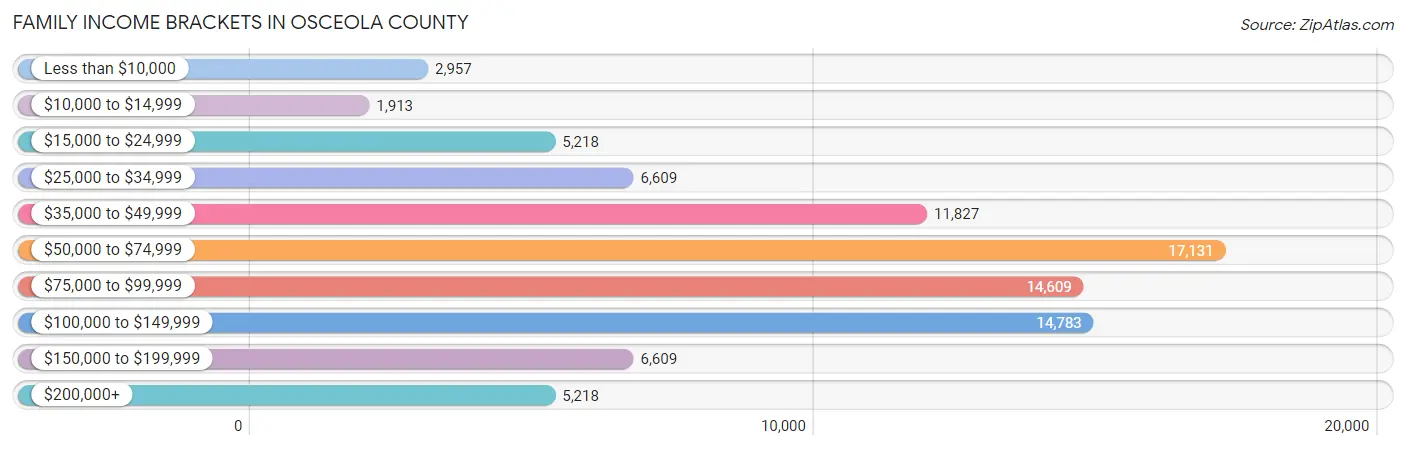
| Income Bracket | # Families | % Families |
| Less than $10,000 | 2,957 | 3.4% |
| $10,000 to $14,999 | 1,913 | 2.2% |
| $15,000 to $24,999 | 5,218 | 6.0% |
| $25,000 to $34,999 | 6,609 | 7.6% |
| $35,000 to $49,999 | 11,827 | 13.6% |
| $50,000 to $74,999 | 17,131 | 19.7% |
| $75,000 to $99,999 | 14,609 | 16.8% |
| $100,000 to $149,999 | 14,783 | 17.0% |
| $150,000 to $199,999 | 6,609 | 7.6% |
| $200,000+ | 5,218 | 6.0% |
Family Income by Famaliy Size in Osceola County
7+ person families (1,715 | 2.0%) account for the highest median family income in Osceola County with $111,097 per family, while 2-person families (34,642 | 39.8%) have the highest median income of $30,412 per family member.
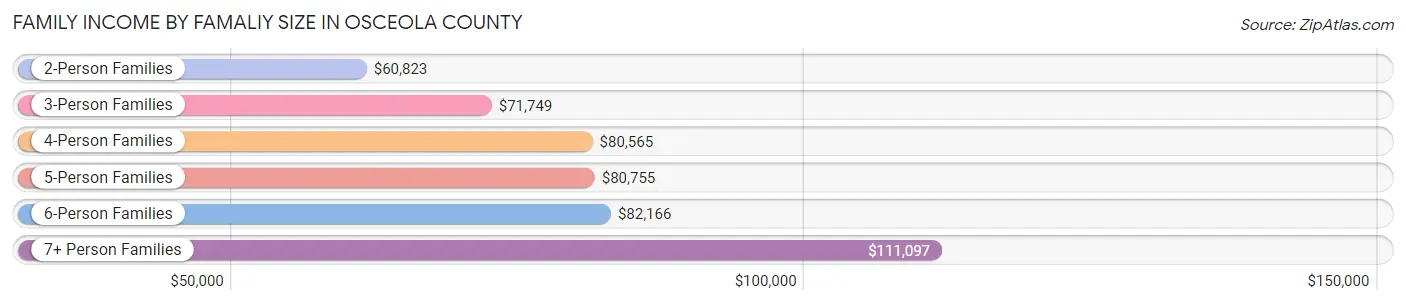
| Income Bracket | # Families | Median Income |
| 2-Person Families | 34,642 (39.8%) | $60,823 |
| 3-Person Families | 21,980 (25.3%) | $71,749 |
| 4-Person Families | 17,170 (19.7%) | $80,565 |
| 5-Person Families | 8,433 (9.7%) | $80,755 |
| 6-Person Families | 3,020 (3.5%) | $82,166 |
| 7+ Person Families | 1,715 (2.0%) | $111,097 |
| Total | 86,960 (100.0%) | $71,239 |
Family Income by Number of Earners in Osceola County
The median family income in Osceola County is $71,239, with families comprising 3+ earners (13,364) having the highest median family income of $114,054, while families with no earners (11,742) have the lowest median family income of $34,309, accounting for 15.4% and 13.5% of families, respectively.
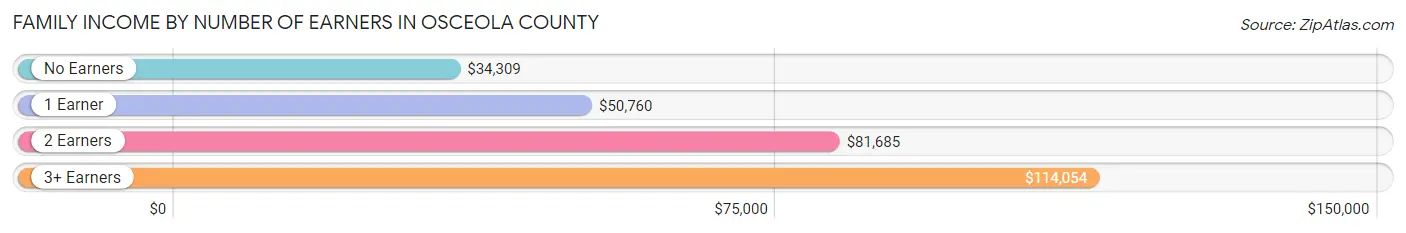
| Number of Earners | # Families | Median Income |
| No Earners | 11,742 (13.5%) | $34,309 |
| 1 Earner | 28,720 (33.0%) | $50,760 |
| 2 Earners | 33,134 (38.1%) | $81,685 |
| 3+ Earners | 13,364 (15.4%) | $114,054 |
| Total | 86,960 (100.0%) | $71,239 |
Household Income in Osceola County
Household Income Brackets in Osceola County
With 22,645 households falling in the category, the $50,000 to $74,999 income range is the most frequent in Osceola County, accounting for 18.9% of all households. In contrast, only 4,673 households (3.9%) fall into the $10,000 to $14,999 income bracket, making it the least populous group.
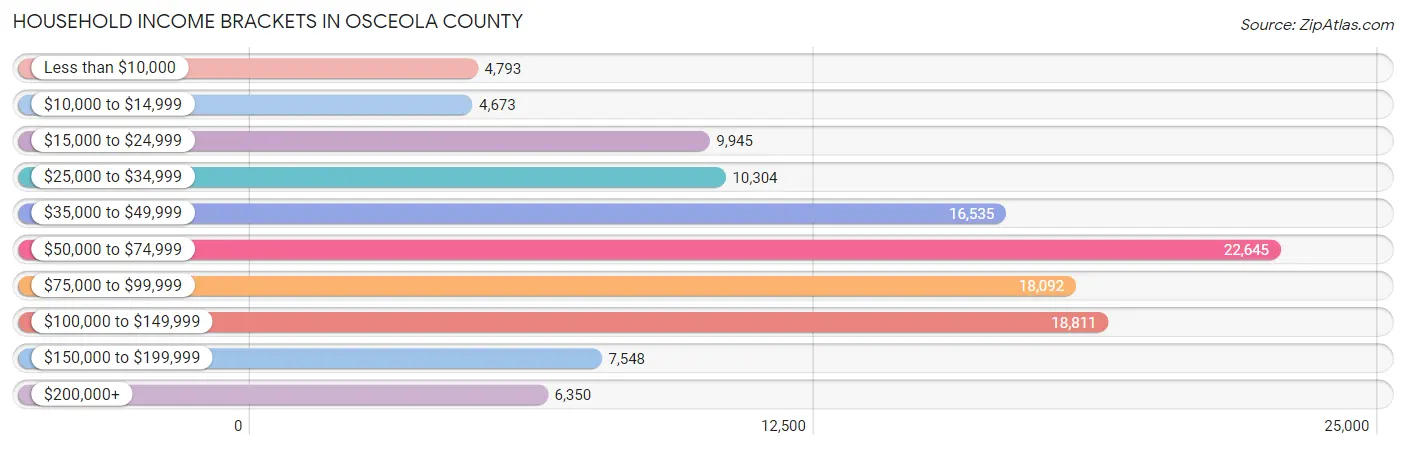
| Income Bracket | # Households | % Households |
| Less than $10,000 | 4,793 | 4.0% |
| $10,000 to $14,999 | 4,673 | 3.9% |
| $15,000 to $24,999 | 9,945 | 8.3% |
| $25,000 to $34,999 | 10,304 | 8.6% |
| $35,000 to $49,999 | 16,535 | 13.8% |
| $50,000 to $74,999 | 22,645 | 18.9% |
| $75,000 to $99,999 | 18,092 | 15.1% |
| $100,000 to $149,999 | 18,811 | 15.7% |
| $150,000 to $199,999 | 7,548 | 6.3% |
| $200,000+ | 6,350 | 5.3% |
Household Income by Householder Age in Osceola County
The median household income in Osceola County is $64,312, with the highest median household income of $76,930 found in the 45 to 64 years age bracket for the primary householder. A total of 47,859 households (39.9%) fall into this category. Meanwhile, the 15 to 24 years age bracket for the primary householder has the lowest median household income of $42,932, with 2,946 households (2.5%) in this group.
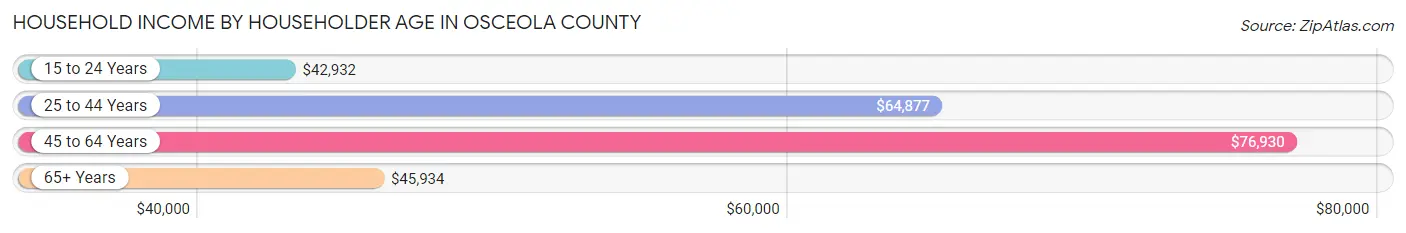
| Income Bracket | # Households | Median Income |
| 15 to 24 Years | 2,946 (2.5%) | $42,932 |
| 25 to 44 Years | 43,695 (36.5%) | $64,877 |
| 45 to 64 Years | 47,859 (39.9%) | $76,930 |
| 65+ Years | 25,317 (21.1%) | $45,934 |
| Total | 119,817 (100.0%) | $64,312 |
Poverty in Osceola County
Income Below Poverty by Sex and Age in Osceola County
With 12.6% poverty level for males and 14.2% for females among the residents of Osceola County, 5 year old males and 12 to 14 year old females are the most vulnerable to poverty, with 651 males (22.2%) and 1,906 females (25.0%) in their respective age groups living below the poverty level.
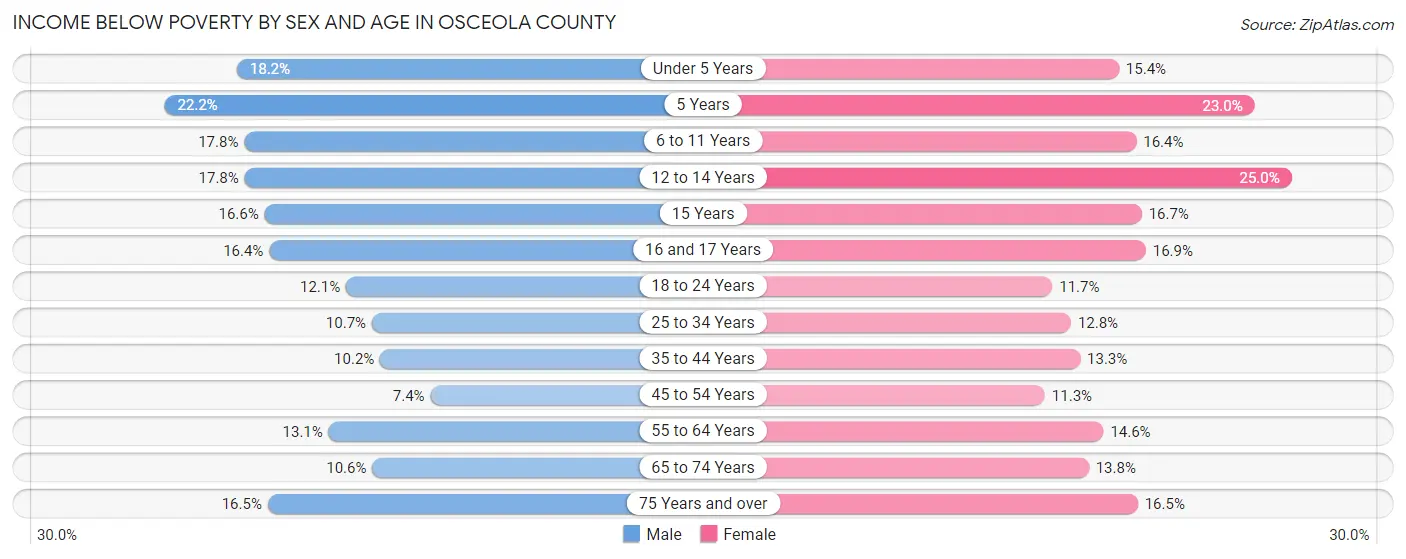
| Age Bracket | Male | Female |
| Under 5 Years | 2,135 (18.2%) | 1,768 (15.4%) |
| 5 Years | 651 (22.2%) | 420 (23.0%) |
| 6 to 11 Years | 2,853 (17.8%) | 2,625 (16.4%) |
| 12 to 14 Years | 1,528 (17.7%) | 1,906 (25.0%) |
| 15 Years | 475 (16.6%) | 379 (16.7%) |
| 16 and 17 Years | 961 (16.4%) | 1,041 (16.9%) |
| 18 to 24 Years | 2,269 (12.1%) | 2,138 (11.7%) |
| 25 to 34 Years | 3,007 (10.7%) | 3,502 (12.8%) |
| 35 to 44 Years | 2,989 (10.2%) | 3,818 (13.3%) |
| 45 to 54 Years | 1,908 (7.4%) | 3,022 (11.3%) |
| 55 to 64 Years | 2,747 (13.1%) | 3,226 (14.6%) |
| 65 to 74 Years | 1,524 (10.6%) | 2,304 (13.8%) |
| 75 Years and over | 1,378 (16.5%) | 1,867 (16.5%) |
| Total | 24,425 (12.6%) | 28,016 (14.2%) |
Income Above Poverty by Sex and Age in Osceola County
According to the poverty statistics in Osceola County, males aged 45 to 54 years and females aged 45 to 54 years are the age groups that are most secure financially, with 92.6% of males and 88.7% of females in these age groups living above the poverty line.
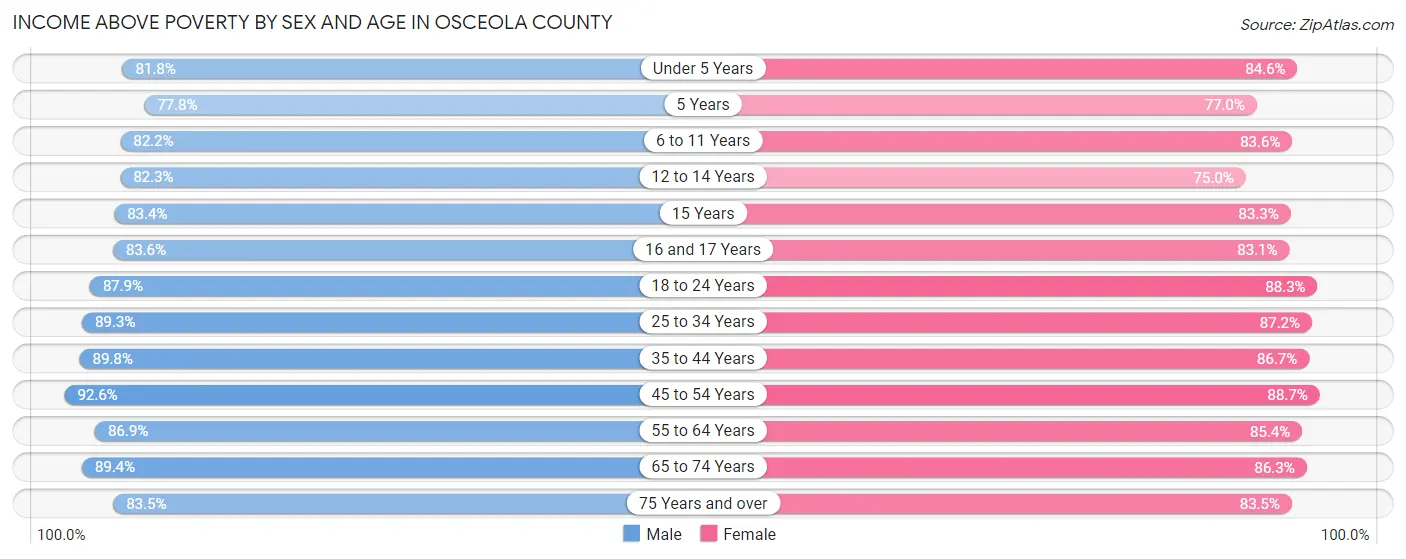
| Age Bracket | Male | Female |
| Under 5 Years | 9,607 (81.8%) | 9,692 (84.6%) |
| 5 Years | 2,280 (77.8%) | 1,408 (77.0%) |
| 6 to 11 Years | 13,204 (82.2%) | 13,382 (83.6%) |
| 12 to 14 Years | 7,080 (82.3%) | 5,707 (75.0%) |
| 15 Years | 2,379 (83.4%) | 1,891 (83.3%) |
| 16 and 17 Years | 4,905 (83.6%) | 5,108 (83.1%) |
| 18 to 24 Years | 16,478 (87.9%) | 16,104 (88.3%) |
| 25 to 34 Years | 25,212 (89.3%) | 23,946 (87.2%) |
| 35 to 44 Years | 26,305 (89.8%) | 24,953 (86.7%) |
| 45 to 54 Years | 23,860 (92.6%) | 23,694 (88.7%) |
| 55 to 64 Years | 18,263 (86.9%) | 18,917 (85.4%) |
| 65 to 74 Years | 12,802 (89.4%) | 14,447 (86.3%) |
| 75 Years and over | 6,996 (83.5%) | 9,464 (83.5%) |
| Total | 169,371 (87.4%) | 168,713 (85.8%) |
Income Below Poverty Among Married-Couple Families in Osceola County
The poverty statistics for married-couple families in Osceola County show that 7.9% or 4,830 of the total 61,155 families live below the poverty line. Families with 3 or 4 children have the highest poverty rate of 14.8%, comprising of 656 families. On the other hand, families with 5 or more children have the lowest poverty rate of 5.6%, which includes 14 families.
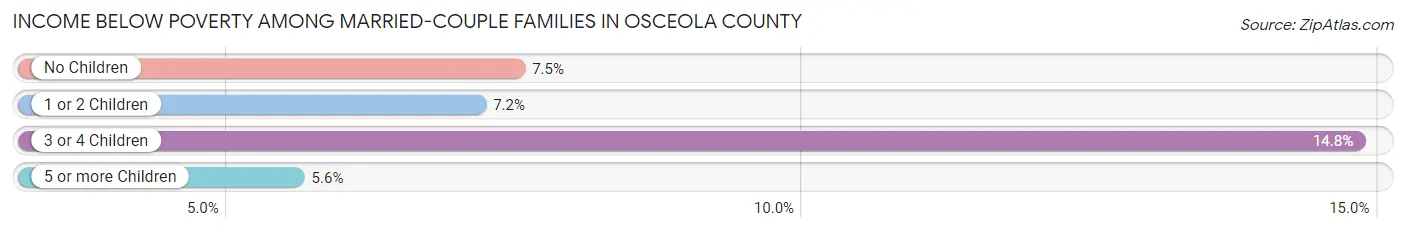
| Children | Above Poverty | Below Poverty |
| No Children | 31,517 (92.5%) | 2,555 (7.5%) |
| 1 or 2 Children | 20,798 (92.8%) | 1,605 (7.2%) |
| 3 or 4 Children | 3,773 (85.2%) | 656 (14.8%) |
| 5 or more Children | 237 (94.4%) | 14 (5.6%) |
| Total | 56,325 (92.1%) | 4,830 (7.9%) |
Income Below Poverty Among Single-Parent Households in Osceola County
According to the poverty data in Osceola County, 13.5% or 929 single-father households and 21.0% or 3,964 single-mother households are living below the poverty line. Among single-father households, those with 1 or 2 children have the highest poverty rate, with 536 households (18.3%) experiencing poverty. Likewise, among single-mother households, those with 3 or 4 children have the highest poverty rate, with 1,307 households (66.4%) falling below the poverty line.
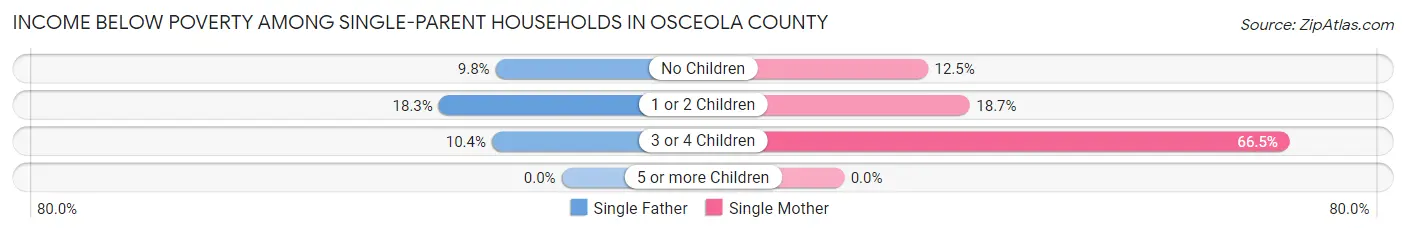
| Children | Single Father | Single Mother |
| No Children | 346 (9.8%) | 979 (12.5%) |
| 1 or 2 Children | 536 (18.3%) | 1,678 (18.7%) |
| 3 or 4 Children | 47 (10.4%) | 1,307 (66.4%) |
| 5 or more Children | 0 (0.0%) | 0 (0.0%) |
| Total | 929 (13.5%) | 3,964 (21.0%) |
Income Below Poverty Among Married-Couple vs Single-Parent Households in Osceola County
The poverty data for Osceola County shows that 4,830 of the married-couple family households (7.9%) and 4,893 of the single-parent households (19.0%) are living below the poverty level. Within the married-couple family households, those with 3 or 4 children have the highest poverty rate, with 656 households (14.8%) falling below the poverty line. Among the single-parent households, those with 3 or 4 children have the highest poverty rate, with 1,354 household (55.9%) living below poverty.
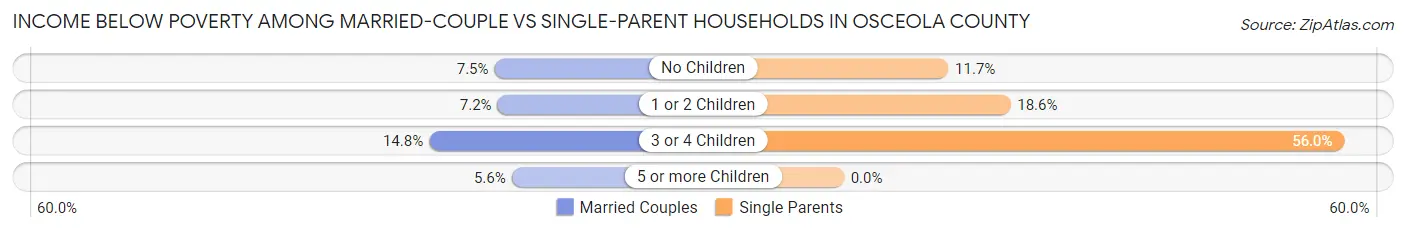
| Children | Married-Couple Families | Single-Parent Households |
| No Children | 2,555 (7.5%) | 1,325 (11.7%) |
| 1 or 2 Children | 1,605 (7.2%) | 2,214 (18.6%) |
| 3 or 4 Children | 656 (14.8%) | 1,354 (55.9%) |
| 5 or more Children | 14 (5.6%) | 0 (0.0%) |
| Total | 4,830 (7.9%) | 4,893 (19.0%) |
Race in Osceola County
The most populous races in Osceola County are Hispanic or Latino (220,780 | 56.1%), White / Caucasian (195,489 | 49.6%), and Some other Race (77,308 | 19.6%).
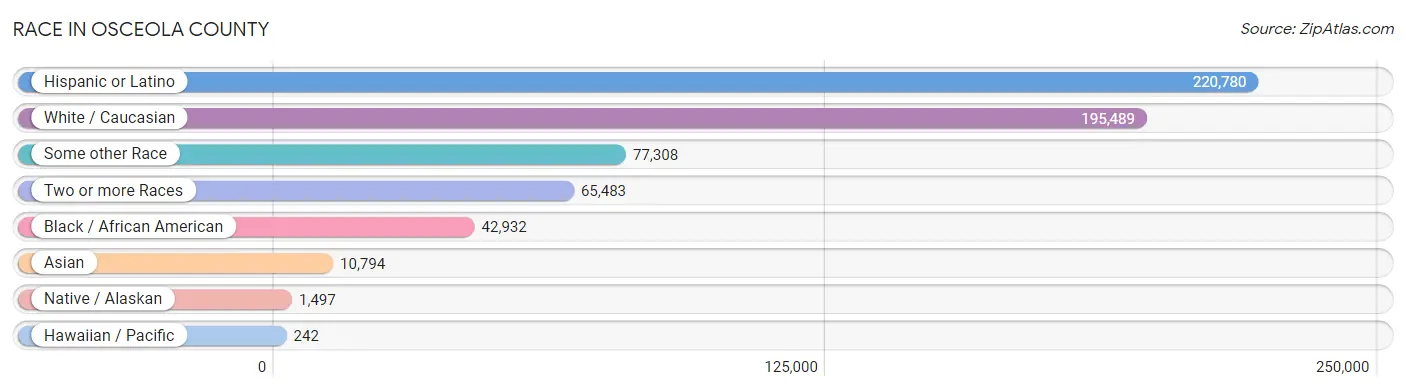
| Race | # Population | % Population |
| Asian | 10,794 | 2.7% |
| Black / African American | 42,932 | 10.9% |
| Hawaiian / Pacific | 242 | 0.1% |
| Hispanic or Latino | 220,780 | 56.1% |
| Native / Alaskan | 1,497 | 0.4% |
| White / Caucasian | 195,489 | 49.6% |
| Two or more Races | 65,483 | 16.6% |
| Some other Race | 77,308 | 19.6% |
| Total | 393,745 | 100.0% |
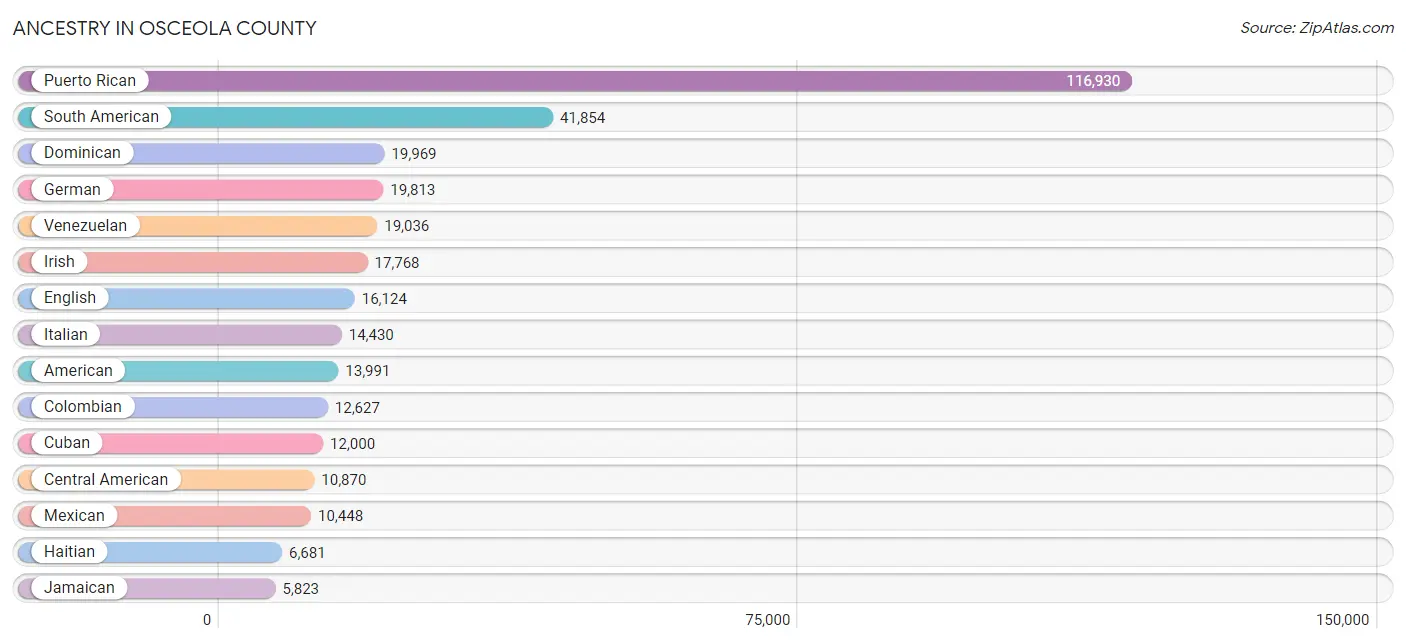
Ancestry in Osceola County
The most populous ancestries reported in Osceola County are Puerto Rican (116,930 | 29.7%), South American (41,854 | 10.6%), Dominican (19,969 | 5.1%), German (19,813 | 5.0%), and Venezuelan (19,036 | 4.8%), together accounting for 55.3% of all Osceola County residents.
| Ancestry | # Population | % Population |
| African | 3,262 | 0.8% |
| Albanian | 22 | 0.0% |
| American | 13,991 | 3.5% |
| Arab | 4,056 | 1.0% |
| Arapaho | 10 | 0.0% |
| Argentinean | 459 | 0.1% |
| Armenian | 48 | 0.0% |
| Australian | 73 | 0.0% |
| Austrian | 640 | 0.2% |
| Bahamian | 71 | 0.0% |
| Barbadian | 28 | 0.0% |
| Basque | 14 | 0.0% |
| Belgian | 360 | 0.1% |
| Belizean | 49 | 0.0% |
| Bhutanese | 217 | 0.1% |
| Blackfeet | 92 | 0.0% |
| Bolivian | 129 | 0.0% |
| Brazilian | 1,754 | 0.4% |
| British | 1,832 | 0.5% |
| British West Indian | 581 | 0.2% |
| Bulgarian | 258 | 0.1% |
| Burmese | 241 | 0.1% |
| Cajun | 40 | 0.0% |
| Canadian | 648 | 0.2% |
| Cape Verdean | 43 | 0.0% |
| Celtic | 21 | 0.0% |
| Central American | 10,870 | 2.8% |
| Central American Indian | 2,285 | 0.6% |
| Cherokee | 687 | 0.2% |
| Chilean | 745 | 0.2% |
| Chippewa | 26 | 0.0% |
| Choctaw | 46 | 0.0% |
| Colombian | 12,627 | 3.2% |
| Costa Rican | 401 | 0.1% |
| Croatian | 243 | 0.1% |
| Cuban | 12,000 | 3.0% |
| Czech | 346 | 0.1% |
| Czechoslovakian | 186 | 0.1% |
| Danish | 370 | 0.1% |
| Dominican | 19,969 | 5.1% |
| Dutch | 1,580 | 0.4% |
| Dutch West Indian | 23 | 0.0% |
| Eastern European | 285 | 0.1% |
| Ecuadorian | 4,102 | 1.0% |
| Egyptian | 242 | 0.1% |
| English | 16,124 | 4.1% |
| Ethiopian | 62 | 0.0% |
| European | 1,932 | 0.5% |
| Filipino | 114 | 0.0% |
| Finnish | 177 | 0.0% |
| French | 5,062 | 1.3% |
| French American Indian | 165 | 0.0% |
| French Canadian | 1,191 | 0.3% |
| German | 19,813 | 5.0% |
| Greek | 799 | 0.2% |
| Guamanian / Chamorro | 46 | 0.0% |
| Guatemalan | 1,186 | 0.3% |
| Guyanese | 368 | 0.1% |
| Haitian | 6,681 | 1.7% |
| Honduran | 2,603 | 0.7% |
| Hungarian | 1,105 | 0.3% |
| Indian (Asian) | 2,079 | 0.5% |
| Indonesian | 86 | 0.0% |
| Iranian | 89 | 0.0% |
| Iraqi | 647 | 0.2% |
| Irish | 17,768 | 4.5% |
| Iroquois | 62 | 0.0% |
| Israeli | 293 | 0.1% |
| Italian | 14,430 | 3.7% |
| Jamaican | 5,823 | 1.5% |
| Japanese | 110 | 0.0% |
| Jordanian | 109 | 0.0% |
| Kenyan | 72 | 0.0% |
| Korean | 4,932 | 1.3% |
| Latvian | 17 | 0.0% |
| Lebanese | 315 | 0.1% |
| Lithuanian | 232 | 0.1% |
| Lumbee | 44 | 0.0% |
| Luxembourger | 19 | 0.0% |
| Macedonian | 56 | 0.0% |
| Malaysian | 771 | 0.2% |
| Maltese | 5 | 0.0% |
| Menominee | 52 | 0.0% |
| Mexican | 10,448 | 2.6% |
| Mexican American Indian | 251 | 0.1% |
| Mongolian | 20 | 0.0% |
| Moroccan | 1,428 | 0.4% |
| Native Hawaiian | 174 | 0.0% |
| Navajo | 4 | 0.0% |
| Nicaraguan | 2,426 | 0.6% |
| Nigerian | 180 | 0.1% |
| Northern European | 107 | 0.0% |
| Norwegian | 1,418 | 0.4% |
| Pakistani | 128 | 0.0% |
| Palestinian | 231 | 0.1% |
| Panamanian | 1,999 | 0.5% |
| Paraguayan | 21 | 0.0% |
| Pennsylvania German | 15 | 0.0% |
| Peruvian | 4,037 | 1.0% |
| Polish | 4,581 | 1.2% |
| Portuguese | 2,982 | 0.8% |
| Puerto Rican | 116,930 | 29.7% |
| Romanian | 556 | 0.1% |
| Russian | 885 | 0.2% |
| Salvadoran | 2,247 | 0.6% |
| Samoan | 42 | 0.0% |
| Scandinavian | 465 | 0.1% |
| Scotch-Irish | 1,259 | 0.3% |
| Scottish | 2,954 | 0.7% |
| Seminole | 30 | 0.0% |
| Slavic | 15 | 0.0% |
| Slovak | 320 | 0.1% |
| Slovene | 75 | 0.0% |
| Somali | 10 | 0.0% |
| South African | 9 | 0.0% |
| South American | 41,854 | 10.6% |
| South American Indian | 165 | 0.0% |
| Spaniard | 704 | 0.2% |
| Spanish | 740 | 0.2% |
| Spanish American | 33 | 0.0% |
| Spanish American Indian | 80 | 0.0% |
| Sri Lankan | 826 | 0.2% |
| Subsaharan African | 3,723 | 0.9% |
| Swedish | 1,384 | 0.4% |
| Swiss | 505 | 0.1% |
| Syrian | 137 | 0.0% |
| Thai | 4,643 | 1.2% |
| Tlingit-Haida | 21 | 0.0% |
| Trinidadian and Tobagonian | 1,044 | 0.3% |
| Turkish | 156 | 0.0% |
| U.S. Virgin Islander | 72 | 0.0% |
| Ukrainian | 428 | 0.1% |
| Uruguayan | 423 | 0.1% |
| Venezuelan | 19,036 | 4.8% |
| Vietnamese | 367 | 0.1% |
| Welsh | 1,751 | 0.4% |
| West Indian | 1,736 | 0.4% |
| Yugoslavian | 41 | 0.0% | View All 138 Rows |
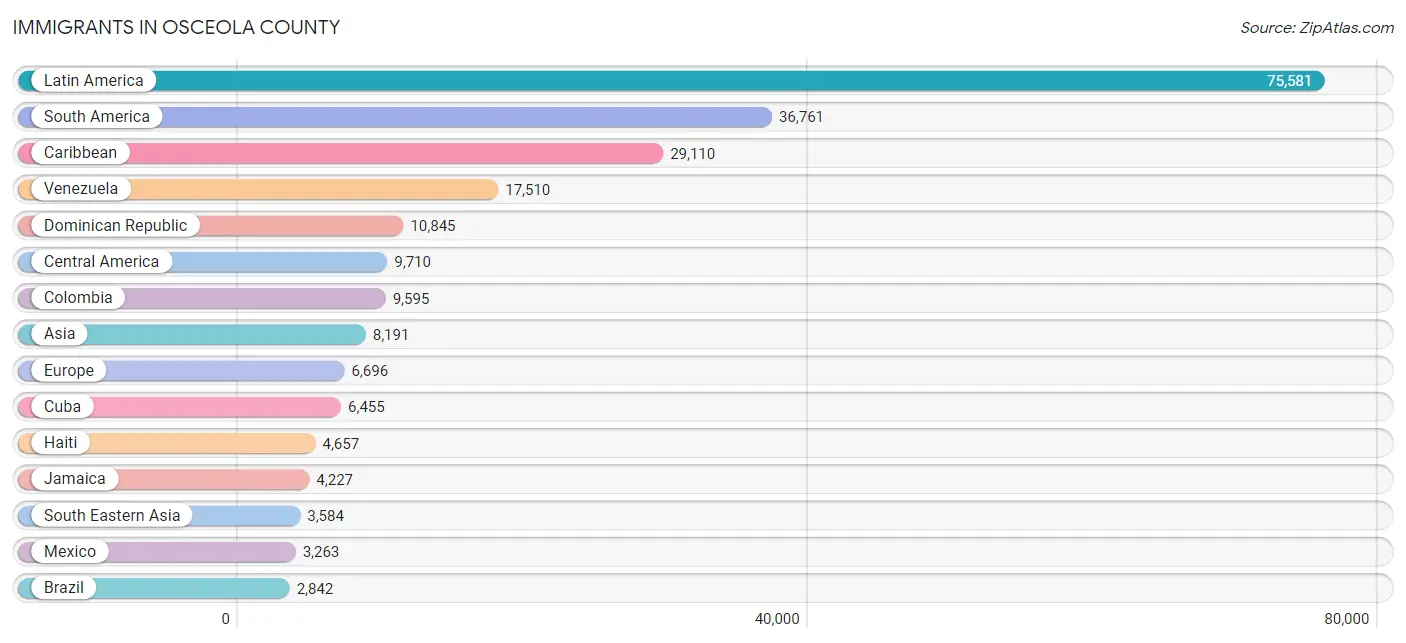
Immigrants in Osceola County
The most numerous immigrant groups reported in Osceola County came from Latin America (75,581 | 19.2%), South America (36,761 | 9.3%), Caribbean (29,110 | 7.4%), Venezuela (17,510 | 4.4%), and Dominican Republic (10,845 | 2.8%), together accounting for 43.1% of all Osceola County residents.
| Immigration Origin | # Population | % Population |
| Africa | 1,935 | 0.5% |
| Argentina | 543 | 0.1% |
| Asia | 8,191 | 2.1% |
| Bahamas | 59 | 0.0% |
| Bangladesh | 234 | 0.1% |
| Barbados | 42 | 0.0% |
| Belgium | 164 | 0.0% |
| Belize | 49 | 0.0% |
| Bolivia | 217 | 0.1% |
| Brazil | 2,842 | 0.7% |
| Bulgaria | 21 | 0.0% |
| Cabo Verde | 62 | 0.0% |
| Cambodia | 47 | 0.0% |
| Canada | 1,019 | 0.3% |
| Caribbean | 29,110 | 7.4% |
| Central America | 9,710 | 2.5% |
| Chile | 274 | 0.1% |
| China | 657 | 0.2% |
| Colombia | 9,595 | 2.4% |
| Costa Rica | 334 | 0.1% |
| Croatia | 31 | 0.0% |
| Cuba | 6,455 | 1.6% |
| Czechoslovakia | 114 | 0.0% |
| Dominica | 100 | 0.0% |
| Dominican Republic | 10,845 | 2.8% |
| Eastern Africa | 207 | 0.1% |
| Eastern Asia | 929 | 0.2% |
| Eastern Europe | 2,024 | 0.5% |
| Ecuador | 1,808 | 0.5% |
| Egypt | 166 | 0.0% |
| El Salvador | 1,307 | 0.3% |
| England | 1,006 | 0.3% |
| Ethiopia | 62 | 0.0% |
| Europe | 6,696 | 1.7% |
| France | 714 | 0.2% |
| Germany | 332 | 0.1% |
| Greece | 34 | 0.0% |
| Grenada | 555 | 0.1% |
| Guatemala | 748 | 0.2% |
| Guyana | 1,129 | 0.3% |
| Haiti | 4,657 | 1.2% |
| Honduras | 1,539 | 0.4% |
| Hong Kong | 95 | 0.0% |
| Hungary | 29 | 0.0% |
| India | 1,001 | 0.3% |
| Indonesia | 40 | 0.0% |
| Iran | 165 | 0.0% |
| Iraq | 551 | 0.1% |
| Ireland | 103 | 0.0% |
| Israel | 80 | 0.0% |
| Italy | 243 | 0.1% |
| Jamaica | 4,227 | 1.1% |
| Japan | 69 | 0.0% |
| Jordan | 205 | 0.1% |
| Kenya | 111 | 0.0% |
| Korea | 203 | 0.1% |
| Kuwait | 66 | 0.0% |
| Laos | 165 | 0.0% |
| Latin America | 75,581 | 19.2% |
| Lebanon | 29 | 0.0% |
| Malaysia | 49 | 0.0% |
| Mexico | 3,263 | 0.8% |
| Moldova | 140 | 0.0% |
| Morocco | 1,170 | 0.3% |
| Netherlands | 142 | 0.0% |
| Nicaragua | 1,007 | 0.3% |
| Nigeria | 79 | 0.0% |
| Northern Africa | 1,401 | 0.4% |
| Northern Europe | 2,593 | 0.7% |
| Norway | 24 | 0.0% |
| Pakistan | 703 | 0.2% |
| Panama | 1,433 | 0.4% |
| Peru | 2,492 | 0.6% |
| Philippines | 2,697 | 0.7% |
| Poland | 922 | 0.2% |
| Portugal | 345 | 0.1% |
| Romania | 290 | 0.1% |
| Russia | 156 | 0.0% |
| Saudi Arabia | 44 | 0.0% |
| Scotland | 50 | 0.0% |
| Senegal | 22 | 0.0% |
| Sierra Leone | 26 | 0.0% |
| Singapore | 34 | 0.0% |
| South Africa | 9 | 0.0% |
| South America | 36,761 | 9.3% |
| South Central Asia | 2,159 | 0.5% |
| South Eastern Asia | 3,584 | 0.9% |
| Southern Europe | 696 | 0.2% |
| Spain | 74 | 0.0% |
| Sri Lanka | 4 | 0.0% |
| Sweden | 5 | 0.0% |
| Syria | 302 | 0.1% |
| Taiwan | 94 | 0.0% |
| Thailand | 3 | 0.0% |
| Trinidad and Tobago | 1,292 | 0.3% |
| Turkey | 49 | 0.0% |
| Uganda | 8 | 0.0% |
| Ukraine | 284 | 0.1% |
| Uruguay | 301 | 0.1% |
| Uzbekistan | 17 | 0.0% |
| Venezuela | 17,510 | 4.4% |
| Vietnam | 463 | 0.1% |
| Western Africa | 261 | 0.1% |
| Western Asia | 1,326 | 0.3% |
| Western Europe | 1,352 | 0.3% |
| Zimbabwe | 17 | 0.0% | View All 106 Rows |
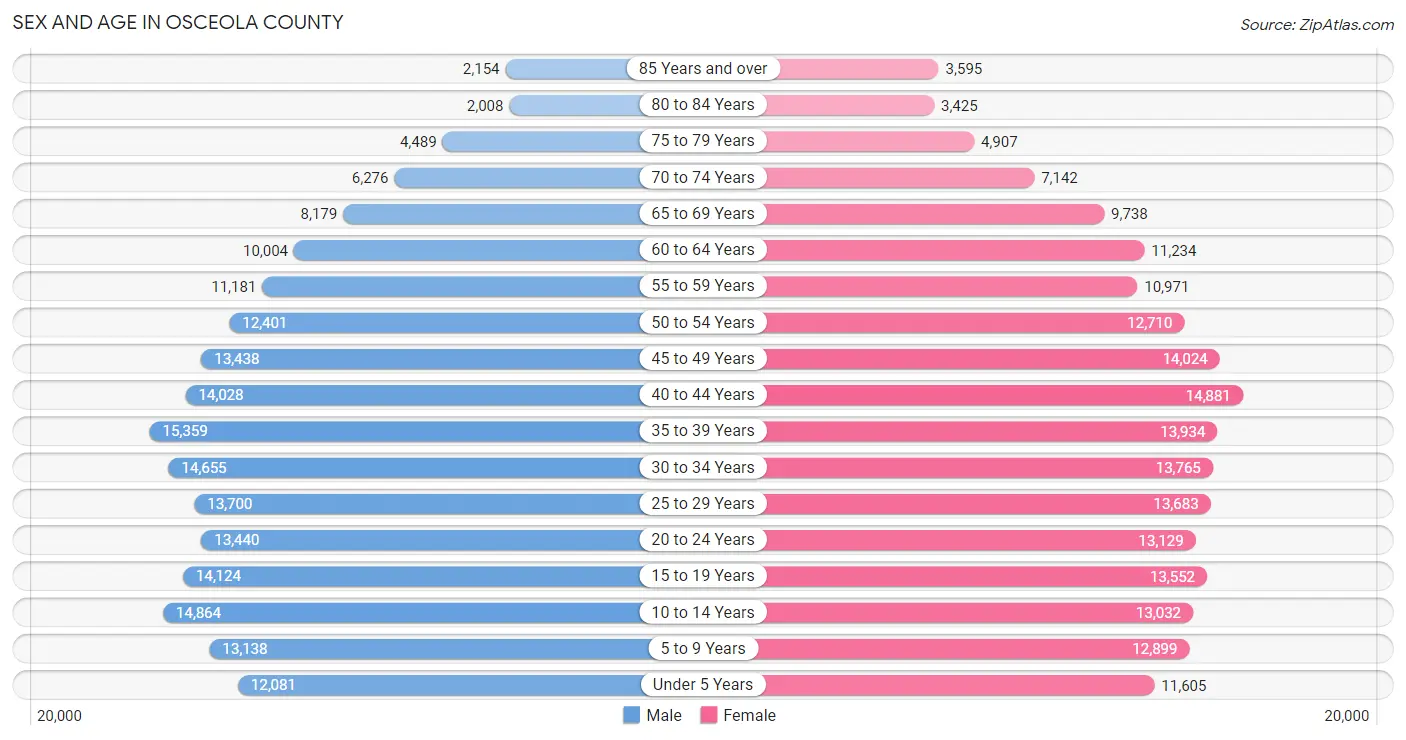
Sex and Age in Osceola County
Sex and Age in Osceola County
The most populous age groups in Osceola County are 35 to 39 Years (15,359 | 7.9%) for men and 40 to 44 Years (14,881 | 7.5%) for women.
| Age Bracket | Male | Female |
| Under 5 Years | 12,081 (6.2%) | 11,605 (5.9%) |
| 5 to 9 Years | 13,138 (6.7%) | 12,899 (6.5%) |
| 10 to 14 Years | 14,864 (7.6%) | 13,032 (6.6%) |
| 15 to 19 Years | 14,124 (7.2%) | 13,552 (6.8%) |
| 20 to 24 Years | 13,440 (6.9%) | 13,129 (6.6%) |
| 25 to 29 Years | 13,700 (7.0%) | 13,683 (6.9%) |
| 30 to 34 Years | 14,655 (7.5%) | 13,765 (6.9%) |
| 35 to 39 Years | 15,359 (7.9%) | 13,934 (7.0%) |
| 40 to 44 Years | 14,028 (7.2%) | 14,881 (7.5%) |
| 45 to 49 Years | 13,438 (6.9%) | 14,024 (7.1%) |
| 50 to 54 Years | 12,401 (6.3%) | 12,710 (6.4%) |
| 55 to 59 Years | 11,181 (5.7%) | 10,971 (5.5%) |
| 60 to 64 Years | 10,004 (5.1%) | 11,234 (5.7%) |
| 65 to 69 Years | 8,179 (4.2%) | 9,738 (4.9%) |
| 70 to 74 Years | 6,276 (3.2%) | 7,142 (3.6%) |
| 75 to 79 Years | 4,489 (2.3%) | 4,907 (2.5%) |
| 80 to 84 Years | 2,008 (1.0%) | 3,425 (1.7%) |
| 85 Years and over | 2,154 (1.1%) | 3,595 (1.8%) |
| Total | 195,519 (100.0%) | 198,226 (100.0%) |
Families and Households in Osceola County
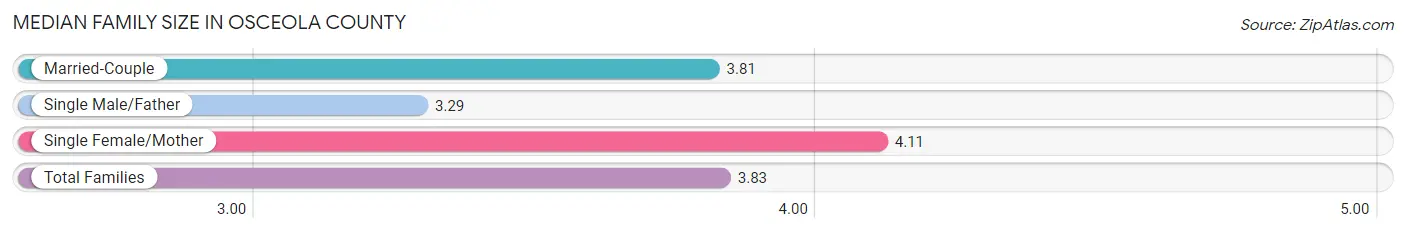
Median Family Size in Osceola County
The median family size in Osceola County is 3.83 persons per family, with single female/mother families (18,909 | 21.7%) accounting for the largest median family size of 4.11 persons per family. On the other hand, single male/father families (6,896 | 7.9%) represent the smallest median family size with 3.29 persons per family.
| Family Type | # Families | Family Size |
| Married-Couple | 61,155 (70.3%) | 3.81 |
| Single Male/Father | 6,896 (7.9%) | 3.29 |
| Single Female/Mother | 18,909 (21.7%) | 4.11 |
| Total Families | 86,960 (100.0%) | 3.83 |
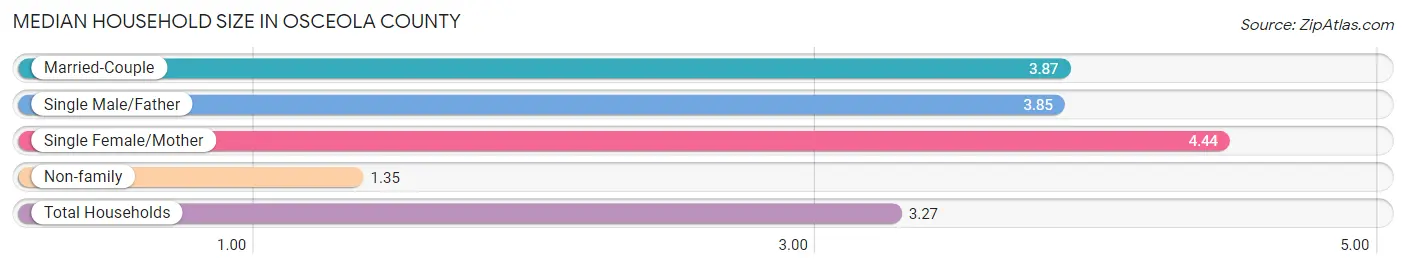
Median Household Size in Osceola County
The median household size in Osceola County is 3.27 persons per household, with single female/mother households (18,909 | 15.8%) accounting for the largest median household size of 4.44 persons per household. non-family households (32,857 | 27.4%) represent the smallest median household size with 1.35 persons per household.
| Household Type | # Households | Household Size |
| Married-Couple | 61,155 (51.0%) | 3.87 |
| Single Male/Father | 6,896 (5.8%) | 3.85 |
| Single Female/Mother | 18,909 (15.8%) | 4.44 |
| Non-family | 32,857 (27.4%) | 1.35 |
| Total Households | 119,817 (100.0%) | 3.27 |
Household Size by Marriage Status in Osceola County
Out of a total of 119,817 households in Osceola County, 86,960 (72.6%) are family households, while 32,857 (27.4%) are nonfamily households. The most numerous type of family households are 2-person households, comprising 31,580, and the most common type of nonfamily households are 1-person households, comprising 25,629.
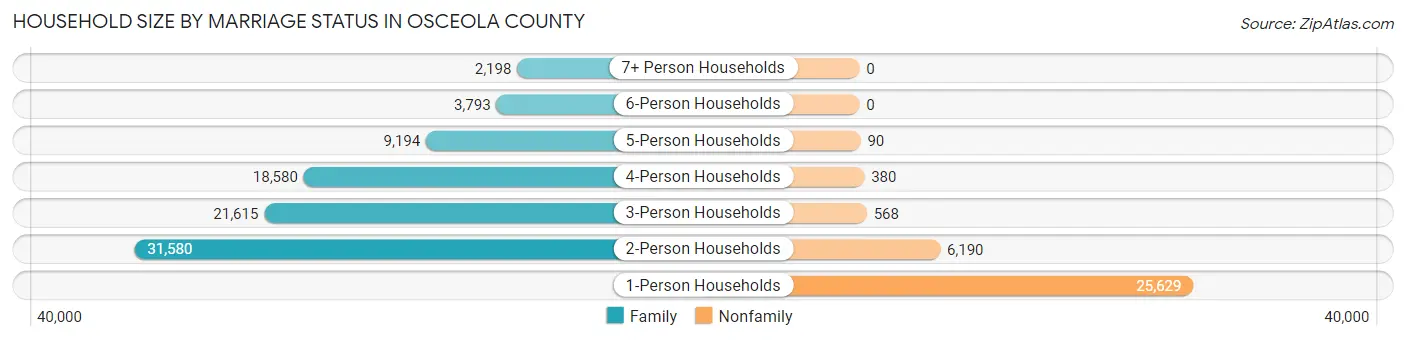
| Household Size | Family Households | Nonfamily Households |
| 1-Person Households | - | 25,629 (21.4%) |
| 2-Person Households | 31,580 (26.4%) | 6,190 (5.2%) |
| 3-Person Households | 21,615 (18.0%) | 568 (0.5%) |
| 4-Person Households | 18,580 (15.5%) | 380 (0.3%) |
| 5-Person Households | 9,194 (7.7%) | 90 (0.1%) |
| 6-Person Households | 3,793 (3.2%) | 0 (0.0%) |
| 7+ Person Households | 2,198 (1.8%) | 0 (0.0%) |
| Total | 86,960 (72.6%) | 32,857 (27.4%) |
Female Fertility in Osceola County
Fertility by Age in Osceola County
Average fertility rate in Osceola County is 41.0 births per 1,000 women. Women in the age bracket of 20 to 34 years have the highest fertility rate with 77.0 births per 1,000 women. Women in the age bracket of 20 to 34 years acount for 75.9% of all women with births.
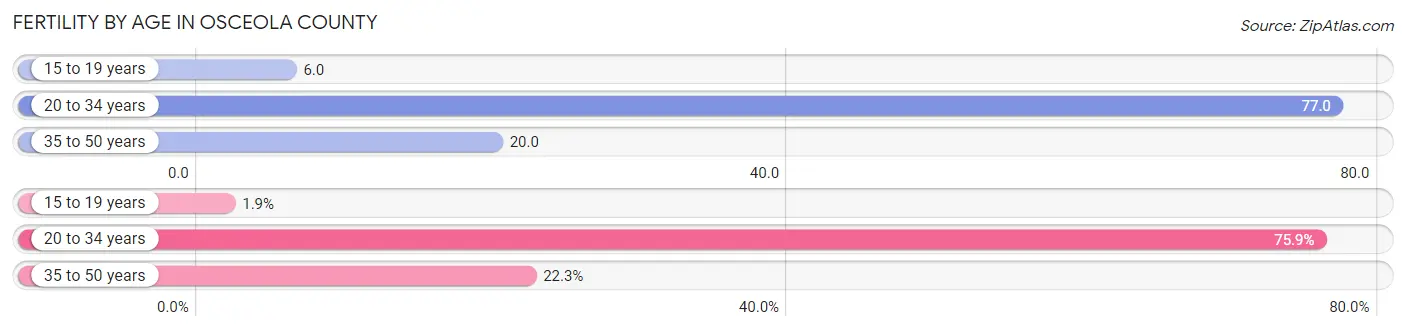
| Age Bracket | Women with Births | Births / 1,000 Women |
| 15 to 19 years | 76 (1.8%) | 6.0 |
| 20 to 34 years | 3,122 (75.9%) | 77.0 |
| 35 to 50 years | 916 (22.3%) | 20.0 |
| Total | 4,114 (100.0%) | 41.0 |
Fertility by Age by Marriage Status in Osceola County
59.7% of women with births (4,114) in Osceola County are married. The highest percentage of unmarried women with births falls into 15 to 19 years age bracket with 100.0% of them unmarried at the time of birth, while the lowest percentage of unmarried women with births belong to 35 to 50 years age bracket with 10.5% of them unmarried.
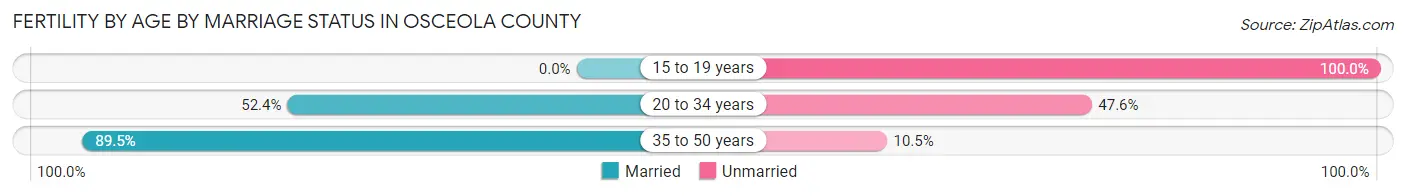
| Age Bracket | Married | Unmarried |
| 15 to 19 years | 0 (0.0%) | 76 (100.0%) |
| 20 to 34 years | 1,636 (52.4%) | 1,486 (47.6%) |
| 35 to 50 years | 820 (89.5%) | 96 (10.5%) |
| Total | 2,456 (59.7%) | 1,658 (40.3%) |
Fertility by Education in Osceola County
Average fertility rate in Osceola County is 41.0 births per 1,000 women. Women with the education attainment of college or associate's degree have the highest fertility rate of 57.0 births per 1,000 women, while women with the education attainment of less than high school have the lowest fertility at 9.0 births per 1,000 women. Women with the education attainment of college or associate's degree represent 47.9% of all women with births.
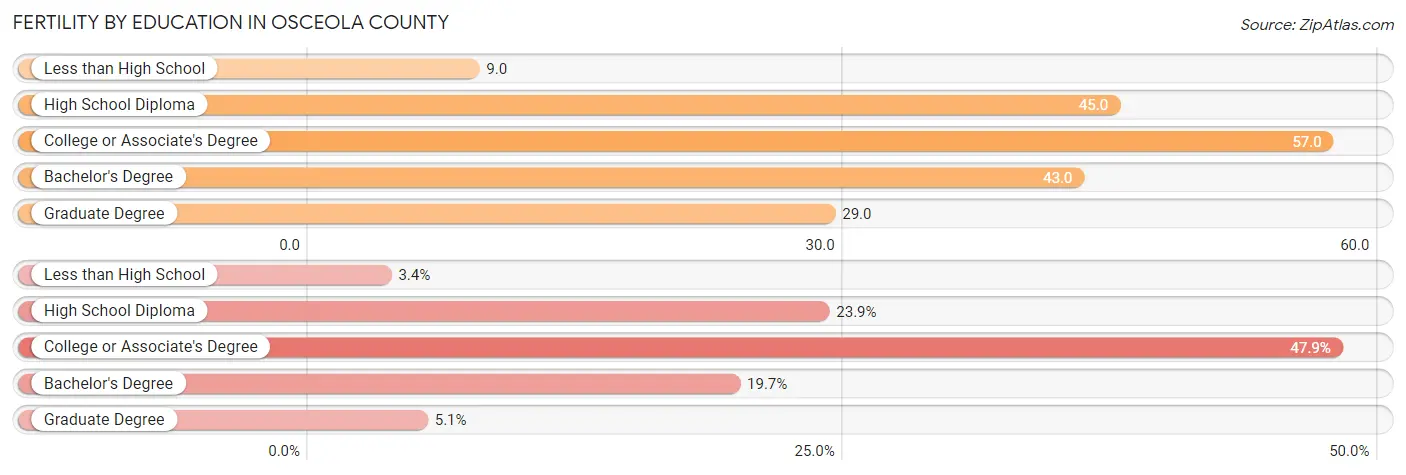
| Educational Attainment | Women with Births | Births / 1,000 Women |
| Less than High School | 139 (3.4%) | 9.0 |
| High School Diploma | 983 (23.9%) | 45.0 |
| College or Associate's Degree | 1,972 (47.9%) | 57.0 |
| Bachelor's Degree | 811 (19.7%) | 43.0 |
| Graduate Degree | 209 (5.1%) | 29.0 |
| Total | 4,114 (100.0%) | 41.0 |
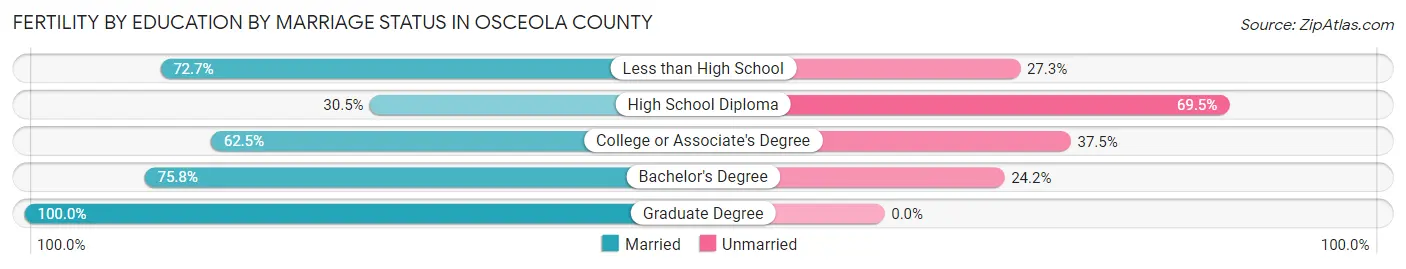
Fertility by Education by Marriage Status in Osceola County
40.3% of women with births in Osceola County are unmarried. Women with the educational attainment of graduate degree are most likely to be married with 100.0% of them married at childbirth, while women with the educational attainment of high school diploma are least likely to be married with 69.5% of them unmarried at childbirth.
| Educational Attainment | Married | Unmarried |
| Less than High School | 101 (72.7%) | 38 (27.3%) |
| High School Diploma | 300 (30.5%) | 683 (69.5%) |
| College or Associate's Degree | 1,232 (62.5%) | 740 (37.5%) |
| Bachelor's Degree | 615 (75.8%) | 196 (24.2%) |
| Graduate Degree | 209 (100.0%) | 0 (0.0%) |
| Total | 2,456 (59.7%) | 1,658 (40.3%) |
Employment Characteristics in Osceola County
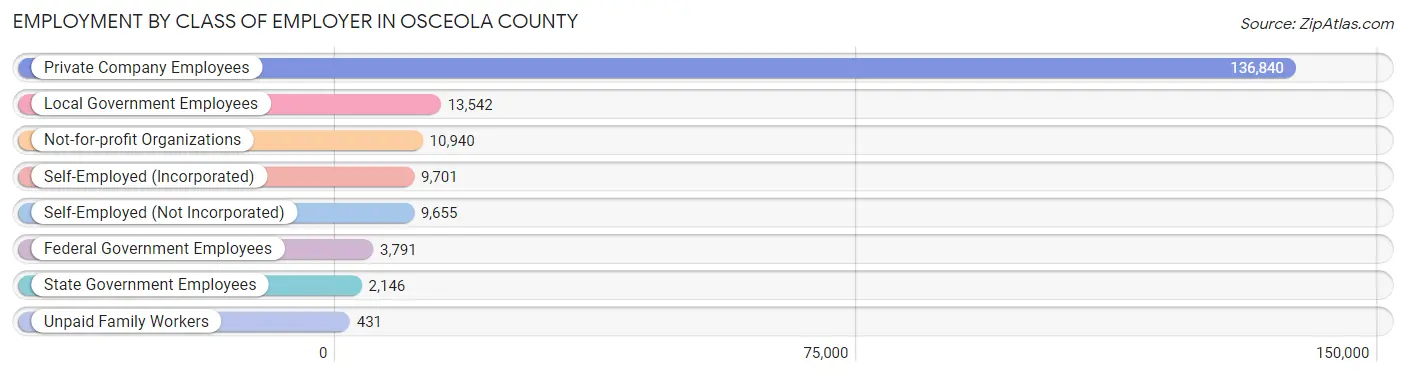
Employment by Class of Employer in Osceola County
Among the 187,046 employed individuals in Osceola County, private company employees (136,840 | 73.2%), local government employees (13,542 | 7.2%), and not-for-profit organizations (10,940 | 5.9%) make up the most common classes of employment.
| Employer Class | # Employees | % Employees |
| Private Company Employees | 136,840 | 73.2% |
| Self-Employed (Incorporated) | 9,701 | 5.2% |
| Self-Employed (Not Incorporated) | 9,655 | 5.2% |
| Not-for-profit Organizations | 10,940 | 5.9% |
| Local Government Employees | 13,542 | 7.2% |
| State Government Employees | 2,146 | 1.1% |
| Federal Government Employees | 3,791 | 2.0% |
| Unpaid Family Workers | 431 | 0.2% |
| Total | 187,046 | 100.0% |
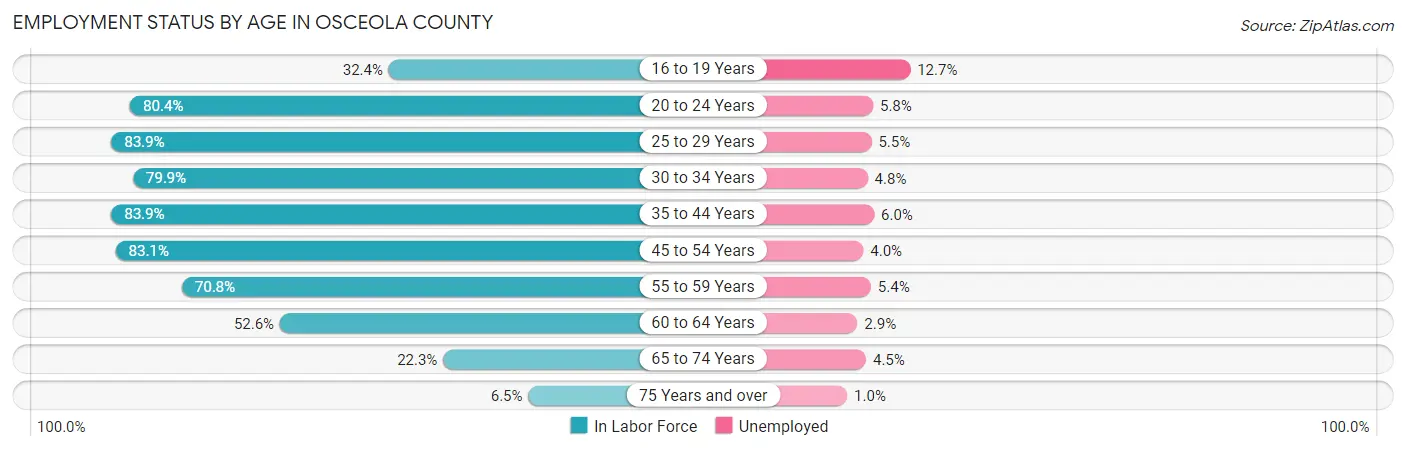
Employment Status by Age in Osceola County
According to the labor force statistics for Osceola County, out of the total population over 16 years of age (310,997), 65.0% or 202,148 individuals are in the labor force, with 5.3% or 10,714 of them unemployed. The age group with the highest labor force participation rate is 25 to 29 years, with 83.9% or 22,974 individuals in the labor force. Within the labor force, the 16 to 19 years age range has the highest percentage of unemployed individuals, with 12.7% or 928 of them being unemployed.
| Age Bracket | In Labor Force | Unemployed |
| 16 to 19 Years | 7,305 (32.4%) | 928 (12.7%) |
| 20 to 24 Years | 21,361 (80.4%) | 1,239 (5.8%) |
| 25 to 29 Years | 22,974 (83.9%) | 1,264 (5.5%) |
| 30 to 34 Years | 22,708 (79.9%) | 1,090 (4.8%) |
| 35 to 44 Years | 48,831 (83.9%) | 2,930 (6.0%) |
| 45 to 54 Years | 43,688 (83.1%) | 1,748 (4.0%) |
| 55 to 59 Years | 15,684 (70.8%) | 847 (5.4%) |
| 60 to 64 Years | 11,171 (52.6%) | 324 (2.9%) |
| 65 to 74 Years | 6,988 (22.3%) | 314 (4.5%) |
| 75 Years and over | 1,338 (6.5%) | 13 (1.0%) |
| Total | 202,148 (65.0%) | 10,714 (5.3%) |
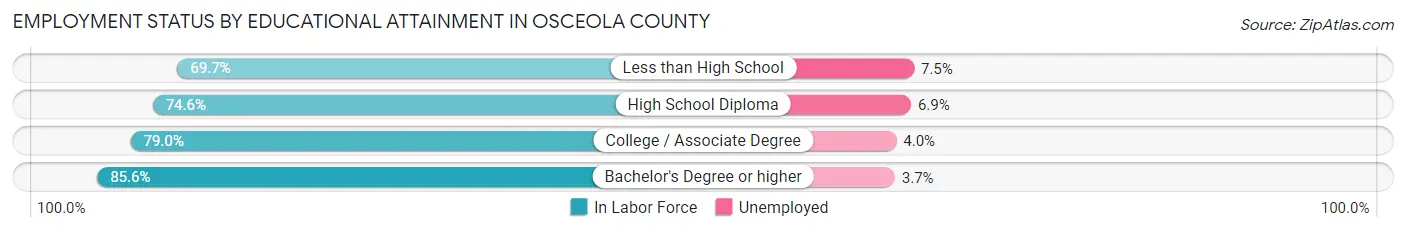
Employment Status by Educational Attainment in Osceola County
According to labor force statistics for Osceola County, 78.6% of individuals (165,035) out of the total population between 25 and 64 years of age (209,968) are in the labor force, with 5.0% or 8,252 of them being unemployed. The group with the highest labor force participation rate are those with the educational attainment of bachelor's degree or higher, with 85.6% or 50,011 individuals in the labor force. Within the labor force, individuals with less than high school education have the highest percentage of unemployment, with 7.5% or 1,119 of them being unemployed.
| Educational Attainment | In Labor Force | Unemployed |
| Less than High School | 14,922 (69.7%) | 1,606 (7.5%) |
| High School Diploma | 44,386 (74.6%) | 4,105 (6.9%) |
| College / Associate Degree | 55,803 (79.0%) | 2,825 (4.0%) |
| Bachelor's Degree or higher | 50,011 (85.6%) | 2,162 (3.7%) |
| Total | 165,035 (78.6%) | 10,498 (5.0%) |
Employment Occupations by Sex in Osceola County
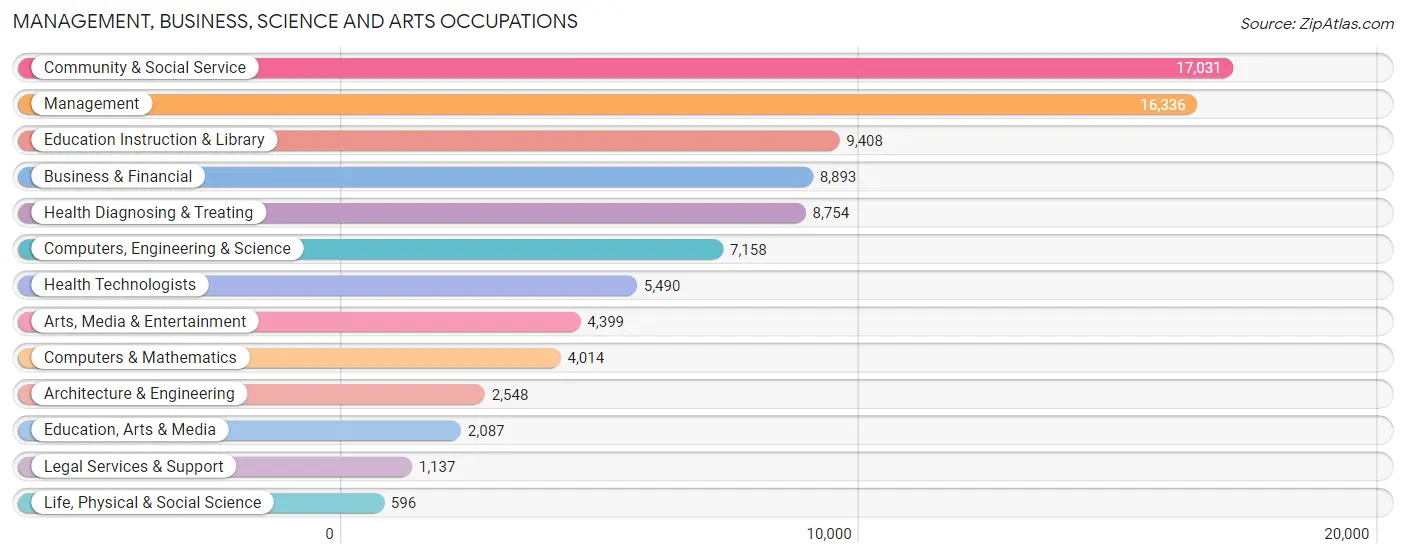
Management, Business, Science and Arts Occupations
The most common Management, Business, Science and Arts occupations in Osceola County are Community & Social Service (17,031 | 8.9%), Management (16,336 | 8.5%), Education Instruction & Library (9,408 | 4.9%), Business & Financial (8,893 | 4.6%), and Health Diagnosing & Treating (8,754 | 4.6%).
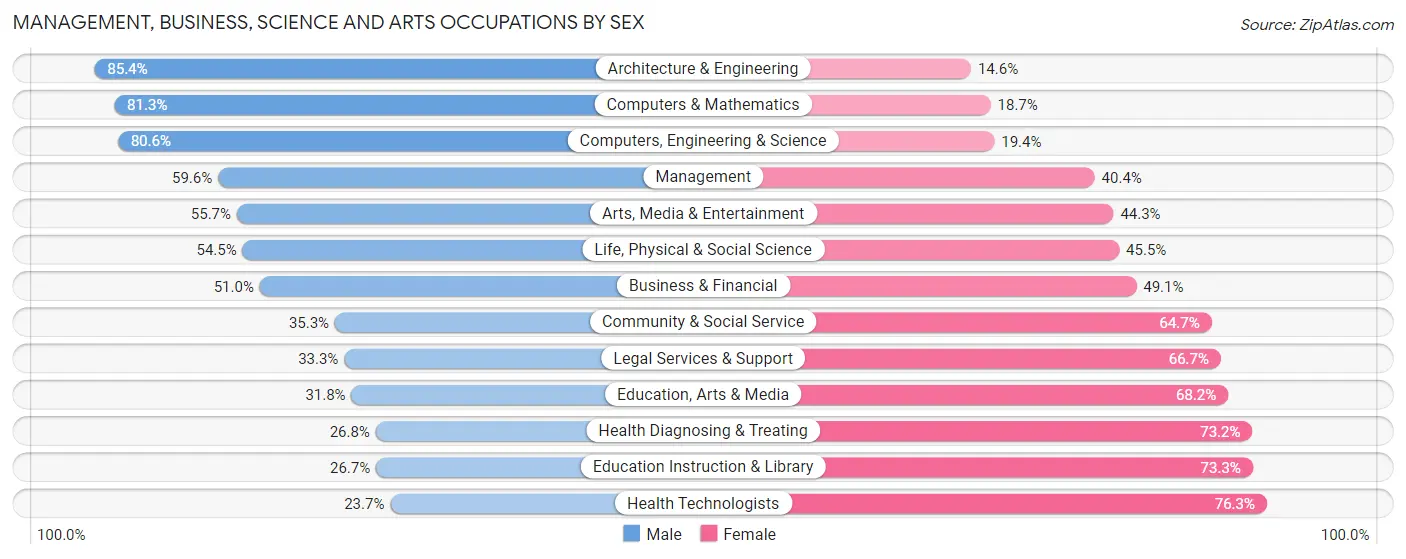
Management, Business, Science and Arts Occupations by Sex
Within the Management, Business, Science and Arts occupations in Osceola County, the most male-oriented occupations are Architecture & Engineering (85.4%), Computers & Mathematics (81.3%), and Computers, Engineering & Science (80.6%), while the most female-oriented occupations are Health Technologists (76.3%), Education Instruction & Library (73.3%), and Health Diagnosing & Treating (73.2%).
| Occupation | Male | Female |
| Management | 9,742 (59.6%) | 6,594 (40.4%) |
| Business & Financial | 4,531 (50.9%) | 4,362 (49.0%) |
| Computers, Engineering & Science | 5,767 (80.6%) | 1,391 (19.4%) |
| Computers & Mathematics | 3,265 (81.3%) | 749 (18.7%) |
| Architecture & Engineering | 2,177 (85.4%) | 371 (14.6%) |
| Life, Physical & Social Science | 325 (54.5%) | 271 (45.5%) |
| Community & Social Service | 6,005 (35.3%) | 11,026 (64.7%) |
| Education, Arts & Media | 664 (31.8%) | 1,423 (68.2%) |
| Legal Services & Support | 379 (33.3%) | 758 (66.7%) |
| Education Instruction & Library | 2,511 (26.7%) | 6,897 (73.3%) |
| Arts, Media & Entertainment | 2,451 (55.7%) | 1,948 (44.3%) |
| Health Diagnosing & Treating | 2,343 (26.8%) | 6,411 (73.2%) |
| Health Technologists | 1,303 (23.7%) | 4,187 (76.3%) |
| Total (Category) | 28,388 (48.8%) | 29,784 (51.2%) |
| Total (Overall) | 101,713 (53.2%) | 89,604 (46.8%) |
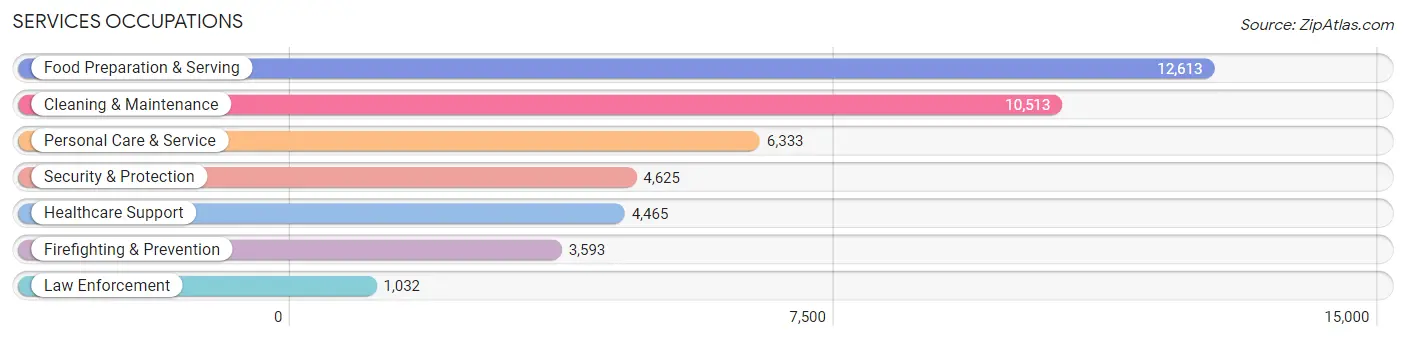
Services Occupations
The most common Services occupations in Osceola County are Food Preparation & Serving (12,613 | 6.6%), Cleaning & Maintenance (10,513 | 5.5%), Personal Care & Service (6,333 | 3.3%), Security & Protection (4,625 | 2.4%), and Healthcare Support (4,465 | 2.3%).
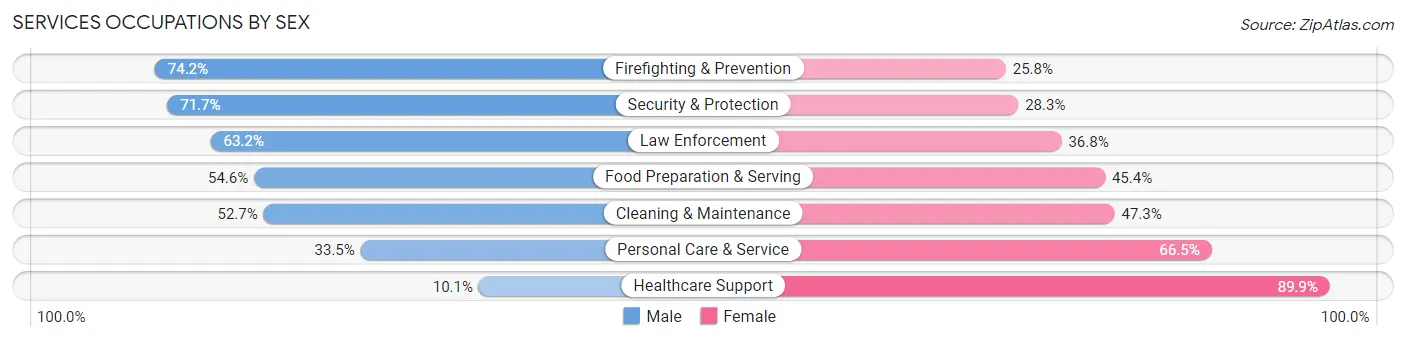
Services Occupations by Sex
Within the Services occupations in Osceola County, the most male-oriented occupations are Firefighting & Prevention (74.2%), Security & Protection (71.7%), and Law Enforcement (63.2%), while the most female-oriented occupations are Healthcare Support (89.9%), Personal Care & Service (66.5%), and Cleaning & Maintenance (47.3%).
| Occupation | Male | Female |
| Healthcare Support | 449 (10.1%) | 4,016 (89.9%) |
| Security & Protection | 3,318 (71.7%) | 1,307 (28.3%) |
| Firefighting & Prevention | 2,666 (74.2%) | 927 (25.8%) |
| Law Enforcement | 652 (63.2%) | 380 (36.8%) |
| Food Preparation & Serving | 6,883 (54.6%) | 5,730 (45.4%) |
| Cleaning & Maintenance | 5,538 (52.7%) | 4,975 (47.3%) |
| Personal Care & Service | 2,119 (33.5%) | 4,214 (66.5%) |
| Total (Category) | 18,307 (47.5%) | 20,242 (52.5%) |
| Total (Overall) | 101,713 (53.2%) | 89,604 (46.8%) |
Sales and Office Occupations
The most common Sales and Office occupations in Osceola County are Office & Administration (26,821 | 14.0%), and Sales & Related (21,248 | 11.1%).

Sales and Office Occupations by Sex
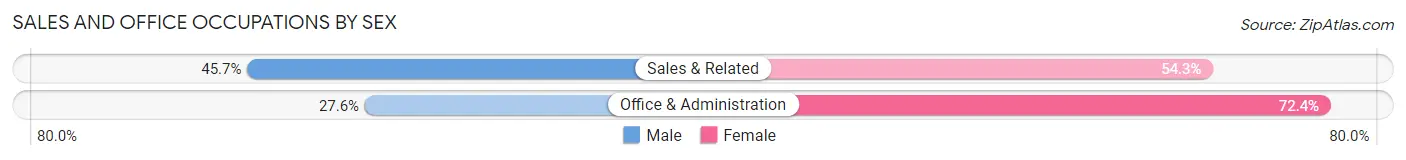
| Occupation | Male | Female |
| Sales & Related | 9,718 (45.7%) | 11,530 (54.3%) |
| Office & Administration | 7,412 (27.6%) | 19,409 (72.4%) |
| Total (Category) | 17,130 (35.6%) | 30,939 (64.4%) |
| Total (Overall) | 101,713 (53.2%) | 89,604 (46.8%) |
Natural Resources, Construction and Maintenance Occupations
The most common Natural Resources, Construction and Maintenance occupations in Osceola County are Construction & Extraction (12,032 | 6.3%), Installation, Maintenance & Repair (7,185 | 3.8%), and Farming, Fishing & Forestry (201 | 0.1%).

Natural Resources, Construction and Maintenance Occupations by Sex
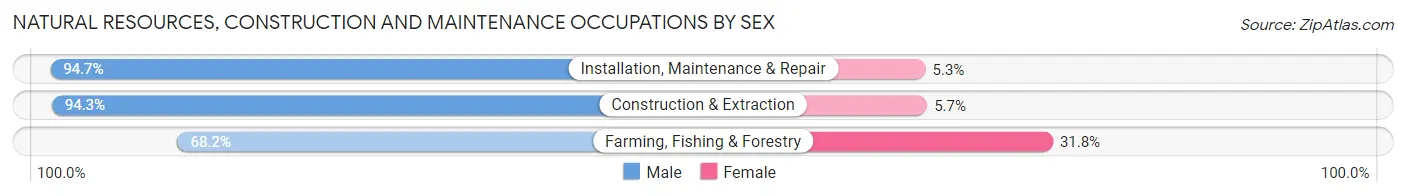
| Occupation | Male | Female |
| Farming, Fishing & Forestry | 137 (68.2%) | 64 (31.8%) |
| Construction & Extraction | 11,348 (94.3%) | 684 (5.7%) |
| Installation, Maintenance & Repair | 6,801 (94.7%) | 384 (5.3%) |
| Total (Category) | 18,286 (94.2%) | 1,132 (5.8%) |
| Total (Overall) | 101,713 (53.2%) | 89,604 (46.8%) |
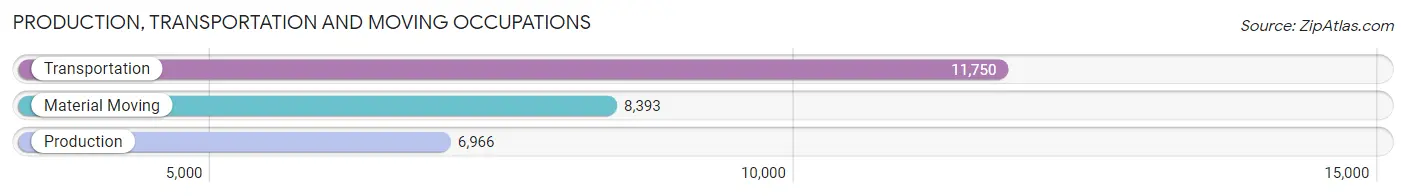
Production, Transportation and Moving Occupations
The most common Production, Transportation and Moving occupations in Osceola County are Transportation (11,750 | 6.1%), Material Moving (8,393 | 4.4%), and Production (6,966 | 3.6%).
Production, Transportation and Moving Occupations by Sex
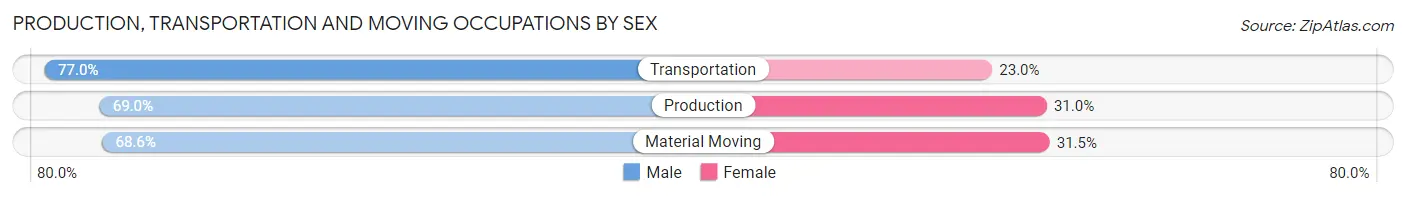
| Occupation | Male | Female |
| Production | 4,804 (69.0%) | 2,162 (31.0%) |
| Transportation | 9,045 (77.0%) | 2,705 (23.0%) |
| Material Moving | 5,753 (68.5%) | 2,640 (31.5%) |
| Total (Category) | 19,602 (72.3%) | 7,507 (27.7%) |
| Total (Overall) | 101,713 (53.2%) | 89,604 (46.8%) |
Employment Industries by Sex in Osceola County
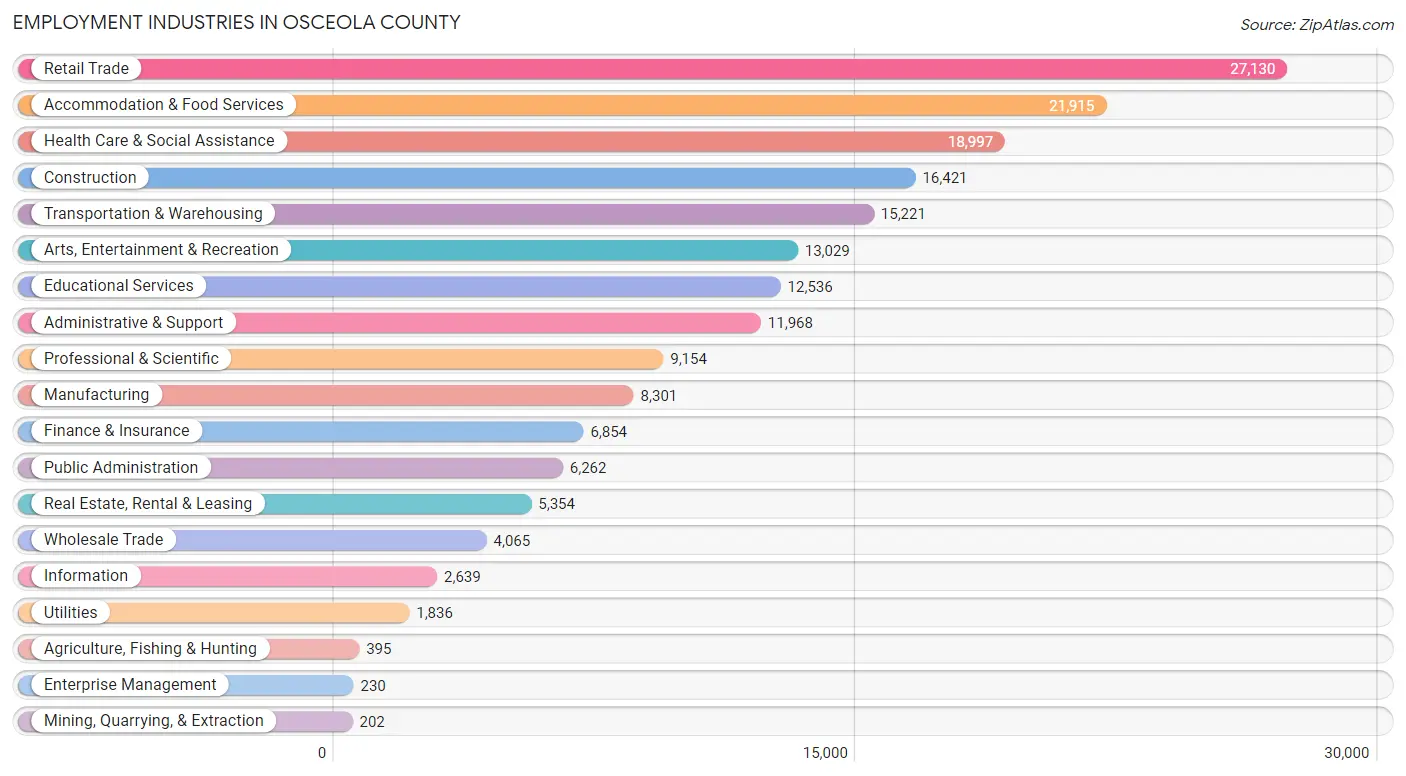
Employment Industries in Osceola County
The major employment industries in Osceola County include Retail Trade (27,130 | 14.2%), Accommodation & Food Services (21,915 | 11.5%), Health Care & Social Assistance (18,997 | 9.9%), Construction (16,421 | 8.6%), and Transportation & Warehousing (15,221 | 8.0%).
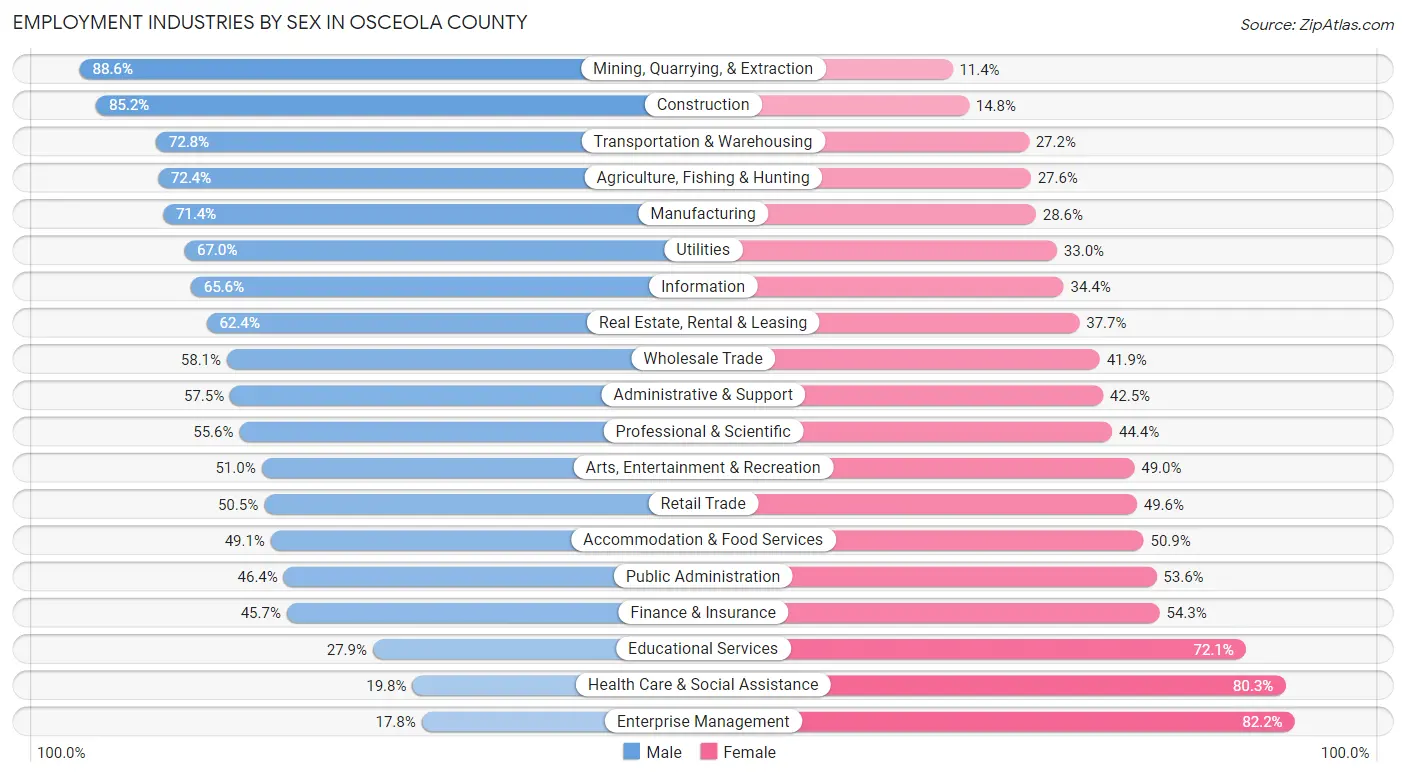
Employment Industries by Sex in Osceola County
The Osceola County industries that see more men than women are Mining, Quarrying, & Extraction (88.6%), Construction (85.2%), and Transportation & Warehousing (72.8%), whereas the industries that tend to have a higher number of women are Enterprise Management (82.2%), Health Care & Social Assistance (80.2%), and Educational Services (72.1%).
| Industry | Male | Female |
| Agriculture, Fishing & Hunting | 286 (72.4%) | 109 (27.6%) |
| Mining, Quarrying, & Extraction | 179 (88.6%) | 23 (11.4%) |
| Construction | 13,994 (85.2%) | 2,427 (14.8%) |
| Manufacturing | 5,924 (71.4%) | 2,377 (28.6%) |
| Wholesale Trade | 2,363 (58.1%) | 1,702 (41.9%) |
| Retail Trade | 13,688 (50.4%) | 13,442 (49.5%) |
| Transportation & Warehousing | 11,084 (72.8%) | 4,137 (27.2%) |
| Utilities | 1,230 (67.0%) | 606 (33.0%) |
| Information | 1,731 (65.6%) | 908 (34.4%) |
| Finance & Insurance | 3,135 (45.7%) | 3,719 (54.3%) |
| Real Estate, Rental & Leasing | 3,338 (62.4%) | 2,016 (37.7%) |
| Professional & Scientific | 5,087 (55.6%) | 4,067 (44.4%) |
| Enterprise Management | 41 (17.8%) | 189 (82.2%) |
| Administrative & Support | 6,878 (57.5%) | 5,090 (42.5%) |
| Educational Services | 3,501 (27.9%) | 9,035 (72.1%) |
| Health Care & Social Assistance | 3,751 (19.8%) | 15,246 (80.2%) |
| Arts, Entertainment & Recreation | 6,641 (51.0%) | 6,388 (49.0%) |
| Accommodation & Food Services | 10,751 (49.1%) | 11,164 (50.9%) |
| Public Administration | 2,905 (46.4%) | 3,357 (53.6%) |
| Total | 101,713 (53.2%) | 89,604 (46.8%) |
Education in Osceola County
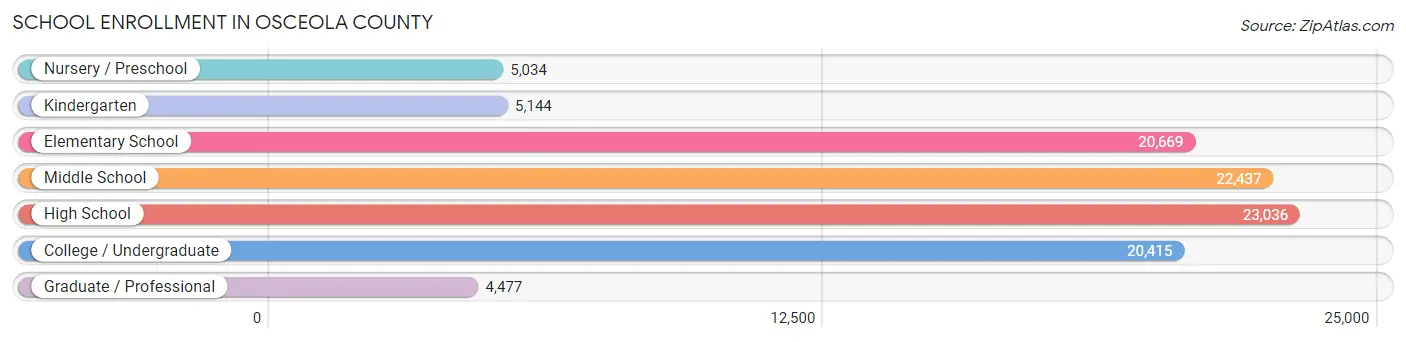
School Enrollment in Osceola County
The most common levels of schooling among the 101,212 students in Osceola County are high school (23,036 | 22.8%), middle school (22,437 | 22.2%), and elementary school (20,669 | 20.4%).
| School Level | # Students | % Students |
| Nursery / Preschool | 5,034 | 5.0% |
| Kindergarten | 5,144 | 5.1% |
| Elementary School | 20,669 | 20.4% |
| Middle School | 22,437 | 22.2% |
| High School | 23,036 | 22.8% |
| College / Undergraduate | 20,415 | 20.2% |
| Graduate / Professional | 4,477 | 4.4% |
| Total | 101,212 | 100.0% |
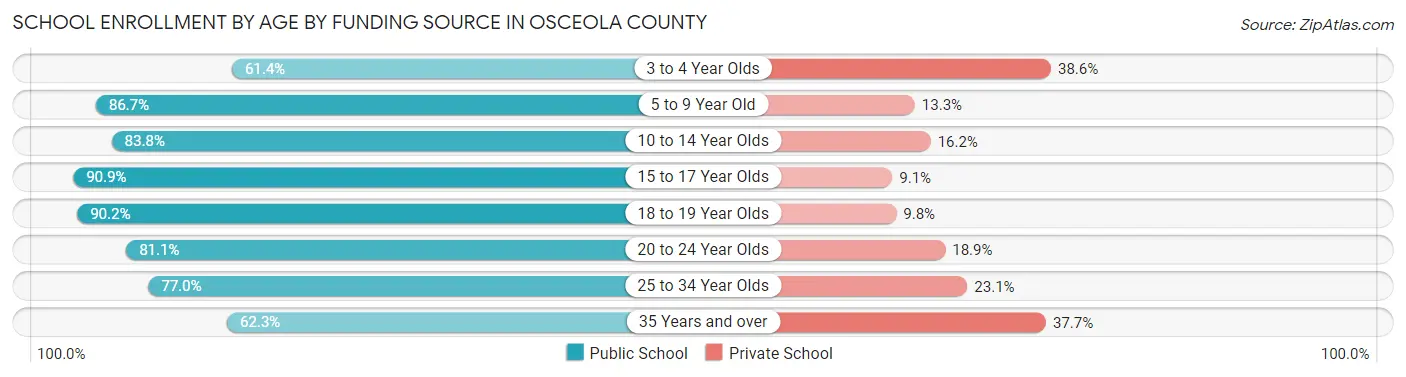
School Enrollment by Age by Funding Source in Osceola County
Out of a total of 101,212 students who are enrolled in schools in Osceola County, 16,801 (16.6%) attend a private institution, while the remaining 84,411 (83.4%) are enrolled in public schools. The age group of 3 to 4 year olds has the highest likelihood of being enrolled in private schools, with 1,512 (38.6% in the age bracket) enrolled. Conversely, the age group of 15 to 17 year olds has the lowest likelihood of being enrolled in a private school, with 15,094 (90.9% in the age bracket) attending a public institution.
| Age Bracket | Public School | Private School |
| 3 to 4 Year Olds | 2,402 (61.4%) | 1,512 (38.6%) |
| 5 to 9 Year Old | 21,791 (86.7%) | 3,335 (13.3%) |
| 10 to 14 Year Olds | 23,130 (83.8%) | 4,475 (16.2%) |
| 15 to 17 Year Olds | 15,094 (90.9%) | 1,504 (9.1%) |
| 18 to 19 Year Olds | 6,184 (90.2%) | 673 (9.8%) |
| 20 to 24 Year Olds | 8,142 (81.1%) | 1,901 (18.9%) |
| 25 to 34 Year Olds | 4,186 (76.9%) | 1,254 (23.1%) |
| 35 Years and over | 3,507 (62.3%) | 2,122 (37.7%) |
| Total | 84,411 (83.4%) | 16,801 (16.6%) |
Educational Attainment by Field of Study in Osceola County
Business (18,660 | 25.2%), science & technology (9,495 | 12.9%), education (9,023 | 12.2%), engineering (5,796 | 7.8%), and arts & humanities (4,974 | 6.7%) are the most common fields of study among 73,916 individuals in Osceola County who have obtained a bachelor's degree or higher.
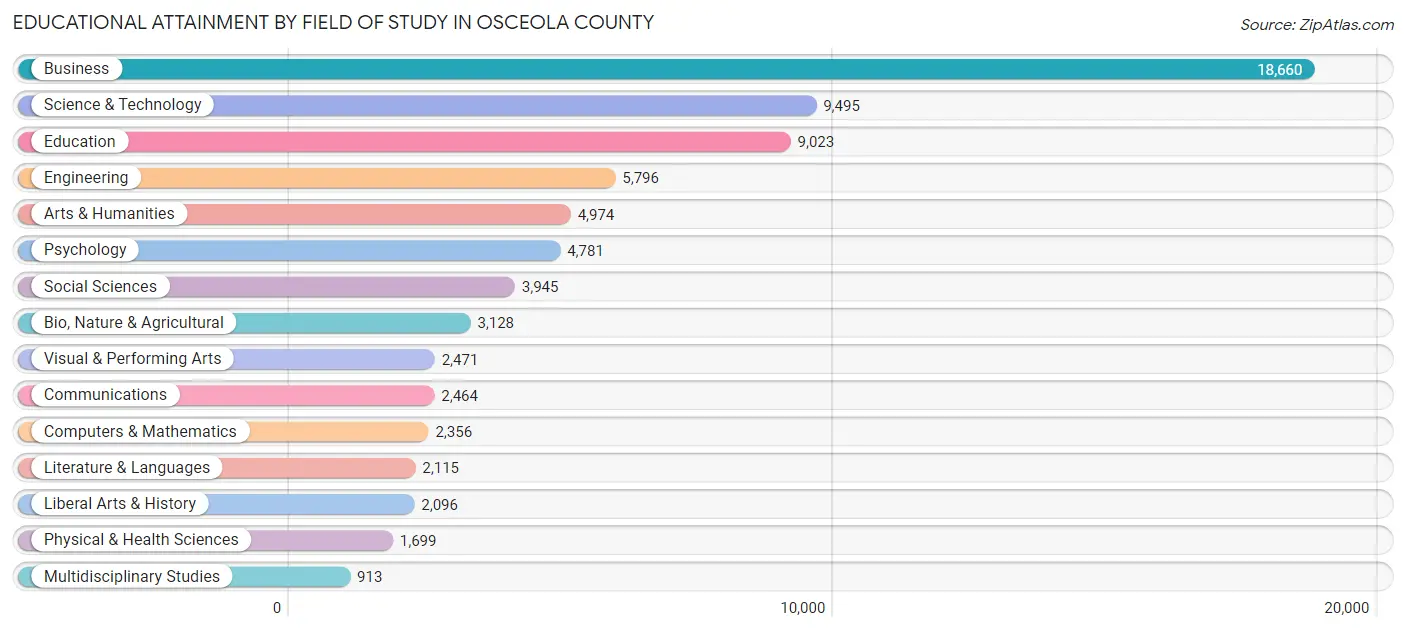
| Field of Study | # Graduates | % Graduates |
| Computers & Mathematics | 2,356 | 3.2% |
| Bio, Nature & Agricultural | 3,128 | 4.2% |
| Physical & Health Sciences | 1,699 | 2.3% |
| Psychology | 4,781 | 6.5% |
| Social Sciences | 3,945 | 5.3% |
| Engineering | 5,796 | 7.8% |
| Multidisciplinary Studies | 913 | 1.2% |
| Science & Technology | 9,495 | 12.9% |
| Business | 18,660 | 25.2% |
| Education | 9,023 | 12.2% |
| Literature & Languages | 2,115 | 2.9% |
| Liberal Arts & History | 2,096 | 2.8% |
| Visual & Performing Arts | 2,471 | 3.3% |
| Communications | 2,464 | 3.3% |
| Arts & Humanities | 4,974 | 6.7% |
| Total | 73,916 | 100.0% |
Transportation & Commute in Osceola County
Vehicle Availability by Sex in Osceola County
The most prevalent vehicle ownership categories in Osceola County are males with 2 vehicles (42,944, accounting for 43.0%) and females with 2 vehicles (36,212, making up 49.3%).
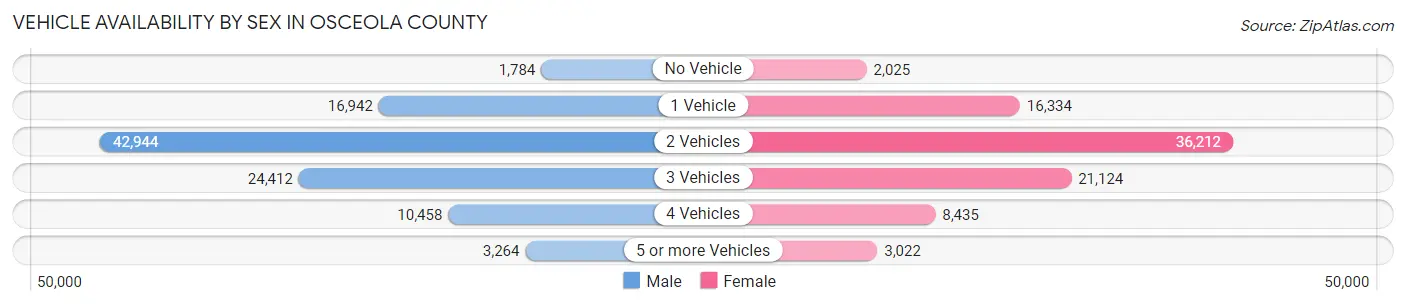
| Vehicles Available | Male | Female |
| No Vehicle | 1,784 (1.8%) | 2,025 (2.3%) |
| 1 Vehicle | 16,942 (17.0%) | 16,334 (18.7%) |
| 2 Vehicles | 42,944 (43.0%) | 36,212 (41.5%) |
| 3 Vehicles | 24,412 (24.5%) | 21,124 (24.2%) |
| 4 Vehicles | 10,458 (10.5%) | 8,435 (9.7%) |
| 5 or more Vehicles | 3,264 (3.3%) | 3,022 (3.5%) |
| Total | 99,804 (100.0%) | 87,152 (100.0%) |
Commute Time in Osceola County
The most frequently occuring commute durations in Osceola County are 30 to 34 minutes (31,119 commuters, 18.5%), 45 to 59 minutes (26,135 commuters, 15.5%), and 60 to 89 minutes (18,442 commuters, 11.0%).
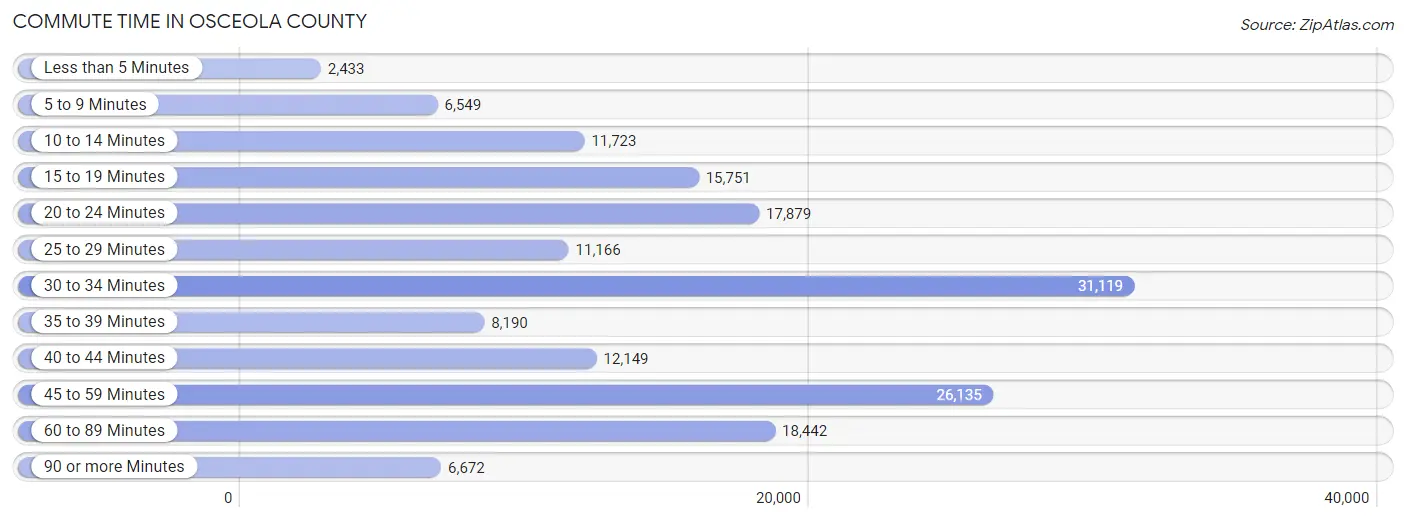
| Commute Time | # Commuters | % Commuters |
| Less than 5 Minutes | 2,433 | 1.5% |
| 5 to 9 Minutes | 6,549 | 3.9% |
| 10 to 14 Minutes | 11,723 | 7.0% |
| 15 to 19 Minutes | 15,751 | 9.4% |
| 20 to 24 Minutes | 17,879 | 10.6% |
| 25 to 29 Minutes | 11,166 | 6.6% |
| 30 to 34 Minutes | 31,119 | 18.5% |
| 35 to 39 Minutes | 8,190 | 4.9% |
| 40 to 44 Minutes | 12,149 | 7.2% |
| 45 to 59 Minutes | 26,135 | 15.5% |
| 60 to 89 Minutes | 18,442 | 11.0% |
| 90 or more Minutes | 6,672 | 4.0% |
Commute Time by Sex in Osceola County
The most common commute times in Osceola County are 30 to 34 minutes (16,744 commuters, 18.3%) for males and 30 to 34 minutes (14,375 commuters, 18.7%) for females.
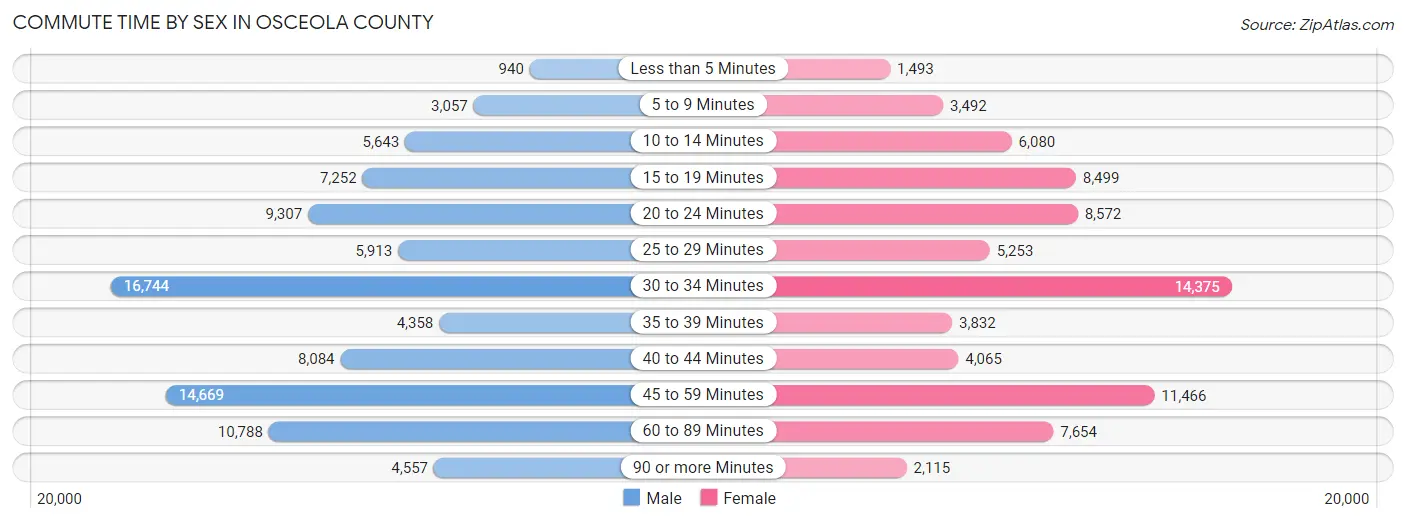
| Commute Time | Male | Female |
| Less than 5 Minutes | 940 (1.0%) | 1,493 (1.9%) |
| 5 to 9 Minutes | 3,057 (3.4%) | 3,492 (4.5%) |
| 10 to 14 Minutes | 5,643 (6.2%) | 6,080 (7.9%) |
| 15 to 19 Minutes | 7,252 (7.9%) | 8,499 (11.1%) |
| 20 to 24 Minutes | 9,307 (10.2%) | 8,572 (11.2%) |
| 25 to 29 Minutes | 5,913 (6.5%) | 5,253 (6.8%) |
| 30 to 34 Minutes | 16,744 (18.3%) | 14,375 (18.7%) |
| 35 to 39 Minutes | 4,358 (4.8%) | 3,832 (5.0%) |
| 40 to 44 Minutes | 8,084 (8.8%) | 4,065 (5.3%) |
| 45 to 59 Minutes | 14,669 (16.1%) | 11,466 (14.9%) |
| 60 to 89 Minutes | 10,788 (11.8%) | 7,654 (10.0%) |
| 90 or more Minutes | 4,557 (5.0%) | 2,115 (2.8%) |
Time of Departure to Work by Sex in Osceola County
The most frequent times of departure to work in Osceola County are 7:00 AM to 7:29 AM (12,138, 13.3%) for males and 7:00 AM to 7:29 AM (13,347, 17.4%) for females.
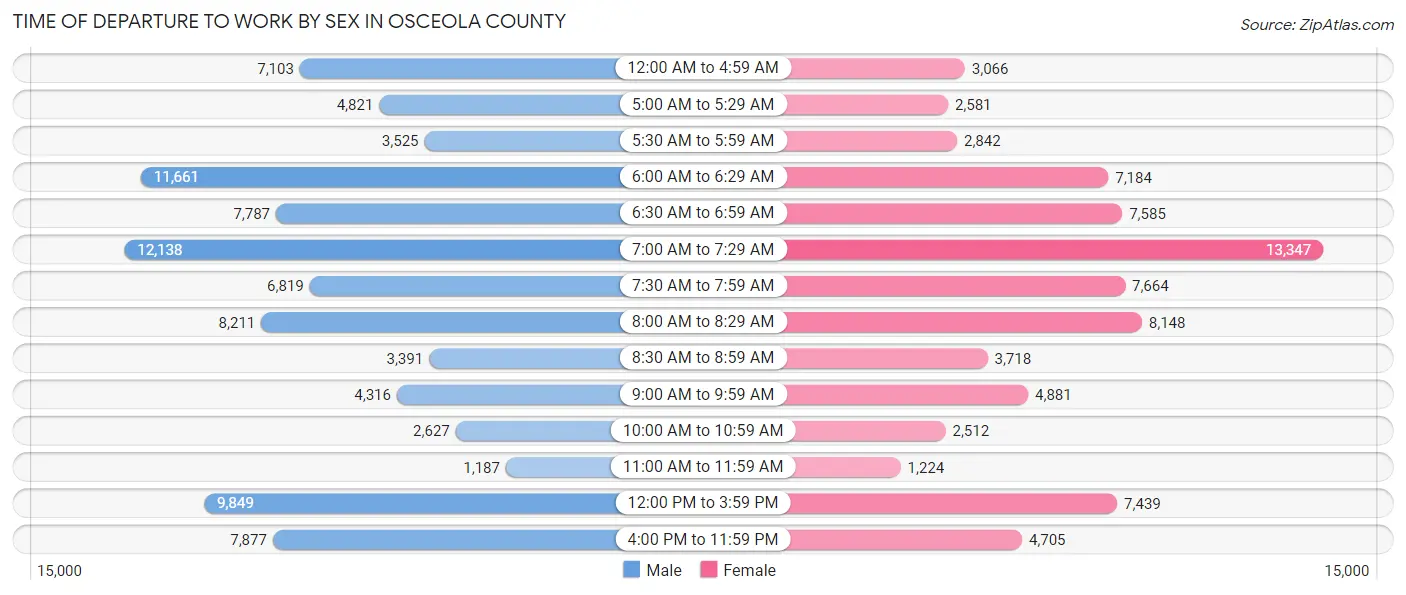
| Time of Departure | Male | Female |
| 12:00 AM to 4:59 AM | 7,103 (7.8%) | 3,066 (4.0%) |
| 5:00 AM to 5:29 AM | 4,821 (5.3%) | 2,581 (3.4%) |
| 5:30 AM to 5:59 AM | 3,525 (3.9%) | 2,842 (3.7%) |
| 6:00 AM to 6:29 AM | 11,661 (12.8%) | 7,184 (9.3%) |
| 6:30 AM to 6:59 AM | 7,787 (8.5%) | 7,585 (9.9%) |
| 7:00 AM to 7:29 AM | 12,138 (13.3%) | 13,347 (17.4%) |
| 7:30 AM to 7:59 AM | 6,819 (7.5%) | 7,664 (10.0%) |
| 8:00 AM to 8:29 AM | 8,211 (9.0%) | 8,148 (10.6%) |
| 8:30 AM to 8:59 AM | 3,391 (3.7%) | 3,718 (4.8%) |
| 9:00 AM to 9:59 AM | 4,316 (4.7%) | 4,881 (6.4%) |
| 10:00 AM to 10:59 AM | 2,627 (2.9%) | 2,512 (3.3%) |
| 11:00 AM to 11:59 AM | 1,187 (1.3%) | 1,224 (1.6%) |
| 12:00 PM to 3:59 PM | 9,849 (10.8%) | 7,439 (9.7%) |
| 4:00 PM to 11:59 PM | 7,877 (8.6%) | 4,705 (6.1%) |
| Total | 91,312 (100.0%) | 76,896 (100.0%) |
Housing Occupancy in Osceola County
Occupancy by Ownership in Osceola County
Of the total 119,817 dwellings in Osceola County, owner-occupied units account for 78,747 (65.7%), while renter-occupied units make up 41,070 (34.3%).
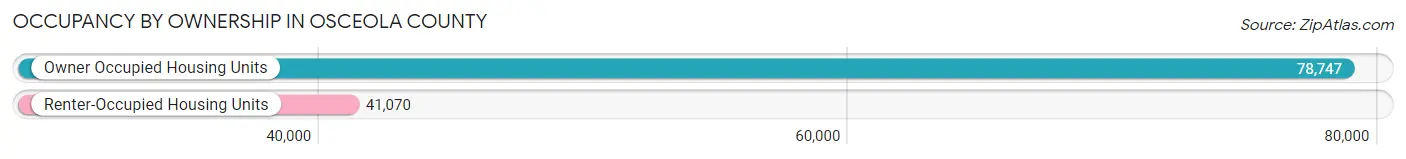
| Occupancy | # Housing Units | % Housing Units |
| Owner Occupied Housing Units | 78,747 | 65.7% |
| Renter-Occupied Housing Units | 41,070 | 34.3% |
| Total Occupied Housing Units | 119,817 | 100.0% |
Occupancy by Household Size in Osceola County
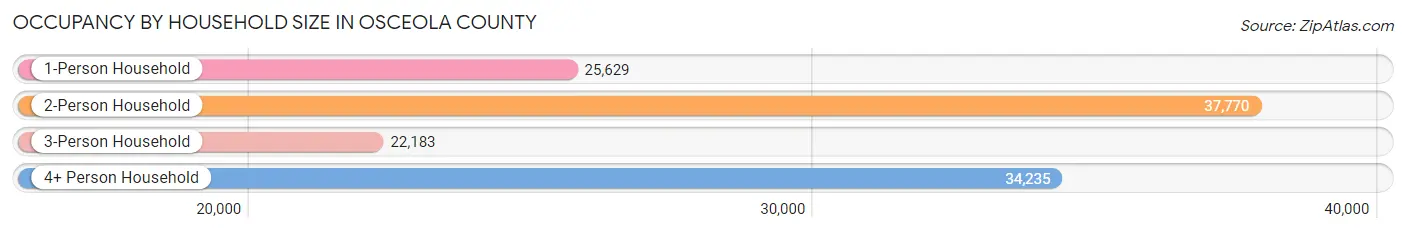
| Household Size | # Housing Units | % Housing Units |
| 1-Person Household | 25,629 | 21.4% |
| 2-Person Household | 37,770 | 31.5% |
| 3-Person Household | 22,183 | 18.5% |
| 4+ Person Household | 34,235 | 28.6% |
| Total Housing Units | 119,817 | 100.0% |
Occupancy by Ownership by Household Size in Osceola County
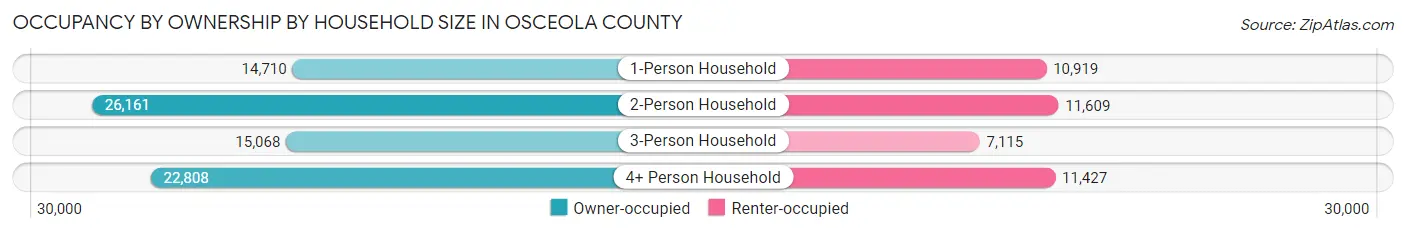
| Household Size | Owner-occupied | Renter-occupied |
| 1-Person Household | 14,710 (57.4%) | 10,919 (42.6%) |
| 2-Person Household | 26,161 (69.3%) | 11,609 (30.7%) |
| 3-Person Household | 15,068 (67.9%) | 7,115 (32.1%) |
| 4+ Person Household | 22,808 (66.6%) | 11,427 (33.4%) |
| Total Housing Units | 78,747 (65.7%) | 41,070 (34.3%) |
Occupancy by Educational Attainment in Osceola County
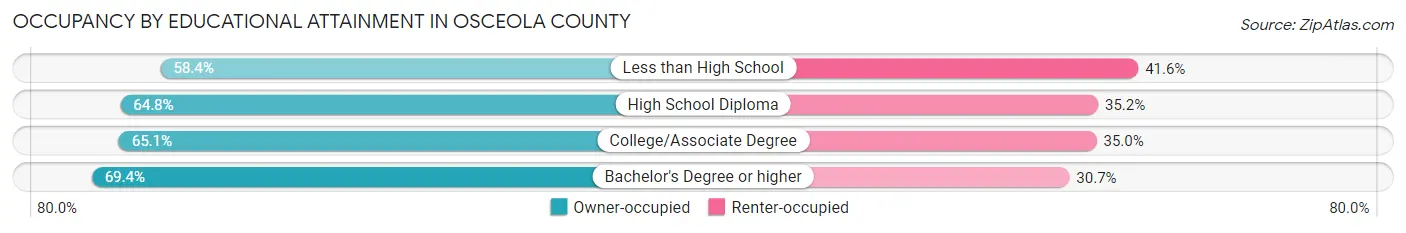
| Household Size | Owner-occupied | Renter-occupied |
| Less than High School | 6,284 (58.4%) | 4,468 (41.6%) |
| High School Diploma | 20,905 (64.8%) | 11,351 (35.2%) |
| College/Associate Degree | 25,873 (65.0%) | 13,901 (34.9%) |
| Bachelor's Degree or higher | 25,685 (69.4%) | 11,350 (30.6%) |
Occupancy by Age of Householder in Osceola County
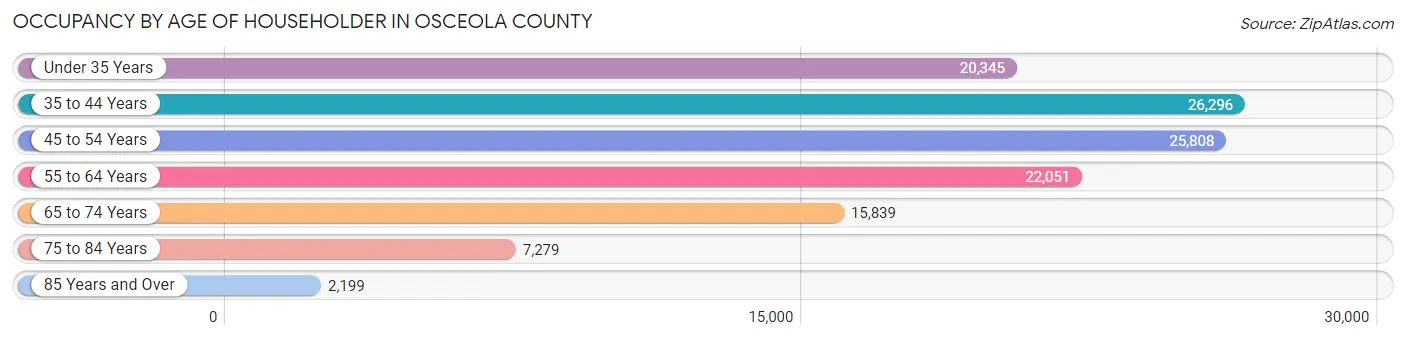
| Age Bracket | # Households | % Households |
| Under 35 Years | 20,345 | 17.0% |
| 35 to 44 Years | 26,296 | 22.0% |
| 45 to 54 Years | 25,808 | 21.5% |
| 55 to 64 Years | 22,051 | 18.4% |
| 65 to 74 Years | 15,839 | 13.2% |
| 75 to 84 Years | 7,279 | 6.1% |
| 85 Years and Over | 2,199 | 1.8% |
| Total | 119,817 | 100.0% |
Housing Finances in Osceola County
Median Income by Occupancy in Osceola County
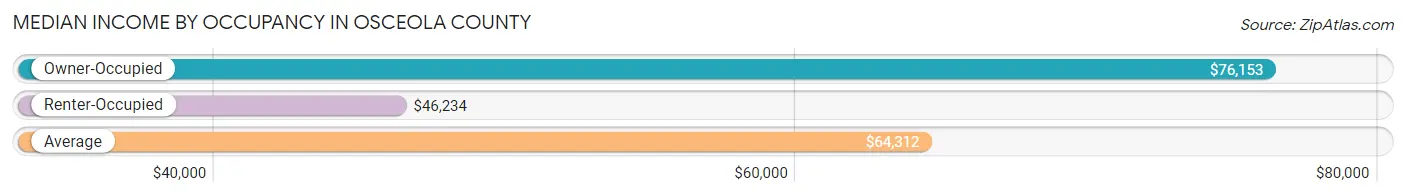
| Occupancy Type | # Households | Median Income |
| Owner-Occupied | 78,747 (65.7%) | $76,153 |
| Renter-Occupied | 41,070 (34.3%) | $46,234 |
| Average | 119,817 (100.0%) | $64,312 |
Occupancy by Householder Income Bracket in Osceola County
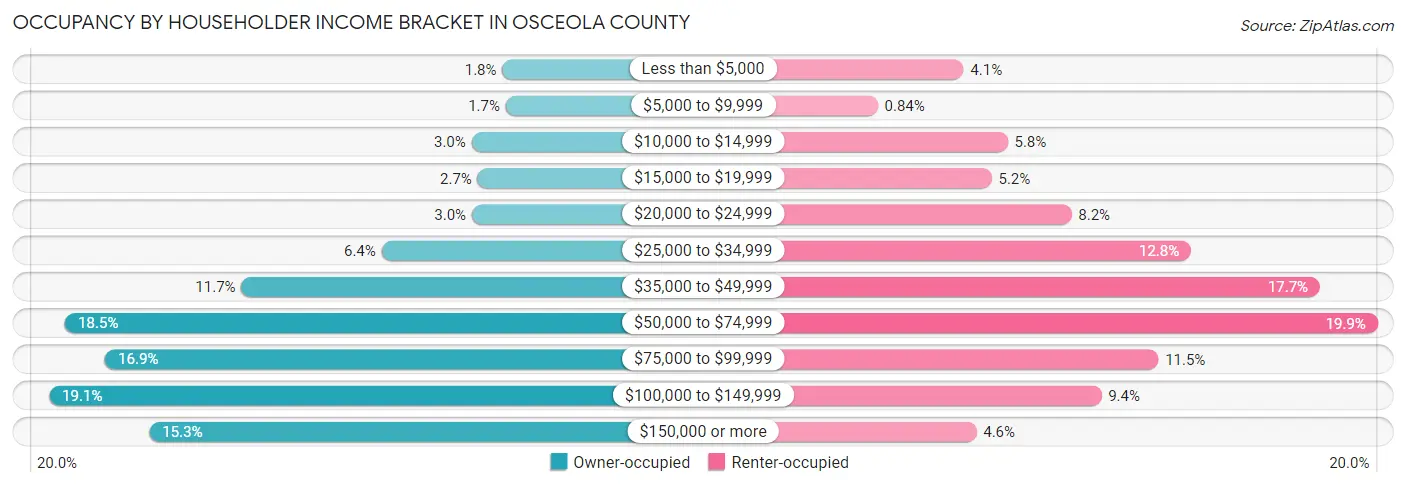
| Income Bracket | Owner-occupied | Renter-occupied |
| Less than $5,000 | 1,418 (1.8%) | 1,688 (4.1%) |
| $5,000 to $9,999 | 1,318 (1.7%) | 343 (0.8%) |
| $10,000 to $14,999 | 2,342 (3.0%) | 2,379 (5.8%) |
| $15,000 to $19,999 | 2,157 (2.7%) | 2,129 (5.2%) |
| $20,000 to $24,999 | 2,330 (3.0%) | 3,378 (8.2%) |
| $25,000 to $34,999 | 5,042 (6.4%) | 5,250 (12.8%) |
| $35,000 to $49,999 | 9,247 (11.7%) | 7,265 (17.7%) |
| $50,000 to $74,999 | 14,537 (18.5%) | 8,167 (19.9%) |
| $75,000 to $99,999 | 13,330 (16.9%) | 4,737 (11.5%) |
| $100,000 to $149,999 | 15,014 (19.1%) | 3,843 (9.4%) |
| $150,000 or more | 12,012 (15.2%) | 1,891 (4.6%) |
| Total | 78,747 (100.0%) | 41,070 (100.0%) |
Monthly Housing Cost Tiers in Osceola County
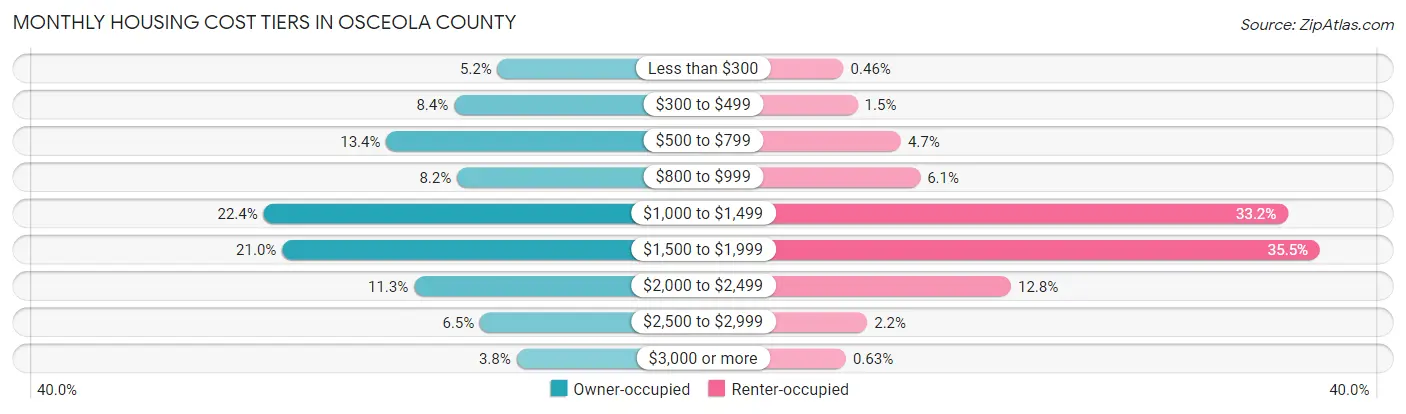
| Monthly Cost | Owner-occupied | Renter-occupied |
| Less than $300 | 4,062 (5.2%) | 189 (0.5%) |
| $300 to $499 | 6,592 (8.4%) | 612 (1.5%) |
| $500 to $799 | 10,518 (13.4%) | 1,922 (4.7%) |
| $800 to $999 | 6,416 (8.2%) | 2,506 (6.1%) |
| $1,000 to $1,499 | 17,640 (22.4%) | 13,633 (33.2%) |
| $1,500 to $1,999 | 16,561 (21.0%) | 14,594 (35.5%) |
| $2,000 to $2,499 | 8,913 (11.3%) | 5,254 (12.8%) |
| $2,500 to $2,999 | 5,076 (6.5%) | 905 (2.2%) |
| $3,000 or more | 2,969 (3.8%) | 260 (0.6%) |
| Total | 78,747 (100.0%) | 41,070 (100.0%) |
Physical Housing Characteristics in Osceola County
Housing Structures in Osceola County
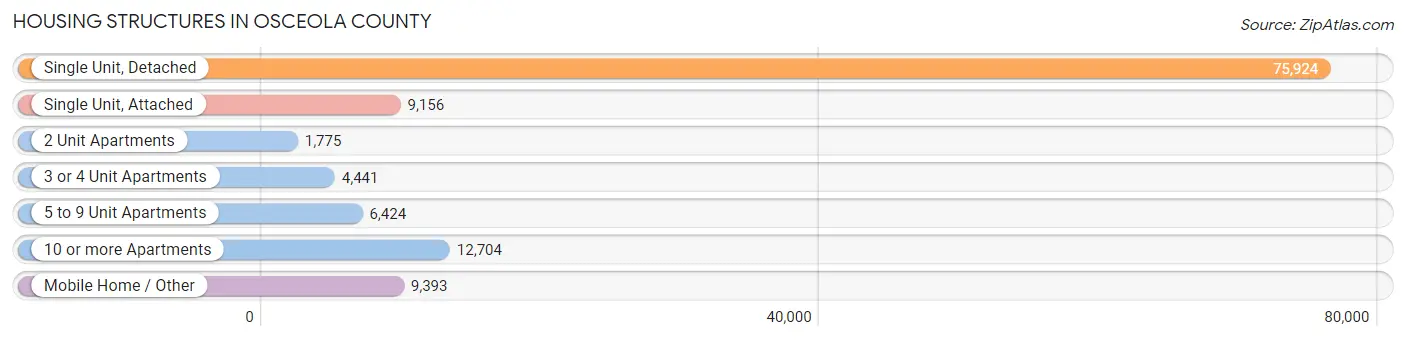
| Structure Type | # Housing Units | % Housing Units |
| Single Unit, Detached | 75,924 | 63.4% |
| Single Unit, Attached | 9,156 | 7.6% |
| 2 Unit Apartments | 1,775 | 1.5% |
| 3 or 4 Unit Apartments | 4,441 | 3.7% |
| 5 to 9 Unit Apartments | 6,424 | 5.4% |
| 10 or more Apartments | 12,704 | 10.6% |
| Mobile Home / Other | 9,393 | 7.8% |
| Total | 119,817 | 100.0% |
Housing Structures by Occupancy in Osceola County
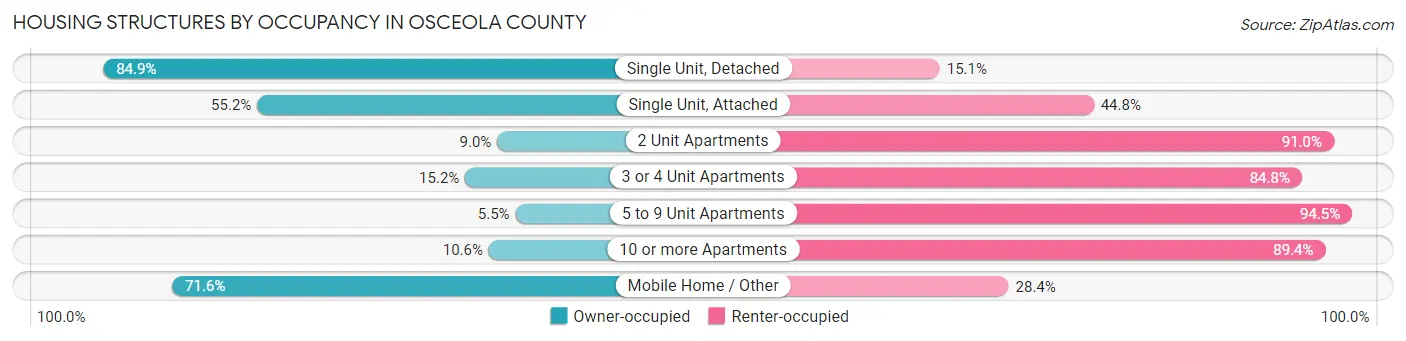
| Structure Type | Owner-occupied | Renter-occupied |
| Single Unit, Detached | 64,428 (84.9%) | 11,496 (15.1%) |
| Single Unit, Attached | 5,056 (55.2%) | 4,100 (44.8%) |
| 2 Unit Apartments | 160 (9.0%) | 1,615 (91.0%) |
| 3 or 4 Unit Apartments | 674 (15.2%) | 3,767 (84.8%) |
| 5 to 9 Unit Apartments | 353 (5.5%) | 6,071 (94.5%) |
| 10 or more Apartments | 1,350 (10.6%) | 11,354 (89.4%) |
| Mobile Home / Other | 6,726 (71.6%) | 2,667 (28.4%) |
| Total | 78,747 (65.7%) | 41,070 (34.3%) |
Housing Structures by Number of Rooms in Osceola County
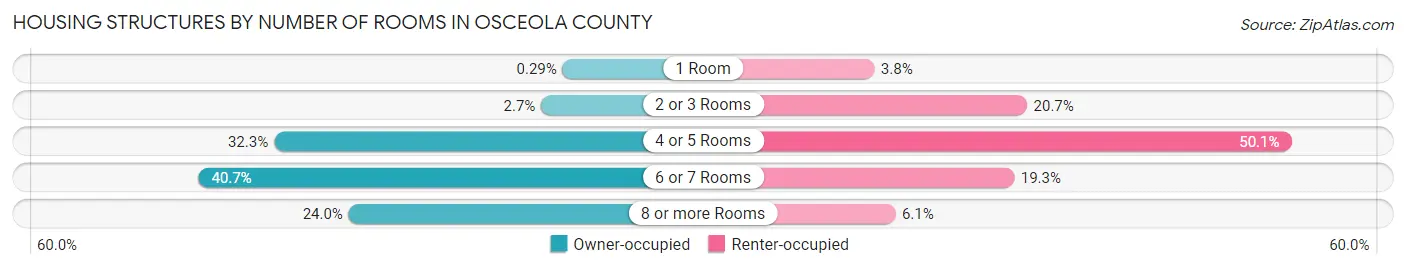
| Number of Rooms | Owner-occupied | Renter-occupied |
| 1 Room | 225 (0.3%) | 1,549 (3.8%) |
| 2 or 3 Rooms | 2,104 (2.7%) | 8,511 (20.7%) |
| 4 or 5 Rooms | 25,448 (32.3%) | 20,574 (50.1%) |
| 6 or 7 Rooms | 32,051 (40.7%) | 7,926 (19.3%) |
| 8 or more Rooms | 18,919 (24.0%) | 2,510 (6.1%) |
| Total | 78,747 (100.0%) | 41,070 (100.0%) |
Housing Structure by Heating Type in Osceola County
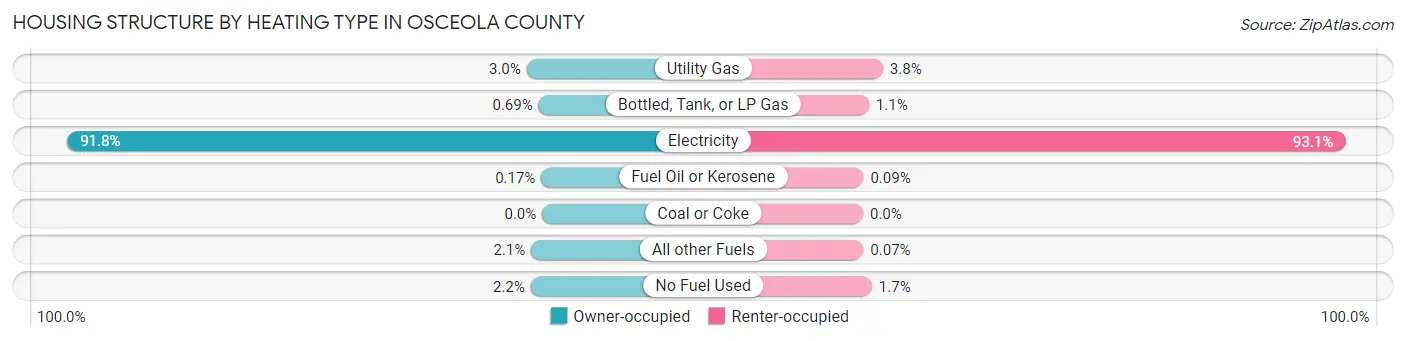
| Heating Type | Owner-occupied | Renter-occupied |
| Utility Gas | 2,373 (3.0%) | 1,576 (3.8%) |
| Bottled, Tank, or LP Gas | 542 (0.7%) | 470 (1.1%) |
| Electricity | 72,260 (91.8%) | 38,253 (93.1%) |
| Fuel Oil or Kerosene | 134 (0.2%) | 39 (0.1%) |
| Coal or Coke | 0 (0.0%) | 0 (0.0%) |
| All other Fuels | 1,689 (2.1%) | 29 (0.1%) |
| No Fuel Used | 1,749 (2.2%) | 703 (1.7%) |
| Total | 78,747 (100.0%) | 41,070 (100.0%) |
Household Vehicle Usage in Osceola County
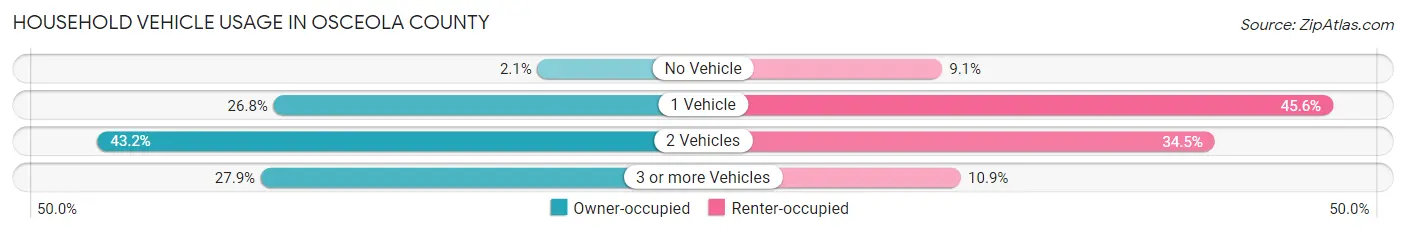
| Vehicles per Household | Owner-occupied | Renter-occupied |
| No Vehicle | 1,668 (2.1%) | 3,735 (9.1%) |
| 1 Vehicle | 21,062 (26.8%) | 18,706 (45.6%) |
| 2 Vehicles | 34,018 (43.2%) | 14,173 (34.5%) |
| 3 or more Vehicles | 21,999 (27.9%) | 4,456 (10.8%) |
| Total | 78,747 (100.0%) | 41,070 (100.0%) |
Real Estate & Mortgages in Osceola County
Real Estate and Mortgage Overview in Osceola County
| Characteristic | Without Mortgage | With Mortgage |
| Housing Units | 25,445 | 53,302 |
| Median Property Value | $248,800 | $295,600 |
| Median Household Income | $61,340 | $9,016 |
| Monthly Housing Costs | $567 | $2,930 |
| Real Estate Taxes | $2,150 | $1,895 |
Property Value by Mortgage Status in Osceola County
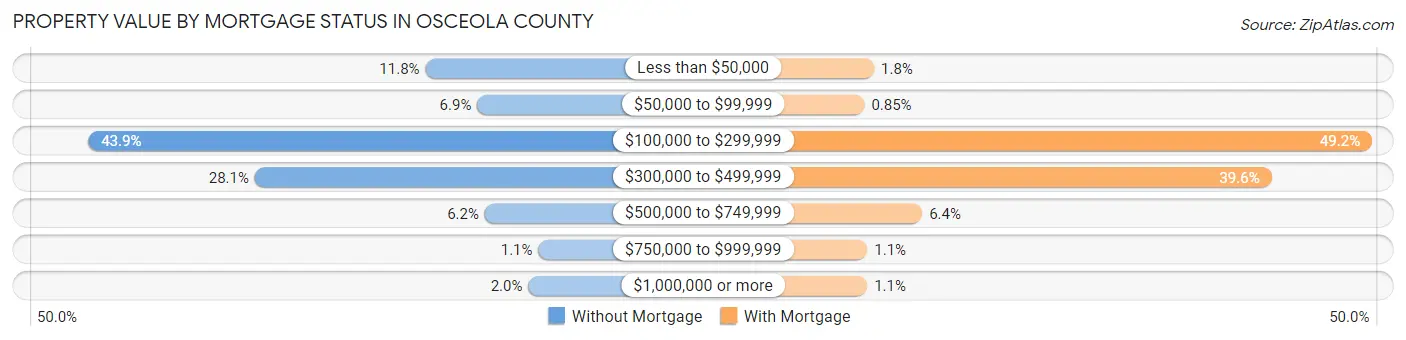
| Property Value | Without Mortgage | With Mortgage |
| Less than $50,000 | 3,009 (11.8%) | 943 (1.8%) |
| $50,000 to $99,999 | 1,752 (6.9%) | 455 (0.9%) |
| $100,000 to $299,999 | 11,181 (43.9%) | 26,214 (49.2%) |
| $300,000 to $499,999 | 7,144 (28.1%) | 21,113 (39.6%) |
| $500,000 to $749,999 | 1,571 (6.2%) | 3,385 (6.4%) |
| $750,000 to $999,999 | 272 (1.1%) | 599 (1.1%) |
| $1,000,000 or more | 516 (2.0%) | 593 (1.1%) |
| Total | 25,445 (100.0%) | 53,302 (100.0%) |
Household Income by Mortgage Status in Osceola County
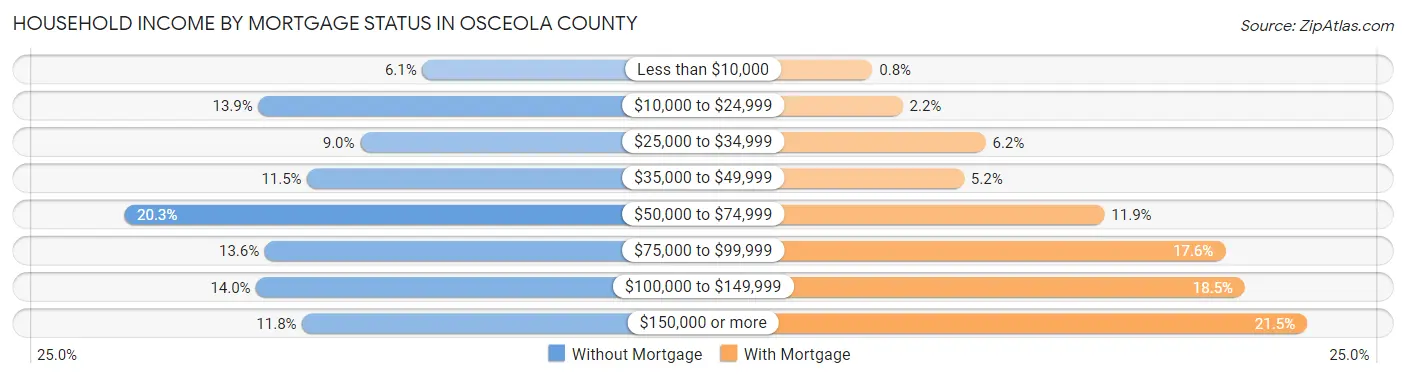
| Household Income | Without Mortgage | With Mortgage |
| Less than $10,000 | 1,540 (6.0%) | 427 (0.8%) |
| $10,000 to $24,999 | 3,527 (13.9%) | 1,196 (2.2%) |
| $25,000 to $34,999 | 2,293 (9.0%) | 3,302 (6.2%) |
| $35,000 to $49,999 | 2,933 (11.5%) | 2,749 (5.2%) |
| $50,000 to $74,999 | 5,155 (20.3%) | 6,314 (11.8%) |
| $75,000 to $99,999 | 3,448 (13.6%) | 9,382 (17.6%) |
| $100,000 to $149,999 | 3,553 (14.0%) | 9,882 (18.5%) |
| $150,000 or more | 2,996 (11.8%) | 11,461 (21.5%) |
| Total | 25,445 (100.0%) | 53,302 (100.0%) |
Property Value to Household Income Ratio in Osceola County
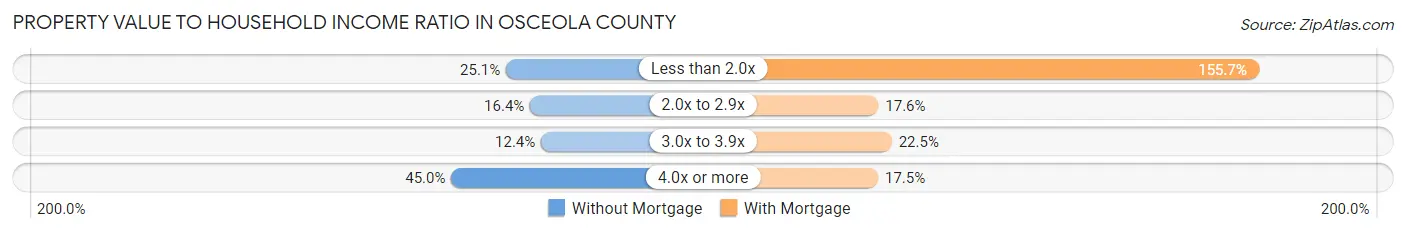
| Value-to-Income Ratio | Without Mortgage | With Mortgage |
| Less than 2.0x | 6,388 (25.1%) | 83,012 (155.7%) |
| 2.0x to 2.9x | 4,163 (16.4%) | 9,374 (17.6%) |
| 3.0x to 3.9x | 3,151 (12.4%) | 11,973 (22.5%) |
| 4.0x or more | 11,450 (45.0%) | 9,312 (17.5%) |
| Total | 25,445 (100.0%) | 53,302 (100.0%) |
Real Estate Taxes by Mortgage Status in Osceola County
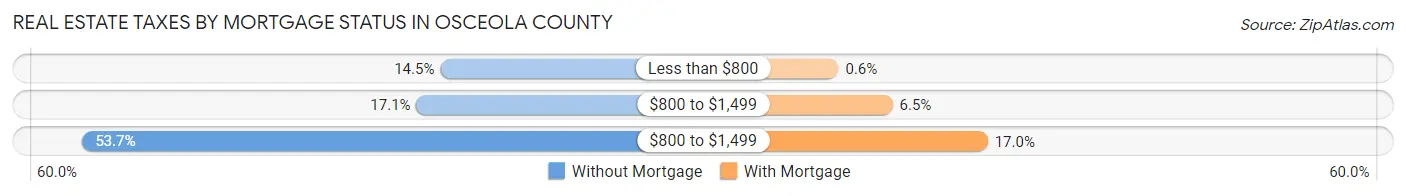
| Property Taxes | Without Mortgage | With Mortgage |
| Less than $800 | 3,676 (14.4%) | 318 (0.6%) |
| $800 to $1,499 | 4,341 (17.1%) | 3,480 (6.5%) |
| $800 to $1,499 | 13,659 (53.7%) | 9,036 (17.0%) |
| Total | 25,445 (100.0%) | 53,302 (100.0%) |
Health & Disability in Osceola County
Health Insurance Coverage by Age in Osceola County
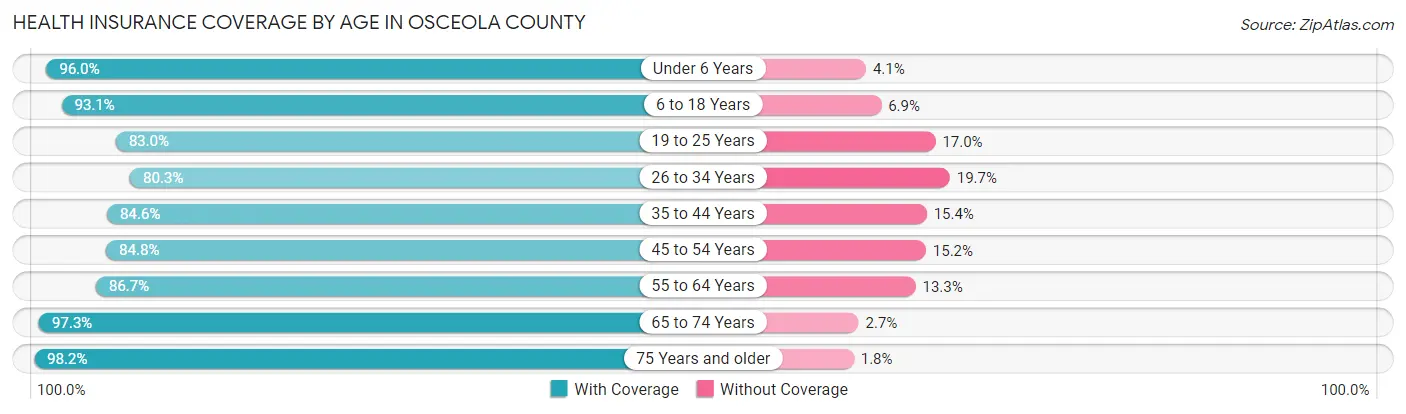
| Age Bracket | With Coverage | Without Coverage |
| Under 6 Years | 27,474 (96.0%) | 1,160 (4.1%) |
| 6 to 18 Years | 65,844 (93.1%) | 4,861 (6.9%) |
| 19 to 25 Years | 31,857 (83.0%) | 6,525 (17.0%) |
| 26 to 34 Years | 39,934 (80.3%) | 9,781 (19.7%) |
| 35 to 44 Years | 49,108 (84.6%) | 8,918 (15.4%) |
| 45 to 54 Years | 44,500 (84.8%) | 7,984 (15.2%) |
| 55 to 64 Years | 37,403 (86.7%) | 5,731 (13.3%) |
| 65 to 74 Years | 30,246 (97.3%) | 831 (2.7%) |
| 75 Years and older | 19,356 (98.2%) | 349 (1.8%) |
| Total | 345,722 (88.2%) | 46,140 (11.8%) |
Health Insurance Coverage by Citizenship Status in Osceola County
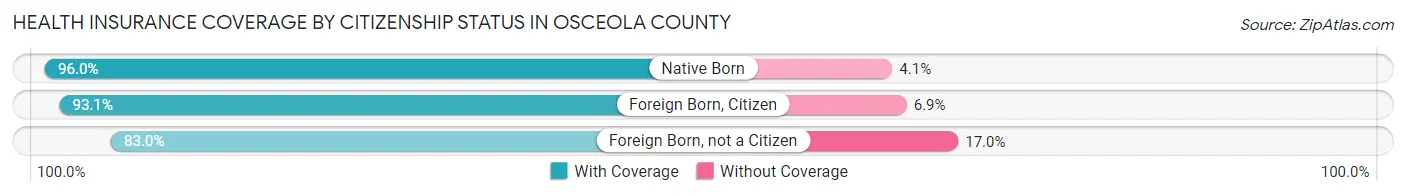
| Citizenship Status | With Coverage | Without Coverage |
| Native Born | 27,474 (96.0%) | 1,160 (4.1%) |
| Foreign Born, Citizen | 65,844 (93.1%) | 4,861 (6.9%) |
| Foreign Born, not a Citizen | 31,857 (83.0%) | 6,525 (17.0%) |
Health Insurance Coverage by Household Income in Osceola County
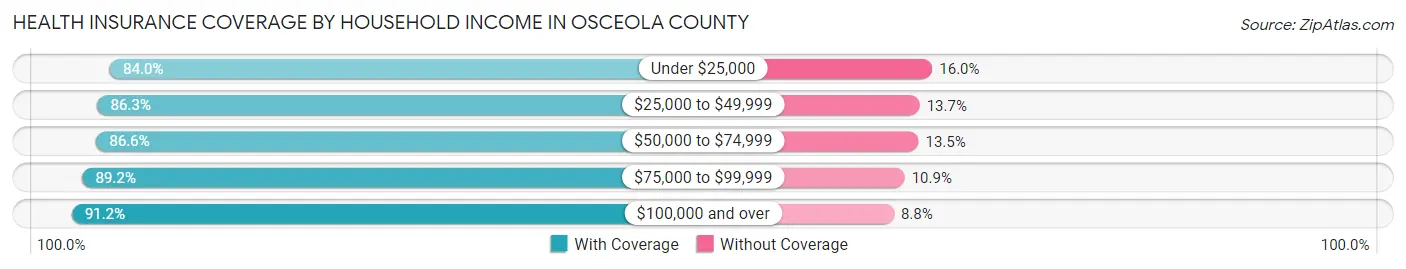
| Household Income | With Coverage | Without Coverage |
| Under $25,000 | 35,895 (84.0%) | 6,854 (16.0%) |
| $25,000 to $49,999 | 64,038 (86.3%) | 10,128 (13.7%) |
| $50,000 to $74,999 | 64,990 (86.6%) | 10,103 (13.5%) |
| $75,000 to $99,999 | 57,703 (89.1%) | 7,022 (10.8%) |
| $100,000 and over | 122,867 (91.2%) | 11,912 (8.8%) |
Public vs Private Health Insurance Coverage by Age in Osceola County
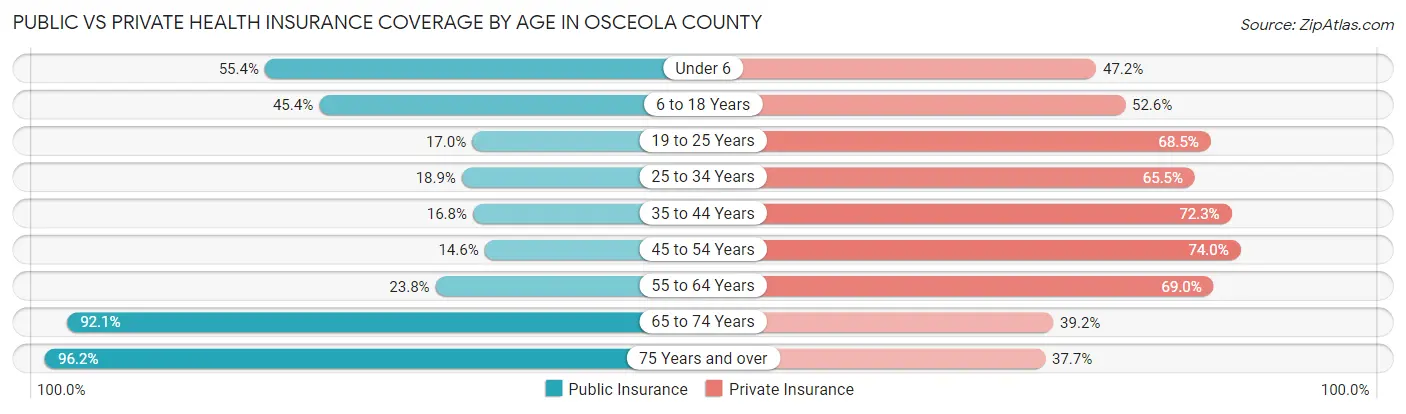
| Age Bracket | Public Insurance | Private Insurance |
| Under 6 | 15,872 (55.4%) | 13,511 (47.2%) |
| 6 to 18 Years | 32,069 (45.4%) | 37,169 (52.6%) |
| 19 to 25 Years | 6,511 (17.0%) | 26,275 (68.5%) |
| 25 to 34 Years | 9,379 (18.9%) | 32,577 (65.5%) |
| 35 to 44 Years | 9,751 (16.8%) | 41,967 (72.3%) |
| 45 to 54 Years | 7,684 (14.6%) | 38,837 (74.0%) |
| 55 to 64 Years | 10,245 (23.7%) | 29,768 (69.0%) |
| 65 to 74 Years | 28,616 (92.1%) | 12,193 (39.2%) |
| 75 Years and over | 18,957 (96.2%) | 7,434 (37.7%) |
| Total | 139,084 (35.5%) | 239,731 (61.2%) |
Disability Status by Sex by Age in Osceola County
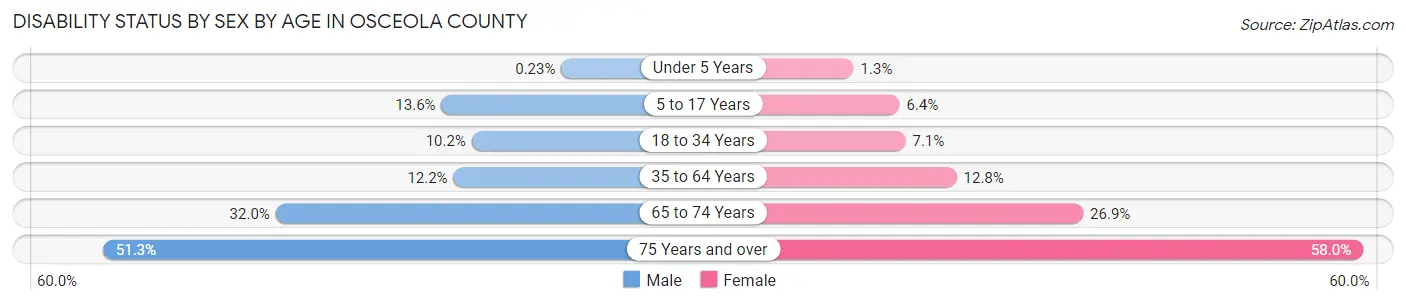
| Age Bracket | Male | Female |
| Under 5 Years | 28 (0.2%) | 153 (1.3%) |
| 5 to 17 Years | 4,985 (13.6%) | 2,204 (6.4%) |
| 18 to 34 Years | 4,799 (10.2%) | 3,243 (7.1%) |
| 35 to 64 Years | 9,301 (12.2%) | 9,929 (12.8%) |
| 65 to 74 Years | 4,590 (32.0%) | 4,502 (26.9%) |
| 75 Years and over | 4,294 (51.3%) | 6,577 (58.0%) |
Disability Class by Sex by Age in Osceola County
Disability Class: Hearing Difficulty
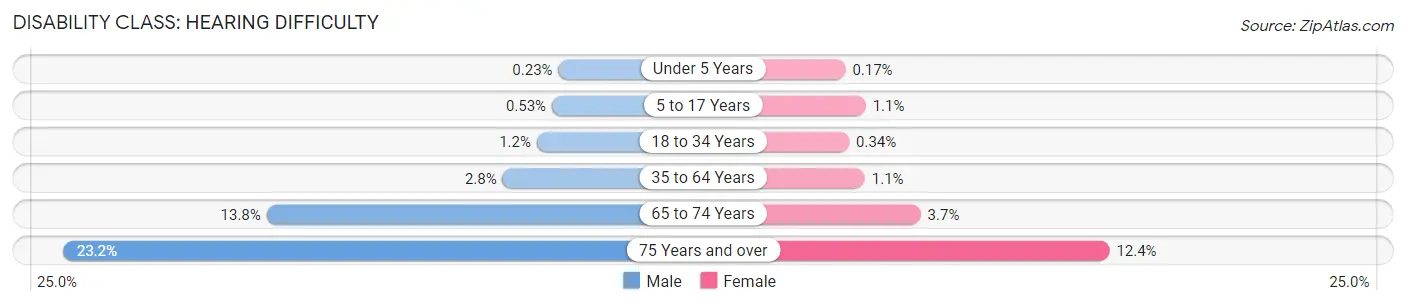
| Age Bracket | Male | Female |
| Under 5 Years | 28 (0.2%) | 20 (0.2%) |
| 5 to 17 Years | 195 (0.5%) | 381 (1.1%) |
| 18 to 34 Years | 578 (1.2%) | 154 (0.3%) |
| 35 to 64 Years | 2,141 (2.8%) | 828 (1.1%) |
| 65 to 74 Years | 1,973 (13.8%) | 613 (3.7%) |
| 75 Years and over | 1,941 (23.2%) | 1,407 (12.4%) |
Disability Class: Vision Difficulty
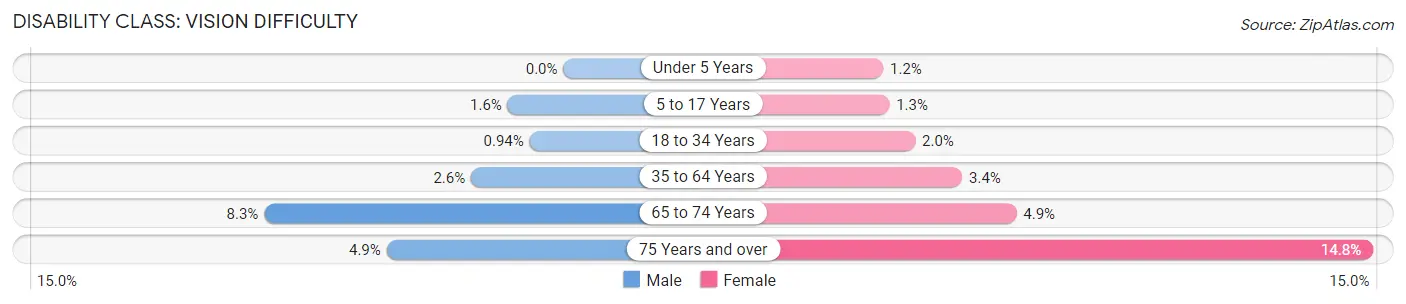
| Age Bracket | Male | Female |
| Under 5 Years | 0 (0.0%) | 133 (1.1%) |
| 5 to 17 Years | 568 (1.5%) | 452 (1.3%) |
| 18 to 34 Years | 441 (0.9%) | 931 (2.0%) |
| 35 to 64 Years | 1,954 (2.6%) | 2,600 (3.4%) |
| 65 to 74 Years | 1,193 (8.3%) | 814 (4.9%) |
| 75 Years and over | 412 (4.9%) | 1,676 (14.8%) |
Disability Class: Cognitive Difficulty
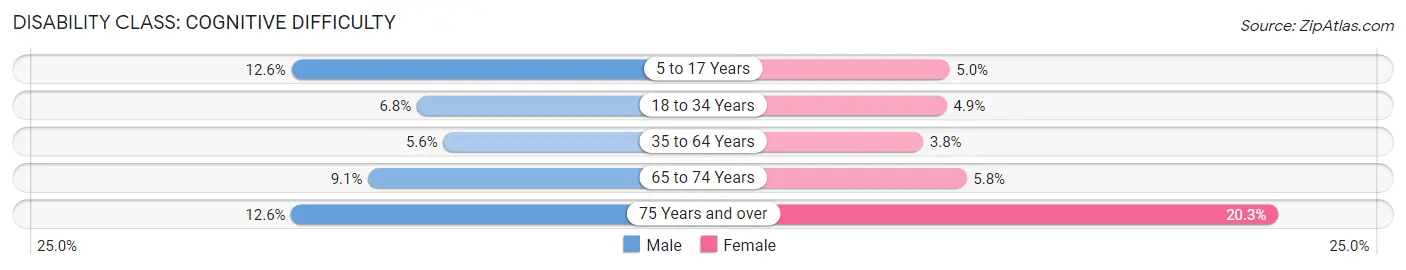
| Age Bracket | Male | Female |
| 5 to 17 Years | 4,629 (12.6%) | 1,713 (5.0%) |
| 18 to 34 Years | 3,188 (6.8%) | 2,219 (4.9%) |
| 35 to 64 Years | 4,227 (5.6%) | 2,921 (3.8%) |
| 65 to 74 Years | 1,297 (9.0%) | 968 (5.8%) |
| 75 Years and over | 1,057 (12.6%) | 2,294 (20.3%) |
Disability Class: Ambulatory Difficulty
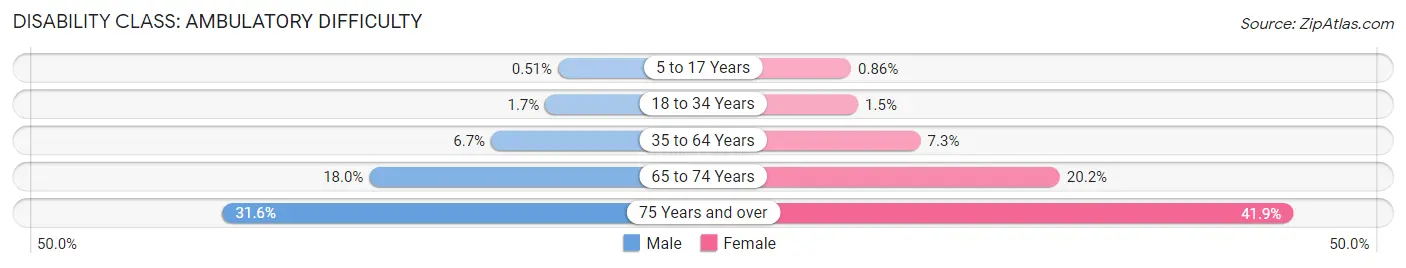
| Age Bracket | Male | Female |
| 5 to 17 Years | 189 (0.5%) | 297 (0.9%) |
| 18 to 34 Years | 794 (1.7%) | 693 (1.5%) |
| 35 to 64 Years | 5,110 (6.7%) | 5,685 (7.3%) |
| 65 to 74 Years | 2,582 (18.0%) | 3,390 (20.2%) |
| 75 Years and over | 2,648 (31.6%) | 4,747 (41.9%) |
Disability Class: Self-Care Difficulty
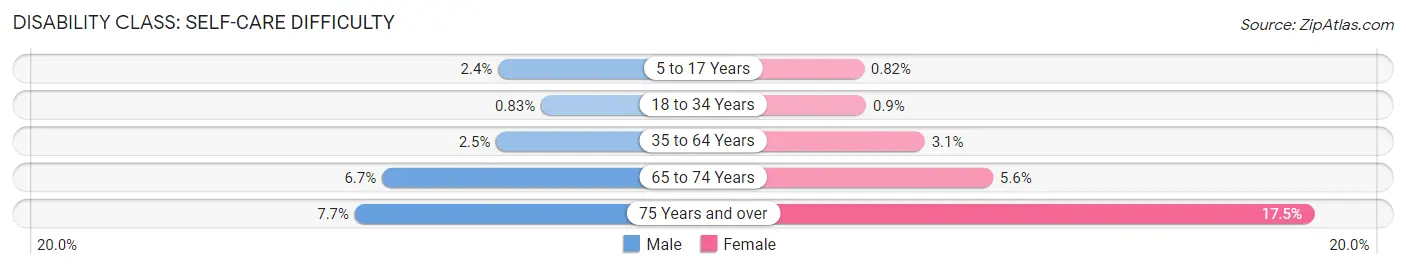
| Age Bracket | Male | Female |
| 5 to 17 Years | 888 (2.4%) | 283 (0.8%) |
| 18 to 34 Years | 389 (0.8%) | 410 (0.9%) |
| 35 to 64 Years | 1,890 (2.5%) | 2,392 (3.1%) |
| 65 to 74 Years | 964 (6.7%) | 939 (5.6%) |
| 75 Years and over | 648 (7.7%) | 1,985 (17.5%) |
Technology Access in Osceola County
Computing Device Access in Osceola County
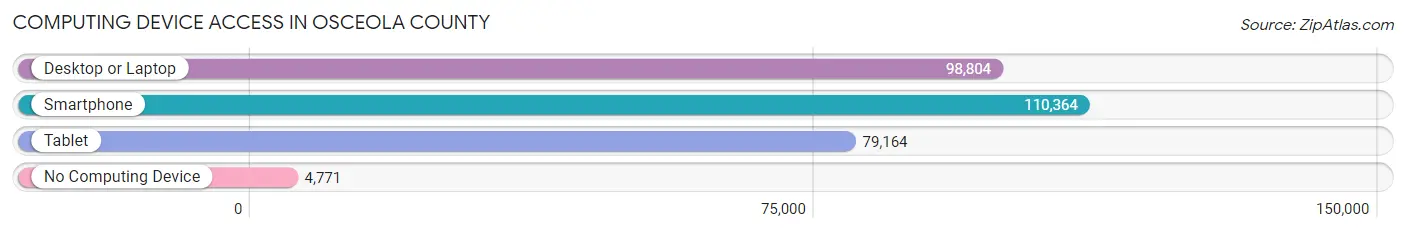
| Device Type | # Households | % Households |
| Desktop or Laptop | 98,804 | 82.5% |
| Smartphone | 110,364 | 92.1% |
| Tablet | 79,164 | 66.1% |
| No Computing Device | 4,771 | 4.0% |
| Total | 119,817 | 100.0% |
Internet Access in Osceola County
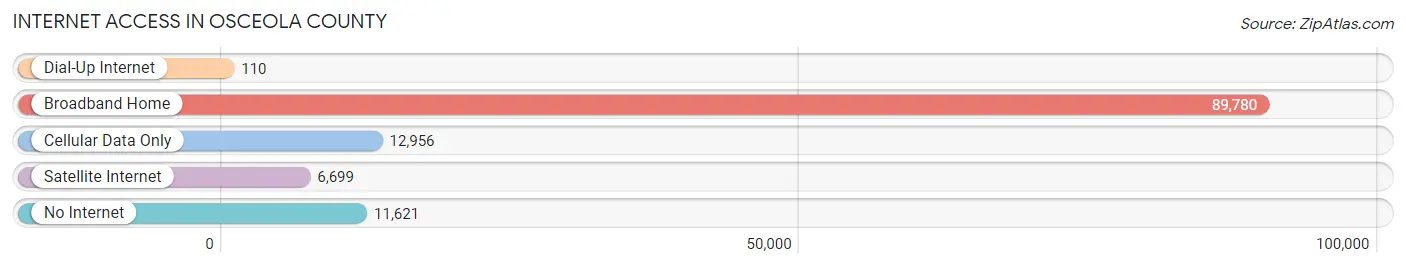
| Internet Type | # Households | % Households |
| Dial-Up Internet | 110 | 0.1% |
| Broadband Home | 89,780 | 74.9% |
| Cellular Data Only | 12,956 | 10.8% |
| Satellite Internet | 6,699 | 5.6% |
| No Internet | 11,621 | 9.7% |
| Total | 119,817 | 100.0% |
Osceola County Summary
Osceola County is located in the central part of the state of Florida, in the United States. It is part of the Orlando-Kissimmee-Sanford Metropolitan Statistical Area. The county was established in 1887 and is named after the Seminole leader Osceola. As of the 2010 census, the population of Osceola County was 268,685.
History
Osceola County was established in 1887, and was named after the Seminole leader Osceola. The county was originally part of the larger Orange County, but was split off in 1887. The county was originally inhabited by the Seminole and Creek Native American tribes. The first settlers in the area were cattle ranchers, who began to arrive in the late 19th century. The first towns in the county were Kissimmee and St. Cloud, which were both founded in the 1880s.
In the early 20th century, the county began to develop rapidly, as the area became a popular tourist destination. The county was also home to a large citrus industry, which was a major source of income for the county. The county was also home to a large cattle industry, which was also a major source of income.
In the mid-20th century, the county began to experience rapid population growth, as the area became a popular destination for retirees. The county also experienced a large influx of immigrants from Latin America, which has had a major impact on the county's demographics.
Geography
Osceola County is located in the central part of the state of Florida, in the United States. It is part of the Orlando-Kissimmee-Sanford Metropolitan Statistical Area. The county is bordered by Orange County to the north, Polk County to the east, Brevard County to the south, and Lake County to the west. The county covers an area of 1,506 square miles, of which 1,451 square miles is land and 55 square miles is water.
The county is home to several large lakes, including Lake Tohopekaliga, Lake Cypress, and Lake Hatchineha. The county is also home to several state parks, including Kissimmee Prairie Preserve State Park, Lake Kissimmee State Park, and Lake Louisa State Park.
Economy
Osceola County has a diverse economy, with a variety of industries providing employment opportunities. The county is home to a large tourism industry, which is a major source of income for the county. The county is also home to a large agricultural industry, which is also a major source of income. The county is also home to a large manufacturing industry, which is also a major source of income.
The county is home to several major employers, including Walt Disney World, Universal Orlando Resort, and the Osceola County School District. The county is also home to several major hospitals, including Osceola Regional Medical Center and Florida Hospital Kissimmee.
Demographics
As of the 2010 census, the population of Osceola County was 268,685. The population is made up of a variety of ethnic and racial groups, including White (63.2%), Hispanic or Latino (25.2%), African American (7.2%), and Asian (2.3%). The median household income in the county is $45,845, and the median family income is $51,945. The per capita income in the county is $22,845.
The county is home to a large number of immigrants from Latin America, which has had a major impact on the county's demographics. The county is also home to a large number of retirees, which has also had a major impact on the county's demographics.
Common Questions
What is Per Capita Income in Osceola County?
Per Capita income in Osceola County is $28,690.
What is the Median Family Income in Osceola County?
Median Family Income in Osceola County is $71,239.
What is the Median Household income in Osceola County?
Median Household Income in Osceola County is $64,312.
What is Income or Wage Gap in Osceola County?
Income or Wage Gap in Osceola County is 18.6%.
Women in Osceola County earn 81.4 cents for every dollar earned by a man.
What is Family Income Deficit in Osceola County?
Family Income Deficit in Osceola County is $9,942.
Families that are below poverty line in Osceola County earn $9,942 less on average than the poverty threshold level.
What is Inequality or Gini Index in Osceola County?
Inequality or Gini Index in Osceola County is 0.44.
What is the Total Population of Osceola County?
Total Population of Osceola County is 393,745.
What is the Total Male Population of Osceola County?
Total Male Population of Osceola County is 195,519.
What is the Total Female Population of Osceola County?
Total Female Population of Osceola County is 198,226.
What is the Ratio of Males per 100 Females in Osceola County?
There are 98.63 Males per 100 Females in Osceola County.
What is the Ratio of Females per 100 Males in Osceola County?
There are 101.38 Females per 100 Males in Osceola County.
What is the Median Population Age in Osceola County?
Median Population Age in Osceola County is 36.6 Years.
What is the Average Family Size in Osceola County
Average Family Size in Osceola County is 3.8 People.
What is the Average Household Size in Osceola County
Average Household Size in Osceola County is 3.3 People.
How Large is the Labor Force in Osceola County?
There are 202,148 People in the Labor Forcein in Osceola County.
What is the Percentage of People in the Labor Force in Osceola County?
65.0% of People are in the Labor Force in Osceola County.
What is the Unemployment Rate in Osceola County?
Unemployment Rate in Osceola County is 5.3%.