Volusia County, FL Map & Demographics
Volusia County Map
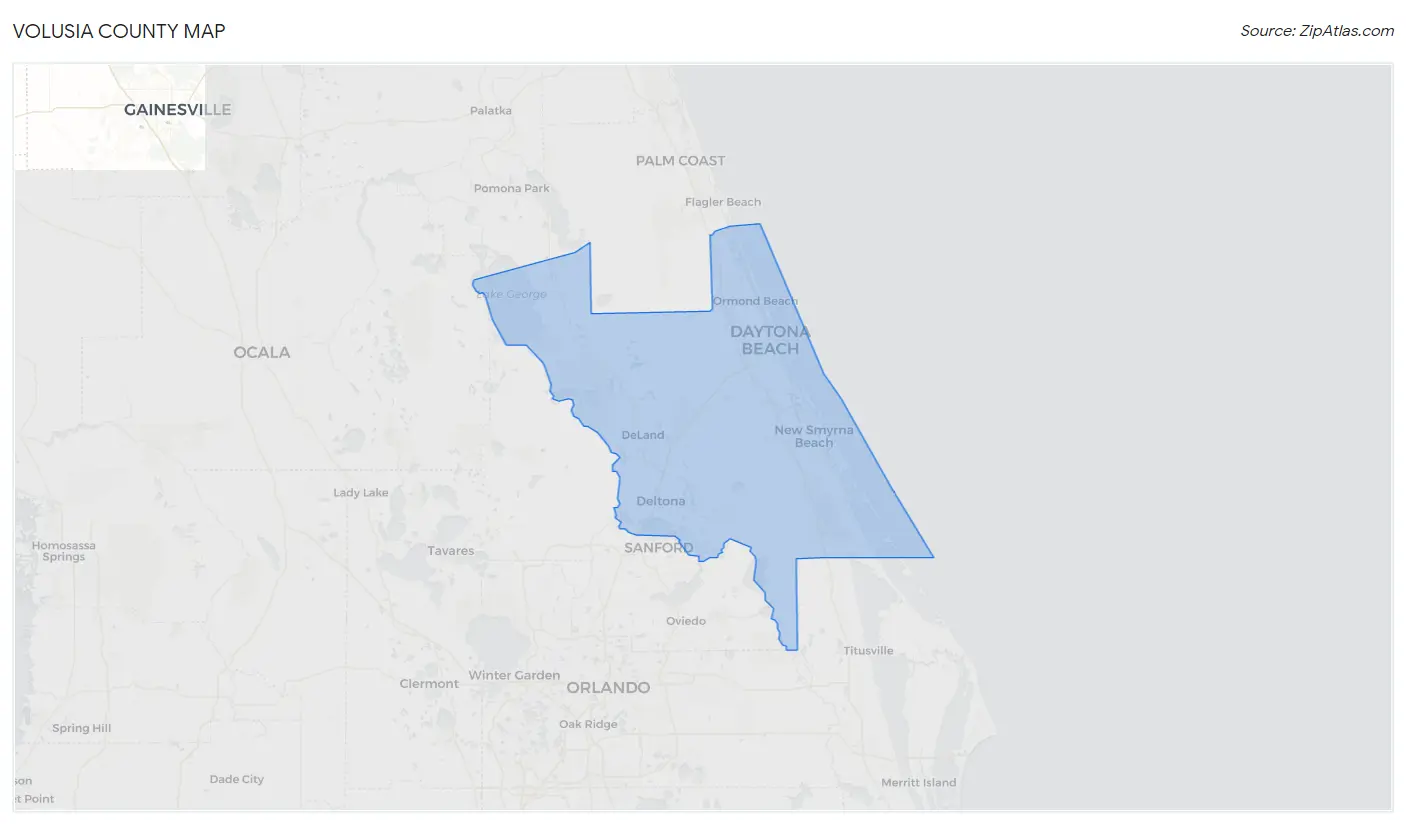
Volusia County Overview
$35,364
PER CAPITA INCOME
$76,486
AVG FAMILY INCOME
$63,075
AVG HOUSEHOLD INCOME
19.8%
WAGE / INCOME GAP [ % ]
80.2¢/ $1
WAGE / INCOME GAP [ $ ]
$9,987
FAMILY INCOME DEFICIT
0.45
INEQUALITY / GINI INDEX
558,520
TOTAL POPULATION
274,078
MALE POPULATION
284,442
FEMALE POPULATION
96.36
MALES / 100 FEMALES
103.78
FEMALES / 100 MALES
46.5
MEDIAN AGE
2.9
AVG FAMILY SIZE
2.3
AVG HOUSEHOLD SIZE
255,678
LABOR FORCE [ PEOPLE ]
54.1%
PERCENT IN LABOR FORCE
4.2%
UNEMPLOYMENT RATE
Income in Volusia County
Income Overview in Volusia County
Per Capita Income in Volusia County is $35,364, while median incomes of families and households are $76,486 and $63,075 respectively.
| Characteristic | Number | Measure |
| Per Capita Income | 558,520 | $35,364 |
| Median Family Income | 144,016 | $76,486 |
| Mean Family Income | 144,016 | $97,523 |
| Median Household Income | 232,673 | $63,075 |
| Mean Household Income | 232,673 | $82,859 |
| Income Deficit | 144,016 | $9,987 |
| Wage / Income Gap (%) | 558,520 | 19.85% |
| Wage / Income Gap ($) | 558,520 | 80.15¢ per $1 |
| Gini / Inequality Index | 558,520 | 0.45 |
Earnings by Sex in Volusia County
Average Earnings in Volusia County are $37,212, $41,735 for men and $33,452 for women, a difference of 19.9%.
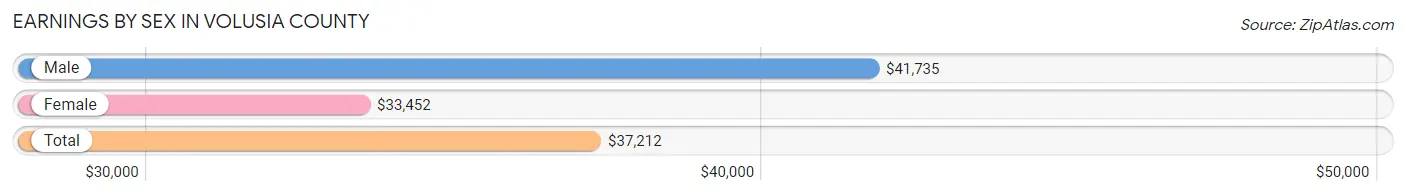
| Sex | Number | Average Earnings |
| Male | 138,831 (52.3%) | $41,735 |
| Female | 126,375 (47.6%) | $33,452 |
| Total | 265,206 (100.0%) | $37,212 |
Earnings by Sex by Income Bracket in Volusia County
The most common earnings brackets in Volusia County are $100,000+ for men (17,815 | 12.8%) and $30,000 to $34,999 for women (11,050 | 8.7%).
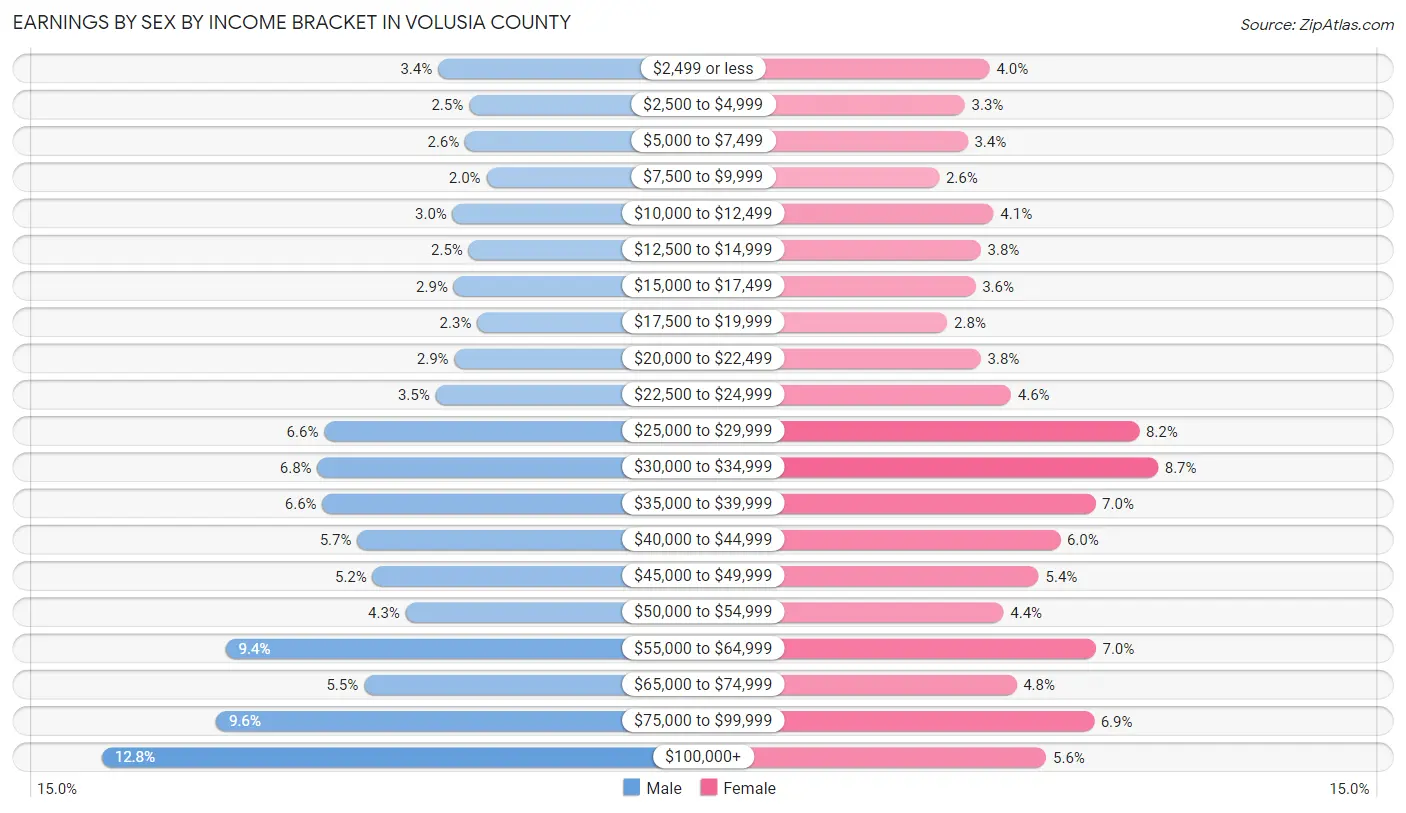
| Income | Male | Female |
| $2,499 or less | 4,686 (3.4%) | 5,073 (4.0%) |
| $2,500 to $4,999 | 3,481 (2.5%) | 4,185 (3.3%) |
| $5,000 to $7,499 | 3,632 (2.6%) | 4,284 (3.4%) |
| $7,500 to $9,999 | 2,806 (2.0%) | 3,277 (2.6%) |
| $10,000 to $12,499 | 4,120 (3.0%) | 5,208 (4.1%) |
| $12,500 to $14,999 | 3,495 (2.5%) | 4,748 (3.8%) |
| $15,000 to $17,499 | 4,086 (2.9%) | 4,556 (3.6%) |
| $17,500 to $19,999 | 3,165 (2.3%) | 3,562 (2.8%) |
| $20,000 to $22,499 | 4,049 (2.9%) | 4,755 (3.8%) |
| $22,500 to $24,999 | 4,793 (3.5%) | 5,831 (4.6%) |
| $25,000 to $29,999 | 9,133 (6.6%) | 10,379 (8.2%) |
| $30,000 to $34,999 | 9,405 (6.8%) | 11,050 (8.7%) |
| $35,000 to $39,999 | 9,203 (6.6%) | 8,827 (7.0%) |
| $40,000 to $44,999 | 7,843 (5.7%) | 7,568 (6.0%) |
| $45,000 to $49,999 | 7,250 (5.2%) | 6,813 (5.4%) |
| $50,000 to $54,999 | 5,952 (4.3%) | 5,562 (4.4%) |
| $55,000 to $64,999 | 12,974 (9.3%) | 8,833 (7.0%) |
| $65,000 to $74,999 | 7,586 (5.5%) | 6,020 (4.8%) |
| $75,000 to $99,999 | 13,357 (9.6%) | 8,771 (6.9%) |
| $100,000+ | 17,815 (12.8%) | 7,073 (5.6%) |
| Total | 138,831 (100.0%) | 126,375 (100.0%) |
Earnings by Sex by Educational Attainment in Volusia County
Average earnings in Volusia County are $46,160 for men and $36,336 for women, a difference of 21.3%. Men with an educational attainment of graduate degree enjoy the highest average annual earnings of $75,095, while those with less than high school education earn the least with $34,413. Women with an educational attainment of graduate degree earn the most with the average annual earnings of $57,538, while those with less than high school education have the smallest earnings of $20,561.
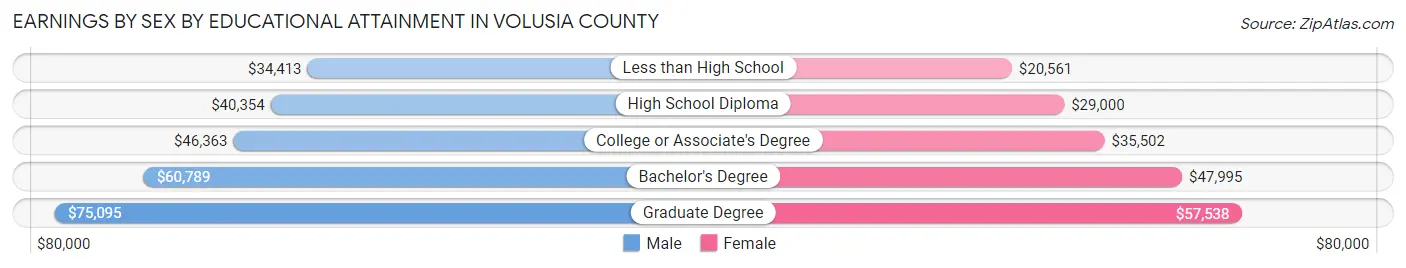
| Educational Attainment | Male Income | Female Income |
| Less than High School | $34,413 | $20,561 |
| High School Diploma | $40,354 | $29,000 |
| College or Associate's Degree | $46,363 | $35,502 |
| Bachelor's Degree | $60,789 | $47,995 |
| Graduate Degree | $75,095 | $57,538 |
| Total | $46,160 | $36,336 |
Family Income in Volusia County
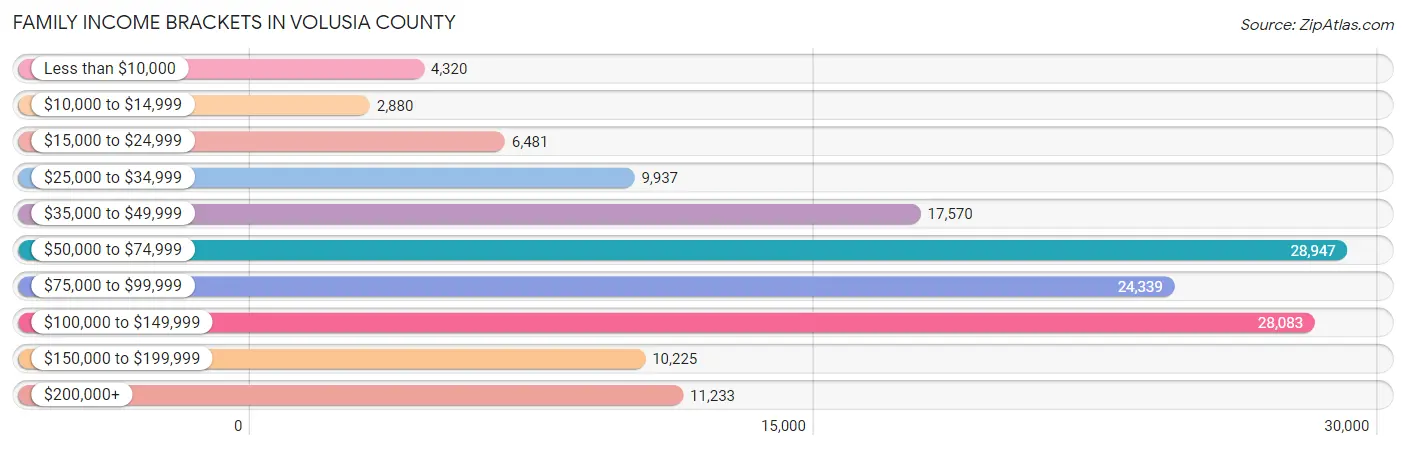
Family Income Brackets in Volusia County
According to the Volusia County family income data, there are 28,947 families falling into the $50,000 to $74,999 income range, which is the most common income bracket and makes up 20.1% of all families. Conversely, the $10,000 to $14,999 income bracket is the least frequent group with only 2,880 families (2.0%) belonging to this category.
| Income Bracket | # Families | % Families |
| Less than $10,000 | 4,320 | 3.0% |
| $10,000 to $14,999 | 2,880 | 2.0% |
| $15,000 to $24,999 | 6,481 | 4.5% |
| $25,000 to $34,999 | 9,937 | 6.9% |
| $35,000 to $49,999 | 17,570 | 12.2% |
| $50,000 to $74,999 | 28,947 | 20.1% |
| $75,000 to $99,999 | 24,339 | 16.9% |
| $100,000 to $149,999 | 28,083 | 19.5% |
| $150,000 to $199,999 | 10,225 | 7.1% |
| $200,000+ | 11,233 | 7.8% |
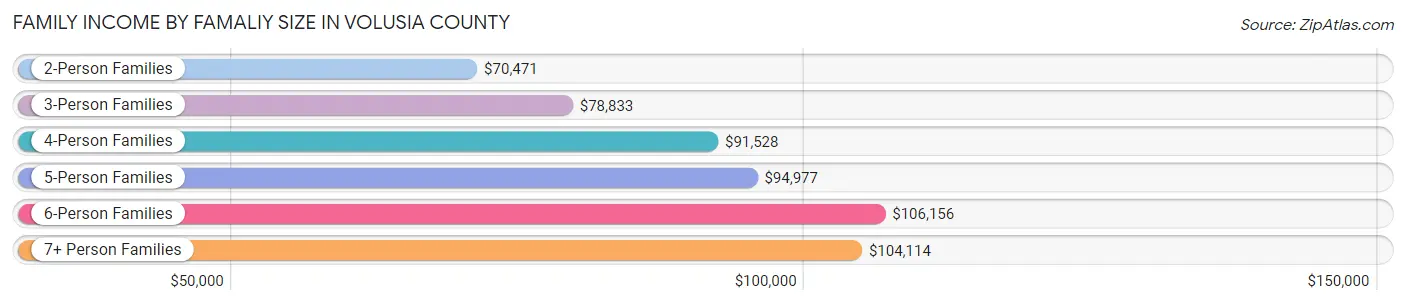
Family Income by Famaliy Size in Volusia County
6-person families (3,375 | 2.3%) account for the highest median family income in Volusia County with $106,156 per family, while 2-person families (82,027 | 57.0%) have the highest median income of $35,236 per family member.
| Income Bracket | # Families | Median Income |
| 2-Person Families | 82,027 (57.0%) | $70,471 |
| 3-Person Families | 28,704 (19.9%) | $78,833 |
| 4-Person Families | 20,235 (14.1%) | $91,528 |
| 5-Person Families | 8,272 (5.7%) | $94,977 |
| 6-Person Families | 3,375 (2.3%) | $106,156 |
| 7+ Person Families | 1,403 (1.0%) | $104,114 |
| Total | 144,016 (100.0%) | $76,486 |
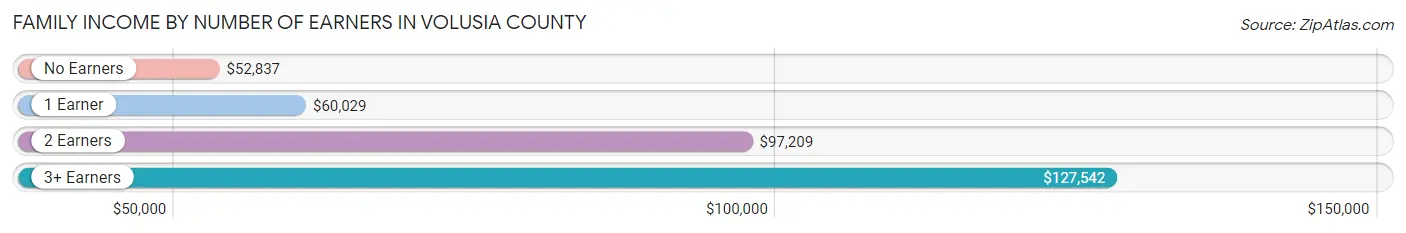
Family Income by Number of Earners in Volusia County
The median family income in Volusia County is $76,486, with families comprising 3+ earners (13,257) having the highest median family income of $127,542, while families with no earners (34,137) have the lowest median family income of $52,837, accounting for 9.2% and 23.7% of families, respectively.
| Number of Earners | # Families | Median Income |
| No Earners | 34,137 (23.7%) | $52,837 |
| 1 Earner | 47,814 (33.2%) | $60,029 |
| 2 Earners | 48,808 (33.9%) | $97,209 |
| 3+ Earners | 13,257 (9.2%) | $127,542 |
| Total | 144,016 (100.0%) | $76,486 |
Household Income in Volusia County
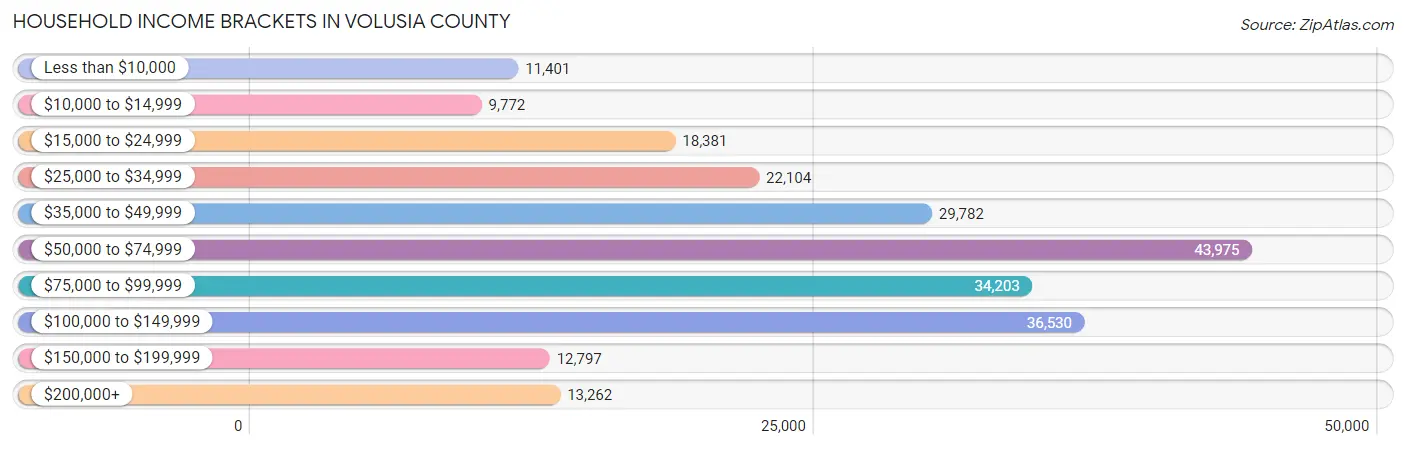
Household Income Brackets in Volusia County
With 43,975 households falling in the category, the $50,000 to $74,999 income range is the most frequent in Volusia County, accounting for 18.9% of all households. In contrast, only 9,772 households (4.2%) fall into the $10,000 to $14,999 income bracket, making it the least populous group.
| Income Bracket | # Households | % Households |
| Less than $10,000 | 11,401 | 4.9% |
| $10,000 to $14,999 | 9,772 | 4.2% |
| $15,000 to $24,999 | 18,381 | 7.9% |
| $25,000 to $34,999 | 22,104 | 9.5% |
| $35,000 to $49,999 | 29,782 | 12.8% |
| $50,000 to $74,999 | 43,975 | 18.9% |
| $75,000 to $99,999 | 34,203 | 14.7% |
| $100,000 to $149,999 | 36,530 | 15.7% |
| $150,000 to $199,999 | 12,797 | 5.5% |
| $200,000+ | 13,262 | 5.7% |
Household Income by Householder Age in Volusia County
The median household income in Volusia County is $63,075, with the highest median household income of $74,278 found in the 45 to 64 years age bracket for the primary householder. A total of 84,016 households (36.1%) fall into this category. Meanwhile, the 15 to 24 years age bracket for the primary householder has the lowest median household income of $47,157, with 6,691 households (2.9%) in this group.
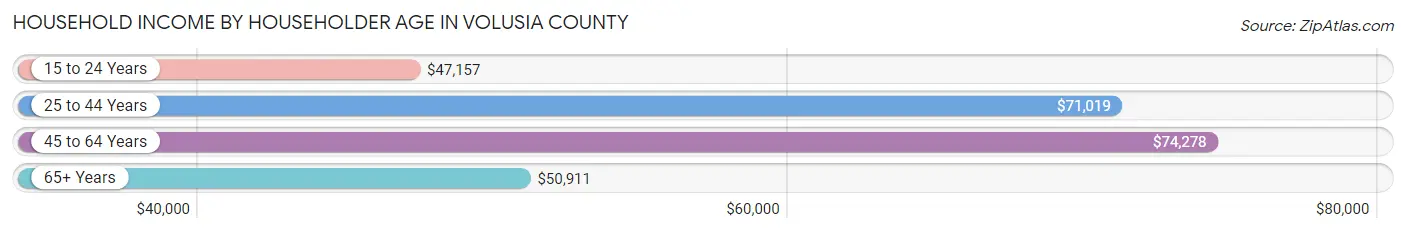
| Income Bracket | # Households | Median Income |
| 15 to 24 Years | 6,691 (2.9%) | $47,157 |
| 25 to 44 Years | 56,615 (24.3%) | $71,019 |
| 45 to 64 Years | 84,016 (36.1%) | $74,278 |
| 65+ Years | 85,351 (36.7%) | $50,911 |
| Total | 232,673 (100.0%) | $63,075 |
Poverty in Volusia County
Income Below Poverty by Sex and Age in Volusia County
With 11.2% poverty level for males and 13.2% for females among the residents of Volusia County, 18 to 24 year old males and under 5 year old females are the most vulnerable to poverty, with 3,979 males (18.7%) and 2,118 females (17.4%) in their respective age groups living below the poverty level.
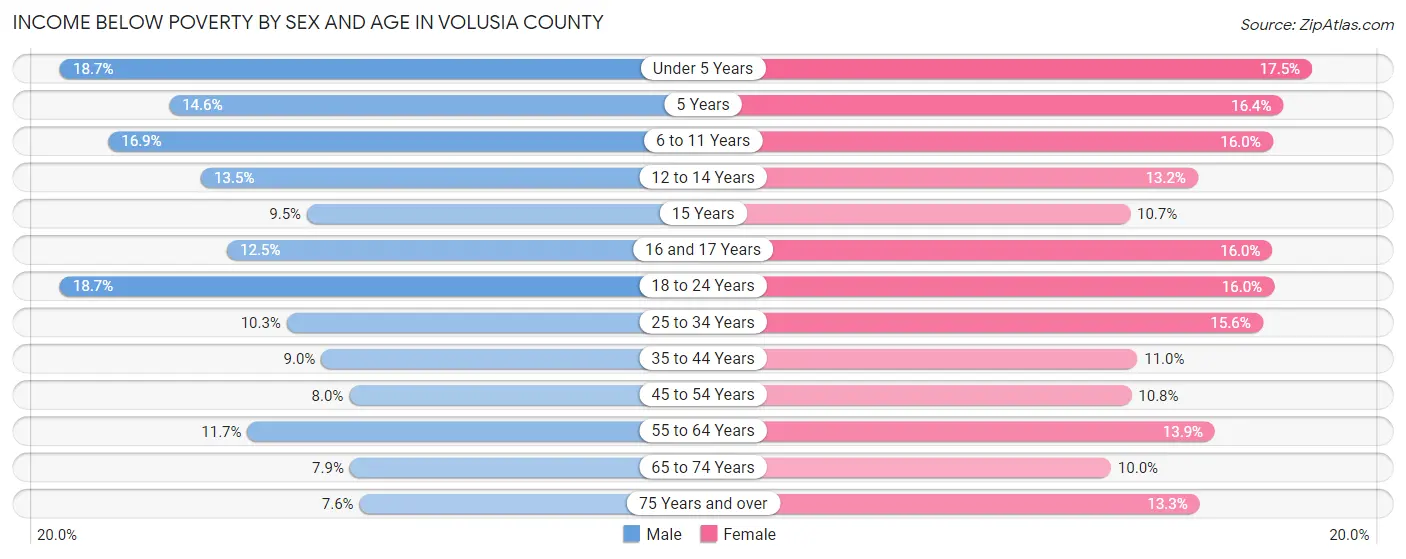
| Age Bracket | Male | Female |
| Under 5 Years | 2,322 (18.7%) | 2,118 (17.4%) |
| 5 Years | 387 (14.6%) | 349 (16.4%) |
| 6 to 11 Years | 2,847 (16.9%) | 2,637 (16.0%) |
| 12 to 14 Years | 1,081 (13.5%) | 1,056 (13.2%) |
| 15 Years | 293 (9.5%) | 268 (10.7%) |
| 16 and 17 Years | 716 (12.5%) | 929 (16.0%) |
| 18 to 24 Years | 3,979 (18.7%) | 2,976 (16.0%) |
| 25 to 34 Years | 3,361 (10.3%) | 4,929 (15.6%) |
| 35 to 44 Years | 2,684 (9.0%) | 3,245 (11.0%) |
| 45 to 54 Years | 2,550 (8.0%) | 3,606 (10.7%) |
| 55 to 64 Years | 4,685 (11.7%) | 6,144 (13.9%) |
| 65 to 74 Years | 2,899 (7.9%) | 4,035 (10.0%) |
| 75 Years and over | 1,935 (7.6%) | 4,297 (13.3%) |
| Total | 29,739 (11.2%) | 36,589 (13.2%) |
Income Above Poverty by Sex and Age in Volusia County
According to the poverty statistics in Volusia County, males aged 75 years and over and females aged 65 to 74 years are the age groups that are most secure financially, with 92.4% of males and 90.0% of females in these age groups living above the poverty line.
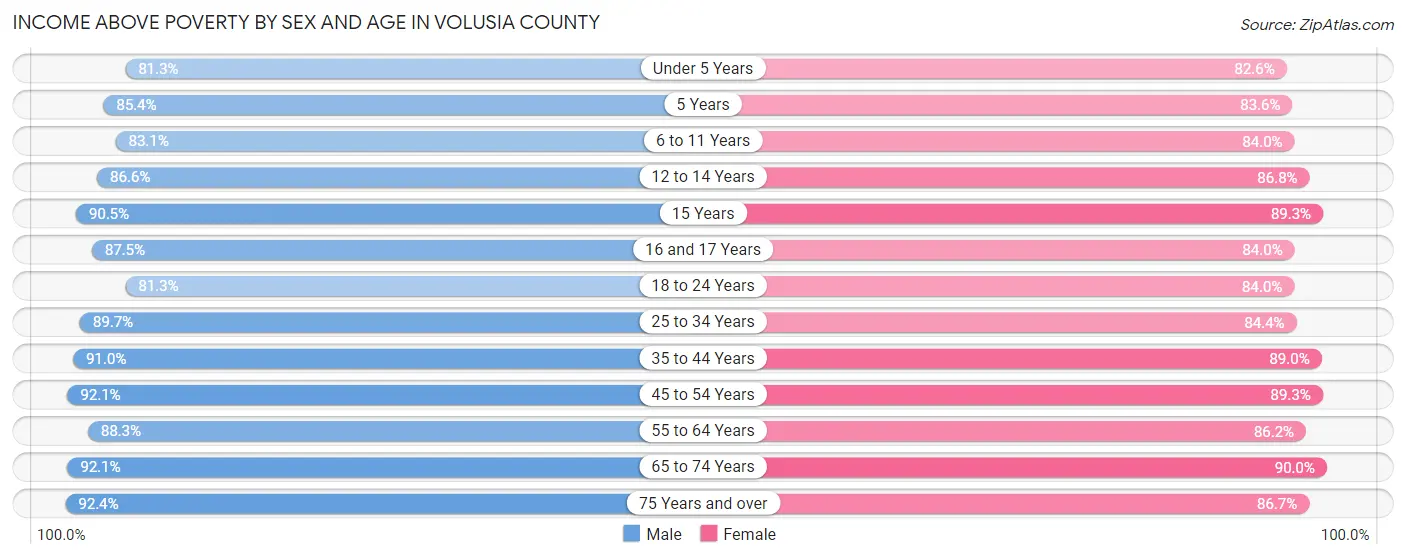
| Age Bracket | Male | Female |
| Under 5 Years | 10,106 (81.3%) | 10,021 (82.6%) |
| 5 Years | 2,259 (85.4%) | 1,780 (83.6%) |
| 6 to 11 Years | 14,010 (83.1%) | 13,851 (84.0%) |
| 12 to 14 Years | 6,957 (86.6%) | 6,938 (86.8%) |
| 15 Years | 2,786 (90.5%) | 2,236 (89.3%) |
| 16 and 17 Years | 5,022 (87.5%) | 4,883 (84.0%) |
| 18 to 24 Years | 17,313 (81.3%) | 15,576 (84.0%) |
| 25 to 34 Years | 29,362 (89.7%) | 26,620 (84.4%) |
| 35 to 44 Years | 27,165 (91.0%) | 26,329 (89.0%) |
| 45 to 54 Years | 29,536 (92.0%) | 29,928 (89.2%) |
| 55 to 64 Years | 35,246 (88.3%) | 38,226 (86.2%) |
| 65 to 74 Years | 33,641 (92.1%) | 36,368 (90.0%) |
| 75 Years and over | 23,621 (92.4%) | 28,061 (86.7%) |
| Total | 237,024 (88.8%) | 240,817 (86.8%) |
Income Below Poverty Among Married-Couple Families in Volusia County
The poverty statistics for married-couple families in Volusia County show that 4.4% or 4,580 of the total 105,156 families live below the poverty line. Families with 5 or more children have the highest poverty rate of 20.1%, comprising of 99 families. On the other hand, families with 1 or 2 children have the lowest poverty rate of 3.3%, which includes 838 families.
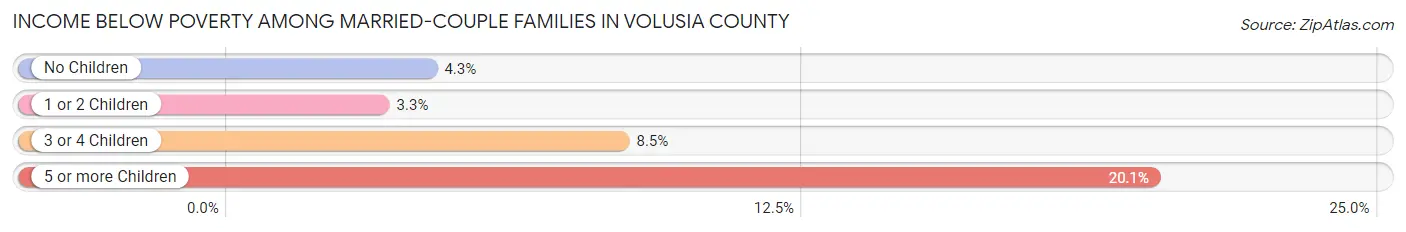
| Children | Above Poverty | Below Poverty |
| No Children | 71,056 (95.7%) | 3,220 (4.3%) |
| 1 or 2 Children | 24,583 (96.7%) | 838 (3.3%) |
| 3 or 4 Children | 4,543 (91.5%) | 423 (8.5%) |
| 5 or more Children | 394 (79.9%) | 99 (20.1%) |
| Total | 100,576 (95.6%) | 4,580 (4.4%) |
Income Below Poverty Among Single-Parent Households in Volusia County
According to the poverty data in Volusia County, 13.9% or 1,804 single-father households and 19.6% or 5,062 single-mother households are living below the poverty line. Among single-father households, those with 3 or 4 children have the highest poverty rate, with 408 households (28.9%) experiencing poverty. Likewise, among single-mother households, those with 5 or more children have the highest poverty rate, with 95 households (87.2%) falling below the poverty line.
| Children | Single Father | Single Mother |
| No Children | 430 (7.5%) | 1,053 (9.2%) |
| 1 or 2 Children | 966 (16.5%) | 3,115 (25.1%) |
| 3 or 4 Children | 408 (28.9%) | 799 (42.8%) |
| 5 or more Children | 0 (0.0%) | 95 (87.2%) |
| Total | 1,804 (13.9%) | 5,062 (19.6%) |
Income Below Poverty Among Married-Couple vs Single-Parent Households in Volusia County
The poverty data for Volusia County shows that 4,580 of the married-couple family households (4.4%) and 6,866 of the single-parent households (17.7%) are living below the poverty level. Within the married-couple family households, those with 5 or more children have the highest poverty rate, with 99 households (20.1%) falling below the poverty line. Among the single-parent households, those with 5 or more children have the highest poverty rate, with 95 household (61.7%) living below poverty.
| Children | Married-Couple Families | Single-Parent Households |
| No Children | 3,220 (4.3%) | 1,483 (8.6%) |
| 1 or 2 Children | 838 (3.3%) | 4,081 (22.4%) |
| 3 or 4 Children | 423 (8.5%) | 1,207 (36.8%) |
| 5 or more Children | 99 (20.1%) | 95 (61.7%) |
| Total | 4,580 (4.4%) | 6,866 (17.7%) |
Race in Volusia County
The most populous races in Volusia County are White / Caucasian (416,566 | 74.6%), Hispanic or Latino (87,375 | 15.6%), and Black / African American (59,935 | 10.7%).
| Race | # Population | % Population |
| Asian | 10,398 | 1.9% |
| Black / African American | 59,935 | 10.7% |
| Hawaiian / Pacific | 135 | 0.0% |
| Hispanic or Latino | 87,375 | 15.6% |
| Native / Alaskan | 1,194 | 0.2% |
| White / Caucasian | 416,566 | 74.6% |
| Two or more Races | 30,863 | 5.5% |
| Some other Race | 39,429 | 7.1% |
| Total | 558,520 | 100.0% |
Ancestry in Volusia County
The most populous ancestries reported in Volusia County are Irish (55,905 | 10.0%), German (55,635 | 10.0%), English (51,281 | 9.2%), Puerto Rican (39,990 | 7.2%), and Italian (38,509 | 6.9%), together accounting for 43.2% of all Volusia County residents.
| Ancestry | # Population | % Population |
| African | 1,372 | 0.3% |
| Albanian | 140 | 0.0% |
| American | 29,751 | 5.3% |
| Apache | 84 | 0.0% |
| Arab | 2,470 | 0.4% |
| Argentinean | 483 | 0.1% |
| Armenian | 167 | 0.0% |
| Australian | 101 | 0.0% |
| Austrian | 1,110 | 0.2% |
| Bahamian | 152 | 0.0% |
| Bangladeshi | 129 | 0.0% |
| Barbadian | 39 | 0.0% |
| Basque | 31 | 0.0% |
| Belgian | 344 | 0.1% |
| Belizean | 94 | 0.0% |
| Bermudan | 26 | 0.0% |
| Bhutanese | 656 | 0.1% |
| Blackfeet | 94 | 0.0% |
| Bolivian | 217 | 0.0% |
| Brazilian | 713 | 0.1% |
| British | 3,052 | 0.5% |
| British West Indian | 257 | 0.1% |
| Bulgarian | 54 | 0.0% |
| Burmese | 1,199 | 0.2% |
| Cajun | 3 | 0.0% |
| Canadian | 1,754 | 0.3% |
| Cape Verdean | 285 | 0.1% |
| Carpatho Rusyn | 6 | 0.0% |
| Celtic | 70 | 0.0% |
| Central American | 3,062 | 0.5% |
| Central American Indian | 280 | 0.1% |
| Cherokee | 1,117 | 0.2% |
| Chickasaw | 3 | 0.0% |
| Chilean | 262 | 0.1% |
| Chippewa | 69 | 0.0% |
| Choctaw | 12 | 0.0% |
| Colombian | 4,028 | 0.7% |
| Comanche | 42 | 0.0% |
| Costa Rican | 624 | 0.1% |
| Creek | 46 | 0.0% |
| Croatian | 626 | 0.1% |
| Cuban | 6,350 | 1.1% |
| Czech | 1,973 | 0.4% |
| Czechoslovakian | 386 | 0.1% |
| Danish | 1,217 | 0.2% |
| Delaware | 7 | 0.0% |
| Dominican | 4,549 | 0.8% |
| Dutch | 5,206 | 0.9% |
| Eastern European | 1,054 | 0.2% |
| Ecuadorian | 1,047 | 0.2% |
| Egyptian | 835 | 0.2% |
| English | 51,281 | 9.2% |
| Estonian | 52 | 0.0% |
| Ethiopian | 73 | 0.0% |
| European | 6,954 | 1.3% |
| Filipino | 136 | 0.0% |
| Finnish | 537 | 0.1% |
| French | 11,041 | 2.0% |
| French American Indian | 208 | 0.0% |
| French Canadian | 3,463 | 0.6% |
| German | 55,635 | 10.0% |
| German Russian | 23 | 0.0% |
| Ghanaian | 33 | 0.0% |
| Greek | 2,348 | 0.4% |
| Guamanian / Chamorro | 17 | 0.0% |
| Guatemalan | 692 | 0.1% |
| Guyanese | 364 | 0.1% |
| Haitian | 845 | 0.2% |
| Honduran | 318 | 0.1% |
| Hungarian | 3,656 | 0.6% |
| Icelander | 161 | 0.0% |
| Indian (Asian) | 2,093 | 0.4% |
| Indonesian | 137 | 0.0% |
| Inupiat | 10 | 0.0% |
| Iranian | 424 | 0.1% |
| Iraqi | 10 | 0.0% |
| Irish | 55,905 | 10.0% |
| Iroquois | 122 | 0.0% |
| Israeli | 67 | 0.0% |
| Italian | 38,509 | 6.9% |
| Jamaican | 2,629 | 0.5% |
| Japanese | 40 | 0.0% |
| Korean | 3,263 | 0.6% |
| Laotian | 167 | 0.0% |
| Latvian | 201 | 0.0% |
| Lebanese | 709 | 0.1% |
| Liberian | 61 | 0.0% |
| Lithuanian | 955 | 0.2% |
| Lumbee | 8 | 0.0% |
| Luxembourger | 52 | 0.0% |
| Macedonian | 20 | 0.0% |
| Malaysian | 109 | 0.0% |
| Maltese | 164 | 0.0% |
| Mexican | 17,220 | 3.1% |
| Mexican American Indian | 244 | 0.0% |
| Mongolian | 35 | 0.0% |
| Moroccan | 123 | 0.0% |
| Native Hawaiian | 363 | 0.1% |
| Navajo | 34 | 0.0% |
| New Zealander | 78 | 0.0% |
| Nicaraguan | 326 | 0.1% |
| Nigerian | 667 | 0.1% |
| Northern European | 355 | 0.1% |
| Norwegian | 3,407 | 0.6% |
| Ottawa | 14 | 0.0% |
| Pakistani | 357 | 0.1% |
| Palestinian | 72 | 0.0% |
| Panamanian | 390 | 0.1% |
| Paraguayan | 20 | 0.0% |
| Pennsylvania German | 345 | 0.1% |
| Peruvian | 1,498 | 0.3% |
| Polish | 15,306 | 2.7% |
| Portuguese | 1,518 | 0.3% |
| Puerto Rican | 39,990 | 7.2% |
| Romanian | 680 | 0.1% |
| Russian | 3,004 | 0.5% |
| Salvadoran | 700 | 0.1% |
| Samoan | 127 | 0.0% |
| Scandinavian | 1,482 | 0.3% |
| Scotch-Irish | 4,634 | 0.8% |
| Scottish | 8,475 | 1.5% |
| Seminole | 23 | 0.0% |
| Serbian | 181 | 0.0% |
| Sioux | 55 | 0.0% |
| Slavic | 343 | 0.1% |
| Slovak | 803 | 0.1% |
| Slovene | 521 | 0.1% |
| Somali | 28 | 0.0% |
| South African | 590 | 0.1% |
| South American | 9,659 | 1.7% |
| South American Indian | 14 | 0.0% |
| Spaniard | 872 | 0.2% |
| Spanish | 485 | 0.1% |
| Sri Lankan | 2,706 | 0.5% |
| Subsaharan African | 3,057 | 0.5% |
| Swedish | 4,077 | 0.7% |
| Swiss | 1,161 | 0.2% |
| Syrian | 392 | 0.1% |
| Thai | 2,315 | 0.4% |
| Trinidadian and Tobagonian | 233 | 0.0% |
| Turkish | 148 | 0.0% |
| Ukrainian | 1,517 | 0.3% |
| Uruguayan | 202 | 0.0% |
| Venezuelan | 1,879 | 0.3% |
| Vietnamese | 74 | 0.0% |
| Welsh | 3,448 | 0.6% |
| West Indian | 556 | 0.1% |
| Yugoslavian | 190 | 0.0% | View All 148 Rows |
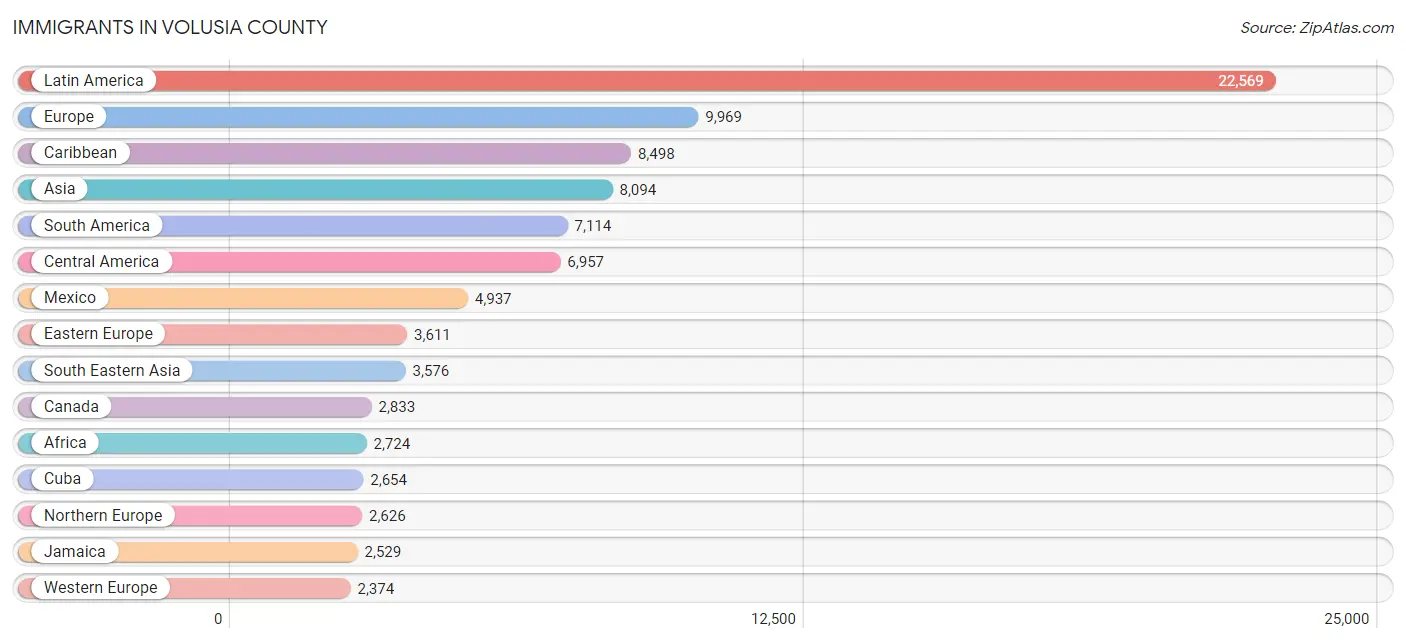
Immigrants in Volusia County
The most numerous immigrant groups reported in Volusia County came from Latin America (22,569 | 4.0%), Europe (9,969 | 1.8%), Caribbean (8,498 | 1.5%), Asia (8,094 | 1.5%), and South America (7,114 | 1.3%), together accounting for 10.1% of all Volusia County residents.
| Immigration Origin | # Population | % Population |
| Afghanistan | 15 | 0.0% |
| Africa | 2,724 | 0.5% |
| Albania | 96 | 0.0% |
| Argentina | 350 | 0.1% |
| Armenia | 3 | 0.0% |
| Asia | 8,094 | 1.5% |
| Australia | 154 | 0.0% |
| Austria | 61 | 0.0% |
| Bahamas | 145 | 0.0% |
| Bangladesh | 102 | 0.0% |
| Barbados | 84 | 0.0% |
| Belgium | 103 | 0.0% |
| Belize | 57 | 0.0% |
| Bolivia | 54 | 0.0% |
| Brazil | 811 | 0.2% |
| Bulgaria | 21 | 0.0% |
| Cambodia | 29 | 0.0% |
| Cameroon | 46 | 0.0% |
| Canada | 2,833 | 0.5% |
| Caribbean | 8,498 | 1.5% |
| Central America | 6,957 | 1.3% |
| Chile | 183 | 0.0% |
| China | 1,001 | 0.2% |
| Colombia | 1,585 | 0.3% |
| Costa Rica | 175 | 0.0% |
| Croatia | 243 | 0.0% |
| Cuba | 2,654 | 0.5% |
| Czechoslovakia | 359 | 0.1% |
| Denmark | 45 | 0.0% |
| Dominica | 256 | 0.1% |
| Dominican Republic | 1,255 | 0.2% |
| Eastern Africa | 284 | 0.1% |
| Eastern Asia | 2,354 | 0.4% |
| Eastern Europe | 3,611 | 0.6% |
| Ecuador | 780 | 0.1% |
| Egypt | 893 | 0.2% |
| El Salvador | 463 | 0.1% |
| England | 971 | 0.2% |
| Ethiopia | 9 | 0.0% |
| Europe | 9,969 | 1.8% |
| Fiji | 64 | 0.0% |
| France | 159 | 0.0% |
| Germany | 1,593 | 0.3% |
| Ghana | 6 | 0.0% |
| Greece | 177 | 0.0% |
| Grenada | 148 | 0.0% |
| Guatemala | 339 | 0.1% |
| Guyana | 540 | 0.1% |
| Haiti | 730 | 0.1% |
| Honduras | 263 | 0.1% |
| Hong Kong | 59 | 0.0% |
| Hungary | 604 | 0.1% |
| India | 893 | 0.2% |
| Indonesia | 9 | 0.0% |
| Iran | 270 | 0.1% |
| Iraq | 59 | 0.0% |
| Ireland | 139 | 0.0% |
| Israel | 91 | 0.0% |
| Italy | 703 | 0.1% |
| Jamaica | 2,529 | 0.4% |
| Japan | 264 | 0.1% |
| Jordan | 27 | 0.0% |
| Kenya | 91 | 0.0% |
| Korea | 1,089 | 0.2% |
| Kuwait | 34 | 0.0% |
| Laos | 76 | 0.0% |
| Latin America | 22,569 | 4.0% |
| Latvia | 68 | 0.0% |
| Lebanon | 44 | 0.0% |
| Lithuania | 62 | 0.0% |
| Malaysia | 54 | 0.0% |
| Mexico | 4,937 | 0.9% |
| Middle Africa | 435 | 0.1% |
| Morocco | 80 | 0.0% |
| Netherlands | 282 | 0.1% |
| Nicaragua | 236 | 0.0% |
| Nigeria | 498 | 0.1% |
| North Macedonia | 84 | 0.0% |
| Northern Africa | 992 | 0.2% |
| Northern Europe | 2,626 | 0.5% |
| Norway | 24 | 0.0% |
| Oceania | 294 | 0.1% |
| Pakistan | 116 | 0.0% |
| Panama | 487 | 0.1% |
| Peru | 1,008 | 0.2% |
| Philippines | 1,676 | 0.3% |
| Poland | 356 | 0.1% |
| Portugal | 132 | 0.0% |
| Romania | 437 | 0.1% |
| Russia | 635 | 0.1% |
| Saudi Arabia | 235 | 0.0% |
| Scotland | 241 | 0.0% |
| Serbia | 75 | 0.0% |
| Sierra Leone | 39 | 0.0% |
| Somalia | 39 | 0.0% |
| South Africa | 183 | 0.0% |
| South America | 7,114 | 1.3% |
| South Central Asia | 1,437 | 0.3% |
| South Eastern Asia | 3,576 | 0.6% |
| Southern Europe | 1,358 | 0.2% |
| Spain | 330 | 0.1% |
| Sri Lanka | 22 | 0.0% |
| St. Vincent and the Grenadines | 45 | 0.0% |
| Sweden | 119 | 0.0% |
| Switzerland | 139 | 0.0% |
| Syria | 102 | 0.0% |
| Taiwan | 161 | 0.0% |
| Thailand | 177 | 0.0% |
| Trinidad and Tobago | 367 | 0.1% |
| Turkey | 50 | 0.0% |
| Uganda | 2 | 0.0% |
| Ukraine | 507 | 0.1% |
| Uruguay | 145 | 0.0% |
| Uzbekistan | 19 | 0.0% |
| Venezuela | 1,466 | 0.3% |
| Vietnam | 1,521 | 0.3% |
| West Indies | 64 | 0.0% |
| Western Africa | 618 | 0.1% |
| Western Asia | 663 | 0.1% |
| Western Europe | 2,374 | 0.4% | View All 120 Rows |
Sex and Age in Volusia County
Sex and Age in Volusia County
The most populous age groups in Volusia County are 60 to 64 Years (21,521 | 7.9%) for men and 65 to 69 Years (22,981 | 8.1%) for women.
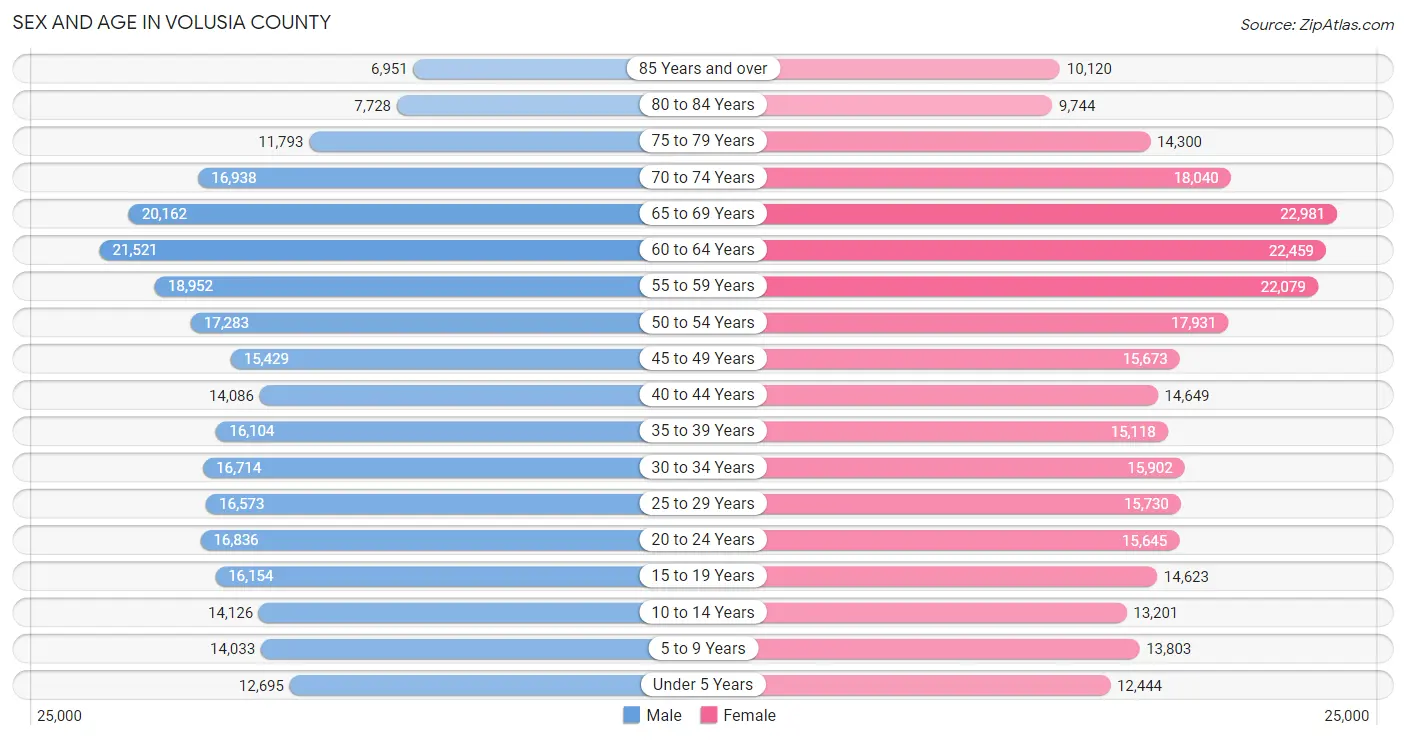
| Age Bracket | Male | Female |
| Under 5 Years | 12,695 (4.6%) | 12,444 (4.4%) |
| 5 to 9 Years | 14,033 (5.1%) | 13,803 (4.9%) |
| 10 to 14 Years | 14,126 (5.1%) | 13,201 (4.6%) |
| 15 to 19 Years | 16,154 (5.9%) | 14,623 (5.1%) |
| 20 to 24 Years | 16,836 (6.1%) | 15,645 (5.5%) |
| 25 to 29 Years | 16,573 (6.0%) | 15,730 (5.5%) |
| 30 to 34 Years | 16,714 (6.1%) | 15,902 (5.6%) |
| 35 to 39 Years | 16,104 (5.9%) | 15,118 (5.3%) |
| 40 to 44 Years | 14,086 (5.1%) | 14,649 (5.1%) |
| 45 to 49 Years | 15,429 (5.6%) | 15,673 (5.5%) |
| 50 to 54 Years | 17,283 (6.3%) | 17,931 (6.3%) |
| 55 to 59 Years | 18,952 (6.9%) | 22,079 (7.8%) |
| 60 to 64 Years | 21,521 (7.9%) | 22,459 (7.9%) |
| 65 to 69 Years | 20,162 (7.4%) | 22,981 (8.1%) |
| 70 to 74 Years | 16,938 (6.2%) | 18,040 (6.3%) |
| 75 to 79 Years | 11,793 (4.3%) | 14,300 (5.0%) |
| 80 to 84 Years | 7,728 (2.8%) | 9,744 (3.4%) |
| 85 Years and over | 6,951 (2.5%) | 10,120 (3.6%) |
| Total | 274,078 (100.0%) | 284,442 (100.0%) |
Families and Households in Volusia County
Median Family Size in Volusia County
The median family size in Volusia County is 2.89 persons per family, with single female/mother families (25,857 | 17.9%) accounting for the largest median family size of 2.96 persons per family. On the other hand, single male/father families (13,003 | 9.0%) represent the smallest median family size with 2.84 persons per family.
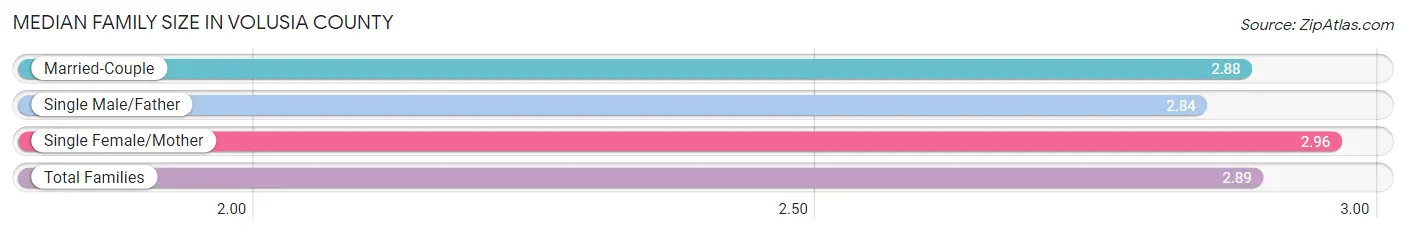
| Family Type | # Families | Family Size |
| Married-Couple | 105,156 (73.0%) | 2.88 |
| Single Male/Father | 13,003 (9.0%) | 2.84 |
| Single Female/Mother | 25,857 (17.9%) | 2.96 |
| Total Families | 144,016 (100.0%) | 2.89 |
Median Household Size in Volusia County
The median household size in Volusia County is 2.34 persons per household, with single male/father households (13,003 | 5.6%) accounting for the largest median household size of 3.34 persons per household. non-family households (88,657 | 38.1%) represent the smallest median household size with 1.28 persons per household.
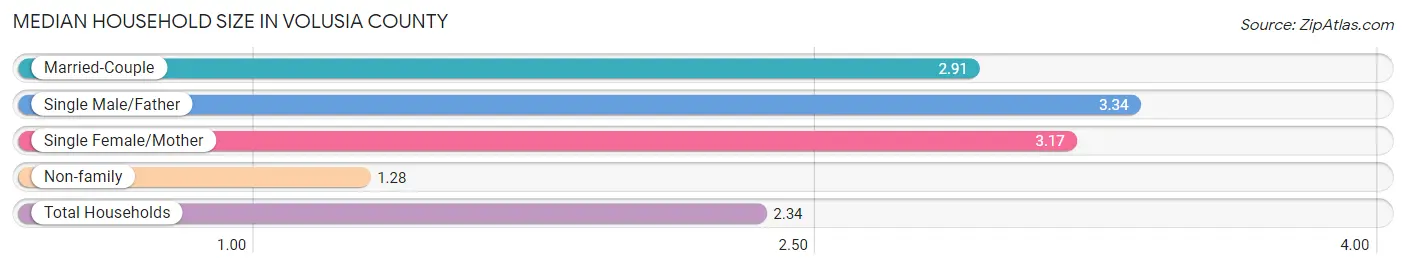
| Household Type | # Households | Household Size |
| Married-Couple | 105,156 (45.2%) | 2.91 |
| Single Male/Father | 13,003 (5.6%) | 3.34 |
| Single Female/Mother | 25,857 (11.1%) | 3.17 |
| Non-family | 88,657 (38.1%) | 1.28 |
| Total Households | 232,673 (100.0%) | 2.34 |
Household Size by Marriage Status in Volusia County
Out of a total of 232,673 households in Volusia County, 144,016 (61.9%) are family households, while 88,657 (38.1%) are nonfamily households. The most numerous type of family households are 2-person households, comprising 76,184, and the most common type of nonfamily households are 1-person households, comprising 69,413.
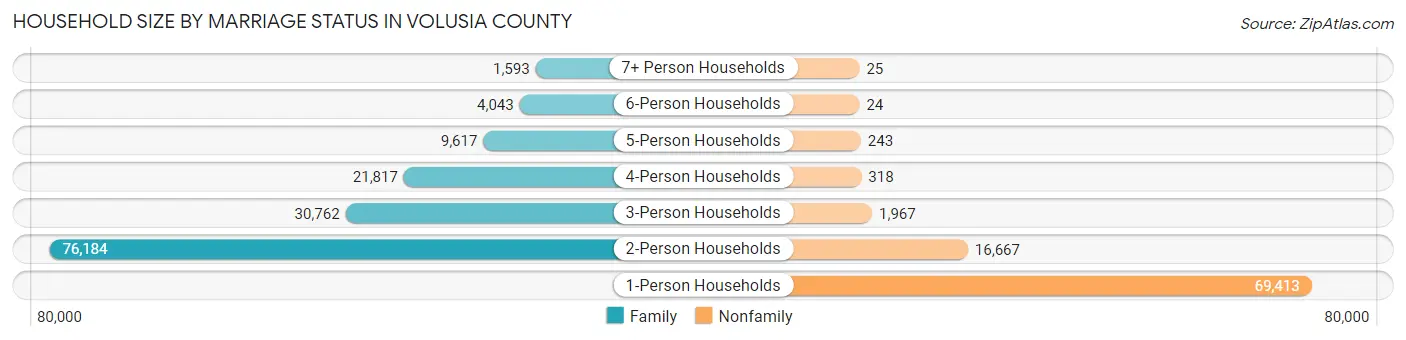
| Household Size | Family Households | Nonfamily Households |
| 1-Person Households | - | 69,413 (29.8%) |
| 2-Person Households | 76,184 (32.7%) | 16,667 (7.2%) |
| 3-Person Households | 30,762 (13.2%) | 1,967 (0.9%) |
| 4-Person Households | 21,817 (9.4%) | 318 (0.1%) |
| 5-Person Households | 9,617 (4.1%) | 243 (0.1%) |
| 6-Person Households | 4,043 (1.7%) | 24 (0.0%) |
| 7+ Person Households | 1,593 (0.7%) | 25 (0.0%) |
| Total | 144,016 (61.9%) | 88,657 (38.1%) |
Female Fertility in Volusia County
Fertility by Age in Volusia County
Average fertility rate in Volusia County is 41.0 births per 1,000 women. Women in the age bracket of 20 to 34 years have the highest fertility rate with 70.0 births per 1,000 women. Women in the age bracket of 20 to 34 years acount for 74.1% of all women with births.
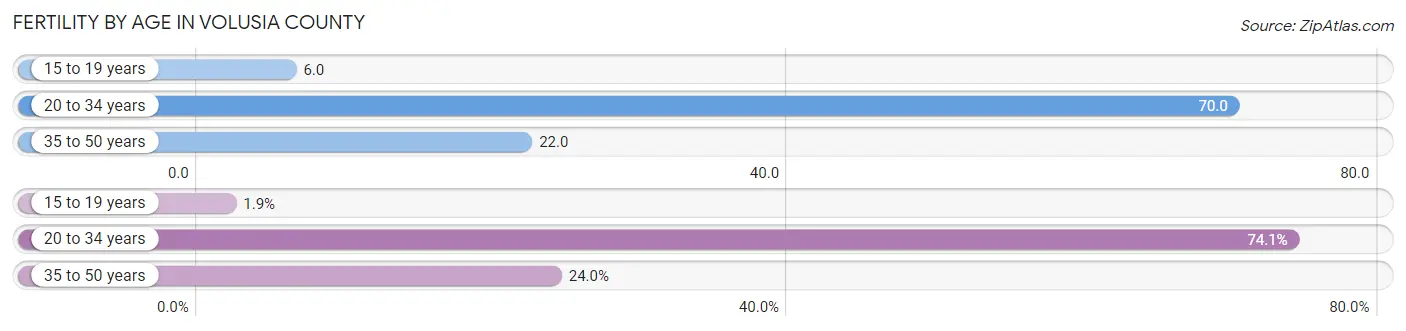
| Age Bracket | Women with Births | Births / 1,000 Women |
| 15 to 19 years | 86 (1.9%) | 6.0 |
| 20 to 34 years | 3,325 (74.1%) | 70.0 |
| 35 to 50 years | 1,078 (24.0%) | 22.0 |
| Total | 4,489 (100.0%) | 41.0 |
Fertility by Age by Marriage Status in Volusia County
56.6% of women with births (4,489) in Volusia County are married. The highest percentage of unmarried women with births falls into 15 to 19 years age bracket with 100.0% of them unmarried at the time of birth, while the lowest percentage of unmarried women with births belong to 35 to 50 years age bracket with 16.8% of them unmarried.
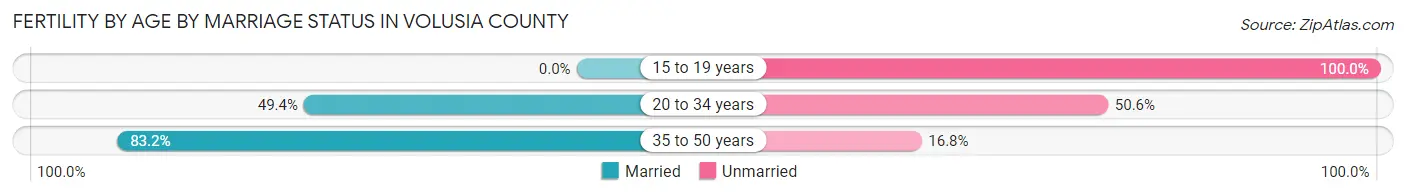
| Age Bracket | Married | Unmarried |
| 15 to 19 years | 0 (0.0%) | 86 (100.0%) |
| 20 to 34 years | 1,643 (49.4%) | 1,682 (50.6%) |
| 35 to 50 years | 897 (83.2%) | 181 (16.8%) |
| Total | 2,541 (56.6%) | 1,948 (43.4%) |
Fertility by Education in Volusia County
Average fertility rate in Volusia County is 41.0 births per 1,000 women. Women with the education attainment of graduate degree have the highest fertility rate of 75.0 births per 1,000 women, while women with the education attainment of less than high school have the lowest fertility at 20.0 births per 1,000 women. Women with the education attainment of college or associate's degree represent 36.3% of all women with births.
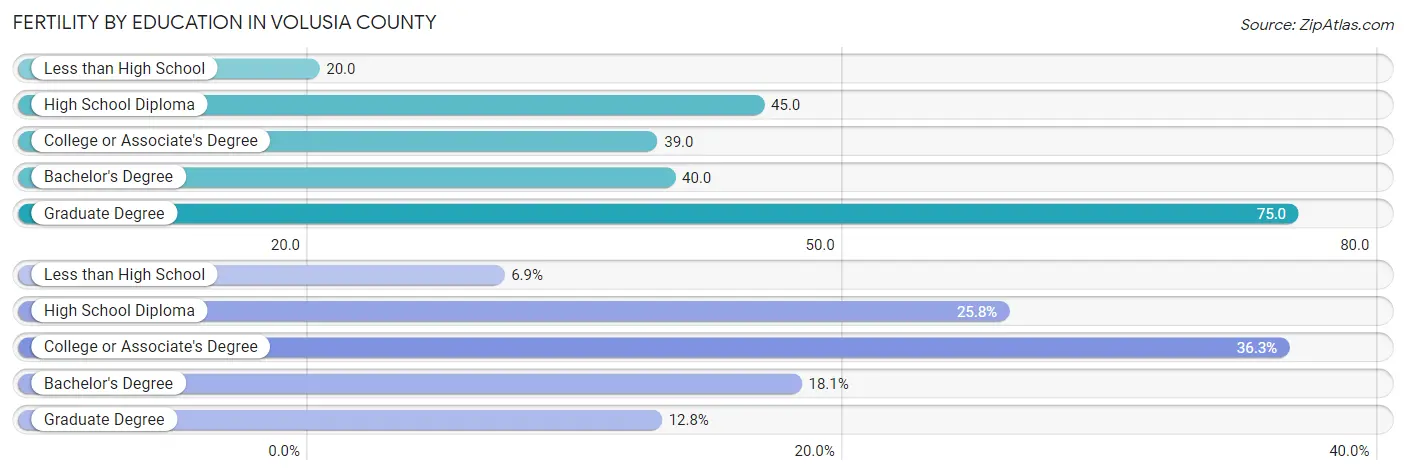
| Educational Attainment | Women with Births | Births / 1,000 Women |
| Less than High School | 311 (6.9%) | 20.0 |
| High School Diploma | 1,160 (25.8%) | 45.0 |
| College or Associate's Degree | 1,631 (36.3%) | 39.0 |
| Bachelor's Degree | 811 (18.1%) | 40.0 |
| Graduate Degree | 576 (12.8%) | 75.0 |
| Total | 4,489 (100.0%) | 41.0 |
Fertility by Education by Marriage Status in Volusia County
43.4% of women with births in Volusia County are unmarried. Women with the educational attainment of bachelor's degree are most likely to be married with 87.4% of them married at childbirth, while women with the educational attainment of less than high school are least likely to be married with 86.5% of them unmarried at childbirth.
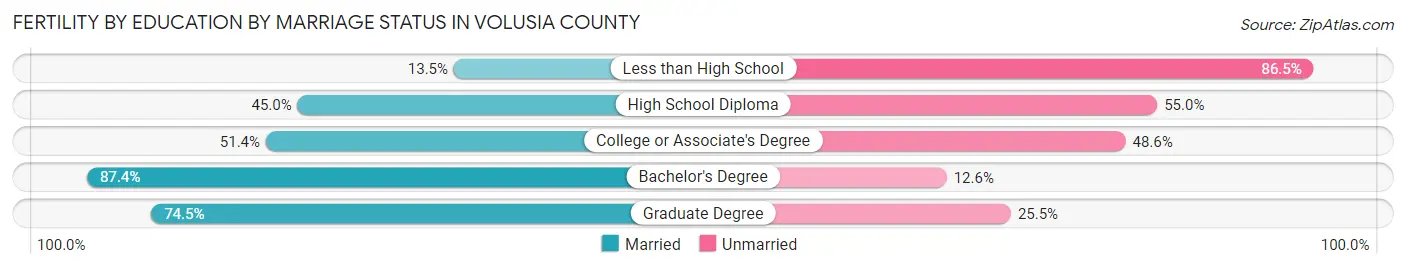
| Educational Attainment | Married | Unmarried |
| Less than High School | 42 (13.5%) | 269 (86.5%) |
| High School Diploma | 522 (45.0%) | 638 (55.0%) |
| College or Associate's Degree | 838 (51.4%) | 793 (48.6%) |
| Bachelor's Degree | 709 (87.4%) | 102 (12.6%) |
| Graduate Degree | 429 (74.5%) | 147 (25.5%) |
| Total | 2,541 (56.6%) | 1,948 (43.4%) |
Employment Characteristics in Volusia County
Employment by Class of Employer in Volusia County
Among the 241,735 employed individuals in Volusia County, private company employees (170,145 | 70.4%), local government employees (16,708 | 6.9%), and self-employed (not incorporated) (15,133 | 6.3%) make up the most common classes of employment.
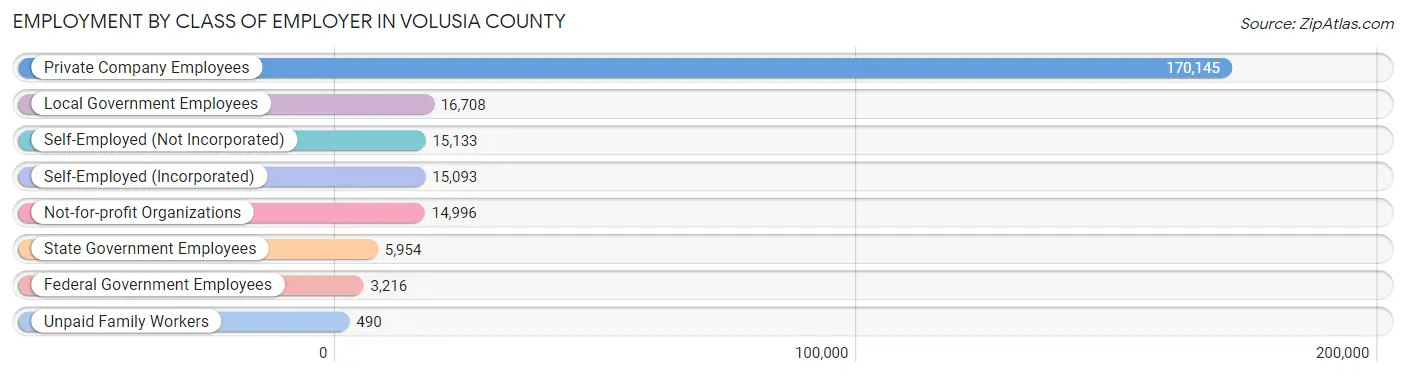
| Employer Class | # Employees | % Employees |
| Private Company Employees | 170,145 | 70.4% |
| Self-Employed (Incorporated) | 15,093 | 6.2% |
| Self-Employed (Not Incorporated) | 15,133 | 6.3% |
| Not-for-profit Organizations | 14,996 | 6.2% |
| Local Government Employees | 16,708 | 6.9% |
| State Government Employees | 5,954 | 2.5% |
| Federal Government Employees | 3,216 | 1.3% |
| Unpaid Family Workers | 490 | 0.2% |
| Total | 241,735 | 100.0% |
Employment Status by Age in Volusia County
According to the labor force statistics for Volusia County, out of the total population over 16 years of age (472,602), 54.1% or 255,678 individuals are in the labor force, with 4.2% or 10,738 of them unemployed. The age group with the highest labor force participation rate is 30 to 34 years, with 83.3% or 27,169 individuals in the labor force. Within the labor force, the 16 to 19 years age range has the highest percentage of unemployed individuals, with 12.2% or 1,007 of them being unemployed.
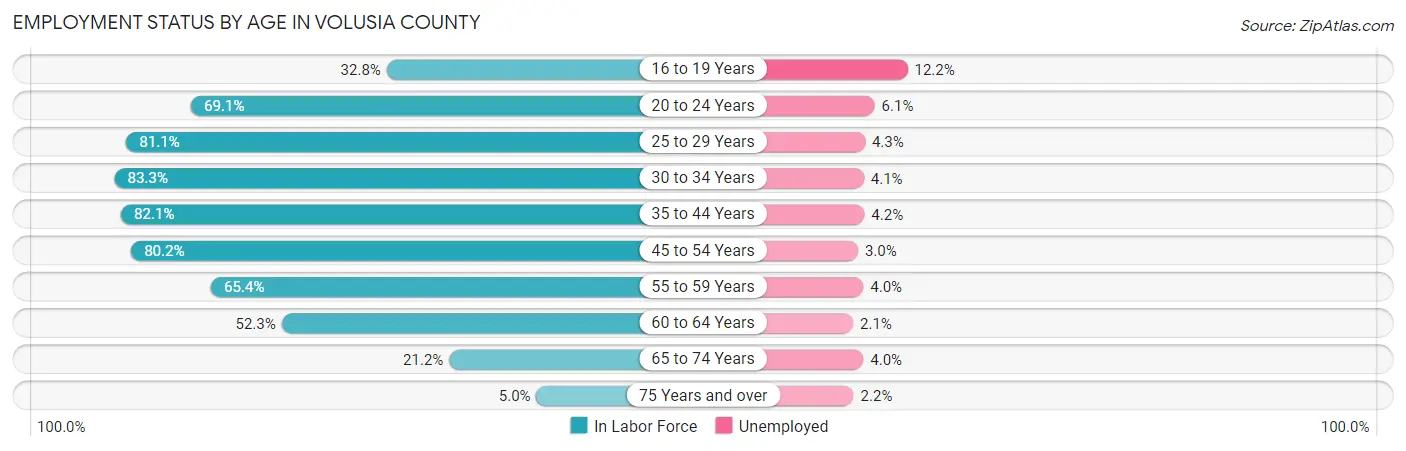
| Age Bracket | In Labor Force | Unemployed |
| 16 to 19 Years | 8,253 (32.8%) | 1,007 (12.2%) |
| 20 to 24 Years | 22,444 (69.1%) | 1,369 (6.1%) |
| 25 to 29 Years | 26,198 (81.1%) | 1,127 (4.3%) |
| 30 to 34 Years | 27,169 (83.3%) | 1,114 (4.1%) |
| 35 to 44 Years | 49,225 (82.1%) | 2,067 (4.2%) |
| 45 to 54 Years | 53,185 (80.2%) | 1,596 (3.0%) |
| 55 to 59 Years | 26,834 (65.4%) | 1,073 (4.0%) |
| 60 to 64 Years | 23,002 (52.3%) | 483 (2.1%) |
| 65 to 74 Years | 16,562 (21.2%) | 662 (4.0%) |
| 75 Years and over | 3,032 (5.0%) | 67 (2.2%) |
| Total | 255,678 (54.1%) | 10,738 (4.2%) |
Employment Status by Educational Attainment in Volusia County
According to labor force statistics for Volusia County, 74.4% of individuals (205,495) out of the total population between 25 and 64 years of age (276,203) are in the labor force, with 3.7% or 7,603 of them being unemployed. The group with the highest labor force participation rate are those with the educational attainment of bachelor's degree or higher, with 80.1% or 57,821 individuals in the labor force. Within the labor force, individuals with less than high school education have the highest percentage of unemployment, with 5.1% or 742 of them being unemployed.
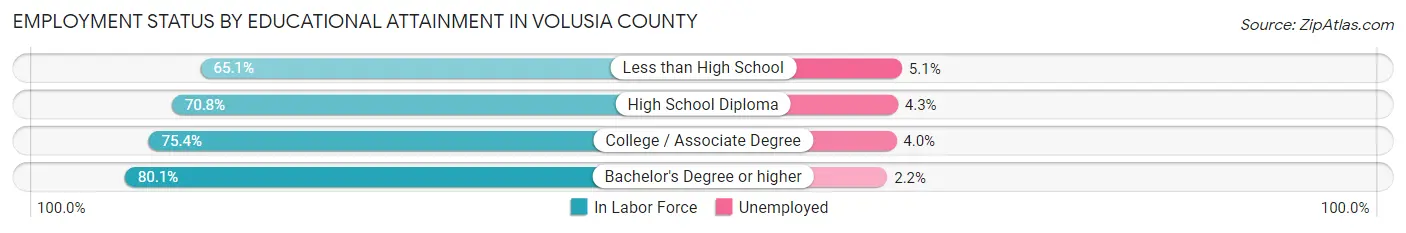
| Educational Attainment | In Labor Force | Unemployed |
| Less than High School | 14,541 (65.1%) | 1,139 (5.1%) |
| High School Diploma | 58,427 (70.8%) | 3,549 (4.3%) |
| College / Associate Degree | 74,764 (75.4%) | 3,966 (4.0%) |
| Bachelor's Degree or higher | 57,821 (80.1%) | 1,588 (2.2%) |
| Total | 205,495 (74.4%) | 10,220 (3.7%) |
Employment Occupations by Sex in Volusia County
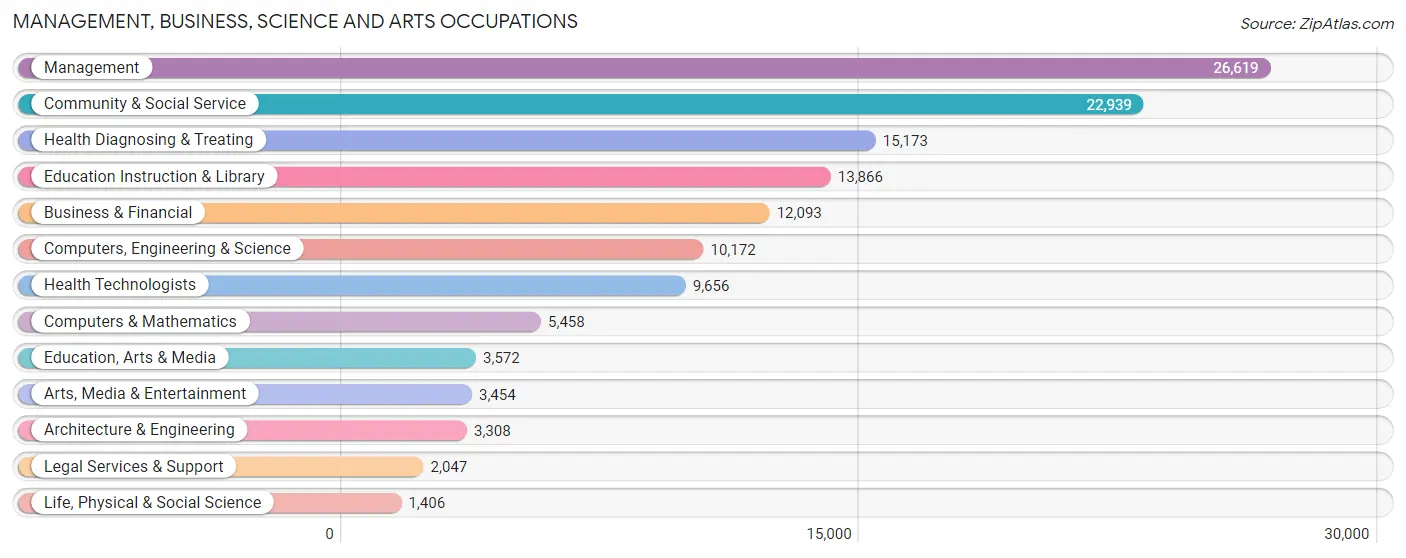
Management, Business, Science and Arts Occupations
The most common Management, Business, Science and Arts occupations in Volusia County are Management (26,619 | 10.9%), Community & Social Service (22,939 | 9.4%), Health Diagnosing & Treating (15,173 | 6.2%), Education Instruction & Library (13,866 | 5.7%), and Business & Financial (12,093 | 4.9%).
Management, Business, Science and Arts Occupations by Sex
Within the Management, Business, Science and Arts occupations in Volusia County, the most male-oriented occupations are Architecture & Engineering (84.2%), Computers & Mathematics (79.1%), and Computers, Engineering & Science (75.9%), while the most female-oriented occupations are Health Diagnosing & Treating (76.1%), Education Instruction & Library (74.1%), and Health Technologists (74.1%).
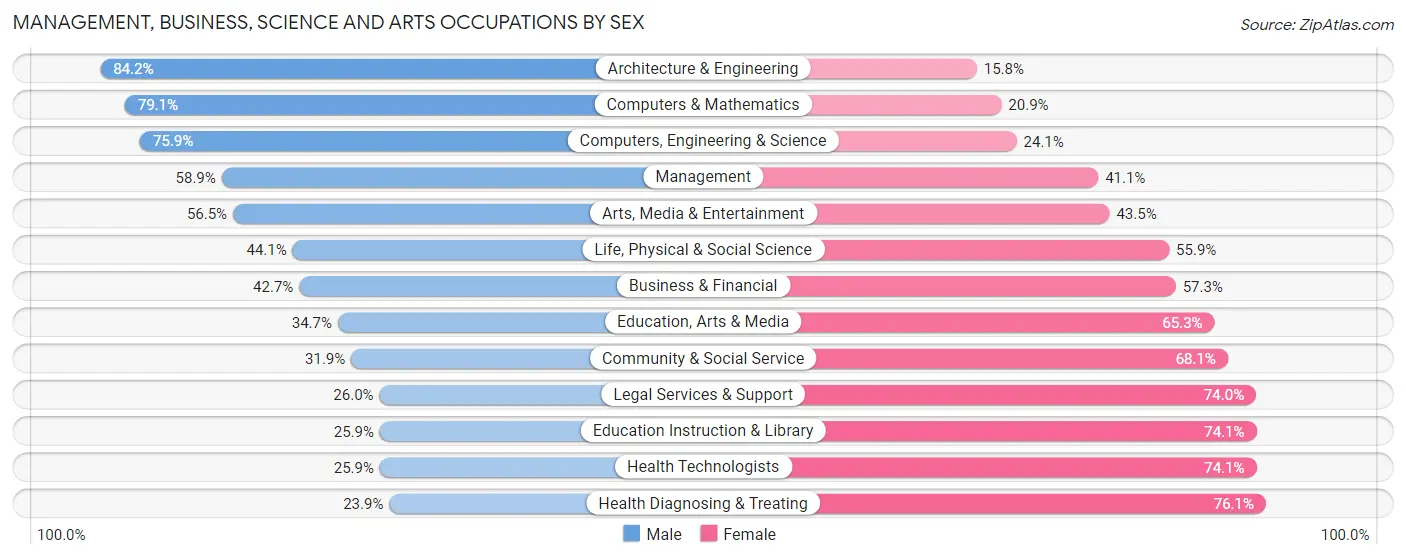
| Occupation | Male | Female |
| Management | 15,679 (58.9%) | 10,940 (41.1%) |
| Business & Financial | 5,167 (42.7%) | 6,926 (57.3%) |
| Computers, Engineering & Science | 7,723 (75.9%) | 2,449 (24.1%) |
| Computers & Mathematics | 4,317 (79.1%) | 1,141 (20.9%) |
| Architecture & Engineering | 2,786 (84.2%) | 522 (15.8%) |
| Life, Physical & Social Science | 620 (44.1%) | 786 (55.9%) |
| Community & Social Service | 7,316 (31.9%) | 15,623 (68.1%) |
| Education, Arts & Media | 1,238 (34.7%) | 2,334 (65.3%) |
| Legal Services & Support | 532 (26.0%) | 1,515 (74.0%) |
| Education Instruction & Library | 3,593 (25.9%) | 10,273 (74.1%) |
| Arts, Media & Entertainment | 1,953 (56.5%) | 1,501 (43.5%) |
| Health Diagnosing & Treating | 3,632 (23.9%) | 11,541 (76.1%) |
| Health Technologists | 2,502 (25.9%) | 7,154 (74.1%) |
| Total (Category) | 39,517 (45.4%) | 47,479 (54.6%) |
| Total (Overall) | 127,367 (52.0%) | 117,333 (47.9%) |
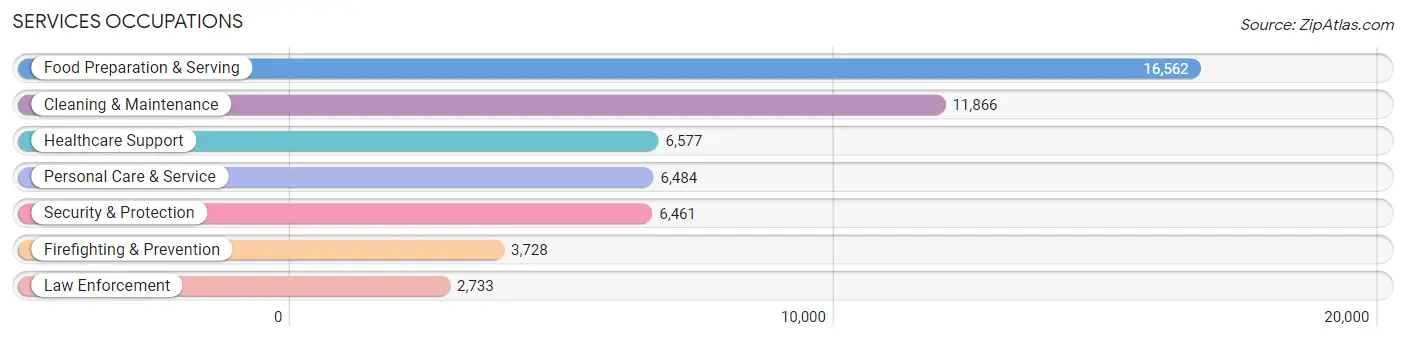
Services Occupations
The most common Services occupations in Volusia County are Food Preparation & Serving (16,562 | 6.8%), Cleaning & Maintenance (11,866 | 4.9%), Healthcare Support (6,577 | 2.7%), Personal Care & Service (6,484 | 2.6%), and Security & Protection (6,461 | 2.6%).
Services Occupations by Sex
Within the Services occupations in Volusia County, the most male-oriented occupations are Firefighting & Prevention (84.2%), Security & Protection (79.8%), and Law Enforcement (73.9%), while the most female-oriented occupations are Healthcare Support (88.6%), Personal Care & Service (75.4%), and Food Preparation & Serving (51.9%).
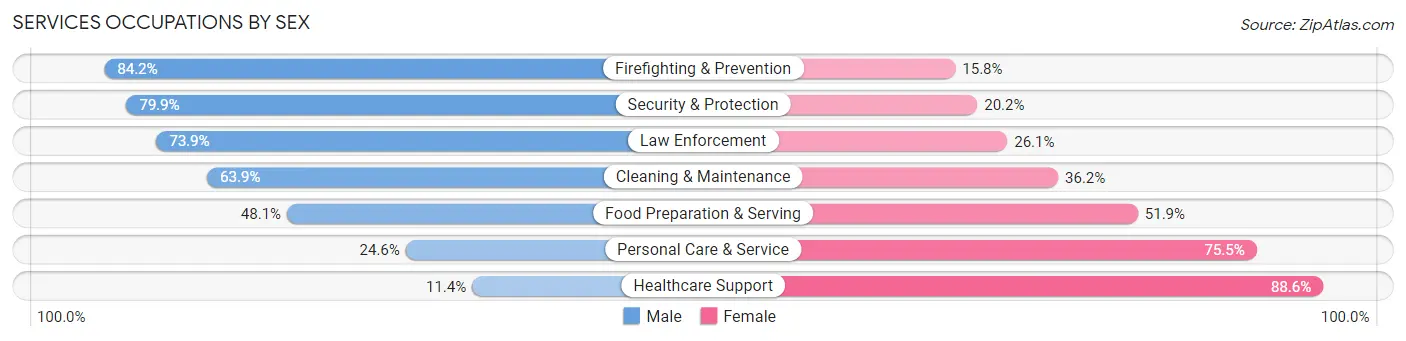
| Occupation | Male | Female |
| Healthcare Support | 750 (11.4%) | 5,827 (88.6%) |
| Security & Protection | 5,159 (79.8%) | 1,302 (20.2%) |
| Firefighting & Prevention | 3,139 (84.2%) | 589 (15.8%) |
| Law Enforcement | 2,020 (73.9%) | 713 (26.1%) |
| Food Preparation & Serving | 7,960 (48.1%) | 8,602 (51.9%) |
| Cleaning & Maintenance | 7,576 (63.8%) | 4,290 (36.1%) |
| Personal Care & Service | 1,592 (24.5%) | 4,892 (75.4%) |
| Total (Category) | 23,037 (48.0%) | 24,913 (52.0%) |
| Total (Overall) | 127,367 (52.0%) | 117,333 (47.9%) |
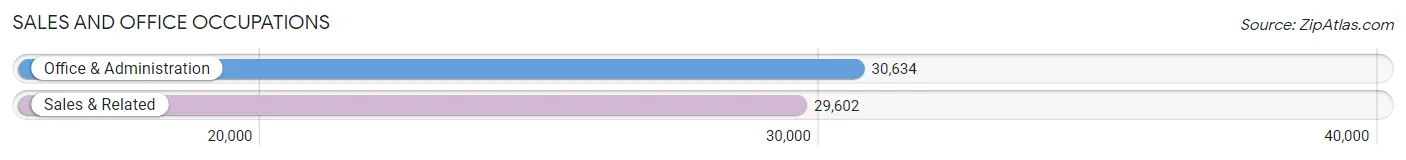
Sales and Office Occupations
The most common Sales and Office occupations in Volusia County are Office & Administration (30,634 | 12.5%), and Sales & Related (29,602 | 12.1%).
Sales and Office Occupations by Sex
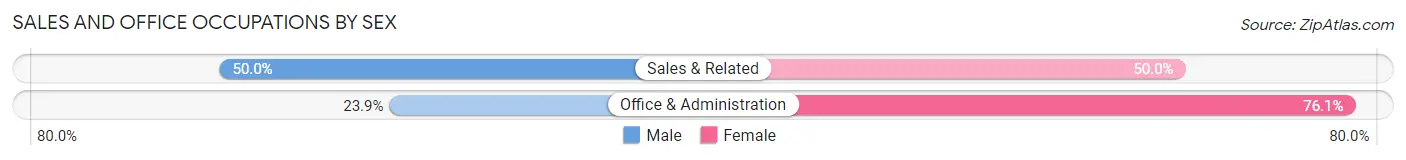
| Occupation | Male | Female |
| Sales & Related | 14,807 (50.0%) | 14,795 (50.0%) |
| Office & Administration | 7,319 (23.9%) | 23,315 (76.1%) |
| Total (Category) | 22,126 (36.7%) | 38,110 (63.3%) |
| Total (Overall) | 127,367 (52.0%) | 117,333 (47.9%) |
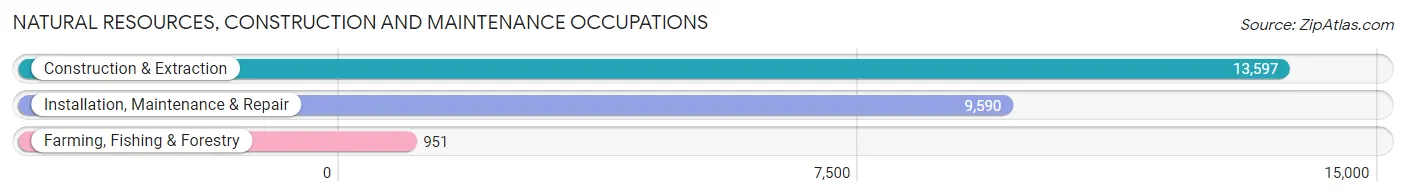
Natural Resources, Construction and Maintenance Occupations
The most common Natural Resources, Construction and Maintenance occupations in Volusia County are Construction & Extraction (13,597 | 5.6%), Installation, Maintenance & Repair (9,590 | 3.9%), and Farming, Fishing & Forestry (951 | 0.4%).
Natural Resources, Construction and Maintenance Occupations by Sex
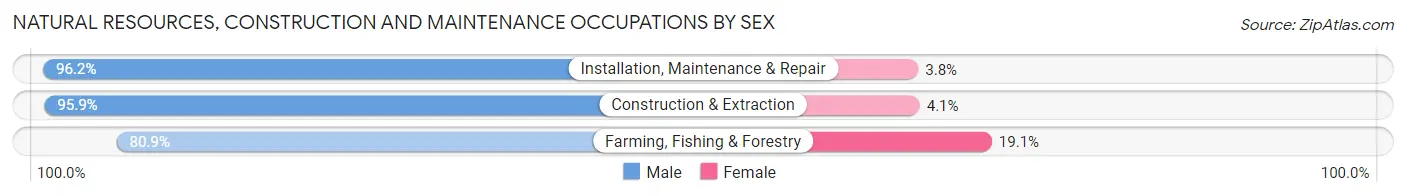
| Occupation | Male | Female |
| Farming, Fishing & Forestry | 769 (80.9%) | 182 (19.1%) |
| Construction & Extraction | 13,036 (95.9%) | 561 (4.1%) |
| Installation, Maintenance & Repair | 9,222 (96.2%) | 368 (3.8%) |
| Total (Category) | 23,027 (95.4%) | 1,111 (4.6%) |
| Total (Overall) | 127,367 (52.0%) | 117,333 (47.9%) |
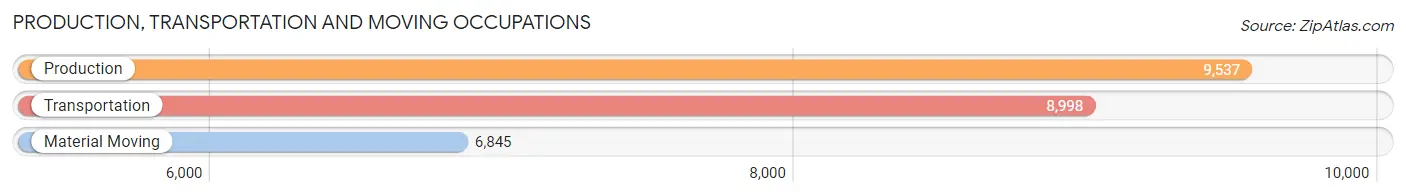
Production, Transportation and Moving Occupations
The most common Production, Transportation and Moving occupations in Volusia County are Production (9,537 | 3.9%), Transportation (8,998 | 3.7%), and Material Moving (6,845 | 2.8%).
Production, Transportation and Moving Occupations by Sex
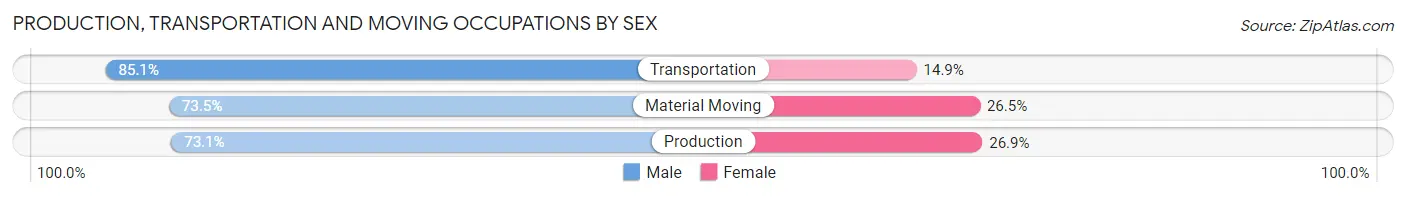
| Occupation | Male | Female |
| Production | 6,969 (73.1%) | 2,568 (26.9%) |
| Transportation | 7,660 (85.1%) | 1,338 (14.9%) |
| Material Moving | 5,031 (73.5%) | 1,814 (26.5%) |
| Total (Category) | 19,660 (77.5%) | 5,720 (22.5%) |
| Total (Overall) | 127,367 (52.0%) | 117,333 (47.9%) |
Employment Industries by Sex in Volusia County
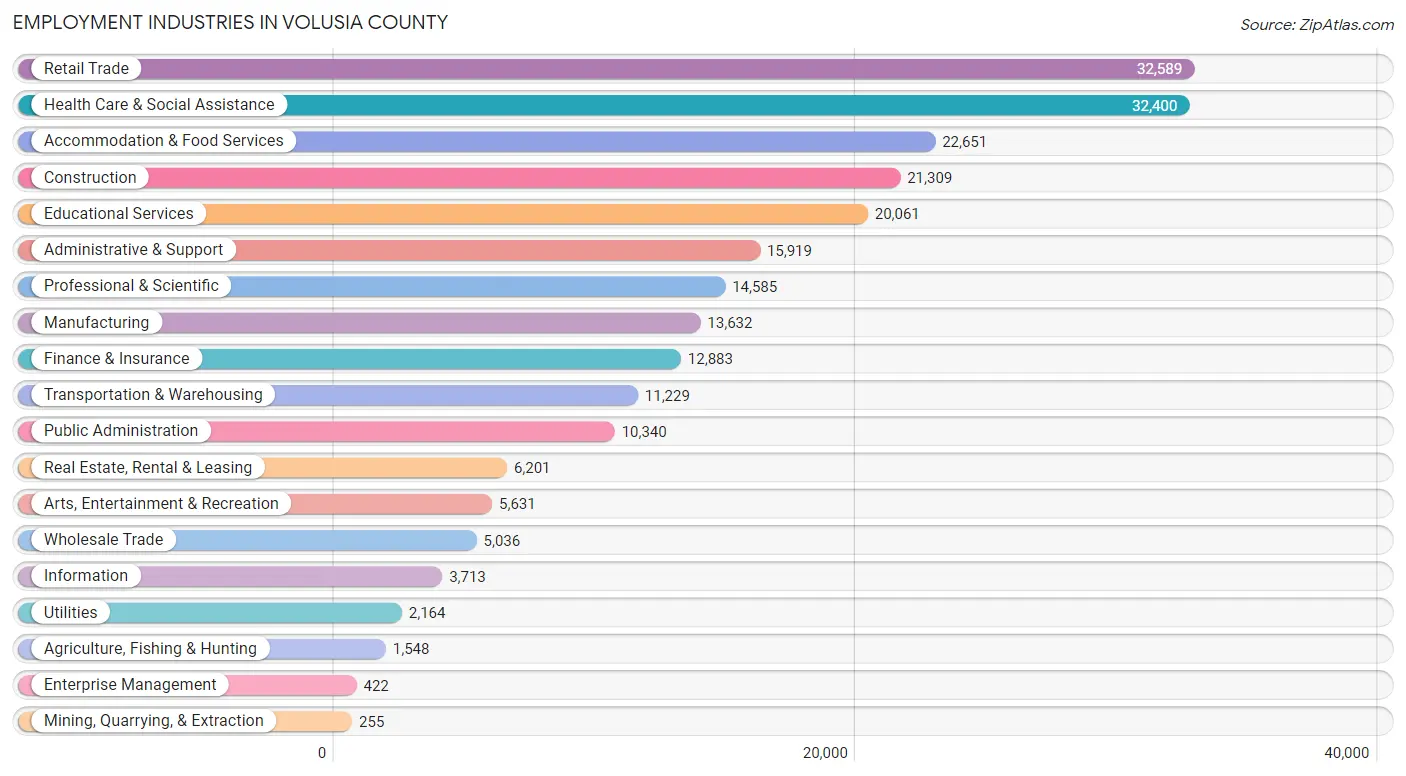
Employment Industries in Volusia County
The major employment industries in Volusia County include Retail Trade (32,589 | 13.3%), Health Care & Social Assistance (32,400 | 13.2%), Accommodation & Food Services (22,651 | 9.3%), Construction (21,309 | 8.7%), and Educational Services (20,061 | 8.2%).
Employment Industries by Sex in Volusia County
The Volusia County industries that see more men than women are Mining, Quarrying, & Extraction (100.0%), Utilities (89.0%), and Construction (87.2%), whereas the industries that tend to have a higher number of women are Health Care & Social Assistance (78.0%), Educational Services (68.5%), and Finance & Insurance (68.0%).
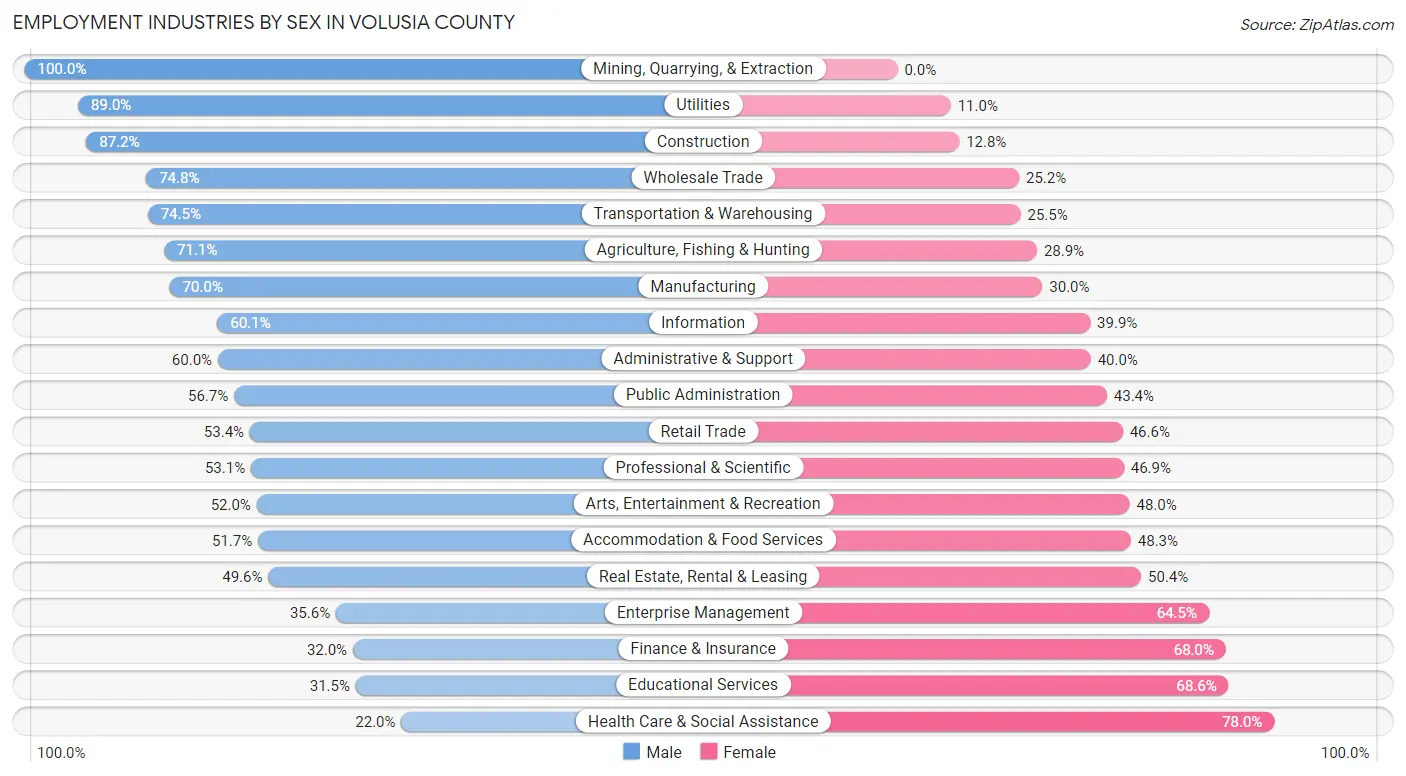
| Industry | Male | Female |
| Agriculture, Fishing & Hunting | 1,101 (71.1%) | 447 (28.9%) |
| Mining, Quarrying, & Extraction | 255 (100.0%) | 0 (0.0%) |
| Construction | 18,583 (87.2%) | 2,726 (12.8%) |
| Manufacturing | 9,542 (70.0%) | 4,090 (30.0%) |
| Wholesale Trade | 3,768 (74.8%) | 1,268 (25.2%) |
| Retail Trade | 17,391 (53.4%) | 15,198 (46.6%) |
| Transportation & Warehousing | 8,367 (74.5%) | 2,862 (25.5%) |
| Utilities | 1,925 (89.0%) | 239 (11.0%) |
| Information | 2,232 (60.1%) | 1,481 (39.9%) |
| Finance & Insurance | 4,128 (32.0%) | 8,755 (68.0%) |
| Real Estate, Rental & Leasing | 3,073 (49.6%) | 3,128 (50.4%) |
| Professional & Scientific | 7,751 (53.1%) | 6,834 (46.9%) |
| Enterprise Management | 150 (35.5%) | 272 (64.4%) |
| Administrative & Support | 9,550 (60.0%) | 6,369 (40.0%) |
| Educational Services | 6,310 (31.5%) | 13,751 (68.5%) |
| Health Care & Social Assistance | 7,135 (22.0%) | 25,265 (78.0%) |
| Arts, Entertainment & Recreation | 2,926 (52.0%) | 2,705 (48.0%) |
| Accommodation & Food Services | 11,706 (51.7%) | 10,945 (48.3%) |
| Public Administration | 5,858 (56.7%) | 4,482 (43.3%) |
| Total | 127,367 (52.0%) | 117,333 (47.9%) |
Education in Volusia County
School Enrollment in Volusia County
The most common levels of schooling among the 112,967 students in Volusia County are college / undergraduate (29,427 | 26.1%), high school (23,920 | 21.2%), and elementary school (22,300 | 19.7%).
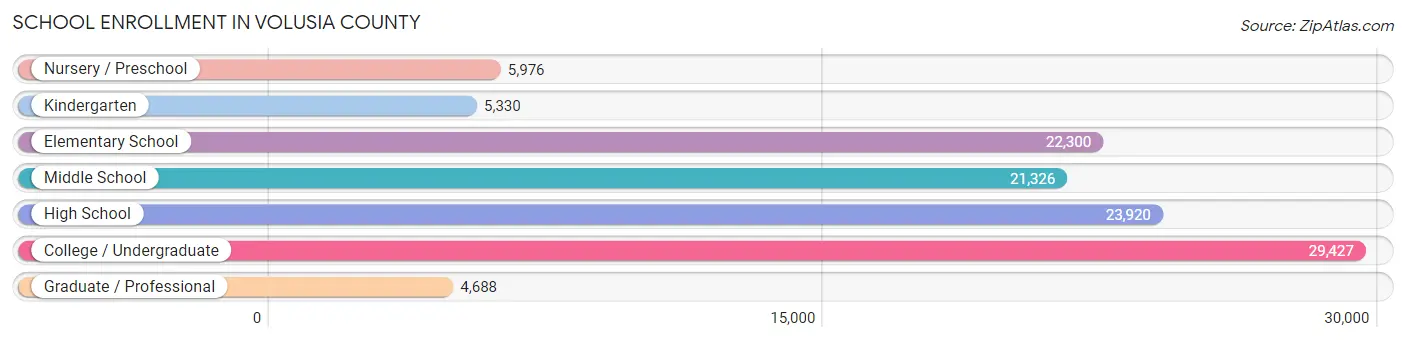
| School Level | # Students | % Students |
| Nursery / Preschool | 5,976 | 5.3% |
| Kindergarten | 5,330 | 4.7% |
| Elementary School | 22,300 | 19.7% |
| Middle School | 21,326 | 18.9% |
| High School | 23,920 | 21.2% |
| College / Undergraduate | 29,427 | 26.1% |
| Graduate / Professional | 4,688 | 4.2% |
| Total | 112,967 | 100.0% |
School Enrollment by Age by Funding Source in Volusia County
Out of a total of 112,967 students who are enrolled in schools in Volusia County, 27,903 (24.7%) attend a private institution, while the remaining 85,064 (75.3%) are enrolled in public schools. The age group of 20 to 24 year olds has the highest likelihood of being enrolled in private schools, with 6,628 (47.8% in the age bracket) enrolled. Conversely, the age group of 15 to 17 year olds has the lowest likelihood of being enrolled in a private school, with 15,430 (91.6% in the age bracket) attending a public institution.
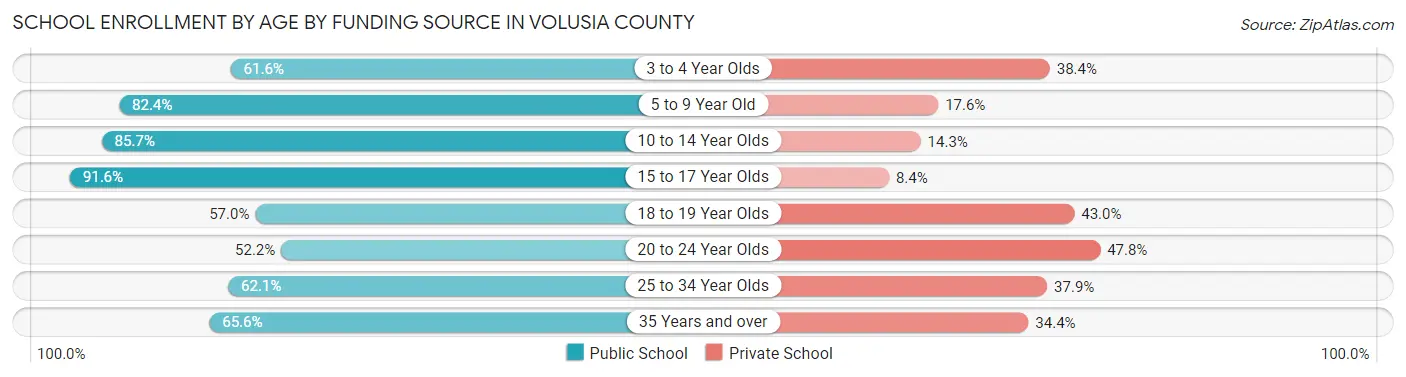
| Age Bracket | Public School | Private School |
| 3 to 4 Year Olds | 2,969 (61.6%) | 1,850 (38.4%) |
| 5 to 9 Year Old | 21,495 (82.4%) | 4,593 (17.6%) |
| 10 to 14 Year Olds | 23,019 (85.7%) | 3,855 (14.3%) |
| 15 to 17 Year Olds | 15,430 (91.6%) | 1,422 (8.4%) |
| 18 to 19 Year Olds | 5,959 (57.0%) | 4,488 (43.0%) |
| 20 to 24 Year Olds | 7,243 (52.2%) | 6,628 (47.8%) |
| 25 to 34 Year Olds | 4,475 (62.1%) | 2,731 (37.9%) |
| 35 Years and over | 4,467 (65.6%) | 2,343 (34.4%) |
| Total | 85,064 (75.3%) | 27,903 (24.7%) |
Educational Attainment by Field of Study in Volusia County
Business (27,324 | 23.4%), education (15,876 | 13.6%), science & technology (12,457 | 10.7%), arts & humanities (8,910 | 7.6%), and social sciences (7,119 | 6.1%) are the most common fields of study among 116,712 individuals in Volusia County who have obtained a bachelor's degree or higher.
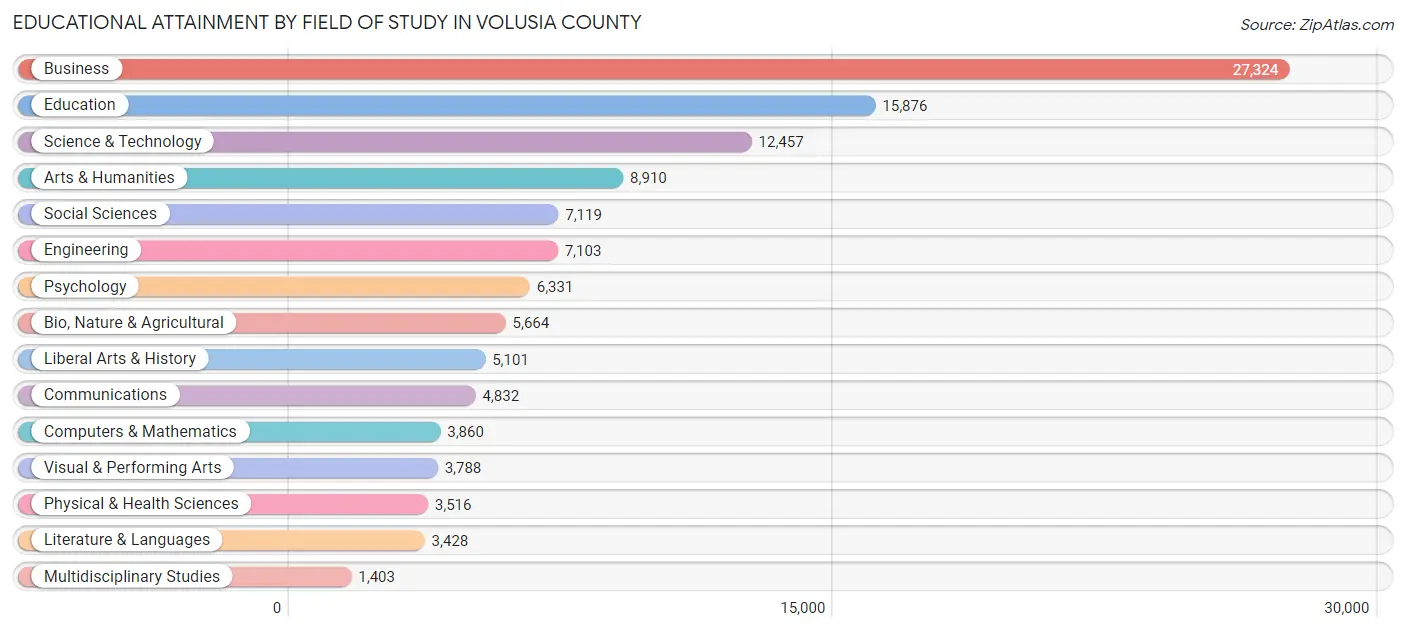
| Field of Study | # Graduates | % Graduates |
| Computers & Mathematics | 3,860 | 3.3% |
| Bio, Nature & Agricultural | 5,664 | 4.9% |
| Physical & Health Sciences | 3,516 | 3.0% |
| Psychology | 6,331 | 5.4% |
| Social Sciences | 7,119 | 6.1% |
| Engineering | 7,103 | 6.1% |
| Multidisciplinary Studies | 1,403 | 1.2% |
| Science & Technology | 12,457 | 10.7% |
| Business | 27,324 | 23.4% |
| Education | 15,876 | 13.6% |
| Literature & Languages | 3,428 | 2.9% |
| Liberal Arts & History | 5,101 | 4.4% |
| Visual & Performing Arts | 3,788 | 3.3% |
| Communications | 4,832 | 4.1% |
| Arts & Humanities | 8,910 | 7.6% |
| Total | 116,712 | 100.0% |
Transportation & Commute in Volusia County
Vehicle Availability by Sex in Volusia County
The most prevalent vehicle ownership categories in Volusia County are males with 2 vehicles (57,225, accounting for 45.4%) and females with 2 vehicles (51,559, making up 49.6%).
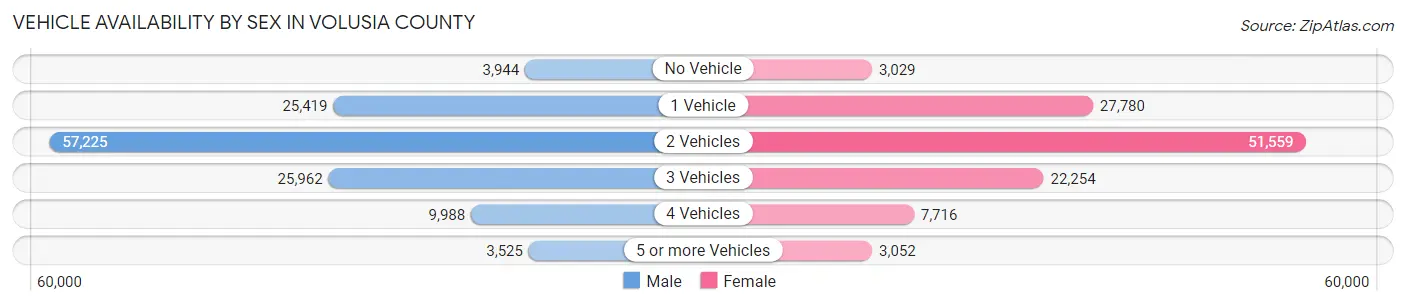
| Vehicles Available | Male | Female |
| No Vehicle | 3,944 (3.1%) | 3,029 (2.6%) |
| 1 Vehicle | 25,419 (20.2%) | 27,780 (24.1%) |
| 2 Vehicles | 57,225 (45.4%) | 51,559 (44.7%) |
| 3 Vehicles | 25,962 (20.6%) | 22,254 (19.3%) |
| 4 Vehicles | 9,988 (7.9%) | 7,716 (6.7%) |
| 5 or more Vehicles | 3,525 (2.8%) | 3,052 (2.6%) |
| Total | 126,063 (100.0%) | 115,390 (100.0%) |
Commute Time in Volusia County
The most frequently occuring commute durations in Volusia County are 15 to 19 minutes (34,647 commuters, 16.2%), 20 to 24 minutes (30,227 commuters, 14.2%), and 10 to 14 minutes (29,720 commuters, 13.9%).
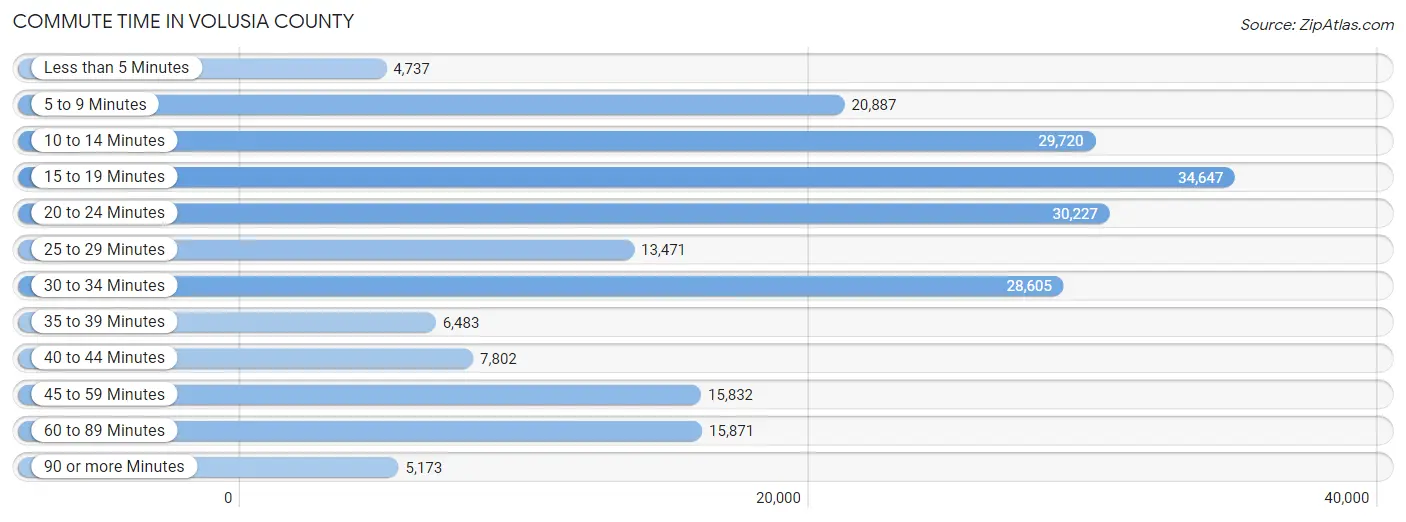
| Commute Time | # Commuters | % Commuters |
| Less than 5 Minutes | 4,737 | 2.2% |
| 5 to 9 Minutes | 20,887 | 9.8% |
| 10 to 14 Minutes | 29,720 | 13.9% |
| 15 to 19 Minutes | 34,647 | 16.2% |
| 20 to 24 Minutes | 30,227 | 14.2% |
| 25 to 29 Minutes | 13,471 | 6.3% |
| 30 to 34 Minutes | 28,605 | 13.4% |
| 35 to 39 Minutes | 6,483 | 3.0% |
| 40 to 44 Minutes | 7,802 | 3.7% |
| 45 to 59 Minutes | 15,832 | 7.4% |
| 60 to 89 Minutes | 15,871 | 7.4% |
| 90 or more Minutes | 5,173 | 2.4% |
Commute Time by Sex in Volusia County
The most common commute times in Volusia County are 15 to 19 minutes (16,870 commuters, 14.9%) for males and 15 to 19 minutes (17,777 commuters, 17.7%) for females.
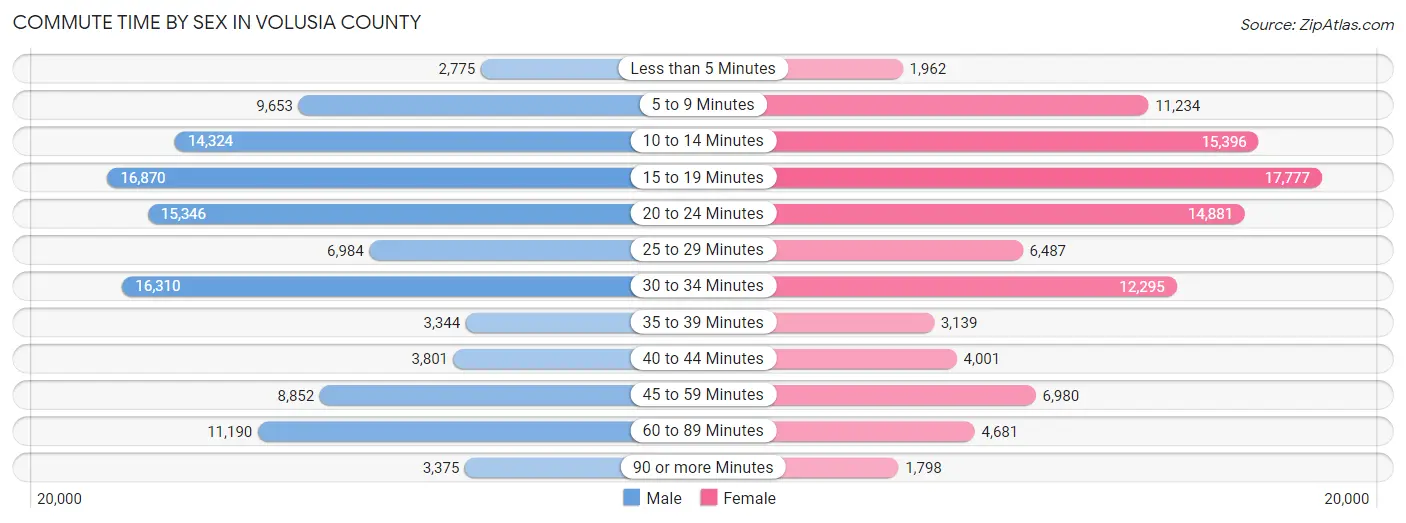
| Commute Time | Male | Female |
| Less than 5 Minutes | 2,775 (2.5%) | 1,962 (1.9%) |
| 5 to 9 Minutes | 9,653 (8.6%) | 11,234 (11.2%) |
| 10 to 14 Minutes | 14,324 (12.7%) | 15,396 (15.3%) |
| 15 to 19 Minutes | 16,870 (14.9%) | 17,777 (17.7%) |
| 20 to 24 Minutes | 15,346 (13.6%) | 14,881 (14.8%) |
| 25 to 29 Minutes | 6,984 (6.2%) | 6,487 (6.5%) |
| 30 to 34 Minutes | 16,310 (14.5%) | 12,295 (12.2%) |
| 35 to 39 Minutes | 3,344 (3.0%) | 3,139 (3.1%) |
| 40 to 44 Minutes | 3,801 (3.4%) | 4,001 (4.0%) |
| 45 to 59 Minutes | 8,852 (7.9%) | 6,980 (6.9%) |
| 60 to 89 Minutes | 11,190 (9.9%) | 4,681 (4.6%) |
| 90 or more Minutes | 3,375 (3.0%) | 1,798 (1.8%) |
Time of Departure to Work by Sex in Volusia County
The most frequent times of departure to work in Volusia County are 7:00 AM to 7:29 AM (15,910, 14.1%) for males and 7:00 AM to 7:29 AM (16,126, 16.0%) for females.
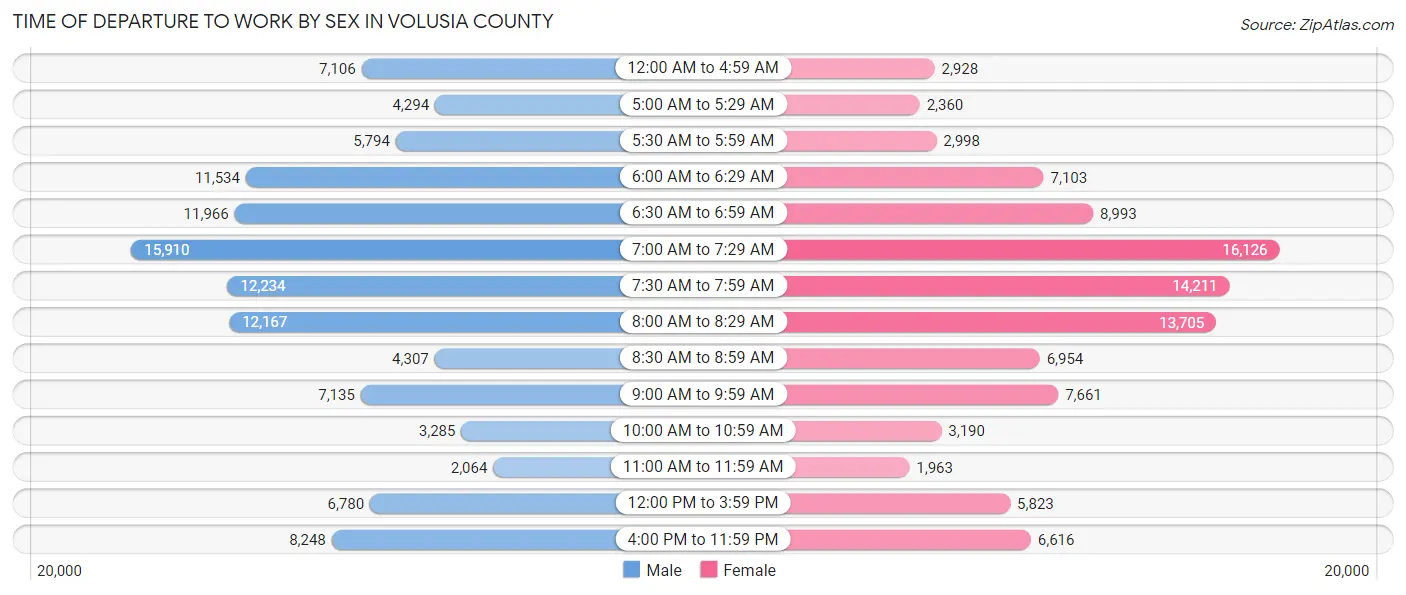
| Time of Departure | Male | Female |
| 12:00 AM to 4:59 AM | 7,106 (6.3%) | 2,928 (2.9%) |
| 5:00 AM to 5:29 AM | 4,294 (3.8%) | 2,360 (2.4%) |
| 5:30 AM to 5:59 AM | 5,794 (5.1%) | 2,998 (3.0%) |
| 6:00 AM to 6:29 AM | 11,534 (10.2%) | 7,103 (7.1%) |
| 6:30 AM to 6:59 AM | 11,966 (10.6%) | 8,993 (8.9%) |
| 7:00 AM to 7:29 AM | 15,910 (14.1%) | 16,126 (16.0%) |
| 7:30 AM to 7:59 AM | 12,234 (10.8%) | 14,211 (14.1%) |
| 8:00 AM to 8:29 AM | 12,167 (10.8%) | 13,705 (13.6%) |
| 8:30 AM to 8:59 AM | 4,307 (3.8%) | 6,954 (6.9%) |
| 9:00 AM to 9:59 AM | 7,135 (6.3%) | 7,661 (7.6%) |
| 10:00 AM to 10:59 AM | 3,285 (2.9%) | 3,190 (3.2%) |
| 11:00 AM to 11:59 AM | 2,064 (1.8%) | 1,963 (1.9%) |
| 12:00 PM to 3:59 PM | 6,780 (6.0%) | 5,823 (5.8%) |
| 4:00 PM to 11:59 PM | 8,248 (7.3%) | 6,616 (6.6%) |
| Total | 112,824 (100.0%) | 100,631 (100.0%) |
Housing Occupancy in Volusia County
Occupancy by Ownership in Volusia County
Of the total 232,673 dwellings in Volusia County, owner-occupied units account for 167,784 (72.1%), while renter-occupied units make up 64,889 (27.9%).
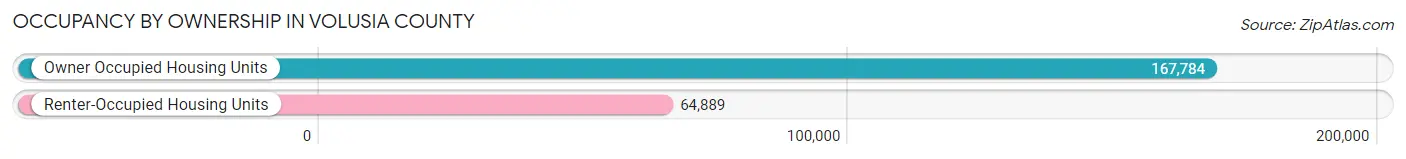
| Occupancy | # Housing Units | % Housing Units |
| Owner Occupied Housing Units | 167,784 | 72.1% |
| Renter-Occupied Housing Units | 64,889 | 27.9% |
| Total Occupied Housing Units | 232,673 | 100.0% |
Occupancy by Household Size in Volusia County
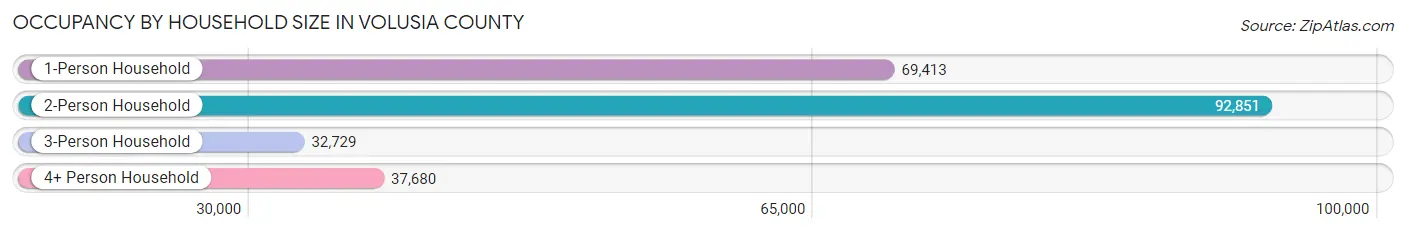
| Household Size | # Housing Units | % Housing Units |
| 1-Person Household | 69,413 | 29.8% |
| 2-Person Household | 92,851 | 39.9% |
| 3-Person Household | 32,729 | 14.1% |
| 4+ Person Household | 37,680 | 16.2% |
| Total Housing Units | 232,673 | 100.0% |
Occupancy by Ownership by Household Size in Volusia County
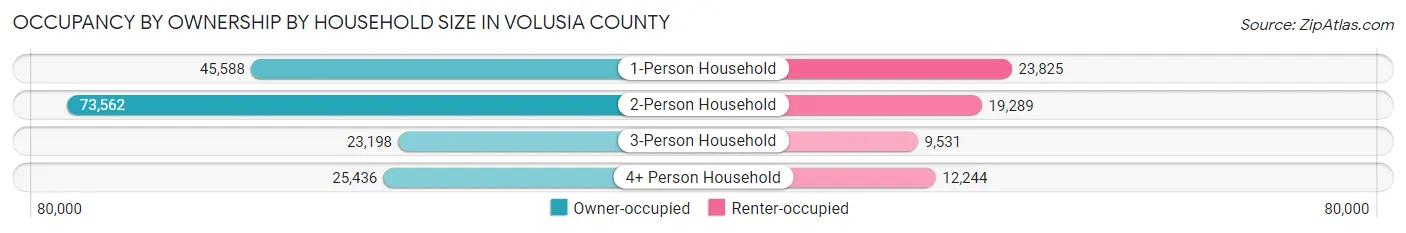
| Household Size | Owner-occupied | Renter-occupied |
| 1-Person Household | 45,588 (65.7%) | 23,825 (34.3%) |
| 2-Person Household | 73,562 (79.2%) | 19,289 (20.8%) |
| 3-Person Household | 23,198 (70.9%) | 9,531 (29.1%) |
| 4+ Person Household | 25,436 (67.5%) | 12,244 (32.5%) |
| Total Housing Units | 167,784 (72.1%) | 64,889 (27.9%) |
Occupancy by Educational Attainment in Volusia County
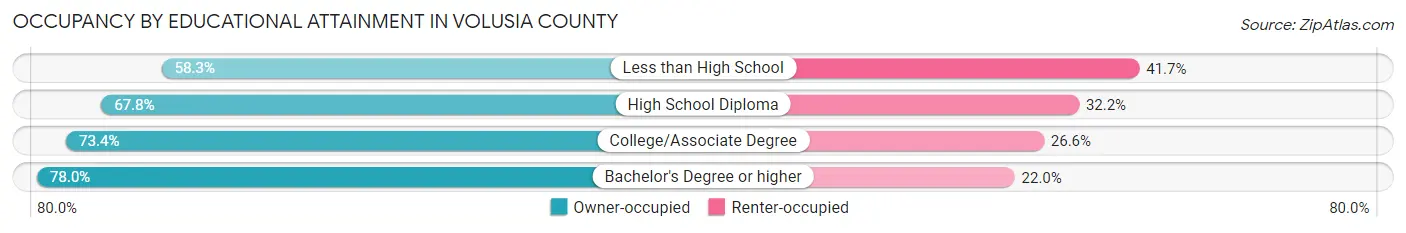
| Household Size | Owner-occupied | Renter-occupied |
| Less than High School | 9,952 (58.3%) | 7,128 (41.7%) |
| High School Diploma | 42,830 (67.8%) | 20,301 (32.2%) |
| College/Associate Degree | 62,963 (73.4%) | 22,818 (26.6%) |
| Bachelor's Degree or higher | 52,039 (78.0%) | 14,642 (22.0%) |
Occupancy by Age of Householder in Volusia County
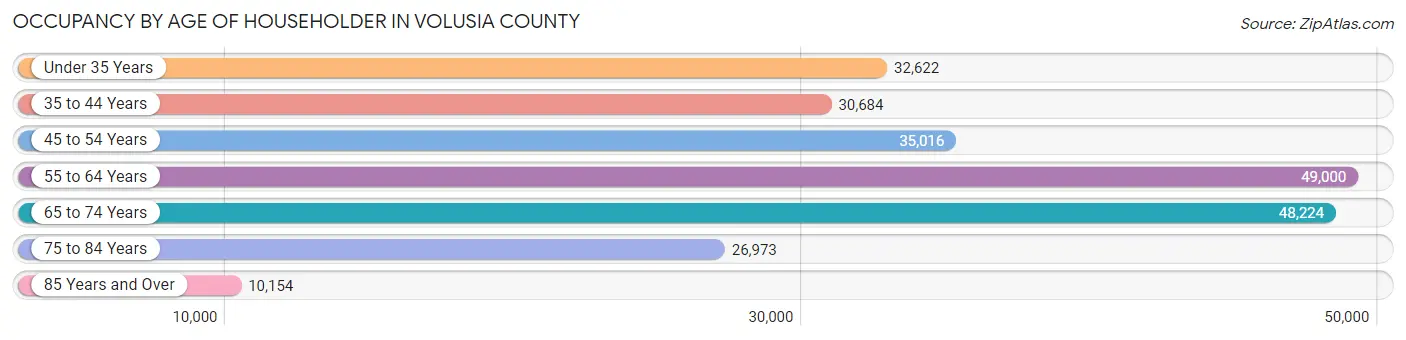
| Age Bracket | # Households | % Households |
| Under 35 Years | 32,622 | 14.0% |
| 35 to 44 Years | 30,684 | 13.2% |
| 45 to 54 Years | 35,016 | 15.0% |
| 55 to 64 Years | 49,000 | 21.1% |
| 65 to 74 Years | 48,224 | 20.7% |
| 75 to 84 Years | 26,973 | 11.6% |
| 85 Years and Over | 10,154 | 4.4% |
| Total | 232,673 | 100.0% |
Housing Finances in Volusia County
Median Income by Occupancy in Volusia County
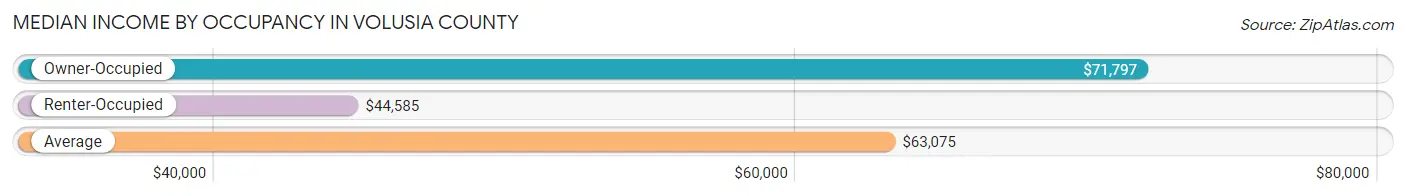
| Occupancy Type | # Households | Median Income |
| Owner-Occupied | 167,784 (72.1%) | $71,797 |
| Renter-Occupied | 64,889 (27.9%) | $44,585 |
| Average | 232,673 (100.0%) | $63,075 |
Occupancy by Householder Income Bracket in Volusia County
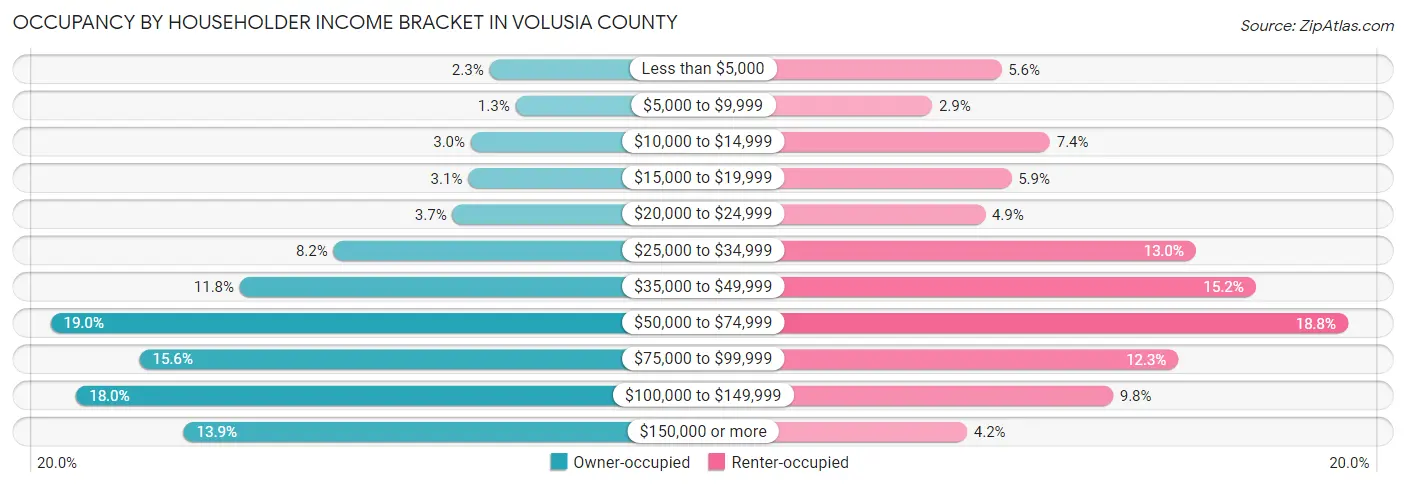
| Income Bracket | Owner-occupied | Renter-occupied |
| Less than $5,000 | 3,842 (2.3%) | 3,603 (5.6%) |
| $5,000 to $9,999 | 2,174 (1.3%) | 1,890 (2.9%) |
| $10,000 to $14,999 | 5,029 (3.0%) | 4,800 (7.4%) |
| $15,000 to $19,999 | 5,195 (3.1%) | 3,850 (5.9%) |
| $20,000 to $24,999 | 6,200 (3.7%) | 3,200 (4.9%) |
| $25,000 to $34,999 | 13,807 (8.2%) | 8,410 (13.0%) |
| $35,000 to $49,999 | 19,793 (11.8%) | 9,889 (15.2%) |
| $50,000 to $74,999 | 31,900 (19.0%) | 12,164 (18.8%) |
| $75,000 to $99,999 | 26,216 (15.6%) | 7,972 (12.3%) |
| $100,000 to $149,999 | 30,245 (18.0%) | 6,360 (9.8%) |
| $150,000 or more | 23,383 (13.9%) | 2,751 (4.2%) |
| Total | 167,784 (100.0%) | 64,889 (100.0%) |
Monthly Housing Cost Tiers in Volusia County
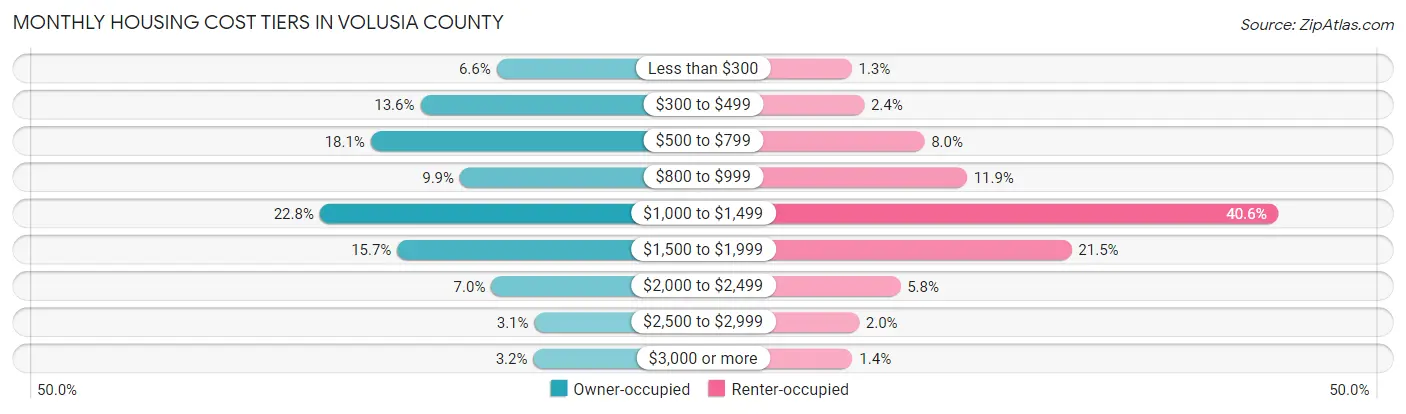
| Monthly Cost | Owner-occupied | Renter-occupied |
| Less than $300 | 10,997 (6.6%) | 841 (1.3%) |
| $300 to $499 | 22,773 (13.6%) | 1,581 (2.4%) |
| $500 to $799 | 30,428 (18.1%) | 5,186 (8.0%) |
| $800 to $999 | 16,653 (9.9%) | 7,719 (11.9%) |
| $1,000 to $1,499 | 38,301 (22.8%) | 26,342 (40.6%) |
| $1,500 to $1,999 | 26,350 (15.7%) | 13,977 (21.5%) |
| $2,000 to $2,499 | 11,811 (7.0%) | 3,752 (5.8%) |
| $2,500 to $2,999 | 5,153 (3.1%) | 1,278 (2.0%) |
| $3,000 or more | 5,318 (3.2%) | 894 (1.4%) |
| Total | 167,784 (100.0%) | 64,889 (100.0%) |
Physical Housing Characteristics in Volusia County
Housing Structures in Volusia County
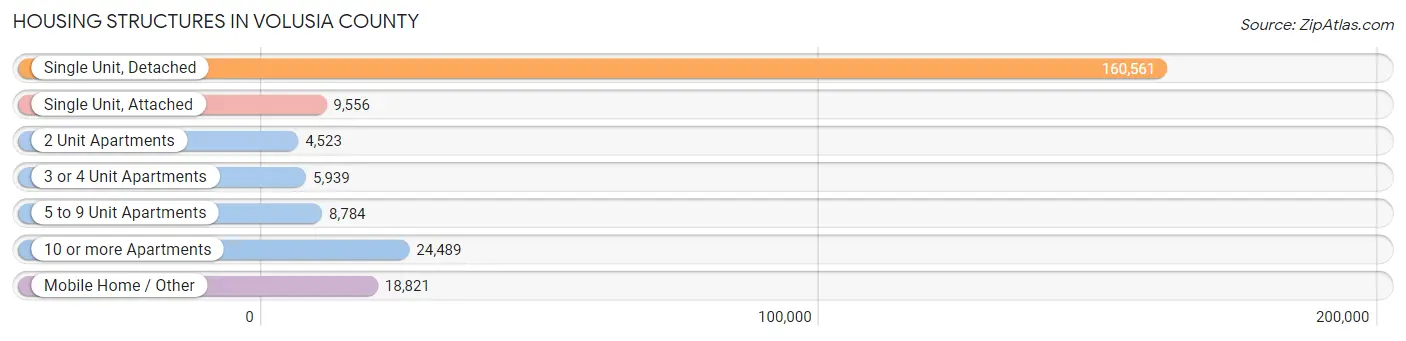
| Structure Type | # Housing Units | % Housing Units |
| Single Unit, Detached | 160,561 | 69.0% |
| Single Unit, Attached | 9,556 | 4.1% |
| 2 Unit Apartments | 4,523 | 1.9% |
| 3 or 4 Unit Apartments | 5,939 | 2.5% |
| 5 to 9 Unit Apartments | 8,784 | 3.8% |
| 10 or more Apartments | 24,489 | 10.5% |
| Mobile Home / Other | 18,821 | 8.1% |
| Total | 232,673 | 100.0% |
Housing Structures by Occupancy in Volusia County
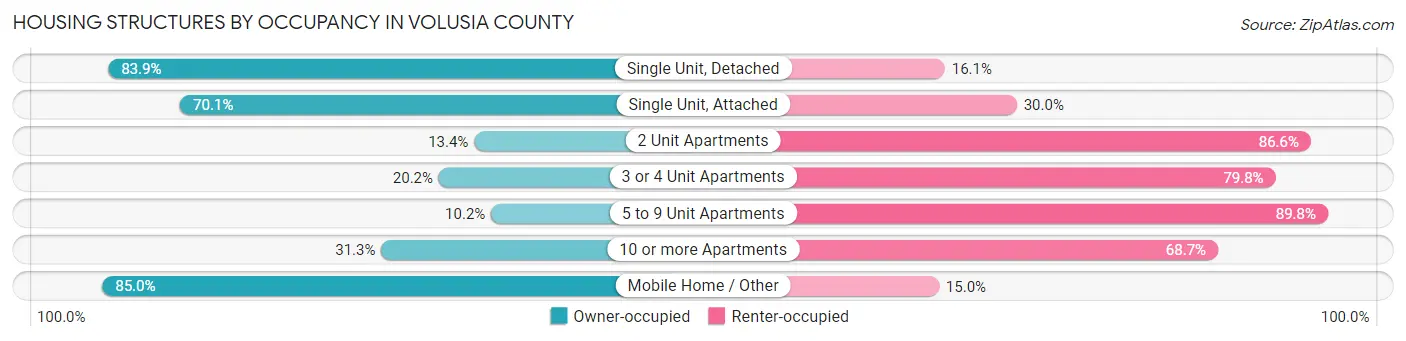
| Structure Type | Owner-occupied | Renter-occupied |
| Single Unit, Detached | 134,713 (83.9%) | 25,848 (16.1%) |
| Single Unit, Attached | 6,694 (70.1%) | 2,862 (29.9%) |
| 2 Unit Apartments | 608 (13.4%) | 3,915 (86.6%) |
| 3 or 4 Unit Apartments | 1,202 (20.2%) | 4,737 (79.8%) |
| 5 to 9 Unit Apartments | 893 (10.2%) | 7,891 (89.8%) |
| 10 or more Apartments | 7,670 (31.3%) | 16,819 (68.7%) |
| Mobile Home / Other | 16,004 (85.0%) | 2,817 (15.0%) |
| Total | 167,784 (72.1%) | 64,889 (27.9%) |
Housing Structures by Number of Rooms in Volusia County
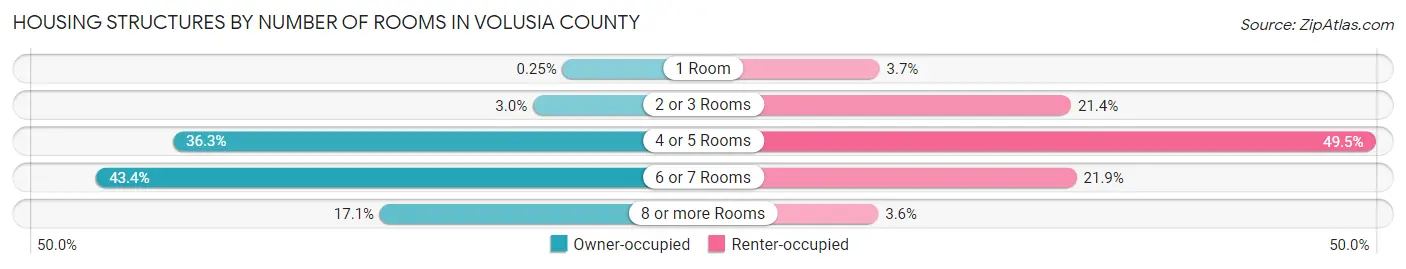
| Number of Rooms | Owner-occupied | Renter-occupied |
| 1 Room | 421 (0.3%) | 2,379 (3.7%) |
| 2 or 3 Rooms | 5,000 (3.0%) | 13,873 (21.4%) |
| 4 or 5 Rooms | 60,837 (36.3%) | 32,125 (49.5%) |
| 6 or 7 Rooms | 72,766 (43.4%) | 14,207 (21.9%) |
| 8 or more Rooms | 28,760 (17.1%) | 2,305 (3.5%) |
| Total | 167,784 (100.0%) | 64,889 (100.0%) |
Housing Structure by Heating Type in Volusia County
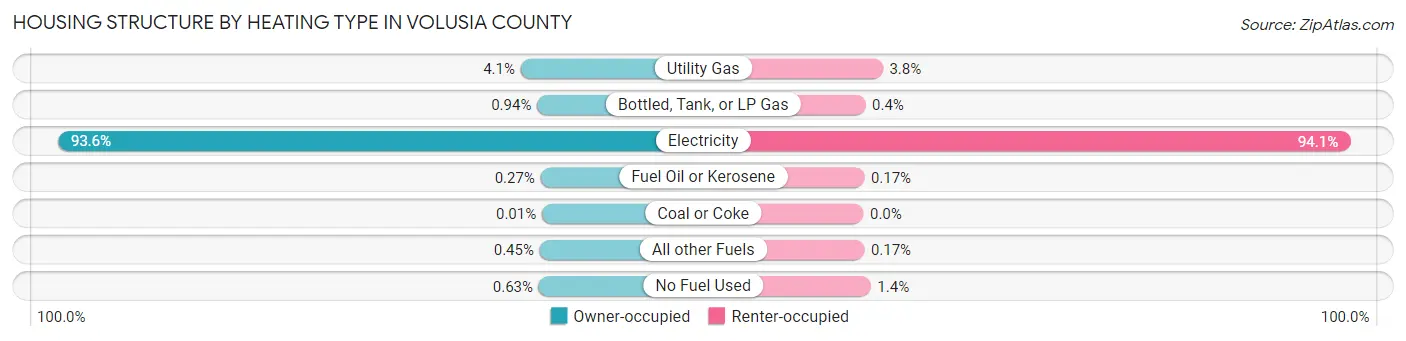
| Heating Type | Owner-occupied | Renter-occupied |
| Utility Gas | 6,909 (4.1%) | 2,433 (3.7%) |
| Bottled, Tank, or LP Gas | 1,580 (0.9%) | 261 (0.4%) |
| Electricity | 157,009 (93.6%) | 61,055 (94.1%) |
| Fuel Oil or Kerosene | 456 (0.3%) | 110 (0.2%) |
| Coal or Coke | 18 (0.0%) | 0 (0.0%) |
| All other Fuels | 760 (0.4%) | 111 (0.2%) |
| No Fuel Used | 1,052 (0.6%) | 919 (1.4%) |
| Total | 167,784 (100.0%) | 64,889 (100.0%) |
Household Vehicle Usage in Volusia County
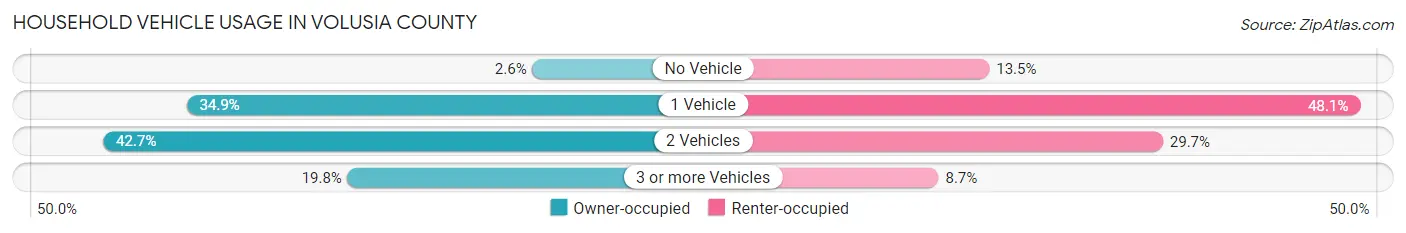
| Vehicles per Household | Owner-occupied | Renter-occupied |
| No Vehicle | 4,344 (2.6%) | 8,747 (13.5%) |
| 1 Vehicle | 58,535 (34.9%) | 31,211 (48.1%) |
| 2 Vehicles | 71,609 (42.7%) | 19,258 (29.7%) |
| 3 or more Vehicles | 33,296 (19.8%) | 5,673 (8.7%) |
| Total | 167,784 (100.0%) | 64,889 (100.0%) |
Real Estate & Mortgages in Volusia County
Real Estate and Mortgage Overview in Volusia County
| Characteristic | Without Mortgage | With Mortgage |
| Housing Units | 75,440 | 92,344 |
| Median Property Value | $227,200 | $266,300 |
| Median Household Income | $56,452 | $15,925 |
| Monthly Housing Costs | $548 | $4,983 |
| Real Estate Taxes | $1,751 | $2,543 |
Property Value by Mortgage Status in Volusia County
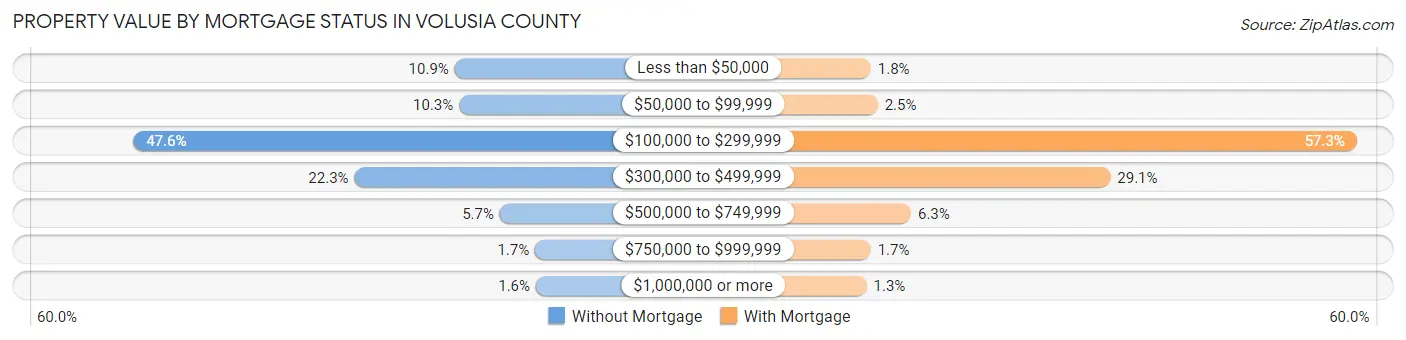
| Property Value | Without Mortgage | With Mortgage |
| Less than $50,000 | 8,187 (10.8%) | 1,613 (1.8%) |
| $50,000 to $99,999 | 7,799 (10.3%) | 2,333 (2.5%) |
| $100,000 to $299,999 | 35,892 (47.6%) | 52,885 (57.3%) |
| $300,000 to $499,999 | 16,829 (22.3%) | 26,887 (29.1%) |
| $500,000 to $749,999 | 4,294 (5.7%) | 5,856 (6.3%) |
| $750,000 to $999,999 | 1,253 (1.7%) | 1,602 (1.7%) |
| $1,000,000 or more | 1,186 (1.6%) | 1,168 (1.3%) |
| Total | 75,440 (100.0%) | 92,344 (100.0%) |
Household Income by Mortgage Status in Volusia County
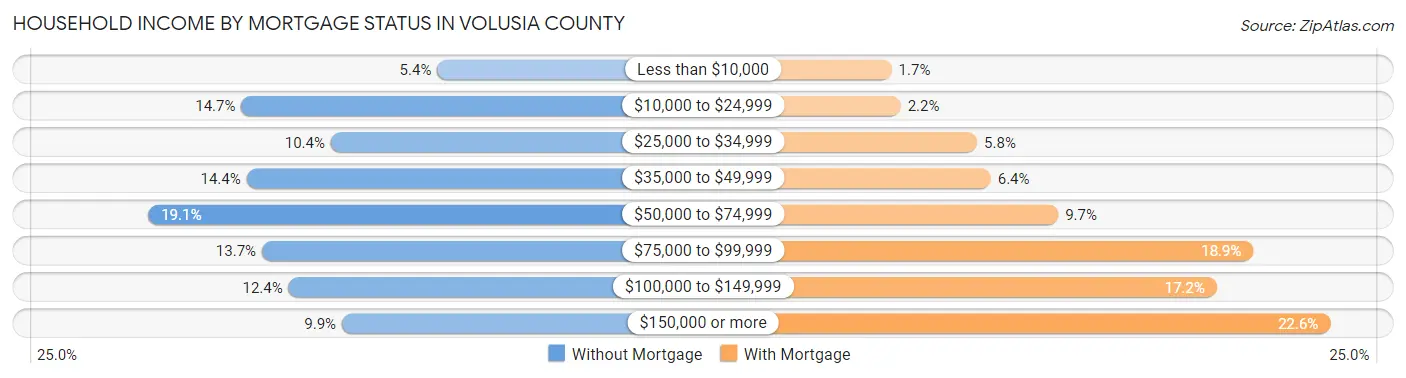
| Household Income | Without Mortgage | With Mortgage |
| Less than $10,000 | 4,035 (5.3%) | 1,587 (1.7%) |
| $10,000 to $24,999 | 11,076 (14.7%) | 1,981 (2.1%) |
| $25,000 to $34,999 | 7,861 (10.4%) | 5,348 (5.8%) |
| $35,000 to $49,999 | 10,883 (14.4%) | 5,946 (6.4%) |
| $50,000 to $74,999 | 14,413 (19.1%) | 8,910 (9.7%) |
| $75,000 to $99,999 | 10,335 (13.7%) | 17,487 (18.9%) |
| $100,000 to $149,999 | 9,379 (12.4%) | 15,881 (17.2%) |
| $150,000 or more | 7,458 (9.9%) | 20,866 (22.6%) |
| Total | 75,440 (100.0%) | 92,344 (100.0%) |
Property Value to Household Income Ratio in Volusia County
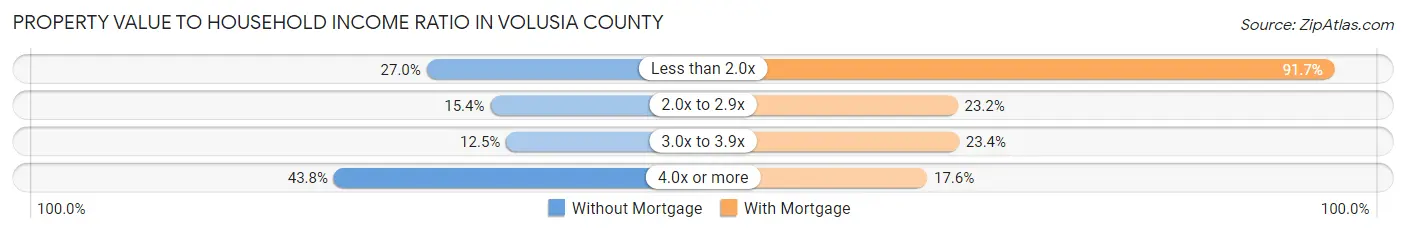
| Value-to-Income Ratio | Without Mortgage | With Mortgage |
| Less than 2.0x | 20,364 (27.0%) | 84,652 (91.7%) |
| 2.0x to 2.9x | 11,634 (15.4%) | 21,402 (23.2%) |
| 3.0x to 3.9x | 9,457 (12.5%) | 21,627 (23.4%) |
| 4.0x or more | 33,070 (43.8%) | 16,294 (17.6%) |
| Total | 75,440 (100.0%) | 92,344 (100.0%) |
Real Estate Taxes by Mortgage Status in Volusia County
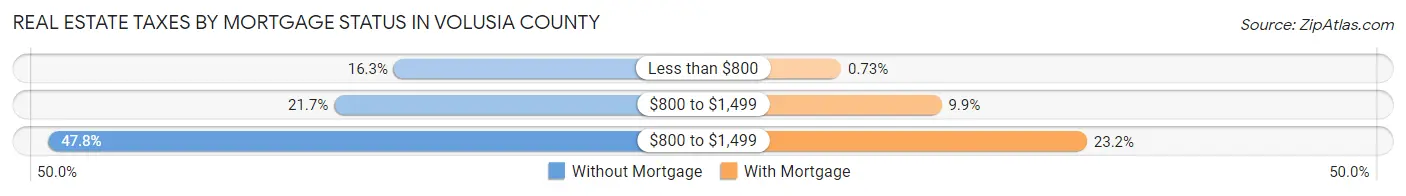
| Property Taxes | Without Mortgage | With Mortgage |
| Less than $800 | 12,280 (16.3%) | 677 (0.7%) |
| $800 to $1,499 | 16,398 (21.7%) | 9,138 (9.9%) |
| $800 to $1,499 | 36,090 (47.8%) | 21,402 (23.2%) |
| Total | 75,440 (100.0%) | 92,344 (100.0%) |
Health & Disability in Volusia County
Health Insurance Coverage by Age in Volusia County
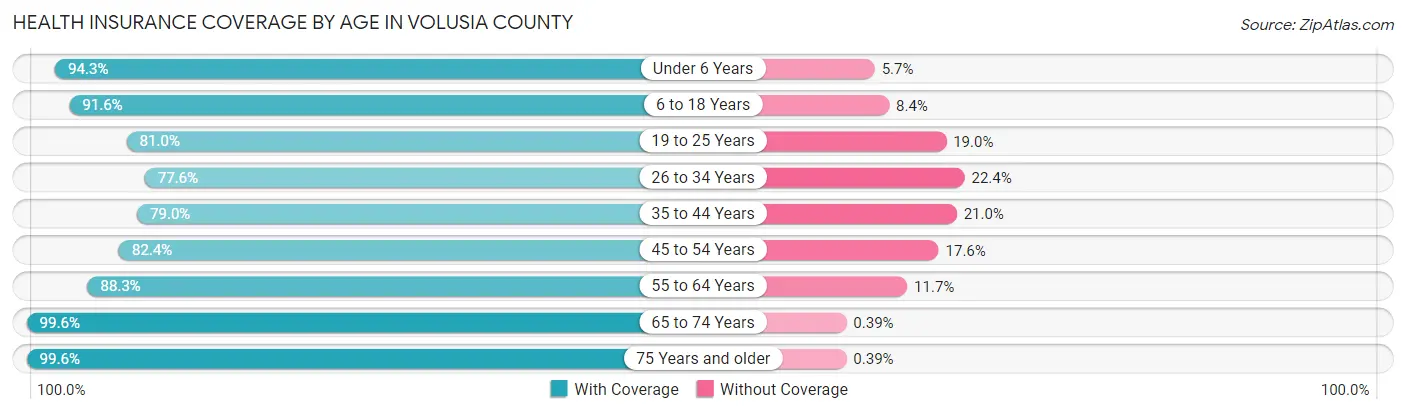
| Age Bracket | With Coverage | Without Coverage |
| Under 6 Years | 28,334 (94.3%) | 1,707 (5.7%) |
| 6 to 18 Years | 68,841 (91.6%) | 6,282 (8.4%) |
| 19 to 25 Years | 35,314 (81.0%) | 8,289 (19.0%) |
| 26 to 34 Years | 45,432 (77.6%) | 13,132 (22.4%) |
| 35 to 44 Years | 46,836 (79.0%) | 12,417 (21.0%) |
| 45 to 54 Years | 53,958 (82.4%) | 11,516 (17.6%) |
| 55 to 64 Years | 74,421 (88.3%) | 9,880 (11.7%) |
| 65 to 74 Years | 76,641 (99.6%) | 302 (0.4%) |
| 75 Years and older | 57,687 (99.6%) | 227 (0.4%) |
| Total | 487,464 (88.4%) | 63,752 (11.6%) |
Health Insurance Coverage by Citizenship Status in Volusia County
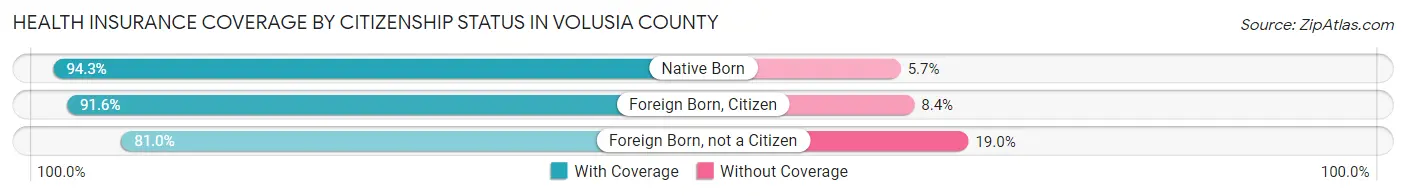
| Citizenship Status | With Coverage | Without Coverage |
| Native Born | 28,334 (94.3%) | 1,707 (5.7%) |
| Foreign Born, Citizen | 68,841 (91.6%) | 6,282 (8.4%) |
| Foreign Born, not a Citizen | 35,314 (81.0%) | 8,289 (19.0%) |
Health Insurance Coverage by Household Income in Volusia County
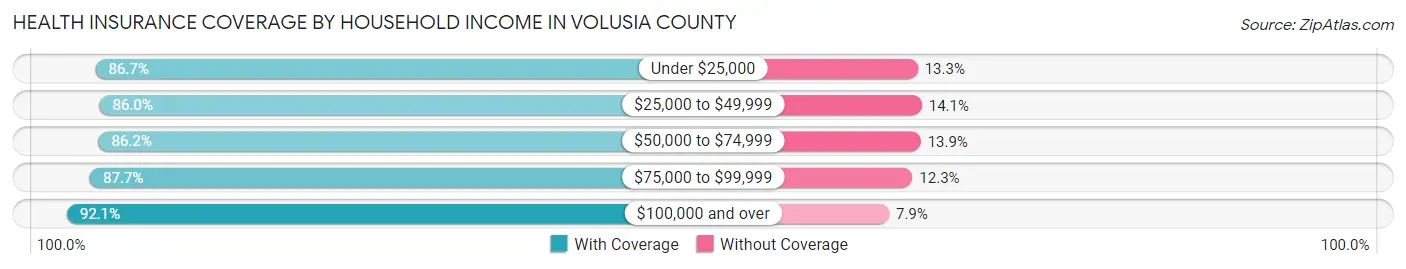
| Household Income | With Coverage | Without Coverage |
| Under $25,000 | 55,010 (86.7%) | 8,433 (13.3%) |
| $25,000 to $49,999 | 87,803 (86.0%) | 14,347 (14.1%) |
| $50,000 to $74,999 | 89,012 (86.2%) | 14,314 (13.9%) |
| $75,000 to $99,999 | 78,915 (87.7%) | 11,058 (12.3%) |
| $100,000 and over | 170,329 (92.1%) | 14,636 (7.9%) |
Public vs Private Health Insurance Coverage by Age in Volusia County
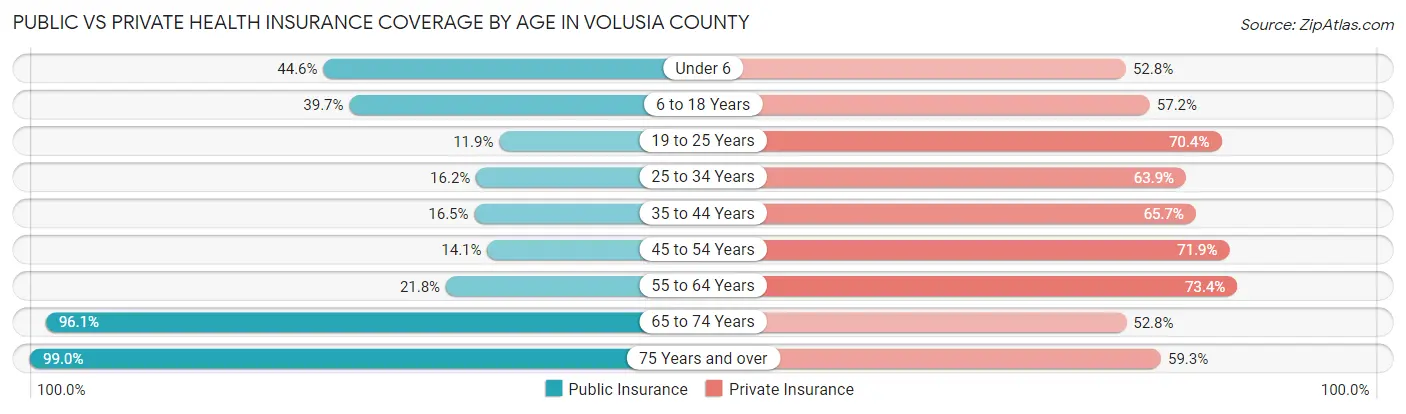
| Age Bracket | Public Insurance | Private Insurance |
| Under 6 | 13,382 (44.6%) | 15,848 (52.7%) |
| 6 to 18 Years | 29,838 (39.7%) | 42,955 (57.2%) |
| 19 to 25 Years | 5,187 (11.9%) | 30,705 (70.4%) |
| 25 to 34 Years | 9,473 (16.2%) | 37,406 (63.9%) |
| 35 to 44 Years | 9,788 (16.5%) | 38,920 (65.7%) |
| 45 to 54 Years | 9,230 (14.1%) | 47,096 (71.9%) |
| 55 to 64 Years | 18,368 (21.8%) | 61,867 (73.4%) |
| 65 to 74 Years | 73,927 (96.1%) | 40,631 (52.8%) |
| 75 Years and over | 57,315 (99.0%) | 34,318 (59.3%) |
| Total | 226,508 (41.1%) | 349,746 (63.4%) |
Disability Status by Sex by Age in Volusia County
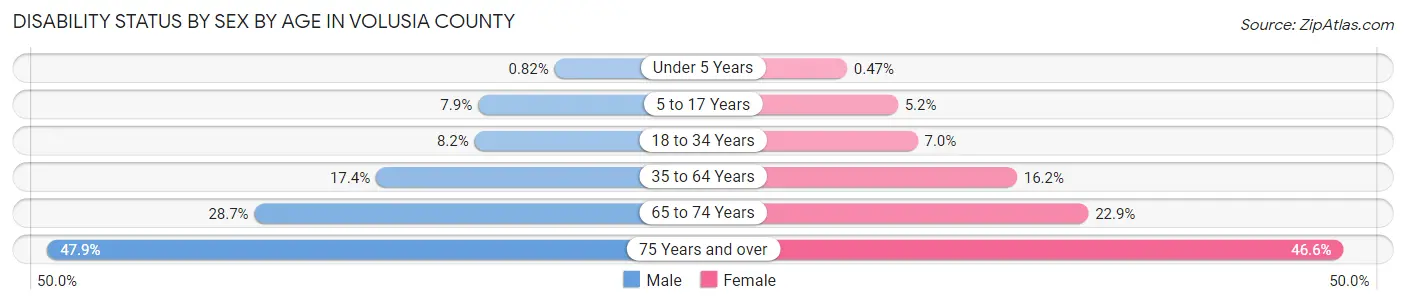
| Age Bracket | Male | Female |
| Under 5 Years | 104 (0.8%) | 58 (0.5%) |
| 5 to 17 Years | 2,926 (7.9%) | 1,833 (5.2%) |
| 18 to 34 Years | 4,655 (8.2%) | 3,756 (7.0%) |
| 35 to 64 Years | 17,659 (17.4%) | 17,458 (16.2%) |
| 65 to 74 Years | 10,475 (28.7%) | 9,239 (22.9%) |
| 75 Years and over | 12,242 (47.9%) | 15,063 (46.6%) |
Disability Class by Sex by Age in Volusia County
Disability Class: Hearing Difficulty
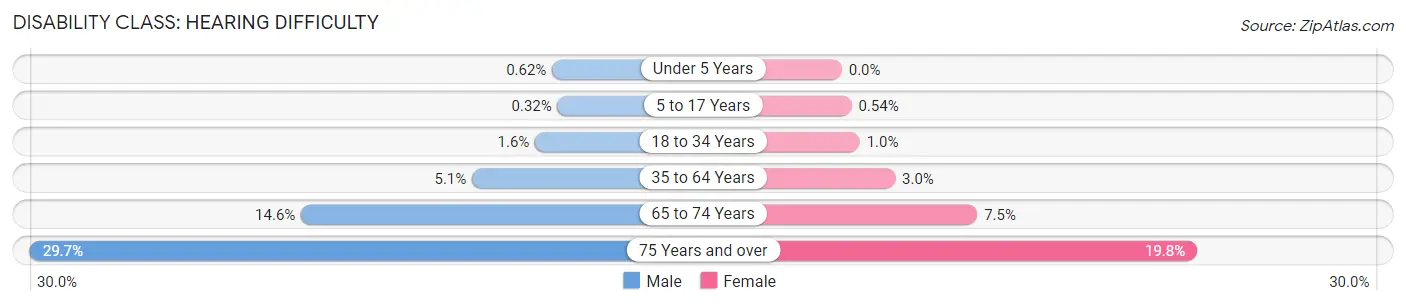
| Age Bracket | Male | Female |
| Under 5 Years | 79 (0.6%) | 0 (0.0%) |
| 5 to 17 Years | 118 (0.3%) | 192 (0.5%) |
| 18 to 34 Years | 886 (1.6%) | 536 (1.0%) |
| 35 to 64 Years | 5,154 (5.1%) | 3,192 (3.0%) |
| 65 to 74 Years | 5,335 (14.6%) | 3,045 (7.5%) |
| 75 Years and over | 7,593 (29.7%) | 6,399 (19.8%) |
Disability Class: Vision Difficulty
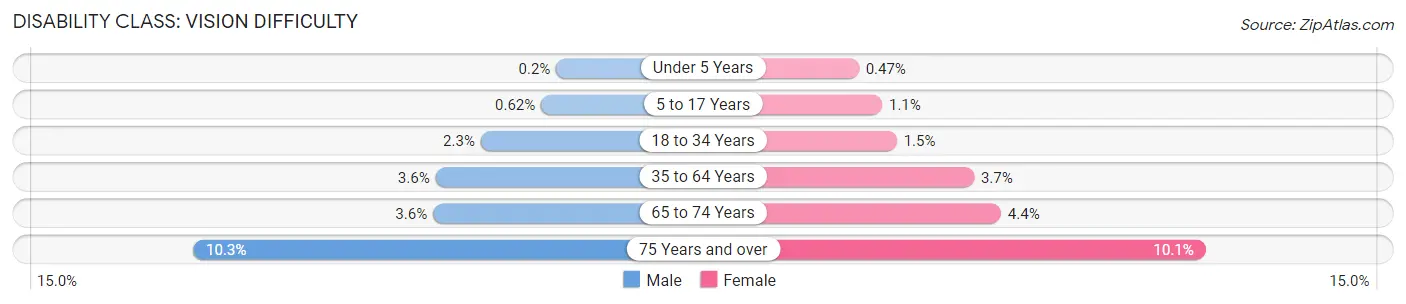
| Age Bracket | Male | Female |
| Under 5 Years | 25 (0.2%) | 58 (0.5%) |
| 5 to 17 Years | 231 (0.6%) | 394 (1.1%) |
| 18 to 34 Years | 1,297 (2.3%) | 816 (1.5%) |
| 35 to 64 Years | 3,619 (3.6%) | 3,954 (3.7%) |
| 65 to 74 Years | 1,327 (3.6%) | 1,791 (4.4%) |
| 75 Years and over | 2,636 (10.3%) | 3,279 (10.1%) |
Disability Class: Cognitive Difficulty
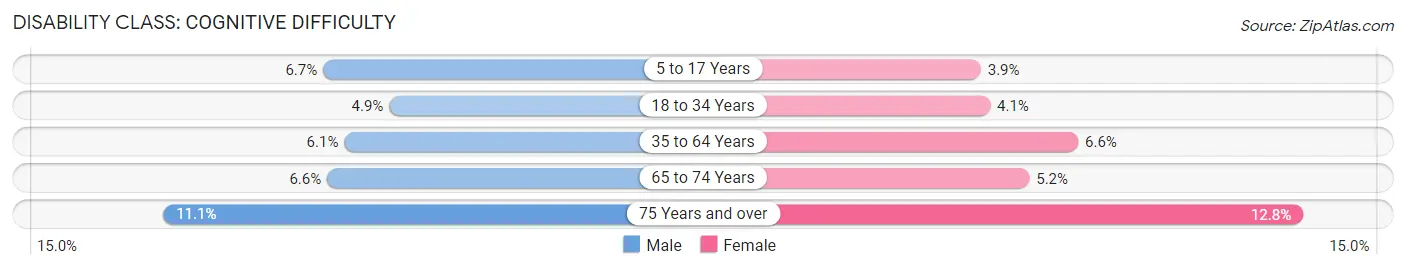
| Age Bracket | Male | Female |
| 5 to 17 Years | 2,474 (6.7%) | 1,367 (3.9%) |
| 18 to 34 Years | 2,736 (4.9%) | 2,210 (4.1%) |
| 35 to 64 Years | 6,199 (6.1%) | 7,067 (6.6%) |
| 65 to 74 Years | 2,403 (6.6%) | 2,110 (5.2%) |
| 75 Years and over | 2,847 (11.1%) | 4,154 (12.8%) |
Disability Class: Ambulatory Difficulty
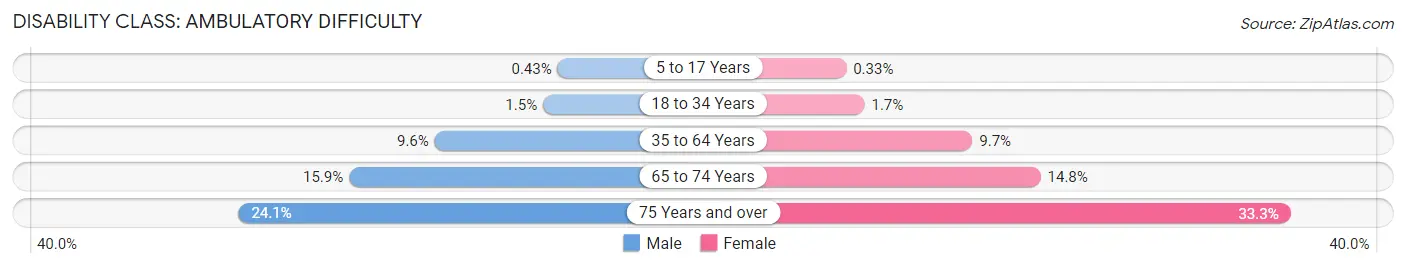
| Age Bracket | Male | Female |
| 5 to 17 Years | 159 (0.4%) | 115 (0.3%) |
| 18 to 34 Years | 850 (1.5%) | 901 (1.7%) |
| 35 to 64 Years | 9,704 (9.6%) | 10,409 (9.7%) |
| 65 to 74 Years | 5,813 (15.9%) | 5,963 (14.8%) |
| 75 Years and over | 6,165 (24.1%) | 10,780 (33.3%) |
Disability Class: Self-Care Difficulty
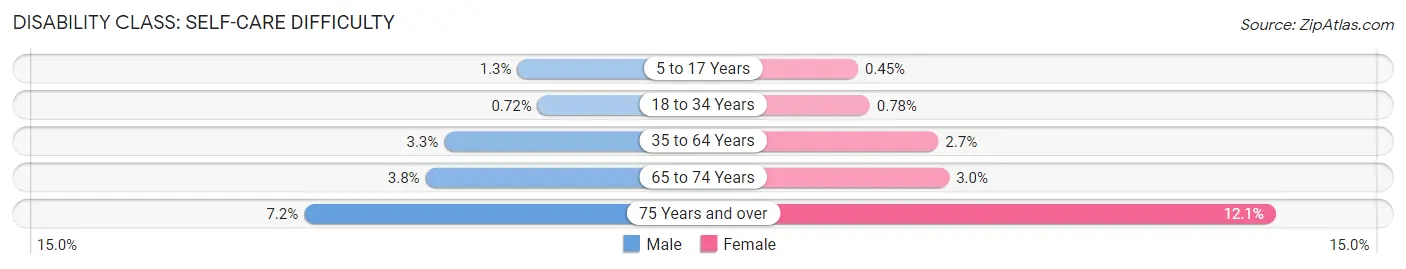
| Age Bracket | Male | Female |
| 5 to 17 Years | 472 (1.3%) | 159 (0.4%) |
| 18 to 34 Years | 407 (0.7%) | 418 (0.8%) |
| 35 to 64 Years | 3,376 (3.3%) | 2,895 (2.7%) |
| 65 to 74 Years | 1,404 (3.8%) | 1,207 (3.0%) |
| 75 Years and over | 1,844 (7.2%) | 3,910 (12.1%) |
Technology Access in Volusia County
Computing Device Access in Volusia County
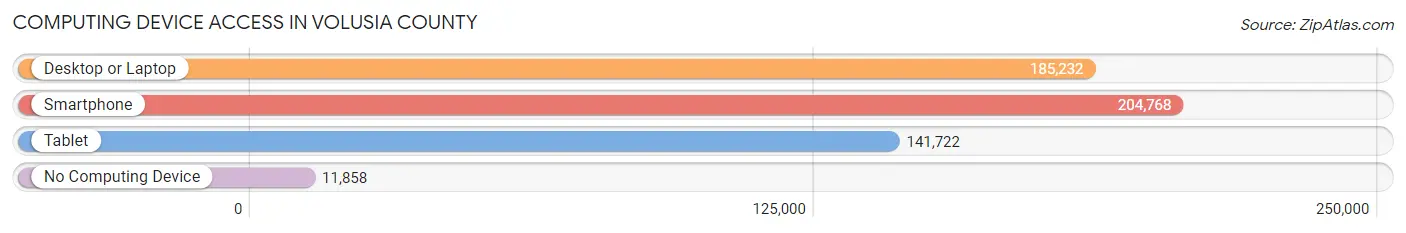
| Device Type | # Households | % Households |
| Desktop or Laptop | 185,232 | 79.6% |
| Smartphone | 204,768 | 88.0% |
| Tablet | 141,722 | 60.9% |
| No Computing Device | 11,858 | 5.1% |
| Total | 232,673 | 100.0% |
Internet Access in Volusia County
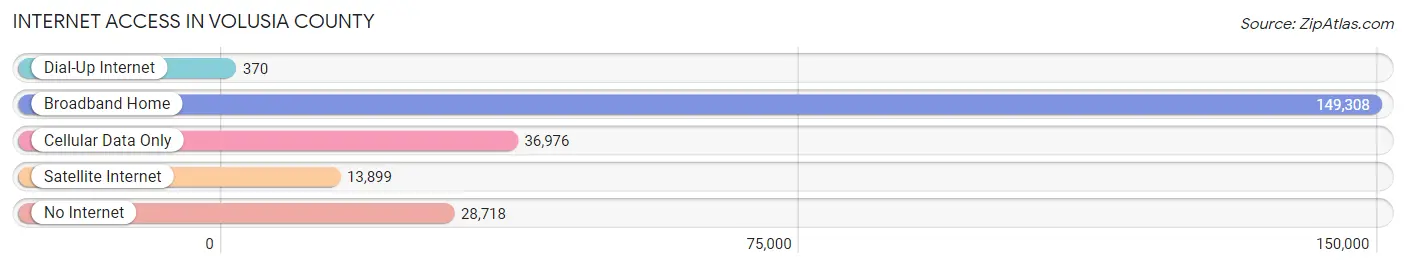
| Internet Type | # Households | % Households |
| Dial-Up Internet | 370 | 0.2% |
| Broadband Home | 149,308 | 64.2% |
| Cellular Data Only | 36,976 | 15.9% |
| Satellite Internet | 13,899 | 6.0% |
| No Internet | 28,718 | 12.3% |
| Total | 232,673 | 100.0% |
Volusia County Summary
Volusia County, Florida is located in the east-central part of the state, along the Atlantic Coast. It is bordered by Flagler, Putnam, and Brevard counties to the north, Seminole County to the west, and the Atlantic Ocean to the east. The county seat is DeLand, and the largest city is Daytona Beach. The county is home to a population of approximately 517,000 people, making it the sixth most populous county in Florida.
History
Volusia County was created in 1854 from a portion of Mosquito County, which was later renamed Orange County. The county was named after the Volusia tribe, a Native American tribe that lived in the area. The county was originally part of the St. Johns River region, and was home to many Seminole and Creek Indians.
In the late 19th century, the county began to develop as a tourist destination, with the establishment of the Daytona Beach Hotel in 1876. The hotel was the first of its kind in the area, and it attracted many visitors from the North. The area also became known for its automobile racing, with the first Daytona Beach Road Course being established in 1903.
In the early 20th century, the county experienced a population boom, with the establishment of many new towns and cities. The county was also home to a large number of citrus groves, which provided employment for many of the county’s residents.
Geography
Volusia County covers an area of 1,432 square miles, making it the second largest county in Florida. The county is located in the east-central part of the state, along the Atlantic Coast. It is bordered by Flagler, Putnam, and Brevard counties to the north, Seminole County to the west, and the Atlantic Ocean to the east.
The county is divided into two distinct regions: the coastal region and the interior region. The coastal region is characterized by low-lying, sandy beaches and is home to many of the county’s tourist attractions. The interior region is characterized by rolling hills and is home to many of the county’s agricultural areas.
The county is home to several rivers, including the St. Johns River, the Halifax River, and the Tomoka River. The county is also home to several lakes, including Lake George, Lake Monroe, and Lake Ashby.
Economy
Volusia County’s economy is largely driven by tourism, with the county being home to many of Florida’s most popular tourist attractions. The county is home to Daytona International Speedway, the Daytona Beach Boardwalk, and the Daytona Beach Pier. The county is also home to many of Florida’s most popular beaches, including Daytona Beach, New Smyrna Beach, and Ormond Beach.
The county is also home to a large number of manufacturing and technology companies, including Embraer, Lockheed Martin, and Northrop Grumman. The county is also home to a large number of agricultural operations, including citrus groves, cattle ranches, and vegetable farms.
Demographics
As of the 2010 census, Volusia County had a population of 494,593 people. The population was spread out, with 24.3% under the age of 18, 8.7% from 18 to 24, 28.2% from 25 to 44, 24.3% from 45 to 64, and 14.5% who were 65 years of age or older. The median age was 38.2 years.
The racial makeup of the county was 79.2% White, 11.3% African American, 0.5% Native American, 2.2% Asian, 0.1% Pacific Islander, 4.2% from other races, and 2.5% from two or more races. Hispanic or Latino of any race were 11.3% of the population.
The median income for a household in the county was $45,890, and the median income for a family was $54,890. The per capita income for the county was $25,890. About 11.2% of families and 14.7% of the population were below the poverty line, including 20.2% of those under age 18 and 8.2% of those age 65 or over.
Common Questions
What is Per Capita Income in Volusia County?
Per Capita income in Volusia County is $35,364.
What is the Median Family Income in Volusia County?
Median Family Income in Volusia County is $76,486.
What is the Median Household income in Volusia County?
Median Household Income in Volusia County is $63,075.
What is Income or Wage Gap in Volusia County?
Income or Wage Gap in Volusia County is 19.8%.
Women in Volusia County earn 80.2 cents for every dollar earned by a man.
What is Family Income Deficit in Volusia County?
Family Income Deficit in Volusia County is $9,987.
Families that are below poverty line in Volusia County earn $9,987 less on average than the poverty threshold level.
What is Inequality or Gini Index in Volusia County?
Inequality or Gini Index in Volusia County is 0.45.
What is the Total Population of Volusia County?
Total Population of Volusia County is 558,520.
What is the Total Male Population of Volusia County?
Total Male Population of Volusia County is 274,078.
What is the Total Female Population of Volusia County?
Total Female Population of Volusia County is 284,442.
What is the Ratio of Males per 100 Females in Volusia County?
There are 96.36 Males per 100 Females in Volusia County.
What is the Ratio of Females per 100 Males in Volusia County?
There are 103.78 Females per 100 Males in Volusia County.
What is the Median Population Age in Volusia County?
Median Population Age in Volusia County is 46.5 Years.
What is the Average Family Size in Volusia County
Average Family Size in Volusia County is 2.9 People.
What is the Average Household Size in Volusia County
Average Household Size in Volusia County is 2.3 People.
How Large is the Labor Force in Volusia County?
There are 255,678 People in the Labor Forcein in Volusia County.
What is the Percentage of People in the Labor Force in Volusia County?
54.1% of People are in the Labor Force in Volusia County.
What is the Unemployment Rate in Volusia County?
Unemployment Rate in Volusia County is 4.2%.