Clearwater, FL Map & Demographics
Clearwater Map
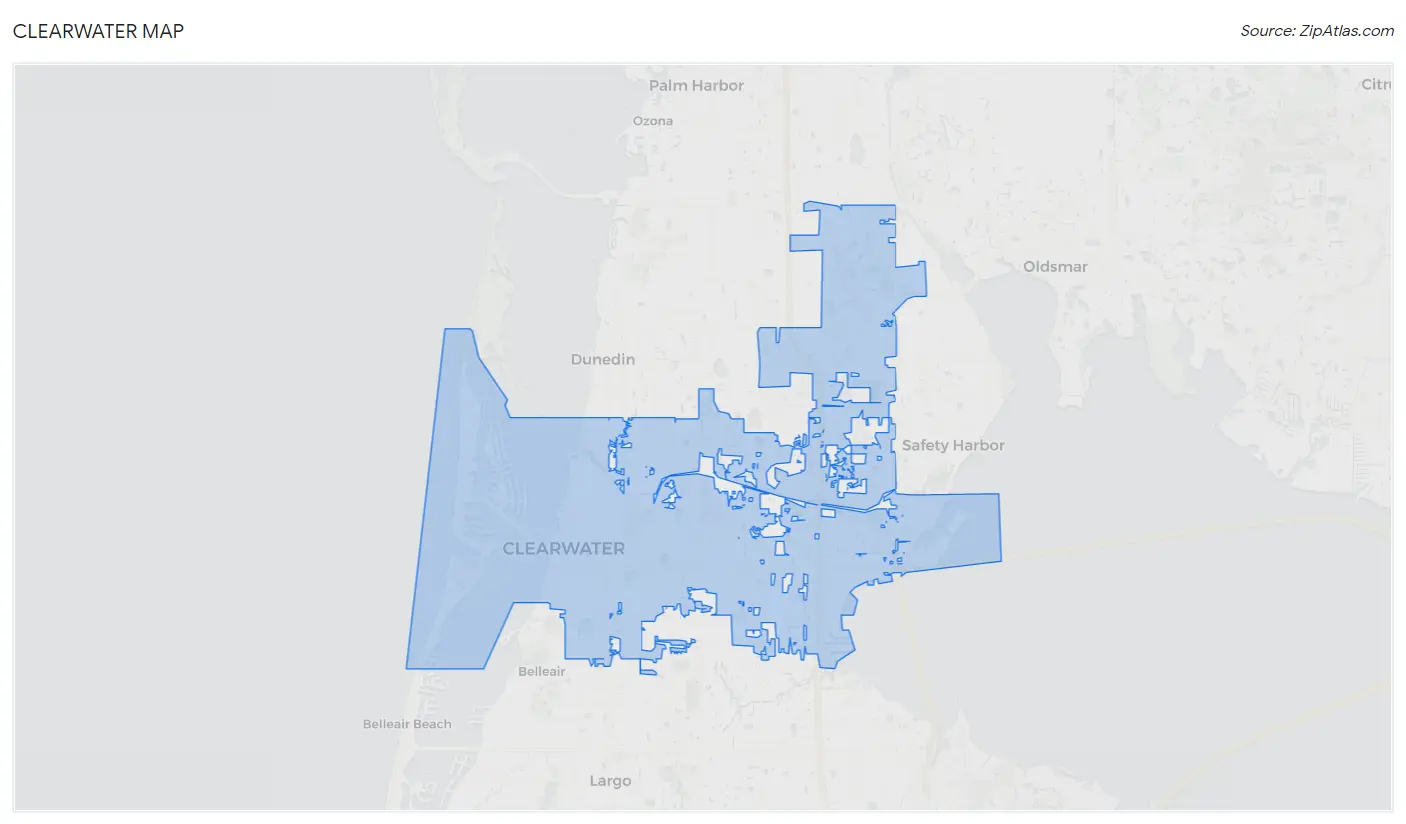
Clearwater Overview
$39,315
PER CAPITA INCOME
$81,820
AVG FAMILY INCOME
$59,358
AVG HOUSEHOLD INCOME
17.2%
WAGE / INCOME GAP [ % ]
82.8¢/ $1
WAGE / INCOME GAP [ $ ]
$11,332
FAMILY INCOME DEFICIT
0.50
INEQUALITY / GINI INDEX
116,984
TOTAL POPULATION
57,947
MALE POPULATION
59,037
FEMALE POPULATION
98.15
MALES / 100 FEMALES
101.88
FEMALES / 100 MALES
46.0
MEDIAN AGE
3.0
AVG FAMILY SIZE
2.3
AVG HOUSEHOLD SIZE
57,861
LABOR FORCE [ PEOPLE ]
58.9%
PERCENT IN LABOR FORCE
4.7%
UNEMPLOYMENT RATE
Income in Clearwater
Income Overview in Clearwater
Per Capita Income in Clearwater is $39,315, while median incomes of families and households are $81,820 and $59,358 respectively.
| Characteristic | Number | Measure |
| Per Capita Income | 116,984 | $39,315 |
| Median Family Income | 27,415 | $81,820 |
| Mean Family Income | 27,415 | $112,386 |
| Median Household Income | 49,592 | $59,358 |
| Mean Household Income | 49,592 | $88,197 |
| Income Deficit | 27,415 | $11,332 |
| Wage / Income Gap (%) | 116,984 | 17.21% |
| Wage / Income Gap ($) | 116,984 | 82.79¢ per $1 |
| Gini / Inequality Index | 116,984 | 0.50 |
Earnings by Sex in Clearwater
Average Earnings in Clearwater are $38,338, $42,851 for men and $35,478 for women, a difference of 17.2%.
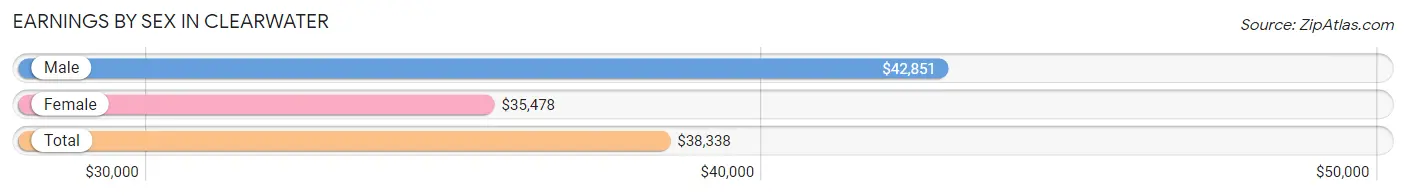
| Sex | Number | Average Earnings |
| Male | 31,307 (52.4%) | $42,851 |
| Female | 28,463 (47.6%) | $35,478 |
| Total | 59,770 (100.0%) | $38,338 |
Earnings by Sex by Income Bracket in Clearwater
The most common earnings brackets in Clearwater are $100,000+ for men (5,314 | 17.0%) and $25,000 to $29,999 for women (2,449 | 8.6%).
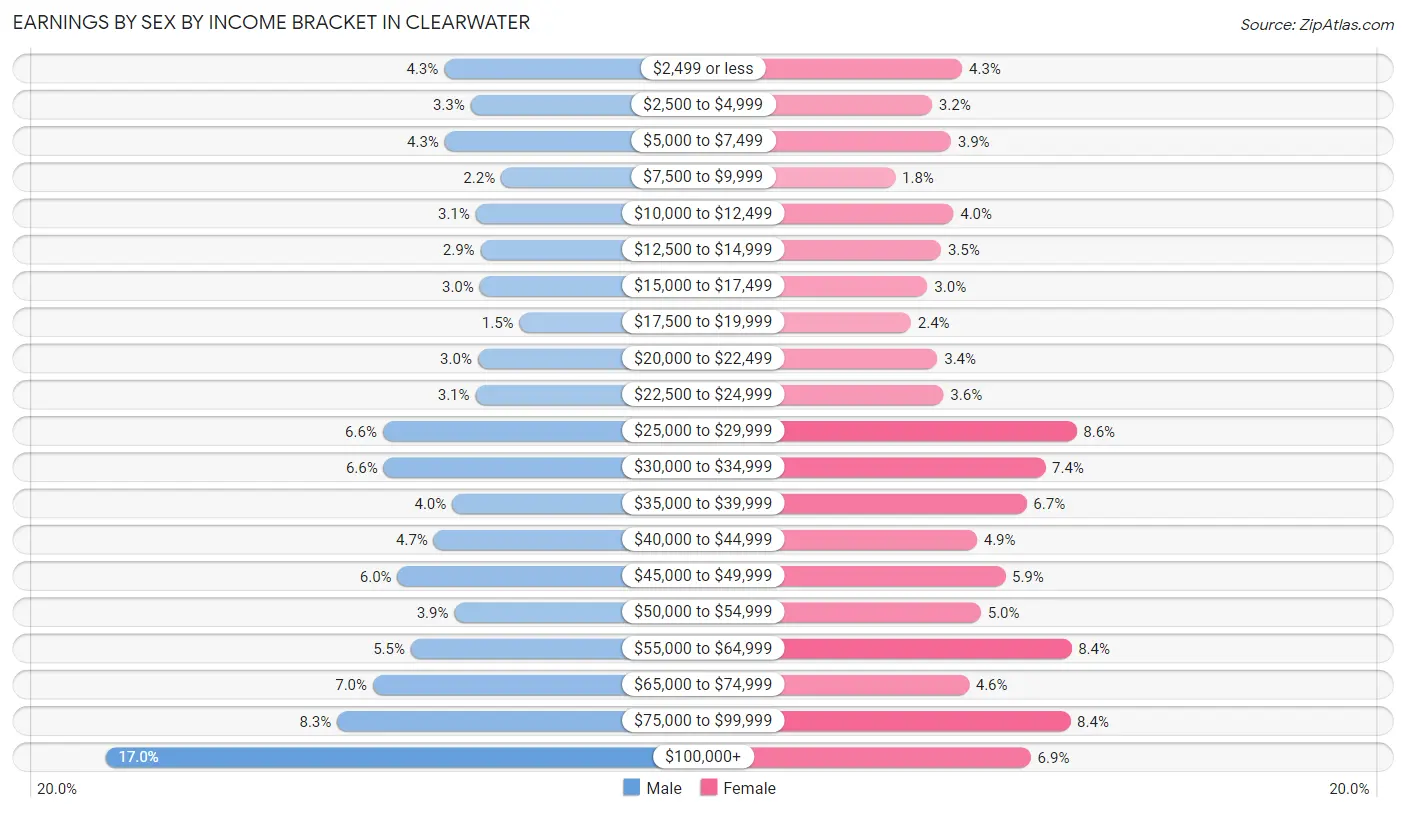
| Income | Male | Female |
| $2,499 or less | 1,340 (4.3%) | 1,230 (4.3%) |
| $2,500 to $4,999 | 1,029 (3.3%) | 909 (3.2%) |
| $5,000 to $7,499 | 1,335 (4.3%) | 1,111 (3.9%) |
| $7,500 to $9,999 | 673 (2.1%) | 514 (1.8%) |
| $10,000 to $12,499 | 969 (3.1%) | 1,135 (4.0%) |
| $12,500 to $14,999 | 913 (2.9%) | 1,005 (3.5%) |
| $15,000 to $17,499 | 922 (2.9%) | 861 (3.0%) |
| $17,500 to $19,999 | 458 (1.5%) | 684 (2.4%) |
| $20,000 to $22,499 | 946 (3.0%) | 965 (3.4%) |
| $22,500 to $24,999 | 975 (3.1%) | 1,030 (3.6%) |
| $25,000 to $29,999 | 2,060 (6.6%) | 2,449 (8.6%) |
| $30,000 to $34,999 | 2,050 (6.6%) | 2,114 (7.4%) |
| $35,000 to $39,999 | 1,247 (4.0%) | 1,915 (6.7%) |
| $40,000 to $44,999 | 1,462 (4.7%) | 1,385 (4.9%) |
| $45,000 to $49,999 | 1,888 (6.0%) | 1,689 (5.9%) |
| $50,000 to $54,999 | 1,222 (3.9%) | 1,429 (5.0%) |
| $55,000 to $64,999 | 1,731 (5.5%) | 2,393 (8.4%) |
| $65,000 to $74,999 | 2,177 (7.0%) | 1,301 (4.6%) |
| $75,000 to $99,999 | 2,596 (8.3%) | 2,383 (8.4%) |
| $100,000+ | 5,314 (17.0%) | 1,961 (6.9%) |
| Total | 31,307 (100.0%) | 28,463 (100.0%) |
Earnings by Sex by Educational Attainment in Clearwater
Average earnings in Clearwater are $46,419 for men and $38,628 for women, a difference of 16.8%. Men with an educational attainment of graduate degree enjoy the highest average annual earnings of $78,640, while those with less than high school education earn the least with $30,254. Women with an educational attainment of graduate degree earn the most with the average annual earnings of $59,693, while those with less than high school education have the smallest earnings of $26,964.
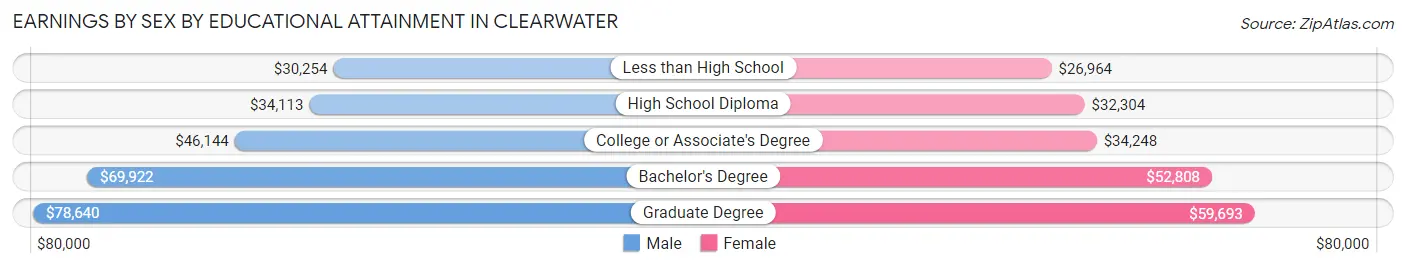
| Educational Attainment | Male Income | Female Income |
| Less than High School | $30,254 | $26,964 |
| High School Diploma | $34,113 | $32,304 |
| College or Associate's Degree | $46,144 | $34,248 |
| Bachelor's Degree | $69,922 | $52,808 |
| Graduate Degree | $78,640 | $59,693 |
| Total | $46,419 | $38,628 |
Family Income in Clearwater
Family Income Brackets in Clearwater
According to the Clearwater family income data, there are 4,798 families falling into the $100,000 to $149,999 income range, which is the most common income bracket and makes up 17.5% of all families. Conversely, the $10,000 to $14,999 income bracket is the least frequent group with only 466 families (1.7%) belonging to this category.
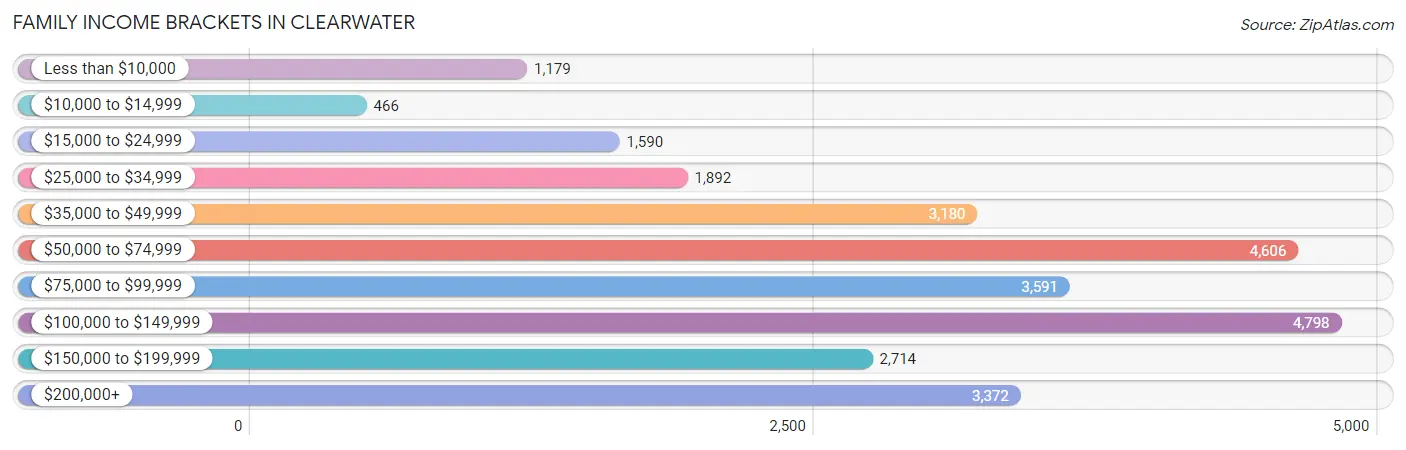
| Income Bracket | # Families | % Families |
| Less than $10,000 | 1,179 | 4.3% |
| $10,000 to $14,999 | 466 | 1.7% |
| $15,000 to $24,999 | 1,590 | 5.8% |
| $25,000 to $34,999 | 1,892 | 6.9% |
| $35,000 to $49,999 | 3,180 | 11.6% |
| $50,000 to $74,999 | 4,606 | 16.8% |
| $75,000 to $99,999 | 3,591 | 13.1% |
| $100,000 to $149,999 | 4,798 | 17.5% |
| $150,000 to $199,999 | 2,714 | 9.9% |
| $200,000+ | 3,372 | 12.3% |
Family Income by Famaliy Size in Clearwater
6-person families (279 | 1.0%) account for the highest median family income in Clearwater with $142,019 per family, while 2-person families (15,794 | 57.6%) have the highest median income of $37,426 per family member.
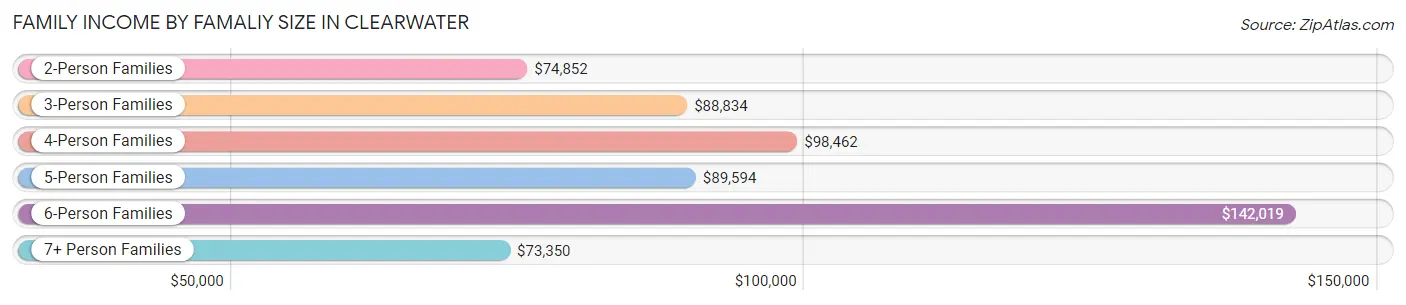
| Income Bracket | # Families | Median Income |
| 2-Person Families | 15,794 (57.6%) | $74,852 |
| 3-Person Families | 5,825 (21.2%) | $88,834 |
| 4-Person Families | 3,736 (13.6%) | $98,462 |
| 5-Person Families | 1,537 (5.6%) | $89,594 |
| 6-Person Families | 279 (1.0%) | $142,019 |
| 7+ Person Families | 244 (0.9%) | $73,350 |
| Total | 27,415 (100.0%) | $81,820 |
Family Income by Number of Earners in Clearwater
The median family income in Clearwater is $81,820, with families comprising 3+ earners (2,286) having the highest median family income of $148,446, while families with no earners (5,454) have the lowest median family income of $44,926, accounting for 8.3% and 19.9% of families, respectively.
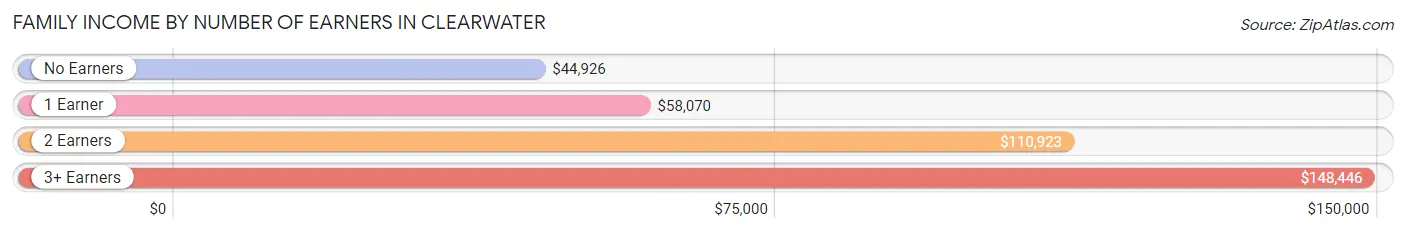
| Number of Earners | # Families | Median Income |
| No Earners | 5,454 (19.9%) | $44,926 |
| 1 Earner | 9,223 (33.6%) | $58,070 |
| 2 Earners | 10,452 (38.1%) | $110,923 |
| 3+ Earners | 2,286 (8.3%) | $148,446 |
| Total | 27,415 (100.0%) | $81,820 |
Household Income in Clearwater
Household Income Brackets in Clearwater
With 8,877 households falling in the category, the $50,000 to $74,999 income range is the most frequent in Clearwater, accounting for 17.9% of all households. In contrast, only 1,934 households (3.9%) fall into the $10,000 to $14,999 income bracket, making it the least populous group.
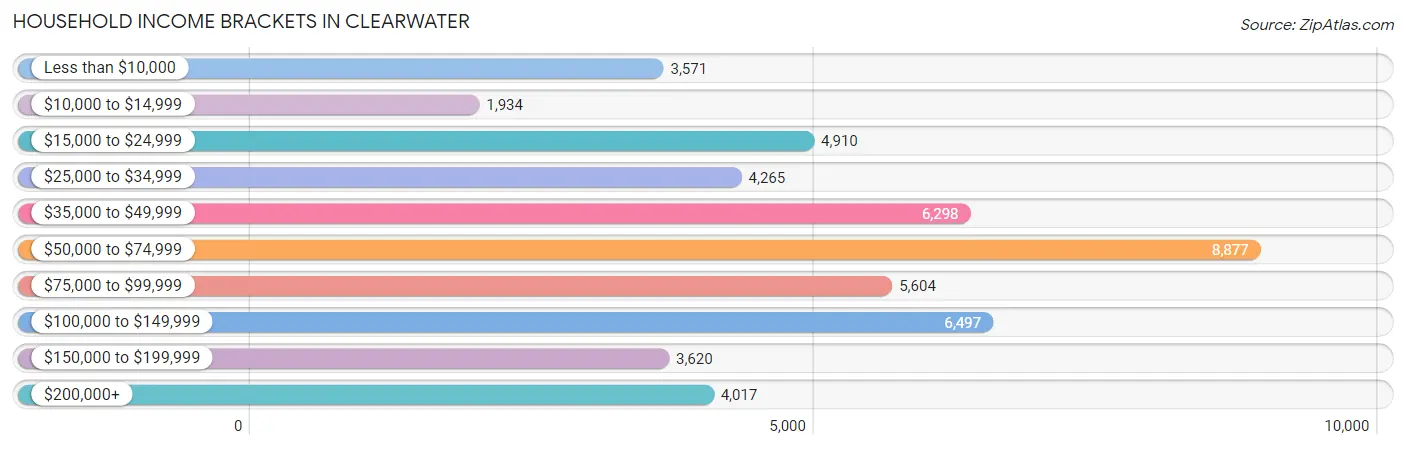
| Income Bracket | # Households | % Households |
| Less than $10,000 | 3,571 | 7.2% |
| $10,000 to $14,999 | 1,934 | 3.9% |
| $15,000 to $24,999 | 4,910 | 9.9% |
| $25,000 to $34,999 | 4,265 | 8.6% |
| $35,000 to $49,999 | 6,298 | 12.7% |
| $50,000 to $74,999 | 8,877 | 17.9% |
| $75,000 to $99,999 | 5,604 | 11.3% |
| $100,000 to $149,999 | 6,497 | 13.1% |
| $150,000 to $199,999 | 3,620 | 7.3% |
| $200,000+ | 4,017 | 8.1% |
Household Income by Householder Age in Clearwater
The median household income in Clearwater is $59,358, with the highest median household income of $74,714 found in the 45 to 64 years age bracket for the primary householder. A total of 18,777 households (37.9%) fall into this category. Meanwhile, the 15 to 24 years age bracket for the primary householder has the lowest median household income of $33,125, with 1,345 households (2.7%) in this group.
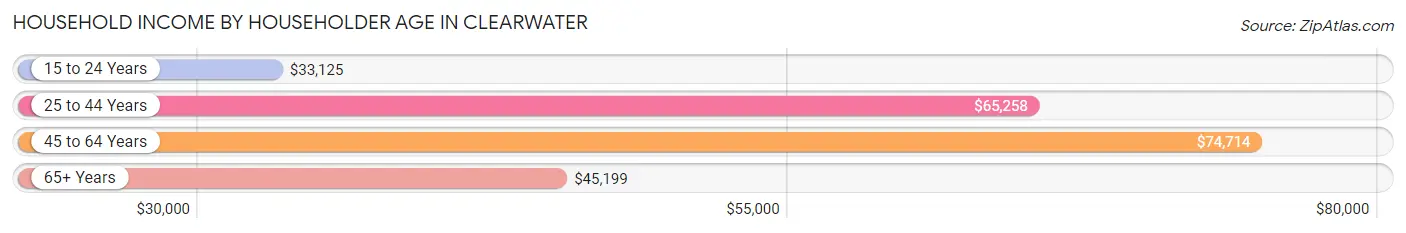
| Income Bracket | # Households | Median Income |
| 15 to 24 Years | 1,345 (2.7%) | $33,125 |
| 25 to 44 Years | 12,932 (26.1%) | $65,258 |
| 45 to 64 Years | 18,777 (37.9%) | $74,714 |
| 65+ Years | 16,538 (33.4%) | $45,199 |
| Total | 49,592 (100.0%) | $59,358 |
Poverty in Clearwater
Income Below Poverty by Sex and Age in Clearwater
With 16.4% poverty level for males and 16.0% for females among the residents of Clearwater, under 5 year old males and 5 year old females are the most vulnerable to poverty, with 765 males (26.0%) and 427 females (54.3%) in their respective age groups living below the poverty level.
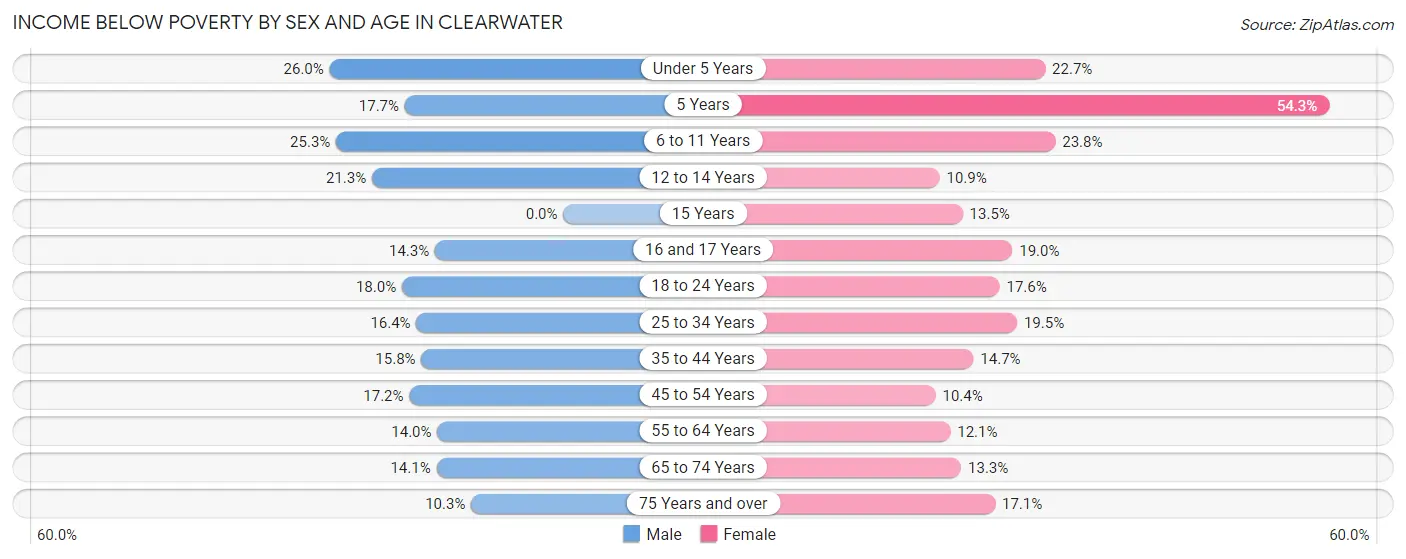
| Age Bracket | Male | Female |
| Under 5 Years | 765 (26.0%) | 573 (22.7%) |
| 5 Years | 90 (17.6%) | 427 (54.3%) |
| 6 to 11 Years | 946 (25.3%) | 812 (23.8%) |
| 12 to 14 Years | 365 (21.3%) | 200 (10.9%) |
| 15 Years | 0 (0.0%) | 72 (13.5%) |
| 16 and 17 Years | 150 (14.3%) | 150 (19.0%) |
| 18 to 24 Years | 789 (18.0%) | 646 (17.6%) |
| 25 to 34 Years | 1,206 (16.4%) | 1,573 (19.5%) |
| 35 to 44 Years | 1,033 (15.8%) | 919 (14.7%) |
| 45 to 54 Years | 1,345 (17.2%) | 793 (10.4%) |
| 55 to 64 Years | 1,172 (14.0%) | 1,015 (12.1%) |
| 65 to 74 Years | 1,007 (14.1%) | 1,000 (13.3%) |
| 75 Years and over | 523 (10.3%) | 1,128 (17.1%) |
| Total | 9,391 (16.4%) | 9,308 (16.0%) |
Income Above Poverty by Sex and Age in Clearwater
According to the poverty statistics in Clearwater, males aged 15 years and females aged 45 to 54 years are the age groups that are most secure financially, with 100.0% of males and 89.6% of females in these age groups living above the poverty line.
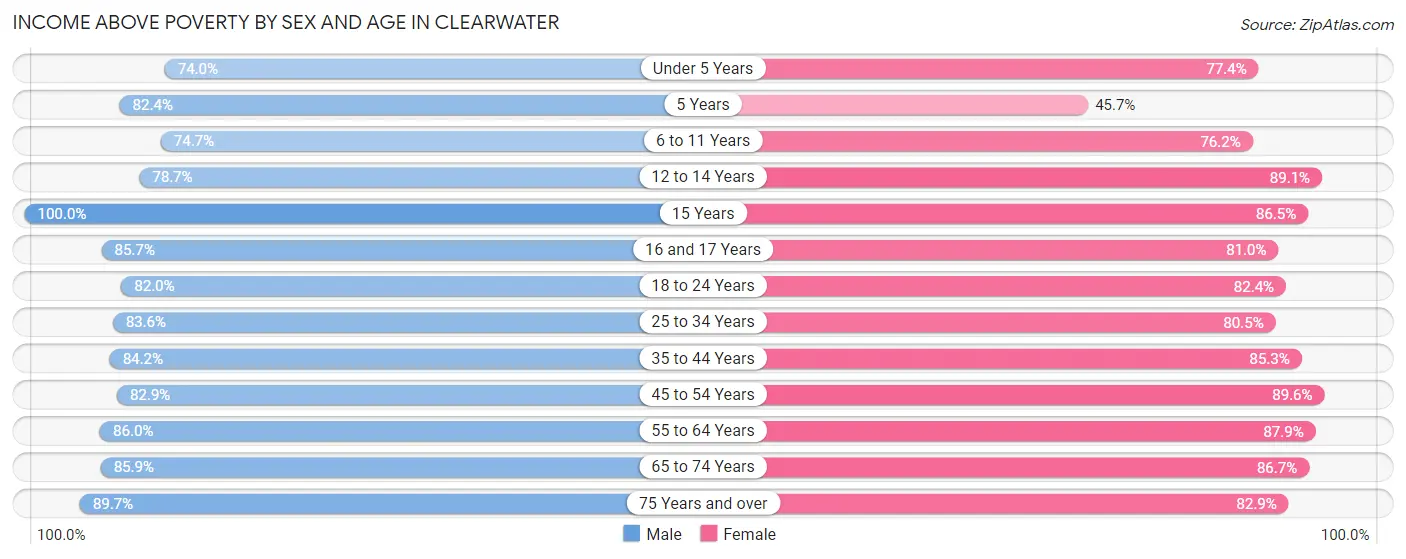
| Age Bracket | Male | Female |
| Under 5 Years | 2,174 (74.0%) | 1,957 (77.3%) |
| 5 Years | 420 (82.4%) | 360 (45.7%) |
| 6 to 11 Years | 2,793 (74.7%) | 2,602 (76.2%) |
| 12 to 14 Years | 1,348 (78.7%) | 1,636 (89.1%) |
| 15 Years | 482 (100.0%) | 463 (86.5%) |
| 16 and 17 Years | 900 (85.7%) | 640 (81.0%) |
| 18 to 24 Years | 3,602 (82.0%) | 3,031 (82.4%) |
| 25 to 34 Years | 6,167 (83.6%) | 6,489 (80.5%) |
| 35 to 44 Years | 5,501 (84.2%) | 5,348 (85.3%) |
| 45 to 54 Years | 6,496 (82.9%) | 6,803 (89.6%) |
| 55 to 64 Years | 7,184 (86.0%) | 7,388 (87.9%) |
| 65 to 74 Years | 6,118 (85.9%) | 6,526 (86.7%) |
| 75 Years and over | 4,575 (89.7%) | 5,480 (82.9%) |
| Total | 47,760 (83.6%) | 48,723 (84.0%) |
Income Below Poverty Among Married-Couple Families in Clearwater
The poverty statistics for married-couple families in Clearwater show that 5.3% or 1,035 of the total 19,339 families live below the poverty line. Families with 3 or 4 children have the highest poverty rate of 7.8%, comprising of 44 families. On the other hand, families with 5 or more children have the lowest poverty rate of 0.0%, which includes 0 families.
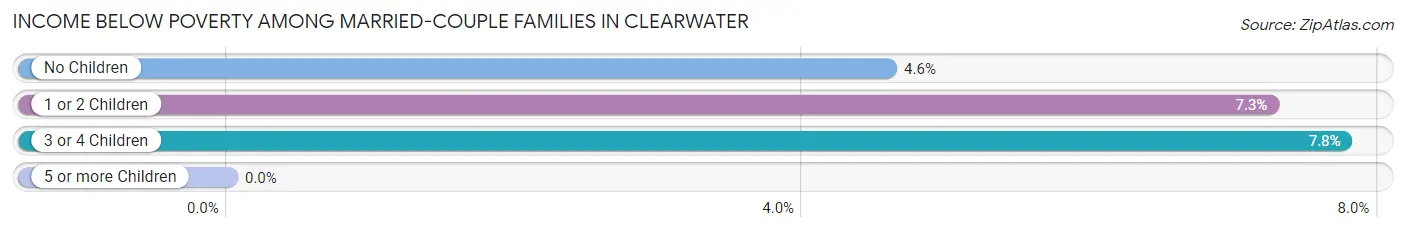
| Children | Above Poverty | Below Poverty |
| No Children | 13,100 (95.4%) | 630 (4.6%) |
| 1 or 2 Children | 4,618 (92.7%) | 361 (7.2%) |
| 3 or 4 Children | 523 (92.2%) | 44 (7.8%) |
| 5 or more Children | 63 (100.0%) | 0 (0.0%) |
| Total | 18,304 (94.7%) | 1,035 (5.3%) |
Income Below Poverty Among Single-Parent Households in Clearwater
According to the poverty data in Clearwater, 16.3% or 380 single-father households and 23.1% or 1,329 single-mother households are living below the poverty line. Among single-father households, those with 1 or 2 children have the highest poverty rate, with 312 households (28.5%) experiencing poverty. Likewise, among single-mother households, those with 3 or 4 children have the highest poverty rate, with 277 households (66.9%) falling below the poverty line.
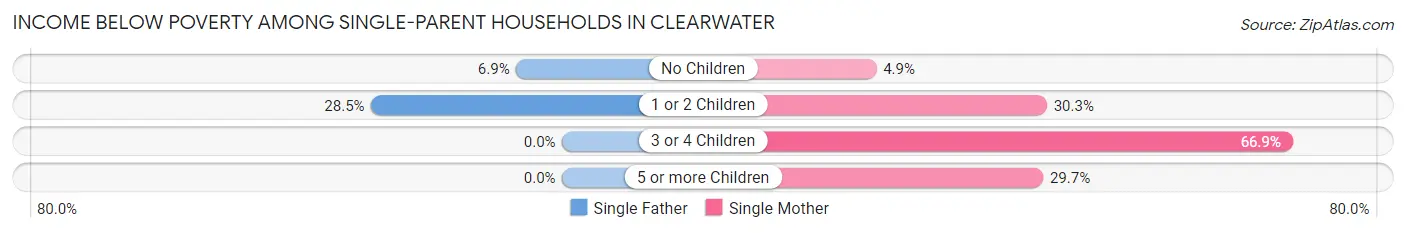
| Children | Single Father | Single Mother |
| No Children | 68 (6.9%) | 107 (4.9%) |
| 1 or 2 Children | 312 (28.5%) | 915 (30.3%) |
| 3 or 4 Children | 0 (0.0%) | 277 (66.9%) |
| 5 or more Children | 0 (0.0%) | 30 (29.7%) |
| Total | 380 (16.3%) | 1,329 (23.1%) |
Income Below Poverty Among Married-Couple vs Single-Parent Households in Clearwater
The poverty data for Clearwater shows that 1,035 of the married-couple family households (5.3%) and 1,709 of the single-parent households (21.2%) are living below the poverty level. Within the married-couple family households, those with 3 or 4 children have the highest poverty rate, with 44 households (7.8%) falling below the poverty line. Among the single-parent households, those with 3 or 4 children have the highest poverty rate, with 277 household (42.2%) living below poverty.
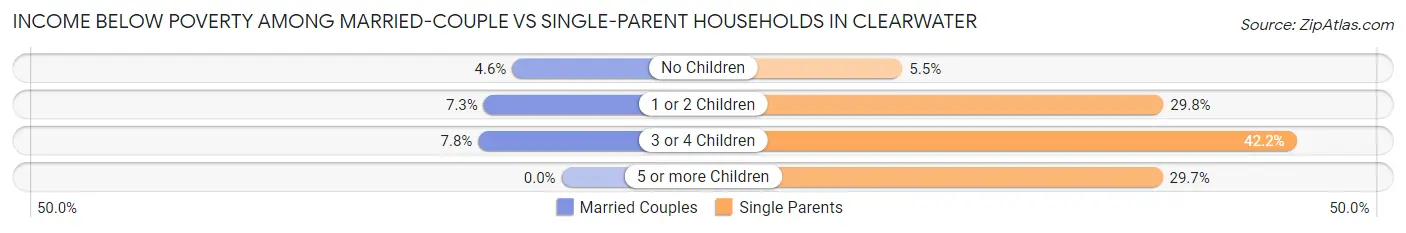
| Children | Married-Couple Families | Single-Parent Households |
| No Children | 630 (4.6%) | 175 (5.5%) |
| 1 or 2 Children | 361 (7.2%) | 1,227 (29.8%) |
| 3 or 4 Children | 44 (7.8%) | 277 (42.2%) |
| 5 or more Children | 0 (0.0%) | 30 (29.7%) |
| Total | 1,035 (5.3%) | 1,709 (21.2%) |
Race in Clearwater
The most populous races in Clearwater are White / Caucasian (84,915 | 72.6%), Hispanic or Latino (19,629 | 16.8%), and Black / African American (13,213 | 11.3%).
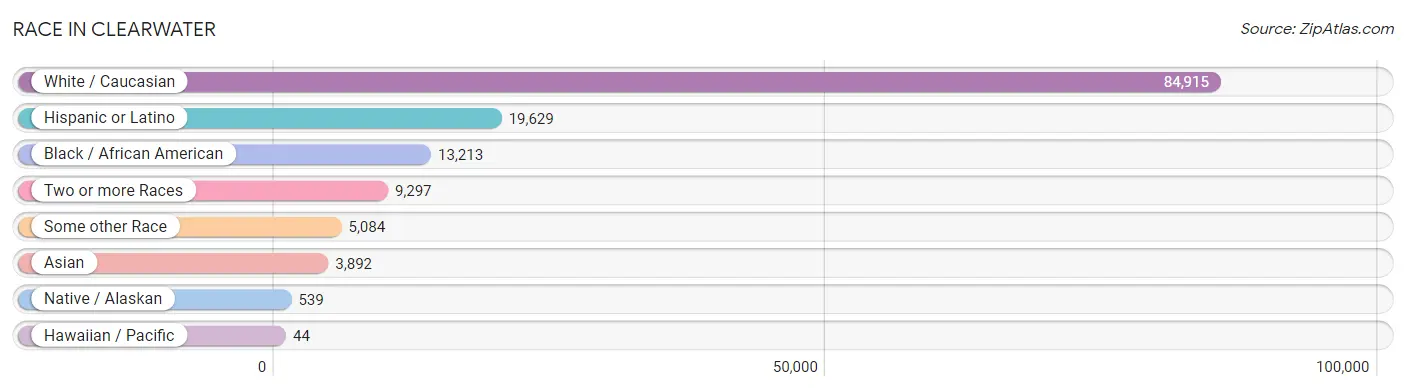
| Race | # Population | % Population |
| Asian | 3,892 | 3.3% |
| Black / African American | 13,213 | 11.3% |
| Hawaiian / Pacific | 44 | 0.0% |
| Hispanic or Latino | 19,629 | 16.8% |
| Native / Alaskan | 539 | 0.5% |
| White / Caucasian | 84,915 | 72.6% |
| Two or more Races | 9,297 | 8.0% |
| Some other Race | 5,084 | 4.3% |
| Total | 116,984 | 100.0% |
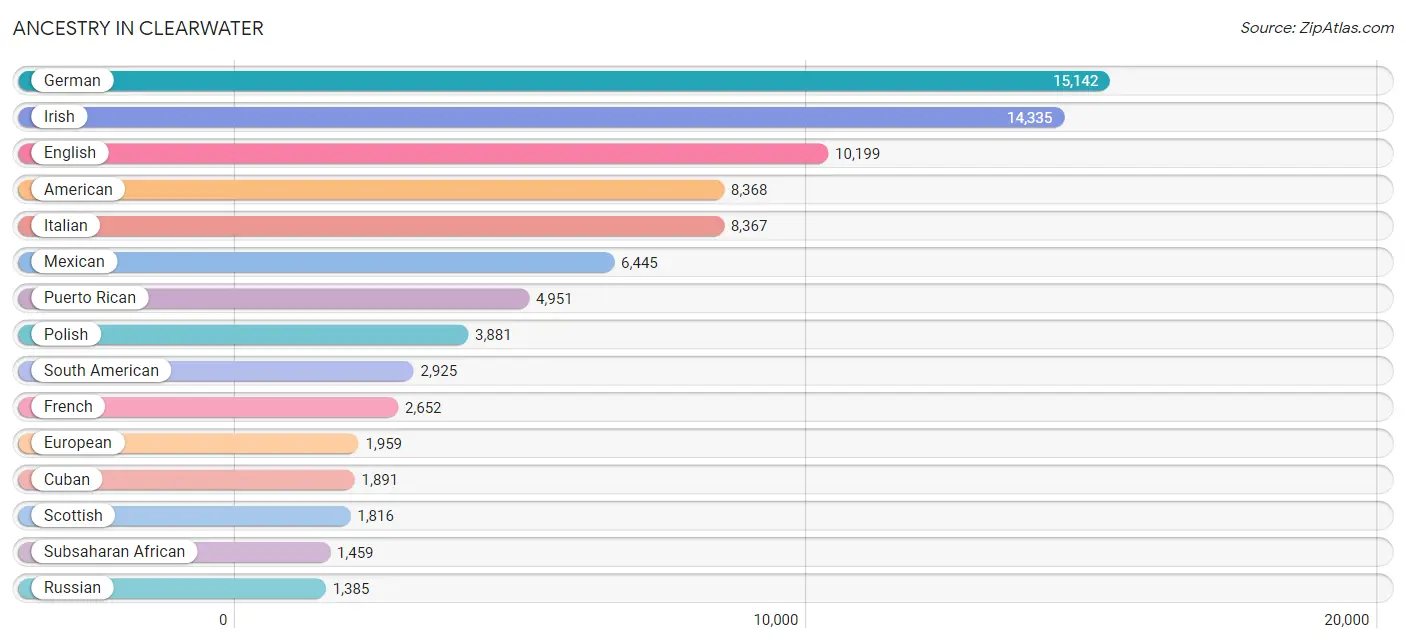
Ancestry in Clearwater
The most populous ancestries reported in Clearwater are German (15,142 | 12.9%), Irish (14,335 | 12.2%), English (10,199 | 8.7%), American (8,368 | 7.1%), and Italian (8,367 | 7.1%), together accounting for 48.2% of all Clearwater residents.
| Ancestry | # Population | % Population |
| African | 1,051 | 0.9% |
| Albanian | 887 | 0.8% |
| American | 8,368 | 7.1% |
| Apache | 5 | 0.0% |
| Arab | 1,157 | 1.0% |
| Argentinean | 93 | 0.1% |
| Armenian | 51 | 0.0% |
| Assyrian / Chaldean / Syriac | 17 | 0.0% |
| Australian | 408 | 0.4% |
| Austrian | 222 | 0.2% |
| Bahamian | 19 | 0.0% |
| Bangladeshi | 171 | 0.2% |
| Barbadian | 8 | 0.0% |
| Belgian | 90 | 0.1% |
| Bhutanese | 133 | 0.1% |
| Blackfeet | 19 | 0.0% |
| Bolivian | 113 | 0.1% |
| Brazilian | 353 | 0.3% |
| British | 1,030 | 0.9% |
| Bulgarian | 122 | 0.1% |
| Burmese | 146 | 0.1% |
| Cajun | 10 | 0.0% |
| Canadian | 540 | 0.5% |
| Cape Verdean | 26 | 0.0% |
| Carpatho Rusyn | 30 | 0.0% |
| Celtic | 30 | 0.0% |
| Central American | 1,338 | 1.1% |
| Central American Indian | 352 | 0.3% |
| Cherokee | 187 | 0.2% |
| Chilean | 87 | 0.1% |
| Chippewa | 12 | 0.0% |
| Choctaw | 35 | 0.0% |
| Colombian | 919 | 0.8% |
| Costa Rican | 46 | 0.0% |
| Croatian | 244 | 0.2% |
| Cuban | 1,891 | 1.6% |
| Czech | 834 | 0.7% |
| Czechoslovakian | 293 | 0.3% |
| Danish | 241 | 0.2% |
| Dominican | 461 | 0.4% |
| Dutch | 1,090 | 0.9% |
| Dutch West Indian | 80 | 0.1% |
| Eastern European | 328 | 0.3% |
| Ecuadorian | 417 | 0.4% |
| Egyptian | 361 | 0.3% |
| English | 10,199 | 8.7% |
| European | 1,959 | 1.7% |
| Filipino | 21 | 0.0% |
| Finnish | 147 | 0.1% |
| French | 2,652 | 2.3% |
| French Canadian | 682 | 0.6% |
| German | 15,142 | 12.9% |
| German Russian | 8 | 0.0% |
| Ghanaian | 43 | 0.0% |
| Greek | 1,191 | 1.0% |
| Guamanian / Chamorro | 190 | 0.2% |
| Guatemalan | 351 | 0.3% |
| Guyanese | 42 | 0.0% |
| Haitian | 546 | 0.5% |
| Honduran | 51 | 0.0% |
| Hungarian | 584 | 0.5% |
| Icelander | 10 | 0.0% |
| Indian (Asian) | 543 | 0.5% |
| Iranian | 152 | 0.1% |
| Iraqi | 329 | 0.3% |
| Irish | 14,335 | 12.2% |
| Iroquois | 15 | 0.0% |
| Israeli | 60 | 0.1% |
| Italian | 8,367 | 7.1% |
| Jamaican | 980 | 0.8% |
| Japanese | 48 | 0.0% |
| Jordanian | 9 | 0.0% |
| Korean | 1,022 | 0.9% |
| Latvian | 7 | 0.0% |
| Lebanese | 238 | 0.2% |
| Lithuanian | 361 | 0.3% |
| Macedonian | 51 | 0.0% |
| Malaysian | 227 | 0.2% |
| Mexican | 6,445 | 5.5% |
| Mexican American Indian | 253 | 0.2% |
| Mongolian | 14 | 0.0% |
| Moroccan | 37 | 0.0% |
| Native Hawaiian | 59 | 0.1% |
| New Zealander | 74 | 0.1% |
| Nicaraguan | 218 | 0.2% |
| Nigerian | 264 | 0.2% |
| Northern European | 109 | 0.1% |
| Norwegian | 718 | 0.6% |
| Pakistani | 131 | 0.1% |
| Palestinian | 98 | 0.1% |
| Panamanian | 53 | 0.1% |
| Pennsylvania German | 70 | 0.1% |
| Peruvian | 206 | 0.2% |
| Polish | 3,881 | 3.3% |
| Portuguese | 481 | 0.4% |
| Puerto Rican | 4,951 | 4.2% |
| Romanian | 267 | 0.2% |
| Russian | 1,385 | 1.2% |
| Salvadoran | 541 | 0.5% |
| Samoan | 83 | 0.1% |
| Scandinavian | 290 | 0.3% |
| Scotch-Irish | 1,115 | 0.9% |
| Scottish | 1,816 | 1.5% |
| Seminole | 15 | 0.0% |
| Serbian | 258 | 0.2% |
| Slavic | 182 | 0.2% |
| Slovak | 167 | 0.1% |
| Slovene | 41 | 0.0% |
| South African | 68 | 0.1% |
| South American | 2,925 | 2.5% |
| South American Indian | 13 | 0.0% |
| Spaniard | 196 | 0.2% |
| Spanish | 112 | 0.1% |
| Sri Lankan | 866 | 0.7% |
| Subsaharan African | 1,459 | 1.3% |
| Swedish | 906 | 0.8% |
| Swiss | 508 | 0.4% |
| Syrian | 83 | 0.1% |
| Thai | 1,123 | 1.0% |
| Tongan | 21 | 0.0% |
| Trinidadian and Tobagonian | 35 | 0.0% |
| Turkish | 49 | 0.0% |
| Ukrainian | 497 | 0.4% |
| Venezuelan | 1,090 | 0.9% |
| Welsh | 984 | 0.8% |
| West Indian | 39 | 0.0% |
| Yugoslavian | 407 | 0.4% | View All 127 Rows |
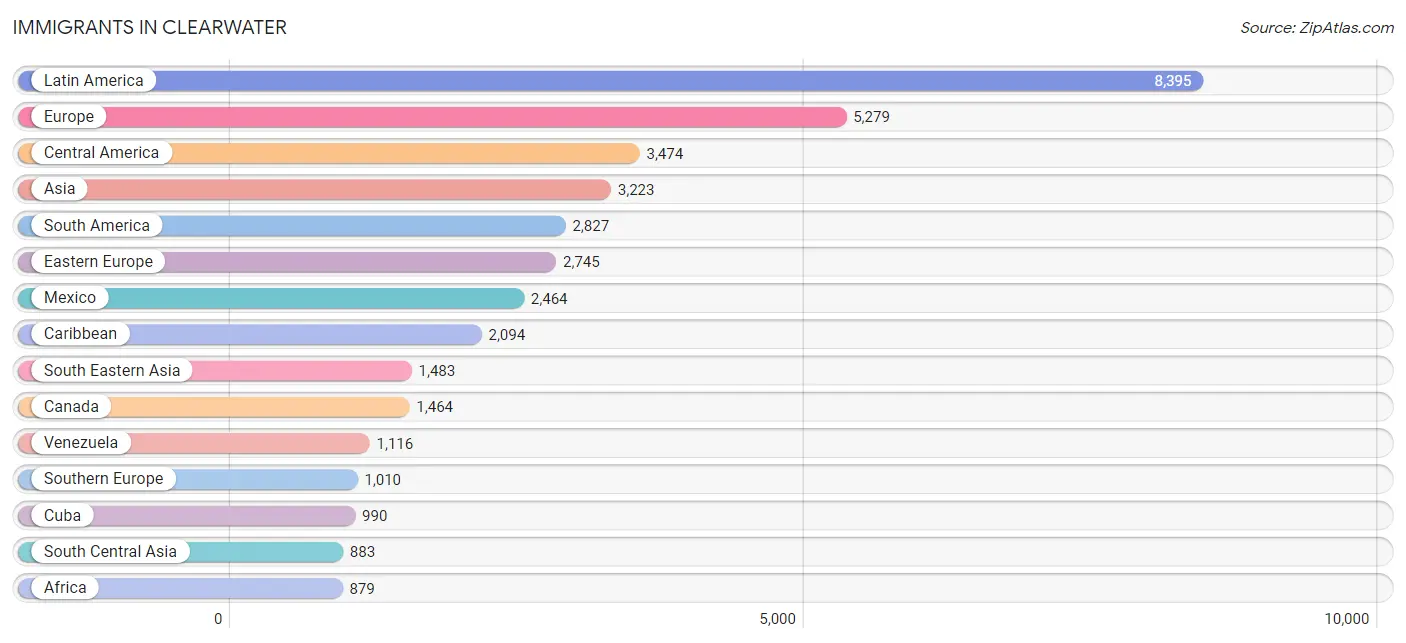
Immigrants in Clearwater
The most numerous immigrant groups reported in Clearwater came from Latin America (8,395 | 7.2%), Europe (5,279 | 4.5%), Central America (3,474 | 3.0%), Asia (3,223 | 2.8%), and South America (2,827 | 2.4%), together accounting for 19.8% of all Clearwater residents.
| Immigration Origin | # Population | % Population |
| Africa | 879 | 0.7% |
| Albania | 607 | 0.5% |
| Argentina | 100 | 0.1% |
| Asia | 3,223 | 2.8% |
| Australia | 530 | 0.4% |
| Austria | 10 | 0.0% |
| Bahamas | 39 | 0.0% |
| Bangladesh | 12 | 0.0% |
| Barbados | 8 | 0.0% |
| Belarus | 21 | 0.0% |
| Belgium | 29 | 0.0% |
| Bolivia | 104 | 0.1% |
| Bosnia and Herzegovina | 331 | 0.3% |
| Brazil | 549 | 0.5% |
| Bulgaria | 60 | 0.1% |
| Cambodia | 33 | 0.0% |
| Canada | 1,464 | 1.3% |
| Caribbean | 2,094 | 1.8% |
| Central America | 3,474 | 3.0% |
| Chile | 71 | 0.1% |
| China | 144 | 0.1% |
| Colombia | 564 | 0.5% |
| Costa Rica | 46 | 0.0% |
| Croatia | 58 | 0.1% |
| Cuba | 990 | 0.9% |
| Czechoslovakia | 30 | 0.0% |
| Dominica | 35 | 0.0% |
| Dominican Republic | 375 | 0.3% |
| Eastern Africa | 60 | 0.1% |
| Eastern Asia | 238 | 0.2% |
| Eastern Europe | 2,745 | 2.4% |
| Ecuador | 150 | 0.1% |
| Egypt | 343 | 0.3% |
| El Salvador | 482 | 0.4% |
| England | 233 | 0.2% |
| Europe | 5,279 | 4.5% |
| France | 45 | 0.0% |
| Germany | 516 | 0.4% |
| Ghana | 83 | 0.1% |
| Greece | 441 | 0.4% |
| Guatemala | 255 | 0.2% |
| Haiti | 128 | 0.1% |
| Hungary | 88 | 0.1% |
| India | 699 | 0.6% |
| Iran | 147 | 0.1% |
| Iraq | 286 | 0.2% |
| Ireland | 13 | 0.0% |
| Israel | 49 | 0.0% |
| Italy | 477 | 0.4% |
| Jamaica | 450 | 0.4% |
| Japan | 29 | 0.0% |
| Kazakhstan | 11 | 0.0% |
| Kenya | 45 | 0.0% |
| Korea | 65 | 0.1% |
| Laos | 66 | 0.1% |
| Latin America | 8,395 | 7.2% |
| Latvia | 7 | 0.0% |
| Lebanon | 99 | 0.1% |
| Lithuania | 6 | 0.0% |
| Malaysia | 134 | 0.1% |
| Mexico | 2,464 | 2.1% |
| Morocco | 23 | 0.0% |
| Netherlands | 47 | 0.0% |
| Nicaragua | 180 | 0.2% |
| Nigeria | 179 | 0.2% |
| North Macedonia | 24 | 0.0% |
| Northern Africa | 366 | 0.3% |
| Northern Europe | 803 | 0.7% |
| Oceania | 564 | 0.5% |
| Panama | 47 | 0.0% |
| Peru | 173 | 0.2% |
| Philippines | 729 | 0.6% |
| Poland | 705 | 0.6% |
| Portugal | 8 | 0.0% |
| Romania | 50 | 0.0% |
| Russia | 123 | 0.1% |
| Scotland | 135 | 0.1% |
| Senegal | 13 | 0.0% |
| Serbia | 69 | 0.1% |
| Singapore | 13 | 0.0% |
| South Africa | 176 | 0.2% |
| South America | 2,827 | 2.4% |
| South Central Asia | 883 | 0.7% |
| South Eastern Asia | 1,483 | 1.3% |
| Southern Europe | 1,010 | 0.9% |
| Spain | 70 | 0.1% |
| Sri Lanka | 14 | 0.0% |
| Sweden | 22 | 0.0% |
| Switzerland | 74 | 0.1% |
| Syria | 9 | 0.0% |
| Taiwan | 26 | 0.0% |
| Thailand | 58 | 0.1% |
| Trinidad and Tobago | 51 | 0.0% |
| Turkey | 142 | 0.1% |
| Ukraine | 269 | 0.2% |
| Venezuela | 1,116 | 0.9% |
| Vietnam | 450 | 0.4% |
| West Indies | 14 | 0.0% |
| Western Africa | 277 | 0.2% |
| Western Asia | 619 | 0.5% |
| Western Europe | 721 | 0.6% | View All 101 Rows |
Sex and Age in Clearwater
Sex and Age in Clearwater
The most populous age groups in Clearwater are 55 to 59 Years (4,346 | 7.5%) for men and 55 to 59 Years (4,776 | 8.1%) for women.
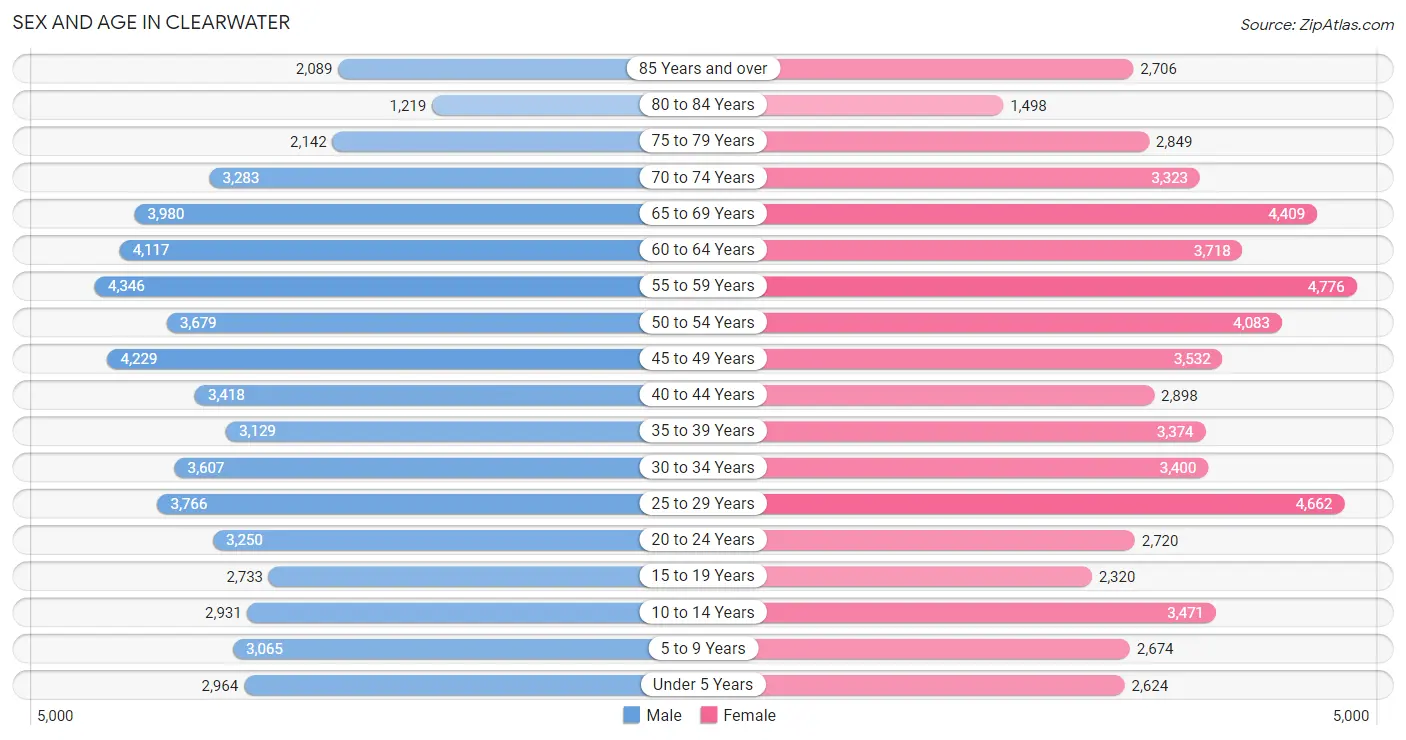
| Age Bracket | Male | Female |
| Under 5 Years | 2,964 (5.1%) | 2,624 (4.4%) |
| 5 to 9 Years | 3,065 (5.3%) | 2,674 (4.5%) |
| 10 to 14 Years | 2,931 (5.1%) | 3,471 (5.9%) |
| 15 to 19 Years | 2,733 (4.7%) | 2,320 (3.9%) |
| 20 to 24 Years | 3,250 (5.6%) | 2,720 (4.6%) |
| 25 to 29 Years | 3,766 (6.5%) | 4,662 (7.9%) |
| 30 to 34 Years | 3,607 (6.2%) | 3,400 (5.8%) |
| 35 to 39 Years | 3,129 (5.4%) | 3,374 (5.7%) |
| 40 to 44 Years | 3,418 (5.9%) | 2,898 (4.9%) |
| 45 to 49 Years | 4,229 (7.3%) | 3,532 (6.0%) |
| 50 to 54 Years | 3,679 (6.4%) | 4,083 (6.9%) |
| 55 to 59 Years | 4,346 (7.5%) | 4,776 (8.1%) |
| 60 to 64 Years | 4,117 (7.1%) | 3,718 (6.3%) |
| 65 to 69 Years | 3,980 (6.9%) | 4,409 (7.5%) |
| 70 to 74 Years | 3,283 (5.7%) | 3,323 (5.6%) |
| 75 to 79 Years | 2,142 (3.7%) | 2,849 (4.8%) |
| 80 to 84 Years | 1,219 (2.1%) | 1,498 (2.5%) |
| 85 Years and over | 2,089 (3.6%) | 2,706 (4.6%) |
| Total | 57,947 (100.0%) | 59,037 (100.0%) |
Families and Households in Clearwater
Median Family Size in Clearwater
The median family size in Clearwater is 3.03 persons per family, with single female/mother families (5,744 | 20.9%) accounting for the largest median family size of 3.54 persons per family. On the other hand, married-couple families (19,339 | 70.5%) represent the smallest median family size with 2.88 persons per family.
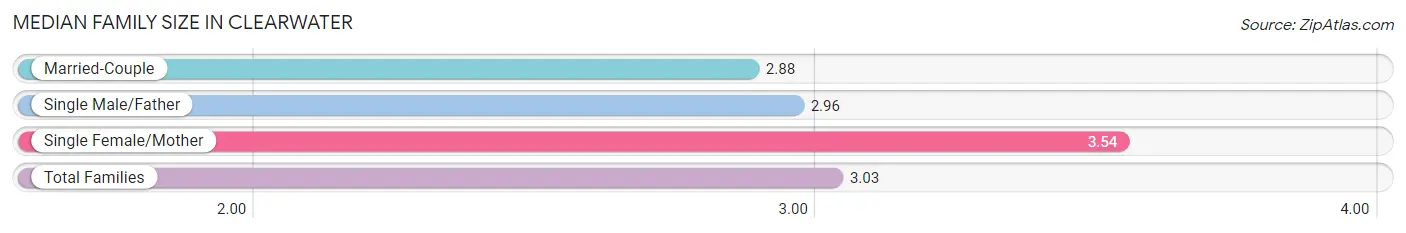
| Family Type | # Families | Family Size |
| Married-Couple | 19,339 (70.5%) | 2.88 |
| Single Male/Father | 2,332 (8.5%) | 2.96 |
| Single Female/Mother | 5,744 (20.9%) | 3.54 |
| Total Families | 27,415 (100.0%) | 3.03 |
Median Household Size in Clearwater
The median household size in Clearwater is 2.28 persons per household, with single female/mother households (5,744 | 11.6%) accounting for the largest median household size of 3.78 persons per household. non-family households (22,177 | 44.7%) represent the smallest median household size with 1.25 persons per household.
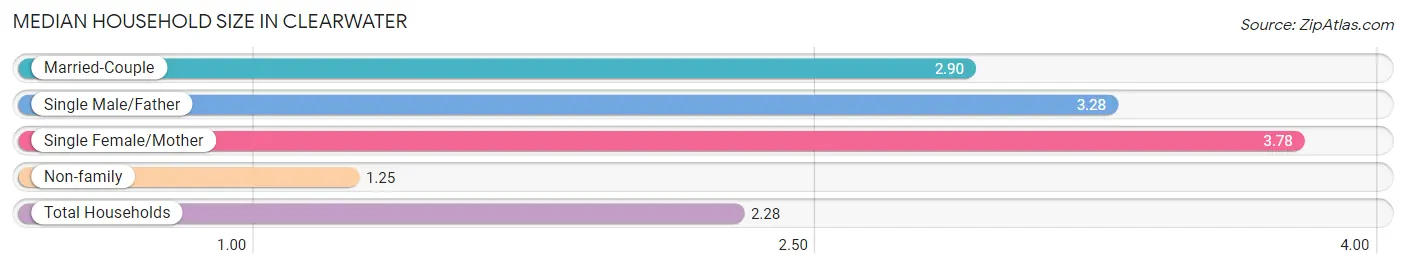
| Household Type | # Households | Household Size |
| Married-Couple | 19,339 (39.0%) | 2.90 |
| Single Male/Father | 2,332 (4.7%) | 3.28 |
| Single Female/Mother | 5,744 (11.6%) | 3.78 |
| Non-family | 22,177 (44.7%) | 1.25 |
| Total Households | 49,592 (100.0%) | 2.28 |
Household Size by Marriage Status in Clearwater
Out of a total of 49,592 households in Clearwater, 27,415 (55.3%) are family households, while 22,177 (44.7%) are nonfamily households. The most numerous type of family households are 2-person households, comprising 14,927, and the most common type of nonfamily households are 1-person households, comprising 18,015.
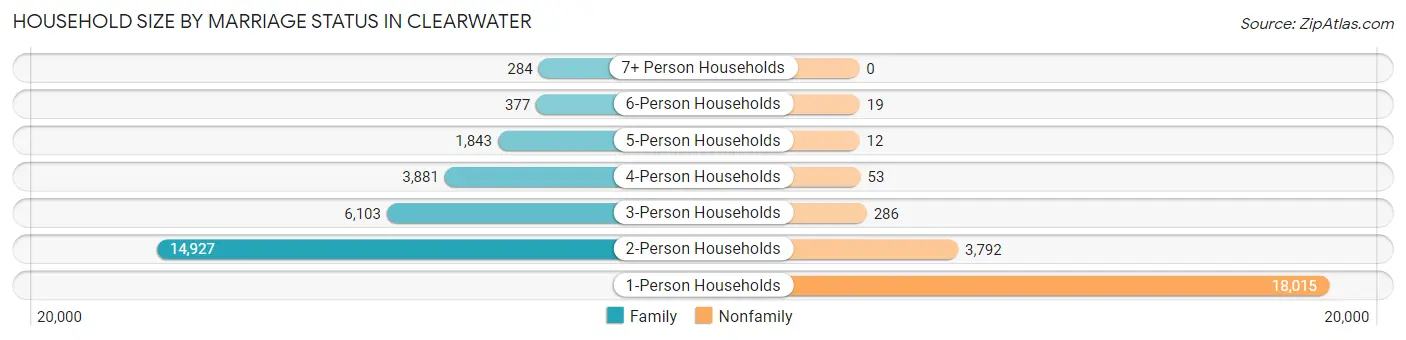
| Household Size | Family Households | Nonfamily Households |
| 1-Person Households | - | 18,015 (36.3%) |
| 2-Person Households | 14,927 (30.1%) | 3,792 (7.6%) |
| 3-Person Households | 6,103 (12.3%) | 286 (0.6%) |
| 4-Person Households | 3,881 (7.8%) | 53 (0.1%) |
| 5-Person Households | 1,843 (3.7%) | 12 (0.0%) |
| 6-Person Households | 377 (0.8%) | 19 (0.0%) |
| 7+ Person Households | 284 (0.6%) | 0 (0.0%) |
| Total | 27,415 (55.3%) | 22,177 (44.7%) |
Female Fertility in Clearwater
Fertility by Age in Clearwater
Average fertility rate in Clearwater is 41.0 births per 1,000 women. Women in the age bracket of 20 to 34 years have the highest fertility rate with 64.0 births per 1,000 women. Women in the age bracket of 20 to 34 years acount for 71.4% of all women with births.
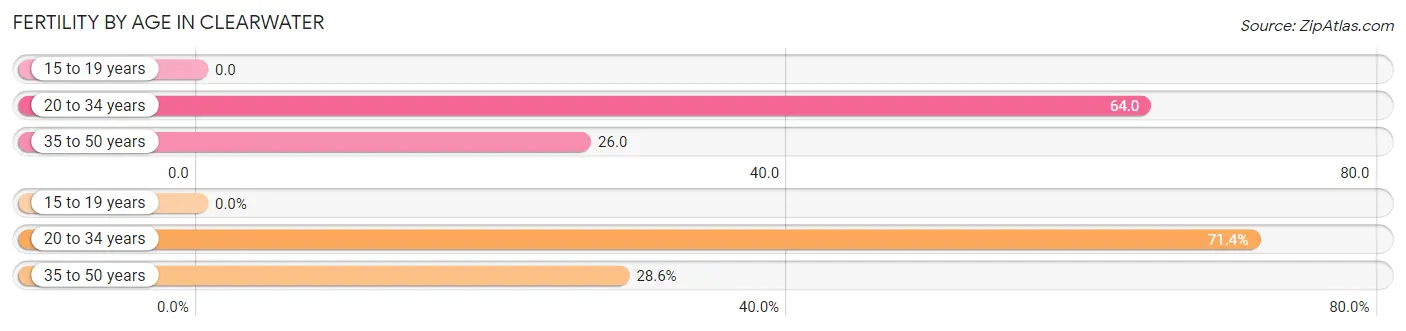
| Age Bracket | Women with Births | Births / 1,000 Women |
| 15 to 19 years | 0 (0.0%) | 0.0 |
| 20 to 34 years | 689 (71.4%) | 64.0 |
| 35 to 50 years | 276 (28.6%) | 26.0 |
| Total | 965 (100.0%) | 41.0 |
Fertility by Age by Marriage Status in Clearwater
45.3% of women with births (965) in Clearwater are married. The highest percentage of unmarried women with births falls into 20 to 34 years age bracket with 65.9% of them unmarried at the time of birth, while the lowest percentage of unmarried women with births belong to 35 to 50 years age bracket with 26.8% of them unmarried.
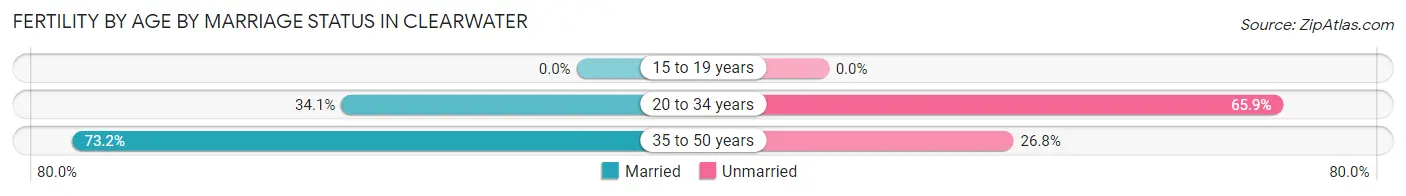
| Age Bracket | Married | Unmarried |
| 15 to 19 years | 0 (0.0%) | 0 (0.0%) |
| 20 to 34 years | 235 (34.1%) | 454 (65.9%) |
| 35 to 50 years | 202 (73.2%) | 74 (26.8%) |
| Total | 437 (45.3%) | 528 (54.7%) |
Fertility by Education in Clearwater
Average fertility rate in Clearwater is 41.0 births per 1,000 women. Women with the education attainment of high school diploma have the highest fertility rate of 83.0 births per 1,000 women, while women with the education attainment of college or associate's degree have the lowest fertility at 24.0 births per 1,000 women. Women with the education attainment of high school diploma represent 47.6% of all women with births.
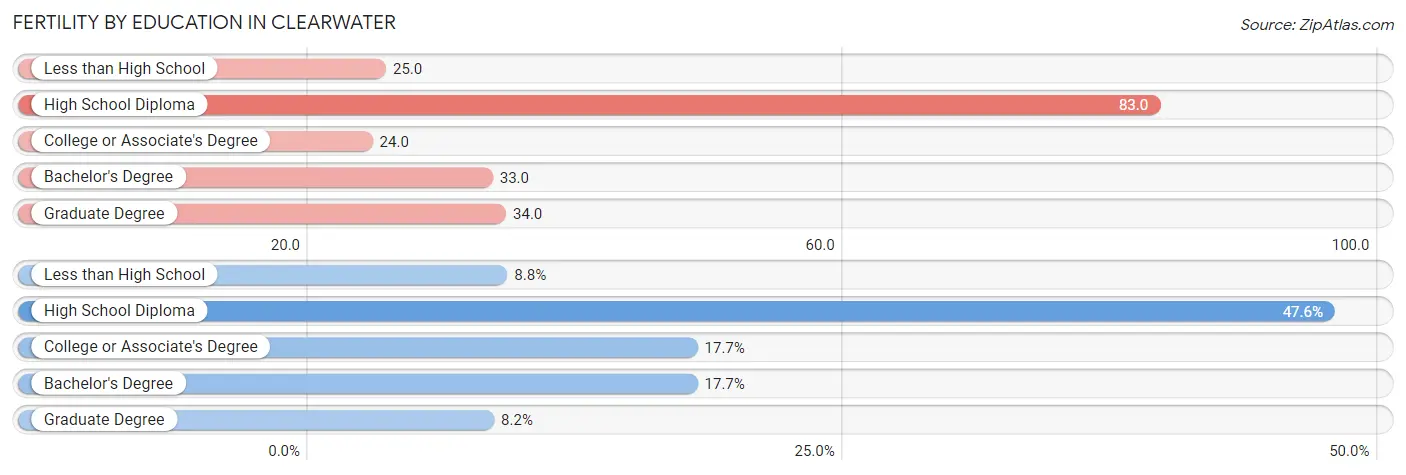
| Educational Attainment | Women with Births | Births / 1,000 Women |
| Less than High School | 85 (8.8%) | 25.0 |
| High School Diploma | 459 (47.6%) | 83.0 |
| College or Associate's Degree | 171 (17.7%) | 24.0 |
| Bachelor's Degree | 171 (17.7%) | 33.0 |
| Graduate Degree | 79 (8.2%) | 34.0 |
| Total | 965 (100.0%) | 41.0 |
Fertility by Education by Marriage Status in Clearwater
54.7% of women with births in Clearwater are unmarried. Women with the educational attainment of bachelor's degree are most likely to be married with 100.0% of them married at childbirth, while women with the educational attainment of high school diploma are least likely to be married with 100.0% of them unmarried at childbirth.
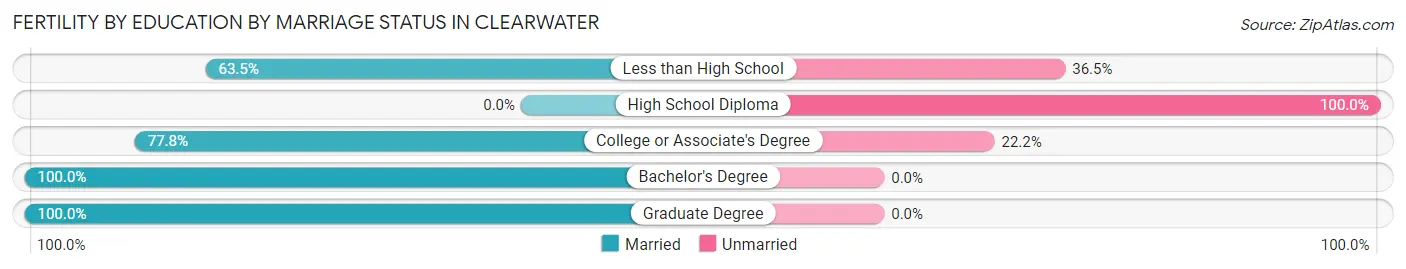
| Educational Attainment | Married | Unmarried |
| Less than High School | 54 (63.5%) | 31 (36.5%) |
| High School Diploma | 0 (0.0%) | 459 (100.0%) |
| College or Associate's Degree | 133 (77.8%) | 38 (22.2%) |
| Bachelor's Degree | 171 (100.0%) | 0 (0.0%) |
| Graduate Degree | 79 (100.0%) | 0 (0.0%) |
| Total | 437 (45.3%) | 528 (54.7%) |
Employment Characteristics in Clearwater
Employment by Class of Employer in Clearwater
Among the 53,987 employed individuals in Clearwater, private company employees (36,032 | 66.7%), not-for-profit organizations (5,495 | 10.2%), and self-employed (not incorporated) (3,783 | 7.0%) make up the most common classes of employment.
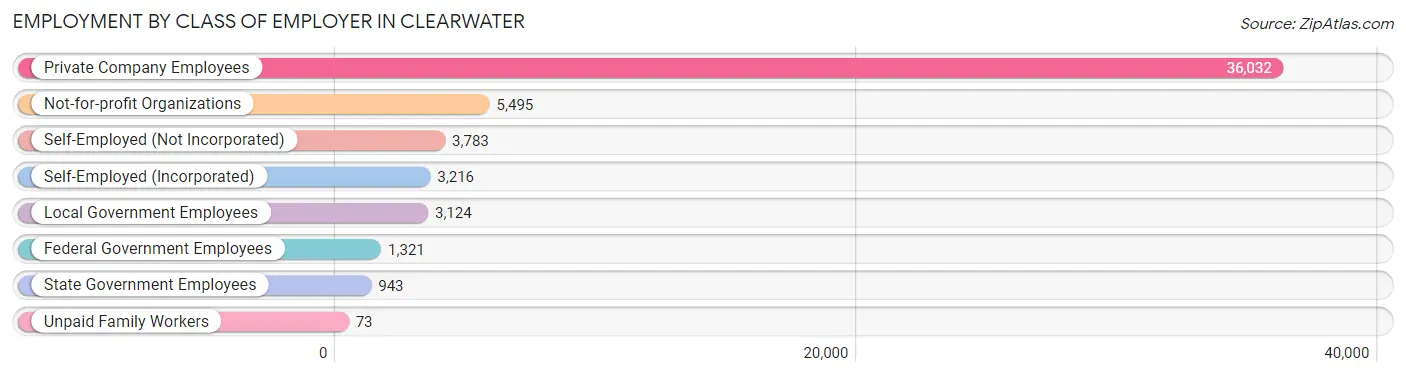
| Employer Class | # Employees | % Employees |
| Private Company Employees | 36,032 | 66.7% |
| Self-Employed (Incorporated) | 3,216 | 6.0% |
| Self-Employed (Not Incorporated) | 3,783 | 7.0% |
| Not-for-profit Organizations | 5,495 | 10.2% |
| Local Government Employees | 3,124 | 5.8% |
| State Government Employees | 943 | 1.8% |
| Federal Government Employees | 1,321 | 2.5% |
| Unpaid Family Workers | 73 | 0.1% |
| Total | 53,987 | 100.0% |
Employment Status by Age in Clearwater
According to the labor force statistics for Clearwater, out of the total population over 16 years of age (98,236), 58.9% or 57,861 individuals are in the labor force, with 4.7% or 2,719 of them unemployed. The age group with the highest labor force participation rate is 30 to 34 years, with 83.7% or 5,865 individuals in the labor force. Within the labor force, the 60 to 64 years age range has the highest percentage of unemployed individuals, with 10.1% or 459 of them being unemployed.
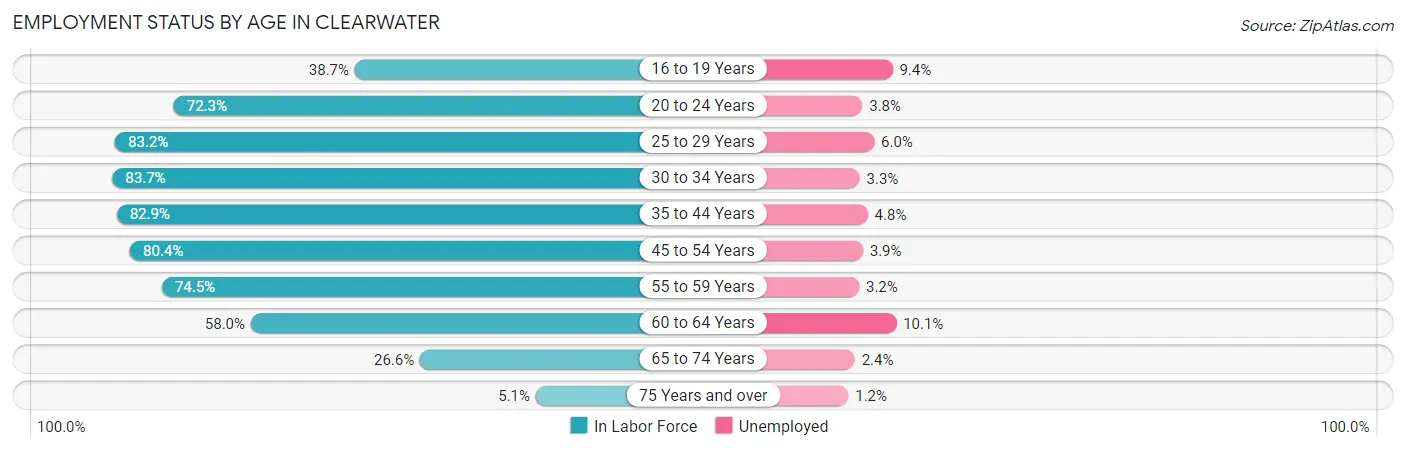
| Age Bracket | In Labor Force | Unemployed |
| 16 to 19 Years | 1,561 (38.7%) | 147 (9.4%) |
| 20 to 24 Years | 4,316 (72.3%) | 164 (3.8%) |
| 25 to 29 Years | 7,012 (83.2%) | 421 (6.0%) |
| 30 to 34 Years | 5,865 (83.7%) | 194 (3.3%) |
| 35 to 44 Years | 10,627 (82.9%) | 510 (4.8%) |
| 45 to 54 Years | 12,480 (80.4%) | 487 (3.9%) |
| 55 to 59 Years | 6,796 (74.5%) | 217 (3.2%) |
| 60 to 64 Years | 4,544 (58.0%) | 459 (10.1%) |
| 65 to 74 Years | 3,989 (26.6%) | 96 (2.4%) |
| 75 Years and over | 638 (5.1%) | 8 (1.2%) |
| Total | 57,861 (58.9%) | 2,719 (4.7%) |
Employment Status by Educational Attainment in Clearwater
According to labor force statistics for Clearwater, 77.9% of individuals (47,312) out of the total population between 25 and 64 years of age (60,734) are in the labor force, with 4.8% or 2,271 of them being unemployed. The group with the highest labor force participation rate are those with the educational attainment of bachelor's degree or higher, with 84.5% or 17,005 individuals in the labor force. Within the labor force, individuals with college / associate degree education have the highest percentage of unemployment, with 6.5% or 969 of them being unemployed.
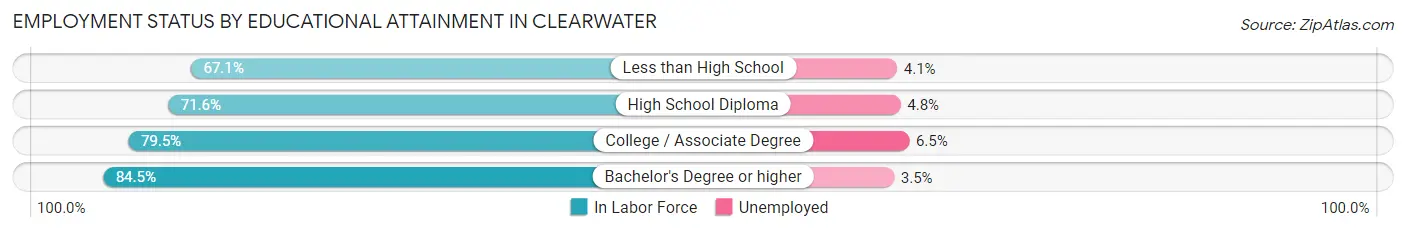
| Educational Attainment | In Labor Force | Unemployed |
| Less than High School | 3,725 (67.1%) | 228 (4.1%) |
| High School Diploma | 11,673 (71.6%) | 783 (4.8%) |
| College / Associate Degree | 14,911 (79.5%) | 1,219 (6.5%) |
| Bachelor's Degree or higher | 17,005 (84.5%) | 704 (3.5%) |
| Total | 47,312 (77.9%) | 2,915 (4.8%) |
Employment Occupations by Sex in Clearwater
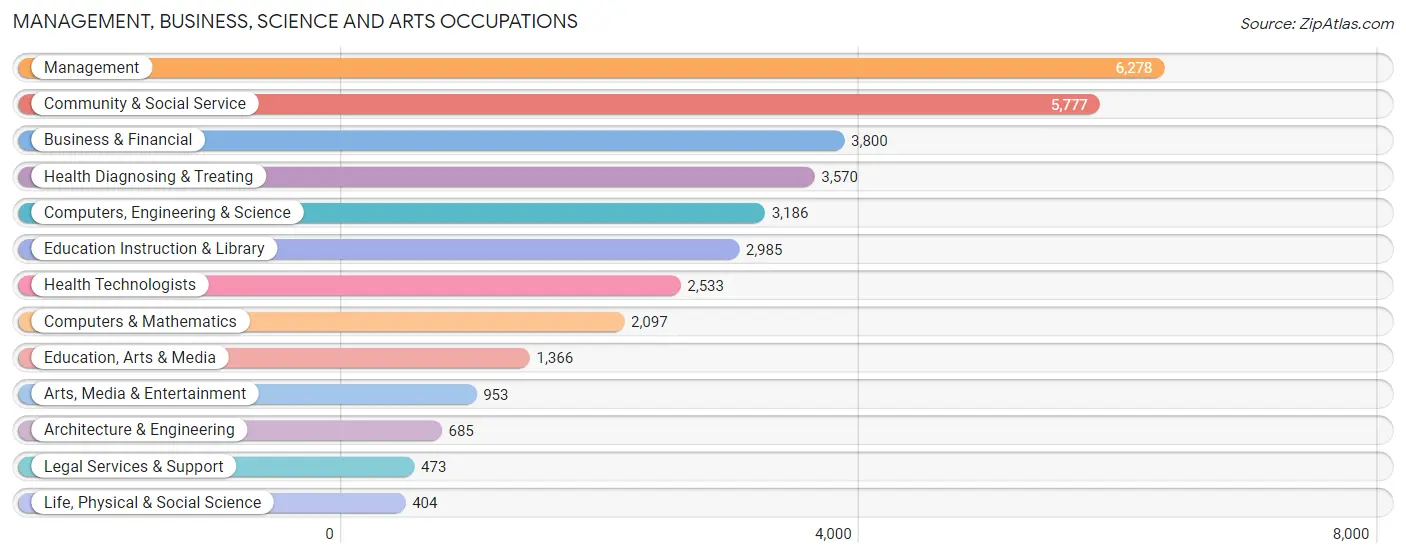
Management, Business, Science and Arts Occupations
The most common Management, Business, Science and Arts occupations in Clearwater are Management (6,278 | 11.4%), Community & Social Service (5,777 | 10.5%), Business & Financial (3,800 | 6.9%), Health Diagnosing & Treating (3,570 | 6.5%), and Computers, Engineering & Science (3,186 | 5.8%).
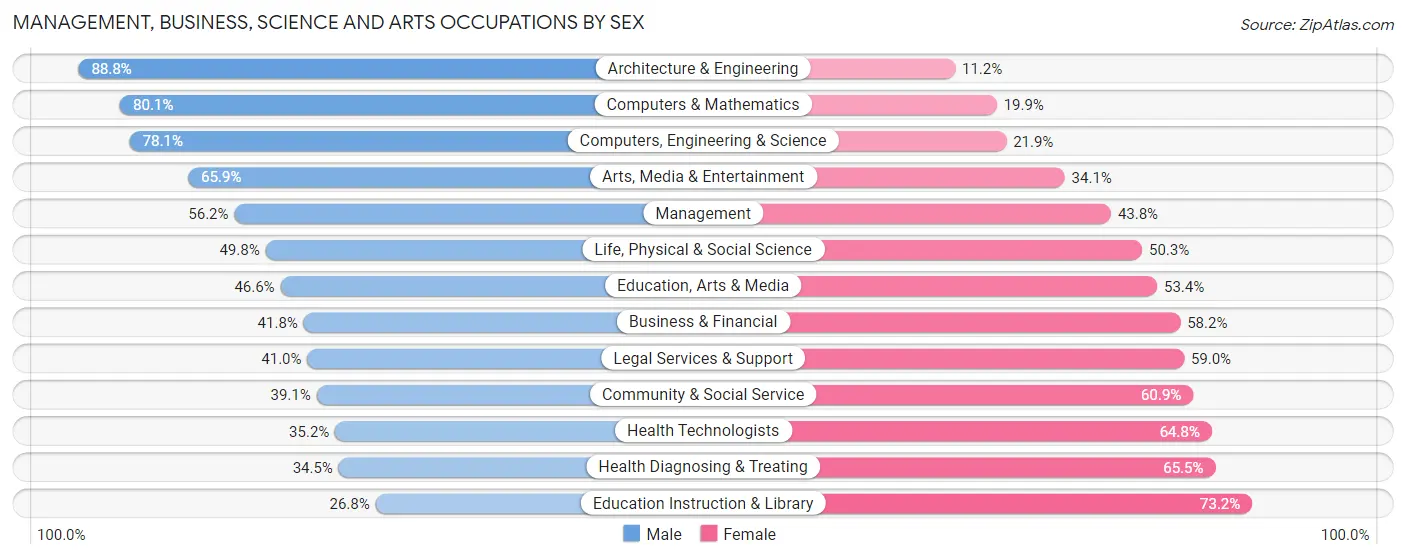
Management, Business, Science and Arts Occupations by Sex
Within the Management, Business, Science and Arts occupations in Clearwater, the most male-oriented occupations are Architecture & Engineering (88.8%), Computers & Mathematics (80.1%), and Computers, Engineering & Science (78.1%), while the most female-oriented occupations are Education Instruction & Library (73.2%), Health Diagnosing & Treating (65.5%), and Health Technologists (64.8%).
| Occupation | Male | Female |
| Management | 3,531 (56.2%) | 2,747 (43.8%) |
| Business & Financial | 1,588 (41.8%) | 2,212 (58.2%) |
| Computers, Engineering & Science | 2,488 (78.1%) | 698 (21.9%) |
| Computers & Mathematics | 1,679 (80.1%) | 418 (19.9%) |
| Architecture & Engineering | 608 (88.8%) | 77 (11.2%) |
| Life, Physical & Social Science | 201 (49.7%) | 203 (50.2%) |
| Community & Social Service | 2,259 (39.1%) | 3,518 (60.9%) |
| Education, Arts & Media | 637 (46.6%) | 729 (53.4%) |
| Legal Services & Support | 194 (41.0%) | 279 (59.0%) |
| Education Instruction & Library | 800 (26.8%) | 2,185 (73.2%) |
| Arts, Media & Entertainment | 628 (65.9%) | 325 (34.1%) |
| Health Diagnosing & Treating | 1,231 (34.5%) | 2,339 (65.5%) |
| Health Technologists | 892 (35.2%) | 1,641 (64.8%) |
| Total (Category) | 11,097 (49.1%) | 11,514 (50.9%) |
| Total (Overall) | 28,484 (51.9%) | 26,393 (48.1%) |
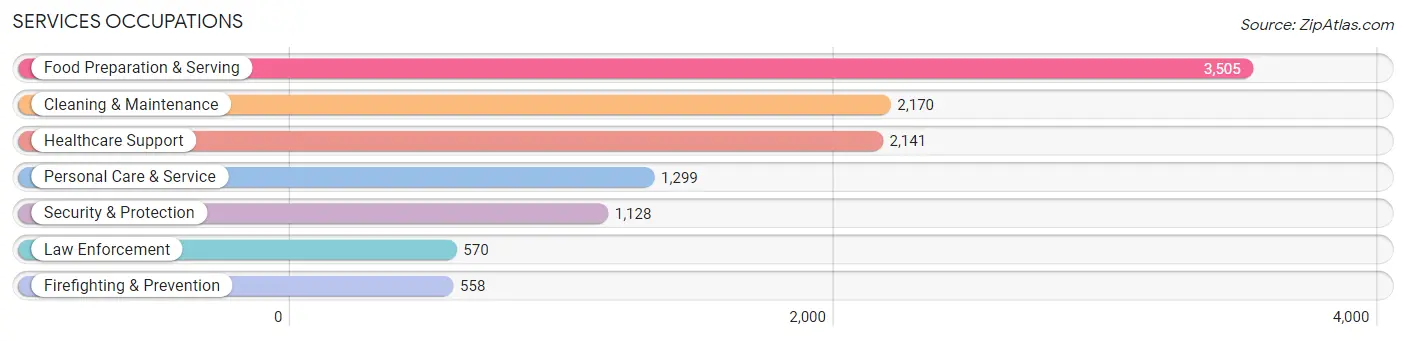
Services Occupations
The most common Services occupations in Clearwater are Food Preparation & Serving (3,505 | 6.4%), Cleaning & Maintenance (2,170 | 4.0%), Healthcare Support (2,141 | 3.9%), Personal Care & Service (1,299 | 2.4%), and Security & Protection (1,128 | 2.1%).
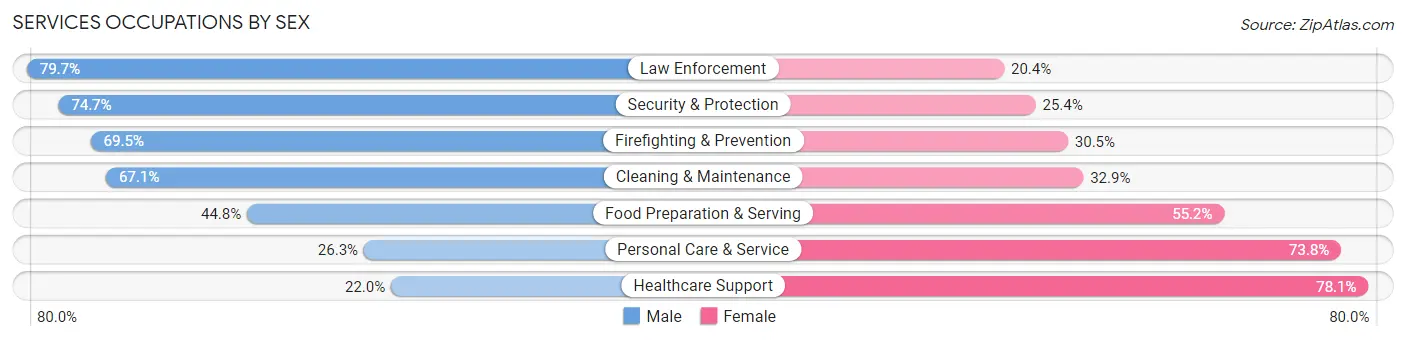
Services Occupations by Sex
Within the Services occupations in Clearwater, the most male-oriented occupations are Law Enforcement (79.6%), Security & Protection (74.7%), and Firefighting & Prevention (69.5%), while the most female-oriented occupations are Healthcare Support (78.0%), Personal Care & Service (73.8%), and Food Preparation & Serving (55.2%).
| Occupation | Male | Female |
| Healthcare Support | 470 (22.0%) | 1,671 (78.0%) |
| Security & Protection | 842 (74.7%) | 286 (25.4%) |
| Firefighting & Prevention | 388 (69.5%) | 170 (30.5%) |
| Law Enforcement | 454 (79.6%) | 116 (20.3%) |
| Food Preparation & Serving | 1,569 (44.8%) | 1,936 (55.2%) |
| Cleaning & Maintenance | 1,456 (67.1%) | 714 (32.9%) |
| Personal Care & Service | 341 (26.3%) | 958 (73.8%) |
| Total (Category) | 4,678 (45.7%) | 5,565 (54.3%) |
| Total (Overall) | 28,484 (51.9%) | 26,393 (48.1%) |
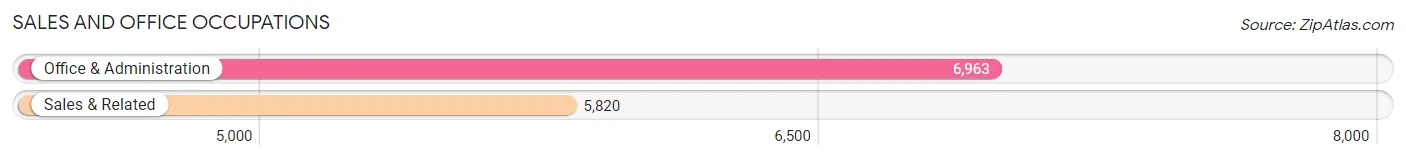
Sales and Office Occupations
The most common Sales and Office occupations in Clearwater are Office & Administration (6,963 | 12.7%), and Sales & Related (5,820 | 10.6%).
Sales and Office Occupations by Sex
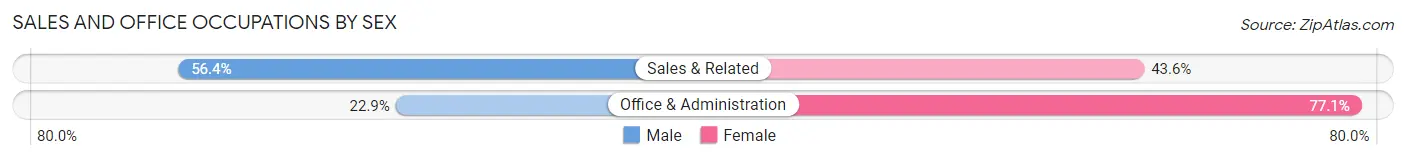
| Occupation | Male | Female |
| Sales & Related | 3,280 (56.4%) | 2,540 (43.6%) |
| Office & Administration | 1,596 (22.9%) | 5,367 (77.1%) |
| Total (Category) | 4,876 (38.1%) | 7,907 (61.9%) |
| Total (Overall) | 28,484 (51.9%) | 26,393 (48.1%) |
Natural Resources, Construction and Maintenance Occupations
The most common Natural Resources, Construction and Maintenance occupations in Clearwater are Construction & Extraction (2,722 | 5.0%), Installation, Maintenance & Repair (1,739 | 3.2%), and Farming, Fishing & Forestry (84 | 0.2%).
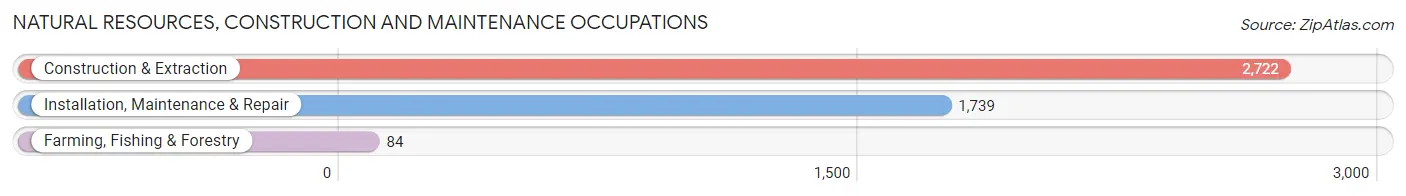
Natural Resources, Construction and Maintenance Occupations by Sex
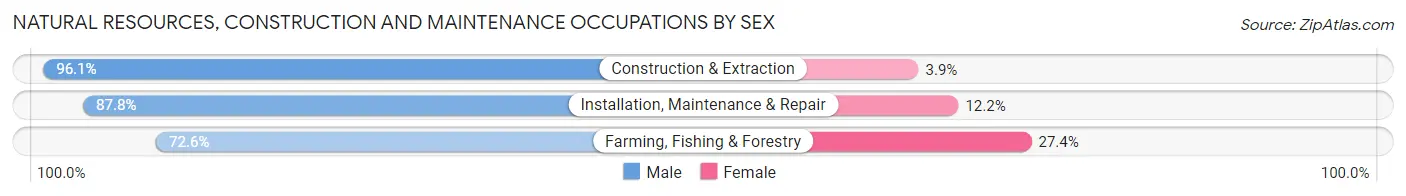
| Occupation | Male | Female |
| Farming, Fishing & Forestry | 61 (72.6%) | 23 (27.4%) |
| Construction & Extraction | 2,616 (96.1%) | 106 (3.9%) |
| Installation, Maintenance & Repair | 1,527 (87.8%) | 212 (12.2%) |
| Total (Category) | 4,204 (92.5%) | 341 (7.5%) |
| Total (Overall) | 28,484 (51.9%) | 26,393 (48.1%) |
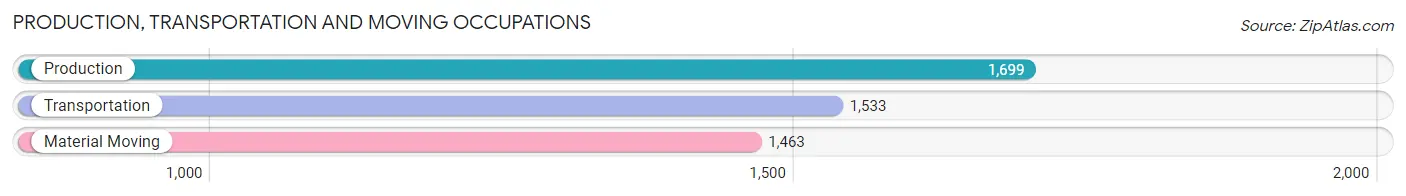
Production, Transportation and Moving Occupations
The most common Production, Transportation and Moving occupations in Clearwater are Production (1,699 | 3.1%), Transportation (1,533 | 2.8%), and Material Moving (1,463 | 2.7%).
Production, Transportation and Moving Occupations by Sex
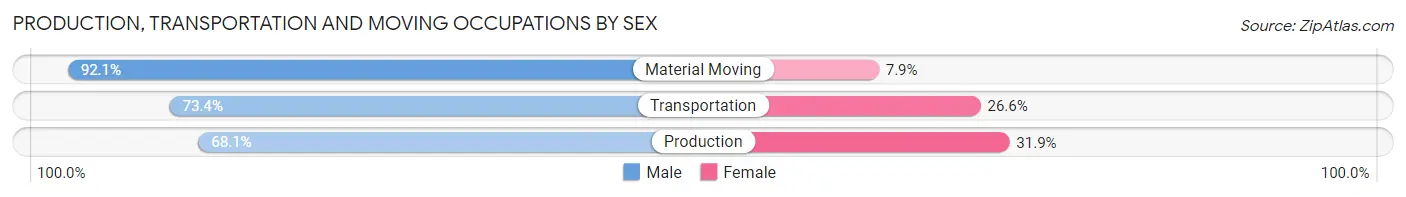
| Occupation | Male | Female |
| Production | 1,157 (68.1%) | 542 (31.9%) |
| Transportation | 1,125 (73.4%) | 408 (26.6%) |
| Material Moving | 1,347 (92.1%) | 116 (7.9%) |
| Total (Category) | 3,629 (77.3%) | 1,066 (22.7%) |
| Total (Overall) | 28,484 (51.9%) | 26,393 (48.1%) |
Employment Industries by Sex in Clearwater
Employment Industries in Clearwater
The major employment industries in Clearwater include Health Care & Social Assistance (7,666 | 14.0%), Retail Trade (6,528 | 11.9%), Professional & Scientific (4,852 | 8.8%), Accommodation & Food Services (4,649 | 8.5%), and Finance & Insurance (4,098 | 7.5%).
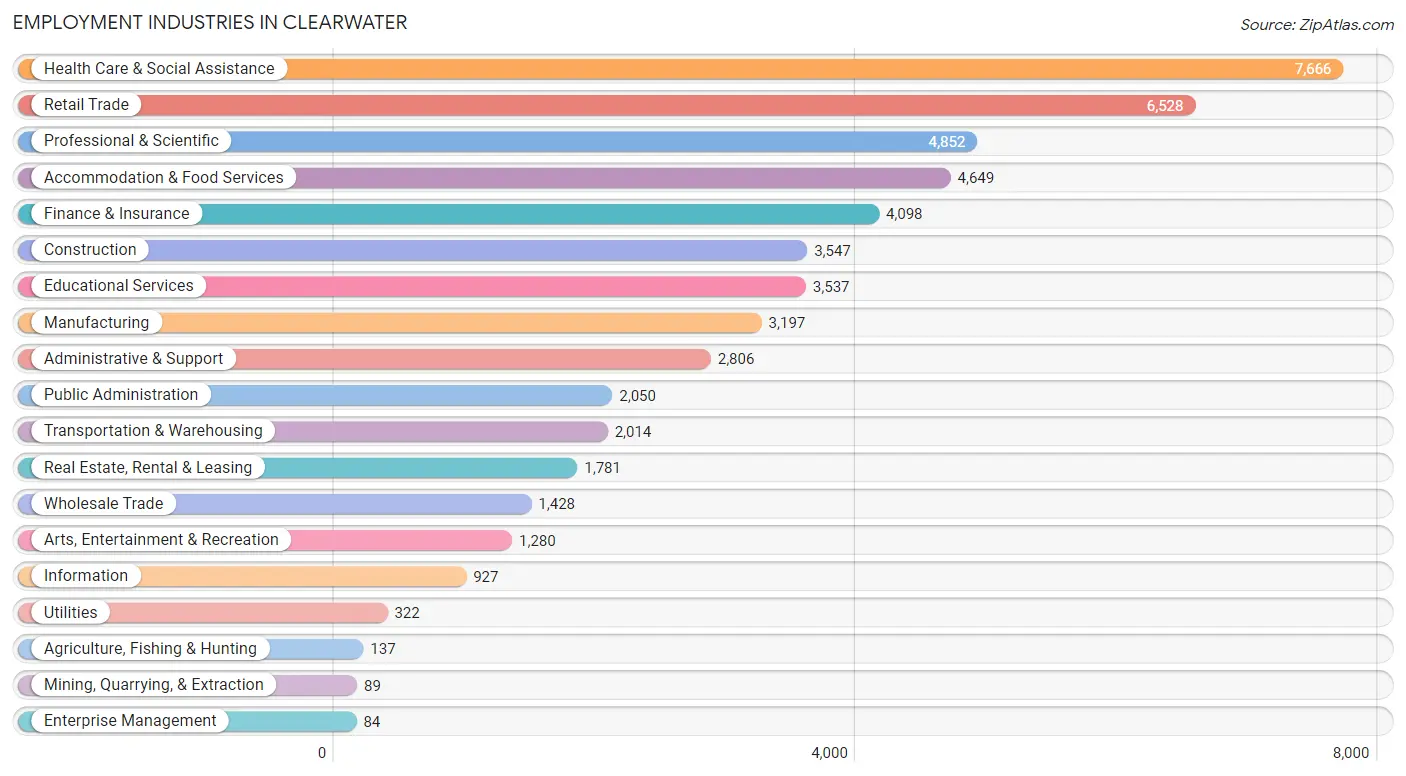
Employment Industries by Sex in Clearwater
The Clearwater industries that see more men than women are Mining, Quarrying, & Extraction (93.3%), Utilities (91.3%), and Construction (90.1%), whereas the industries that tend to have a higher number of women are Enterprise Management (77.4%), Health Care & Social Assistance (74.0%), and Educational Services (68.8%).
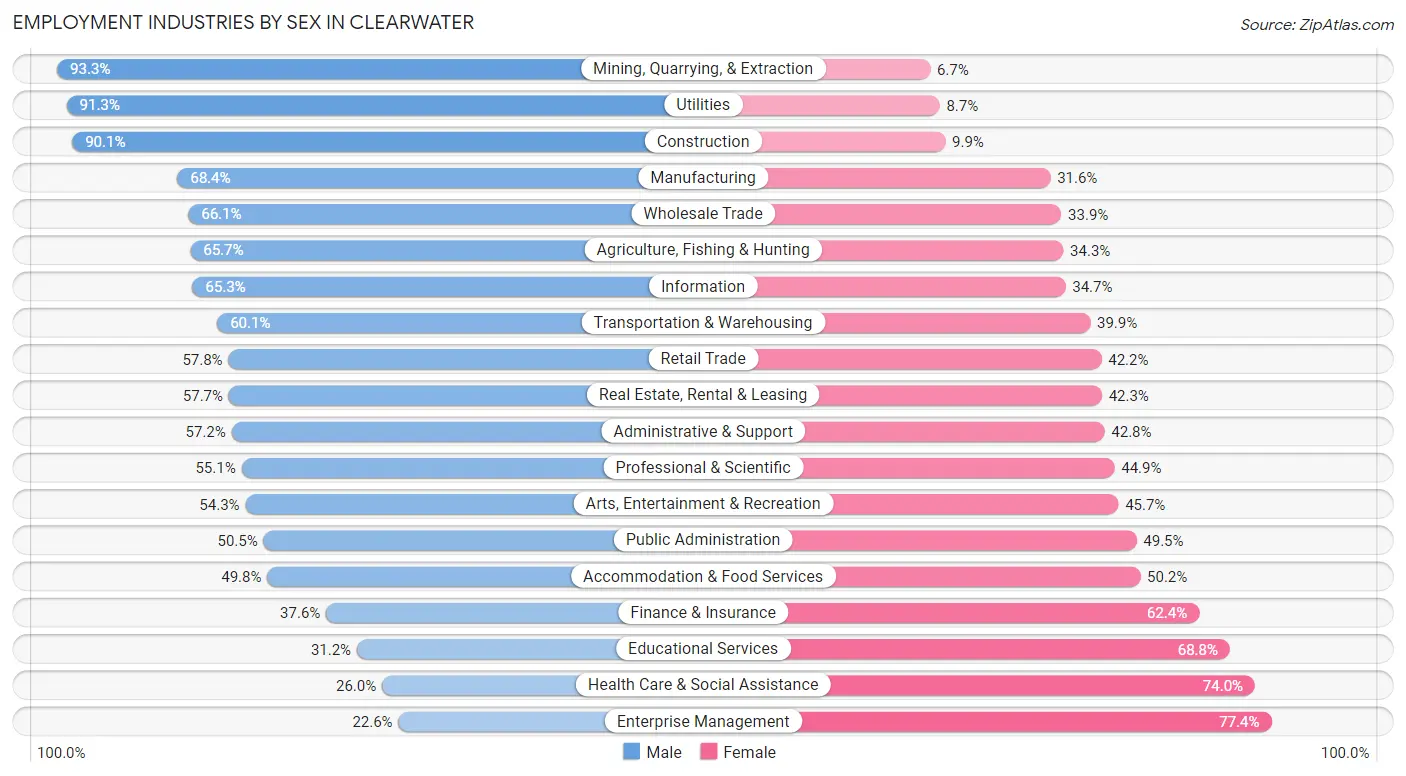
| Industry | Male | Female |
| Agriculture, Fishing & Hunting | 90 (65.7%) | 47 (34.3%) |
| Mining, Quarrying, & Extraction | 83 (93.3%) | 6 (6.7%) |
| Construction | 3,197 (90.1%) | 350 (9.9%) |
| Manufacturing | 2,186 (68.4%) | 1,011 (31.6%) |
| Wholesale Trade | 944 (66.1%) | 484 (33.9%) |
| Retail Trade | 3,774 (57.8%) | 2,754 (42.2%) |
| Transportation & Warehousing | 1,211 (60.1%) | 803 (39.9%) |
| Utilities | 294 (91.3%) | 28 (8.7%) |
| Information | 605 (65.3%) | 322 (34.7%) |
| Finance & Insurance | 1,540 (37.6%) | 2,558 (62.4%) |
| Real Estate, Rental & Leasing | 1,028 (57.7%) | 753 (42.3%) |
| Professional & Scientific | 2,674 (55.1%) | 2,178 (44.9%) |
| Enterprise Management | 19 (22.6%) | 65 (77.4%) |
| Administrative & Support | 1,604 (57.2%) | 1,202 (42.8%) |
| Educational Services | 1,104 (31.2%) | 2,433 (68.8%) |
| Health Care & Social Assistance | 1,994 (26.0%) | 5,672 (74.0%) |
| Arts, Entertainment & Recreation | 695 (54.3%) | 585 (45.7%) |
| Accommodation & Food Services | 2,314 (49.8%) | 2,335 (50.2%) |
| Public Administration | 1,036 (50.5%) | 1,014 (49.5%) |
| Total | 28,484 (51.9%) | 26,393 (48.1%) |
Education in Clearwater
School Enrollment in Clearwater
The most common levels of schooling among the 22,060 students in Clearwater are middle school (4,915 | 22.3%), high school (4,481 | 20.3%), and elementary school (4,426 | 20.1%).
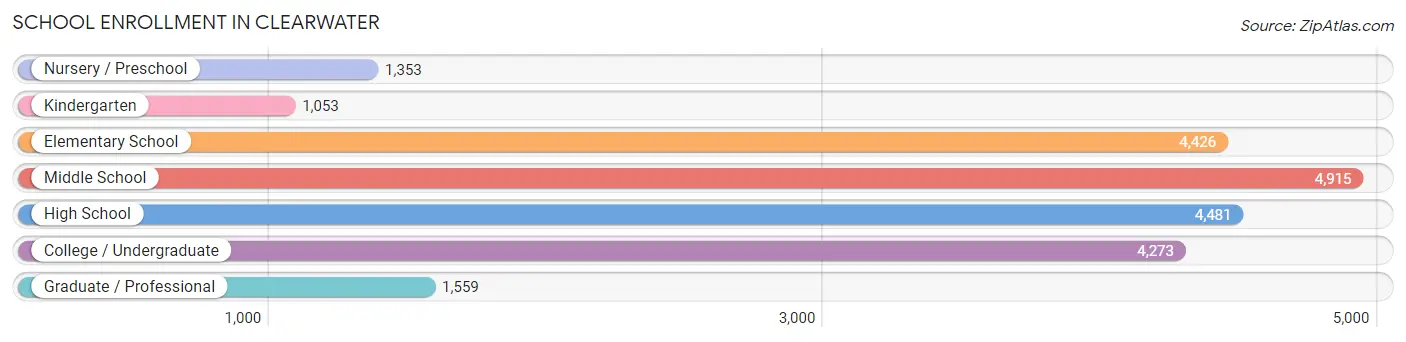
| School Level | # Students | % Students |
| Nursery / Preschool | 1,353 | 6.1% |
| Kindergarten | 1,053 | 4.8% |
| Elementary School | 4,426 | 20.1% |
| Middle School | 4,915 | 22.3% |
| High School | 4,481 | 20.3% |
| College / Undergraduate | 4,273 | 19.4% |
| Graduate / Professional | 1,559 | 7.1% |
| Total | 22,060 | 100.0% |
School Enrollment by Age by Funding Source in Clearwater
Out of a total of 22,060 students who are enrolled in schools in Clearwater, 4,897 (22.2%) attend a private institution, while the remaining 17,163 (77.8%) are enrolled in public schools. The age group of 3 to 4 year olds has the highest likelihood of being enrolled in private schools, with 513 (49.9% in the age bracket) enrolled. Conversely, the age group of 5 to 9 year old has the lowest likelihood of being enrolled in a private school, with 4,330 (85.3% in the age bracket) attending a public institution.
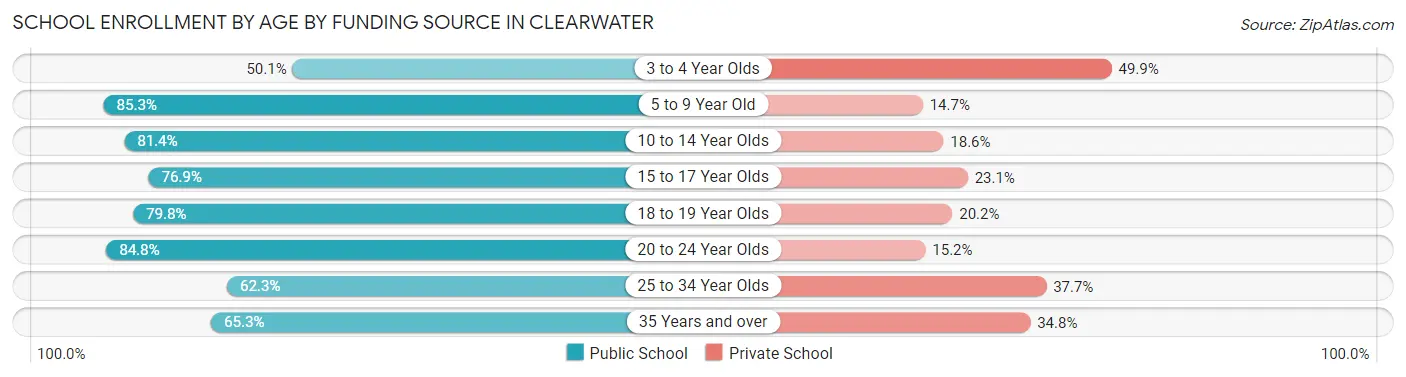
| Age Bracket | Public School | Private School |
| 3 to 4 Year Olds | 515 (50.1%) | 513 (49.9%) |
| 5 to 9 Year Old | 4,330 (85.3%) | 748 (14.7%) |
| 10 to 14 Year Olds | 5,178 (81.4%) | 1,181 (18.6%) |
| 15 to 17 Year Olds | 2,114 (76.9%) | 635 (23.1%) |
| 18 to 19 Year Olds | 1,246 (79.8%) | 316 (20.2%) |
| 20 to 24 Year Olds | 1,665 (84.8%) | 299 (15.2%) |
| 25 to 34 Year Olds | 1,220 (62.3%) | 739 (37.7%) |
| 35 Years and over | 888 (65.2%) | 473 (34.7%) |
| Total | 17,163 (77.8%) | 4,897 (22.2%) |
Educational Attainment by Field of Study in Clearwater
Business (7,082 | 24.0%), education (3,476 | 11.8%), science & technology (3,313 | 11.2%), engineering (2,090 | 7.1%), and social sciences (1,957 | 6.6%) are the most common fields of study among 29,563 individuals in Clearwater who have obtained a bachelor's degree or higher.
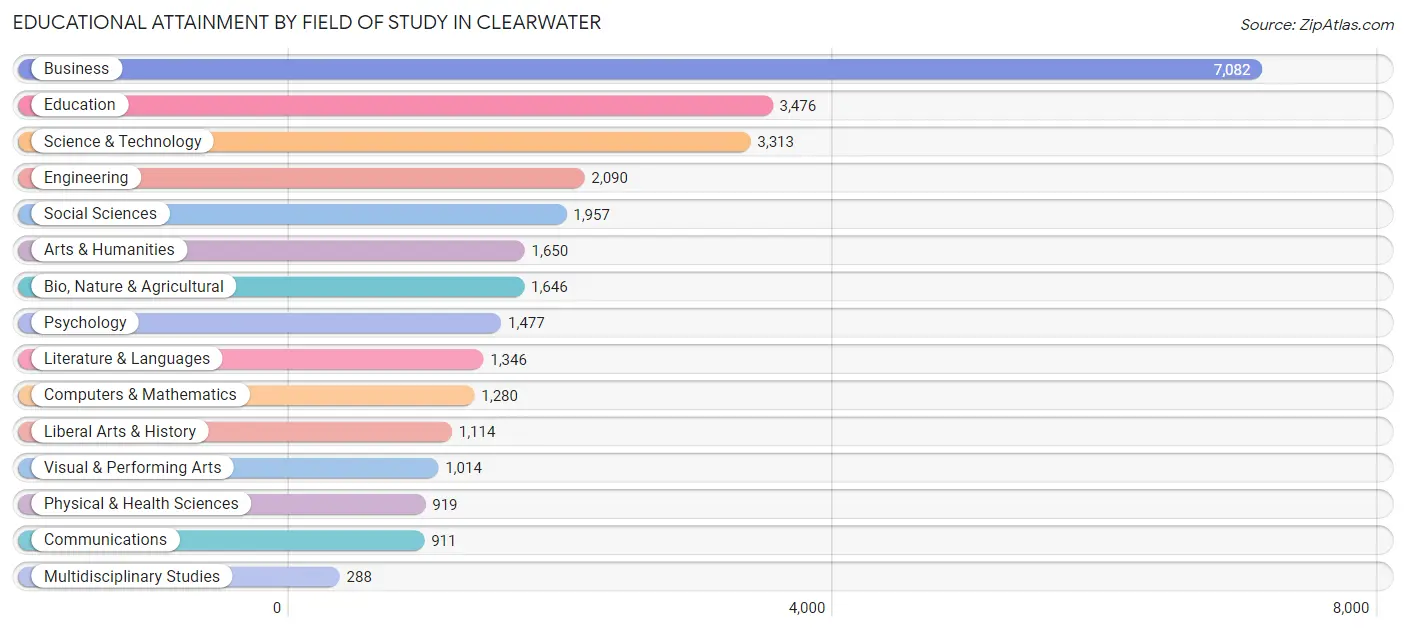
| Field of Study | # Graduates | % Graduates |
| Computers & Mathematics | 1,280 | 4.3% |
| Bio, Nature & Agricultural | 1,646 | 5.6% |
| Physical & Health Sciences | 919 | 3.1% |
| Psychology | 1,477 | 5.0% |
| Social Sciences | 1,957 | 6.6% |
| Engineering | 2,090 | 7.1% |
| Multidisciplinary Studies | 288 | 1.0% |
| Science & Technology | 3,313 | 11.2% |
| Business | 7,082 | 24.0% |
| Education | 3,476 | 11.8% |
| Literature & Languages | 1,346 | 4.5% |
| Liberal Arts & History | 1,114 | 3.8% |
| Visual & Performing Arts | 1,014 | 3.4% |
| Communications | 911 | 3.1% |
| Arts & Humanities | 1,650 | 5.6% |
| Total | 29,563 | 100.0% |
Transportation & Commute in Clearwater
Vehicle Availability by Sex in Clearwater
The most prevalent vehicle ownership categories in Clearwater are males with 2 vehicles (12,301, accounting for 44.8%) and females with 2 vehicles (11,144, making up 48.2%).
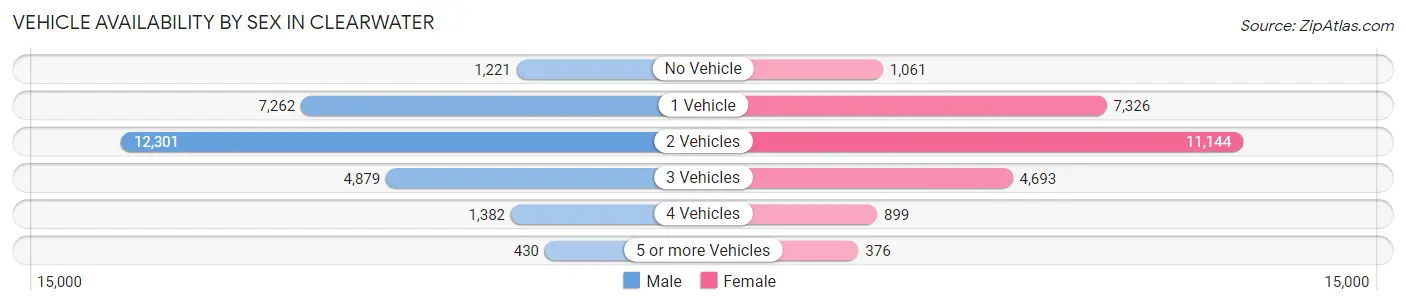
| Vehicles Available | Male | Female |
| No Vehicle | 1,221 (4.4%) | 1,061 (4.2%) |
| 1 Vehicle | 7,262 (26.4%) | 7,326 (28.7%) |
| 2 Vehicles | 12,301 (44.8%) | 11,144 (43.7%) |
| 3 Vehicles | 4,879 (17.8%) | 4,693 (18.4%) |
| 4 Vehicles | 1,382 (5.0%) | 899 (3.5%) |
| 5 or more Vehicles | 430 (1.6%) | 376 (1.5%) |
| Total | 27,475 (100.0%) | 25,499 (100.0%) |
Commute Time in Clearwater
The most frequently occuring commute durations in Clearwater are 15 to 19 minutes (8,066 commuters, 17.9%), 20 to 24 minutes (7,972 commuters, 17.7%), and 30 to 34 minutes (7,531 commuters, 16.7%).
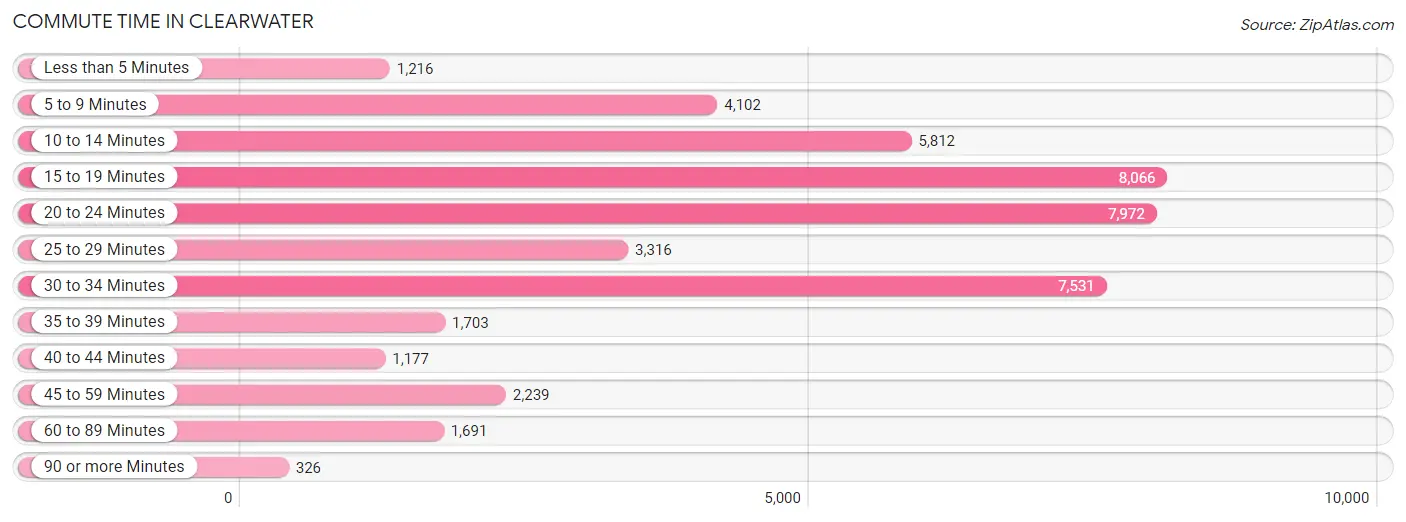
| Commute Time | # Commuters | % Commuters |
| Less than 5 Minutes | 1,216 | 2.7% |
| 5 to 9 Minutes | 4,102 | 9.1% |
| 10 to 14 Minutes | 5,812 | 12.9% |
| 15 to 19 Minutes | 8,066 | 17.9% |
| 20 to 24 Minutes | 7,972 | 17.7% |
| 25 to 29 Minutes | 3,316 | 7.3% |
| 30 to 34 Minutes | 7,531 | 16.7% |
| 35 to 39 Minutes | 1,703 | 3.8% |
| 40 to 44 Minutes | 1,177 | 2.6% |
| 45 to 59 Minutes | 2,239 | 5.0% |
| 60 to 89 Minutes | 1,691 | 3.7% |
| 90 or more Minutes | 326 | 0.7% |
Commute Time by Sex in Clearwater
The most common commute times in Clearwater are 15 to 19 minutes (4,223 commuters, 18.0%) for males and 20 to 24 minutes (3,857 commuters, 17.8%) for females.
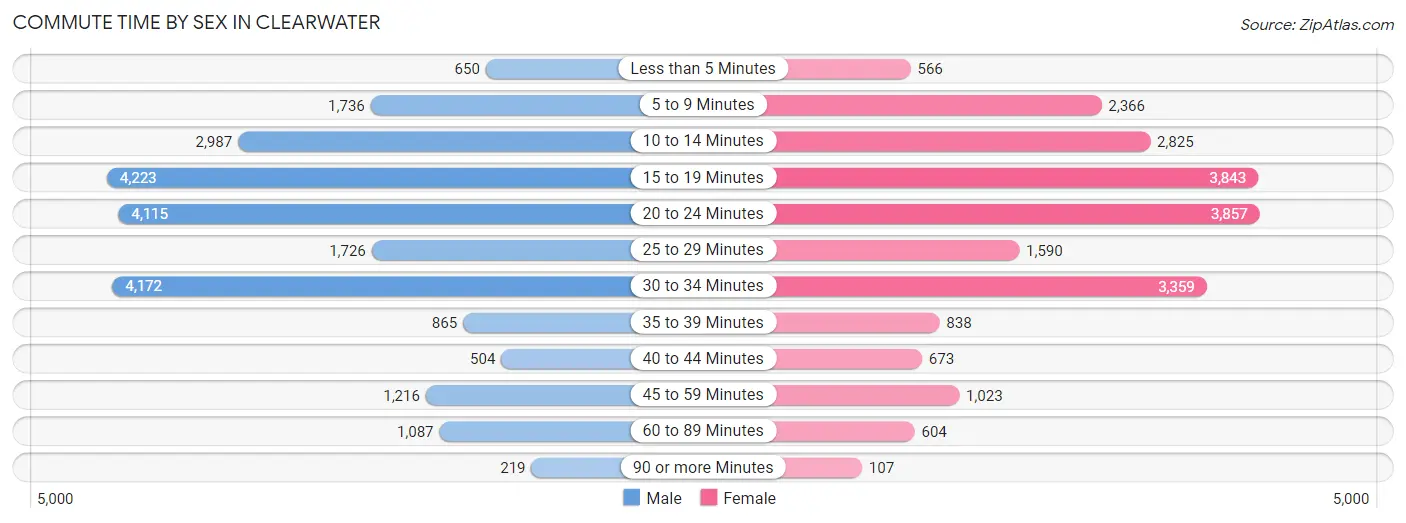
| Commute Time | Male | Female |
| Less than 5 Minutes | 650 (2.8%) | 566 (2.6%) |
| 5 to 9 Minutes | 1,736 (7.4%) | 2,366 (10.9%) |
| 10 to 14 Minutes | 2,987 (12.7%) | 2,825 (13.1%) |
| 15 to 19 Minutes | 4,223 (18.0%) | 3,843 (17.7%) |
| 20 to 24 Minutes | 4,115 (17.5%) | 3,857 (17.8%) |
| 25 to 29 Minutes | 1,726 (7.3%) | 1,590 (7.3%) |
| 30 to 34 Minutes | 4,172 (17.7%) | 3,359 (15.5%) |
| 35 to 39 Minutes | 865 (3.7%) | 838 (3.9%) |
| 40 to 44 Minutes | 504 (2.1%) | 673 (3.1%) |
| 45 to 59 Minutes | 1,216 (5.2%) | 1,023 (4.7%) |
| 60 to 89 Minutes | 1,087 (4.6%) | 604 (2.8%) |
| 90 or more Minutes | 219 (0.9%) | 107 (0.5%) |
Time of Departure to Work by Sex in Clearwater
The most frequent times of departure to work in Clearwater are 8:00 AM to 8:29 AM (3,453, 14.7%) for males and 8:00 AM to 8:29 AM (3,027, 14.0%) for females.
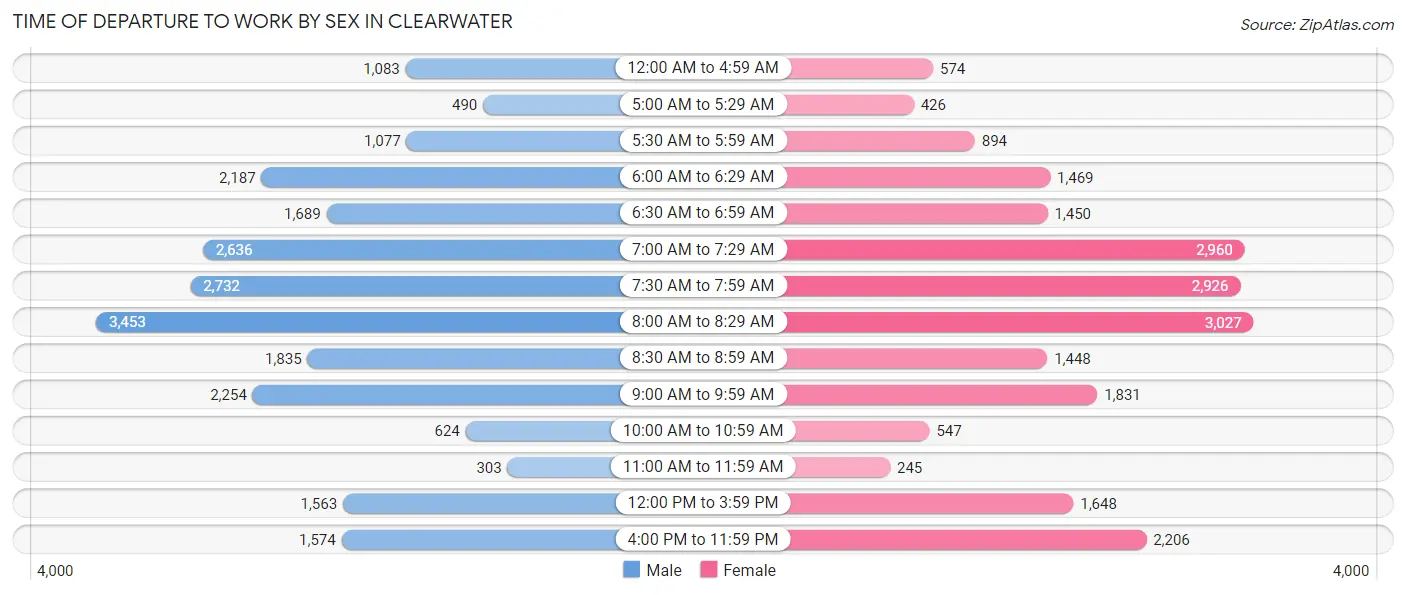
| Time of Departure | Male | Female |
| 12:00 AM to 4:59 AM | 1,083 (4.6%) | 574 (2.6%) |
| 5:00 AM to 5:29 AM | 490 (2.1%) | 426 (2.0%) |
| 5:30 AM to 5:59 AM | 1,077 (4.6%) | 894 (4.1%) |
| 6:00 AM to 6:29 AM | 2,187 (9.3%) | 1,469 (6.8%) |
| 6:30 AM to 6:59 AM | 1,689 (7.2%) | 1,450 (6.7%) |
| 7:00 AM to 7:29 AM | 2,636 (11.2%) | 2,960 (13.7%) |
| 7:30 AM to 7:59 AM | 2,732 (11.6%) | 2,926 (13.5%) |
| 8:00 AM to 8:29 AM | 3,453 (14.7%) | 3,027 (14.0%) |
| 8:30 AM to 8:59 AM | 1,835 (7.8%) | 1,448 (6.7%) |
| 9:00 AM to 9:59 AM | 2,254 (9.6%) | 1,831 (8.5%) |
| 10:00 AM to 10:59 AM | 624 (2.7%) | 547 (2.5%) |
| 11:00 AM to 11:59 AM | 303 (1.3%) | 245 (1.1%) |
| 12:00 PM to 3:59 PM | 1,563 (6.7%) | 1,648 (7.6%) |
| 4:00 PM to 11:59 PM | 1,574 (6.7%) | 2,206 (10.2%) |
| Total | 23,500 (100.0%) | 21,651 (100.0%) |
Housing Occupancy in Clearwater
Occupancy by Ownership in Clearwater
Of the total 49,592 dwellings in Clearwater, owner-occupied units account for 29,152 (58.8%), while renter-occupied units make up 20,440 (41.2%).
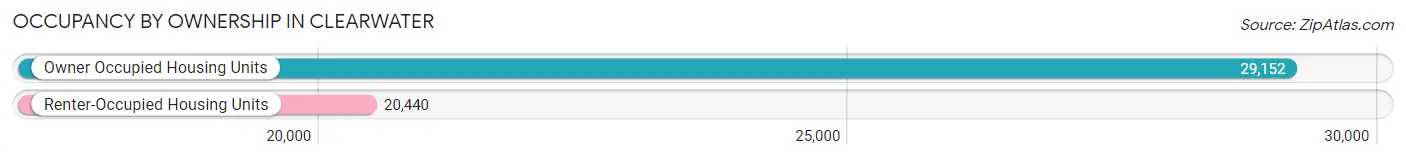
| Occupancy | # Housing Units | % Housing Units |
| Owner Occupied Housing Units | 29,152 | 58.8% |
| Renter-Occupied Housing Units | 20,440 | 41.2% |
| Total Occupied Housing Units | 49,592 | 100.0% |
Occupancy by Household Size in Clearwater
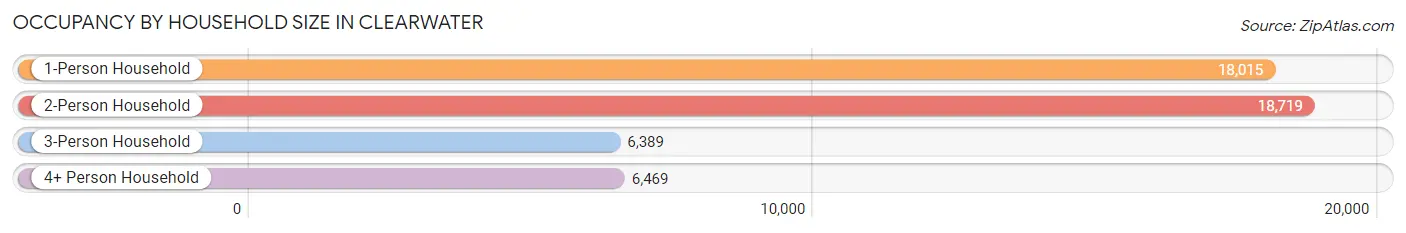
| Household Size | # Housing Units | % Housing Units |
| 1-Person Household | 18,015 | 36.3% |
| 2-Person Household | 18,719 | 37.8% |
| 3-Person Household | 6,389 | 12.9% |
| 4+ Person Household | 6,469 | 13.0% |
| Total Housing Units | 49,592 | 100.0% |
Occupancy by Ownership by Household Size in Clearwater
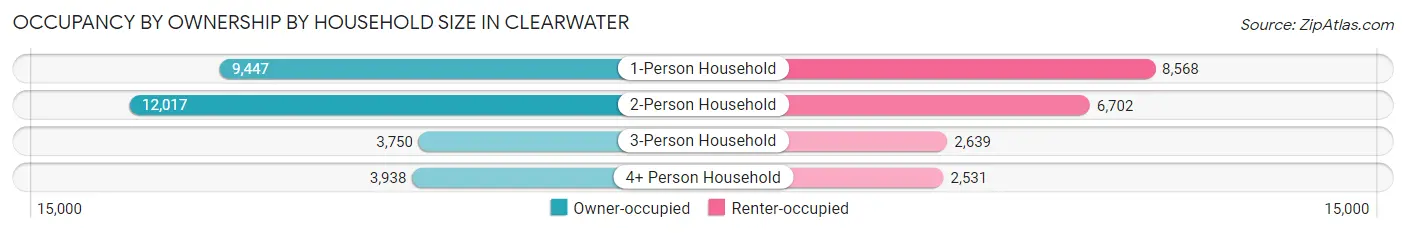
| Household Size | Owner-occupied | Renter-occupied |
| 1-Person Household | 9,447 (52.4%) | 8,568 (47.6%) |
| 2-Person Household | 12,017 (64.2%) | 6,702 (35.8%) |
| 3-Person Household | 3,750 (58.7%) | 2,639 (41.3%) |
| 4+ Person Household | 3,938 (60.9%) | 2,531 (39.1%) |
| Total Housing Units | 29,152 (58.8%) | 20,440 (41.2%) |
Occupancy by Educational Attainment in Clearwater
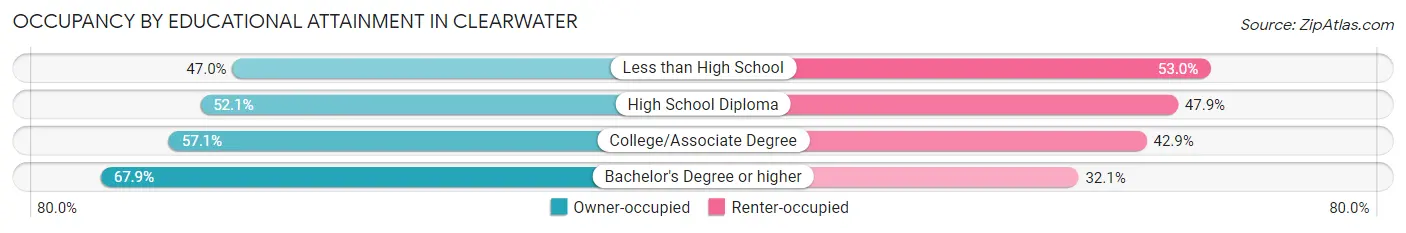
| Household Size | Owner-occupied | Renter-occupied |
| Less than High School | 1,920 (47.0%) | 2,162 (53.0%) |
| High School Diploma | 6,467 (52.1%) | 5,937 (47.9%) |
| College/Associate Degree | 9,083 (57.1%) | 6,822 (42.9%) |
| Bachelor's Degree or higher | 11,682 (67.9%) | 5,519 (32.1%) |
Occupancy by Age of Householder in Clearwater
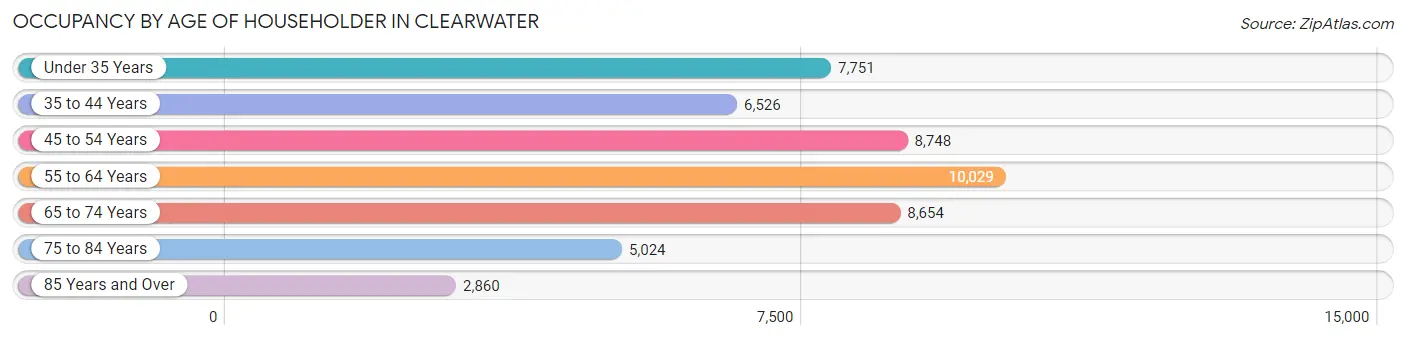
| Age Bracket | # Households | % Households |
| Under 35 Years | 7,751 | 15.6% |
| 35 to 44 Years | 6,526 | 13.2% |
| 45 to 54 Years | 8,748 | 17.6% |
| 55 to 64 Years | 10,029 | 20.2% |
| 65 to 74 Years | 8,654 | 17.4% |
| 75 to 84 Years | 5,024 | 10.1% |
| 85 Years and Over | 2,860 | 5.8% |
| Total | 49,592 | 100.0% |
Housing Finances in Clearwater
Median Income by Occupancy in Clearwater
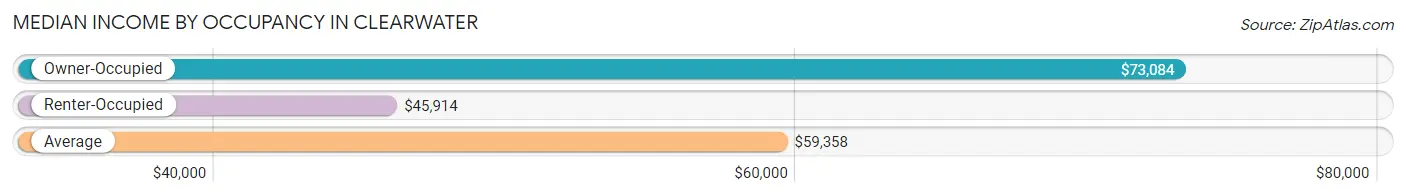
| Occupancy Type | # Households | Median Income |
| Owner-Occupied | 29,152 (58.8%) | $73,084 |
| Renter-Occupied | 20,440 (41.2%) | $45,914 |
| Average | 49,592 (100.0%) | $59,358 |
Occupancy by Householder Income Bracket in Clearwater
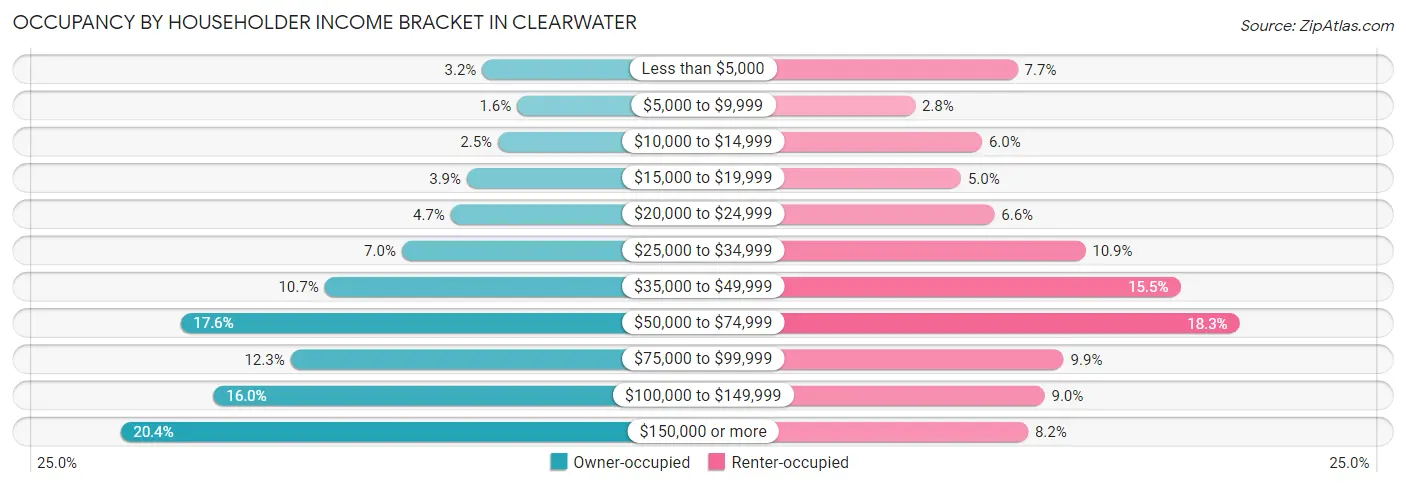
| Income Bracket | Owner-occupied | Renter-occupied |
| Less than $5,000 | 937 (3.2%) | 1,578 (7.7%) |
| $5,000 to $9,999 | 453 (1.5%) | 578 (2.8%) |
| $10,000 to $14,999 | 717 (2.5%) | 1,230 (6.0%) |
| $15,000 to $19,999 | 1,148 (3.9%) | 1,027 (5.0%) |
| $20,000 to $24,999 | 1,372 (4.7%) | 1,351 (6.6%) |
| $25,000 to $34,999 | 2,052 (7.0%) | 2,236 (10.9%) |
| $35,000 to $49,999 | 3,126 (10.7%) | 3,160 (15.5%) |
| $50,000 to $74,999 | 5,125 (17.6%) | 3,737 (18.3%) |
| $75,000 to $99,999 | 3,596 (12.3%) | 2,026 (9.9%) |
| $100,000 to $149,999 | 4,668 (16.0%) | 1,839 (9.0%) |
| $150,000 or more | 5,958 (20.4%) | 1,678 (8.2%) |
| Total | 29,152 (100.0%) | 20,440 (100.0%) |
Monthly Housing Cost Tiers in Clearwater
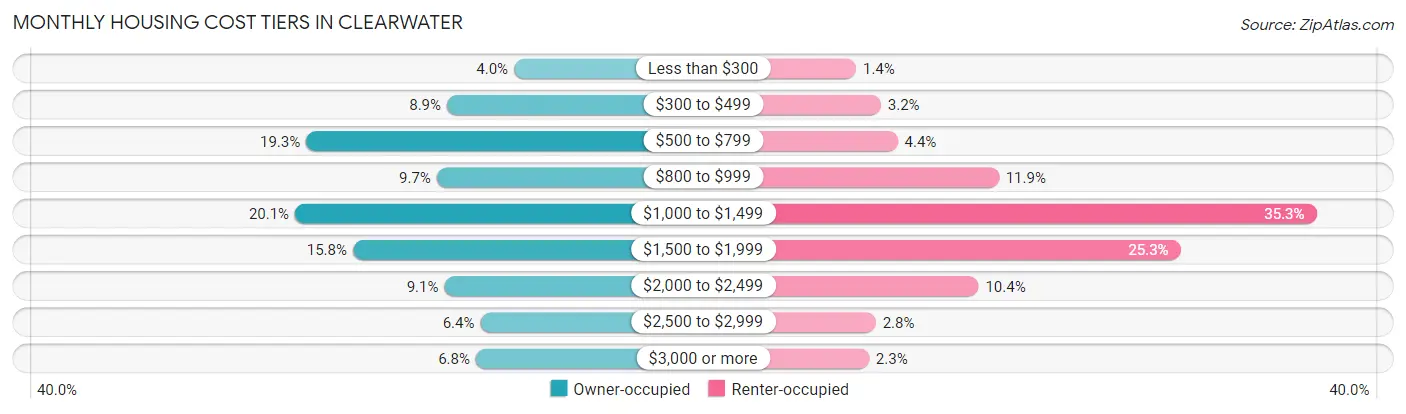
| Monthly Cost | Owner-occupied | Renter-occupied |
| Less than $300 | 1,154 (4.0%) | 280 (1.4%) |
| $300 to $499 | 2,594 (8.9%) | 655 (3.2%) |
| $500 to $799 | 5,618 (19.3%) | 906 (4.4%) |
| $800 to $999 | 2,814 (9.7%) | 2,428 (11.9%) |
| $1,000 to $1,499 | 5,857 (20.1%) | 7,209 (35.3%) |
| $1,500 to $1,999 | 4,616 (15.8%) | 5,164 (25.3%) |
| $2,000 to $2,499 | 2,650 (9.1%) | 2,124 (10.4%) |
| $2,500 to $2,999 | 1,876 (6.4%) | 577 (2.8%) |
| $3,000 or more | 1,973 (6.8%) | 475 (2.3%) |
| Total | 29,152 (100.0%) | 20,440 (100.0%) |
Physical Housing Characteristics in Clearwater
Housing Structures in Clearwater
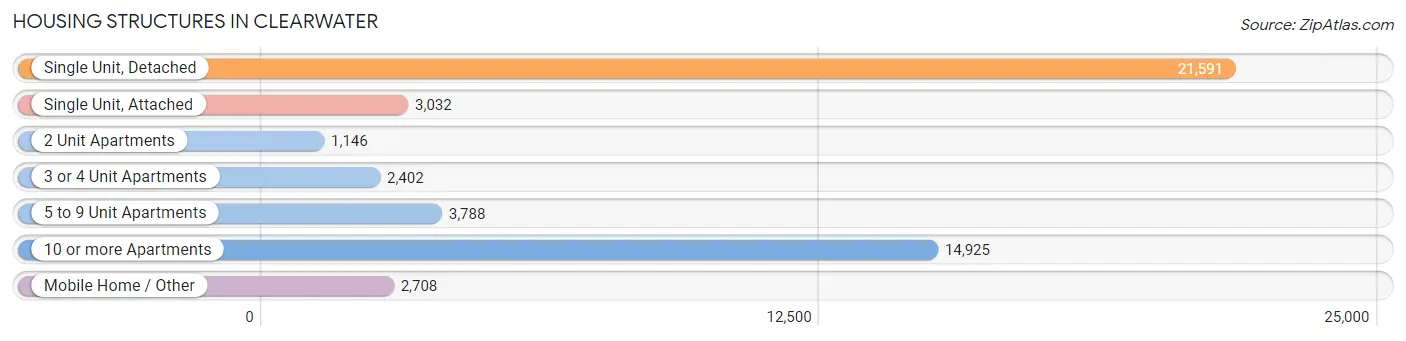
| Structure Type | # Housing Units | % Housing Units |
| Single Unit, Detached | 21,591 | 43.5% |
| Single Unit, Attached | 3,032 | 6.1% |
| 2 Unit Apartments | 1,146 | 2.3% |
| 3 or 4 Unit Apartments | 2,402 | 4.8% |
| 5 to 9 Unit Apartments | 3,788 | 7.6% |
| 10 or more Apartments | 14,925 | 30.1% |
| Mobile Home / Other | 2,708 | 5.5% |
| Total | 49,592 | 100.0% |
Housing Structures by Occupancy in Clearwater
| Structure Type | Owner-occupied | Renter-occupied |
| Single Unit, Detached | 18,209 (84.3%) | 3,382 (15.7%) |
| Single Unit, Attached | 2,018 (66.6%) | 1,014 (33.4%) |
| 2 Unit Apartments | 169 (14.7%) | 977 (85.3%) |
| 3 or 4 Unit Apartments | 469 (19.5%) | 1,933 (80.5%) |
| 5 to 9 Unit Apartments | 1,080 (28.5%) | 2,708 (71.5%) |
| 10 or more Apartments | 5,042 (33.8%) | 9,883 (66.2%) |
| Mobile Home / Other | 2,165 (79.9%) | 543 (20.1%) |
| Total | 29,152 (58.8%) | 20,440 (41.2%) |
Housing Structures by Number of Rooms in Clearwater
| Number of Rooms | Owner-occupied | Renter-occupied |
| 1 Room | 211 (0.7%) | 1,338 (6.6%) |
| 2 or 3 Rooms | 2,222 (7.6%) | 5,733 (28.1%) |
| 4 or 5 Rooms | 11,521 (39.5%) | 10,494 (51.3%) |
| 6 or 7 Rooms | 10,326 (35.4%) | 2,220 (10.9%) |
| 8 or more Rooms | 4,872 (16.7%) | 655 (3.2%) |
| Total | 29,152 (100.0%) | 20,440 (100.0%) |
Housing Structure by Heating Type in Clearwater
| Heating Type | Owner-occupied | Renter-occupied |
| Utility Gas | 1,186 (4.1%) | 940 (4.6%) |
| Bottled, Tank, or LP Gas | 22 (0.1%) | 105 (0.5%) |
| Electricity | 27,353 (93.8%) | 18,831 (92.1%) |
| Fuel Oil or Kerosene | 25 (0.1%) | 4 (0.0%) |
| Coal or Coke | 0 (0.0%) | 0 (0.0%) |
| All other Fuels | 206 (0.7%) | 8 (0.0%) |
| No Fuel Used | 360 (1.2%) | 552 (2.7%) |
| Total | 29,152 (100.0%) | 20,440 (100.0%) |
Household Vehicle Usage in Clearwater
| Vehicles per Household | Owner-occupied | Renter-occupied |
| No Vehicle | 1,736 (5.9%) | 3,218 (15.7%) |
| 1 Vehicle | 11,588 (39.8%) | 10,660 (52.1%) |
| 2 Vehicles | 11,116 (38.1%) | 5,582 (27.3%) |
| 3 or more Vehicles | 4,712 (16.2%) | 980 (4.8%) |
| Total | 29,152 (100.0%) | 20,440 (100.0%) |
Real Estate & Mortgages in Clearwater
Real Estate and Mortgage Overview in Clearwater
| Characteristic | Without Mortgage | With Mortgage |
| Housing Units | 13,616 | 15,536 |
| Median Property Value | $265,900 | $305,600 |
| Median Household Income | $54,641 | $3,934 |
| Monthly Housing Costs | $679 | $1,762 |
| Real Estate Taxes | $1,834 | $733 |
Property Value by Mortgage Status in Clearwater
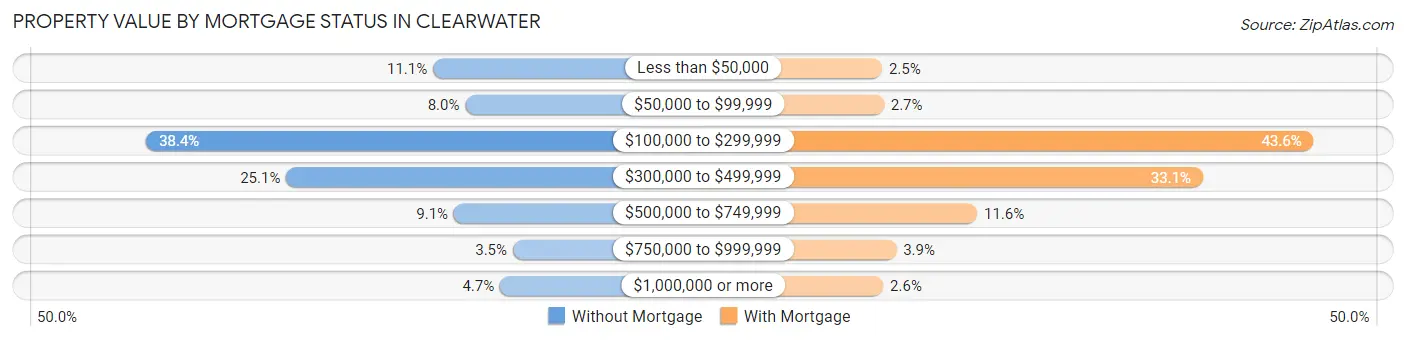
| Property Value | Without Mortgage | With Mortgage |
| Less than $50,000 | 1,512 (11.1%) | 392 (2.5%) |
| $50,000 to $99,999 | 1,094 (8.0%) | 418 (2.7%) |
| $100,000 to $299,999 | 5,234 (38.4%) | 6,779 (43.6%) |
| $300,000 to $499,999 | 3,415 (25.1%) | 5,140 (33.1%) |
| $500,000 to $749,999 | 1,241 (9.1%) | 1,797 (11.6%) |
| $750,000 to $999,999 | 477 (3.5%) | 602 (3.9%) |
| $1,000,000 or more | 643 (4.7%) | 408 (2.6%) |
| Total | 13,616 (100.0%) | 15,536 (100.0%) |
Household Income by Mortgage Status in Clearwater
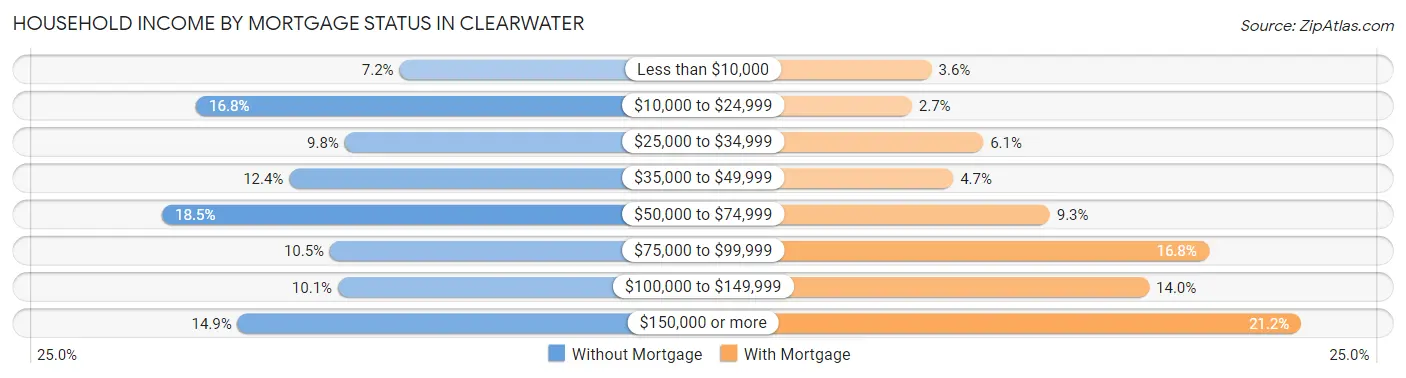
| Household Income | Without Mortgage | With Mortgage |
| Less than $10,000 | 974 (7.1%) | 563 (3.6%) |
| $10,000 to $24,999 | 2,292 (16.8%) | 416 (2.7%) |
| $25,000 to $34,999 | 1,329 (9.8%) | 945 (6.1%) |
| $35,000 to $49,999 | 1,689 (12.4%) | 723 (4.6%) |
| $50,000 to $74,999 | 2,512 (18.4%) | 1,437 (9.2%) |
| $75,000 to $99,999 | 1,424 (10.5%) | 2,613 (16.8%) |
| $100,000 to $149,999 | 1,372 (10.1%) | 2,172 (14.0%) |
| $150,000 or more | 2,024 (14.9%) | 3,296 (21.2%) |
| Total | 13,616 (100.0%) | 15,536 (100.0%) |
Property Value to Household Income Ratio in Clearwater
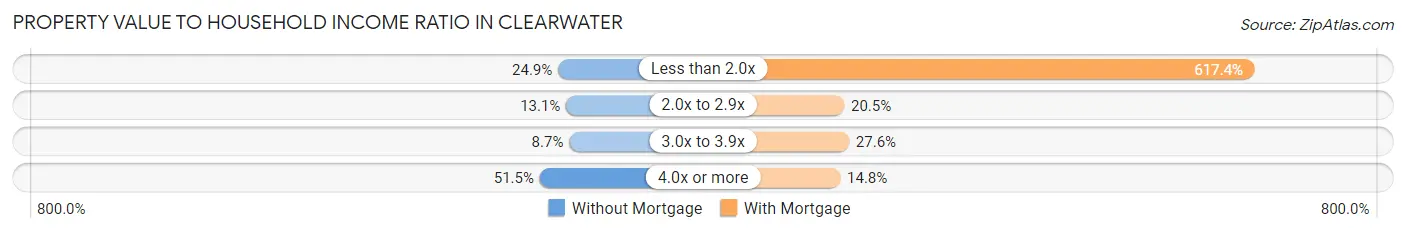
| Value-to-Income Ratio | Without Mortgage | With Mortgage |
| Less than 2.0x | 3,392 (24.9%) | 95,924 (617.4%) |
| 2.0x to 2.9x | 1,783 (13.1%) | 3,186 (20.5%) |
| 3.0x to 3.9x | 1,189 (8.7%) | 4,286 (27.6%) |
| 4.0x or more | 7,006 (51.4%) | 2,301 (14.8%) |
| Total | 13,616 (100.0%) | 15,536 (100.0%) |
Real Estate Taxes by Mortgage Status in Clearwater
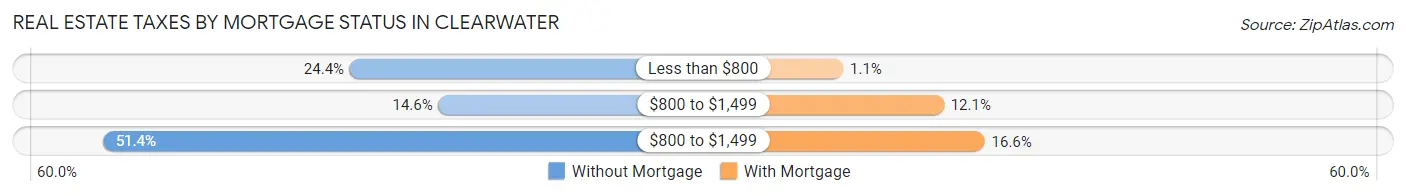
| Property Taxes | Without Mortgage | With Mortgage |
| Less than $800 | 3,316 (24.3%) | 171 (1.1%) |
| $800 to $1,499 | 1,994 (14.6%) | 1,884 (12.1%) |
| $800 to $1,499 | 7,004 (51.4%) | 2,581 (16.6%) |
| Total | 13,616 (100.0%) | 15,536 (100.0%) |
Health & Disability in Clearwater
Health Insurance Coverage by Age in Clearwater
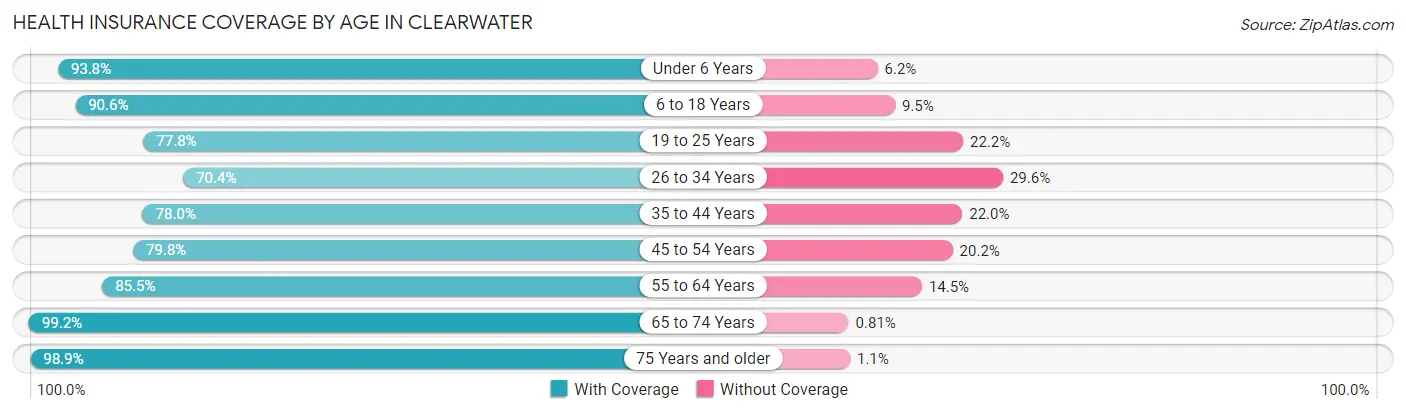
| Age Bracket | With Coverage | Without Coverage |
| Under 6 Years | 6,461 (93.8%) | 428 (6.2%) |
| 6 to 18 Years | 13,487 (90.5%) | 1,408 (9.5%) |
| 19 to 25 Years | 6,309 (77.8%) | 1,796 (22.2%) |
| 26 to 34 Years | 9,910 (70.4%) | 4,165 (29.6%) |
| 35 to 44 Years | 9,963 (78.0%) | 2,812 (22.0%) |
| 45 to 54 Years | 12,301 (79.8%) | 3,115 (20.2%) |
| 55 to 64 Years | 14,332 (85.5%) | 2,427 (14.5%) |
| 65 to 74 Years | 14,533 (99.2%) | 118 (0.8%) |
| 75 Years and older | 11,581 (98.9%) | 125 (1.1%) |
| Total | 98,877 (85.8%) | 16,394 (14.2%) |
Health Insurance Coverage by Citizenship Status in Clearwater
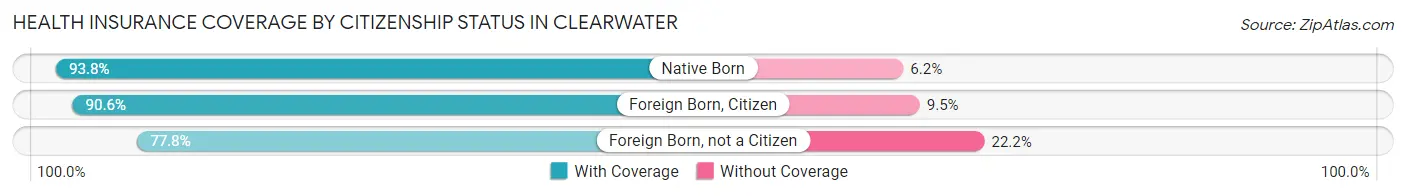
| Citizenship Status | With Coverage | Without Coverage |
| Native Born | 6,461 (93.8%) | 428 (6.2%) |
| Foreign Born, Citizen | 13,487 (90.5%) | 1,408 (9.5%) |
| Foreign Born, not a Citizen | 6,309 (77.8%) | 1,796 (22.2%) |
Health Insurance Coverage by Household Income in Clearwater
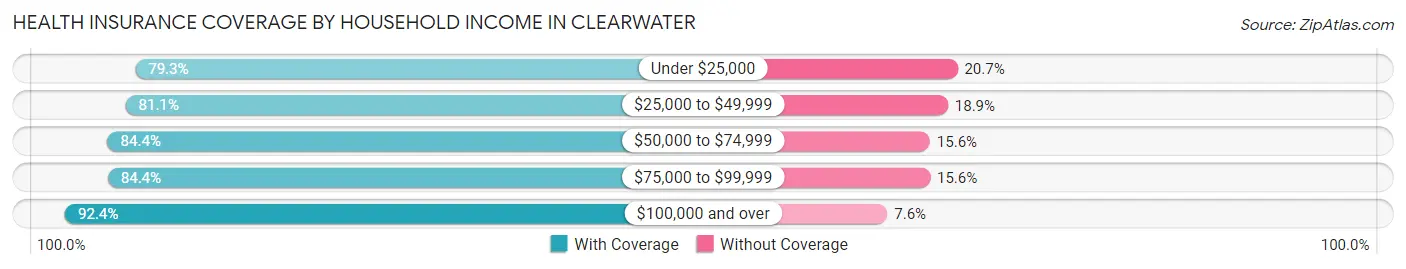
| Household Income | With Coverage | Without Coverage |
| Under $25,000 | 14,400 (79.3%) | 3,767 (20.7%) |
| $25,000 to $49,999 | 16,831 (81.1%) | 3,931 (18.9%) |
| $50,000 to $74,999 | 17,196 (84.4%) | 3,170 (15.6%) |
| $75,000 to $99,999 | 11,596 (84.4%) | 2,144 (15.6%) |
| $100,000 and over | 36,943 (92.4%) | 3,037 (7.6%) |
Public vs Private Health Insurance Coverage by Age in Clearwater
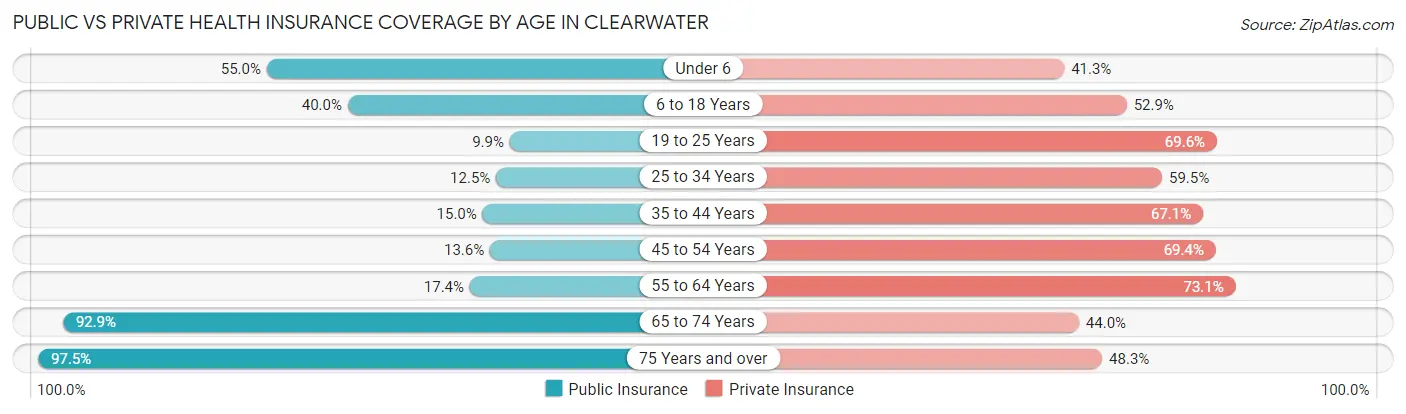
| Age Bracket | Public Insurance | Private Insurance |
| Under 6 | 3,792 (55.0%) | 2,844 (41.3%) |
| 6 to 18 Years | 5,959 (40.0%) | 7,877 (52.9%) |
| 19 to 25 Years | 806 (9.9%) | 5,643 (69.6%) |
| 25 to 34 Years | 1,755 (12.5%) | 8,367 (59.5%) |
| 35 to 44 Years | 1,915 (15.0%) | 8,566 (67.0%) |
| 45 to 54 Years | 2,098 (13.6%) | 10,699 (69.4%) |
| 55 to 64 Years | 2,908 (17.3%) | 12,247 (73.1%) |
| 65 to 74 Years | 13,614 (92.9%) | 6,448 (44.0%) |
| 75 Years and over | 11,416 (97.5%) | 5,658 (48.3%) |
| Total | 44,263 (38.4%) | 68,349 (59.3%) |
Disability Status by Sex by Age in Clearwater
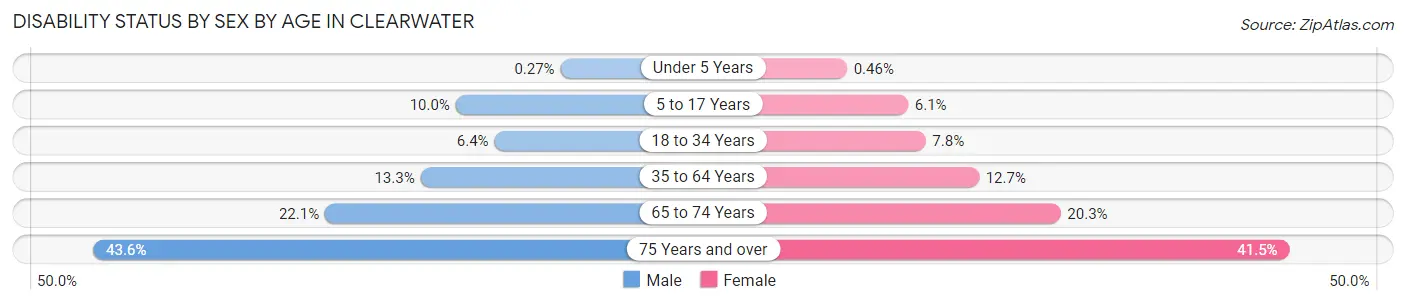
| Age Bracket | Male | Female |
| Under 5 Years | 8 (0.3%) | 12 (0.5%) |
| 5 to 17 Years | 752 (10.0%) | 458 (6.1%) |
| 18 to 34 Years | 748 (6.4%) | 907 (7.8%) |
| 35 to 64 Years | 3,010 (13.3%) | 2,828 (12.7%) |
| 65 to 74 Years | 1,576 (22.1%) | 1,527 (20.3%) |
| 75 Years and over | 2,225 (43.6%) | 2,745 (41.5%) |
Disability Class by Sex by Age in Clearwater
Disability Class: Hearing Difficulty
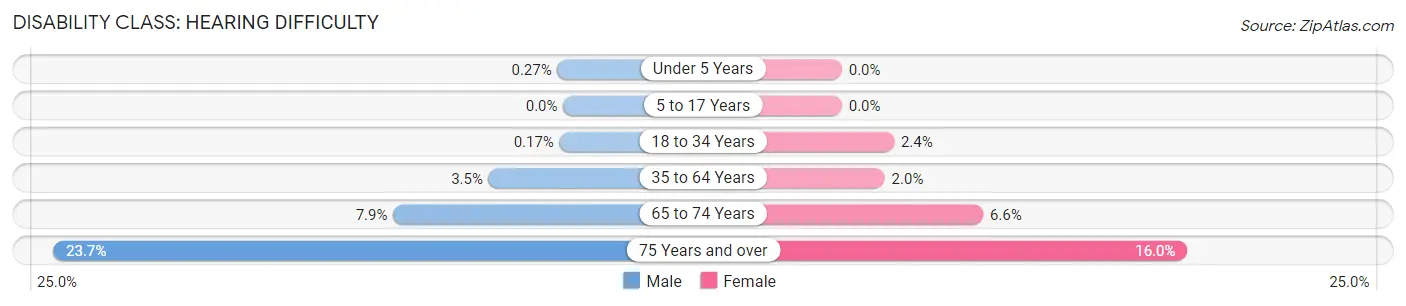
| Age Bracket | Male | Female |
| Under 5 Years | 8 (0.3%) | 0 (0.0%) |
| 5 to 17 Years | 0 (0.0%) | 0 (0.0%) |
| 18 to 34 Years | 20 (0.2%) | 283 (2.4%) |
| 35 to 64 Years | 786 (3.5%) | 442 (2.0%) |
| 65 to 74 Years | 562 (7.9%) | 493 (6.6%) |
| 75 Years and over | 1,207 (23.7%) | 1,059 (16.0%) |
Disability Class: Vision Difficulty
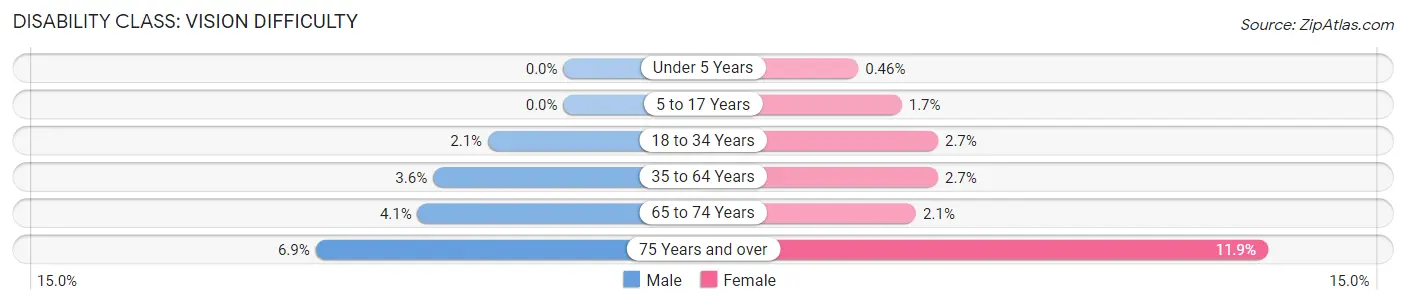
| Age Bracket | Male | Female |
| Under 5 Years | 0 (0.0%) | 12 (0.5%) |
| 5 to 17 Years | 0 (0.0%) | 125 (1.7%) |
| 18 to 34 Years | 245 (2.1%) | 313 (2.7%) |
| 35 to 64 Years | 823 (3.6%) | 596 (2.7%) |
| 65 to 74 Years | 289 (4.1%) | 156 (2.1%) |
| 75 Years and over | 352 (6.9%) | 784 (11.9%) |
Disability Class: Cognitive Difficulty
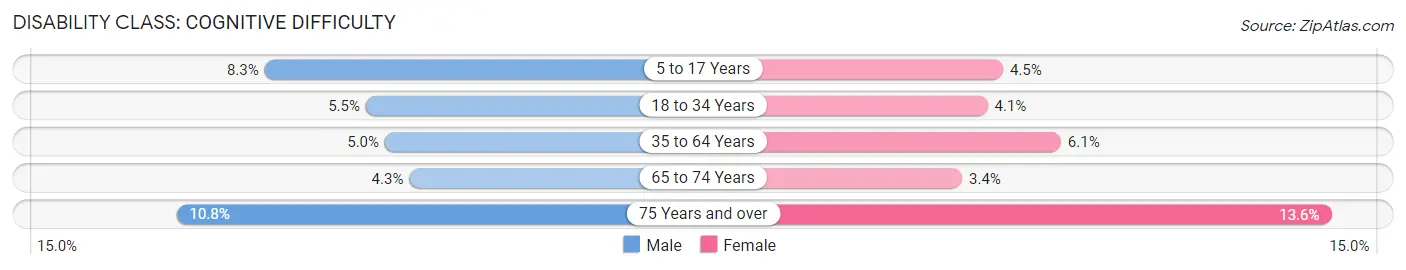
| Age Bracket | Male | Female |
| 5 to 17 Years | 626 (8.3%) | 335 (4.5%) |
| 18 to 34 Years | 643 (5.5%) | 475 (4.1%) |
| 35 to 64 Years | 1,127 (5.0%) | 1,357 (6.1%) |
| 65 to 74 Years | 306 (4.3%) | 252 (3.4%) |
| 75 Years and over | 549 (10.8%) | 901 (13.6%) |
Disability Class: Ambulatory Difficulty
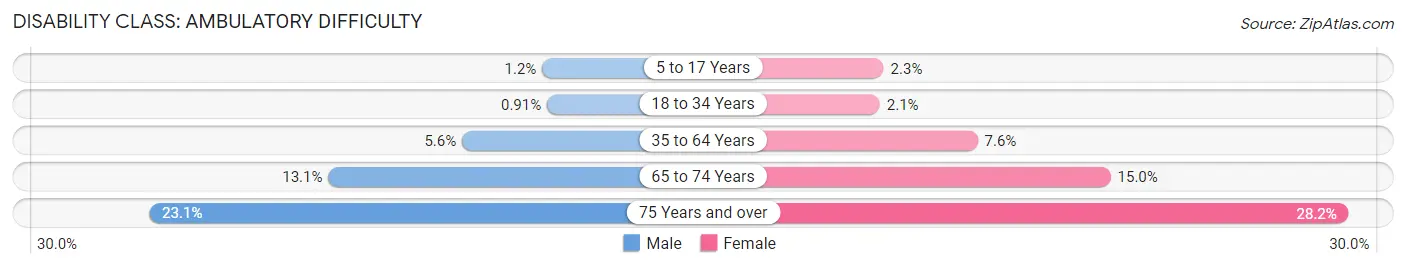
| Age Bracket | Male | Female |
| 5 to 17 Years | 89 (1.2%) | 174 (2.3%) |
| 18 to 34 Years | 106 (0.9%) | 248 (2.1%) |
| 35 to 64 Years | 1,280 (5.6%) | 1,682 (7.6%) |
| 65 to 74 Years | 933 (13.1%) | 1,127 (15.0%) |
| 75 Years and over | 1,176 (23.1%) | 1,865 (28.2%) |
Disability Class: Self-Care Difficulty
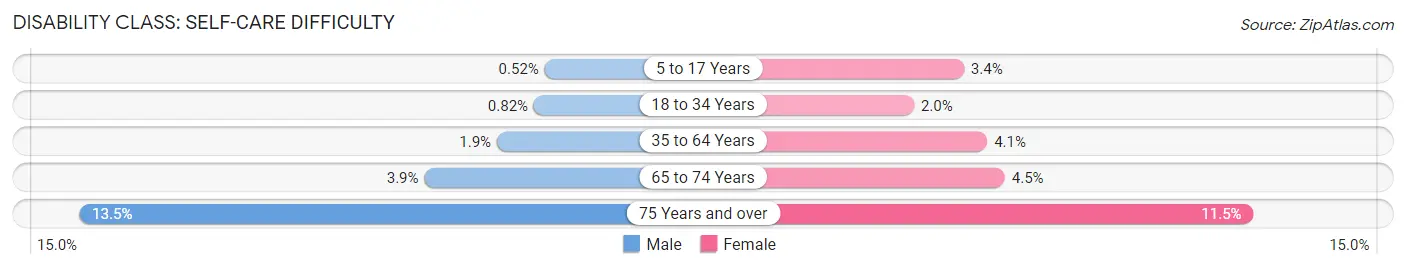
| Age Bracket | Male | Female |
| 5 to 17 Years | 39 (0.5%) | 254 (3.4%) |
| 18 to 34 Years | 96 (0.8%) | 235 (2.0%) |
| 35 to 64 Years | 419 (1.8%) | 901 (4.1%) |
| 65 to 74 Years | 276 (3.9%) | 342 (4.5%) |
| 75 Years and over | 687 (13.5%) | 757 (11.5%) |
Technology Access in Clearwater
Computing Device Access in Clearwater
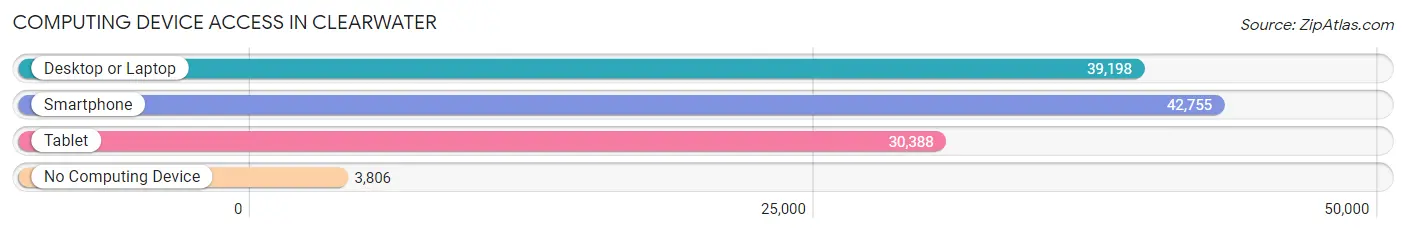
| Device Type | # Households | % Households |
| Desktop or Laptop | 39,198 | 79.0% |
| Smartphone | 42,755 | 86.2% |
| Tablet | 30,388 | 61.3% |
| No Computing Device | 3,806 | 7.7% |
| Total | 49,592 | 100.0% |
Internet Access in Clearwater
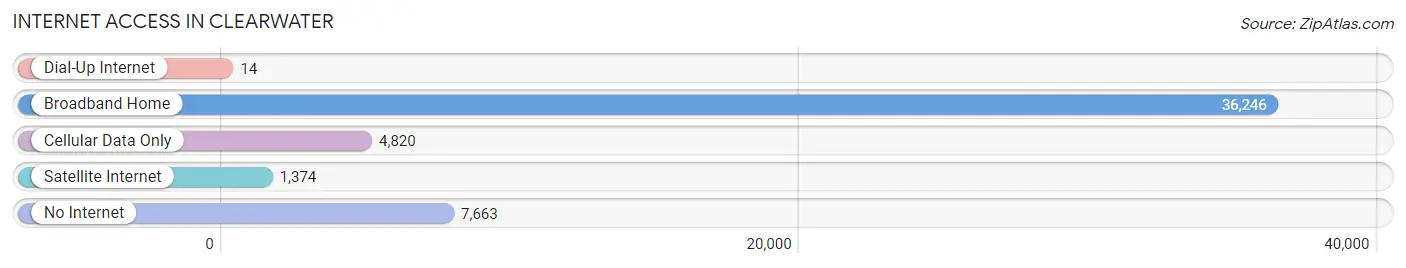
| Internet Type | # Households | % Households |
| Dial-Up Internet | 14 | 0.0% |
| Broadband Home | 36,246 | 73.1% |
| Cellular Data Only | 4,820 | 9.7% |
| Satellite Internet | 1,374 | 2.8% |
| No Internet | 7,663 | 15.4% |
| Total | 49,592 | 100.0% |
Clearwater Summary
Clearwater, Florida is a city located in Pinellas County, Florida, United States. It is the county seat of Pinellas County and is the third-largest city in the Tampa Bay Area, after Tampa and St. Petersburg. Clearwater is located on the Gulf of Mexico, just west of Tampa Bay. The city is known for its beautiful beaches, its vibrant downtown, and its many attractions.
Geography
Clearwater is located on the west coast of Florida, on the Gulf of Mexico. The city is bordered by the cities of Largo to the north, Dunedin to the east, Safety Harbor to the south, and Belleair Beach to the west. Clearwater is situated on a peninsula, with the Gulf of Mexico to the west and Tampa Bay to the east. The city has a total area of 40.6 square miles, of which 35.3 square miles is land and 5.3 square miles is water.
The city is home to several parks and beaches, including Clearwater Beach, Sand Key Park, and Caladesi Island State Park. Clearwater Beach is a popular destination for tourists and locals alike, with its white sand beaches and crystal clear waters. Sand Key Park is a popular spot for swimming, fishing, and picnicking, and Caladesi Island State Park is a great spot for kayaking, fishing, and bird watching.
Economy
Clearwater’s economy is largely driven by tourism, with the city’s beaches and attractions drawing in visitors from around the world. The city is also home to several major employers, including Tech Data Corporation, Raymond James Financial, and BayCare Health System.
The city’s economy is also supported by a strong manufacturing sector, with companies such as Honeywell, Jabil Circuit, and Lockheed Martin all having a presence in the city. Additionally, Clearwater is home to several major retail outlets, including the Clearwater Mall and the Countryside Mall.
Demographics
As of the 2010 census, Clearwater had a population of 107,685. The city’s population is diverse, with the largest racial group being White (77.2%), followed by African American (13.3%), Hispanic or Latino (7.2%), and Asian (2.2%).
The median household income in Clearwater is $45,845, and the median age is 42. The city’s population is well-educated, with over 80% of residents having at least a high school diploma and over 30% having a bachelor’s degree or higher.
History
Clearwater was first settled in 1842 by a group of settlers from Ohio. The city was originally known as Clear Water Harbor, and was incorporated in 1891. The city grew rapidly in the early 20th century, and by the 1950s, it had become a popular tourist destination.
In the 1960s, Clearwater was the site of a major civil rights movement, with the city becoming a major center for the struggle for racial equality. The city was also the site of the Clearwater Jazz Holiday, an annual music festival that has been held since 1982.
Today, Clearwater is a vibrant city with a thriving economy and a diverse population. The city is home to several attractions, including the Clearwater Marine Aquarium, the Clearwater Beach Boardwalk, and the Clearwater Jazz Holiday. Clearwater is also home to several major employers, and is a popular destination for tourists and locals alike.
Common Questions
What is Per Capita Income in Clearwater?
Per Capita income in Clearwater is $39,315.
What is the Median Family Income in Clearwater?
Median Family Income in Clearwater is $81,820.
What is the Median Household income in Clearwater?
Median Household Income in Clearwater is $59,358.
What is Income or Wage Gap in Clearwater?
Income or Wage Gap in Clearwater is 17.2%.
Women in Clearwater earn 82.8 cents for every dollar earned by a man.
What is Family Income Deficit in Clearwater?
Family Income Deficit in Clearwater is $11,332.
Families that are below poverty line in Clearwater earn $11,332 less on average than the poverty threshold level.
What is Inequality or Gini Index in Clearwater?
Inequality or Gini Index in Clearwater is 0.50.
What is the Total Population of Clearwater?
Total Population of Clearwater is 116,984.
What is the Total Male Population of Clearwater?
Total Male Population of Clearwater is 57,947.
What is the Total Female Population of Clearwater?
Total Female Population of Clearwater is 59,037.
What is the Ratio of Males per 100 Females in Clearwater?
There are 98.15 Males per 100 Females in Clearwater.
What is the Ratio of Females per 100 Males in Clearwater?
There are 101.88 Females per 100 Males in Clearwater.
What is the Median Population Age in Clearwater?
Median Population Age in Clearwater is 46.0 Years.
What is the Average Family Size in Clearwater
Average Family Size in Clearwater is 3.0 People.
What is the Average Household Size in Clearwater
Average Household Size in Clearwater is 2.3 People.
How Large is the Labor Force in Clearwater?
There are 57,861 People in the Labor Forcein in Clearwater.
What is the Percentage of People in the Labor Force in Clearwater?
58.9% of People are in the Labor Force in Clearwater.
What is the Unemployment Rate in Clearwater?
Unemployment Rate in Clearwater is 4.7%.