Area Code 239 Map & Demographics
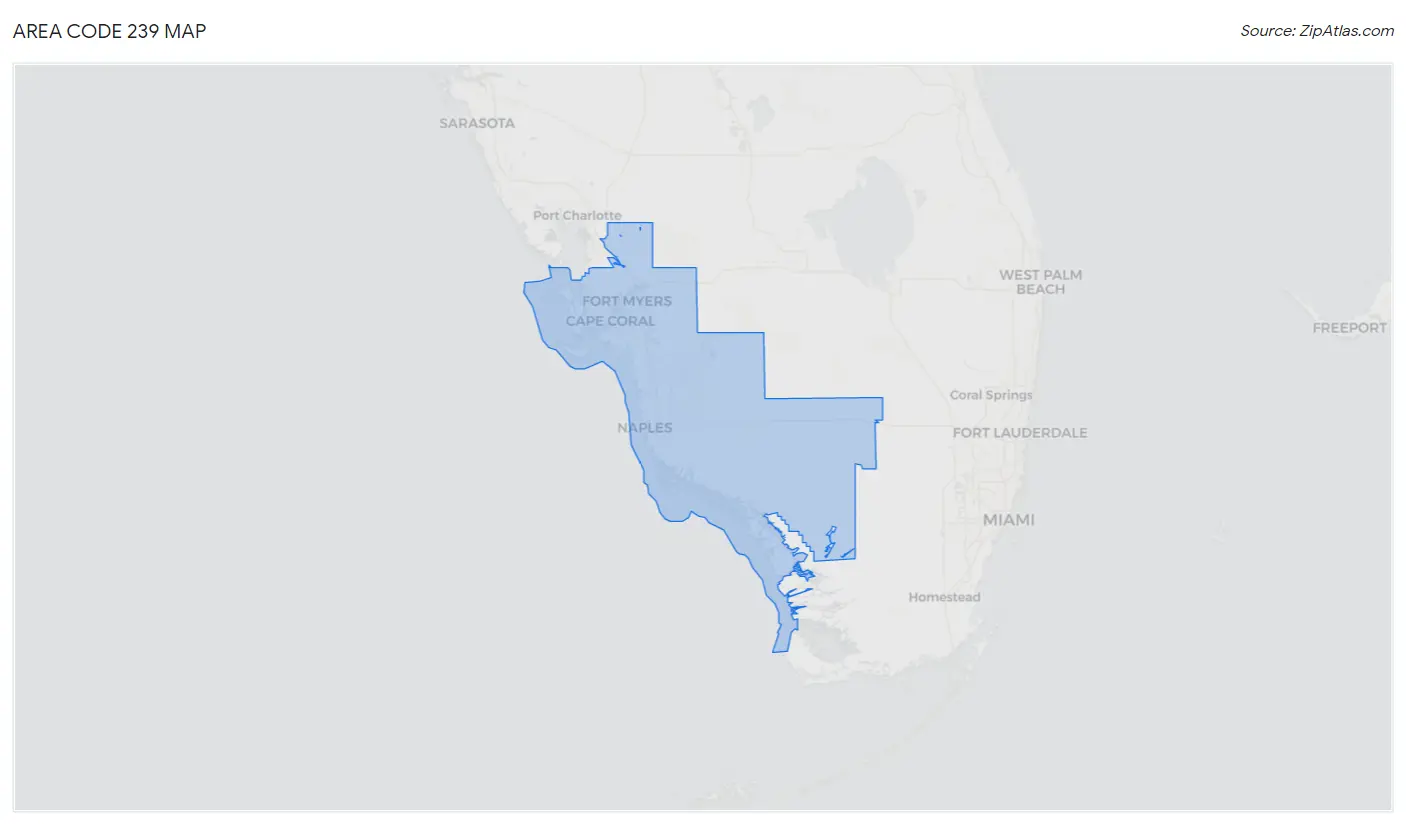
Area Code 239 Map
Area Code 239 Overview
$47,968
PER CAPITA INCOME
$91,907
AVG FAMILY INCOME
$76,533
AVG HOUSEHOLD INCOME
24.4%
WAGE / INCOME GAP [ % ]
75.6¢/ $1
WAGE / INCOME GAP [ $ ]
$10,569
FAMILY INCOME DEFICIT
25.72
INEQUALITY / GINI INDEX
1,262,982
TOTAL POPULATION
621,028
MALE POPULATION
641,954
FEMALE POPULATION
96.74
MALES / 100 FEMALES
103.37
FEMALES / 100 MALES
49.3
MEDIAN AGE
3.0
AVG FAMILY SIZE
2.5
AVG HOUSEHOLD SIZE
544,366
LABOR FORCE [ PEOPLE ]
50.9%
PERCENT IN LABOR FORCE
4.5%
UNEMPLOYMENT RATE
Income in Area Code 239
Income Overview in Area Code 239
Per Capita Income in Area Code 239 is $47,968, while median incomes of families and households are $91,907 and $76,533 respectively.
| Characteristic | Number | Measure |
| Per Capita Income | 1,262,982 | $47,968 |
| Median Family Income | 334,639 | $91,907 |
| Mean Family Income | 334,639 | $7,130,576 |
| Median Household Income | 507,445 | $76,533 |
| Mean Household Income | 507,445 | $6,168,096 |
| Income Deficit | 334,639 | $10,569 |
| Wage / Income Gap (%) | 1,262,982 | 24.45% |
| Wage / Income Gap ($) | 1,262,982 | 75.55¢ per $1 |
| Gini / Inequality Index | 1,262,982 | 25.72 |
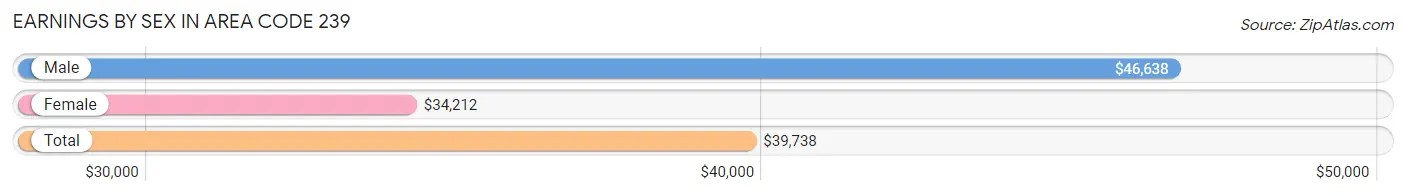
Earnings by Sex in Area Code 239
Average Earnings in Area Code 239 are $39,738, $46,638 for men and $34,212 for women, a difference of 26.6%.
| Sex | Number | Average Earnings |
| Male | 313,395 (53.2%) | $46,638 |
| Female | 275,306 (46.8%) | $34,212 |
| Total | 588,701 (100.0%) | $39,738 |
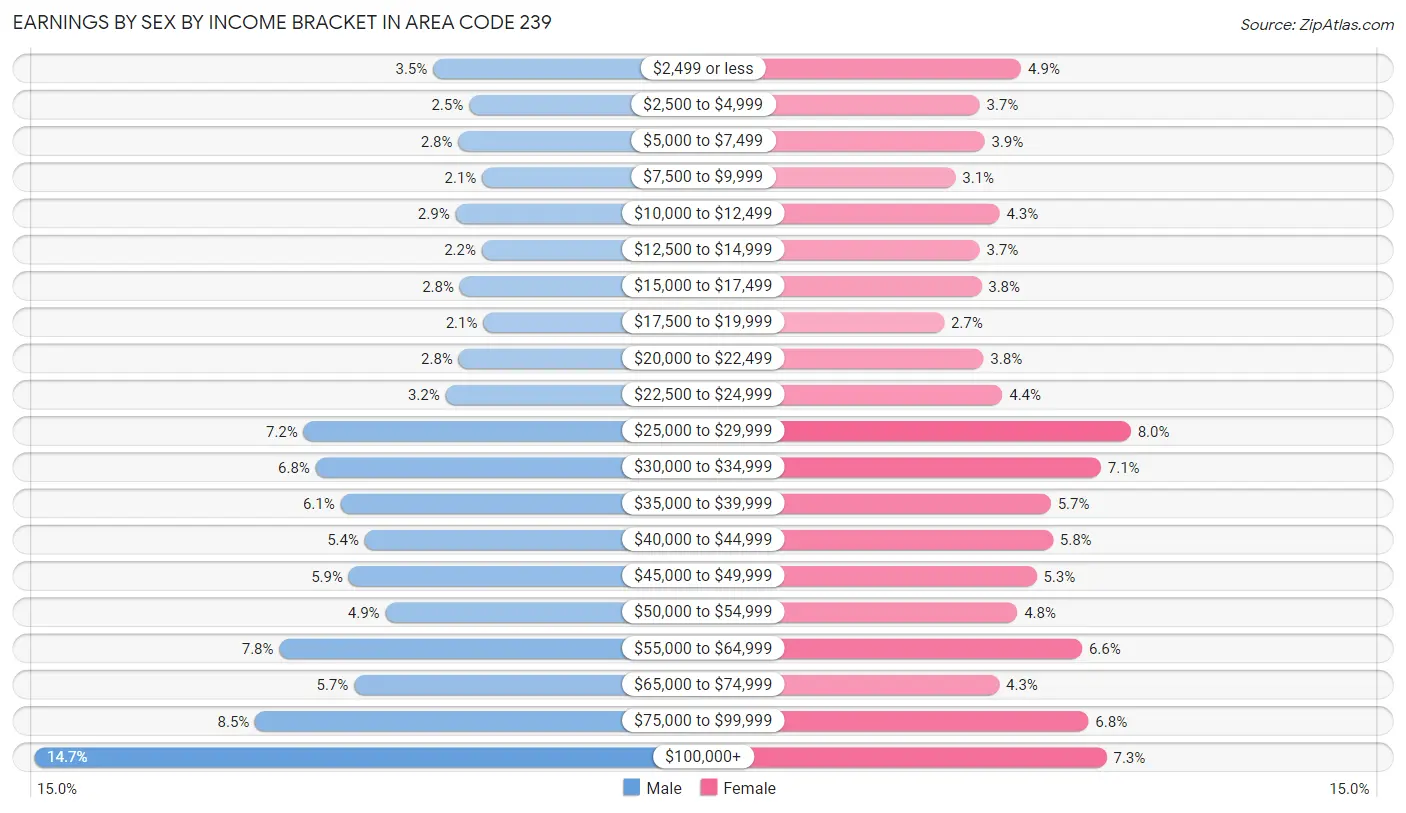
Earnings by Sex by Income Bracket in Area Code 239
The most common earnings brackets in Area Code 239 are $100,000+ for men (46,173 | 14.7%) and $25,000 to $29,999 for women (21,960 | 8.0%).
| Income | Male | Female |
| $2,499 or less | 11,020 (3.5%) | 13,477 (4.9%) |
| $2,500 to $4,999 | 7,851 (2.5%) | 10,264 (3.7%) |
| $5,000 to $7,499 | 8,819 (2.8%) | 10,642 (3.9%) |
| $7,500 to $9,999 | 6,719 (2.1%) | 8,389 (3.0%) |
| $10,000 to $12,499 | 9,060 (2.9%) | 11,801 (4.3%) |
| $12,500 to $14,999 | 6,747 (2.1%) | 10,279 (3.7%) |
| $15,000 to $17,499 | 8,693 (2.8%) | 10,417 (3.8%) |
| $17,500 to $19,999 | 6,600 (2.1%) | 7,527 (2.7%) |
| $20,000 to $22,499 | 8,778 (2.8%) | 10,565 (3.8%) |
| $22,500 to $24,999 | 9,930 (3.2%) | 12,027 (4.4%) |
| $25,000 to $29,999 | 22,452 (7.2%) | 21,960 (8.0%) |
| $30,000 to $34,999 | 21,384 (6.8%) | 19,645 (7.1%) |
| $35,000 to $39,999 | 19,188 (6.1%) | 15,783 (5.7%) |
| $40,000 to $44,999 | 17,041 (5.4%) | 15,933 (5.8%) |
| $45,000 to $49,999 | 18,448 (5.9%) | 14,661 (5.3%) |
| $50,000 to $54,999 | 15,239 (4.9%) | 13,195 (4.8%) |
| $55,000 to $64,999 | 24,563 (7.8%) | 18,185 (6.6%) |
| $65,000 to $74,999 | 17,975 (5.7%) | 11,776 (4.3%) |
| $75,000 to $99,999 | 26,715 (8.5%) | 18,681 (6.8%) |
| $100,000+ | 46,173 (14.7%) | 20,099 (7.3%) |
| Total | 313,395 (100.0%) | 275,306 (100.0%) |
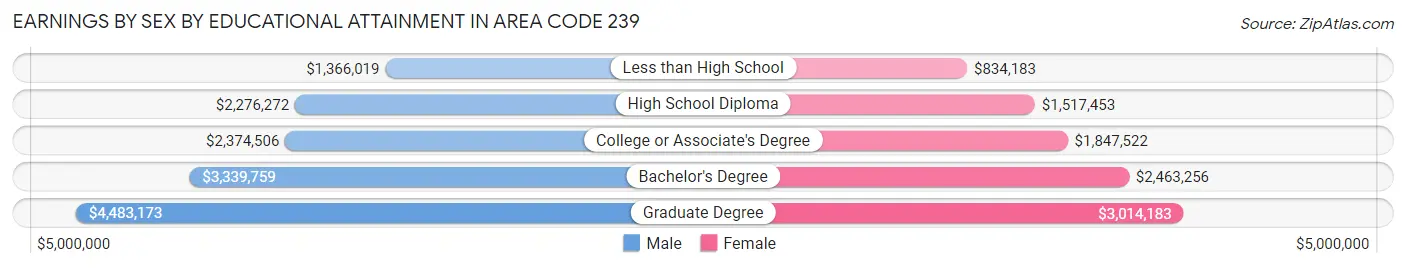
Earnings by Sex by Educational Attainment in Area Code 239
Average earnings in Area Code 239 are $2,679,421 for men and $1,998,109 for women, a difference of 25.4%. Men with an educational attainment of graduate degree enjoy the highest average annual earnings of $4,483,173, while those with less than high school education earn the least with $1,366,019. Women with an educational attainment of graduate degree earn the most with the average annual earnings of $3,014,183, while those with less than high school education have the smallest earnings of $834,183.
| Educational Attainment | Male Income | Female Income |
| Less than High School | $1,366,019 | $834,183 |
| High School Diploma | $2,276,272 | $1,517,453 |
| College or Associate's Degree | $2,374,506 | $1,847,522 |
| Bachelor's Degree | $3,339,759 | $2,463,256 |
| Graduate Degree | $4,483,173 | $3,014,183 |
| Total | $2,679,421 | $1,998,109 |
Family Income in Area Code 239
Family Income Brackets in Area Code 239
According to the Area Code 239 family income data, there are 3,395,247 families falling into the $100,000 to $149,999 income range, which is the most common income bracket and makes up 1,014.6% of all families. Conversely, the $10,000 to $14,999 income bracket is the least frequent group with only 286,451 families (85.6%) belonging to this category.
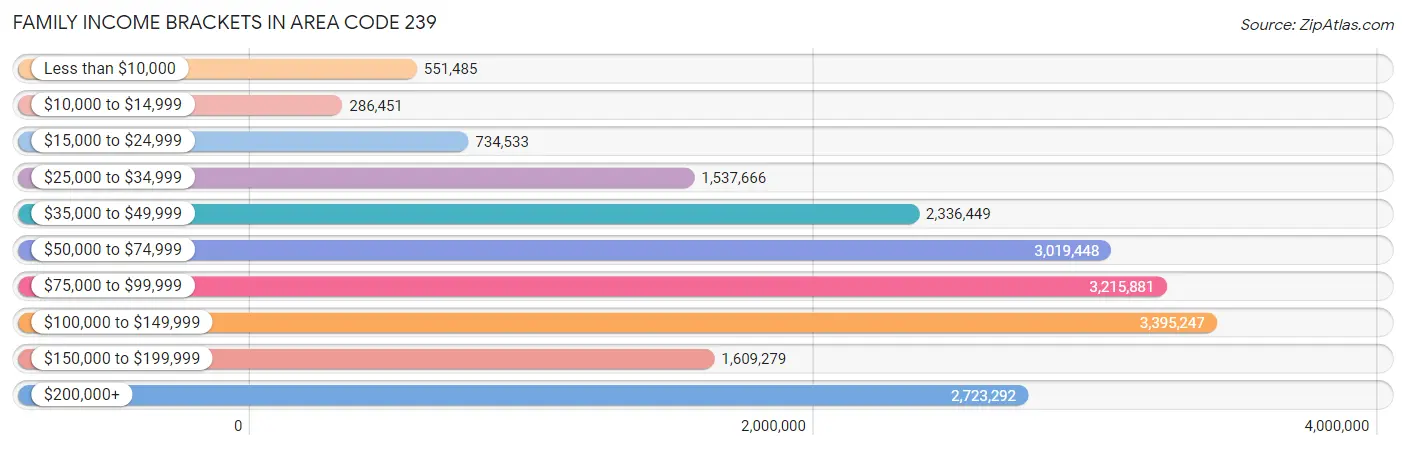
| Income Bracket | # Families | % Families |
| Less than $10,000 | 551,485 | 164.8% |
| $10,000 to $14,999 | 286,451 | 85.6% |
| $15,000 to $24,999 | 734,533 | 219.5% |
| $25,000 to $34,999 | 1,537,666 | 459.5% |
| $35,000 to $49,999 | 2,336,449 | 698.2% |
| $50,000 to $74,999 | 3,019,448 | 902.3% |
| $75,000 to $99,999 | 3,215,881 | 961.0% |
| $100,000 to $149,999 | 3,395,247 | 1,014.6% |
| $150,000 to $199,999 | 1,609,279 | 480.9% |
| $200,000+ | 2,723,292 | 813.8% |
Family Income by Famaliy Size in Area Code 239
6-person families (7,224 | 2.2%) account for the highest median family income in Area Code 239 with $109,880 per family, while 2-person families (204,886 | 61.2%) have the highest median income of $44,725 per family member.
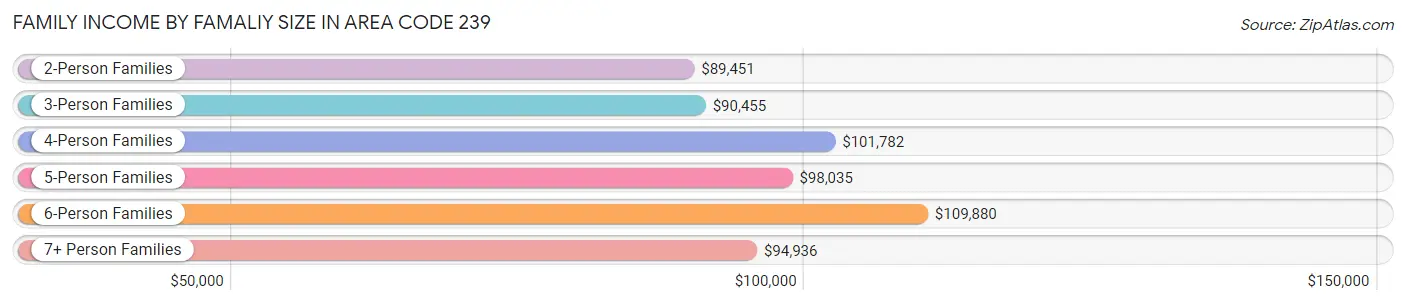
| Income Bracket | # Families | Median Income |
| 2-Person Families | 204,886 (61.2%) | $89,451 |
| 3-Person Families | 56,271 (16.8%) | $90,455 |
| 4-Person Families | 43,082 (12.9%) | $101,782 |
| 5-Person Families | 19,357 (5.8%) | $98,035 |
| 6-Person Families | 7,224 (2.2%) | $109,880 |
| 7+ Person Families | 3,819 (1.1%) | $94,936 |
| Total | 334,639 (100.0%) | $91,907 |
Family Income by Number of Earners in Area Code 239
The median family income in Area Code 239 is $91,907, with families comprising 3+ earners (26,458) having the highest median family income of $126,321, while families with no earners (97,232) have the lowest median family income of $72,562, accounting for 7.9% and 29.1% of families, respectively.
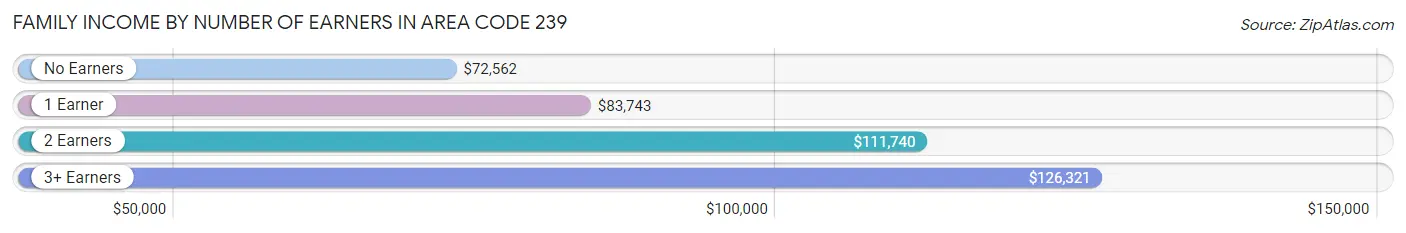
| Number of Earners | # Families | Median Income |
| No Earners | 97,232 (29.1%) | $72,562 |
| 1 Earner | 100,867 (30.1%) | $83,743 |
| 2 Earners | 110,082 (32.9%) | $111,740 |
| 3+ Earners | 26,458 (7.9%) | $126,321 |
| Total | 334,639 (100.0%) | $91,907 |
Household Income in Area Code 239
Household Income Brackets in Area Code 239
With 4,534,021 households falling in the category, the $75,000 to $99,999 income range is the most frequent in Area Code 239, accounting for 893.5% of all households. In contrast, only 1,381,265 households (272.2%) fall into the $10,000 to $14,999 income bracket, making it the least populous group.
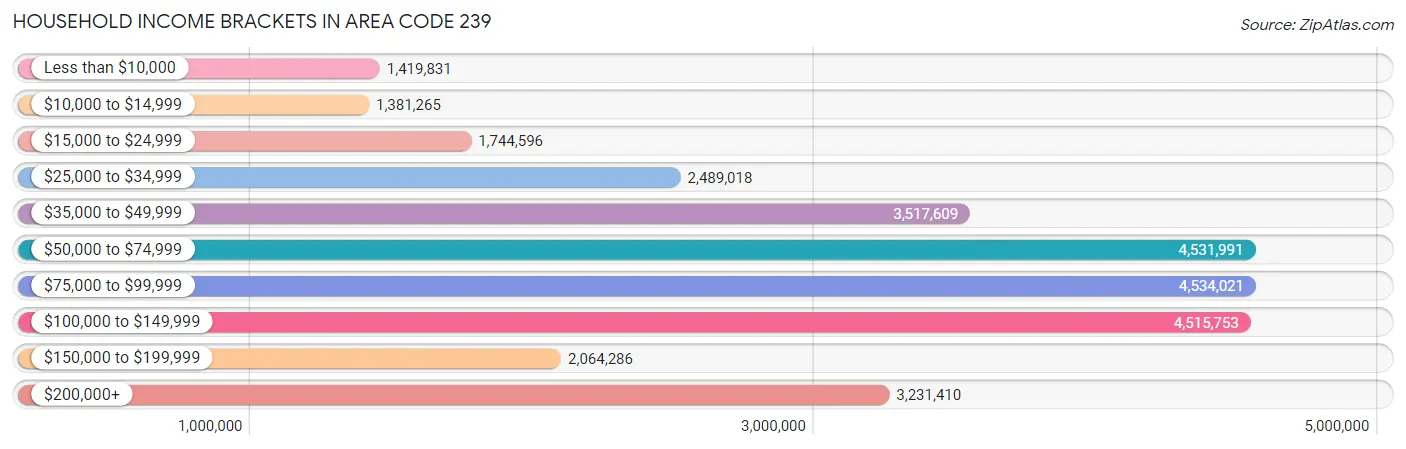
| Income Bracket | # Households | % Households |
| Less than $10,000 | 1,419,831 | 279.8% |
| $10,000 to $14,999 | 1,381,265 | 272.2% |
| $15,000 to $24,999 | 1,744,596 | 343.8% |
| $25,000 to $34,999 | 2,489,018 | 490.5% |
| $35,000 to $49,999 | 3,517,609 | 693.2% |
| $50,000 to $74,999 | 4,531,991 | 893.1% |
| $75,000 to $99,999 | 4,534,021 | 893.5% |
| $100,000 to $149,999 | 4,515,753 | 889.9% |
| $150,000 to $199,999 | 2,064,286 | 406.8% |
| $200,000+ | 3,231,410 | 636.8% |
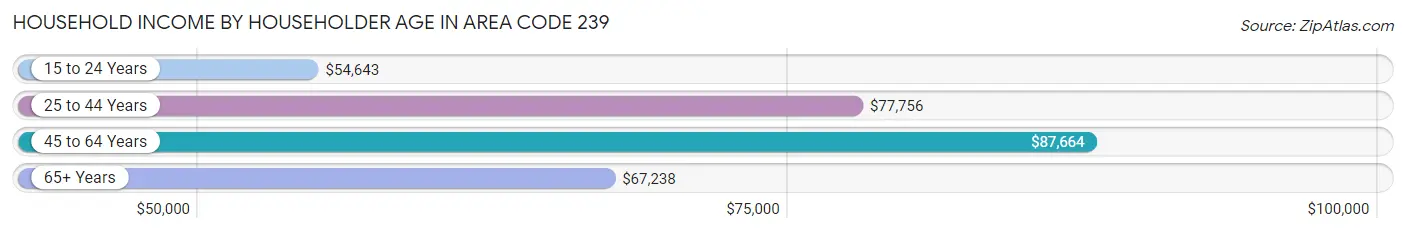
Household Income by Householder Age in Area Code 239
The median household income in Area Code 239 is $76,533, with the highest median household income of $87,664 found in the 45 to 64 years age bracket for the primary householder. A total of 167,179 households (33.0%) fall into this category. Meanwhile, the 15 to 24 years age bracket for the primary householder has the lowest median household income of $54,643, with 9,158 households (1.8%) in this group.
| Income Bracket | # Households | Median Income |
| 15 to 24 Years | 9,158 (1.8%) | $54,643 |
| 25 to 44 Years | 112,586 (22.2%) | $77,756 |
| 45 to 64 Years | 167,179 (33.0%) | $87,664 |
| 65+ Years | 218,522 (43.1%) | $67,238 |
| Total | 507,445 (100.0%) | $76,533 |
Poverty in Area Code 239
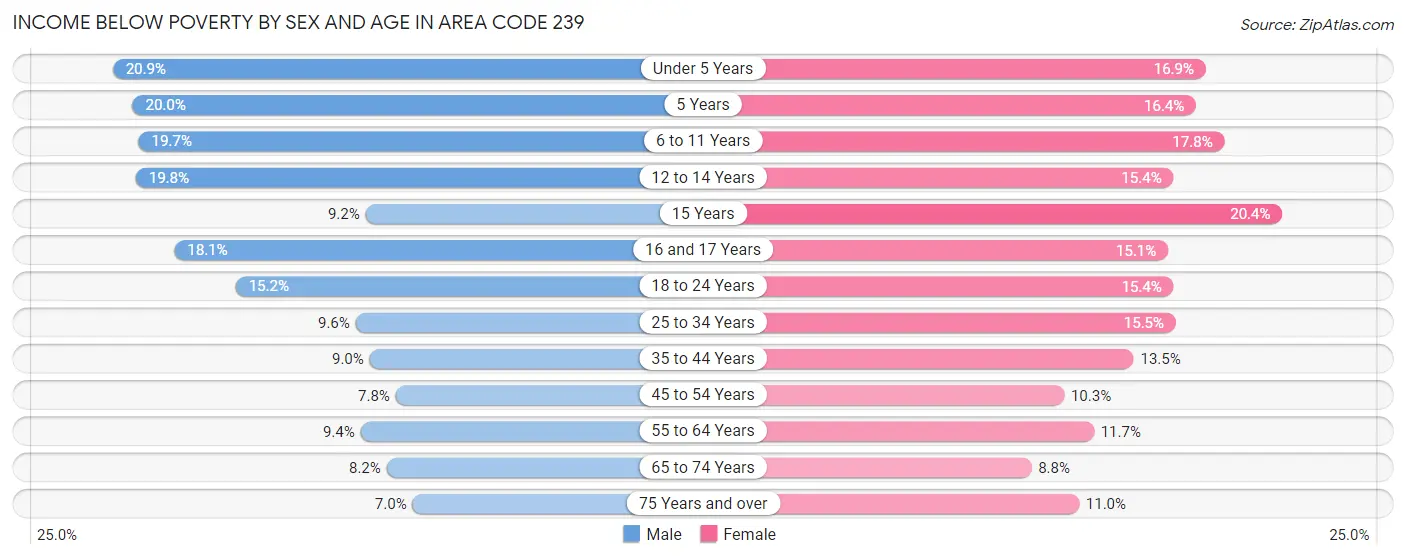
Income Below Poverty by Sex and Age in Area Code 239
With 10.9% poverty level for males and 12.7% for females among the residents of Area Code 239, under 5 year old males and 15 year old females are the most vulnerable to poverty, with 6,049 males (20.9%) and 1,242 females (20.4%) in their respective age groups living below the poverty level.
| Age Bracket | Male | Female |
| Under 5 Years | 6,049 (20.9%) | 4,671 (16.9%) |
| 5 Years | 1,106 (20.0%) | 884 (16.4%) |
| 6 to 11 Years | 7,073 (19.7%) | 6,357 (17.8%) |
| 12 to 14 Years | 4,227 (19.8%) | 2,827 (15.4%) |
| 15 Years | 661 (9.2%) | 1,242 (20.4%) |
| 16 and 17 Years | 2,395 (18.0%) | 2,037 (15.1%) |
| 18 to 24 Years | 6,583 (15.2%) | 6,373 (15.4%) |
| 25 to 34 Years | 6,525 (9.6%) | 10,118 (15.5%) |
| 35 to 44 Years | 5,838 (9.0%) | 8,595 (13.5%) |
| 45 to 54 Years | 5,442 (7.8%) | 7,439 (10.3%) |
| 55 to 64 Years | 7,720 (9.4%) | 10,711 (11.7%) |
| 65 to 74 Years | 7,294 (8.2%) | 8,837 (8.8%) |
| 75 Years and over | 5,864 (7.0%) | 10,223 (11.0%) |
| Total | 66,777 (10.9%) | 80,314 (12.7%) |
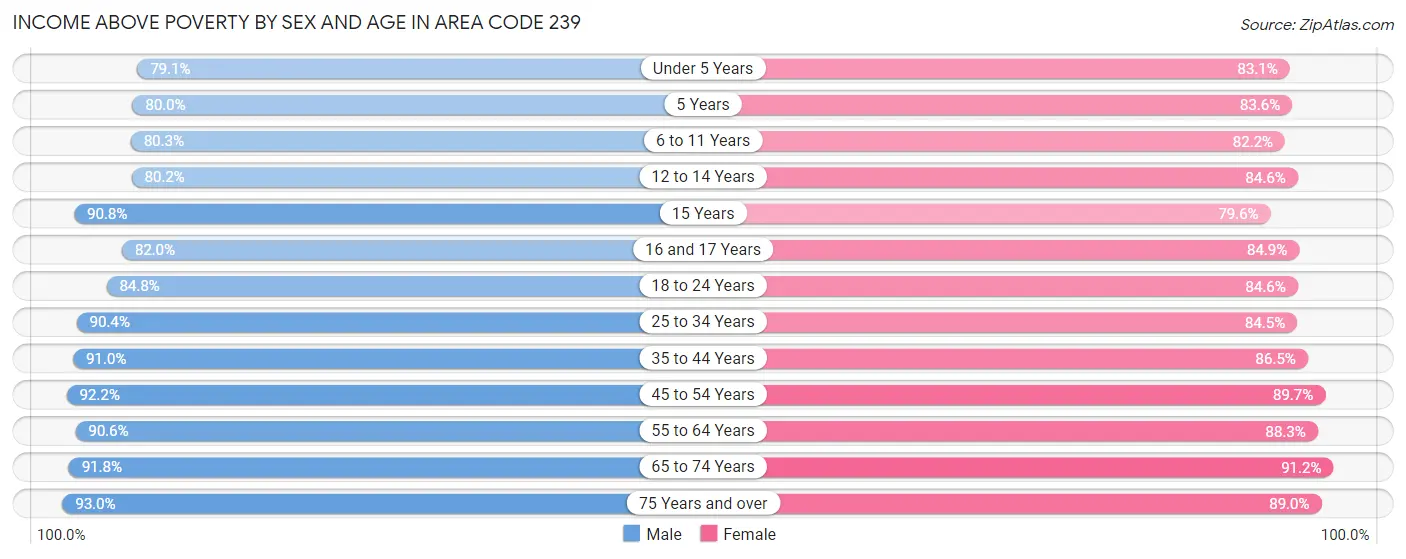
Income Above Poverty by Sex and Age in Area Code 239
According to the poverty statistics in Area Code 239, males aged 75 years and over and females aged 65 to 74 years are the age groups that are most secure financially, with 93.0% of males and 91.2% of females in these age groups living above the poverty line.
| Age Bracket | Male | Female |
| Under 5 Years | 22,878 (79.1%) | 22,986 (83.1%) |
| 5 Years | 4,426 (80.0%) | 4,494 (83.6%) |
| 6 to 11 Years | 28,813 (80.3%) | 29,429 (82.2%) |
| 12 to 14 Years | 17,079 (80.2%) | 15,548 (84.6%) |
| 15 Years | 6,542 (90.8%) | 4,833 (79.6%) |
| 16 and 17 Years | 10,871 (82.0%) | 11,417 (84.9%) |
| 18 to 24 Years | 36,728 (84.8%) | 35,017 (84.6%) |
| 25 to 34 Years | 61,174 (90.4%) | 55,178 (84.5%) |
| 35 to 44 Years | 59,104 (91.0%) | 54,884 (86.5%) |
| 45 to 54 Years | 64,483 (92.2%) | 64,716 (89.7%) |
| 55 to 64 Years | 74,291 (90.6%) | 80,930 (88.3%) |
| 65 to 74 Years | 81,696 (91.8%) | 91,749 (91.2%) |
| 75 Years and over | 77,886 (93.0%) | 82,675 (89.0%) |
| Total | 545,971 (89.1%) | 553,856 (87.3%) |
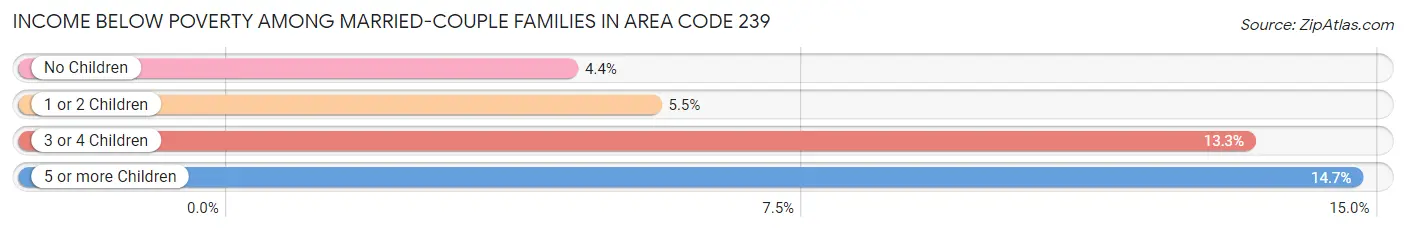
Income Below Poverty Among Married-Couple Families in Area Code 239
The poverty statistics for married-couple families in Area Code 239 show that 5.1% or 13,486 of the total 263,283 families live below the poverty line. Families with 5 or more children have the highest poverty rate of 14.7%, comprising of 156 families. On the other hand, families with no children have the lowest poverty rate of 4.4%, which includes 8,568 families.
| Children | Above Poverty | Below Poverty |
| No Children | 184,404 (95.6%) | 8,568 (4.4%) |
| 1 or 2 Children | 54,097 (94.5%) | 3,169 (5.5%) |
| 3 or 4 Children | 10,390 (86.7%) | 1,593 (13.3%) |
| 5 or more Children | 906 (85.3%) | 156 (14.7%) |
| Total | 249,797 (94.9%) | 13,486 (5.1%) |
Income Below Poverty Among Single-Parent Households in Area Code 239
According to the poverty data in Area Code 239, 13.3% or 2,922 single-father households and 22.1% or 10,911 single-mother households are living below the poverty line. Among single-father households, those with 5 or more children have the highest poverty rate, with 120 households (48.6%) experiencing poverty. Likewise, among single-mother households, those with 5 or more children have the highest poverty rate, with 231 households (67.1%) falling below the poverty line.
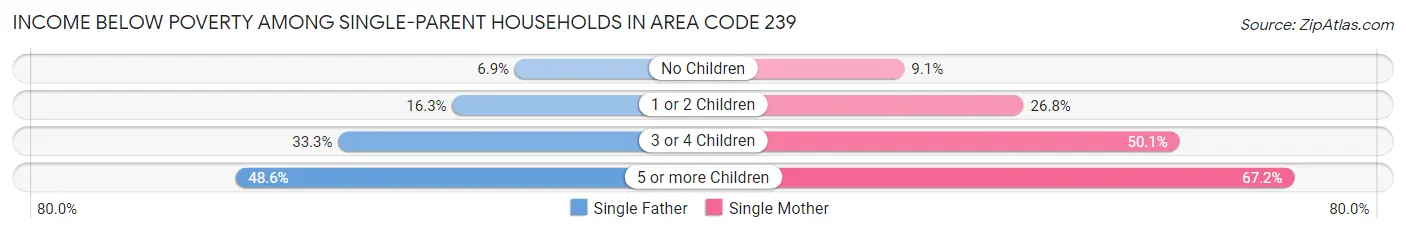
| Children | Single Father | Single Mother |
| No Children | 711 (6.9%) | 1,903 (9.0%) |
| 1 or 2 Children | 1,656 (16.3%) | 6,032 (26.8%) |
| 3 or 4 Children | 435 (33.3%) | 2,745 (50.1%) |
| 5 or more Children | 120 (48.6%) | 231 (67.1%) |
| Total | 2,922 (13.3%) | 10,911 (22.1%) |
Income Below Poverty Among Married-Couple vs Single-Parent Households in Area Code 239
The poverty data for Area Code 239 shows that 13,486 of the married-couple family households (5.1%) and 13,833 of the single-parent households (19.4%) are living below the poverty level. Within the married-couple family households, those with 5 or more children have the highest poverty rate, with 156 households (14.7%) falling below the poverty line. Among the single-parent households, those with 5 or more children have the highest poverty rate, with 351 household (59.4%) living below poverty.
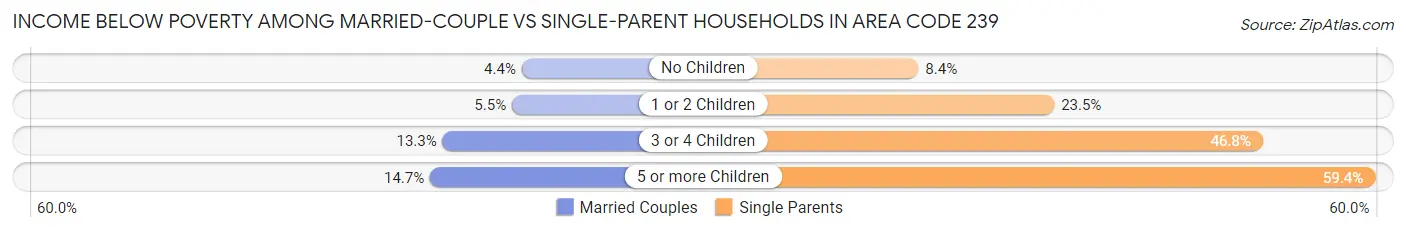
| Children | Married-Couple Families | Single-Parent Households |
| No Children | 8,568 (4.4%) | 2,614 (8.4%) |
| 1 or 2 Children | 3,169 (5.5%) | 7,688 (23.5%) |
| 3 or 4 Children | 1,593 (13.3%) | 3,180 (46.8%) |
| 5 or more Children | 156 (14.7%) | 351 (59.4%) |
| Total | 13,486 (5.1%) | 13,833 (19.4%) |
Race in Area Code 239
The most populous races in Area Code 239 are White / Caucasian (917,441 | 72.6%), Hispanic or Latino (314,841 | 24.9%), and Two or more Races (155,464 | 12.3%).
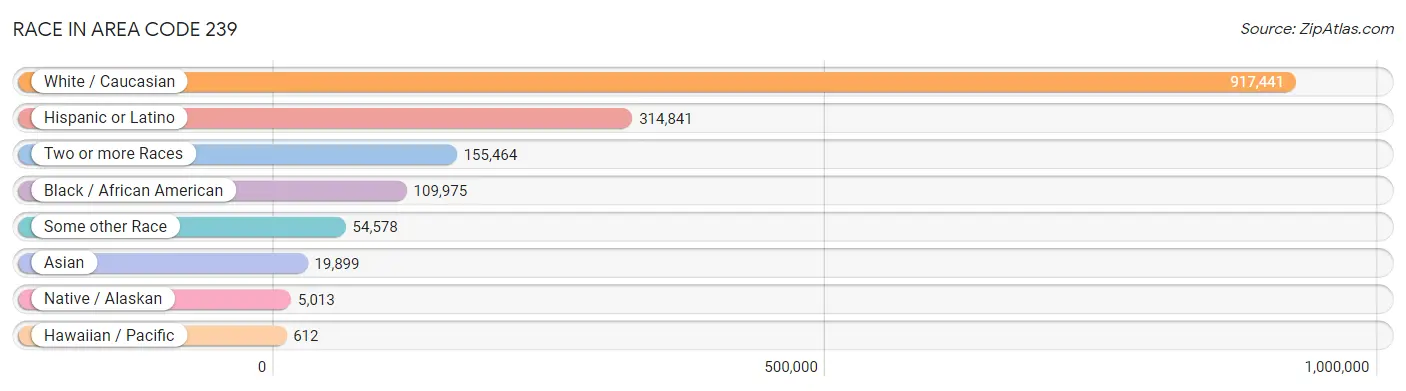
| Race | # Population | % Population |
| Asian | 19,899 | 1.6% |
| Black / African American | 109,975 | 8.7% |
| Hawaiian / Pacific | 612 | 0.1% |
| Hispanic or Latino | 314,841 | 24.9% |
| Native / Alaskan | 5,013 | 0.4% |
| White / Caucasian | 917,441 | 72.6% |
| Two or more Races | 155,464 | 12.3% |
| Some other Race | 54,578 | 4.3% |
| Total | 1,262,982 | 100.0% |
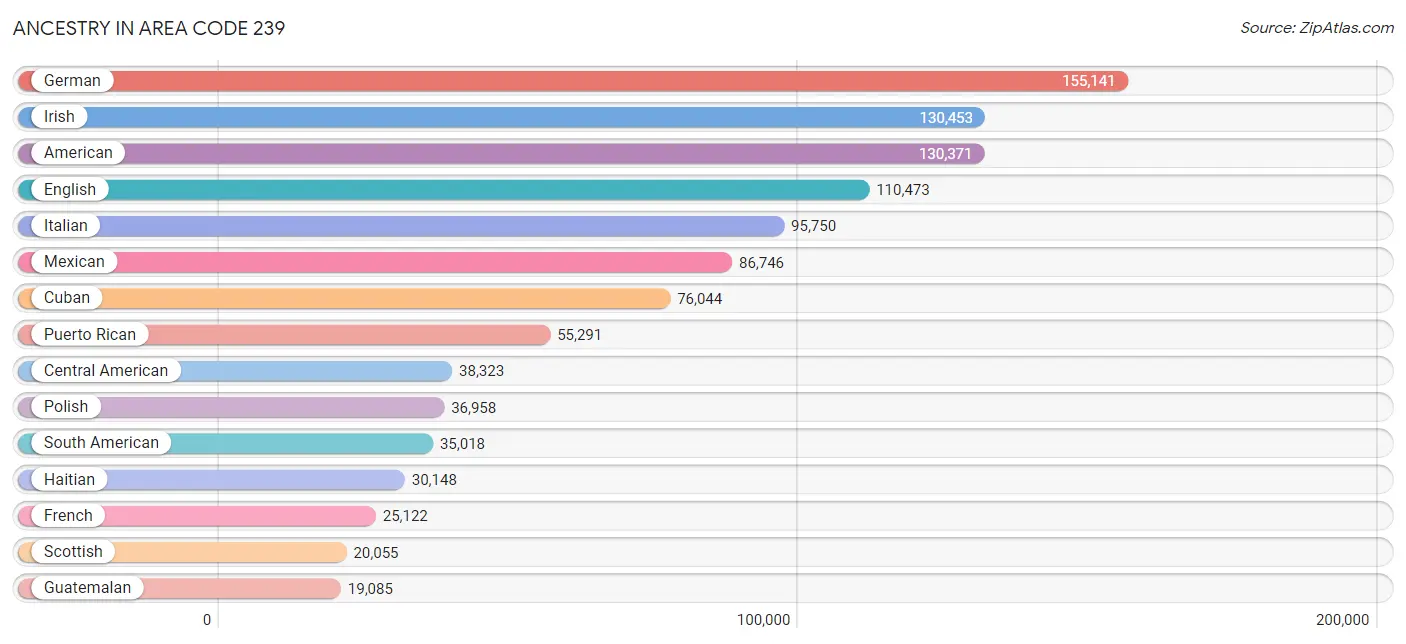
Ancestry in Area Code 239
The most populous ancestries reported in Area Code 239 are German (155,141 | 12.3%), Irish (130,453 | 10.3%), American (130,371 | 10.3%), English (110,473 | 8.7%), and Italian (95,750 | 7.6%), together accounting for 49.3% of all Area Code 239 residents.
| Ancestry | # Population | % Population |
| Afghan | 30 | 0.0% |
| African | 3,102 | 0.3% |
| Alaska Native | 64 | 0.0% |
| Albanian | 1,665 | 0.1% |
| American | 130,371 | 10.3% |
| Apache | 225 | 0.0% |
| Arab | 4,401 | 0.4% |
| Argentinean | 2,532 | 0.2% |
| Armenian | 1,336 | 0.1% |
| Assyrian / Chaldean / Syriac | 14 | 0.0% |
| Australian | 152 | 0.0% |
| Austrian | 3,542 | 0.3% |
| Bahamian | 347 | 0.0% |
| Barbadian | 292 | 0.0% |
| Basque | 140 | 0.0% |
| Belgian | 1,469 | 0.1% |
| Belizean | 501 | 0.0% |
| Bermudan | 9 | 0.0% |
| Bhutanese | 1,233 | 0.1% |
| Blackfeet | 304 | 0.0% |
| Bolivian | 1,728 | 0.1% |
| Brazilian | 4,158 | 0.3% |
| British | 6,788 | 0.5% |
| British West Indian | 500 | 0.0% |
| Bulgarian | 280 | 0.0% |
| Burmese | 1,554 | 0.1% |
| Cajun | 142 | 0.0% |
| Cambodian | 22 | 0.0% |
| Canadian | 6,131 | 0.5% |
| Cape Verdean | 83 | 0.0% |
| Carpatho Rusyn | 37 | 0.0% |
| Celtic | 353 | 0.0% |
| Central American | 38,323 | 3.0% |
| Central American Indian | 3,185 | 0.3% |
| Cherokee | 1,592 | 0.1% |
| Cheyenne | 8 | 0.0% |
| Chickasaw | 41 | 0.0% |
| Chilean | 693 | 0.1% |
| Chinese | 17 | 0.0% |
| Chippewa | 141 | 0.0% |
| Choctaw | 151 | 0.0% |
| Colombian | 13,604 | 1.1% |
| Costa Rican | 1,476 | 0.1% |
| Cree | 2 | 0.0% |
| Creek | 78 | 0.0% |
| Croatian | 1,820 | 0.1% |
| Crow | 22 | 0.0% |
| Cuban | 76,044 | 6.0% |
| Czech | 5,277 | 0.4% |
| Czechoslovakian | 1,790 | 0.1% |
| Danish | 2,973 | 0.2% |
| Delaware | 8 | 0.0% |
| Dominican | 12,410 | 1.0% |
| Dutch | 11,888 | 0.9% |
| Dutch West Indian | 53 | 0.0% |
| Eastern European | 3,381 | 0.3% |
| Ecuadorian | 3,375 | 0.3% |
| Egyptian | 298 | 0.0% |
| English | 110,473 | 8.7% |
| Estonian | 122 | 0.0% |
| Ethiopian | 26 | 0.0% |
| European | 16,745 | 1.3% |
| Filipino | 171 | 0.0% |
| Finnish | 2,147 | 0.2% |
| French | 25,122 | 2.0% |
| French American Indian | 80 | 0.0% |
| French Canadian | 7,939 | 0.6% |
| German | 155,141 | 12.3% |
| German Russian | 11 | 0.0% |
| Ghanaian | 182 | 0.0% |
| Greek | 4,986 | 0.4% |
| Guamanian / Chamorro | 59 | 0.0% |
| Guatemalan | 19,085 | 1.5% |
| Guyanese | 1,562 | 0.1% |
| Haitian | 30,148 | 2.4% |
| Honduran | 8,921 | 0.7% |
| Hopi | 14 | 0.0% |
| Hungarian | 7,375 | 0.6% |
| Icelander | 68 | 0.0% |
| Indian (Asian) | 5,430 | 0.4% |
| Indonesian | 118 | 0.0% |
| Inupiat | 8 | 0.0% |
| Iranian | 377 | 0.0% |
| Iraqi | 102 | 0.0% |
| Irish | 130,453 | 10.3% |
| Iroquois | 138 | 0.0% |
| Israeli | 282 | 0.0% |
| Italian | 95,750 | 7.6% |
| Jamaican | 6,942 | 0.5% |
| Japanese | 201 | 0.0% |
| Jordanian | 48 | 0.0% |
| Kenyan | 35 | 0.0% |
| Kiowa | 39 | 0.0% |
| Korean | 7,062 | 0.6% |
| Laotian | 181 | 0.0% |
| Latvian | 173 | 0.0% |
| Lebanese | 2,201 | 0.2% |
| Liberian | 12 | 0.0% |
| Lithuanian | 3,549 | 0.3% |
| Lumbee | 11 | 0.0% |
| Luxembourger | 129 | 0.0% |
| Macedonian | 182 | 0.0% |
| Malaysian | 359 | 0.0% |
| Maltese | 247 | 0.0% |
| Mexican | 86,746 | 6.9% |
| Mexican American Indian | 1,455 | 0.1% |
| Mongolian | 50 | 0.0% |
| Moroccan | 177 | 0.0% |
| Native Hawaiian | 336 | 0.0% |
| Navajo | 129 | 0.0% |
| New Zealander | 32 | 0.0% |
| Nicaraguan | 4,829 | 0.4% |
| Nigerian | 411 | 0.0% |
| Northern European | 1,589 | 0.1% |
| Norwegian | 10,840 | 0.9% |
| Okinawan | 46 | 0.0% |
| Osage | 15 | 0.0% |
| Ottawa | 182 | 0.0% |
| Pakistani | 535 | 0.0% |
| Palestinian | 211 | 0.0% |
| Panamanian | 1,025 | 0.1% |
| Paraguayan | 149 | 0.0% |
| Pennsylvania German | 664 | 0.1% |
| Peruvian | 4,383 | 0.4% |
| Polish | 36,958 | 2.9% |
| Portuguese | 5,005 | 0.4% |
| Potawatomi | 74 | 0.0% |
| Pueblo | 21 | 0.0% |
| Puerto Rican | 55,291 | 4.4% |
| Romanian | 2,927 | 0.2% |
| Russian | 9,362 | 0.7% |
| Salvadoran | 2,987 | 0.2% |
| Samoan | 256 | 0.0% |
| Scandinavian | 2,473 | 0.2% |
| Scotch-Irish | 9,205 | 0.7% |
| Scottish | 20,055 | 1.6% |
| Seminole | 443 | 0.0% |
| Serbian | 549 | 0.0% |
| Shoshone | 8 | 0.0% |
| Sierra Leonean | 74 | 0.0% |
| Sioux | 108 | 0.0% |
| Slavic | 1,020 | 0.1% |
| Slovak | 2,979 | 0.2% |
| Slovene | 724 | 0.1% |
| South African | 547 | 0.0% |
| South American | 35,018 | 2.8% |
| South American Indian | 371 | 0.0% |
| Spaniard | 2,308 | 0.2% |
| Spanish | 2,019 | 0.2% |
| Spanish American Indian | 31 | 0.0% |
| Sri Lankan | 3,111 | 0.3% |
| Subsaharan African | 4,622 | 0.4% |
| Swedish | 13,630 | 1.1% |
| Swiss | 3,402 | 0.3% |
| Syrian | 838 | 0.1% |
| Thai | 5,907 | 0.5% |
| Tongan | 25 | 0.0% |
| Trinidadian and Tobagonian | 1,070 | 0.1% |
| Turkish | 712 | 0.1% |
| U.S. Virgin Islander | 239 | 0.0% |
| Ukrainian | 3,893 | 0.3% |
| Uruguayan | 1,017 | 0.1% |
| Ute | 56 | 0.0% |
| Venezuelan | 7,480 | 0.6% |
| Vietnamese | 160 | 0.0% |
| Welsh | 5,993 | 0.5% |
| West Indian | 914 | 0.1% |
| Yaqui | 57 | 0.0% |
| Yugoslavian | 817 | 0.1% |
| Zimbabwean | 73 | 0.0% | View All 170 Rows |
Immigrants in Area Code 239
The most numerous immigrant groups reported in Area Code 239 came from Latin America (178,976 | 14.2%), Caribbean (88,989 | 7.0%), Central America (57,570 | 4.6%), Cuba (51,098 | 4.1%), and South America (32,417 | 2.6%), together accounting for 32.4% of all Area Code 239 residents.
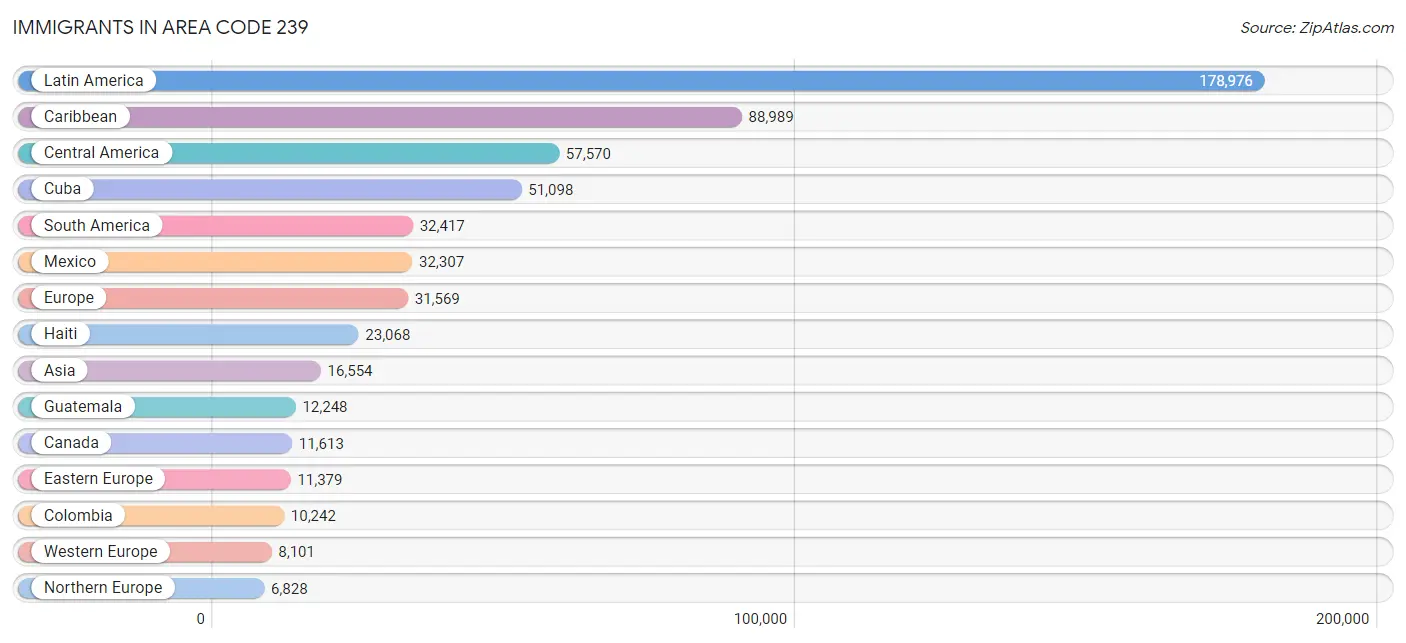
| Immigration Origin | # Population | % Population |
| Africa | 1,990 | 0.2% |
| Albania | 1,121 | 0.1% |
| Argentina | 1,651 | 0.1% |
| Asia | 16,554 | 1.3% |
| Australia | 92 | 0.0% |
| Austria | 355 | 0.0% |
| Azores | 52 | 0.0% |
| Bahamas | 569 | 0.1% |
| Bangladesh | 254 | 0.0% |
| Barbados | 364 | 0.0% |
| Belarus | 323 | 0.0% |
| Belgium | 136 | 0.0% |
| Belize | 356 | 0.0% |
| Bolivia | 1,454 | 0.1% |
| Bosnia and Herzegovina | 308 | 0.0% |
| Brazil | 4,581 | 0.4% |
| Bulgaria | 355 | 0.0% |
| Cambodia | 84 | 0.0% |
| Cameroon | 61 | 0.0% |
| Canada | 11,613 | 0.9% |
| Caribbean | 88,989 | 7.0% |
| Central America | 57,570 | 4.6% |
| Chile | 549 | 0.0% |
| China | 2,807 | 0.2% |
| Colombia | 10,242 | 0.8% |
| Congo | 5 | 0.0% |
| Costa Rica | 1,034 | 0.1% |
| Croatia | 439 | 0.0% |
| Cuba | 51,098 | 4.1% |
| Czechoslovakia | 1,341 | 0.1% |
| Denmark | 143 | 0.0% |
| Dominica | 191 | 0.0% |
| Dominican Republic | 6,268 | 0.5% |
| Eastern Africa | 471 | 0.0% |
| Eastern Asia | 3,651 | 0.3% |
| Eastern Europe | 11,379 | 0.9% |
| Ecuador | 2,241 | 0.2% |
| Egypt | 269 | 0.0% |
| El Salvador | 2,198 | 0.2% |
| England | 2,632 | 0.2% |
| Ethiopia | 21 | 0.0% |
| Europe | 31,569 | 2.5% |
| Fiji | 43 | 0.0% |
| France | 816 | 0.1% |
| Germany | 5,457 | 0.4% |
| Ghana | 69 | 0.0% |
| Greece | 557 | 0.0% |
| Grenada | 62 | 0.0% |
| Guatemala | 12,248 | 1.0% |
| Guyana | 1,466 | 0.1% |
| Haiti | 23,068 | 1.8% |
| Honduras | 5,896 | 0.5% |
| Hong Kong | 167 | 0.0% |
| Hungary | 645 | 0.1% |
| India | 3,039 | 0.2% |
| Indonesia | 38 | 0.0% |
| Iran | 363 | 0.0% |
| Iraq | 62 | 0.0% |
| Ireland | 914 | 0.1% |
| Israel | 314 | 0.0% |
| Italy | 3,220 | 0.3% |
| Jamaica | 5,635 | 0.4% |
| Japan | 183 | 0.0% |
| Jordan | 63 | 0.0% |
| Kazakhstan | 44 | 0.0% |
| Kenya | 50 | 0.0% |
| Korea | 661 | 0.1% |
| Kuwait | 45 | 0.0% |
| Laos | 162 | 0.0% |
| Latin America | 178,976 | 14.2% |
| Latvia | 125 | 0.0% |
| Lebanon | 536 | 0.0% |
| Liberia | 12 | 0.0% |
| Lithuania | 198 | 0.0% |
| Malaysia | 210 | 0.0% |
| Mexico | 32,307 | 2.6% |
| Middle Africa | 88 | 0.0% |
| Moldova | 261 | 0.0% |
| Morocco | 138 | 0.0% |
| Nepal | 95 | 0.0% |
| Netherlands | 870 | 0.1% |
| Nicaragua | 2,895 | 0.2% |
| Nigeria | 8 | 0.0% |
| North Macedonia | 84 | 0.0% |
| Northern Africa | 442 | 0.0% |
| Northern Europe | 6,828 | 0.5% |
| Norway | 126 | 0.0% |
| Oceania | 252 | 0.0% |
| Pakistan | 310 | 0.0% |
| Panama | 636 | 0.1% |
| Peru | 2,937 | 0.2% |
| Philippines | 3,798 | 0.3% |
| Poland | 2,283 | 0.2% |
| Portugal | 460 | 0.0% |
| Romania | 1,469 | 0.1% |
| Russia | 1,043 | 0.1% |
| Saudi Arabia | 58 | 0.0% |
| Scotland | 334 | 0.0% |
| Serbia | 143 | 0.0% |
| Sierra Leone | 50 | 0.0% |
| Singapore | 19 | 0.0% |
| South Africa | 699 | 0.1% |
| South America | 32,417 | 2.6% |
| South Central Asia | 4,653 | 0.4% |
| South Eastern Asia | 6,592 | 0.5% |
| Southern Europe | 5,158 | 0.4% |
| Spain | 843 | 0.1% |
| Sri Lanka | 196 | 0.0% |
| St. Vincent and the Grenadines | 48 | 0.0% |
| Sweden | 325 | 0.0% |
| Switzerland | 375 | 0.0% |
| Syria | 138 | 0.0% |
| Taiwan | 240 | 0.0% |
| Thailand | 237 | 0.0% |
| Trinidad and Tobago | 1,016 | 0.1% |
| Turkey | 347 | 0.0% |
| Uganda | 15 | 0.0% |
| Ukraine | 676 | 0.1% |
| Uruguay | 571 | 0.1% |
| Uzbekistan | 279 | 0.0% |
| Venezuela | 6,529 | 0.5% |
| Vietnam | 1,939 | 0.2% |
| West Indies | 49 | 0.0% |
| Western Africa | 216 | 0.0% |
| Western Asia | 1,602 | 0.1% |
| Western Europe | 8,101 | 0.6% |
| Zimbabwe | 91 | 0.0% | View All 127 Rows |
Sex and Age in Area Code 239
Sex and Age in Area Code 239
The most populous age groups in Area Code 239 are 65 to 69 Years (45,531 | 7.3%) for men and 65 to 69 Years (51,481 | 8.0%) for women.
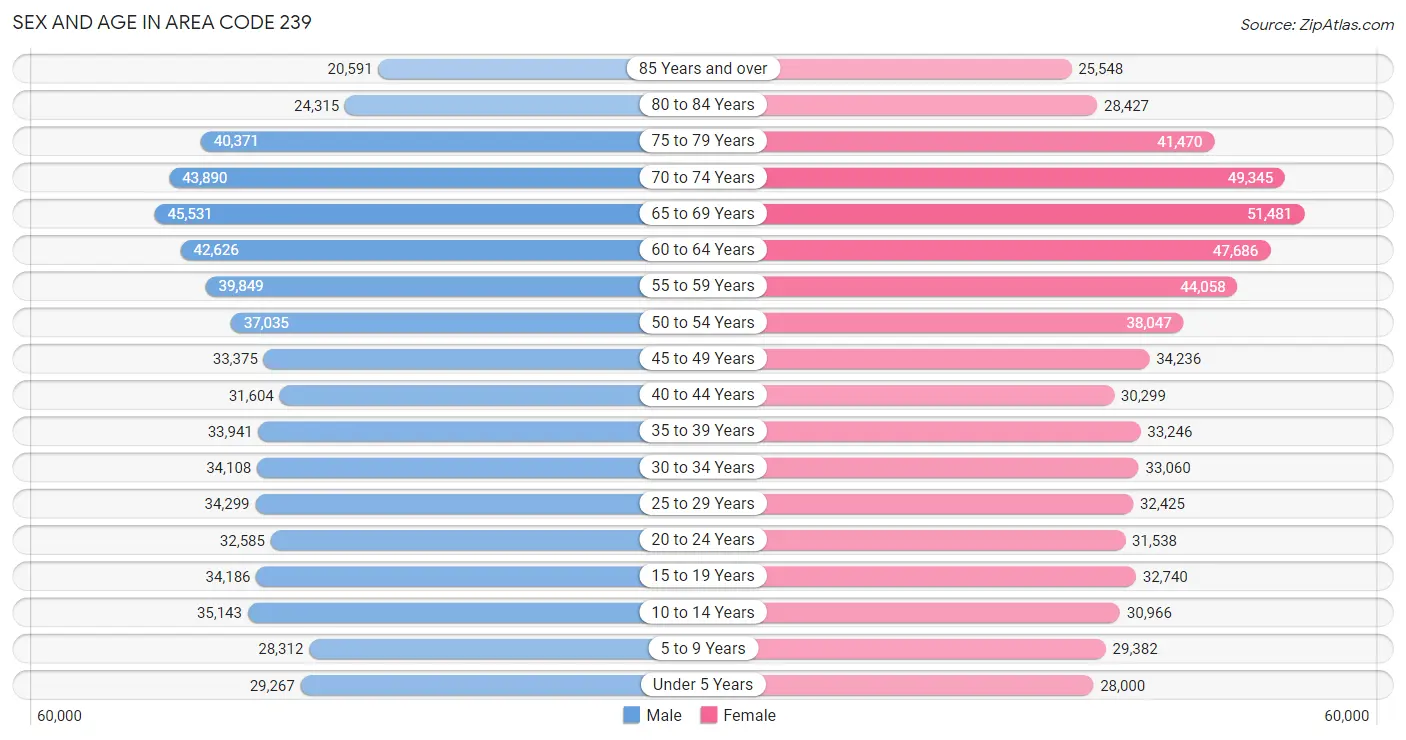
| Age Bracket | Male | Female |
| Under 5 Years | 29,267 (4.7%) | 28,000 (4.4%) |
| 5 to 9 Years | 28,312 (4.6%) | 29,382 (4.6%) |
| 10 to 14 Years | 35,143 (5.7%) | 30,966 (4.8%) |
| 15 to 19 Years | 34,186 (5.5%) | 32,740 (5.1%) |
| 20 to 24 Years | 32,585 (5.2%) | 31,538 (4.9%) |
| 25 to 29 Years | 34,299 (5.5%) | 32,425 (5.1%) |
| 30 to 34 Years | 34,108 (5.5%) | 33,060 (5.1%) |
| 35 to 39 Years | 33,941 (5.5%) | 33,246 (5.2%) |
| 40 to 44 Years | 31,604 (5.1%) | 30,299 (4.7%) |
| 45 to 49 Years | 33,375 (5.4%) | 34,236 (5.3%) |
| 50 to 54 Years | 37,035 (6.0%) | 38,047 (5.9%) |
| 55 to 59 Years | 39,849 (6.4%) | 44,058 (6.9%) |
| 60 to 64 Years | 42,626 (6.9%) | 47,686 (7.4%) |
| 65 to 69 Years | 45,531 (7.3%) | 51,481 (8.0%) |
| 70 to 74 Years | 43,890 (7.1%) | 49,345 (7.7%) |
| 75 to 79 Years | 40,371 (6.5%) | 41,470 (6.5%) |
| 80 to 84 Years | 24,315 (3.9%) | 28,427 (4.4%) |
| 85 Years and over | 20,591 (3.3%) | 25,548 (4.0%) |
| Total | 621,028 (100.0%) | 641,954 (100.0%) |
Families and Households in Area Code 239
Median Family Size in Area Code 239
The median family size in Area Code 239 is 2.97 persons per family, with single female/mother families (49,345 | 14.7%) accounting for the largest median family size of 3.3425 persons per family. On the other hand, married-couple families (263,283 | 78.7%) represent the smallest median family size with 2.94 persons per family.
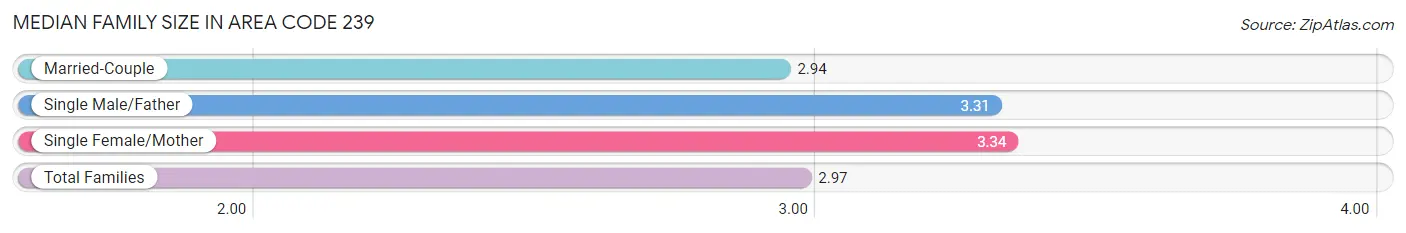
| Family Type | # Families | Family Size |
| Married-Couple | 263,283 (78.7%) | 2.94 |
| Single Male/Father | 22,011 (6.6%) | 3.31 |
| Single Female/Mother | 49,345 (14.7%) | 3.34 |
| Total Families | 334,639 (100.0%) | 2.97 |
Median Household Size in Area Code 239
The median household size in Area Code 239 is 2.52 persons per household, with single male/father households (22,011 | 4.3%) accounting for the largest median household size of 3.73941 persons per household. non-family households (172,806 | 34.1%) represent the smallest median household size with 1.37 persons per household.
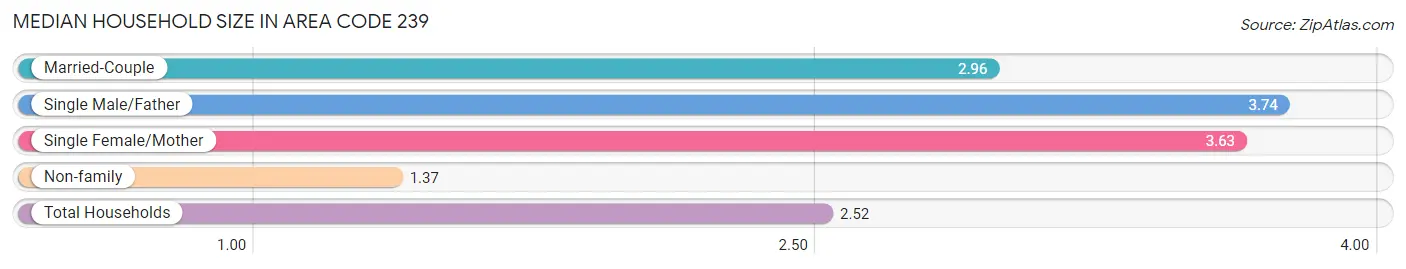
| Household Type | # Households | Household Size |
| Married-Couple | 263,283 (51.9%) | 2.96 |
| Single Male/Father | 22,011 (4.3%) | 3.74 |
| Single Female/Mother | 49,345 (9.7%) | 3.63 |
| Non-family | 172,806 (34.1%) | 1.37 |
| Total Households | 507,445 (100.0%) | 2.52 |
Household Size by Marriage Status in Area Code 239
Out of a total of 507,445 households in Area Code 239, 334,639 (65.9%) are family households, while 172,806 (34.1%) are nonfamily households. The most numerous type of family households are 2-person households, comprising 195,704, and the most common type of nonfamily households are 1-person households, comprising 142,934.
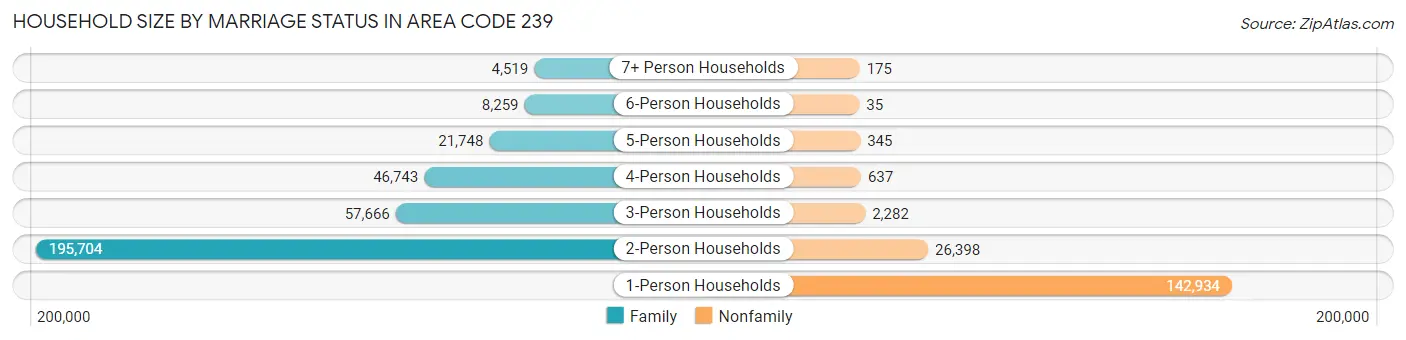
| Household Size | Family Households | Nonfamily Households |
| 1-Person Households | - | 142,934 (28.2%) |
| 2-Person Households | 195,704 (38.6%) | 26,398 (5.2%) |
| 3-Person Households | 57,666 (11.4%) | 2,282 (0.4%) |
| 4-Person Households | 46,743 (9.2%) | 637 (0.1%) |
| 5-Person Households | 21,748 (4.3%) | 345 (0.1%) |
| 6-Person Households | 8,259 (1.6%) | 35 (0.0%) |
| 7+ Person Households | 4,519 (0.9%) | 175 (0.0%) |
| Total | 334,639 (65.9%) | 172,806 (34.1%) |
Female Fertility in Area Code 239
Fertility by Age in Area Code 239
Average fertility rate in Area Code 239 is 49.9 births per 1,000 women. Women in the age bracket of 20 to 34 years have the highest fertility rate with 91.5 births per 1,000 women. Women in the age bracket of 20 to 34 years acount for 75.9% of all women with births.
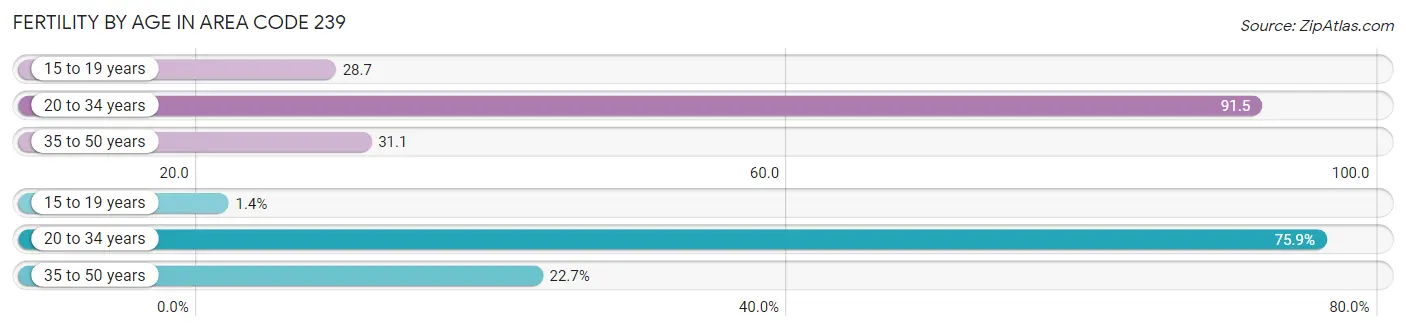
| Age Bracket | Women with Births | Births / 1,000 Women |
| 15 to 19 years | 163 (1.4%) | 28.7 |
| 20 to 34 years | 8,931 (75.9%) | 91.5 |
| 35 to 50 years | 2,671 (22.7%) | 31.1 |
| Total | 11,765 (100.0%) | 49.9 |
Fertility by Age by Marriage Status in Area Code 239
61.4% of women with births (11,765) in Area Code 239 are married. The highest percentage of unmarried women with births falls into 15 to 19 years age bracket with 100.0% of them unmarried at the time of birth, while the lowest percentage of unmarried women with births belong to 20 to 34 years age bracket with 44.2% of them unmarried.
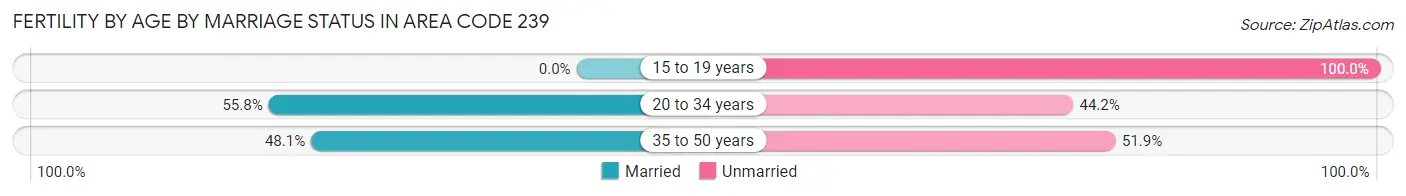
| Age Bracket | Married | Unmarried |
| 15 to 19 years | 0 (0.0%) | 163 (100.0%) |
| 20 to 34 years | 4,984 (55.8%) | 3,947 (44.2%) |
| 35 to 50 years | 1,285 (48.1%) | 1,386 (51.9%) |
| Total | 7,227 (61.4%) | 4,538 (38.6%) |
Fertility by Education in Area Code 239
Average fertility rate in Area Code 239 is 49.9 births per 1,000 women. Women with the education attainment of graduate degree have the highest fertility rate of 89.8 births per 1,000 women, while women with the education attainment of less than high school have the lowest fertility at 58.3 births per 1,000 women. Women with the education attainment of college or associate's degree represent 28.6% of all women with births.
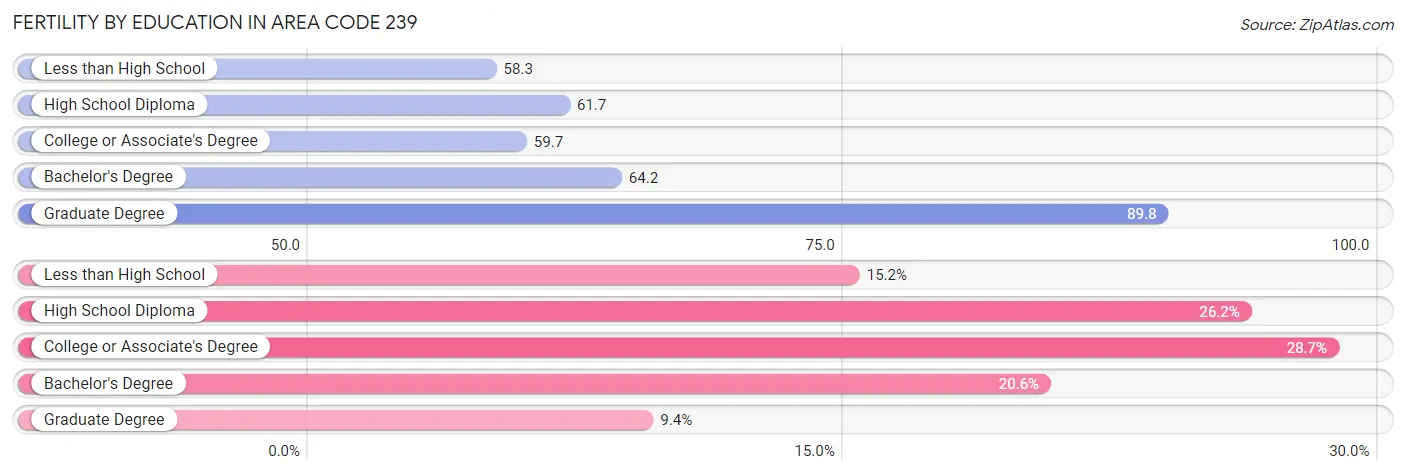
| Educational Attainment | Women with Births | Births / 1,000 Women |
| Less than High School | 1,787 (15.2%) | 58.3 |
| High School Diploma | 3,083 (26.2%) | 61.7 |
| College or Associate's Degree | 3,371 (28.6%) | 59.7 |
| Bachelor's Degree | 2,419 (20.6%) | 64.2 |
| Graduate Degree | 1,105 (9.4%) | 89.8 |
| Total | 11,765 (100.0%) | 49.9 |
Fertility by Education by Marriage Status in Area Code 239
38.6% of women with births in Area Code 239 are unmarried. Women with the educational attainment of graduate degree are most likely to be married with 58.6% of them married at childbirth, while women with the educational attainment of less than high school are least likely to be married with 76.2% of them unmarried at childbirth.
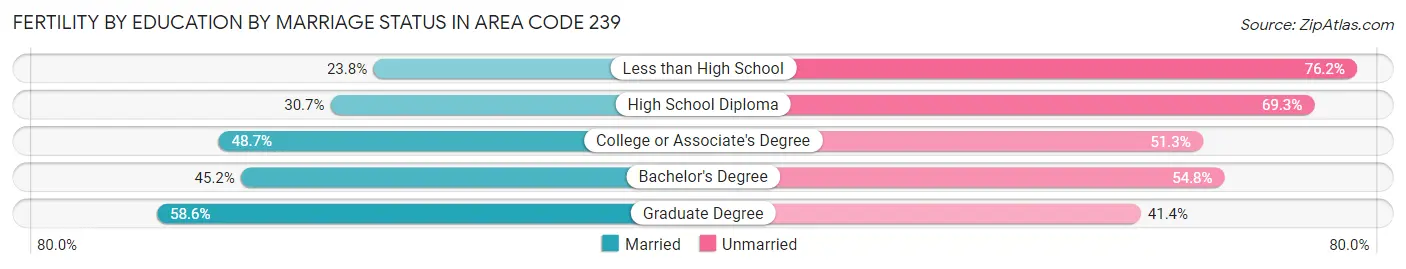
| Educational Attainment | Married | Unmarried |
| Less than High School | 426 (23.8%) | 1,361 (76.2%) |
| High School Diploma | 947 (30.7%) | 2,136 (69.3%) |
| College or Associate's Degree | 1,642 (48.7%) | 1,729 (51.3%) |
| Bachelor's Degree | 1,093 (45.2%) | 1,326 (54.8%) |
| Graduate Degree | 648 (58.6%) | 457 (41.4%) |
| Total | 7,227 (61.4%) | 4,538 (38.6%) |
Employment Characteristics in Area Code 239
Employment by Class of Employer in Area Code 239
Among the 531,100 employed individuals in Area Code 239, private company employees (368,322 | 69.4%), self-employed (incorporated) (38,260 | 7.2%), and local government employees (37,074 | 7.0%) make up the most common classes of employment.
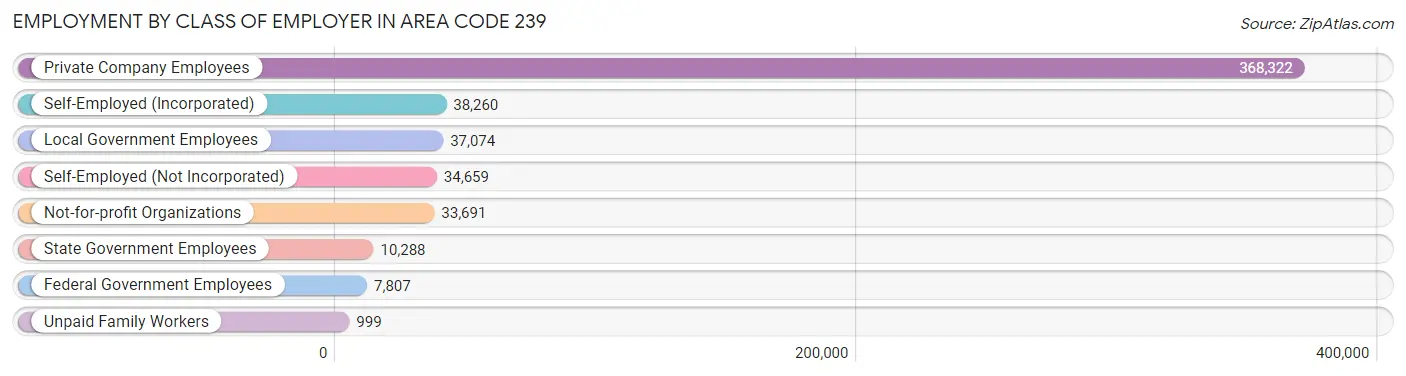
| Employer Class | # Employees | % Employees |
| Private Company Employees | 368,322 | 69.4% |
| Self-Employed (Incorporated) | 38,260 | 7.2% |
| Self-Employed (Not Incorporated) | 34,659 | 6.5% |
| Not-for-profit Organizations | 33,691 | 6.3% |
| Local Government Employees | 37,074 | 7.0% |
| State Government Employees | 10,288 | 1.9% |
| Federal Government Employees | 7,807 | 1.5% |
| Unpaid Family Workers | 999 | 0.2% |
| Total | 531,100 | 100.0% |
Employment Status by Age in Area Code 239
According to the labor force statistics for Area Code 239, out of the total population over 16 years of age (1,068,613), 50.9% or 544,351 individuals are in the labor force, with 4.5% or 24,659 of them unemployed. The age group with the highest labor force participation rate is 35 to 44 years, with 84.2% or 108,668 individuals in the labor force. Within the labor force, the 16 to 19 years age range has the highest percentage of unemployed individuals, with 578.7% or 121,811 of them being unemployed.
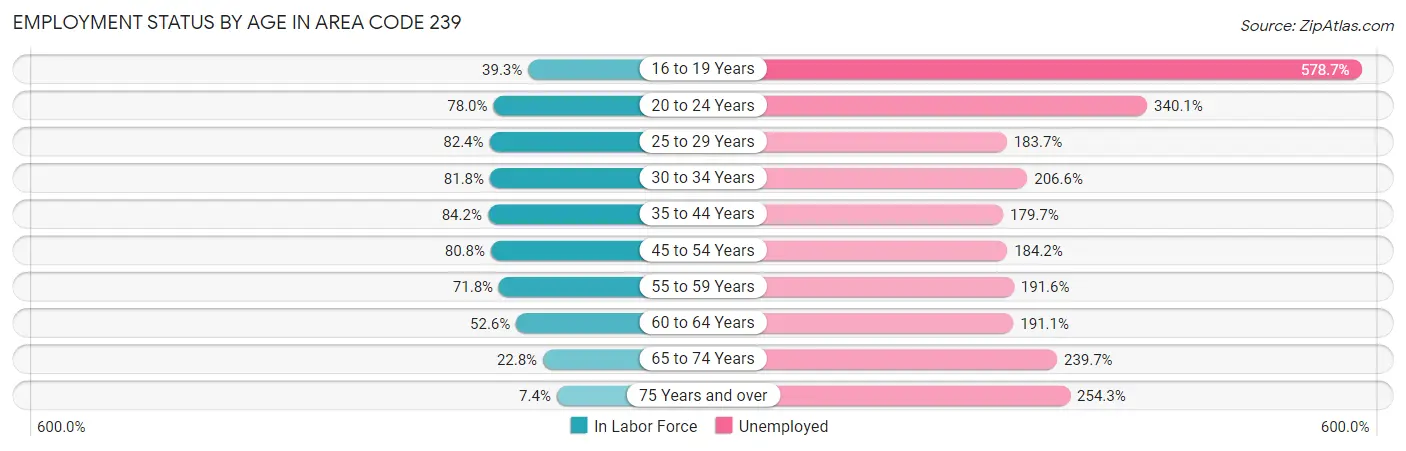
| Age Bracket | In Labor Force | Unemployed |
| 16 to 19 Years | 21,048 (39.3%) | 121,811 (578.7%) |
| 20 to 24 Years | 49,997 (78.0%) | 170,040 (340.1%) |
| 25 to 29 Years | 54,984 (82.4%) | 101,011 (183.7%) |
| 30 to 34 Years | 54,970 (81.8%) | 113,568 (206.6%) |
| 35 to 44 Years | 108,670 (84.2%) | 195,276 (179.7%) |
| 45 to 54 Years | 115,314 (80.8%) | 212,401 (184.2%) |
| 55 to 59 Years | 60,245 (71.8%) | 115,429 (191.6%) |
| 60 to 64 Years | 47,523 (52.6%) | 90,815 (191.1%) |
| 65 to 74 Years | 43,278 (22.8%) | 103,745 (239.7%) |
| 75 Years and over | 13,355 (7.4%) | 33,962 (254.3%) |
| Total | 544,366 (50.9%) | 24,677 (4.5%) |
Employment Status by Educational Attainment in Area Code 239
According to labor force statistics for Area Code 239, 74.5% of individuals (432,253) out of the total population between 25 and 64 years of age (579,894) are in the labor force, with 194.9% or 842,461 of them being unemployed. The group with the highest labor force participation rate are those with the educational attainment of bachelor's degree or higher, with 77.6% or 127,017 individuals in the labor force. Within the labor force, individuals with high school diploma education have the highest percentage of unemployment, with 237.0% or 315,203 of them being unemployed.
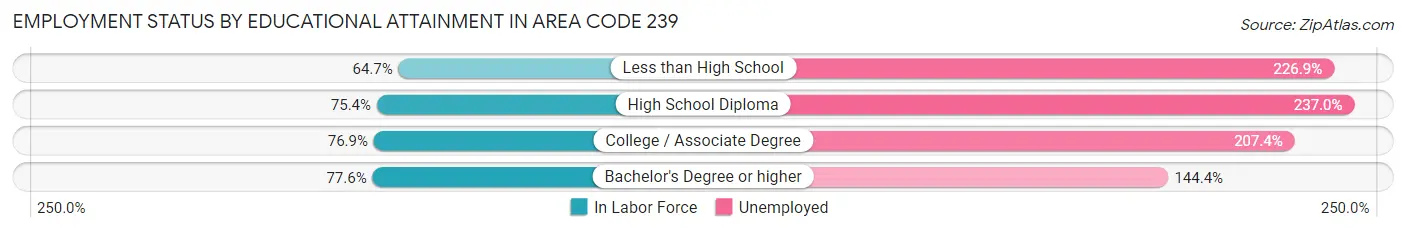
| Educational Attainment | In Labor Force | Unemployed |
| Less than High School | 44,855 (64.7%) | 157,396 (226.9%) |
| High School Diploma | 132,991 (75.4%) | 418,042 (237.0%) |
| College / Associate Degree | 131,028 (76.9%) | 353,349 (207.4%) |
| Bachelor's Degree or higher | 127,019 (77.6%) | 236,478 (144.4%) |
| Total | 432,231 (74.5%) | 1,130,213 (194.9%) |
Employment Occupations by Sex in Area Code 239
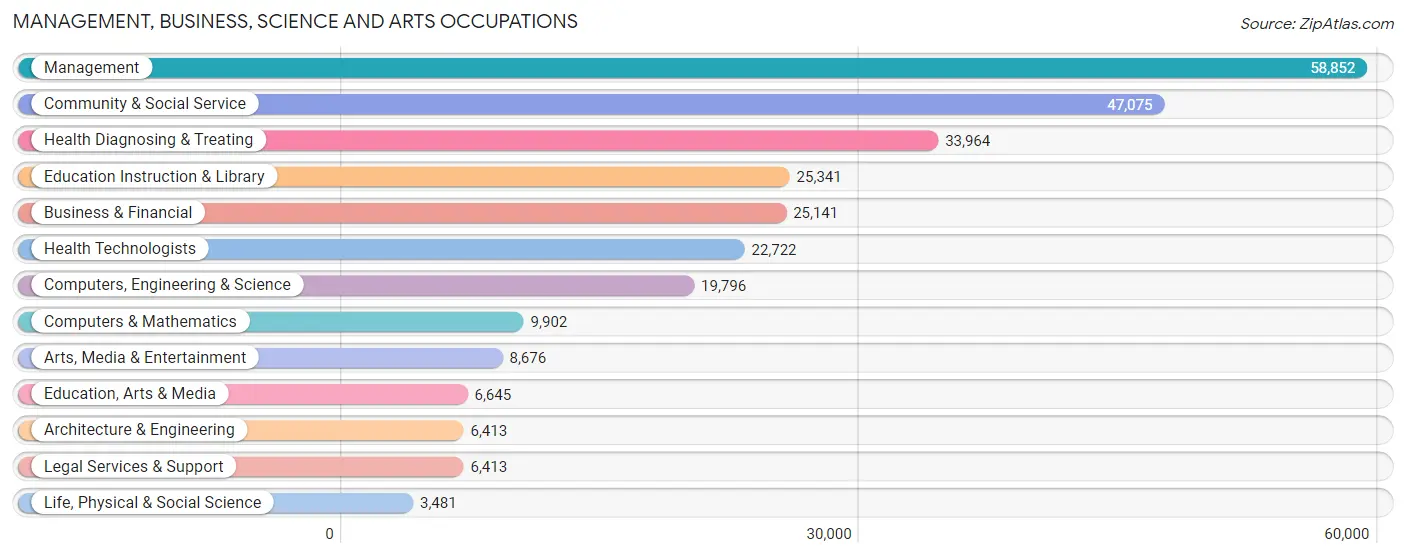
Management, Business, Science and Arts Occupations
The most common Management, Business, Science and Arts occupations in Area Code 239 are Management (58,852 | 10.9%), Community & Social Service (47,075 | 8.7%), Health Diagnosing & Treating (33,964 | 6.3%), Education Instruction & Library (25,341 | 4.7%), and Business & Financial (25,141 | 4.6%).
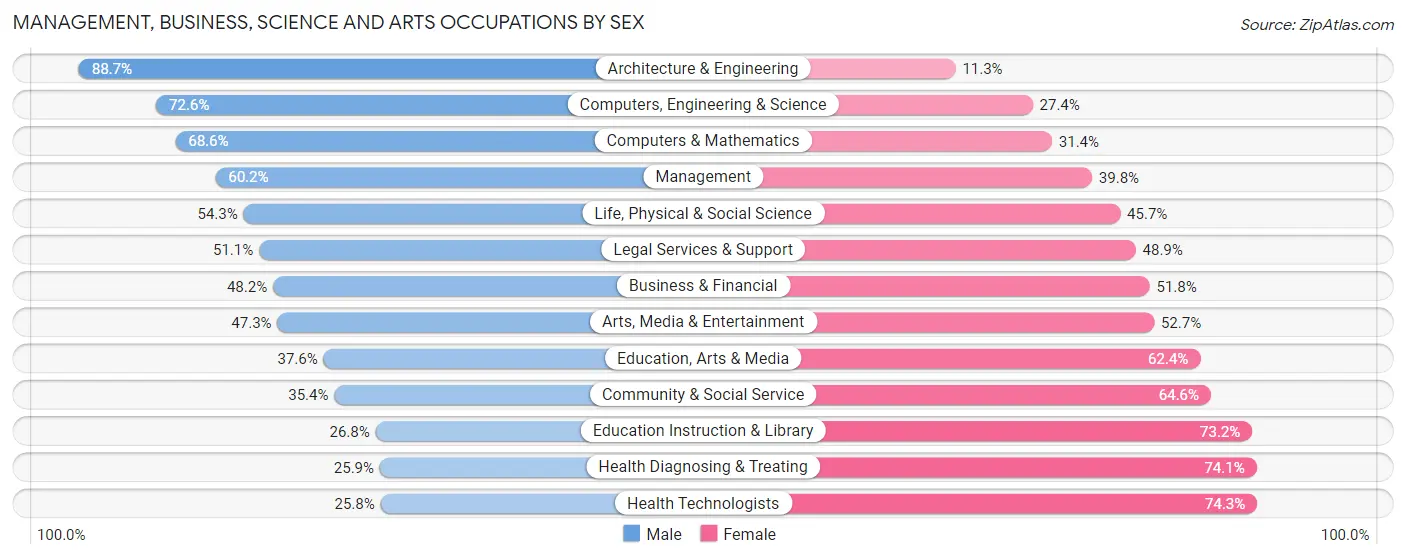
Management, Business, Science and Arts Occupations by Sex
Within the Management, Business, Science and Arts occupations in Area Code 239, the most male-oriented occupations are Architecture & Engineering (88.7%), Computers, Engineering & Science (72.6%), and Computers & Mathematics (68.6%), while the most female-oriented occupations are Health Technologists (74.3%), Health Diagnosing & Treating (74.1%), and Education Instruction & Library (73.2%).
| Occupation | Male | Female |
| Management | 35,432 (60.2%) | 23,420 (39.8%) |
| Business & Financial | 12,116 (48.2%) | 13,025 (51.8%) |
| Computers, Engineering & Science | 14,367 (72.6%) | 5,429 (27.4%) |
| Computers & Mathematics | 6,789 (68.6%) | 3,113 (31.4%) |
| Architecture & Engineering | 5,687 (88.7%) | 726 (11.3%) |
| Life, Physical & Social Science | 1,891 (54.3%) | 1,590 (45.7%) |
| Community & Social Service | 16,666 (35.4%) | 30,409 (64.6%) |
| Education, Arts & Media | 2,501 (37.6%) | 4,144 (62.4%) |
| Legal Services & Support | 3,277 (51.1%) | 3,136 (48.9%) |
| Education Instruction & Library | 6,788 (26.8%) | 18,553 (73.2%) |
| Arts, Media & Entertainment | 4,100 (47.3%) | 4,576 (52.7%) |
| Health Diagnosing & Treating | 8,793 (25.9%) | 25,171 (74.1%) |
| Health Technologists | 5,850 (25.8%) | 16,872 (74.3%) |
| Total (Category) | 87,374 (47.3%) | 97,454 (52.7%) |
| Total (Overall) | 289,379 (53.5%) | 251,521 (46.5%) |
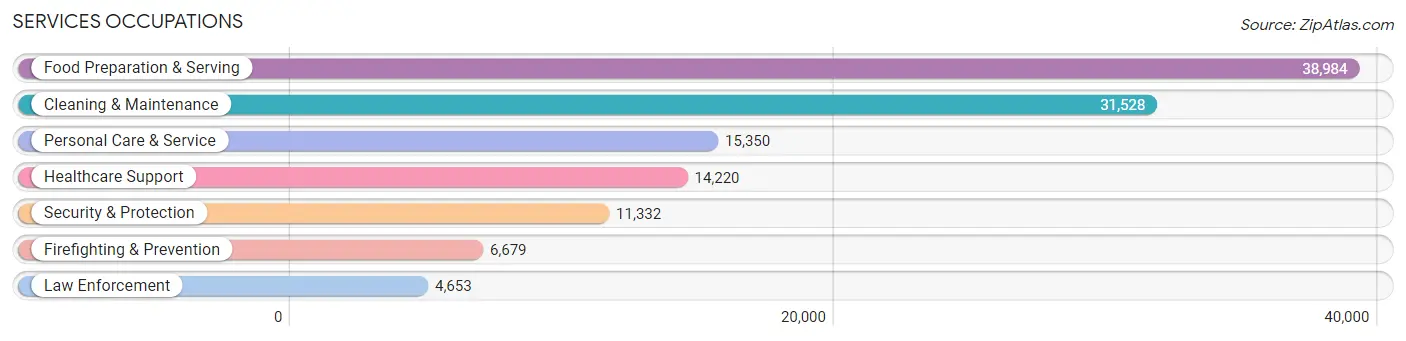
Services Occupations
The most common Services occupations in Area Code 239 are Food Preparation & Serving (38,984 | 7.2%), Cleaning & Maintenance (31,528 | 5.8%), Personal Care & Service (15,350 | 2.8%), Healthcare Support (14,220 | 2.6%), and Security & Protection (11,332 | 2.1%).
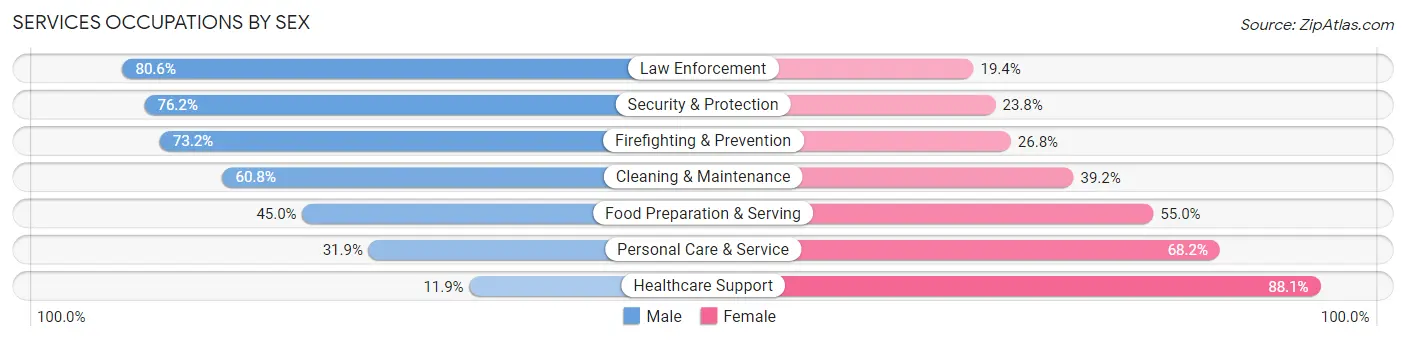
Services Occupations by Sex
Within the Services occupations in Area Code 239, the most male-oriented occupations are Law Enforcement (80.6%), Security & Protection (76.2%), and Firefighting & Prevention (73.2%), while the most female-oriented occupations are Healthcare Support (88.1%), Personal Care & Service (68.1%), and Food Preparation & Serving (55.0%).
| Occupation | Male | Female |
| Healthcare Support | 1,693 (11.9%) | 12,527 (88.1%) |
| Security & Protection | 8,639 (76.2%) | 2,693 (23.8%) |
| Firefighting & Prevention | 4,889 (73.2%) | 1,790 (26.8%) |
| Law Enforcement | 3,750 (80.6%) | 903 (19.4%) |
| Food Preparation & Serving | 17,535 (45.0%) | 21,449 (55.0%) |
| Cleaning & Maintenance | 19,166 (60.8%) | 12,362 (39.2%) |
| Personal Care & Service | 4,889 (31.9%) | 10,461 (68.1%) |
| Total (Category) | 51,922 (46.6%) | 59,492 (53.4%) |
| Total (Overall) | 289,379 (53.5%) | 251,521 (46.5%) |
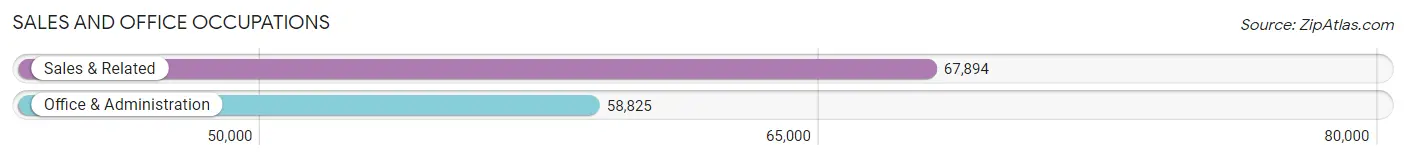
Sales and Office Occupations
The most common Sales and Office occupations in Area Code 239 are Sales & Related (67,894 | 12.6%), and Office & Administration (58,825 | 10.9%).
Sales and Office Occupations by Sex
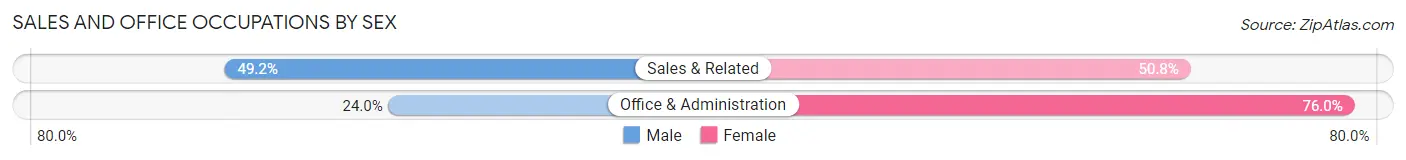
| Occupation | Male | Female |
| Sales & Related | 33,422 (49.2%) | 34,472 (50.8%) |
| Office & Administration | 14,125 (24.0%) | 44,700 (76.0%) |
| Total (Category) | 47,547 (37.5%) | 79,172 (62.5%) |
| Total (Overall) | 289,379 (53.5%) | 251,521 (46.5%) |
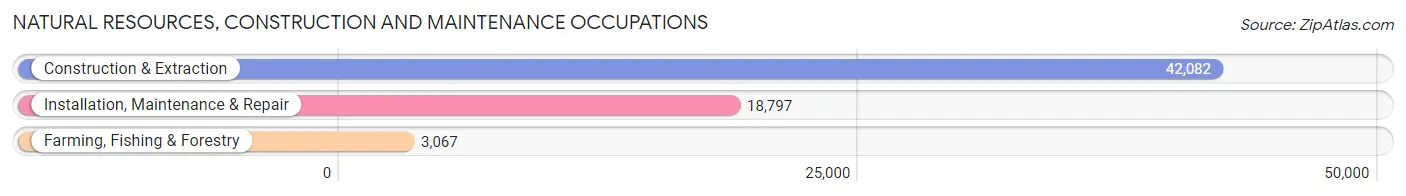
Natural Resources, Construction and Maintenance Occupations
The most common Natural Resources, Construction and Maintenance occupations in Area Code 239 are Construction & Extraction (42,082 | 7.8%), Installation, Maintenance & Repair (18,797 | 3.5%), and Farming, Fishing & Forestry (3,067 | 0.6%).
Natural Resources, Construction and Maintenance Occupations by Sex
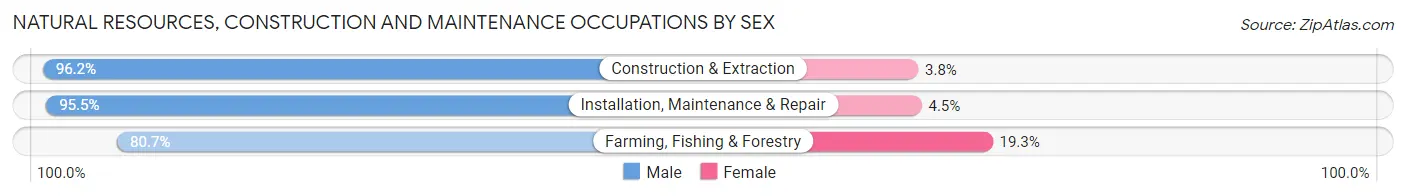
| Occupation | Male | Female |
| Farming, Fishing & Forestry | 2,476 (80.7%) | 591 (19.3%) |
| Construction & Extraction | 40,485 (96.2%) | 1,597 (3.8%) |
| Installation, Maintenance & Repair | 17,951 (95.5%) | 846 (4.5%) |
| Total (Category) | 60,912 (95.3%) | 3,034 (4.7%) |
| Total (Overall) | 289,379 (53.5%) | 251,521 (46.5%) |
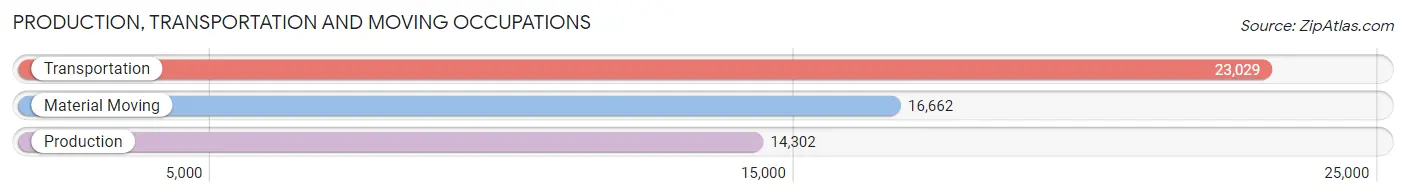
Production, Transportation and Moving Occupations
The most common Production, Transportation and Moving occupations in Area Code 239 are Transportation (23,029 | 4.3%), Material Moving (16,662 | 3.1%), and Production (14,302 | 2.6%).
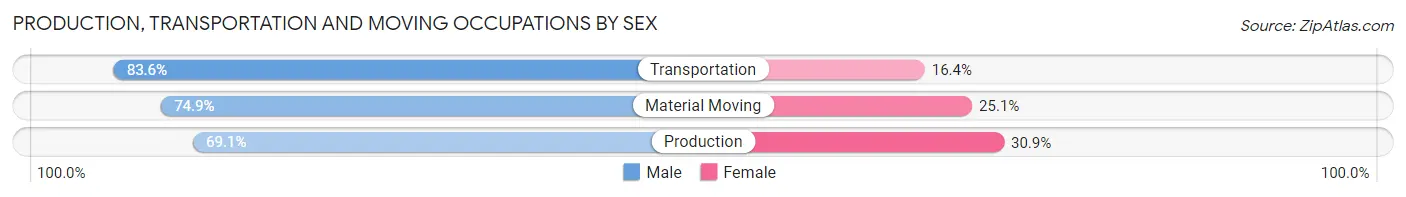
Production, Transportation and Moving Occupations by Sex
| Occupation | Male | Female |
| Production | 9,881 (69.1%) | 4,421 (30.9%) |
| Transportation | 19,258 (83.6%) | 3,771 (16.4%) |
| Material Moving | 12,485 (74.9%) | 4,177 (25.1%) |
| Total (Category) | 41,624 (77.1%) | 12,369 (22.9%) |
| Total (Overall) | 289,379 (53.5%) | 251,521 (46.5%) |
Employment Industries by Sex in Area Code 239
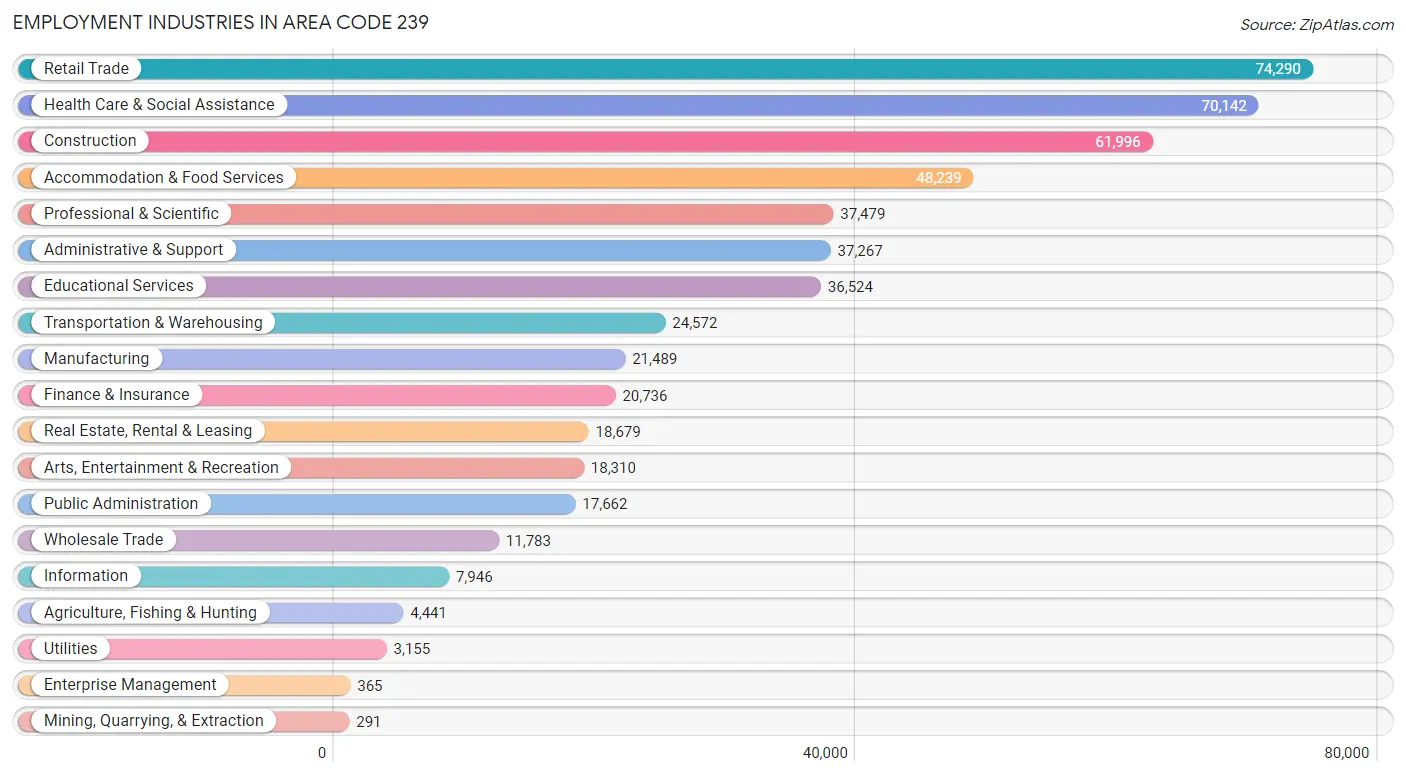
Employment Industries in Area Code 239
The major employment industries in Area Code 239 include Retail Trade (74,290 | 13.7%), Health Care & Social Assistance (70,142 | 13.0%), Construction (61,996 | 11.5%), Accommodation & Food Services (48,239 | 8.9%), and Professional & Scientific (37,479 | 6.9%).
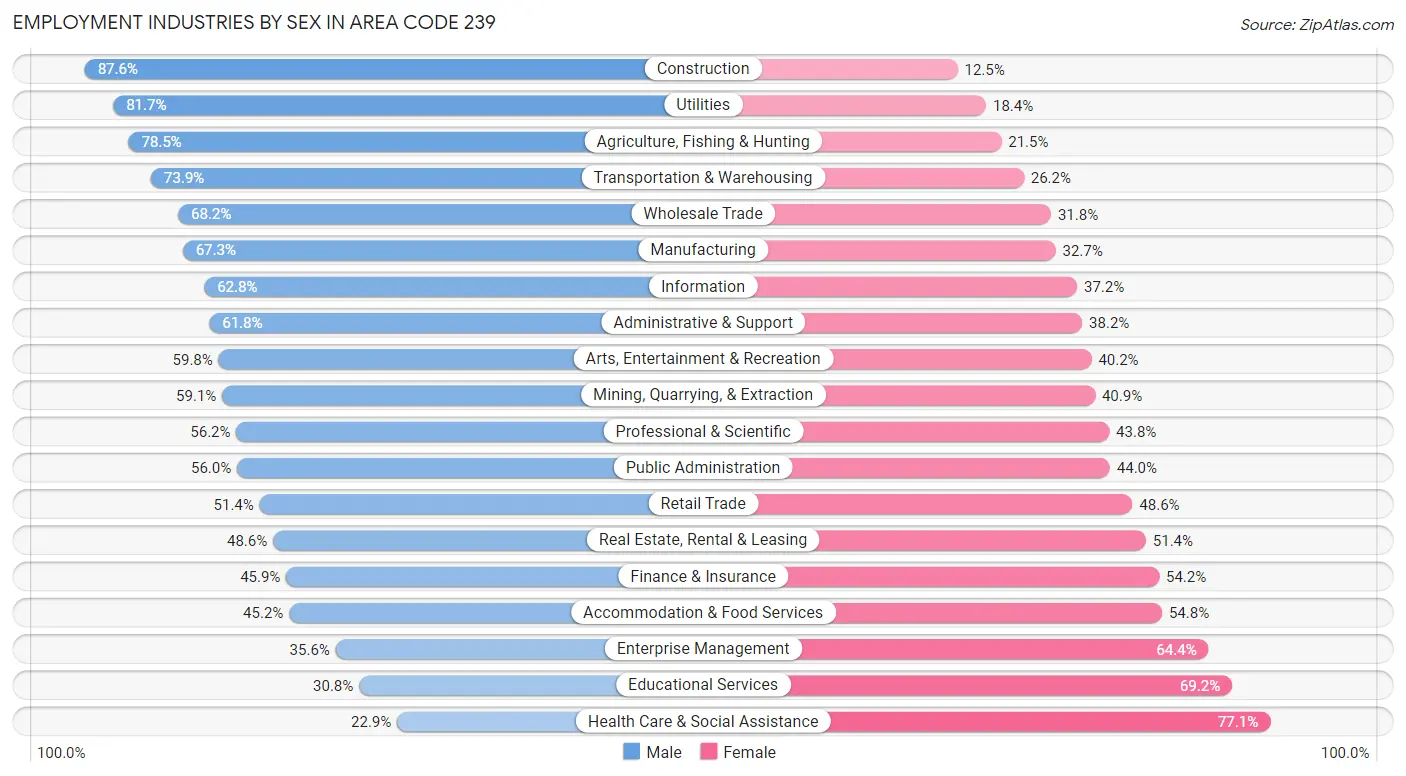
Employment Industries by Sex in Area Code 239
The Area Code 239 industries that see more men than women are Construction (87.5%), Utilities (81.7%), and Agriculture, Fishing & Hunting (78.5%), whereas the industries that tend to have a higher number of women are Health Care & Social Assistance (77.1%), Educational Services (69.2%), and Enterprise Management (64.4%).
| Industry | Male | Female |
| Agriculture, Fishing & Hunting | 3,486 (78.5%) | 955 (21.5%) |
| Mining, Quarrying, & Extraction | 172 (59.1%) | 119 (40.9%) |
| Construction | 54,278 (87.5%) | 7,718 (12.4%) |
| Manufacturing | 14,456 (67.3%) | 7,033 (32.7%) |
| Wholesale Trade | 8,038 (68.2%) | 3,745 (31.8%) |
| Retail Trade | 38,152 (51.4%) | 36,138 (48.6%) |
| Transportation & Warehousing | 18,146 (73.9%) | 6,426 (26.2%) |
| Utilities | 2,576 (81.7%) | 579 (18.3%) |
| Information | 4,992 (62.8%) | 2,954 (37.2%) |
| Finance & Insurance | 9,507 (45.9%) | 11,229 (54.1%) |
| Real Estate, Rental & Leasing | 9,075 (48.6%) | 9,604 (51.4%) |
| Professional & Scientific | 21,052 (56.2%) | 16,427 (43.8%) |
| Enterprise Management | 130 (35.6%) | 235 (64.4%) |
| Administrative & Support | 23,017 (61.8%) | 14,250 (38.2%) |
| Educational Services | 11,235 (30.8%) | 25,289 (69.2%) |
| Health Care & Social Assistance | 16,053 (22.9%) | 54,089 (77.1%) |
| Arts, Entertainment & Recreation | 10,957 (59.8%) | 7,353 (40.2%) |
| Accommodation & Food Services | 21,822 (45.2%) | 26,417 (54.8%) |
| Public Administration | 9,896 (56.0%) | 7,766 (44.0%) |
| Total | 289,379 (53.5%) | 251,521 (46.5%) |
Education in Area Code 239
School Enrollment in Area Code 239
The most common levels of schooling among the 233,292 students in Area Code 239 are high school (55,867 | 23.9%), middle school (51,047 | 21.9%), and elementary school (47,280 | 20.3%).
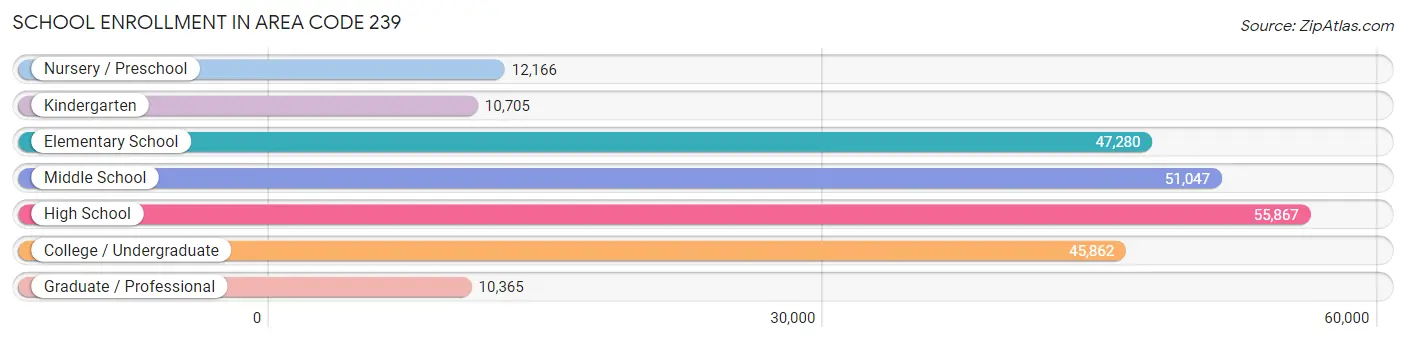
| School Level | # Students | % Students |
| Nursery / Preschool | 12,166 | 5.2% |
| Kindergarten | 10,705 | 4.6% |
| Elementary School | 47,280 | 20.3% |
| Middle School | 51,047 | 21.9% |
| High School | 55,867 | 23.9% |
| College / Undergraduate | 45,862 | 19.7% |
| Graduate / Professional | 10,365 | 4.4% |
| Total | 233,292 | 100.0% |
School Enrollment by Age by Funding Source in Area Code 239
Out of a total of 233,292 students who are enrolled in schools in Area Code 239, 37,290 (16.0%) attend a private institution, while the remaining 196,002 (84.0%) are enrolled in public schools. The age group of 3 to 4 year olds has the highest likelihood of being enrolled in private schools, with 3,546 (38.5% in the age bracket) enrolled. Conversely, the age group of 15 to 17 year olds has the lowest likelihood of being enrolled in a private school, with 34,856 (90.3% in the age bracket) attending a public institution.
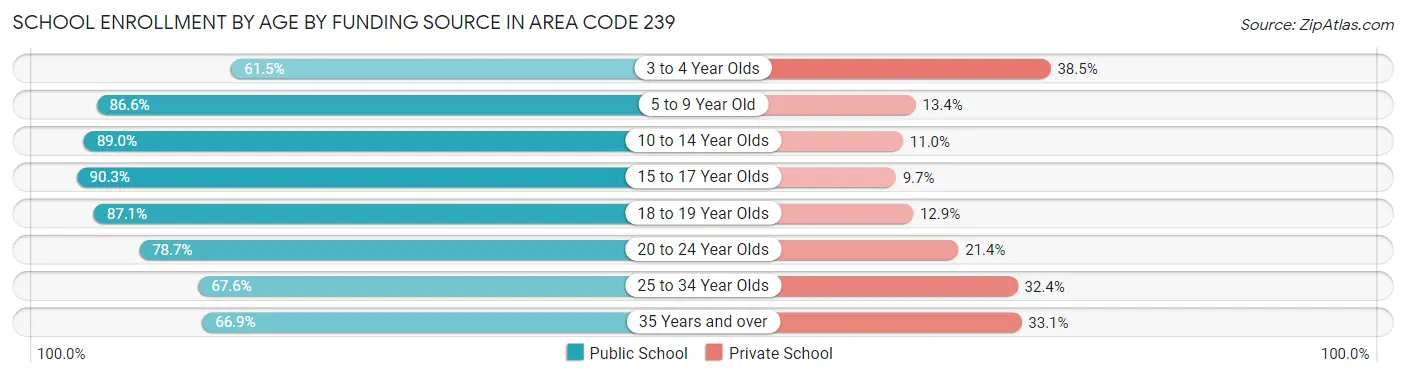
| Age Bracket | Public School | Private School |
| 3 to 4 Year Olds | 5,660 (61.5%) | 3,546 (38.5%) |
| 5 to 9 Year Old | 46,500 (86.6%) | 7,187 (13.4%) |
| 10 to 14 Year Olds | 57,385 (89.0%) | 7,110 (11.0%) |
| 15 to 17 Year Olds | 34,856 (90.3%) | 3,741 (9.7%) |
| 18 to 19 Year Olds | 16,262 (87.1%) | 2,410 (12.9%) |
| 20 to 24 Year Olds | 18,199 (78.6%) | 4,940 (21.3%) |
| 25 to 34 Year Olds | 8,506 (67.6%) | 4,075 (32.4%) |
| 35 Years and over | 8,640 (66.9%) | 4,275 (33.1%) |
| Total | 196,002 (84.0%) | 37,290 (16.0%) |
Educational Attainment by Field of Study in Area Code 239
Business (75,946 | 23.6%), education (50,441 | 15.7%), science & technology (32,522 | 10.1%), social sciences (25,254 | 7.8%), and engineering (21,351 | 6.6%) are the most common fields of study among 321,925 individuals in Area Code 239 who have obtained a bachelor's degree or higher.
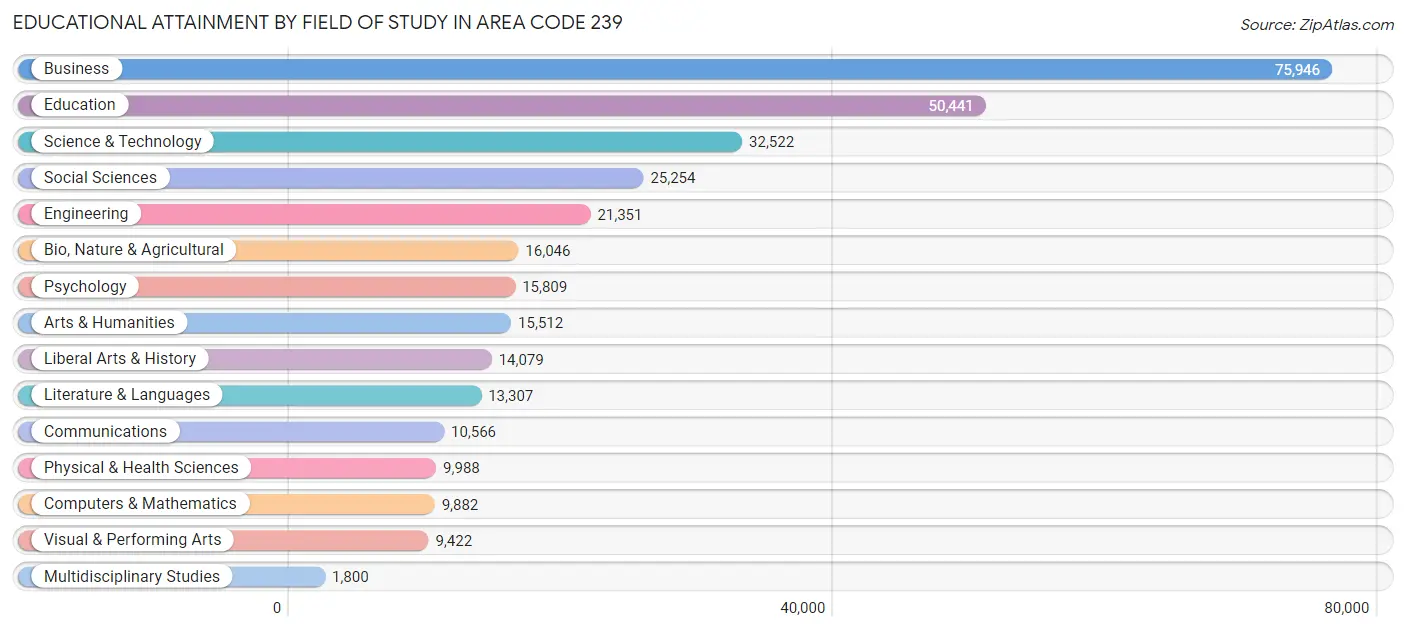
| Field of Study | # Graduates | % Graduates |
| Computers & Mathematics | 9,882 | 3.1% |
| Bio, Nature & Agricultural | 16,046 | 5.0% |
| Physical & Health Sciences | 9,988 | 3.1% |
| Psychology | 15,809 | 4.9% |
| Social Sciences | 25,254 | 7.8% |
| Engineering | 21,351 | 6.6% |
| Multidisciplinary Studies | 1,800 | 0.6% |
| Science & Technology | 32,522 | 10.1% |
| Business | 75,946 | 23.6% |
| Education | 50,441 | 15.7% |
| Literature & Languages | 13,307 | 4.1% |
| Liberal Arts & History | 14,079 | 4.4% |
| Visual & Performing Arts | 9,422 | 2.9% |
| Communications | 10,566 | 3.3% |
| Arts & Humanities | 15,512 | 4.8% |
| Total | 321,925 | 100.0% |
Transportation & Commute in Area Code 239
Vehicle Availability by Sex in Area Code 239
The most prevalent vehicle ownership categories in Area Code 239 are males with 2 vehicles (131,590, accounting for 46.5%) and females with 2 vehicles (109,812, making up 53.8%).
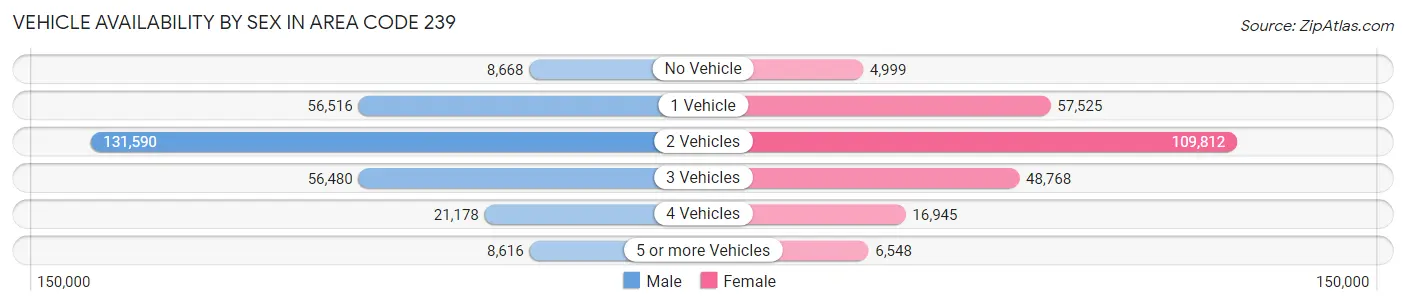
| Vehicles Available | Male | Female |
| No Vehicle | 8,668 (3.1%) | 4,999 (2.0%) |
| 1 Vehicle | 56,516 (20.0%) | 57,525 (23.5%) |
| 2 Vehicles | 131,590 (46.5%) | 109,812 (44.9%) |
| 3 Vehicles | 56,480 (20.0%) | 48,768 (19.9%) |
| 4 Vehicles | 21,178 (7.5%) | 16,945 (6.9%) |
| 5 or more Vehicles | 8,616 (3.0%) | 6,548 (2.7%) |
| Total | 283,048 (100.0%) | 244,597 (100.0%) |
Commute Time in Area Code 239
The most frequently occuring commute durations in Area Code 239 are 20 to 24 minutes (76,023 commuters, 16.1%), 30 to 34 minutes (75,201 commuters, 16.0%), and 15 to 19 minutes (72,139 commuters, 15.3%).
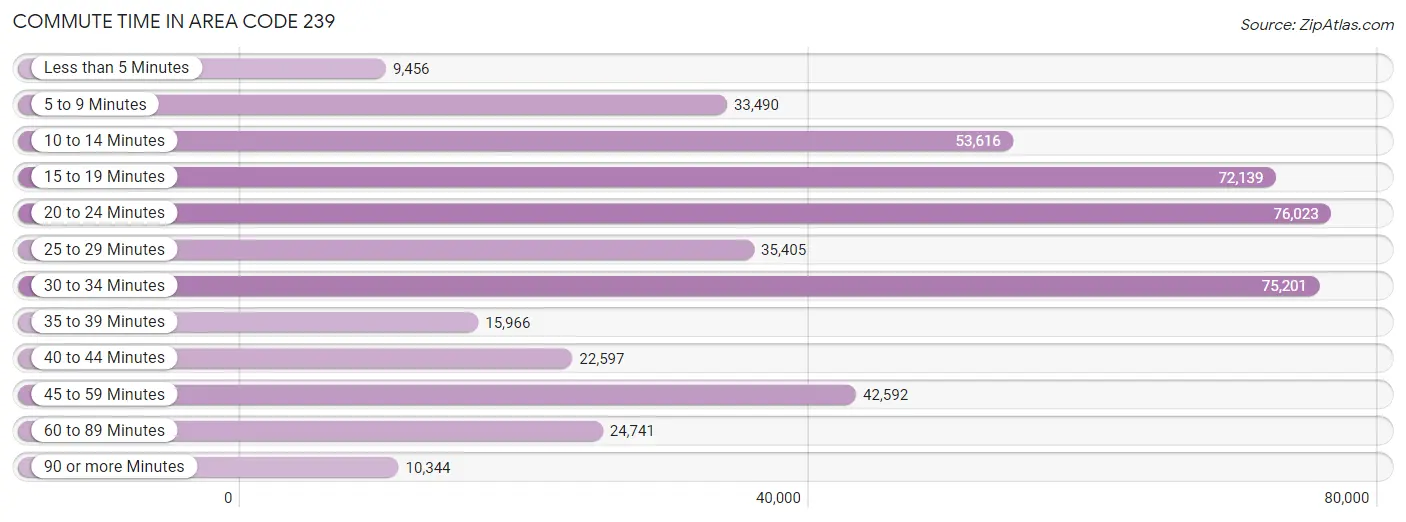
| Commute Time | # Commuters | % Commuters |
| Less than 5 Minutes | 9,456 | 2.0% |
| 5 to 9 Minutes | 33,490 | 7.1% |
| 10 to 14 Minutes | 53,616 | 11.4% |
| 15 to 19 Minutes | 72,139 | 15.3% |
| 20 to 24 Minutes | 76,023 | 16.1% |
| 25 to 29 Minutes | 35,405 | 7.5% |
| 30 to 34 Minutes | 75,201 | 16.0% |
| 35 to 39 Minutes | 15,966 | 3.4% |
| 40 to 44 Minutes | 22,597 | 4.8% |
| 45 to 59 Minutes | 42,592 | 9.0% |
| 60 to 89 Minutes | 24,741 | 5.2% |
| 90 or more Minutes | 10,344 | 2.2% |
Commute Time by Sex in Area Code 239
The most common commute times in Area Code 239 are 30 to 34 minutes (42,142 commuters, 16.6%) for males and 15 to 19 minutes (36,559 commuters, 16.8%) for females.
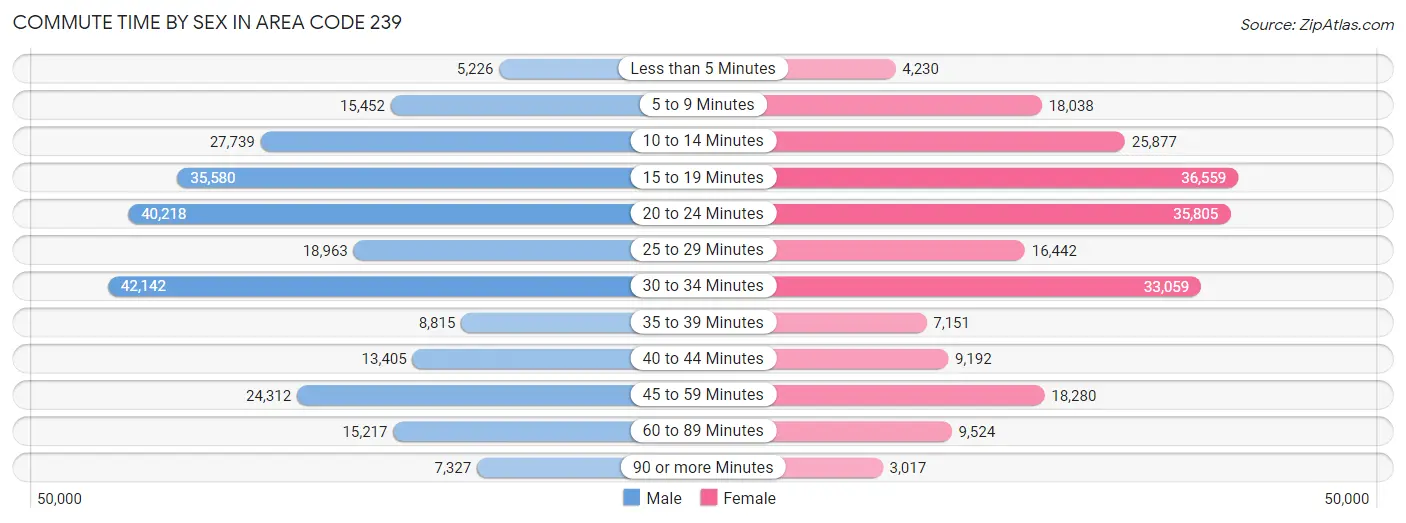
| Commute Time | Male | Female |
| Less than 5 Minutes | 5,226 (2.1%) | 4,230 (1.9%) |
| 5 to 9 Minutes | 15,452 (6.1%) | 18,038 (8.3%) |
| 10 to 14 Minutes | 27,739 (10.9%) | 25,877 (11.9%) |
| 15 to 19 Minutes | 35,580 (14.0%) | 36,559 (16.8%) |
| 20 to 24 Minutes | 40,218 (15.8%) | 35,805 (16.5%) |
| 25 to 29 Minutes | 18,963 (7.4%) | 16,442 (7.6%) |
| 30 to 34 Minutes | 42,142 (16.6%) | 33,059 (15.2%) |
| 35 to 39 Minutes | 8,815 (3.5%) | 7,151 (3.3%) |
| 40 to 44 Minutes | 13,405 (5.3%) | 9,192 (4.2%) |
| 45 to 59 Minutes | 24,312 (9.6%) | 18,280 (8.4%) |
| 60 to 89 Minutes | 15,217 (6.0%) | 9,524 (4.4%) |
| 90 or more Minutes | 7,327 (2.9%) | 3,017 (1.4%) |
Time of Departure to Work by Sex in Area Code 239
The most frequent times of departure to work in Area Code 239 are 7:00 AM to 7:29 AM (39,614, 15.6%) for males and 7:00 AM to 7:29 AM (32,622, 15.0%) for females.
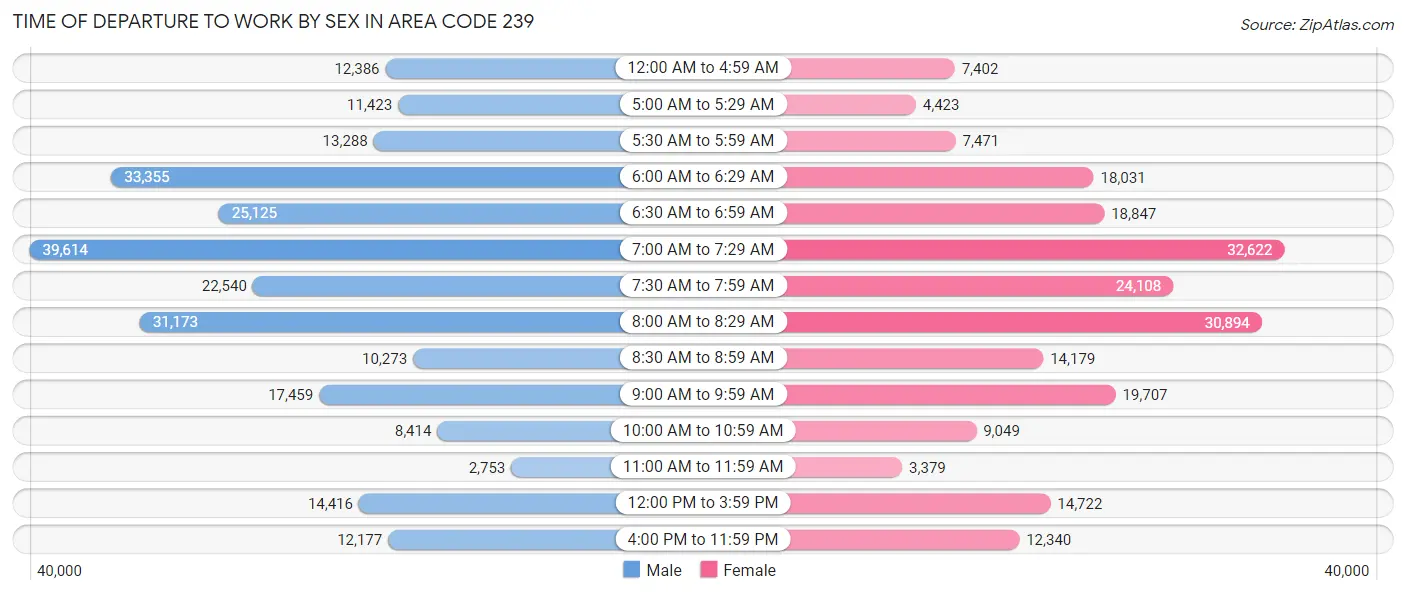
| Time of Departure | Male | Female |
| 12:00 AM to 4:59 AM | 12,386 (4.9%) | 7,402 (3.4%) |
| 5:00 AM to 5:29 AM | 11,423 (4.5%) | 4,423 (2.0%) |
| 5:30 AM to 5:59 AM | 13,288 (5.2%) | 7,471 (3.4%) |
| 6:00 AM to 6:29 AM | 33,355 (13.1%) | 18,031 (8.3%) |
| 6:30 AM to 6:59 AM | 25,125 (9.9%) | 18,847 (8.7%) |
| 7:00 AM to 7:29 AM | 39,614 (15.6%) | 32,622 (15.0%) |
| 7:30 AM to 7:59 AM | 22,540 (8.9%) | 24,108 (11.1%) |
| 8:00 AM to 8:29 AM | 31,173 (12.2%) | 30,894 (14.2%) |
| 8:30 AM to 8:59 AM | 10,273 (4.0%) | 14,179 (6.5%) |
| 9:00 AM to 9:59 AM | 17,459 (6.9%) | 19,707 (9.1%) |
| 10:00 AM to 10:59 AM | 8,414 (3.3%) | 9,049 (4.2%) |
| 11:00 AM to 11:59 AM | 2,753 (1.1%) | 3,379 (1.6%) |
| 12:00 PM to 3:59 PM | 14,416 (5.7%) | 14,722 (6.8%) |
| 4:00 PM to 11:59 PM | 12,177 (4.8%) | 12,340 (5.7%) |
| Total | 254,396 (100.0%) | 217,174 (100.0%) |
Housing Occupancy in Area Code 239
Occupancy by Ownership in Area Code 239
Of the total 507,445 dwellings in Area Code 239, owner-occupied units account for 372,532 (73.4%), while renter-occupied units make up 134,913 (26.6%).
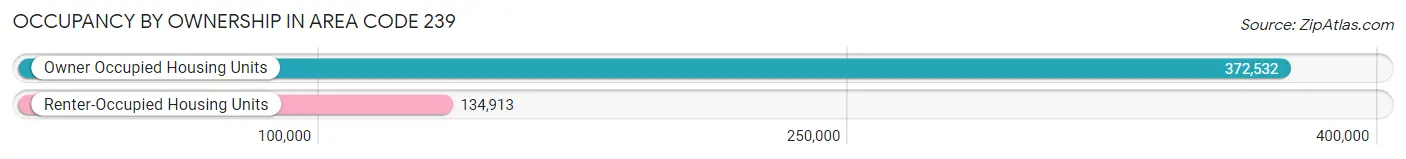
| Occupancy | # Housing Units | % Housing Units |
| Owner Occupied Housing Units | 372,532 | 73.4% |
| Renter-Occupied Housing Units | 134,913 | 26.6% |
| Total Occupied Housing Units | 507,445 | 100.0% |
Occupancy by Household Size in Area Code 239
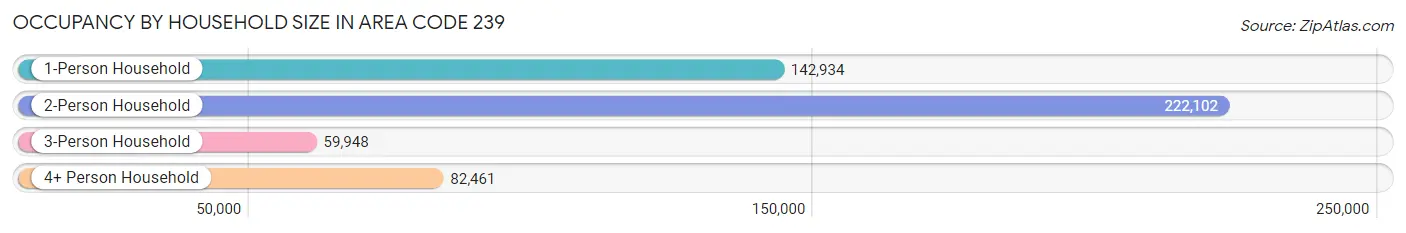
| Household Size | # Housing Units | % Housing Units |
| 1-Person Household | 142,934 | 28.2% |
| 2-Person Household | 222,102 | 43.8% |
| 3-Person Household | 59,948 | 11.8% |
| 4+ Person Household | 82,461 | 16.3% |
| Total Housing Units | 507,445 | 100.0% |
Occupancy by Ownership by Household Size in Area Code 239
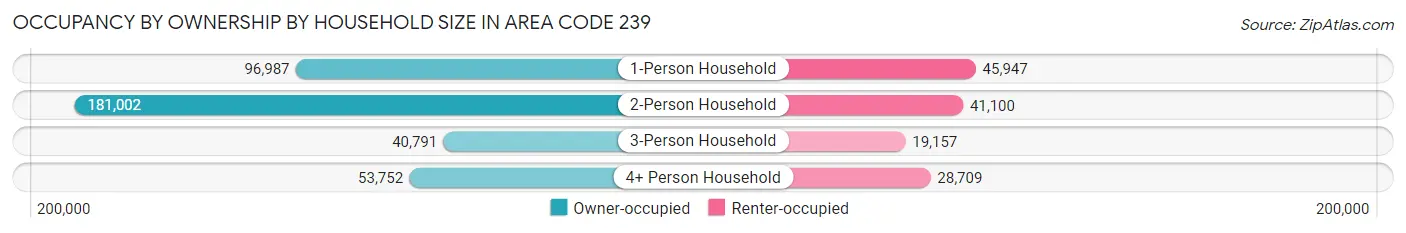
| Household Size | Owner-occupied | Renter-occupied |
| 1-Person Household | 96,987 (67.8%) | 45,947 (32.2%) |
| 2-Person Household | 181,002 (81.5%) | 41,100 (18.5%) |
| 3-Person Household | 40,791 (68.0%) | 19,157 (32.0%) |
| 4+ Person Household | 53,752 (65.2%) | 28,709 (34.8%) |
| Total Housing Units | 372,532 (73.4%) | 134,913 (26.6%) |
Occupancy by Educational Attainment in Area Code 239
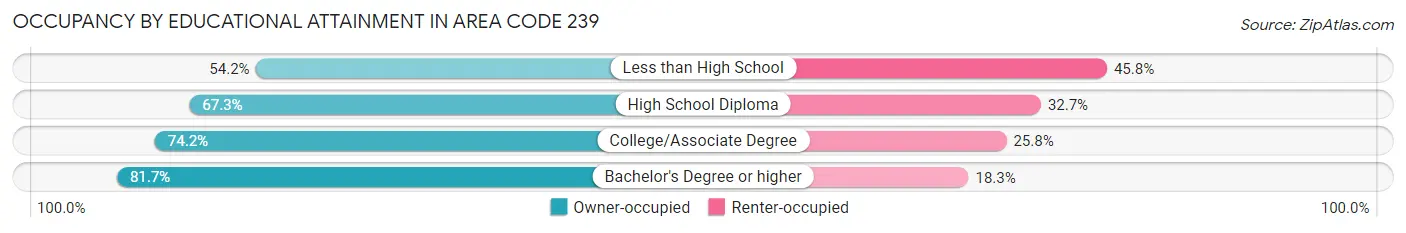
| Household Size | Owner-occupied | Renter-occupied |
| Less than High School | 23,437 (54.2%) | 19,772 (45.8%) |
| High School Diploma | 87,898 (67.3%) | 42,655 (32.7%) |
| College/Associate Degree | 112,011 (74.2%) | 39,033 (25.8%) |
| Bachelor's Degree or higher | 149,186 (81.7%) | 33,453 (18.3%) |
Occupancy by Age of Householder in Area Code 239
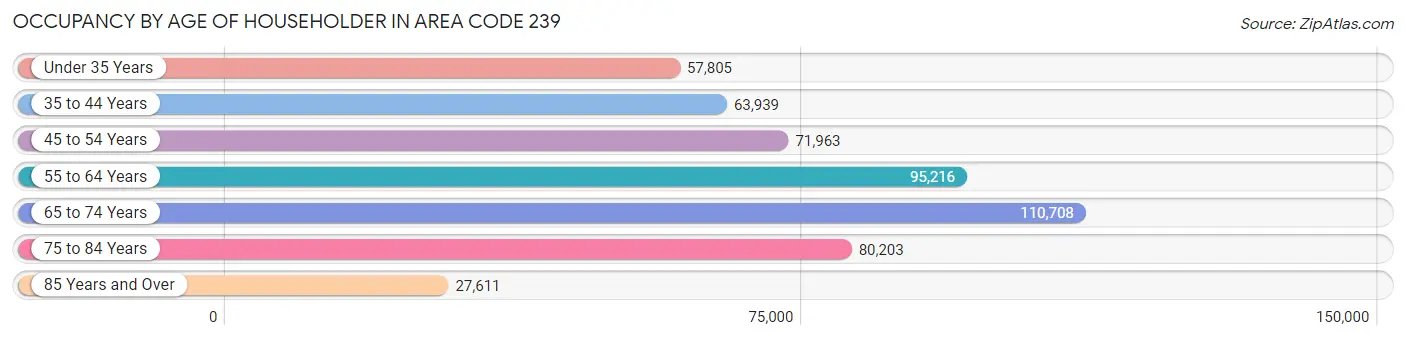
| Age Bracket | # Households | % Households |
| Under 35 Years | 57,805 | 11.4% |
| 35 to 44 Years | 63,939 | 12.6% |
| 45 to 54 Years | 71,963 | 14.2% |
| 55 to 64 Years | 95,216 | 18.8% |
| 65 to 74 Years | 110,708 | 21.8% |
| 75 to 84 Years | 80,203 | 15.8% |
| 85 Years and Over | 27,611 | 5.4% |
| Total | 507,445 | 100.0% |
Housing Finances in Area Code 239
Median Income by Occupancy in Area Code 239
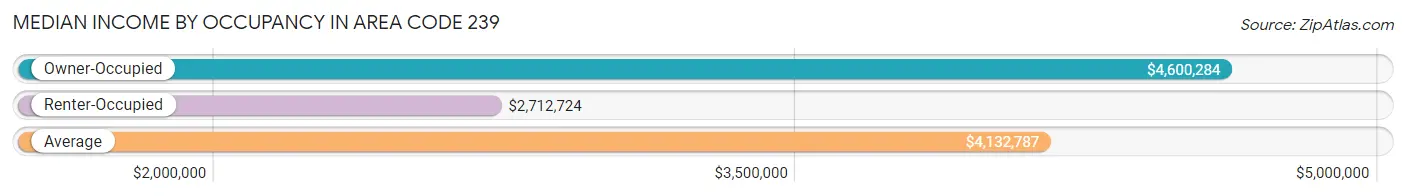
| Occupancy Type | # Households | Median Income |
| Owner-Occupied | 372,532 (73.4%) | $4,600,284 |
| Renter-Occupied | 134,913 (26.6%) | $2,712,724 |
| Average | 507,445 (100.0%) | $4,132,787 |
Occupancy by Householder Income Bracket in Area Code 239
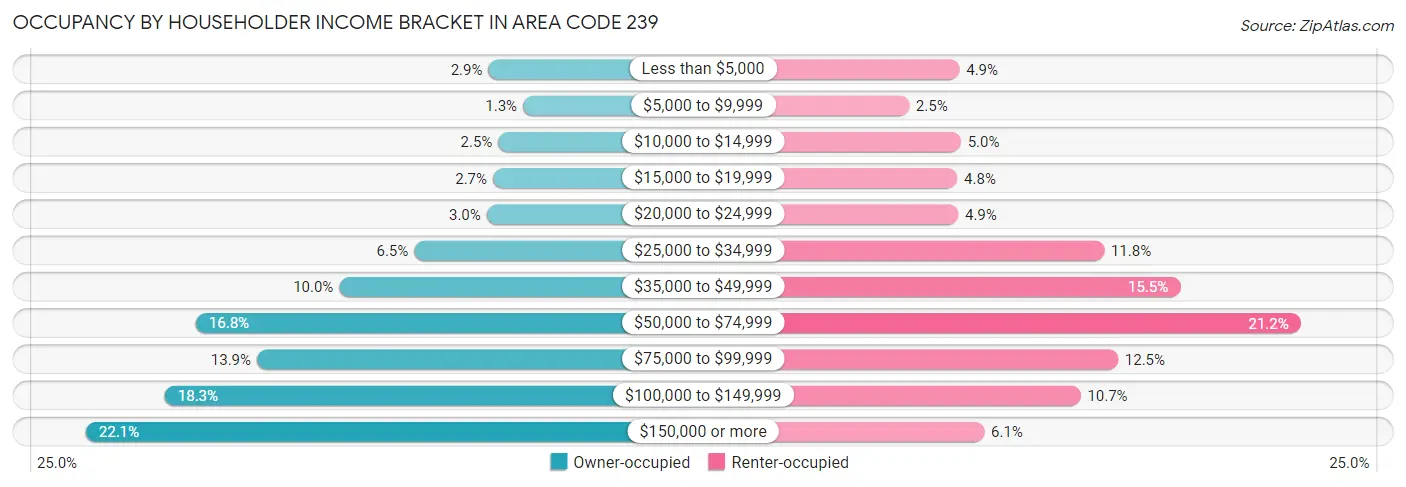
| Income Bracket | Owner-occupied | Renter-occupied |
| Less than $5,000 | 10,865 (2.9%) | 6,670 (4.9%) |
| $5,000 to $9,999 | 4,738 (1.3%) | 3,432 (2.5%) |
| $10,000 to $14,999 | 9,128 (2.5%) | 6,755 (5.0%) |
| $15,000 to $19,999 | 10,050 (2.7%) | 6,528 (4.8%) |
| $20,000 to $24,999 | 11,166 (3.0%) | 6,582 (4.9%) |
| $25,000 to $34,999 | 24,044 (6.5%) | 15,965 (11.8%) |
| $35,000 to $49,999 | 37,335 (10.0%) | 20,845 (15.4%) |
| $50,000 to $74,999 | 62,740 (16.8%) | 28,588 (21.2%) |
| $75,000 to $99,999 | 51,949 (13.9%) | 16,844 (12.5%) |
| $100,000 to $149,999 | 68,260 (18.3%) | 14,444 (10.7%) |
| $150,000 or more | 82,257 (22.1%) | 8,260 (6.1%) |
| Total | 372,532 (100.0%) | 134,913 (100.0%) |
Monthly Housing Cost Tiers in Area Code 239
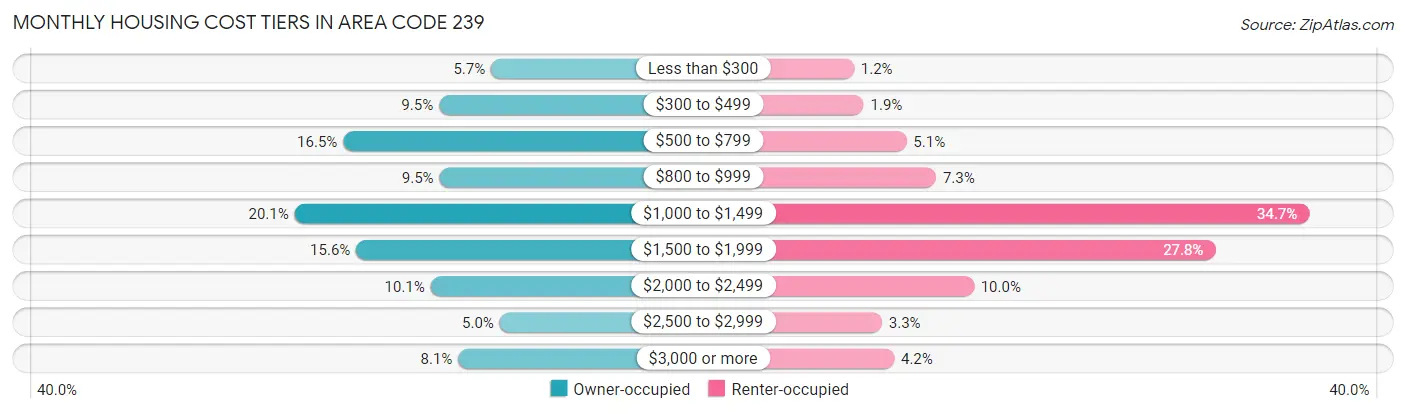
| Monthly Cost | Owner-occupied | Renter-occupied |
| Less than $300 | 21,034 (5.7%) | 1,626 (1.2%) |
| $300 to $499 | 35,303 (9.5%) | 2,600 (1.9%) |
| $500 to $799 | 61,619 (16.5%) | 6,858 (5.1%) |
| $800 to $999 | 35,200 (9.5%) | 9,797 (7.3%) |
| $1,000 to $1,499 | 74,956 (20.1%) | 46,866 (34.7%) |
| $1,500 to $1,999 | 58,030 (15.6%) | 37,529 (27.8%) |
| $2,000 to $2,499 | 37,643 (10.1%) | 13,552 (10.0%) |
| $2,500 to $2,999 | 18,680 (5.0%) | 4,417 (3.3%) |
| $3,000 or more | 30,067 (8.1%) | 5,632 (4.2%) |
| Total | 372,532 (100.0%) | 134,913 (100.0%) |
Physical Housing Characteristics in Area Code 239
Housing Structures in Area Code 239
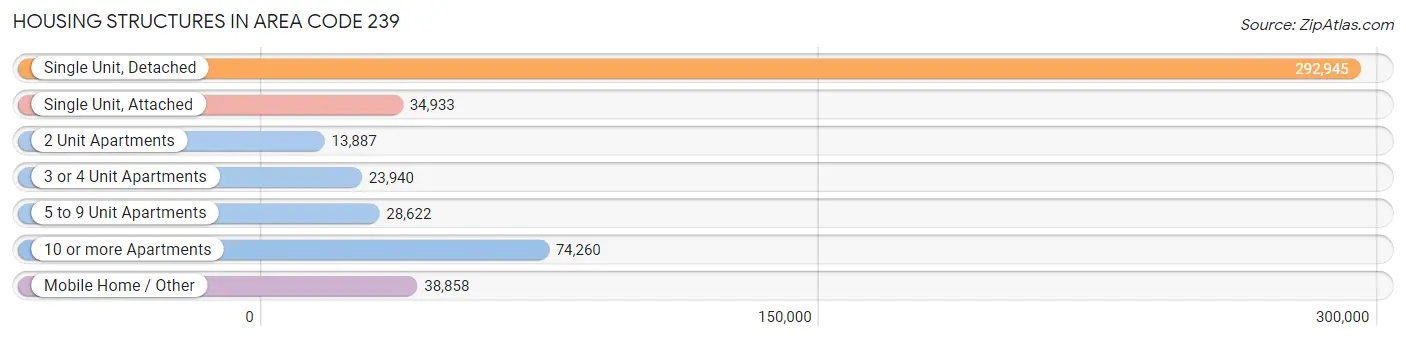
| Structure Type | # Housing Units | % Housing Units |
| Single Unit, Detached | 292,945 | 57.7% |
| Single Unit, Attached | 34,933 | 6.9% |
| 2 Unit Apartments | 13,887 | 2.7% |
| 3 or 4 Unit Apartments | 23,940 | 4.7% |
| 5 to 9 Unit Apartments | 28,622 | 5.6% |
| 10 or more Apartments | 74,260 | 14.6% |
| Mobile Home / Other | 38,858 | 7.7% |
| Total | 507,445 | 100.0% |
Housing Structures by Occupancy in Area Code 239
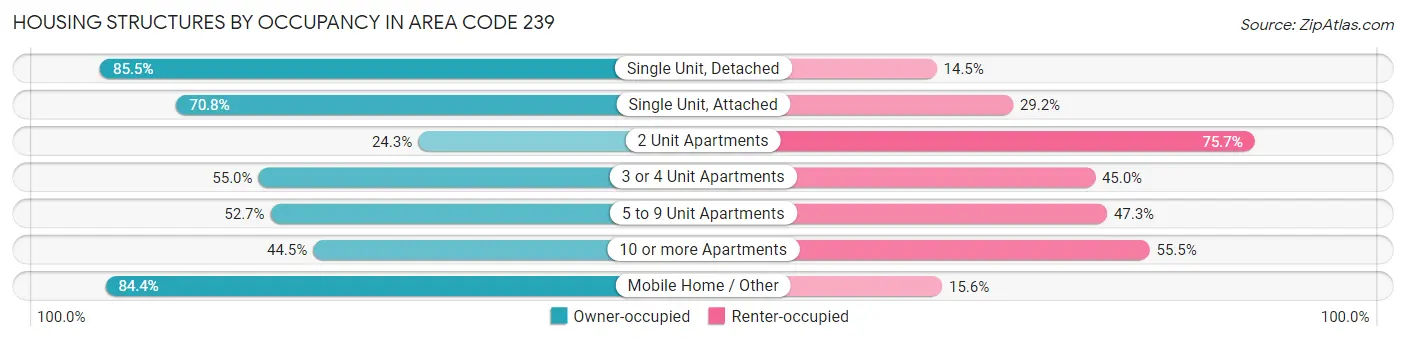
| Structure Type | Owner-occupied | Renter-occupied |
| Single Unit, Detached | 250,367 (85.5%) | 42,578 (14.5%) |
| Single Unit, Attached | 24,726 (70.8%) | 10,207 (29.2%) |
| 2 Unit Apartments | 3,369 (24.3%) | 10,518 (75.7%) |
| 3 or 4 Unit Apartments | 13,165 (55.0%) | 10,775 (45.0%) |
| 5 to 9 Unit Apartments | 15,078 (52.7%) | 13,544 (47.3%) |
| 10 or more Apartments | 33,021 (44.5%) | 41,239 (55.5%) |
| Mobile Home / Other | 32,806 (84.4%) | 6,052 (15.6%) |
| Total | 372,532 (73.4%) | 134,913 (26.6%) |
Housing Structures by Number of Rooms in Area Code 239
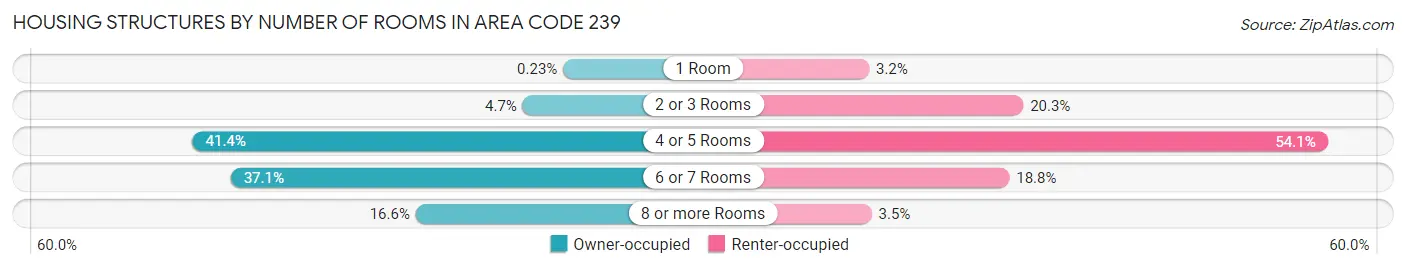
| Number of Rooms | Owner-occupied | Renter-occupied |
| 1 Room | 860 (0.2%) | 4,360 (3.2%) |
| 2 or 3 Rooms | 17,591 (4.7%) | 27,443 (20.3%) |
| 4 or 5 Rooms | 154,026 (41.3%) | 73,002 (54.1%) |
| 6 or 7 Rooms | 138,270 (37.1%) | 25,362 (18.8%) |
| 8 or more Rooms | 61,785 (16.6%) | 4,746 (3.5%) |
| Total | 372,532 (100.0%) | 134,913 (100.0%) |
Housing Structure by Heating Type in Area Code 239
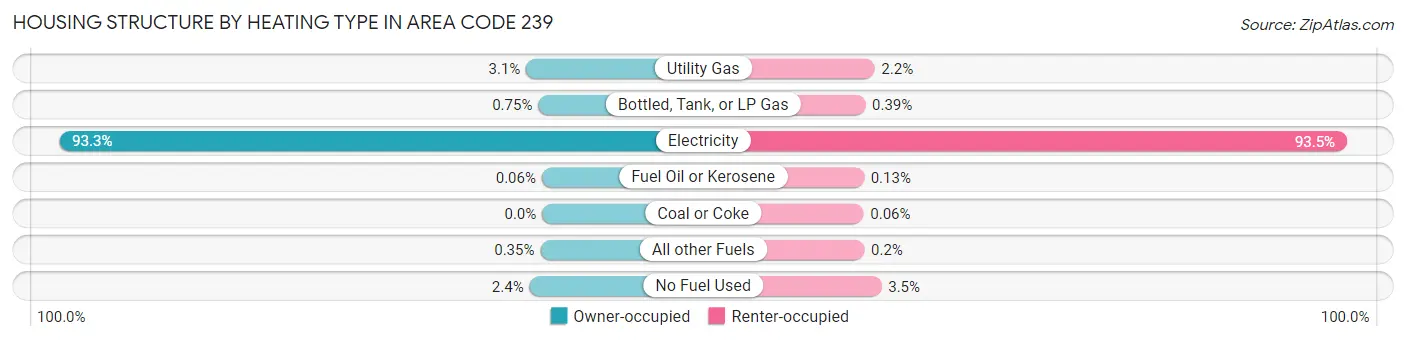
| Heating Type | Owner-occupied | Renter-occupied |
| Utility Gas | 11,426 (3.1%) | 2,964 (2.2%) |
| Bottled, Tank, or LP Gas | 2,790 (0.7%) | 531 (0.4%) |
| Electricity | 347,688 (93.3%) | 126,147 (93.5%) |
| Fuel Oil or Kerosene | 227 (0.1%) | 180 (0.1%) |
| Coal or Coke | 10 (0.0%) | 75 (0.1%) |
| All other Fuels | 1,295 (0.4%) | 269 (0.2%) |
| No Fuel Used | 9,096 (2.4%) | 4,747 (3.5%) |
| Total | 372,532 (100.0%) | 134,913 (100.0%) |
Household Vehicle Usage in Area Code 239
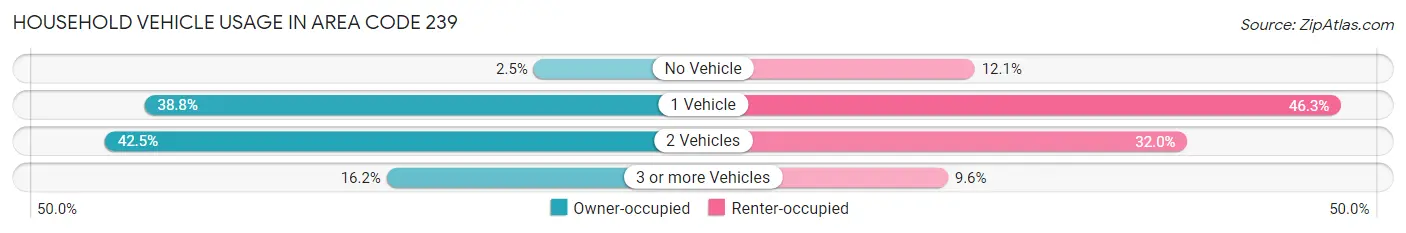
| Vehicles per Household | Owner-occupied | Renter-occupied |
| No Vehicle | 9,241 (2.5%) | 16,356 (12.1%) |
| 1 Vehicle | 144,560 (38.8%) | 62,486 (46.3%) |
| 2 Vehicles | 158,379 (42.5%) | 43,125 (32.0%) |
| 3 or more Vehicles | 60,352 (16.2%) | 12,946 (9.6%) |
| Total | 372,532 (100.0%) | 134,913 (100.0%) |
Real Estate & Mortgages in Area Code 239
Real Estate and Mortgage Overview in Area Code 239
| Characteristic | Without Mortgage | With Mortgage |
| Housing Units | 184,886 | 187,646 |
| Median Property Value | $22,038,201 | $22,124,701 |
| Median Household Income | $3,890,263 | $45,131 |
| Monthly Housing Costs | $40,229 | $26,013 |
| Real Estate Taxes | $164,918 | $4,772 |
Property Value by Mortgage Status in Area Code 239
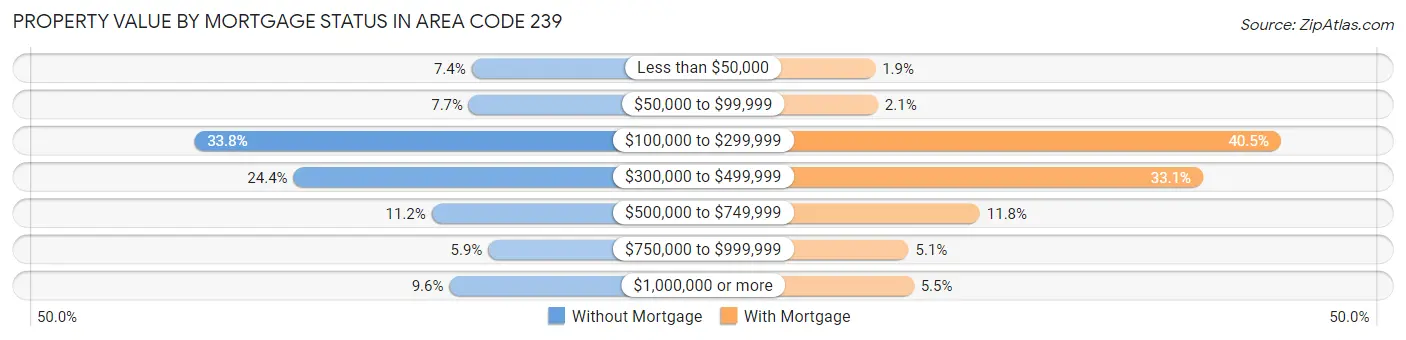
| Property Value | Without Mortgage | With Mortgage |
| Less than $50,000 | 13,732 (7.4%) | 3,506 (1.9%) |
| $50,000 to $99,999 | 14,209 (7.7%) | 3,998 (2.1%) |
| $100,000 to $299,999 | 62,565 (33.8%) | 75,975 (40.5%) |
| $300,000 to $499,999 | 45,116 (24.4%) | 62,075 (33.1%) |
| $500,000 to $749,999 | 20,784 (11.2%) | 22,213 (11.8%) |
| $750,000 to $999,999 | 10,815 (5.9%) | 9,484 (5.1%) |
| $1,000,000 or more | 17,665 (9.6%) | 10,395 (5.5%) |
| Total | 184,886 (100.0%) | 187,646 (100.0%) |
Household Income by Mortgage Status in Area Code 239
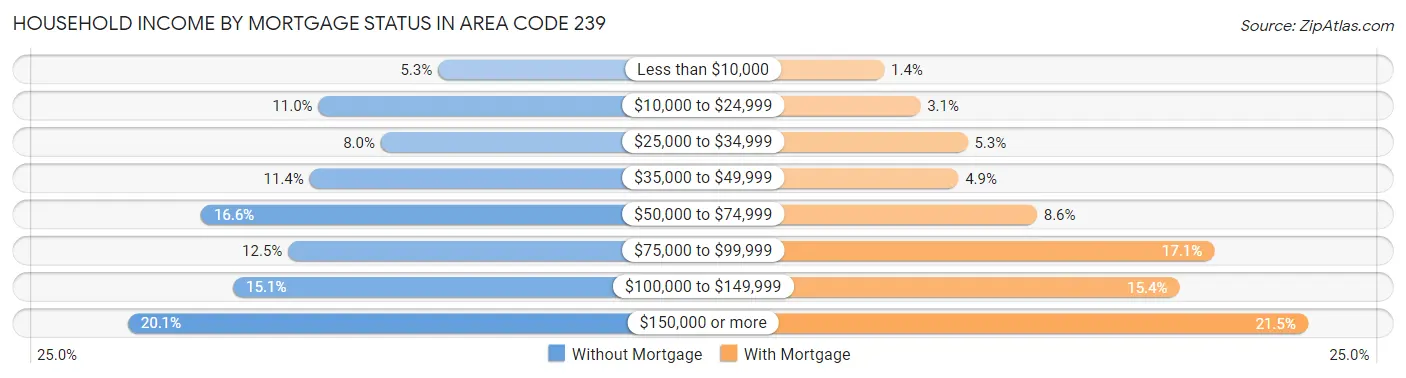
| Household Income | Without Mortgage | With Mortgage |
| Less than $10,000 | 9,826 (5.3%) | 2,554 (1.4%) |
| $10,000 to $24,999 | 20,348 (11.0%) | 5,777 (3.1%) |
| $25,000 to $34,999 | 14,874 (8.0%) | 9,996 (5.3%) |
| $35,000 to $49,999 | 21,133 (11.4%) | 9,170 (4.9%) |
| $50,000 to $74,999 | 30,700 (16.6%) | 16,202 (8.6%) |
| $75,000 to $99,999 | 23,015 (12.4%) | 32,040 (17.1%) |
| $100,000 to $149,999 | 27,864 (15.1%) | 28,934 (15.4%) |
| $150,000 or more | 37,126 (20.1%) | 40,396 (21.5%) |
| Total | 184,886 (100.0%) | 187,646 (100.0%) |
Property Value to Household Income Ratio in Area Code 239
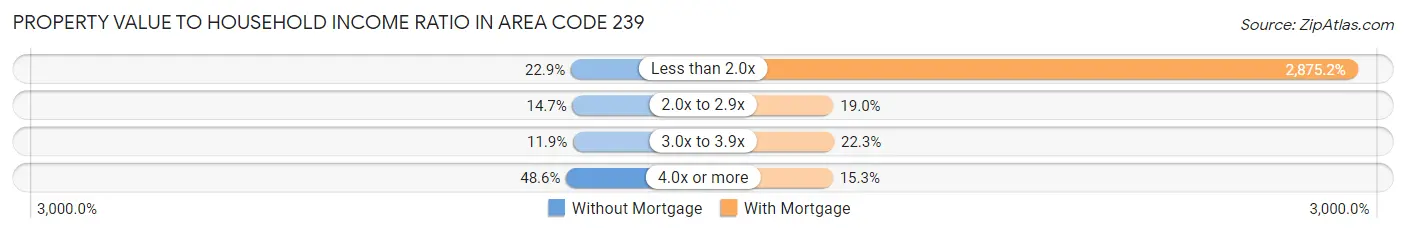
| Value-to-Income Ratio | Without Mortgage | With Mortgage |
| Less than 2.0x | 42,404 (22.9%) | 5,395,128 (2,875.2%) |
| 2.0x to 2.9x | 27,079 (14.6%) | 35,679 (19.0%) |
| 3.0x to 3.9x | 21,973 (11.9%) | 41,915 (22.3%) |
| 4.0x or more | 89,782 (48.6%) | 28,721 (15.3%) |
| Total | 184,886 (100.0%) | 187,646 (100.0%) |
Real Estate Taxes by Mortgage Status in Area Code 239
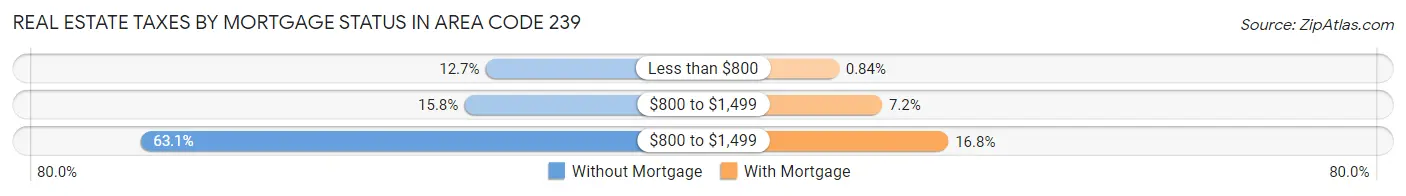
| Property Taxes | Without Mortgage | With Mortgage |
| Less than $800 | 23,452 (12.7%) | 1,578 (0.8%) |
| $800 to $1,499 | 29,180 (15.8%) | 13,423 (7.1%) |
| $800 to $1,499 | 116,648 (63.1%) | 31,578 (16.8%) |
| Total | 184,886 (100.0%) | 187,646 (100.0%) |
Health & Disability in Area Code 239
Health Insurance Coverage by Age in Area Code 239
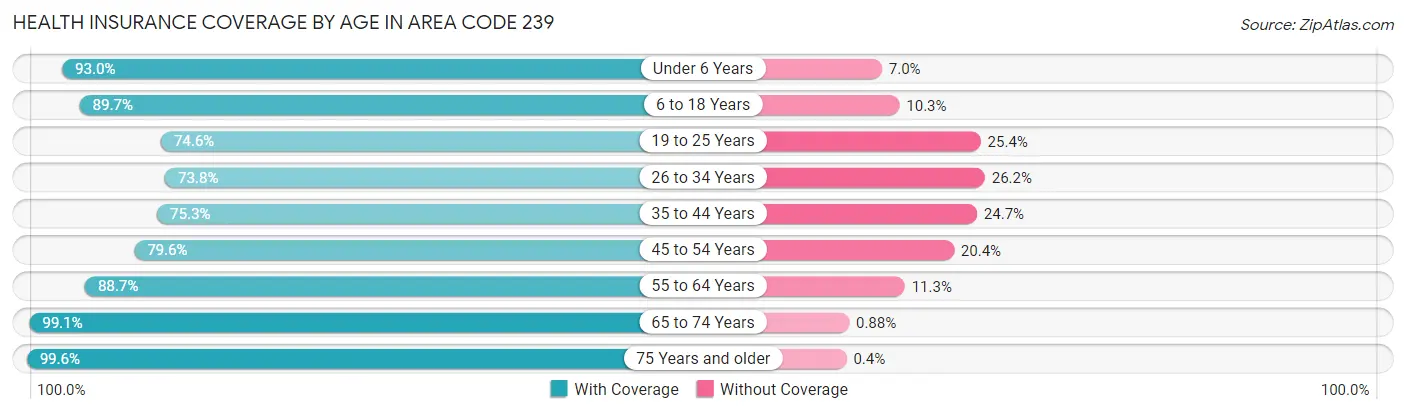
| Age Bracket | With Coverage | Without Coverage |
| Under 6 Years | 63,541 (93.0%) | 4,788 (7.0%) |
| 6 to 18 Years | 149,448 (89.7%) | 17,107 (10.3%) |
| 19 to 25 Years | 67,228 (74.6%) | 22,924 (25.4%) |
| 26 to 34 Years | 88,046 (73.8%) | 31,257 (26.2%) |
| 35 to 44 Years | 96,616 (75.3%) | 31,737 (24.7%) |
| 45 to 54 Years | 113,009 (79.6%) | 29,025 (20.4%) |
| 55 to 64 Years | 154,064 (88.7%) | 19,573 (11.3%) |
| 65 to 74 Years | 187,914 (99.1%) | 1,662 (0.9%) |
| 75 Years and older | 175,936 (99.6%) | 712 (0.4%) |
| Total | 1,095,802 (87.3%) | 158,785 (12.7%) |
Health Insurance Coverage by Citizenship Status in Area Code 239
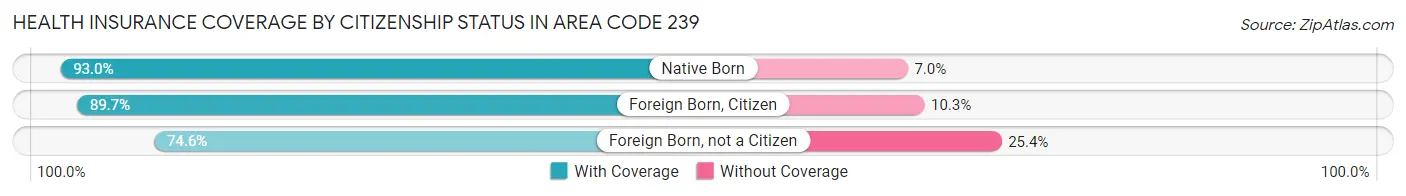
| Citizenship Status | With Coverage | Without Coverage |
| Native Born | 63,541 (93.0%) | 4,788 (7.0%) |
| Foreign Born, Citizen | 149,448 (89.7%) | 17,107 (10.3%) |
| Foreign Born, not a Citizen | 67,228 (74.6%) | 22,924 (25.4%) |
Health Insurance Coverage by Household Income in Area Code 239
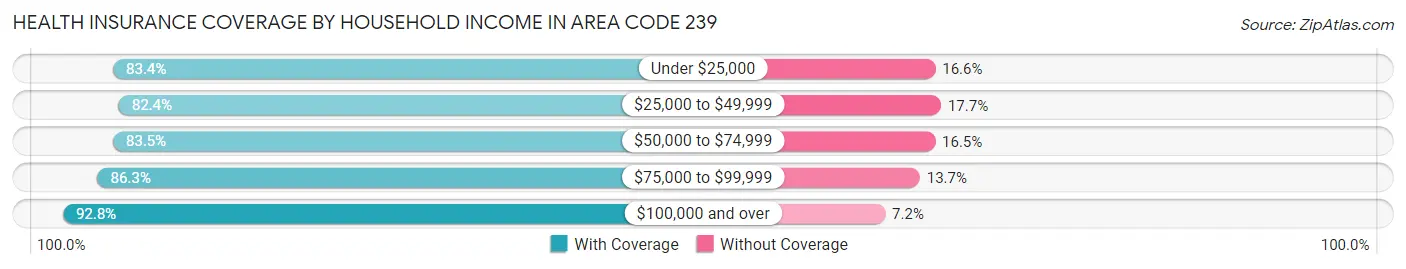
| Household Income | With Coverage | Without Coverage |
| Under $25,000 | 109,225 (83.4%) | 21,714 (16.6%) |
| $25,000 to $49,999 | 171,301 (82.4%) | 36,717 (17.6%) |
| $50,000 to $74,999 | 188,791 (83.5%) | 37,411 (16.5%) |
| $75,000 to $99,999 | 165,080 (86.3%) | 26,156 (13.7%) |
| $100,000 and over | 453,356 (92.8%) | 35,110 (7.2%) |
Public vs Private Health Insurance Coverage by Age in Area Code 239
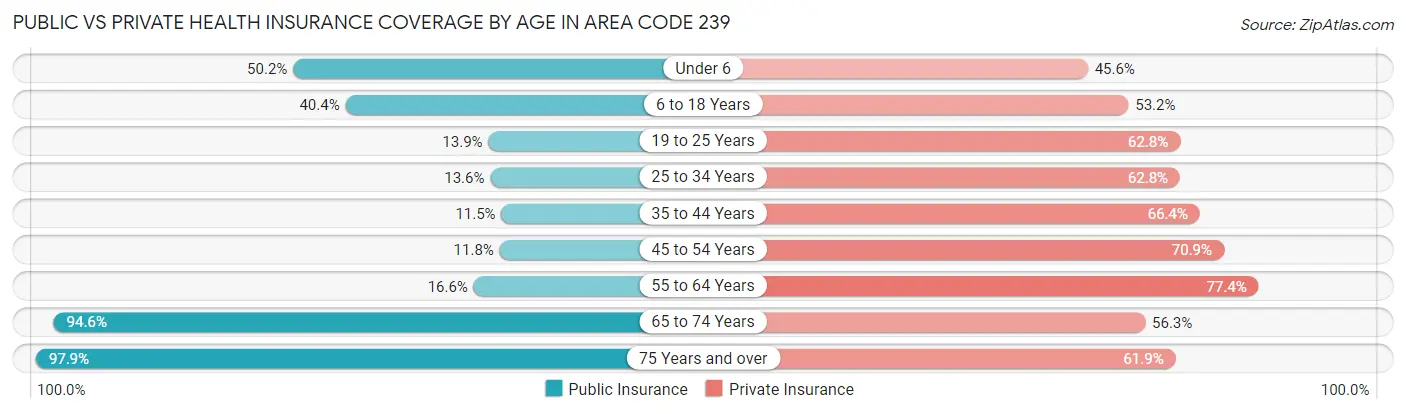
| Age Bracket | Public Insurance | Private Insurance |
| Under 6 | 34,267 (50.1%) | 31,183 (45.6%) |
| 6 to 18 Years | 67,363 (40.4%) | 88,573 (53.2%) |
| 19 to 25 Years | 12,538 (13.9%) | 56,603 (62.8%) |
| 25 to 34 Years | 16,172 (13.6%) | 74,871 (62.8%) |
| 35 to 44 Years | 14,748 (11.5%) | 85,279 (66.4%) |
| 45 to 54 Years | 16,782 (11.8%) | 100,715 (70.9%) |
| 55 to 64 Years | 28,889 (16.6%) | 134,338 (77.4%) |
| 65 to 74 Years | 179,357 (94.6%) | 106,733 (56.3%) |
| 75 Years and over | 172,933 (97.9%) | 109,393 (61.9%) |
| Total | 543,049 (43.3%) | 787,688 (62.8%) |
Disability Status by Sex by Age in Area Code 239
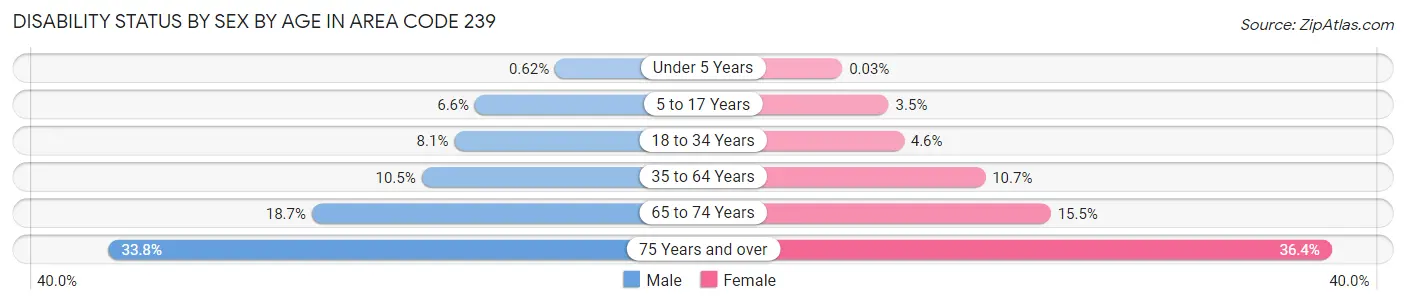
| Age Bracket | Male | Female |
| Under 5 Years | 180 (0.6%) | 8 (0.0%) |
| 5 to 17 Years | 5,515 (6.6%) | 2,777 (3.5%) |
| 18 to 34 Years | 9,180 (8.1%) | 5,062 (4.6%) |
| 35 to 64 Years | 22,824 (10.5%) | 24,197 (10.6%) |
| 65 to 74 Years | 16,626 (18.7%) | 15,604 (15.5%) |
| 75 Years and over | 28,275 (33.8%) | 33,784 (36.4%) |
Disability Class by Sex by Age in Area Code 239
Disability Class: Hearing Difficulty
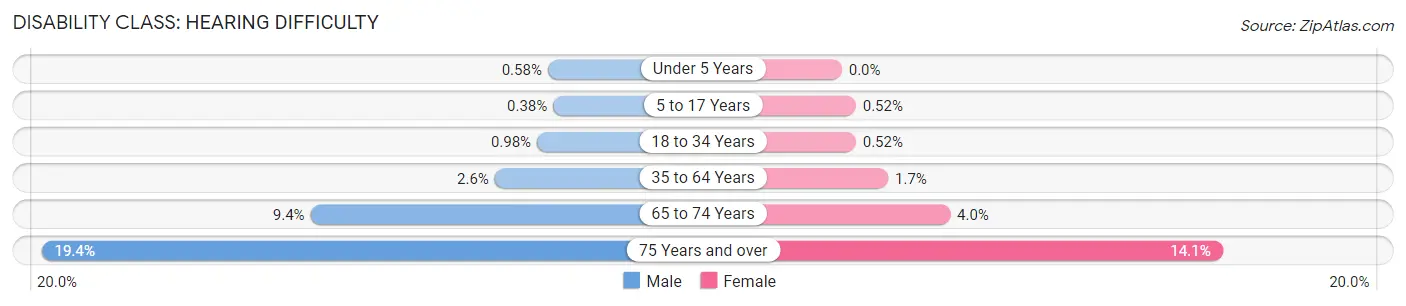
| Age Bracket | Male | Female |
| Under 5 Years | 169 (0.6%) | 0 (0.0%) |
| 5 to 17 Years | 316 (0.4%) | 417 (0.5%) |
| 18 to 34 Years | 1,107 (1.0%) | 575 (0.5%) |
| 35 to 64 Years | 5,537 (2.5%) | 3,902 (1.7%) |
| 65 to 74 Years | 8,356 (9.4%) | 4,041 (4.0%) |
| 75 Years and over | 16,219 (19.4%) | 13,124 (14.1%) |
Disability Class: Vision Difficulty
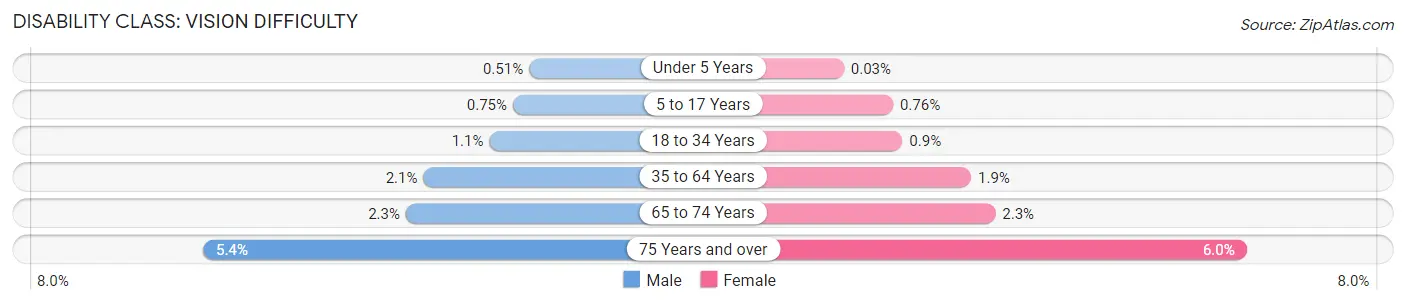
| Age Bracket | Male | Female |
| Under 5 Years | 148 (0.5%) | 8 (0.0%) |
| 5 to 17 Years | 629 (0.7%) | 609 (0.8%) |
| 18 to 34 Years | 1,247 (1.1%) | 993 (0.9%) |
| 35 to 64 Years | 4,505 (2.1%) | 4,373 (1.9%) |
| 65 to 74 Years | 2,083 (2.3%) | 2,294 (2.3%) |
| 75 Years and over | 4,483 (5.3%) | 5,583 (6.0%) |
Disability Class: Cognitive Difficulty
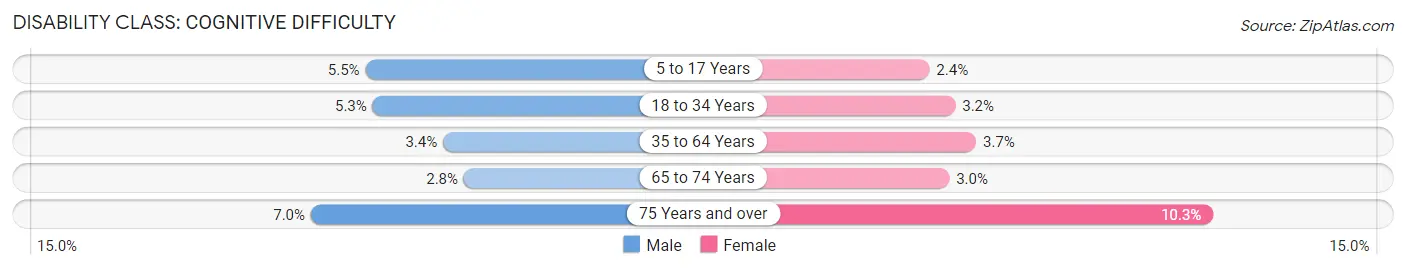
| Age Bracket | Male | Female |
| 5 to 17 Years | 4,626 (5.5%) | 1,945 (2.4%) |
| 18 to 34 Years | 6,017 (5.3%) | 3,478 (3.2%) |
| 35 to 64 Years | 7,267 (3.4%) | 8,506 (3.7%) |
| 65 to 74 Years | 2,469 (2.8%) | 3,009 (3.0%) |
| 75 Years and over | 5,886 (7.0%) | 9,603 (10.3%) |
Disability Class: Ambulatory Difficulty
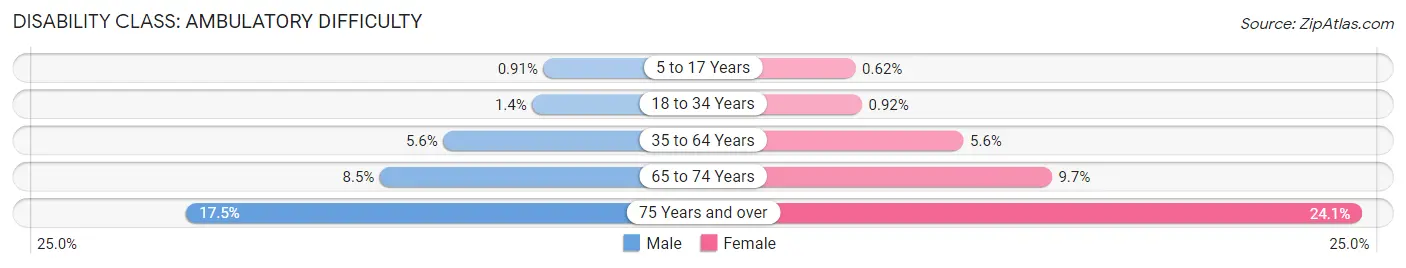
| Age Bracket | Male | Female |
| 5 to 17 Years | 762 (0.9%) | 493 (0.6%) |
| 18 to 34 Years | 1,619 (1.4%) | 1,012 (0.9%) |
| 35 to 64 Years | 12,057 (5.6%) | 12,796 (5.6%) |
| 65 to 74 Years | 7,568 (8.5%) | 9,788 (9.7%) |
| 75 Years and over | 14,649 (17.5%) | 22,425 (24.1%) |
Disability Class: Self-Care Difficulty
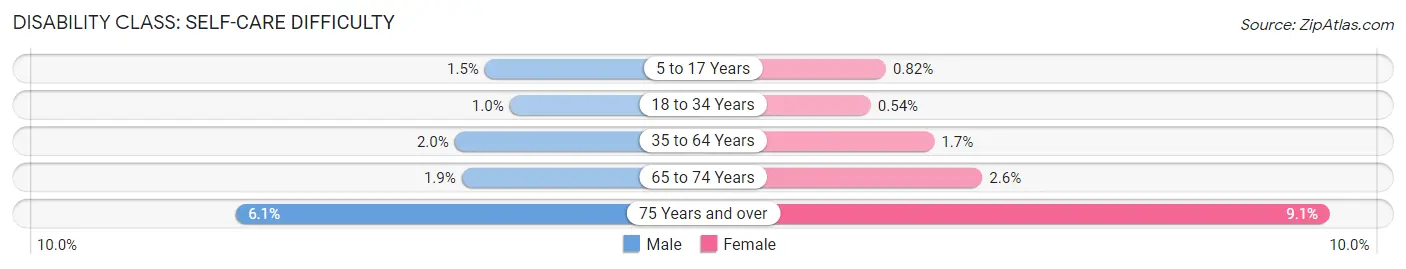
| Age Bracket | Male | Female |
| 5 to 17 Years | 1,227 (1.5%) | 652 (0.8%) |
| 18 to 34 Years | 1,133 (1.0%) | 598 (0.5%) |
| 35 to 64 Years | 4,378 (2.0%) | 3,910 (1.7%) |
| 65 to 74 Years | 1,682 (1.9%) | 2,625 (2.6%) |
| 75 Years and over | 5,097 (6.1%) | 8,418 (9.1%) |
Technology Access in Area Code 239
Computing Device Access in Area Code 239
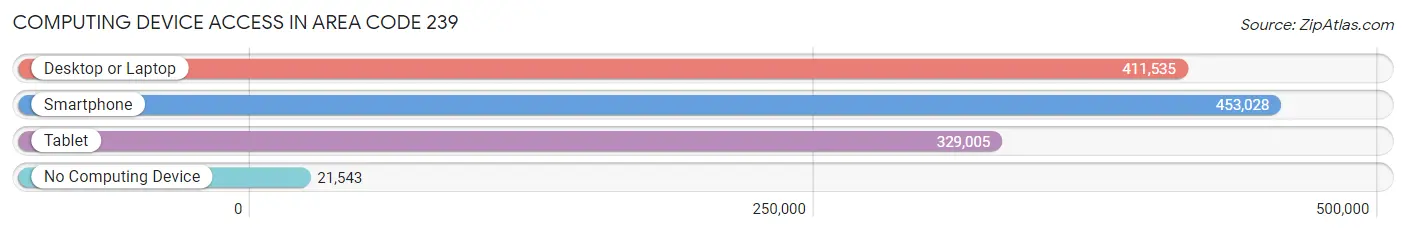
| Device Type | # Households | % Households |
| Desktop or Laptop | 411,535 | 81.1% |
| Smartphone | 453,028 | 89.3% |
| Tablet | 329,005 | 64.8% |
| No Computing Device | 21,543 | 4.3% |
| Total | 507,445 | 100.0% |
Internet Access in Area Code 239
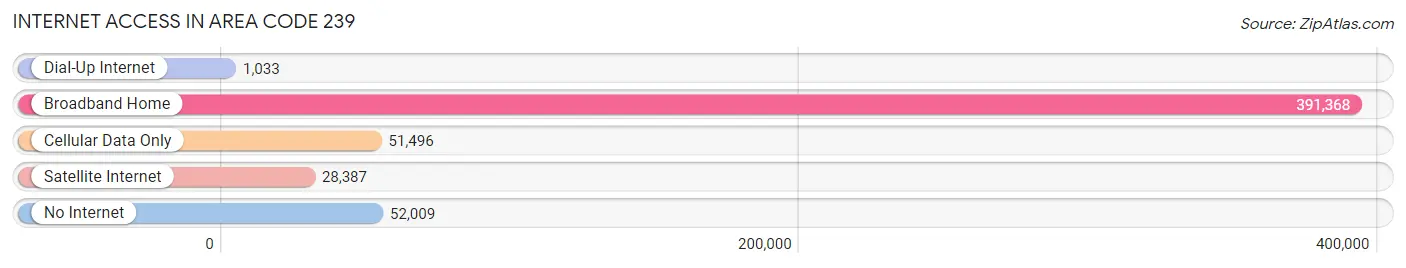
| Internet Type | # Households | % Households |
| Dial-Up Internet | 1,033 | 0.2% |
| Broadband Home | 391,368 | 77.1% |
| Cellular Data Only | 51,496 | 10.2% |
| Satellite Internet | 28,387 | 5.6% |
| No Internet | 52,009 | 10.2% |
| Total | 507,445 | 100.0% |
Area Code 239 Summary
Geography
Area code 239 is located in the southwestern part of Florida, covering the counties of Lee, Collier, and Hendry. It is bordered by area codes 941 to the north, 321 to the east, 305 to the south, and 239 to the west.
Social
Area code 239 is home to a diverse population, with a mix of cultures and backgrounds. The area is known for its vibrant nightlife, with a variety of bars, clubs, and restaurants. It is also home to a number of universities and colleges, making it a popular destination for students.
Economics
Area code 239 is a major economic hub in the region, with a number of large businesses and corporations based in the area. It is also home to a number of tourist attractions, including beaches, parks, and museums. The area is also known for its agricultural industry, with a number of farms and ranches located in the area.
Demographics
Area code 239 is home to a population of over 1.2 million people. The area is predominantly white, with a large Hispanic population. The median household income is around $50,000, and the unemployment rate is around 4%. The area is also home to a number of military bases, making it a popular destination for veterans.
Common Questions
What is Per Capita Income in Area Code 239?
Per Capita income in Area Code 239 is $47,968.
What is the Median Family Income in Area Code 239?
Median Family Income in Area Code 239 is $91,907.
What is the Median Household income in Area Code 239?
Median Household Income in Area Code 239 is $76,533.
What is Income or Wage Gap in Area Code 239?
Income or Wage Gap in Area Code 239 is 24.4%.
Women in Area Code 239 earn 75.6 cents for every dollar earned by a man.
What is Family Income Deficit in Area Code 239?
Family Income Deficit in Area Code 239 is $10,569.
Families that are below poverty line in Area Code 239 earn $10,569 less on average than the poverty threshold level.
What is Inequality or Gini Index in Area Code 239?
Inequality or Gini Index in Area Code 239 is 25.72.
What is the Total Population of Area Code 239?
Total Population of Area Code 239 is 1,262,982.
What is the Total Male Population of Area Code 239?
Total Male Population of Area Code 239 is 621,028.
What is the Total Female Population of Area Code 239?
Total Female Population of Area Code 239 is 641,954.
What is the Ratio of Males per 100 Females in Area Code 239?
There are 96.74 Males per 100 Females in Area Code 239.
What is the Ratio of Females per 100 Males in Area Code 239?
There are 103.37 Females per 100 Males in Area Code 239.
What is the Median Population Age in Area Code 239?
Median Population Age in Area Code 239 is 49.3 Years.
What is the Average Family Size in Area Code 239
Average Family Size in Area Code 239 is 3.0 People.
What is the Average Household Size in Area Code 239
Average Household Size in Area Code 239 is 2.5 People.
How Large is the Labor Force in Area Code 239?
There are 544,366 People in the Labor Forcein in Area Code 239.
What is the Percentage of People in the Labor Force in Area Code 239?
50.9% of People are in the Labor Force in Area Code 239.
What is the Unemployment Rate in Area Code 239?
Unemployment Rate in Area Code 239 is 4.5%.