Area Code 772 Map & Demographics
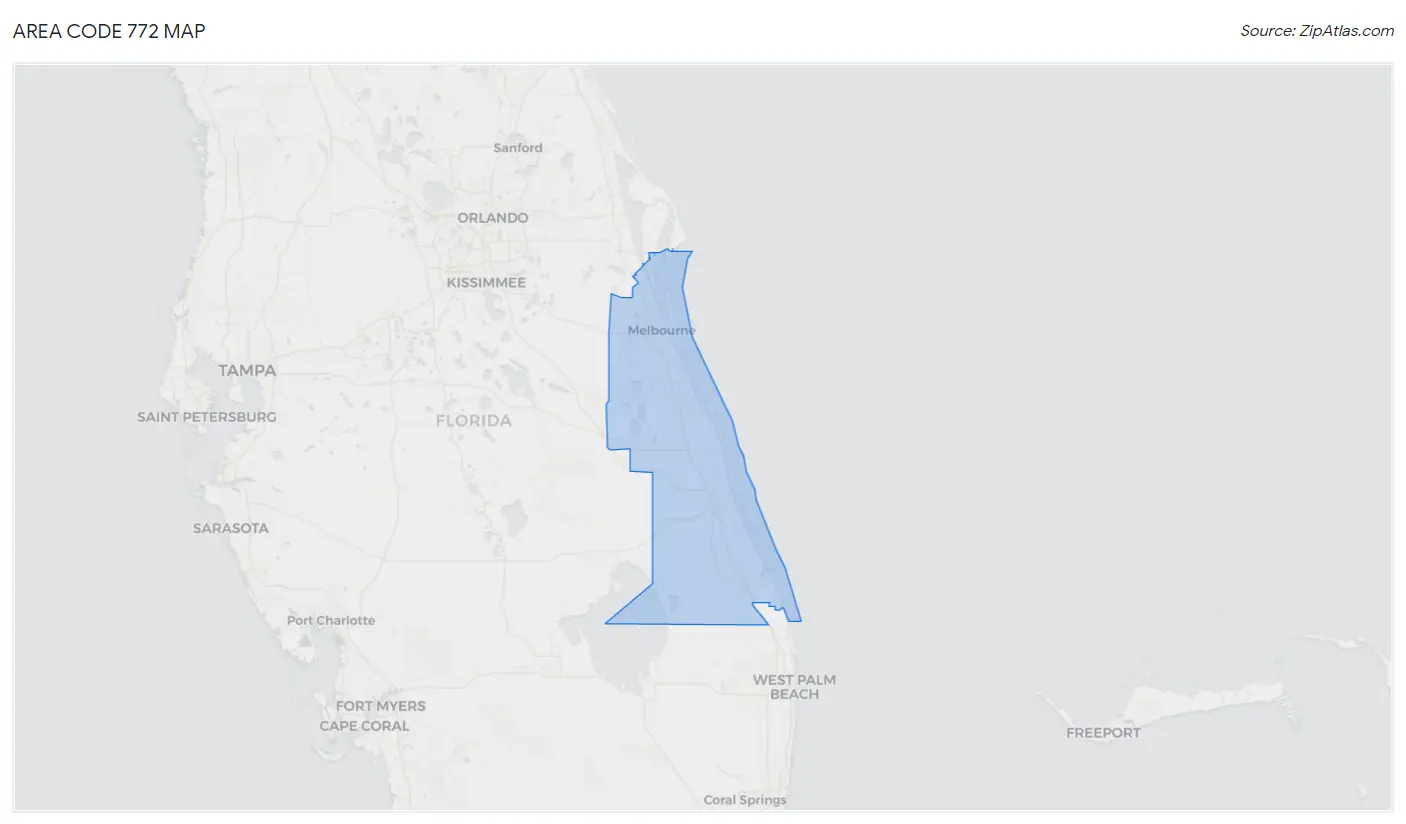
Area Code 772 Map
Area Code 772 Overview
$39,665
PER CAPITA INCOME
$81,704
AVG FAMILY INCOME
$67,637
AVG HOUSEHOLD INCOME
26.6%
WAGE / INCOME GAP [ % ]
73.4¢/ $1
WAGE / INCOME GAP [ $ ]
$10,867
FAMILY INCOME DEFICIT
13.65
INEQUALITY / GINI INDEX
657,288
TOTAL POPULATION
322,797
MALE POPULATION
334,491
FEMALE POPULATION
96.50
MALES / 100 FEMALES
103.62
FEMALES / 100 MALES
50.4
MEDIAN AGE
3.2
AVG FAMILY SIZE
2.6
AVG HOUSEHOLD SIZE
284,256
LABOR FORCE [ PEOPLE ]
51.2%
PERCENT IN LABOR FORCE
5.8%
UNEMPLOYMENT RATE
Income in Area Code 772
Income Overview in Area Code 772
Per Capita Income in Area Code 772 is $39,665, while median incomes of families and households are $81,704 and $67,637 respectively.
| Characteristic | Number | Measure |
| Per Capita Income | 657,288 | $39,665 |
| Median Family Income | 170,638 | $81,704 |
| Mean Family Income | 170,638 | $3,230,169 |
| Median Household Income | 260,959 | $67,637 |
| Mean Household Income | 260,959 | $2,832,879 |
| Income Deficit | 170,638 | $10,867 |
| Wage / Income Gap (%) | 657,288 | 26.62% |
| Wage / Income Gap ($) | 657,288 | 73.38¢ per $1 |
| Gini / Inequality Index | 657,288 | 13.65 |
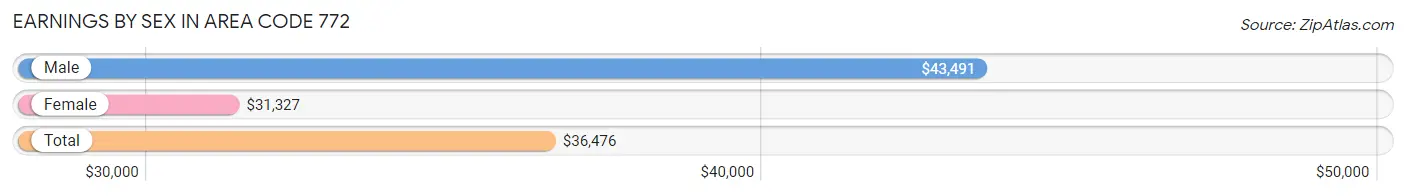
Earnings by Sex in Area Code 772
Average Earnings in Area Code 772 are $36,476, $43,491 for men and $31,327 for women, a difference of 28.0%.
| Sex | Number | Average Earnings |
| Male | 158,221 (52.2%) | $43,491 |
| Female | 145,009 (47.8%) | $31,327 |
| Total | 303,230 (100.0%) | $36,476 |
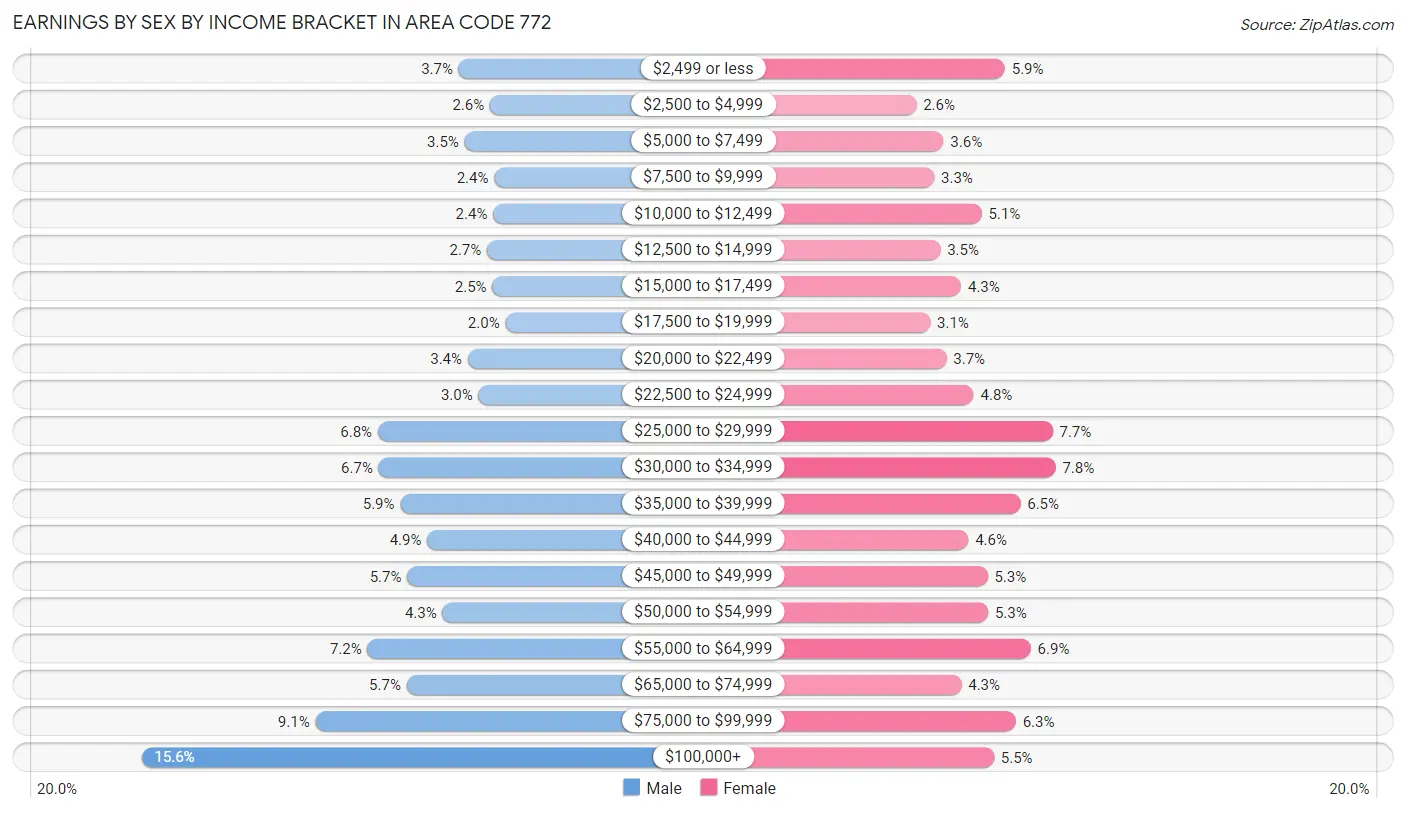
Earnings by Sex by Income Bracket in Area Code 772
The most common earnings brackets in Area Code 772 are $100,000+ for men (24,717 | 15.6%) and $30,000 to $34,999 for women (11,337 | 7.8%).
| Income | Male | Female |
| $2,499 or less | 5,906 (3.7%) | 8,590 (5.9%) |
| $2,500 to $4,999 | 4,047 (2.6%) | 3,772 (2.6%) |
| $5,000 to $7,499 | 5,554 (3.5%) | 5,248 (3.6%) |
| $7,500 to $9,999 | 3,794 (2.4%) | 4,744 (3.3%) |
| $10,000 to $12,499 | 3,857 (2.4%) | 7,326 (5.1%) |
| $12,500 to $14,999 | 4,223 (2.7%) | 5,078 (3.5%) |
| $15,000 to $17,499 | 3,909 (2.5%) | 6,209 (4.3%) |
| $17,500 to $19,999 | 3,131 (2.0%) | 4,521 (3.1%) |
| $20,000 to $22,499 | 5,370 (3.4%) | 5,402 (3.7%) |
| $22,500 to $24,999 | 4,738 (3.0%) | 6,883 (4.8%) |
| $25,000 to $29,999 | 10,691 (6.8%) | 11,173 (7.7%) |
| $30,000 to $34,999 | 10,642 (6.7%) | 11,337 (7.8%) |
| $35,000 to $39,999 | 9,374 (5.9%) | 9,432 (6.5%) |
| $40,000 to $44,999 | 7,767 (4.9%) | 6,604 (4.5%) |
| $45,000 to $49,999 | 8,952 (5.7%) | 7,636 (5.3%) |
| $50,000 to $54,999 | 6,859 (4.3%) | 7,666 (5.3%) |
| $55,000 to $64,999 | 11,306 (7.1%) | 9,985 (6.9%) |
| $65,000 to $74,999 | 8,983 (5.7%) | 6,224 (4.3%) |
| $75,000 to $99,999 | 14,401 (9.1%) | 9,186 (6.3%) |
| $100,000+ | 24,717 (15.6%) | 7,993 (5.5%) |
| Total | 158,221 (100.0%) | 145,009 (100.0%) |
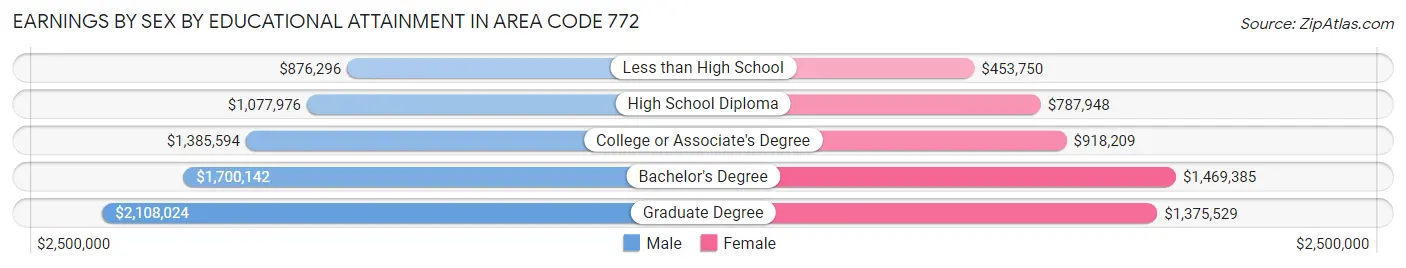
Earnings by Sex by Educational Attainment in Area Code 772
Average earnings in Area Code 772 are $1,493,884 for men and $1,048,136 for women, a difference of 29.8%. Men with an educational attainment of graduate degree enjoy the highest average annual earnings of $2,108,024, while those with less than high school education earn the least with $876,296. Women with an educational attainment of bachelor's degree earn the most with the average annual earnings of $1,469,385, while those with less than high school education have the smallest earnings of $453,750.
| Educational Attainment | Male Income | Female Income |
| Less than High School | $876,296 | $453,750 |
| High School Diploma | $1,077,976 | $787,948 |
| College or Associate's Degree | $1,385,594 | $918,209 |
| Bachelor's Degree | $1,700,142 | $1,469,385 |
| Graduate Degree | $2,108,024 | $1,375,529 |
| Total | $1,493,884 | $1,048,136 |
Family Income in Area Code 772
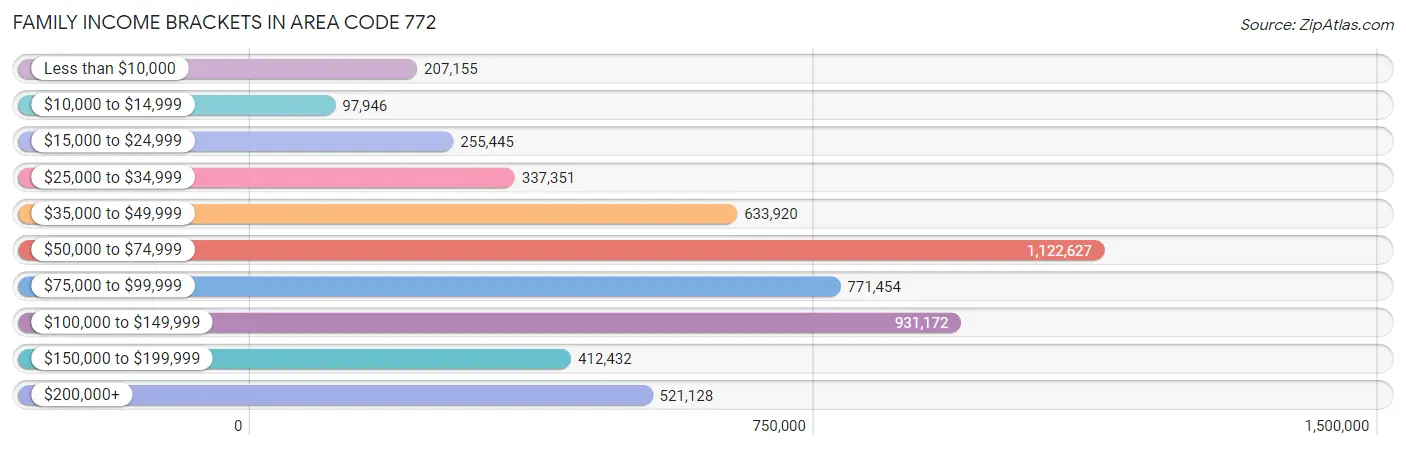
Family Income Brackets in Area Code 772
According to the Area Code 772 family income data, there are 1,122,627 families falling into the $50,000 to $74,999 income range, which is the most common income bracket and makes up 657.9% of all families. Conversely, the $10,000 to $14,999 income bracket is the least frequent group with only 97,946 families (57.4%) belonging to this category.
| Income Bracket | # Families | % Families |
| Less than $10,000 | 207,155 | 121.4% |
| $10,000 to $14,999 | 97,946 | 57.4% |
| $15,000 to $24,999 | 255,445 | 149.7% |
| $25,000 to $34,999 | 337,351 | 197.7% |
| $35,000 to $49,999 | 633,920 | 371.5% |
| $50,000 to $74,999 | 1,122,627 | 657.9% |
| $75,000 to $99,999 | 771,454 | 452.1% |
| $100,000 to $149,999 | 931,172 | 545.7% |
| $150,000 to $199,999 | 412,432 | 241.7% |
| $200,000+ | 521,128 | 305.4% |
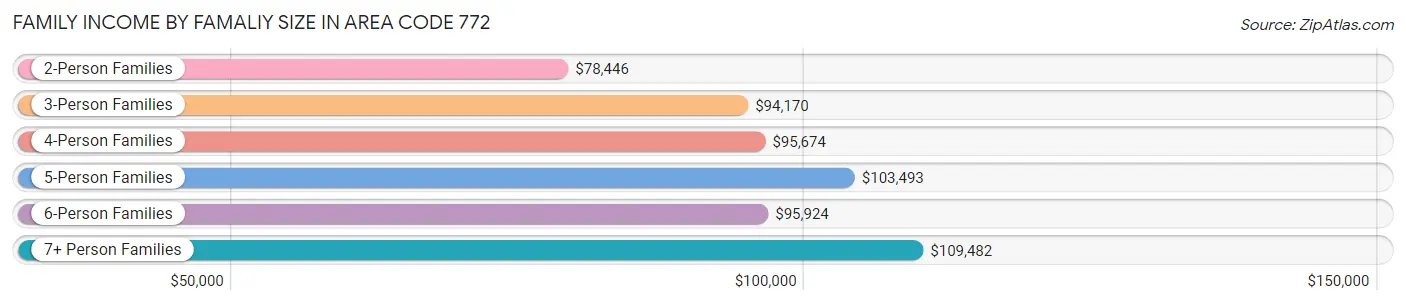
Family Income by Famaliy Size in Area Code 772
7+ person families (1,817 | 1.1%) account for the highest median family income in Area Code 772 with $109,482 per family, while 2-person families (100,971 | 59.2%) have the highest median income of $39,223 per family member.
| Income Bracket | # Families | Median Income |
| 2-Person Families | 100,971 (59.2%) | $78,446 |
| 3-Person Families | 32,437 (19.0%) | $94,170 |
| 4-Person Families | 22,885 (13.4%) | $95,674 |
| 5-Person Families | 8,997 (5.3%) | $103,493 |
| 6-Person Families | 3,531 (2.1%) | $95,924 |
| 7+ Person Families | 1,817 (1.1%) | $109,482 |
| Total | 170,638 (100.0%) | $81,704 |
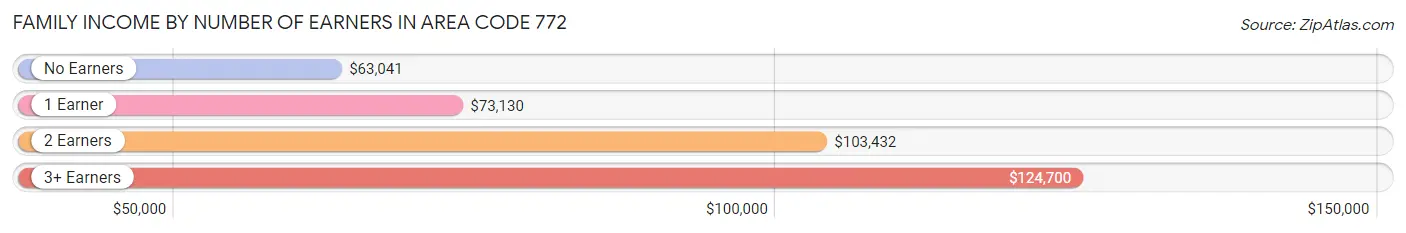
Family Income by Number of Earners in Area Code 772
The median family income in Area Code 772 is $81,704, with families comprising 3+ earners (15,397) having the highest median family income of $124,700, while families with no earners (45,767) have the lowest median family income of $63,041, accounting for 9.0% and 26.8% of families, respectively.
| Number of Earners | # Families | Median Income |
| No Earners | 45,767 (26.8%) | $63,041 |
| 1 Earner | 55,589 (32.6%) | $73,130 |
| 2 Earners | 53,885 (31.6%) | $103,432 |
| 3+ Earners | 15,397 (9.0%) | $124,700 |
| Total | 170,638 (100.0%) | $81,704 |
Household Income in Area Code 772
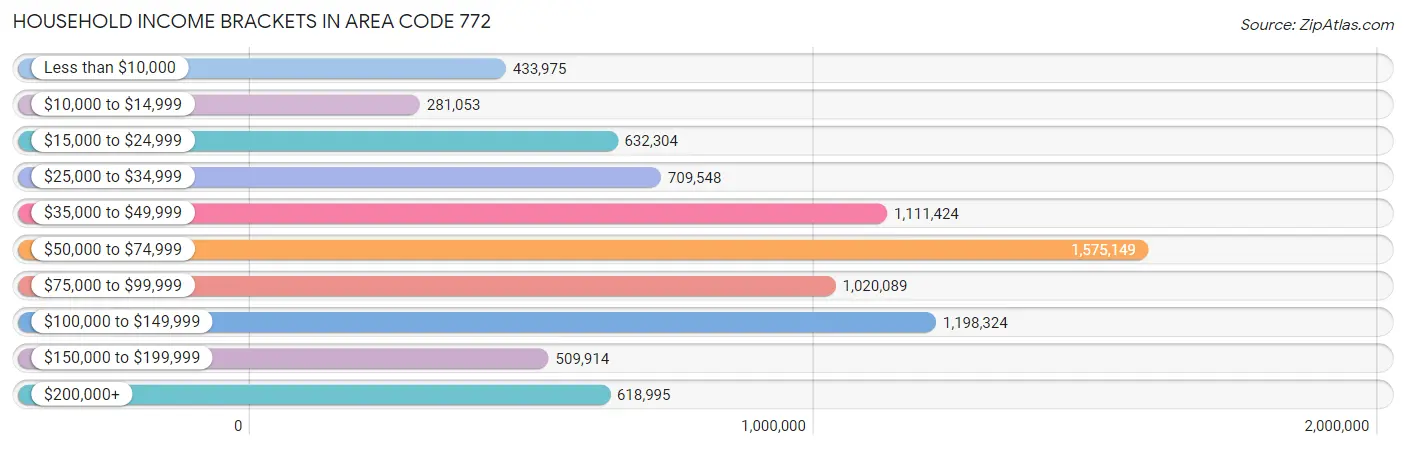
Household Income Brackets in Area Code 772
With 1,575,149 households falling in the category, the $50,000 to $74,999 income range is the most frequent in Area Code 772, accounting for 603.6% of all households. In contrast, only 281,053 households (107.7%) fall into the $10,000 to $14,999 income bracket, making it the least populous group.
| Income Bracket | # Households | % Households |
| Less than $10,000 | 433,975 | 166.3% |
| $10,000 to $14,999 | 281,053 | 107.7% |
| $15,000 to $24,999 | 632,304 | 242.3% |
| $25,000 to $34,999 | 709,548 | 271.9% |
| $35,000 to $49,999 | 1,111,424 | 425.9% |
| $50,000 to $74,999 | 1,575,149 | 603.6% |
| $75,000 to $99,999 | 1,020,089 | 390.9% |
| $100,000 to $149,999 | 1,198,324 | 459.2% |
| $150,000 to $199,999 | 509,914 | 195.4% |
| $200,000+ | 618,995 | 237.2% |
Household Income by Householder Age in Area Code 772
The median household income in Area Code 772 is $67,637, with the highest median household income of $81,061 found in the 45 to 64 years age bracket for the primary householder. A total of 93,354 households (35.8%) fall into this category. Meanwhile, the 15 to 24 years age bracket for the primary householder has the lowest median household income of $43,996, with 3,396 households (1.3%) in this group.
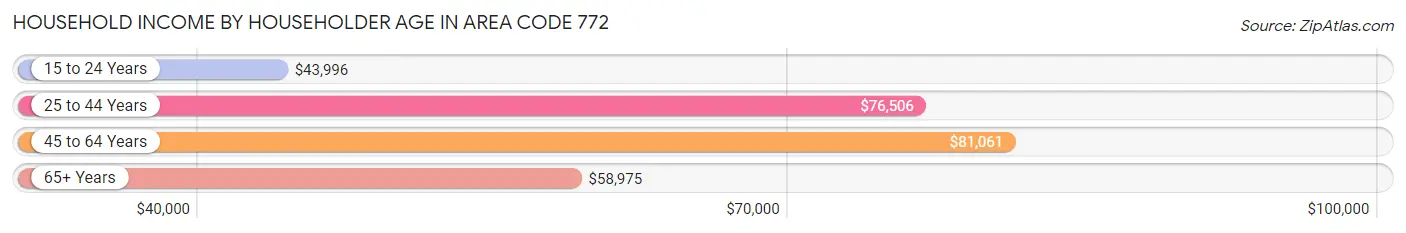
| Income Bracket | # Households | Median Income |
| 15 to 24 Years | 3,396 (1.3%) | $43,996 |
| 25 to 44 Years | 52,438 (20.1%) | $76,506 |
| 45 to 64 Years | 93,354 (35.8%) | $81,061 |
| 65+ Years | 111,771 (42.8%) | $58,975 |
| Total | 260,959 (100.0%) | $67,637 |
Poverty in Area Code 772
Income Below Poverty by Sex and Age in Area Code 772
With 10.7% poverty level for males and 12.8% for females among the residents of Area Code 772, 15 year old males and 15 year old females are the most vulnerable to poverty, with 960 males (23.6%) and 786 females (22.8%) in their respective age groups living below the poverty level.
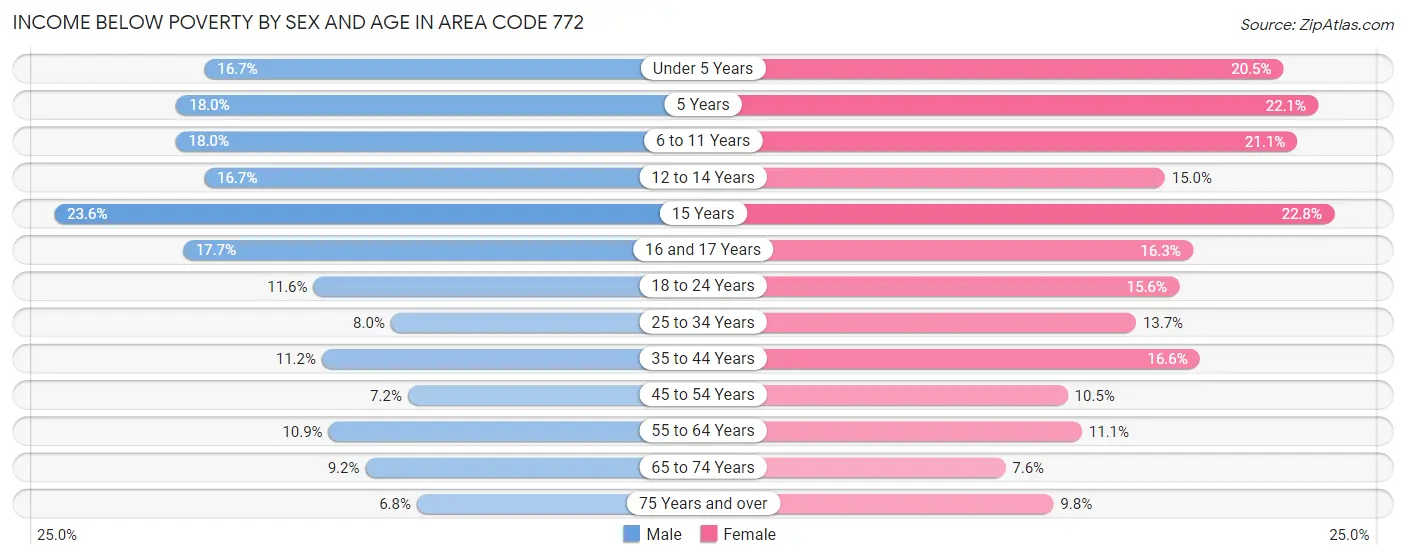
| Age Bracket | Male | Female |
| Under 5 Years | 2,414 (16.7%) | 2,848 (20.5%) |
| 5 Years | 530 (18.0%) | 672 (22.1%) |
| 6 to 11 Years | 3,221 (18.0%) | 3,812 (21.1%) |
| 12 to 14 Years | 1,941 (16.7%) | 1,596 (15.0%) |
| 15 Years | 960 (23.6%) | 786 (22.8%) |
| 16 and 17 Years | 1,291 (17.7%) | 1,040 (16.3%) |
| 18 to 24 Years | 2,602 (11.6%) | 3,307 (15.6%) |
| 25 to 34 Years | 2,695 (8.0%) | 4,369 (13.7%) |
| 35 to 44 Years | 3,704 (11.2%) | 5,557 (16.6%) |
| 45 to 54 Years | 2,641 (7.2%) | 4,033 (10.5%) |
| 55 to 64 Years | 5,037 (10.9%) | 5,730 (11.1%) |
| 65 to 74 Years | 4,277 (9.2%) | 3,998 (7.6%) |
| 75 Years and over | 2,758 (6.8%) | 4,577 (9.8%) |
| Total | 34,071 (10.7%) | 42,325 (12.8%) |
Income Above Poverty by Sex and Age in Area Code 772
According to the poverty statistics in Area Code 772, males aged 75 years and over and females aged 65 to 74 years are the age groups that are most secure financially, with 93.2% of males and 92.4% of females in these age groups living above the poverty line.
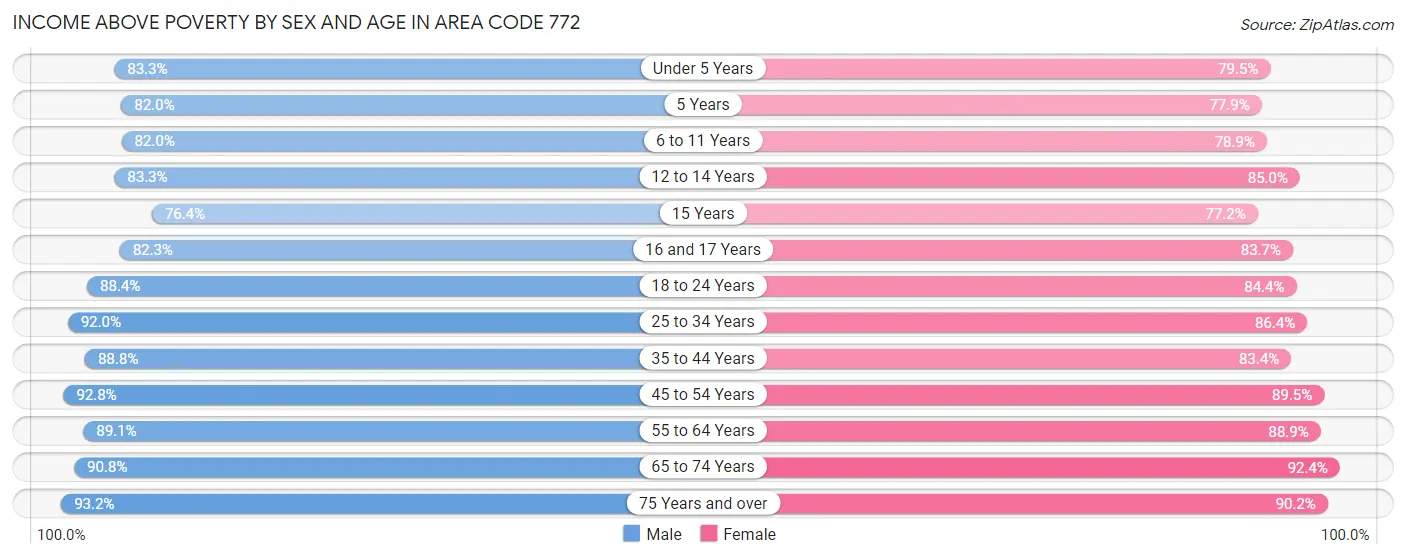
| Age Bracket | Male | Female |
| Under 5 Years | 12,080 (83.3%) | 11,052 (79.5%) |
| 5 Years | 2,421 (82.0%) | 2,370 (77.9%) |
| 6 to 11 Years | 14,681 (82.0%) | 14,225 (78.9%) |
| 12 to 14 Years | 9,704 (83.3%) | 9,049 (85.0%) |
| 15 Years | 3,102 (76.4%) | 2,657 (77.2%) |
| 16 and 17 Years | 6,021 (82.3%) | 5,348 (83.7%) |
| 18 to 24 Years | 19,822 (88.4%) | 17,839 (84.4%) |
| 25 to 34 Years | 30,970 (92.0%) | 27,641 (86.4%) |
| 35 to 44 Years | 29,347 (88.8%) | 27,912 (83.4%) |
| 45 to 54 Years | 33,914 (92.8%) | 34,458 (89.5%) |
| 55 to 64 Years | 41,157 (89.1%) | 45,728 (88.9%) |
| 65 to 74 Years | 42,282 (90.8%) | 48,689 (92.4%) |
| 75 Years and over | 37,822 (93.2%) | 42,044 (90.2%) |
| Total | 283,323 (89.3%) | 289,012 (87.2%) |
Income Below Poverty Among Married-Couple Families in Area Code 772
The poverty statistics for married-couple families in Area Code 772 show that 4.6% or 5,976 of the total 130,753 families live below the poverty line. Families with 5 or more children have the highest poverty rate of 23.9%, comprising of 140 families. On the other hand, families with no children have the lowest poverty rate of 4.0%, which includes 3,877 families.
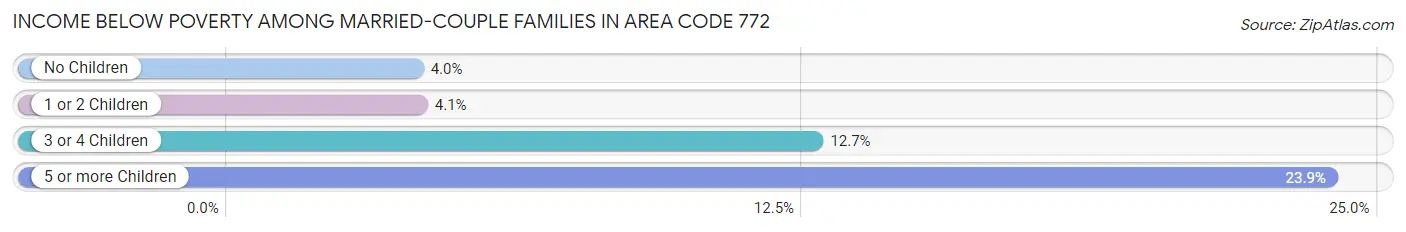
| Children | Above Poverty | Below Poverty |
| No Children | 91,970 (96.0%) | 3,877 (4.0%) |
| 1 or 2 Children | 26,863 (95.9%) | 1,156 (4.1%) |
| 3 or 4 Children | 5,499 (87.3%) | 803 (12.7%) |
| 5 or more Children | 445 (76.1%) | 140 (23.9%) |
| Total | 124,777 (95.4%) | 5,976 (4.6%) |
Income Below Poverty Among Single-Parent Households in Area Code 772
According to the poverty data in Area Code 772, 10.1% or 1,101 single-father households and 21.0% or 6,101 single-mother households are living below the poverty line. Among single-father households, those with 3 or 4 children have the highest poverty rate, with 102 households (21.1%) experiencing poverty. Likewise, among single-mother households, those with 5 or more children have the highest poverty rate, with 274 households (81.6%) falling below the poverty line.
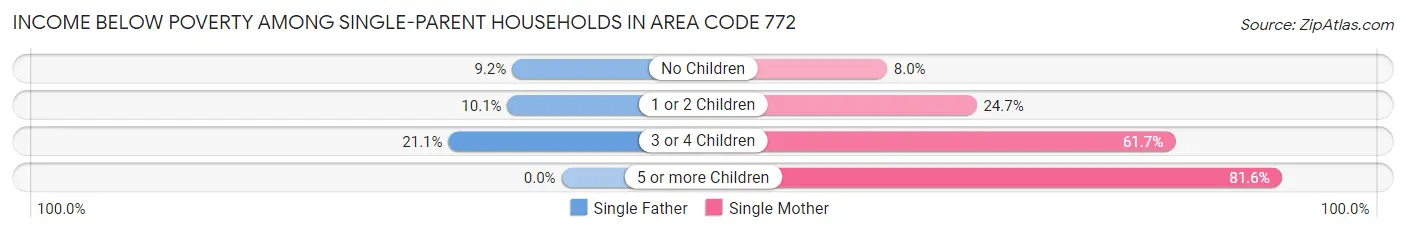
| Children | Single Father | Single Mother |
| No Children | 531 (9.2%) | 1,008 (8.0%) |
| 1 or 2 Children | 468 (10.1%) | 3,429 (24.7%) |
| 3 or 4 Children | 102 (21.1%) | 1,390 (61.7%) |
| 5 or more Children | 0 (0.0%) | 274 (81.6%) |
| Total | 1,101 (10.1%) | 6,101 (21.0%) |
Income Below Poverty Among Married-Couple vs Single-Parent Households in Area Code 772
The poverty data for Area Code 772 shows that 5,976 of the married-couple family households (4.6%) and 7,202 of the single-parent households (18.1%) are living below the poverty level. Within the married-couple family households, those with 5 or more children have the highest poverty rate, with 140 households (23.9%) falling below the poverty line. Among the single-parent households, those with 5 or more children have the highest poverty rate, with 274 household (81.6%) living below poverty.
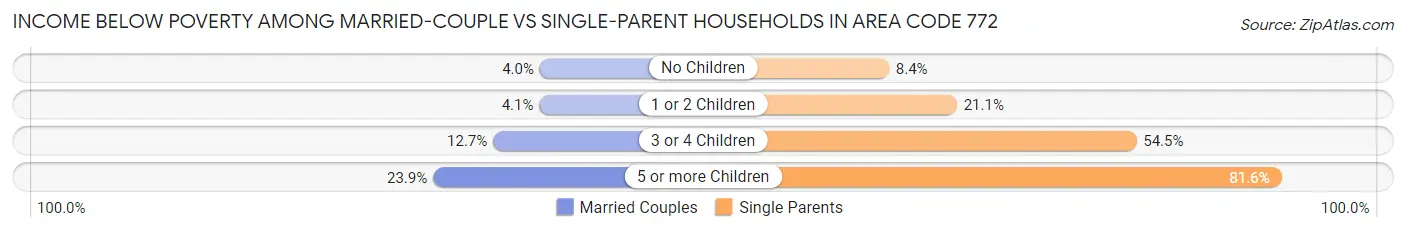
| Children | Married-Couple Families | Single-Parent Households |
| No Children | 3,877 (4.0%) | 1,539 (8.4%) |
| 1 or 2 Children | 1,156 (4.1%) | 3,897 (21.1%) |
| 3 or 4 Children | 803 (12.7%) | 1,492 (54.5%) |
| 5 or more Children | 140 (23.9%) | 274 (81.6%) |
| Total | 5,976 (4.6%) | 7,202 (18.1%) |
Race in Area Code 772
The most populous races in Area Code 772 are White / Caucasian (473,356 | 72.0%), Hispanic or Latino (112,882 | 17.2%), and Black / African American (90,145 | 13.7%).
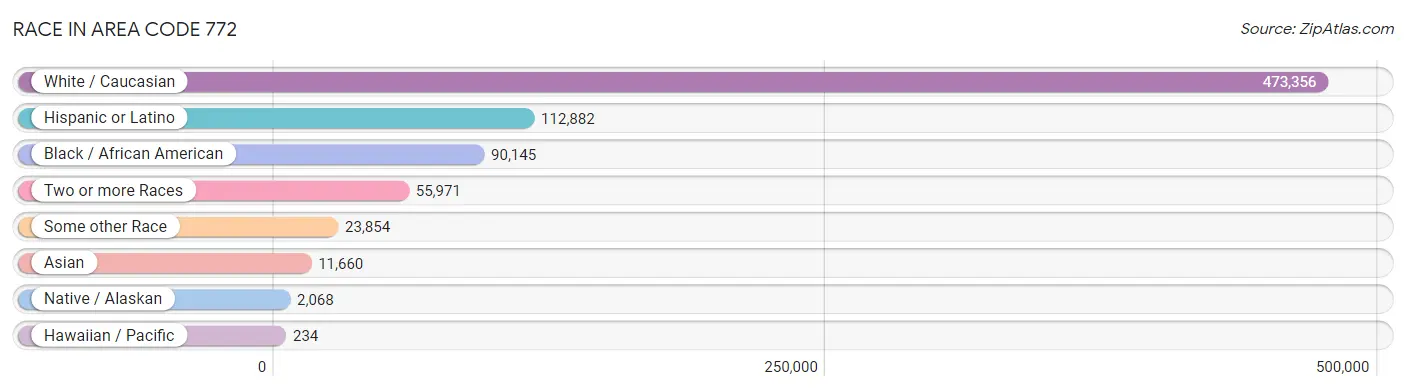
| Race | # Population | % Population |
| Asian | 11,660 | 1.8% |
| Black / African American | 90,145 | 13.7% |
| Hawaiian / Pacific | 234 | 0.0% |
| Hispanic or Latino | 112,882 | 17.2% |
| Native / Alaskan | 2,068 | 0.3% |
| White / Caucasian | 473,356 | 72.0% |
| Two or more Races | 55,971 | 8.5% |
| Some other Race | 23,854 | 3.6% |
| Total | 657,288 | 100.0% |
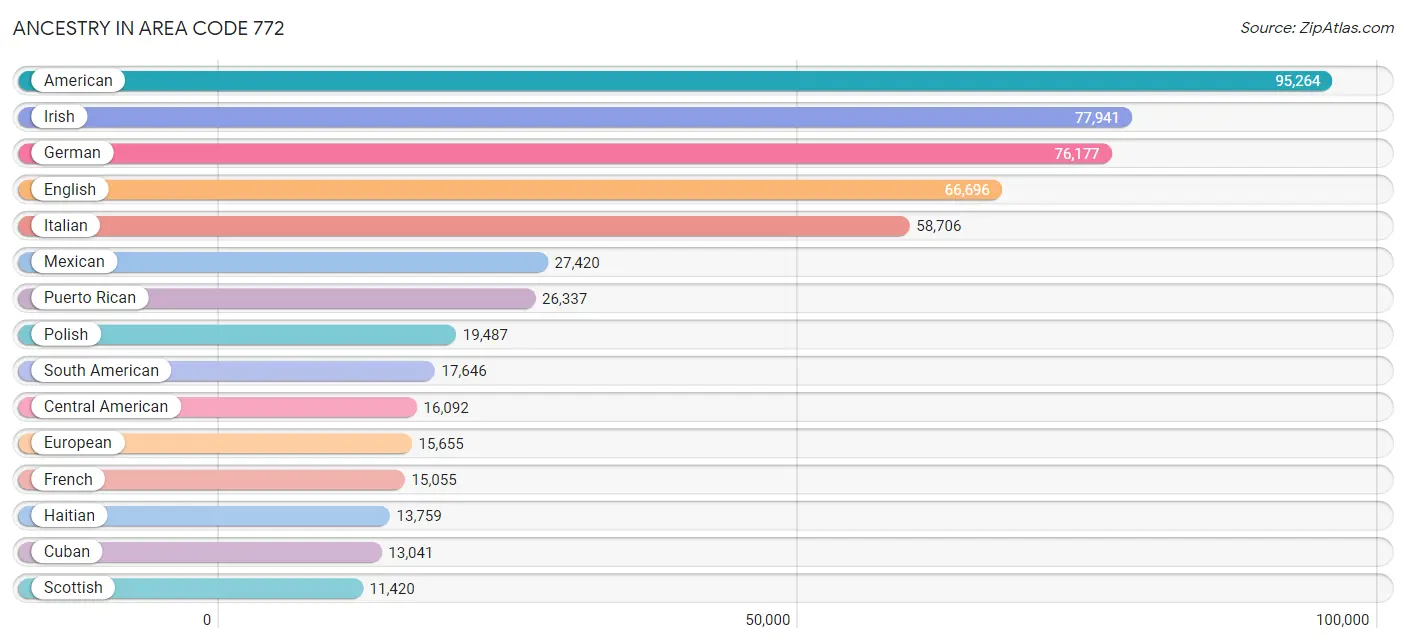
Ancestry in Area Code 772
The most populous ancestries reported in Area Code 772 are American (95,264 | 14.5%), Irish (77,941 | 11.9%), German (76,177 | 11.6%), English (66,696 | 10.2%), and Italian (58,706 | 8.9%), together accounting for 57.0% of all Area Code 772 residents.
| Ancestry | # Population | % Population |
| Afghan | 7 | 0.0% |
| African | 1,973 | 0.3% |
| Alaskan Athabascan | 15 | 0.0% |
| Albanian | 191 | 0.0% |
| Alsatian | 8 | 0.0% |
| American | 95,264 | 14.5% |
| Apache | 357 | 0.1% |
| Arab | 2,494 | 0.4% |
| Argentinean | 1,275 | 0.2% |
| Armenian | 425 | 0.1% |
| Assyrian / Chaldean / Syriac | 20 | 0.0% |
| Australian | 75 | 0.0% |
| Austrian | 1,927 | 0.3% |
| Bahamian | 699 | 0.1% |
| Bangladeshi | 83 | 0.0% |
| Barbadian | 148 | 0.0% |
| Basque | 76 | 0.0% |
| Belgian | 629 | 0.1% |
| Belizean | 63 | 0.0% |
| Bhutanese | 1,047 | 0.2% |
| Blackfeet | 143 | 0.0% |
| Bolivian | 560 | 0.1% |
| Brazilian | 3,176 | 0.5% |
| British | 3,994 | 0.6% |
| British West Indian | 646 | 0.1% |
| Bulgarian | 15 | 0.0% |
| Burmese | 759 | 0.1% |
| Cajun | 9 | 0.0% |
| Canadian | 1,954 | 0.3% |
| Cape Verdean | 40 | 0.0% |
| Carpatho Rusyn | 12 | 0.0% |
| Celtic | 74 | 0.0% |
| Central American | 16,092 | 2.5% |
| Central American Indian | 747 | 0.1% |
| Cherokee | 1,331 | 0.2% |
| Cheyenne | 15 | 0.0% |
| Chickasaw | 44 | 0.0% |
| Chilean | 560 | 0.1% |
| Chippewa | 8 | 0.0% |
| Choctaw | 100 | 0.0% |
| Colombian | 5,768 | 0.9% |
| Comanche | 40 | 0.0% |
| Costa Rican | 620 | 0.1% |
| Creek | 75 | 0.0% |
| Croatian | 531 | 0.1% |
| Cuban | 13,041 | 2.0% |
| Cypriot | 17 | 0.0% |
| Czech | 1,611 | 0.3% |
| Czechoslovakian | 701 | 0.1% |
| Danish | 1,669 | 0.3% |
| Dominican | 6,249 | 0.9% |
| Dutch | 5,825 | 0.9% |
| Dutch West Indian | 12 | 0.0% |
| Eastern European | 2,032 | 0.3% |
| Ecuadorian | 2,171 | 0.3% |
| Egyptian | 129 | 0.0% |
| English | 66,696 | 10.2% |
| Estonian | 125 | 0.0% |
| Ethiopian | 140 | 0.0% |
| European | 15,655 | 2.4% |
| Finnish | 1,211 | 0.2% |
| French | 15,055 | 2.3% |
| French American Indian | 55 | 0.0% |
| French Canadian | 5,422 | 0.8% |
| German | 76,177 | 11.6% |
| German Russian | 51 | 0.0% |
| Ghanaian | 63 | 0.0% |
| Greek | 2,695 | 0.4% |
| Guamanian / Chamorro | 65 | 0.0% |
| Guatemalan | 7,400 | 1.1% |
| Guyanese | 551 | 0.1% |
| Haitian | 13,759 | 2.1% |
| Honduran | 3,817 | 0.6% |
| Hopi | 40 | 0.0% |
| Houma | 9 | 0.0% |
| Hungarian | 3,563 | 0.5% |
| Icelander | 129 | 0.0% |
| Indian (Asian) | 2,005 | 0.3% |
| Indonesian | 92 | 0.0% |
| Iranian | 196 | 0.0% |
| Irish | 77,941 | 11.9% |
| Iroquois | 179 | 0.0% |
| Israeli | 257 | 0.0% |
| Italian | 58,706 | 8.9% |
| Jamaican | 9,406 | 1.4% |
| Japanese | 197 | 0.0% |
| Jordanian | 72 | 0.0% |
| Korean | 4,328 | 0.7% |
| Laotian | 20 | 0.0% |
| Latvian | 184 | 0.0% |
| Lebanese | 1,442 | 0.2% |
| Lithuanian | 1,375 | 0.2% |
| Lumbee | 93 | 0.0% |
| Luxembourger | 49 | 0.0% |
| Malaysian | 90 | 0.0% |
| Maltese | 168 | 0.0% |
| Mexican | 27,420 | 4.2% |
| Mexican American Indian | 505 | 0.1% |
| Moroccan | 233 | 0.0% |
| Native Hawaiian | 231 | 0.0% |
| Navajo | 83 | 0.0% |
| New Zealander | 22 | 0.0% |
| Nicaraguan | 1,903 | 0.3% |
| Nigerian | 615 | 0.1% |
| Northern European | 648 | 0.1% |
| Norwegian | 5,348 | 0.8% |
| Okinawan | 56 | 0.0% |
| Pakistani | 625 | 0.1% |
| Palestinian | 284 | 0.0% |
| Panamanian | 854 | 0.1% |
| Paraguayan | 309 | 0.1% |
| Pennsylvania German | 332 | 0.1% |
| Peruvian | 2,966 | 0.4% |
| Pima | 2 | 0.0% |
| Polish | 19,487 | 3.0% |
| Portuguese | 3,256 | 0.5% |
| Potawatomi | 161 | 0.0% |
| Puerto Rican | 26,337 | 4.0% |
| Romanian | 938 | 0.1% |
| Russian | 5,083 | 0.8% |
| Salvadoran | 1,498 | 0.2% |
| Samoan | 109 | 0.0% |
| Scandinavian | 1,115 | 0.2% |
| Scotch-Irish | 5,130 | 0.8% |
| Scottish | 11,420 | 1.7% |
| Seminole | 204 | 0.0% |
| Serbian | 159 | 0.0% |
| Sioux | 155 | 0.0% |
| Slavic | 326 | 0.1% |
| Slovak | 1,140 | 0.2% |
| Slovene | 163 | 0.0% |
| South African | 403 | 0.1% |
| South American | 17,646 | 2.7% |
| South American Indian | 132 | 0.0% |
| Spaniard | 1,202 | 0.2% |
| Spanish | 1,517 | 0.2% |
| Spanish American | 9 | 0.0% |
| Sri Lankan | 2,045 | 0.3% |
| Subsaharan African | 3,283 | 0.5% |
| Swedish | 6,634 | 1.0% |
| Swiss | 1,333 | 0.2% |
| Syrian | 157 | 0.0% |
| Thai | 2,720 | 0.4% |
| Tlingit-Haida | 10 | 0.0% |
| Tohono O'Odham | 27 | 0.0% |
| Trinidadian and Tobagonian | 2,013 | 0.3% |
| Turkish | 160 | 0.0% |
| U.S. Virgin Islander | 224 | 0.0% |
| Ukrainian | 2,166 | 0.3% |
| Uruguayan | 349 | 0.1% |
| Venezuelan | 3,537 | 0.5% |
| Vietnamese | 13 | 0.0% |
| Welsh | 2,969 | 0.4% |
| West Indian | 661 | 0.1% |
| Yaqui | 41 | 0.0% |
| Yugoslavian | 198 | 0.0% |
| Yuman | 19 | 0.0% | View All 157 Rows |
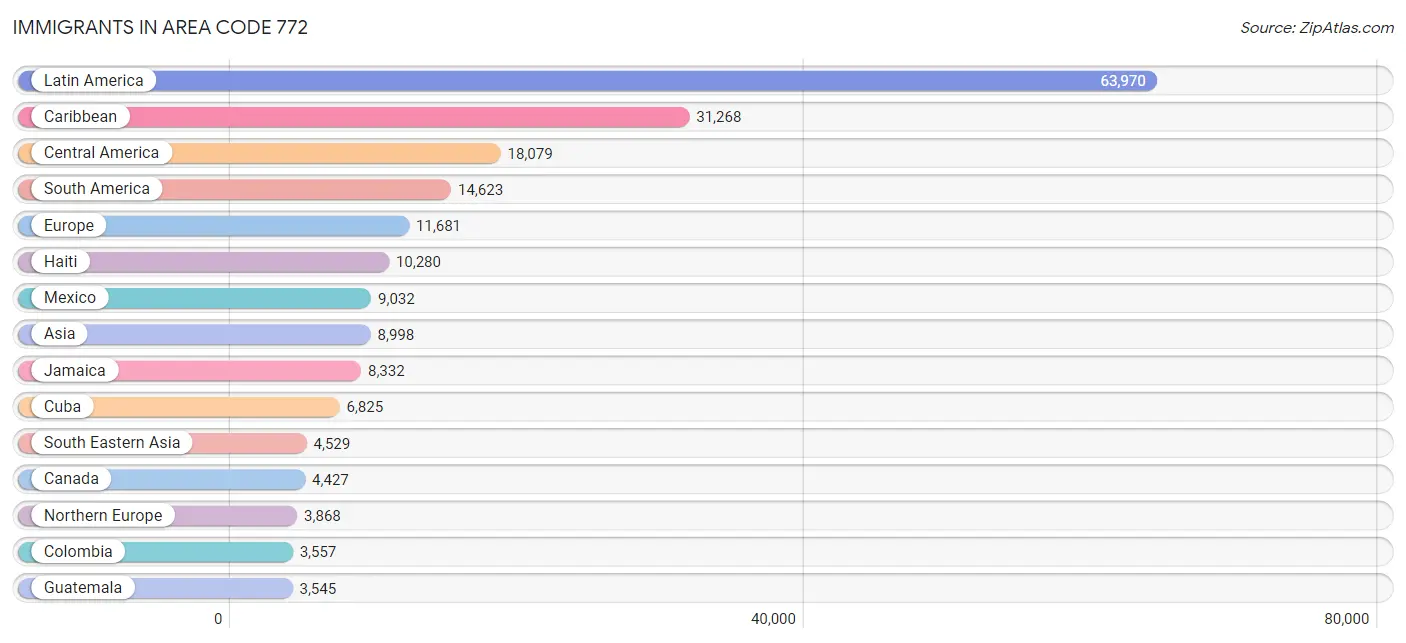
Immigrants in Area Code 772
The most numerous immigrant groups reported in Area Code 772 came from Latin America (63,970 | 9.7%), Caribbean (31,268 | 4.8%), Central America (18,079 | 2.8%), South America (14,623 | 2.2%), and Europe (11,681 | 1.8%), together accounting for 21.2% of all Area Code 772 residents.
| Immigration Origin | # Population | % Population |
| Afghanistan | 2 | 0.0% |
| Africa | 1,470 | 0.2% |
| Argentina | 542 | 0.1% |
| Asia | 8,998 | 1.4% |
| Australia | 69 | 0.0% |
| Austria | 161 | 0.0% |
| Bahamas | 341 | 0.1% |
| Bangladesh | 8 | 0.0% |
| Barbados | 164 | 0.0% |
| Belarus | 61 | 0.0% |
| Belgium | 172 | 0.0% |
| Belize | 45 | 0.0% |
| Bolivia | 334 | 0.1% |
| Bosnia and Herzegovina | 110 | 0.0% |
| Brazil | 2,637 | 0.4% |
| Cambodia | 51 | 0.0% |
| Canada | 4,427 | 0.7% |
| Caribbean | 31,268 | 4.8% |
| Central America | 18,079 | 2.8% |
| Chile | 507 | 0.1% |
| China | 1,062 | 0.2% |
| Colombia | 3,557 | 0.5% |
| Costa Rica | 384 | 0.1% |
| Cuba | 6,825 | 1.0% |
| Czechoslovakia | 166 | 0.0% |
| Denmark | 69 | 0.0% |
| Dominica | 143 | 0.0% |
| Dominican Republic | 2,714 | 0.4% |
| Eastern Africa | 139 | 0.0% |
| Eastern Asia | 1,865 | 0.3% |
| Eastern Europe | 2,882 | 0.4% |
| Ecuador | 1,215 | 0.2% |
| Egypt | 78 | 0.0% |
| El Salvador | 781 | 0.1% |
| England | 1,244 | 0.2% |
| Ethiopia | 55 | 0.0% |
| Europe | 11,681 | 1.8% |
| France | 521 | 0.1% |
| Germany | 1,586 | 0.2% |
| Ghana | 242 | 0.0% |
| Greece | 164 | 0.0% |
| Grenada | 176 | 0.0% |
| Guatemala | 3,545 | 0.5% |
| Guyana | 1,013 | 0.2% |
| Haiti | 10,280 | 1.6% |
| Honduras | 2,797 | 0.4% |
| Hong Kong | 175 | 0.0% |
| Hungary | 312 | 0.1% |
| India | 1,184 | 0.2% |
| Indonesia | 95 | 0.0% |
| Iran | 190 | 0.0% |
| Iraq | 41 | 0.0% |
| Ireland | 495 | 0.1% |
| Israel | 198 | 0.0% |
| Italy | 973 | 0.2% |
| Jamaica | 8,332 | 1.3% |
| Japan | 458 | 0.1% |
| Jordan | 51 | 0.0% |
| Kazakhstan | 18 | 0.0% |
| Kenya | 41 | 0.0% |
| Korea | 345 | 0.1% |
| Laos | 40 | 0.0% |
| Latin America | 63,970 | 9.7% |
| Latvia | 71 | 0.0% |
| Lebanon | 372 | 0.1% |
| Lithuania | 121 | 0.0% |
| Malaysia | 29 | 0.0% |
| Mexico | 9,032 | 1.4% |
| Micronesia | 26 | 0.0% |
| Middle Africa | 29 | 0.0% |
| Moldova | 72 | 0.0% |
| Morocco | 131 | 0.0% |
| Netherlands | 340 | 0.1% |
| Nicaragua | 1,174 | 0.2% |
| Nigeria | 150 | 0.0% |
| North Macedonia | 8 | 0.0% |
| Northern Africa | 243 | 0.0% |
| Northern Europe | 3,868 | 0.6% |
| Norway | 83 | 0.0% |
| Oceania | 105 | 0.0% |
| Pakistan | 247 | 0.0% |
| Panama | 321 | 0.1% |
| Peru | 1,791 | 0.3% |
| Philippines | 2,624 | 0.4% |
| Poland | 788 | 0.1% |
| Portugal | 559 | 0.1% |
| Romania | 222 | 0.0% |
| Russia | 444 | 0.1% |
| Saudi Arabia | 39 | 0.0% |
| Scotland | 440 | 0.1% |
| Senegal | 50 | 0.0% |
| Serbia | 10 | 0.0% |
| Singapore | 56 | 0.0% |
| South Africa | 560 | 0.1% |
| South America | 14,623 | 2.2% |
| South Central Asia | 1,805 | 0.3% |
| South Eastern Asia | 4,529 | 0.7% |
| Southern Europe | 2,016 | 0.3% |
| Spain | 274 | 0.0% |
| St. Vincent and the Grenadines | 272 | 0.0% |
| Sweden | 168 | 0.0% |
| Switzerland | 135 | 0.0% |
| Taiwan | 250 | 0.0% |
| Thailand | 602 | 0.1% |
| Trinidad and Tobago | 1,509 | 0.2% |
| Turkey | 23 | 0.0% |
| Ukraine | 298 | 0.1% |
| Uruguay | 124 | 0.0% |
| Uzbekistan | 131 | 0.0% |
| Venezuela | 2,594 | 0.4% |
| Vietnam | 940 | 0.1% |
| Western Africa | 442 | 0.1% |
| Western Asia | 758 | 0.1% |
| Western Europe | 2,915 | 0.4% |
| Zaire | 21 | 0.0% |
| Zimbabwe | 43 | 0.0% | View All 116 Rows |
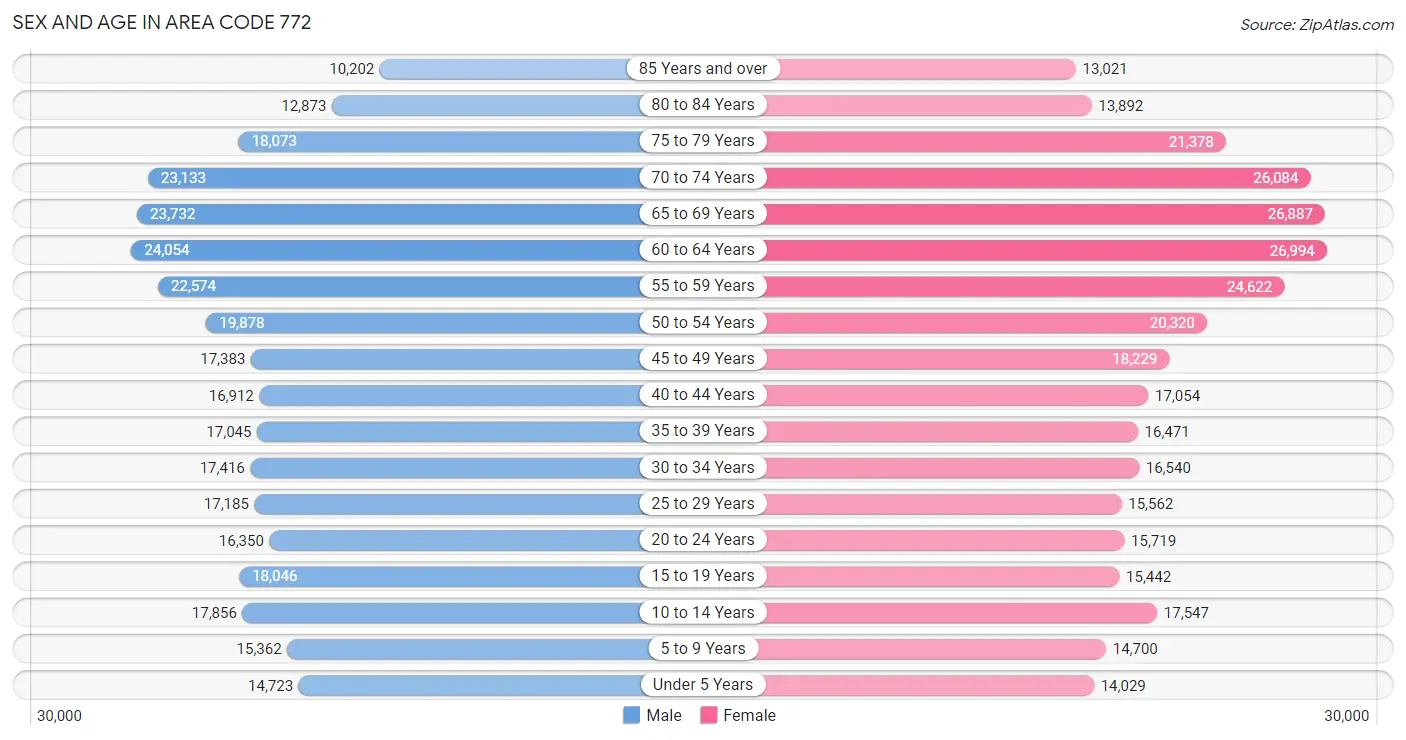
Sex and Age in Area Code 772
Sex and Age in Area Code 772
The most populous age groups in Area Code 772 are 60 to 64 Years (24,054 | 7.4%) for men and 60 to 64 Years (26,994 | 8.1%) for women.
| Age Bracket | Male | Female |
| Under 5 Years | 14,723 (4.6%) | 14,029 (4.2%) |
| 5 to 9 Years | 15,362 (4.8%) | 14,700 (4.4%) |
| 10 to 14 Years | 17,856 (5.5%) | 17,547 (5.2%) |
| 15 to 19 Years | 18,046 (5.6%) | 15,442 (4.6%) |
| 20 to 24 Years | 16,350 (5.1%) | 15,719 (4.7%) |
| 25 to 29 Years | 17,185 (5.3%) | 15,562 (4.6%) |
| 30 to 34 Years | 17,416 (5.4%) | 16,540 (4.9%) |
| 35 to 39 Years | 17,045 (5.3%) | 16,471 (4.9%) |
| 40 to 44 Years | 16,912 (5.2%) | 17,054 (5.1%) |
| 45 to 49 Years | 17,383 (5.4%) | 18,229 (5.4%) |
| 50 to 54 Years | 19,878 (6.2%) | 20,320 (6.1%) |
| 55 to 59 Years | 22,574 (7.0%) | 24,622 (7.4%) |
| 60 to 64 Years | 24,054 (7.4%) | 26,994 (8.1%) |
| 65 to 69 Years | 23,732 (7.3%) | 26,887 (8.0%) |
| 70 to 74 Years | 23,133 (7.2%) | 26,084 (7.8%) |
| 75 to 79 Years | 18,073 (5.6%) | 21,378 (6.4%) |
| 80 to 84 Years | 12,873 (4.0%) | 13,892 (4.2%) |
| 85 Years and over | 10,202 (3.2%) | 13,021 (3.9%) |
| Total | 322,797 (100.0%) | 334,491 (100.0%) |
Families and Households in Area Code 772
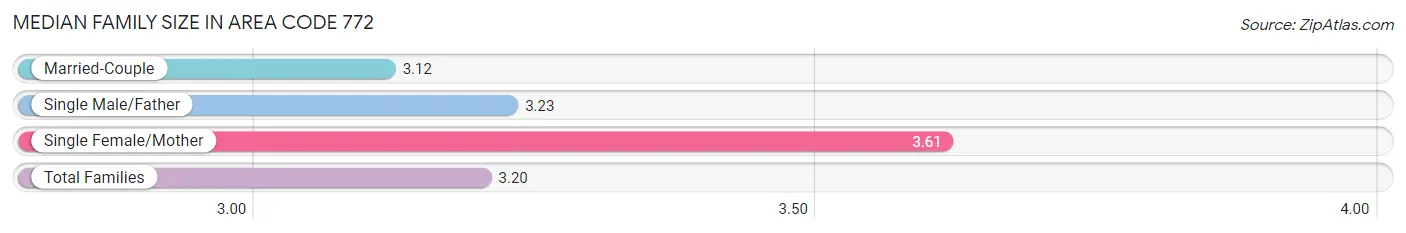
Median Family Size in Area Code 772
The median family size in Area Code 772 is 3.20 persons per family, with single female/mother families (28,983 | 17.0%) accounting for the largest median family size of 3.61354 persons per family. On the other hand, married-couple families (130,753 | 76.6%) represent the smallest median family size with 3.12 persons per family.
| Family Type | # Families | Family Size |
| Married-Couple | 130,753 (76.6%) | 3.12 |
| Single Male/Father | 10,902 (6.4%) | 3.23 |
| Single Female/Mother | 28,983 (17.0%) | 3.61 |
| Total Families | 170,638 (100.0%) | 3.20 |
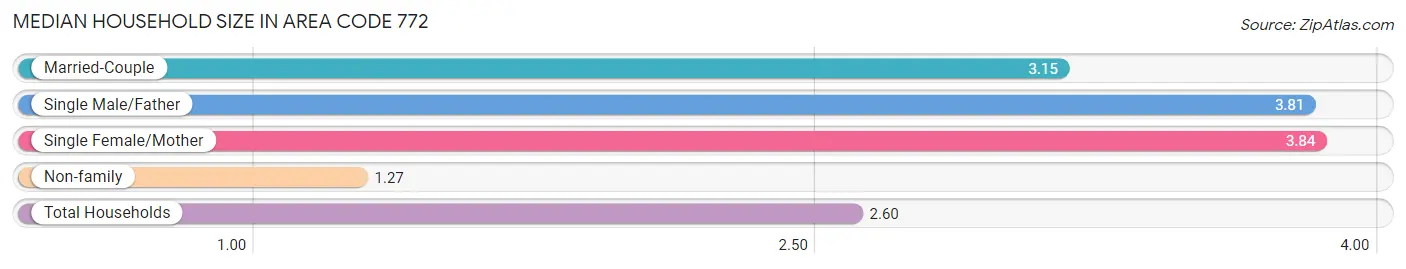
Median Household Size in Area Code 772
The median household size in Area Code 772 is 2.60 persons per household, with single female/mother households (28,983 | 11.1%) accounting for the largest median household size of 3.84032 persons per household. non-family households (90,321 | 34.6%) represent the smallest median household size with 1.27 persons per household.
| Household Type | # Households | Household Size |
| Married-Couple | 130,753 (50.1%) | 3.15 |
| Single Male/Father | 10,902 (4.2%) | 3.81 |
| Single Female/Mother | 28,983 (11.1%) | 3.84 |
| Non-family | 90,321 (34.6%) | 1.27 |
| Total Households | 260,959 (100.0%) | 2.60 |
Household Size by Marriage Status in Area Code 772
Out of a total of 260,959 households in Area Code 772, 170,638 (65.4%) are family households, while 90,321 (34.6%) are nonfamily households. The most numerous type of family households are 2-person households, comprising 95,173, and the most common type of nonfamily households are 1-person households, comprising 76,318.
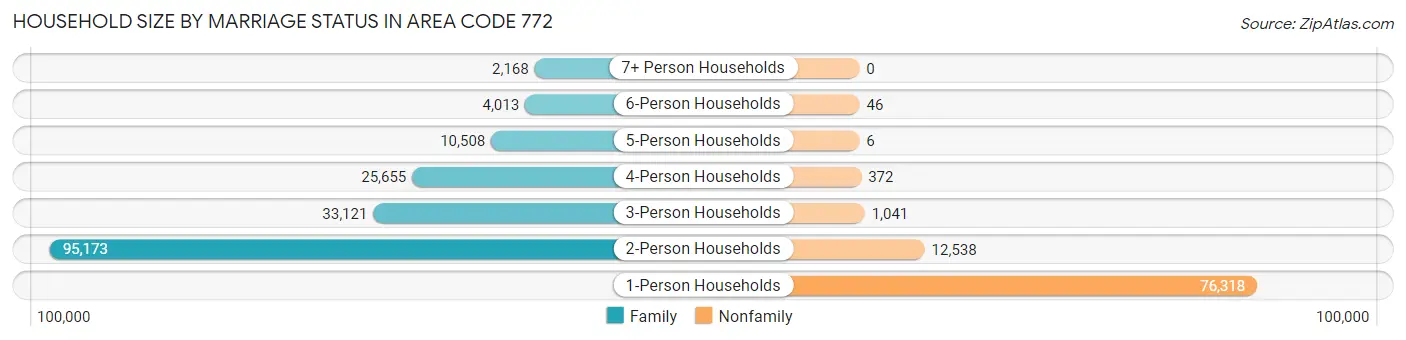
| Household Size | Family Households | Nonfamily Households |
| 1-Person Households | - | 76,318 (29.2%) |
| 2-Person Households | 95,173 (36.5%) | 12,538 (4.8%) |
| 3-Person Households | 33,121 (12.7%) | 1,041 (0.4%) |
| 4-Person Households | 25,655 (9.8%) | 372 (0.1%) |
| 5-Person Households | 10,508 (4.0%) | 6 (0.0%) |
| 6-Person Households | 4,013 (1.5%) | 46 (0.0%) |
| 7+ Person Households | 2,168 (0.8%) | 0 (0.0%) |
| Total | 170,638 (65.4%) | 90,321 (34.6%) |
Female Fertility in Area Code 772
Fertility by Age in Area Code 772
Average fertility rate in Area Code 772 is 51.1 births per 1,000 women. Women in the age bracket of 20 to 34 years have the highest fertility rate with 90.6 births per 1,000 women. Women in the age bracket of 20 to 34 years acount for 70.9% of all women with births.
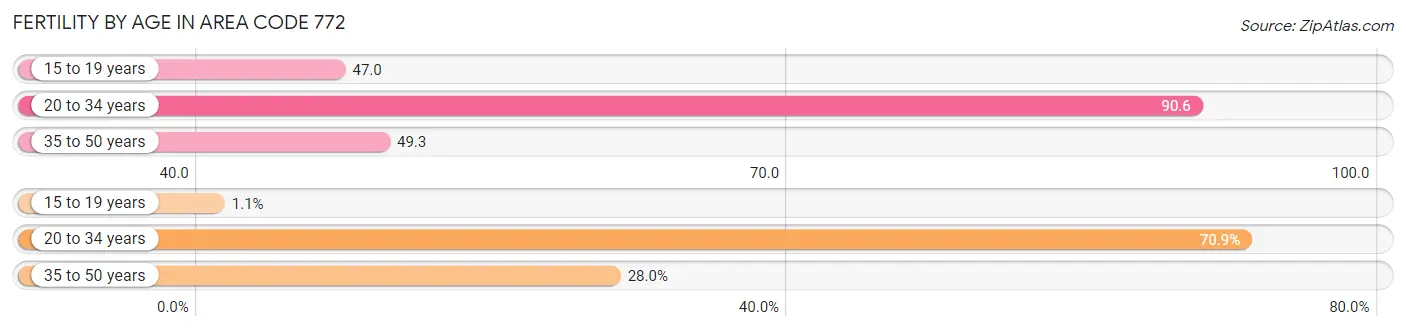
| Age Bracket | Women with Births | Births / 1,000 Women |
| 15 to 19 years | 70 (1.1%) | 47.0 |
| 20 to 34 years | 4,361 (70.9%) | 90.6 |
| 35 to 50 years | 1,724 (28.0%) | 49.3 |
| Total | 6,155 (100.0%) | 51.1 |
Fertility by Age by Marriage Status in Area Code 772
49.0% of women with births (6,155) in Area Code 772 are married. The highest percentage of unmarried women with births falls into 15 to 19 years age bracket with 100.0% of them unmarried at the time of birth, while the lowest percentage of unmarried women with births belong to 35 to 50 years age bracket with 52.8% of them unmarried.
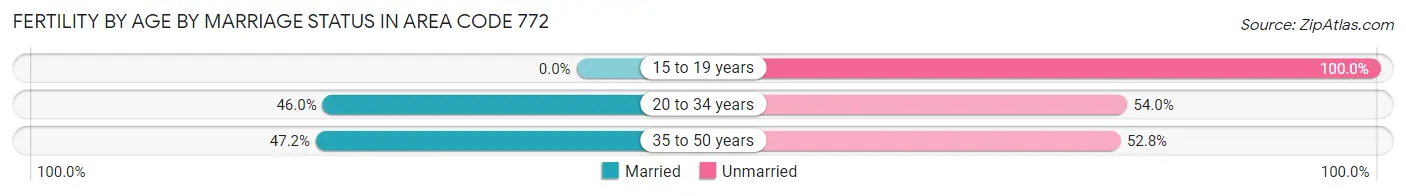
| Age Bracket | Married | Unmarried |
| 15 to 19 years | 0 (0.0%) | 70 (100.0%) |
| 20 to 34 years | 2,007 (46.0%) | 2,354 (54.0%) |
| 35 to 50 years | 814 (47.2%) | 910 (52.8%) |
| Total | 3,015 (49.0%) | 3,140 (51.0%) |
Fertility by Education in Area Code 772
Average fertility rate in Area Code 772 is 51.1 births per 1,000 women. Women with the education attainment of graduate degree have the highest fertility rate of 149.2 births per 1,000 women, while women with the education attainment of college or associate's degree have the lowest fertility at 60.8 births per 1,000 women. Women with the education attainment of college or associate's degree represent 34.8% of all women with births.
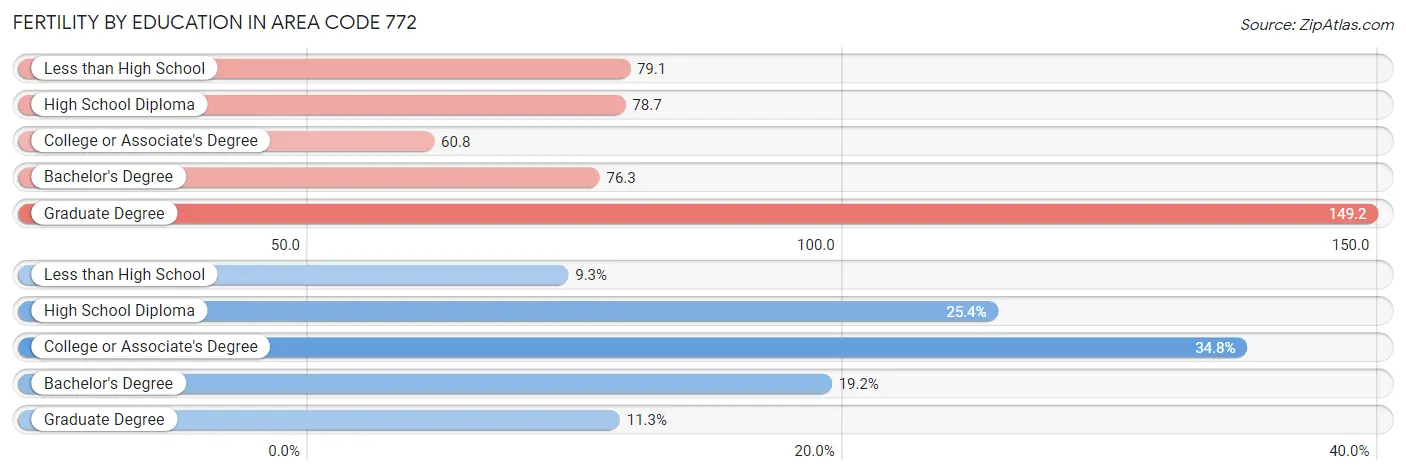
| Educational Attainment | Women with Births | Births / 1,000 Women |
| Less than High School | 574 (9.3%) | 79.1 |
| High School Diploma | 1,566 (25.4%) | 78.7 |
| College or Associate's Degree | 2,140 (34.8%) | 60.8 |
| Bachelor's Degree | 1,182 (19.2%) | 76.2 |
| Graduate Degree | 693 (11.3%) | 149.2 |
| Total | 6,155 (100.0%) | 51.1 |
Fertility by Education by Marriage Status in Area Code 772
51.0% of women with births in Area Code 772 are unmarried. Women with the educational attainment of graduate degree are most likely to be married with 63.3% of them married at childbirth, while women with the educational attainment of high school diploma are least likely to be married with 87.2% of them unmarried at childbirth.
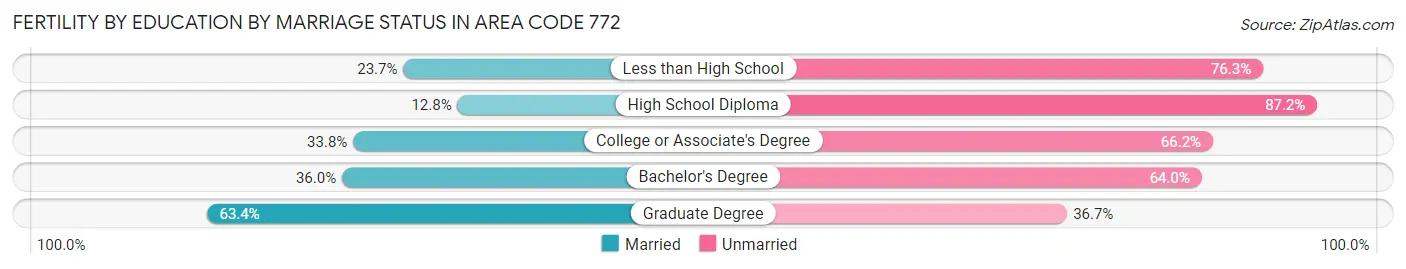
| Educational Attainment | Married | Unmarried |
| Less than High School | 136 (23.7%) | 438 (76.3%) |
| High School Diploma | 200 (12.8%) | 1,366 (87.2%) |
| College or Associate's Degree | 723 (33.8%) | 1,417 (66.2%) |
| Bachelor's Degree | 426 (36.0%) | 756 (64.0%) |
| Graduate Degree | 439 (63.3%) | 254 (36.6%) |
| Total | 3,015 (49.0%) | 3,140 (51.0%) |
Employment Characteristics in Area Code 772
Employment by Class of Employer in Area Code 772
Among the 270,610 employed individuals in Area Code 772, private company employees (185,099 | 68.4%), local government employees (19,560 | 7.2%), and not-for-profit organizations (19,184 | 7.1%) make up the most common classes of employment.
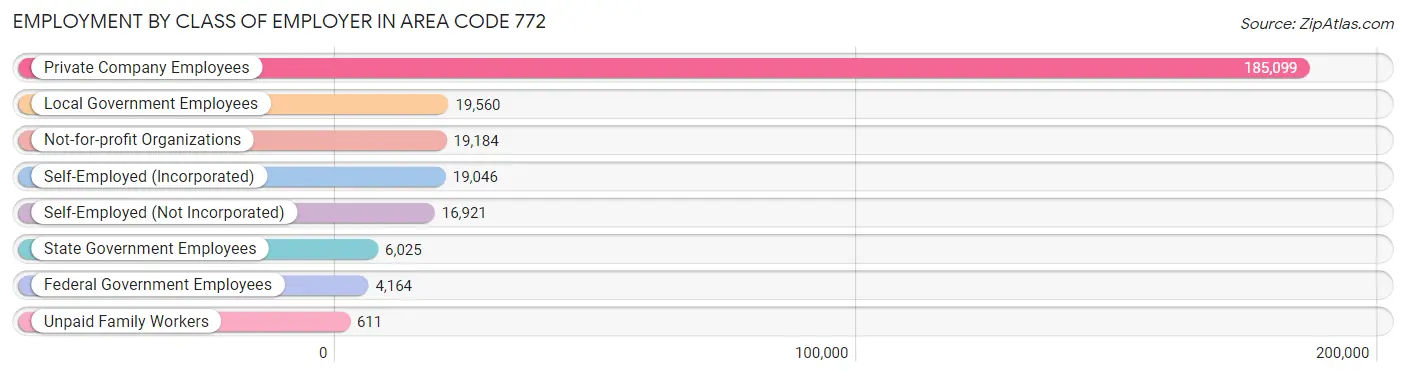
| Employer Class | # Employees | % Employees |
| Private Company Employees | 185,099 | 68.4% |
| Self-Employed (Incorporated) | 19,046 | 7.0% |
| Self-Employed (Not Incorporated) | 16,921 | 6.2% |
| Not-for-profit Organizations | 19,184 | 7.1% |
| Local Government Employees | 19,560 | 7.2% |
| State Government Employees | 6,025 | 2.2% |
| Federal Government Employees | 4,164 | 1.5% |
| Unpaid Family Workers | 611 | 0.2% |
| Total | 270,610 | 100.0% |
Employment Status by Age in Area Code 772
According to the labor force statistics for Area Code 772, out of the total population over 16 years of age (555,538), 51.2% or 284,269 individuals are in the labor force, with 5.8% or 16,374 of them unemployed. The age group with the highest labor force participation rate is 25 to 29 years, with 81.8% or 26,794 individuals in the labor force. Within the labor force, the 16 to 19 years age range has the highest percentage of unemployed individuals, with 467.6% or 54,115 of them being unemployed.
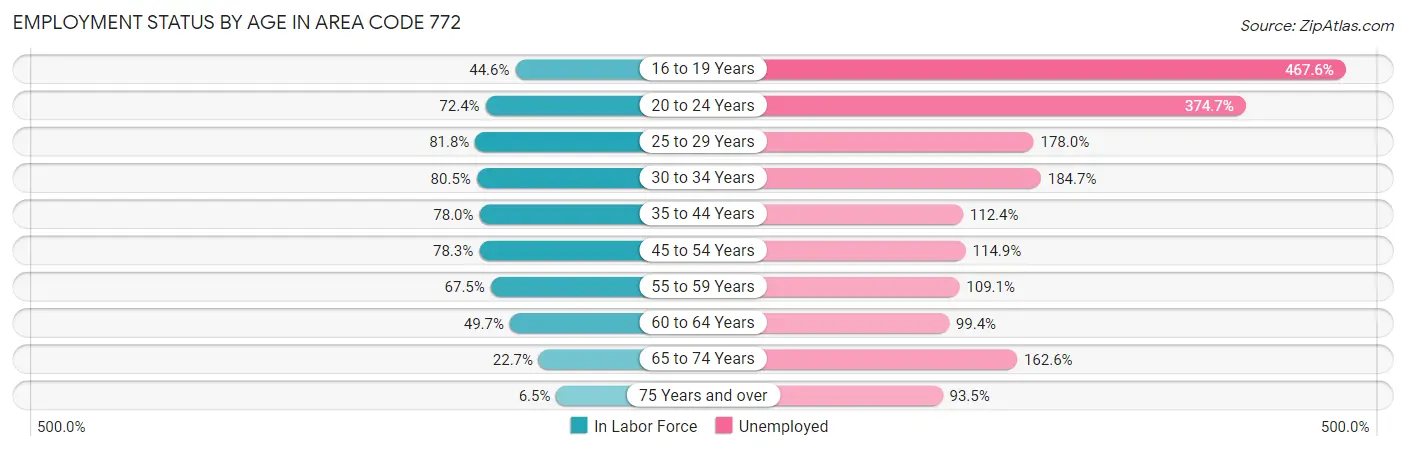
| Age Bracket | In Labor Force | Unemployed |
| 16 to 19 Years | 11,574 (44.6%) | 54,115 (467.6%) |
| 20 to 24 Years | 23,201 (72.4%) | 86,938 (374.7%) |
| 25 to 29 Years | 26,793 (81.8%) | 47,693 (178.0%) |
| 30 to 34 Years | 27,326 (80.5%) | 50,467 (184.7%) |
| 35 to 44 Years | 52,618 (78.0%) | 59,140 (112.4%) |
| 45 to 54 Years | 59,320 (78.2%) | 68,160 (114.9%) |
| 55 to 59 Years | 31,854 (67.5%) | 34,752 (109.1%) |
| 60 to 64 Years | 25,388 (49.7%) | 25,234 (99.4%) |
| 65 to 74 Years | 22,696 (22.7%) | 36,899 (162.6%) |
| 75 Years and over | 5,843 (6.5%) | 5,460 (93.5%) |
| Total | 284,256 (51.2%) | 16,364 (5.8%) |
Employment Status by Educational Attainment in Area Code 772
According to labor force statistics for Area Code 772, 71.6% of individuals (220,699) out of the total population between 25 and 64 years of age (308,239) are in the labor force, with 130.9% or 288,895 of them being unemployed. The group with the highest labor force participation rate are those with the educational attainment of bachelor's degree or higher, with 79.2% or 67,970 individuals in the labor force. Within the labor force, individuals with less than high school education have the highest percentage of unemployment, with 186.3% or 32,308 of them being unemployed.
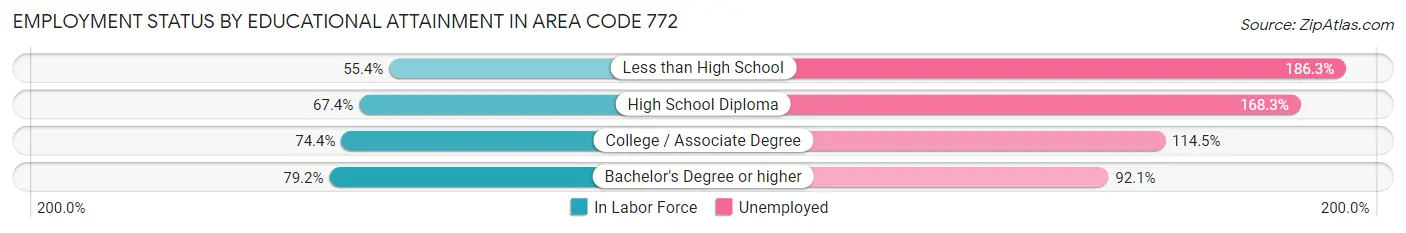
| Educational Attainment | In Labor Force | Unemployed |
| Less than High School | 17,342 (55.4%) | 58,288 (186.3%) |
| High School Diploma | 58,613 (67.4%) | 146,434 (168.3%) |
| College / Associate Degree | 77,490 (74.4%) | 119,209 (114.5%) |
| Bachelor's Degree or higher | 67,970 (79.2%) | 79,050 (92.1%) |
| Total | 220,689 (71.6%) | 403,485 (130.9%) |
Employment Occupations by Sex in Area Code 772
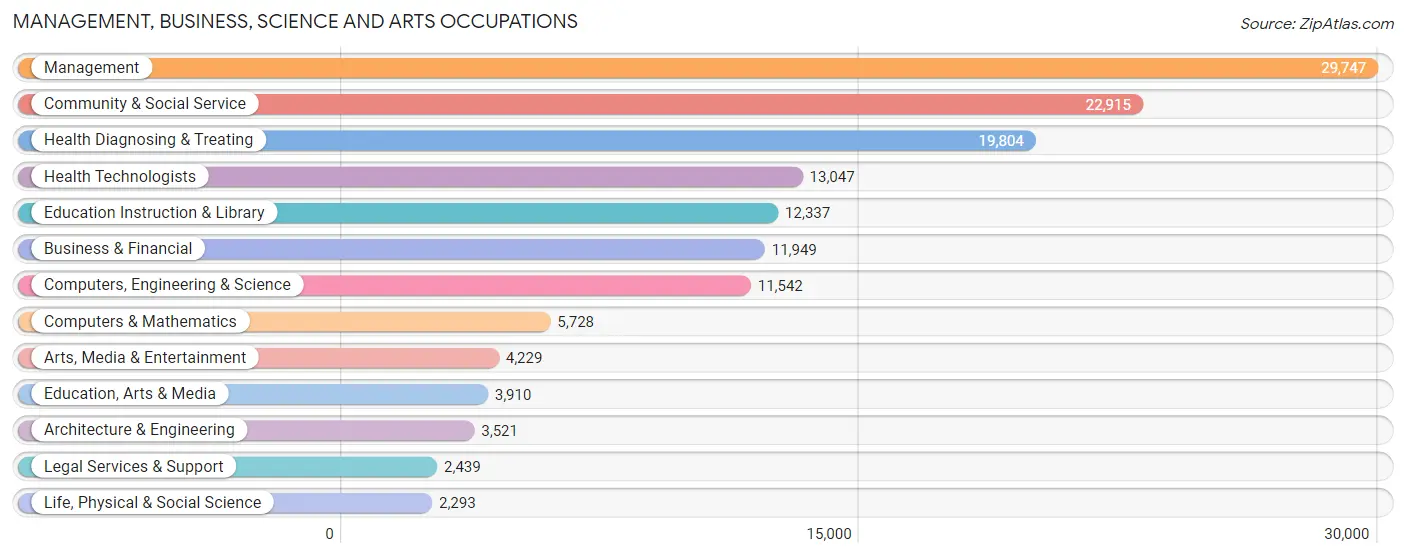
Management, Business, Science and Arts Occupations
The most common Management, Business, Science and Arts occupations in Area Code 772 are Management (29,747 | 10.8%), Community & Social Service (22,915 | 8.3%), Health Diagnosing & Treating (19,804 | 7.2%), Health Technologists (13,047 | 4.7%), and Education Instruction & Library (12,337 | 4.5%).
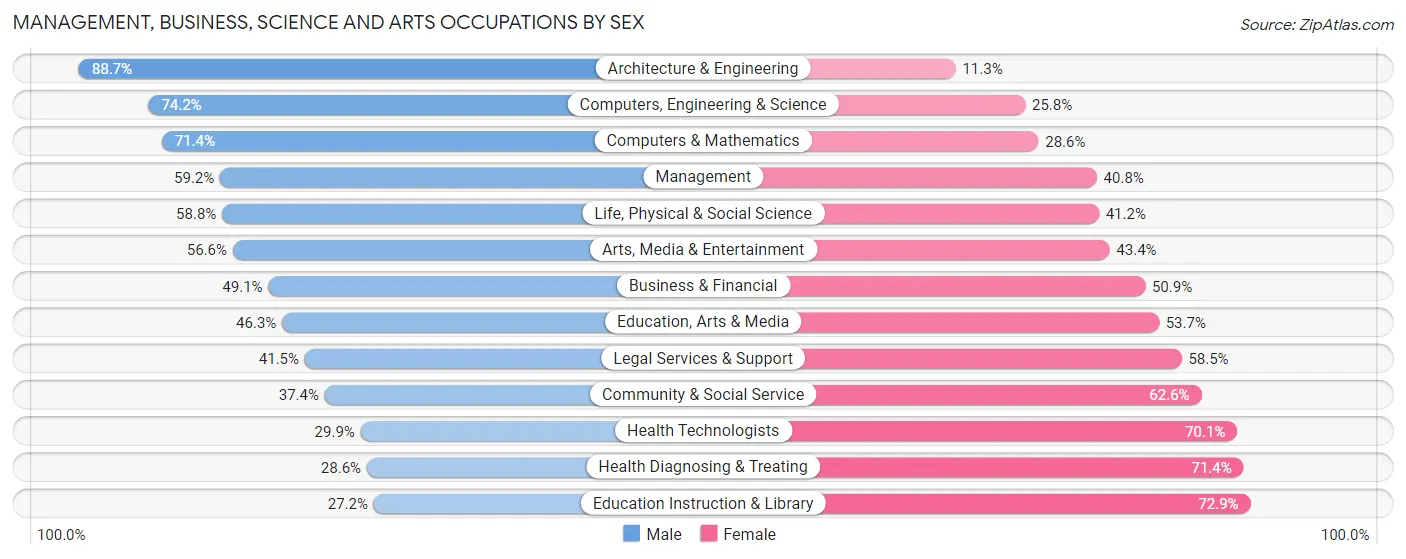
Management, Business, Science and Arts Occupations by Sex
Within the Management, Business, Science and Arts occupations in Area Code 772, the most male-oriented occupations are Architecture & Engineering (88.7%), Computers, Engineering & Science (74.2%), and Computers & Mathematics (71.4%), while the most female-oriented occupations are Education Instruction & Library (72.9%), Health Diagnosing & Treating (71.4%), and Health Technologists (70.1%).
| Occupation | Male | Female |
| Management | 17,617 (59.2%) | 12,130 (40.8%) |
| Business & Financial | 5,872 (49.1%) | 6,077 (50.9%) |
| Computers, Engineering & Science | 8,559 (74.2%) | 2,983 (25.8%) |
| Computers & Mathematics | 4,089 (71.4%) | 1,639 (28.6%) |
| Architecture & Engineering | 3,122 (88.7%) | 399 (11.3%) |
| Life, Physical & Social Science | 1,348 (58.8%) | 945 (41.2%) |
| Community & Social Service | 8,564 (37.4%) | 14,351 (62.6%) |
| Education, Arts & Media | 1,809 (46.3%) | 2,101 (53.7%) |
| Legal Services & Support | 1,013 (41.5%) | 1,426 (58.5%) |
| Education Instruction & Library | 3,350 (27.2%) | 8,987 (72.9%) |
| Arts, Media & Entertainment | 2,392 (56.6%) | 1,837 (43.4%) |
| Health Diagnosing & Treating | 5,661 (28.6%) | 14,143 (71.4%) |
| Health Technologists | 3,901 (29.9%) | 9,146 (70.1%) |
| Total (Category) | 46,273 (48.2%) | 49,684 (51.8%) |
| Total (Overall) | 143,070 (52.0%) | 132,105 (48.0%) |
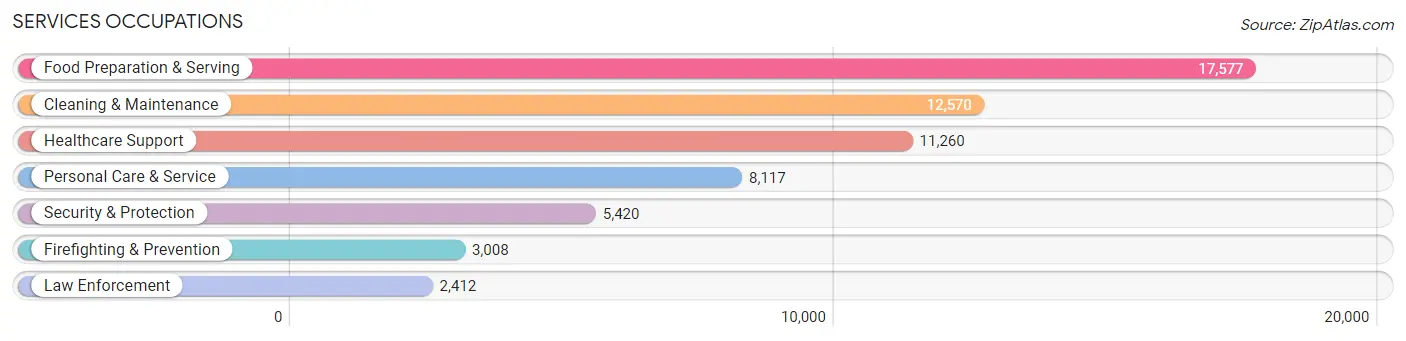
Services Occupations
The most common Services occupations in Area Code 772 are Food Preparation & Serving (17,577 | 6.4%), Cleaning & Maintenance (12,570 | 4.6%), Healthcare Support (11,260 | 4.1%), Personal Care & Service (8,117 | 2.9%), and Security & Protection (5,420 | 2.0%).
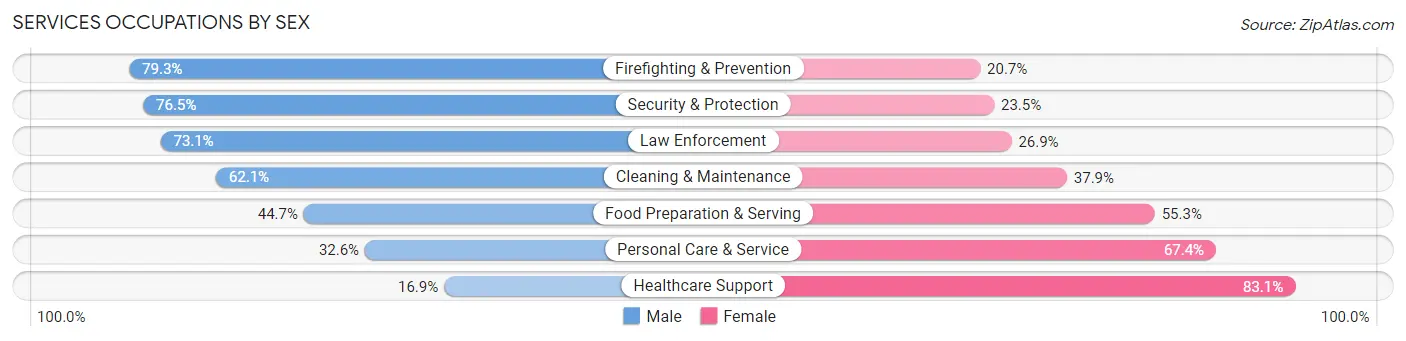
Services Occupations by Sex
Within the Services occupations in Area Code 772, the most male-oriented occupations are Firefighting & Prevention (79.3%), Security & Protection (76.5%), and Law Enforcement (73.1%), while the most female-oriented occupations are Healthcare Support (83.1%), Personal Care & Service (67.4%), and Food Preparation & Serving (55.3%).
| Occupation | Male | Female |
| Healthcare Support | 1,907 (16.9%) | 9,353 (83.1%) |
| Security & Protection | 4,148 (76.5%) | 1,272 (23.5%) |
| Firefighting & Prevention | 2,385 (79.3%) | 623 (20.7%) |
| Law Enforcement | 1,763 (73.1%) | 649 (26.9%) |
| Food Preparation & Serving | 7,858 (44.7%) | 9,719 (55.3%) |
| Cleaning & Maintenance | 7,807 (62.1%) | 4,763 (37.9%) |
| Personal Care & Service | 2,646 (32.6%) | 5,471 (67.4%) |
| Total (Category) | 24,366 (44.4%) | 30,578 (55.6%) |
| Total (Overall) | 143,070 (52.0%) | 132,105 (48.0%) |
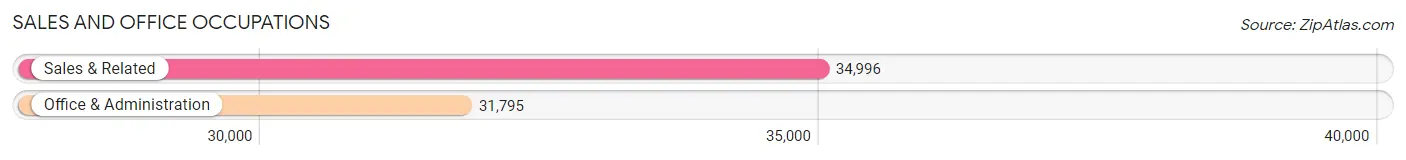
Sales and Office Occupations
The most common Sales and Office occupations in Area Code 772 are Sales & Related (34,996 | 12.7%), and Office & Administration (31,795 | 11.6%).
Sales and Office Occupations by Sex
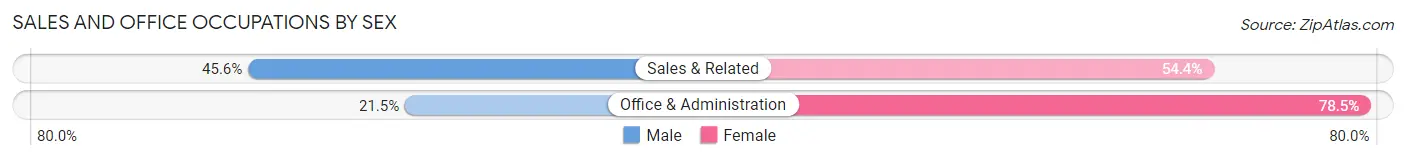
| Occupation | Male | Female |
| Sales & Related | 15,962 (45.6%) | 19,034 (54.4%) |
| Office & Administration | 6,825 (21.5%) | 24,970 (78.5%) |
| Total (Category) | 22,787 (34.1%) | 44,004 (65.9%) |
| Total (Overall) | 143,070 (52.0%) | 132,105 (48.0%) |
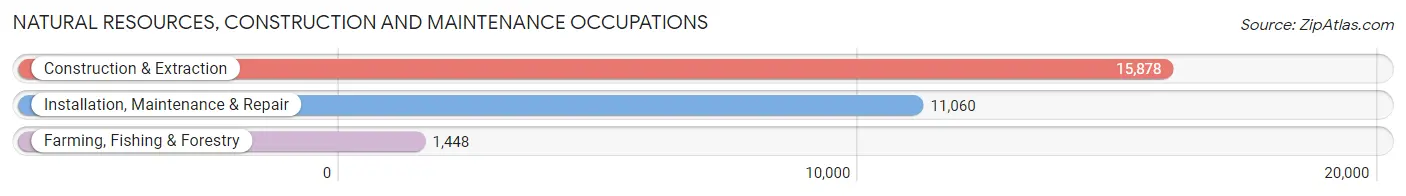
Natural Resources, Construction and Maintenance Occupations
The most common Natural Resources, Construction and Maintenance occupations in Area Code 772 are Construction & Extraction (15,878 | 5.8%), Installation, Maintenance & Repair (11,060 | 4.0%), and Farming, Fishing & Forestry (1,448 | 0.5%).
Natural Resources, Construction and Maintenance Occupations by Sex
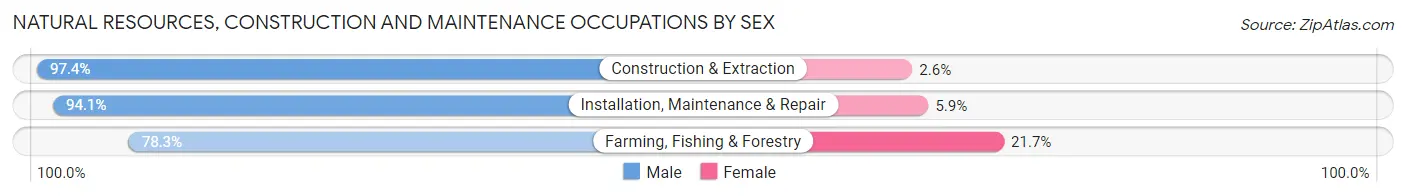
| Occupation | Male | Female |
| Farming, Fishing & Forestry | 1,134 (78.3%) | 314 (21.7%) |
| Construction & Extraction | 15,465 (97.4%) | 413 (2.6%) |
| Installation, Maintenance & Repair | 10,403 (94.1%) | 657 (5.9%) |
| Total (Category) | 27,002 (95.1%) | 1,384 (4.9%) |
| Total (Overall) | 143,070 (52.0%) | 132,105 (48.0%) |
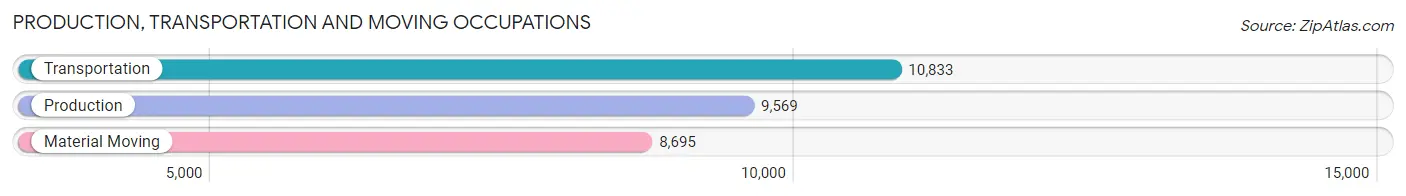
Production, Transportation and Moving Occupations
The most common Production, Transportation and Moving occupations in Area Code 772 are Transportation (10,833 | 3.9%), Production (9,569 | 3.5%), and Material Moving (8,695 | 3.2%).
Production, Transportation and Moving Occupations by Sex
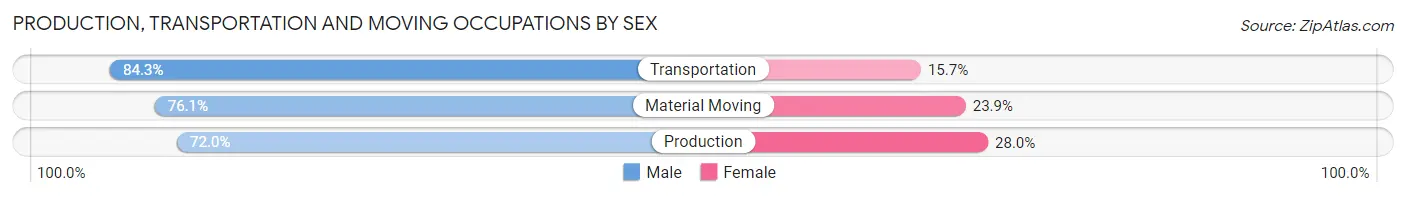
| Occupation | Male | Female |
| Production | 6,891 (72.0%) | 2,678 (28.0%) |
| Transportation | 9,134 (84.3%) | 1,699 (15.7%) |
| Material Moving | 6,617 (76.1%) | 2,078 (23.9%) |
| Total (Category) | 22,642 (77.8%) | 6,455 (22.2%) |
| Total (Overall) | 143,070 (52.0%) | 132,105 (48.0%) |
Employment Industries by Sex in Area Code 772
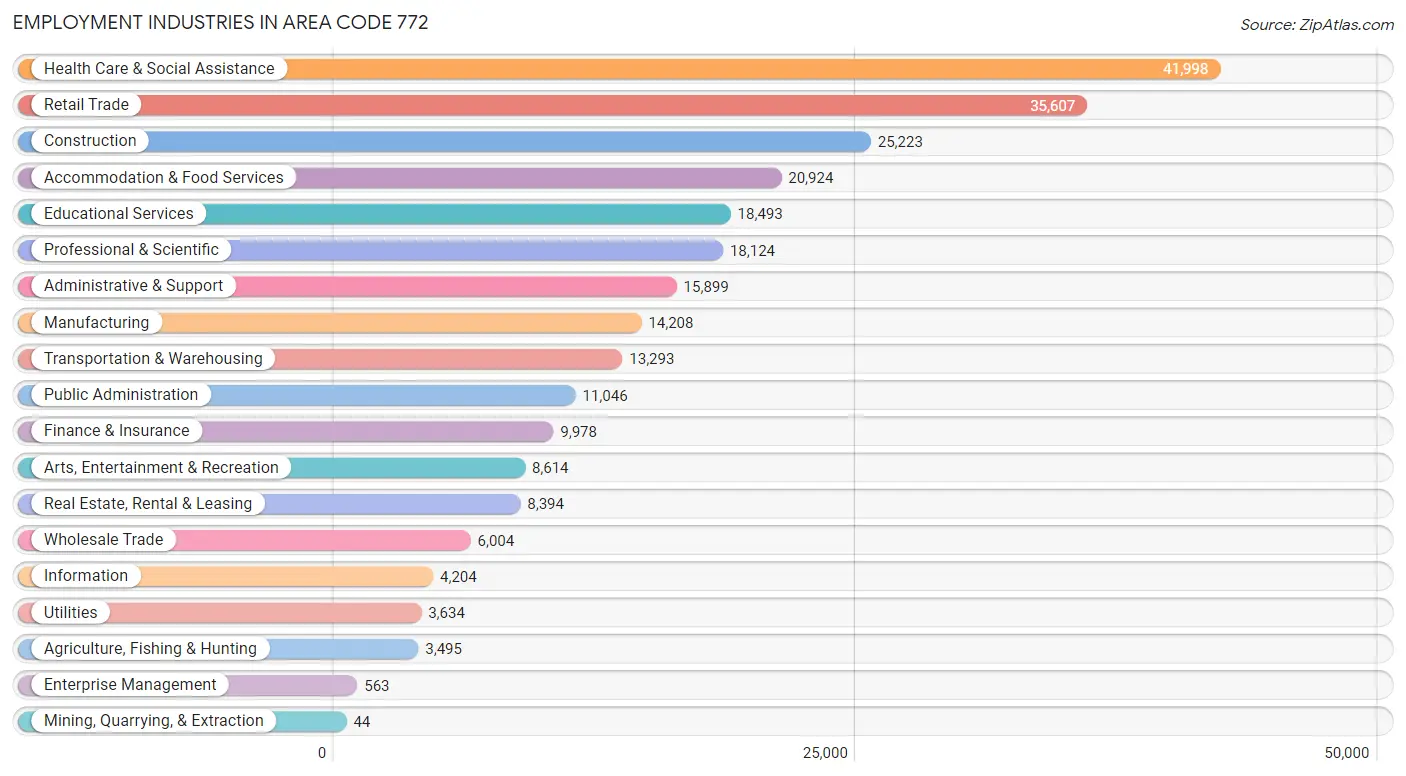
Employment Industries in Area Code 772
The major employment industries in Area Code 772 include Health Care & Social Assistance (41,998 | 15.3%), Retail Trade (35,607 | 12.9%), Construction (25,223 | 9.2%), Accommodation & Food Services (20,924 | 7.6%), and Educational Services (18,493 | 6.7%).
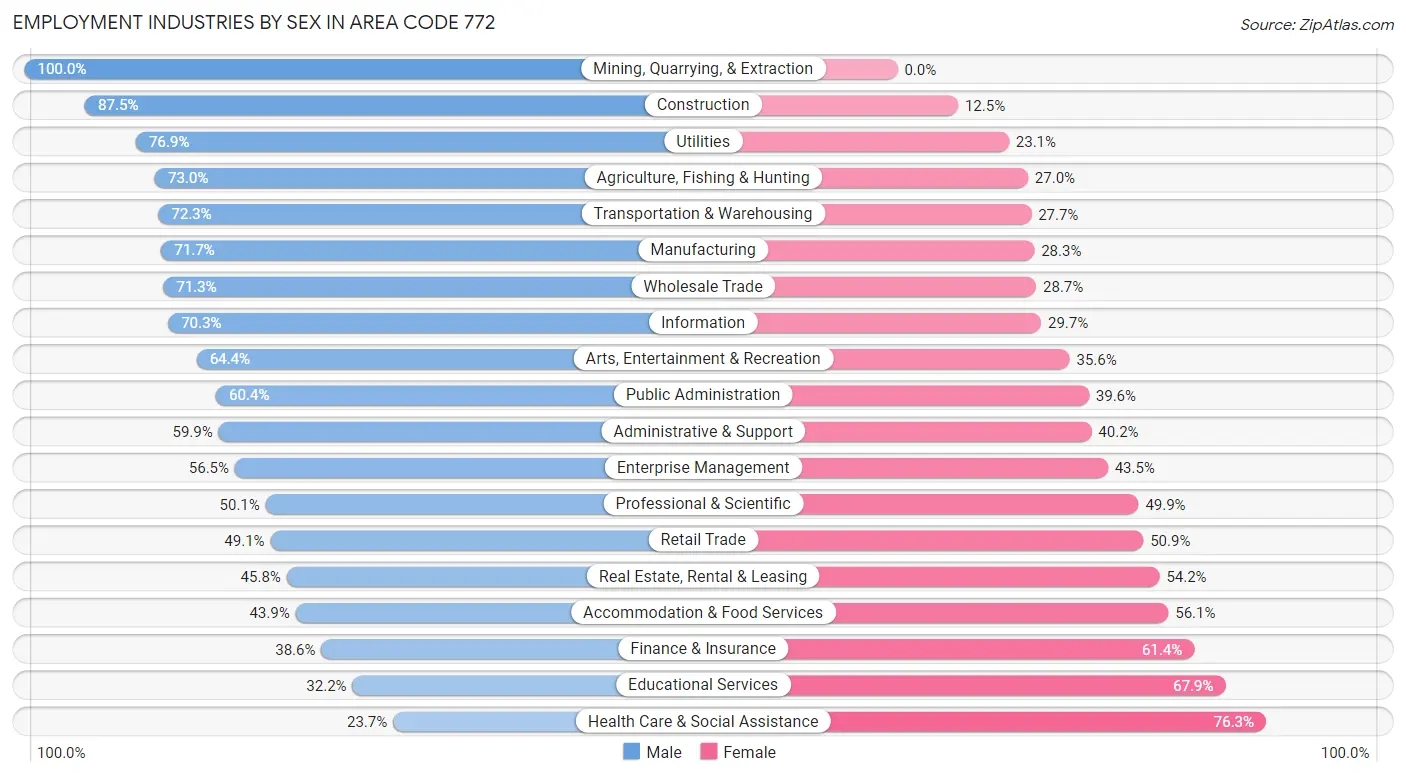
Employment Industries by Sex in Area Code 772
The Area Code 772 industries that see more men than women are Mining, Quarrying, & Extraction (100.0%), Construction (87.5%), and Utilities (76.9%), whereas the industries that tend to have a higher number of women are Health Care & Social Assistance (76.3%), Educational Services (67.8%), and Finance & Insurance (61.4%).
| Industry | Male | Female |
| Agriculture, Fishing & Hunting | 2,551 (73.0%) | 944 (27.0%) |
| Mining, Quarrying, & Extraction | 44 (100.0%) | 0 (0.0%) |
| Construction | 22,060 (87.5%) | 3,163 (12.5%) |
| Manufacturing | 10,184 (71.7%) | 4,024 (28.3%) |
| Wholesale Trade | 4,280 (71.3%) | 1,724 (28.7%) |
| Retail Trade | 17,490 (49.1%) | 18,117 (50.9%) |
| Transportation & Warehousing | 9,612 (72.3%) | 3,681 (27.7%) |
| Utilities | 2,796 (76.9%) | 838 (23.1%) |
| Information | 2,954 (70.3%) | 1,250 (29.7%) |
| Finance & Insurance | 3,851 (38.6%) | 6,127 (61.4%) |
| Real Estate, Rental & Leasing | 3,841 (45.8%) | 4,553 (54.2%) |
| Professional & Scientific | 9,082 (50.1%) | 9,042 (49.9%) |
| Enterprise Management | 318 (56.5%) | 245 (43.5%) |
| Administrative & Support | 9,515 (59.9%) | 6,384 (40.2%) |
| Educational Services | 5,945 (32.2%) | 12,548 (67.8%) |
| Health Care & Social Assistance | 9,971 (23.7%) | 32,027 (76.3%) |
| Arts, Entertainment & Recreation | 5,545 (64.4%) | 3,069 (35.6%) |
| Accommodation & Food Services | 9,191 (43.9%) | 11,733 (56.1%) |
| Public Administration | 6,669 (60.4%) | 4,377 (39.6%) |
| Total | 143,070 (52.0%) | 132,105 (48.0%) |
Education in Area Code 772
School Enrollment in Area Code 772
The most common levels of schooling among the 126,149 students in Area Code 772 are middle school (29,163 | 23.1%), high school (28,829 | 22.9%), and college / undergraduate (24,576 | 19.5%).
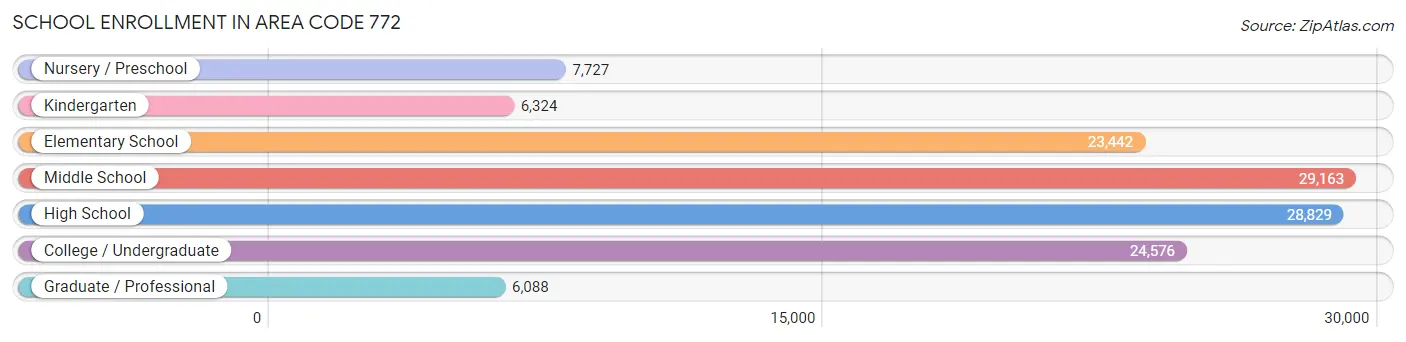
| School Level | # Students | % Students |
| Nursery / Preschool | 7,727 | 6.1% |
| Kindergarten | 6,324 | 5.0% |
| Elementary School | 23,442 | 18.6% |
| Middle School | 29,163 | 23.1% |
| High School | 28,829 | 22.9% |
| College / Undergraduate | 24,576 | 19.5% |
| Graduate / Professional | 6,088 | 4.8% |
| Total | 126,149 | 100.0% |
School Enrollment by Age by Funding Source in Area Code 772
Out of a total of 126,149 students who are enrolled in schools in Area Code 772, 22,088 (17.5%) attend a private institution, while the remaining 104,061 (82.5%) are enrolled in public schools. The age group of 3 to 4 year olds has the highest likelihood of being enrolled in private schools, with 2,733 (43.5% in the age bracket) enrolled. Conversely, the age group of 15 to 17 year olds has the lowest likelihood of being enrolled in a private school, with 19,038 (91.3% in the age bracket) attending a public institution.
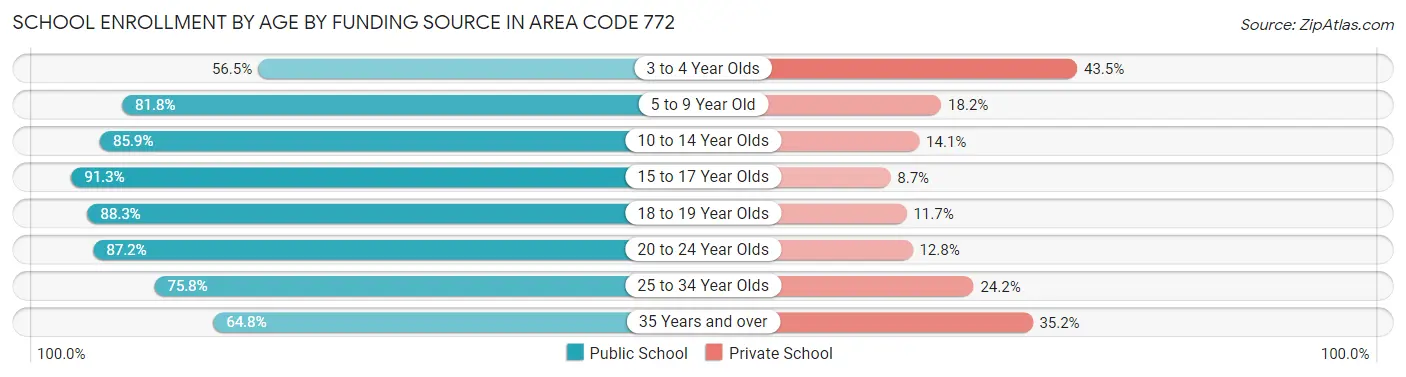
| Age Bracket | Public School | Private School |
| 3 to 4 Year Olds | 3,554 (56.5%) | 2,733 (43.5%) |
| 5 to 9 Year Old | 23,343 (81.8%) | 5,178 (18.2%) |
| 10 to 14 Year Olds | 29,879 (85.9%) | 4,890 (14.1%) |
| 15 to 17 Year Olds | 19,038 (91.3%) | 1,815 (8.7%) |
| 18 to 19 Year Olds | 7,137 (88.3%) | 946 (11.7%) |
| 20 to 24 Year Olds | 9,199 (87.2%) | 1,353 (12.8%) |
| 25 to 34 Year Olds | 5,832 (75.8%) | 1,860 (24.2%) |
| 35 Years and over | 6,090 (64.8%) | 3,302 (35.2%) |
| Total | 104,061 (82.5%) | 22,088 (17.5%) |
Educational Attainment by Field of Study in Area Code 772
Business (34,925 | 22.6%), education (20,869 | 13.5%), science & technology (17,367 | 11.3%), social sciences (12,008 | 7.8%), and arts & humanities (11,007 | 7.1%) are the most common fields of study among 154,395 individuals in Area Code 772 who have obtained a bachelor's degree or higher.
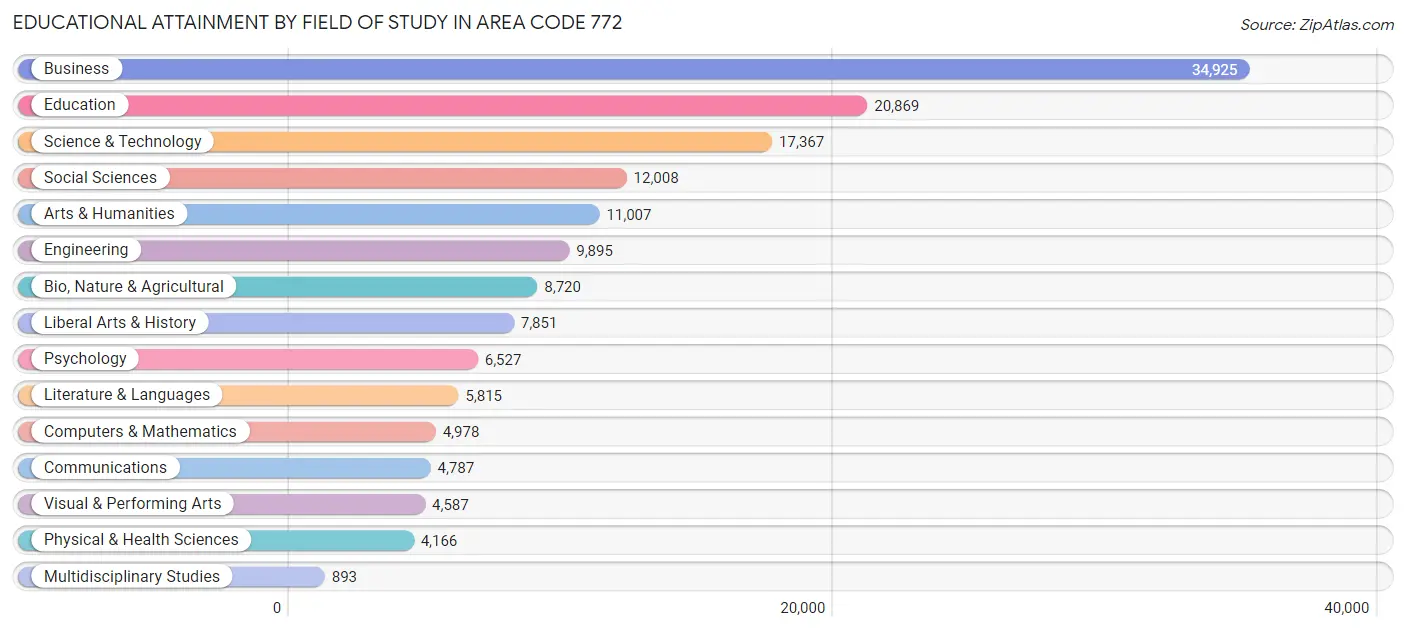
| Field of Study | # Graduates | % Graduates |
| Computers & Mathematics | 4,978 | 3.2% |
| Bio, Nature & Agricultural | 8,720 | 5.7% |
| Physical & Health Sciences | 4,166 | 2.7% |
| Psychology | 6,527 | 4.2% |
| Social Sciences | 12,008 | 7.8% |
| Engineering | 9,895 | 6.4% |
| Multidisciplinary Studies | 893 | 0.6% |
| Science & Technology | 17,367 | 11.3% |
| Business | 34,925 | 22.6% |
| Education | 20,869 | 13.5% |
| Literature & Languages | 5,815 | 3.8% |
| Liberal Arts & History | 7,851 | 5.1% |
| Visual & Performing Arts | 4,587 | 3.0% |
| Communications | 4,787 | 3.1% |
| Arts & Humanities | 11,007 | 7.1% |
| Total | 154,395 | 100.0% |
Transportation & Commute in Area Code 772
Vehicle Availability by Sex in Area Code 772
The most prevalent vehicle ownership categories in Area Code 772 are males with 2 vehicles (66,637, accounting for 47.3%) and females with 2 vehicles (54,894, making up 51.6%).
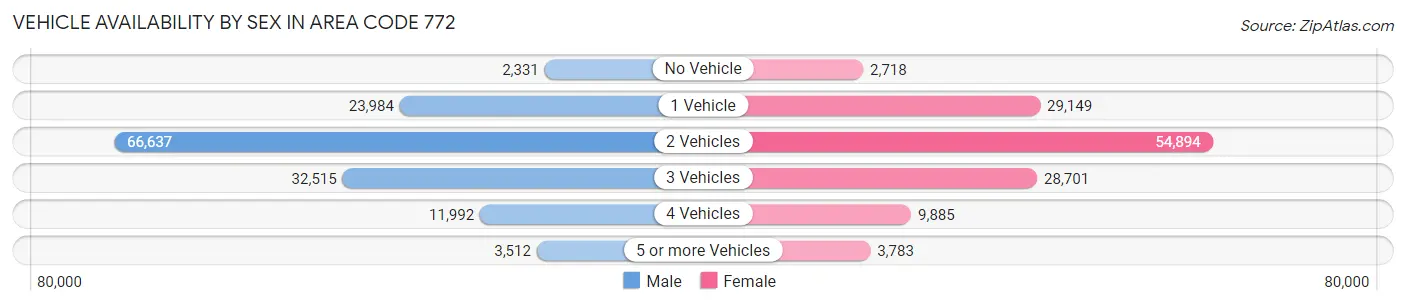
| Vehicles Available | Male | Female |
| No Vehicle | 2,331 (1.7%) | 2,718 (2.1%) |
| 1 Vehicle | 23,984 (17.0%) | 29,149 (22.6%) |
| 2 Vehicles | 66,637 (47.3%) | 54,894 (42.5%) |
| 3 Vehicles | 32,515 (23.1%) | 28,701 (22.2%) |
| 4 Vehicles | 11,992 (8.5%) | 9,885 (7.7%) |
| 5 or more Vehicles | 3,512 (2.5%) | 3,783 (2.9%) |
| Total | 140,971 (100.0%) | 129,130 (100.0%) |
Commute Time in Area Code 772
The most frequently occuring commute durations in Area Code 772 are 15 to 19 minutes (41,044 commuters, 16.9%), 30 to 34 minutes (38,072 commuters, 15.7%), and 20 to 24 minutes (36,781 commuters, 15.1%).
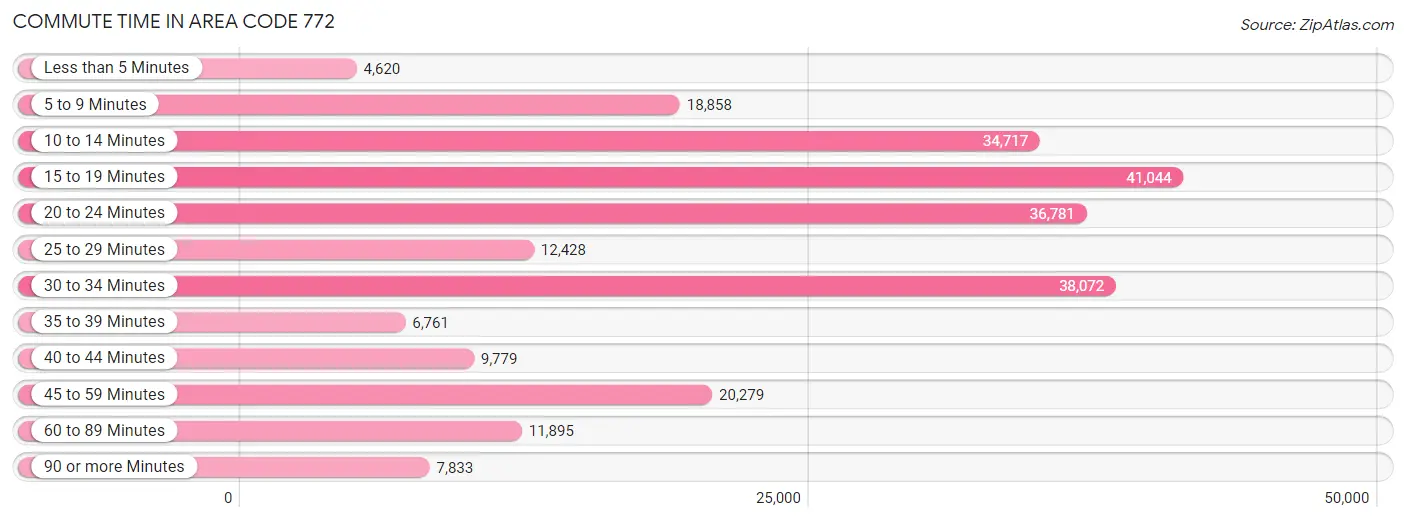
| Commute Time | # Commuters | % Commuters |
| Less than 5 Minutes | 4,620 | 1.9% |
| 5 to 9 Minutes | 18,858 | 7.8% |
| 10 to 14 Minutes | 34,717 | 14.3% |
| 15 to 19 Minutes | 41,044 | 16.9% |
| 20 to 24 Minutes | 36,781 | 15.1% |
| 25 to 29 Minutes | 12,428 | 5.1% |
| 30 to 34 Minutes | 38,072 | 15.7% |
| 35 to 39 Minutes | 6,761 | 2.8% |
| 40 to 44 Minutes | 9,779 | 4.0% |
| 45 to 59 Minutes | 20,279 | 8.3% |
| 60 to 89 Minutes | 11,895 | 4.9% |
| 90 or more Minutes | 7,833 | 3.2% |
Commute Time by Sex in Area Code 772
The most common commute times in Area Code 772 are 30 to 34 minutes (21,392 commuters, 16.6%) for males and 15 to 19 minutes (21,407 commuters, 18.7%) for females.
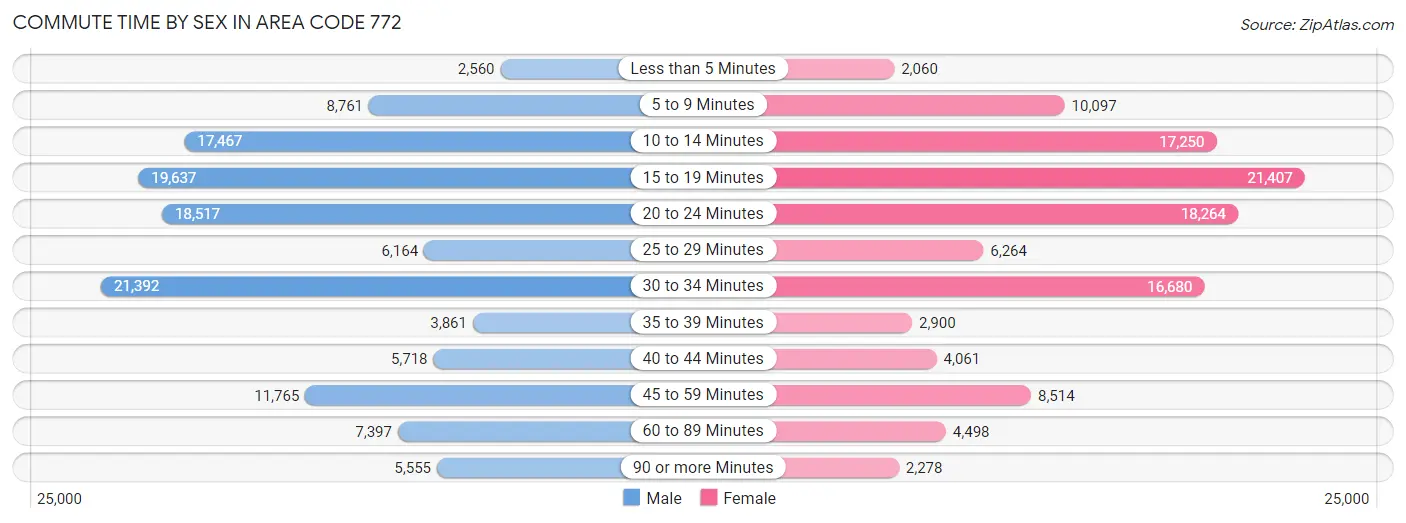
| Commute Time | Male | Female |
| Less than 5 Minutes | 2,560 (2.0%) | 2,060 (1.8%) |
| 5 to 9 Minutes | 8,761 (6.8%) | 10,097 (8.8%) |
| 10 to 14 Minutes | 17,467 (13.6%) | 17,250 (15.1%) |
| 15 to 19 Minutes | 19,637 (15.2%) | 21,407 (18.7%) |
| 20 to 24 Minutes | 18,517 (14.4%) | 18,264 (16.0%) |
| 25 to 29 Minutes | 6,164 (4.8%) | 6,264 (5.5%) |
| 30 to 34 Minutes | 21,392 (16.6%) | 16,680 (14.6%) |
| 35 to 39 Minutes | 3,861 (3.0%) | 2,900 (2.5%) |
| 40 to 44 Minutes | 5,718 (4.4%) | 4,061 (3.5%) |
| 45 to 59 Minutes | 11,765 (9.1%) | 8,514 (7.4%) |
| 60 to 89 Minutes | 7,397 (5.7%) | 4,498 (3.9%) |
| 90 or more Minutes | 5,555 (4.3%) | 2,278 (2.0%) |
Time of Departure to Work by Sex in Area Code 772
The most frequent times of departure to work in Area Code 772 are 7:00 AM to 7:29 AM (19,816, 15.4%) for males and 8:00 AM to 8:29 AM (15,731, 13.8%) for females.
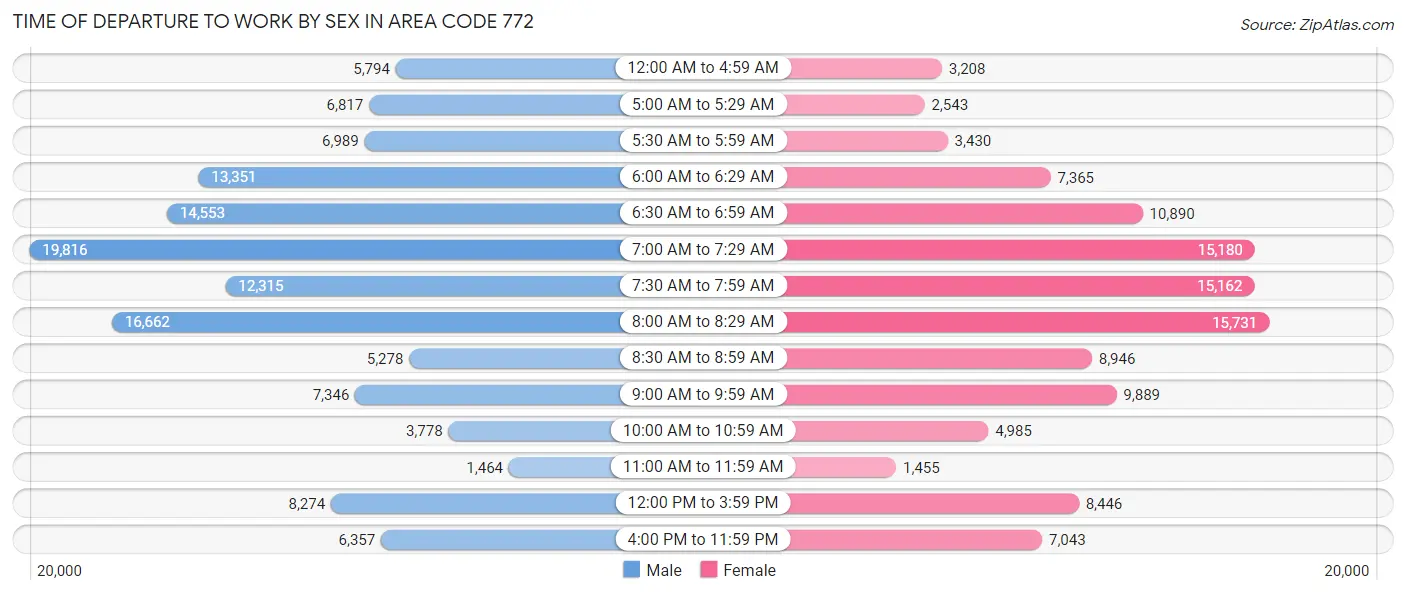
| Time of Departure | Male | Female |
| 12:00 AM to 4:59 AM | 5,794 (4.5%) | 3,208 (2.8%) |
| 5:00 AM to 5:29 AM | 6,817 (5.3%) | 2,543 (2.2%) |
| 5:30 AM to 5:59 AM | 6,989 (5.4%) | 3,430 (3.0%) |
| 6:00 AM to 6:29 AM | 13,351 (10.4%) | 7,365 (6.5%) |
| 6:30 AM to 6:59 AM | 14,553 (11.3%) | 10,890 (9.5%) |
| 7:00 AM to 7:29 AM | 19,816 (15.4%) | 15,180 (13.3%) |
| 7:30 AM to 7:59 AM | 12,315 (9.6%) | 15,162 (13.3%) |
| 8:00 AM to 8:29 AM | 16,662 (12.9%) | 15,731 (13.8%) |
| 8:30 AM to 8:59 AM | 5,278 (4.1%) | 8,946 (7.8%) |
| 9:00 AM to 9:59 AM | 7,346 (5.7%) | 9,889 (8.6%) |
| 10:00 AM to 10:59 AM | 3,778 (2.9%) | 4,985 (4.4%) |
| 11:00 AM to 11:59 AM | 1,464 (1.1%) | 1,455 (1.3%) |
| 12:00 PM to 3:59 PM | 8,274 (6.4%) | 8,446 (7.4%) |
| 4:00 PM to 11:59 PM | 6,357 (4.9%) | 7,043 (6.2%) |
| Total | 128,794 (100.0%) | 114,273 (100.0%) |
Housing Occupancy in Area Code 772
Occupancy by Ownership in Area Code 772
Of the total 260,959 dwellings in Area Code 772, owner-occupied units account for 205,797 (78.9%), while renter-occupied units make up 55,162 (21.1%).
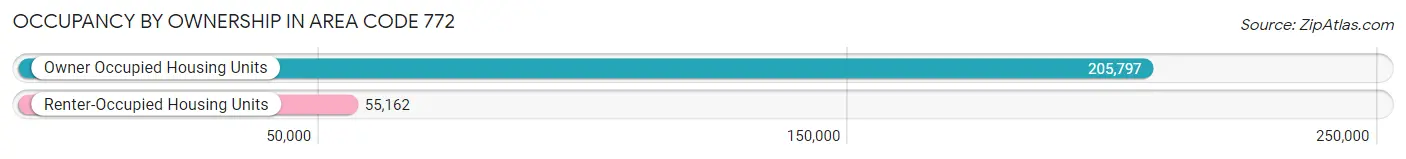
| Occupancy | # Housing Units | % Housing Units |
| Owner Occupied Housing Units | 205,797 | 78.9% |
| Renter-Occupied Housing Units | 55,162 | 21.1% |
| Total Occupied Housing Units | 260,959 | 100.0% |
Occupancy by Household Size in Area Code 772
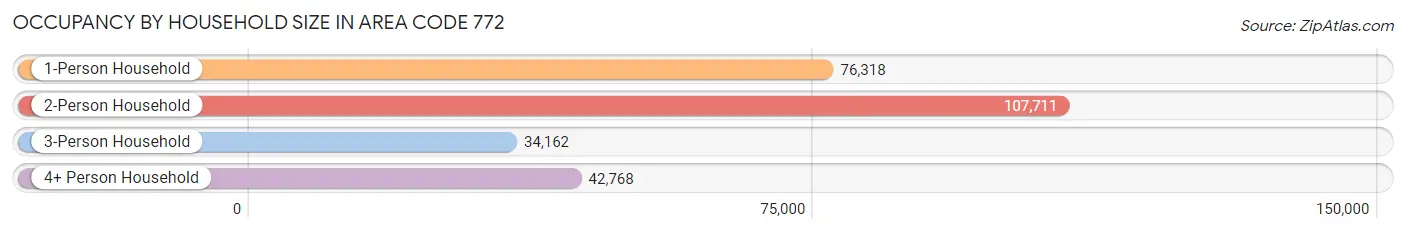
| Household Size | # Housing Units | % Housing Units |
| 1-Person Household | 76,318 | 29.2% |
| 2-Person Household | 107,711 | 41.3% |
| 3-Person Household | 34,162 | 13.1% |
| 4+ Person Household | 42,768 | 16.4% |
| Total Housing Units | 260,959 | 100.0% |
Occupancy by Ownership by Household Size in Area Code 772
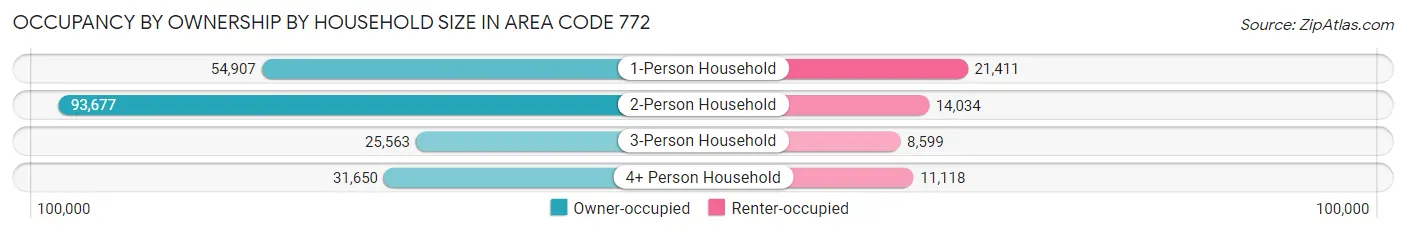
| Household Size | Owner-occupied | Renter-occupied |
| 1-Person Household | 54,907 (72.0%) | 21,411 (28.1%) |
| 2-Person Household | 93,677 (87.0%) | 14,034 (13.0%) |
| 3-Person Household | 25,563 (74.8%) | 8,599 (25.2%) |
| 4+ Person Household | 31,650 (74.0%) | 11,118 (26.0%) |
| Total Housing Units | 205,797 (78.9%) | 55,162 (21.1%) |
Occupancy by Educational Attainment in Area Code 772
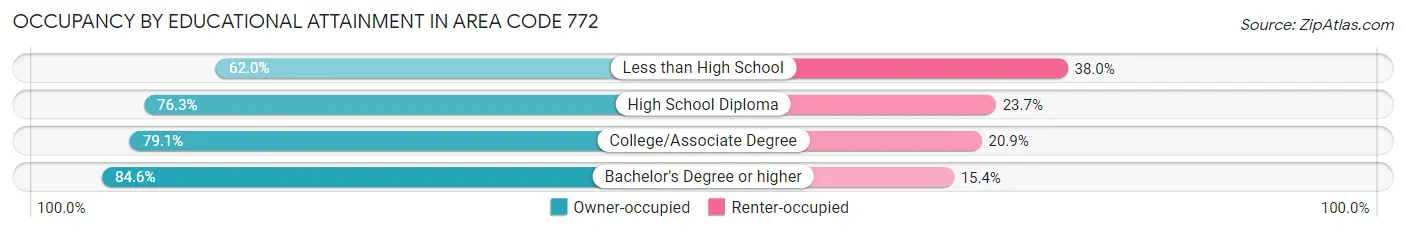
| Household Size | Owner-occupied | Renter-occupied |
| Less than High School | 12,928 (62.0%) | 7,911 (38.0%) |
| High School Diploma | 47,942 (76.3%) | 14,903 (23.7%) |
| College/Associate Degree | 73,209 (79.1%) | 19,327 (20.9%) |
| Bachelor's Degree or higher | 71,718 (84.6%) | 13,021 (15.4%) |
Occupancy by Age of Householder in Area Code 772
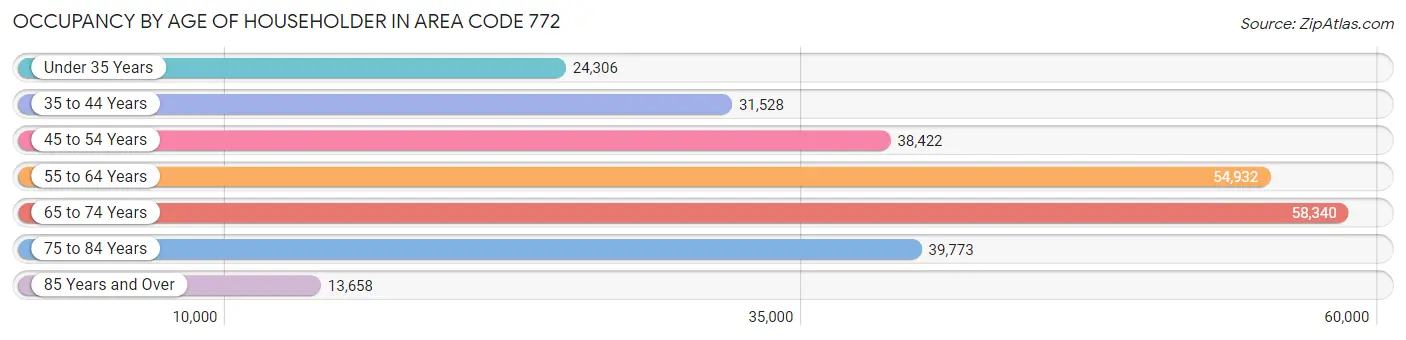
| Age Bracket | # Households | % Households |
| Under 35 Years | 24,306 | 9.3% |
| 35 to 44 Years | 31,528 | 12.1% |
| 45 to 54 Years | 38,422 | 14.7% |
| 55 to 64 Years | 54,932 | 21.0% |
| 65 to 74 Years | 58,340 | 22.4% |
| 75 to 84 Years | 39,773 | 15.2% |
| 85 Years and Over | 13,658 | 5.2% |
| Total | 260,959 | 100.0% |
Housing Finances in Area Code 772
Median Income by Occupancy in Area Code 772
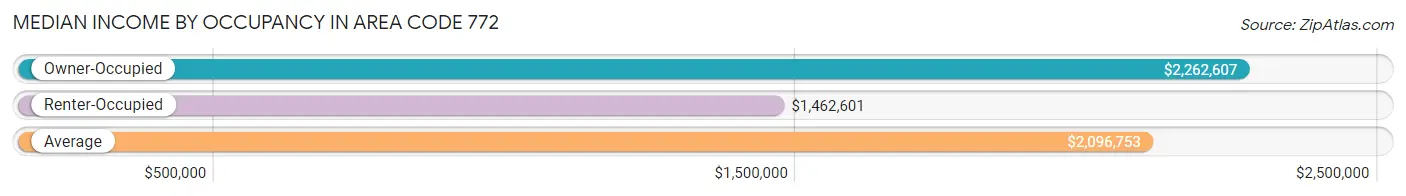
| Occupancy Type | # Households | Median Income |
| Owner-Occupied | 205,797 (78.9%) | $2,262,607 |
| Renter-Occupied | 55,162 (21.1%) | $1,462,601 |
| Average | 260,959 (100.0%) | $2,096,753 |
Occupancy by Householder Income Bracket in Area Code 772
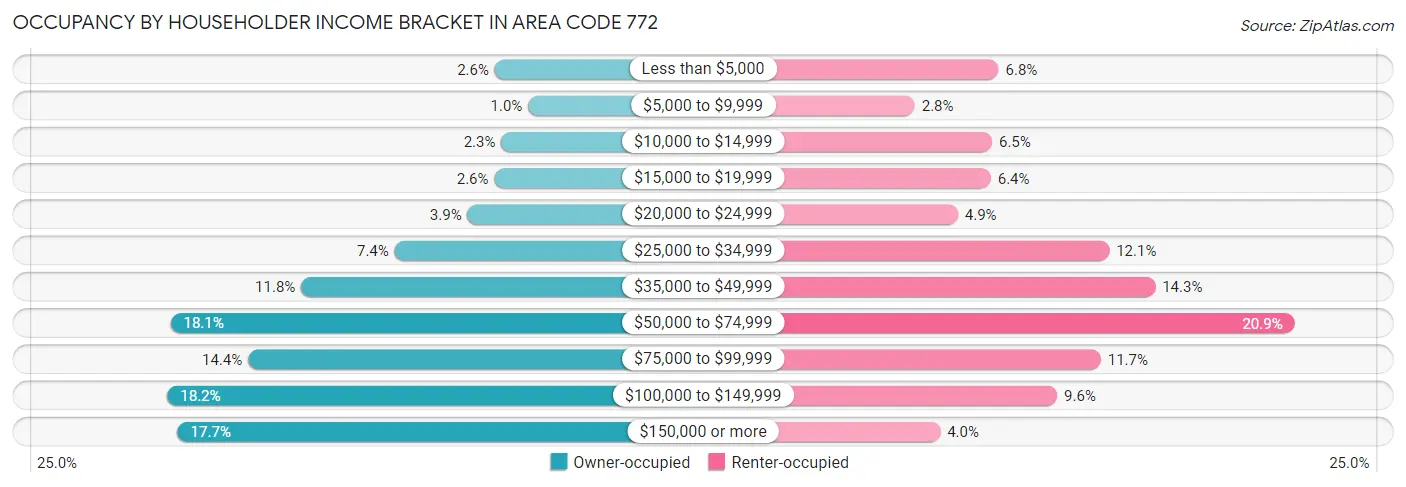
| Income Bracket | Owner-occupied | Renter-occupied |
| Less than $5,000 | 5,365 (2.6%) | 3,756 (6.8%) |
| $5,000 to $9,999 | 2,100 (1.0%) | 1,557 (2.8%) |
| $10,000 to $14,999 | 4,742 (2.3%) | 3,587 (6.5%) |
| $15,000 to $19,999 | 5,405 (2.6%) | 3,550 (6.4%) |
| $20,000 to $24,999 | 8,044 (3.9%) | 2,688 (4.9%) |
| $25,000 to $34,999 | 15,195 (7.4%) | 6,662 (12.1%) |
| $35,000 to $49,999 | 24,347 (11.8%) | 7,871 (14.3%) |
| $50,000 to $74,999 | 37,144 (18.0%) | 11,529 (20.9%) |
| $75,000 to $99,999 | 29,549 (14.4%) | 6,445 (11.7%) |
| $100,000 to $149,999 | 37,454 (18.2%) | 5,293 (9.6%) |
| $150,000 or more | 36,452 (17.7%) | 2,224 (4.0%) |
| Total | 205,797 (100.0%) | 55,162 (100.0%) |
Monthly Housing Cost Tiers in Area Code 772
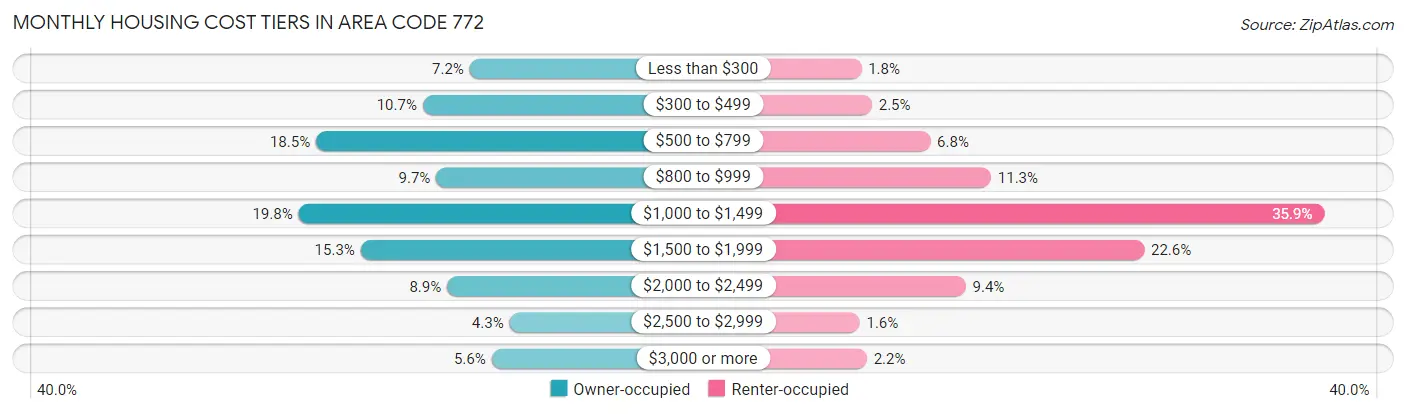
| Monthly Cost | Owner-occupied | Renter-occupied |
| Less than $300 | 14,865 (7.2%) | 965 (1.8%) |
| $300 to $499 | 21,986 (10.7%) | 1,395 (2.5%) |
| $500 to $799 | 38,152 (18.5%) | 3,765 (6.8%) |
| $800 to $999 | 19,940 (9.7%) | 6,236 (11.3%) |
| $1,000 to $1,499 | 40,803 (19.8%) | 19,777 (35.8%) |
| $1,500 to $1,999 | 31,383 (15.2%) | 12,455 (22.6%) |
| $2,000 to $2,499 | 18,289 (8.9%) | 5,209 (9.4%) |
| $2,500 to $2,999 | 8,824 (4.3%) | 899 (1.6%) |
| $3,000 or more | 11,555 (5.6%) | 1,190 (2.2%) |
| Total | 205,797 (100.0%) | 55,162 (100.0%) |
Physical Housing Characteristics in Area Code 772
Housing Structures in Area Code 772
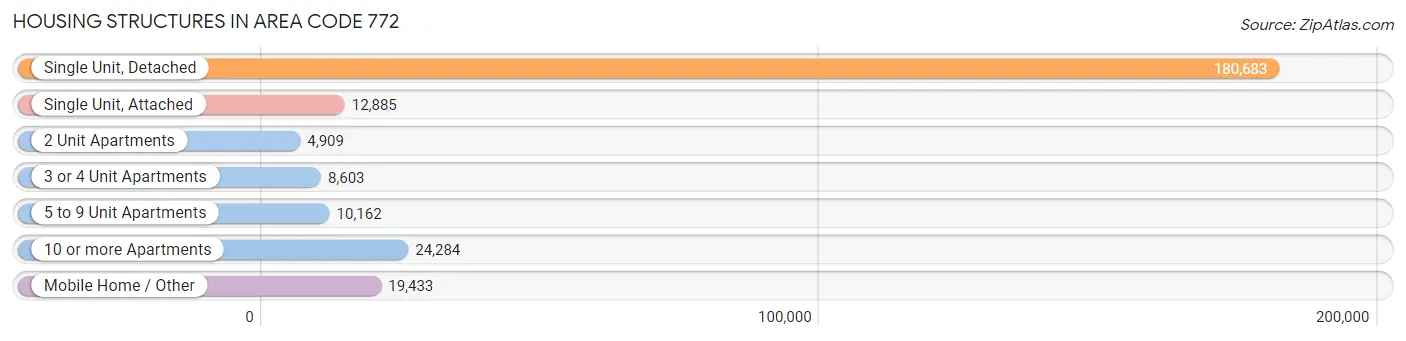
| Structure Type | # Housing Units | % Housing Units |
| Single Unit, Detached | 180,683 | 69.2% |
| Single Unit, Attached | 12,885 | 4.9% |
| 2 Unit Apartments | 4,909 | 1.9% |
| 3 or 4 Unit Apartments | 8,603 | 3.3% |
| 5 to 9 Unit Apartments | 10,162 | 3.9% |
| 10 or more Apartments | 24,284 | 9.3% |
| Mobile Home / Other | 19,433 | 7.4% |
| Total | 260,959 | 100.0% |
Housing Structures by Occupancy in Area Code 772
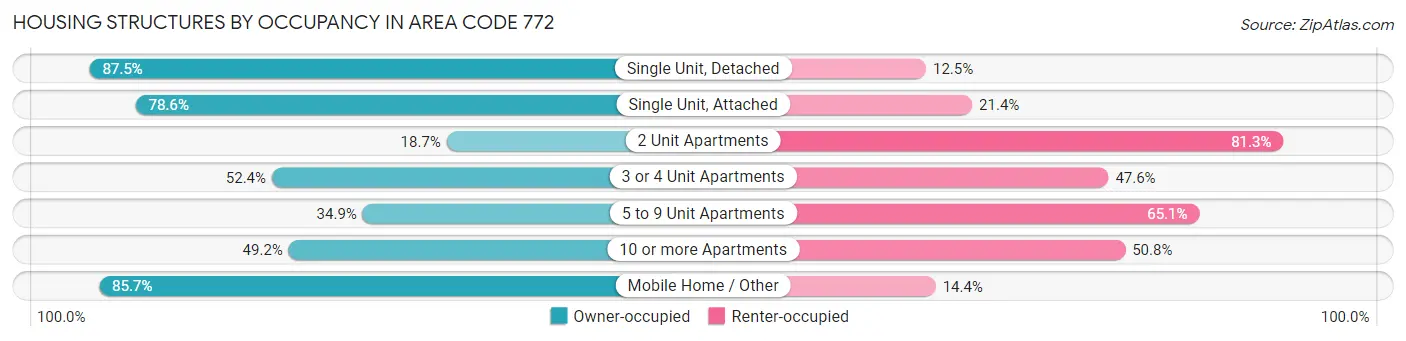
| Structure Type | Owner-occupied | Renter-occupied |
| Single Unit, Detached | 158,107 (87.5%) | 22,576 (12.5%) |
| Single Unit, Attached | 10,131 (78.6%) | 2,754 (21.4%) |
| 2 Unit Apartments | 920 (18.7%) | 3,989 (81.3%) |
| 3 or 4 Unit Apartments | 4,507 (52.4%) | 4,096 (47.6%) |
| 5 to 9 Unit Apartments | 3,548 (34.9%) | 6,614 (65.1%) |
| 10 or more Apartments | 11,939 (49.2%) | 12,345 (50.8%) |
| Mobile Home / Other | 16,645 (85.7%) | 2,788 (14.3%) |
| Total | 205,797 (78.9%) | 55,162 (21.1%) |
Housing Structures by Number of Rooms in Area Code 772
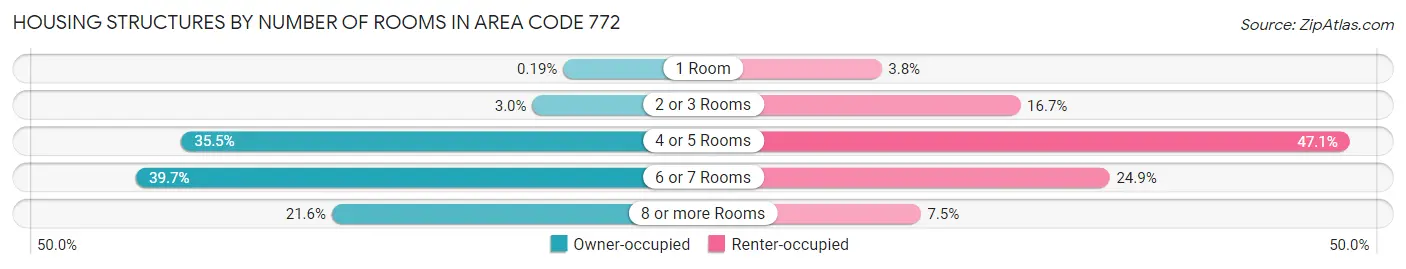
| Number of Rooms | Owner-occupied | Renter-occupied |
| 1 Room | 400 (0.2%) | 2,111 (3.8%) |
| 2 or 3 Rooms | 6,247 (3.0%) | 9,193 (16.7%) |
| 4 or 5 Rooms | 73,048 (35.5%) | 25,998 (47.1%) |
| 6 or 7 Rooms | 81,670 (39.7%) | 13,753 (24.9%) |
| 8 or more Rooms | 44,432 (21.6%) | 4,107 (7.4%) |
| Total | 205,797 (100.0%) | 55,162 (100.0%) |
Housing Structure by Heating Type in Area Code 772
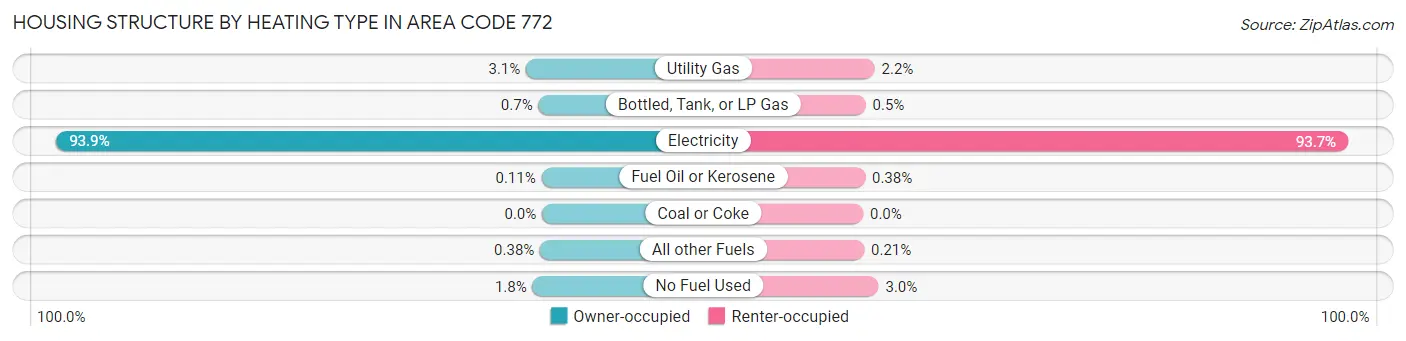
| Heating Type | Owner-occupied | Renter-occupied |
| Utility Gas | 6,353 (3.1%) | 1,230 (2.2%) |
| Bottled, Tank, or LP Gas | 1,444 (0.7%) | 274 (0.5%) |
| Electricity | 193,205 (93.9%) | 51,681 (93.7%) |
| Fuel Oil or Kerosene | 222 (0.1%) | 211 (0.4%) |
| Coal or Coke | 0 (0.0%) | 0 (0.0%) |
| All other Fuels | 777 (0.4%) | 115 (0.2%) |
| No Fuel Used | 3,796 (1.8%) | 1,651 (3.0%) |
| Total | 205,797 (100.0%) | 55,162 (100.0%) |
Household Vehicle Usage in Area Code 772
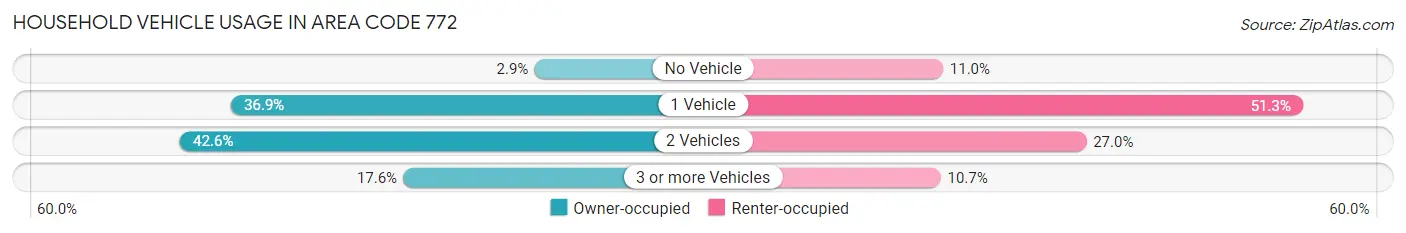
| Vehicles per Household | Owner-occupied | Renter-occupied |
| No Vehicle | 6,011 (2.9%) | 6,051 (11.0%) |
| 1 Vehicle | 75,899 (36.9%) | 28,289 (51.3%) |
| 2 Vehicles | 87,633 (42.6%) | 14,913 (27.0%) |
| 3 or more Vehicles | 36,254 (17.6%) | 5,909 (10.7%) |
| Total | 205,797 (100.0%) | 55,162 (100.0%) |
Real Estate & Mortgages in Area Code 772
Real Estate and Mortgage Overview in Area Code 772
| Characteristic | Without Mortgage | With Mortgage |
| Housing Units | 100,421 | 105,376 |
| Median Property Value | $7,904,600 | $9,365,400 |
| Median Household Income | $1,830,279 | $21,937 |
| Monthly Housing Costs | $18,188 | $10,289 |
| Real Estate Taxes | $68,028 | $2,559 |
Property Value by Mortgage Status in Area Code 772
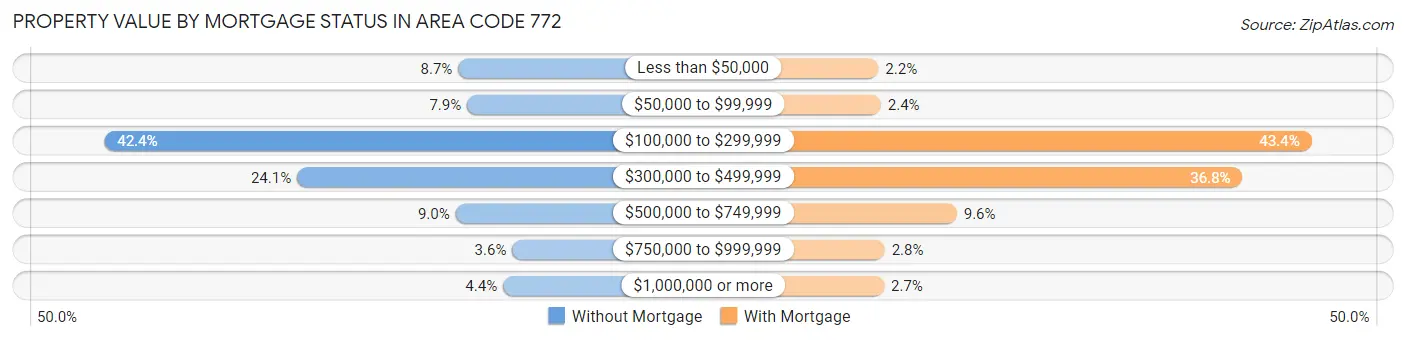
| Property Value | Without Mortgage | With Mortgage |
| Less than $50,000 | 8,744 (8.7%) | 2,300 (2.2%) |
| $50,000 to $99,999 | 7,896 (7.9%) | 2,542 (2.4%) |
| $100,000 to $299,999 | 42,586 (42.4%) | 45,762 (43.4%) |
| $300,000 to $499,999 | 24,158 (24.1%) | 38,821 (36.8%) |
| $500,000 to $749,999 | 9,001 (9.0%) | 10,162 (9.6%) |
| $750,000 to $999,999 | 3,580 (3.6%) | 2,926 (2.8%) |
| $1,000,000 or more | 4,456 (4.4%) | 2,863 (2.7%) |
| Total | 100,421 (100.0%) | 105,376 (100.0%) |
Household Income by Mortgage Status in Area Code 772
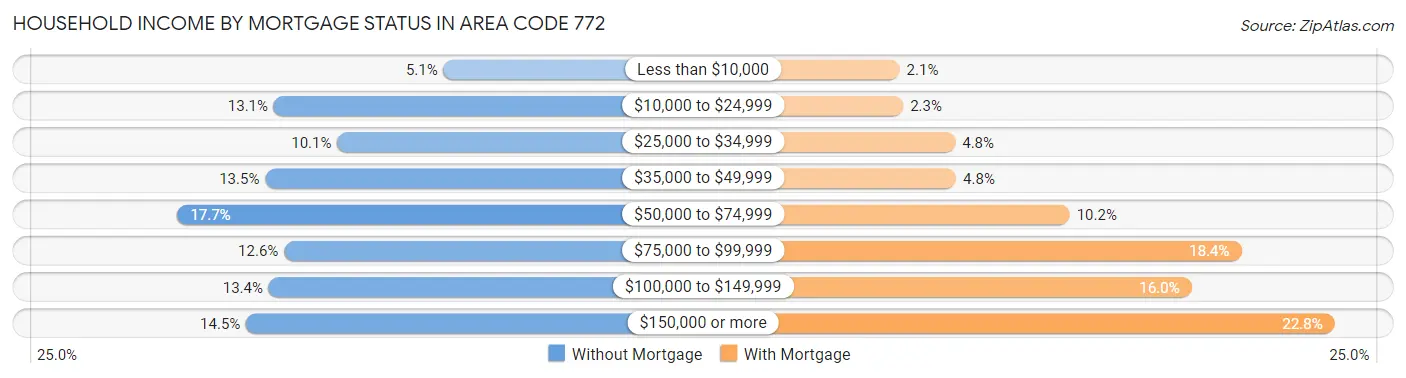
| Household Income | Without Mortgage | With Mortgage |
| Less than $10,000 | 5,069 (5.1%) | 2,218 (2.1%) |
| $10,000 to $24,999 | 13,189 (13.1%) | 2,396 (2.3%) |
| $25,000 to $34,999 | 10,149 (10.1%) | 5,002 (4.8%) |
| $35,000 to $49,999 | 13,594 (13.5%) | 5,046 (4.8%) |
| $50,000 to $74,999 | 17,791 (17.7%) | 10,753 (10.2%) |
| $75,000 to $99,999 | 12,691 (12.6%) | 19,353 (18.4%) |
| $100,000 to $149,999 | 13,423 (13.4%) | 16,858 (16.0%) |
| $150,000 or more | 14,515 (14.4%) | 24,031 (22.8%) |
| Total | 100,421 (100.0%) | 105,376 (100.0%) |
Property Value to Household Income Ratio in Area Code 772
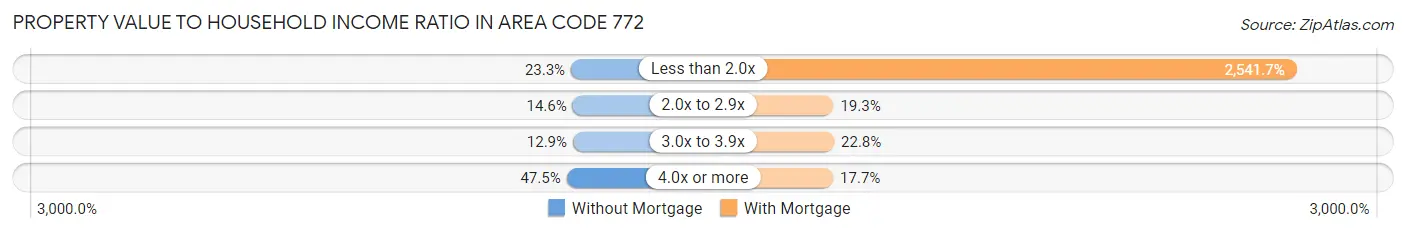
| Value-to-Income Ratio | Without Mortgage | With Mortgage |
| Less than 2.0x | 23,443 (23.3%) | 2,678,335 (2,541.7%) |
| 2.0x to 2.9x | 14,626 (14.6%) | 20,373 (19.3%) |
| 3.0x to 3.9x | 12,902 (12.9%) | 24,068 (22.8%) |
| 4.0x or more | 47,685 (47.5%) | 18,657 (17.7%) |
| Total | 100,421 (100.0%) | 105,376 (100.0%) |
Real Estate Taxes by Mortgage Status in Area Code 772
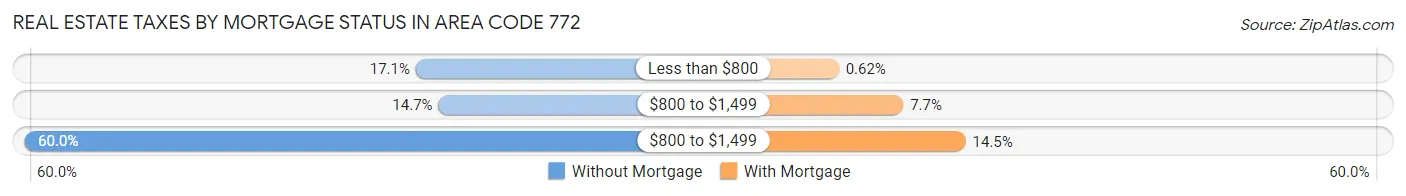
| Property Taxes | Without Mortgage | With Mortgage |
| Less than $800 | 17,205 (17.1%) | 652 (0.6%) |
| $800 to $1,499 | 14,716 (14.6%) | 8,105 (7.7%) |
| $800 to $1,499 | 60,205 (60.0%) | 15,299 (14.5%) |
| Total | 100,421 (100.0%) | 105,376 (100.0%) |
Health & Disability in Area Code 772
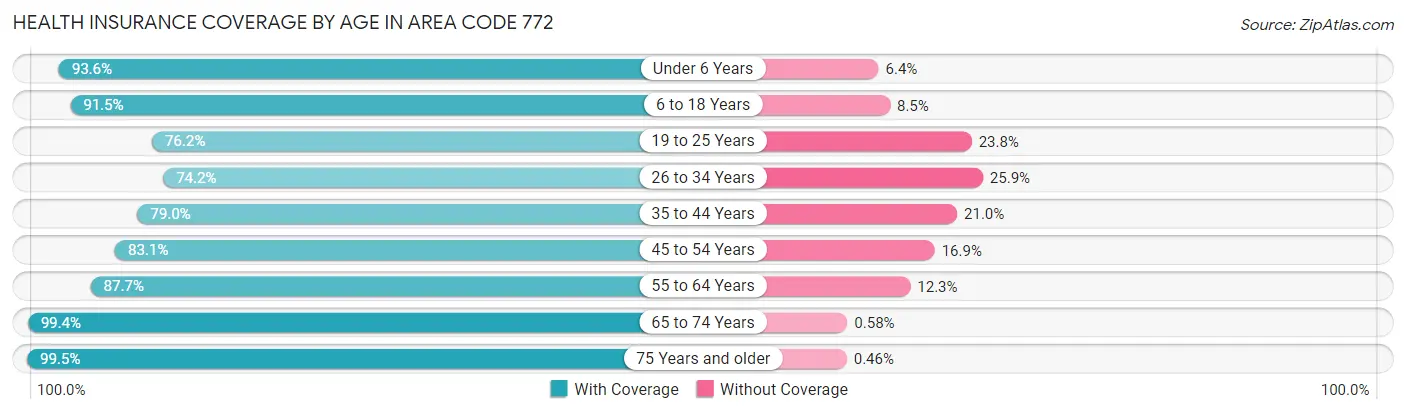
Health Insurance Coverage by Age in Area Code 772
| Age Bracket | With Coverage | Without Coverage |
| Under 6 Years | 32,525 (93.6%) | 2,219 (6.4%) |
| 6 to 18 Years | 79,772 (91.5%) | 7,441 (8.5%) |
| 19 to 25 Years | 33,442 (76.2%) | 10,423 (23.8%) |
| 26 to 34 Years | 43,503 (74.2%) | 15,163 (25.9%) |
| 35 to 44 Years | 52,114 (79.0%) | 13,887 (21.0%) |
| 45 to 54 Years | 62,352 (83.1%) | 12,652 (16.9%) |
| 55 to 64 Years | 85,621 (87.7%) | 12,028 (12.3%) |
| 65 to 74 Years | 98,668 (99.4%) | 578 (0.6%) |
| 75 Years and older | 86,804 (99.5%) | 397 (0.5%) |
| Total | 574,801 (88.5%) | 74,788 (11.5%) |
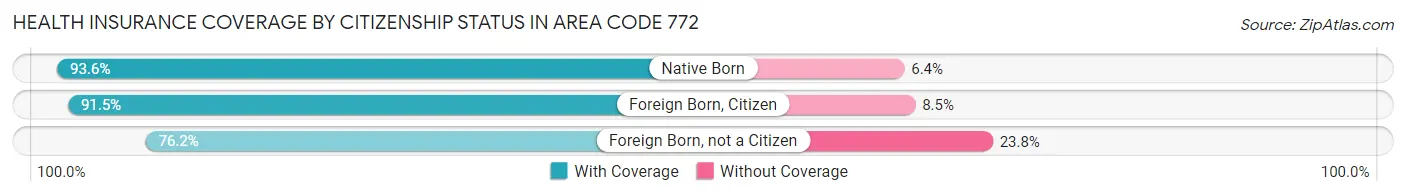
Health Insurance Coverage by Citizenship Status in Area Code 772
| Citizenship Status | With Coverage | Without Coverage |
| Native Born | 32,525 (93.6%) | 2,219 (6.4%) |
| Foreign Born, Citizen | 79,772 (91.5%) | 7,441 (8.5%) |
| Foreign Born, not a Citizen | 33,442 (76.2%) | 10,423 (23.8%) |
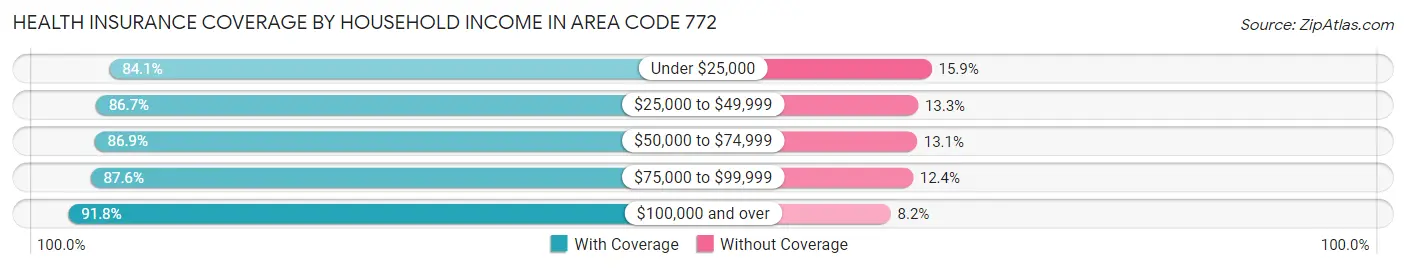
Health Insurance Coverage by Household Income in Area Code 772
| Household Income | With Coverage | Without Coverage |
| Under $25,000 | 58,374 (84.1%) | 11,023 (15.9%) |
| $25,000 to $49,999 | 100,143 (86.7%) | 15,401 (13.3%) |
| $50,000 to $74,999 | 103,040 (86.9%) | 15,564 (13.1%) |
| $75,000 to $99,999 | 86,881 (87.6%) | 12,268 (12.4%) |
| $100,000 and over | 224,684 (91.8%) | 20,105 (8.2%) |
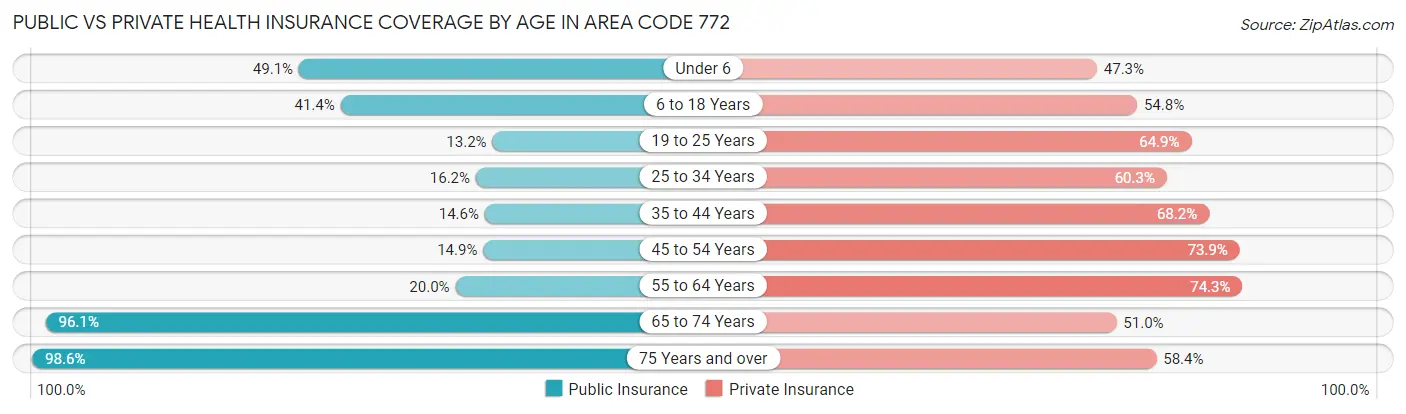
Public vs Private Health Insurance Coverage by Age in Area Code 772
| Age Bracket | Public Insurance | Private Insurance |
| Under 6 | 17,055 (49.1%) | 16,449 (47.3%) |
| 6 to 18 Years | 36,069 (41.4%) | 47,788 (54.8%) |
| 19 to 25 Years | 5,778 (13.2%) | 28,454 (64.9%) |
| 25 to 34 Years | 9,526 (16.2%) | 35,383 (60.3%) |
| 35 to 44 Years | 9,620 (14.6%) | 44,986 (68.2%) |
| 45 to 54 Years | 11,150 (14.9%) | 55,388 (73.9%) |
| 55 to 64 Years | 19,568 (20.0%) | 72,588 (74.3%) |
| 65 to 74 Years | 95,383 (96.1%) | 50,585 (51.0%) |
| 75 Years and over | 85,972 (98.6%) | 50,904 (58.4%) |
| Total | 290,121 (44.7%) | 402,525 (62.0%) |
Disability Status by Sex by Age in Area Code 772
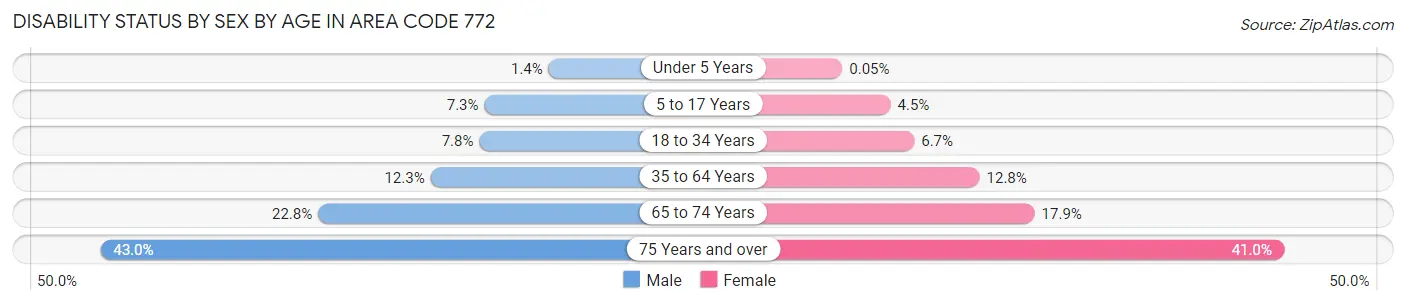
| Age Bracket | Male | Female |
| Under 5 Years | 202 (1.4%) | 7 (0.1%) |
| 5 to 17 Years | 3,265 (7.3%) | 1,906 (4.5%) |
| 18 to 34 Years | 4,358 (7.8%) | 3,581 (6.7%) |
| 35 to 64 Years | 14,213 (12.3%) | 15,781 (12.8%) |
| 65 to 74 Years | 10,600 (22.8%) | 9,430 (17.9%) |
| 75 Years and over | 17,438 (43.0%) | 19,121 (41.0%) |
Disability Class by Sex by Age in Area Code 772
Disability Class: Hearing Difficulty
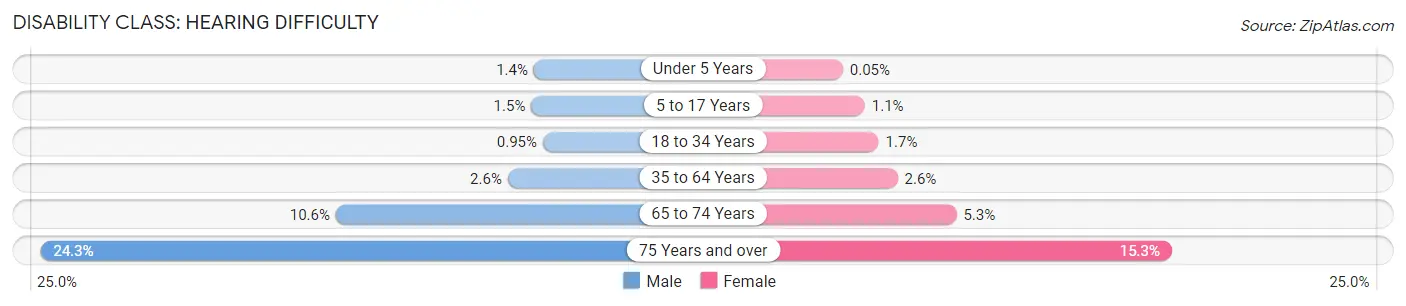
| Age Bracket | Male | Female |
| Under 5 Years | 202 (1.4%) | 7 (0.1%) |
| 5 to 17 Years | 666 (1.5%) | 451 (1.1%) |
| 18 to 34 Years | 532 (0.9%) | 909 (1.7%) |
| 35 to 64 Years | 2,976 (2.6%) | 3,191 (2.6%) |
| 65 to 74 Years | 4,916 (10.6%) | 2,804 (5.3%) |
| 75 Years and over | 9,847 (24.3%) | 7,137 (15.3%) |
Disability Class: Vision Difficulty
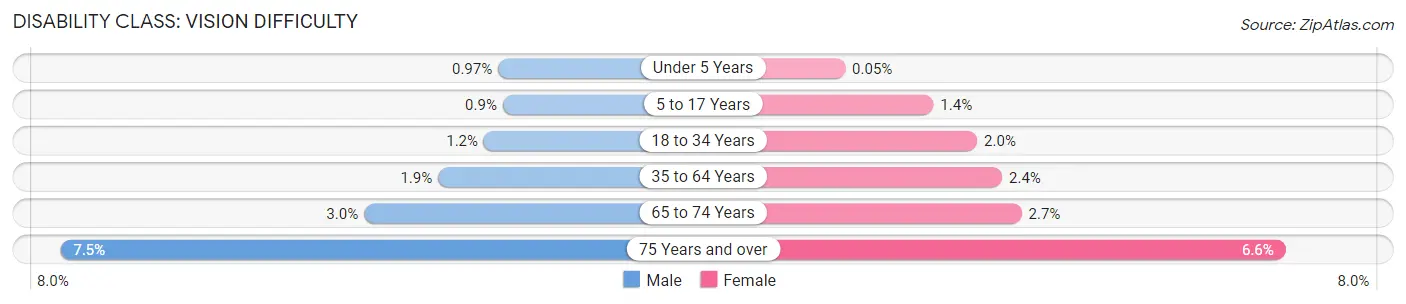
| Age Bracket | Male | Female |
| Under 5 Years | 143 (1.0%) | 7 (0.1%) |
| 5 to 17 Years | 400 (0.9%) | 571 (1.4%) |
| 18 to 34 Years | 662 (1.2%) | 1,067 (2.0%) |
| 35 to 64 Years | 2,140 (1.9%) | 2,933 (2.4%) |
| 65 to 74 Years | 1,376 (3.0%) | 1,407 (2.7%) |
| 75 Years and over | 3,032 (7.5%) | 3,071 (6.6%) |
Disability Class: Cognitive Difficulty
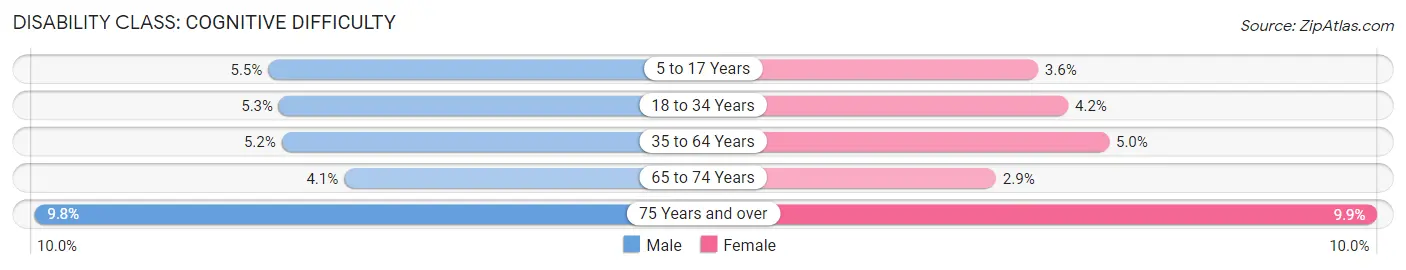
| Age Bracket | Male | Female |
| 5 to 17 Years | 2,442 (5.5%) | 1,531 (3.6%) |
| 18 to 34 Years | 2,948 (5.3%) | 2,234 (4.2%) |
| 35 to 64 Years | 6,032 (5.2%) | 6,120 (5.0%) |
| 65 to 74 Years | 1,896 (4.1%) | 1,506 (2.9%) |
| 75 Years and over | 3,985 (9.8%) | 4,636 (9.9%) |
Disability Class: Ambulatory Difficulty
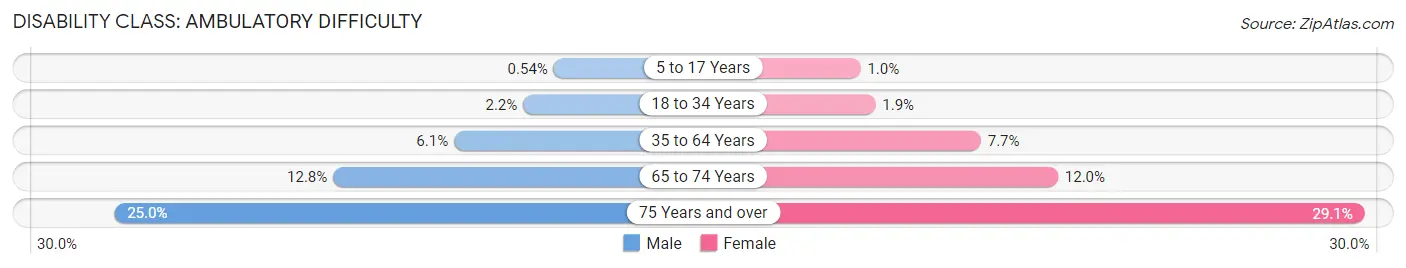
| Age Bracket | Male | Female |
| 5 to 17 Years | 239 (0.5%) | 437 (1.0%) |
| 18 to 34 Years | 1,254 (2.2%) | 993 (1.9%) |
| 35 to 64 Years | 7,024 (6.1%) | 9,550 (7.7%) |
| 65 to 74 Years | 5,969 (12.8%) | 6,337 (12.0%) |
| 75 Years and over | 10,150 (25.0%) | 13,571 (29.1%) |
Disability Class: Self-Care Difficulty
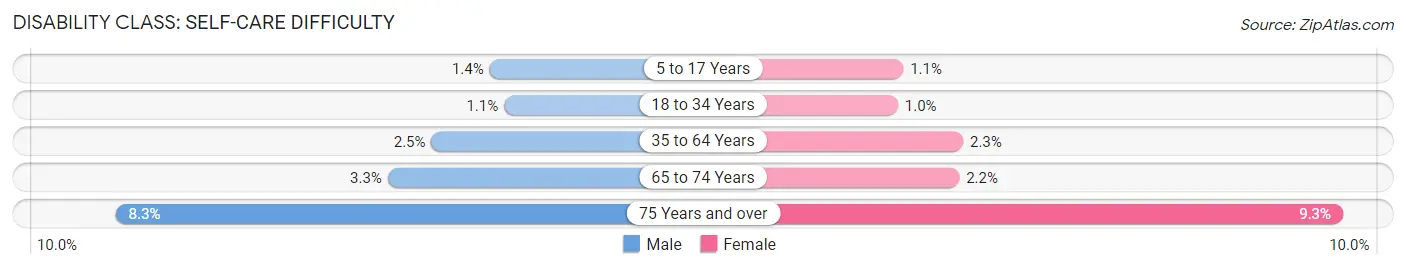
| Age Bracket | Male | Female |
| 5 to 17 Years | 610 (1.4%) | 479 (1.1%) |
| 18 to 34 Years | 616 (1.1%) | 552 (1.0%) |
| 35 to 64 Years | 2,818 (2.5%) | 2,772 (2.2%) |
| 65 to 74 Years | 1,517 (3.3%) | 1,148 (2.2%) |
| 75 Years and over | 3,373 (8.3%) | 4,337 (9.3%) |
Technology Access in Area Code 772
Computing Device Access in Area Code 772
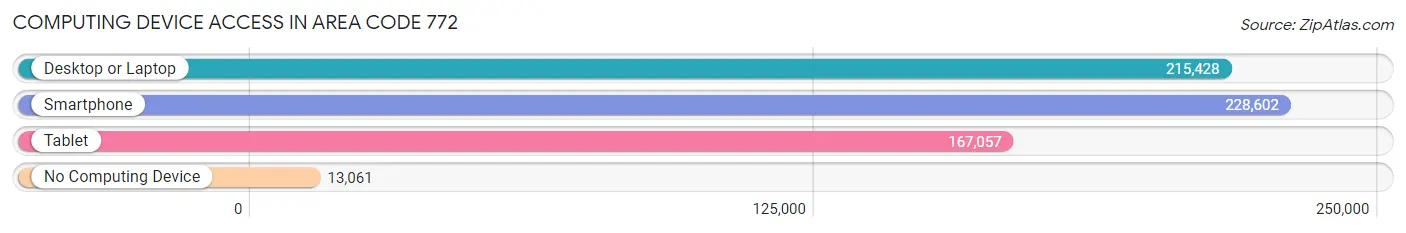
| Device Type | # Households | % Households |
| Desktop or Laptop | 215,428 | 82.6% |
| Smartphone | 228,602 | 87.6% |
| Tablet | 167,057 | 64.0% |
| No Computing Device | 13,061 | 5.0% |
| Total | 260,959 | 100.0% |
Internet Access in Area Code 772
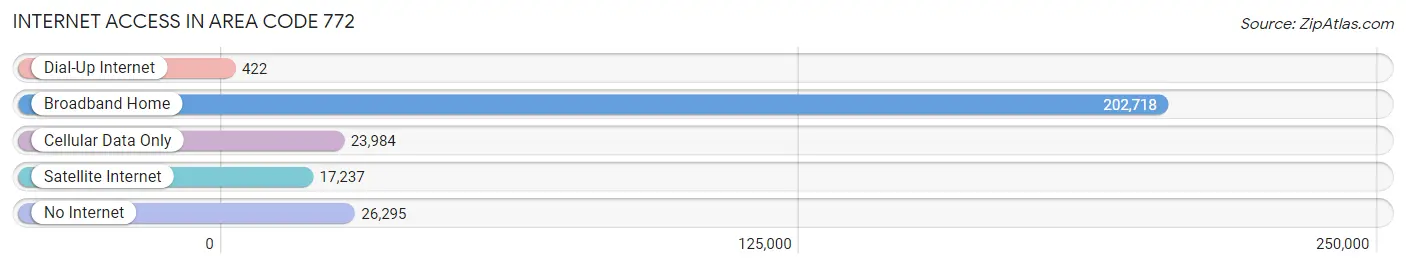
| Internet Type | # Households | % Households |
| Dial-Up Internet | 422 | 0.2% |
| Broadband Home | 202,718 | 77.7% |
| Cellular Data Only | 23,984 | 9.2% |
| Satellite Internet | 17,237 | 6.6% |
| No Internet | 26,295 | 10.1% |
| Total | 260,959 | 100.0% |
Area Code 772 Summary
Geography
Area code 772 is located in the eastern part of Florida, covering the Treasure Coast region. It includes the cities of Port St. Lucie, Fort Pierce, Vero Beach, Stuart, and Sebastian.
Social
The area code 772 region is known for its beautiful beaches, fishing, and outdoor activities. It is a popular tourist destination, with many people visiting the area for its natural beauty and recreational activities.
Economics
The economy of the area code 772 region is largely based on tourism, with many businesses catering to visitors. There are also a number of manufacturing and technology companies in the area, as well as a growing number of startups.
Demographics
The population of the area code 772 region is largely white, with a significant Hispanic population. The median household income is slightly lower than the national average, and the poverty rate is slightly higher.
Common Questions
What is Per Capita Income in Area Code 772?
Per Capita income in Area Code 772 is $39,665.
What is the Median Family Income in Area Code 772?
Median Family Income in Area Code 772 is $81,704.
What is the Median Household income in Area Code 772?
Median Household Income in Area Code 772 is $67,637.
What is Income or Wage Gap in Area Code 772?
Income or Wage Gap in Area Code 772 is 26.6%.
Women in Area Code 772 earn 73.4 cents for every dollar earned by a man.
What is Family Income Deficit in Area Code 772?
Family Income Deficit in Area Code 772 is $10,867.
Families that are below poverty line in Area Code 772 earn $10,867 less on average than the poverty threshold level.
What is Inequality or Gini Index in Area Code 772?
Inequality or Gini Index in Area Code 772 is 13.65.
What is the Total Population of Area Code 772?
Total Population of Area Code 772 is 657,288.
What is the Total Male Population of Area Code 772?
Total Male Population of Area Code 772 is 322,797.
What is the Total Female Population of Area Code 772?
Total Female Population of Area Code 772 is 334,491.
What is the Ratio of Males per 100 Females in Area Code 772?
There are 96.50 Males per 100 Females in Area Code 772.
What is the Ratio of Females per 100 Males in Area Code 772?
There are 103.62 Females per 100 Males in Area Code 772.
What is the Median Population Age in Area Code 772?
Median Population Age in Area Code 772 is 50.4 Years.
What is the Average Family Size in Area Code 772
Average Family Size in Area Code 772 is 3.2 People.
What is the Average Household Size in Area Code 772
Average Household Size in Area Code 772 is 2.6 People.
How Large is the Labor Force in Area Code 772?
There are 284,256 People in the Labor Forcein in Area Code 772.
What is the Percentage of People in the Labor Force in Area Code 772?
51.2% of People are in the Labor Force in Area Code 772.
What is the Unemployment Rate in Area Code 772?
Unemployment Rate in Area Code 772 is 5.8%.