Marion County, FL Map & Demographics
Marion County Map
Marion County Overview
$31,086
PER CAPITA INCOME
$66,666
AVG FAMILY INCOME
$55,265
AVG HOUSEHOLD INCOME
20.5%
WAGE / INCOME GAP [ % ]
79.5¢/ $1
WAGE / INCOME GAP [ $ ]
$10,351
FAMILY INCOME DEFICIT
0.45
INEQUALITY / GINI INDEX
378,225
TOTAL POPULATION
182,704
MALE POPULATION
195,521
FEMALE POPULATION
93.44
MALES / 100 FEMALES
107.02
FEMALES / 100 MALES
48.5
MEDIAN AGE
2.9
AVG FAMILY SIZE
2.4
AVG HOUSEHOLD SIZE
151,558
LABOR FORCE [ PEOPLE ]
47.9%
PERCENT IN LABOR FORCE
5.9%
UNEMPLOYMENT RATE
Marion County Area Codes
Income in Marion County
Income Overview in Marion County
Per Capita Income in Marion County is $31,086, while median incomes of families and households are $66,666 and $55,265 respectively.
| Characteristic | Number | Measure |
| Per Capita Income | 378,225 | $31,086 |
| Median Family Income | 101,086 | $66,666 |
| Mean Family Income | 101,086 | $85,521 |
| Median Household Income | 154,996 | $55,265 |
| Mean Household Income | 154,996 | $73,931 |
| Income Deficit | 101,086 | $10,351 |
| Wage / Income Gap (%) | 378,225 | 20.49% |
| Wage / Income Gap ($) | 378,225 | 79.51¢ per $1 |
| Gini / Inequality Index | 378,225 | 0.45 |
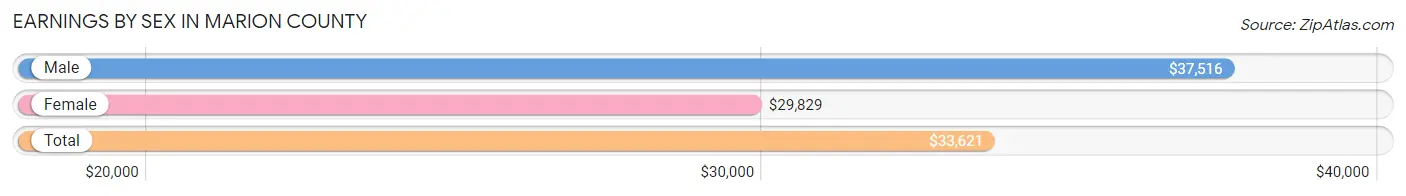
Earnings by Sex in Marion County
Average Earnings in Marion County are $33,621, $37,516 for men and $29,829 for women, a difference of 20.5%.
| Sex | Number | Average Earnings |
| Male | 80,159 (51.3%) | $37,516 |
| Female | 76,037 (48.7%) | $29,829 |
| Total | 156,196 (100.0%) | $33,621 |
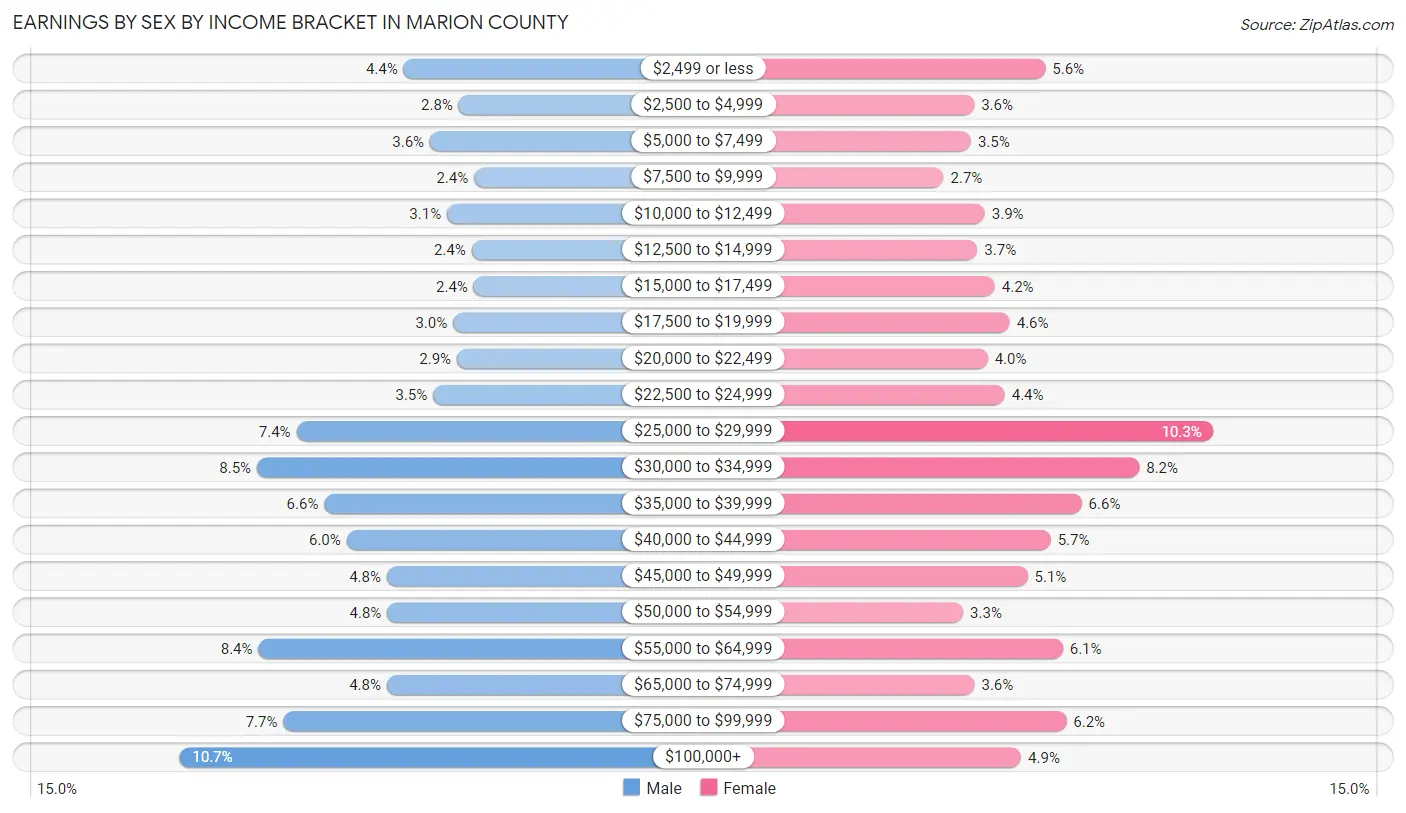
Earnings by Sex by Income Bracket in Marion County
The most common earnings brackets in Marion County are $100,000+ for men (8,533 | 10.6%) and $25,000 to $29,999 for women (7,837 | 10.3%).
| Income | Male | Female |
| $2,499 or less | 3,483 (4.3%) | 4,244 (5.6%) |
| $2,500 to $4,999 | 2,241 (2.8%) | 2,725 (3.6%) |
| $5,000 to $7,499 | 2,891 (3.6%) | 2,653 (3.5%) |
| $7,500 to $9,999 | 1,901 (2.4%) | 2,071 (2.7%) |
| $10,000 to $12,499 | 2,506 (3.1%) | 2,951 (3.9%) |
| $12,500 to $14,999 | 1,957 (2.4%) | 2,790 (3.7%) |
| $15,000 to $17,499 | 1,909 (2.4%) | 3,163 (4.2%) |
| $17,500 to $19,999 | 2,370 (3.0%) | 3,480 (4.6%) |
| $20,000 to $22,499 | 2,283 (2.9%) | 3,009 (4.0%) |
| $22,500 to $24,999 | 2,818 (3.5%) | 3,378 (4.4%) |
| $25,000 to $29,999 | 5,900 (7.4%) | 7,837 (10.3%) |
| $30,000 to $34,999 | 6,790 (8.5%) | 6,249 (8.2%) |
| $35,000 to $39,999 | 5,271 (6.6%) | 5,021 (6.6%) |
| $40,000 to $44,999 | 4,773 (5.9%) | 4,354 (5.7%) |
| $45,000 to $49,999 | 3,865 (4.8%) | 3,860 (5.1%) |
| $50,000 to $54,999 | 3,852 (4.8%) | 2,483 (3.3%) |
| $55,000 to $64,999 | 6,760 (8.4%) | 4,619 (6.1%) |
| $65,000 to $74,999 | 3,862 (4.8%) | 2,733 (3.6%) |
| $75,000 to $99,999 | 6,194 (7.7%) | 4,692 (6.2%) |
| $100,000+ | 8,533 (10.6%) | 3,725 (4.9%) |
| Total | 80,159 (100.0%) | 76,037 (100.0%) |
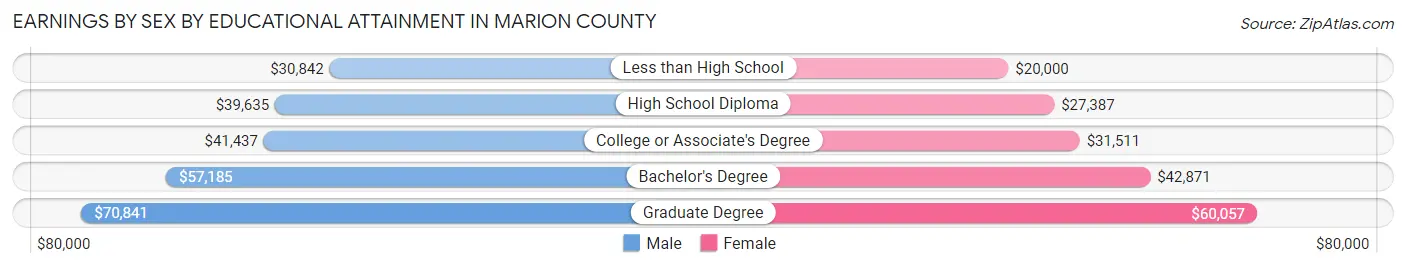
Earnings by Sex by Educational Attainment in Marion County
Average earnings in Marion County are $41,557 for men and $32,343 for women, a difference of 22.2%. Men with an educational attainment of graduate degree enjoy the highest average annual earnings of $70,841, while those with less than high school education earn the least with $30,842. Women with an educational attainment of graduate degree earn the most with the average annual earnings of $60,057, while those with less than high school education have the smallest earnings of $20,000.
| Educational Attainment | Male Income | Female Income |
| Less than High School | $30,842 | $20,000 |
| High School Diploma | $39,635 | $27,387 |
| College or Associate's Degree | $41,437 | $31,511 |
| Bachelor's Degree | $57,185 | $42,871 |
| Graduate Degree | $70,841 | $60,057 |
| Total | $41,557 | $32,343 |
Family Income in Marion County
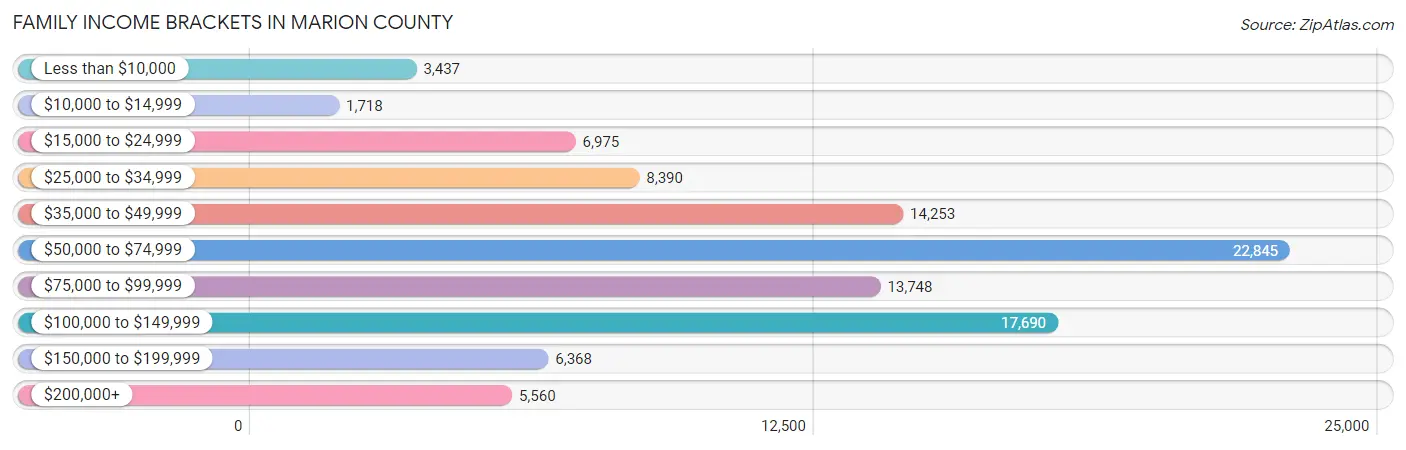
Family Income Brackets in Marion County
According to the Marion County family income data, there are 22,845 families falling into the $50,000 to $74,999 income range, which is the most common income bracket and makes up 22.6% of all families. Conversely, the $10,000 to $14,999 income bracket is the least frequent group with only 1,718 families (1.7%) belonging to this category.
| Income Bracket | # Families | % Families |
| Less than $10,000 | 3,437 | 3.4% |
| $10,000 to $14,999 | 1,718 | 1.7% |
| $15,000 to $24,999 | 6,975 | 6.9% |
| $25,000 to $34,999 | 8,390 | 8.3% |
| $35,000 to $49,999 | 14,253 | 14.1% |
| $50,000 to $74,999 | 22,845 | 22.6% |
| $75,000 to $99,999 | 13,748 | 13.6% |
| $100,000 to $149,999 | 17,690 | 17.5% |
| $150,000 to $199,999 | 6,368 | 6.3% |
| $200,000+ | 5,560 | 5.5% |
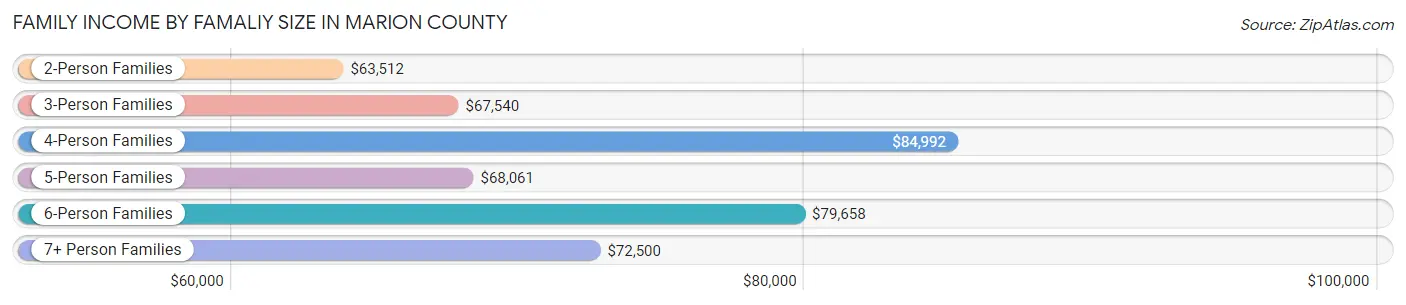
Family Income by Famaliy Size in Marion County
4-person families (12,883 | 12.7%) account for the highest median family income in Marion County with $84,992 per family, while 2-person families (59,811 | 59.2%) have the highest median income of $31,756 per family member.
| Income Bracket | # Families | Median Income |
| 2-Person Families | 59,811 (59.2%) | $63,512 |
| 3-Person Families | 19,240 (19.0%) | $67,540 |
| 4-Person Families | 12,883 (12.7%) | $84,992 |
| 5-Person Families | 5,320 (5.3%) | $68,061 |
| 6-Person Families | 2,298 (2.3%) | $79,658 |
| 7+ Person Families | 1,534 (1.5%) | $72,500 |
| Total | 101,086 (100.0%) | $66,666 |
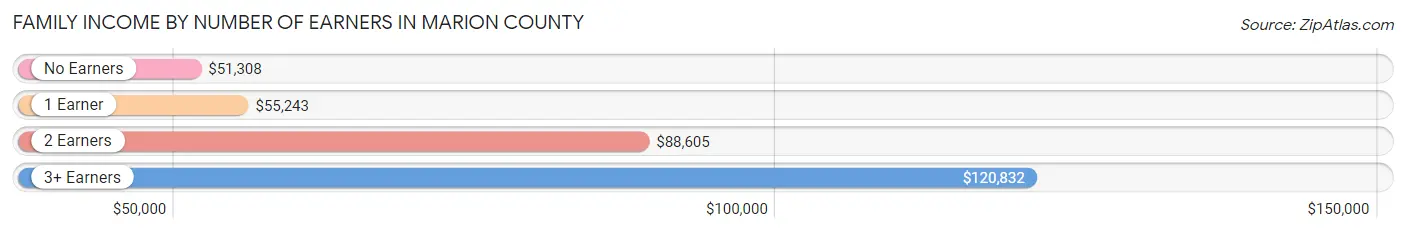
Family Income by Number of Earners in Marion County
The median family income in Marion County is $66,666, with families comprising 3+ earners (7,383) having the highest median family income of $120,832, while families with no earners (30,664) have the lowest median family income of $51,308, accounting for 7.3% and 30.3% of families, respectively.
| Number of Earners | # Families | Median Income |
| No Earners | 30,664 (30.3%) | $51,308 |
| 1 Earner | 32,838 (32.5%) | $55,243 |
| 2 Earners | 30,201 (29.9%) | $88,605 |
| 3+ Earners | 7,383 (7.3%) | $120,832 |
| Total | 101,086 (100.0%) | $66,666 |
Household Income in Marion County
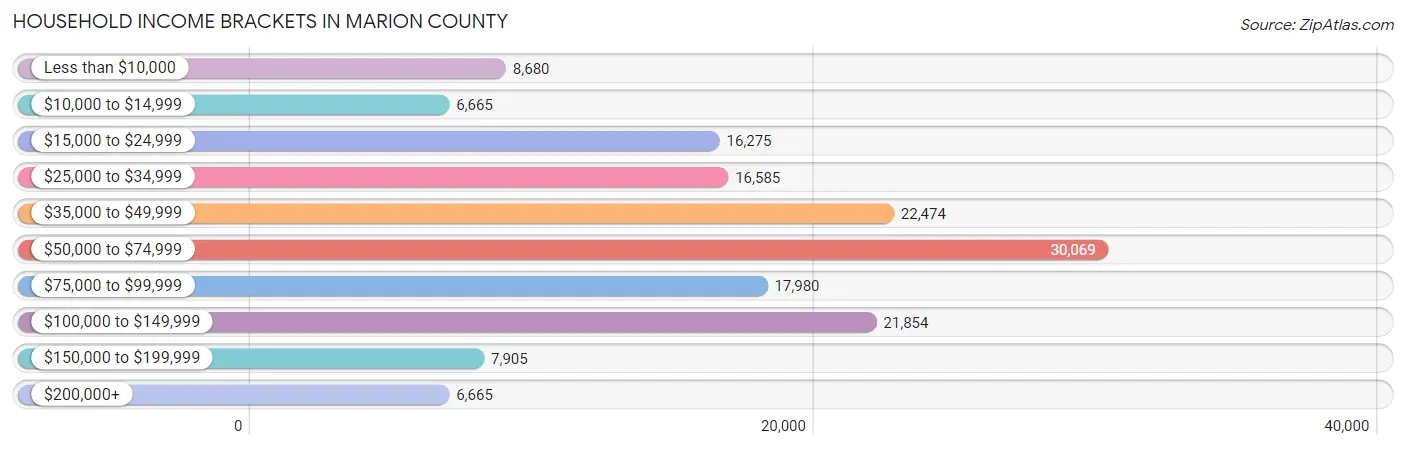
Household Income Brackets in Marion County
With 30,069 households falling in the category, the $50,000 to $74,999 income range is the most frequent in Marion County, accounting for 19.4% of all households. In contrast, only 6,665 households (4.3%) fall into the $10,000 to $14,999 income bracket, making it the least populous group.
| Income Bracket | # Households | % Households |
| Less than $10,000 | 8,680 | 5.6% |
| $10,000 to $14,999 | 6,665 | 4.3% |
| $15,000 to $24,999 | 16,275 | 10.5% |
| $25,000 to $34,999 | 16,585 | 10.7% |
| $35,000 to $49,999 | 22,474 | 14.5% |
| $50,000 to $74,999 | 30,069 | 19.4% |
| $75,000 to $99,999 | 17,980 | 11.6% |
| $100,000 to $149,999 | 21,854 | 14.1% |
| $150,000 to $199,999 | 7,905 | 5.1% |
| $200,000+ | 6,665 | 4.3% |
Household Income by Householder Age in Marion County
The median household income in Marion County is $55,265, with the highest median household income of $65,186 found in the 45 to 64 years age bracket for the primary householder. A total of 51,000 households (32.9%) fall into this category. Meanwhile, the 15 to 24 years age bracket for the primary householder has the lowest median household income of $46,225, with 3,417 households (2.2%) in this group.
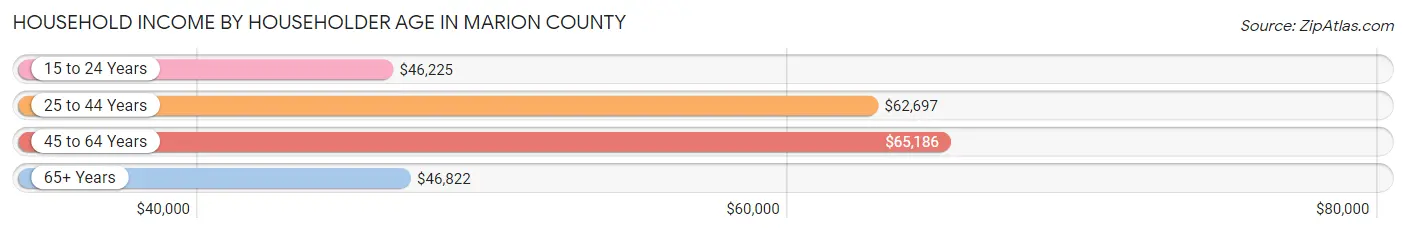
| Income Bracket | # Households | Median Income |
| 15 to 24 Years | 3,417 (2.2%) | $46,225 |
| 25 to 44 Years | 33,623 (21.7%) | $62,697 |
| 45 to 64 Years | 51,000 (32.9%) | $65,186 |
| 65+ Years | 66,956 (43.2%) | $46,822 |
| Total | 154,996 (100.0%) | $55,265 |
Poverty in Marion County
Income Below Poverty by Sex and Age in Marion County
With 13.3% poverty level for males and 15.4% for females among the residents of Marion County, 15 year old males and 15 year old females are the most vulnerable to poverty, with 577 males (26.0%) and 375 females (23.4%) in their respective age groups living below the poverty level.
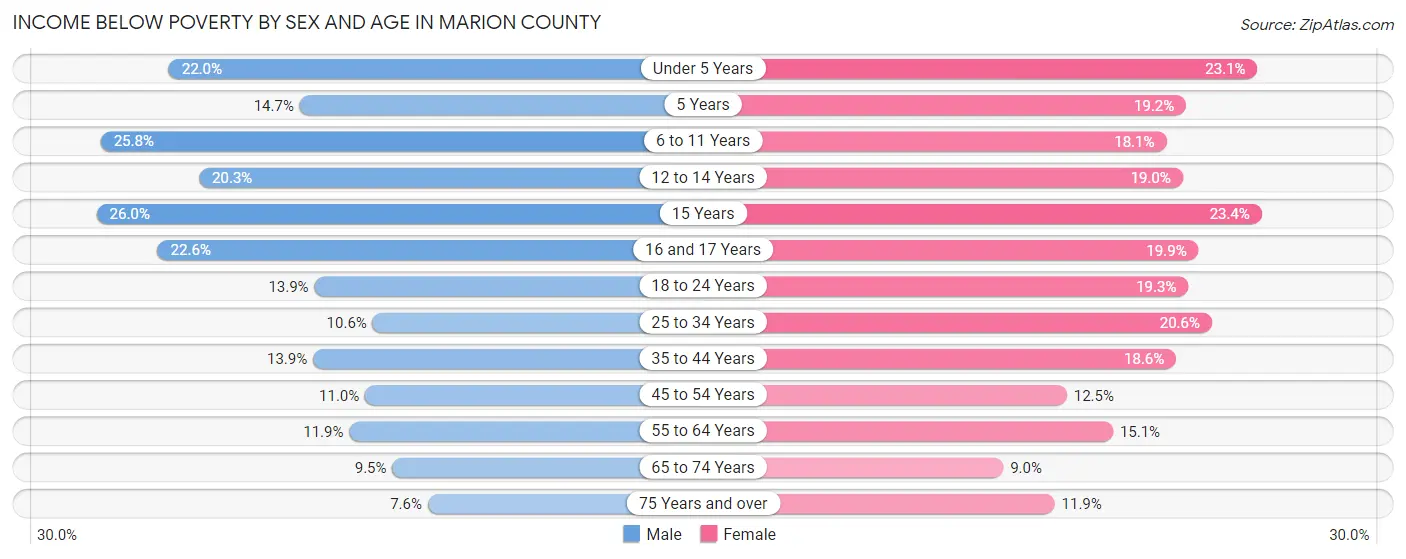
| Age Bracket | Male | Female |
| Under 5 Years | 1,937 (22.0%) | 1,944 (23.1%) |
| 5 Years | 276 (14.7%) | 263 (19.2%) |
| 6 to 11 Years | 2,895 (25.8%) | 2,055 (18.1%) |
| 12 to 14 Years | 1,410 (20.3%) | 1,187 (19.0%) |
| 15 Years | 577 (26.0%) | 375 (23.4%) |
| 16 and 17 Years | 917 (22.6%) | 901 (19.9%) |
| 18 to 24 Years | 1,798 (13.9%) | 2,365 (19.3%) |
| 25 to 34 Years | 2,071 (10.6%) | 4,040 (20.6%) |
| 35 to 44 Years | 2,491 (13.9%) | 3,432 (18.6%) |
| 45 to 54 Years | 2,140 (11.0%) | 2,645 (12.5%) |
| 55 to 64 Years | 2,822 (11.9%) | 4,152 (15.1%) |
| 65 to 74 Years | 2,536 (9.5%) | 2,809 (9.0%) |
| 75 Years and over | 1,726 (7.5%) | 3,159 (11.8%) |
| Total | 23,596 (13.3%) | 29,327 (15.4%) |
Income Above Poverty by Sex and Age in Marion County
According to the poverty statistics in Marion County, males aged 75 years and over and females aged 65 to 74 years are the age groups that are most secure financially, with 92.4% of males and 91.0% of females in these age groups living above the poverty line.
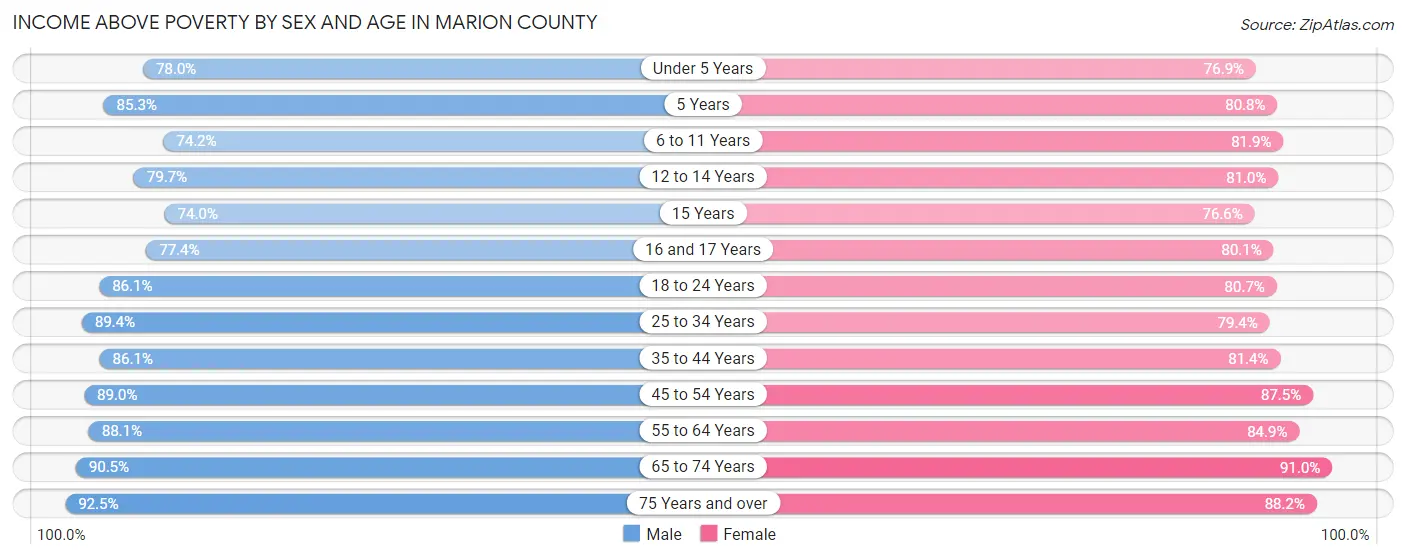
| Age Bracket | Male | Female |
| Under 5 Years | 6,881 (78.0%) | 6,458 (76.9%) |
| 5 Years | 1,604 (85.3%) | 1,109 (80.8%) |
| 6 to 11 Years | 8,345 (74.2%) | 9,318 (81.9%) |
| 12 to 14 Years | 5,540 (79.7%) | 5,068 (81.0%) |
| 15 Years | 1,643 (74.0%) | 1,229 (76.6%) |
| 16 and 17 Years | 3,143 (77.4%) | 3,636 (80.1%) |
| 18 to 24 Years | 11,171 (86.1%) | 9,898 (80.7%) |
| 25 to 34 Years | 17,437 (89.4%) | 15,569 (79.4%) |
| 35 to 44 Years | 15,373 (86.1%) | 15,009 (81.4%) |
| 45 to 54 Years | 17,247 (89.0%) | 18,472 (87.5%) |
| 55 to 64 Years | 20,845 (88.1%) | 23,350 (84.9%) |
| 65 to 74 Years | 24,104 (90.5%) | 28,433 (91.0%) |
| 75 Years and over | 21,136 (92.4%) | 23,509 (88.1%) |
| Total | 154,469 (86.8%) | 161,058 (84.6%) |
Income Below Poverty Among Married-Couple Families in Marion County
The poverty statistics for married-couple families in Marion County show that 5.7% or 4,292 of the total 75,986 families live below the poverty line. Families with 3 or 4 children have the highest poverty rate of 18.9%, comprising of 714 families. On the other hand, families with no children have the lowest poverty rate of 4.6%, which includes 2,571 families.
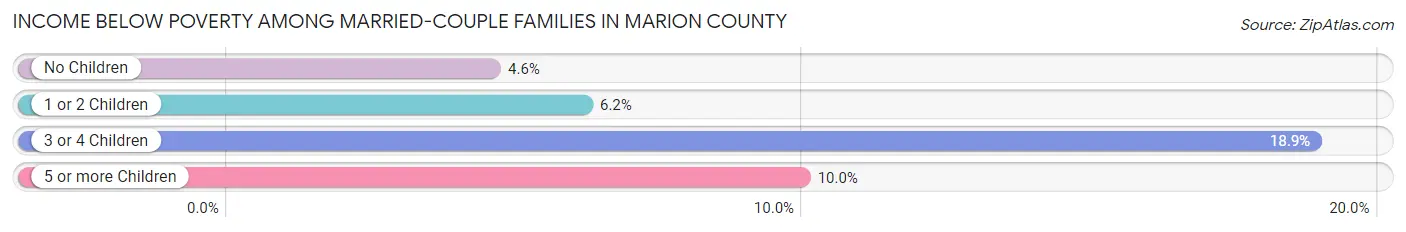
| Children | Above Poverty | Below Poverty |
| No Children | 53,517 (95.4%) | 2,571 (4.6%) |
| 1 or 2 Children | 14,828 (93.8%) | 976 (6.2%) |
| 3 or 4 Children | 3,069 (81.1%) | 714 (18.9%) |
| 5 or more Children | 280 (90.0%) | 31 (10.0%) |
| Total | 71,694 (94.4%) | 4,292 (5.7%) |
Income Below Poverty Among Single-Parent Households in Marion County
According to the poverty data in Marion County, 12.8% or 1,022 single-father households and 26.2% or 4,476 single-mother households are living below the poverty line. Among single-father households, those with 5 or more children have the highest poverty rate, with 12 households (100.0%) experiencing poverty. Likewise, among single-mother households, those with 5 or more children have the highest poverty rate, with 118 households (100.0%) falling below the poverty line.
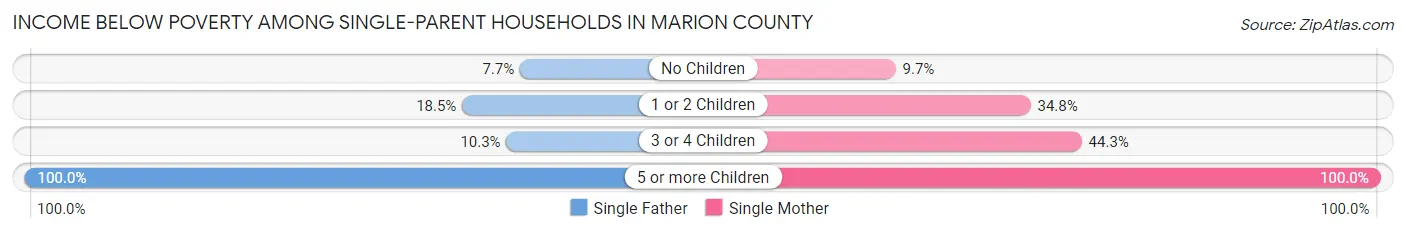
| Children | Single Father | Single Mother |
| No Children | 276 (7.7%) | 685 (9.7%) |
| 1 or 2 Children | 634 (18.5%) | 2,633 (34.8%) |
| 3 or 4 Children | 100 (10.2%) | 1,040 (44.3%) |
| 5 or more Children | 12 (100.0%) | 118 (100.0%) |
| Total | 1,022 (12.8%) | 4,476 (26.2%) |
Income Below Poverty Among Married-Couple vs Single-Parent Households in Marion County
The poverty data for Marion County shows that 4,292 of the married-couple family households (5.7%) and 5,498 of the single-parent households (21.9%) are living below the poverty level. Within the married-couple family households, those with 3 or 4 children have the highest poverty rate, with 714 households (18.9%) falling below the poverty line. Among the single-parent households, those with 5 or more children have the highest poverty rate, with 130 household (100.0%) living below poverty.
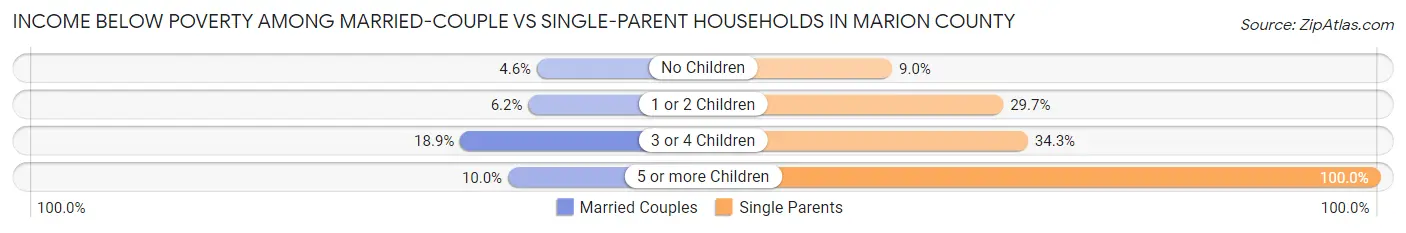
| Children | Married-Couple Families | Single-Parent Households |
| No Children | 2,571 (4.6%) | 961 (9.0%) |
| 1 or 2 Children | 976 (6.2%) | 3,267 (29.7%) |
| 3 or 4 Children | 714 (18.9%) | 1,140 (34.3%) |
| 5 or more Children | 31 (10.0%) | 130 (100.0%) |
| Total | 4,292 (5.7%) | 5,498 (21.9%) |
Race in Marion County
The most populous races in Marion County are White / Caucasian (281,422 | 74.4%), Hispanic or Latino (56,818 | 15.0%), and Black / African American (46,704 | 12.3%).
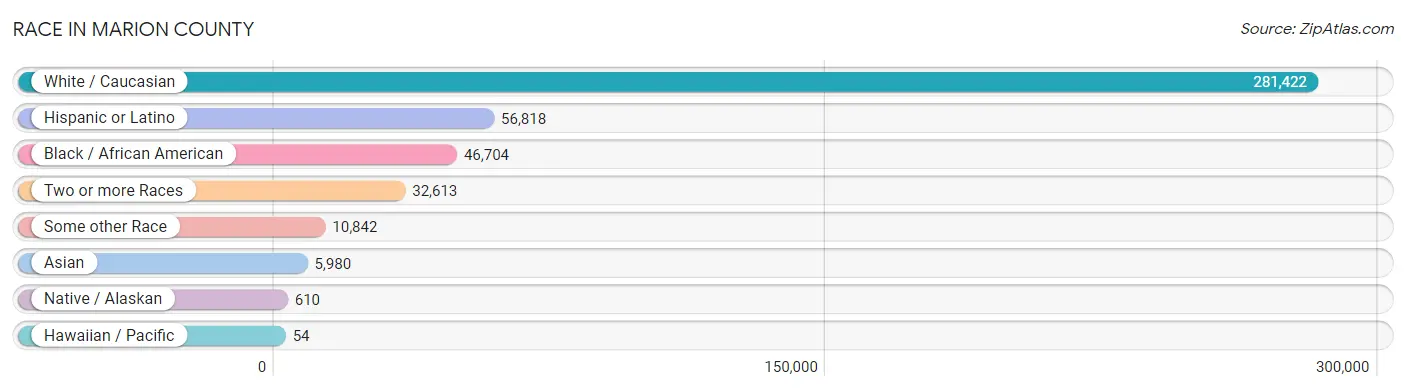
| Race | # Population | % Population |
| Asian | 5,980 | 1.6% |
| Black / African American | 46,704 | 12.3% |
| Hawaiian / Pacific | 54 | 0.0% |
| Hispanic or Latino | 56,818 | 15.0% |
| Native / Alaskan | 610 | 0.2% |
| White / Caucasian | 281,422 | 74.4% |
| Two or more Races | 32,613 | 8.6% |
| Some other Race | 10,842 | 2.9% |
| Total | 378,225 | 100.0% |
Ancestry in Marion County
The most populous ancestries reported in Marion County are German (44,469 | 11.8%), Irish (42,329 | 11.2%), English (38,442 | 10.2%), Puerto Rican (27,121 | 7.2%), and American (23,568 | 6.2%), together accounting for 46.5% of all Marion County residents.
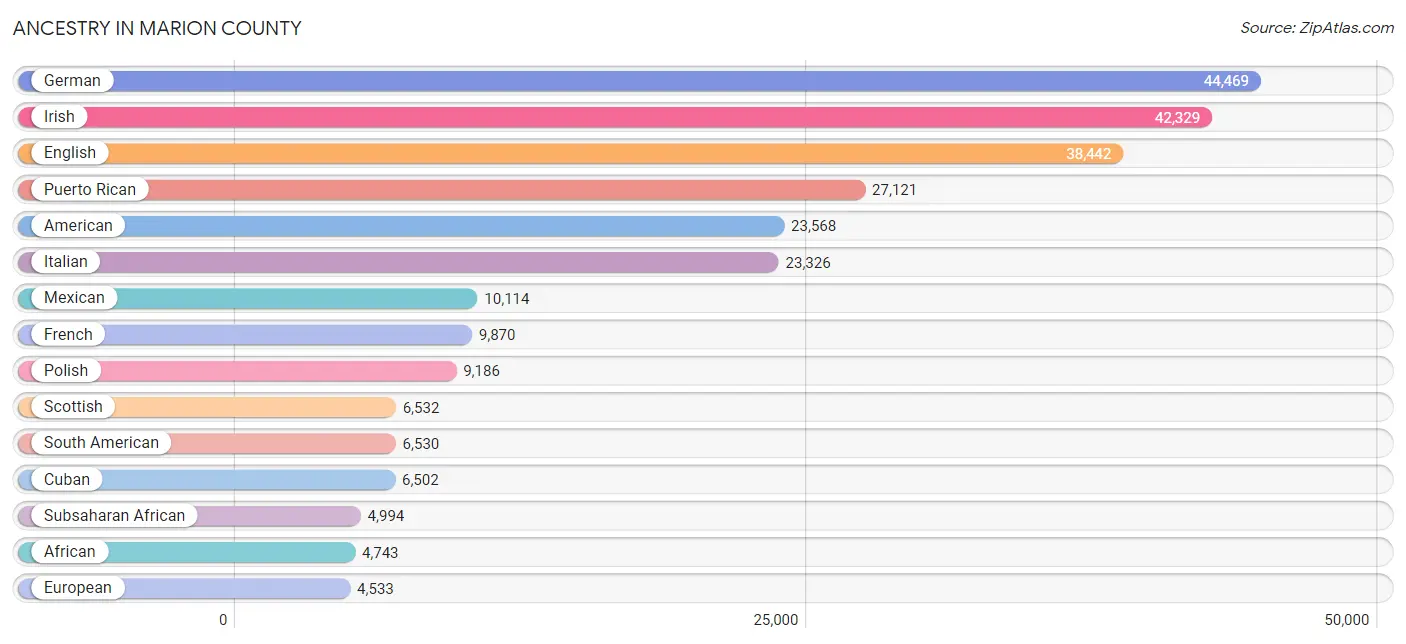
| Ancestry | # Population | % Population |
| Afghan | 15 | 0.0% |
| African | 4,743 | 1.3% |
| Albanian | 26 | 0.0% |
| Alsatian | 1 | 0.0% |
| American | 23,568 | 6.2% |
| Apache | 104 | 0.0% |
| Arab | 652 | 0.2% |
| Arapaho | 7 | 0.0% |
| Argentinean | 364 | 0.1% |
| Armenian | 373 | 0.1% |
| Australian | 99 | 0.0% |
| Austrian | 686 | 0.2% |
| Bahamian | 226 | 0.1% |
| Barbadian | 112 | 0.0% |
| Basque | 9 | 0.0% |
| Belgian | 263 | 0.1% |
| Bermudan | 17 | 0.0% |
| Bhutanese | 966 | 0.3% |
| Blackfeet | 373 | 0.1% |
| Bolivian | 76 | 0.0% |
| Brazilian | 549 | 0.2% |
| British | 1,859 | 0.5% |
| British West Indian | 177 | 0.1% |
| Burmese | 817 | 0.2% |
| Cajun | 26 | 0.0% |
| Canadian | 912 | 0.2% |
| Cape Verdean | 10 | 0.0% |
| Celtic | 35 | 0.0% |
| Central American | 3,085 | 0.8% |
| Central American Indian | 323 | 0.1% |
| Cherokee | 1,420 | 0.4% |
| Chickasaw | 33 | 0.0% |
| Chilean | 329 | 0.1% |
| Chippewa | 25 | 0.0% |
| Choctaw | 68 | 0.0% |
| Colombian | 2,994 | 0.8% |
| Comanche | 14 | 0.0% |
| Costa Rican | 136 | 0.0% |
| Creek | 91 | 0.0% |
| Croatian | 303 | 0.1% |
| Crow | 43 | 0.0% |
| Cuban | 6,502 | 1.7% |
| Czech | 765 | 0.2% |
| Czechoslovakian | 265 | 0.1% |
| Danish | 672 | 0.2% |
| Dominican | 1,472 | 0.4% |
| Dutch | 3,396 | 0.9% |
| Eastern European | 386 | 0.1% |
| Ecuadorian | 460 | 0.1% |
| Egyptian | 175 | 0.1% |
| English | 38,442 | 10.2% |
| Estonian | 24 | 0.0% |
| European | 4,533 | 1.2% |
| Filipino | 163 | 0.0% |
| Finnish | 611 | 0.2% |
| French | 9,870 | 2.6% |
| French American Indian | 23 | 0.0% |
| French Canadian | 2,537 | 0.7% |
| German | 44,469 | 11.8% |
| German Russian | 38 | 0.0% |
| Greek | 1,140 | 0.3% |
| Guamanian / Chamorro | 21 | 0.0% |
| Guatemalan | 958 | 0.3% |
| Guyanese | 700 | 0.2% |
| Haitian | 1,288 | 0.3% |
| Honduran | 526 | 0.1% |
| Houma | 139 | 0.0% |
| Hungarian | 1,957 | 0.5% |
| Icelander | 90 | 0.0% |
| Indian (Asian) | 1,711 | 0.4% |
| Iranian | 8 | 0.0% |
| Iraqi | 11 | 0.0% |
| Irish | 42,329 | 11.2% |
| Iroquois | 295 | 0.1% |
| Israeli | 31 | 0.0% |
| Italian | 23,326 | 6.2% |
| Jamaican | 3,305 | 0.9% |
| Japanese | 40 | 0.0% |
| Kenyan | 16 | 0.0% |
| Korean | 1,120 | 0.3% |
| Laotian | 150 | 0.0% |
| Latvian | 164 | 0.0% |
| Lebanese | 188 | 0.1% |
| Lithuanian | 678 | 0.2% |
| Lumbee | 38 | 0.0% |
| Macedonian | 24 | 0.0% |
| Malaysian | 113 | 0.0% |
| Maltese | 15 | 0.0% |
| Mexican | 10,114 | 2.7% |
| Mongolian | 40 | 0.0% |
| Moroccan | 53 | 0.0% |
| Native Hawaiian | 139 | 0.0% |
| New Zealander | 17 | 0.0% |
| Nicaraguan | 489 | 0.1% |
| Nigerian | 99 | 0.0% |
| Northern European | 229 | 0.1% |
| Norwegian | 3,385 | 0.9% |
| Pakistani | 284 | 0.1% |
| Palestinian | 12 | 0.0% |
| Panamanian | 412 | 0.1% |
| Pennsylvania German | 351 | 0.1% |
| Peruvian | 655 | 0.2% |
| Polish | 9,186 | 2.4% |
| Portuguese | 1,334 | 0.4% |
| Potawatomi | 17 | 0.0% |
| Puerto Rican | 27,121 | 7.2% |
| Romanian | 557 | 0.2% |
| Russian | 1,406 | 0.4% |
| Salvadoran | 564 | 0.2% |
| Samoan | 11 | 0.0% |
| Scandinavian | 800 | 0.2% |
| Scotch-Irish | 3,362 | 0.9% |
| Scottish | 6,532 | 1.7% |
| Seminole | 15 | 0.0% |
| Serbian | 111 | 0.0% |
| Shoshone | 16 | 0.0% |
| Sioux | 139 | 0.0% |
| Slavic | 249 | 0.1% |
| Slovak | 559 | 0.2% |
| Slovene | 238 | 0.1% |
| South African | 109 | 0.0% |
| South American | 6,530 | 1.7% |
| South American Indian | 89 | 0.0% |
| Soviet Union | 3 | 0.0% |
| Spaniard | 913 | 0.2% |
| Spanish | 247 | 0.1% |
| Spanish American | 19 | 0.0% |
| Sri Lankan | 877 | 0.2% |
| Subsaharan African | 4,994 | 1.3% |
| Swedish | 2,273 | 0.6% |
| Swiss | 758 | 0.2% |
| Syrian | 124 | 0.0% |
| Thai | 2,327 | 0.6% |
| Trinidadian and Tobagonian | 539 | 0.1% |
| Turkish | 61 | 0.0% |
| U.S. Virgin Islander | 180 | 0.1% |
| Ukrainian | 1,021 | 0.3% |
| Uruguayan | 92 | 0.0% |
| Venezuelan | 1,511 | 0.4% |
| Vietnamese | 26 | 0.0% |
| Welsh | 1,572 | 0.4% |
| West Indian | 611 | 0.2% |
| Yugoslavian | 126 | 0.0% |
| Yuman | 9 | 0.0% | View All 144 Rows |
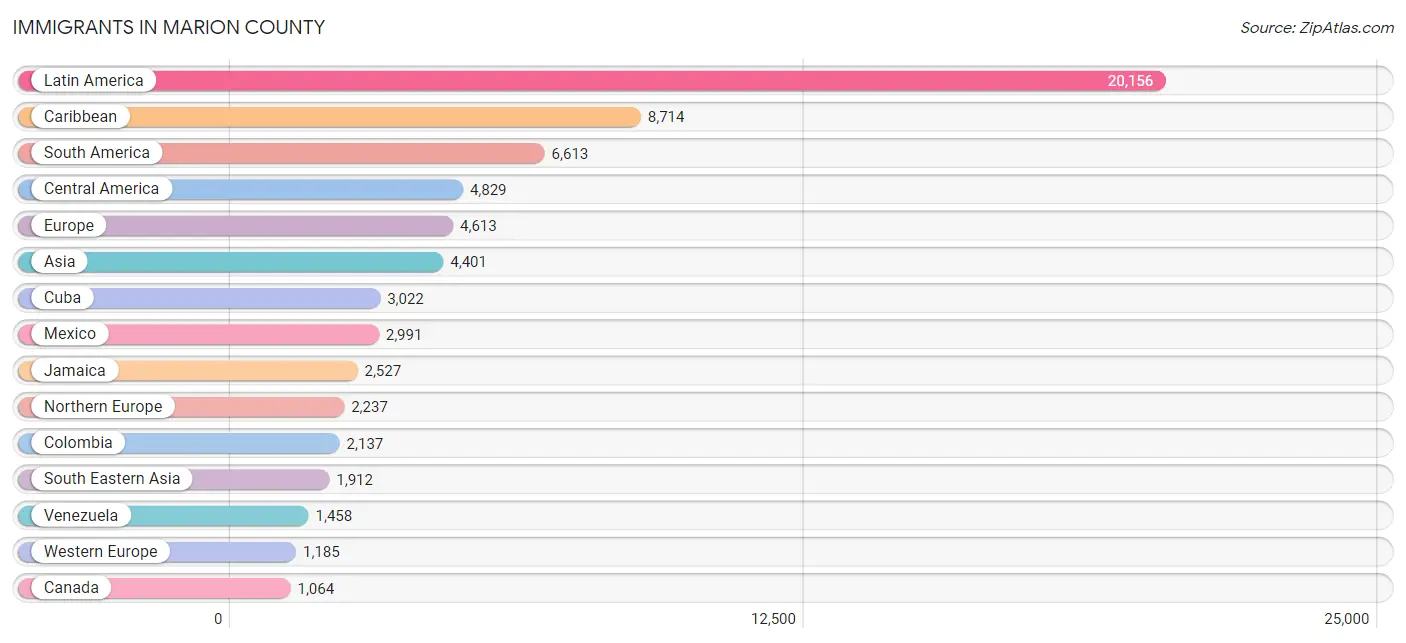
Immigrants in Marion County
The most numerous immigrant groups reported in Marion County came from Latin America (20,156 | 5.3%), Caribbean (8,714 | 2.3%), South America (6,613 | 1.8%), Central America (4,829 | 1.3%), and Europe (4,613 | 1.2%), together accounting for 11.9% of all Marion County residents.
| Immigration Origin | # Population | % Population |
| Afghanistan | 15 | 0.0% |
| Africa | 569 | 0.2% |
| Albania | 12 | 0.0% |
| Argentina | 294 | 0.1% |
| Asia | 4,401 | 1.2% |
| Australia | 121 | 0.0% |
| Austria | 50 | 0.0% |
| Bahamas | 147 | 0.0% |
| Bangladesh | 53 | 0.0% |
| Barbados | 187 | 0.1% |
| Belarus | 12 | 0.0% |
| Belgium | 3 | 0.0% |
| Belize | 23 | 0.0% |
| Bolivia | 20 | 0.0% |
| Brazil | 866 | 0.2% |
| Cambodia | 28 | 0.0% |
| Canada | 1,064 | 0.3% |
| Caribbean | 8,714 | 2.3% |
| Central America | 4,829 | 1.3% |
| Chile | 41 | 0.0% |
| China | 404 | 0.1% |
| Colombia | 2,137 | 0.6% |
| Costa Rica | 68 | 0.0% |
| Cuba | 3,022 | 0.8% |
| Czechoslovakia | 25 | 0.0% |
| Denmark | 30 | 0.0% |
| Dominica | 150 | 0.0% |
| Dominican Republic | 825 | 0.2% |
| Eastern Africa | 133 | 0.0% |
| Eastern Asia | 923 | 0.2% |
| Eastern Europe | 640 | 0.2% |
| Ecuador | 351 | 0.1% |
| Egypt | 107 | 0.0% |
| El Salvador | 315 | 0.1% |
| England | 572 | 0.2% |
| Europe | 4,613 | 1.2% |
| France | 79 | 0.0% |
| Germany | 925 | 0.2% |
| Greece | 95 | 0.0% |
| Grenada | 91 | 0.0% |
| Guatemala | 365 | 0.1% |
| Guyana | 985 | 0.3% |
| Haiti | 1,062 | 0.3% |
| Honduras | 424 | 0.1% |
| Hong Kong | 35 | 0.0% |
| Hungary | 154 | 0.0% |
| India | 847 | 0.2% |
| Indonesia | 170 | 0.0% |
| Iran | 6 | 0.0% |
| Ireland | 492 | 0.1% |
| Israel | 98 | 0.0% |
| Italy | 258 | 0.1% |
| Jamaica | 2,527 | 0.7% |
| Japan | 183 | 0.1% |
| Jordan | 56 | 0.0% |
| Kenya | 70 | 0.0% |
| Korea | 336 | 0.1% |
| Kuwait | 63 | 0.0% |
| Laos | 28 | 0.0% |
| Latin America | 20,156 | 5.3% |
| Lebanon | 280 | 0.1% |
| Lithuania | 7 | 0.0% |
| Malaysia | 49 | 0.0% |
| Mexico | 2,991 | 0.8% |
| Morocco | 35 | 0.0% |
| Netherlands | 114 | 0.0% |
| Nicaragua | 284 | 0.1% |
| Nigeria | 29 | 0.0% |
| North Macedonia | 53 | 0.0% |
| Northern Africa | 142 | 0.0% |
| Northern Europe | 2,237 | 0.6% |
| Oceania | 179 | 0.1% |
| Pakistan | 30 | 0.0% |
| Panama | 359 | 0.1% |
| Peru | 350 | 0.1% |
| Philippines | 679 | 0.2% |
| Poland | 78 | 0.0% |
| Portugal | 158 | 0.0% |
| Romania | 153 | 0.0% |
| Russia | 116 | 0.0% |
| Saudi Arabia | 10 | 0.0% |
| Scotland | 249 | 0.1% |
| South Africa | 226 | 0.1% |
| South America | 6,613 | 1.8% |
| South Central Asia | 951 | 0.3% |
| South Eastern Asia | 1,912 | 0.5% |
| Southern Europe | 551 | 0.2% |
| Spain | 25 | 0.0% |
| St. Vincent and the Grenadines | 20 | 0.0% |
| Sweden | 118 | 0.0% |
| Switzerland | 14 | 0.0% |
| Syria | 52 | 0.0% |
| Taiwan | 38 | 0.0% |
| Thailand | 159 | 0.0% |
| Trinidad and Tobago | 441 | 0.1% |
| Turkey | 56 | 0.0% |
| Ukraine | 8 | 0.0% |
| Uruguay | 31 | 0.0% |
| Venezuela | 1,458 | 0.4% |
| Vietnam | 799 | 0.2% |
| West Indies | 83 | 0.0% |
| Western Africa | 48 | 0.0% |
| Western Asia | 615 | 0.2% |
| Western Europe | 1,185 | 0.3% |
| Zimbabwe | 11 | 0.0% | View All 105 Rows |
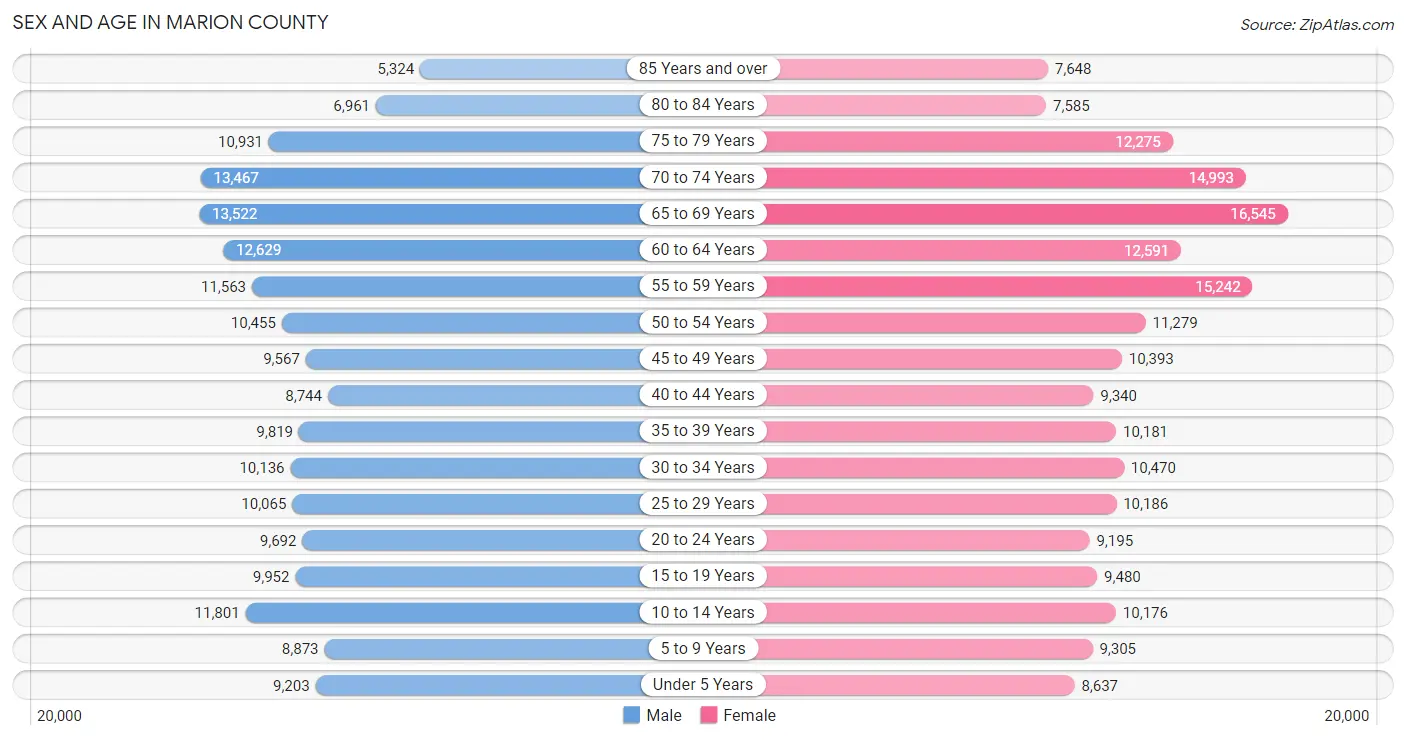
Sex and Age in Marion County
Sex and Age in Marion County
The most populous age groups in Marion County are 65 to 69 Years (13,522 | 7.4%) for men and 65 to 69 Years (16,545 | 8.5%) for women.
| Age Bracket | Male | Female |
| Under 5 Years | 9,203 (5.0%) | 8,637 (4.4%) |
| 5 to 9 Years | 8,873 (4.9%) | 9,305 (4.8%) |
| 10 to 14 Years | 11,801 (6.5%) | 10,176 (5.2%) |
| 15 to 19 Years | 9,952 (5.4%) | 9,480 (4.9%) |
| 20 to 24 Years | 9,692 (5.3%) | 9,195 (4.7%) |
| 25 to 29 Years | 10,065 (5.5%) | 10,186 (5.2%) |
| 30 to 34 Years | 10,136 (5.6%) | 10,470 (5.3%) |
| 35 to 39 Years | 9,819 (5.4%) | 10,181 (5.2%) |
| 40 to 44 Years | 8,744 (4.8%) | 9,340 (4.8%) |
| 45 to 49 Years | 9,567 (5.2%) | 10,393 (5.3%) |
| 50 to 54 Years | 10,455 (5.7%) | 11,279 (5.8%) |
| 55 to 59 Years | 11,563 (6.3%) | 15,242 (7.8%) |
| 60 to 64 Years | 12,629 (6.9%) | 12,591 (6.4%) |
| 65 to 69 Years | 13,522 (7.4%) | 16,545 (8.5%) |
| 70 to 74 Years | 13,467 (7.4%) | 14,993 (7.7%) |
| 75 to 79 Years | 10,931 (6.0%) | 12,275 (6.3%) |
| 80 to 84 Years | 6,961 (3.8%) | 7,585 (3.9%) |
| 85 Years and over | 5,324 (2.9%) | 7,648 (3.9%) |
| Total | 182,704 (100.0%) | 195,521 (100.0%) |
Families and Households in Marion County
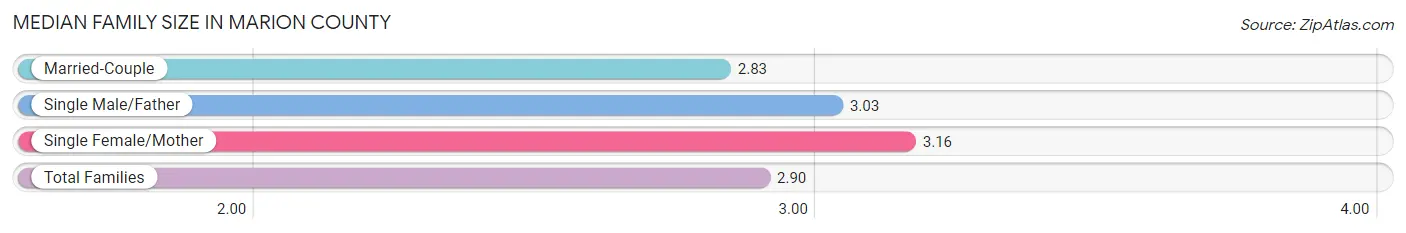
Median Family Size in Marion County
The median family size in Marion County is 2.90 persons per family, with single female/mother families (17,110 | 16.9%) accounting for the largest median family size of 3.16 persons per family. On the other hand, married-couple families (75,986 | 75.2%) represent the smallest median family size with 2.83 persons per family.
| Family Type | # Families | Family Size |
| Married-Couple | 75,986 (75.2%) | 2.83 |
| Single Male/Father | 7,990 (7.9%) | 3.03 |
| Single Female/Mother | 17,110 (16.9%) | 3.16 |
| Total Families | 101,086 (100.0%) | 2.90 |
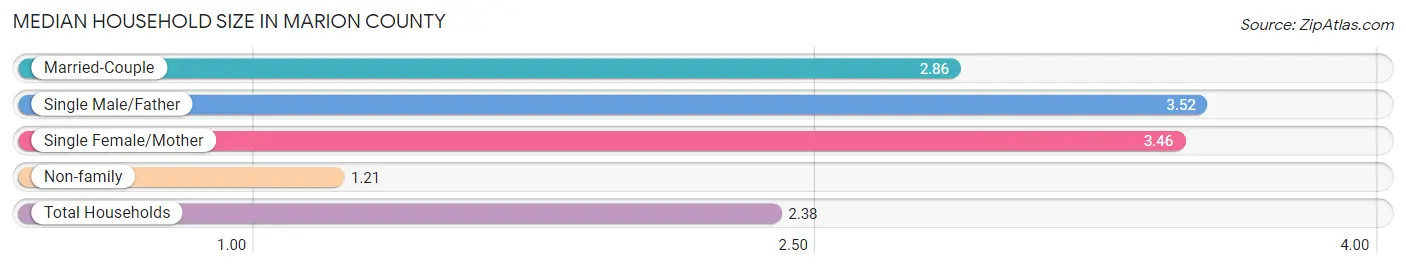
Median Household Size in Marion County
The median household size in Marion County is 2.38 persons per household, with single male/father households (7,990 | 5.1%) accounting for the largest median household size of 3.52 persons per household. non-family households (53,910 | 34.8%) represent the smallest median household size with 1.21 persons per household.
| Household Type | # Households | Household Size |
| Married-Couple | 75,986 (49.0%) | 2.86 |
| Single Male/Father | 7,990 (5.1%) | 3.52 |
| Single Female/Mother | 17,110 (11.0%) | 3.46 |
| Non-family | 53,910 (34.8%) | 1.21 |
| Total Households | 154,996 (100.0%) | 2.38 |
Household Size by Marriage Status in Marion County
Out of a total of 154,996 households in Marion County, 101,086 (65.2%) are family households, while 53,910 (34.8%) are nonfamily households. The most numerous type of family households are 2-person households, comprising 56,110, and the most common type of nonfamily households are 1-person households, comprising 45,744.
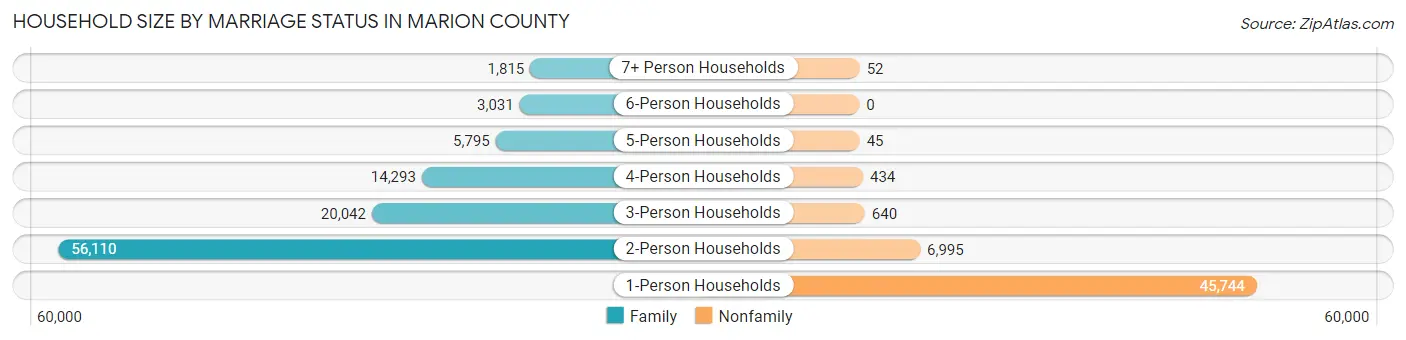
| Household Size | Family Households | Nonfamily Households |
| 1-Person Households | - | 45,744 (29.5%) |
| 2-Person Households | 56,110 (36.2%) | 6,995 (4.5%) |
| 3-Person Households | 20,042 (12.9%) | 640 (0.4%) |
| 4-Person Households | 14,293 (9.2%) | 434 (0.3%) |
| 5-Person Households | 5,795 (3.7%) | 45 (0.0%) |
| 6-Person Households | 3,031 (2.0%) | 0 (0.0%) |
| 7+ Person Households | 1,815 (1.2%) | 52 (0.0%) |
| Total | 101,086 (65.2%) | 53,910 (34.8%) |
Female Fertility in Marion County
Fertility by Age in Marion County
Average fertility rate in Marion County is 54.0 births per 1,000 women. Women in the age bracket of 20 to 34 years have the highest fertility rate with 99.0 births per 1,000 women. Women in the age bracket of 20 to 34 years acount for 75.9% of all women with births.
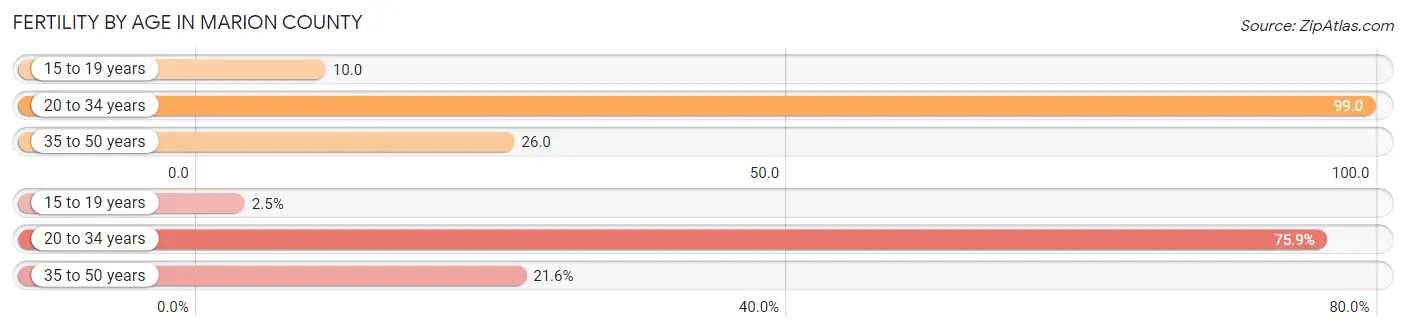
| Age Bracket | Women with Births | Births / 1,000 Women |
| 15 to 19 years | 97 (2.5%) | 10.0 |
| 20 to 34 years | 2,949 (75.9%) | 99.0 |
| 35 to 50 years | 839 (21.6%) | 26.0 |
| Total | 3,885 (100.0%) | 54.0 |
Fertility by Age by Marriage Status in Marion County
59.9% of women with births (3,885) in Marion County are married. The highest percentage of unmarried women with births falls into 15 to 19 years age bracket with 72.2% of them unmarried at the time of birth, while the lowest percentage of unmarried women with births belong to 35 to 50 years age bracket with 19.8% of them unmarried.
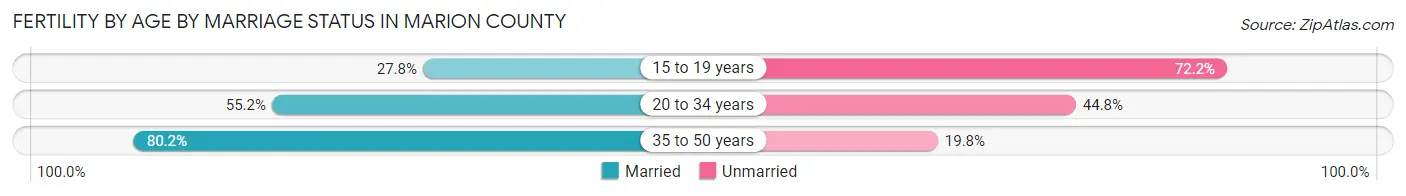
| Age Bracket | Married | Unmarried |
| 15 to 19 years | 27 (27.8%) | 70 (72.2%) |
| 20 to 34 years | 1,628 (55.2%) | 1,321 (44.8%) |
| 35 to 50 years | 673 (80.2%) | 166 (19.8%) |
| Total | 2,327 (59.9%) | 1,558 (40.1%) |
Fertility by Education in Marion County
Average fertility rate in Marion County is 54.0 births per 1,000 women. Women with the education attainment of bachelor's degree have the highest fertility rate of 83.0 births per 1,000 women, while women with the education attainment of less than high school have the lowest fertility at 35.0 births per 1,000 women. Women with the education attainment of college or associate's degree represent 38.2% of all women with births.
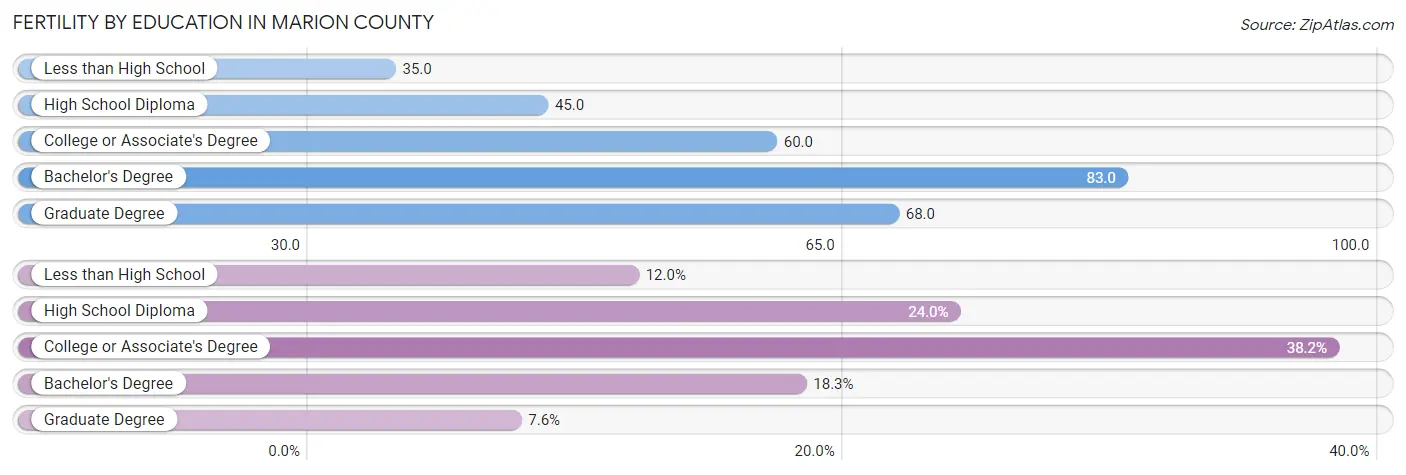
| Educational Attainment | Women with Births | Births / 1,000 Women |
| Less than High School | 465 (12.0%) | 35.0 |
| High School Diploma | 933 (24.0%) | 45.0 |
| College or Associate's Degree | 1,484 (38.2%) | 60.0 |
| Bachelor's Degree | 709 (18.2%) | 83.0 |
| Graduate Degree | 294 (7.6%) | 68.0 |
| Total | 3,885 (100.0%) | 54.0 |
Fertility by Education by Marriage Status in Marion County
40.1% of women with births in Marion County are unmarried. Women with the educational attainment of graduate degree are most likely to be married with 92.9% of them married at childbirth, while women with the educational attainment of less than high school are least likely to be married with 75.9% of them unmarried at childbirth.
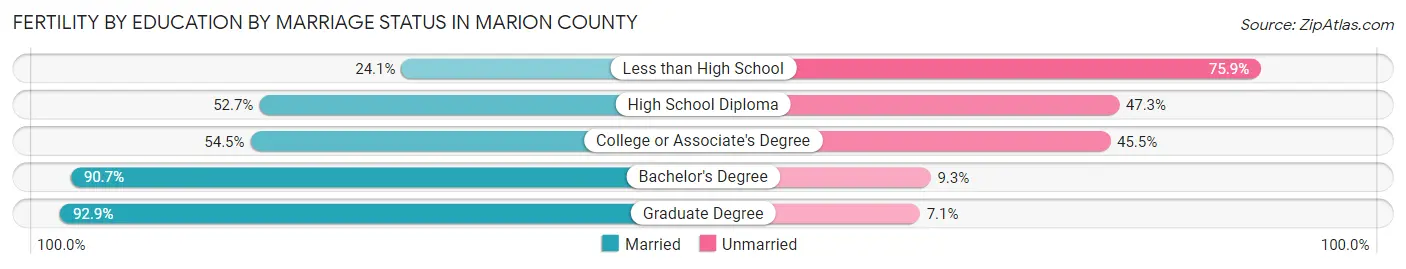
| Educational Attainment | Married | Unmarried |
| Less than High School | 112 (24.1%) | 353 (75.9%) |
| High School Diploma | 492 (52.7%) | 441 (47.3%) |
| College or Associate's Degree | 809 (54.5%) | 675 (45.5%) |
| Bachelor's Degree | 643 (90.7%) | 66 (9.3%) |
| Graduate Degree | 273 (92.9%) | 21 (7.1%) |
| Total | 2,327 (59.9%) | 1,558 (40.1%) |
Employment Characteristics in Marion County
Employment by Class of Employer in Marion County
Among the 139,755 employed individuals in Marion County, private company employees (96,876 | 69.3%), local government employees (10,508 | 7.5%), and self-employed (not incorporated) (8,733 | 6.2%) make up the most common classes of employment.
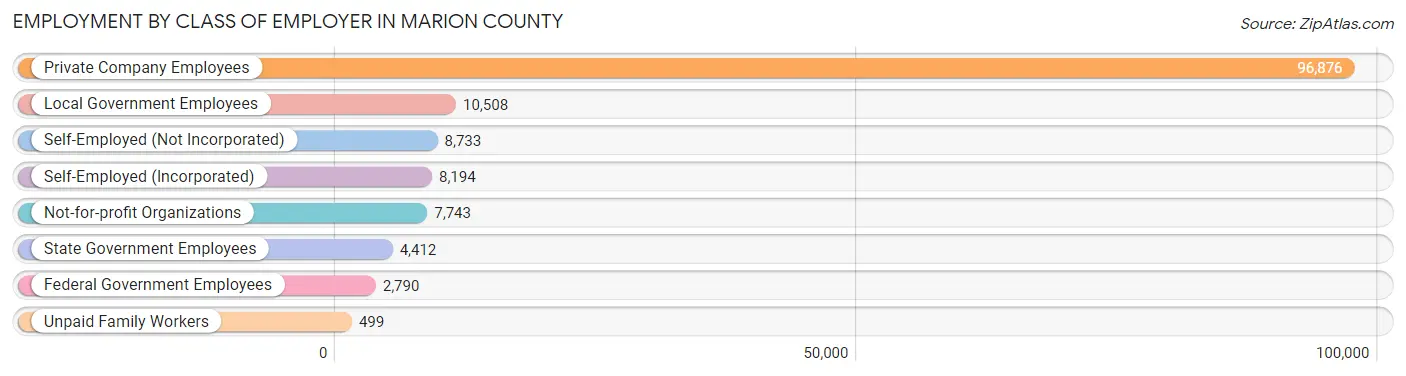
| Employer Class | # Employees | % Employees |
| Private Company Employees | 96,876 | 69.3% |
| Self-Employed (Incorporated) | 8,194 | 5.9% |
| Self-Employed (Not Incorporated) | 8,733 | 6.2% |
| Not-for-profit Organizations | 7,743 | 5.5% |
| Local Government Employees | 10,508 | 7.5% |
| State Government Employees | 4,412 | 3.2% |
| Federal Government Employees | 2,790 | 2.0% |
| Unpaid Family Workers | 499 | 0.4% |
| Total | 139,755 | 100.0% |
Employment Status by Age in Marion County
According to the labor force statistics for Marion County, out of the total population over 16 years of age (316,405), 47.9% or 151,558 individuals are in the labor force, with 5.9% or 8,942 of them unemployed. The age group with the highest labor force participation rate is 25 to 29 years, with 78.6% or 15,917 individuals in the labor force. Within the labor force, the 16 to 19 years age range has the highest percentage of unemployed individuals, with 14.7% or 837 of them being unemployed.
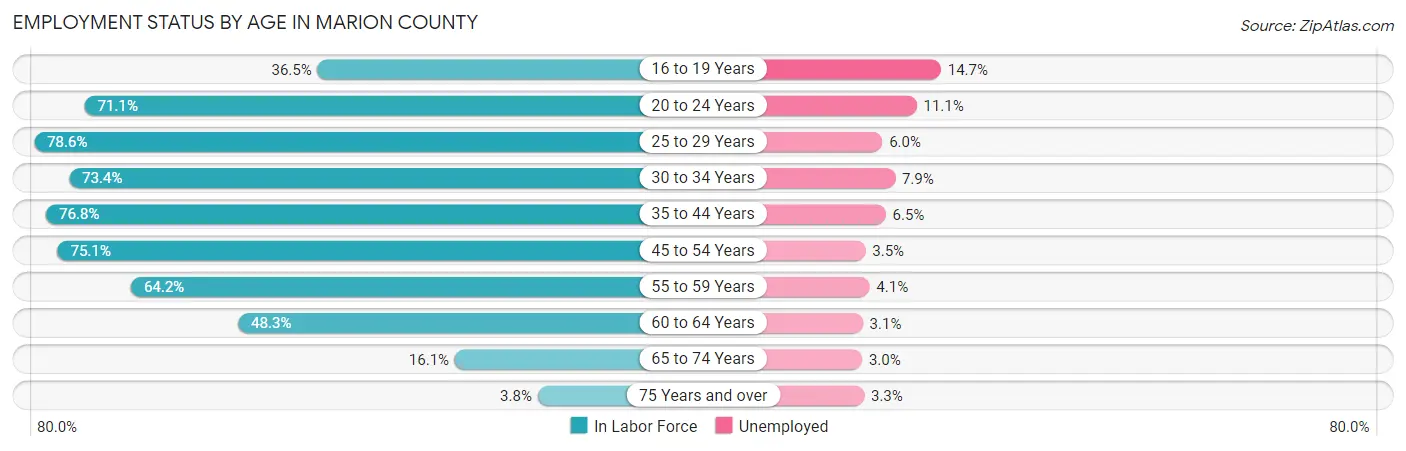
| Age Bracket | In Labor Force | Unemployed |
| 16 to 19 Years | 5,697 (36.5%) | 837 (14.7%) |
| 20 to 24 Years | 13,429 (71.1%) | 1,491 (11.1%) |
| 25 to 29 Years | 15,917 (78.6%) | 955 (6.0%) |
| 30 to 34 Years | 15,125 (73.4%) | 1,195 (7.9%) |
| 35 to 44 Years | 29,249 (76.8%) | 1,901 (6.5%) |
| 45 to 54 Years | 31,312 (75.1%) | 1,096 (3.5%) |
| 55 to 59 Years | 17,209 (64.2%) | 706 (4.1%) |
| 60 to 64 Years | 12,181 (48.3%) | 378 (3.1%) |
| 65 to 74 Years | 9,423 (16.1%) | 283 (3.0%) |
| 75 Years and over | 1,928 (3.8%) | 64 (3.3%) |
| Total | 151,558 (47.9%) | 8,942 (5.9%) |
Employment Status by Educational Attainment in Marion County
According to labor force statistics for Marion County, 70.1% of individuals (121,035) out of the total population between 25 and 64 years of age (172,660) are in the labor force, with 5.1% or 6,173 of them being unemployed. The group with the highest labor force participation rate are those with the educational attainment of bachelor's degree or higher, with 80.8% or 28,775 individuals in the labor force. Within the labor force, individuals with less than high school education have the highest percentage of unemployment, with 10.7% or 1,126 of them being unemployed.
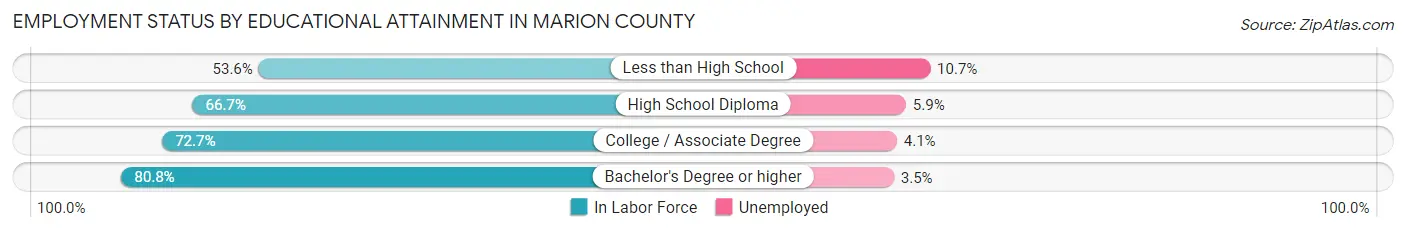
| Educational Attainment | In Labor Force | Unemployed |
| Less than High School | 10,521 (53.6%) | 2,100 (10.7%) |
| High School Diploma | 40,215 (66.7%) | 3,557 (5.9%) |
| College / Associate Degree | 41,531 (72.7%) | 2,342 (4.1%) |
| Bachelor's Degree or higher | 28,775 (80.8%) | 1,246 (3.5%) |
| Total | 121,035 (70.1%) | 8,806 (5.1%) |
Employment Occupations by Sex in Marion County
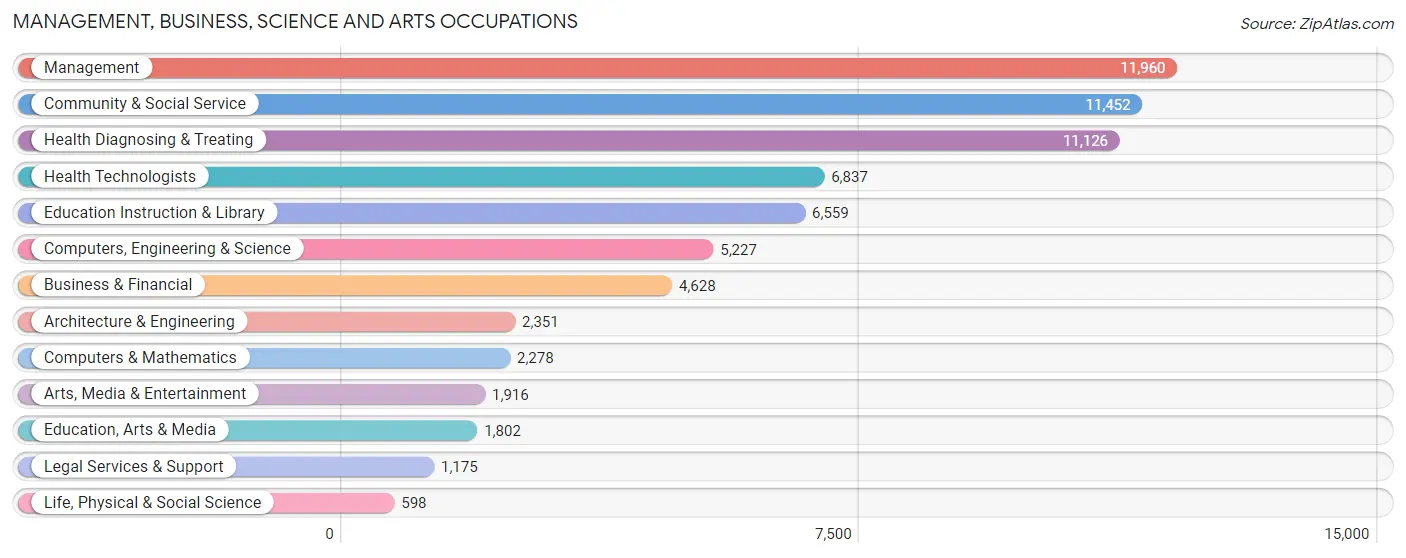
Management, Business, Science and Arts Occupations
The most common Management, Business, Science and Arts occupations in Marion County are Management (11,960 | 8.4%), Community & Social Service (11,452 | 8.0%), Health Diagnosing & Treating (11,126 | 7.8%), Health Technologists (6,837 | 4.8%), and Education Instruction & Library (6,559 | 4.6%).
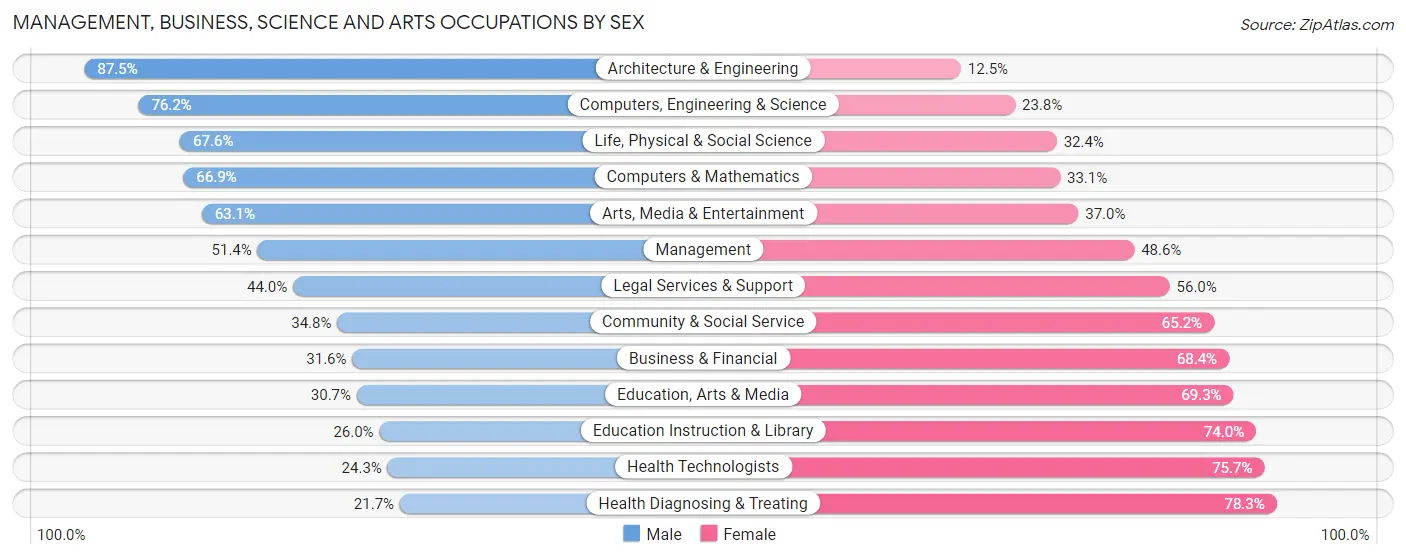
Management, Business, Science and Arts Occupations by Sex
Within the Management, Business, Science and Arts occupations in Marion County, the most male-oriented occupations are Architecture & Engineering (87.5%), Computers, Engineering & Science (76.2%), and Life, Physical & Social Science (67.6%), while the most female-oriented occupations are Health Diagnosing & Treating (78.3%), Health Technologists (75.7%), and Education Instruction & Library (74.0%).
| Occupation | Male | Female |
| Management | 6,146 (51.4%) | 5,814 (48.6%) |
| Business & Financial | 1,464 (31.6%) | 3,164 (68.4%) |
| Computers, Engineering & Science | 3,985 (76.2%) | 1,242 (23.8%) |
| Computers & Mathematics | 1,523 (66.9%) | 755 (33.1%) |
| Architecture & Engineering | 2,058 (87.5%) | 293 (12.5%) |
| Life, Physical & Social Science | 404 (67.6%) | 194 (32.4%) |
| Community & Social Service | 3,982 (34.8%) | 7,470 (65.2%) |
| Education, Arts & Media | 553 (30.7%) | 1,249 (69.3%) |
| Legal Services & Support | 517 (44.0%) | 658 (56.0%) |
| Education Instruction & Library | 1,704 (26.0%) | 4,855 (74.0%) |
| Arts, Media & Entertainment | 1,208 (63.0%) | 708 (36.9%) |
| Health Diagnosing & Treating | 2,415 (21.7%) | 8,711 (78.3%) |
| Health Technologists | 1,659 (24.3%) | 5,178 (75.7%) |
| Total (Category) | 17,992 (40.5%) | 26,401 (59.5%) |
| Total (Overall) | 72,731 (51.1%) | 69,659 (48.9%) |
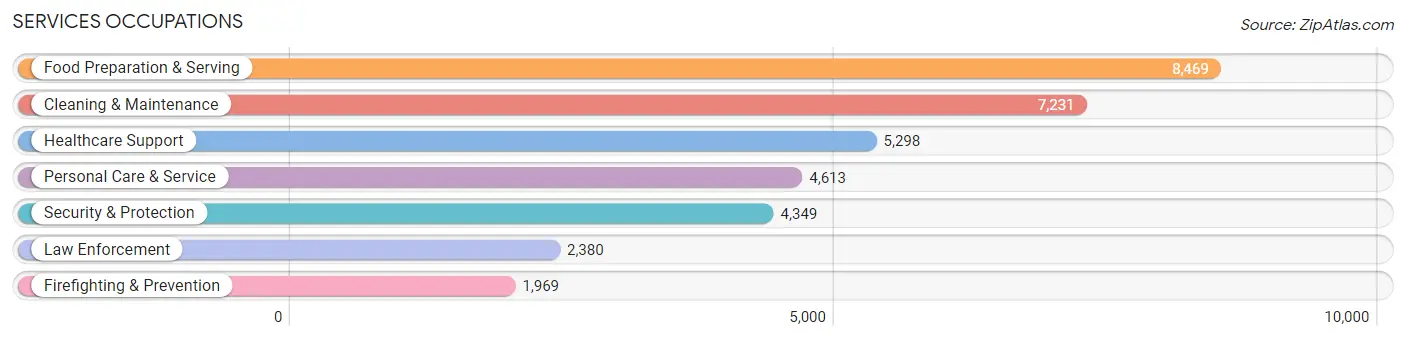
Services Occupations
The most common Services occupations in Marion County are Food Preparation & Serving (8,469 | 5.9%), Cleaning & Maintenance (7,231 | 5.1%), Healthcare Support (5,298 | 3.7%), Personal Care & Service (4,613 | 3.2%), and Security & Protection (4,349 | 3.0%).
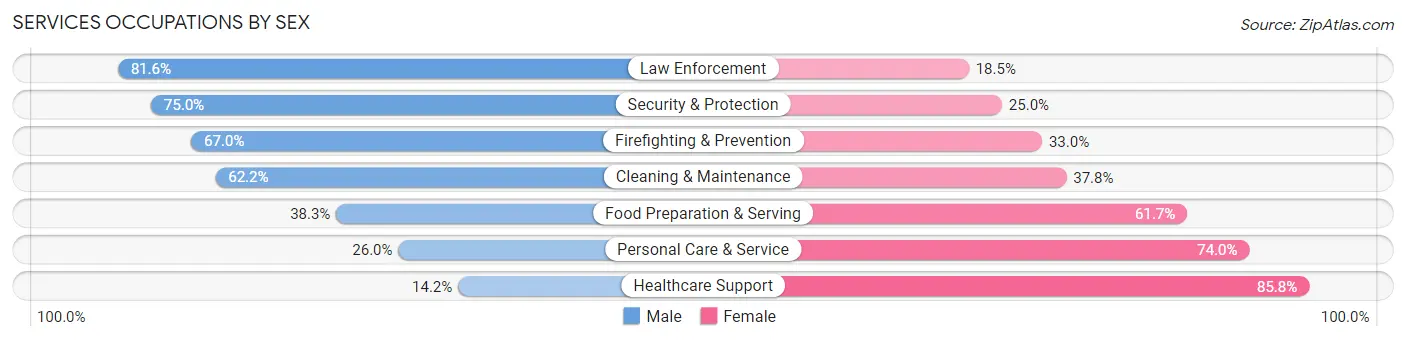
Services Occupations by Sex
Within the Services occupations in Marion County, the most male-oriented occupations are Law Enforcement (81.6%), Security & Protection (75.0%), and Firefighting & Prevention (67.0%), while the most female-oriented occupations are Healthcare Support (85.8%), Personal Care & Service (74.0%), and Food Preparation & Serving (61.7%).
| Occupation | Male | Female |
| Healthcare Support | 750 (14.2%) | 4,548 (85.8%) |
| Security & Protection | 3,261 (75.0%) | 1,088 (25.0%) |
| Firefighting & Prevention | 1,320 (67.0%) | 649 (33.0%) |
| Law Enforcement | 1,941 (81.6%) | 439 (18.4%) |
| Food Preparation & Serving | 3,244 (38.3%) | 5,225 (61.7%) |
| Cleaning & Maintenance | 4,500 (62.2%) | 2,731 (37.8%) |
| Personal Care & Service | 1,199 (26.0%) | 3,414 (74.0%) |
| Total (Category) | 12,954 (43.2%) | 17,006 (56.8%) |
| Total (Overall) | 72,731 (51.1%) | 69,659 (48.9%) |
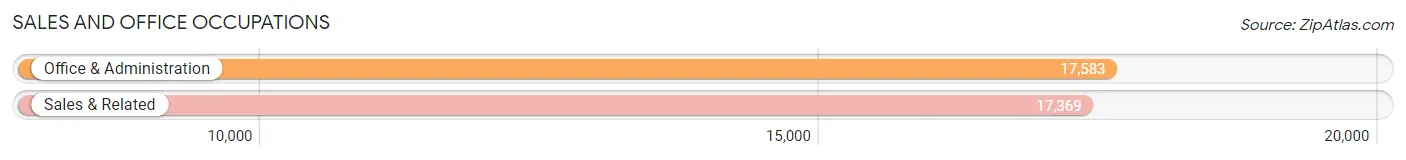
Sales and Office Occupations
The most common Sales and Office occupations in Marion County are Office & Administration (17,583 | 12.3%), and Sales & Related (17,369 | 12.2%).
Sales and Office Occupations by Sex
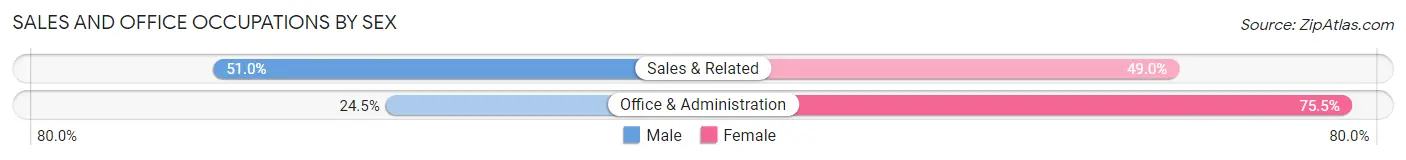
| Occupation | Male | Female |
| Sales & Related | 8,854 (51.0%) | 8,515 (49.0%) |
| Office & Administration | 4,302 (24.5%) | 13,281 (75.5%) |
| Total (Category) | 13,156 (37.6%) | 21,796 (62.4%) |
| Total (Overall) | 72,731 (51.1%) | 69,659 (48.9%) |
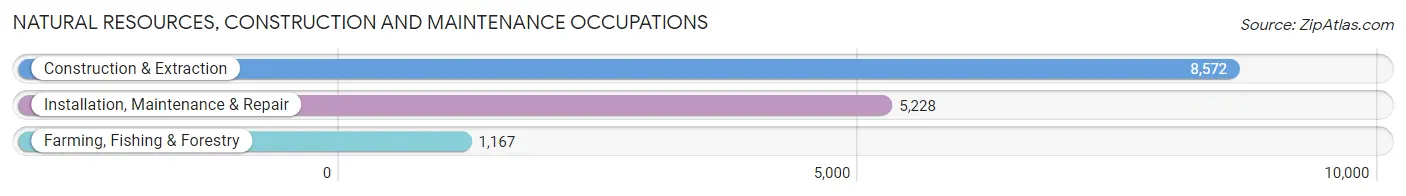
Natural Resources, Construction and Maintenance Occupations
The most common Natural Resources, Construction and Maintenance occupations in Marion County are Construction & Extraction (8,572 | 6.0%), Installation, Maintenance & Repair (5,228 | 3.7%), and Farming, Fishing & Forestry (1,167 | 0.8%).
Natural Resources, Construction and Maintenance Occupations by Sex
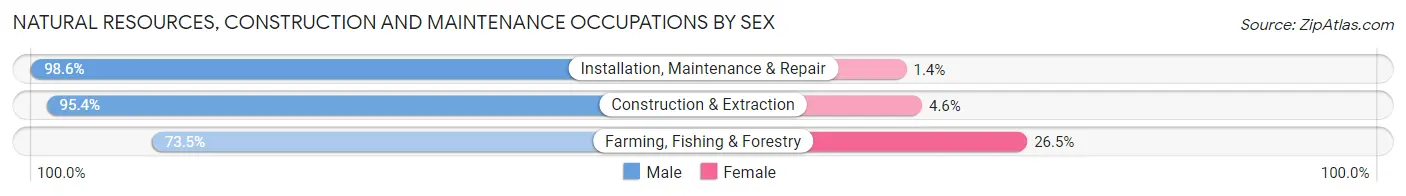
| Occupation | Male | Female |
| Farming, Fishing & Forestry | 858 (73.5%) | 309 (26.5%) |
| Construction & Extraction | 8,178 (95.4%) | 394 (4.6%) |
| Installation, Maintenance & Repair | 5,156 (98.6%) | 72 (1.4%) |
| Total (Category) | 14,192 (94.8%) | 775 (5.2%) |
| Total (Overall) | 72,731 (51.1%) | 69,659 (48.9%) |
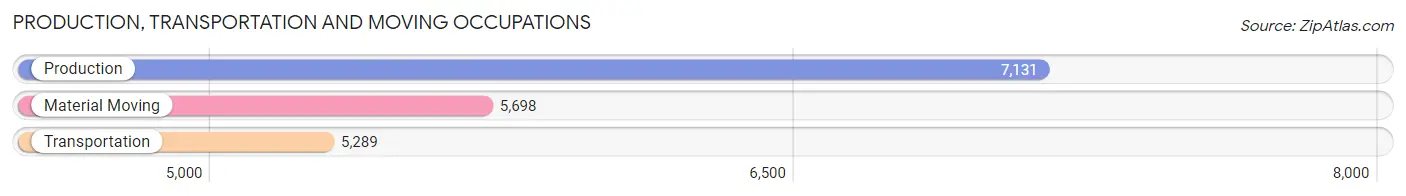
Production, Transportation and Moving Occupations
The most common Production, Transportation and Moving occupations in Marion County are Production (7,131 | 5.0%), Material Moving (5,698 | 4.0%), and Transportation (5,289 | 3.7%).
Production, Transportation and Moving Occupations by Sex
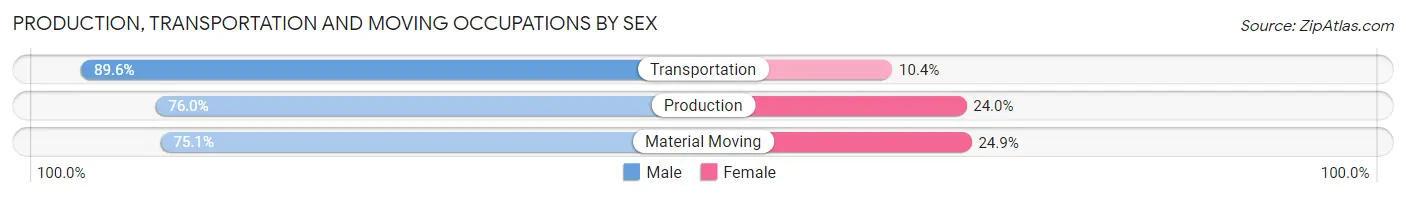
| Occupation | Male | Female |
| Production | 5,420 (76.0%) | 1,711 (24.0%) |
| Transportation | 4,740 (89.6%) | 549 (10.4%) |
| Material Moving | 4,277 (75.1%) | 1,421 (24.9%) |
| Total (Category) | 14,437 (79.7%) | 3,681 (20.3%) |
| Total (Overall) | 72,731 (51.1%) | 69,659 (48.9%) |
Employment Industries by Sex in Marion County
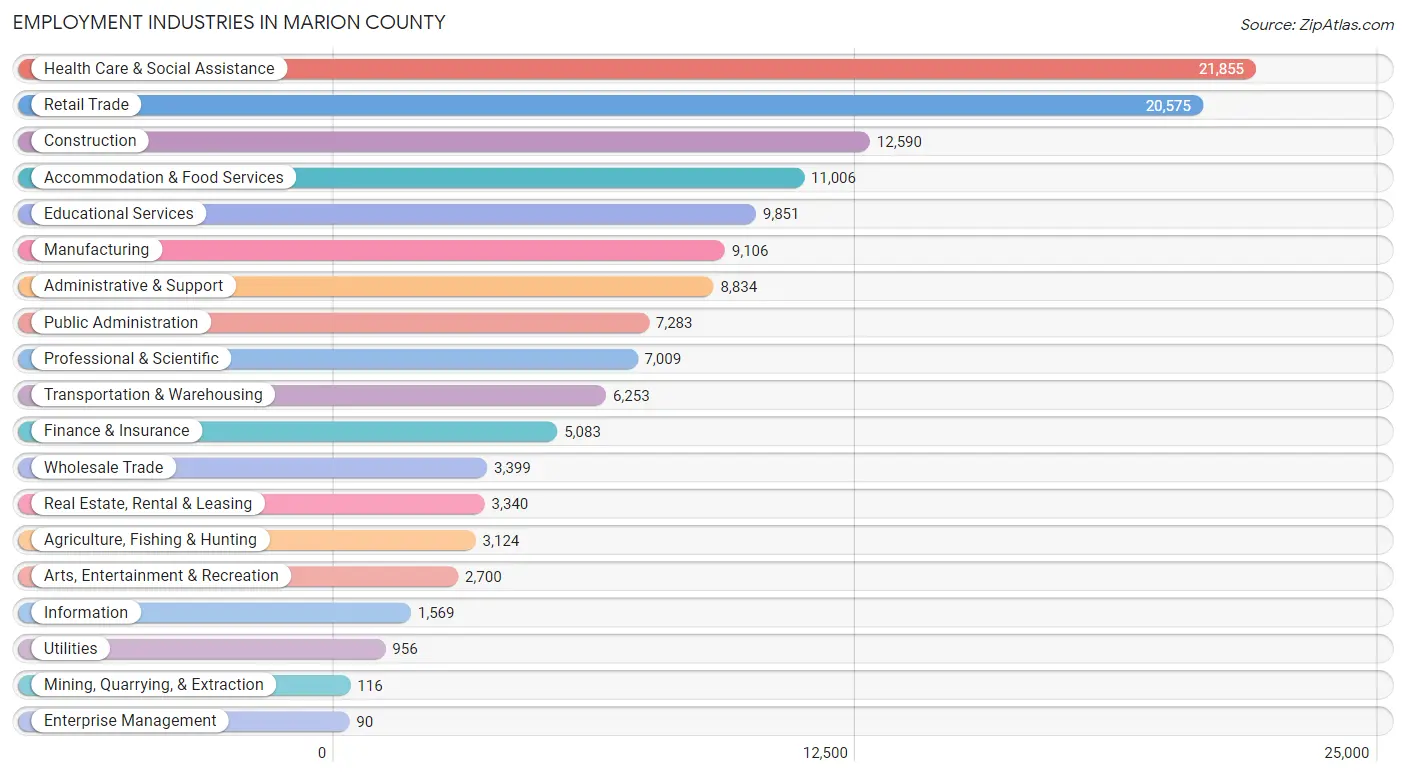
Employment Industries in Marion County
The major employment industries in Marion County include Health Care & Social Assistance (21,855 | 15.3%), Retail Trade (20,575 | 14.4%), Construction (12,590 | 8.8%), Accommodation & Food Services (11,006 | 7.7%), and Educational Services (9,851 | 6.9%).
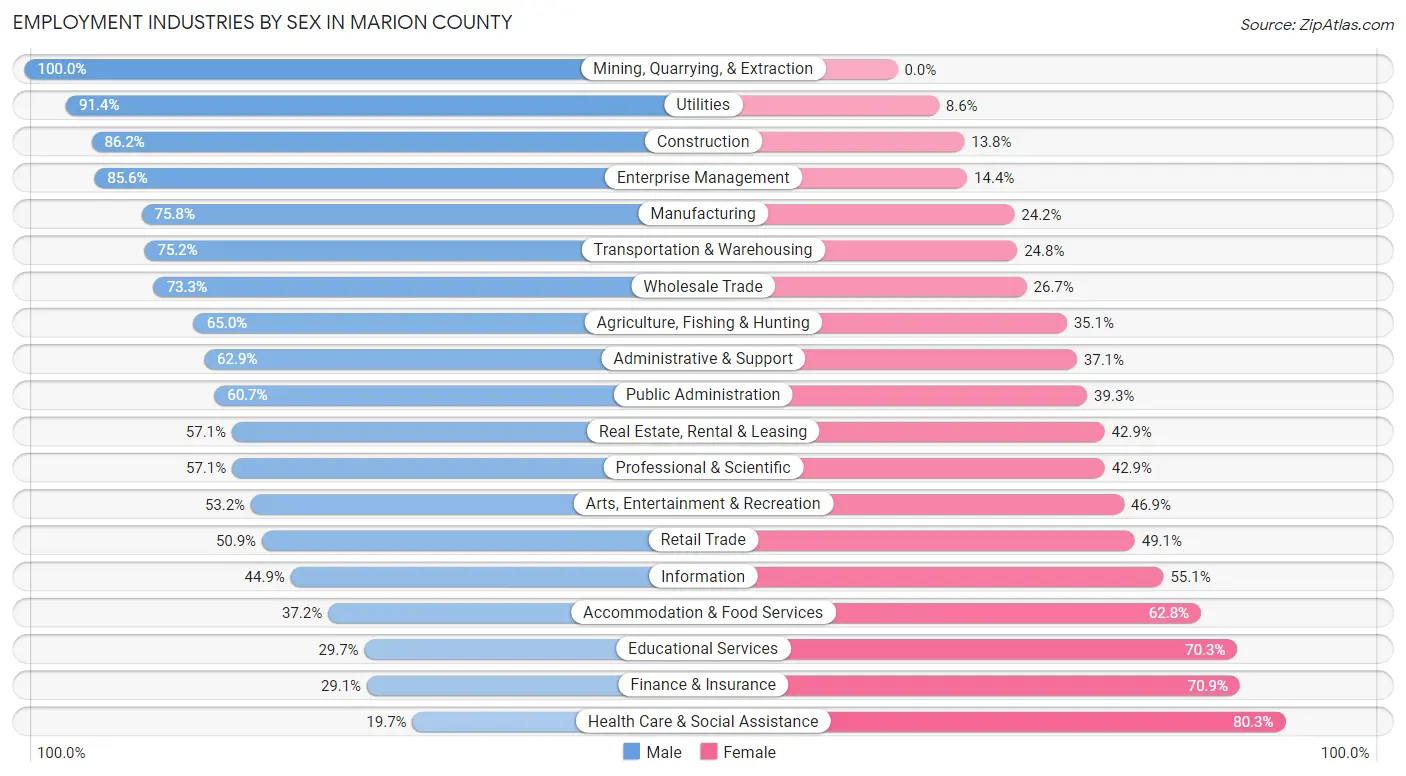
Employment Industries by Sex in Marion County
The Marion County industries that see more men than women are Mining, Quarrying, & Extraction (100.0%), Utilities (91.4%), and Construction (86.2%), whereas the industries that tend to have a higher number of women are Health Care & Social Assistance (80.3%), Finance & Insurance (70.9%), and Educational Services (70.3%).
| Industry | Male | Female |
| Agriculture, Fishing & Hunting | 2,029 (64.9%) | 1,095 (35.0%) |
| Mining, Quarrying, & Extraction | 116 (100.0%) | 0 (0.0%) |
| Construction | 10,848 (86.2%) | 1,742 (13.8%) |
| Manufacturing | 6,901 (75.8%) | 2,205 (24.2%) |
| Wholesale Trade | 2,490 (73.3%) | 909 (26.7%) |
| Retail Trade | 10,467 (50.9%) | 10,108 (49.1%) |
| Transportation & Warehousing | 4,702 (75.2%) | 1,551 (24.8%) |
| Utilities | 874 (91.4%) | 82 (8.6%) |
| Information | 705 (44.9%) | 864 (55.1%) |
| Finance & Insurance | 1,481 (29.1%) | 3,602 (70.9%) |
| Real Estate, Rental & Leasing | 1,907 (57.1%) | 1,433 (42.9%) |
| Professional & Scientific | 4,000 (57.1%) | 3,009 (42.9%) |
| Enterprise Management | 77 (85.6%) | 13 (14.4%) |
| Administrative & Support | 5,553 (62.9%) | 3,281 (37.1%) |
| Educational Services | 2,922 (29.7%) | 6,929 (70.3%) |
| Health Care & Social Assistance | 4,311 (19.7%) | 17,544 (80.3%) |
| Arts, Entertainment & Recreation | 1,435 (53.1%) | 1,265 (46.9%) |
| Accommodation & Food Services | 4,093 (37.2%) | 6,913 (62.8%) |
| Public Administration | 4,423 (60.7%) | 2,860 (39.3%) |
| Total | 72,731 (51.1%) | 69,659 (48.9%) |
Education in Marion County
School Enrollment in Marion County
The most common levels of schooling among the 71,475 students in Marion County are middle school (17,605 | 24.6%), high school (17,119 | 23.9%), and elementary school (13,666 | 19.1%).
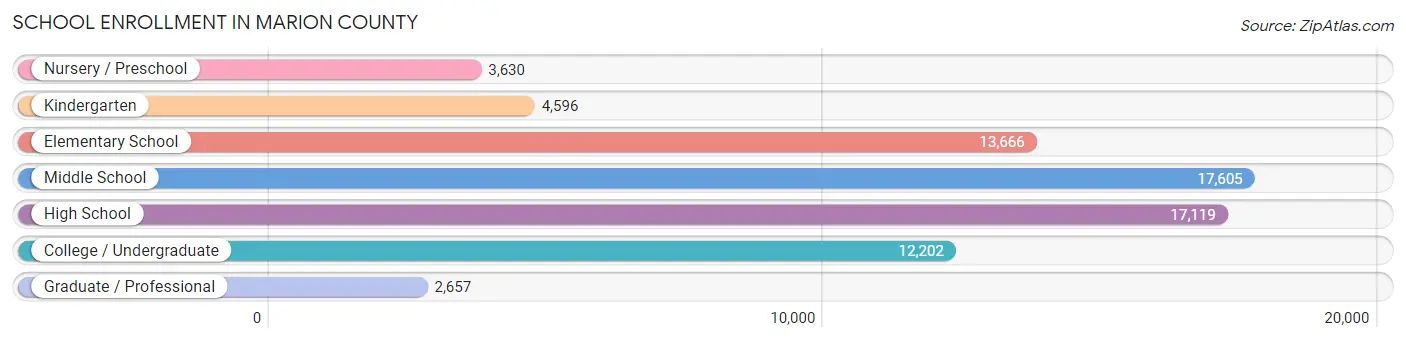
| School Level | # Students | % Students |
| Nursery / Preschool | 3,630 | 5.1% |
| Kindergarten | 4,596 | 6.4% |
| Elementary School | 13,666 | 19.1% |
| Middle School | 17,605 | 24.6% |
| High School | 17,119 | 23.9% |
| College / Undergraduate | 12,202 | 17.1% |
| Graduate / Professional | 2,657 | 3.7% |
| Total | 71,475 | 100.0% |
School Enrollment by Age by Funding Source in Marion County
Out of a total of 71,475 students who are enrolled in schools in Marion County, 14,009 (19.6%) attend a private institution, while the remaining 57,466 (80.4%) are enrolled in public schools. The age group of 3 to 4 year olds has the highest likelihood of being enrolled in private schools, with 1,342 (42.2% in the age bracket) enrolled. Conversely, the age group of 18 to 19 year olds has the lowest likelihood of being enrolled in a private school, with 3,482 (91.3% in the age bracket) attending a public institution.
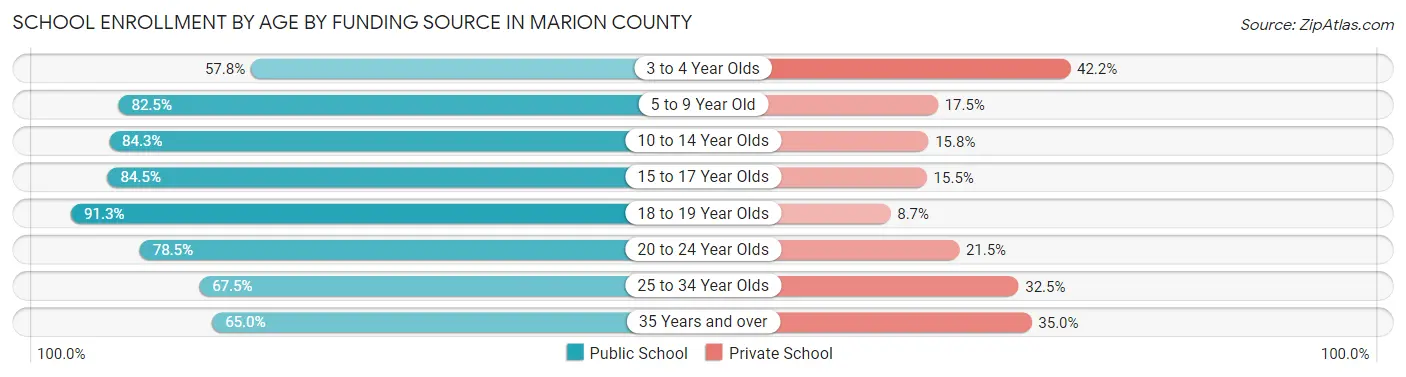
| Age Bracket | Public School | Private School |
| 3 to 4 Year Olds | 1,840 (57.8%) | 1,342 (42.2%) |
| 5 to 9 Year Old | 14,083 (82.5%) | 2,989 (17.5%) |
| 10 to 14 Year Olds | 18,106 (84.3%) | 3,386 (15.8%) |
| 15 to 17 Year Olds | 9,857 (84.5%) | 1,803 (15.5%) |
| 18 to 19 Year Olds | 3,482 (91.3%) | 331 (8.7%) |
| 20 to 24 Year Olds | 4,125 (78.5%) | 1,128 (21.5%) |
| 25 to 34 Year Olds | 2,672 (67.5%) | 1,288 (32.5%) |
| 35 Years and over | 3,280 (65.0%) | 1,763 (35.0%) |
| Total | 57,466 (80.4%) | 14,009 (19.6%) |
Educational Attainment by Field of Study in Marion County
Business (14,917 | 22.8%), education (10,766 | 16.4%), science & technology (7,777 | 11.9%), social sciences (4,414 | 6.7%), and arts & humanities (4,179 | 6.4%) are the most common fields of study among 65,572 individuals in Marion County who have obtained a bachelor's degree or higher.
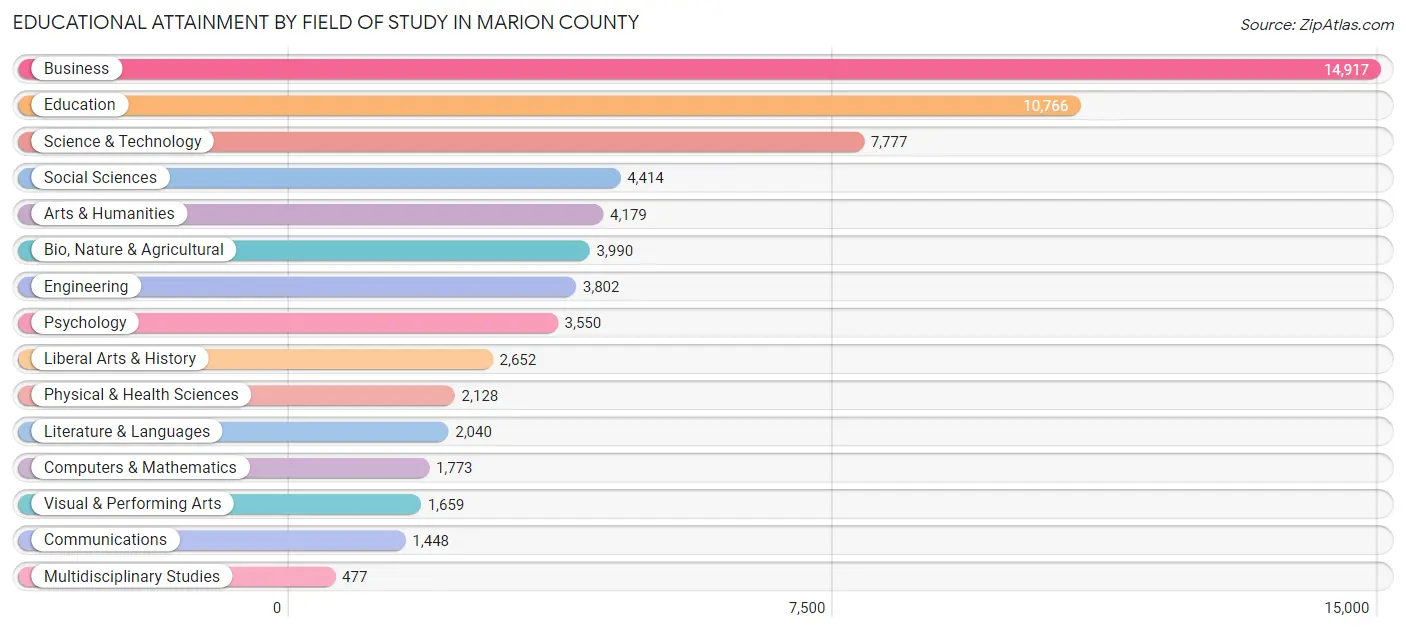
| Field of Study | # Graduates | % Graduates |
| Computers & Mathematics | 1,773 | 2.7% |
| Bio, Nature & Agricultural | 3,990 | 6.1% |
| Physical & Health Sciences | 2,128 | 3.3% |
| Psychology | 3,550 | 5.4% |
| Social Sciences | 4,414 | 6.7% |
| Engineering | 3,802 | 5.8% |
| Multidisciplinary Studies | 477 | 0.7% |
| Science & Technology | 7,777 | 11.9% |
| Business | 14,917 | 22.8% |
| Education | 10,766 | 16.4% |
| Literature & Languages | 2,040 | 3.1% |
| Liberal Arts & History | 2,652 | 4.0% |
| Visual & Performing Arts | 1,659 | 2.5% |
| Communications | 1,448 | 2.2% |
| Arts & Humanities | 4,179 | 6.4% |
| Total | 65,572 | 100.0% |
Transportation & Commute in Marion County
Vehicle Availability by Sex in Marion County
The most prevalent vehicle ownership categories in Marion County are males with 2 vehicles (31,296, accounting for 43.6%) and females with 2 vehicles (28,907, making up 46.1%).
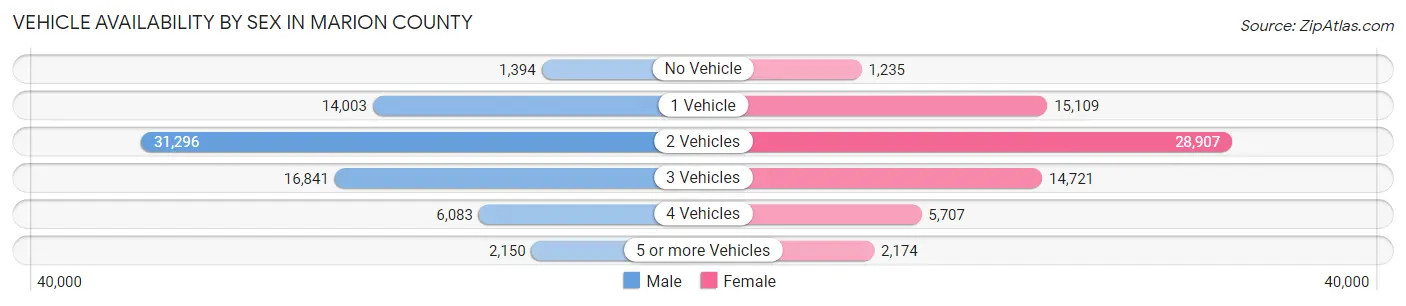
| Vehicles Available | Male | Female |
| No Vehicle | 1,394 (1.9%) | 1,235 (1.8%) |
| 1 Vehicle | 14,003 (19.5%) | 15,109 (22.3%) |
| 2 Vehicles | 31,296 (43.6%) | 28,907 (42.6%) |
| 3 Vehicles | 16,841 (23.5%) | 14,721 (21.7%) |
| 4 Vehicles | 6,083 (8.5%) | 5,707 (8.4%) |
| 5 or more Vehicles | 2,150 (3.0%) | 2,174 (3.2%) |
| Total | 71,767 (100.0%) | 67,853 (100.0%) |
Commute Time in Marion County
The most frequently occuring commute durations in Marion County are 15 to 19 minutes (21,005 commuters, 16.5%), 30 to 34 minutes (20,659 commuters, 16.3%), and 20 to 24 minutes (18,792 commuters, 14.8%).
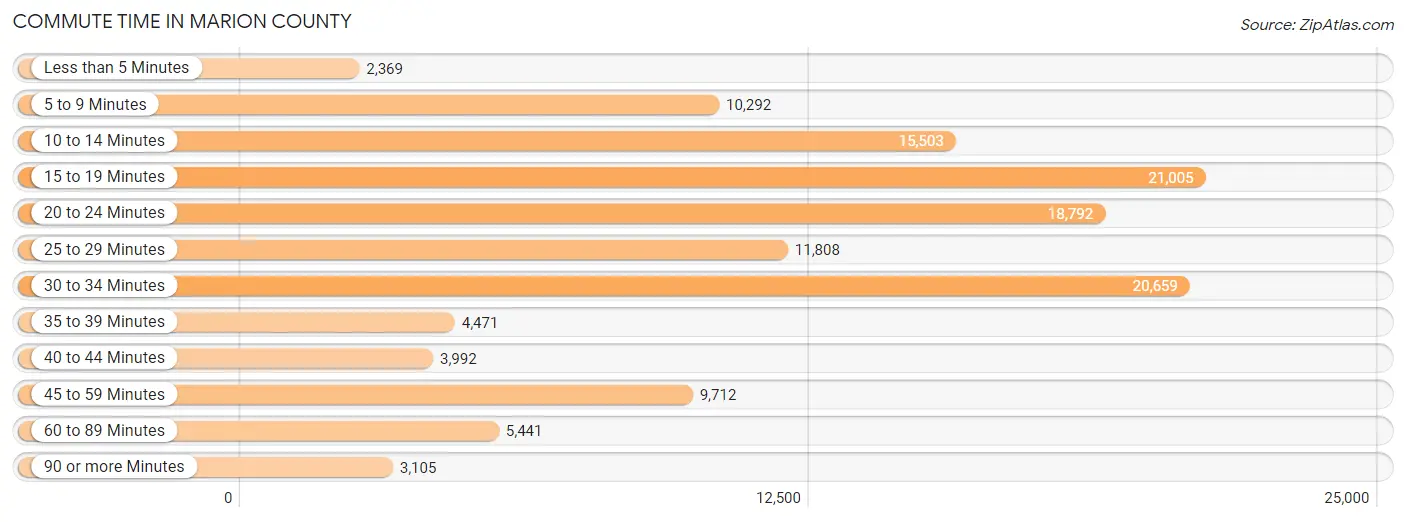
| Commute Time | # Commuters | % Commuters |
| Less than 5 Minutes | 2,369 | 1.9% |
| 5 to 9 Minutes | 10,292 | 8.1% |
| 10 to 14 Minutes | 15,503 | 12.2% |
| 15 to 19 Minutes | 21,005 | 16.5% |
| 20 to 24 Minutes | 18,792 | 14.8% |
| 25 to 29 Minutes | 11,808 | 9.3% |
| 30 to 34 Minutes | 20,659 | 16.3% |
| 35 to 39 Minutes | 4,471 | 3.5% |
| 40 to 44 Minutes | 3,992 | 3.1% |
| 45 to 59 Minutes | 9,712 | 7.6% |
| 60 to 89 Minutes | 5,441 | 4.3% |
| 90 or more Minutes | 3,105 | 2.4% |
Commute Time by Sex in Marion County
The most common commute times in Marion County are 30 to 34 minutes (11,309 commuters, 17.1%) for males and 15 to 19 minutes (10,199 commuters, 16.7%) for females.
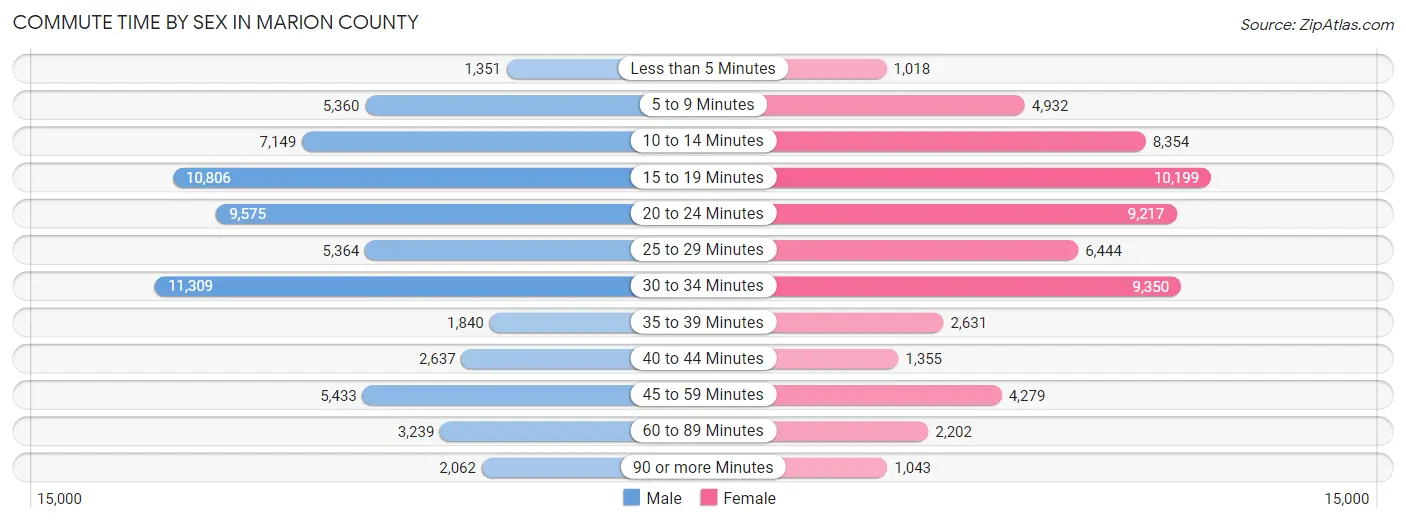
| Commute Time | Male | Female |
| Less than 5 Minutes | 1,351 (2.0%) | 1,018 (1.7%) |
| 5 to 9 Minutes | 5,360 (8.1%) | 4,932 (8.1%) |
| 10 to 14 Minutes | 7,149 (10.8%) | 8,354 (13.7%) |
| 15 to 19 Minutes | 10,806 (16.3%) | 10,199 (16.7%) |
| 20 to 24 Minutes | 9,575 (14.5%) | 9,217 (15.1%) |
| 25 to 29 Minutes | 5,364 (8.1%) | 6,444 (10.6%) |
| 30 to 34 Minutes | 11,309 (17.1%) | 9,350 (15.3%) |
| 35 to 39 Minutes | 1,840 (2.8%) | 2,631 (4.3%) |
| 40 to 44 Minutes | 2,637 (4.0%) | 1,355 (2.2%) |
| 45 to 59 Minutes | 5,433 (8.2%) | 4,279 (7.0%) |
| 60 to 89 Minutes | 3,239 (4.9%) | 2,202 (3.6%) |
| 90 or more Minutes | 2,062 (3.1%) | 1,043 (1.7%) |
Time of Departure to Work by Sex in Marion County
The most frequent times of departure to work in Marion County are 7:00 AM to 7:29 AM (8,942, 13.5%) for males and 7:00 AM to 7:29 AM (11,659, 19.1%) for females.
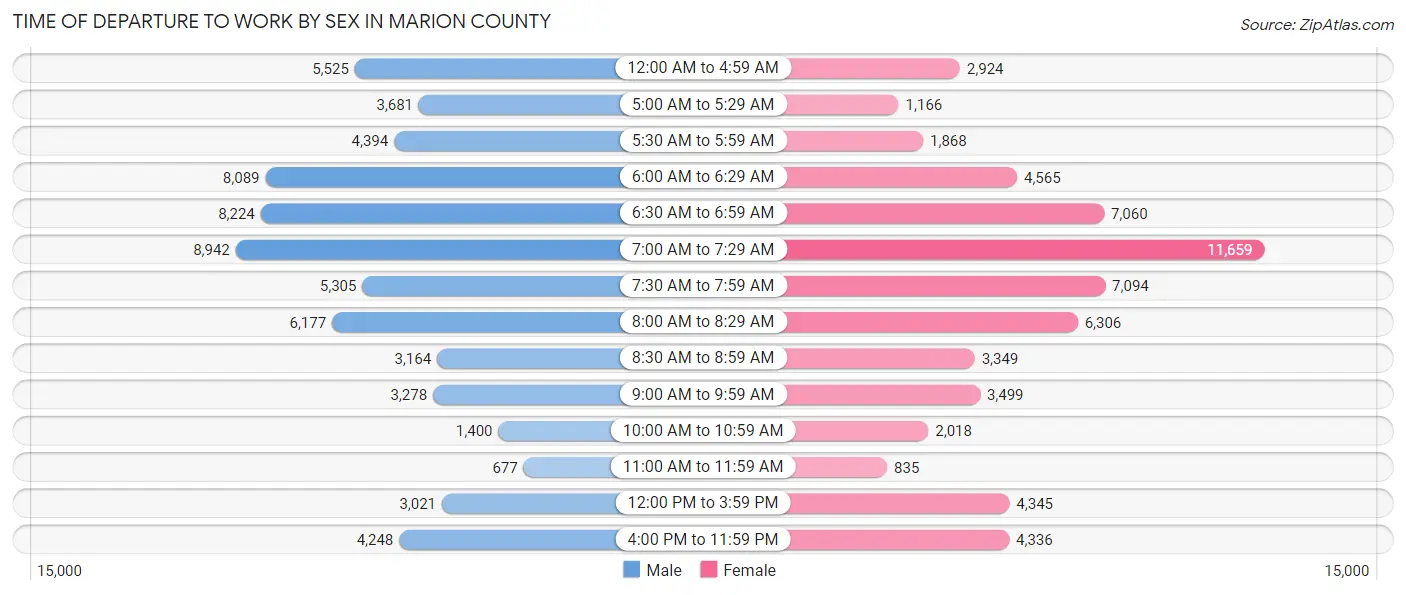
| Time of Departure | Male | Female |
| 12:00 AM to 4:59 AM | 5,525 (8.4%) | 2,924 (4.8%) |
| 5:00 AM to 5:29 AM | 3,681 (5.6%) | 1,166 (1.9%) |
| 5:30 AM to 5:59 AM | 4,394 (6.6%) | 1,868 (3.1%) |
| 6:00 AM to 6:29 AM | 8,089 (12.2%) | 4,565 (7.5%) |
| 6:30 AM to 6:59 AM | 8,224 (12.4%) | 7,060 (11.6%) |
| 7:00 AM to 7:29 AM | 8,942 (13.5%) | 11,659 (19.1%) |
| 7:30 AM to 7:59 AM | 5,305 (8.0%) | 7,094 (11.6%) |
| 8:00 AM to 8:29 AM | 6,177 (9.3%) | 6,306 (10.3%) |
| 8:30 AM to 8:59 AM | 3,164 (4.8%) | 3,349 (5.5%) |
| 9:00 AM to 9:59 AM | 3,278 (5.0%) | 3,499 (5.7%) |
| 10:00 AM to 10:59 AM | 1,400 (2.1%) | 2,018 (3.3%) |
| 11:00 AM to 11:59 AM | 677 (1.0%) | 835 (1.4%) |
| 12:00 PM to 3:59 PM | 3,021 (4.6%) | 4,345 (7.1%) |
| 4:00 PM to 11:59 PM | 4,248 (6.4%) | 4,336 (7.1%) |
| Total | 66,125 (100.0%) | 61,024 (100.0%) |
Housing Occupancy in Marion County
Occupancy by Ownership in Marion County
Of the total 154,996 dwellings in Marion County, owner-occupied units account for 118,521 (76.5%), while renter-occupied units make up 36,475 (23.5%).
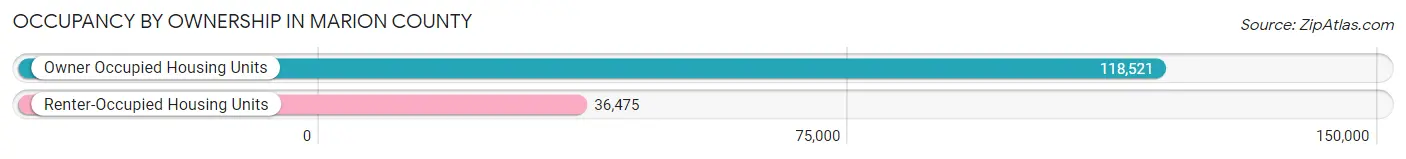
| Occupancy | # Housing Units | % Housing Units |
| Owner Occupied Housing Units | 118,521 | 76.5% |
| Renter-Occupied Housing Units | 36,475 | 23.5% |
| Total Occupied Housing Units | 154,996 | 100.0% |
Occupancy by Household Size in Marion County
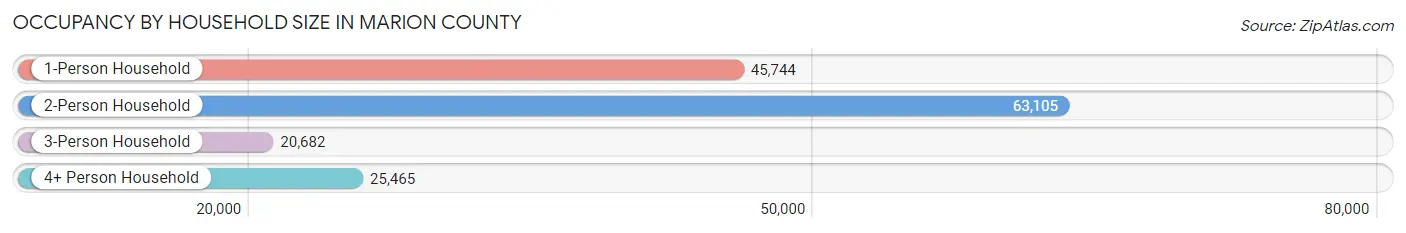
| Household Size | # Housing Units | % Housing Units |
| 1-Person Household | 45,744 | 29.5% |
| 2-Person Household | 63,105 | 40.7% |
| 3-Person Household | 20,682 | 13.3% |
| 4+ Person Household | 25,465 | 16.4% |
| Total Housing Units | 154,996 | 100.0% |
Occupancy by Ownership by Household Size in Marion County
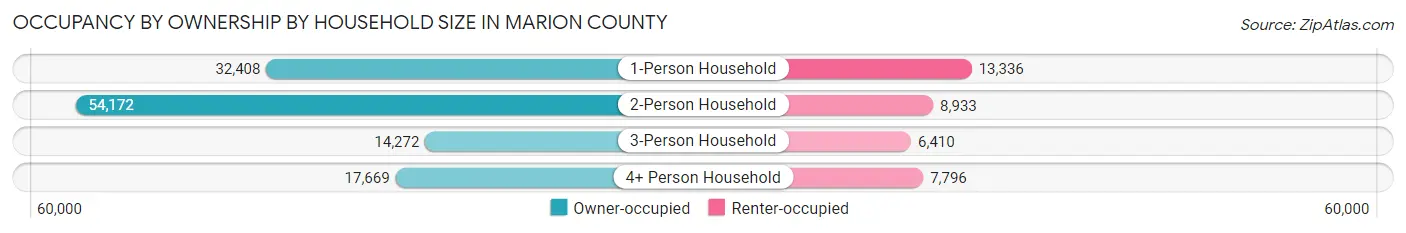
| Household Size | Owner-occupied | Renter-occupied |
| 1-Person Household | 32,408 (70.9%) | 13,336 (29.1%) |
| 2-Person Household | 54,172 (85.8%) | 8,933 (14.2%) |
| 3-Person Household | 14,272 (69.0%) | 6,410 (31.0%) |
| 4+ Person Household | 17,669 (69.4%) | 7,796 (30.6%) |
| Total Housing Units | 118,521 (76.5%) | 36,475 (23.5%) |
Occupancy by Educational Attainment in Marion County
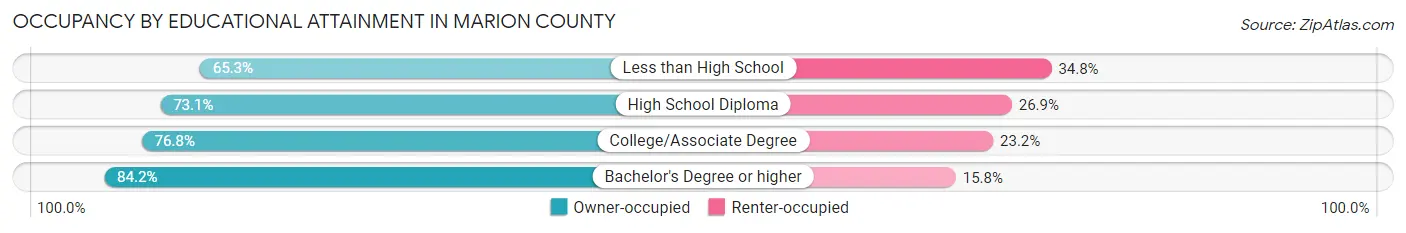
| Household Size | Owner-occupied | Renter-occupied |
| Less than High School | 9,137 (65.2%) | 4,866 (34.7%) |
| High School Diploma | 34,846 (73.1%) | 12,819 (26.9%) |
| College/Associate Degree | 42,108 (76.8%) | 12,714 (23.2%) |
| Bachelor's Degree or higher | 32,430 (84.2%) | 6,076 (15.8%) |
Occupancy by Age of Householder in Marion County
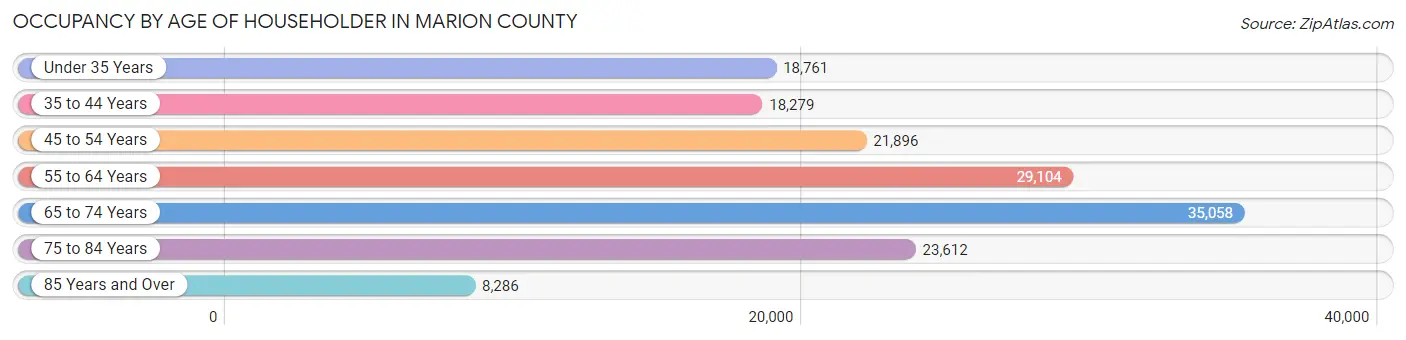
| Age Bracket | # Households | % Households |
| Under 35 Years | 18,761 | 12.1% |
| 35 to 44 Years | 18,279 | 11.8% |
| 45 to 54 Years | 21,896 | 14.1% |
| 55 to 64 Years | 29,104 | 18.8% |
| 65 to 74 Years | 35,058 | 22.6% |
| 75 to 84 Years | 23,612 | 15.2% |
| 85 Years and Over | 8,286 | 5.3% |
| Total | 154,996 | 100.0% |
Housing Finances in Marion County
Median Income by Occupancy in Marion County
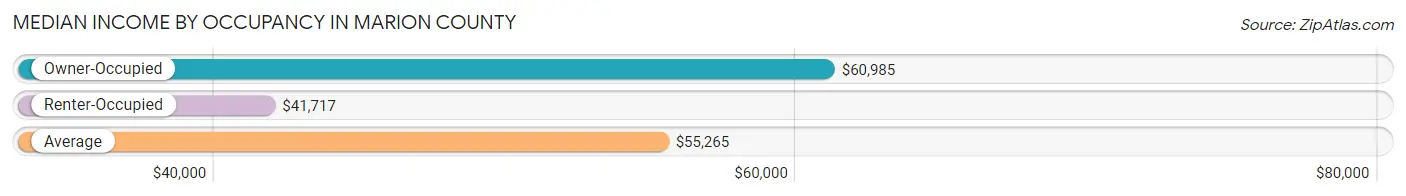
| Occupancy Type | # Households | Median Income |
| Owner-Occupied | 118,521 (76.5%) | $60,985 |
| Renter-Occupied | 36,475 (23.5%) | $41,717 |
| Average | 154,996 (100.0%) | $55,265 |
Occupancy by Householder Income Bracket in Marion County
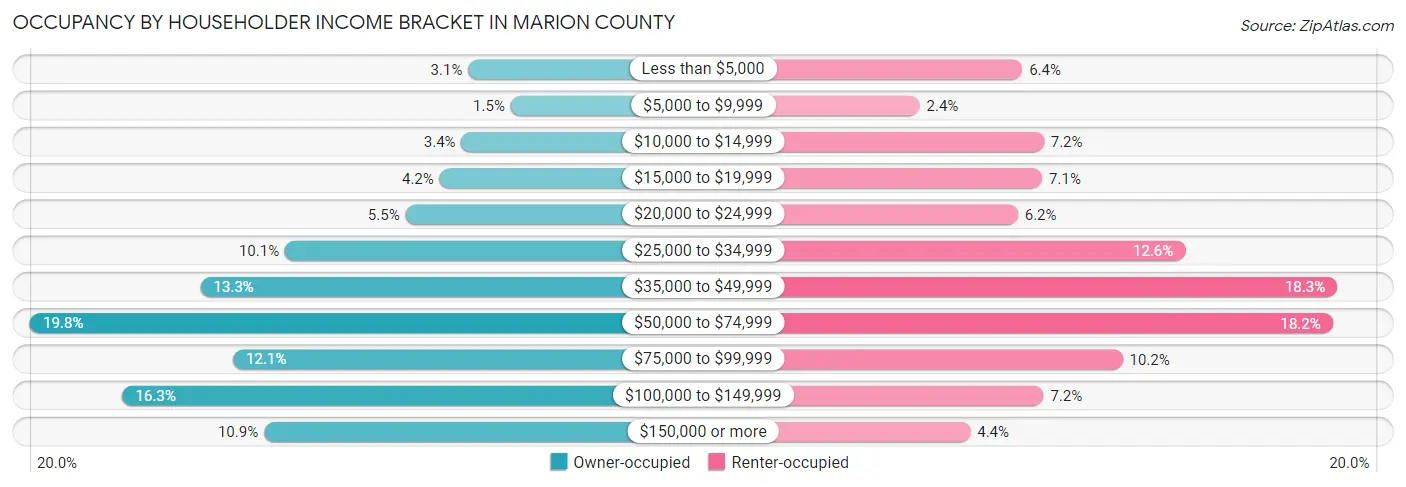
| Income Bracket | Owner-occupied | Renter-occupied |
| Less than $5,000 | 3,674 (3.1%) | 2,316 (6.4%) |
| $5,000 to $9,999 | 1,757 (1.5%) | 890 (2.4%) |
| $10,000 to $14,999 | 3,980 (3.4%) | 2,617 (7.2%) |
| $15,000 to $19,999 | 4,963 (4.2%) | 2,592 (7.1%) |
| $20,000 to $24,999 | 6,506 (5.5%) | 2,253 (6.2%) |
| $25,000 to $34,999 | 11,951 (10.1%) | 4,576 (12.6%) |
| $35,000 to $49,999 | 15,763 (13.3%) | 6,690 (18.3%) |
| $50,000 to $74,999 | 23,456 (19.8%) | 6,626 (18.2%) |
| $75,000 to $99,999 | 14,291 (12.1%) | 3,710 (10.2%) |
| $100,000 to $149,999 | 19,280 (16.3%) | 2,612 (7.2%) |
| $150,000 or more | 12,900 (10.9%) | 1,593 (4.4%) |
| Total | 118,521 (100.0%) | 36,475 (100.0%) |
Monthly Housing Cost Tiers in Marion County
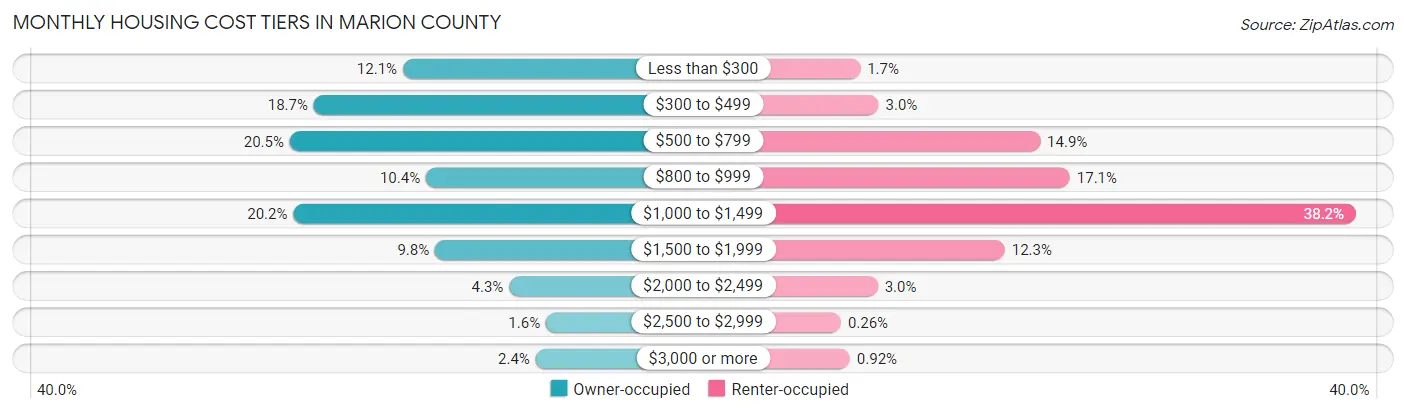
| Monthly Cost | Owner-occupied | Renter-occupied |
| Less than $300 | 14,384 (12.1%) | 612 (1.7%) |
| $300 to $499 | 22,168 (18.7%) | 1,107 (3.0%) |
| $500 to $799 | 24,264 (20.5%) | 5,447 (14.9%) |
| $800 to $999 | 12,376 (10.4%) | 6,246 (17.1%) |
| $1,000 to $1,499 | 23,949 (20.2%) | 13,925 (38.2%) |
| $1,500 to $1,999 | 11,578 (9.8%) | 4,498 (12.3%) |
| $2,000 to $2,499 | 5,103 (4.3%) | 1,082 (3.0%) |
| $2,500 to $2,999 | 1,896 (1.6%) | 94 (0.3%) |
| $3,000 or more | 2,803 (2.4%) | 334 (0.9%) |
| Total | 118,521 (100.0%) | 36,475 (100.0%) |
Physical Housing Characteristics in Marion County
Housing Structures in Marion County
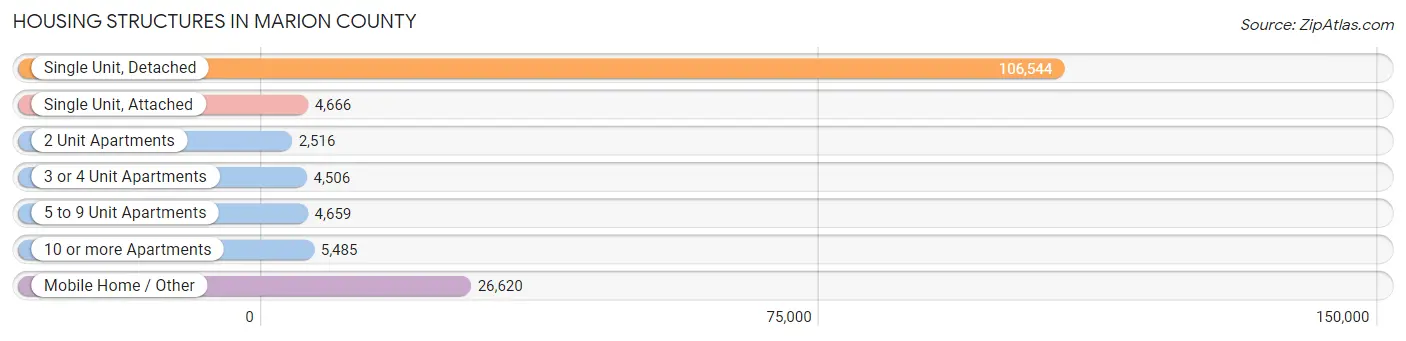
| Structure Type | # Housing Units | % Housing Units |
| Single Unit, Detached | 106,544 | 68.7% |
| Single Unit, Attached | 4,666 | 3.0% |
| 2 Unit Apartments | 2,516 | 1.6% |
| 3 or 4 Unit Apartments | 4,506 | 2.9% |
| 5 to 9 Unit Apartments | 4,659 | 3.0% |
| 10 or more Apartments | 5,485 | 3.5% |
| Mobile Home / Other | 26,620 | 17.2% |
| Total | 154,996 | 100.0% |
Housing Structures by Occupancy in Marion County
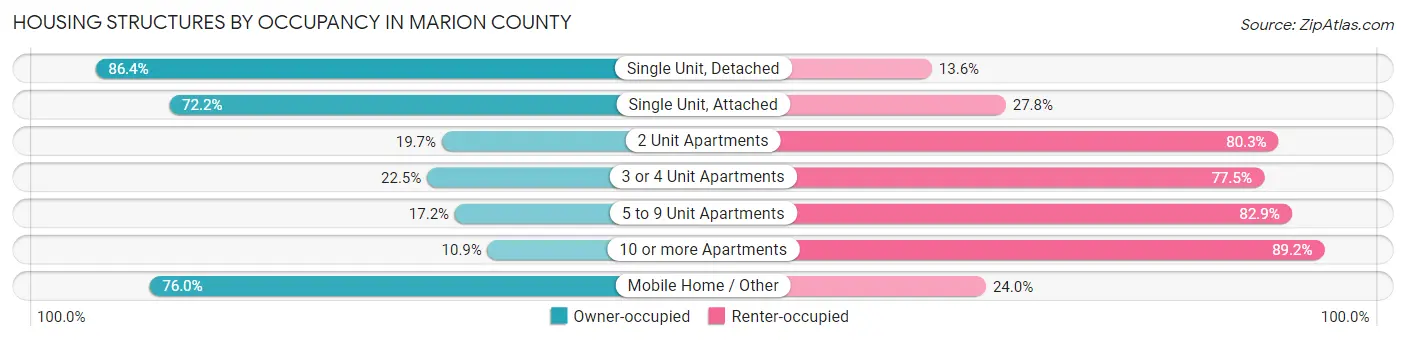
| Structure Type | Owner-occupied | Renter-occupied |
| Single Unit, Detached | 92,028 (86.4%) | 14,516 (13.6%) |
| Single Unit, Attached | 3,367 (72.2%) | 1,299 (27.8%) |
| 2 Unit Apartments | 495 (19.7%) | 2,021 (80.3%) |
| 3 or 4 Unit Apartments | 1,014 (22.5%) | 3,492 (77.5%) |
| 5 to 9 Unit Apartments | 799 (17.2%) | 3,860 (82.9%) |
| 10 or more Apartments | 595 (10.8%) | 4,890 (89.1%) |
| Mobile Home / Other | 20,223 (76.0%) | 6,397 (24.0%) |
| Total | 118,521 (76.5%) | 36,475 (23.5%) |
Housing Structures by Number of Rooms in Marion County
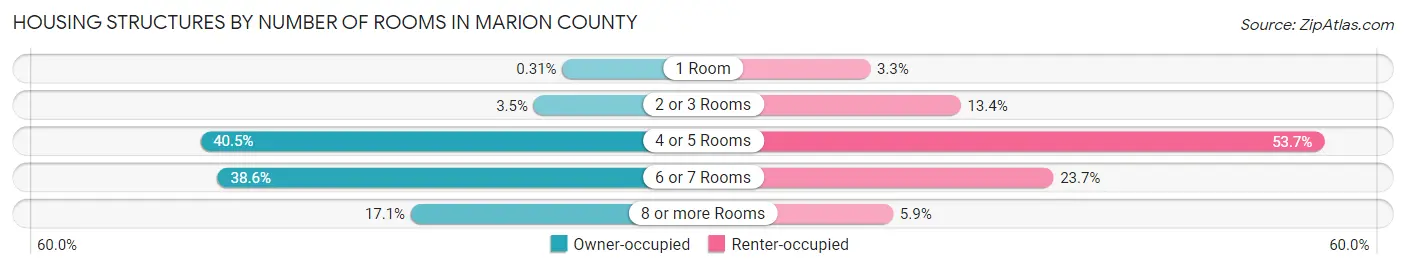
| Number of Rooms | Owner-occupied | Renter-occupied |
| 1 Room | 368 (0.3%) | 1,214 (3.3%) |
| 2 or 3 Rooms | 4,133 (3.5%) | 4,881 (13.4%) |
| 4 or 5 Rooms | 48,016 (40.5%) | 19,600 (53.7%) |
| 6 or 7 Rooms | 45,718 (38.6%) | 8,634 (23.7%) |
| 8 or more Rooms | 20,286 (17.1%) | 2,146 (5.9%) |
| Total | 118,521 (100.0%) | 36,475 (100.0%) |
Housing Structure by Heating Type in Marion County
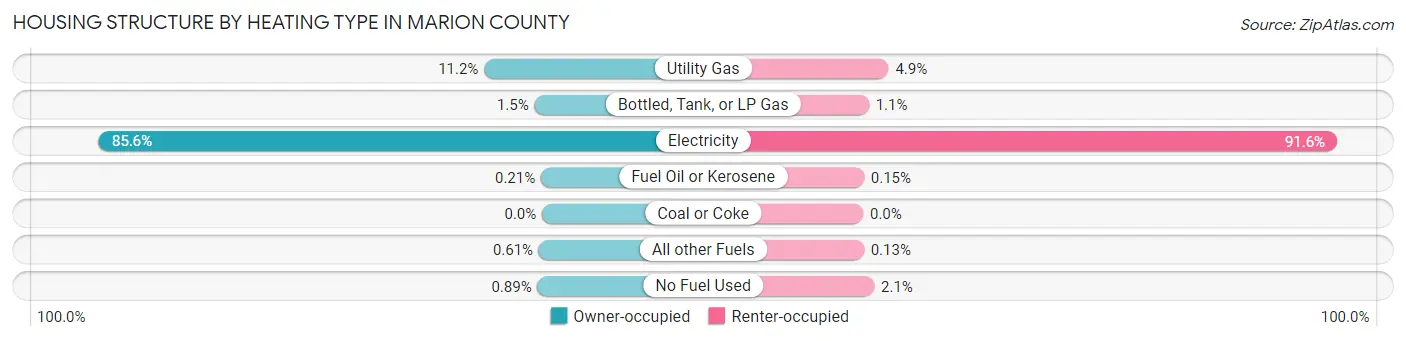
| Heating Type | Owner-occupied | Renter-occupied |
| Utility Gas | 13,266 (11.2%) | 1,796 (4.9%) |
| Bottled, Tank, or LP Gas | 1,725 (1.5%) | 400 (1.1%) |
| Electricity | 101,499 (85.6%) | 33,400 (91.6%) |
| Fuel Oil or Kerosene | 247 (0.2%) | 56 (0.2%) |
| Coal or Coke | 0 (0.0%) | 1 (0.0%) |
| All other Fuels | 727 (0.6%) | 46 (0.1%) |
| No Fuel Used | 1,057 (0.9%) | 776 (2.1%) |
| Total | 118,521 (100.0%) | 36,475 (100.0%) |
Household Vehicle Usage in Marion County
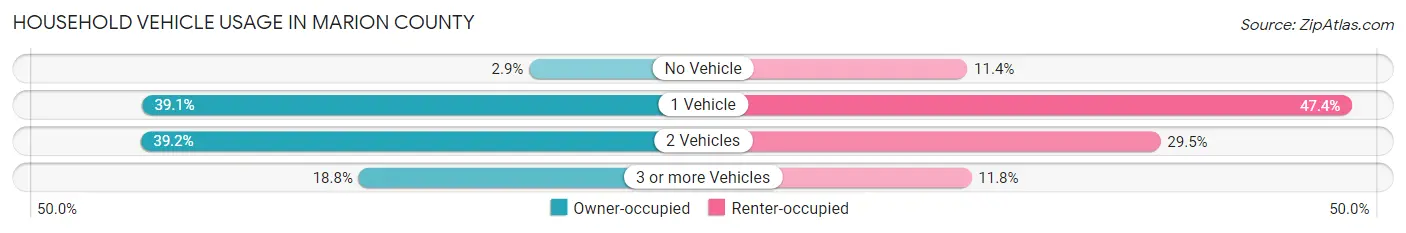
| Vehicles per Household | Owner-occupied | Renter-occupied |
| No Vehicle | 3,436 (2.9%) | 4,161 (11.4%) |
| 1 Vehicle | 46,330 (39.1%) | 17,270 (47.3%) |
| 2 Vehicles | 46,466 (39.2%) | 10,741 (29.4%) |
| 3 or more Vehicles | 22,289 (18.8%) | 4,303 (11.8%) |
| Total | 118,521 (100.0%) | 36,475 (100.0%) |
Real Estate & Mortgages in Marion County
Real Estate and Mortgage Overview in Marion County
| Characteristic | Without Mortgage | With Mortgage |
| Housing Units | 59,107 | 59,414 |
| Median Property Value | $172,300 | $213,100 |
| Median Household Income | $47,885 | $8,880 |
| Monthly Housing Costs | $437 | $2,720 |
| Real Estate Taxes | $1,375 | $1,574 |
Property Value by Mortgage Status in Marion County
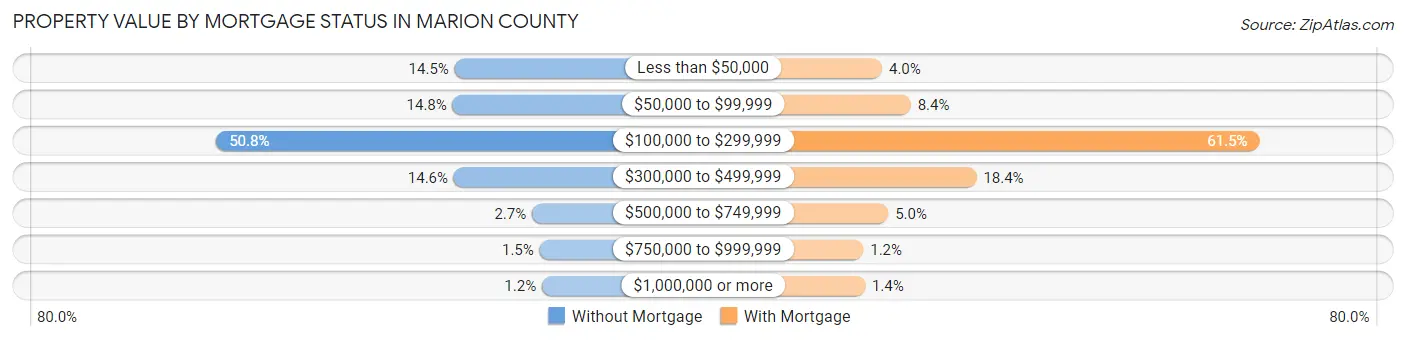
| Property Value | Without Mortgage | With Mortgage |
| Less than $50,000 | 8,553 (14.5%) | 2,398 (4.0%) |
| $50,000 to $99,999 | 8,736 (14.8%) | 4,998 (8.4%) |
| $100,000 to $299,999 | 30,029 (50.8%) | 36,563 (61.5%) |
| $300,000 to $499,999 | 8,623 (14.6%) | 10,942 (18.4%) |
| $500,000 to $749,999 | 1,583 (2.7%) | 2,958 (5.0%) |
| $750,000 to $999,999 | 896 (1.5%) | 701 (1.2%) |
| $1,000,000 or more | 687 (1.2%) | 854 (1.4%) |
| Total | 59,107 (100.0%) | 59,414 (100.0%) |
Household Income by Mortgage Status in Marion County
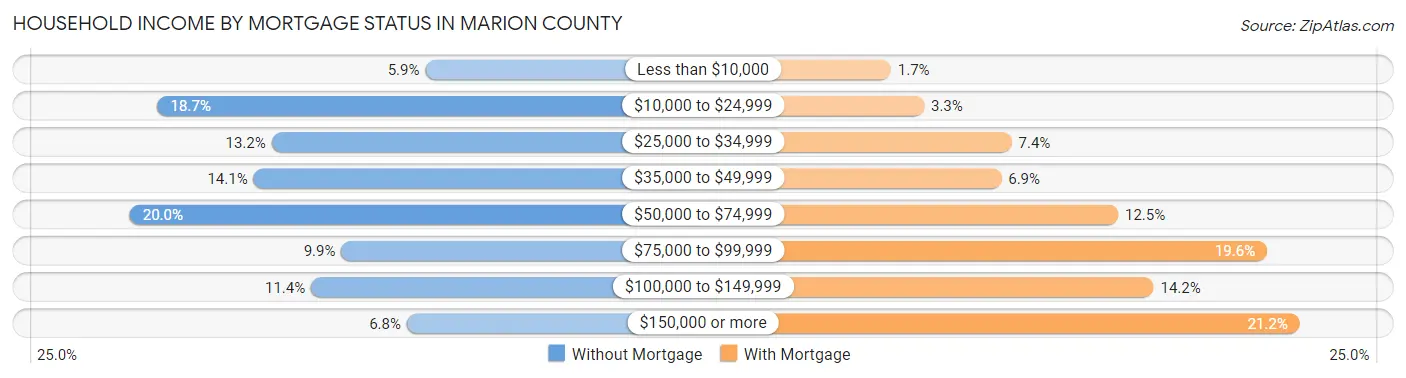
| Household Income | Without Mortgage | With Mortgage |
| Less than $10,000 | 3,497 (5.9%) | 1,000 (1.7%) |
| $10,000 to $24,999 | 11,033 (18.7%) | 1,934 (3.3%) |
| $25,000 to $34,999 | 7,828 (13.2%) | 4,416 (7.4%) |
| $35,000 to $49,999 | 8,336 (14.1%) | 4,123 (6.9%) |
| $50,000 to $74,999 | 11,817 (20.0%) | 7,427 (12.5%) |
| $75,000 to $99,999 | 5,862 (9.9%) | 11,639 (19.6%) |
| $100,000 to $149,999 | 6,714 (11.4%) | 8,429 (14.2%) |
| $150,000 or more | 4,020 (6.8%) | 12,566 (21.1%) |
| Total | 59,107 (100.0%) | 59,414 (100.0%) |
Property Value to Household Income Ratio in Marion County
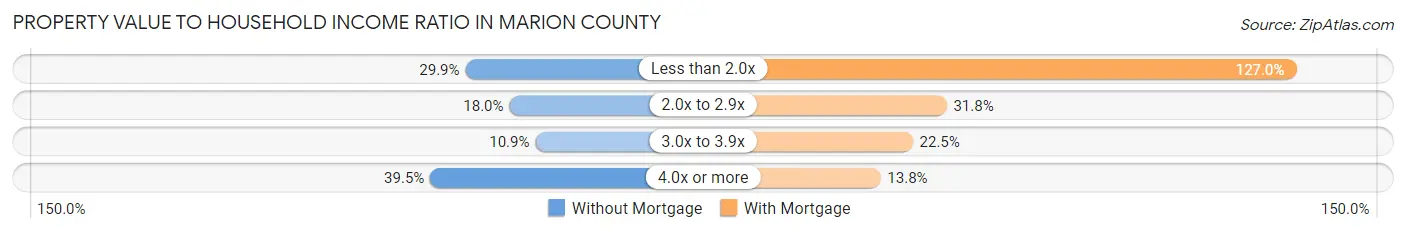
| Value-to-Income Ratio | Without Mortgage | With Mortgage |
| Less than 2.0x | 17,693 (29.9%) | 75,470 (127.0%) |
| 2.0x to 2.9x | 10,607 (17.9%) | 18,866 (31.8%) |
| 3.0x to 3.9x | 6,423 (10.9%) | 13,383 (22.5%) |
| 4.0x or more | 23,360 (39.5%) | 8,169 (13.8%) |
| Total | 59,107 (100.0%) | 59,414 (100.0%) |
Real Estate Taxes by Mortgage Status in Marion County
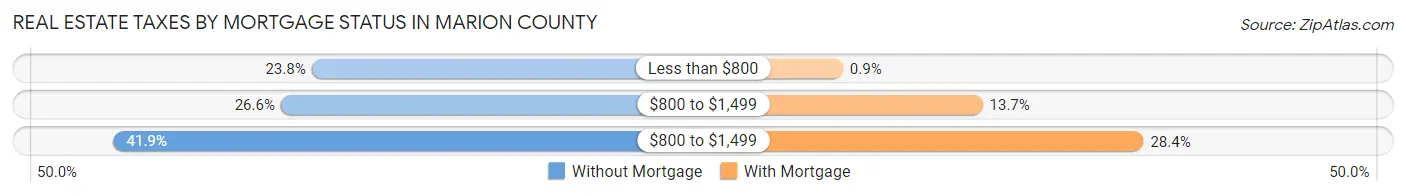
| Property Taxes | Without Mortgage | With Mortgage |
| Less than $800 | 14,070 (23.8%) | 537 (0.9%) |
| $800 to $1,499 | 15,727 (26.6%) | 8,114 (13.7%) |
| $800 to $1,499 | 24,746 (41.9%) | 16,843 (28.3%) |
| Total | 59,107 (100.0%) | 59,414 (100.0%) |
Health & Disability in Marion County
Health Insurance Coverage by Age in Marion County
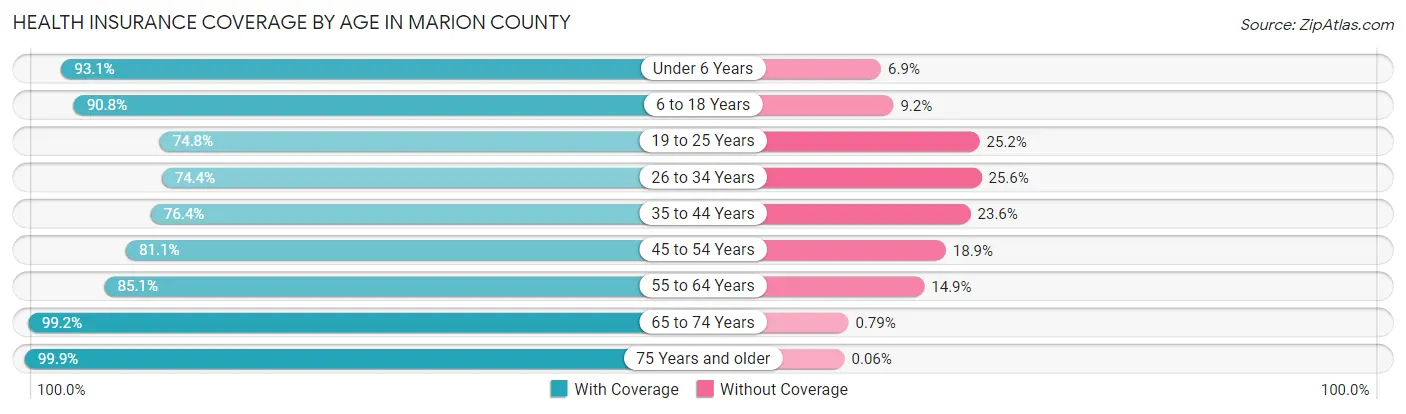
| Age Bracket | With Coverage | Without Coverage |
| Under 6 Years | 19,643 (93.1%) | 1,449 (6.9%) |
| 6 to 18 Years | 48,202 (90.8%) | 4,865 (9.2%) |
| 19 to 25 Years | 19,057 (74.8%) | 6,429 (25.2%) |
| 26 to 34 Years | 26,158 (74.4%) | 8,994 (25.6%) |
| 35 to 44 Years | 27,749 (76.4%) | 8,555 (23.6%) |
| 45 to 54 Years | 32,723 (81.1%) | 7,647 (18.9%) |
| 55 to 64 Years | 43,531 (85.1%) | 7,638 (14.9%) |
| 65 to 74 Years | 57,423 (99.2%) | 459 (0.8%) |
| 75 Years and older | 49,498 (99.9%) | 32 (0.1%) |
| Total | 323,984 (87.5%) | 46,068 (12.4%) |
Health Insurance Coverage by Citizenship Status in Marion County
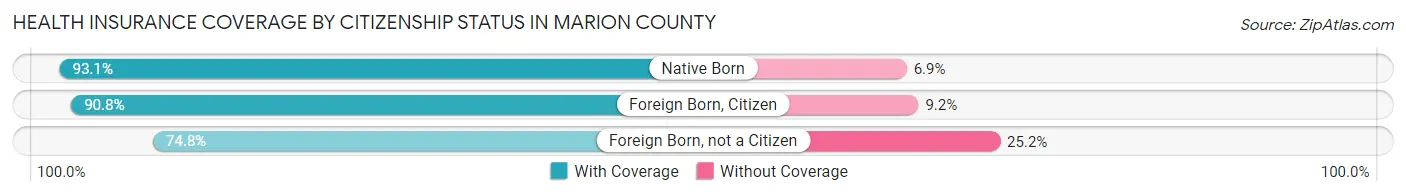
| Citizenship Status | With Coverage | Without Coverage |
| Native Born | 19,643 (93.1%) | 1,449 (6.9%) |
| Foreign Born, Citizen | 48,202 (90.8%) | 4,865 (9.2%) |
| Foreign Born, not a Citizen | 19,057 (74.8%) | 6,429 (25.2%) |
Health Insurance Coverage by Household Income in Marion County
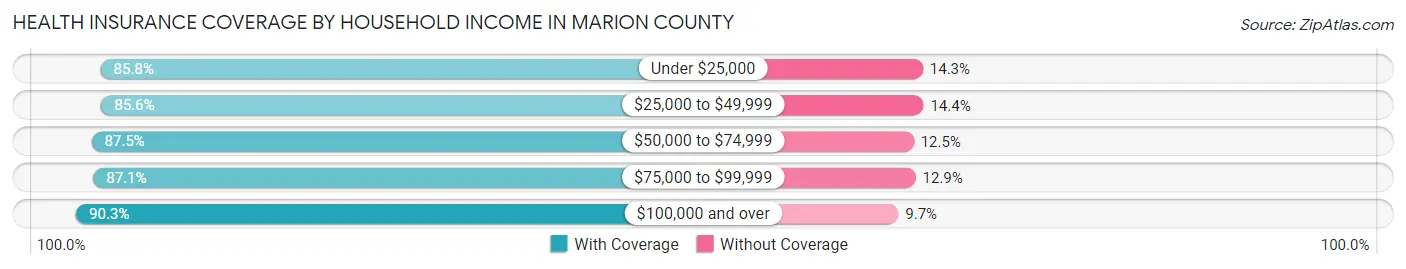
| Household Income | With Coverage | Without Coverage |
| Under $25,000 | 46,274 (85.8%) | 7,689 (14.2%) |
| $25,000 to $49,999 | 68,832 (85.6%) | 11,553 (14.4%) |
| $50,000 to $74,999 | 67,722 (87.5%) | 9,700 (12.5%) |
| $75,000 to $99,999 | 41,944 (87.1%) | 6,205 (12.9%) |
| $100,000 and over | 98,798 (90.3%) | 10,563 (9.7%) |
Public vs Private Health Insurance Coverage by Age in Marion County
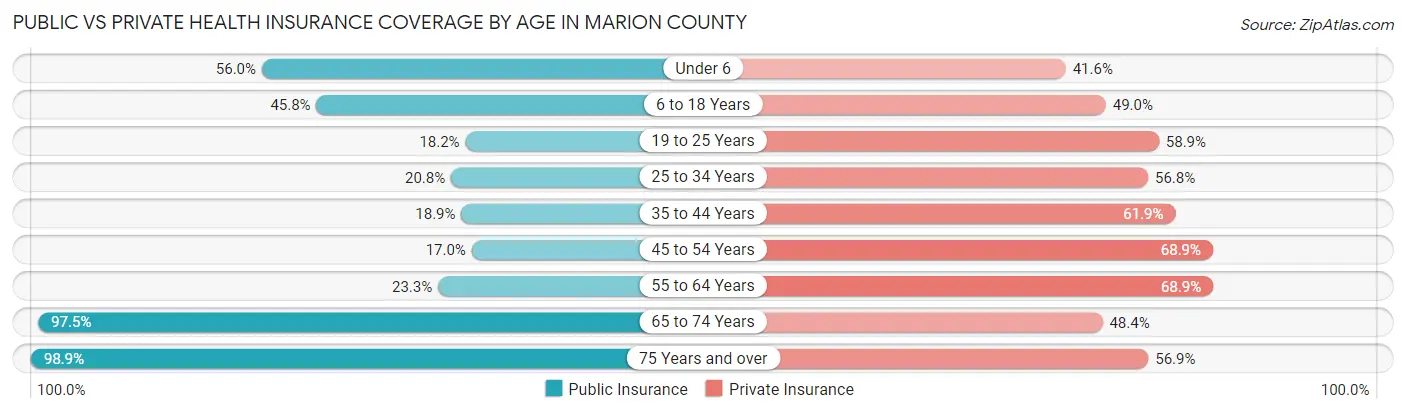
| Age Bracket | Public Insurance | Private Insurance |
| Under 6 | 11,803 (56.0%) | 8,768 (41.6%) |
| 6 to 18 Years | 24,319 (45.8%) | 26,001 (49.0%) |
| 19 to 25 Years | 4,632 (18.2%) | 14,998 (58.9%) |
| 25 to 34 Years | 7,326 (20.8%) | 19,980 (56.8%) |
| 35 to 44 Years | 6,871 (18.9%) | 22,475 (61.9%) |
| 45 to 54 Years | 6,866 (17.0%) | 27,801 (68.9%) |
| 55 to 64 Years | 11,904 (23.3%) | 35,263 (68.9%) |
| 65 to 74 Years | 56,432 (97.5%) | 28,007 (48.4%) |
| 75 Years and over | 48,960 (98.9%) | 28,179 (56.9%) |
| Total | 179,113 (48.4%) | 211,472 (57.2%) |
Disability Status by Sex by Age in Marion County
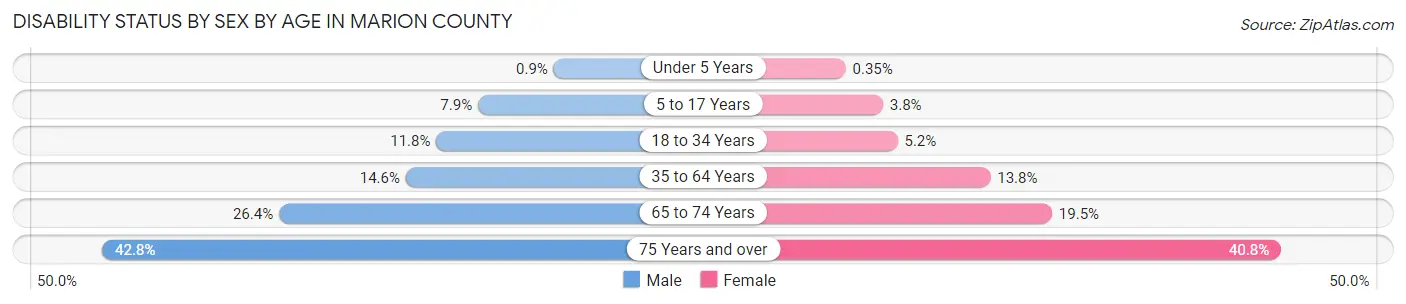
| Age Bracket | Male | Female |
| Under 5 Years | 83 (0.9%) | 30 (0.4%) |
| 5 to 17 Years | 2,131 (7.9%) | 976 (3.8%) |
| 18 to 34 Years | 3,840 (11.8%) | 1,648 (5.2%) |
| 35 to 64 Years | 8,884 (14.6%) | 9,238 (13.8%) |
| 65 to 74 Years | 7,030 (26.4%) | 6,093 (19.5%) |
| 75 Years and over | 9,787 (42.8%) | 10,872 (40.8%) |
Disability Class by Sex by Age in Marion County
Disability Class: Hearing Difficulty
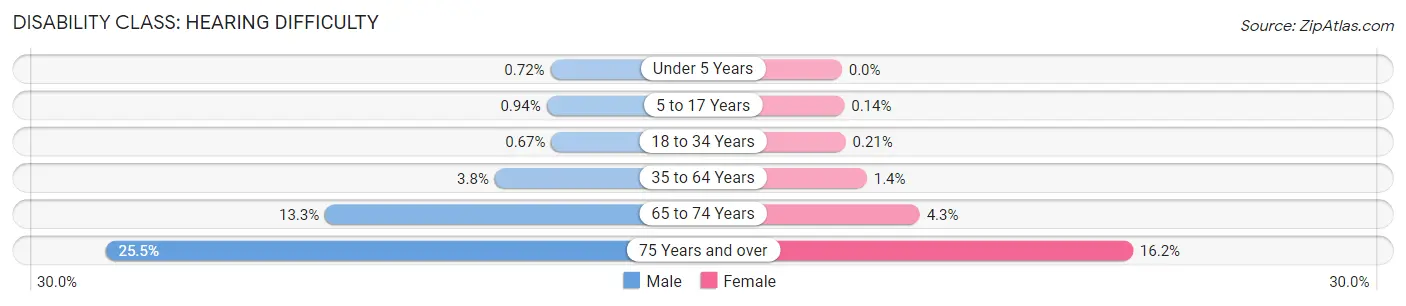
| Age Bracket | Male | Female |
| Under 5 Years | 66 (0.7%) | 0 (0.0%) |
| 5 to 17 Years | 252 (0.9%) | 35 (0.1%) |
| 18 to 34 Years | 219 (0.7%) | 67 (0.2%) |
| 35 to 64 Years | 2,322 (3.8%) | 932 (1.4%) |
| 65 to 74 Years | 3,534 (13.3%) | 1,357 (4.3%) |
| 75 Years and over | 5,828 (25.5%) | 4,322 (16.2%) |
Disability Class: Vision Difficulty
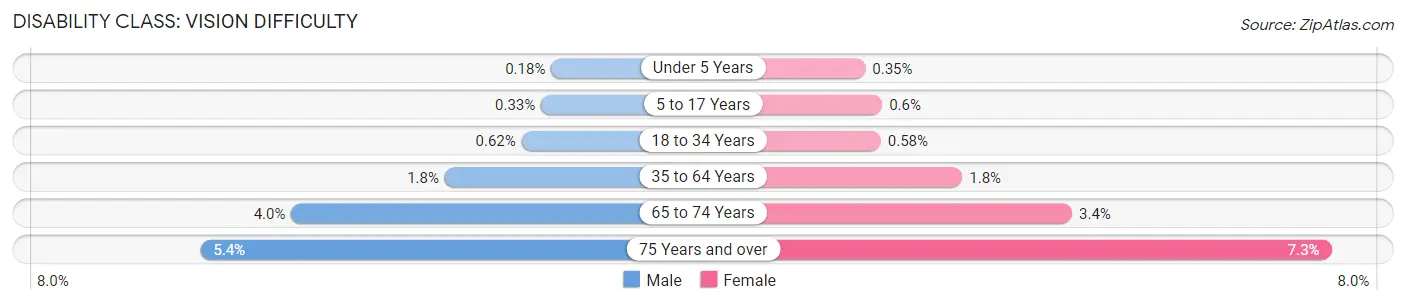
| Age Bracket | Male | Female |
| Under 5 Years | 17 (0.2%) | 30 (0.4%) |
| 5 to 17 Years | 89 (0.3%) | 153 (0.6%) |
| 18 to 34 Years | 201 (0.6%) | 186 (0.6%) |
| 35 to 64 Years | 1,068 (1.8%) | 1,202 (1.8%) |
| 65 to 74 Years | 1,077 (4.0%) | 1,069 (3.4%) |
| 75 Years and over | 1,232 (5.4%) | 1,940 (7.3%) |
Disability Class: Cognitive Difficulty
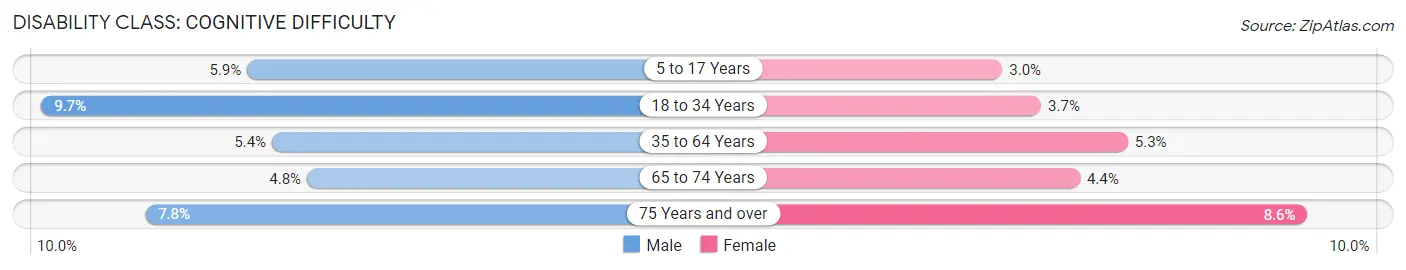
| Age Bracket | Male | Female |
| 5 to 17 Years | 1,581 (5.9%) | 762 (3.0%) |
| 18 to 34 Years | 3,154 (9.7%) | 1,178 (3.7%) |
| 35 to 64 Years | 3,287 (5.4%) | 3,560 (5.3%) |
| 65 to 74 Years | 1,268 (4.8%) | 1,382 (4.4%) |
| 75 Years and over | 1,775 (7.8%) | 2,305 (8.6%) |
Disability Class: Ambulatory Difficulty
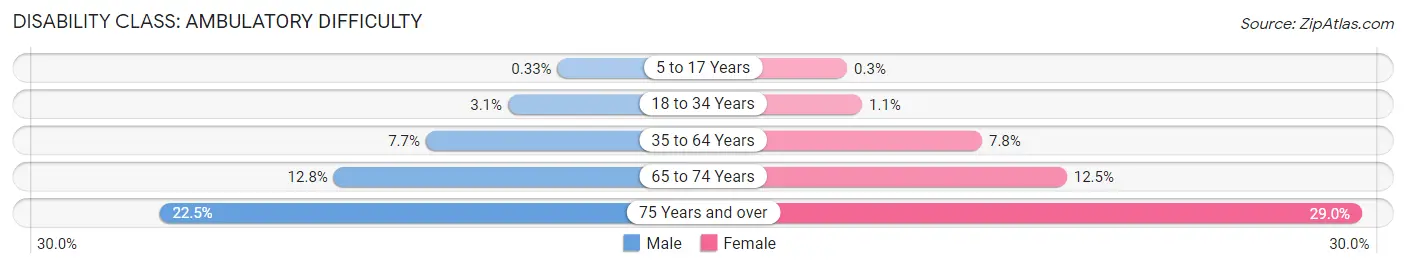
| Age Bracket | Male | Female |
| 5 to 17 Years | 88 (0.3%) | 77 (0.3%) |
| 18 to 34 Years | 1,005 (3.1%) | 360 (1.1%) |
| 35 to 64 Years | 4,656 (7.7%) | 5,235 (7.8%) |
| 65 to 74 Years | 3,408 (12.8%) | 3,914 (12.5%) |
| 75 Years and over | 5,141 (22.5%) | 7,724 (29.0%) |
Disability Class: Self-Care Difficulty
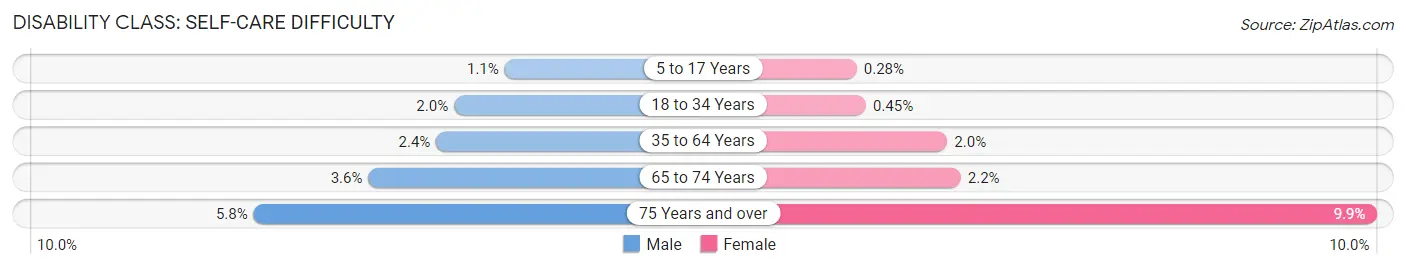
| Age Bracket | Male | Female |
| 5 to 17 Years | 293 (1.1%) | 72 (0.3%) |
| 18 to 34 Years | 661 (2.0%) | 143 (0.4%) |
| 35 to 64 Years | 1,436 (2.4%) | 1,315 (2.0%) |
| 65 to 74 Years | 965 (3.6%) | 691 (2.2%) |
| 75 Years and over | 1,315 (5.8%) | 2,651 (9.9%) |
Technology Access in Marion County
Computing Device Access in Marion County
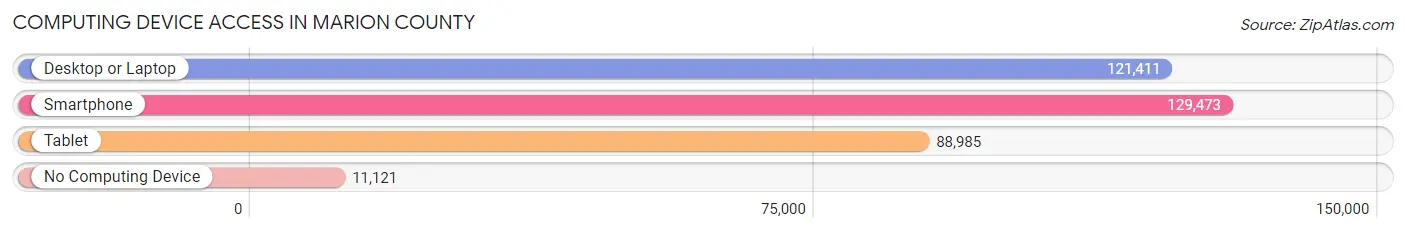
| Device Type | # Households | % Households |
| Desktop or Laptop | 121,411 | 78.3% |
| Smartphone | 129,473 | 83.5% |
| Tablet | 88,985 | 57.4% |
| No Computing Device | 11,121 | 7.2% |
| Total | 154,996 | 100.0% |
Internet Access in Marion County
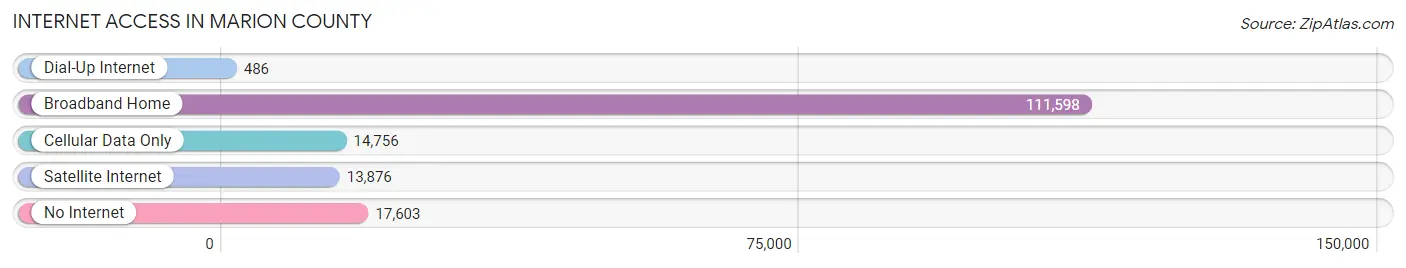
| Internet Type | # Households | % Households |
| Dial-Up Internet | 486 | 0.3% |
| Broadband Home | 111,598 | 72.0% |
| Cellular Data Only | 14,756 | 9.5% |
| Satellite Internet | 13,876 | 8.9% |
| No Internet | 17,603 | 11.4% |
| Total | 154,996 | 100.0% |
Marion County Summary
Marion County, Florida is located in the north-central part of the state and is part of the Ocala Metropolitan Statistical Area. The county was established in 1844 and is named after General Francis Marion, a Revolutionary War hero. The county seat is Ocala, which is also the largest city in the county.
Geography
Marion County is located in the north-central part of Florida and is bordered by Alachua, Levy, Citrus, Sumter, Lake, and Putnam counties. The county covers an area of 1,663 square miles and is the fifth-largest county in the state. The terrain is mostly flat with some rolling hills and is mostly covered in pine forests. The Ocklawaha River runs through the county and is a major source of recreation.
The climate of Marion County is humid subtropical with hot, humid summers and mild winters. The average annual temperature is 71 degrees Fahrenheit and the average annual precipitation is 51 inches.
Demographics
As of the 2010 census, Marion County had a population of 331,298. The population is made up of a diverse mix of races and ethnicities, with the largest groups being White (77.2%), African American (14.2%), Hispanic or Latino (7.2%), and Asian (1.2%). The median household income is $45,890 and the median age is 40.
Economy
Marion County’s economy is largely based on agriculture, with the main crops being citrus, vegetables, and hay. The county is also home to several large manufacturing companies, including Lockheed Martin, Procter & Gamble, and Coca-Cola. Tourism is also an important part of the economy, with Silver Springs State Park and the Ocala National Forest being popular destinations.
History
Marion County was established in 1844 and was named after General Francis Marion, a Revolutionary War hero. The county was originally part of Alachua County and was created to provide better access to the county seat in Ocala.
In the late 19th century, the county was a major producer of citrus and other agricultural products. The county was also home to several large phosphate mines, which provided jobs for many of the county’s residents.
In the early 20th century, the county experienced a population boom due to the arrival of the railroad and the development of the tourism industry. The county was also home to several large manufacturing companies, which provided jobs for many of the county’s residents.
Today, Marion County is a vibrant and diverse community with a strong economy and a rich history. The county is home to several large companies, a thriving tourism industry, and a diverse population.
Common Questions
What is Per Capita Income in Marion County?
Per Capita income in Marion County is $31,086.
What is the Median Family Income in Marion County?
Median Family Income in Marion County is $66,666.
What is the Median Household income in Marion County?
Median Household Income in Marion County is $55,265.
What is Income or Wage Gap in Marion County?
Income or Wage Gap in Marion County is 20.5%.
Women in Marion County earn 79.5 cents for every dollar earned by a man.
What is Family Income Deficit in Marion County?
Family Income Deficit in Marion County is $10,351.
Families that are below poverty line in Marion County earn $10,351 less on average than the poverty threshold level.
What is Inequality or Gini Index in Marion County?
Inequality or Gini Index in Marion County is 0.45.
What is the Total Population of Marion County?
Total Population of Marion County is 378,225.
What is the Total Male Population of Marion County?
Total Male Population of Marion County is 182,704.
What is the Total Female Population of Marion County?
Total Female Population of Marion County is 195,521.
What is the Ratio of Males per 100 Females in Marion County?
There are 93.44 Males per 100 Females in Marion County.
What is the Ratio of Females per 100 Males in Marion County?
There are 107.02 Females per 100 Males in Marion County.
What is the Median Population Age in Marion County?
Median Population Age in Marion County is 48.5 Years.
What is the Average Family Size in Marion County
Average Family Size in Marion County is 2.9 People.
What is the Average Household Size in Marion County
Average Household Size in Marion County is 2.4 People.
How Large is the Labor Force in Marion County?
There are 151,558 People in the Labor Forcein in Marion County.
What is the Percentage of People in the Labor Force in Marion County?
47.9% of People are in the Labor Force in Marion County.
What is the Unemployment Rate in Marion County?
Unemployment Rate in Marion County is 5.9%.