Lake County, FL Map & Demographics
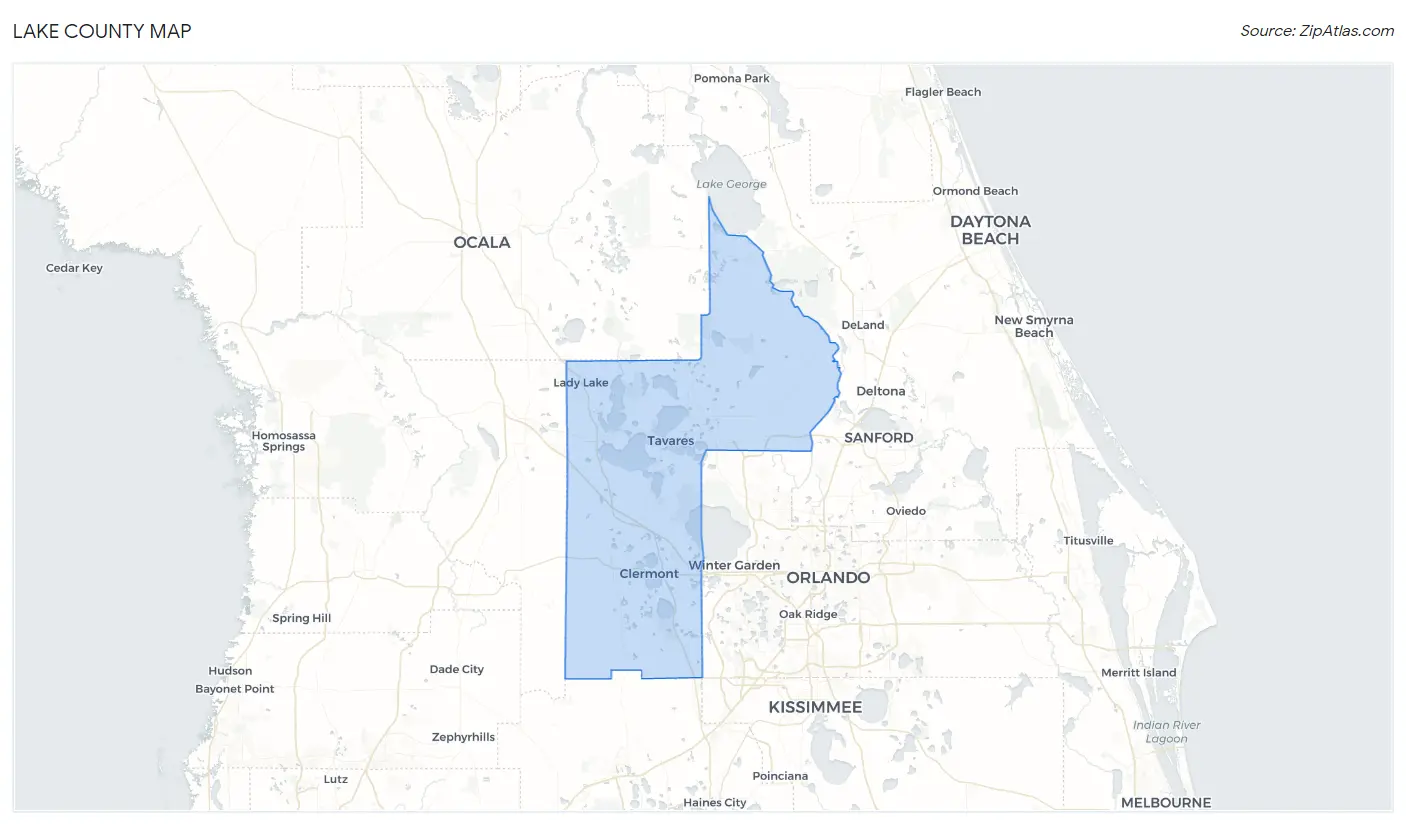
Lake County Map
Lake County Overview
$35,150
PER CAPITA INCOME
$80,569
AVG FAMILY INCOME
$66,239
AVG HOUSEHOLD INCOME
25.5%
WAGE / INCOME GAP [ % ]
74.5¢/ $1
WAGE / INCOME GAP [ $ ]
$10,162
FAMILY INCOME DEFICIT
0.43
INEQUALITY / GINI INDEX
386,829
TOTAL POPULATION
188,572
MALE POPULATION
198,257
FEMALE POPULATION
95.11
MALES / 100 FEMALES
105.14
FEMALES / 100 MALES
46.9
MEDIAN AGE
3.0
AVG FAMILY SIZE
2.5
AVG HOUSEHOLD SIZE
172,943
LABOR FORCE [ PEOPLE ]
53.7%
PERCENT IN LABOR FORCE
5.5%
UNEMPLOYMENT RATE
Income in Lake County
Income Overview in Lake County
Per Capita Income in Lake County is $35,150, while median incomes of families and households are $80,569 and $66,239 respectively.
| Characteristic | Number | Measure |
| Per Capita Income | 386,829 | $35,150 |
| Median Family Income | 106,147 | $80,569 |
| Mean Family Income | 106,147 | $100,288 |
| Median Household Income | 153,817 | $66,239 |
| Mean Household Income | 153,817 | $86,578 |
| Income Deficit | 106,147 | $10,162 |
| Wage / Income Gap (%) | 386,829 | 25.53% |
| Wage / Income Gap ($) | 386,829 | 74.47¢ per $1 |
| Gini / Inequality Index | 386,829 | 0.43 |
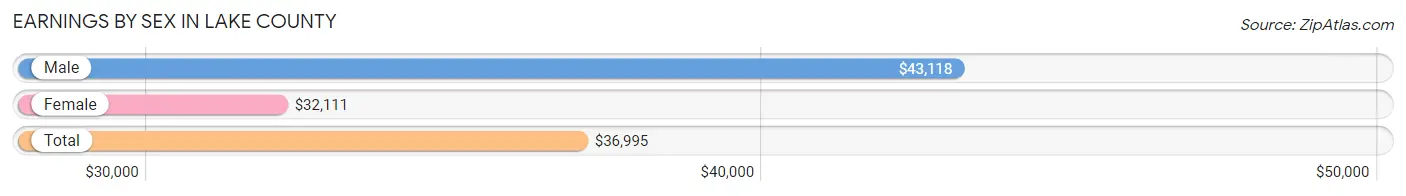
Earnings by Sex in Lake County
Average Earnings in Lake County are $36,995, $43,118 for men and $32,111 for women, a difference of 25.5%.
| Sex | Number | Average Earnings |
| Male | 92,992 (51.9%) | $43,118 |
| Female | 86,043 (48.1%) | $32,111 |
| Total | 179,035 (100.0%) | $36,995 |
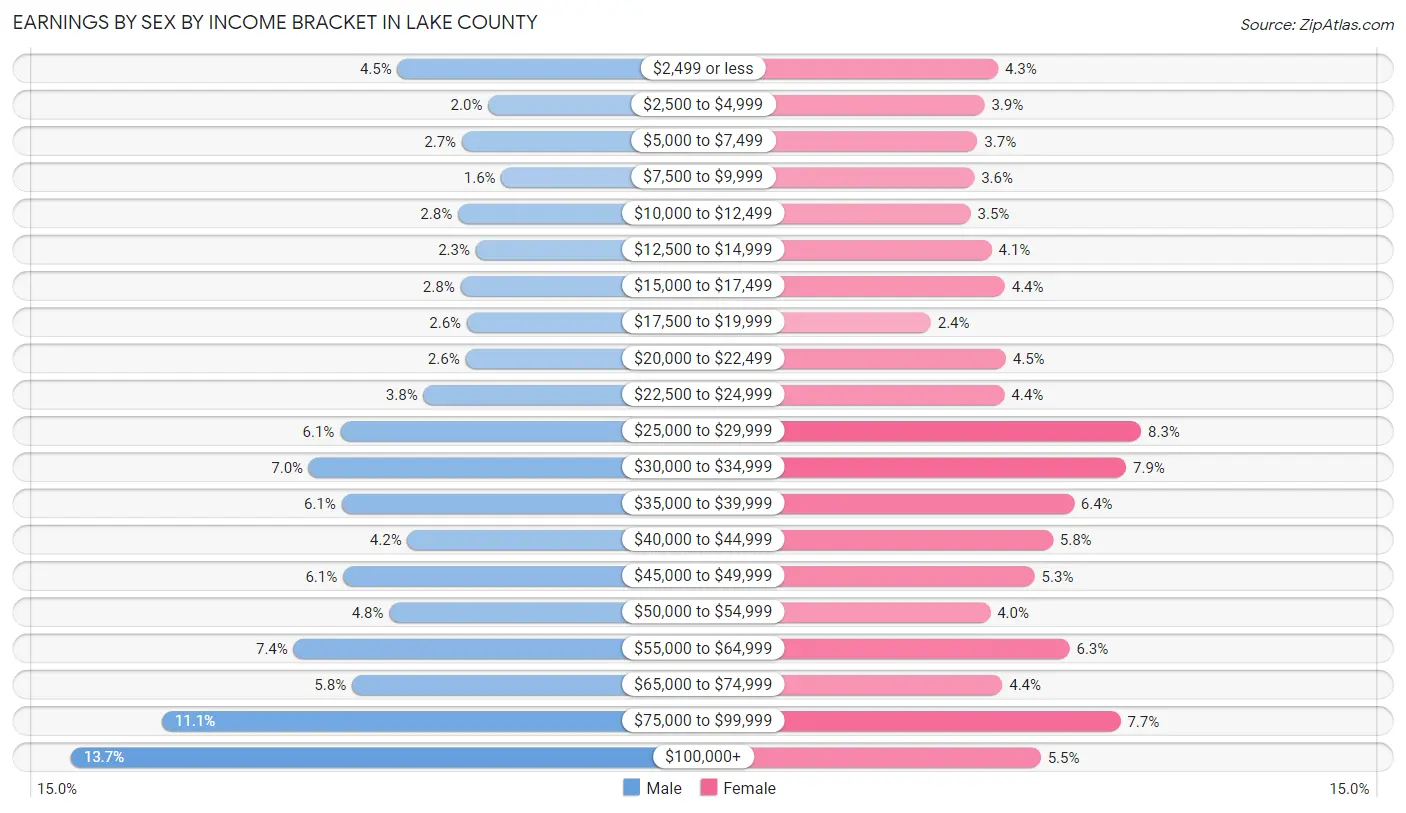
Earnings by Sex by Income Bracket in Lake County
The most common earnings brackets in Lake County are $100,000+ for men (12,740 | 13.7%) and $25,000 to $29,999 for women (7,118 | 8.3%).
| Income | Male | Female |
| $2,499 or less | 4,207 (4.5%) | 3,655 (4.3%) |
| $2,500 to $4,999 | 1,829 (2.0%) | 3,334 (3.9%) |
| $5,000 to $7,499 | 2,516 (2.7%) | 3,156 (3.7%) |
| $7,500 to $9,999 | 1,484 (1.6%) | 3,079 (3.6%) |
| $10,000 to $12,499 | 2,624 (2.8%) | 2,998 (3.5%) |
| $12,500 to $14,999 | 2,154 (2.3%) | 3,506 (4.1%) |
| $15,000 to $17,499 | 2,561 (2.8%) | 3,822 (4.4%) |
| $17,500 to $19,999 | 2,393 (2.6%) | 2,028 (2.4%) |
| $20,000 to $22,499 | 2,430 (2.6%) | 3,842 (4.5%) |
| $22,500 to $24,999 | 3,520 (3.8%) | 3,816 (4.4%) |
| $25,000 to $29,999 | 5,698 (6.1%) | 7,118 (8.3%) |
| $30,000 to $34,999 | 6,521 (7.0%) | 6,758 (7.9%) |
| $35,000 to $39,999 | 5,665 (6.1%) | 5,486 (6.4%) |
| $40,000 to $44,999 | 3,947 (4.2%) | 4,979 (5.8%) |
| $45,000 to $49,999 | 5,624 (6.0%) | 4,547 (5.3%) |
| $50,000 to $54,999 | 4,413 (4.8%) | 3,467 (4.0%) |
| $55,000 to $64,999 | 6,916 (7.4%) | 5,389 (6.3%) |
| $65,000 to $74,999 | 5,394 (5.8%) | 3,762 (4.4%) |
| $75,000 to $99,999 | 10,356 (11.1%) | 6,615 (7.7%) |
| $100,000+ | 12,740 (13.7%) | 4,686 (5.4%) |
| Total | 92,992 (100.0%) | 86,043 (100.0%) |
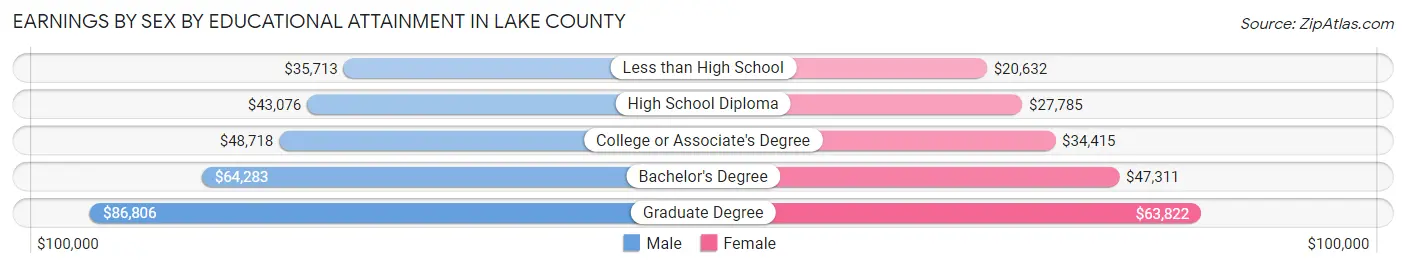
Earnings by Sex by Educational Attainment in Lake County
Average earnings in Lake County are $48,116 for men and $35,825 for women, a difference of 25.5%. Men with an educational attainment of graduate degree enjoy the highest average annual earnings of $86,806, while those with less than high school education earn the least with $35,713. Women with an educational attainment of graduate degree earn the most with the average annual earnings of $63,822, while those with less than high school education have the smallest earnings of $20,632.
| Educational Attainment | Male Income | Female Income |
| Less than High School | $35,713 | $20,632 |
| High School Diploma | $43,076 | $27,785 |
| College or Associate's Degree | $48,718 | $34,415 |
| Bachelor's Degree | $64,283 | $47,311 |
| Graduate Degree | $86,806 | $63,822 |
| Total | $48,116 | $35,825 |
Family Income in Lake County
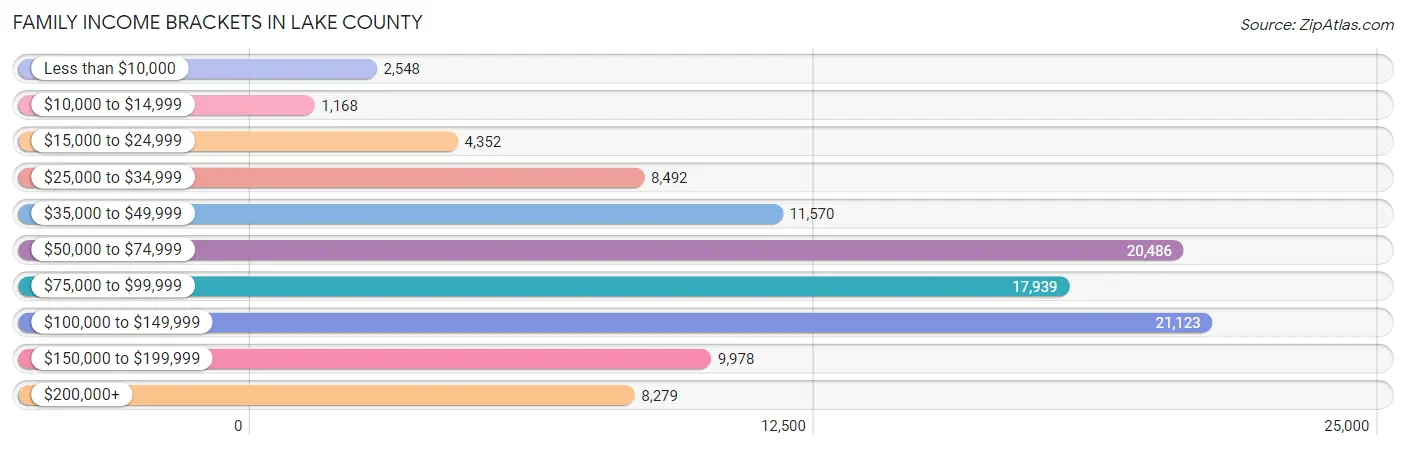
Family Income Brackets in Lake County
According to the Lake County family income data, there are 21,123 families falling into the $100,000 to $149,999 income range, which is the most common income bracket and makes up 19.9% of all families. Conversely, the $10,000 to $14,999 income bracket is the least frequent group with only 1,168 families (1.1%) belonging to this category.
| Income Bracket | # Families | % Families |
| Less than $10,000 | 2,548 | 2.4% |
| $10,000 to $14,999 | 1,168 | 1.1% |
| $15,000 to $24,999 | 4,352 | 4.1% |
| $25,000 to $34,999 | 8,492 | 8.0% |
| $35,000 to $49,999 | 11,570 | 10.9% |
| $50,000 to $74,999 | 20,486 | 19.3% |
| $75,000 to $99,999 | 17,939 | 16.9% |
| $100,000 to $149,999 | 21,123 | 19.9% |
| $150,000 to $199,999 | 9,978 | 9.4% |
| $200,000+ | 8,279 | 7.8% |
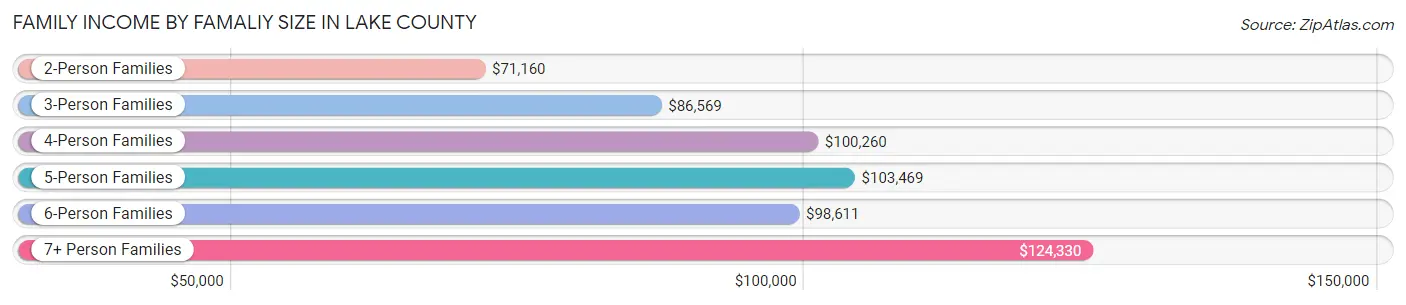
Family Income by Famaliy Size in Lake County
7+ person families (1,159 | 1.1%) account for the highest median family income in Lake County with $124,330 per family, while 2-person families (59,169 | 55.7%) have the highest median income of $35,580 per family member.
| Income Bracket | # Families | Median Income |
| 2-Person Families | 59,169 (55.7%) | $71,160 |
| 3-Person Families | 20,933 (19.7%) | $86,569 |
| 4-Person Families | 14,822 (14.0%) | $100,260 |
| 5-Person Families | 7,424 (7.0%) | $103,469 |
| 6-Person Families | 2,640 (2.5%) | $98,611 |
| 7+ Person Families | 1,159 (1.1%) | $124,330 |
| Total | 106,147 (100.0%) | $80,569 |
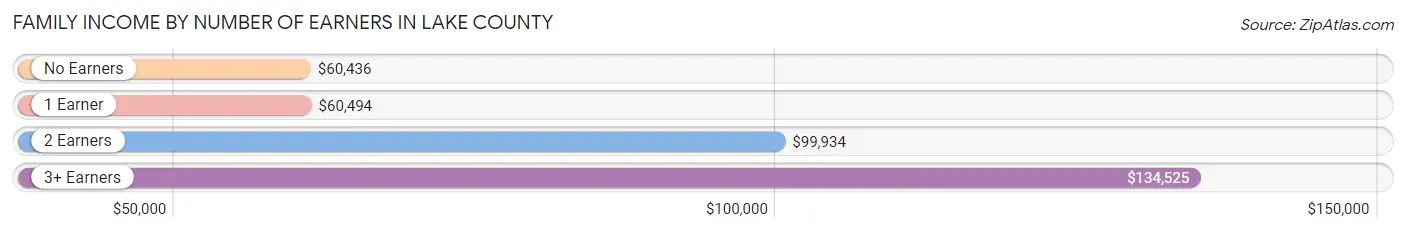
Family Income by Number of Earners in Lake County
The median family income in Lake County is $80,569, with families comprising 3+ earners (10,131) having the highest median family income of $134,525, while families with no earners (28,134) have the lowest median family income of $60,436, accounting for 9.5% and 26.5% of families, respectively.
| Number of Earners | # Families | Median Income |
| No Earners | 28,134 (26.5%) | $60,436 |
| 1 Earner | 31,321 (29.5%) | $60,494 |
| 2 Earners | 36,561 (34.4%) | $99,934 |
| 3+ Earners | 10,131 (9.5%) | $134,525 |
| Total | 106,147 (100.0%) | $80,569 |
Household Income in Lake County
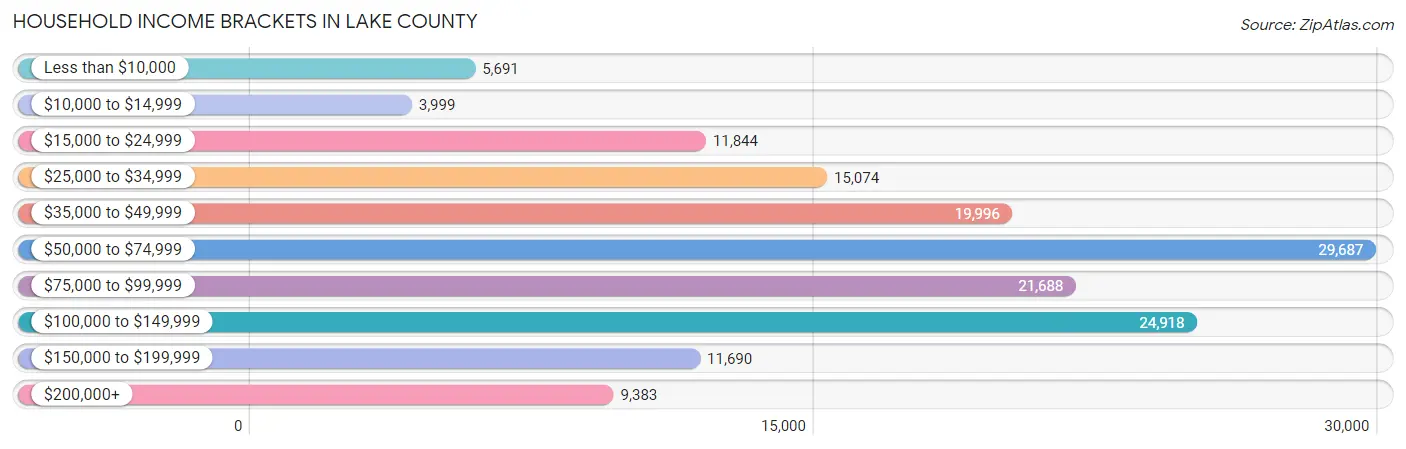
Household Income Brackets in Lake County
With 29,687 households falling in the category, the $50,000 to $74,999 income range is the most frequent in Lake County, accounting for 19.3% of all households. In contrast, only 3,999 households (2.6%) fall into the $10,000 to $14,999 income bracket, making it the least populous group.
| Income Bracket | # Households | % Households |
| Less than $10,000 | 5,691 | 3.7% |
| $10,000 to $14,999 | 3,999 | 2.6% |
| $15,000 to $24,999 | 11,844 | 7.7% |
| $25,000 to $34,999 | 15,074 | 9.8% |
| $35,000 to $49,999 | 19,996 | 13.0% |
| $50,000 to $74,999 | 29,687 | 19.3% |
| $75,000 to $99,999 | 21,688 | 14.1% |
| $100,000 to $149,999 | 24,918 | 16.2% |
| $150,000 to $199,999 | 11,690 | 7.6% |
| $200,000+ | 9,383 | 6.1% |
Household Income by Householder Age in Lake County
The median household income in Lake County is $66,239, with the highest median household income of $79,797 found in the 45 to 64 years age bracket for the primary householder. A total of 52,917 households (34.4%) fall into this category. Meanwhile, the 65+ years age bracket for the primary householder has the lowest median household income of $53,355, with 60,804 households (39.5%) in this group.
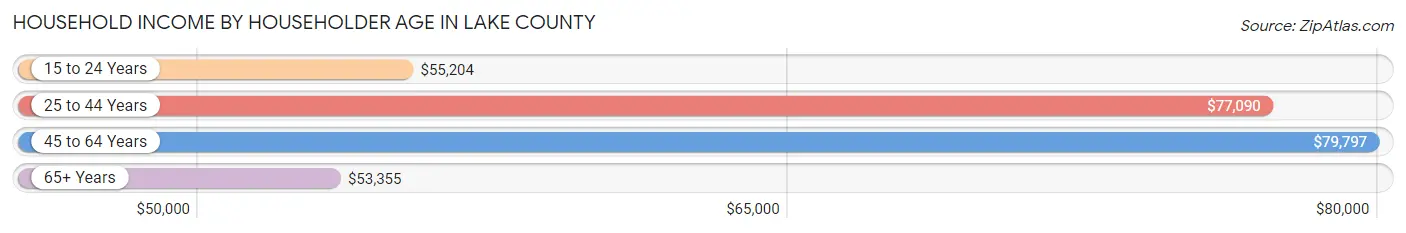
| Income Bracket | # Households | Median Income |
| 15 to 24 Years | 3,359 (2.2%) | $55,204 |
| 25 to 44 Years | 36,737 (23.9%) | $77,090 |
| 45 to 64 Years | 52,917 (34.4%) | $79,797 |
| 65+ Years | 60,804 (39.5%) | $53,355 |
| Total | 153,817 (100.0%) | $66,239 |
Poverty in Lake County
Income Below Poverty by Sex and Age in Lake County
With 8.1% poverty level for males and 11.2% for females among the residents of Lake County, under 5 year old males and 5 year old females are the most vulnerable to poverty, with 1,921 males (21.5%) and 500 females (25.0%) in their respective age groups living below the poverty level.
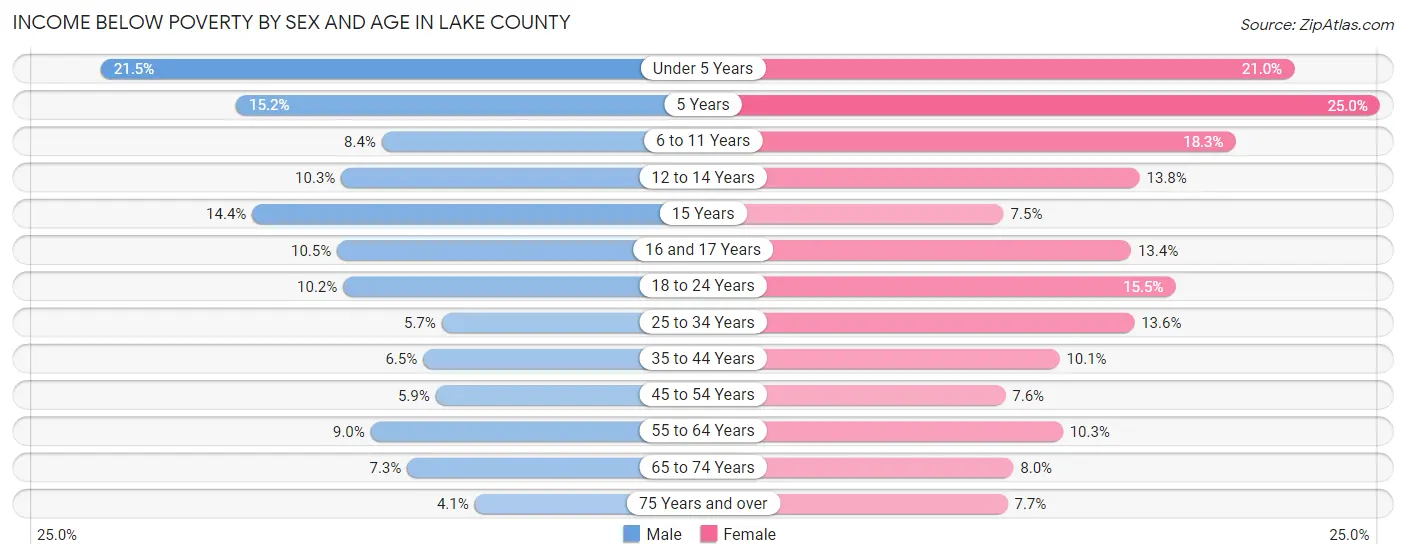
| Age Bracket | Male | Female |
| Under 5 Years | 1,921 (21.5%) | 1,855 (21.0%) |
| 5 Years | 346 (15.2%) | 500 (25.0%) |
| 6 to 11 Years | 1,017 (8.4%) | 2,223 (18.3%) |
| 12 to 14 Years | 712 (10.3%) | 822 (13.8%) |
| 15 Years | 329 (14.4%) | 166 (7.5%) |
| 16 and 17 Years | 464 (10.5%) | 554 (13.4%) |
| 18 to 24 Years | 1,347 (10.2%) | 1,992 (15.5%) |
| 25 to 34 Years | 1,154 (5.7%) | 2,876 (13.6%) |
| 35 to 44 Years | 1,349 (6.5%) | 2,211 (10.1%) |
| 45 to 54 Years | 1,318 (5.9%) | 1,760 (7.6%) |
| 55 to 64 Years | 2,233 (8.9%) | 2,806 (10.2%) |
| 65 to 74 Years | 1,833 (7.2%) | 2,357 (8.0%) |
| 75 Years and over | 887 (4.1%) | 1,945 (7.7%) |
| Total | 14,910 (8.1%) | 22,067 (11.2%) |
Income Above Poverty by Sex and Age in Lake County
According to the poverty statistics in Lake County, males aged 75 years and over and females aged 15 years are the age groups that are most secure financially, with 95.9% of males and 92.5% of females in these age groups living above the poverty line.
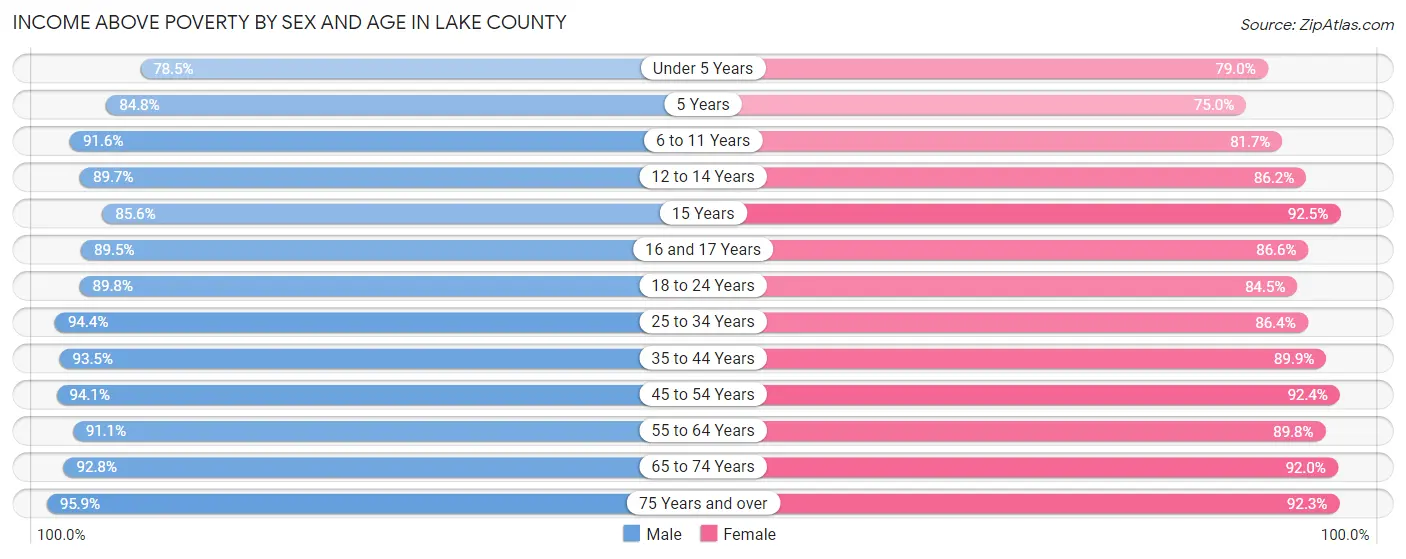
| Age Bracket | Male | Female |
| Under 5 Years | 7,030 (78.5%) | 6,985 (79.0%) |
| 5 Years | 1,934 (84.8%) | 1,503 (75.0%) |
| 6 to 11 Years | 11,047 (91.6%) | 9,951 (81.7%) |
| 12 to 14 Years | 6,192 (89.7%) | 5,126 (86.2%) |
| 15 Years | 1,949 (85.6%) | 2,045 (92.5%) |
| 16 and 17 Years | 3,954 (89.5%) | 3,573 (86.6%) |
| 18 to 24 Years | 11,835 (89.8%) | 10,884 (84.5%) |
| 25 to 34 Years | 19,266 (94.4%) | 18,322 (86.4%) |
| 35 to 44 Years | 19,381 (93.5%) | 19,672 (89.9%) |
| 45 to 54 Years | 20,909 (94.1%) | 21,427 (92.4%) |
| 55 to 64 Years | 22,729 (91.0%) | 24,564 (89.7%) |
| 65 to 74 Years | 23,454 (92.7%) | 27,244 (92.0%) |
| 75 Years and over | 20,628 (95.9%) | 23,362 (92.3%) |
| Total | 170,308 (91.9%) | 174,658 (88.8%) |
Income Below Poverty Among Married-Couple Families in Lake County
The poverty statistics for married-couple families in Lake County show that 3.4% or 2,839 of the total 83,493 families live below the poverty line. Families with 5 or more children have the highest poverty rate of 23.0%, comprising of 91 families. On the other hand, families with 1 or 2 children have the lowest poverty rate of 2.5%, which includes 485 families.
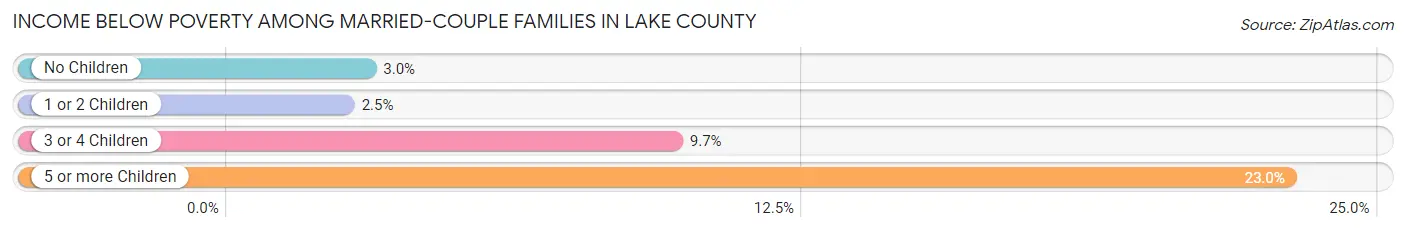
| Children | Above Poverty | Below Poverty |
| No Children | 57,130 (97.0%) | 1,770 (3.0%) |
| 1 or 2 Children | 18,619 (97.5%) | 485 (2.5%) |
| 3 or 4 Children | 4,601 (90.3%) | 493 (9.7%) |
| 5 or more Children | 304 (77.0%) | 91 (23.0%) |
| Total | 80,654 (96.6%) | 2,839 (3.4%) |
Income Below Poverty Among Single-Parent Households in Lake County
According to the poverty data in Lake County, 7.6% or 507 single-father households and 22.0% or 3,514 single-mother households are living below the poverty line. Among single-father households, those with 3 or 4 children have the highest poverty rate, with 87 households (16.9%) experiencing poverty. Likewise, among single-mother households, those with 5 or more children have the highest poverty rate, with 193 households (100.0%) falling below the poverty line.
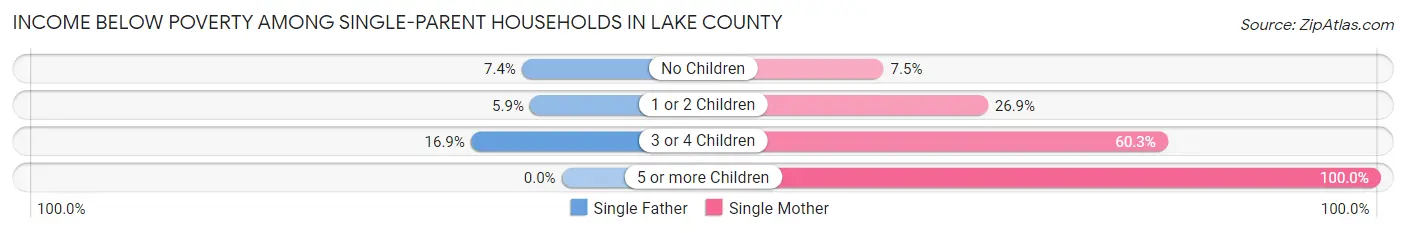
| Children | Single Father | Single Mother |
| No Children | 285 (7.4%) | 525 (7.4%) |
| 1 or 2 Children | 135 (5.9%) | 2,002 (26.9%) |
| 3 or 4 Children | 87 (16.9%) | 794 (60.3%) |
| 5 or more Children | 0 (0.0%) | 193 (100.0%) |
| Total | 507 (7.6%) | 3,514 (22.0%) |
Income Below Poverty Among Married-Couple vs Single-Parent Households in Lake County
The poverty data for Lake County shows that 2,839 of the married-couple family households (3.4%) and 4,021 of the single-parent households (17.7%) are living below the poverty level. Within the married-couple family households, those with 5 or more children have the highest poverty rate, with 91 households (23.0%) falling below the poverty line. Among the single-parent households, those with 5 or more children have the highest poverty rate, with 193 household (100.0%) living below poverty.
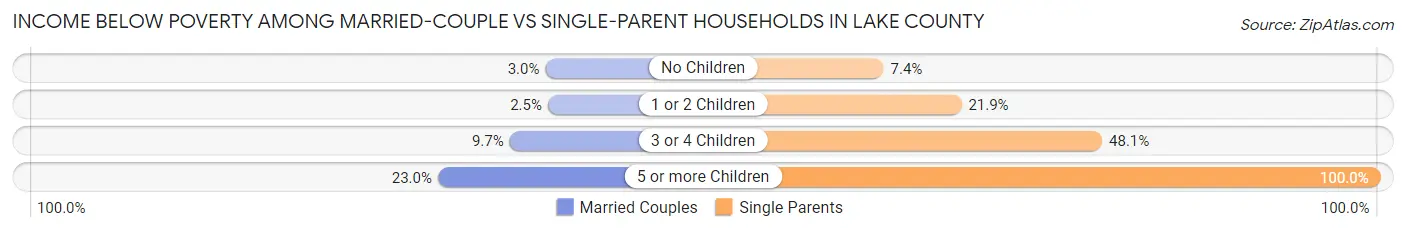
| Children | Married-Couple Families | Single-Parent Households |
| No Children | 1,770 (3.0%) | 810 (7.4%) |
| 1 or 2 Children | 485 (2.5%) | 2,137 (21.9%) |
| 3 or 4 Children | 493 (9.7%) | 881 (48.1%) |
| 5 or more Children | 91 (23.0%) | 193 (100.0%) |
| Total | 2,839 (3.4%) | 4,021 (17.7%) |
Race in Lake County
The most populous races in Lake County are White / Caucasian (285,523 | 73.8%), Hispanic or Latino (67,297 | 17.4%), and Two or more Races (41,365 | 10.7%).
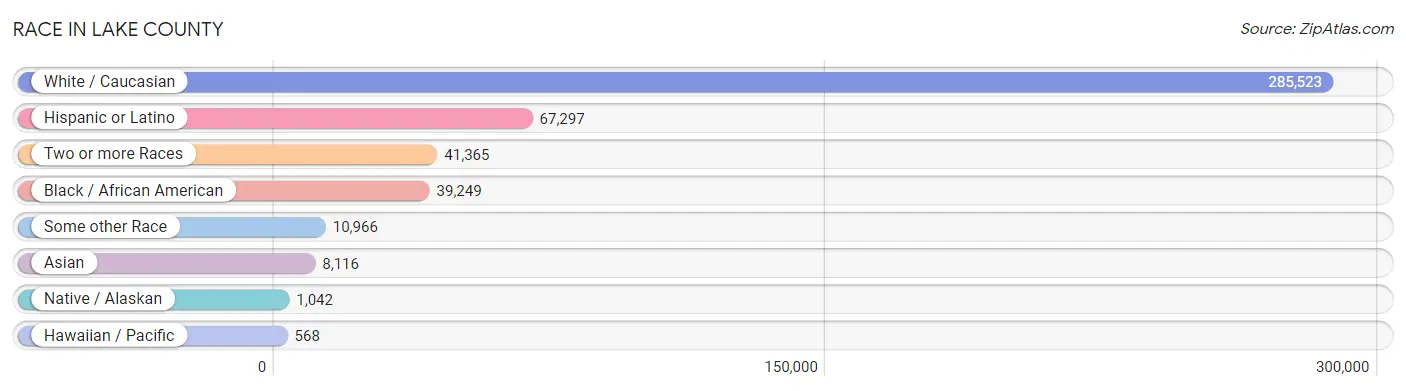
| Race | # Population | % Population |
| Asian | 8,116 | 2.1% |
| Black / African American | 39,249 | 10.2% |
| Hawaiian / Pacific | 568 | 0.2% |
| Hispanic or Latino | 67,297 | 17.4% |
| Native / Alaskan | 1,042 | 0.3% |
| White / Caucasian | 285,523 | 73.8% |
| Two or more Races | 41,365 | 10.7% |
| Some other Race | 10,966 | 2.8% |
| Total | 386,829 | 100.0% |
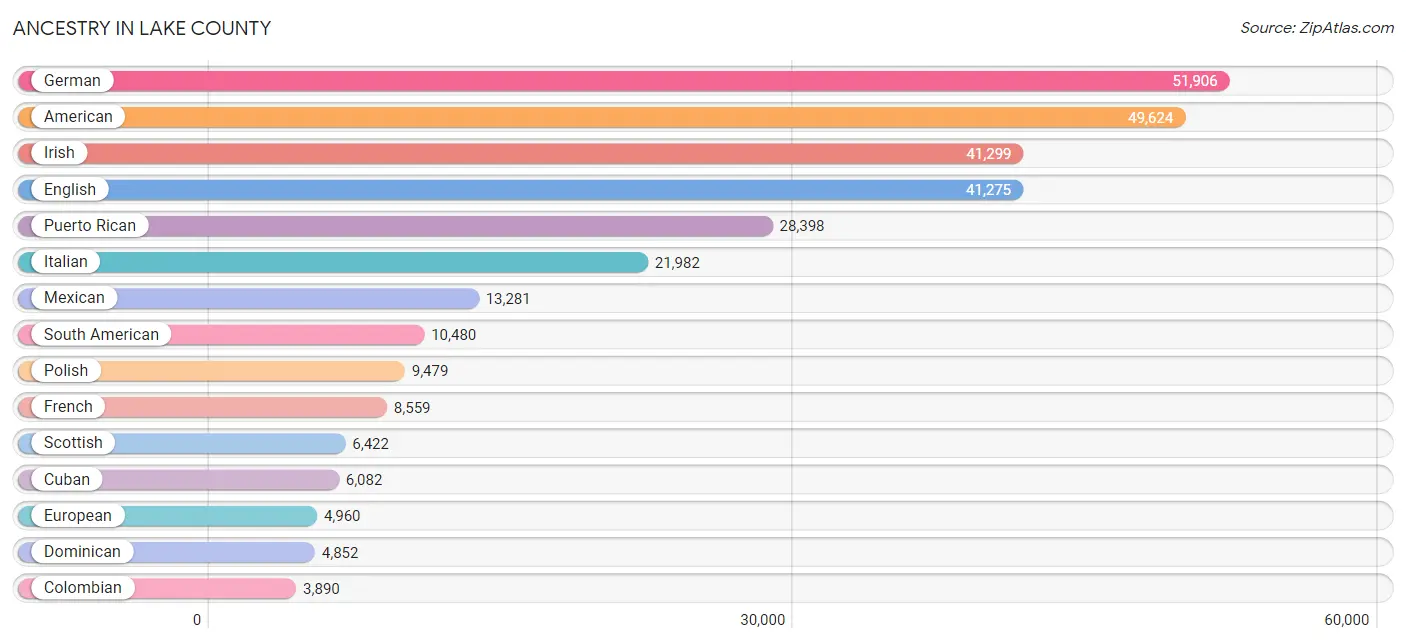
Ancestry in Lake County
The most populous ancestries reported in Lake County are German (51,906 | 13.4%), American (49,624 | 12.8%), Irish (41,299 | 10.7%), English (41,275 | 10.7%), and Puerto Rican (28,398 | 7.3%), together accounting for 54.9% of all Lake County residents.
| Ancestry | # Population | % Population |
| African | 2,109 | 0.5% |
| Albanian | 53 | 0.0% |
| American | 49,624 | 12.8% |
| Apache | 33 | 0.0% |
| Arab | 1,255 | 0.3% |
| Argentinean | 409 | 0.1% |
| Armenian | 194 | 0.1% |
| Australian | 83 | 0.0% |
| Austrian | 748 | 0.2% |
| Bahamian | 133 | 0.0% |
| Barbadian | 111 | 0.0% |
| Basque | 17 | 0.0% |
| Belgian | 576 | 0.2% |
| Bermudan | 11 | 0.0% |
| Bhutanese | 1,226 | 0.3% |
| Blackfeet | 72 | 0.0% |
| Brazilian | 828 | 0.2% |
| British | 2,998 | 0.8% |
| British West Indian | 286 | 0.1% |
| Bulgarian | 78 | 0.0% |
| Burmese | 777 | 0.2% |
| Cajun | 13 | 0.0% |
| Canadian | 1,046 | 0.3% |
| Cape Verdean | 37 | 0.0% |
| Celtic | 18 | 0.0% |
| Central American | 2,217 | 0.6% |
| Central American Indian | 486 | 0.1% |
| Cherokee | 862 | 0.2% |
| Chickasaw | 71 | 0.0% |
| Chilean | 1,200 | 0.3% |
| Chippewa | 207 | 0.1% |
| Choctaw | 58 | 0.0% |
| Colombian | 3,890 | 1.0% |
| Costa Rican | 104 | 0.0% |
| Cree | 6 | 0.0% |
| Creek | 11 | 0.0% |
| Croatian | 400 | 0.1% |
| Crow | 18 | 0.0% |
| Cuban | 6,082 | 1.6% |
| Cypriot | 21 | 0.0% |
| Czech | 730 | 0.2% |
| Czechoslovakian | 287 | 0.1% |
| Danish | 917 | 0.2% |
| Dominican | 4,852 | 1.3% |
| Dutch | 3,678 | 0.9% |
| Eastern European | 563 | 0.2% |
| Ecuadorian | 955 | 0.3% |
| Egyptian | 269 | 0.1% |
| English | 41,275 | 10.7% |
| Estonian | 19 | 0.0% |
| Ethiopian | 5 | 0.0% |
| European | 4,960 | 1.3% |
| Filipino | 104 | 0.0% |
| Finnish | 338 | 0.1% |
| French | 8,559 | 2.2% |
| French American Indian | 59 | 0.0% |
| French Canadian | 3,290 | 0.9% |
| German | 51,906 | 13.4% |
| Ghanaian | 26 | 0.0% |
| Greek | 929 | 0.2% |
| Guamanian / Chamorro | 13 | 0.0% |
| Guatemalan | 535 | 0.1% |
| Guyanese | 3,015 | 0.8% |
| Haitian | 1,757 | 0.4% |
| Honduran | 690 | 0.2% |
| Hungarian | 1,907 | 0.5% |
| Icelander | 31 | 0.0% |
| Indian (Asian) | 1,591 | 0.4% |
| Iranian | 109 | 0.0% |
| Irish | 41,299 | 10.7% |
| Iroquois | 62 | 0.0% |
| Israeli | 134 | 0.0% |
| Italian | 21,982 | 5.7% |
| Jamaican | 3,453 | 0.9% |
| Japanese | 17 | 0.0% |
| Korean | 1,538 | 0.4% |
| Laotian | 53 | 0.0% |
| Latvian | 86 | 0.0% |
| Lebanese | 528 | 0.1% |
| Lithuanian | 679 | 0.2% |
| Luxembourger | 25 | 0.0% |
| Macedonian | 32 | 0.0% |
| Maltese | 8 | 0.0% |
| Mexican | 13,281 | 3.4% |
| Mexican American Indian | 347 | 0.1% |
| Mongolian | 36 | 0.0% |
| Moroccan | 118 | 0.0% |
| Native Hawaiian | 465 | 0.1% |
| Navajo | 6 | 0.0% |
| New Zealander | 13 | 0.0% |
| Nicaraguan | 453 | 0.1% |
| Nigerian | 320 | 0.1% |
| Northern European | 376 | 0.1% |
| Norwegian | 2,789 | 0.7% |
| Pakistani | 139 | 0.0% |
| Palestinian | 12 | 0.0% |
| Panamanian | 211 | 0.1% |
| Pennsylvania German | 187 | 0.1% |
| Peruvian | 722 | 0.2% |
| Polish | 9,479 | 2.5% |
| Portuguese | 1,645 | 0.4% |
| Pueblo | 13 | 0.0% |
| Puerto Rican | 28,398 | 7.3% |
| Romanian | 408 | 0.1% |
| Russian | 2,354 | 0.6% |
| Salvadoran | 224 | 0.1% |
| Samoan | 17 | 0.0% |
| Scandinavian | 867 | 0.2% |
| Scotch-Irish | 2,943 | 0.8% |
| Scottish | 6,422 | 1.7% |
| Seminole | 51 | 0.0% |
| Serbian | 36 | 0.0% |
| Shoshone | 8 | 0.0% |
| Sioux | 18 | 0.0% |
| Slavic | 106 | 0.0% |
| Slovak | 911 | 0.2% |
| Slovene | 164 | 0.0% |
| South African | 73 | 0.0% |
| South American | 10,480 | 2.7% |
| Spaniard | 559 | 0.1% |
| Spanish | 451 | 0.1% |
| Spanish American | 36 | 0.0% |
| Sri Lankan | 2,080 | 0.5% |
| Subsaharan African | 2,746 | 0.7% |
| Swedish | 2,775 | 0.7% |
| Swiss | 980 | 0.3% |
| Syrian | 181 | 0.1% |
| Thai | 3,511 | 0.9% |
| Trinidadian and Tobagonian | 416 | 0.1% |
| Turkish | 66 | 0.0% |
| U.S. Virgin Islander | 374 | 0.1% |
| Ukrainian | 636 | 0.2% |
| Uruguayan | 185 | 0.1% |
| Venezuelan | 3,086 | 0.8% |
| Vietnamese | 17 | 0.0% |
| Welsh | 1,804 | 0.5% |
| West Indian | 381 | 0.1% |
| Yugoslavian | 276 | 0.1% |
| Zimbabwean | 24 | 0.0% | View All 139 Rows |
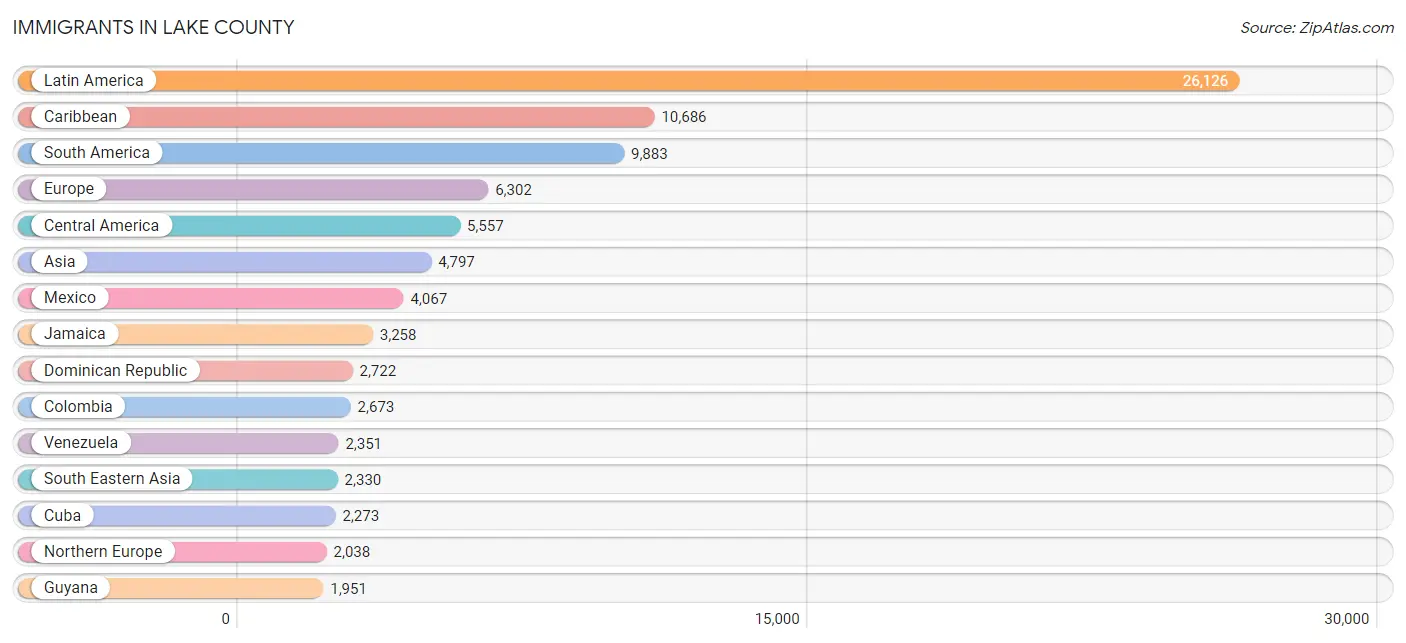
Immigrants in Lake County
The most numerous immigrant groups reported in Lake County came from Latin America (26,126 | 6.8%), Caribbean (10,686 | 2.8%), South America (9,883 | 2.5%), Europe (6,302 | 1.6%), and Central America (5,557 | 1.4%), together accounting for 15.1% of all Lake County residents.
| Immigration Origin | # Population | % Population |
| Africa | 1,242 | 0.3% |
| Argentina | 379 | 0.1% |
| Asia | 4,797 | 1.2% |
| Australia | 16 | 0.0% |
| Austria | 37 | 0.0% |
| Bahamas | 8 | 0.0% |
| Bangladesh | 86 | 0.0% |
| Barbados | 190 | 0.1% |
| Belgium | 34 | 0.0% |
| Belize | 28 | 0.0% |
| Bosnia and Herzegovina | 16 | 0.0% |
| Brazil | 647 | 0.2% |
| Bulgaria | 263 | 0.1% |
| Cambodia | 17 | 0.0% |
| Canada | 1,805 | 0.5% |
| Caribbean | 10,686 | 2.8% |
| Central America | 5,557 | 1.4% |
| Chile | 769 | 0.2% |
| China | 645 | 0.2% |
| Colombia | 2,673 | 0.7% |
| Costa Rica | 95 | 0.0% |
| Croatia | 13 | 0.0% |
| Cuba | 2,273 | 0.6% |
| Czechoslovakia | 64 | 0.0% |
| Denmark | 30 | 0.0% |
| Dominica | 202 | 0.1% |
| Dominican Republic | 2,722 | 0.7% |
| Eastern Africa | 91 | 0.0% |
| Eastern Asia | 946 | 0.2% |
| Eastern Europe | 1,510 | 0.4% |
| Ecuador | 373 | 0.1% |
| Egypt | 205 | 0.1% |
| El Salvador | 79 | 0.0% |
| England | 825 | 0.2% |
| Europe | 6,302 | 1.6% |
| France | 181 | 0.1% |
| Germany | 1,407 | 0.4% |
| Ghana | 26 | 0.0% |
| Greece | 92 | 0.0% |
| Grenada | 45 | 0.0% |
| Guatemala | 428 | 0.1% |
| Guyana | 1,951 | 0.5% |
| Haiti | 718 | 0.2% |
| Honduras | 499 | 0.1% |
| Hong Kong | 54 | 0.0% |
| Hungary | 37 | 0.0% |
| India | 651 | 0.2% |
| Indonesia | 62 | 0.0% |
| Iran | 78 | 0.0% |
| Ireland | 305 | 0.1% |
| Israel | 37 | 0.0% |
| Italy | 494 | 0.1% |
| Jamaica | 3,258 | 0.8% |
| Japan | 106 | 0.0% |
| Kenya | 52 | 0.0% |
| Korea | 195 | 0.1% |
| Latin America | 26,126 | 6.8% |
| Latvia | 24 | 0.0% |
| Lebanon | 131 | 0.0% |
| Liberia | 449 | 0.1% |
| Malaysia | 64 | 0.0% |
| Mexico | 4,067 | 1.1% |
| Morocco | 75 | 0.0% |
| Netherlands | 124 | 0.0% |
| Nicaragua | 246 | 0.1% |
| Nigeria | 239 | 0.1% |
| Northern Africa | 280 | 0.1% |
| Northern Europe | 2,038 | 0.5% |
| Norway | 24 | 0.0% |
| Oceania | 16 | 0.0% |
| Pakistan | 109 | 0.0% |
| Panama | 115 | 0.0% |
| Peru | 551 | 0.1% |
| Philippines | 904 | 0.2% |
| Poland | 272 | 0.1% |
| Portugal | 80 | 0.0% |
| Romania | 158 | 0.0% |
| Russia | 166 | 0.0% |
| Scotland | 105 | 0.0% |
| Serbia | 51 | 0.0% |
| South Africa | 120 | 0.0% |
| South America | 9,883 | 2.5% |
| South Central Asia | 943 | 0.2% |
| South Eastern Asia | 2,330 | 0.6% |
| Southern Europe | 907 | 0.2% |
| Spain | 241 | 0.1% |
| St. Vincent and the Grenadines | 47 | 0.0% |
| Sweden | 134 | 0.0% |
| Switzerland | 64 | 0.0% |
| Syria | 41 | 0.0% |
| Taiwan | 240 | 0.1% |
| Thailand | 98 | 0.0% |
| Trinidad and Tobago | 658 | 0.2% |
| Turkey | 287 | 0.1% |
| Ukraine | 92 | 0.0% |
| Uruguay | 137 | 0.0% |
| Venezuela | 2,351 | 0.6% |
| Vietnam | 1,174 | 0.3% |
| Western Africa | 751 | 0.2% |
| Western Asia | 566 | 0.2% |
| Western Europe | 1,847 | 0.5% |
| Yemen | 49 | 0.0% |
| Zimbabwe | 24 | 0.0% | View All 103 Rows |
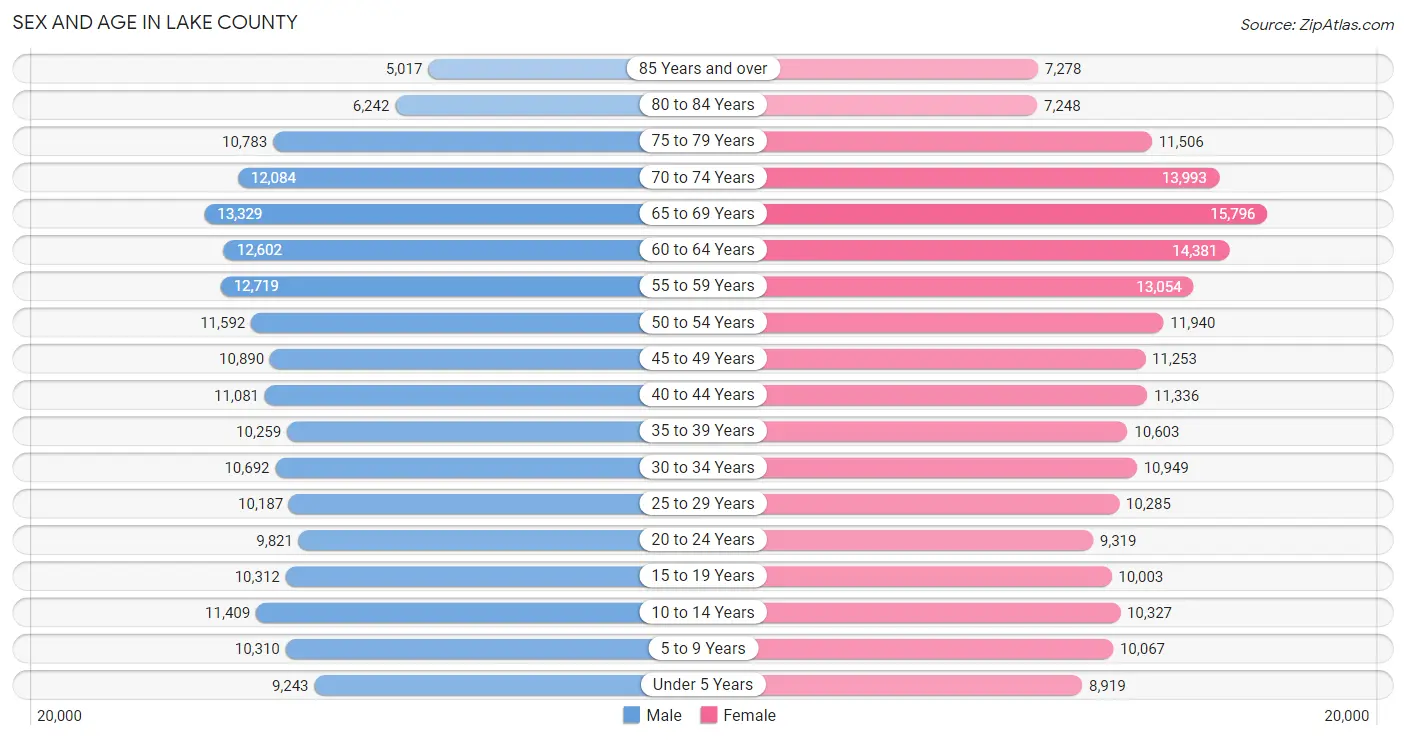
Sex and Age in Lake County
Sex and Age in Lake County
The most populous age groups in Lake County are 65 to 69 Years (13,329 | 7.1%) for men and 65 to 69 Years (15,796 | 8.0%) for women.
| Age Bracket | Male | Female |
| Under 5 Years | 9,243 (4.9%) | 8,919 (4.5%) |
| 5 to 9 Years | 10,310 (5.5%) | 10,067 (5.1%) |
| 10 to 14 Years | 11,409 (6.0%) | 10,327 (5.2%) |
| 15 to 19 Years | 10,312 (5.5%) | 10,003 (5.1%) |
| 20 to 24 Years | 9,821 (5.2%) | 9,319 (4.7%) |
| 25 to 29 Years | 10,187 (5.4%) | 10,285 (5.2%) |
| 30 to 34 Years | 10,692 (5.7%) | 10,949 (5.5%) |
| 35 to 39 Years | 10,259 (5.4%) | 10,603 (5.3%) |
| 40 to 44 Years | 11,081 (5.9%) | 11,336 (5.7%) |
| 45 to 49 Years | 10,890 (5.8%) | 11,253 (5.7%) |
| 50 to 54 Years | 11,592 (6.1%) | 11,940 (6.0%) |
| 55 to 59 Years | 12,719 (6.7%) | 13,054 (6.6%) |
| 60 to 64 Years | 12,602 (6.7%) | 14,381 (7.2%) |
| 65 to 69 Years | 13,329 (7.1%) | 15,796 (8.0%) |
| 70 to 74 Years | 12,084 (6.4%) | 13,993 (7.1%) |
| 75 to 79 Years | 10,783 (5.7%) | 11,506 (5.8%) |
| 80 to 84 Years | 6,242 (3.3%) | 7,248 (3.7%) |
| 85 Years and over | 5,017 (2.7%) | 7,278 (3.7%) |
| Total | 188,572 (100.0%) | 198,257 (100.0%) |
Families and Households in Lake County
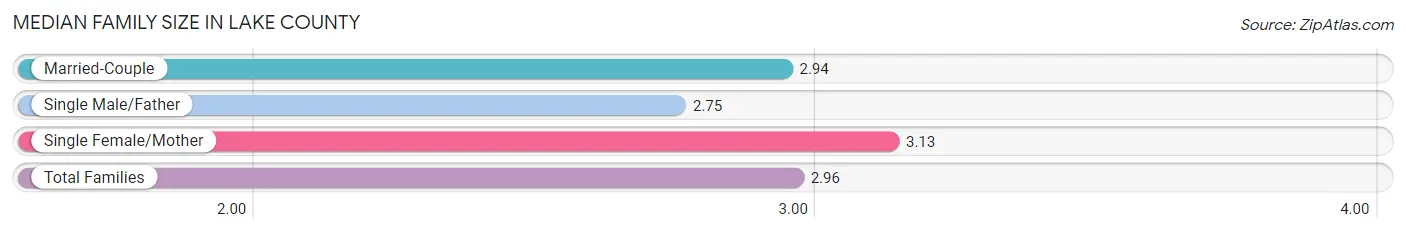
Median Family Size in Lake County
The median family size in Lake County is 2.96 persons per family, with single female/mother families (16,008 | 15.1%) accounting for the largest median family size of 3.13 persons per family. On the other hand, single male/father families (6,646 | 6.3%) represent the smallest median family size with 2.75 persons per family.
| Family Type | # Families | Family Size |
| Married-Couple | 83,493 (78.7%) | 2.94 |
| Single Male/Father | 6,646 (6.3%) | 2.75 |
| Single Female/Mother | 16,008 (15.1%) | 3.13 |
| Total Families | 106,147 (100.0%) | 2.96 |
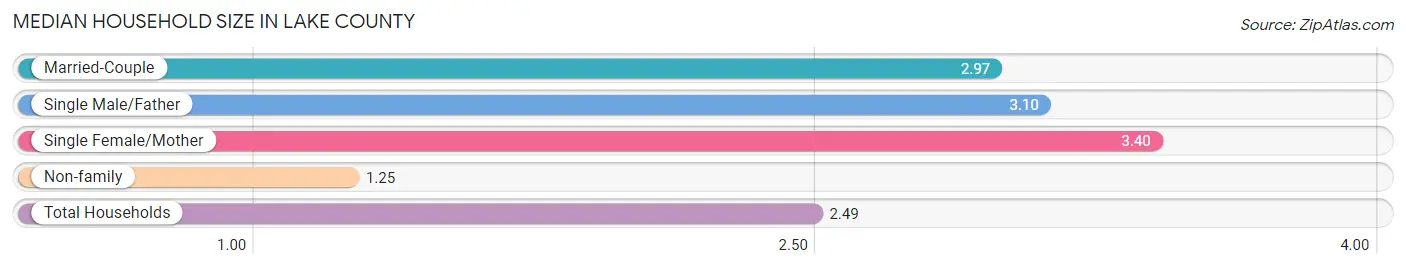
Median Household Size in Lake County
The median household size in Lake County is 2.49 persons per household, with single female/mother households (16,008 | 10.4%) accounting for the largest median household size of 3.4 persons per household. non-family households (47,670 | 31.0%) represent the smallest median household size with 1.25 persons per household.
| Household Type | # Households | Household Size |
| Married-Couple | 83,493 (54.3%) | 2.97 |
| Single Male/Father | 6,646 (4.3%) | 3.10 |
| Single Female/Mother | 16,008 (10.4%) | 3.40 |
| Non-family | 47,670 (31.0%) | 1.25 |
| Total Households | 153,817 (100.0%) | 2.49 |
Household Size by Marriage Status in Lake County
Out of a total of 153,817 households in Lake County, 106,147 (69.0%) are family households, while 47,670 (31.0%) are nonfamily households. The most numerous type of family households are 2-person households, comprising 56,497, and the most common type of nonfamily households are 1-person households, comprising 38,733.
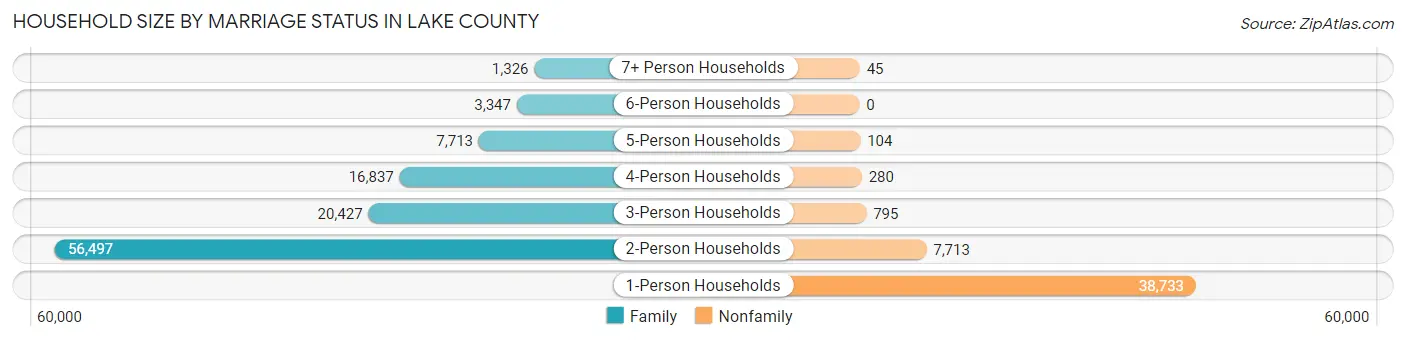
| Household Size | Family Households | Nonfamily Households |
| 1-Person Households | - | 38,733 (25.2%) |
| 2-Person Households | 56,497 (36.7%) | 7,713 (5.0%) |
| 3-Person Households | 20,427 (13.3%) | 795 (0.5%) |
| 4-Person Households | 16,837 (11.0%) | 280 (0.2%) |
| 5-Person Households | 7,713 (5.0%) | 104 (0.1%) |
| 6-Person Households | 3,347 (2.2%) | 0 (0.0%) |
| 7+ Person Households | 1,326 (0.9%) | 45 (0.0%) |
| Total | 106,147 (69.0%) | 47,670 (31.0%) |
Female Fertility in Lake County
Fertility by Age in Lake County
Average fertility rate in Lake County is 42.0 births per 1,000 women. Women in the age bracket of 20 to 34 years have the highest fertility rate with 88.0 births per 1,000 women. Women in the age bracket of 20 to 34 years acount for 84.1% of all women with births.
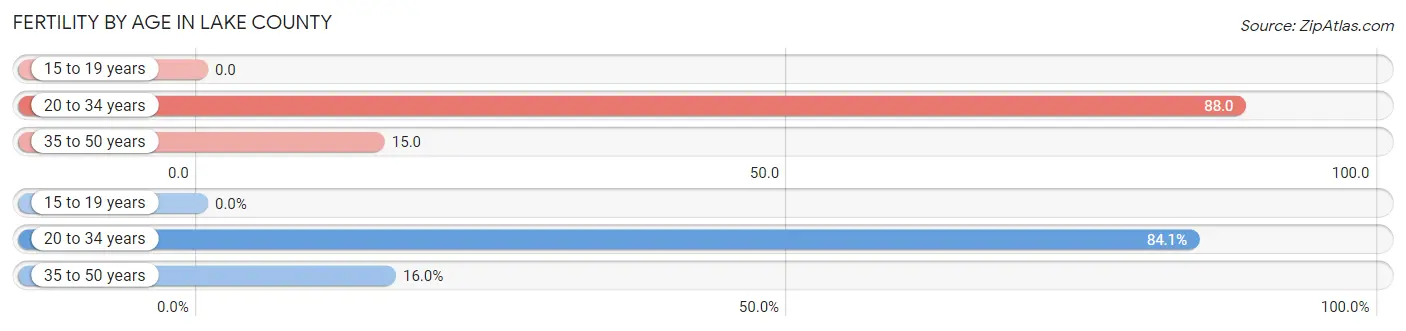
| Age Bracket | Women with Births | Births / 1,000 Women |
| 15 to 19 years | 0 (0.0%) | 0.0 |
| 20 to 34 years | 2,703 (84.1%) | 88.0 |
| 35 to 50 years | 513 (16.0%) | 15.0 |
| Total | 3,216 (100.0%) | 42.0 |
Fertility by Age by Marriage Status in Lake County
61.1% of women with births (3,216) in Lake County are married. The highest percentage of unmarried women with births falls into 20 to 34 years age bracket with 44.4% of them unmarried at the time of birth, while the lowest percentage of unmarried women with births belong to 35 to 50 years age bracket with 9.9% of them unmarried.
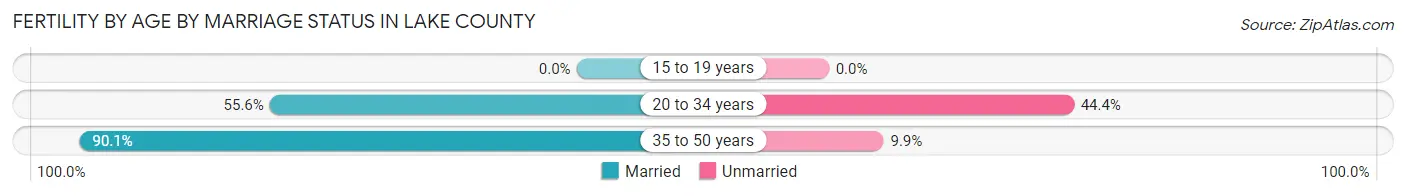
| Age Bracket | Married | Unmarried |
| 15 to 19 years | 0 (0.0%) | 0 (0.0%) |
| 20 to 34 years | 1,503 (55.6%) | 1,200 (44.4%) |
| 35 to 50 years | 462 (90.1%) | 51 (9.9%) |
| Total | 1,965 (61.1%) | 1,251 (38.9%) |
Fertility by Education in Lake County
Average fertility rate in Lake County is 42.0 births per 1,000 women. Women with the education attainment of high school diploma have the highest fertility rate of 60.0 births per 1,000 women, while women with the education attainment of college or associate's degree have the lowest fertility at 31.0 births per 1,000 women. Women with the education attainment of high school diploma represent 35.3% of all women with births.
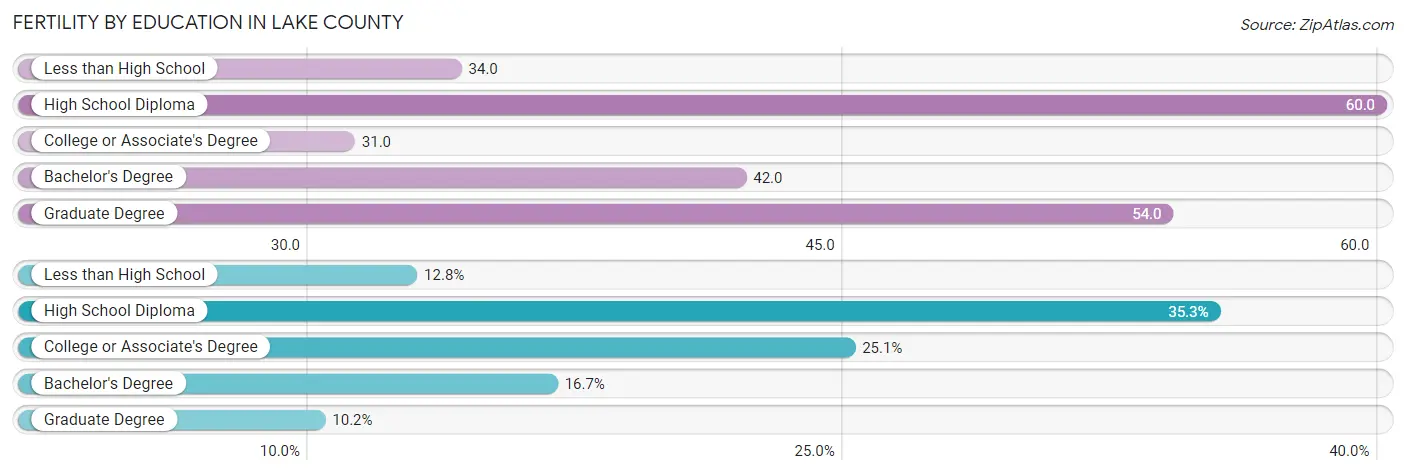
| Educational Attainment | Women with Births | Births / 1,000 Women |
| Less than High School | 410 (12.8%) | 34.0 |
| High School Diploma | 1,136 (35.3%) | 60.0 |
| College or Associate's Degree | 806 (25.1%) | 31.0 |
| Bachelor's Degree | 537 (16.7%) | 42.0 |
| Graduate Degree | 327 (10.2%) | 54.0 |
| Total | 3,216 (100.0%) | 42.0 |
Fertility by Education by Marriage Status in Lake County
38.9% of women with births in Lake County are unmarried. Women with the educational attainment of graduate degree are most likely to be married with 92.7% of them married at childbirth, while women with the educational attainment of high school diploma are least likely to be married with 57.0% of them unmarried at childbirth.
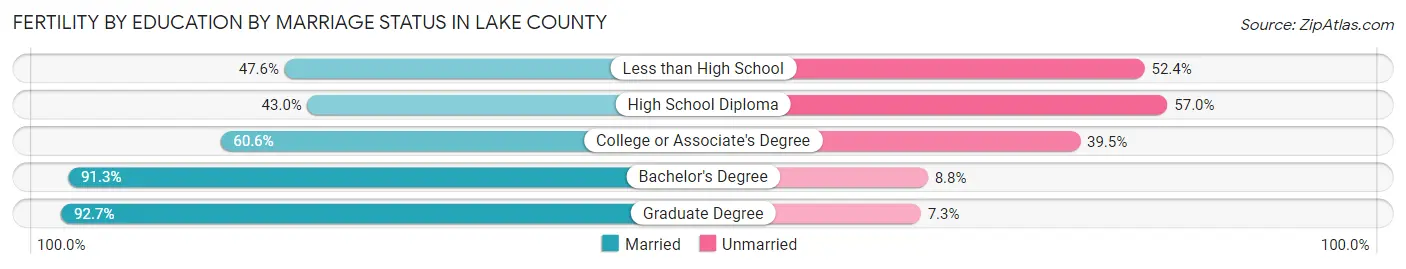
| Educational Attainment | Married | Unmarried |
| Less than High School | 195 (47.6%) | 215 (52.4%) |
| High School Diploma | 488 (43.0%) | 648 (57.0%) |
| College or Associate's Degree | 488 (60.6%) | 318 (39.5%) |
| Bachelor's Degree | 490 (91.2%) | 47 (8.7%) |
| Graduate Degree | 303 (92.7%) | 24 (7.3%) |
| Total | 1,965 (61.1%) | 1,251 (38.9%) |
Employment Characteristics in Lake County
Employment by Class of Employer in Lake County
Among the 160,502 employed individuals in Lake County, private company employees (112,521 | 70.1%), local government employees (12,615 | 7.9%), and not-for-profit organizations (11,514 | 7.2%) make up the most common classes of employment.
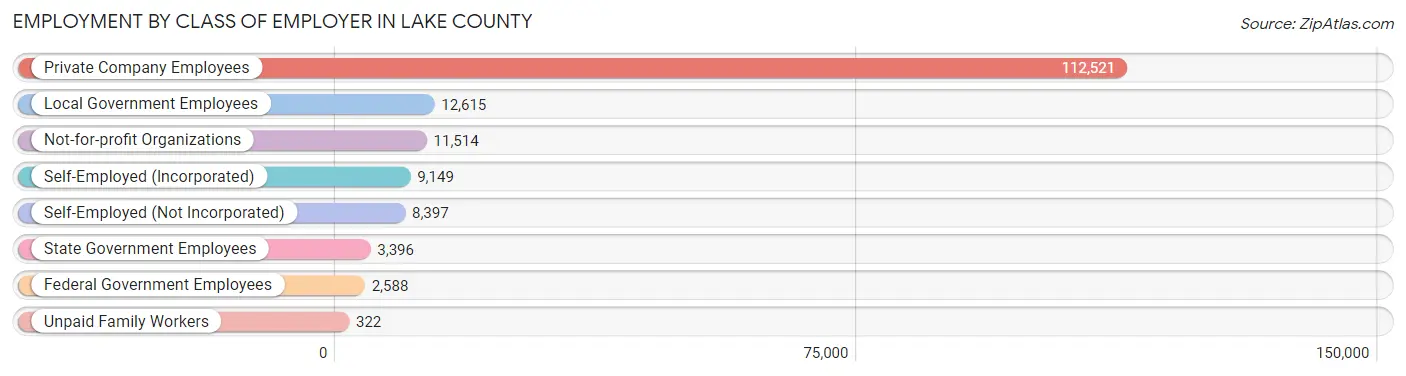
| Employer Class | # Employees | % Employees |
| Private Company Employees | 112,521 | 70.1% |
| Self-Employed (Incorporated) | 9,149 | 5.7% |
| Self-Employed (Not Incorporated) | 8,397 | 5.2% |
| Not-for-profit Organizations | 11,514 | 7.2% |
| Local Government Employees | 12,615 | 7.9% |
| State Government Employees | 3,396 | 2.1% |
| Federal Government Employees | 2,588 | 1.6% |
| Unpaid Family Workers | 322 | 0.2% |
| Total | 160,502 | 100.0% |
Employment Status by Age in Lake County
According to the labor force statistics for Lake County, out of the total population over 16 years of age (322,054), 53.7% or 172,943 individuals are in the labor force, with 5.5% or 9,512 of them unemployed. The age group with the highest labor force participation rate is 30 to 34 years, with 83.8% or 18,135 individuals in the labor force. Within the labor force, the 16 to 19 years age range has the highest percentage of unemployed individuals, with 17.2% or 1,132 of them being unemployed.
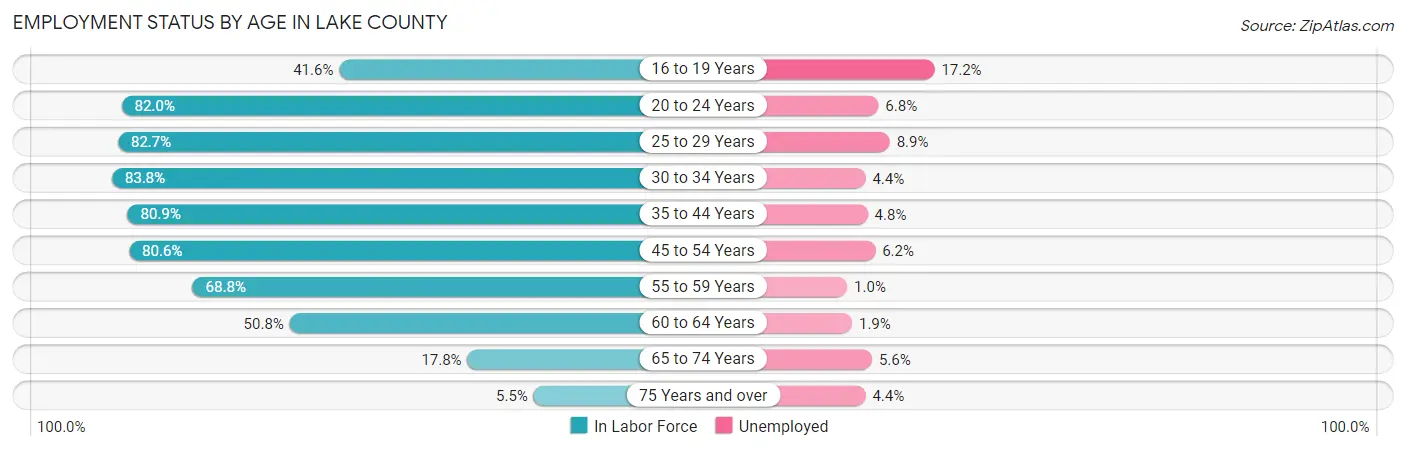
| Age Bracket | In Labor Force | Unemployed |
| 16 to 19 Years | 6,579 (41.6%) | 1,132 (17.2%) |
| 20 to 24 Years | 15,695 (82.0%) | 1,067 (6.8%) |
| 25 to 29 Years | 16,930 (82.7%) | 1,507 (8.9%) |
| 30 to 34 Years | 18,135 (83.8%) | 798 (4.4%) |
| 35 to 44 Years | 35,013 (80.9%) | 1,681 (4.8%) |
| 45 to 54 Years | 36,814 (80.6%) | 2,282 (6.2%) |
| 55 to 59 Years | 17,732 (68.8%) | 177 (1.0%) |
| 60 to 64 Years | 13,707 (50.8%) | 260 (1.9%) |
| 65 to 74 Years | 9,826 (17.8%) | 550 (5.6%) |
| 75 Years and over | 2,644 (5.5%) | 116 (4.4%) |
| Total | 172,943 (53.7%) | 9,512 (5.5%) |
Employment Status by Educational Attainment in Lake County
According to labor force statistics for Lake County, 75.3% of individuals (138,419) out of the total population between 25 and 64 years of age (183,823) are in the labor force, with 4.9% or 6,783 of them being unemployed. The group with the highest labor force participation rate are those with the educational attainment of bachelor's degree or higher, with 83.1% or 38,540 individuals in the labor force. Within the labor force, individuals with less than high school education have the highest percentage of unemployment, with 10.2% or 1,057 of them being unemployed.
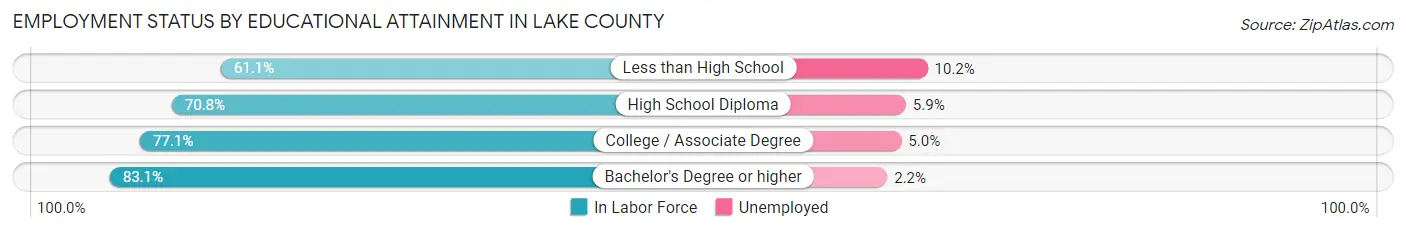
| Educational Attainment | In Labor Force | Unemployed |
| Less than High School | 10,363 (61.1%) | 1,730 (10.2%) |
| High School Diploma | 39,055 (70.8%) | 3,255 (5.9%) |
| College / Associate Degree | 50,363 (77.1%) | 3,266 (5.0%) |
| Bachelor's Degree or higher | 38,540 (83.1%) | 1,020 (2.2%) |
| Total | 138,419 (75.3%) | 9,007 (4.9%) |
Employment Occupations by Sex in Lake County
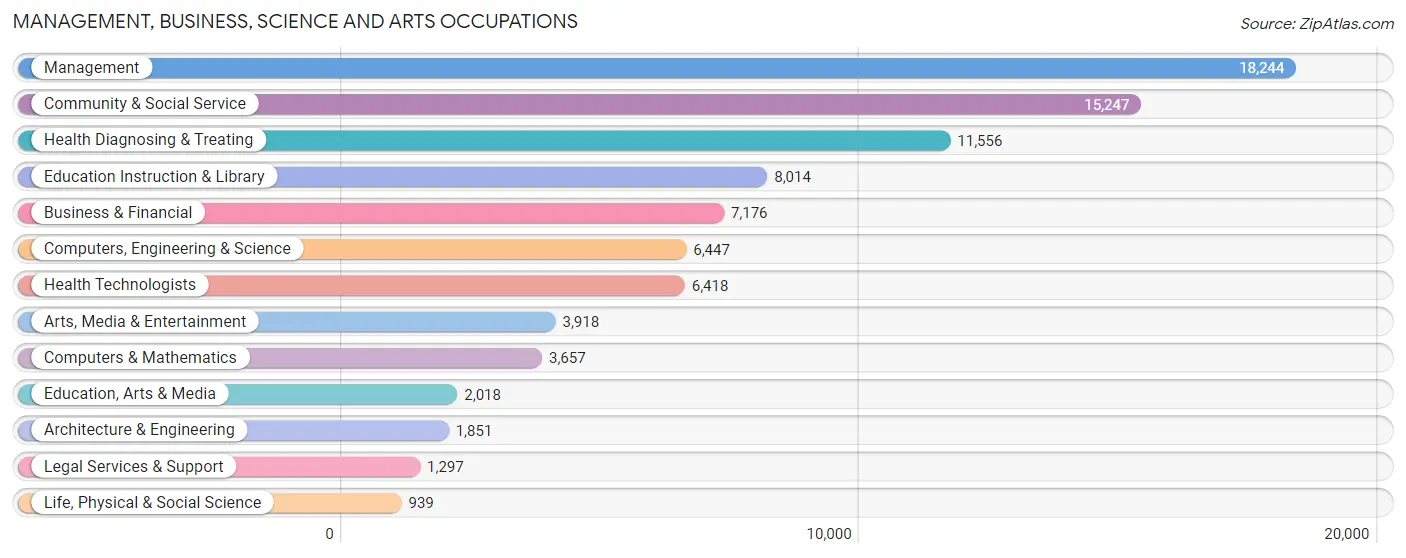
Management, Business, Science and Arts Occupations
The most common Management, Business, Science and Arts occupations in Lake County are Management (18,244 | 11.2%), Community & Social Service (15,247 | 9.3%), Health Diagnosing & Treating (11,556 | 7.1%), Education Instruction & Library (8,014 | 4.9%), and Business & Financial (7,176 | 4.4%).
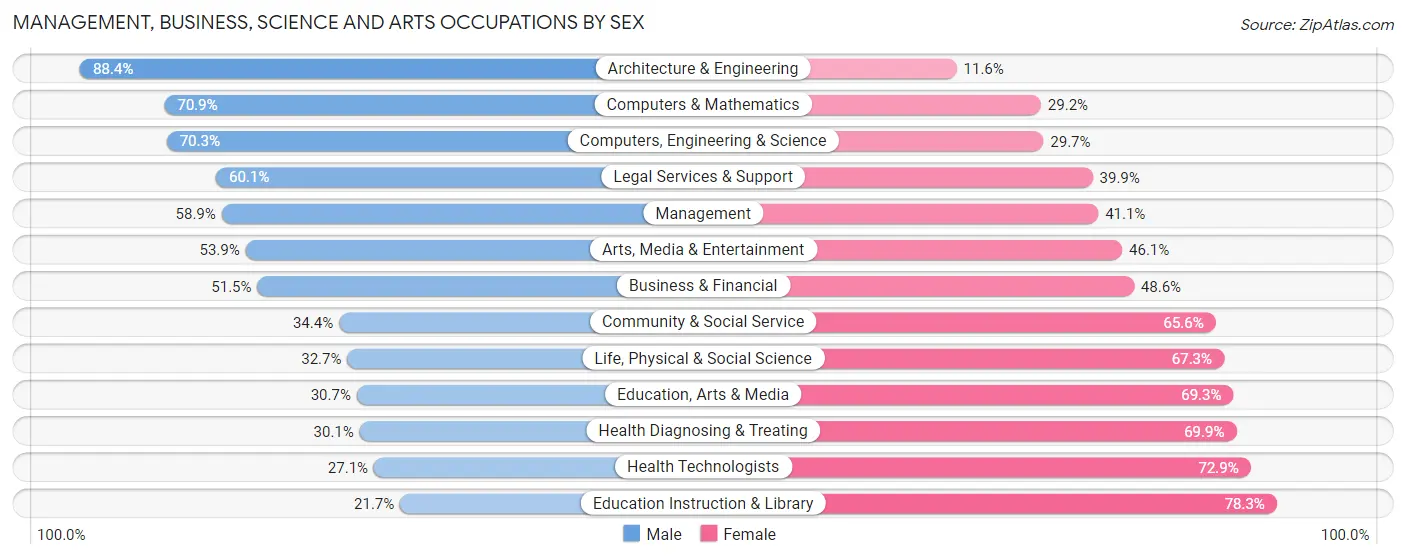
Management, Business, Science and Arts Occupations by Sex
Within the Management, Business, Science and Arts occupations in Lake County, the most male-oriented occupations are Architecture & Engineering (88.4%), Computers & Mathematics (70.9%), and Computers, Engineering & Science (70.3%), while the most female-oriented occupations are Education Instruction & Library (78.3%), Health Technologists (72.9%), and Health Diagnosing & Treating (69.9%).
| Occupation | Male | Female |
| Management | 10,746 (58.9%) | 7,498 (41.1%) |
| Business & Financial | 3,692 (51.4%) | 3,484 (48.5%) |
| Computers, Engineering & Science | 4,535 (70.3%) | 1,912 (29.7%) |
| Computers & Mathematics | 2,591 (70.9%) | 1,066 (29.1%) |
| Architecture & Engineering | 1,637 (88.4%) | 214 (11.6%) |
| Life, Physical & Social Science | 307 (32.7%) | 632 (67.3%) |
| Community & Social Service | 5,248 (34.4%) | 9,999 (65.6%) |
| Education, Arts & Media | 620 (30.7%) | 1,398 (69.3%) |
| Legal Services & Support | 779 (60.1%) | 518 (39.9%) |
| Education Instruction & Library | 1,737 (21.7%) | 6,277 (78.3%) |
| Arts, Media & Entertainment | 2,112 (53.9%) | 1,806 (46.1%) |
| Health Diagnosing & Treating | 3,480 (30.1%) | 8,076 (69.9%) |
| Health Technologists | 1,741 (27.1%) | 4,677 (72.9%) |
| Total (Category) | 27,701 (47.2%) | 30,969 (52.8%) |
| Total (Overall) | 85,119 (52.1%) | 78,111 (47.8%) |
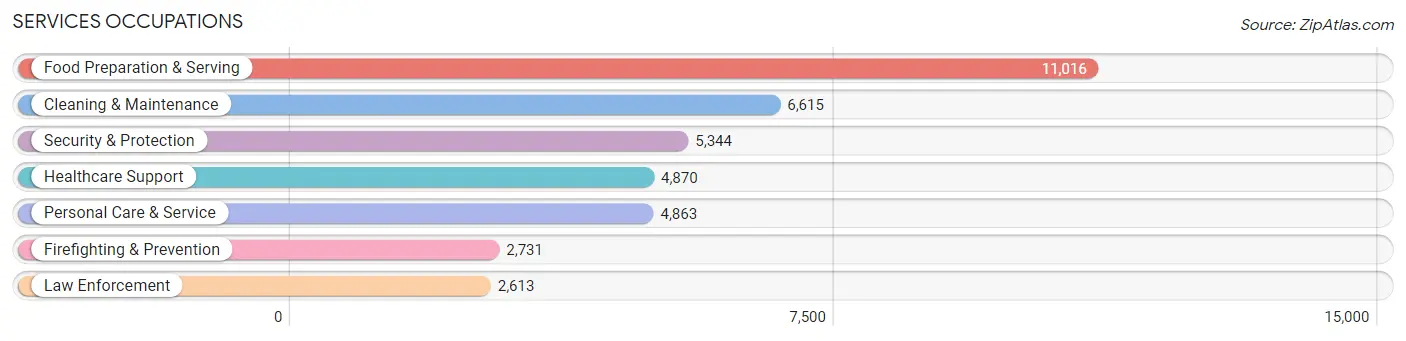
Services Occupations
The most common Services occupations in Lake County are Food Preparation & Serving (11,016 | 6.8%), Cleaning & Maintenance (6,615 | 4.1%), Security & Protection (5,344 | 3.3%), Healthcare Support (4,870 | 3.0%), and Personal Care & Service (4,863 | 3.0%).
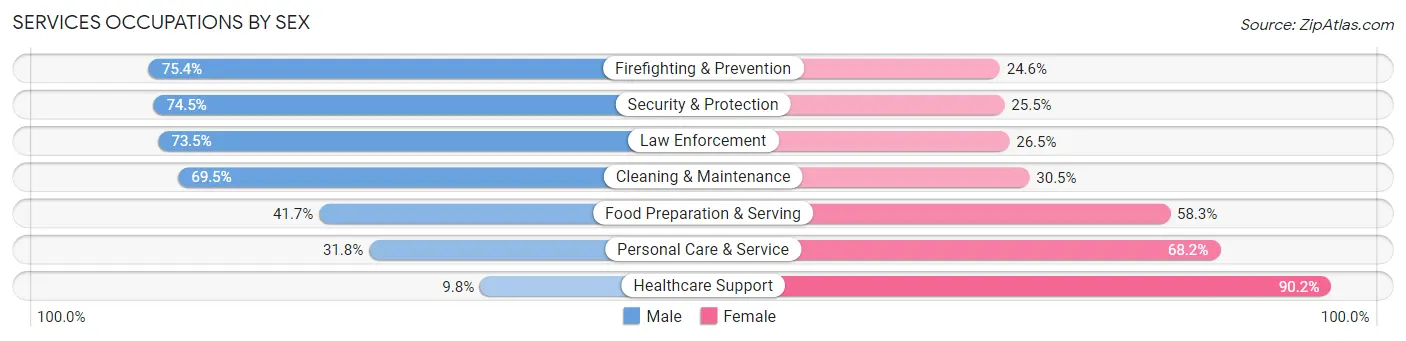
Services Occupations by Sex
Within the Services occupations in Lake County, the most male-oriented occupations are Firefighting & Prevention (75.4%), Security & Protection (74.5%), and Law Enforcement (73.5%), while the most female-oriented occupations are Healthcare Support (90.2%), Personal Care & Service (68.2%), and Food Preparation & Serving (58.3%).
| Occupation | Male | Female |
| Healthcare Support | 478 (9.8%) | 4,392 (90.2%) |
| Security & Protection | 3,980 (74.5%) | 1,364 (25.5%) |
| Firefighting & Prevention | 2,059 (75.4%) | 672 (24.6%) |
| Law Enforcement | 1,921 (73.5%) | 692 (26.5%) |
| Food Preparation & Serving | 4,591 (41.7%) | 6,425 (58.3%) |
| Cleaning & Maintenance | 4,600 (69.5%) | 2,015 (30.5%) |
| Personal Care & Service | 1,546 (31.8%) | 3,317 (68.2%) |
| Total (Category) | 15,195 (46.5%) | 17,513 (53.5%) |
| Total (Overall) | 85,119 (52.1%) | 78,111 (47.8%) |
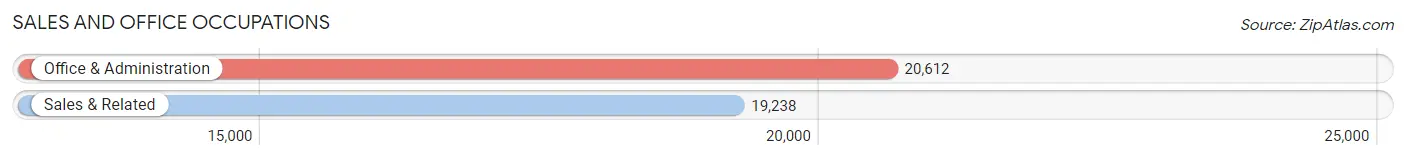
Sales and Office Occupations
The most common Sales and Office occupations in Lake County are Office & Administration (20,612 | 12.6%), and Sales & Related (19,238 | 11.8%).
Sales and Office Occupations by Sex
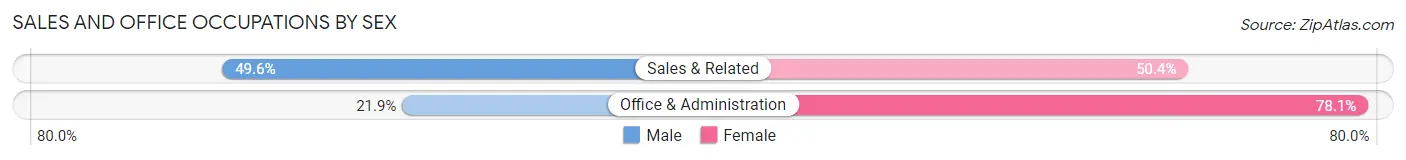
| Occupation | Male | Female |
| Sales & Related | 9,541 (49.6%) | 9,697 (50.4%) |
| Office & Administration | 4,517 (21.9%) | 16,095 (78.1%) |
| Total (Category) | 14,058 (35.3%) | 25,792 (64.7%) |
| Total (Overall) | 85,119 (52.1%) | 78,111 (47.8%) |
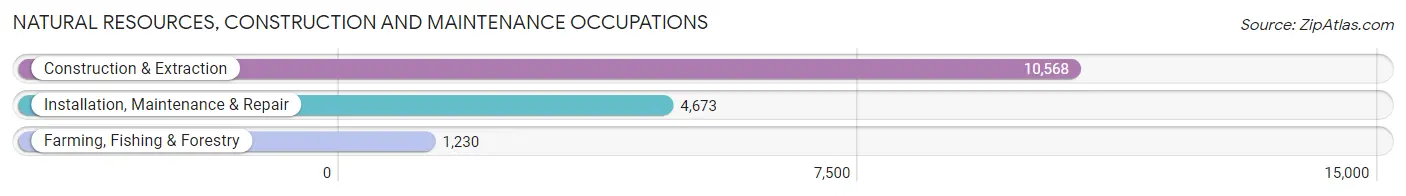
Natural Resources, Construction and Maintenance Occupations
The most common Natural Resources, Construction and Maintenance occupations in Lake County are Construction & Extraction (10,568 | 6.5%), Installation, Maintenance & Repair (4,673 | 2.9%), and Farming, Fishing & Forestry (1,230 | 0.7%).
Natural Resources, Construction and Maintenance Occupations by Sex
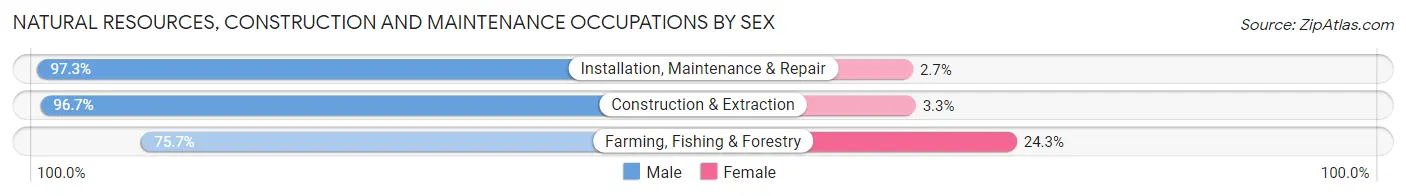
| Occupation | Male | Female |
| Farming, Fishing & Forestry | 931 (75.7%) | 299 (24.3%) |
| Construction & Extraction | 10,220 (96.7%) | 348 (3.3%) |
| Installation, Maintenance & Repair | 4,546 (97.3%) | 127 (2.7%) |
| Total (Category) | 15,697 (95.3%) | 774 (4.7%) |
| Total (Overall) | 85,119 (52.1%) | 78,111 (47.8%) |
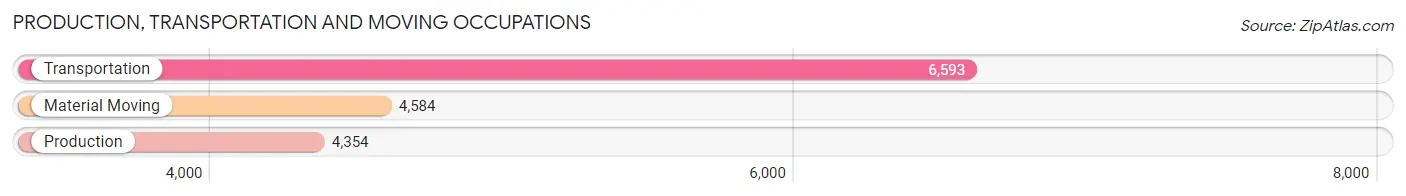
Production, Transportation and Moving Occupations
The most common Production, Transportation and Moving occupations in Lake County are Transportation (6,593 | 4.0%), Material Moving (4,584 | 2.8%), and Production (4,354 | 2.7%).
Production, Transportation and Moving Occupations by Sex
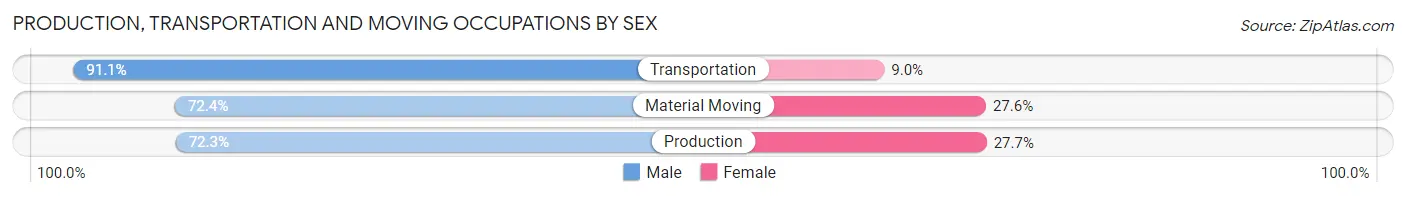
| Occupation | Male | Female |
| Production | 3,146 (72.3%) | 1,208 (27.7%) |
| Transportation | 6,003 (91.0%) | 590 (8.9%) |
| Material Moving | 3,319 (72.4%) | 1,265 (27.6%) |
| Total (Category) | 12,468 (80.3%) | 3,063 (19.7%) |
| Total (Overall) | 85,119 (52.1%) | 78,111 (47.8%) |
Employment Industries by Sex in Lake County
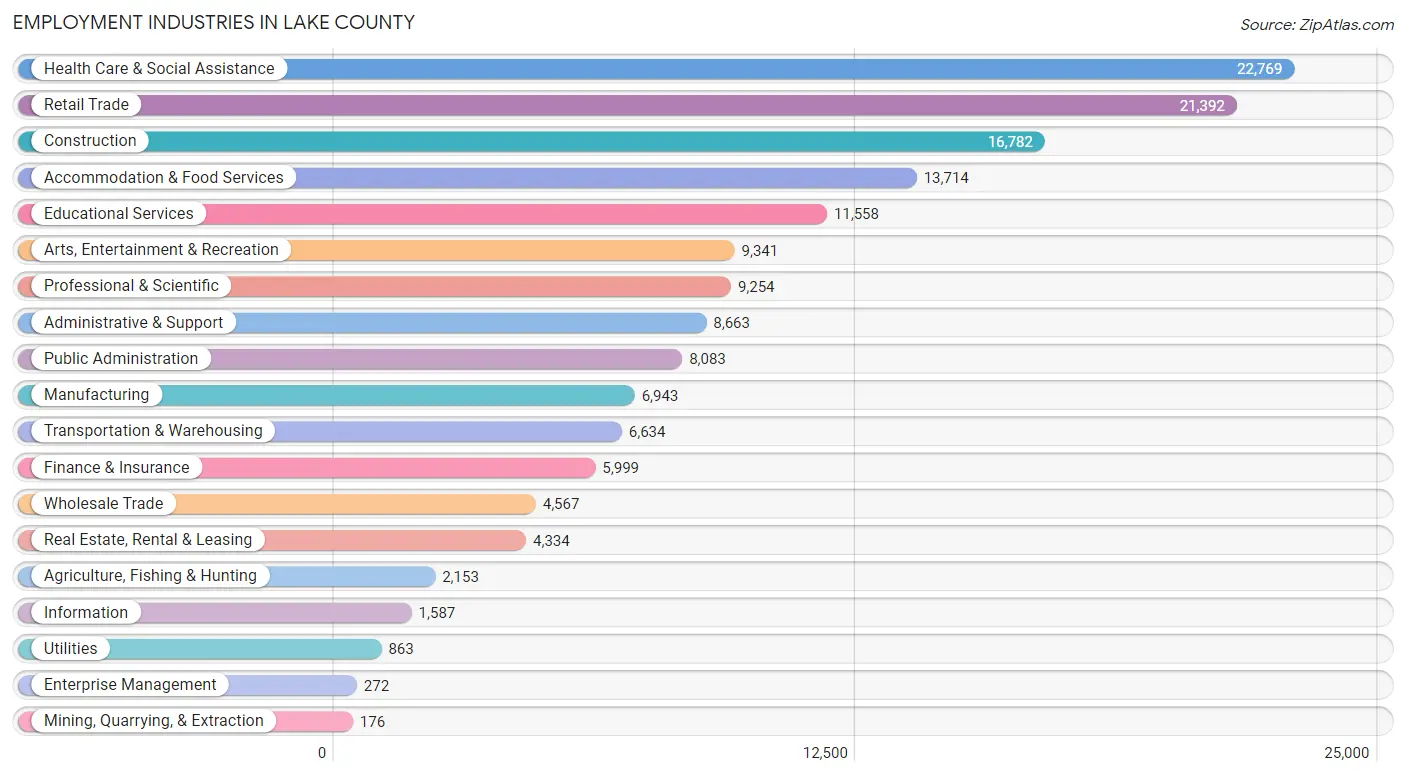
Employment Industries in Lake County
The major employment industries in Lake County include Health Care & Social Assistance (22,769 | 14.0%), Retail Trade (21,392 | 13.1%), Construction (16,782 | 10.3%), Accommodation & Food Services (13,714 | 8.4%), and Educational Services (11,558 | 7.1%).
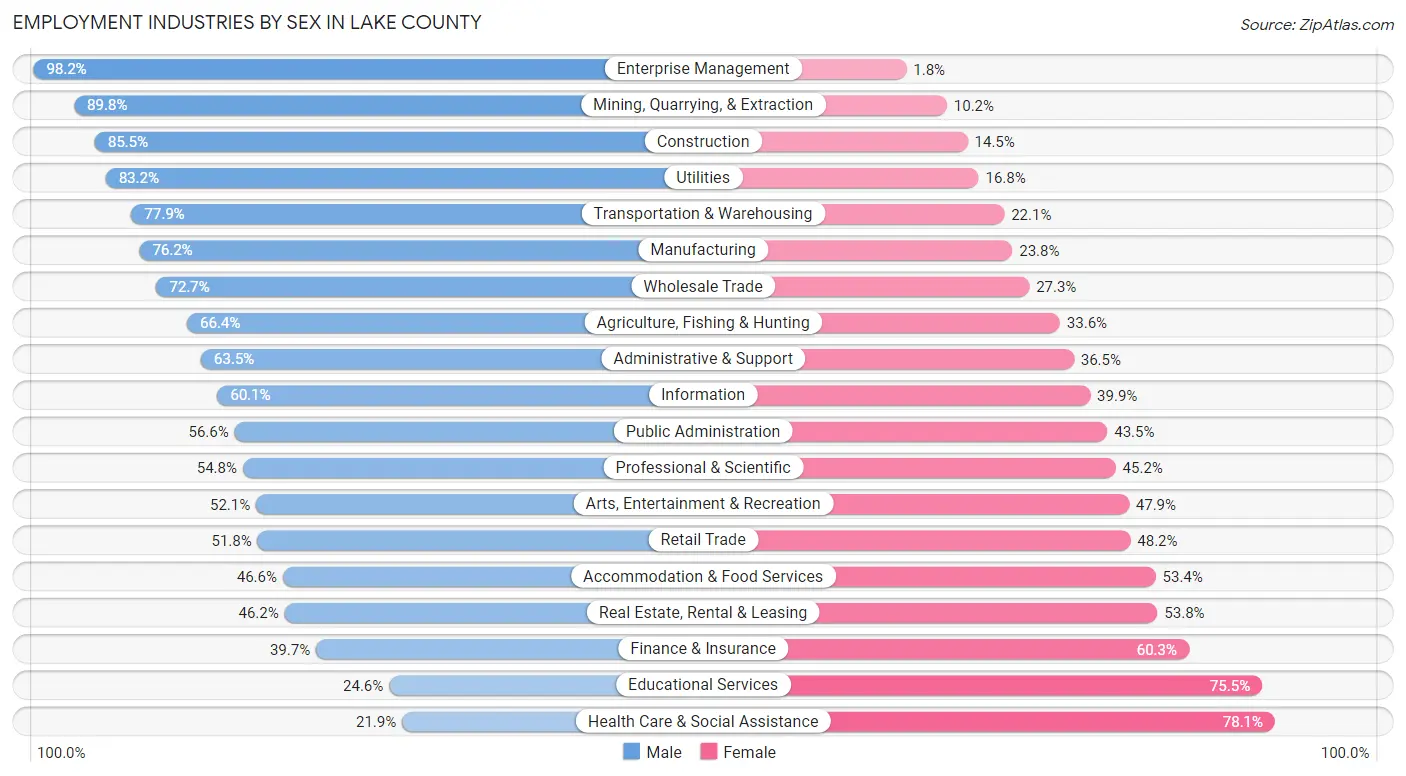
Employment Industries by Sex in Lake County
The Lake County industries that see more men than women are Enterprise Management (98.2%), Mining, Quarrying, & Extraction (89.8%), and Construction (85.5%), whereas the industries that tend to have a higher number of women are Health Care & Social Assistance (78.1%), Educational Services (75.4%), and Finance & Insurance (60.3%).
| Industry | Male | Female |
| Agriculture, Fishing & Hunting | 1,429 (66.4%) | 724 (33.6%) |
| Mining, Quarrying, & Extraction | 158 (89.8%) | 18 (10.2%) |
| Construction | 14,344 (85.5%) | 2,438 (14.5%) |
| Manufacturing | 5,292 (76.2%) | 1,651 (23.8%) |
| Wholesale Trade | 3,321 (72.7%) | 1,246 (27.3%) |
| Retail Trade | 11,076 (51.8%) | 10,316 (48.2%) |
| Transportation & Warehousing | 5,167 (77.9%) | 1,467 (22.1%) |
| Utilities | 718 (83.2%) | 145 (16.8%) |
| Information | 954 (60.1%) | 633 (39.9%) |
| Finance & Insurance | 2,381 (39.7%) | 3,618 (60.3%) |
| Real Estate, Rental & Leasing | 2,002 (46.2%) | 2,332 (53.8%) |
| Professional & Scientific | 5,074 (54.8%) | 4,180 (45.2%) |
| Enterprise Management | 267 (98.2%) | 5 (1.8%) |
| Administrative & Support | 5,501 (63.5%) | 3,162 (36.5%) |
| Educational Services | 2,838 (24.5%) | 8,720 (75.4%) |
| Health Care & Social Assistance | 4,982 (21.9%) | 17,787 (78.1%) |
| Arts, Entertainment & Recreation | 4,867 (52.1%) | 4,474 (47.9%) |
| Accommodation & Food Services | 6,385 (46.6%) | 7,329 (53.4%) |
| Public Administration | 4,571 (56.6%) | 3,512 (43.4%) |
| Total | 85,119 (52.1%) | 78,111 (47.8%) |
Education in Lake County
School Enrollment in Lake County
The most common levels of schooling among the 75,016 students in Lake County are middle school (17,336 | 23.1%), high school (17,208 | 22.9%), and elementary school (16,397 | 21.9%).
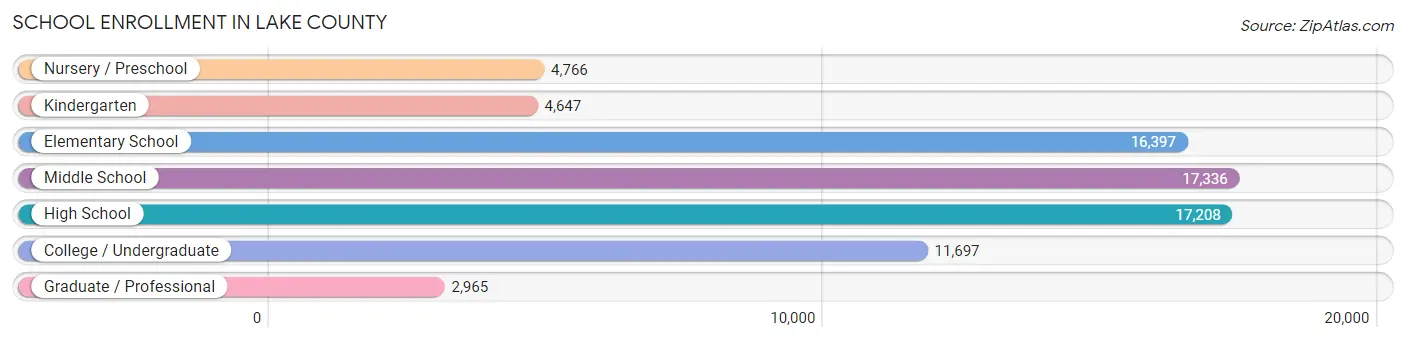
| School Level | # Students | % Students |
| Nursery / Preschool | 4,766 | 6.4% |
| Kindergarten | 4,647 | 6.2% |
| Elementary School | 16,397 | 21.9% |
| Middle School | 17,336 | 23.1% |
| High School | 17,208 | 22.9% |
| College / Undergraduate | 11,697 | 15.6% |
| Graduate / Professional | 2,965 | 4.0% |
| Total | 75,016 | 100.0% |
School Enrollment by Age by Funding Source in Lake County
Out of a total of 75,016 students who are enrolled in schools in Lake County, 16,353 (21.8%) attend a private institution, while the remaining 58,663 (78.2%) are enrolled in public schools. The age group of 3 to 4 year olds has the highest likelihood of being enrolled in private schools, with 2,136 (59.0% in the age bracket) enrolled. Conversely, the age group of 18 to 19 year olds has the lowest likelihood of being enrolled in a private school, with 4,389 (91.6% in the age bracket) attending a public institution.
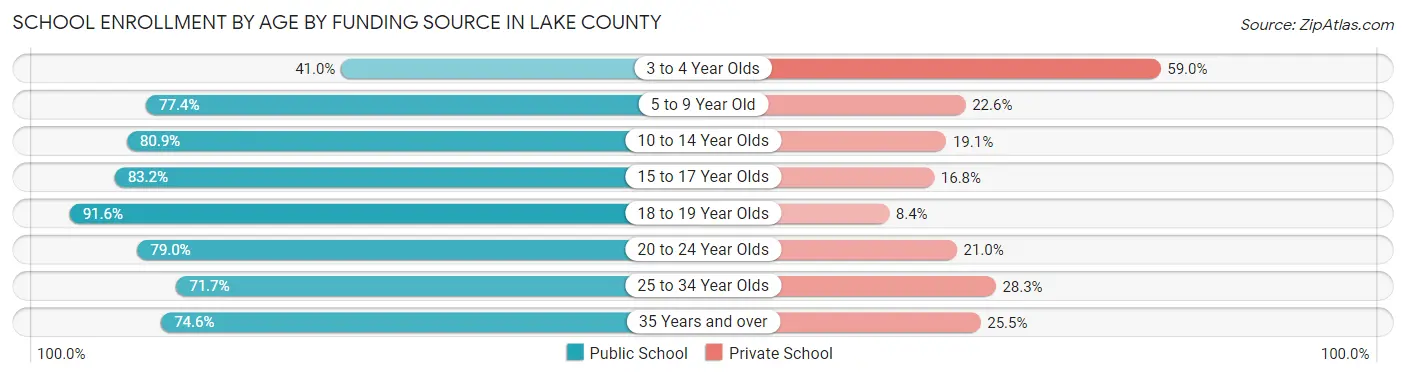
| Age Bracket | Public School | Private School |
| 3 to 4 Year Olds | 1,486 (41.0%) | 2,136 (59.0%) |
| 5 to 9 Year Old | 15,095 (77.4%) | 4,418 (22.6%) |
| 10 to 14 Year Olds | 17,265 (80.9%) | 4,066 (19.1%) |
| 15 to 17 Year Olds | 10,412 (83.2%) | 2,102 (16.8%) |
| 18 to 19 Year Olds | 4,389 (91.6%) | 403 (8.4%) |
| 20 to 24 Year Olds | 4,200 (79.0%) | 1,118 (21.0%) |
| 25 to 34 Year Olds | 2,591 (71.7%) | 1,021 (28.3%) |
| 35 Years and over | 3,216 (74.6%) | 1,098 (25.5%) |
| Total | 58,663 (78.2%) | 16,353 (21.8%) |
Educational Attainment by Field of Study in Lake County
Business (18,174 | 23.2%), education (12,747 | 16.2%), science & technology (9,565 | 12.2%), arts & humanities (5,230 | 6.7%), and engineering (4,889 | 6.2%) are the most common fields of study among 78,470 individuals in Lake County who have obtained a bachelor's degree or higher.
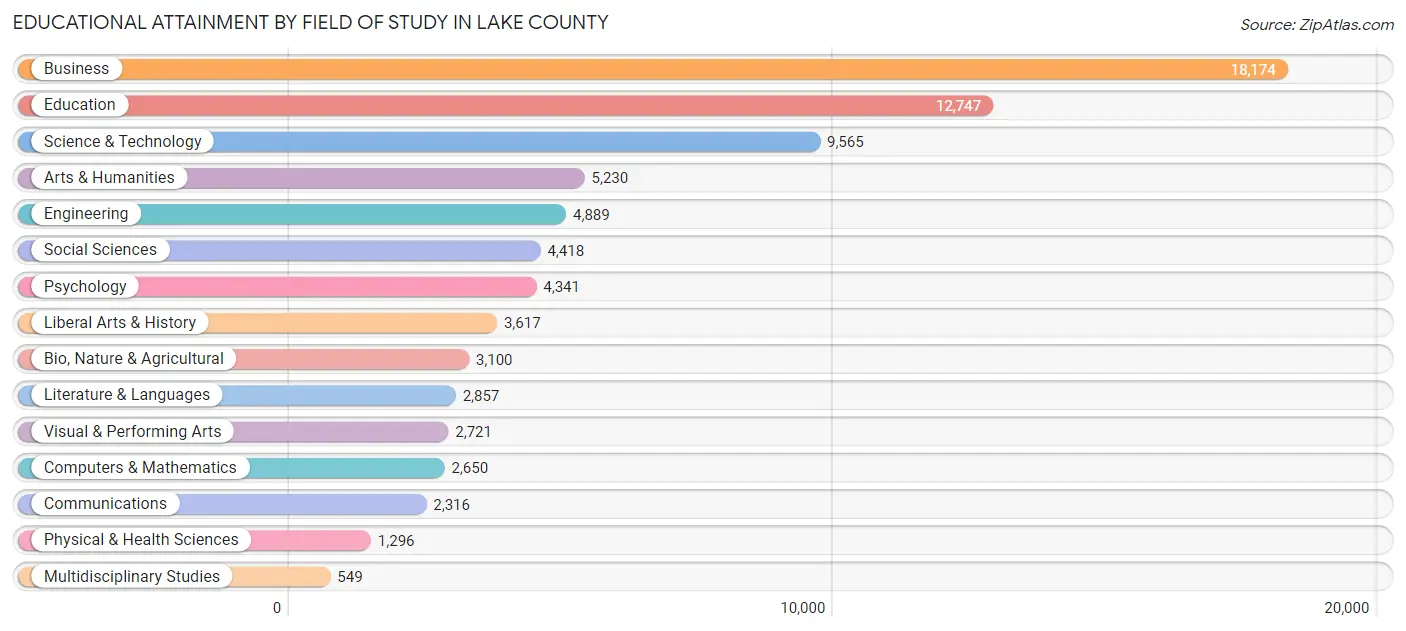
| Field of Study | # Graduates | % Graduates |
| Computers & Mathematics | 2,650 | 3.4% |
| Bio, Nature & Agricultural | 3,100 | 4.0% |
| Physical & Health Sciences | 1,296 | 1.7% |
| Psychology | 4,341 | 5.5% |
| Social Sciences | 4,418 | 5.6% |
| Engineering | 4,889 | 6.2% |
| Multidisciplinary Studies | 549 | 0.7% |
| Science & Technology | 9,565 | 12.2% |
| Business | 18,174 | 23.2% |
| Education | 12,747 | 16.2% |
| Literature & Languages | 2,857 | 3.6% |
| Liberal Arts & History | 3,617 | 4.6% |
| Visual & Performing Arts | 2,721 | 3.5% |
| Communications | 2,316 | 2.9% |
| Arts & Humanities | 5,230 | 6.7% |
| Total | 78,470 | 100.0% |
Transportation & Commute in Lake County
Vehicle Availability by Sex in Lake County
The most prevalent vehicle ownership categories in Lake County are males with 2 vehicles (36,344, accounting for 43.1%) and females with 2 vehicles (32,113, making up 47.8%).
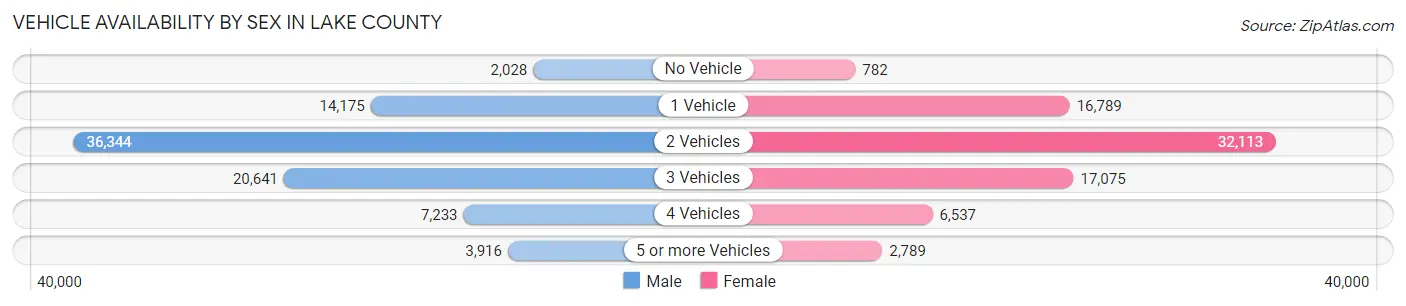
| Vehicles Available | Male | Female |
| No Vehicle | 2,028 (2.4%) | 782 (1.0%) |
| 1 Vehicle | 14,175 (16.8%) | 16,789 (22.1%) |
| 2 Vehicles | 36,344 (43.1%) | 32,113 (42.2%) |
| 3 Vehicles | 20,641 (24.5%) | 17,075 (22.4%) |
| 4 Vehicles | 7,233 (8.6%) | 6,537 (8.6%) |
| 5 or more Vehicles | 3,916 (4.6%) | 2,789 (3.7%) |
| Total | 84,337 (100.0%) | 76,085 (100.0%) |
Commute Time in Lake County
The most frequently occuring commute durations in Lake County are 45 to 59 minutes (19,621 commuters, 13.8%), 30 to 34 minutes (17,806 commuters, 12.6%), and 15 to 19 minutes (17,435 commuters, 12.3%).
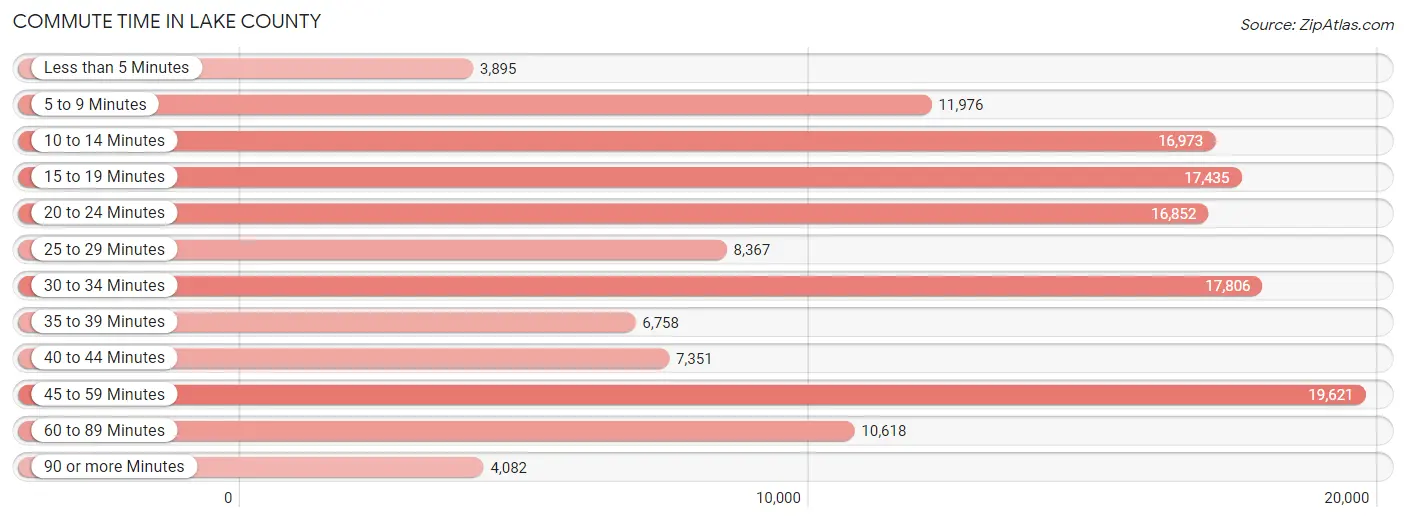
| Commute Time | # Commuters | % Commuters |
| Less than 5 Minutes | 3,895 | 2.8% |
| 5 to 9 Minutes | 11,976 | 8.5% |
| 10 to 14 Minutes | 16,973 | 12.0% |
| 15 to 19 Minutes | 17,435 | 12.3% |
| 20 to 24 Minutes | 16,852 | 11.9% |
| 25 to 29 Minutes | 8,367 | 5.9% |
| 30 to 34 Minutes | 17,806 | 12.6% |
| 35 to 39 Minutes | 6,758 | 4.8% |
| 40 to 44 Minutes | 7,351 | 5.2% |
| 45 to 59 Minutes | 19,621 | 13.8% |
| 60 to 89 Minutes | 10,618 | 7.5% |
| 90 or more Minutes | 4,082 | 2.9% |
Commute Time by Sex in Lake County
The most common commute times in Lake County are 45 to 59 minutes (11,268 commuters, 15.1%) for males and 20 to 24 minutes (9,637 commuters, 14.3%) for females.
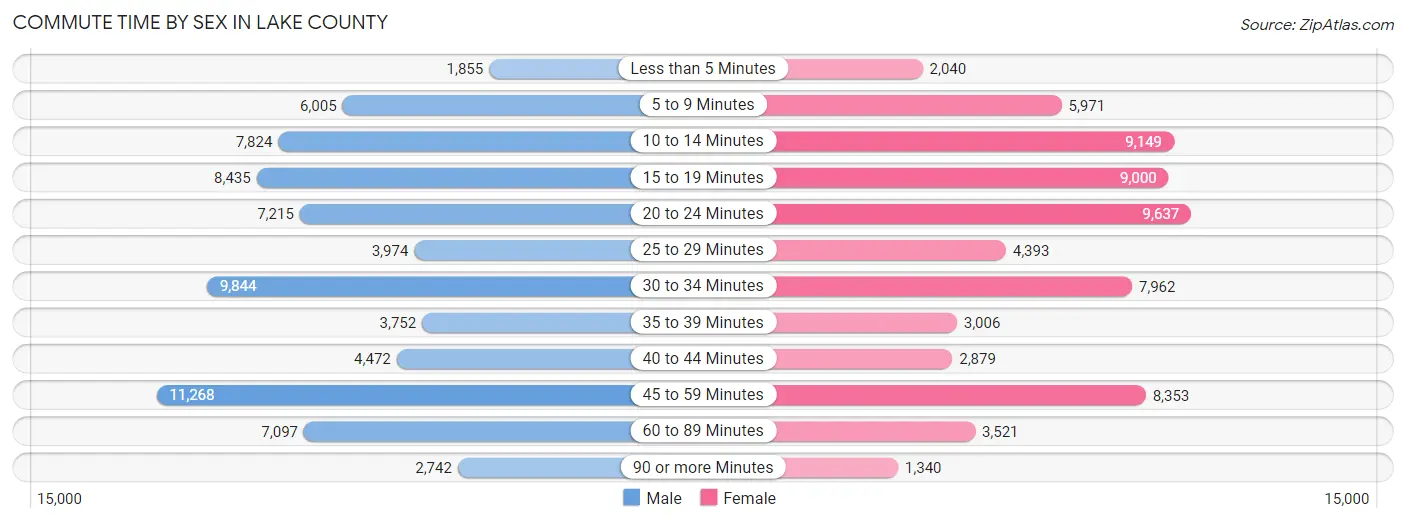
| Commute Time | Male | Female |
| Less than 5 Minutes | 1,855 (2.5%) | 2,040 (3.0%) |
| 5 to 9 Minutes | 6,005 (8.1%) | 5,971 (8.9%) |
| 10 to 14 Minutes | 7,824 (10.5%) | 9,149 (13.6%) |
| 15 to 19 Minutes | 8,435 (11.3%) | 9,000 (13.4%) |
| 20 to 24 Minutes | 7,215 (9.7%) | 9,637 (14.3%) |
| 25 to 29 Minutes | 3,974 (5.3%) | 4,393 (6.5%) |
| 30 to 34 Minutes | 9,844 (13.2%) | 7,962 (11.8%) |
| 35 to 39 Minutes | 3,752 (5.0%) | 3,006 (4.5%) |
| 40 to 44 Minutes | 4,472 (6.0%) | 2,879 (4.3%) |
| 45 to 59 Minutes | 11,268 (15.1%) | 8,353 (12.4%) |
| 60 to 89 Minutes | 7,097 (9.5%) | 3,521 (5.2%) |
| 90 or more Minutes | 2,742 (3.7%) | 1,340 (2.0%) |
Time of Departure to Work by Sex in Lake County
The most frequent times of departure to work in Lake County are 7:00 AM to 7:29 AM (10,753, 14.4%) for males and 7:00 AM to 7:29 AM (10,925, 16.3%) for females.
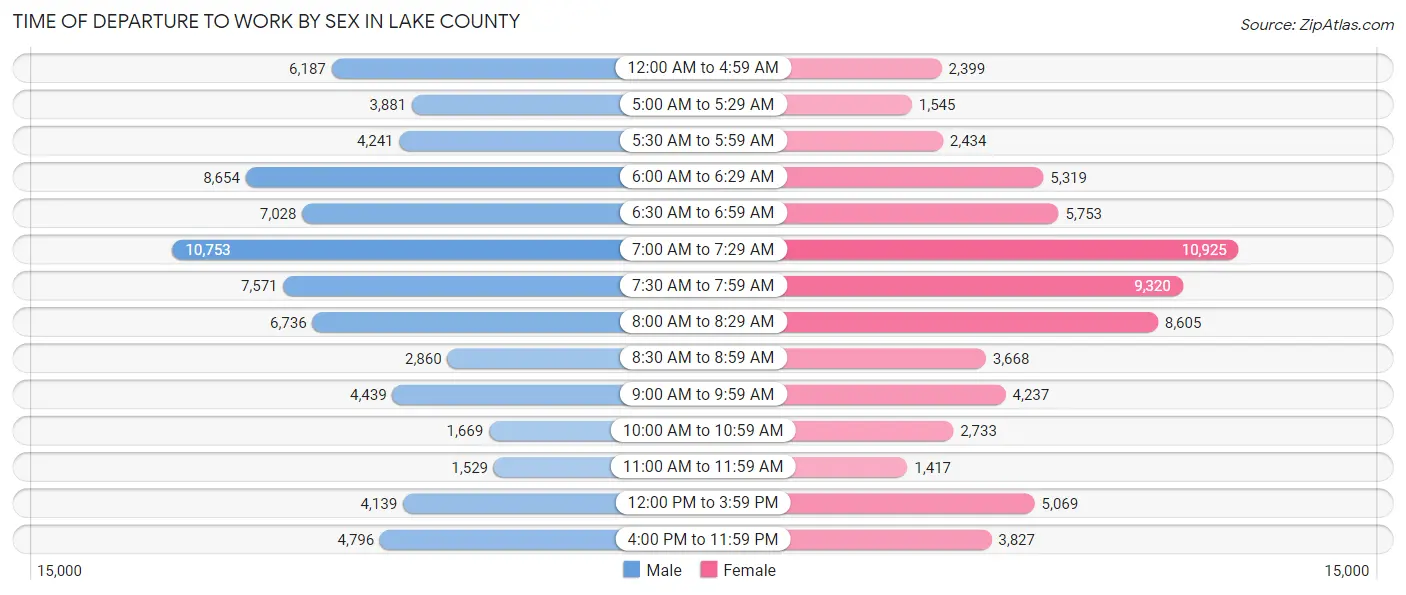
| Time of Departure | Male | Female |
| 12:00 AM to 4:59 AM | 6,187 (8.3%) | 2,399 (3.6%) |
| 5:00 AM to 5:29 AM | 3,881 (5.2%) | 1,545 (2.3%) |
| 5:30 AM to 5:59 AM | 4,241 (5.7%) | 2,434 (3.6%) |
| 6:00 AM to 6:29 AM | 8,654 (11.6%) | 5,319 (7.9%) |
| 6:30 AM to 6:59 AM | 7,028 (9.4%) | 5,753 (8.6%) |
| 7:00 AM to 7:29 AM | 10,753 (14.4%) | 10,925 (16.3%) |
| 7:30 AM to 7:59 AM | 7,571 (10.2%) | 9,320 (13.9%) |
| 8:00 AM to 8:29 AM | 6,736 (9.0%) | 8,605 (12.8%) |
| 8:30 AM to 8:59 AM | 2,860 (3.8%) | 3,668 (5.4%) |
| 9:00 AM to 9:59 AM | 4,439 (6.0%) | 4,237 (6.3%) |
| 10:00 AM to 10:59 AM | 1,669 (2.2%) | 2,733 (4.1%) |
| 11:00 AM to 11:59 AM | 1,529 (2.1%) | 1,417 (2.1%) |
| 12:00 PM to 3:59 PM | 4,139 (5.6%) | 5,069 (7.5%) |
| 4:00 PM to 11:59 PM | 4,796 (6.4%) | 3,827 (5.7%) |
| Total | 74,483 (100.0%) | 67,251 (100.0%) |
Housing Occupancy in Lake County
Occupancy by Ownership in Lake County
Of the total 153,817 dwellings in Lake County, owner-occupied units account for 117,522 (76.4%), while renter-occupied units make up 36,295 (23.6%).
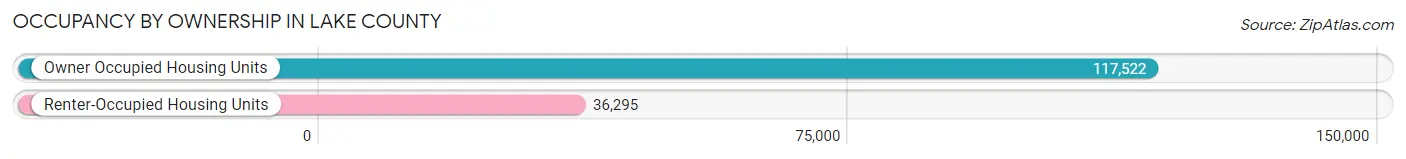
| Occupancy | # Housing Units | % Housing Units |
| Owner Occupied Housing Units | 117,522 | 76.4% |
| Renter-Occupied Housing Units | 36,295 | 23.6% |
| Total Occupied Housing Units | 153,817 | 100.0% |
Occupancy by Household Size in Lake County
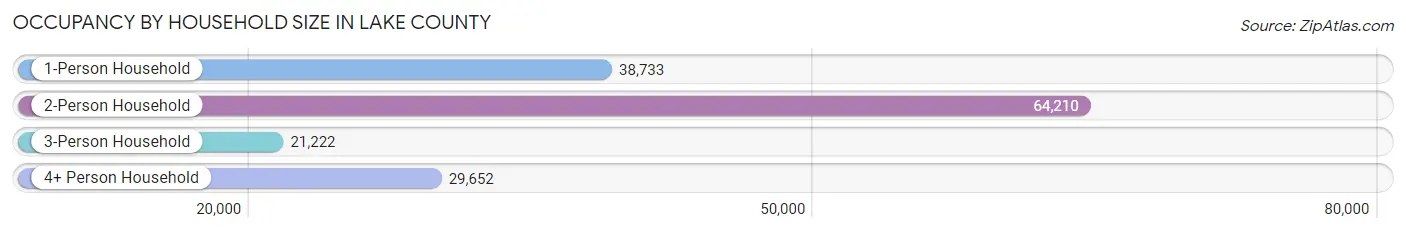
| Household Size | # Housing Units | % Housing Units |
| 1-Person Household | 38,733 | 25.2% |
| 2-Person Household | 64,210 | 41.7% |
| 3-Person Household | 21,222 | 13.8% |
| 4+ Person Household | 29,652 | 19.3% |
| Total Housing Units | 153,817 | 100.0% |
Occupancy by Ownership by Household Size in Lake County
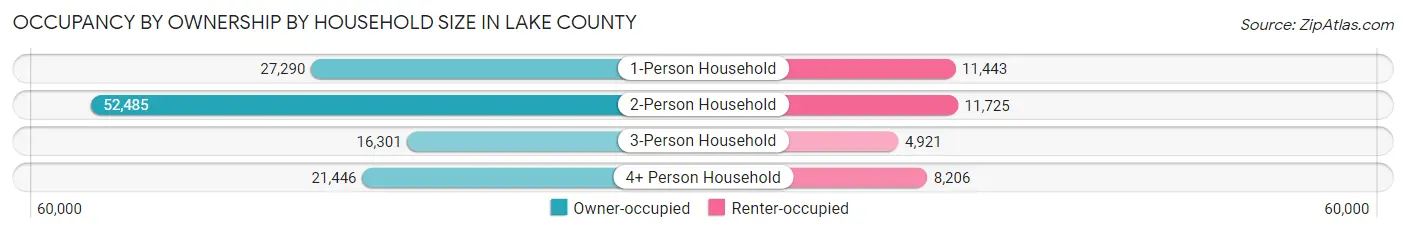
| Household Size | Owner-occupied | Renter-occupied |
| 1-Person Household | 27,290 (70.5%) | 11,443 (29.5%) |
| 2-Person Household | 52,485 (81.7%) | 11,725 (18.3%) |
| 3-Person Household | 16,301 (76.8%) | 4,921 (23.2%) |
| 4+ Person Household | 21,446 (72.3%) | 8,206 (27.7%) |
| Total Housing Units | 117,522 (76.4%) | 36,295 (23.6%) |
Occupancy by Educational Attainment in Lake County
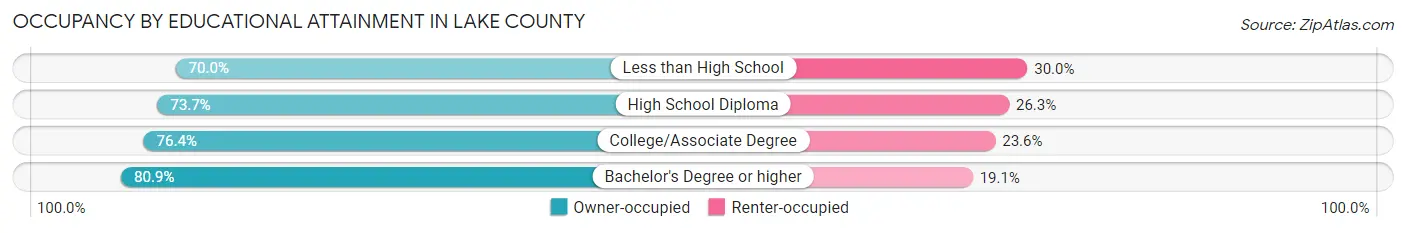
| Household Size | Owner-occupied | Renter-occupied |
| Less than High School | 8,948 (70.0%) | 3,827 (30.0%) |
| High School Diploma | 30,312 (73.7%) | 10,840 (26.3%) |
| College/Associate Degree | 42,890 (76.4%) | 13,257 (23.6%) |
| Bachelor's Degree or higher | 35,372 (80.9%) | 8,371 (19.1%) |
Occupancy by Age of Householder in Lake County
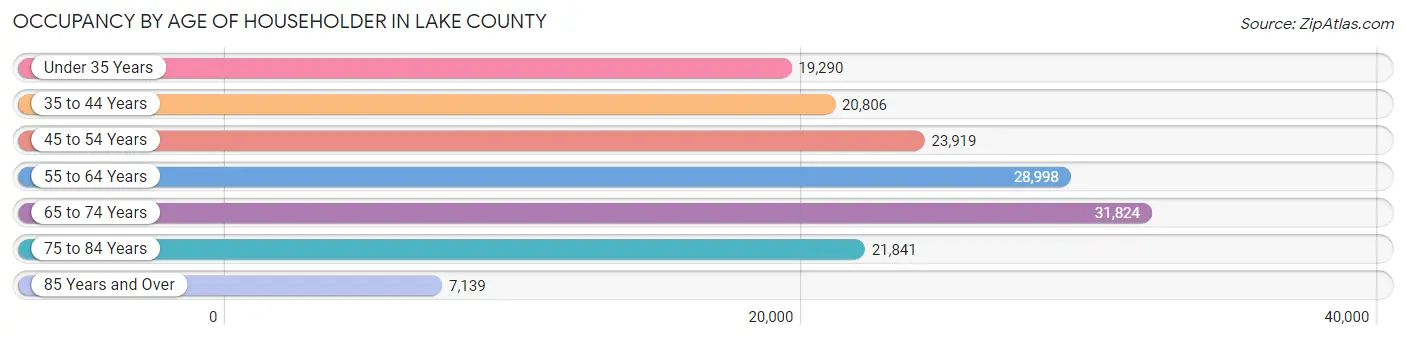
| Age Bracket | # Households | % Households |
| Under 35 Years | 19,290 | 12.5% |
| 35 to 44 Years | 20,806 | 13.5% |
| 45 to 54 Years | 23,919 | 15.5% |
| 55 to 64 Years | 28,998 | 18.9% |
| 65 to 74 Years | 31,824 | 20.7% |
| 75 to 84 Years | 21,841 | 14.2% |
| 85 Years and Over | 7,139 | 4.6% |
| Total | 153,817 | 100.0% |
Housing Finances in Lake County
Median Income by Occupancy in Lake County
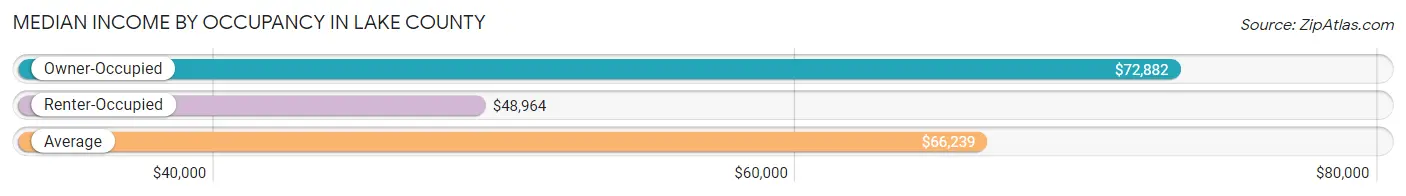
| Occupancy Type | # Households | Median Income |
| Owner-Occupied | 117,522 (76.4%) | $72,882 |
| Renter-Occupied | 36,295 (23.6%) | $48,964 |
| Average | 153,817 (100.0%) | $66,239 |
Occupancy by Householder Income Bracket in Lake County
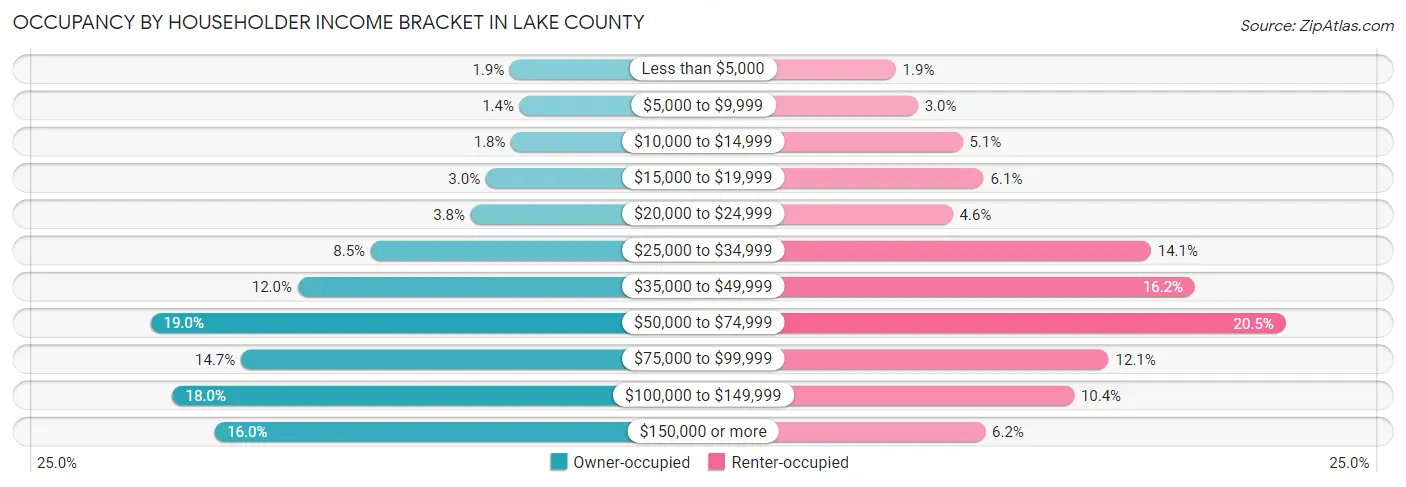
| Income Bracket | Owner-occupied | Renter-occupied |
| Less than $5,000 | 2,213 (1.9%) | 692 (1.9%) |
| $5,000 to $9,999 | 1,663 (1.4%) | 1,075 (3.0%) |
| $10,000 to $14,999 | 2,137 (1.8%) | 1,847 (5.1%) |
| $15,000 to $19,999 | 3,564 (3.0%) | 2,213 (6.1%) |
| $20,000 to $24,999 | 4,408 (3.7%) | 1,676 (4.6%) |
| $25,000 to $34,999 | 9,996 (8.5%) | 5,104 (14.1%) |
| $35,000 to $49,999 | 14,089 (12.0%) | 5,867 (16.2%) |
| $50,000 to $74,999 | 22,330 (19.0%) | 7,433 (20.5%) |
| $75,000 to $99,999 | 17,262 (14.7%) | 4,373 (12.0%) |
| $100,000 to $149,999 | 21,093 (17.9%) | 3,775 (10.4%) |
| $150,000 or more | 18,767 (16.0%) | 2,240 (6.2%) |
| Total | 117,522 (100.0%) | 36,295 (100.0%) |
Monthly Housing Cost Tiers in Lake County
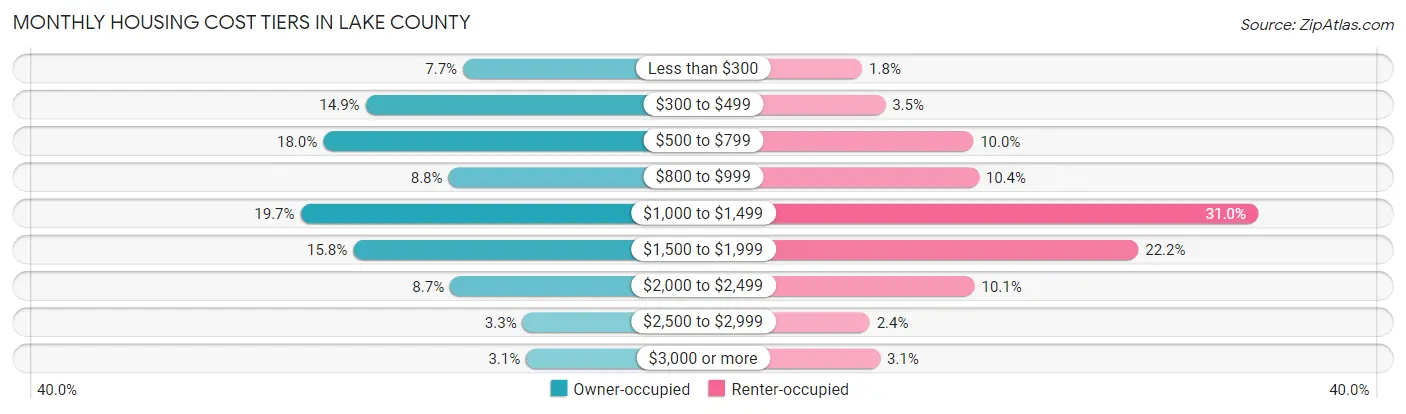
| Monthly Cost | Owner-occupied | Renter-occupied |
| Less than $300 | 9,067 (7.7%) | 662 (1.8%) |
| $300 to $499 | 17,513 (14.9%) | 1,279 (3.5%) |
| $500 to $799 | 21,176 (18.0%) | 3,628 (10.0%) |
| $800 to $999 | 10,331 (8.8%) | 3,779 (10.4%) |
| $1,000 to $1,499 | 23,135 (19.7%) | 11,238 (31.0%) |
| $1,500 to $1,999 | 18,586 (15.8%) | 8,042 (22.2%) |
| $2,000 to $2,499 | 10,189 (8.7%) | 3,664 (10.1%) |
| $2,500 to $2,999 | 3,919 (3.3%) | 863 (2.4%) |
| $3,000 or more | 3,606 (3.1%) | 1,141 (3.1%) |
| Total | 117,522 (100.0%) | 36,295 (100.0%) |
Physical Housing Characteristics in Lake County
Housing Structures in Lake County
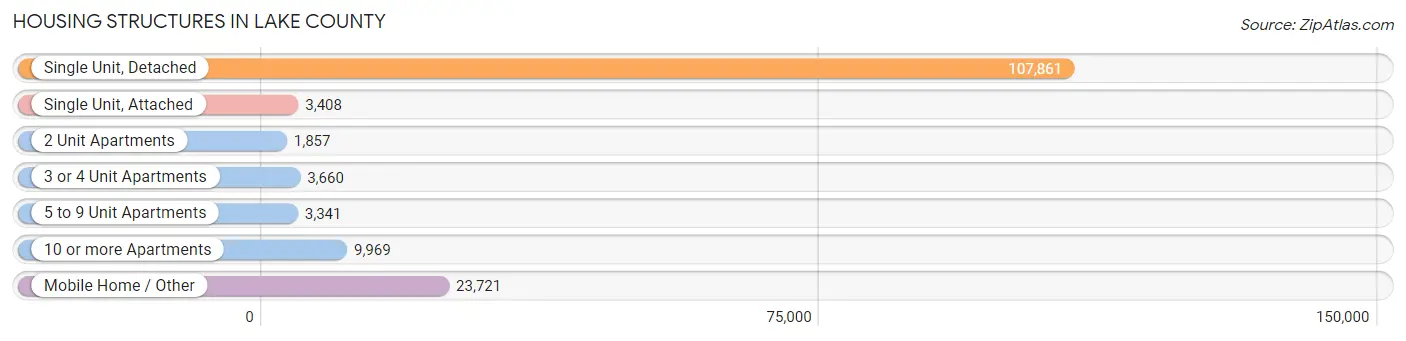
| Structure Type | # Housing Units | % Housing Units |
| Single Unit, Detached | 107,861 | 70.1% |
| Single Unit, Attached | 3,408 | 2.2% |
| 2 Unit Apartments | 1,857 | 1.2% |
| 3 or 4 Unit Apartments | 3,660 | 2.4% |
| 5 to 9 Unit Apartments | 3,341 | 2.2% |
| 10 or more Apartments | 9,969 | 6.5% |
| Mobile Home / Other | 23,721 | 15.4% |
| Total | 153,817 | 100.0% |
Housing Structures by Occupancy in Lake County
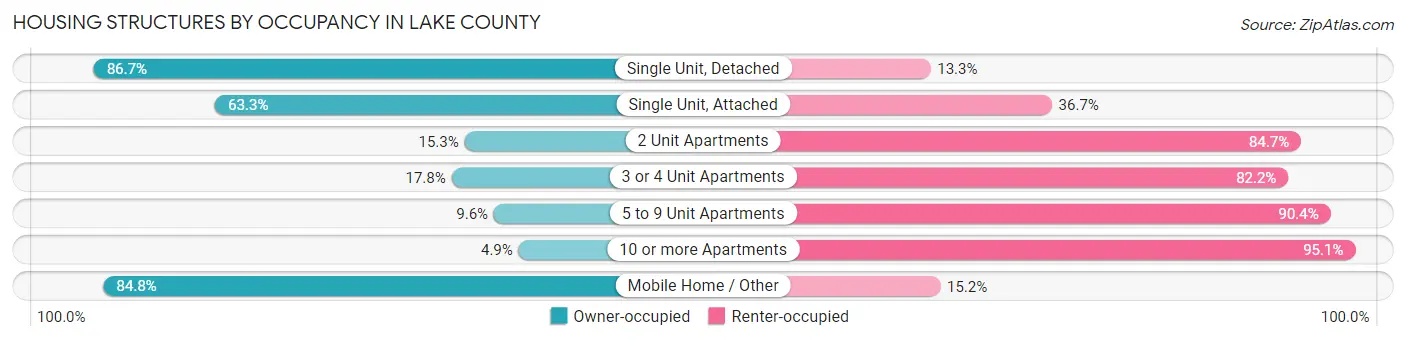
| Structure Type | Owner-occupied | Renter-occupied |
| Single Unit, Detached | 93,500 (86.7%) | 14,361 (13.3%) |
| Single Unit, Attached | 2,158 (63.3%) | 1,250 (36.7%) |
| 2 Unit Apartments | 284 (15.3%) | 1,573 (84.7%) |
| 3 or 4 Unit Apartments | 651 (17.8%) | 3,009 (82.2%) |
| 5 to 9 Unit Apartments | 322 (9.6%) | 3,019 (90.4%) |
| 10 or more Apartments | 486 (4.9%) | 9,483 (95.1%) |
| Mobile Home / Other | 20,121 (84.8%) | 3,600 (15.2%) |
| Total | 117,522 (76.4%) | 36,295 (23.6%) |
Housing Structures by Number of Rooms in Lake County
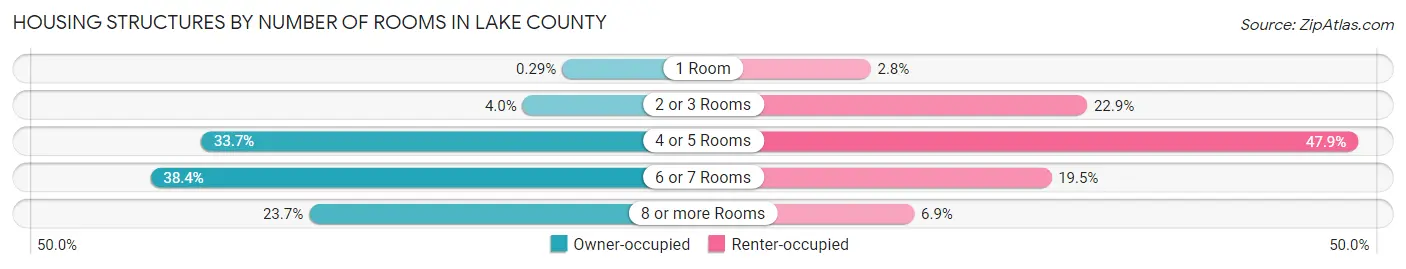
| Number of Rooms | Owner-occupied | Renter-occupied |
| 1 Room | 344 (0.3%) | 1,026 (2.8%) |
| 2 or 3 Rooms | 4,642 (4.0%) | 8,294 (22.9%) |
| 4 or 5 Rooms | 39,598 (33.7%) | 17,393 (47.9%) |
| 6 or 7 Rooms | 45,084 (38.4%) | 7,092 (19.5%) |
| 8 or more Rooms | 27,854 (23.7%) | 2,490 (6.9%) |
| Total | 117,522 (100.0%) | 36,295 (100.0%) |
Housing Structure by Heating Type in Lake County
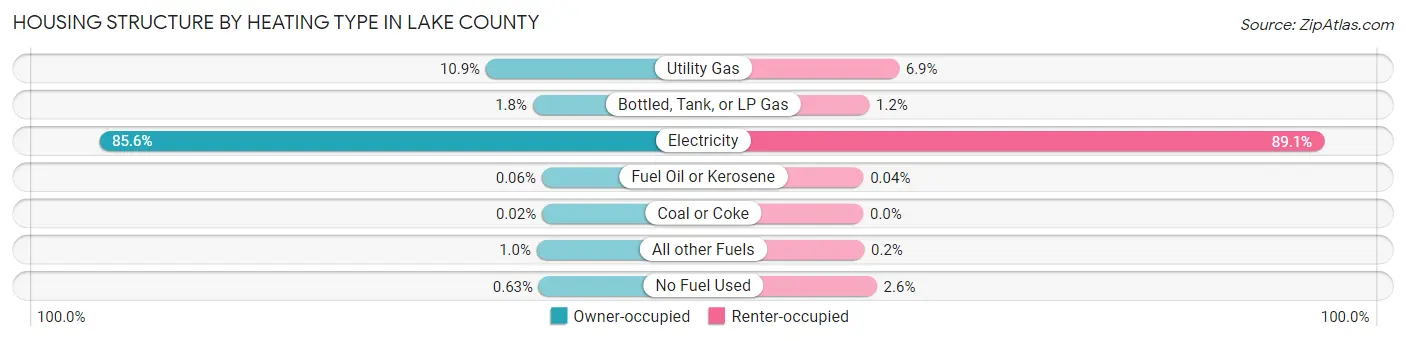
| Heating Type | Owner-occupied | Renter-occupied |
| Utility Gas | 12,748 (10.8%) | 2,508 (6.9%) |
| Bottled, Tank, or LP Gas | 2,113 (1.8%) | 424 (1.2%) |
| Electricity | 100,621 (85.6%) | 32,320 (89.0%) |
| Fuel Oil or Kerosene | 71 (0.1%) | 14 (0.0%) |
| Coal or Coke | 22 (0.0%) | 0 (0.0%) |
| All other Fuels | 1,212 (1.0%) | 74 (0.2%) |
| No Fuel Used | 735 (0.6%) | 955 (2.6%) |
| Total | 117,522 (100.0%) | 36,295 (100.0%) |
Household Vehicle Usage in Lake County
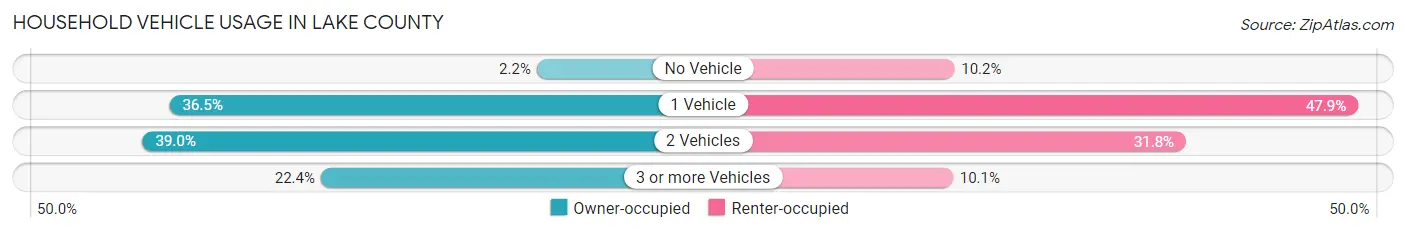
| Vehicles per Household | Owner-occupied | Renter-occupied |
| No Vehicle | 2,574 (2.2%) | 3,706 (10.2%) |
| 1 Vehicle | 42,861 (36.5%) | 17,380 (47.9%) |
| 2 Vehicles | 45,817 (39.0%) | 11,553 (31.8%) |
| 3 or more Vehicles | 26,270 (22.4%) | 3,656 (10.1%) |
| Total | 117,522 (100.0%) | 36,295 (100.0%) |
Real Estate & Mortgages in Lake County
Real Estate and Mortgage Overview in Lake County
| Characteristic | Without Mortgage | With Mortgage |
| Housing Units | 53,193 | 64,329 |
| Median Property Value | $212,600 | $291,000 |
| Median Household Income | $57,234 | $12,857 |
| Monthly Housing Costs | $512 | $3,399 |
| Real Estate Taxes | $1,725 | $2,033 |
Property Value by Mortgage Status in Lake County
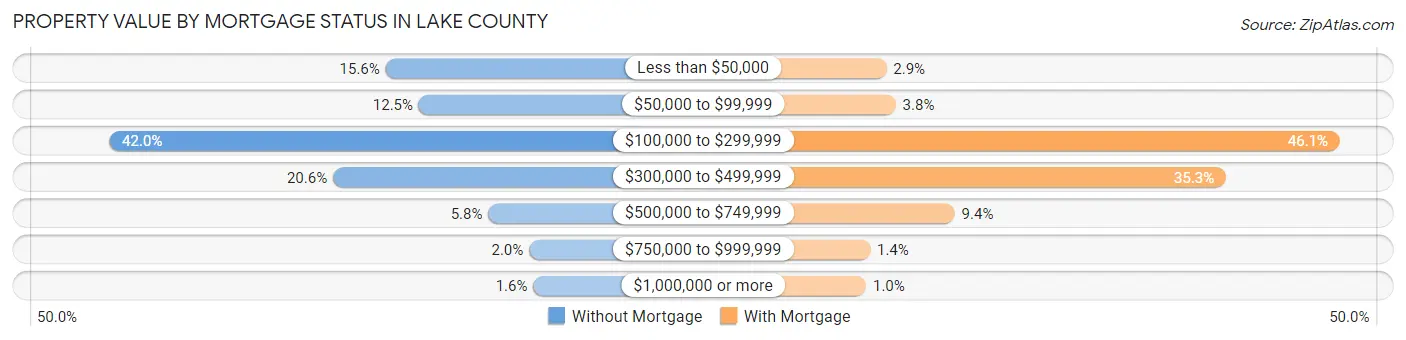
| Property Value | Without Mortgage | With Mortgage |
| Less than $50,000 | 8,308 (15.6%) | 1,884 (2.9%) |
| $50,000 to $99,999 | 6,621 (12.4%) | 2,456 (3.8%) |
| $100,000 to $299,999 | 22,320 (42.0%) | 29,676 (46.1%) |
| $300,000 to $499,999 | 10,976 (20.6%) | 22,704 (35.3%) |
| $500,000 to $749,999 | 3,104 (5.8%) | 6,075 (9.4%) |
| $750,000 to $999,999 | 1,038 (1.9%) | 890 (1.4%) |
| $1,000,000 or more | 826 (1.5%) | 644 (1.0%) |
| Total | 53,193 (100.0%) | 64,329 (100.0%) |
Household Income by Mortgage Status in Lake County
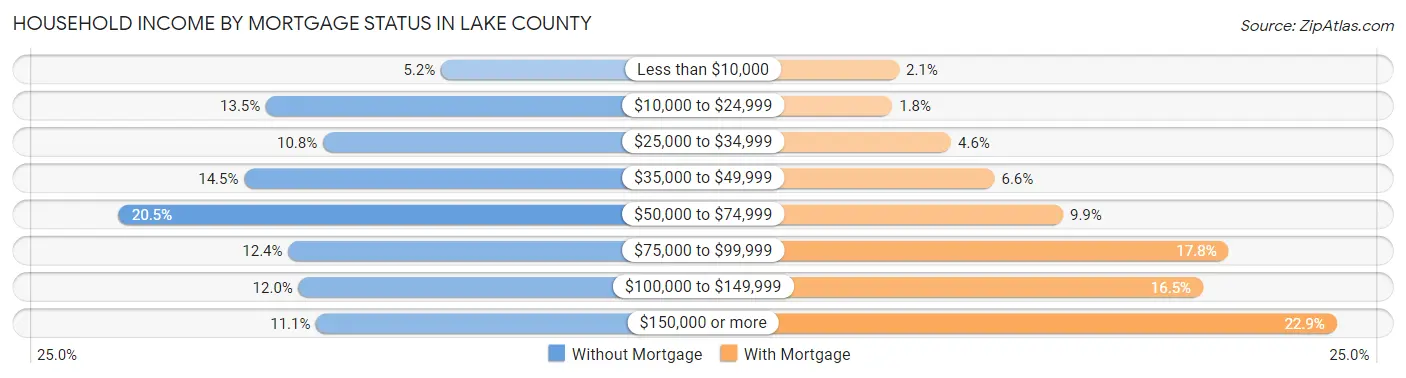
| Household Income | Without Mortgage | With Mortgage |
| Less than $10,000 | 2,748 (5.2%) | 1,330 (2.1%) |
| $10,000 to $24,999 | 7,180 (13.5%) | 1,128 (1.8%) |
| $25,000 to $34,999 | 5,739 (10.8%) | 2,929 (4.5%) |
| $35,000 to $49,999 | 7,735 (14.5%) | 4,257 (6.6%) |
| $50,000 to $74,999 | 10,908 (20.5%) | 6,354 (9.9%) |
| $75,000 to $99,999 | 6,619 (12.4%) | 11,422 (17.8%) |
| $100,000 to $149,999 | 6,354 (11.9%) | 10,643 (16.5%) |
| $150,000 or more | 5,910 (11.1%) | 14,739 (22.9%) |
| Total | 53,193 (100.0%) | 64,329 (100.0%) |
Property Value to Household Income Ratio in Lake County
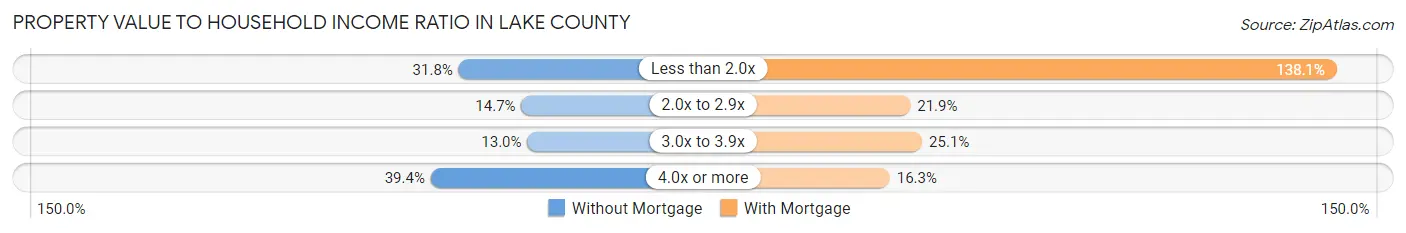
| Value-to-Income Ratio | Without Mortgage | With Mortgage |
| Less than 2.0x | 16,887 (31.8%) | 88,831 (138.1%) |
| 2.0x to 2.9x | 7,796 (14.7%) | 14,088 (21.9%) |
| 3.0x to 3.9x | 6,937 (13.0%) | 16,158 (25.1%) |
| 4.0x or more | 20,936 (39.4%) | 10,495 (16.3%) |
| Total | 53,193 (100.0%) | 64,329 (100.0%) |
Real Estate Taxes by Mortgage Status in Lake County
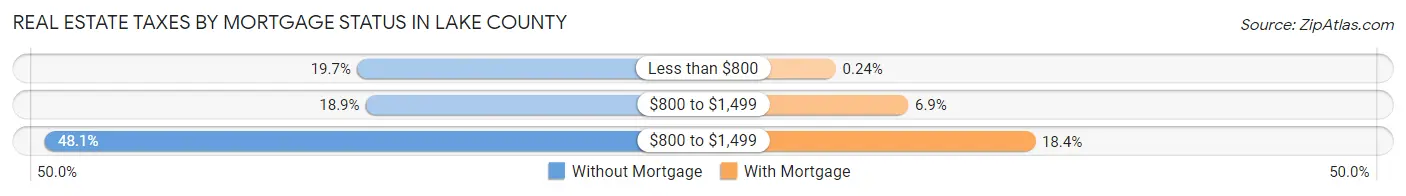
| Property Taxes | Without Mortgage | With Mortgage |
| Less than $800 | 10,464 (19.7%) | 153 (0.2%) |
| $800 to $1,499 | 10,044 (18.9%) | 4,406 (6.9%) |
| $800 to $1,499 | 25,601 (48.1%) | 11,863 (18.4%) |
| Total | 53,193 (100.0%) | 64,329 (100.0%) |
Health & Disability in Lake County
Health Insurance Coverage by Age in Lake County
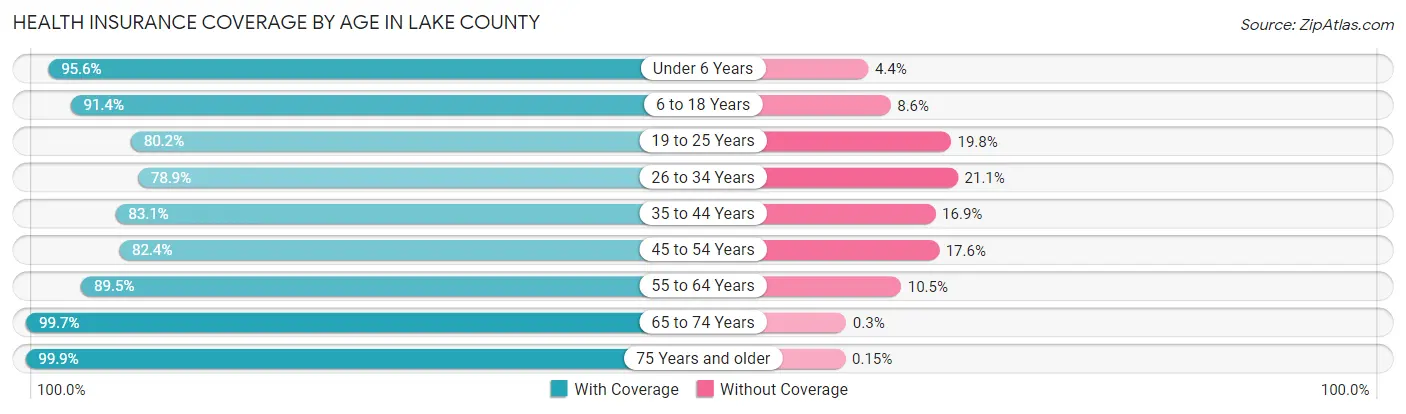
| Age Bracket | With Coverage | Without Coverage |
| Under 6 Years | 21,526 (95.6%) | 993 (4.4%) |
| 6 to 18 Years | 50,618 (91.4%) | 4,748 (8.6%) |
| 19 to 25 Years | 20,701 (80.2%) | 5,115 (19.8%) |
| 26 to 34 Years | 29,479 (78.9%) | 7,896 (21.1%) |
| 35 to 44 Years | 35,244 (83.1%) | 7,186 (16.9%) |
| 45 to 54 Years | 37,352 (82.4%) | 7,983 (17.6%) |
| 55 to 64 Years | 46,819 (89.5%) | 5,513 (10.5%) |
| 65 to 74 Years | 54,723 (99.7%) | 165 (0.3%) |
| 75 Years and older | 46,752 (99.9%) | 70 (0.2%) |
| Total | 343,214 (89.6%) | 39,669 (10.4%) |
Health Insurance Coverage by Citizenship Status in Lake County
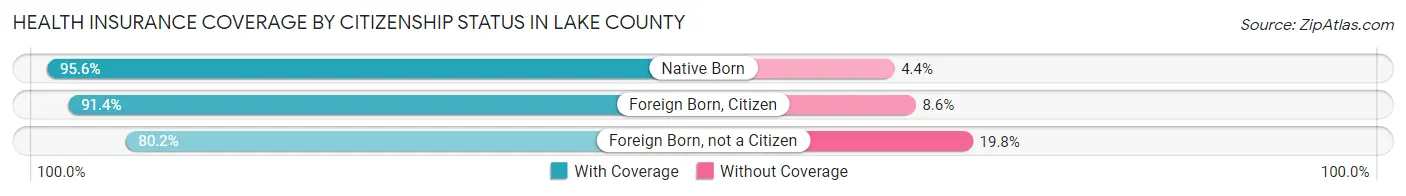
| Citizenship Status | With Coverage | Without Coverage |
| Native Born | 21,526 (95.6%) | 993 (4.4%) |
| Foreign Born, Citizen | 50,618 (91.4%) | 4,748 (8.6%) |
| Foreign Born, not a Citizen | 20,701 (80.2%) | 5,115 (19.8%) |
Health Insurance Coverage by Household Income in Lake County
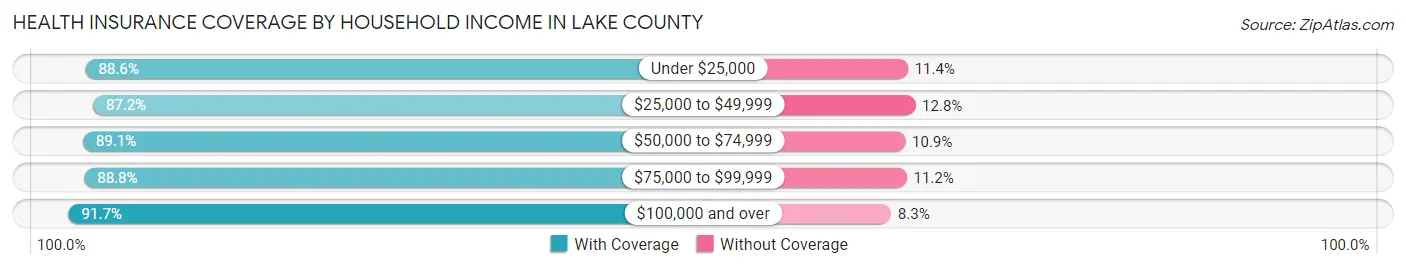
| Household Income | With Coverage | Without Coverage |
| Under $25,000 | 30,695 (88.6%) | 3,954 (11.4%) |
| $25,000 to $49,999 | 62,630 (87.2%) | 9,202 (12.8%) |
| $50,000 to $74,999 | 63,649 (89.1%) | 7,812 (10.9%) |
| $75,000 to $99,999 | 50,610 (88.8%) | 6,379 (11.2%) |
| $100,000 and over | 135,201 (91.7%) | 12,167 (8.3%) |
Public vs Private Health Insurance Coverage by Age in Lake County
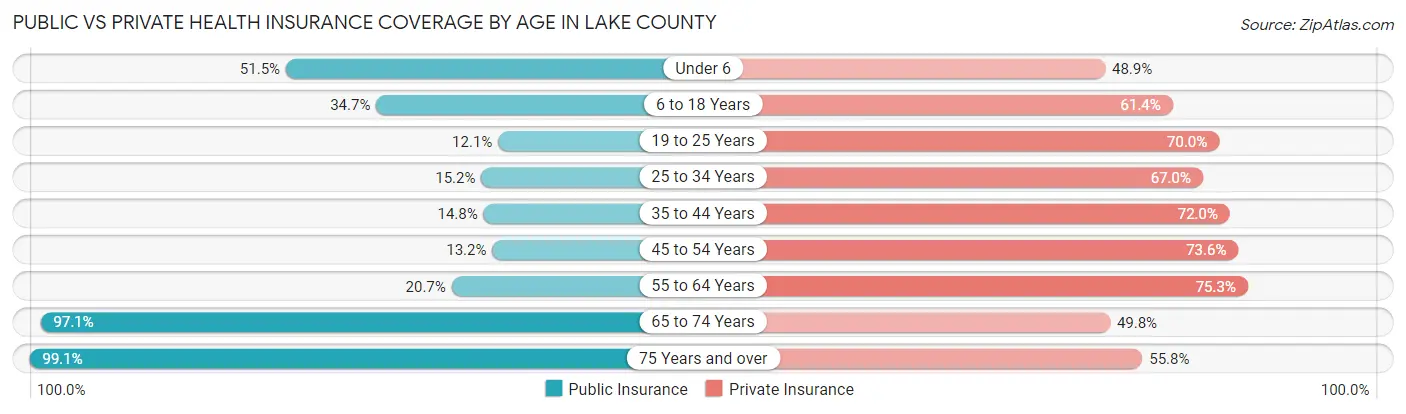
| Age Bracket | Public Insurance | Private Insurance |
| Under 6 | 11,597 (51.5%) | 11,003 (48.9%) |
| 6 to 18 Years | 19,226 (34.7%) | 33,992 (61.4%) |
| 19 to 25 Years | 3,125 (12.1%) | 18,080 (70.0%) |
| 25 to 34 Years | 5,692 (15.2%) | 25,040 (67.0%) |
| 35 to 44 Years | 6,290 (14.8%) | 30,558 (72.0%) |
| 45 to 54 Years | 5,980 (13.2%) | 33,357 (73.6%) |
| 55 to 64 Years | 10,856 (20.7%) | 39,427 (75.3%) |
| 65 to 74 Years | 53,282 (97.1%) | 27,318 (49.8%) |
| 75 Years and over | 46,412 (99.1%) | 26,118 (55.8%) |
| Total | 162,460 (42.4%) | 244,893 (64.0%) |
Disability Status by Sex by Age in Lake County
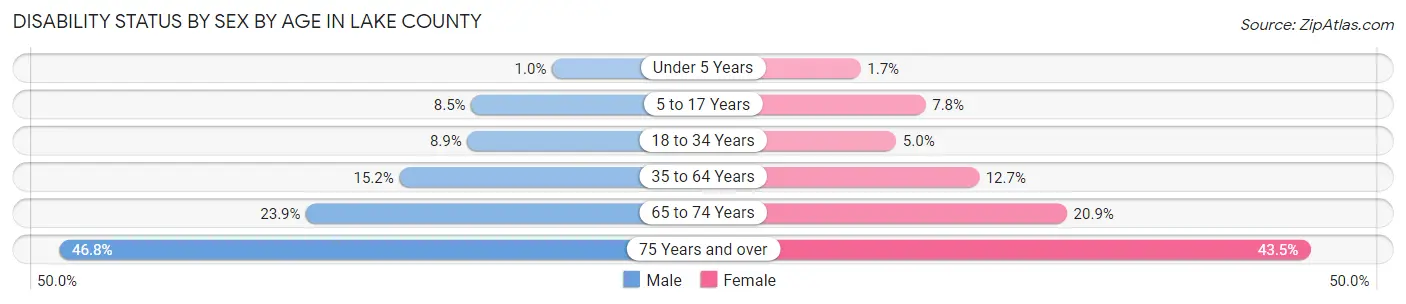
| Age Bracket | Male | Female |
| Under 5 Years | 95 (1.0%) | 153 (1.7%) |
| 5 to 17 Years | 2,423 (8.5%) | 2,072 (7.7%) |
| 18 to 34 Years | 2,991 (8.9%) | 1,715 (5.0%) |
| 35 to 64 Years | 10,289 (15.2%) | 9,207 (12.7%) |
| 65 to 74 Years | 6,032 (23.8%) | 6,178 (20.9%) |
| 75 Years and over | 10,067 (46.8%) | 10,998 (43.5%) |
Disability Class by Sex by Age in Lake County
Disability Class: Hearing Difficulty
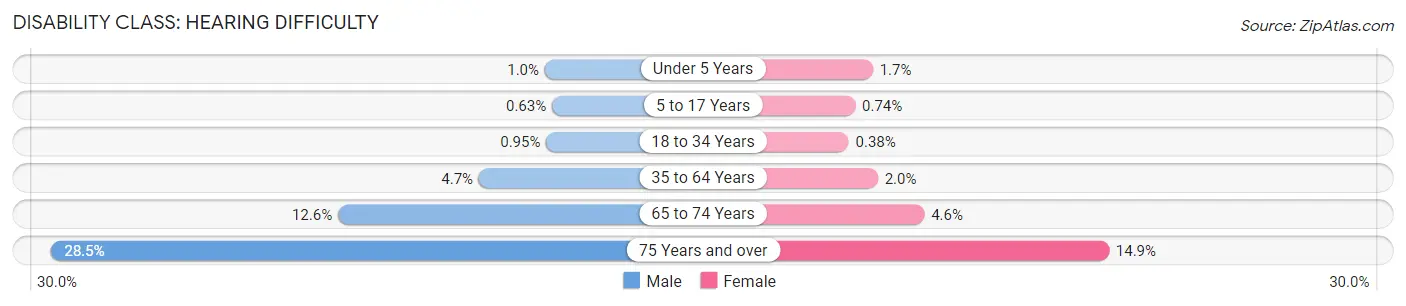
| Age Bracket | Male | Female |
| Under 5 Years | 95 (1.0%) | 153 (1.7%) |
| 5 to 17 Years | 180 (0.6%) | 199 (0.7%) |
| 18 to 34 Years | 320 (0.9%) | 129 (0.4%) |
| 35 to 64 Years | 3,184 (4.7%) | 1,445 (2.0%) |
| 65 to 74 Years | 3,174 (12.6%) | 1,359 (4.6%) |
| 75 Years and over | 6,133 (28.5%) | 3,764 (14.9%) |
Disability Class: Vision Difficulty
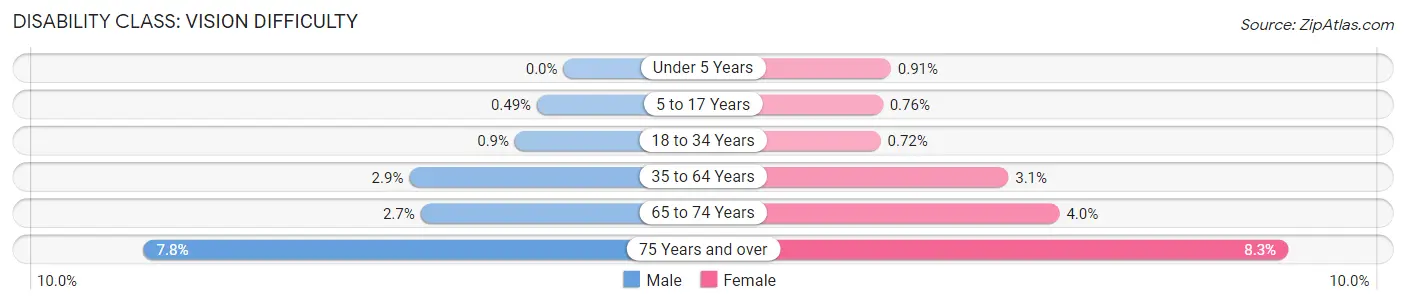
| Age Bracket | Male | Female |
| Under 5 Years | 0 (0.0%) | 81 (0.9%) |
| 5 to 17 Years | 139 (0.5%) | 203 (0.8%) |
| 18 to 34 Years | 302 (0.9%) | 245 (0.7%) |
| 35 to 64 Years | 1,933 (2.9%) | 2,237 (3.1%) |
| 65 to 74 Years | 671 (2.6%) | 1,197 (4.0%) |
| 75 Years and over | 1,677 (7.8%) | 2,095 (8.3%) |
Disability Class: Cognitive Difficulty
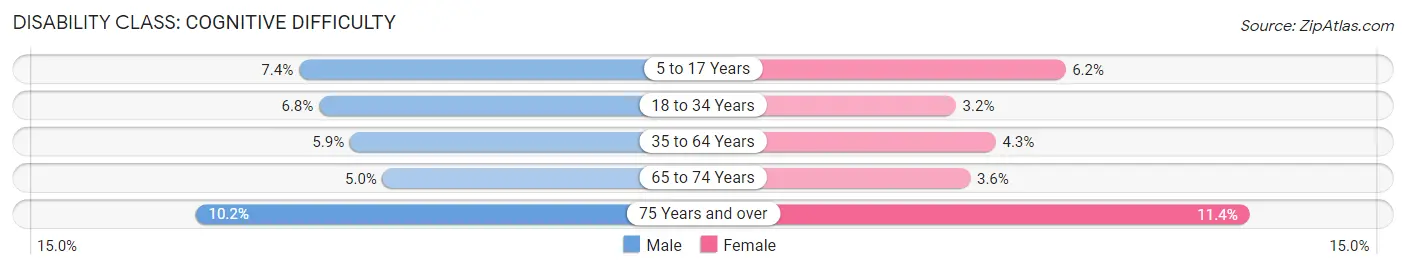
| Age Bracket | Male | Female |
| 5 to 17 Years | 2,092 (7.4%) | 1,662 (6.2%) |
| 18 to 34 Years | 2,286 (6.8%) | 1,084 (3.2%) |
| 35 to 64 Years | 4,018 (5.9%) | 3,097 (4.3%) |
| 65 to 74 Years | 1,271 (5.0%) | 1,058 (3.6%) |
| 75 Years and over | 2,204 (10.2%) | 2,873 (11.4%) |
Disability Class: Ambulatory Difficulty
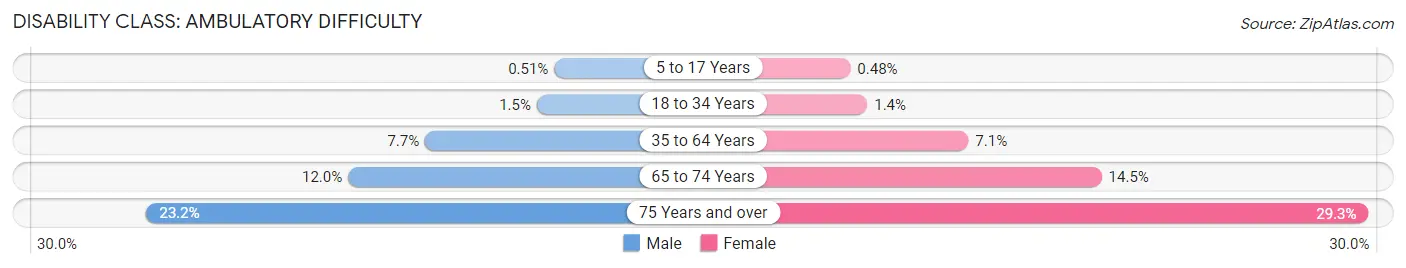
| Age Bracket | Male | Female |
| 5 to 17 Years | 144 (0.5%) | 127 (0.5%) |
| 18 to 34 Years | 499 (1.5%) | 484 (1.4%) |
| 35 to 64 Years | 5,215 (7.7%) | 5,107 (7.0%) |
| 65 to 74 Years | 3,032 (12.0%) | 4,283 (14.5%) |
| 75 Years and over | 4,996 (23.2%) | 7,419 (29.3%) |
Disability Class: Self-Care Difficulty
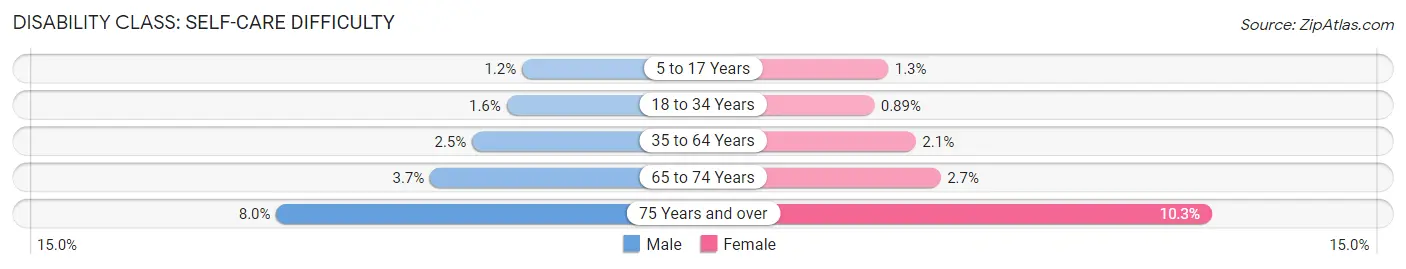
| Age Bracket | Male | Female |
| 5 to 17 Years | 327 (1.1%) | 341 (1.3%) |
| 18 to 34 Years | 532 (1.6%) | 305 (0.9%) |
| 35 to 64 Years | 1,721 (2.5%) | 1,486 (2.1%) |
| 65 to 74 Years | 937 (3.7%) | 812 (2.7%) |
| 75 Years and over | 1,719 (8.0%) | 2,606 (10.3%) |
Technology Access in Lake County
Computing Device Access in Lake County
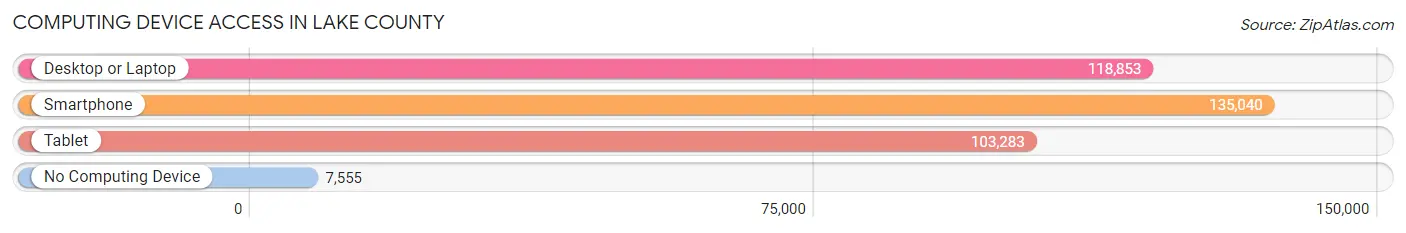
| Device Type | # Households | % Households |
| Desktop or Laptop | 118,853 | 77.3% |
| Smartphone | 135,040 | 87.8% |
| Tablet | 103,283 | 67.1% |
| No Computing Device | 7,555 | 4.9% |
| Total | 153,817 | 100.0% |
Internet Access in Lake County
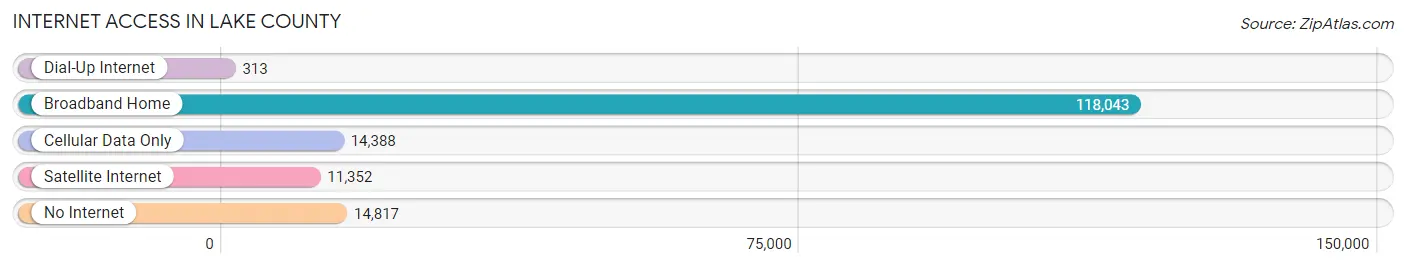
| Internet Type | # Households | % Households |
| Dial-Up Internet | 313 | 0.2% |
| Broadband Home | 118,043 | 76.7% |
| Cellular Data Only | 14,388 | 9.3% |
| Satellite Internet | 11,352 | 7.4% |
| No Internet | 14,817 | 9.6% |
| Total | 153,817 | 100.0% |
Lake County Summary
Lake County is located in the central part of the U.S. state of Florida. It is bordered by Orange County to the east, Sumter County to the south, Marion County to the west, and Volusia County to the north. The county seat is Tavares, and its largest city is Clermont. As of the 2010 census, the population was 297,052.
History
The area that is now Lake County was originally inhabited by the Timucua people. The first European settlers arrived in the area in the late 1700s, and the county was officially established in 1887. It was named for the many lakes in the area, including Lake Apopka, Lake Harris, Lake Eustis, and Lake Griffin.
The county was largely rural until the 1950s, when the population began to grow rapidly due to the influx of retirees and other migrants from the northern United States. This growth continued into the 21st century, and the population of Lake County has more than doubled since 2000.
Geography
Lake County covers an area of 1,156 square miles, making it the fifth-largest county in Florida. It is located in the central part of the state, and is bordered by Orange County to the east, Sumter County to the south, Marion County to the west, and Volusia County to the north.
The terrain of Lake County is mostly flat, with some rolling hills in the northern part of the county. The highest point in the county is Sugarloaf Mountain, which has an elevation of 312 feet. The county is home to several large lakes, including Lake Apopka, Lake Harris, Lake Eustis, and Lake Griffin.
Economy
The economy of Lake County is largely based on tourism and agriculture. The county is home to several large tourist attractions, including Walt Disney World, Universal Studios, and SeaWorld. Agriculture is also an important part of the local economy, with citrus, vegetables, and cattle being the main products.
The county is also home to several large employers, including the Florida Hospital Waterman, the Lake County School Board, and the Lake County Sheriff's Office. The county is also home to several manufacturing companies, including the John Deere plant in Groveland.
Demographics
As of the 2010 census, the population of Lake County was 297,052. The racial makeup of the county was 75.3% White, 15.2% African American, 0.5% Native American, 2.2% Asian, 0.1% Pacific Islander, 4.2% from other races, and 2.5% from two or more races. Hispanic or Latino of any race were 11.2% of the population.
The median income for a household in the county was $45,819, and the median income for a family was $51,890. The per capita income for the county was $22,845. About 11.2% of the population was below the poverty line.
Lake County is served by several public school districts, including the Lake County School District, the Sumter County School District, and the Marion County School District. The county is also home to several colleges and universities, including Lake-Sumter State College, the University of Central Florida, and Rollins College.
Common Questions
What is Per Capita Income in Lake County?
Per Capita income in Lake County is $35,150.
What is the Median Family Income in Lake County?
Median Family Income in Lake County is $80,569.
What is the Median Household income in Lake County?
Median Household Income in Lake County is $66,239.
What is Income or Wage Gap in Lake County?
Income or Wage Gap in Lake County is 25.5%.
Women in Lake County earn 74.5 cents for every dollar earned by a man.
What is Family Income Deficit in Lake County?
Family Income Deficit in Lake County is $10,162.
Families that are below poverty line in Lake County earn $10,162 less on average than the poverty threshold level.
What is Inequality or Gini Index in Lake County?
Inequality or Gini Index in Lake County is 0.43.
What is the Total Population of Lake County?
Total Population of Lake County is 386,829.
What is the Total Male Population of Lake County?
Total Male Population of Lake County is 188,572.
What is the Total Female Population of Lake County?
Total Female Population of Lake County is 198,257.
What is the Ratio of Males per 100 Females in Lake County?
There are 95.11 Males per 100 Females in Lake County.
What is the Ratio of Females per 100 Males in Lake County?
There are 105.14 Females per 100 Males in Lake County.
What is the Median Population Age in Lake County?
Median Population Age in Lake County is 46.9 Years.
What is the Average Family Size in Lake County
Average Family Size in Lake County is 3.0 People.
What is the Average Household Size in Lake County
Average Household Size in Lake County is 2.5 People.
How Large is the Labor Force in Lake County?
There are 172,943 People in the Labor Forcein in Lake County.
What is the Percentage of People in the Labor Force in Lake County?
53.7% of People are in the Labor Force in Lake County.
What is the Unemployment Rate in Lake County?
Unemployment Rate in Lake County is 5.5%.