Bay County, FL Map & Demographics
Bay County Map
Bay County Overview
$36,868
PER CAPITA INCOME
$77,037
AVG FAMILY INCOME
$65,999
AVG HOUSEHOLD INCOME
30.7%
WAGE / INCOME GAP [ % ]
69.3¢/ $1
WAGE / INCOME GAP [ $ ]
$10,716
FAMILY INCOME DEFICIT
0.44
INEQUALITY / GINI INDEX
181,055
TOTAL POPULATION
90,237
MALE POPULATION
90,818
FEMALE POPULATION
99.36
MALES / 100 FEMALES
100.64
FEMALES / 100 MALES
41.2
MEDIAN AGE
2.9
AVG FAMILY SIZE
2.4
AVG HOUSEHOLD SIZE
91,428
LABOR FORCE [ PEOPLE ]
61.9%
PERCENT IN LABOR FORCE
4.0%
UNEMPLOYMENT RATE
Bay County Area Codes
Income in Bay County
Income Overview in Bay County
Per Capita Income in Bay County is $36,868, while median incomes of families and households are $77,037 and $65,999 respectively.
| Characteristic | Number | Measure |
| Per Capita Income | 181,055 | $36,868 |
| Median Family Income | 48,754 | $77,037 |
| Mean Family Income | 48,754 | $100,394 |
| Median Household Income | 74,678 | $65,999 |
| Mean Household Income | 74,678 | $88,375 |
| Income Deficit | 48,754 | $10,716 |
| Wage / Income Gap (%) | 181,055 | 30.69% |
| Wage / Income Gap ($) | 181,055 | 69.31¢ per $1 |
| Gini / Inequality Index | 181,055 | 0.44 |
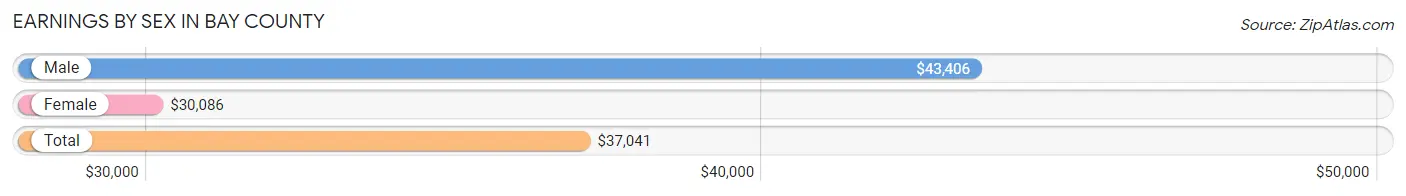
Earnings by Sex in Bay County
Average Earnings in Bay County are $37,041, $43,406 for men and $30,086 for women, a difference of 30.7%.
| Sex | Number | Average Earnings |
| Male | 51,304 (53.5%) | $43,406 |
| Female | 44,669 (46.5%) | $30,086 |
| Total | 95,973 (100.0%) | $37,041 |
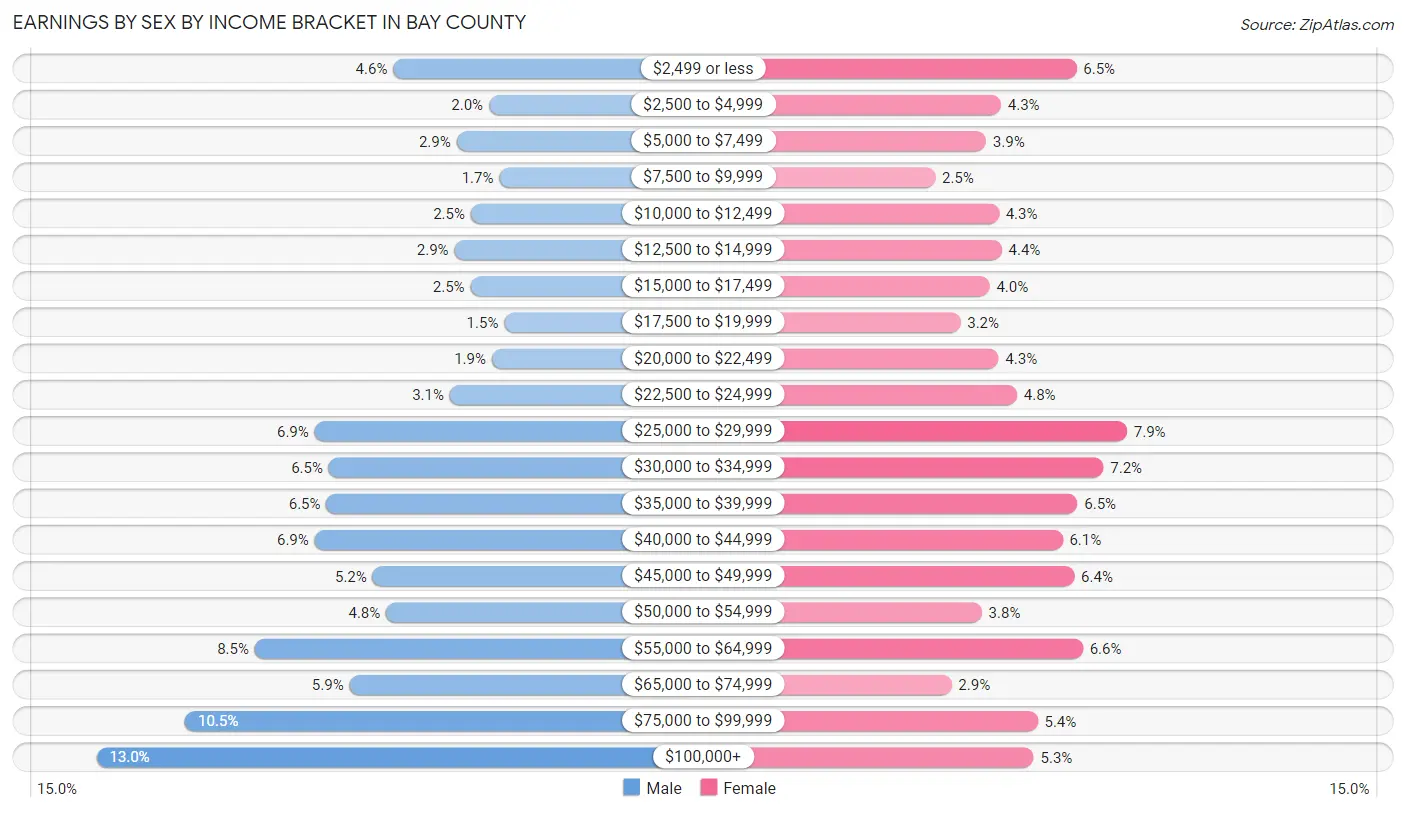
Earnings by Sex by Income Bracket in Bay County
The most common earnings brackets in Bay County are $100,000+ for men (6,659 | 13.0%) and $25,000 to $29,999 for women (3,516 | 7.9%).
| Income | Male | Female |
| $2,499 or less | 2,383 (4.6%) | 2,883 (6.5%) |
| $2,500 to $4,999 | 999 (1.9%) | 1,936 (4.3%) |
| $5,000 to $7,499 | 1,468 (2.9%) | 1,746 (3.9%) |
| $7,500 to $9,999 | 851 (1.7%) | 1,106 (2.5%) |
| $10,000 to $12,499 | 1,264 (2.5%) | 1,908 (4.3%) |
| $12,500 to $14,999 | 1,498 (2.9%) | 1,941 (4.3%) |
| $15,000 to $17,499 | 1,269 (2.5%) | 1,790 (4.0%) |
| $17,500 to $19,999 | 778 (1.5%) | 1,424 (3.2%) |
| $20,000 to $22,499 | 961 (1.9%) | 1,901 (4.3%) |
| $22,500 to $24,999 | 1,563 (3.0%) | 2,134 (4.8%) |
| $25,000 to $29,999 | 3,515 (6.9%) | 3,516 (7.9%) |
| $30,000 to $34,999 | 3,310 (6.5%) | 3,220 (7.2%) |
| $35,000 to $39,999 | 3,345 (6.5%) | 2,893 (6.5%) |
| $40,000 to $44,999 | 3,512 (6.9%) | 2,706 (6.1%) |
| $45,000 to $49,999 | 2,676 (5.2%) | 2,856 (6.4%) |
| $50,000 to $54,999 | 2,484 (4.8%) | 1,692 (3.8%) |
| $55,000 to $64,999 | 4,375 (8.5%) | 2,961 (6.6%) |
| $65,000 to $74,999 | 3,013 (5.9%) | 1,313 (2.9%) |
| $75,000 to $99,999 | 5,381 (10.5%) | 2,396 (5.4%) |
| $100,000+ | 6,659 (13.0%) | 2,347 (5.2%) |
| Total | 51,304 (100.0%) | 44,669 (100.0%) |
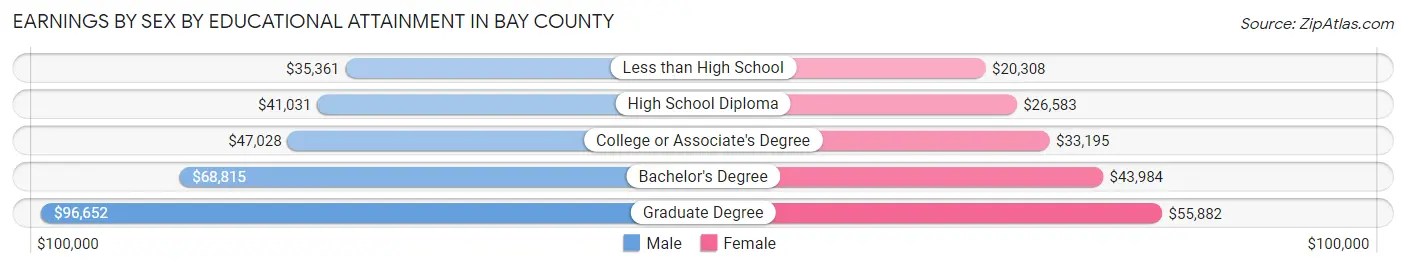
Earnings by Sex by Educational Attainment in Bay County
Average earnings in Bay County are $47,625 for men and $33,949 for women, a difference of 28.7%. Men with an educational attainment of graduate degree enjoy the highest average annual earnings of $96,652, while those with less than high school education earn the least with $35,361. Women with an educational attainment of graduate degree earn the most with the average annual earnings of $55,882, while those with less than high school education have the smallest earnings of $20,308.
| Educational Attainment | Male Income | Female Income |
| Less than High School | $35,361 | $20,308 |
| High School Diploma | $41,031 | $26,583 |
| College or Associate's Degree | $47,028 | $33,195 |
| Bachelor's Degree | $68,815 | $43,984 |
| Graduate Degree | $96,652 | $55,882 |
| Total | $47,625 | $33,949 |
Family Income in Bay County
Family Income Brackets in Bay County
According to the Bay County family income data, there are 10,287 families falling into the $50,000 to $74,999 income range, which is the most common income bracket and makes up 21.1% of all families. Conversely, the $10,000 to $14,999 income bracket is the least frequent group with only 878 families (1.8%) belonging to this category.
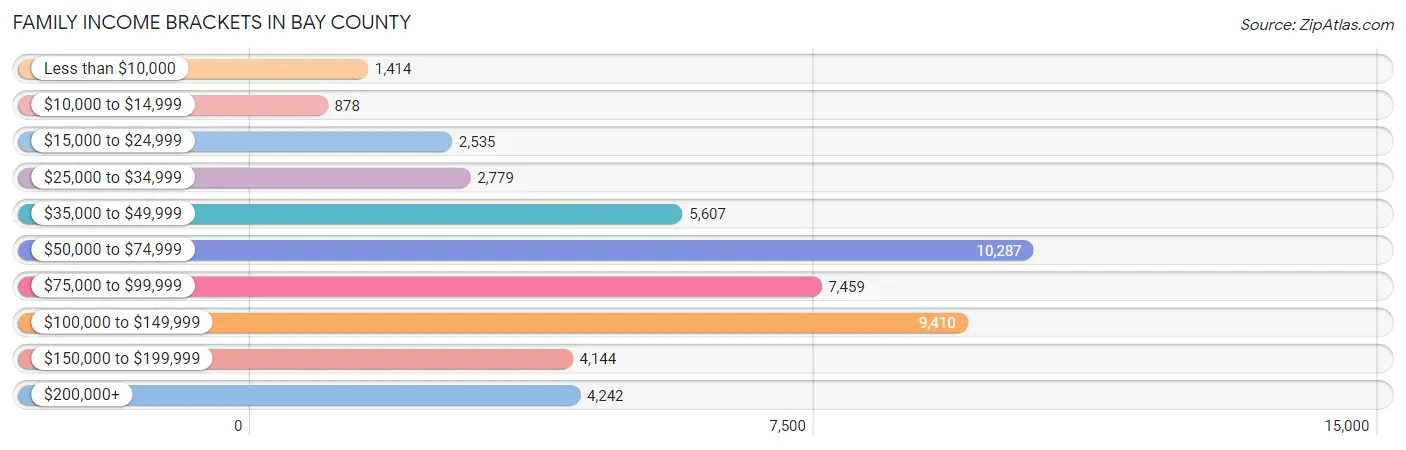
| Income Bracket | # Families | % Families |
| Less than $10,000 | 1,414 | 2.9% |
| $10,000 to $14,999 | 878 | 1.8% |
| $15,000 to $24,999 | 2,535 | 5.2% |
| $25,000 to $34,999 | 2,779 | 5.7% |
| $35,000 to $49,999 | 5,607 | 11.5% |
| $50,000 to $74,999 | 10,287 | 21.1% |
| $75,000 to $99,999 | 7,459 | 15.3% |
| $100,000 to $149,999 | 9,410 | 19.3% |
| $150,000 to $199,999 | 4,144 | 8.5% |
| $200,000+ | 4,242 | 8.7% |
Family Income by Famaliy Size in Bay County
6-person families (1,071 | 2.2%) account for the highest median family income in Bay County with $100,313 per family, while 2-person families (26,082 | 53.5%) have the highest median income of $35,396 per family member.
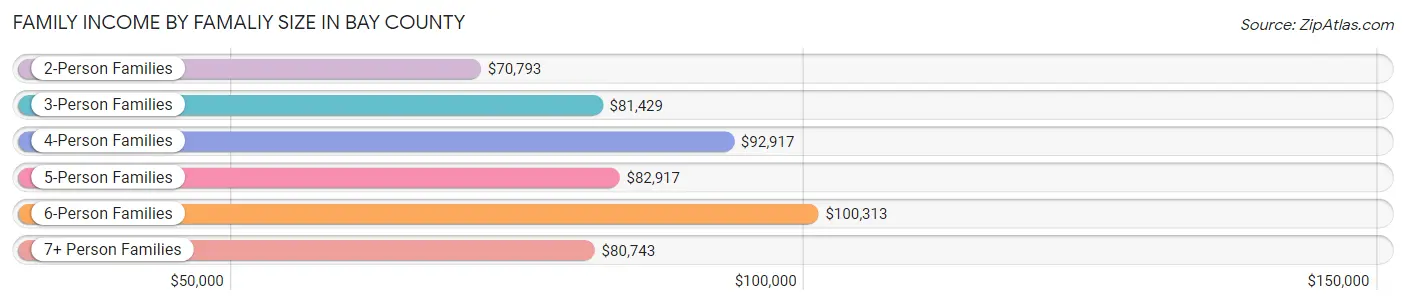
| Income Bracket | # Families | Median Income |
| 2-Person Families | 26,082 (53.5%) | $70,793 |
| 3-Person Families | 10,250 (21.0%) | $81,429 |
| 4-Person Families | 7,427 (15.2%) | $92,917 |
| 5-Person Families | 3,173 (6.5%) | $82,917 |
| 6-Person Families | 1,071 (2.2%) | $100,313 |
| 7+ Person Families | 751 (1.5%) | $80,743 |
| Total | 48,754 (100.0%) | $77,037 |
Family Income by Number of Earners in Bay County
The median family income in Bay County is $77,037, with families comprising 3+ earners (4,334) having the highest median family income of $119,167, while families with no earners (8,099) have the lowest median family income of $56,065, accounting for 8.9% and 16.6% of families, respectively.
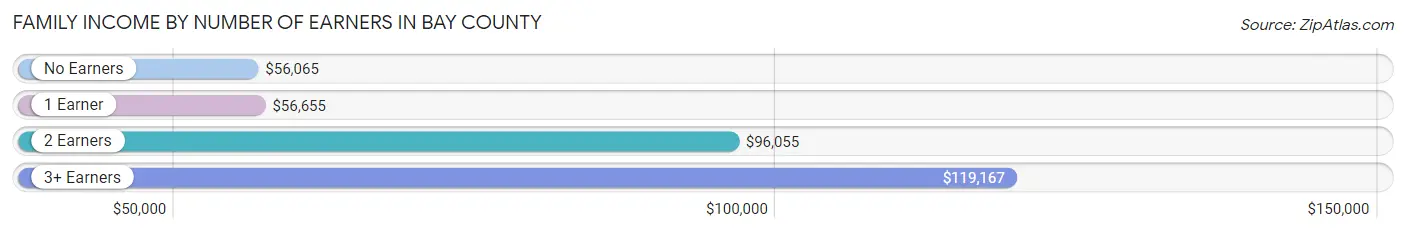
| Number of Earners | # Families | Median Income |
| No Earners | 8,099 (16.6%) | $56,065 |
| 1 Earner | 16,726 (34.3%) | $56,655 |
| 2 Earners | 19,595 (40.2%) | $96,055 |
| 3+ Earners | 4,334 (8.9%) | $119,167 |
| Total | 48,754 (100.0%) | $77,037 |
Household Income in Bay County
Household Income Brackets in Bay County
With 15,906 households falling in the category, the $50,000 to $74,999 income range is the most frequent in Bay County, accounting for 21.3% of all households. In contrast, only 2,539 households (3.4%) fall into the $10,000 to $14,999 income bracket, making it the least populous group.
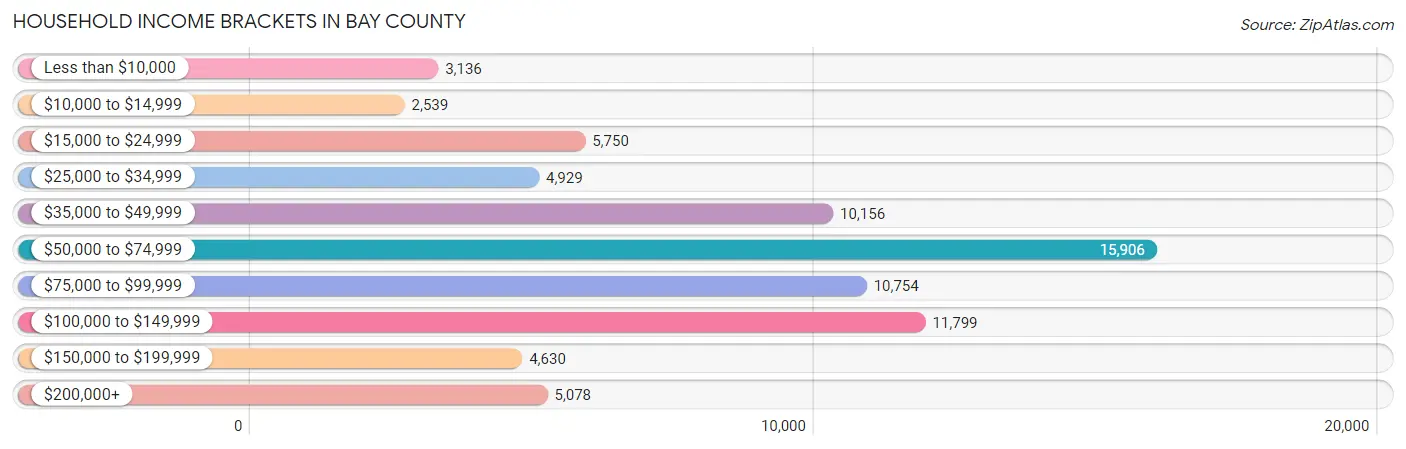
| Income Bracket | # Households | % Households |
| Less than $10,000 | 3,136 | 4.2% |
| $10,000 to $14,999 | 2,539 | 3.4% |
| $15,000 to $24,999 | 5,750 | 7.7% |
| $25,000 to $34,999 | 4,929 | 6.6% |
| $35,000 to $49,999 | 10,156 | 13.6% |
| $50,000 to $74,999 | 15,906 | 21.3% |
| $75,000 to $99,999 | 10,754 | 14.4% |
| $100,000 to $149,999 | 11,799 | 15.8% |
| $150,000 to $199,999 | 4,630 | 6.2% |
| $200,000+ | 5,078 | 6.8% |
Household Income by Householder Age in Bay County
The median household income in Bay County is $65,999, with the highest median household income of $73,904 found in the 45 to 64 years age bracket for the primary householder. A total of 29,224 households (39.1%) fall into this category. Meanwhile, the 15 to 24 years age bracket for the primary householder has the lowest median household income of $49,534, with 2,380 households (3.2%) in this group.
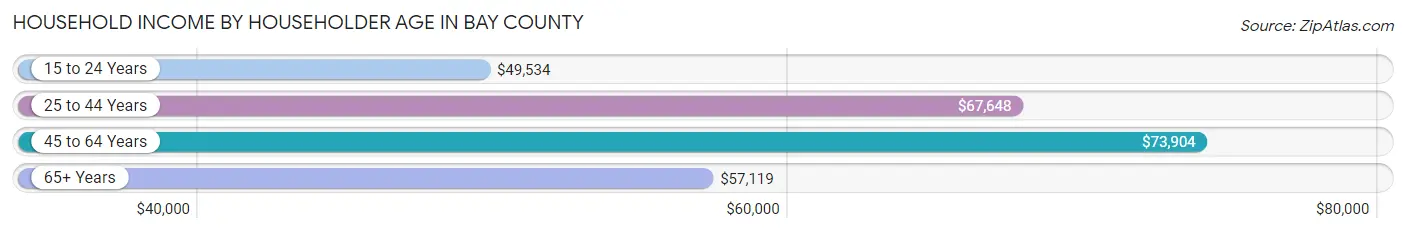
| Income Bracket | # Households | Median Income |
| 15 to 24 Years | 2,380 (3.2%) | $49,534 |
| 25 to 44 Years | 23,203 (31.1%) | $67,648 |
| 45 to 64 Years | 29,224 (39.1%) | $73,904 |
| 65+ Years | 19,871 (26.6%) | $57,119 |
| Total | 74,678 (100.0%) | $65,999 |
Poverty in Bay County
Income Below Poverty by Sex and Age in Bay County
With 10.7% poverty level for males and 13.7% for females among the residents of Bay County, 15 year old males and 18 to 24 year old females are the most vulnerable to poverty, with 310 males (31.8%) and 1,359 females (21.0%) in their respective age groups living below the poverty level.
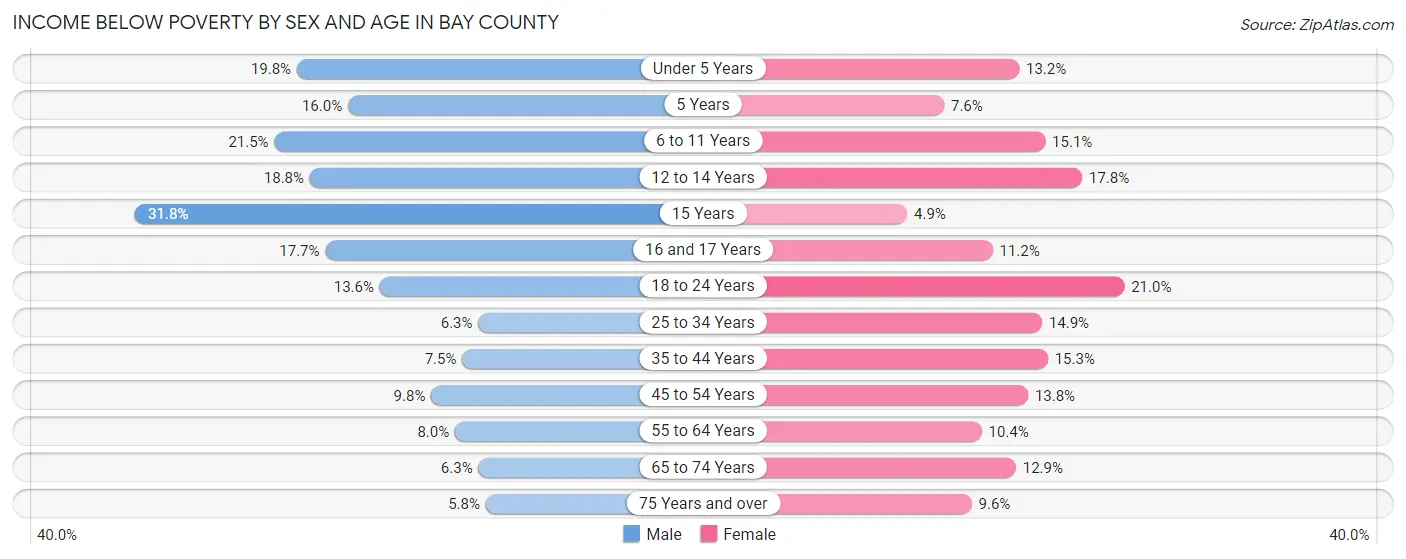
| Age Bracket | Male | Female |
| Under 5 Years | 1,011 (19.8%) | 647 (13.2%) |
| 5 Years | 118 (16.0%) | 89 (7.6%) |
| 6 to 11 Years | 1,399 (21.4%) | 900 (15.1%) |
| 12 to 14 Years | 643 (18.8%) | 580 (17.8%) |
| 15 Years | 310 (31.8%) | 50 (4.9%) |
| 16 and 17 Years | 383 (17.7%) | 243 (11.2%) |
| 18 to 24 Years | 937 (13.6%) | 1,359 (21.0%) |
| 25 to 34 Years | 780 (6.3%) | 1,723 (14.9%) |
| 35 to 44 Years | 848 (7.5%) | 1,707 (15.3%) |
| 45 to 54 Years | 1,103 (9.8%) | 1,593 (13.8%) |
| 55 to 64 Years | 1,042 (8.0%) | 1,411 (10.4%) |
| 65 to 74 Years | 587 (6.3%) | 1,316 (12.9%) |
| 75 Years and over | 314 (5.8%) | 662 (9.6%) |
| Total | 9,475 (10.7%) | 12,280 (13.7%) |
Income Above Poverty by Sex and Age in Bay County
According to the poverty statistics in Bay County, males aged 75 years and over and females aged 15 years are the age groups that are most secure financially, with 94.2% of males and 95.2% of females in these age groups living above the poverty line.
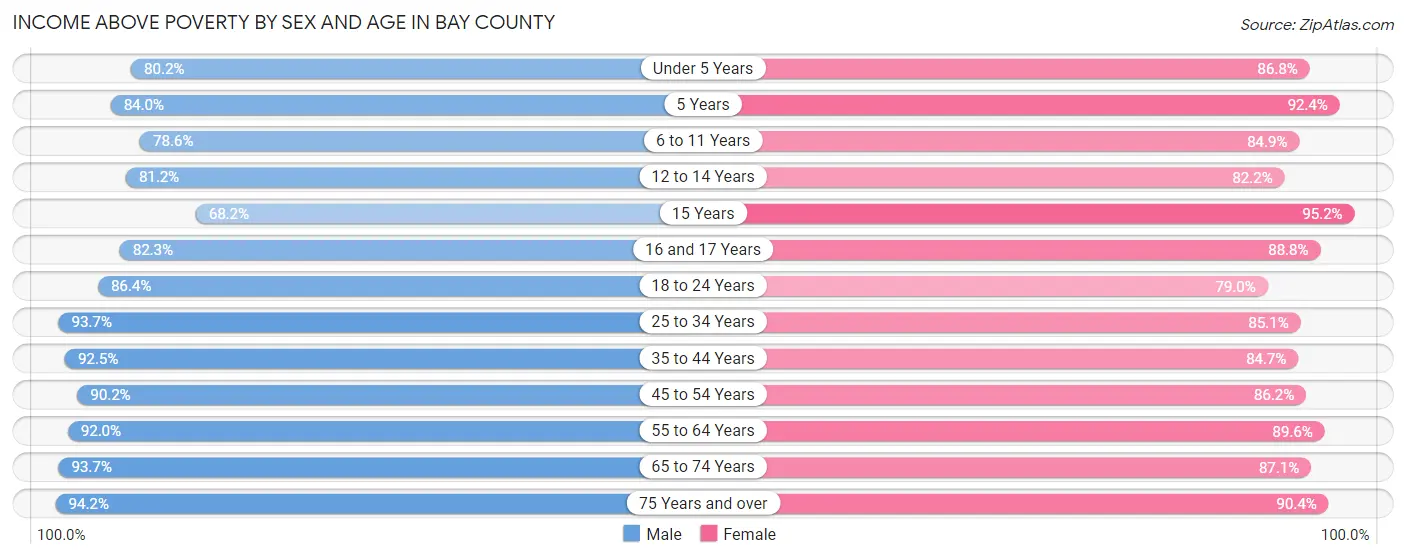
| Age Bracket | Male | Female |
| Under 5 Years | 4,100 (80.2%) | 4,269 (86.8%) |
| 5 Years | 620 (84.0%) | 1,084 (92.4%) |
| 6 to 11 Years | 5,124 (78.5%) | 5,059 (84.9%) |
| 12 to 14 Years | 2,774 (81.2%) | 2,672 (82.2%) |
| 15 Years | 665 (68.2%) | 980 (95.2%) |
| 16 and 17 Years | 1,785 (82.3%) | 1,928 (88.8%) |
| 18 to 24 Years | 5,940 (86.4%) | 5,122 (79.0%) |
| 25 to 34 Years | 11,587 (93.7%) | 9,873 (85.1%) |
| 35 to 44 Years | 10,452 (92.5%) | 9,458 (84.7%) |
| 45 to 54 Years | 10,138 (90.2%) | 9,936 (86.2%) |
| 55 to 64 Years | 11,917 (92.0%) | 12,176 (89.6%) |
| 65 to 74 Years | 8,725 (93.7%) | 8,868 (87.1%) |
| 75 Years and over | 5,133 (94.2%) | 6,208 (90.4%) |
| Total | 78,960 (89.3%) | 77,633 (86.3%) |
Income Below Poverty Among Married-Couple Families in Bay County
The poverty statistics for married-couple families in Bay County show that 4.3% or 1,527 of the total 35,360 families live below the poverty line. Families with 5 or more children have the highest poverty rate of 57.3%, comprising of 129 families. On the other hand, families with 3 or 4 children have the lowest poverty rate of 3.7%, which includes 83 families.
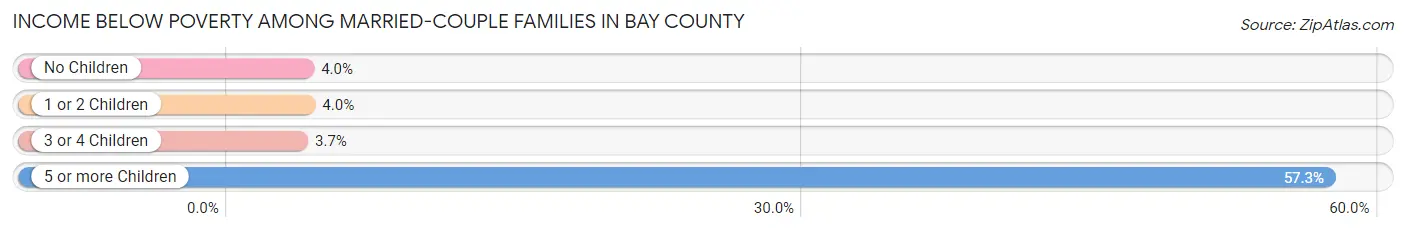
| Children | Above Poverty | Below Poverty |
| No Children | 21,359 (96.0%) | 886 (4.0%) |
| 1 or 2 Children | 10,192 (96.0%) | 429 (4.0%) |
| 3 or 4 Children | 2,186 (96.3%) | 83 (3.7%) |
| 5 or more Children | 96 (42.7%) | 129 (57.3%) |
| Total | 33,833 (95.7%) | 1,527 (4.3%) |
Income Below Poverty Among Single-Parent Households in Bay County
According to the poverty data in Bay County, 9.9% or 415 single-father households and 23.8% or 2,190 single-mother households are living below the poverty line. Among single-father households, those with 1 or 2 children have the highest poverty rate, with 321 households (16.3%) experiencing poverty. Likewise, among single-mother households, those with 5 or more children have the highest poverty rate, with 103 households (73.6%) falling below the poverty line.
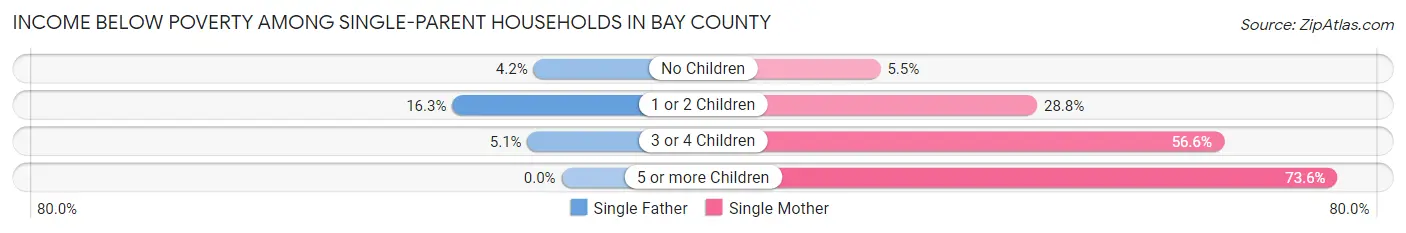
| Children | Single Father | Single Mother |
| No Children | 83 (4.2%) | 171 (5.5%) |
| 1 or 2 Children | 321 (16.3%) | 1,502 (28.8%) |
| 3 or 4 Children | 11 (5.1%) | 414 (56.6%) |
| 5 or more Children | 0 (0.0%) | 103 (73.6%) |
| Total | 415 (9.9%) | 2,190 (23.8%) |
Income Below Poverty Among Married-Couple vs Single-Parent Households in Bay County
The poverty data for Bay County shows that 1,527 of the married-couple family households (4.3%) and 2,605 of the single-parent households (19.5%) are living below the poverty level. Within the married-couple family households, those with 5 or more children have the highest poverty rate, with 129 households (57.3%) falling below the poverty line. Among the single-parent households, those with 5 or more children have the highest poverty rate, with 103 household (67.8%) living below poverty.
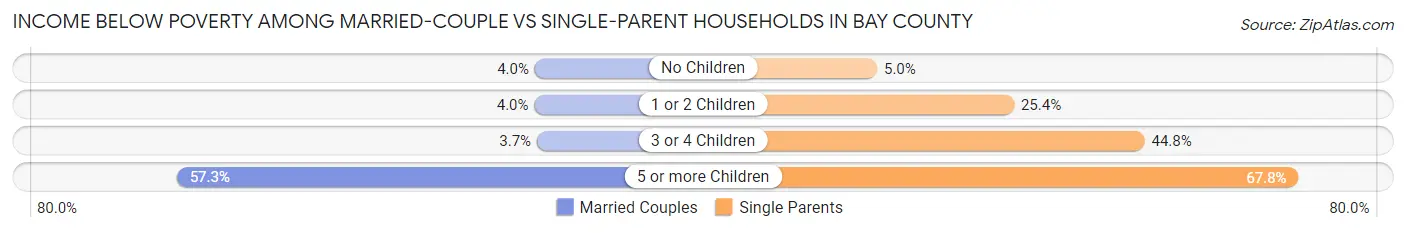
| Children | Married-Couple Families | Single-Parent Households |
| No Children | 886 (4.0%) | 254 (5.0%) |
| 1 or 2 Children | 429 (4.0%) | 1,823 (25.4%) |
| 3 or 4 Children | 83 (3.7%) | 425 (44.8%) |
| 5 or more Children | 129 (57.3%) | 103 (67.8%) |
| Total | 1,527 (4.3%) | 2,605 (19.5%) |
Race in Bay County
The most populous races in Bay County are White / Caucasian (141,183 | 78.0%), Black / African American (18,655 | 10.3%), and Hispanic or Latino (12,980 | 7.2%).
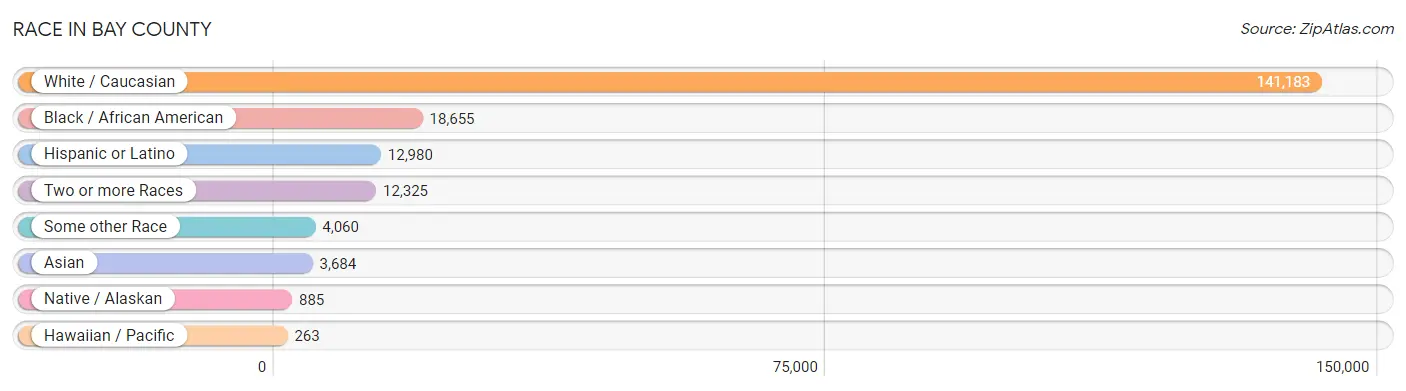
| Race | # Population | % Population |
| Asian | 3,684 | 2.0% |
| Black / African American | 18,655 | 10.3% |
| Hawaiian / Pacific | 263 | 0.2% |
| Hispanic or Latino | 12,980 | 7.2% |
| Native / Alaskan | 885 | 0.5% |
| White / Caucasian | 141,183 | 78.0% |
| Two or more Races | 12,325 | 6.8% |
| Some other Race | 4,060 | 2.2% |
| Total | 181,055 | 100.0% |
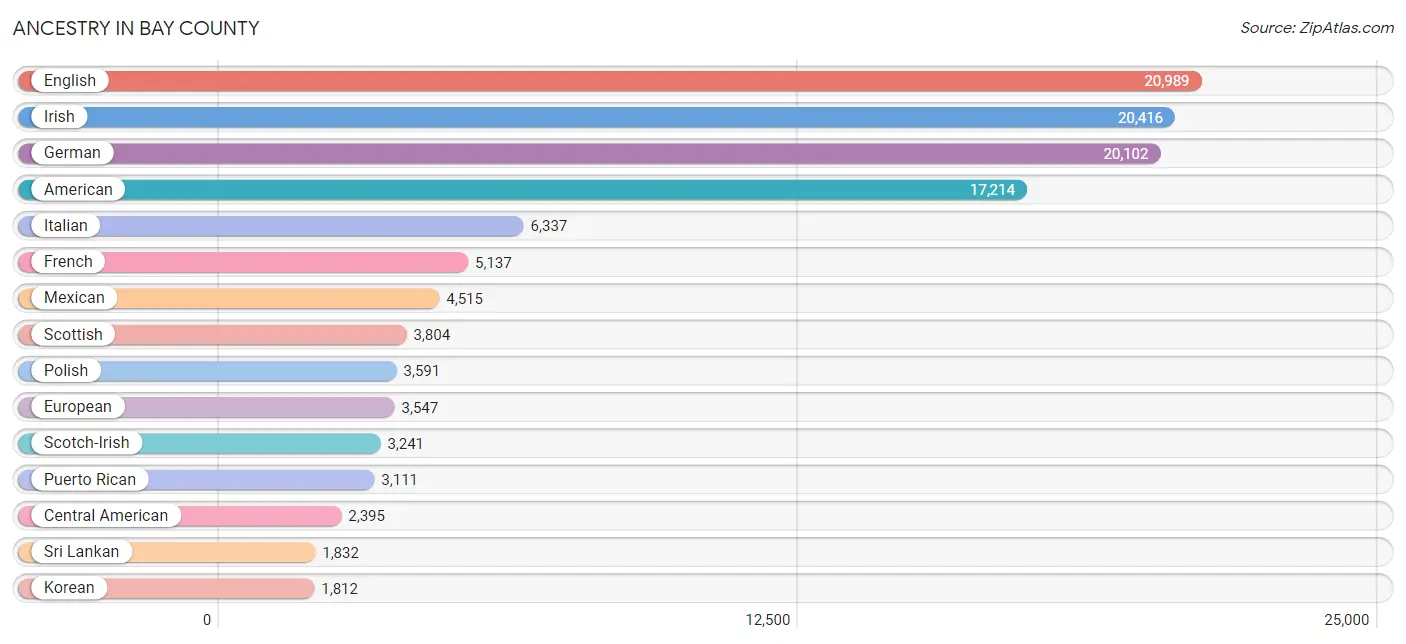
Ancestry in Bay County
The most populous ancestries reported in Bay County are English (20,989 | 11.6%), Irish (20,416 | 11.3%), German (20,102 | 11.1%), American (17,214 | 9.5%), and Italian (6,337 | 3.5%), together accounting for 47.0% of all Bay County residents.
| Ancestry | # Population | % Population |
| African | 534 | 0.3% |
| American | 17,214 | 9.5% |
| Apache | 321 | 0.2% |
| Arab | 914 | 0.5% |
| Argentinean | 225 | 0.1% |
| Armenian | 31 | 0.0% |
| Australian | 31 | 0.0% |
| Austrian | 192 | 0.1% |
| Bahamian | 21 | 0.0% |
| Bangladeshi | 51 | 0.0% |
| Barbadian | 11 | 0.0% |
| Belgian | 89 | 0.1% |
| Bhutanese | 254 | 0.1% |
| Blackfeet | 79 | 0.0% |
| Bolivian | 45 | 0.0% |
| Brazilian | 176 | 0.1% |
| British | 1,772 | 1.0% |
| British West Indian | 122 | 0.1% |
| Bulgarian | 82 | 0.1% |
| Burmese | 619 | 0.3% |
| Cajun | 23 | 0.0% |
| Cambodian | 7 | 0.0% |
| Canadian | 544 | 0.3% |
| Cape Verdean | 40 | 0.0% |
| Celtic | 52 | 0.0% |
| Central American | 2,395 | 1.3% |
| Central American Indian | 123 | 0.1% |
| Cherokee | 875 | 0.5% |
| Chickasaw | 37 | 0.0% |
| Chilean | 165 | 0.1% |
| Chippewa | 80 | 0.0% |
| Choctaw | 4 | 0.0% |
| Colombian | 310 | 0.2% |
| Costa Rican | 133 | 0.1% |
| Creek | 355 | 0.2% |
| Croatian | 63 | 0.0% |
| Cuban | 545 | 0.3% |
| Czech | 574 | 0.3% |
| Czechoslovakian | 23 | 0.0% |
| Danish | 333 | 0.2% |
| Delaware | 5 | 0.0% |
| Dominican | 199 | 0.1% |
| Dutch | 1,544 | 0.9% |
| Eastern European | 317 | 0.2% |
| Ecuadorian | 75 | 0.0% |
| Egyptian | 240 | 0.1% |
| English | 20,989 | 11.6% |
| Estonian | 18 | 0.0% |
| Ethiopian | 16 | 0.0% |
| European | 3,547 | 2.0% |
| Fijian | 22 | 0.0% |
| Filipino | 39 | 0.0% |
| Finnish | 100 | 0.1% |
| French | 5,137 | 2.8% |
| French American Indian | 3 | 0.0% |
| French Canadian | 744 | 0.4% |
| German | 20,102 | 11.1% |
| Greek | 1,097 | 0.6% |
| Guamanian / Chamorro | 144 | 0.1% |
| Guatemalan | 296 | 0.2% |
| Guyanese | 45 | 0.0% |
| Haitian | 83 | 0.1% |
| Honduran | 1,210 | 0.7% |
| Hungarian | 521 | 0.3% |
| Icelander | 25 | 0.0% |
| Indian (Asian) | 347 | 0.2% |
| Iranian | 23 | 0.0% |
| Irish | 20,416 | 11.3% |
| Iroquois | 32 | 0.0% |
| Israeli | 13 | 0.0% |
| Italian | 6,337 | 3.5% |
| Jamaican | 1,146 | 0.6% |
| Japanese | 14 | 0.0% |
| Kenyan | 21 | 0.0% |
| Korean | 1,812 | 1.0% |
| Laotian | 28 | 0.0% |
| Latvian | 100 | 0.1% |
| Lebanese | 149 | 0.1% |
| Lithuanian | 404 | 0.2% |
| Luxembourger | 71 | 0.0% |
| Mexican | 4,515 | 2.5% |
| Mexican American Indian | 373 | 0.2% |
| Moroccan | 80 | 0.0% |
| Native Hawaiian | 89 | 0.1% |
| Navajo | 68 | 0.0% |
| Nicaraguan | 194 | 0.1% |
| Nigerian | 42 | 0.0% |
| Northern European | 381 | 0.2% |
| Norwegian | 1,713 | 0.9% |
| Pakistani | 562 | 0.3% |
| Panamanian | 333 | 0.2% |
| Pennsylvania German | 90 | 0.1% |
| Peruvian | 290 | 0.2% |
| Polish | 3,591 | 2.0% |
| Portuguese | 659 | 0.4% |
| Puerto Rican | 3,111 | 1.7% |
| Romanian | 149 | 0.1% |
| Russian | 956 | 0.5% |
| Salvadoran | 229 | 0.1% |
| Samoan | 9 | 0.0% |
| Scandinavian | 563 | 0.3% |
| Scotch-Irish | 3,241 | 1.8% |
| Scottish | 3,804 | 2.1% |
| Seminole | 107 | 0.1% |
| Serbian | 9 | 0.0% |
| Sioux | 57 | 0.0% |
| Slavic | 70 | 0.0% |
| Slovak | 162 | 0.1% |
| Slovene | 5 | 0.0% |
| South American | 1,318 | 0.7% |
| Spaniard | 210 | 0.1% |
| Spanish | 276 | 0.2% |
| Spanish American | 30 | 0.0% |
| Sri Lankan | 1,832 | 1.0% |
| Subsaharan African | 661 | 0.4% |
| Swedish | 1,001 | 0.5% |
| Swiss | 345 | 0.2% |
| Syrian | 323 | 0.2% |
| Thai | 533 | 0.3% |
| Trinidadian and Tobagonian | 255 | 0.1% |
| Turkish | 128 | 0.1% |
| Ukrainian | 435 | 0.2% |
| Uruguayan | 46 | 0.0% |
| Venezuelan | 132 | 0.1% |
| Welsh | 1,116 | 0.6% |
| West Indian | 34 | 0.0% |
| Yaqui | 44 | 0.0% |
| Yugoslavian | 42 | 0.0% | View All 128 Rows |
Immigrants in Bay County
The most numerous immigrant groups reported in Bay County came from Latin America (6,343 | 3.5%), Central America (3,171 | 1.8%), Europe (2,950 | 1.6%), Asia (2,769 | 1.5%), and Caribbean (2,102 | 1.2%), together accounting for 9.6% of all Bay County residents.

| Immigration Origin | # Population | % Population |
| Africa | 697 | 0.4% |
| Argentina | 115 | 0.1% |
| Asia | 2,769 | 1.5% |
| Azores | 15 | 0.0% |
| Bangladesh | 13 | 0.0% |
| Barbados | 11 | 0.0% |
| Bolivia | 14 | 0.0% |
| Bosnia and Herzegovina | 18 | 0.0% |
| Brazil | 169 | 0.1% |
| Bulgaria | 54 | 0.0% |
| Cabo Verde | 18 | 0.0% |
| Canada | 429 | 0.2% |
| Caribbean | 2,102 | 1.2% |
| Central America | 3,171 | 1.8% |
| Chile | 178 | 0.1% |
| China | 91 | 0.1% |
| Colombia | 244 | 0.1% |
| Costa Rica | 52 | 0.0% |
| Croatia | 14 | 0.0% |
| Cuba | 380 | 0.2% |
| Czechoslovakia | 33 | 0.0% |
| Dominican Republic | 231 | 0.1% |
| Eastern Africa | 98 | 0.1% |
| Eastern Asia | 488 | 0.3% |
| Eastern Europe | 1,656 | 0.9% |
| Ecuador | 75 | 0.0% |
| Egypt | 492 | 0.3% |
| El Salvador | 87 | 0.1% |
| England | 205 | 0.1% |
| Ethiopia | 16 | 0.0% |
| Europe | 2,950 | 1.6% |
| France | 87 | 0.1% |
| Germany | 492 | 0.3% |
| Guatemala | 137 | 0.1% |
| Guyana | 66 | 0.0% |
| Haiti | 18 | 0.0% |
| Honduras | 954 | 0.5% |
| Hungary | 147 | 0.1% |
| India | 184 | 0.1% |
| Indonesia | 17 | 0.0% |
| Iran | 23 | 0.0% |
| Ireland | 36 | 0.0% |
| Israel | 48 | 0.0% |
| Italy | 80 | 0.0% |
| Jamaica | 1,205 | 0.7% |
| Japan | 64 | 0.0% |
| Jordan | 20 | 0.0% |
| Kazakhstan | 9 | 0.0% |
| Kenya | 56 | 0.0% |
| Korea | 333 | 0.2% |
| Latin America | 6,343 | 3.5% |
| Latvia | 77 | 0.0% |
| Lithuania | 19 | 0.0% |
| Mexico | 1,535 | 0.9% |
| Moldova | 118 | 0.1% |
| Morocco | 29 | 0.0% |
| Netherlands | 52 | 0.0% |
| Nicaragua | 147 | 0.1% |
| Nigeria | 60 | 0.0% |
| Northern Africa | 521 | 0.3% |
| Northern Europe | 445 | 0.3% |
| Norway | 8 | 0.0% |
| Oceania | 7 | 0.0% |
| Pakistan | 60 | 0.0% |
| Panama | 259 | 0.1% |
| Peru | 134 | 0.1% |
| Philippines | 757 | 0.4% |
| Poland | 145 | 0.1% |
| Portugal | 138 | 0.1% |
| Romania | 15 | 0.0% |
| Russia | 399 | 0.2% |
| Scotland | 51 | 0.0% |
| Singapore | 10 | 0.0% |
| South America | 1,070 | 0.6% |
| South Central Asia | 295 | 0.2% |
| South Eastern Asia | 1,771 | 1.0% |
| Southern Europe | 218 | 0.1% |
| St. Vincent and the Grenadines | 122 | 0.1% |
| Sweden | 38 | 0.0% |
| Syria | 86 | 0.1% |
| Taiwan | 22 | 0.0% |
| Thailand | 291 | 0.2% |
| Trinidad and Tobago | 76 | 0.0% |
| Turkey | 61 | 0.0% |
| Ukraine | 617 | 0.3% |
| Uzbekistan | 6 | 0.0% |
| Venezuela | 75 | 0.0% |
| Vietnam | 696 | 0.4% |
| West Indies | 15 | 0.0% |
| Western Africa | 78 | 0.0% |
| Western Asia | 215 | 0.1% |
| Western Europe | 631 | 0.4% | View All 92 Rows |
Sex and Age in Bay County
Sex and Age in Bay County
The most populous age groups in Bay County are 60 to 64 Years (7,140 | 7.9%) for men and 60 to 64 Years (6,883 | 7.6%) for women.
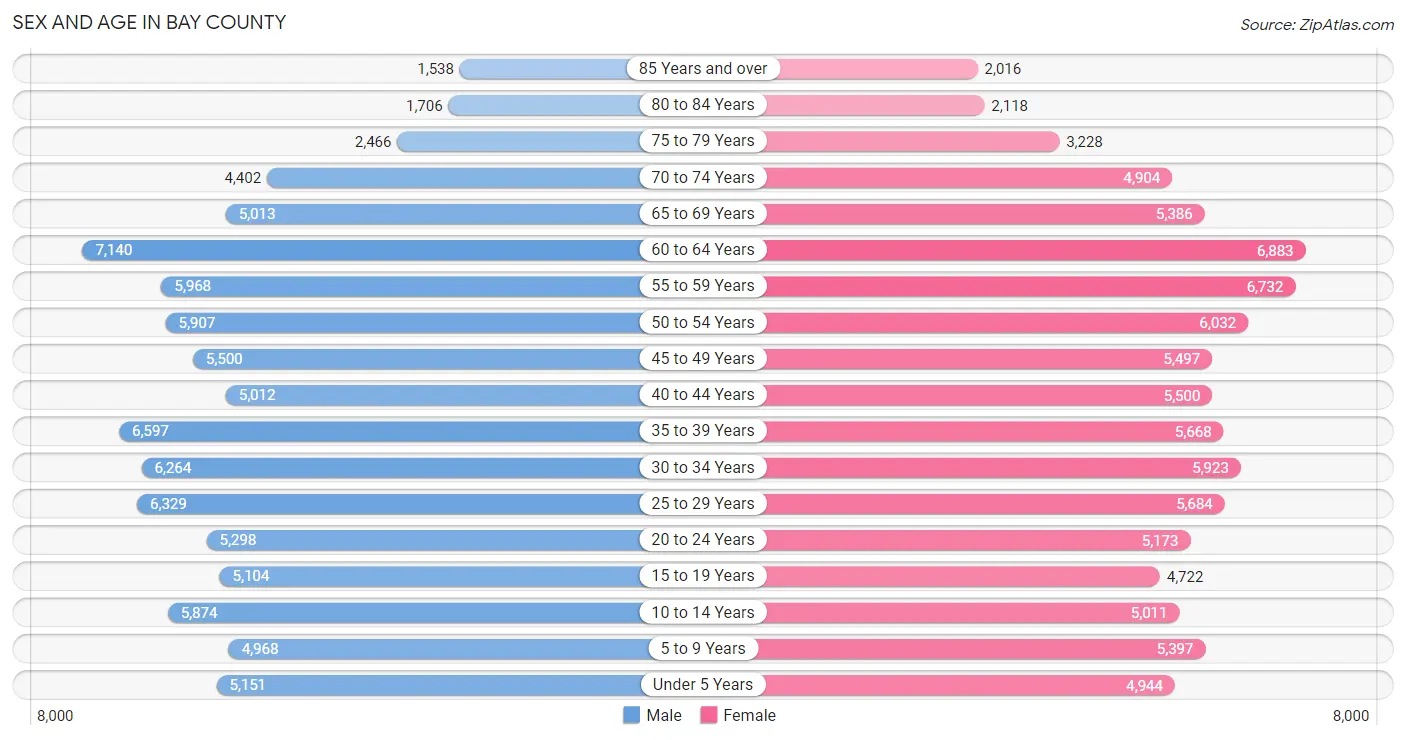
| Age Bracket | Male | Female |
| Under 5 Years | 5,151 (5.7%) | 4,944 (5.4%) |
| 5 to 9 Years | 4,968 (5.5%) | 5,397 (5.9%) |
| 10 to 14 Years | 5,874 (6.5%) | 5,011 (5.5%) |
| 15 to 19 Years | 5,104 (5.7%) | 4,722 (5.2%) |
| 20 to 24 Years | 5,298 (5.9%) | 5,173 (5.7%) |
| 25 to 29 Years | 6,329 (7.0%) | 5,684 (6.3%) |
| 30 to 34 Years | 6,264 (6.9%) | 5,923 (6.5%) |
| 35 to 39 Years | 6,597 (7.3%) | 5,668 (6.2%) |
| 40 to 44 Years | 5,012 (5.6%) | 5,500 (6.1%) |
| 45 to 49 Years | 5,500 (6.1%) | 5,497 (6.0%) |
| 50 to 54 Years | 5,907 (6.6%) | 6,032 (6.6%) |
| 55 to 59 Years | 5,968 (6.6%) | 6,732 (7.4%) |
| 60 to 64 Years | 7,140 (7.9%) | 6,883 (7.6%) |
| 65 to 69 Years | 5,013 (5.6%) | 5,386 (5.9%) |
| 70 to 74 Years | 4,402 (4.9%) | 4,904 (5.4%) |
| 75 to 79 Years | 2,466 (2.7%) | 3,228 (3.5%) |
| 80 to 84 Years | 1,706 (1.9%) | 2,118 (2.3%) |
| 85 Years and over | 1,538 (1.7%) | 2,016 (2.2%) |
| Total | 90,237 (100.0%) | 90,818 (100.0%) |
Families and Households in Bay County
Median Family Size in Bay County
The median family size in Bay County is 2.91 persons per family, with married-couple families (35,360 | 72.5%) accounting for the largest median family size of 2.95 persons per family. On the other hand, single male/father families (4,191 | 8.6%) represent the smallest median family size with 2.58 persons per family.
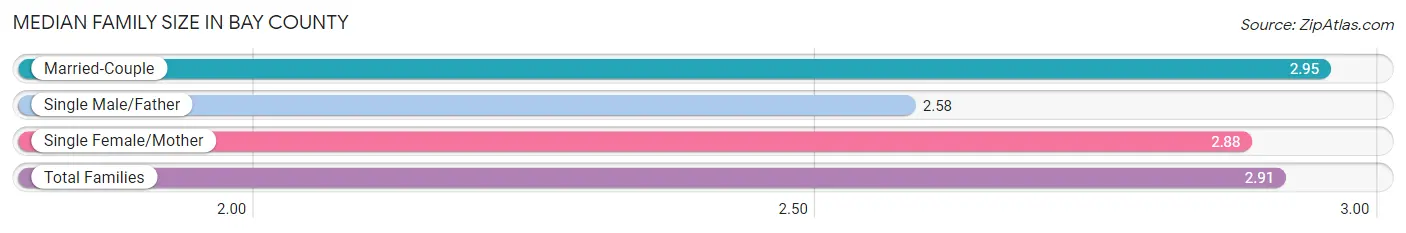
| Family Type | # Families | Family Size |
| Married-Couple | 35,360 (72.5%) | 2.95 |
| Single Male/Father | 4,191 (8.6%) | 2.58 |
| Single Female/Mother | 9,203 (18.9%) | 2.88 |
| Total Families | 48,754 (100.0%) | 2.91 |
Median Household Size in Bay County
The median household size in Bay County is 2.39 persons per household, with single female/mother households (9,203 | 12.3%) accounting for the largest median household size of 3.12 persons per household. non-family households (25,924 | 34.7%) represent the smallest median household size with 1.23 persons per household.
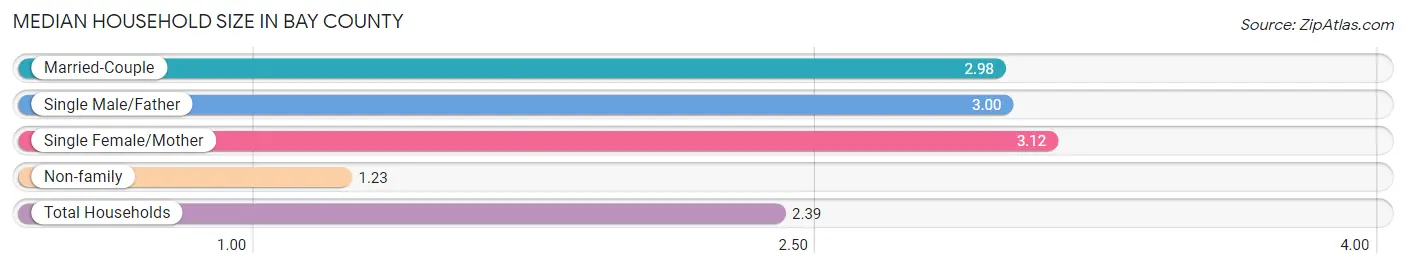
| Household Type | # Households | Household Size |
| Married-Couple | 35,360 (47.3%) | 2.98 |
| Single Male/Father | 4,191 (5.6%) | 3.00 |
| Single Female/Mother | 9,203 (12.3%) | 3.12 |
| Non-family | 25,924 (34.7%) | 1.23 |
| Total Households | 74,678 (100.0%) | 2.39 |
Household Size by Marriage Status in Bay County
Out of a total of 74,678 households in Bay County, 48,754 (65.3%) are family households, while 25,924 (34.7%) are nonfamily households. The most numerous type of family households are 2-person households, comprising 23,780, and the most common type of nonfamily households are 1-person households, comprising 20,883.
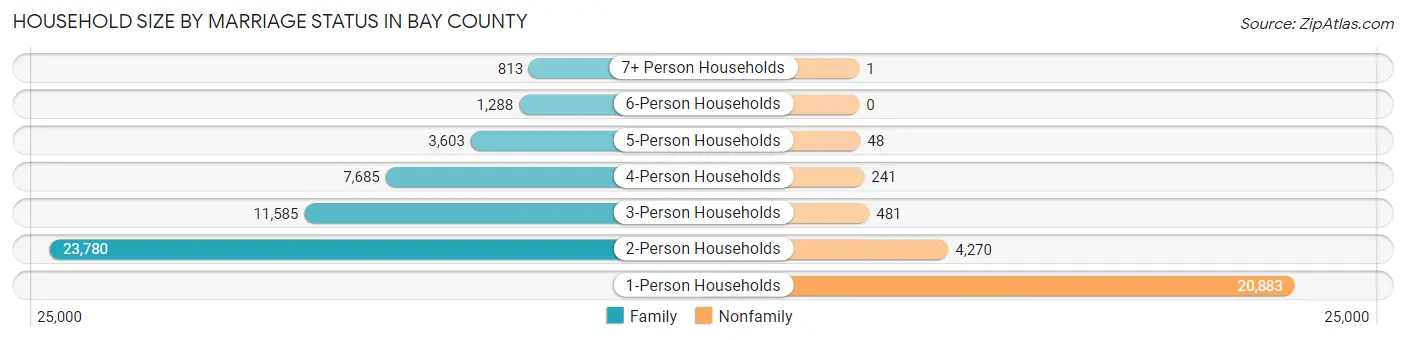
| Household Size | Family Households | Nonfamily Households |
| 1-Person Households | - | 20,883 (28.0%) |
| 2-Person Households | 23,780 (31.8%) | 4,270 (5.7%) |
| 3-Person Households | 11,585 (15.5%) | 481 (0.6%) |
| 4-Person Households | 7,685 (10.3%) | 241 (0.3%) |
| 5-Person Households | 3,603 (4.8%) | 48 (0.1%) |
| 6-Person Households | 1,288 (1.7%) | 0 (0.0%) |
| 7+ Person Households | 813 (1.1%) | 1 (0.0%) |
| Total | 48,754 (65.3%) | 25,924 (34.7%) |
Female Fertility in Bay County
Fertility by Age in Bay County
Average fertility rate in Bay County is 60.0 births per 1,000 women. Women in the age bracket of 20 to 34 years have the highest fertility rate with 112.0 births per 1,000 women. Women in the age bracket of 20 to 34 years acount for 79.0% of all women with births.
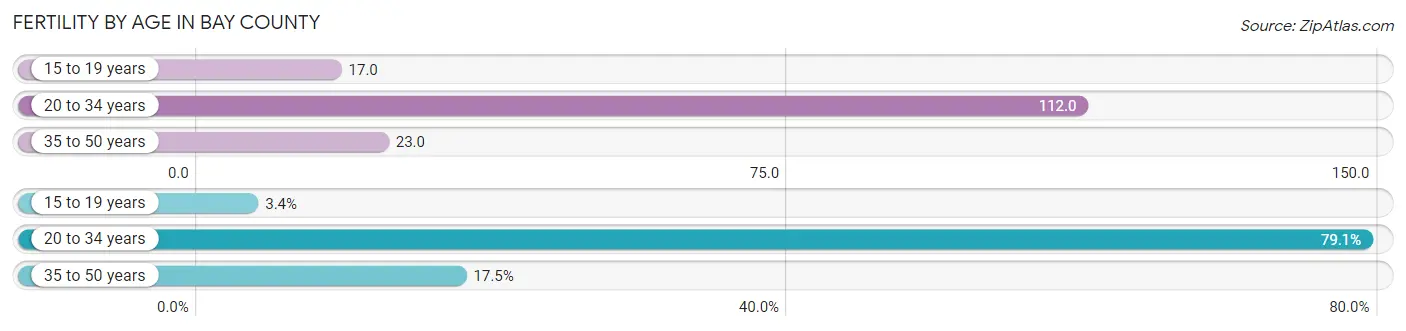
| Age Bracket | Women with Births | Births / 1,000 Women |
| 15 to 19 years | 81 (3.4%) | 17.0 |
| 20 to 34 years | 1,879 (79.0%) | 112.0 |
| 35 to 50 years | 417 (17.5%) | 23.0 |
| Total | 2,377 (100.0%) | 60.0 |
Fertility by Age by Marriage Status in Bay County
69.6% of women with births (2,377) in Bay County are married. The highest percentage of unmarried women with births falls into 15 to 19 years age bracket with 86.4% of them unmarried at the time of birth, while the lowest percentage of unmarried women with births belong to 20 to 34 years age bracket with 28.0% of them unmarried.
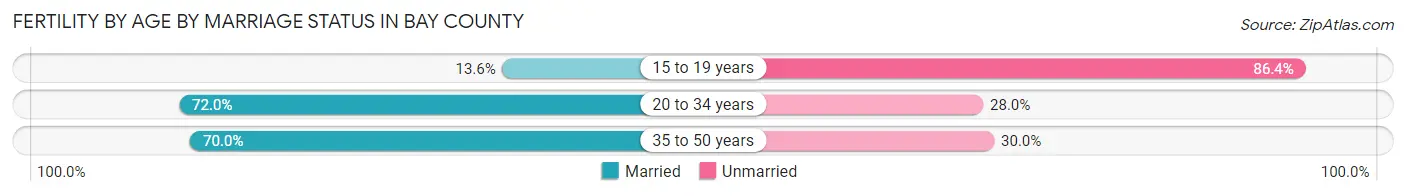
| Age Bracket | Married | Unmarried |
| 15 to 19 years | 11 (13.6%) | 70 (86.4%) |
| 20 to 34 years | 1,353 (72.0%) | 526 (28.0%) |
| 35 to 50 years | 292 (70.0%) | 125 (30.0%) |
| Total | 1,654 (69.6%) | 723 (30.4%) |
Fertility by Education in Bay County
Average fertility rate in Bay County is 60.0 births per 1,000 women. Women with the education attainment of graduate degree have the highest fertility rate of 100.0 births per 1,000 women, while women with the education attainment of college or associate's degree have the lowest fertility at 44.0 births per 1,000 women. Women with the education attainment of bachelor's degree represent 27.1% of all women with births.
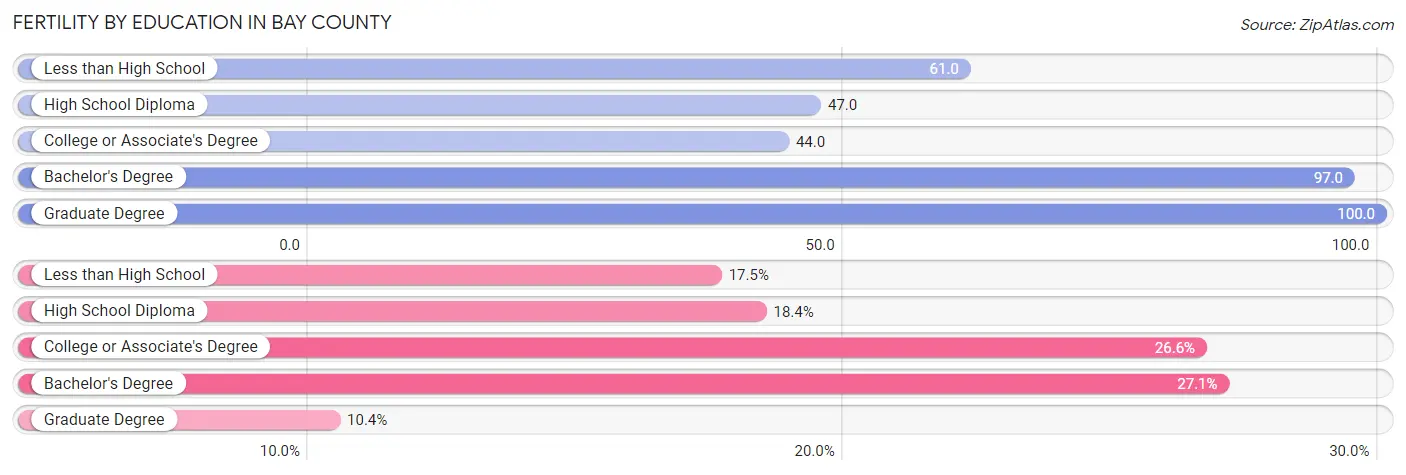
| Educational Attainment | Women with Births | Births / 1,000 Women |
| Less than High School | 417 (17.5%) | 61.0 |
| High School Diploma | 437 (18.4%) | 47.0 |
| College or Associate's Degree | 633 (26.6%) | 44.0 |
| Bachelor's Degree | 643 (27.1%) | 97.0 |
| Graduate Degree | 247 (10.4%) | 100.0 |
| Total | 2,377 (100.0%) | 60.0 |
Fertility by Education by Marriage Status in Bay County
30.4% of women with births in Bay County are unmarried. Women with the educational attainment of bachelor's degree are most likely to be married with 93.5% of them married at childbirth, while women with the educational attainment of high school diploma are least likely to be married with 59.5% of them unmarried at childbirth.
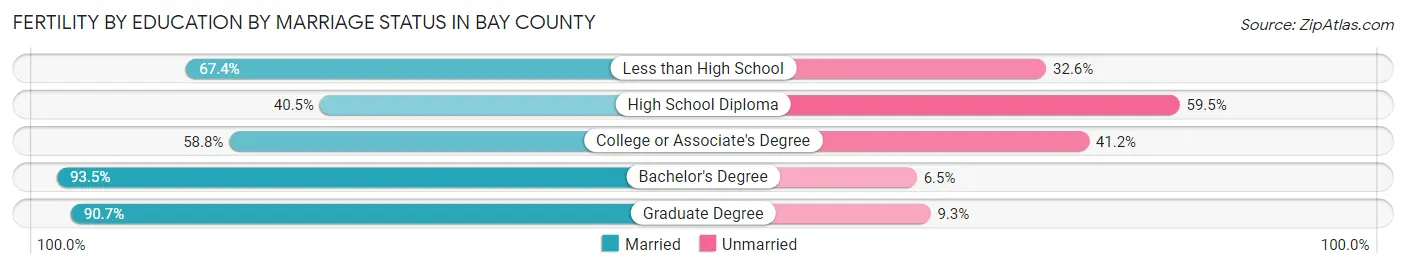
| Educational Attainment | Married | Unmarried |
| Less than High School | 281 (67.4%) | 136 (32.6%) |
| High School Diploma | 177 (40.5%) | 260 (59.5%) |
| College or Associate's Degree | 372 (58.8%) | 261 (41.2%) |
| Bachelor's Degree | 601 (93.5%) | 42 (6.5%) |
| Graduate Degree | 224 (90.7%) | 23 (9.3%) |
| Total | 1,654 (69.6%) | 723 (30.4%) |
Employment Characteristics in Bay County
Employment by Class of Employer in Bay County
Among the 85,923 employed individuals in Bay County, private company employees (52,882 | 61.6%), federal government employees (7,952 | 9.2%), and local government employees (6,988 | 8.1%) make up the most common classes of employment.
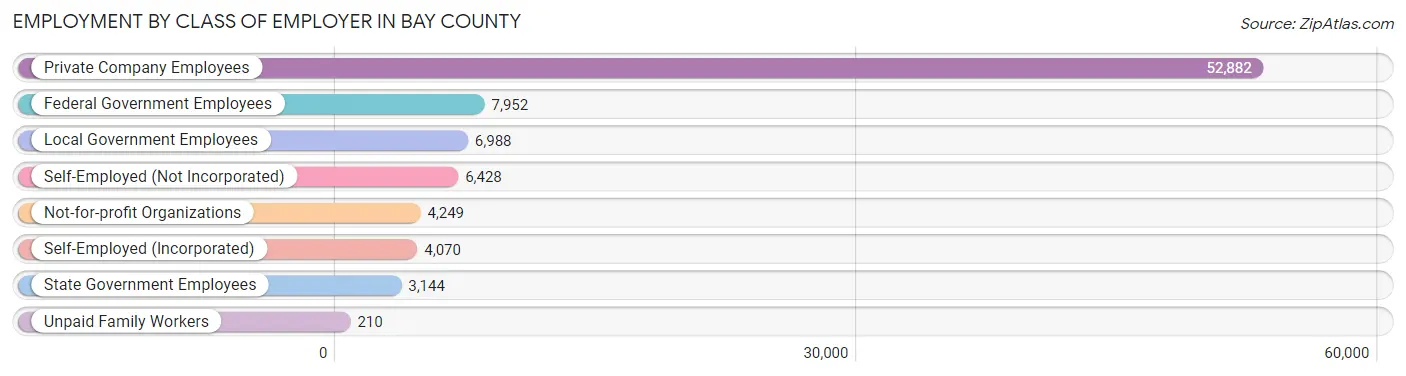
| Employer Class | # Employees | % Employees |
| Private Company Employees | 52,882 | 61.6% |
| Self-Employed (Incorporated) | 4,070 | 4.7% |
| Self-Employed (Not Incorporated) | 6,428 | 7.5% |
| Not-for-profit Organizations | 4,249 | 5.0% |
| Local Government Employees | 6,988 | 8.1% |
| State Government Employees | 3,144 | 3.7% |
| Federal Government Employees | 7,952 | 9.2% |
| Unpaid Family Workers | 210 | 0.2% |
| Total | 85,923 | 100.0% |
Employment Status by Age in Bay County
According to the labor force statistics for Bay County, out of the total population over 16 years of age (147,703), 61.9% or 91,428 individuals are in the labor force, with 4.0% or 3,657 of them unemployed. The age group with the highest labor force participation rate is 30 to 34 years, with 84.7% or 10,322 individuals in the labor force. Within the labor force, the 16 to 19 years age range has the highest percentage of unemployed individuals, with 11.1% or 367 of them being unemployed.
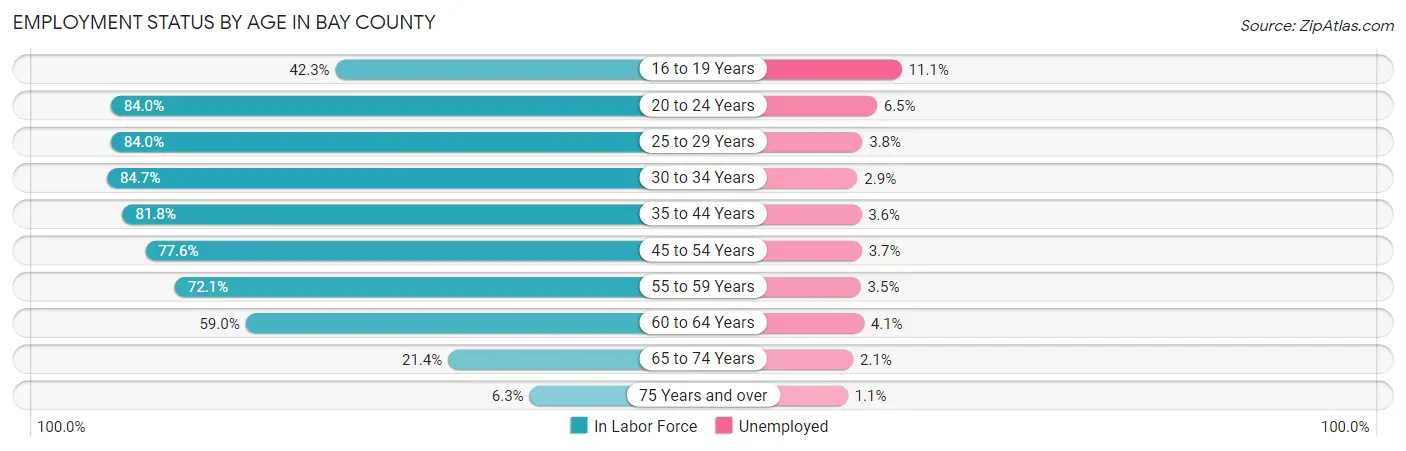
| Age Bracket | In Labor Force | Unemployed |
| 16 to 19 Years | 3,307 (42.3%) | 367 (11.1%) |
| 20 to 24 Years | 8,796 (84.0%) | 572 (6.5%) |
| 25 to 29 Years | 10,091 (84.0%) | 383 (3.8%) |
| 30 to 34 Years | 10,322 (84.7%) | 299 (2.9%) |
| 35 to 44 Years | 18,632 (81.8%) | 671 (3.6%) |
| 45 to 54 Years | 17,798 (77.6%) | 659 (3.7%) |
| 55 to 59 Years | 9,157 (72.1%) | 320 (3.5%) |
| 60 to 64 Years | 8,274 (59.0%) | 339 (4.1%) |
| 65 to 74 Years | 4,217 (21.4%) | 89 (2.1%) |
| 75 Years and over | 824 (6.3%) | 9 (1.1%) |
| Total | 91,428 (61.9%) | 3,657 (4.0%) |
Employment Status by Educational Attainment in Bay County
According to labor force statistics for Bay County, 76.9% of individuals (74,313) out of the total population between 25 and 64 years of age (96,636) are in the labor force, with 3.6% or 2,675 of them being unemployed. The group with the highest labor force participation rate are those with the educational attainment of bachelor's degree or higher, with 84.7% or 21,921 individuals in the labor force. Within the labor force, individuals with less than high school education have the highest percentage of unemployment, with 6.7% or 365 of them being unemployed.
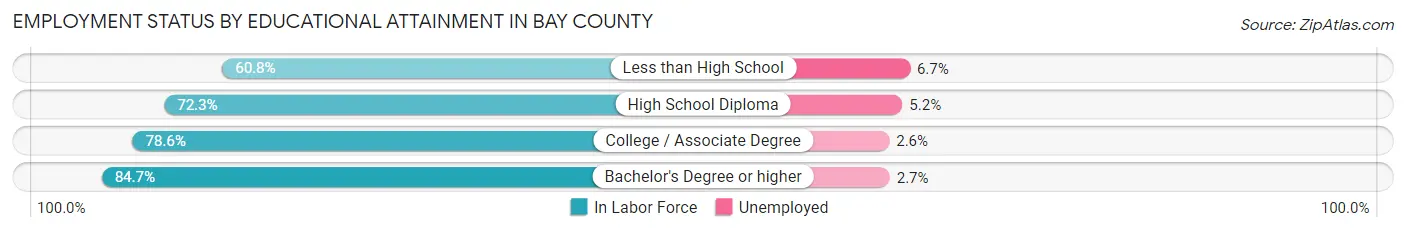
| Educational Attainment | In Labor Force | Unemployed |
| Less than High School | 5,444 (60.8%) | 600 (6.7%) |
| High School Diploma | 19,059 (72.3%) | 1,371 (5.2%) |
| College / Associate Degree | 27,856 (78.6%) | 921 (2.6%) |
| Bachelor's Degree or higher | 21,921 (84.7%) | 699 (2.7%) |
| Total | 74,313 (76.9%) | 3,479 (3.6%) |
Employment Occupations by Sex in Bay County
Management, Business, Science and Arts Occupations
The most common Management, Business, Science and Arts occupations in Bay County are Management (8,624 | 10.2%), Community & Social Service (8,377 | 9.9%), Computers, Engineering & Science (5,259 | 6.2%), Health Diagnosing & Treating (5,165 | 6.1%), and Education Instruction & Library (4,892 | 5.8%).
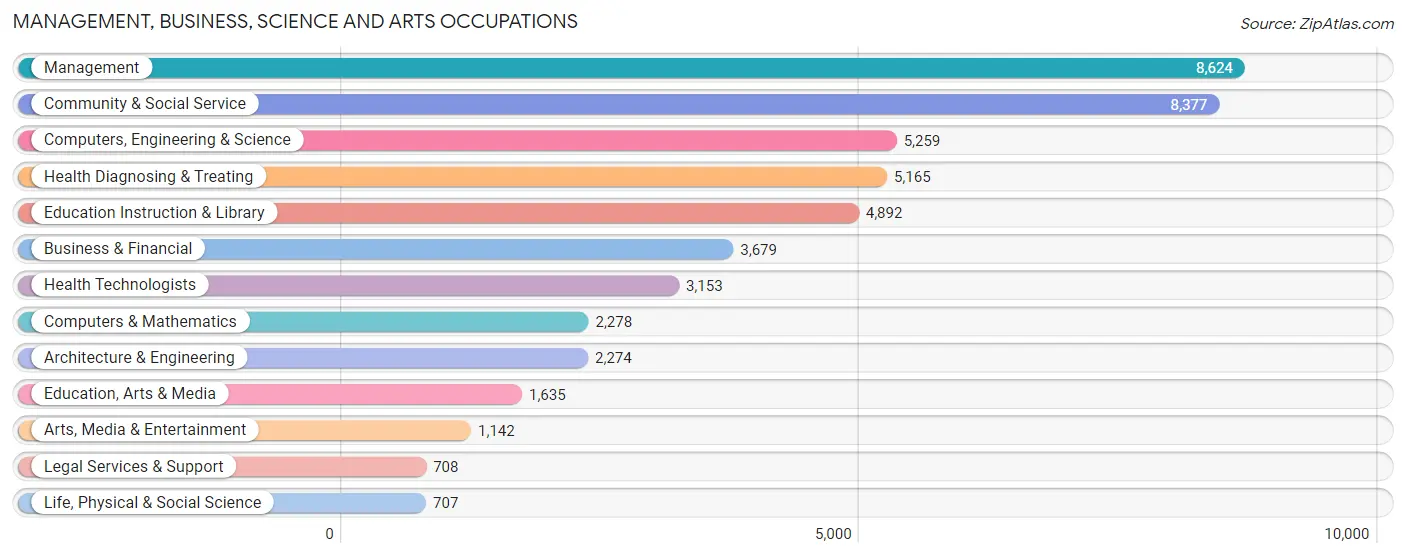
Management, Business, Science and Arts Occupations by Sex
Within the Management, Business, Science and Arts occupations in Bay County, the most male-oriented occupations are Architecture & Engineering (89.7%), Computers & Mathematics (83.4%), and Computers, Engineering & Science (79.8%), while the most female-oriented occupations are Education Instruction & Library (81.4%), Health Diagnosing & Treating (73.6%), and Community & Social Service (70.2%).
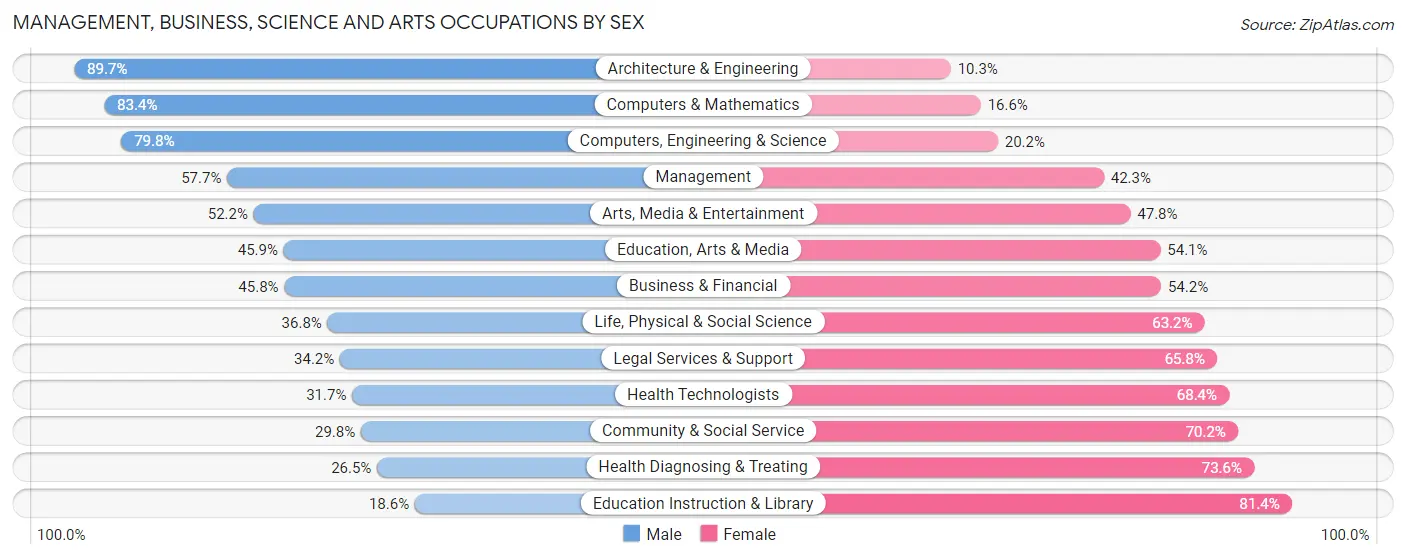
| Occupation | Male | Female |
| Management | 4,979 (57.7%) | 3,645 (42.3%) |
| Business & Financial | 1,685 (45.8%) | 1,994 (54.2%) |
| Computers, Engineering & Science | 4,199 (79.8%) | 1,060 (20.2%) |
| Computers & Mathematics | 1,900 (83.4%) | 378 (16.6%) |
| Architecture & Engineering | 2,039 (89.7%) | 235 (10.3%) |
| Life, Physical & Social Science | 260 (36.8%) | 447 (63.2%) |
| Community & Social Service | 2,497 (29.8%) | 5,880 (70.2%) |
| Education, Arts & Media | 751 (45.9%) | 884 (54.1%) |
| Legal Services & Support | 242 (34.2%) | 466 (65.8%) |
| Education Instruction & Library | 908 (18.6%) | 3,984 (81.4%) |
| Arts, Media & Entertainment | 596 (52.2%) | 546 (47.8%) |
| Health Diagnosing & Treating | 1,366 (26.5%) | 3,799 (73.6%) |
| Health Technologists | 998 (31.7%) | 2,155 (68.3%) |
| Total (Category) | 14,726 (47.3%) | 16,378 (52.7%) |
| Total (Overall) | 44,734 (52.7%) | 40,165 (47.3%) |
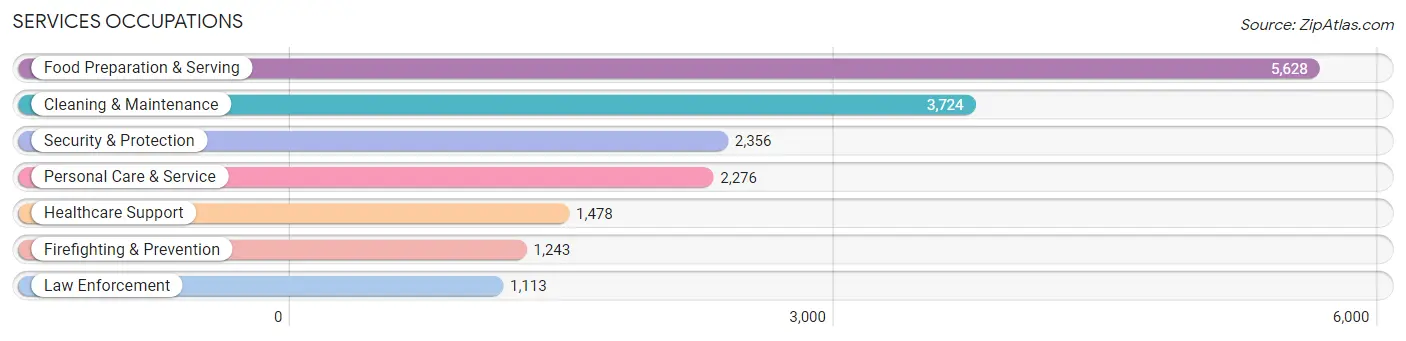
Services Occupations
The most common Services occupations in Bay County are Food Preparation & Serving (5,628 | 6.6%), Cleaning & Maintenance (3,724 | 4.4%), Security & Protection (2,356 | 2.8%), Personal Care & Service (2,276 | 2.7%), and Healthcare Support (1,478 | 1.7%).
Services Occupations by Sex
Within the Services occupations in Bay County, the most male-oriented occupations are Firefighting & Prevention (85.3%), Security & Protection (78.0%), and Law Enforcement (69.8%), while the most female-oriented occupations are Healthcare Support (87.1%), Personal Care & Service (82.2%), and Food Preparation & Serving (56.7%).
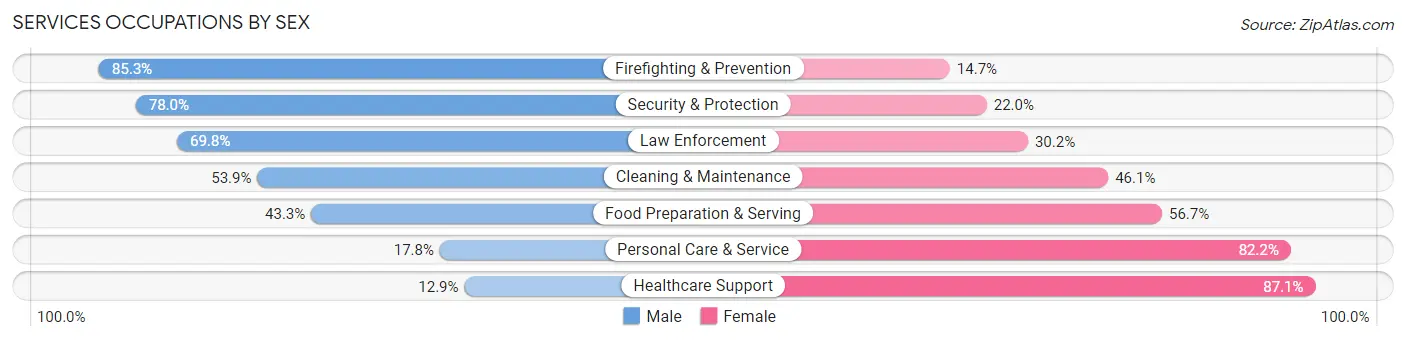
| Occupation | Male | Female |
| Healthcare Support | 191 (12.9%) | 1,287 (87.1%) |
| Security & Protection | 1,837 (78.0%) | 519 (22.0%) |
| Firefighting & Prevention | 1,060 (85.3%) | 183 (14.7%) |
| Law Enforcement | 777 (69.8%) | 336 (30.2%) |
| Food Preparation & Serving | 2,435 (43.3%) | 3,193 (56.7%) |
| Cleaning & Maintenance | 2,008 (53.9%) | 1,716 (46.1%) |
| Personal Care & Service | 405 (17.8%) | 1,871 (82.2%) |
| Total (Category) | 6,876 (44.5%) | 8,586 (55.5%) |
| Total (Overall) | 44,734 (52.7%) | 40,165 (47.3%) |
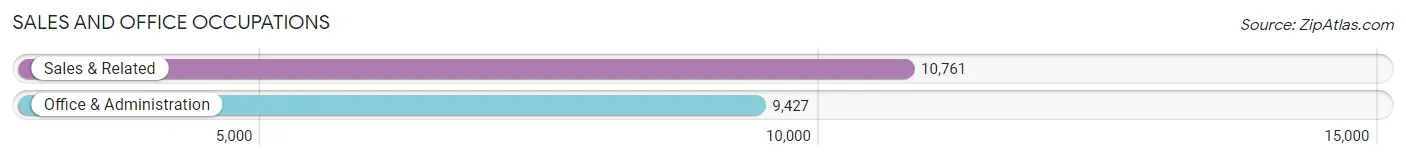
Sales and Office Occupations
The most common Sales and Office occupations in Bay County are Sales & Related (10,761 | 12.7%), and Office & Administration (9,427 | 11.1%).
Sales and Office Occupations by Sex
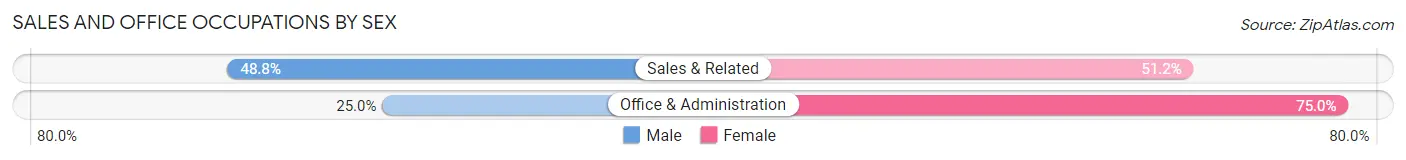
| Occupation | Male | Female |
| Sales & Related | 5,248 (48.8%) | 5,513 (51.2%) |
| Office & Administration | 2,354 (25.0%) | 7,073 (75.0%) |
| Total (Category) | 7,602 (37.7%) | 12,586 (62.3%) |
| Total (Overall) | 44,734 (52.7%) | 40,165 (47.3%) |
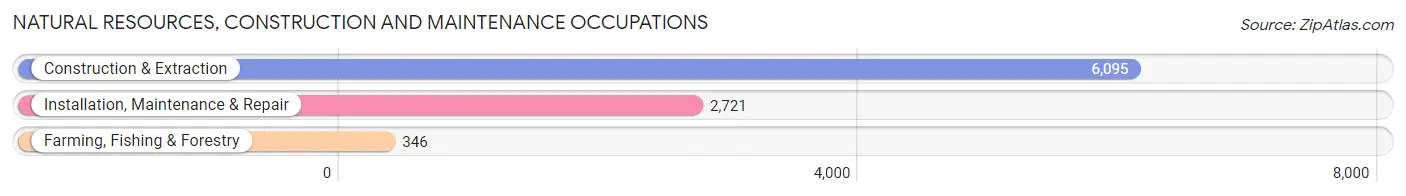
Natural Resources, Construction and Maintenance Occupations
The most common Natural Resources, Construction and Maintenance occupations in Bay County are Construction & Extraction (6,095 | 7.2%), Installation, Maintenance & Repair (2,721 | 3.2%), and Farming, Fishing & Forestry (346 | 0.4%).
Natural Resources, Construction and Maintenance Occupations by Sex
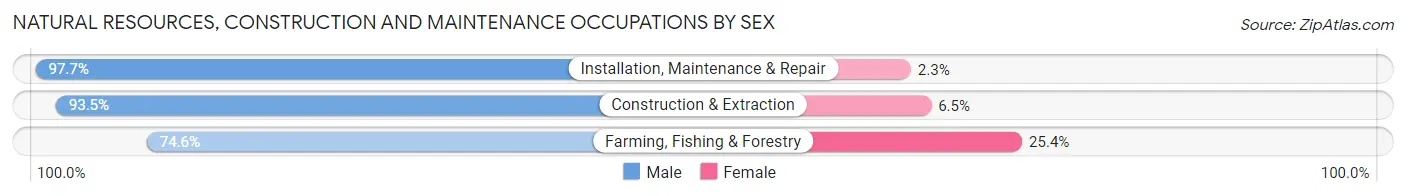
| Occupation | Male | Female |
| Farming, Fishing & Forestry | 258 (74.6%) | 88 (25.4%) |
| Construction & Extraction | 5,698 (93.5%) | 397 (6.5%) |
| Installation, Maintenance & Repair | 2,659 (97.7%) | 62 (2.3%) |
| Total (Category) | 8,615 (94.0%) | 547 (6.0%) |
| Total (Overall) | 44,734 (52.7%) | 40,165 (47.3%) |
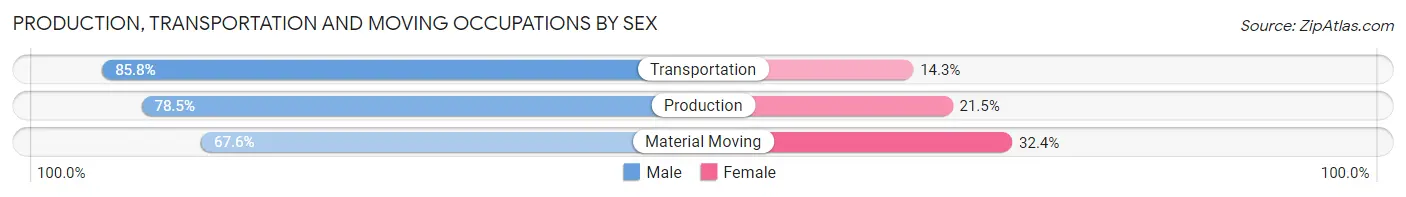
Production, Transportation and Moving Occupations
The most common Production, Transportation and Moving occupations in Bay County are Production (3,359 | 4.0%), Material Moving (3,006 | 3.5%), and Transportation (2,618 | 3.1%).
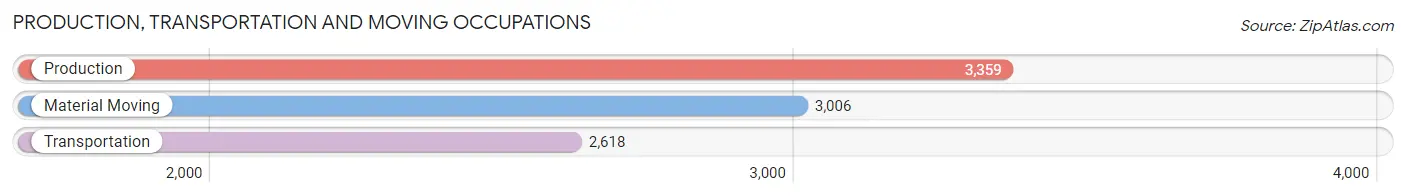
Production, Transportation and Moving Occupations by Sex
| Occupation | Male | Female |
| Production | 2,638 (78.5%) | 721 (21.5%) |
| Transportation | 2,245 (85.8%) | 373 (14.2%) |
| Material Moving | 2,032 (67.6%) | 974 (32.4%) |
| Total (Category) | 6,915 (77.0%) | 2,068 (23.0%) |
| Total (Overall) | 44,734 (52.7%) | 40,165 (47.3%) |
Employment Industries by Sex in Bay County
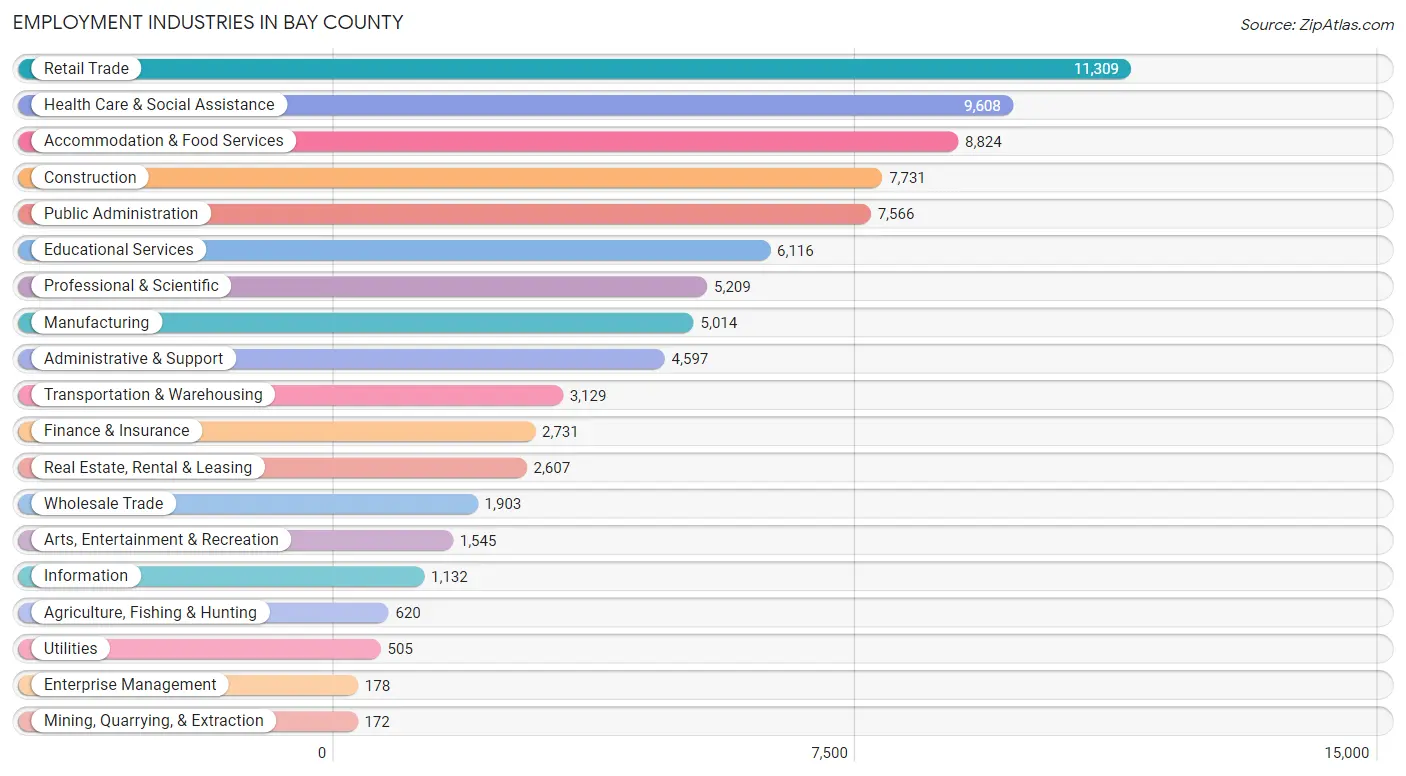
Employment Industries in Bay County
The major employment industries in Bay County include Retail Trade (11,309 | 13.3%), Health Care & Social Assistance (9,608 | 11.3%), Accommodation & Food Services (8,824 | 10.4%), Construction (7,731 | 9.1%), and Public Administration (7,566 | 8.9%).
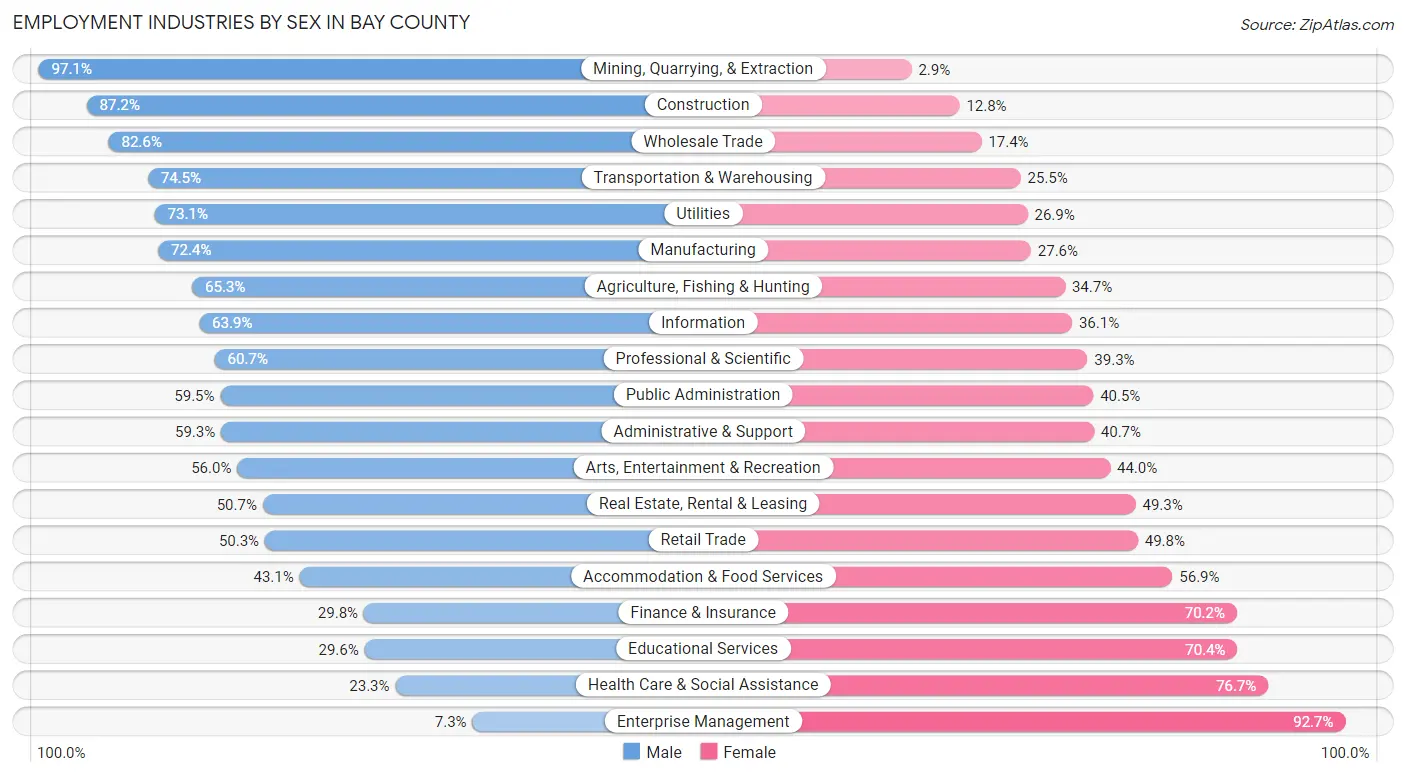
Employment Industries by Sex in Bay County
The Bay County industries that see more men than women are Mining, Quarrying, & Extraction (97.1%), Construction (87.2%), and Wholesale Trade (82.6%), whereas the industries that tend to have a higher number of women are Enterprise Management (92.7%), Health Care & Social Assistance (76.7%), and Educational Services (70.4%).
| Industry | Male | Female |
| Agriculture, Fishing & Hunting | 405 (65.3%) | 215 (34.7%) |
| Mining, Quarrying, & Extraction | 167 (97.1%) | 5 (2.9%) |
| Construction | 6,738 (87.2%) | 993 (12.8%) |
| Manufacturing | 3,629 (72.4%) | 1,385 (27.6%) |
| Wholesale Trade | 1,572 (82.6%) | 331 (17.4%) |
| Retail Trade | 5,683 (50.2%) | 5,626 (49.7%) |
| Transportation & Warehousing | 2,331 (74.5%) | 798 (25.5%) |
| Utilities | 369 (73.1%) | 136 (26.9%) |
| Information | 723 (63.9%) | 409 (36.1%) |
| Finance & Insurance | 813 (29.8%) | 1,918 (70.2%) |
| Real Estate, Rental & Leasing | 1,322 (50.7%) | 1,285 (49.3%) |
| Professional & Scientific | 3,161 (60.7%) | 2,048 (39.3%) |
| Enterprise Management | 13 (7.3%) | 165 (92.7%) |
| Administrative & Support | 2,728 (59.3%) | 1,869 (40.7%) |
| Educational Services | 1,813 (29.6%) | 4,303 (70.4%) |
| Health Care & Social Assistance | 2,235 (23.3%) | 7,373 (76.7%) |
| Arts, Entertainment & Recreation | 865 (56.0%) | 680 (44.0%) |
| Accommodation & Food Services | 3,802 (43.1%) | 5,022 (56.9%) |
| Public Administration | 4,500 (59.5%) | 3,066 (40.5%) |
| Total | 44,734 (52.7%) | 40,165 (47.3%) |
Education in Bay County
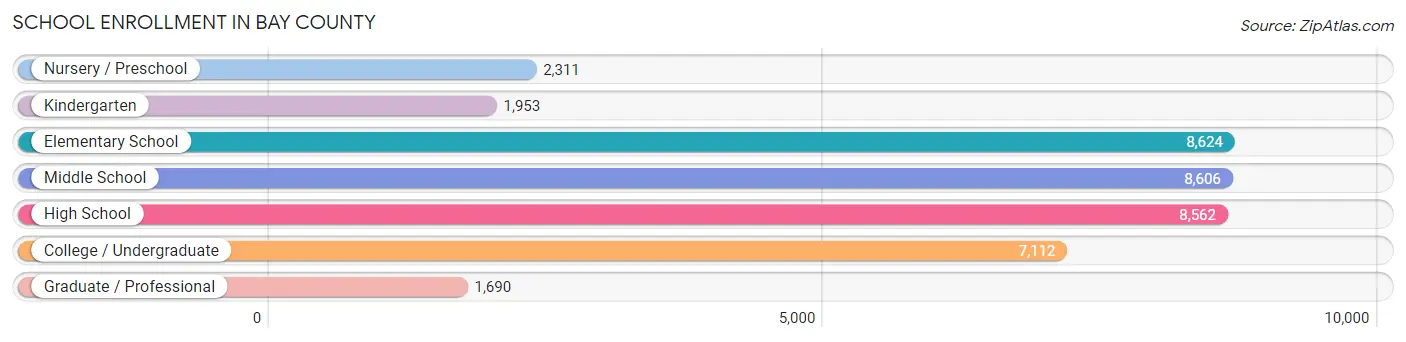
School Enrollment in Bay County
The most common levels of schooling among the 38,858 students in Bay County are elementary school (8,624 | 22.2%), middle school (8,606 | 22.2%), and high school (8,562 | 22.0%).
| School Level | # Students | % Students |
| Nursery / Preschool | 2,311 | 5.9% |
| Kindergarten | 1,953 | 5.0% |
| Elementary School | 8,624 | 22.2% |
| Middle School | 8,606 | 22.2% |
| High School | 8,562 | 22.0% |
| College / Undergraduate | 7,112 | 18.3% |
| Graduate / Professional | 1,690 | 4.3% |
| Total | 38,858 | 100.0% |
School Enrollment by Age by Funding Source in Bay County
Out of a total of 38,858 students who are enrolled in schools in Bay County, 6,450 (16.6%) attend a private institution, while the remaining 32,408 (83.4%) are enrolled in public schools. The age group of 3 to 4 year olds has the highest likelihood of being enrolled in private schools, with 912 (53.0% in the age bracket) enrolled. Conversely, the age group of 20 to 24 year olds has the lowest likelihood of being enrolled in a private school, with 2,345 (90.3% in the age bracket) attending a public institution.
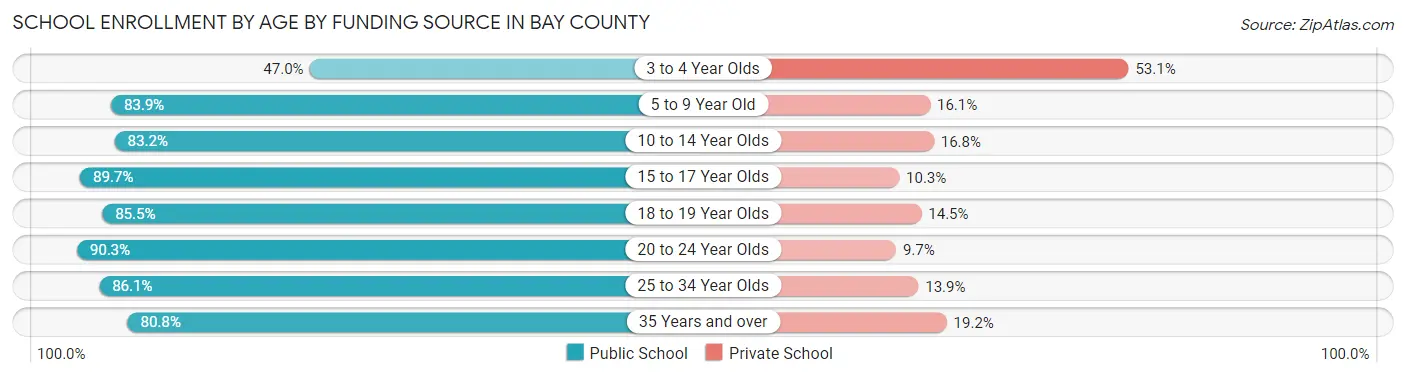
| Age Bracket | Public School | Private School |
| 3 to 4 Year Olds | 807 (46.9%) | 912 (53.0%) |
| 5 to 9 Year Old | 8,201 (83.9%) | 1,572 (16.1%) |
| 10 to 14 Year Olds | 8,940 (83.2%) | 1,803 (16.8%) |
| 15 to 17 Year Olds | 5,504 (89.7%) | 634 (10.3%) |
| 18 to 19 Year Olds | 2,093 (85.5%) | 354 (14.5%) |
| 20 to 24 Year Olds | 2,345 (90.3%) | 253 (9.7%) |
| 25 to 34 Year Olds | 2,094 (86.1%) | 338 (13.9%) |
| 35 Years and over | 2,431 (80.8%) | 577 (19.2%) |
| Total | 32,408 (83.4%) | 6,450 (16.6%) |
Educational Attainment by Field of Study in Bay County
Business (7,568 | 21.0%), education (5,408 | 15.0%), engineering (3,344 | 9.3%), science & technology (3,308 | 9.2%), and arts & humanities (2,792 | 7.7%) are the most common fields of study among 36,114 individuals in Bay County who have obtained a bachelor's degree or higher.
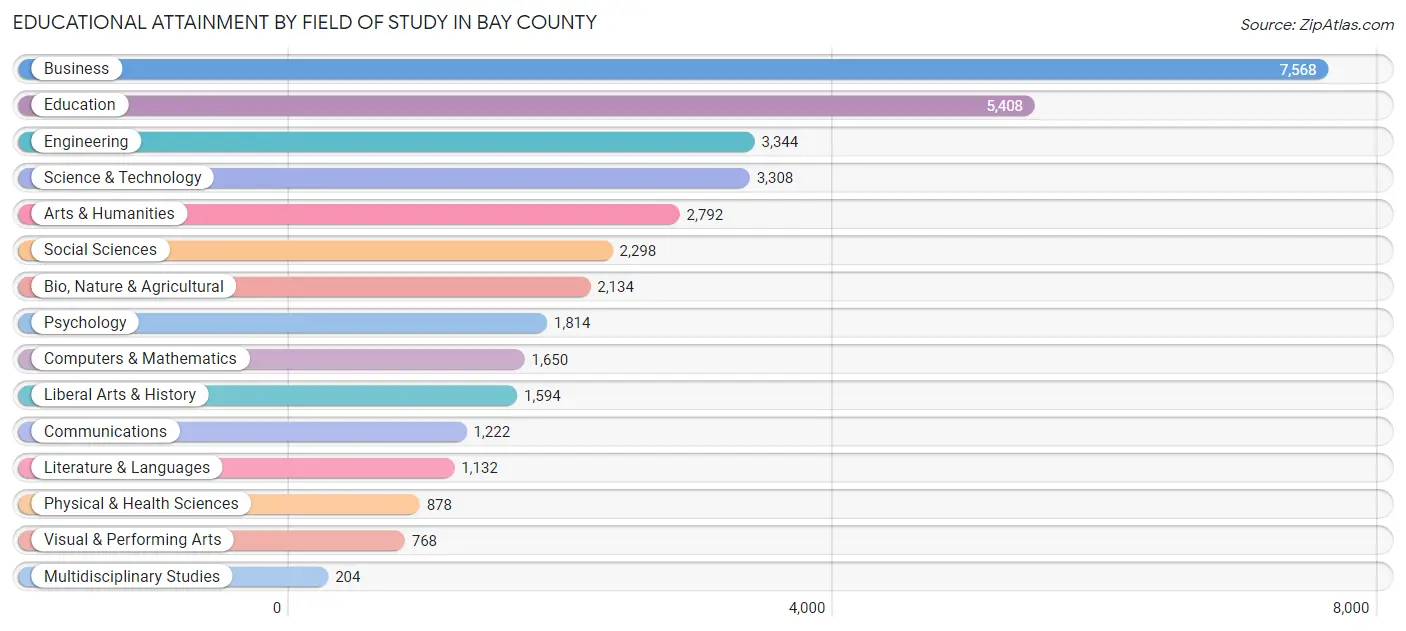
| Field of Study | # Graduates | % Graduates |
| Computers & Mathematics | 1,650 | 4.6% |
| Bio, Nature & Agricultural | 2,134 | 5.9% |
| Physical & Health Sciences | 878 | 2.4% |
| Psychology | 1,814 | 5.0% |
| Social Sciences | 2,298 | 6.4% |
| Engineering | 3,344 | 9.3% |
| Multidisciplinary Studies | 204 | 0.6% |
| Science & Technology | 3,308 | 9.2% |
| Business | 7,568 | 21.0% |
| Education | 5,408 | 15.0% |
| Literature & Languages | 1,132 | 3.1% |
| Liberal Arts & History | 1,594 | 4.4% |
| Visual & Performing Arts | 768 | 2.1% |
| Communications | 1,222 | 3.4% |
| Arts & Humanities | 2,792 | 7.7% |
| Total | 36,114 | 100.0% |
Transportation & Commute in Bay County
Vehicle Availability by Sex in Bay County
The most prevalent vehicle ownership categories in Bay County are males with 2 vehicles (20,688, accounting for 45.1%) and females with 2 vehicles (17,961, making up 52.3%).
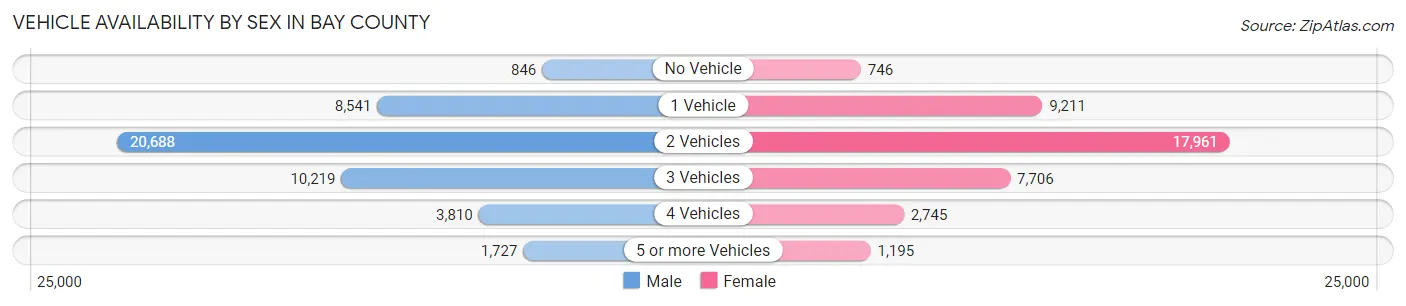
| Vehicles Available | Male | Female |
| No Vehicle | 846 (1.8%) | 746 (1.9%) |
| 1 Vehicle | 8,541 (18.6%) | 9,211 (23.3%) |
| 2 Vehicles | 20,688 (45.1%) | 17,961 (45.4%) |
| 3 Vehicles | 10,219 (22.3%) | 7,706 (19.5%) |
| 4 Vehicles | 3,810 (8.3%) | 2,745 (6.9%) |
| 5 or more Vehicles | 1,727 (3.8%) | 1,195 (3.0%) |
| Total | 45,831 (100.0%) | 39,564 (100.0%) |
Commute Time in Bay County
The most frequently occuring commute durations in Bay County are 15 to 19 minutes (14,930 commuters, 18.8%), 30 to 34 minutes (12,693 commuters, 16.0%), and 10 to 14 minutes (11,484 commuters, 14.5%).
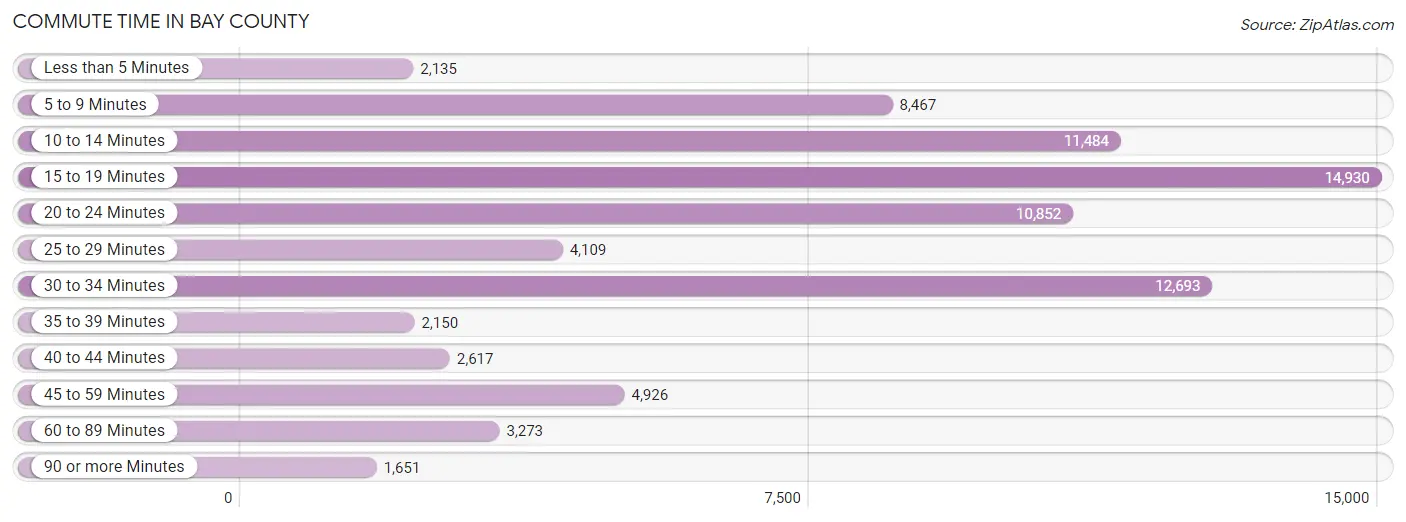
| Commute Time | # Commuters | % Commuters |
| Less than 5 Minutes | 2,135 | 2.7% |
| 5 to 9 Minutes | 8,467 | 10.7% |
| 10 to 14 Minutes | 11,484 | 14.5% |
| 15 to 19 Minutes | 14,930 | 18.8% |
| 20 to 24 Minutes | 10,852 | 13.7% |
| 25 to 29 Minutes | 4,109 | 5.2% |
| 30 to 34 Minutes | 12,693 | 16.0% |
| 35 to 39 Minutes | 2,150 | 2.7% |
| 40 to 44 Minutes | 2,617 | 3.3% |
| 45 to 59 Minutes | 4,926 | 6.2% |
| 60 to 89 Minutes | 3,273 | 4.1% |
| 90 or more Minutes | 1,651 | 2.1% |
Commute Time by Sex in Bay County
The most common commute times in Bay County are 15 to 19 minutes (8,475 commuters, 19.5%) for males and 15 to 19 minutes (6,455 commuters, 18.0%) for females.
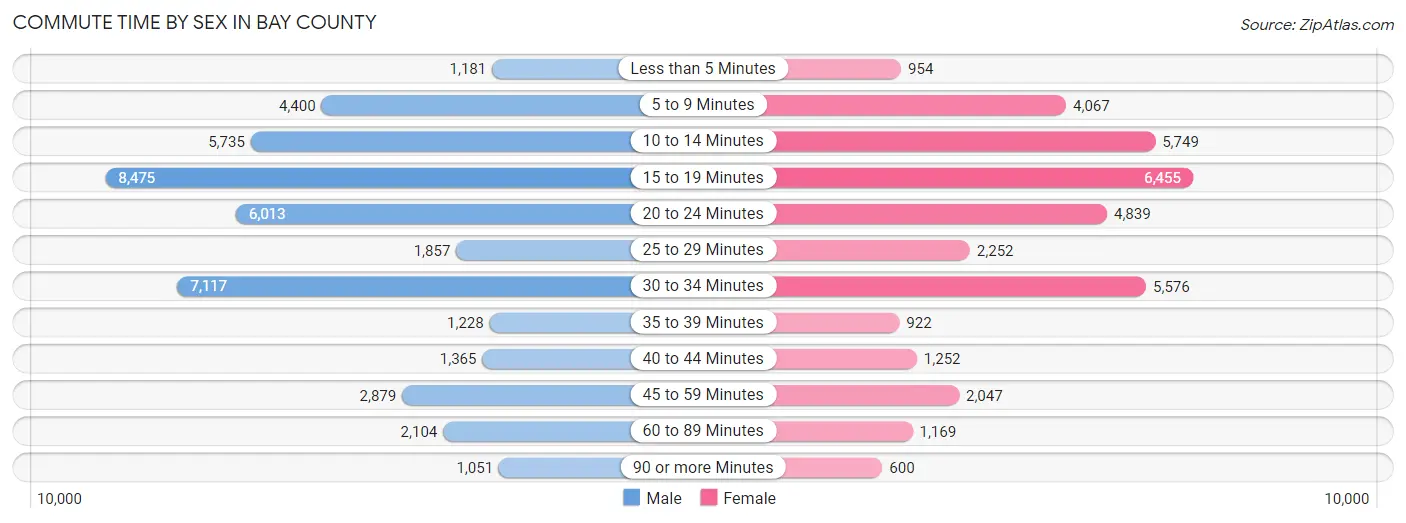
| Commute Time | Male | Female |
| Less than 5 Minutes | 1,181 (2.7%) | 954 (2.7%) |
| 5 to 9 Minutes | 4,400 (10.1%) | 4,067 (11.3%) |
| 10 to 14 Minutes | 5,735 (13.2%) | 5,749 (16.0%) |
| 15 to 19 Minutes | 8,475 (19.5%) | 6,455 (18.0%) |
| 20 to 24 Minutes | 6,013 (13.9%) | 4,839 (13.5%) |
| 25 to 29 Minutes | 1,857 (4.3%) | 2,252 (6.3%) |
| 30 to 34 Minutes | 7,117 (16.4%) | 5,576 (15.5%) |
| 35 to 39 Minutes | 1,228 (2.8%) | 922 (2.6%) |
| 40 to 44 Minutes | 1,365 (3.1%) | 1,252 (3.5%) |
| 45 to 59 Minutes | 2,879 (6.6%) | 2,047 (5.7%) |
| 60 to 89 Minutes | 2,104 (4.9%) | 1,169 (3.3%) |
| 90 or more Minutes | 1,051 (2.4%) | 600 (1.7%) |
Time of Departure to Work by Sex in Bay County
The most frequent times of departure to work in Bay County are 6:30 AM to 6:59 AM (6,261, 14.4%) for males and 7:00 AM to 7:29 AM (6,629, 18.5%) for females.
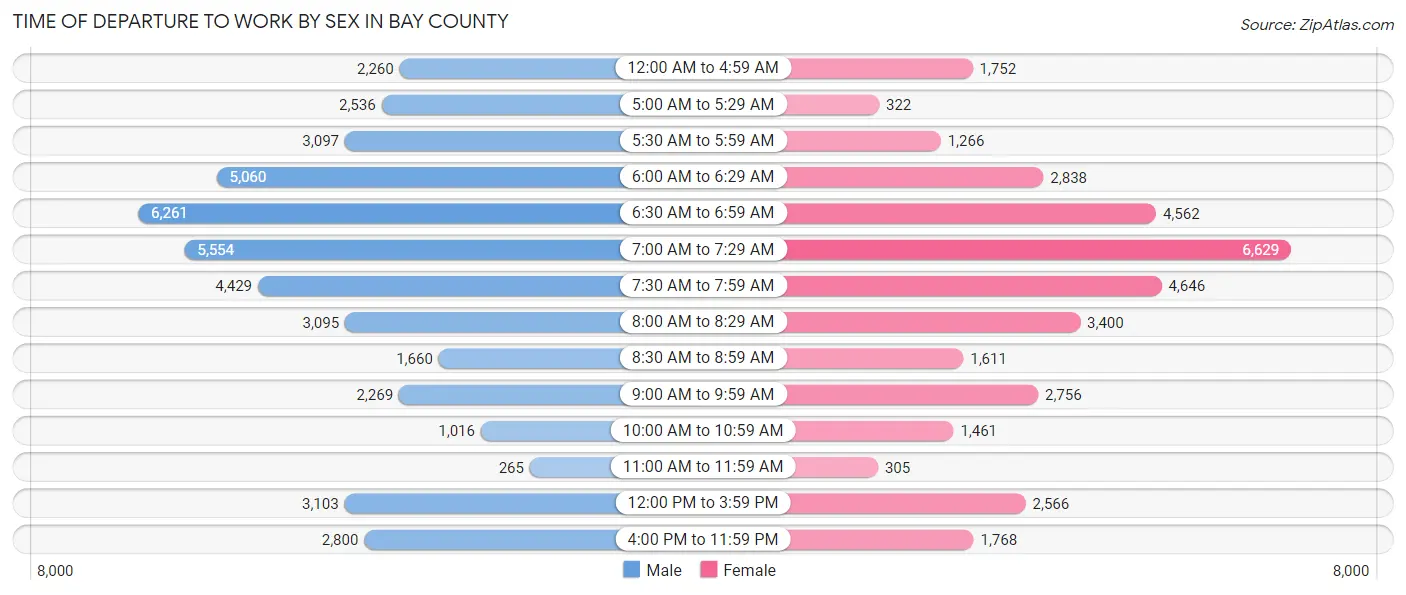
| Time of Departure | Male | Female |
| 12:00 AM to 4:59 AM | 2,260 (5.2%) | 1,752 (4.9%) |
| 5:00 AM to 5:29 AM | 2,536 (5.8%) | 322 (0.9%) |
| 5:30 AM to 5:59 AM | 3,097 (7.1%) | 1,266 (3.5%) |
| 6:00 AM to 6:29 AM | 5,060 (11.7%) | 2,838 (7.9%) |
| 6:30 AM to 6:59 AM | 6,261 (14.4%) | 4,562 (12.7%) |
| 7:00 AM to 7:29 AM | 5,554 (12.8%) | 6,629 (18.5%) |
| 7:30 AM to 7:59 AM | 4,429 (10.2%) | 4,646 (13.0%) |
| 8:00 AM to 8:29 AM | 3,095 (7.1%) | 3,400 (9.5%) |
| 8:30 AM to 8:59 AM | 1,660 (3.8%) | 1,611 (4.5%) |
| 9:00 AM to 9:59 AM | 2,269 (5.2%) | 2,756 (7.7%) |
| 10:00 AM to 10:59 AM | 1,016 (2.3%) | 1,461 (4.1%) |
| 11:00 AM to 11:59 AM | 265 (0.6%) | 305 (0.9%) |
| 12:00 PM to 3:59 PM | 3,103 (7.1%) | 2,566 (7.1%) |
| 4:00 PM to 11:59 PM | 2,800 (6.5%) | 1,768 (4.9%) |
| Total | 43,405 (100.0%) | 35,882 (100.0%) |
Housing Occupancy in Bay County
Occupancy by Ownership in Bay County
Of the total 74,678 dwellings in Bay County, owner-occupied units account for 51,208 (68.6%), while renter-occupied units make up 23,470 (31.4%).
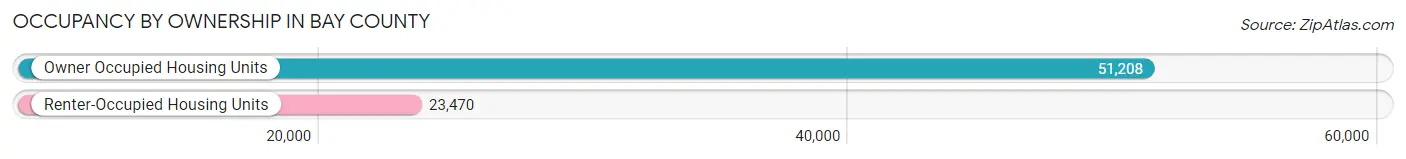
| Occupancy | # Housing Units | % Housing Units |
| Owner Occupied Housing Units | 51,208 | 68.6% |
| Renter-Occupied Housing Units | 23,470 | 31.4% |
| Total Occupied Housing Units | 74,678 | 100.0% |
Occupancy by Household Size in Bay County
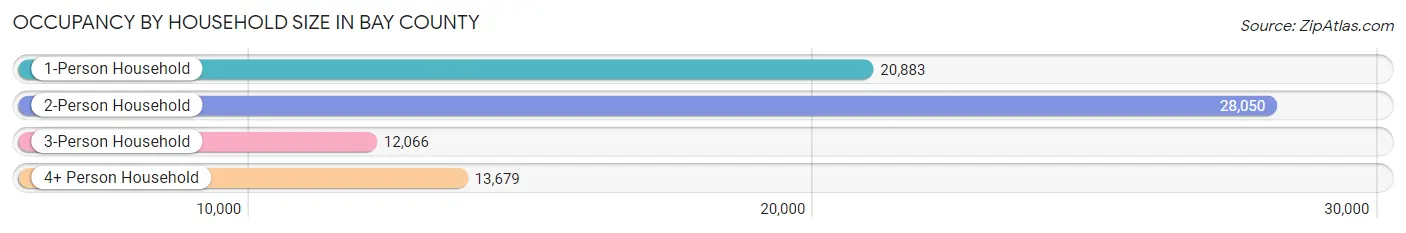
| Household Size | # Housing Units | % Housing Units |
| 1-Person Household | 20,883 | 28.0% |
| 2-Person Household | 28,050 | 37.6% |
| 3-Person Household | 12,066 | 16.2% |
| 4+ Person Household | 13,679 | 18.3% |
| Total Housing Units | 74,678 | 100.0% |
Occupancy by Ownership by Household Size in Bay County
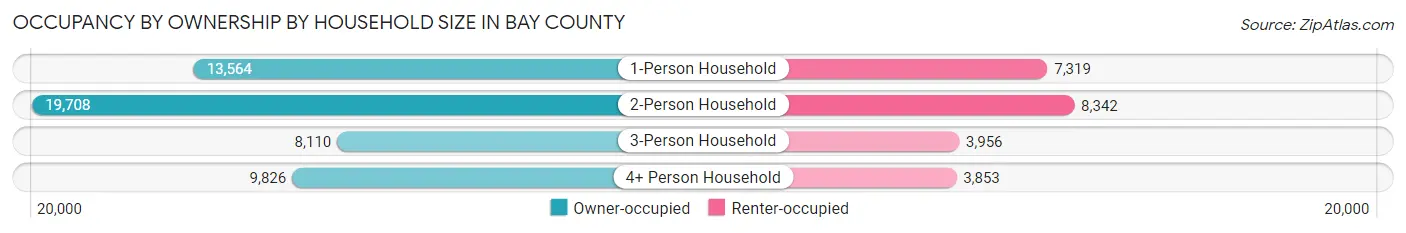
| Household Size | Owner-occupied | Renter-occupied |
| 1-Person Household | 13,564 (64.9%) | 7,319 (35.0%) |
| 2-Person Household | 19,708 (70.3%) | 8,342 (29.7%) |
| 3-Person Household | 8,110 (67.2%) | 3,956 (32.8%) |
| 4+ Person Household | 9,826 (71.8%) | 3,853 (28.2%) |
| Total Housing Units | 51,208 (68.6%) | 23,470 (31.4%) |
Occupancy by Educational Attainment in Bay County
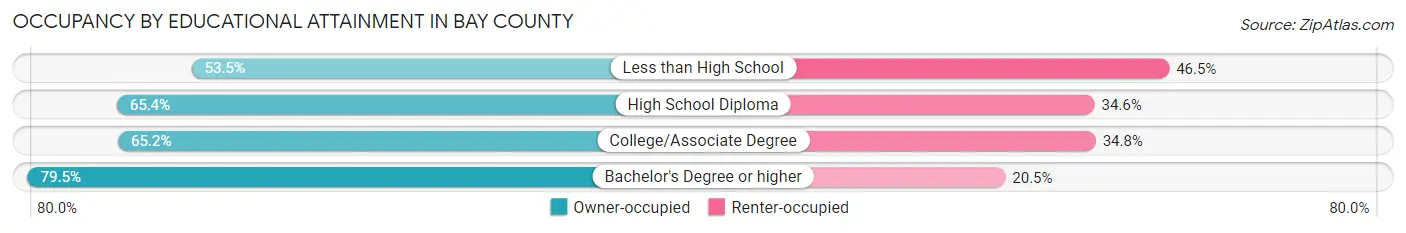
| Household Size | Owner-occupied | Renter-occupied |
| Less than High School | 3,017 (53.5%) | 2,620 (46.5%) |
| High School Diploma | 11,894 (65.4%) | 6,303 (34.6%) |
| College/Associate Degree | 18,777 (65.2%) | 10,033 (34.8%) |
| Bachelor's Degree or higher | 17,520 (79.5%) | 4,514 (20.5%) |
Occupancy by Age of Householder in Bay County
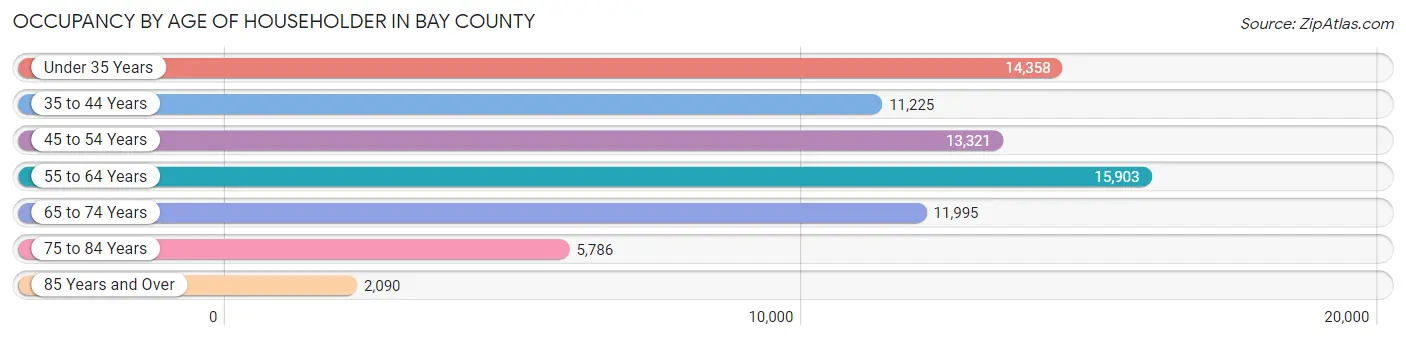
| Age Bracket | # Households | % Households |
| Under 35 Years | 14,358 | 19.2% |
| 35 to 44 Years | 11,225 | 15.0% |
| 45 to 54 Years | 13,321 | 17.8% |
| 55 to 64 Years | 15,903 | 21.3% |
| 65 to 74 Years | 11,995 | 16.1% |
| 75 to 84 Years | 5,786 | 7.7% |
| 85 Years and Over | 2,090 | 2.8% |
| Total | 74,678 | 100.0% |
Housing Finances in Bay County
Median Income by Occupancy in Bay County
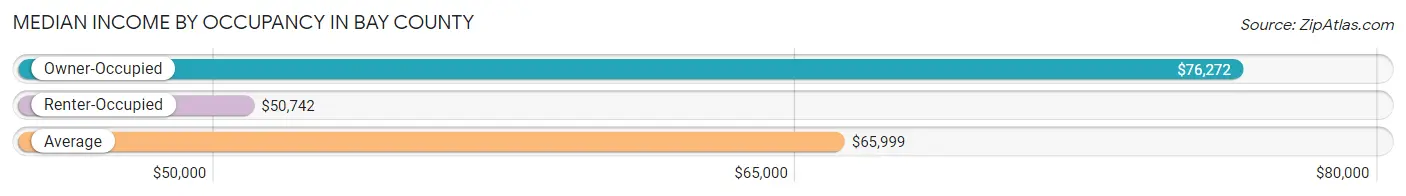
| Occupancy Type | # Households | Median Income |
| Owner-Occupied | 51,208 (68.6%) | $76,272 |
| Renter-Occupied | 23,470 (31.4%) | $50,742 |
| Average | 74,678 (100.0%) | $65,999 |
Occupancy by Householder Income Bracket in Bay County
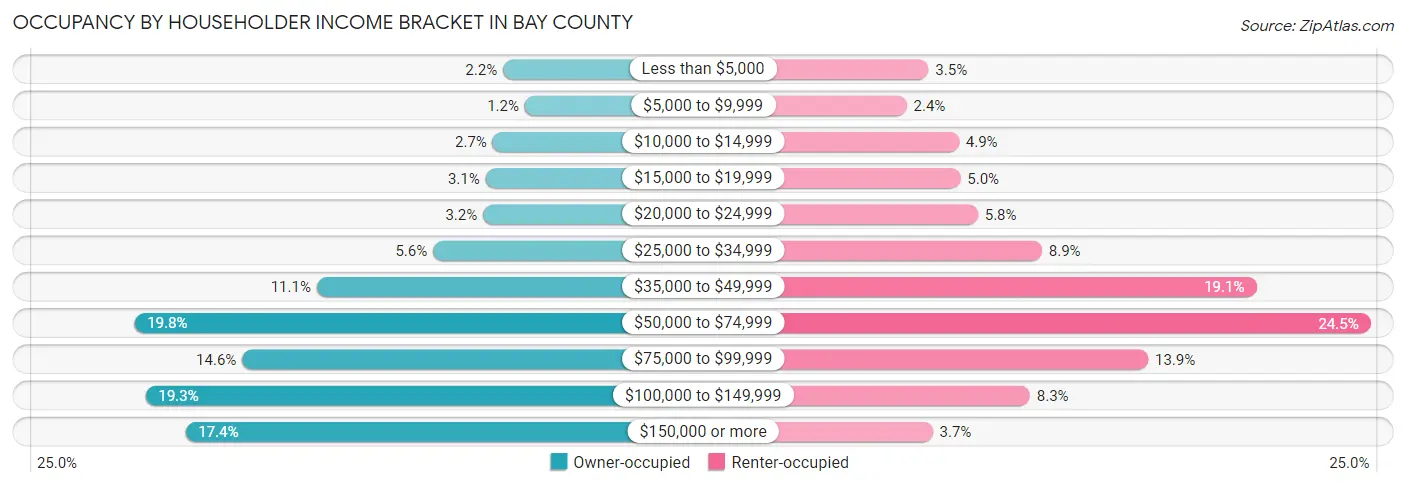
| Income Bracket | Owner-occupied | Renter-occupied |
| Less than $5,000 | 1,139 (2.2%) | 814 (3.5%) |
| $5,000 to $9,999 | 602 (1.2%) | 570 (2.4%) |
| $10,000 to $14,999 | 1,387 (2.7%) | 1,154 (4.9%) |
| $15,000 to $19,999 | 1,562 (3.0%) | 1,171 (5.0%) |
| $20,000 to $24,999 | 1,625 (3.2%) | 1,366 (5.8%) |
| $25,000 to $34,999 | 2,844 (5.6%) | 2,081 (8.9%) |
| $35,000 to $49,999 | 5,681 (11.1%) | 4,479 (19.1%) |
| $50,000 to $74,999 | 10,130 (19.8%) | 5,756 (24.5%) |
| $75,000 to $99,999 | 7,497 (14.6%) | 3,269 (13.9%) |
| $100,000 to $149,999 | 9,858 (19.3%) | 1,949 (8.3%) |
| $150,000 or more | 8,883 (17.3%) | 861 (3.7%) |
| Total | 51,208 (100.0%) | 23,470 (100.0%) |
Monthly Housing Cost Tiers in Bay County
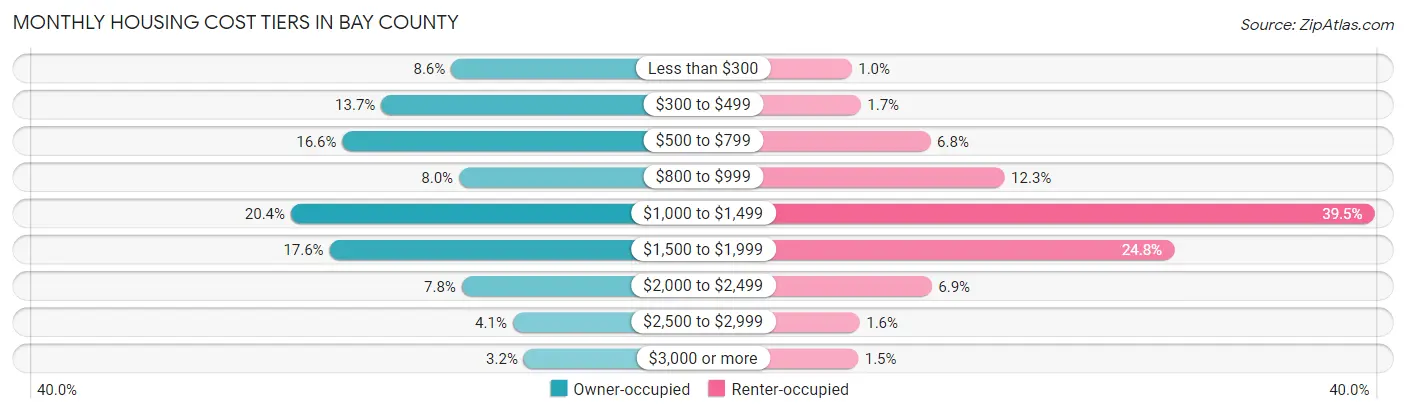
| Monthly Cost | Owner-occupied | Renter-occupied |
| Less than $300 | 4,401 (8.6%) | 239 (1.0%) |
| $300 to $499 | 7,037 (13.7%) | 397 (1.7%) |
| $500 to $799 | 8,502 (16.6%) | 1,603 (6.8%) |
| $800 to $999 | 4,102 (8.0%) | 2,883 (12.3%) |
| $1,000 to $1,499 | 10,442 (20.4%) | 9,281 (39.5%) |
| $1,500 to $1,999 | 8,988 (17.5%) | 5,815 (24.8%) |
| $2,000 to $2,499 | 3,999 (7.8%) | 1,623 (6.9%) |
| $2,500 to $2,999 | 2,076 (4.1%) | 377 (1.6%) |
| $3,000 or more | 1,661 (3.2%) | 351 (1.5%) |
| Total | 51,208 (100.0%) | 23,470 (100.0%) |
Physical Housing Characteristics in Bay County
Housing Structures in Bay County
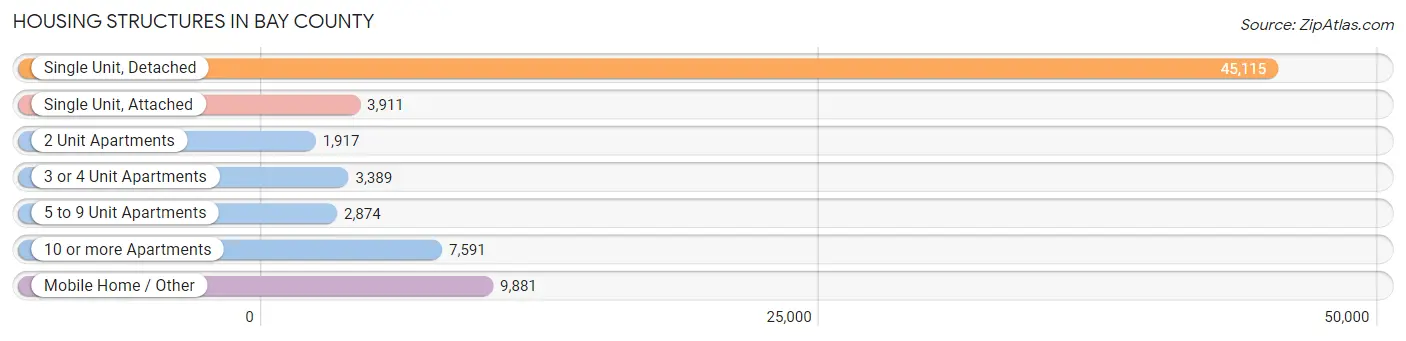
| Structure Type | # Housing Units | % Housing Units |
| Single Unit, Detached | 45,115 | 60.4% |
| Single Unit, Attached | 3,911 | 5.2% |
| 2 Unit Apartments | 1,917 | 2.6% |
| 3 or 4 Unit Apartments | 3,389 | 4.5% |
| 5 to 9 Unit Apartments | 2,874 | 3.8% |
| 10 or more Apartments | 7,591 | 10.2% |
| Mobile Home / Other | 9,881 | 13.2% |
| Total | 74,678 | 100.0% |
Housing Structures by Occupancy in Bay County
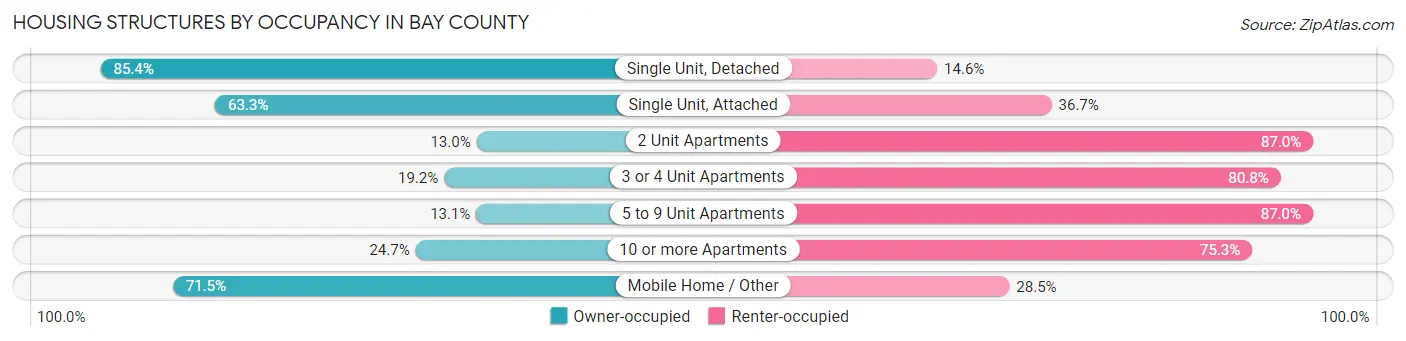
| Structure Type | Owner-occupied | Renter-occupied |
| Single Unit, Detached | 38,516 (85.4%) | 6,599 (14.6%) |
| Single Unit, Attached | 2,477 (63.3%) | 1,434 (36.7%) |
| 2 Unit Apartments | 249 (13.0%) | 1,668 (87.0%) |
| 3 or 4 Unit Apartments | 652 (19.2%) | 2,737 (80.8%) |
| 5 to 9 Unit Apartments | 375 (13.1%) | 2,499 (87.0%) |
| 10 or more Apartments | 1,878 (24.7%) | 5,713 (75.3%) |
| Mobile Home / Other | 7,061 (71.5%) | 2,820 (28.5%) |
| Total | 51,208 (68.6%) | 23,470 (31.4%) |
Housing Structures by Number of Rooms in Bay County
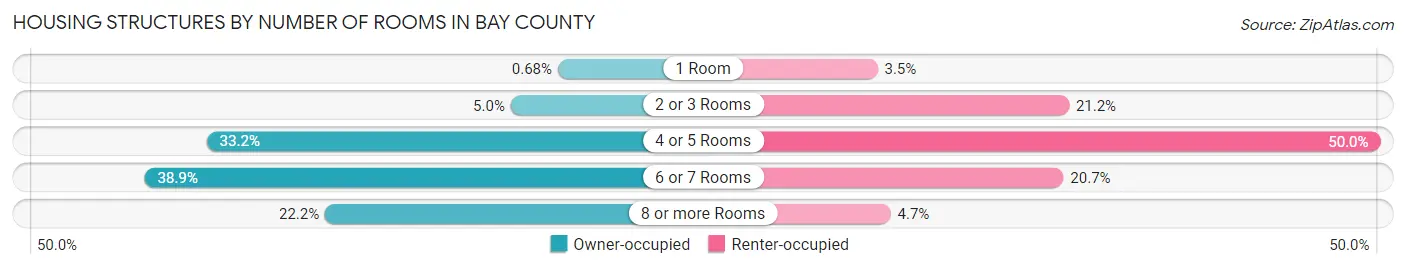
| Number of Rooms | Owner-occupied | Renter-occupied |
| 1 Room | 349 (0.7%) | 817 (3.5%) |
| 2 or 3 Rooms | 2,579 (5.0%) | 4,970 (21.2%) |
| 4 or 5 Rooms | 16,983 (33.2%) | 11,731 (50.0%) |
| 6 or 7 Rooms | 19,924 (38.9%) | 4,852 (20.7%) |
| 8 or more Rooms | 11,373 (22.2%) | 1,100 (4.7%) |
| Total | 51,208 (100.0%) | 23,470 (100.0%) |
Housing Structure by Heating Type in Bay County
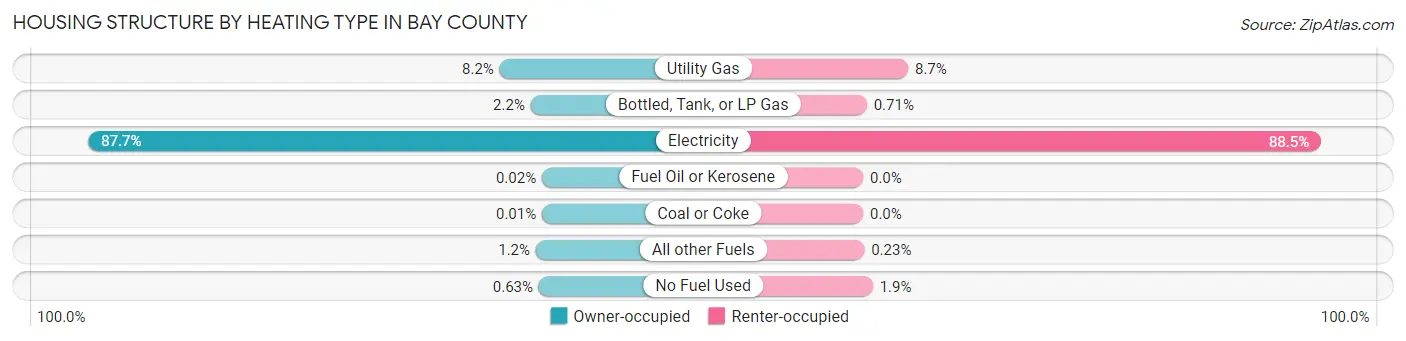
| Heating Type | Owner-occupied | Renter-occupied |
| Utility Gas | 4,198 (8.2%) | 2,040 (8.7%) |
| Bottled, Tank, or LP Gas | 1,125 (2.2%) | 166 (0.7%) |
| Electricity | 44,921 (87.7%) | 20,771 (88.5%) |
| Fuel Oil or Kerosene | 11 (0.0%) | 0 (0.0%) |
| Coal or Coke | 7 (0.0%) | 0 (0.0%) |
| All other Fuels | 621 (1.2%) | 55 (0.2%) |
| No Fuel Used | 325 (0.6%) | 438 (1.9%) |
| Total | 51,208 (100.0%) | 23,470 (100.0%) |
Household Vehicle Usage in Bay County
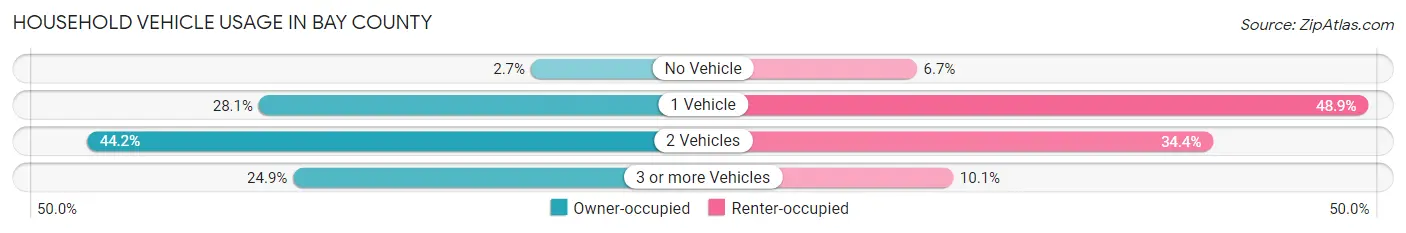
| Vehicles per Household | Owner-occupied | Renter-occupied |
| No Vehicle | 1,402 (2.7%) | 1,569 (6.7%) |
| 1 Vehicle | 14,410 (28.1%) | 11,468 (48.9%) |
| 2 Vehicles | 22,631 (44.2%) | 8,068 (34.4%) |
| 3 or more Vehicles | 12,765 (24.9%) | 2,365 (10.1%) |
| Total | 51,208 (100.0%) | 23,470 (100.0%) |
Real Estate & Mortgages in Bay County
Real Estate and Mortgage Overview in Bay County
| Characteristic | Without Mortgage | With Mortgage |
| Housing Units | 22,367 | 28,841 |
| Median Property Value | $218,900 | $265,500 |
| Median Household Income | $62,321 | $6,015 |
| Monthly Housing Costs | $501 | $1,541 |
| Real Estate Taxes | $1,238 | $1,754 |
Property Value by Mortgage Status in Bay County
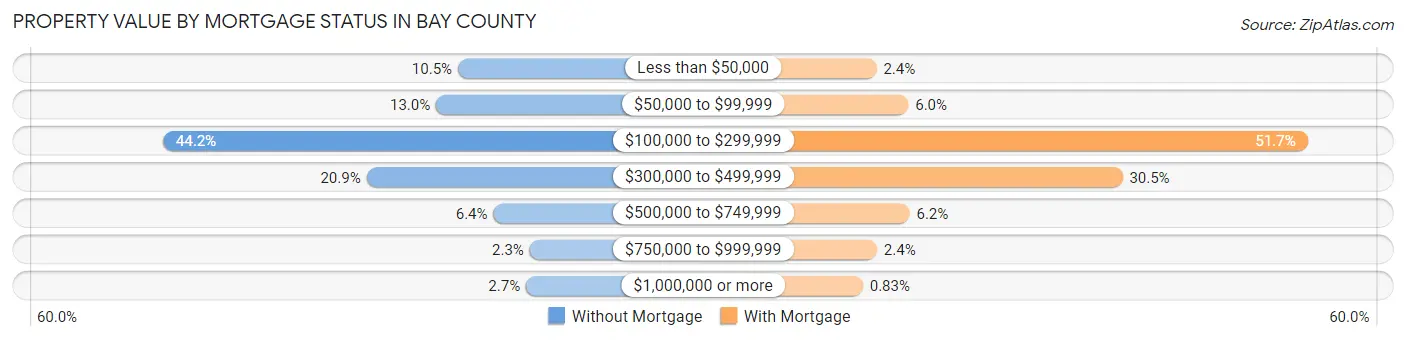
| Property Value | Without Mortgage | With Mortgage |
| Less than $50,000 | 2,345 (10.5%) | 688 (2.4%) |
| $50,000 to $99,999 | 2,904 (13.0%) | 1,740 (6.0%) |
| $100,000 to $299,999 | 9,883 (44.2%) | 14,895 (51.6%) |
| $300,000 to $499,999 | 4,681 (20.9%) | 8,797 (30.5%) |
| $500,000 to $749,999 | 1,439 (6.4%) | 1,779 (6.2%) |
| $750,000 to $999,999 | 510 (2.3%) | 704 (2.4%) |
| $1,000,000 or more | 605 (2.7%) | 238 (0.8%) |
| Total | 22,367 (100.0%) | 28,841 (100.0%) |
Household Income by Mortgage Status in Bay County
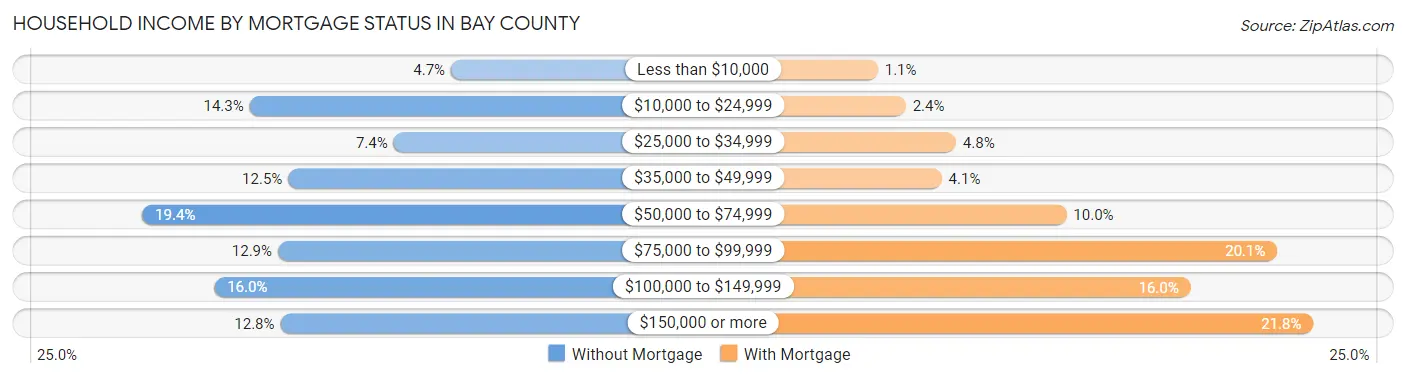
| Household Income | Without Mortgage | With Mortgage |
| Less than $10,000 | 1,051 (4.7%) | 305 (1.1%) |
| $10,000 to $24,999 | 3,196 (14.3%) | 690 (2.4%) |
| $25,000 to $34,999 | 1,661 (7.4%) | 1,378 (4.8%) |
| $35,000 to $49,999 | 2,785 (12.4%) | 1,183 (4.1%) |
| $50,000 to $74,999 | 4,339 (19.4%) | 2,896 (10.0%) |
| $75,000 to $99,999 | 2,895 (12.9%) | 5,791 (20.1%) |
| $100,000 to $149,999 | 3,572 (16.0%) | 4,602 (16.0%) |
| $150,000 or more | 2,868 (12.8%) | 6,286 (21.8%) |
| Total | 22,367 (100.0%) | 28,841 (100.0%) |
Property Value to Household Income Ratio in Bay County
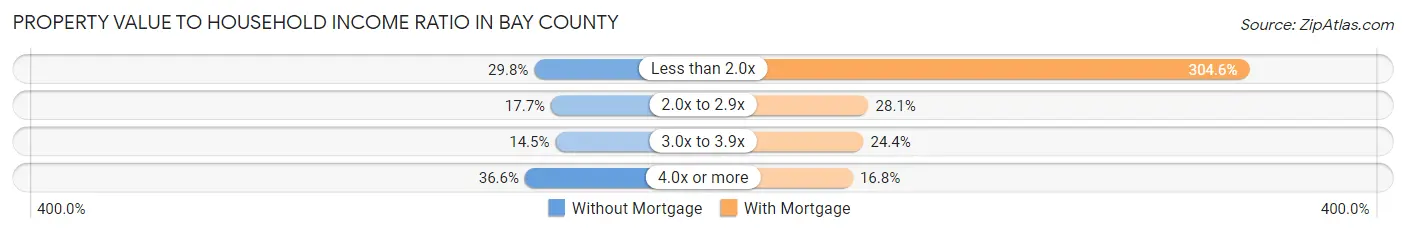
| Value-to-Income Ratio | Without Mortgage | With Mortgage |
| Less than 2.0x | 6,672 (29.8%) | 87,843 (304.6%) |
| 2.0x to 2.9x | 3,949 (17.7%) | 8,116 (28.1%) |
| 3.0x to 3.9x | 3,231 (14.4%) | 7,046 (24.4%) |
| 4.0x or more | 8,192 (36.6%) | 4,838 (16.8%) |
| Total | 22,367 (100.0%) | 28,841 (100.0%) |
Real Estate Taxes by Mortgage Status in Bay County
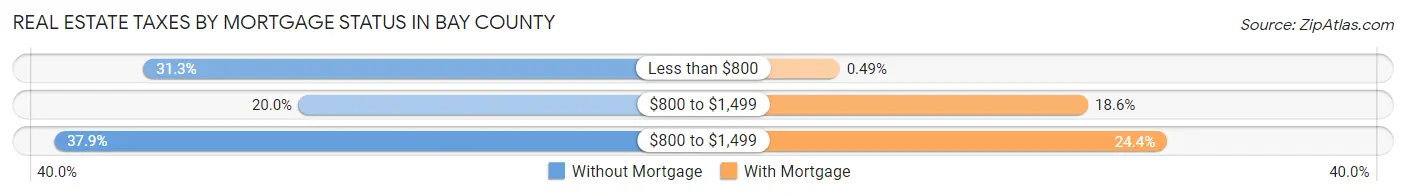
| Property Taxes | Without Mortgage | With Mortgage |
| Less than $800 | 7,006 (31.3%) | 140 (0.5%) |
| $800 to $1,499 | 4,481 (20.0%) | 5,376 (18.6%) |
| $800 to $1,499 | 8,466 (37.9%) | 7,036 (24.4%) |
| Total | 22,367 (100.0%) | 28,841 (100.0%) |
Health & Disability in Bay County
Health Insurance Coverage by Age in Bay County
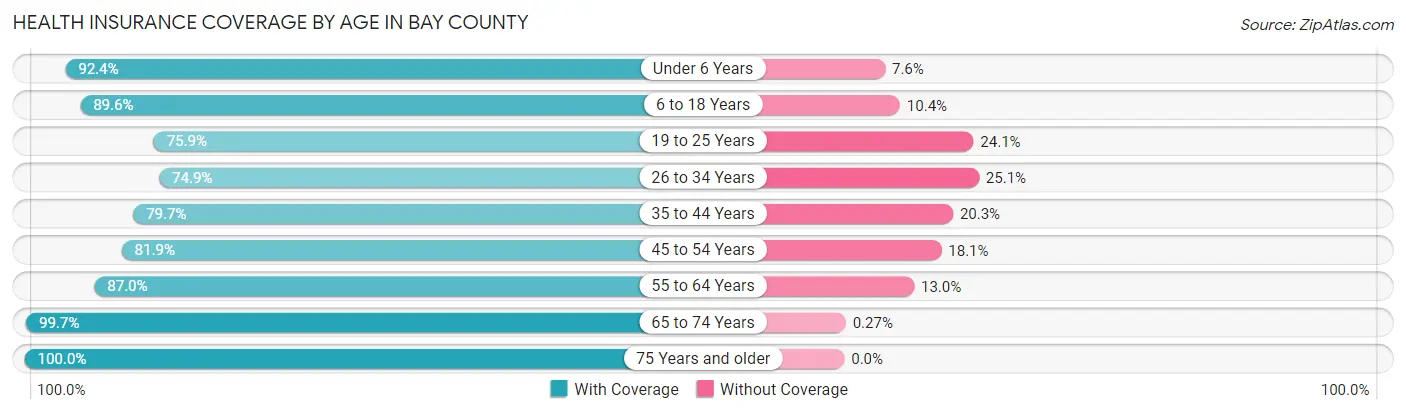
| Age Bracket | With Coverage | Without Coverage |
| Under 6 Years | 11,096 (92.4%) | 913 (7.6%) |
| 6 to 18 Years | 24,493 (89.6%) | 2,835 (10.4%) |
| 19 to 25 Years | 10,507 (75.9%) | 3,332 (24.1%) |
| 26 to 34 Years | 15,239 (74.9%) | 5,107 (25.1%) |
| 35 to 44 Years | 17,317 (79.7%) | 4,399 (20.3%) |
| 45 to 54 Years | 18,490 (81.9%) | 4,087 (18.1%) |
| 55 to 64 Years | 23,092 (87.0%) | 3,454 (13.0%) |
| 65 to 74 Years | 19,444 (99.7%) | 52 (0.3%) |
| 75 Years and older | 12,317 (100.0%) | 0 (0.0%) |
| Total | 151,995 (86.3%) | 24,179 (13.7%) |
Health Insurance Coverage by Citizenship Status in Bay County
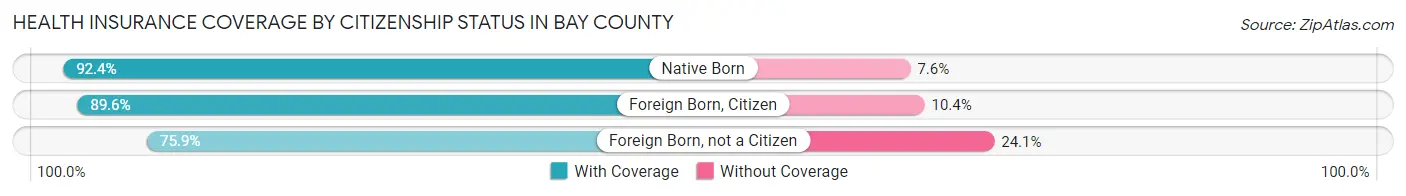
| Citizenship Status | With Coverage | Without Coverage |
| Native Born | 11,096 (92.4%) | 913 (7.6%) |
| Foreign Born, Citizen | 24,493 (89.6%) | 2,835 (10.4%) |
| Foreign Born, not a Citizen | 10,507 (75.9%) | 3,332 (24.1%) |
Health Insurance Coverage by Household Income in Bay County
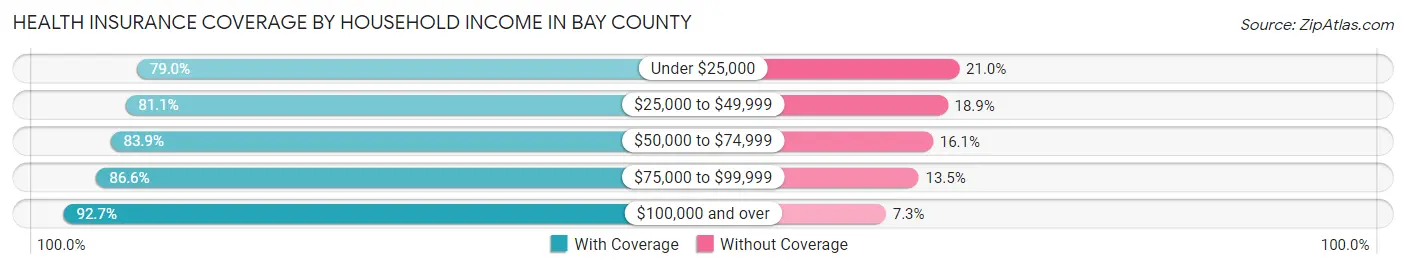
| Household Income | With Coverage | Without Coverage |
| Under $25,000 | 15,230 (79.0%) | 4,059 (21.0%) |
| $25,000 to $49,999 | 25,076 (81.1%) | 5,832 (18.9%) |
| $50,000 to $74,999 | 30,706 (83.9%) | 5,896 (16.1%) |
| $75,000 to $99,999 | 25,020 (86.6%) | 3,889 (13.5%) |
| $100,000 and over | 55,767 (92.7%) | 4,397 (7.3%) |
Public vs Private Health Insurance Coverage by Age in Bay County
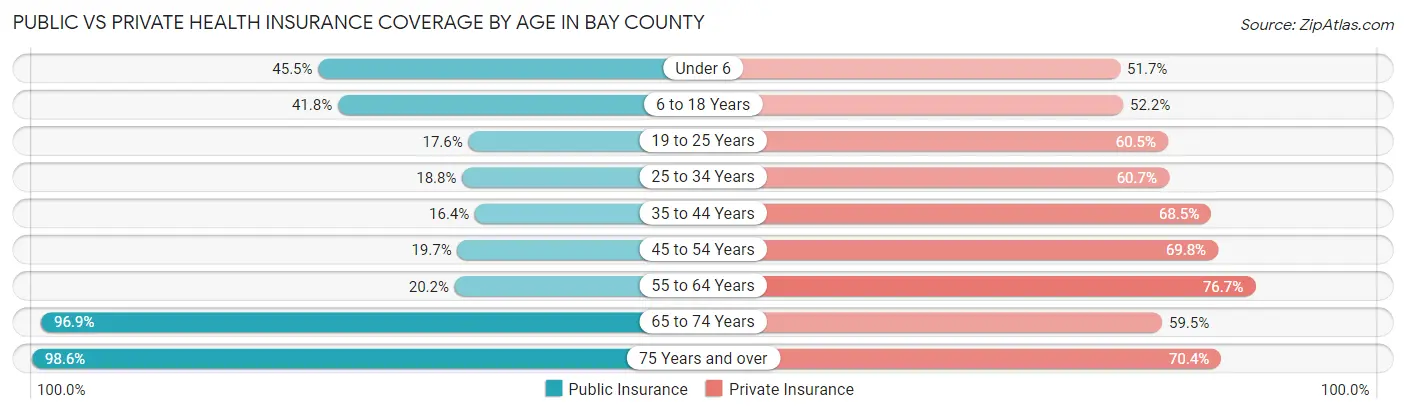
| Age Bracket | Public Insurance | Private Insurance |
| Under 6 | 5,461 (45.5%) | 6,205 (51.7%) |
| 6 to 18 Years | 11,430 (41.8%) | 14,267 (52.2%) |
| 19 to 25 Years | 2,434 (17.6%) | 8,376 (60.5%) |
| 25 to 34 Years | 3,816 (18.8%) | 12,346 (60.7%) |
| 35 to 44 Years | 3,556 (16.4%) | 14,881 (68.5%) |
| 45 to 54 Years | 4,437 (19.7%) | 15,760 (69.8%) |
| 55 to 64 Years | 5,348 (20.2%) | 20,357 (76.7%) |
| 65 to 74 Years | 18,900 (96.9%) | 11,590 (59.5%) |
| 75 Years and over | 12,150 (98.6%) | 8,673 (70.4%) |
| Total | 67,532 (38.3%) | 112,455 (63.8%) |
Disability Status by Sex by Age in Bay County
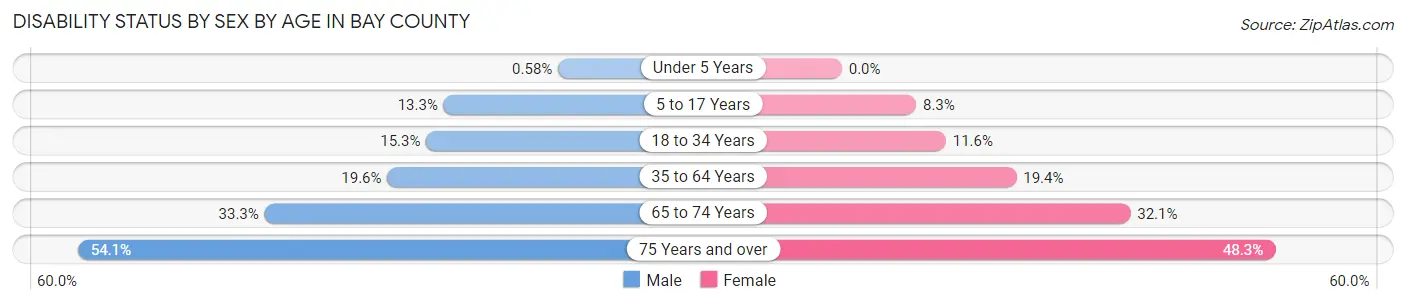
| Age Bracket | Male | Female |
| Under 5 Years | 30 (0.6%) | 0 (0.0%) |
| 5 to 17 Years | 1,862 (13.3%) | 1,126 (8.3%) |
| 18 to 34 Years | 2,755 (15.3%) | 2,059 (11.6%) |
| 35 to 64 Years | 6,789 (19.6%) | 7,035 (19.4%) |
| 65 to 74 Years | 3,098 (33.3%) | 3,272 (32.1%) |
| 75 Years and over | 2,945 (54.1%) | 3,315 (48.2%) |
Disability Class by Sex by Age in Bay County
Disability Class: Hearing Difficulty
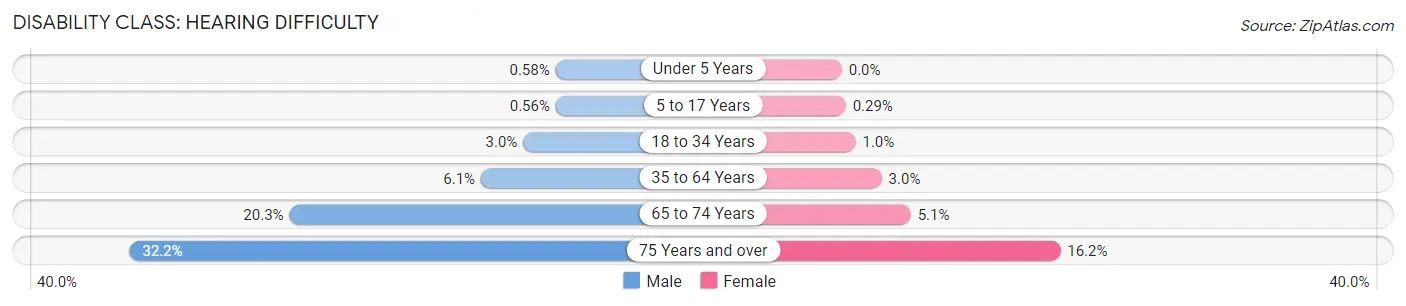
| Age Bracket | Male | Female |
| Under 5 Years | 30 (0.6%) | 0 (0.0%) |
| 5 to 17 Years | 78 (0.6%) | 40 (0.3%) |
| 18 to 34 Years | 537 (3.0%) | 181 (1.0%) |
| 35 to 64 Years | 2,121 (6.1%) | 1,073 (3.0%) |
| 65 to 74 Years | 1,894 (20.3%) | 521 (5.1%) |
| 75 Years and over | 1,755 (32.2%) | 1,114 (16.2%) |
Disability Class: Vision Difficulty
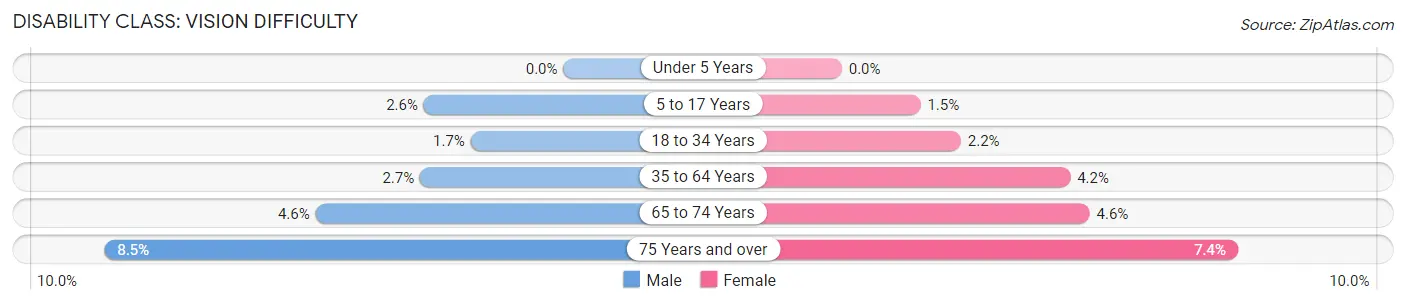
| Age Bracket | Male | Female |
| Under 5 Years | 0 (0.0%) | 0 (0.0%) |
| 5 to 17 Years | 362 (2.6%) | 198 (1.5%) |
| 18 to 34 Years | 311 (1.7%) | 393 (2.2%) |
| 35 to 64 Years | 921 (2.7%) | 1,534 (4.2%) |
| 65 to 74 Years | 428 (4.6%) | 468 (4.6%) |
| 75 Years and over | 464 (8.5%) | 505 (7.3%) |
Disability Class: Cognitive Difficulty
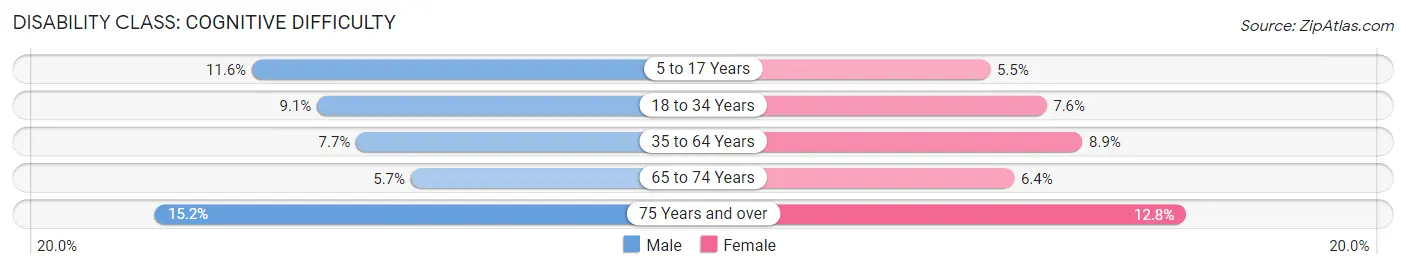
| Age Bracket | Male | Female |
| 5 to 17 Years | 1,616 (11.6%) | 748 (5.5%) |
| 18 to 34 Years | 1,650 (9.1%) | 1,350 (7.6%) |
| 35 to 64 Years | 2,662 (7.7%) | 3,231 (8.9%) |
| 65 to 74 Years | 527 (5.7%) | 651 (6.4%) |
| 75 Years and over | 826 (15.2%) | 878 (12.8%) |
Disability Class: Ambulatory Difficulty
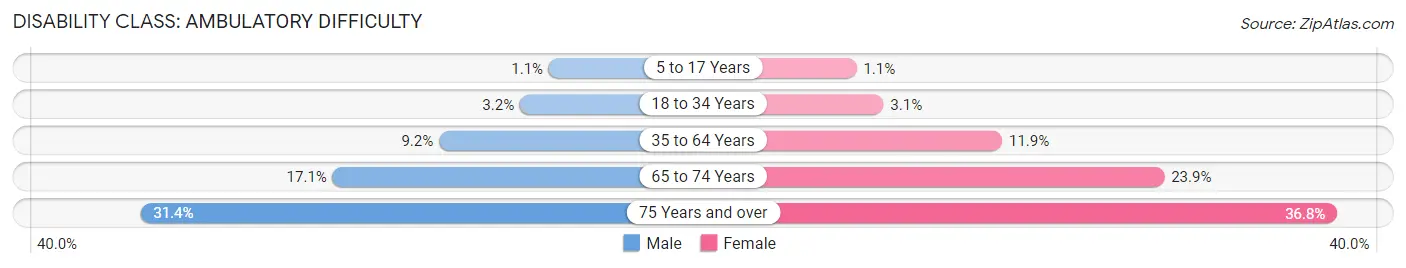
| Age Bracket | Male | Female |
| 5 to 17 Years | 150 (1.1%) | 148 (1.1%) |
| 18 to 34 Years | 581 (3.2%) | 550 (3.1%) |
| 35 to 64 Years | 3,195 (9.2%) | 4,308 (11.9%) |
| 65 to 74 Years | 1,595 (17.1%) | 2,438 (23.9%) |
| 75 Years and over | 1,711 (31.4%) | 2,527 (36.8%) |
Disability Class: Self-Care Difficulty
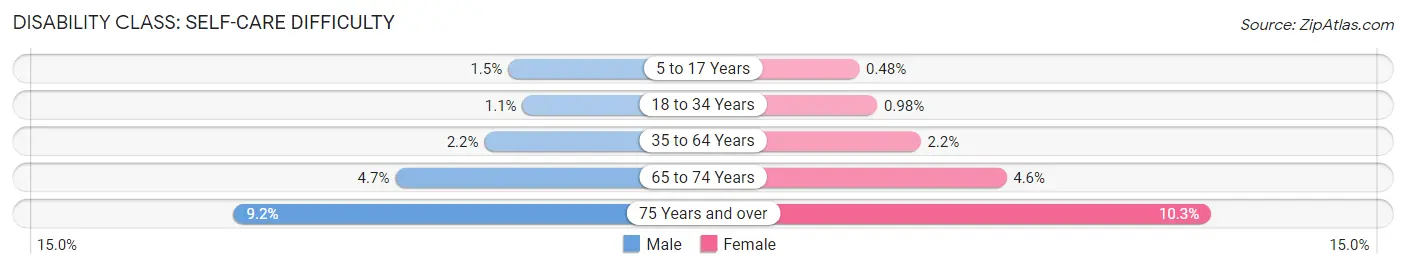
| Age Bracket | Male | Female |
| 5 to 17 Years | 216 (1.5%) | 65 (0.5%) |
| 18 to 34 Years | 205 (1.1%) | 175 (1.0%) |
| 35 to 64 Years | 762 (2.2%) | 792 (2.2%) |
| 65 to 74 Years | 436 (4.7%) | 466 (4.6%) |
| 75 Years and over | 500 (9.2%) | 706 (10.3%) |
Technology Access in Bay County
Computing Device Access in Bay County
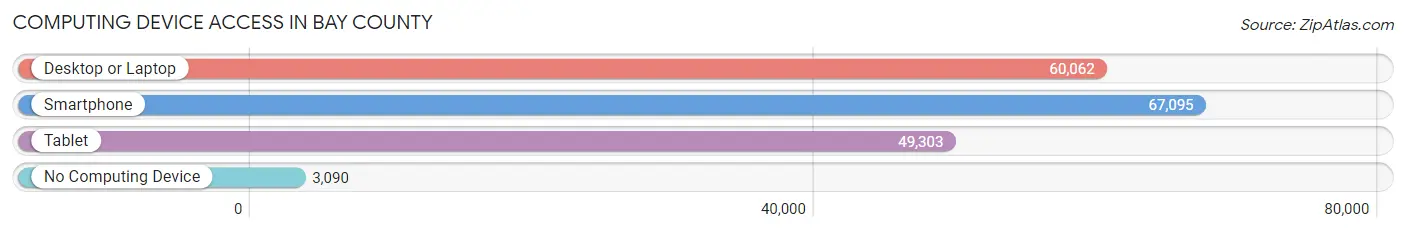
| Device Type | # Households | % Households |
| Desktop or Laptop | 60,062 | 80.4% |
| Smartphone | 67,095 | 89.8% |
| Tablet | 49,303 | 66.0% |
| No Computing Device | 3,090 | 4.1% |
| Total | 74,678 | 100.0% |
Internet Access in Bay County
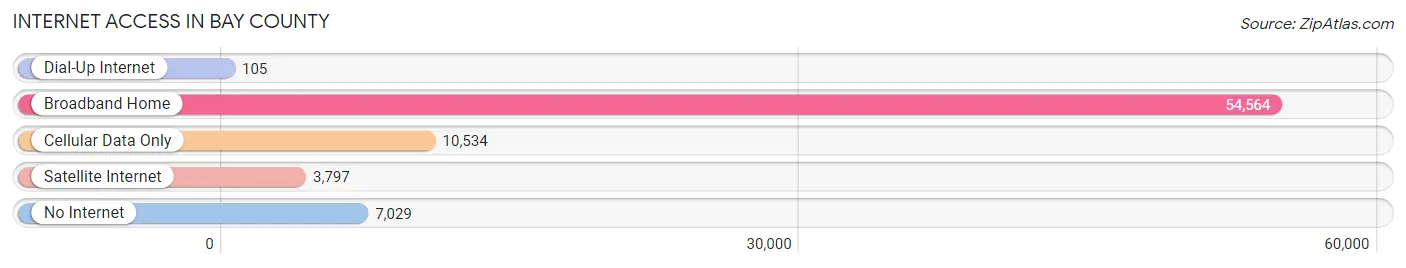
| Internet Type | # Households | % Households |
| Dial-Up Internet | 105 | 0.1% |
| Broadband Home | 54,564 | 73.1% |
| Cellular Data Only | 10,534 | 14.1% |
| Satellite Internet | 3,797 | 5.1% |
| No Internet | 7,029 | 9.4% |
| Total | 74,678 | 100.0% |
Bay County Summary
Bay County is located in the panhandle of Florida, along the Gulf of Mexico. It is bordered by Gulf, Calhoun, Washington, Holmes, and Jackson counties. The county seat is Panama City, and the largest city is Panama City Beach. As of the 2010 census, the population was 168,852.
History
Bay County was created in 1913 from parts of Washington and Calhoun counties. It was named for St. Andrew Bay, which was discovered by Spanish explorer Panfilo de Narvaez in 1528. The area was originally inhabited by Native American tribes, including the Apalachee, Creek, and Choctaw.
In the early 19th century, the area was settled by European Americans, mostly from Georgia and the Carolinas. The first county seat was established at St. Andrew in 1824. In 1836, the county seat was moved to Panama City.
During the Civil War, the county was occupied by Union forces. After the war, the county experienced a period of growth and development. In the late 19th century, the St. Andrews Bay Yacht Club was established, and the area became a popular tourist destination.
In the early 20th century, the county experienced a period of rapid growth. The Panama City-Bay County International Airport was established in 1927, and the Panama City-Bay County Port Authority was established in 1934. The county also experienced a period of industrial growth, with the establishment of paper mills, chemical plants, and other industries.
Geography
Bay County covers an area of 1,033 square miles. It is located in the panhandle of Florida, along the Gulf of Mexico. The county is bordered by Gulf, Calhoun, Washington, Holmes, and Jackson counties.
The county is divided into two distinct regions: the coastal plain and the uplands. The coastal plain is located along the Gulf of Mexico and is characterized by flat terrain and sandy soils. The uplands are located inland and are characterized by rolling hills and sandy soils.
The county is home to several rivers, including the Chipola River, the Apalachicola River, and the Econfina River. The county also contains several lakes, including Lake Powell, Lake Merial, and Lake Iamonia.
Economy
The economy of Bay County is largely based on tourism, manufacturing, and agriculture. The county is home to several tourist attractions, including Panama City Beach, St. Andrews State Park, and Shell Island.
Manufacturing is a major industry in the county. The county is home to several paper mills, chemical plants, and other industries. Agriculture is also an important part of the economy, with the county producing corn, soybeans, cotton, and other crops.
Demographics
As of the 2010 census, the population of Bay County was 168,852. The racial makeup of the county was 79.3% White, 14.2% African American, 0.7% Native American, 2.2% Asian, 0.1% Pacific Islander, and 3.5% from other races. Hispanic or Latino of any race were 8.2% of the population.
The median household income was $41,945 and the median family income was $50,945. The per capita income was $22,945. About 14.2% of the population was below the poverty line.
Common Questions
What is Per Capita Income in Bay County?
Per Capita income in Bay County is $36,868.
What is the Median Family Income in Bay County?
Median Family Income in Bay County is $77,037.
What is the Median Household income in Bay County?
Median Household Income in Bay County is $65,999.
What is Income or Wage Gap in Bay County?
Income or Wage Gap in Bay County is 30.7%.
Women in Bay County earn 69.3 cents for every dollar earned by a man.
What is Family Income Deficit in Bay County?
Family Income Deficit in Bay County is $10,716.
Families that are below poverty line in Bay County earn $10,716 less on average than the poverty threshold level.
What is Inequality or Gini Index in Bay County?
Inequality or Gini Index in Bay County is 0.44.
What is the Total Population of Bay County?
Total Population of Bay County is 181,055.
What is the Total Male Population of Bay County?
Total Male Population of Bay County is 90,237.
What is the Total Female Population of Bay County?
Total Female Population of Bay County is 90,818.
What is the Ratio of Males per 100 Females in Bay County?
There are 99.36 Males per 100 Females in Bay County.
What is the Ratio of Females per 100 Males in Bay County?
There are 100.64 Females per 100 Males in Bay County.
What is the Median Population Age in Bay County?
Median Population Age in Bay County is 41.2 Years.
What is the Average Family Size in Bay County
Average Family Size in Bay County is 2.9 People.
What is the Average Household Size in Bay County
Average Household Size in Bay County is 2.4 People.
How Large is the Labor Force in Bay County?
There are 91,428 People in the Labor Forcein in Bay County.
What is the Percentage of People in the Labor Force in Bay County?
61.9% of People are in the Labor Force in Bay County.
What is the Unemployment Rate in Bay County?
Unemployment Rate in Bay County is 4.0%.