Escambia County, FL Map & Demographics
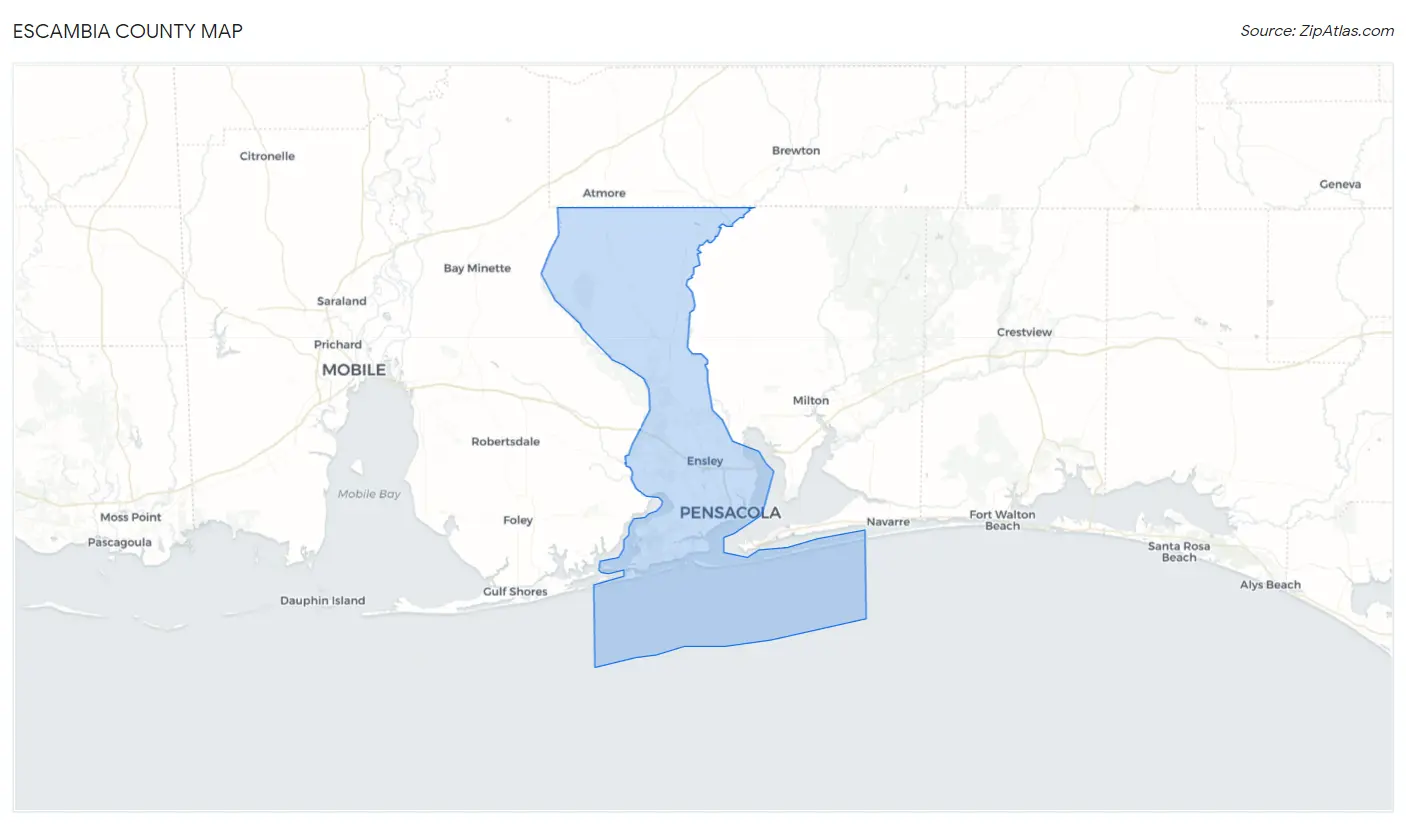
Escambia County Map
Escambia County Overview
$33,656
PER CAPITA INCOME
$74,479
AVG FAMILY INCOME
$61,642
AVG HOUSEHOLD INCOME
20.2%
WAGE / INCOME GAP [ % ]
79.8¢/ $1
WAGE / INCOME GAP [ $ ]
$10,650
FAMILY INCOME DEFICIT
0.45
INEQUALITY / GINI INDEX
321,296
TOTAL POPULATION
159,191
MALE POPULATION
162,105
FEMALE POPULATION
98.20
MALES / 100 FEMALES
101.83
FEMALES / 100 MALES
38.1
MEDIAN AGE
3.0
AVG FAMILY SIZE
2.4
AVG HOUSEHOLD SIZE
159,140
LABOR FORCE [ PEOPLE ]
60.8%
PERCENT IN LABOR FORCE
6.2%
UNEMPLOYMENT RATE
Escambia County Area Codes
Income in Escambia County
Income Overview in Escambia County
Per Capita Income in Escambia County is $33,656, while median incomes of families and households are $74,479 and $61,642 respectively.
| Characteristic | Number | Measure |
| Per Capita Income | 321,296 | $33,656 |
| Median Family Income | 77,660 | $74,479 |
| Mean Family Income | 77,660 | $97,113 |
| Median Household Income | 126,537 | $61,642 |
| Mean Household Income | 126,537 | $82,923 |
| Income Deficit | 77,660 | $10,650 |
| Wage / Income Gap (%) | 321,296 | 20.18% |
| Wage / Income Gap ($) | 321,296 | 79.82¢ per $1 |
| Gini / Inequality Index | 321,296 | 0.45 |
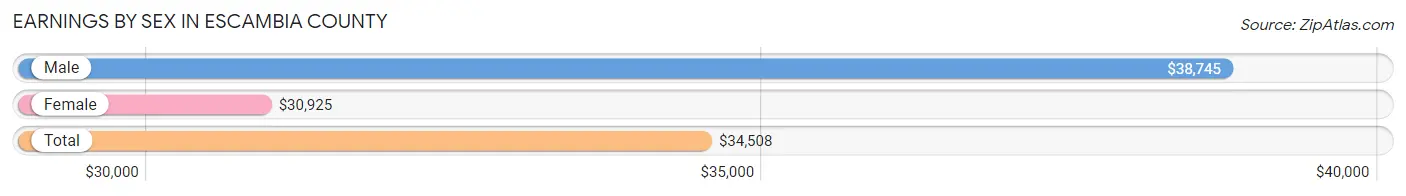
Earnings by Sex in Escambia County
Average Earnings in Escambia County are $34,508, $38,745 for men and $30,925 for women, a difference of 20.2%.
| Sex | Number | Average Earnings |
| Male | 88,178 (52.6%) | $38,745 |
| Female | 79,435 (47.4%) | $30,925 |
| Total | 167,613 (100.0%) | $34,508 |
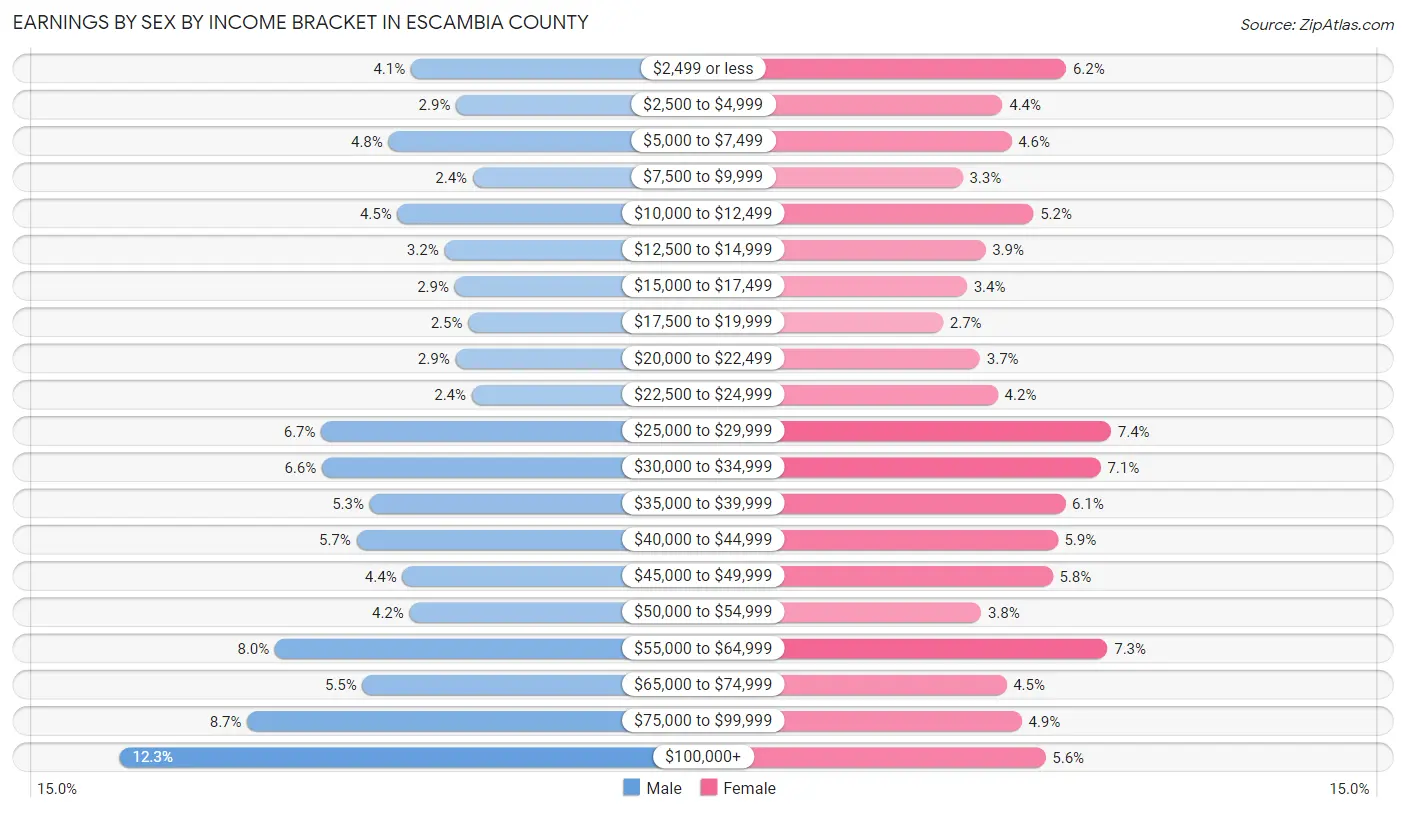
Earnings by Sex by Income Bracket in Escambia County
The most common earnings brackets in Escambia County are $100,000+ for men (10,871 | 12.3%) and $25,000 to $29,999 for women (5,893 | 7.4%).
| Income | Male | Female |
| $2,499 or less | 3,649 (4.1%) | 4,891 (6.2%) |
| $2,500 to $4,999 | 2,529 (2.9%) | 3,468 (4.4%) |
| $5,000 to $7,499 | 4,209 (4.8%) | 3,666 (4.6%) |
| $7,500 to $9,999 | 2,117 (2.4%) | 2,580 (3.3%) |
| $10,000 to $12,499 | 3,985 (4.5%) | 4,166 (5.2%) |
| $12,500 to $14,999 | 2,826 (3.2%) | 3,089 (3.9%) |
| $15,000 to $17,499 | 2,563 (2.9%) | 2,679 (3.4%) |
| $17,500 to $19,999 | 2,234 (2.5%) | 2,145 (2.7%) |
| $20,000 to $22,499 | 2,545 (2.9%) | 2,970 (3.7%) |
| $22,500 to $24,999 | 2,145 (2.4%) | 3,372 (4.2%) |
| $25,000 to $29,999 | 5,871 (6.7%) | 5,893 (7.4%) |
| $30,000 to $34,999 | 5,855 (6.6%) | 5,661 (7.1%) |
| $35,000 to $39,999 | 4,670 (5.3%) | 4,867 (6.1%) |
| $40,000 to $44,999 | 4,996 (5.7%) | 4,699 (5.9%) |
| $45,000 to $49,999 | 3,860 (4.4%) | 4,590 (5.8%) |
| $50,000 to $54,999 | 3,683 (4.2%) | 2,992 (3.8%) |
| $55,000 to $64,999 | 7,016 (8.0%) | 5,814 (7.3%) |
| $65,000 to $74,999 | 4,851 (5.5%) | 3,555 (4.5%) |
| $75,000 to $99,999 | 7,703 (8.7%) | 3,904 (4.9%) |
| $100,000+ | 10,871 (12.3%) | 4,434 (5.6%) |
| Total | 88,178 (100.0%) | 79,435 (100.0%) |
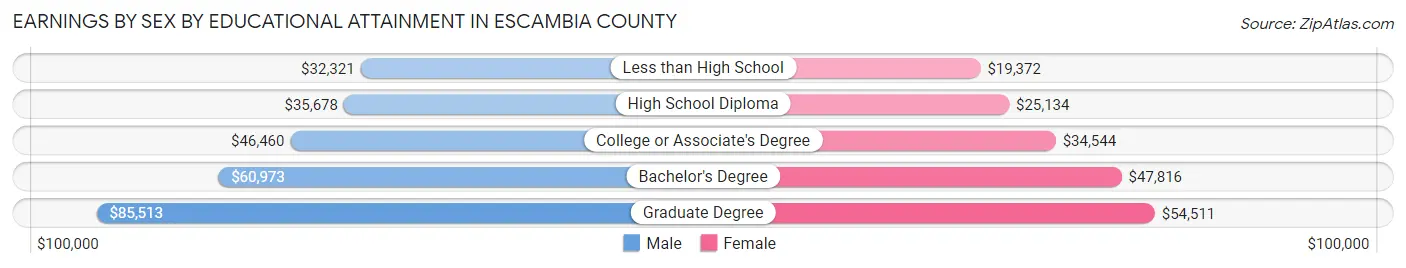
Earnings by Sex by Educational Attainment in Escambia County
Average earnings in Escambia County are $46,116 for men and $35,688 for women, a difference of 22.6%. Men with an educational attainment of graduate degree enjoy the highest average annual earnings of $85,513, while those with less than high school education earn the least with $32,321. Women with an educational attainment of graduate degree earn the most with the average annual earnings of $54,511, while those with less than high school education have the smallest earnings of $19,372.
| Educational Attainment | Male Income | Female Income |
| Less than High School | $32,321 | $19,372 |
| High School Diploma | $35,678 | $25,134 |
| College or Associate's Degree | $46,460 | $34,544 |
| Bachelor's Degree | $60,973 | $47,816 |
| Graduate Degree | $85,513 | $54,511 |
| Total | $46,116 | $35,688 |
Family Income in Escambia County
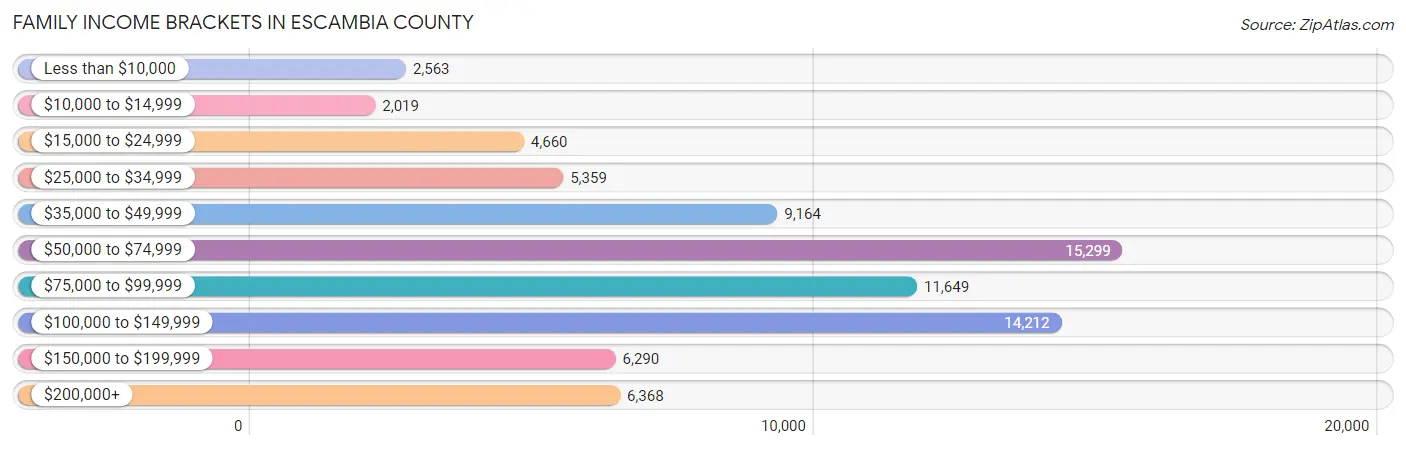
Family Income Brackets in Escambia County
According to the Escambia County family income data, there are 15,299 families falling into the $50,000 to $74,999 income range, which is the most common income bracket and makes up 19.7% of all families. Conversely, the $10,000 to $14,999 income bracket is the least frequent group with only 2,019 families (2.6%) belonging to this category.
| Income Bracket | # Families | % Families |
| Less than $10,000 | 2,563 | 3.3% |
| $10,000 to $14,999 | 2,019 | 2.6% |
| $15,000 to $24,999 | 4,660 | 6.0% |
| $25,000 to $34,999 | 5,359 | 6.9% |
| $35,000 to $49,999 | 9,164 | 11.8% |
| $50,000 to $74,999 | 15,299 | 19.7% |
| $75,000 to $99,999 | 11,649 | 15.0% |
| $100,000 to $149,999 | 14,212 | 18.3% |
| $150,000 to $199,999 | 6,290 | 8.1% |
| $200,000+ | 6,368 | 8.2% |
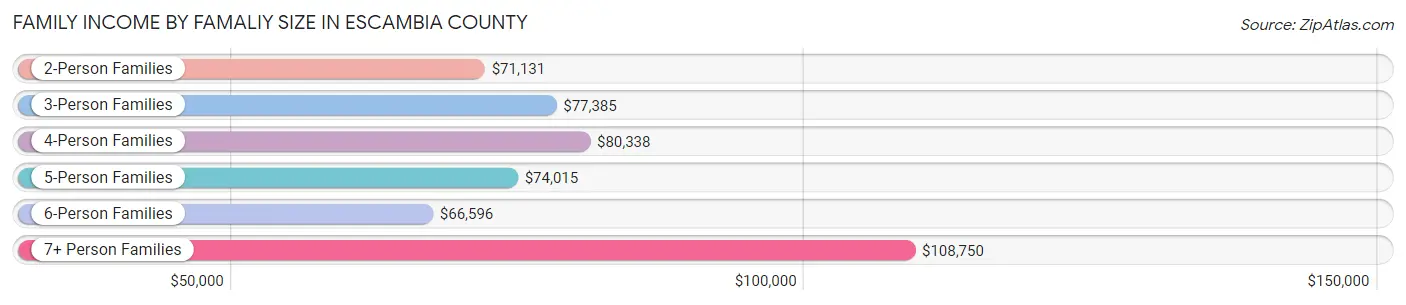
Family Income by Famaliy Size in Escambia County
7+ person families (752 | 1.0%) account for the highest median family income in Escambia County with $108,750 per family, while 2-person families (40,500 | 52.1%) have the highest median income of $35,566 per family member.
| Income Bracket | # Families | Median Income |
| 2-Person Families | 40,500 (52.1%) | $71,131 |
| 3-Person Families | 17,919 (23.1%) | $77,385 |
| 4-Person Families | 12,439 (16.0%) | $80,338 |
| 5-Person Families | 4,482 (5.8%) | $74,015 |
| 6-Person Families | 1,568 (2.0%) | $66,596 |
| 7+ Person Families | 752 (1.0%) | $108,750 |
| Total | 77,660 (100.0%) | $74,479 |
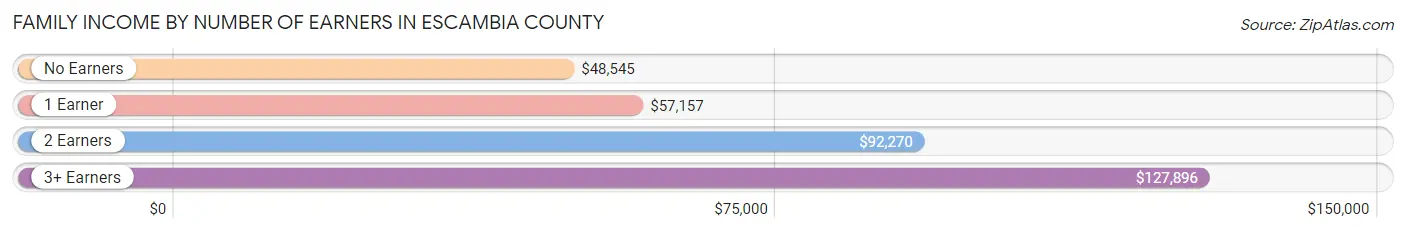
Family Income by Number of Earners in Escambia County
The median family income in Escambia County is $74,479, with families comprising 3+ earners (6,725) having the highest median family income of $127,896, while families with no earners (13,808) have the lowest median family income of $48,545, accounting for 8.7% and 17.8% of families, respectively.
| Number of Earners | # Families | Median Income |
| No Earners | 13,808 (17.8%) | $48,545 |
| 1 Earner | 27,657 (35.6%) | $57,157 |
| 2 Earners | 29,470 (38.0%) | $92,270 |
| 3+ Earners | 6,725 (8.7%) | $127,896 |
| Total | 77,660 (100.0%) | $74,479 |
Household Income in Escambia County
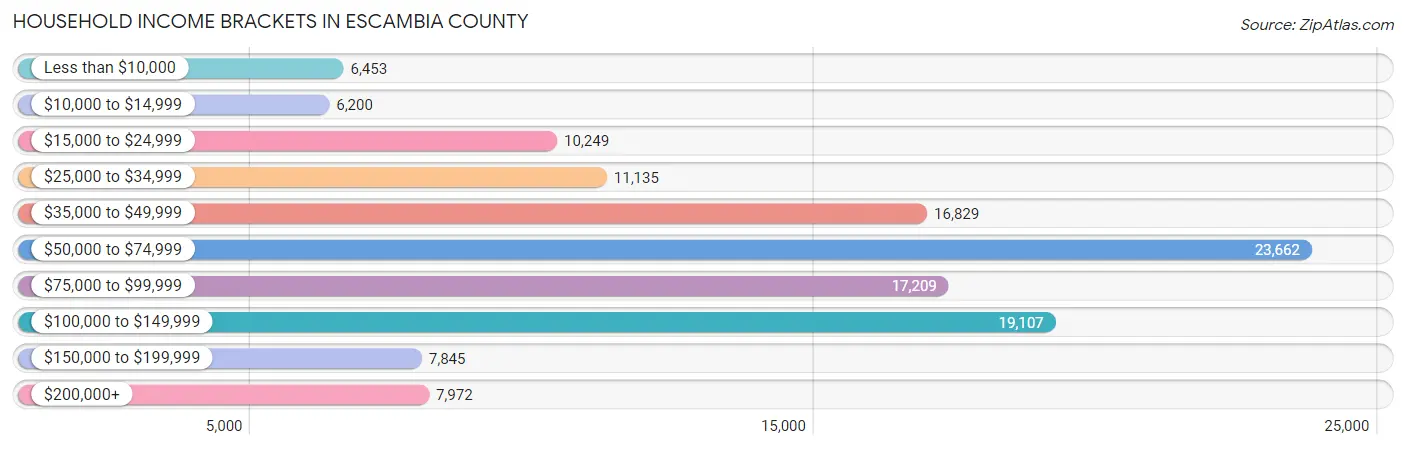
Household Income Brackets in Escambia County
With 23,662 households falling in the category, the $50,000 to $74,999 income range is the most frequent in Escambia County, accounting for 18.7% of all households. In contrast, only 6,200 households (4.9%) fall into the $10,000 to $14,999 income bracket, making it the least populous group.
| Income Bracket | # Households | % Households |
| Less than $10,000 | 6,453 | 5.1% |
| $10,000 to $14,999 | 6,200 | 4.9% |
| $15,000 to $24,999 | 10,249 | 8.1% |
| $25,000 to $34,999 | 11,135 | 8.8% |
| $35,000 to $49,999 | 16,829 | 13.3% |
| $50,000 to $74,999 | 23,662 | 18.7% |
| $75,000 to $99,999 | 17,209 | 13.6% |
| $100,000 to $149,999 | 19,107 | 15.1% |
| $150,000 to $199,999 | 7,845 | 6.2% |
| $200,000+ | 7,972 | 6.3% |
Household Income by Householder Age in Escambia County
The median household income in Escambia County is $61,642, with the highest median household income of $69,998 found in the 45 to 64 years age bracket for the primary householder. A total of 44,391 households (35.1%) fall into this category. Meanwhile, the 15 to 24 years age bracket for the primary householder has the lowest median household income of $43,450, with 5,862 households (4.6%) in this group.
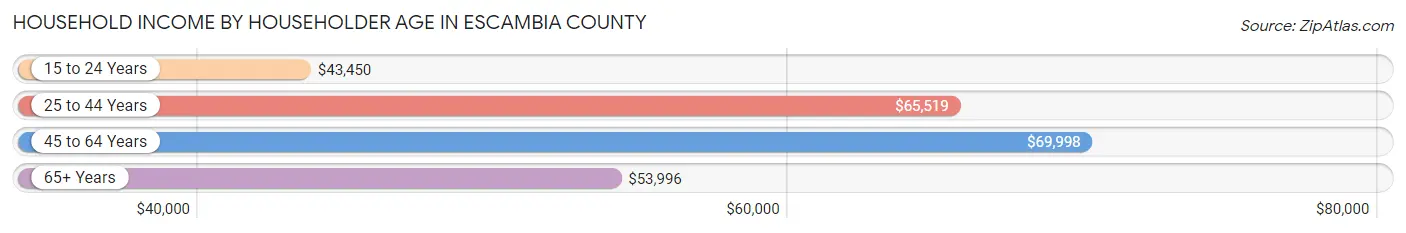
| Income Bracket | # Households | Median Income |
| 15 to 24 Years | 5,862 (4.6%) | $43,450 |
| 25 to 44 Years | 40,604 (32.1%) | $65,519 |
| 45 to 64 Years | 44,391 (35.1%) | $69,998 |
| 65+ Years | 35,680 (28.2%) | $53,996 |
| Total | 126,537 (100.0%) | $61,642 |
Poverty in Escambia County
Income Below Poverty by Sex and Age in Escambia County
With 13.5% poverty level for males and 16.2% for females among the residents of Escambia County, 15 year old males and 16 and 17 year old females are the most vulnerable to poverty, with 474 males (29.0%) and 941 females (28.9%) in their respective age groups living below the poverty level.
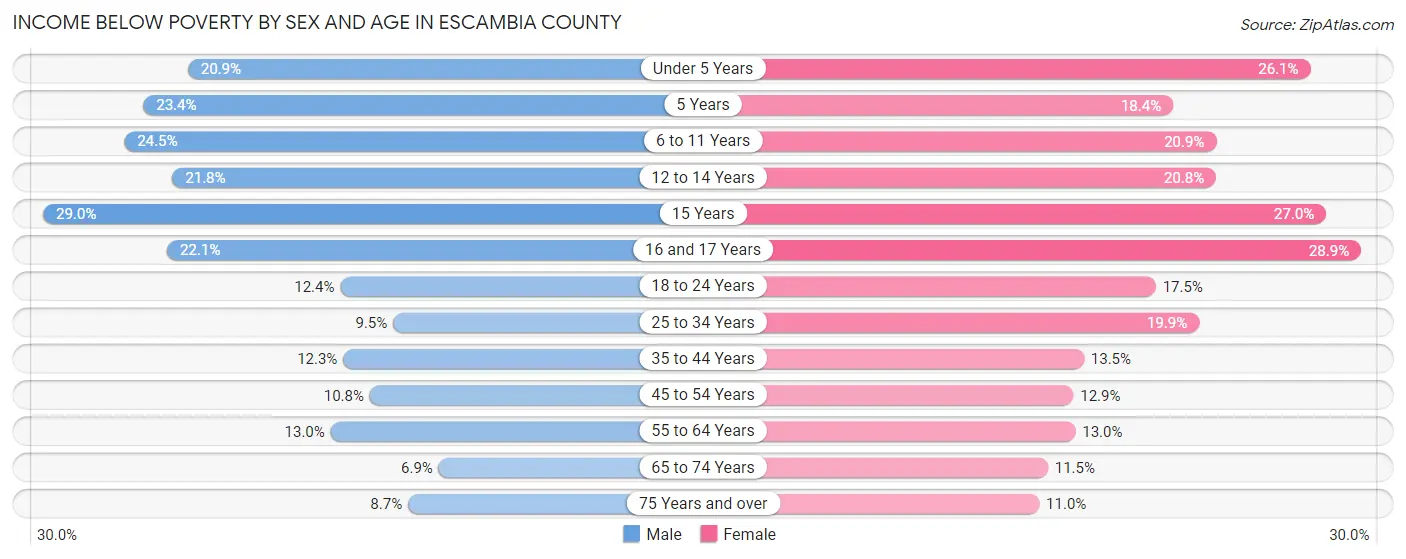
| Age Bracket | Male | Female |
| Under 5 Years | 1,946 (20.9%) | 2,309 (26.1%) |
| 5 Years | 419 (23.4%) | 268 (18.4%) |
| 6 to 11 Years | 2,942 (24.4%) | 2,178 (20.8%) |
| 12 to 14 Years | 1,058 (21.8%) | 1,155 (20.8%) |
| 15 Years | 474 (29.0%) | 528 (27.0%) |
| 16 and 17 Years | 862 (22.1%) | 941 (28.9%) |
| 18 to 24 Years | 1,702 (12.4%) | 2,048 (17.5%) |
| 25 to 34 Years | 2,103 (9.5%) | 4,473 (19.9%) |
| 35 to 44 Years | 2,138 (12.3%) | 2,446 (13.5%) |
| 45 to 54 Years | 1,830 (10.8%) | 2,333 (12.9%) |
| 55 to 64 Years | 2,631 (13.0%) | 2,904 (13.0%) |
| 65 to 74 Years | 1,023 (6.9%) | 2,026 (11.5%) |
| 75 Years and over | 762 (8.6%) | 1,375 (11.0%) |
| Total | 19,890 (13.5%) | 24,984 (16.2%) |
Income Above Poverty by Sex and Age in Escambia County
According to the poverty statistics in Escambia County, males aged 65 to 74 years and females aged 75 years and over are the age groups that are most secure financially, with 93.1% of males and 89.0% of females in these age groups living above the poverty line.
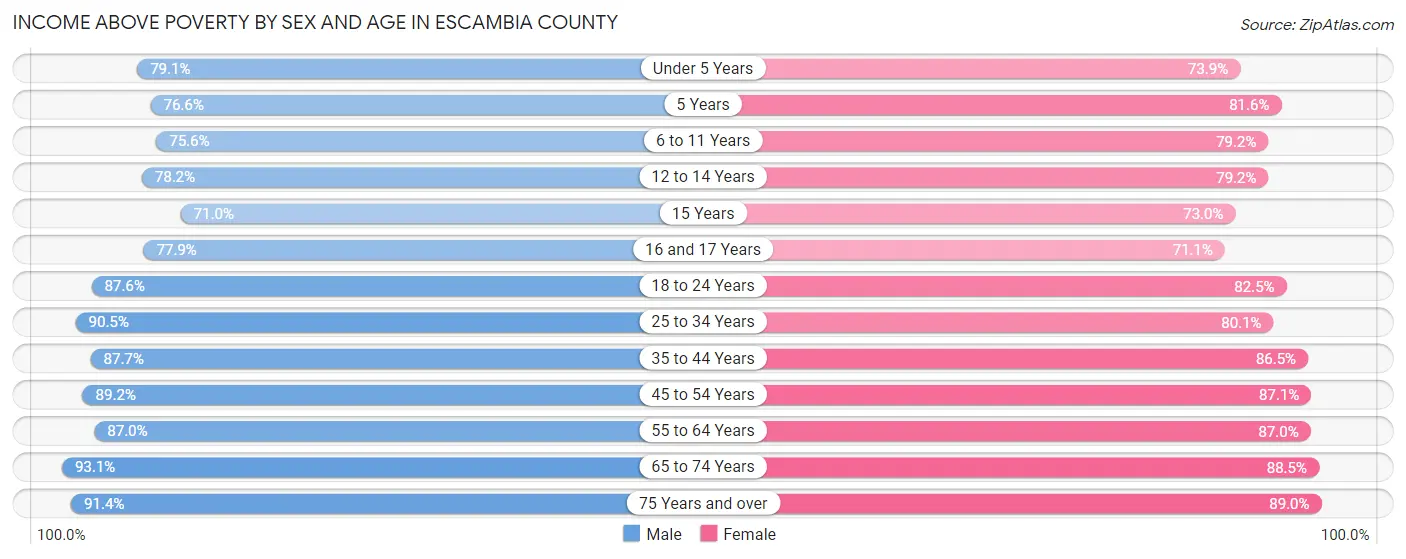
| Age Bracket | Male | Female |
| Under 5 Years | 7,360 (79.1%) | 6,540 (73.9%) |
| 5 Years | 1,372 (76.6%) | 1,185 (81.6%) |
| 6 to 11 Years | 9,092 (75.5%) | 8,266 (79.1%) |
| 12 to 14 Years | 3,802 (78.2%) | 4,386 (79.2%) |
| 15 Years | 1,162 (71.0%) | 1,430 (73.0%) |
| 16 and 17 Years | 3,043 (77.9%) | 2,314 (71.1%) |
| 18 to 24 Years | 12,006 (87.6%) | 9,671 (82.5%) |
| 25 to 34 Years | 20,081 (90.5%) | 18,020 (80.1%) |
| 35 to 44 Years | 15,307 (87.7%) | 15,703 (86.5%) |
| 45 to 54 Years | 15,140 (89.2%) | 15,771 (87.1%) |
| 55 to 64 Years | 17,664 (87.0%) | 19,432 (87.0%) |
| 65 to 74 Years | 13,708 (93.1%) | 15,638 (88.5%) |
| 75 Years and over | 8,050 (91.3%) | 11,142 (89.0%) |
| Total | 127,787 (86.5%) | 129,498 (83.8%) |
Income Below Poverty Among Married-Couple Families in Escambia County
The poverty statistics for married-couple families in Escambia County show that 5.2% or 2,706 of the total 52,456 families live below the poverty line. Families with 3 or 4 children have the highest poverty rate of 23.1%, comprising of 686 families. On the other hand, families with no children have the lowest poverty rate of 3.9%, which includes 1,314 families.
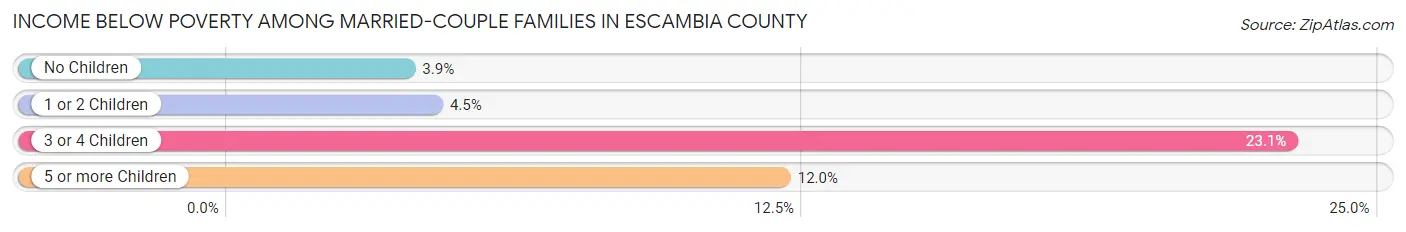
| Children | Above Poverty | Below Poverty |
| No Children | 32,749 (96.1%) | 1,314 (3.9%) |
| 1 or 2 Children | 14,501 (95.5%) | 677 (4.5%) |
| 3 or 4 Children | 2,288 (76.9%) | 686 (23.1%) |
| 5 or more Children | 212 (88.0%) | 29 (12.0%) |
| Total | 49,750 (94.8%) | 2,706 (5.2%) |
Income Below Poverty Among Single-Parent Households in Escambia County
According to the poverty data in Escambia County, 17.2% or 981 single-father households and 24.6% or 4,788 single-mother households are living below the poverty line. Among single-father households, those with 5 or more children have the highest poverty rate, with 23 households (100.0%) experiencing poverty. Likewise, among single-mother households, those with 5 or more children have the highest poverty rate, with 103 households (77.4%) falling below the poverty line.
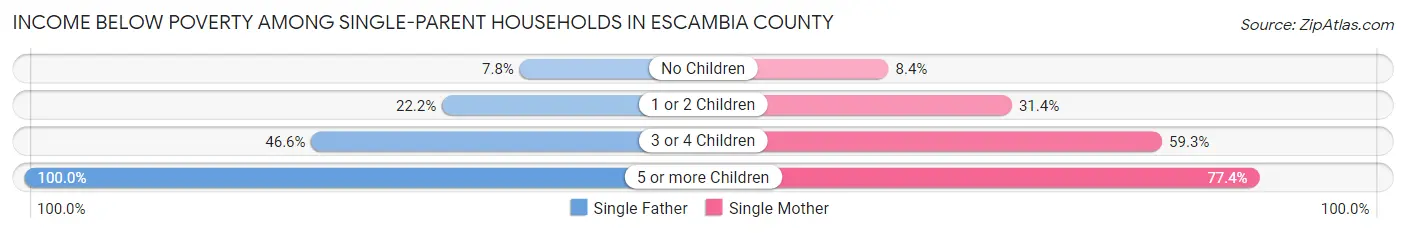
| Children | Single Father | Single Mother |
| No Children | 224 (7.8%) | 685 (8.4%) |
| 1 or 2 Children | 529 (22.2%) | 2,940 (31.4%) |
| 3 or 4 Children | 205 (46.6%) | 1,060 (59.3%) |
| 5 or more Children | 23 (100.0%) | 103 (77.4%) |
| Total | 981 (17.2%) | 4,788 (24.6%) |
Income Below Poverty Among Married-Couple vs Single-Parent Households in Escambia County
The poverty data for Escambia County shows that 2,706 of the married-couple family households (5.2%) and 5,769 of the single-parent households (22.9%) are living below the poverty level. Within the married-couple family households, those with 3 or 4 children have the highest poverty rate, with 686 households (23.1%) falling below the poverty line. Among the single-parent households, those with 5 or more children have the highest poverty rate, with 126 household (80.8%) living below poverty.
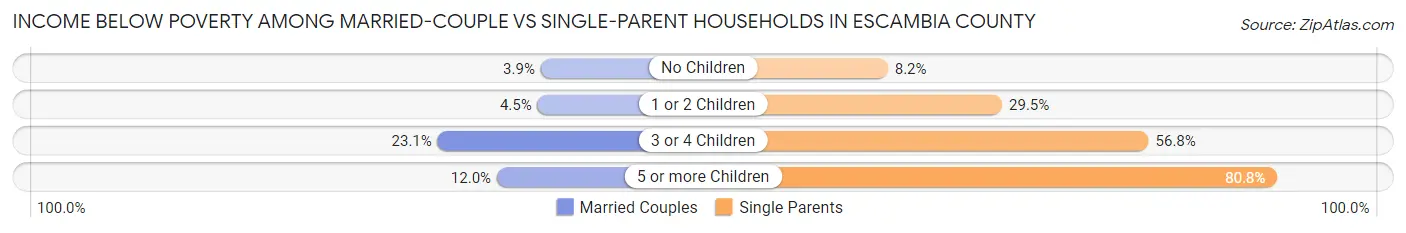
| Children | Married-Couple Families | Single-Parent Households |
| No Children | 1,314 (3.9%) | 909 (8.2%) |
| 1 or 2 Children | 677 (4.5%) | 3,469 (29.5%) |
| 3 or 4 Children | 686 (23.1%) | 1,265 (56.8%) |
| 5 or more Children | 29 (12.0%) | 126 (80.8%) |
| Total | 2,706 (5.2%) | 5,769 (22.9%) |
Race in Escambia County
The most populous races in Escambia County are White / Caucasian (209,744 | 65.3%), Black / African American (69,606 | 21.7%), and Two or more Races (25,048 | 7.8%).
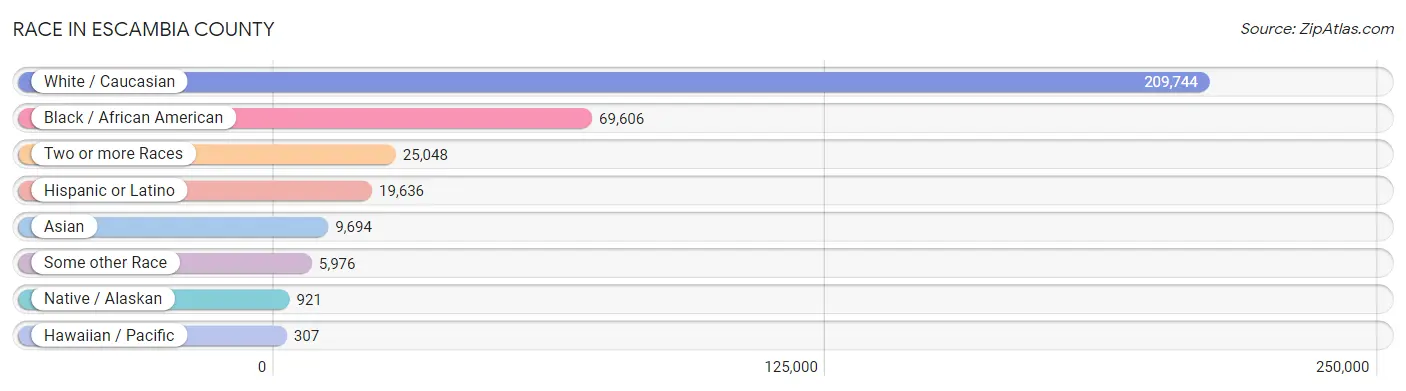
| Race | # Population | % Population |
| Asian | 9,694 | 3.0% |
| Black / African American | 69,606 | 21.7% |
| Hawaiian / Pacific | 307 | 0.1% |
| Hispanic or Latino | 19,636 | 6.1% |
| Native / Alaskan | 921 | 0.3% |
| White / Caucasian | 209,744 | 65.3% |
| Two or more Races | 25,048 | 7.8% |
| Some other Race | 5,976 | 1.9% |
| Total | 321,296 | 100.0% |
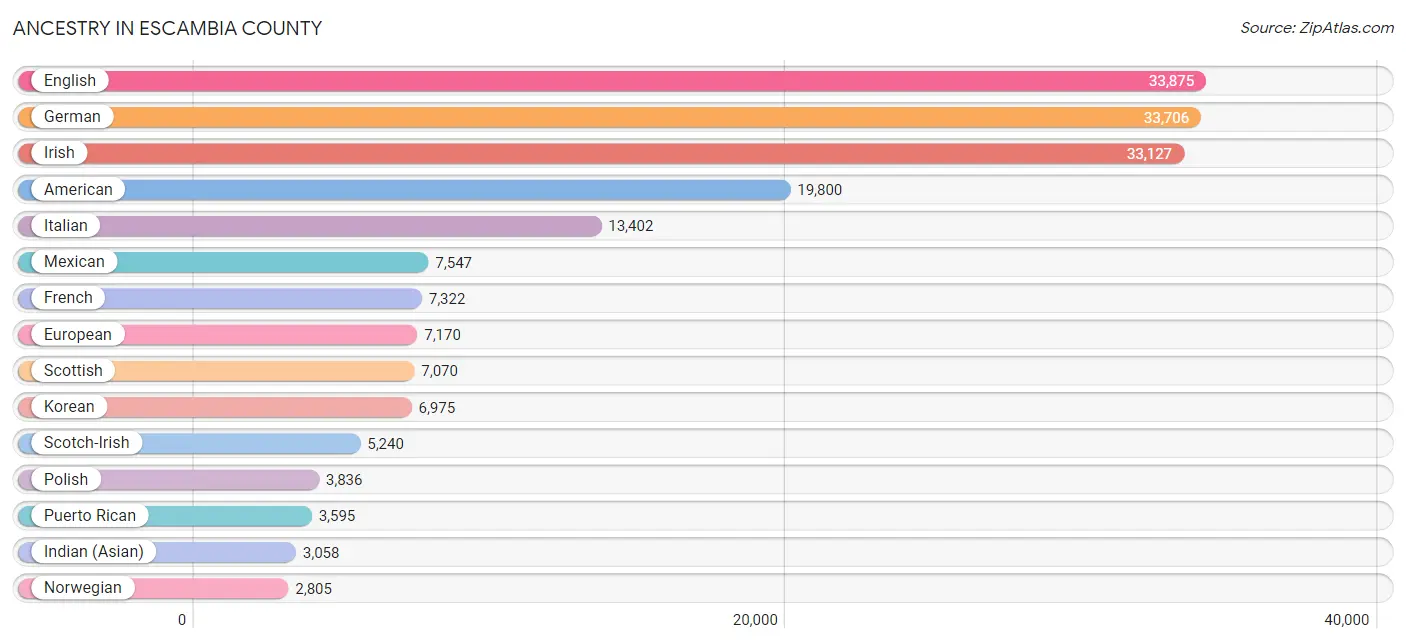
Ancestry in Escambia County
The most populous ancestries reported in Escambia County are English (33,875 | 10.5%), German (33,706 | 10.5%), Irish (33,127 | 10.3%), American (19,800 | 6.2%), and Italian (13,402 | 4.2%), together accounting for 41.7% of all Escambia County residents.
| Ancestry | # Population | % Population |
| African | 2,324 | 0.7% |
| Albanian | 105 | 0.0% |
| American | 19,800 | 6.2% |
| Apache | 78 | 0.0% |
| Arab | 984 | 0.3% |
| Arapaho | 9 | 0.0% |
| Argentinean | 82 | 0.0% |
| Armenian | 183 | 0.1% |
| Australian | 71 | 0.0% |
| Austrian | 604 | 0.2% |
| Bahamian | 34 | 0.0% |
| Bangladeshi | 56 | 0.0% |
| Barbadian | 101 | 0.0% |
| Belgian | 242 | 0.1% |
| Belizean | 33 | 0.0% |
| Bhutanese | 1,445 | 0.4% |
| Blackfeet | 353 | 0.1% |
| Bolivian | 8 | 0.0% |
| Brazilian | 440 | 0.1% |
| British | 1,675 | 0.5% |
| British West Indian | 13 | 0.0% |
| Bulgarian | 4 | 0.0% |
| Burmese | 787 | 0.2% |
| Cajun | 206 | 0.1% |
| Cambodian | 10 | 0.0% |
| Canadian | 518 | 0.2% |
| Cape Verdean | 25 | 0.0% |
| Carpatho Rusyn | 9 | 0.0% |
| Celtic | 54 | 0.0% |
| Central American | 2,183 | 0.7% |
| Central American Indian | 139 | 0.0% |
| Cherokee | 1,768 | 0.5% |
| Cheyenne | 13 | 0.0% |
| Chickasaw | 46 | 0.0% |
| Chilean | 227 | 0.1% |
| Chinese | 18 | 0.0% |
| Chippewa | 26 | 0.0% |
| Choctaw | 220 | 0.1% |
| Colombian | 527 | 0.2% |
| Comanche | 12 | 0.0% |
| Costa Rican | 150 | 0.1% |
| Cree | 84 | 0.0% |
| Creek | 1,176 | 0.4% |
| Croatian | 147 | 0.1% |
| Cuban | 1,445 | 0.4% |
| Czech | 541 | 0.2% |
| Czechoslovakian | 151 | 0.1% |
| Danish | 860 | 0.3% |
| Delaware | 2 | 0.0% |
| Dominican | 325 | 0.1% |
| Dutch | 2,519 | 0.8% |
| Dutch West Indian | 34 | 0.0% |
| Eastern European | 404 | 0.1% |
| Ecuadorian | 106 | 0.0% |
| Egyptian | 68 | 0.0% |
| English | 33,875 | 10.5% |
| Estonian | 18 | 0.0% |
| European | 7,170 | 2.2% |
| Filipino | 47 | 0.0% |
| Finnish | 301 | 0.1% |
| French | 7,322 | 2.3% |
| French American Indian | 72 | 0.0% |
| French Canadian | 1,418 | 0.4% |
| German | 33,706 | 10.5% |
| German Russian | 29 | 0.0% |
| Ghanaian | 33 | 0.0% |
| Greek | 1,287 | 0.4% |
| Guamanian / Chamorro | 327 | 0.1% |
| Guatemalan | 377 | 0.1% |
| Guyanese | 39 | 0.0% |
| Haitian | 614 | 0.2% |
| Honduran | 707 | 0.2% |
| Houma | 14 | 0.0% |
| Hungarian | 970 | 0.3% |
| Icelander | 37 | 0.0% |
| Indian (Asian) | 3,058 | 0.9% |
| Indonesian | 137 | 0.0% |
| Iranian | 77 | 0.0% |
| Irish | 33,127 | 10.3% |
| Iroquois | 136 | 0.0% |
| Israeli | 50 | 0.0% |
| Italian | 13,402 | 4.2% |
| Jamaican | 742 | 0.2% |
| Japanese | 252 | 0.1% |
| Jordanian | 35 | 0.0% |
| Kenyan | 60 | 0.0% |
| Kiowa | 12 | 0.0% |
| Korean | 6,975 | 2.2% |
| Laotian | 122 | 0.0% |
| Latvian | 48 | 0.0% |
| Lebanese | 329 | 0.1% |
| Lithuanian | 282 | 0.1% |
| Luxembourger | 33 | 0.0% |
| Macedonian | 30 | 0.0% |
| Malaysian | 84 | 0.0% |
| Maltese | 162 | 0.1% |
| Mexican | 7,547 | 2.4% |
| Mexican American Indian | 86 | 0.0% |
| Mongolian | 16 | 0.0% |
| Moroccan | 21 | 0.0% |
| Native Hawaiian | 480 | 0.2% |
| Navajo | 85 | 0.0% |
| Nepalese | 10 | 0.0% |
| Nicaraguan | 150 | 0.1% |
| Nigerian | 106 | 0.0% |
| Northern European | 387 | 0.1% |
| Norwegian | 2,805 | 0.9% |
| Osage | 57 | 0.0% |
| Paiute | 74 | 0.0% |
| Pakistani | 134 | 0.0% |
| Palestinian | 3 | 0.0% |
| Panamanian | 273 | 0.1% |
| Paraguayan | 22 | 0.0% |
| Pennsylvania German | 64 | 0.0% |
| Peruvian | 179 | 0.1% |
| Polish | 3,836 | 1.2% |
| Portuguese | 798 | 0.3% |
| Potawatomi | 10 | 0.0% |
| Pueblo | 33 | 0.0% |
| Puerto Rican | 3,595 | 1.1% |
| Romanian | 601 | 0.2% |
| Russian | 1,347 | 0.4% |
| Salvadoran | 520 | 0.2% |
| Samoan | 365 | 0.1% |
| Scandinavian | 1,277 | 0.4% |
| Scotch-Irish | 5,240 | 1.6% |
| Scottish | 7,070 | 2.2% |
| Seminole | 117 | 0.0% |
| Senegalese | 110 | 0.0% |
| Serbian | 31 | 0.0% |
| Sioux | 54 | 0.0% |
| Slavic | 118 | 0.0% |
| Slovak | 405 | 0.1% |
| Slovene | 32 | 0.0% |
| South African | 18 | 0.0% |
| South American | 1,504 | 0.5% |
| South American Indian | 83 | 0.0% |
| Spaniard | 1,515 | 0.5% |
| Spanish | 513 | 0.2% |
| Spanish American | 20 | 0.0% |
| Sri Lankan | 2,158 | 0.7% |
| Subsaharan African | 2,785 | 0.9% |
| Swedish | 2,130 | 0.7% |
| Swiss | 537 | 0.2% |
| Syrian | 198 | 0.1% |
| Thai | 665 | 0.2% |
| Trinidadian and Tobagonian | 42 | 0.0% |
| Turkish | 99 | 0.0% |
| U.S. Virgin Islander | 12 | 0.0% |
| Ukrainian | 425 | 0.1% |
| Uruguayan | 29 | 0.0% |
| Venezuelan | 324 | 0.1% |
| Vietnamese | 48 | 0.0% |
| Welsh | 2,499 | 0.8% |
| West Indian | 39 | 0.0% |
| Yaqui | 11 | 0.0% |
| Yugoslavian | 101 | 0.0% |
| Zimbabwean | 8 | 0.0% | View All 158 Rows |
Immigrants in Escambia County
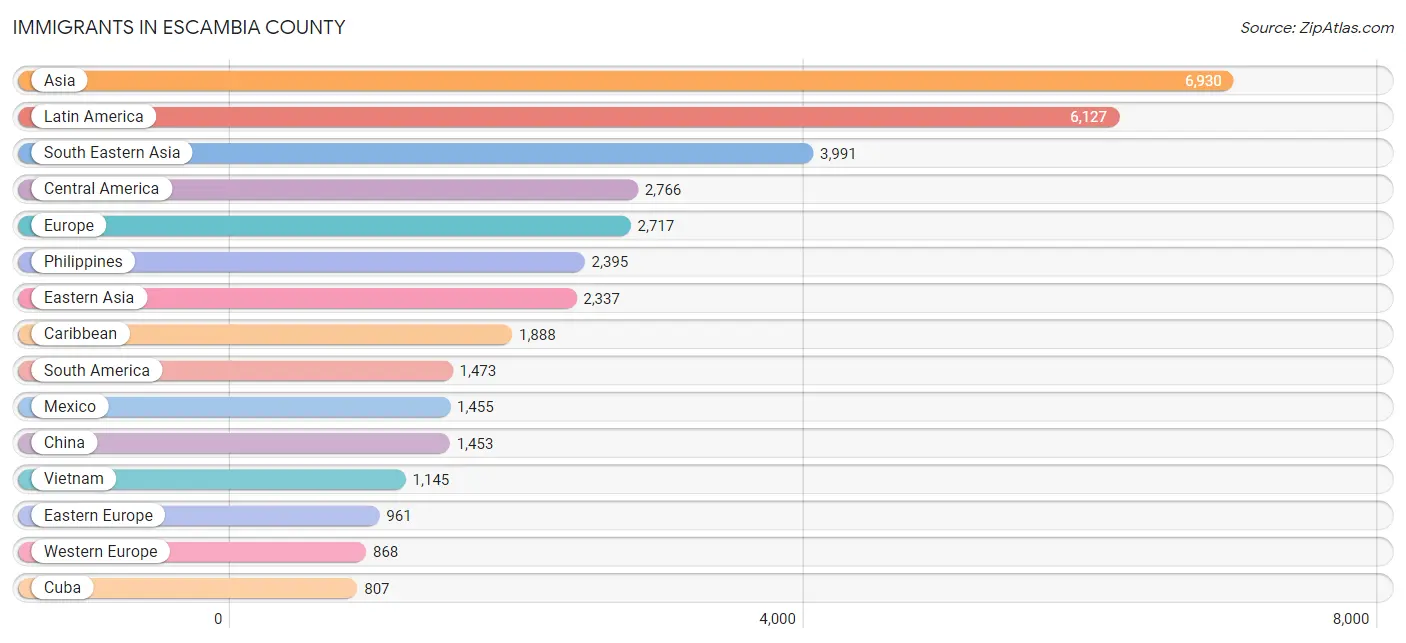
The most numerous immigrant groups reported in Escambia County came from Asia (6,930 | 2.2%), Latin America (6,127 | 1.9%), South Eastern Asia (3,991 | 1.2%), Central America (2,766 | 0.9%), and Europe (2,717 | 0.9%), together accounting for 7.0% of all Escambia County residents.
| Immigration Origin | # Population | % Population |
| Africa | 687 | 0.2% |
| Albania | 42 | 0.0% |
| Argentina | 91 | 0.0% |
| Asia | 6,930 | 2.2% |
| Australia | 47 | 0.0% |
| Austria | 192 | 0.1% |
| Bahamas | 44 | 0.0% |
| Bangladesh | 34 | 0.0% |
| Barbados | 27 | 0.0% |
| Belgium | 7 | 0.0% |
| Belize | 20 | 0.0% |
| Bolivia | 10 | 0.0% |
| Brazil | 480 | 0.2% |
| Cabo Verde | 13 | 0.0% |
| Cambodia | 173 | 0.1% |
| Cameroon | 7 | 0.0% |
| Canada | 421 | 0.1% |
| Caribbean | 1,888 | 0.6% |
| Central America | 2,766 | 0.9% |
| Chile | 122 | 0.0% |
| China | 1,453 | 0.4% |
| Colombia | 206 | 0.1% |
| Costa Rica | 257 | 0.1% |
| Cuba | 807 | 0.3% |
| Czechoslovakia | 6 | 0.0% |
| Dominican Republic | 37 | 0.0% |
| Eastern Africa | 101 | 0.0% |
| Eastern Asia | 2,337 | 0.7% |
| Eastern Europe | 961 | 0.3% |
| Ecuador | 47 | 0.0% |
| Egypt | 16 | 0.0% |
| El Salvador | 105 | 0.0% |
| England | 272 | 0.1% |
| Ethiopia | 21 | 0.0% |
| Europe | 2,717 | 0.9% |
| France | 160 | 0.1% |
| Germany | 500 | 0.2% |
| Ghana | 33 | 0.0% |
| Greece | 21 | 0.0% |
| Guatemala | 209 | 0.1% |
| Guyana | 88 | 0.0% |
| Haiti | 318 | 0.1% |
| Honduras | 583 | 0.2% |
| Hong Kong | 54 | 0.0% |
| Hungary | 12 | 0.0% |
| India | 176 | 0.1% |
| Indonesia | 55 | 0.0% |
| Iran | 64 | 0.0% |
| Ireland | 20 | 0.0% |
| Israel | 3 | 0.0% |
| Italy | 48 | 0.0% |
| Jamaica | 515 | 0.2% |
| Japan | 510 | 0.2% |
| Kazakhstan | 57 | 0.0% |
| Kenya | 76 | 0.0% |
| Korea | 374 | 0.1% |
| Kuwait | 13 | 0.0% |
| Laos | 28 | 0.0% |
| Latin America | 6,127 | 1.9% |
| Liberia | 11 | 0.0% |
| Lithuania | 28 | 0.0% |
| Malaysia | 3 | 0.0% |
| Mexico | 1,455 | 0.4% |
| Middle Africa | 7 | 0.0% |
| Moldova | 383 | 0.1% |
| Morocco | 119 | 0.0% |
| Nepal | 7 | 0.0% |
| Netherlands | 9 | 0.0% |
| Nicaragua | 2 | 0.0% |
| Nigeria | 55 | 0.0% |
| North Macedonia | 21 | 0.0% |
| Northern Africa | 328 | 0.1% |
| Northern Europe | 743 | 0.2% |
| Norway | 21 | 0.0% |
| Oceania | 160 | 0.1% |
| Pakistan | 47 | 0.0% |
| Panama | 135 | 0.0% |
| Peru | 122 | 0.0% |
| Philippines | 2,395 | 0.7% |
| Poland | 91 | 0.0% |
| Portugal | 9 | 0.0% |
| Romania | 24 | 0.0% |
| Russia | 193 | 0.1% |
| Saudi Arabia | 65 | 0.0% |
| Scotland | 140 | 0.0% |
| Senegal | 60 | 0.0% |
| Serbia | 12 | 0.0% |
| Singapore | 16 | 0.0% |
| South Africa | 39 | 0.0% |
| South America | 1,473 | 0.5% |
| South Central Asia | 434 | 0.1% |
| South Eastern Asia | 3,991 | 1.2% |
| Southern Europe | 145 | 0.1% |
| Spain | 67 | 0.0% |
| Sri Lanka | 49 | 0.0% |
| Sweden | 15 | 0.0% |
| Taiwan | 121 | 0.0% |
| Thailand | 88 | 0.0% |
| Trinidad and Tobago | 120 | 0.0% |
| Turkey | 44 | 0.0% |
| Ukraine | 144 | 0.0% |
| Uruguay | 29 | 0.0% |
| Venezuela | 274 | 0.1% |
| Vietnam | 1,145 | 0.4% |
| Western Africa | 212 | 0.1% |
| Western Asia | 168 | 0.1% |
| Western Europe | 868 | 0.3% |
| Zimbabwe | 4 | 0.0% | View All 108 Rows |
Sex and Age in Escambia County
Sex and Age in Escambia County
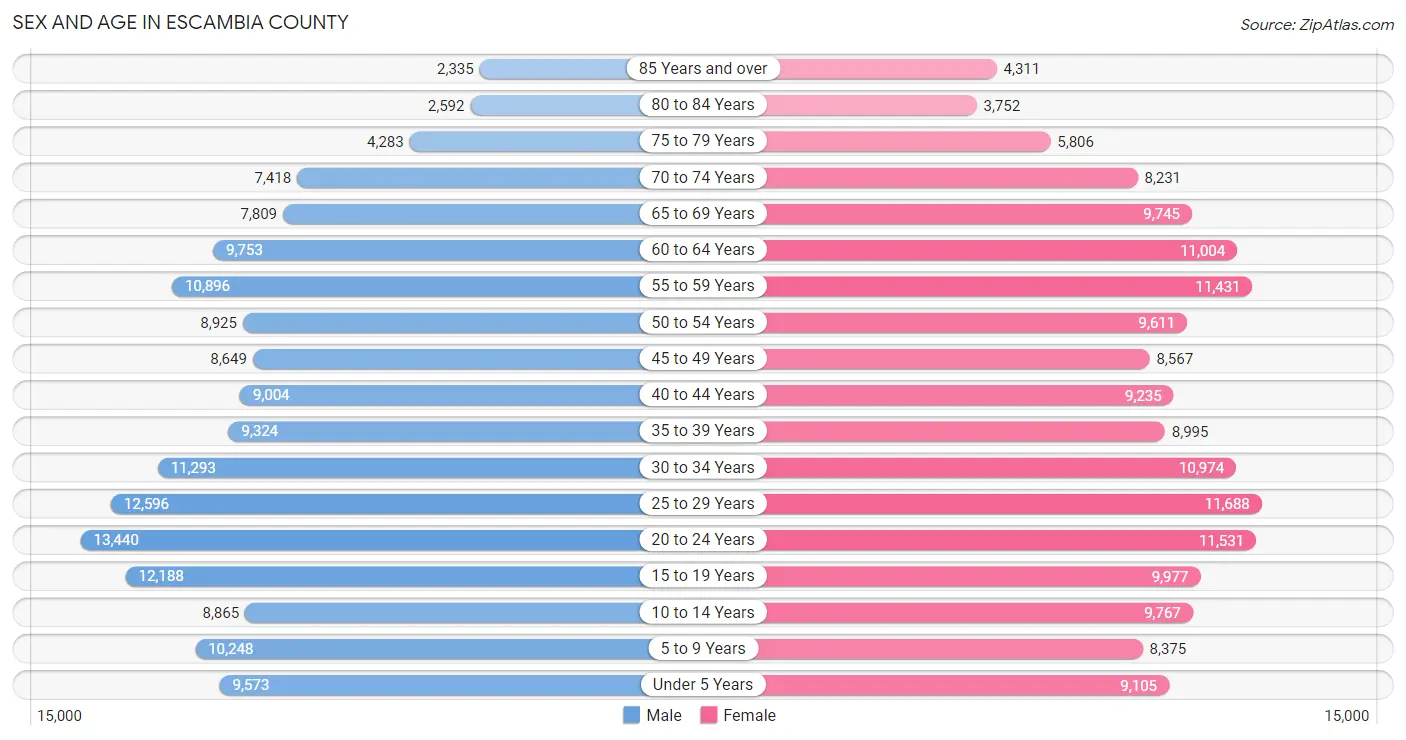
The most populous age groups in Escambia County are 20 to 24 Years (13,440 | 8.4%) for men and 25 to 29 Years (11,688 | 7.2%) for women.
| Age Bracket | Male | Female |
| Under 5 Years | 9,573 (6.0%) | 9,105 (5.6%) |
| 5 to 9 Years | 10,248 (6.4%) | 8,375 (5.2%) |
| 10 to 14 Years | 8,865 (5.6%) | 9,767 (6.0%) |
| 15 to 19 Years | 12,188 (7.7%) | 9,977 (6.1%) |
| 20 to 24 Years | 13,440 (8.4%) | 11,531 (7.1%) |
| 25 to 29 Years | 12,596 (7.9%) | 11,688 (7.2%) |
| 30 to 34 Years | 11,293 (7.1%) | 10,974 (6.8%) |
| 35 to 39 Years | 9,324 (5.9%) | 8,995 (5.6%) |
| 40 to 44 Years | 9,004 (5.7%) | 9,235 (5.7%) |
| 45 to 49 Years | 8,649 (5.4%) | 8,567 (5.3%) |
| 50 to 54 Years | 8,925 (5.6%) | 9,611 (5.9%) |
| 55 to 59 Years | 10,896 (6.8%) | 11,431 (7.0%) |
| 60 to 64 Years | 9,753 (6.1%) | 11,004 (6.8%) |
| 65 to 69 Years | 7,809 (4.9%) | 9,745 (6.0%) |
| 70 to 74 Years | 7,418 (4.7%) | 8,231 (5.1%) |
| 75 to 79 Years | 4,283 (2.7%) | 5,806 (3.6%) |
| 80 to 84 Years | 2,592 (1.6%) | 3,752 (2.3%) |
| 85 Years and over | 2,335 (1.5%) | 4,311 (2.7%) |
| Total | 159,191 (100.0%) | 162,105 (100.0%) |
Families and Households in Escambia County
Median Family Size in Escambia County
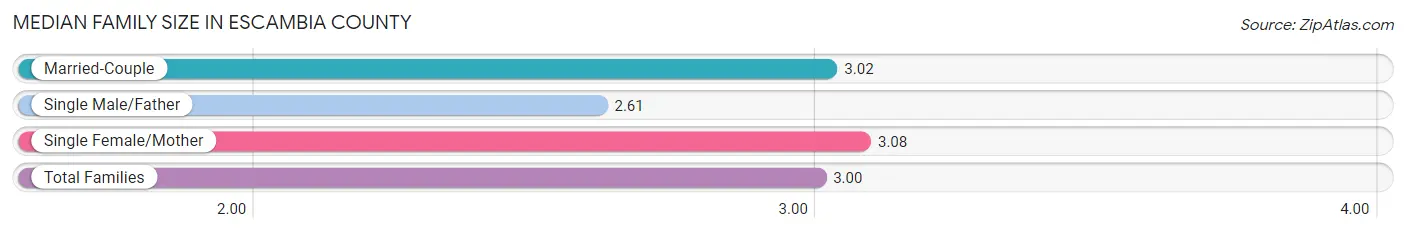
The median family size in Escambia County is 3.00 persons per family, with single female/mother families (19,483 | 25.1%) accounting for the largest median family size of 3.08 persons per family. On the other hand, single male/father families (5,721 | 7.4%) represent the smallest median family size with 2.61 persons per family.
| Family Type | # Families | Family Size |
| Married-Couple | 52,456 (67.5%) | 3.02 |
| Single Male/Father | 5,721 (7.4%) | 2.61 |
| Single Female/Mother | 19,483 (25.1%) | 3.08 |
| Total Families | 77,660 (100.0%) | 3.00 |
Median Household Size in Escambia County
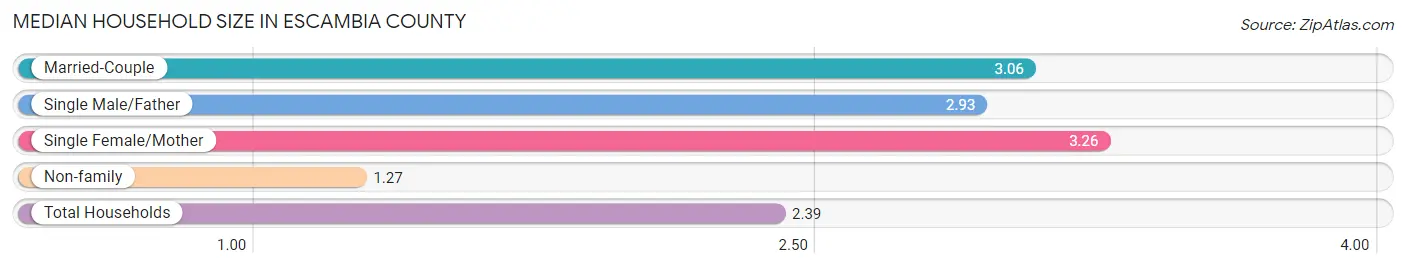
The median household size in Escambia County is 2.39 persons per household, with single female/mother households (19,483 | 15.4%) accounting for the largest median household size of 3.26 persons per household. non-family households (48,877 | 38.6%) represent the smallest median household size with 1.27 persons per household.
| Household Type | # Households | Household Size |
| Married-Couple | 52,456 (41.5%) | 3.06 |
| Single Male/Father | 5,721 (4.5%) | 2.93 |
| Single Female/Mother | 19,483 (15.4%) | 3.26 |
| Non-family | 48,877 (38.6%) | 1.27 |
| Total Households | 126,537 (100.0%) | 2.39 |
Household Size by Marriage Status in Escambia County
Out of a total of 126,537 households in Escambia County, 77,660 (61.4%) are family households, while 48,877 (38.6%) are nonfamily households. The most numerous type of family households are 2-person households, comprising 37,992, and the most common type of nonfamily households are 1-person households, comprising 38,658.
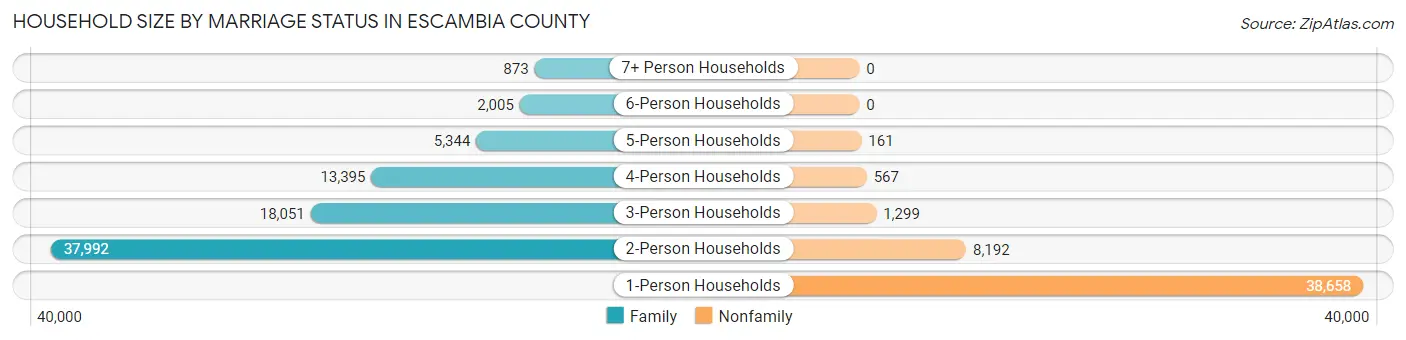
| Household Size | Family Households | Nonfamily Households |
| 1-Person Households | - | 38,658 (30.5%) |
| 2-Person Households | 37,992 (30.0%) | 8,192 (6.5%) |
| 3-Person Households | 18,051 (14.3%) | 1,299 (1.0%) |
| 4-Person Households | 13,395 (10.6%) | 567 (0.4%) |
| 5-Person Households | 5,344 (4.2%) | 161 (0.1%) |
| 6-Person Households | 2,005 (1.6%) | 0 (0.0%) |
| 7+ Person Households | 873 (0.7%) | 0 (0.0%) |
| Total | 77,660 (61.4%) | 48,877 (38.6%) |
Female Fertility in Escambia County
Fertility by Age in Escambia County
Average fertility rate in Escambia County is 53.0 births per 1,000 women. Women in the age bracket of 20 to 34 years have the highest fertility rate with 87.0 births per 1,000 women. Women in the age bracket of 20 to 34 years acount for 77.0% of all women with births.
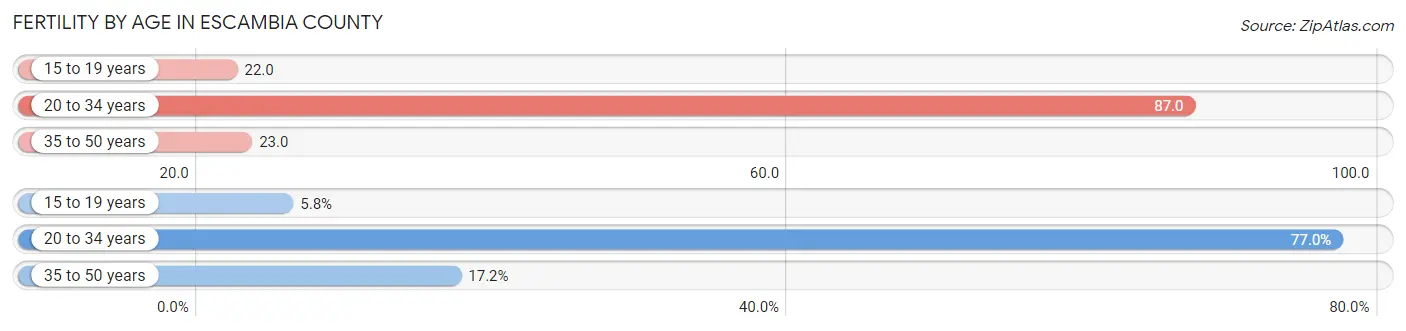
| Age Bracket | Women with Births | Births / 1,000 Women |
| 15 to 19 years | 224 (5.8%) | 22.0 |
| 20 to 34 years | 2,979 (77.0%) | 87.0 |
| 35 to 50 years | 665 (17.2%) | 23.0 |
| Total | 3,868 (100.0%) | 53.0 |
Fertility by Age by Marriage Status in Escambia County
58.6% of women with births (3,868) in Escambia County are married. The highest percentage of unmarried women with births falls into 15 to 19 years age bracket with 96.9% of them unmarried at the time of birth, while the lowest percentage of unmarried women with births belong to 35 to 50 years age bracket with 23.2% of them unmarried.
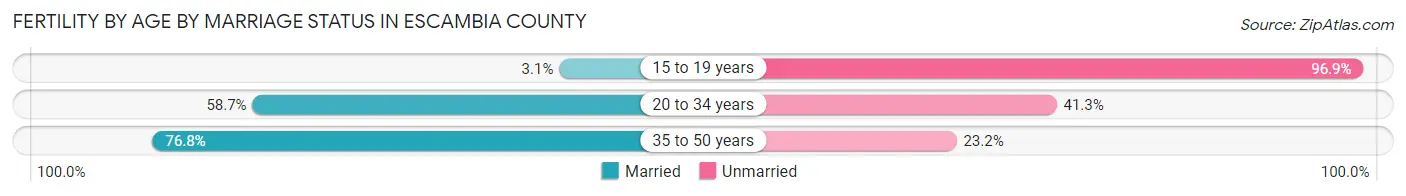
| Age Bracket | Married | Unmarried |
| 15 to 19 years | 7 (3.1%) | 217 (96.9%) |
| 20 to 34 years | 1,749 (58.7%) | 1,230 (41.3%) |
| 35 to 50 years | 511 (76.8%) | 154 (23.2%) |
| Total | 2,267 (58.6%) | 1,601 (41.4%) |
Fertility by Education in Escambia County
Average fertility rate in Escambia County is 53.0 births per 1,000 women. Women with the education attainment of bachelor's degree have the highest fertility rate of 73.0 births per 1,000 women, while women with the education attainment of less than high school have the lowest fertility at 41.0 births per 1,000 women. Women with the education attainment of college or associate's degree represent 30.3% of all women with births.
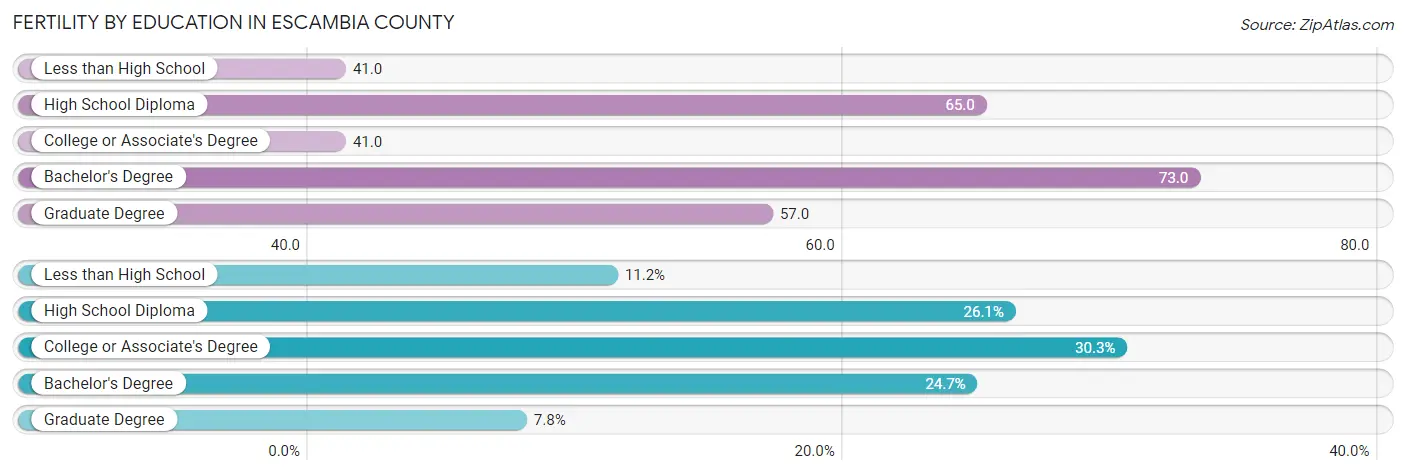
| Educational Attainment | Women with Births | Births / 1,000 Women |
| Less than High School | 433 (11.2%) | 41.0 |
| High School Diploma | 1,009 (26.1%) | 65.0 |
| College or Associate's Degree | 1,171 (30.3%) | 41.0 |
| Bachelor's Degree | 954 (24.7%) | 73.0 |
| Graduate Degree | 301 (7.8%) | 57.0 |
| Total | 3,868 (100.0%) | 53.0 |
Fertility by Education by Marriage Status in Escambia County
41.4% of women with births in Escambia County are unmarried. Women with the educational attainment of bachelor's degree are most likely to be married with 88.2% of them married at childbirth, while women with the educational attainment of high school diploma are least likely to be married with 64.5% of them unmarried at childbirth.
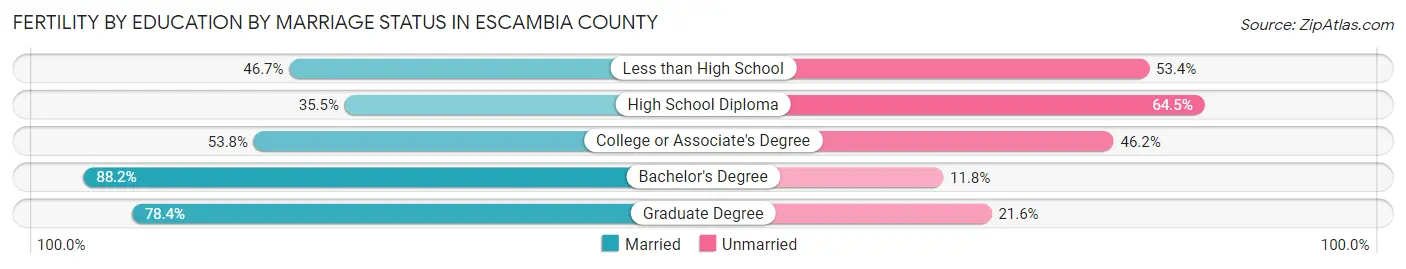
| Educational Attainment | Married | Unmarried |
| Less than High School | 202 (46.7%) | 231 (53.3%) |
| High School Diploma | 358 (35.5%) | 651 (64.5%) |
| College or Associate's Degree | 630 (53.8%) | 541 (46.2%) |
| Bachelor's Degree | 841 (88.2%) | 113 (11.8%) |
| Graduate Degree | 236 (78.4%) | 65 (21.6%) |
| Total | 2,267 (58.6%) | 1,601 (41.4%) |
Employment Characteristics in Escambia County
Employment by Class of Employer in Escambia County
Among the 146,059 employed individuals in Escambia County, private company employees (88,429 | 60.5%), federal government employees (15,917 | 10.9%), and not-for-profit organizations (15,753 | 10.8%) make up the most common classes of employment.
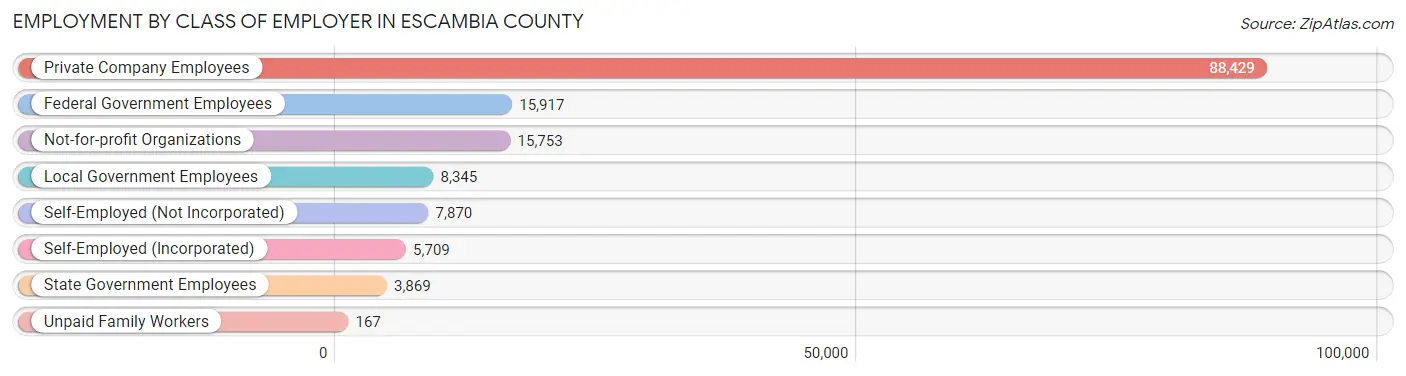
| Employer Class | # Employees | % Employees |
| Private Company Employees | 88,429 | 60.5% |
| Self-Employed (Incorporated) | 5,709 | 3.9% |
| Self-Employed (Not Incorporated) | 7,870 | 5.4% |
| Not-for-profit Organizations | 15,753 | 10.8% |
| Local Government Employees | 8,345 | 5.7% |
| State Government Employees | 3,869 | 2.6% |
| Federal Government Employees | 15,917 | 10.9% |
| Unpaid Family Workers | 167 | 0.1% |
| Total | 146,059 | 100.0% |
Employment Status by Age in Escambia County
According to the labor force statistics for Escambia County, out of the total population over 16 years of age (261,744), 60.8% or 159,140 individuals are in the labor force, with 6.2% or 9,867 of them unemployed. The age group with the highest labor force participation rate is 25 to 29 years, with 84.5% or 20,520 individuals in the labor force. Within the labor force, the 16 to 19 years age range has the highest percentage of unemployed individuals, with 16.0% or 1,430 of them being unemployed.
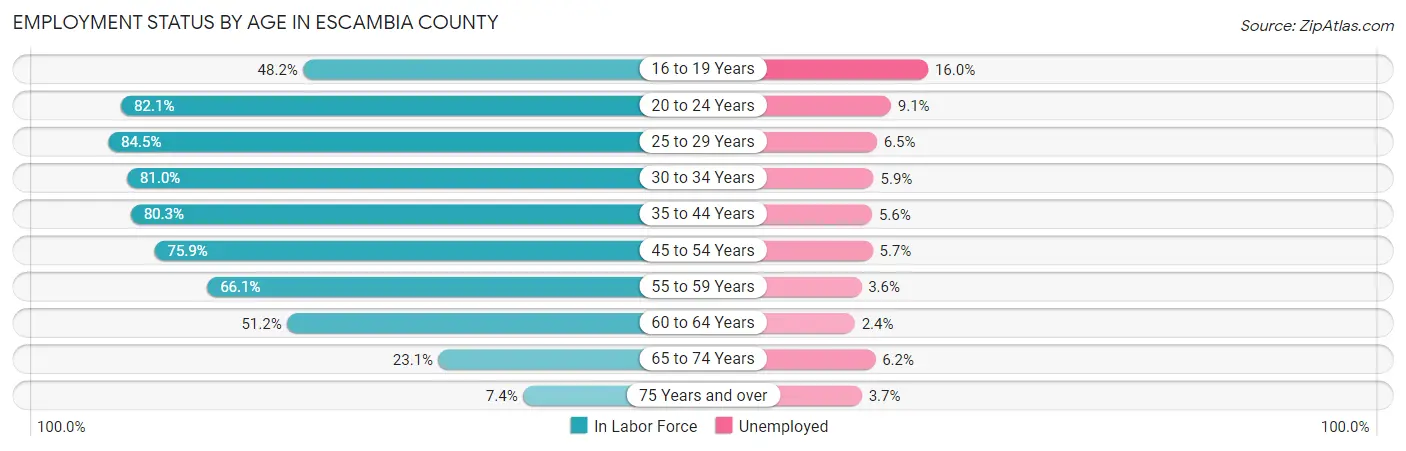
| Age Bracket | In Labor Force | Unemployed |
| 16 to 19 Years | 8,939 (48.2%) | 1,430 (16.0%) |
| 20 to 24 Years | 20,501 (82.1%) | 1,866 (9.1%) |
| 25 to 29 Years | 20,520 (84.5%) | 1,334 (6.5%) |
| 30 to 34 Years | 18,036 (81.0%) | 1,064 (5.9%) |
| 35 to 44 Years | 29,356 (80.3%) | 1,644 (5.6%) |
| 45 to 54 Years | 27,136 (75.9%) | 1,547 (5.7%) |
| 55 to 59 Years | 14,758 (66.1%) | 531 (3.6%) |
| 60 to 64 Years | 10,628 (51.2%) | 255 (2.4%) |
| 65 to 74 Years | 7,670 (23.1%) | 476 (6.2%) |
| 75 Years and over | 1,708 (7.4%) | 63 (3.7%) |
| Total | 159,140 (60.8%) | 9,867 (6.2%) |
Employment Status by Educational Attainment in Escambia County
According to labor force statistics for Escambia County, 74.4% of individuals (120,487) out of the total population between 25 and 64 years of age (161,945) are in the labor force, with 5.2% or 6,265 of them being unemployed. The group with the highest labor force participation rate are those with the educational attainment of bachelor's degree or higher, with 84.7% or 38,786 individuals in the labor force. Within the labor force, individuals with less than high school education have the highest percentage of unemployment, with 9.6% or 773 of them being unemployed.
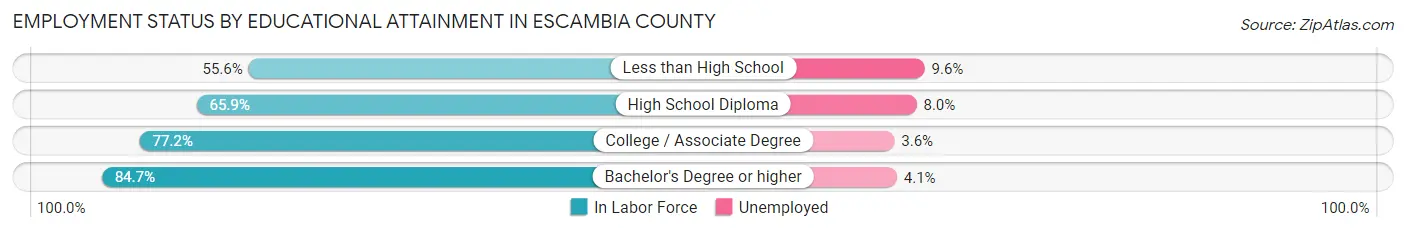
| Educational Attainment | In Labor Force | Unemployed |
| Less than High School | 8,054 (55.6%) | 1,391 (9.6%) |
| High School Diploma | 28,556 (65.9%) | 3,467 (8.0%) |
| College / Associate Degree | 45,035 (77.2%) | 2,100 (3.6%) |
| Bachelor's Degree or higher | 38,786 (84.7%) | 1,877 (4.1%) |
| Total | 120,487 (74.4%) | 8,421 (5.2%) |
Employment Occupations by Sex in Escambia County
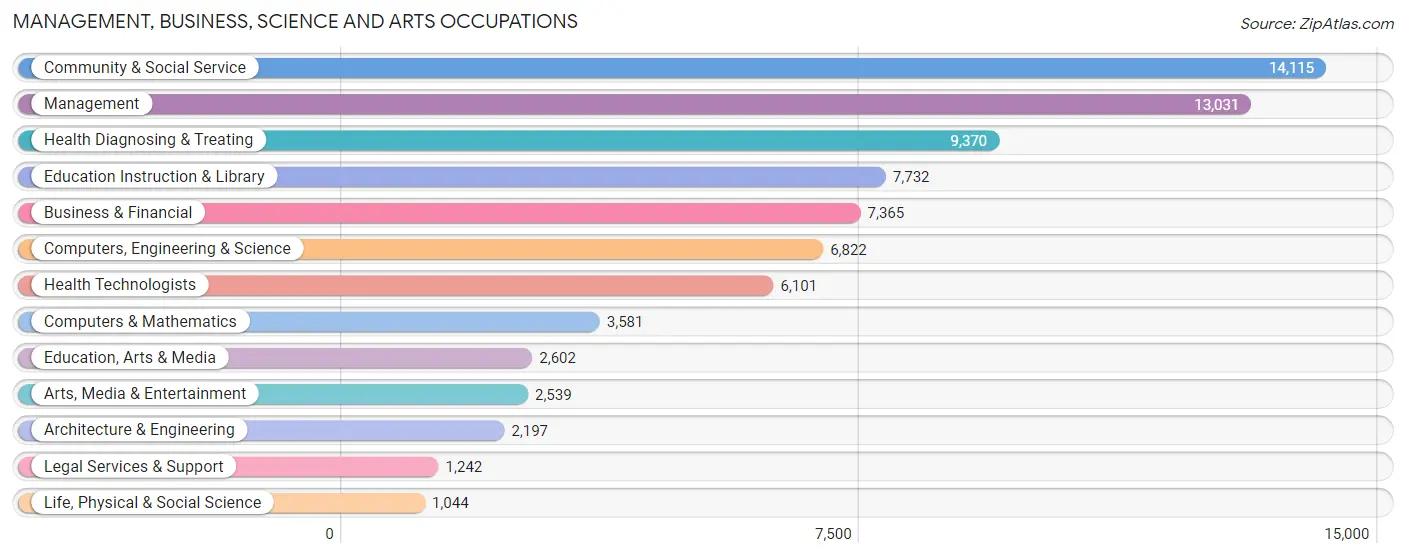
Management, Business, Science and Arts Occupations
The most common Management, Business, Science and Arts occupations in Escambia County are Community & Social Service (14,115 | 10.1%), Management (13,031 | 9.3%), Health Diagnosing & Treating (9,370 | 6.7%), Education Instruction & Library (7,732 | 5.5%), and Business & Financial (7,365 | 5.3%).
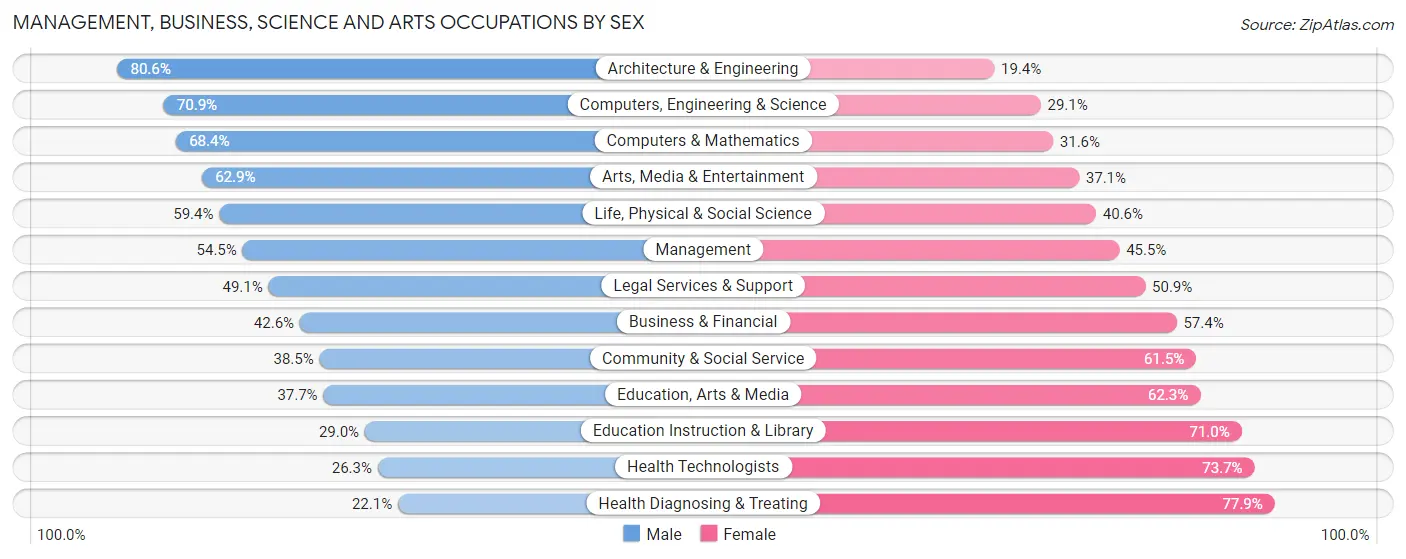
Management, Business, Science and Arts Occupations by Sex
Within the Management, Business, Science and Arts occupations in Escambia County, the most male-oriented occupations are Architecture & Engineering (80.6%), Computers, Engineering & Science (70.9%), and Computers & Mathematics (68.4%), while the most female-oriented occupations are Health Diagnosing & Treating (77.9%), Health Technologists (73.7%), and Education Instruction & Library (71.0%).
| Occupation | Male | Female |
| Management | 7,104 (54.5%) | 5,927 (45.5%) |
| Business & Financial | 3,135 (42.6%) | 4,230 (57.4%) |
| Computers, Engineering & Science | 4,839 (70.9%) | 1,983 (29.1%) |
| Computers & Mathematics | 2,448 (68.4%) | 1,133 (31.6%) |
| Architecture & Engineering | 1,771 (80.6%) | 426 (19.4%) |
| Life, Physical & Social Science | 620 (59.4%) | 424 (40.6%) |
| Community & Social Service | 5,430 (38.5%) | 8,685 (61.5%) |
| Education, Arts & Media | 980 (37.7%) | 1,622 (62.3%) |
| Legal Services & Support | 610 (49.1%) | 632 (50.9%) |
| Education Instruction & Library | 2,242 (29.0%) | 5,490 (71.0%) |
| Arts, Media & Entertainment | 1,598 (62.9%) | 941 (37.1%) |
| Health Diagnosing & Treating | 2,072 (22.1%) | 7,298 (77.9%) |
| Health Technologists | 1,606 (26.3%) | 4,495 (73.7%) |
| Total (Category) | 22,580 (44.5%) | 28,123 (55.5%) |
| Total (Overall) | 71,353 (51.0%) | 68,639 (49.0%) |
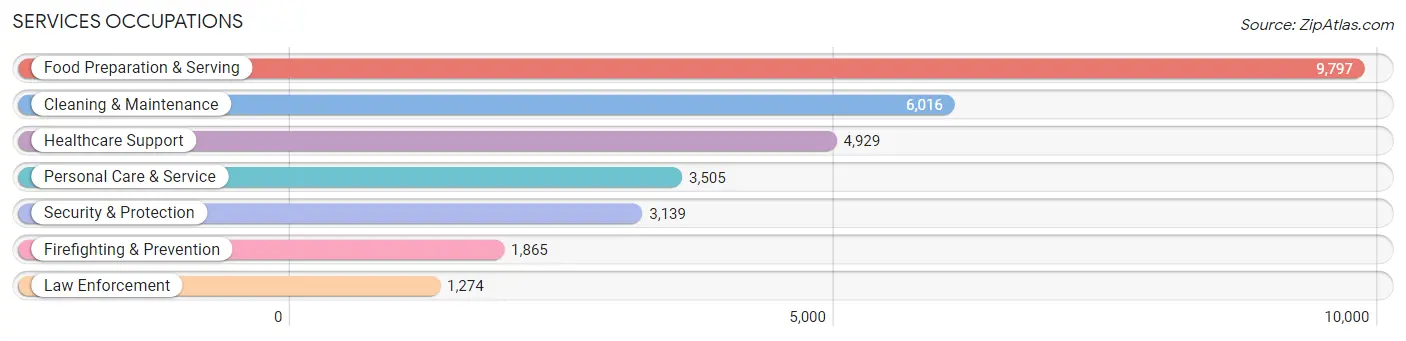
Services Occupations
The most common Services occupations in Escambia County are Food Preparation & Serving (9,797 | 7.0%), Cleaning & Maintenance (6,016 | 4.3%), Healthcare Support (4,929 | 3.5%), Personal Care & Service (3,505 | 2.5%), and Security & Protection (3,139 | 2.2%).
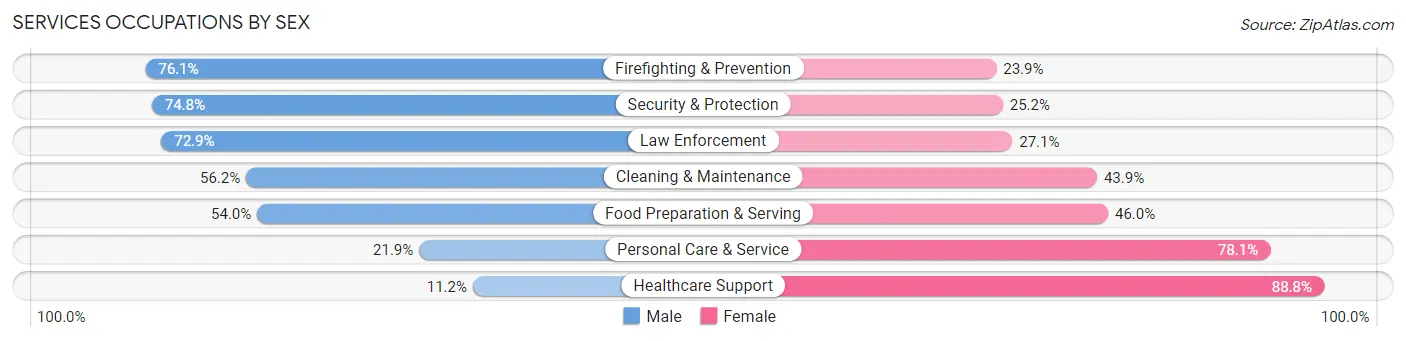
Services Occupations by Sex
Within the Services occupations in Escambia County, the most male-oriented occupations are Firefighting & Prevention (76.1%), Security & Protection (74.8%), and Law Enforcement (72.9%), while the most female-oriented occupations are Healthcare Support (88.8%), Personal Care & Service (78.1%), and Food Preparation & Serving (46.0%).
| Occupation | Male | Female |
| Healthcare Support | 554 (11.2%) | 4,375 (88.8%) |
| Security & Protection | 2,348 (74.8%) | 791 (25.2%) |
| Firefighting & Prevention | 1,419 (76.1%) | 446 (23.9%) |
| Law Enforcement | 929 (72.9%) | 345 (27.1%) |
| Food Preparation & Serving | 5,286 (54.0%) | 4,511 (46.0%) |
| Cleaning & Maintenance | 3,378 (56.1%) | 2,638 (43.9%) |
| Personal Care & Service | 767 (21.9%) | 2,738 (78.1%) |
| Total (Category) | 12,333 (45.0%) | 15,053 (55.0%) |
| Total (Overall) | 71,353 (51.0%) | 68,639 (49.0%) |
Sales and Office Occupations
The most common Sales and Office occupations in Escambia County are Office & Administration (18,268 | 13.1%), and Sales & Related (15,049 | 10.7%).

Sales and Office Occupations by Sex
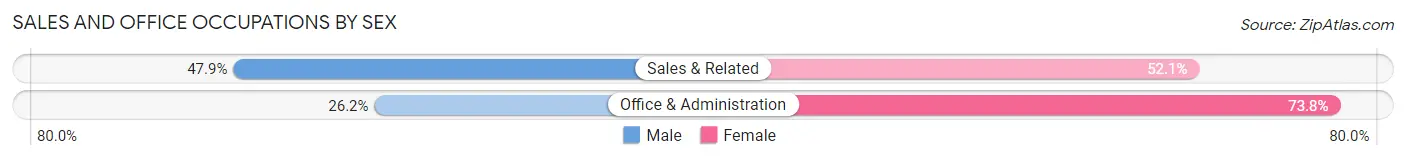
| Occupation | Male | Female |
| Sales & Related | 7,209 (47.9%) | 7,840 (52.1%) |
| Office & Administration | 4,784 (26.2%) | 13,484 (73.8%) |
| Total (Category) | 11,993 (36.0%) | 21,324 (64.0%) |
| Total (Overall) | 71,353 (51.0%) | 68,639 (49.0%) |
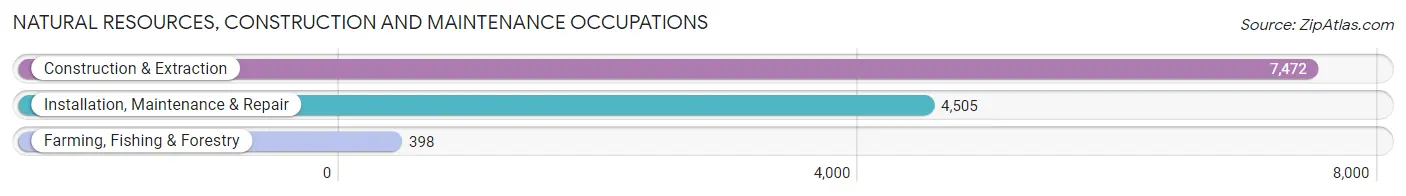
Natural Resources, Construction and Maintenance Occupations
The most common Natural Resources, Construction and Maintenance occupations in Escambia County are Construction & Extraction (7,472 | 5.3%), Installation, Maintenance & Repair (4,505 | 3.2%), and Farming, Fishing & Forestry (398 | 0.3%).
Natural Resources, Construction and Maintenance Occupations by Sex
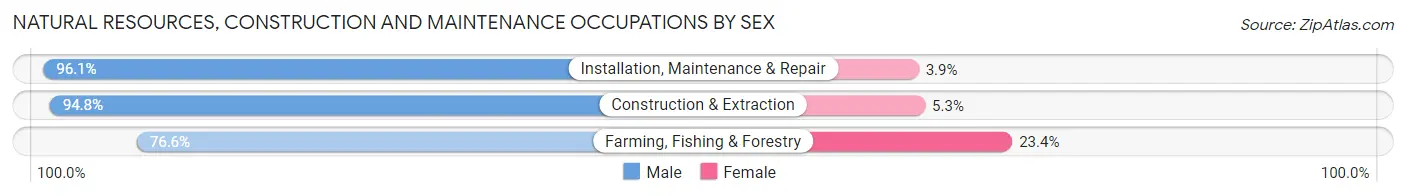
| Occupation | Male | Female |
| Farming, Fishing & Forestry | 305 (76.6%) | 93 (23.4%) |
| Construction & Extraction | 7,080 (94.8%) | 392 (5.2%) |
| Installation, Maintenance & Repair | 4,329 (96.1%) | 176 (3.9%) |
| Total (Category) | 11,714 (94.7%) | 661 (5.3%) |
| Total (Overall) | 71,353 (51.0%) | 68,639 (49.0%) |
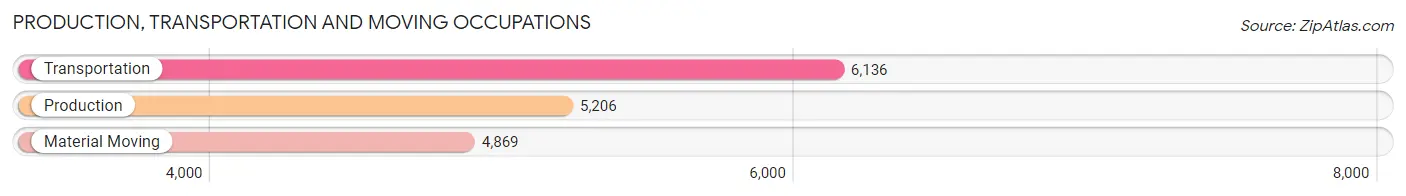
Production, Transportation and Moving Occupations
The most common Production, Transportation and Moving occupations in Escambia County are Transportation (6,136 | 4.4%), Production (5,206 | 3.7%), and Material Moving (4,869 | 3.5%).
Production, Transportation and Moving Occupations by Sex
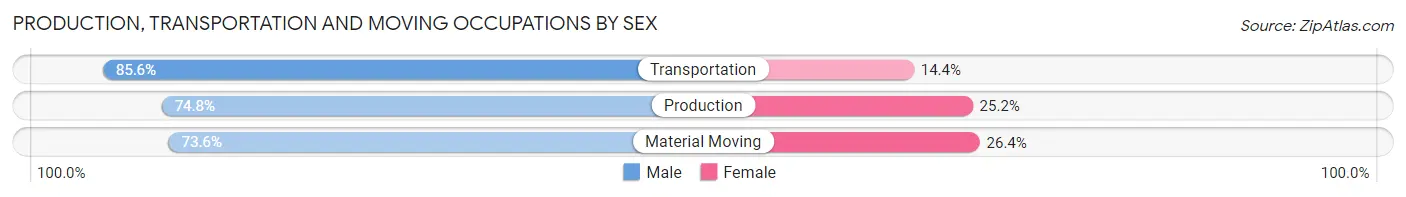
| Occupation | Male | Female |
| Production | 3,896 (74.8%) | 1,310 (25.2%) |
| Transportation | 5,255 (85.6%) | 881 (14.4%) |
| Material Moving | 3,582 (73.6%) | 1,287 (26.4%) |
| Total (Category) | 12,733 (78.5%) | 3,478 (21.4%) |
| Total (Overall) | 71,353 (51.0%) | 68,639 (49.0%) |
Employment Industries by Sex in Escambia County
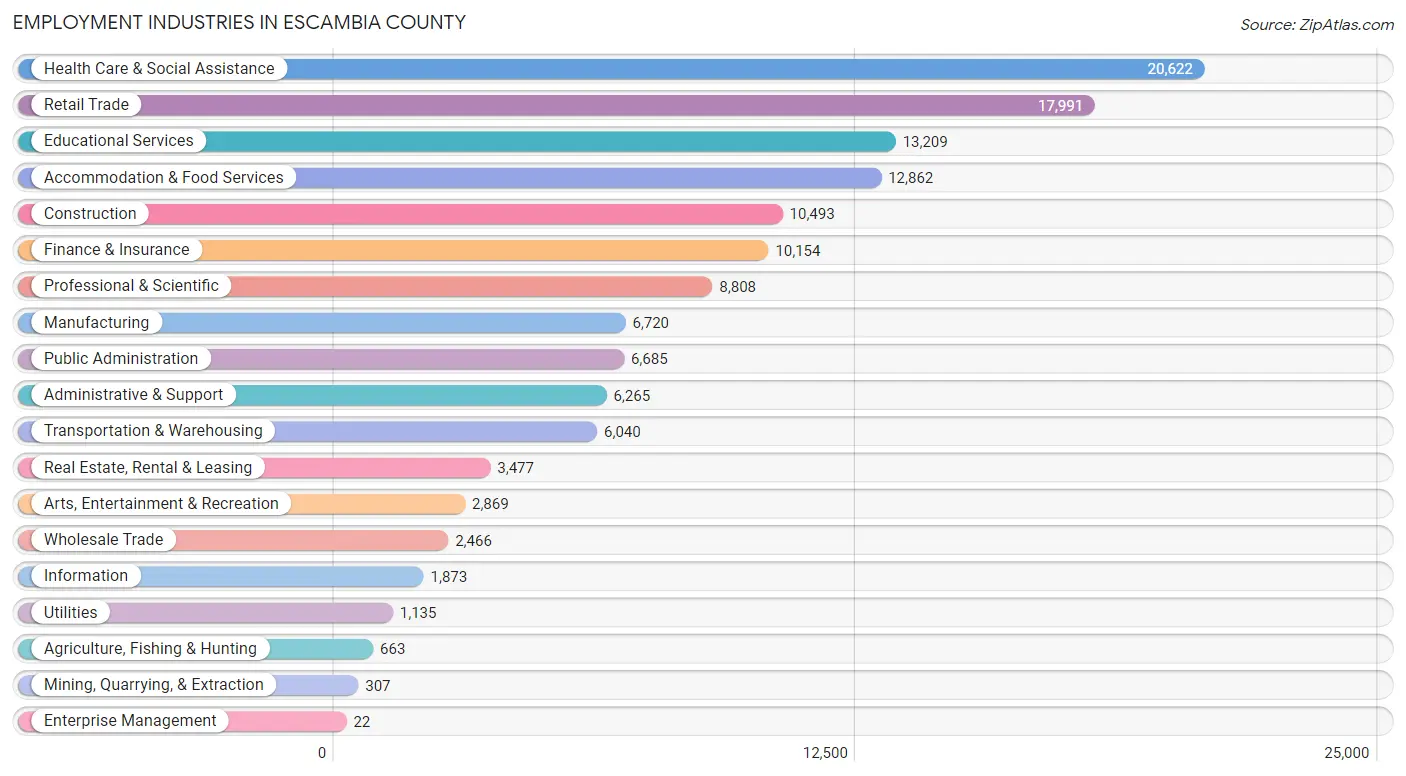
Employment Industries in Escambia County
The major employment industries in Escambia County include Health Care & Social Assistance (20,622 | 14.7%), Retail Trade (17,991 | 12.9%), Educational Services (13,209 | 9.4%), Accommodation & Food Services (12,862 | 9.2%), and Construction (10,493 | 7.5%).
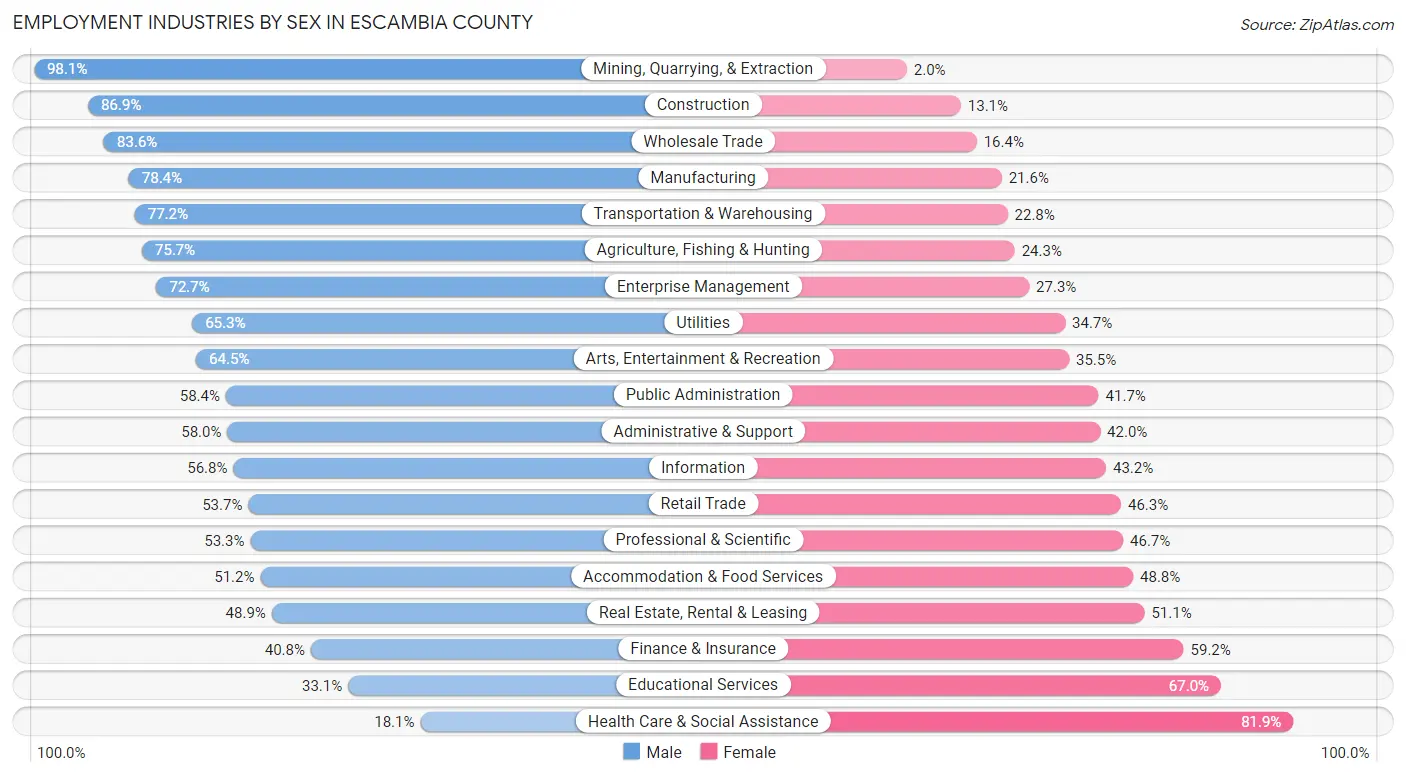
Employment Industries by Sex in Escambia County
The Escambia County industries that see more men than women are Mining, Quarrying, & Extraction (98.1%), Construction (86.9%), and Wholesale Trade (83.6%), whereas the industries that tend to have a higher number of women are Health Care & Social Assistance (81.9%), Educational Services (66.9%), and Finance & Insurance (59.2%).
| Industry | Male | Female |
| Agriculture, Fishing & Hunting | 502 (75.7%) | 161 (24.3%) |
| Mining, Quarrying, & Extraction | 301 (98.1%) | 6 (1.9%) |
| Construction | 9,115 (86.9%) | 1,378 (13.1%) |
| Manufacturing | 5,269 (78.4%) | 1,451 (21.6%) |
| Wholesale Trade | 2,061 (83.6%) | 405 (16.4%) |
| Retail Trade | 9,663 (53.7%) | 8,328 (46.3%) |
| Transportation & Warehousing | 4,662 (77.2%) | 1,378 (22.8%) |
| Utilities | 741 (65.3%) | 394 (34.7%) |
| Information | 1,064 (56.8%) | 809 (43.2%) |
| Finance & Insurance | 4,139 (40.8%) | 6,015 (59.2%) |
| Real Estate, Rental & Leasing | 1,699 (48.9%) | 1,778 (51.1%) |
| Professional & Scientific | 4,693 (53.3%) | 4,115 (46.7%) |
| Enterprise Management | 16 (72.7%) | 6 (27.3%) |
| Administrative & Support | 3,636 (58.0%) | 2,629 (42.0%) |
| Educational Services | 4,366 (33.1%) | 8,843 (66.9%) |
| Health Care & Social Assistance | 3,730 (18.1%) | 16,892 (81.9%) |
| Arts, Entertainment & Recreation | 1,850 (64.5%) | 1,019 (35.5%) |
| Accommodation & Food Services | 6,587 (51.2%) | 6,275 (48.8%) |
| Public Administration | 3,901 (58.4%) | 2,784 (41.6%) |
| Total | 71,353 (51.0%) | 68,639 (49.0%) |
Education in Escambia County
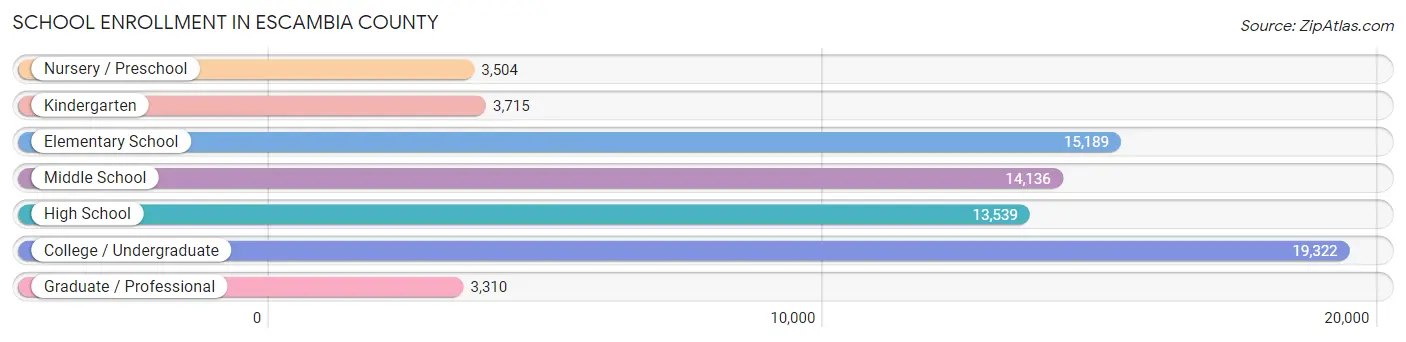
School Enrollment in Escambia County
The most common levels of schooling among the 72,715 students in Escambia County are college / undergraduate (19,322 | 26.6%), elementary school (15,189 | 20.9%), and middle school (14,136 | 19.4%).
| School Level | # Students | % Students |
| Nursery / Preschool | 3,504 | 4.8% |
| Kindergarten | 3,715 | 5.1% |
| Elementary School | 15,189 | 20.9% |
| Middle School | 14,136 | 19.4% |
| High School | 13,539 | 18.6% |
| College / Undergraduate | 19,322 | 26.6% |
| Graduate / Professional | 3,310 | 4.5% |
| Total | 72,715 | 100.0% |
School Enrollment by Age by Funding Source in Escambia County
Out of a total of 72,715 students who are enrolled in schools in Escambia County, 18,470 (25.4%) attend a private institution, while the remaining 54,245 (74.6%) are enrolled in public schools. The age group of 18 to 19 year olds has the highest likelihood of being enrolled in private schools, with 3,130 (45.0% in the age bracket) enrolled. Conversely, the age group of 15 to 17 year olds has the lowest likelihood of being enrolled in a private school, with 8,574 (83.3% in the age bracket) attending a public institution.
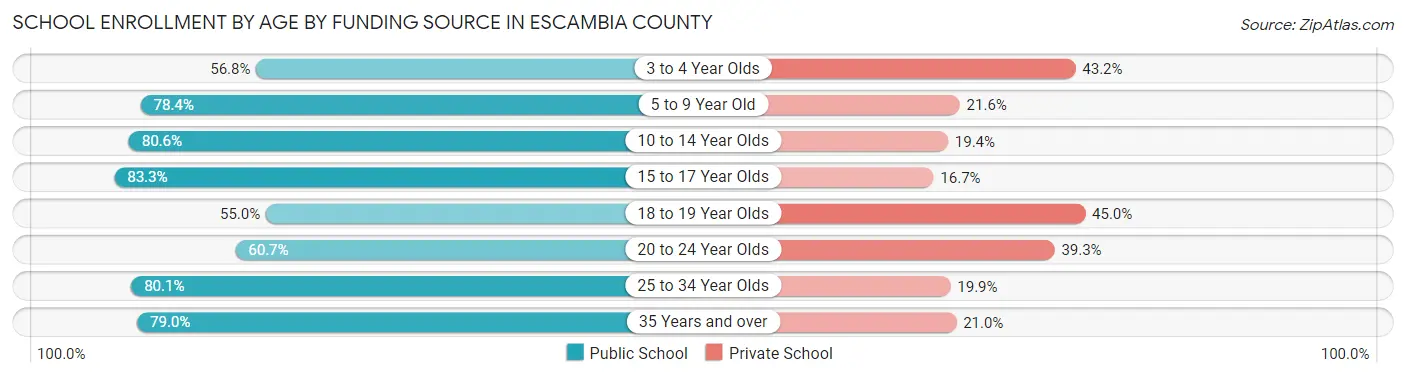
| Age Bracket | Public School | Private School |
| 3 to 4 Year Olds | 1,492 (56.8%) | 1,133 (43.2%) |
| 5 to 9 Year Old | 13,281 (78.4%) | 3,658 (21.6%) |
| 10 to 14 Year Olds | 14,508 (80.6%) | 3,495 (19.4%) |
| 15 to 17 Year Olds | 8,574 (83.3%) | 1,720 (16.7%) |
| 18 to 19 Year Olds | 3,830 (55.0%) | 3,130 (45.0%) |
| 20 to 24 Year Olds | 5,405 (60.7%) | 3,494 (39.3%) |
| 25 to 34 Year Olds | 4,092 (80.1%) | 1,015 (19.9%) |
| 35 Years and over | 3,073 (79.0%) | 815 (21.0%) |
| Total | 54,245 (74.6%) | 18,470 (25.4%) |
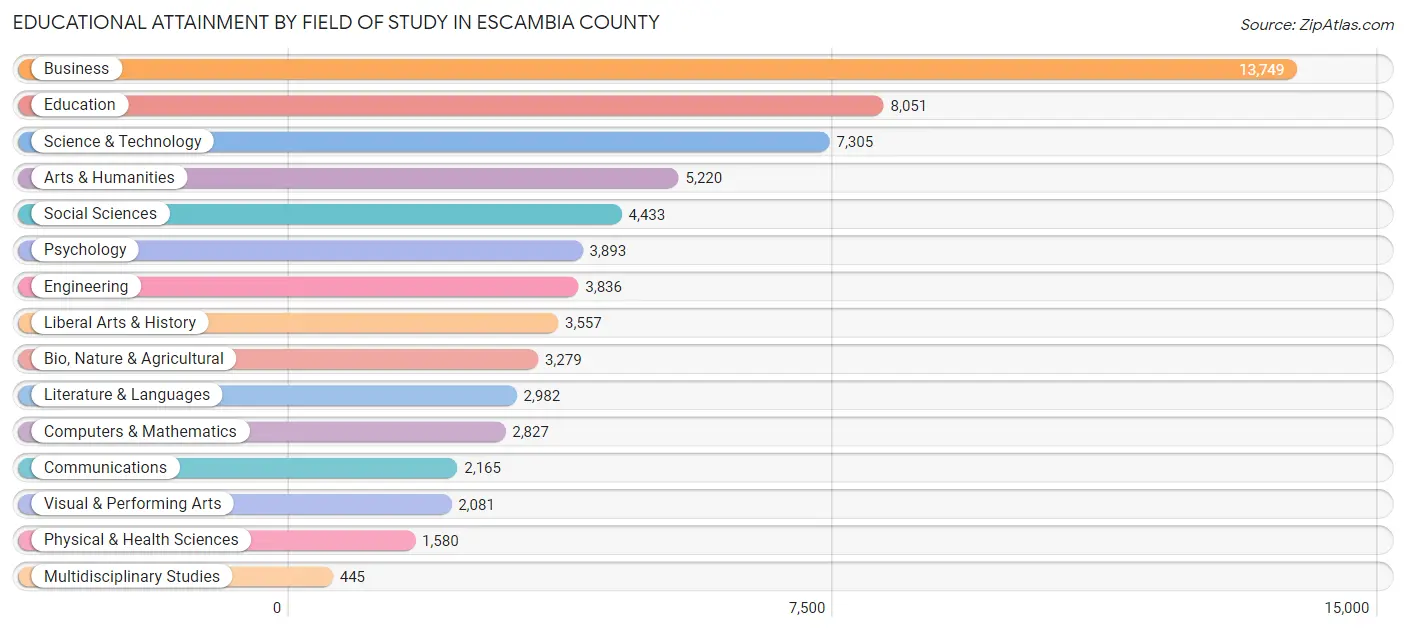
Educational Attainment by Field of Study in Escambia County
Business (13,749 | 21.0%), education (8,051 | 12.3%), science & technology (7,305 | 11.2%), arts & humanities (5,220 | 8.0%), and social sciences (4,433 | 6.8%) are the most common fields of study among 65,403 individuals in Escambia County who have obtained a bachelor's degree or higher.
| Field of Study | # Graduates | % Graduates |
| Computers & Mathematics | 2,827 | 4.3% |
| Bio, Nature & Agricultural | 3,279 | 5.0% |
| Physical & Health Sciences | 1,580 | 2.4% |
| Psychology | 3,893 | 5.9% |
| Social Sciences | 4,433 | 6.8% |
| Engineering | 3,836 | 5.9% |
| Multidisciplinary Studies | 445 | 0.7% |
| Science & Technology | 7,305 | 11.2% |
| Business | 13,749 | 21.0% |
| Education | 8,051 | 12.3% |
| Literature & Languages | 2,982 | 4.6% |
| Liberal Arts & History | 3,557 | 5.4% |
| Visual & Performing Arts | 2,081 | 3.2% |
| Communications | 2,165 | 3.3% |
| Arts & Humanities | 5,220 | 8.0% |
| Total | 65,403 | 100.0% |
Transportation & Commute in Escambia County
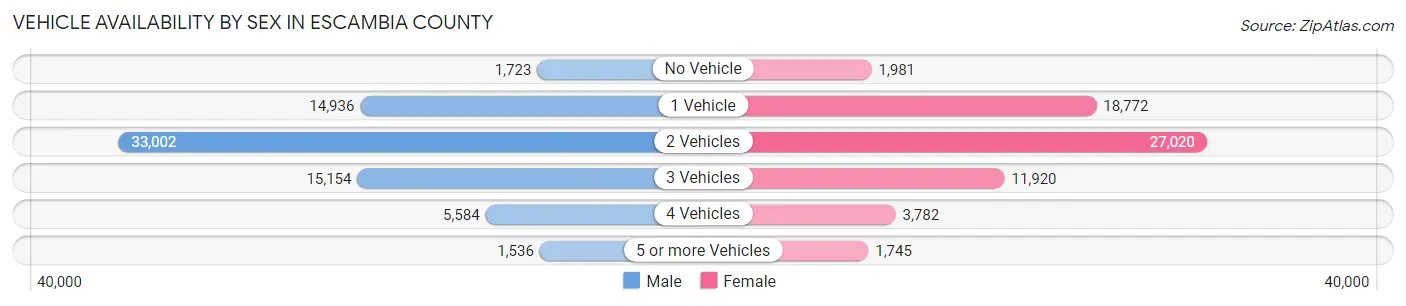
Vehicle Availability by Sex in Escambia County
The most prevalent vehicle ownership categories in Escambia County are males with 2 vehicles (33,002, accounting for 45.9%) and females with 2 vehicles (27,020, making up 50.6%).
| Vehicles Available | Male | Female |
| No Vehicle | 1,723 (2.4%) | 1,981 (3.0%) |
| 1 Vehicle | 14,936 (20.8%) | 18,772 (28.8%) |
| 2 Vehicles | 33,002 (45.9%) | 27,020 (41.4%) |
| 3 Vehicles | 15,154 (21.1%) | 11,920 (18.3%) |
| 4 Vehicles | 5,584 (7.8%) | 3,782 (5.8%) |
| 5 or more Vehicles | 1,536 (2.1%) | 1,745 (2.7%) |
| Total | 71,935 (100.0%) | 65,220 (100.0%) |
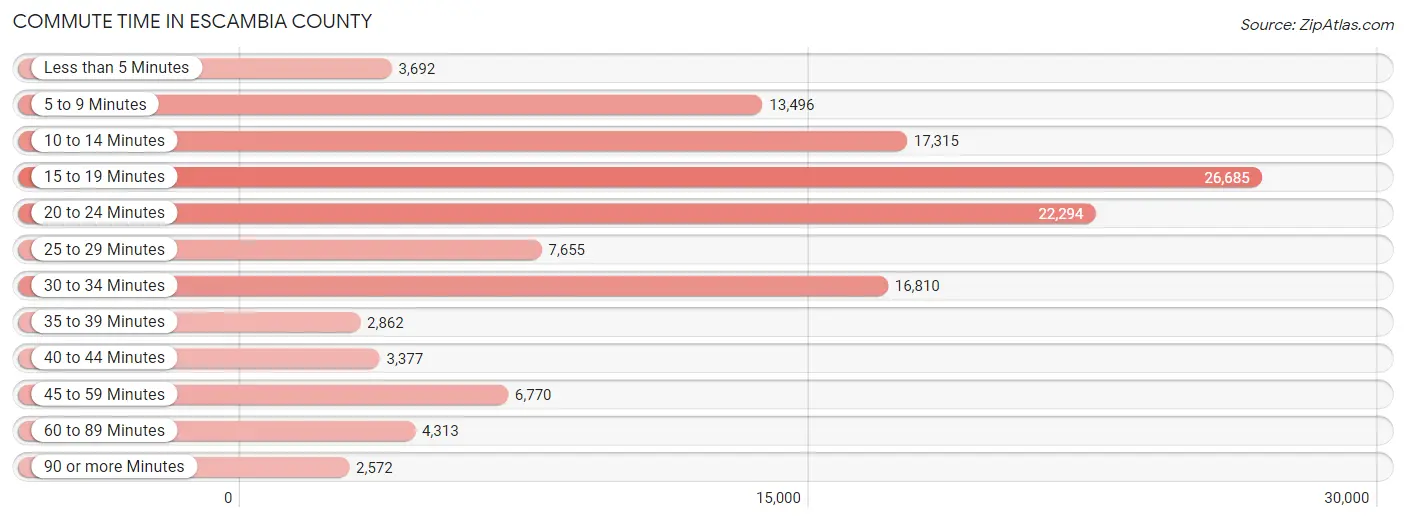
Commute Time in Escambia County
The most frequently occuring commute durations in Escambia County are 15 to 19 minutes (26,685 commuters, 20.9%), 20 to 24 minutes (22,294 commuters, 17.4%), and 10 to 14 minutes (17,315 commuters, 13.5%).
| Commute Time | # Commuters | % Commuters |
| Less than 5 Minutes | 3,692 | 2.9% |
| 5 to 9 Minutes | 13,496 | 10.6% |
| 10 to 14 Minutes | 17,315 | 13.5% |
| 15 to 19 Minutes | 26,685 | 20.9% |
| 20 to 24 Minutes | 22,294 | 17.4% |
| 25 to 29 Minutes | 7,655 | 6.0% |
| 30 to 34 Minutes | 16,810 | 13.2% |
| 35 to 39 Minutes | 2,862 | 2.2% |
| 40 to 44 Minutes | 3,377 | 2.6% |
| 45 to 59 Minutes | 6,770 | 5.3% |
| 60 to 89 Minutes | 4,313 | 3.4% |
| 90 or more Minutes | 2,572 | 2.0% |
Commute Time by Sex in Escambia County
The most common commute times in Escambia County are 15 to 19 minutes (14,052 commuters, 20.5%) for males and 15 to 19 minutes (12,633 commuters, 21.3%) for females.
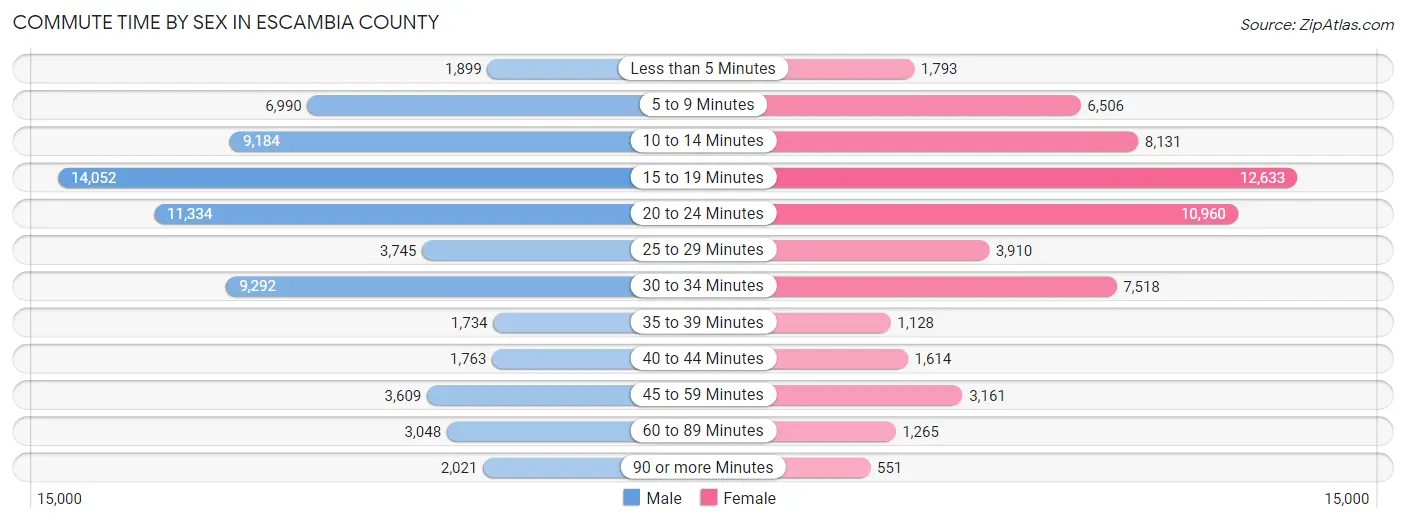
| Commute Time | Male | Female |
| Less than 5 Minutes | 1,899 (2.8%) | 1,793 (3.0%) |
| 5 to 9 Minutes | 6,990 (10.2%) | 6,506 (11.0%) |
| 10 to 14 Minutes | 9,184 (13.4%) | 8,131 (13.7%) |
| 15 to 19 Minutes | 14,052 (20.5%) | 12,633 (21.3%) |
| 20 to 24 Minutes | 11,334 (16.5%) | 10,960 (18.5%) |
| 25 to 29 Minutes | 3,745 (5.4%) | 3,910 (6.6%) |
| 30 to 34 Minutes | 9,292 (13.5%) | 7,518 (12.7%) |
| 35 to 39 Minutes | 1,734 (2.5%) | 1,128 (1.9%) |
| 40 to 44 Minutes | 1,763 (2.6%) | 1,614 (2.7%) |
| 45 to 59 Minutes | 3,609 (5.3%) | 3,161 (5.3%) |
| 60 to 89 Minutes | 3,048 (4.4%) | 1,265 (2.1%) |
| 90 or more Minutes | 2,021 (2.9%) | 551 (0.9%) |
Time of Departure to Work by Sex in Escambia County
The most frequent times of departure to work in Escambia County are 7:00 AM to 7:29 AM (9,921, 14.4%) for males and 7:00 AM to 7:29 AM (9,619, 16.3%) for females.
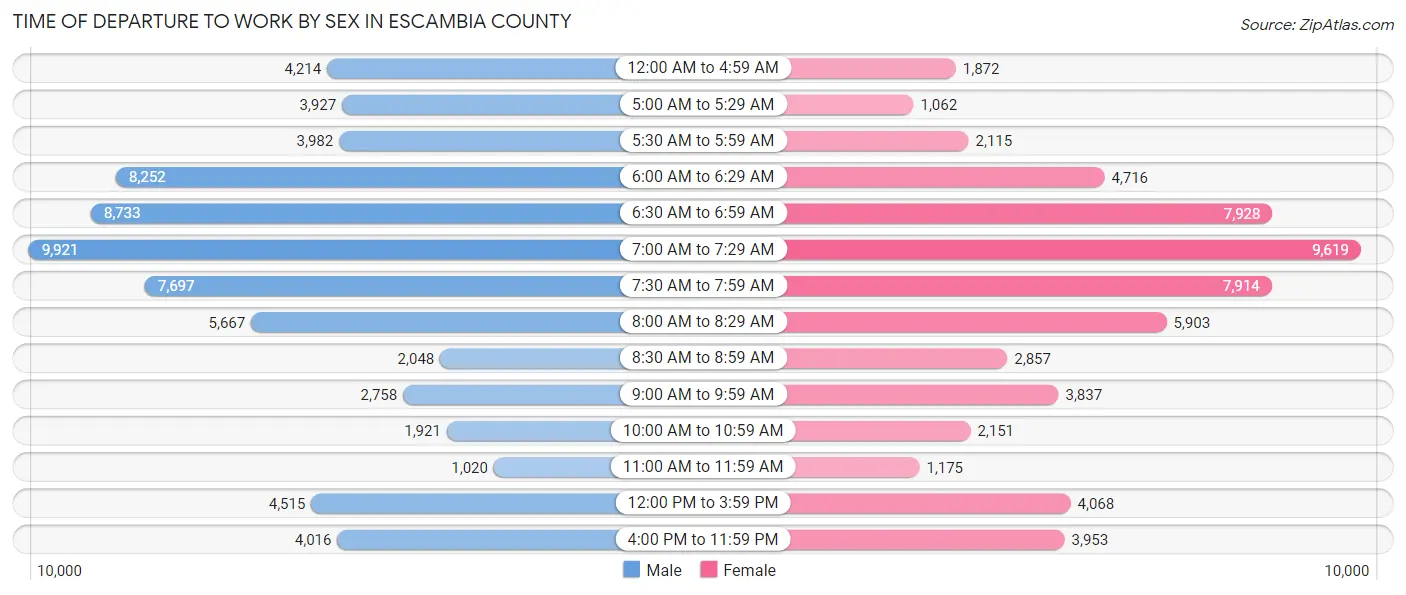
| Time of Departure | Male | Female |
| 12:00 AM to 4:59 AM | 4,214 (6.1%) | 1,872 (3.2%) |
| 5:00 AM to 5:29 AM | 3,927 (5.7%) | 1,062 (1.8%) |
| 5:30 AM to 5:59 AM | 3,982 (5.8%) | 2,115 (3.6%) |
| 6:00 AM to 6:29 AM | 8,252 (12.0%) | 4,716 (8.0%) |
| 6:30 AM to 6:59 AM | 8,733 (12.7%) | 7,928 (13.4%) |
| 7:00 AM to 7:29 AM | 9,921 (14.4%) | 9,619 (16.3%) |
| 7:30 AM to 7:59 AM | 7,697 (11.2%) | 7,914 (13.4%) |
| 8:00 AM to 8:29 AM | 5,667 (8.3%) | 5,903 (10.0%) |
| 8:30 AM to 8:59 AM | 2,048 (3.0%) | 2,857 (4.8%) |
| 9:00 AM to 9:59 AM | 2,758 (4.0%) | 3,837 (6.5%) |
| 10:00 AM to 10:59 AM | 1,921 (2.8%) | 2,151 (3.6%) |
| 11:00 AM to 11:59 AM | 1,020 (1.5%) | 1,175 (2.0%) |
| 12:00 PM to 3:59 PM | 4,515 (6.6%) | 4,068 (6.9%) |
| 4:00 PM to 11:59 PM | 4,016 (5.9%) | 3,953 (6.7%) |
| Total | 68,671 (100.0%) | 59,170 (100.0%) |
Housing Occupancy in Escambia County
Occupancy by Ownership in Escambia County
Of the total 126,537 dwellings in Escambia County, owner-occupied units account for 79,891 (63.1%), while renter-occupied units make up 46,646 (36.9%).
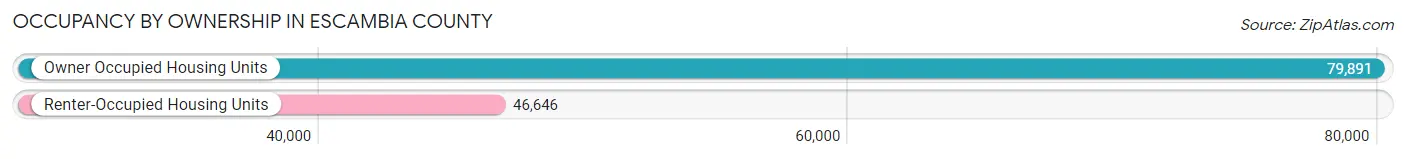
| Occupancy | # Housing Units | % Housing Units |
| Owner Occupied Housing Units | 79,891 | 63.1% |
| Renter-Occupied Housing Units | 46,646 | 36.9% |
| Total Occupied Housing Units | 126,537 | 100.0% |
Occupancy by Household Size in Escambia County
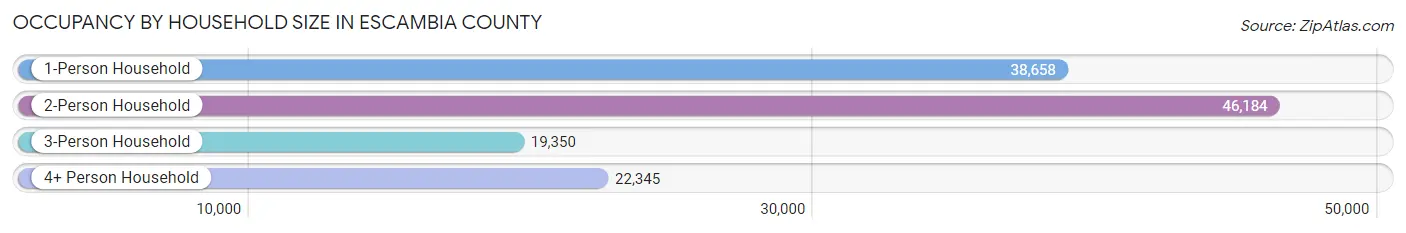
| Household Size | # Housing Units | % Housing Units |
| 1-Person Household | 38,658 | 30.5% |
| 2-Person Household | 46,184 | 36.5% |
| 3-Person Household | 19,350 | 15.3% |
| 4+ Person Household | 22,345 | 17.7% |
| Total Housing Units | 126,537 | 100.0% |
Occupancy by Ownership by Household Size in Escambia County
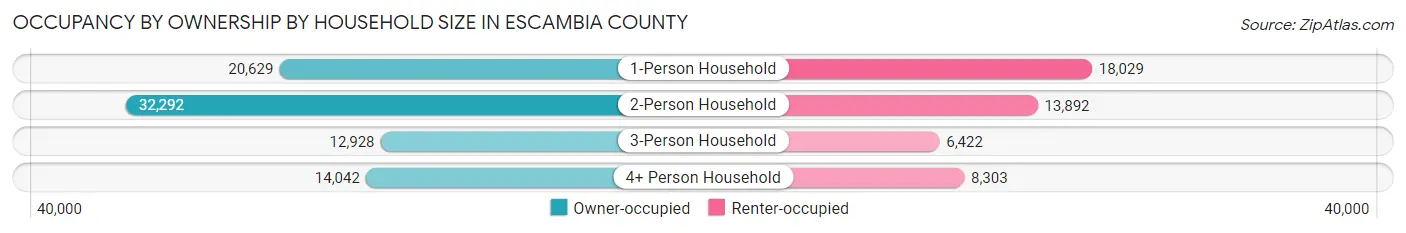
| Household Size | Owner-occupied | Renter-occupied |
| 1-Person Household | 20,629 (53.4%) | 18,029 (46.6%) |
| 2-Person Household | 32,292 (69.9%) | 13,892 (30.1%) |
| 3-Person Household | 12,928 (66.8%) | 6,422 (33.2%) |
| 4+ Person Household | 14,042 (62.8%) | 8,303 (37.2%) |
| Total Housing Units | 79,891 (63.1%) | 46,646 (36.9%) |
Occupancy by Educational Attainment in Escambia County
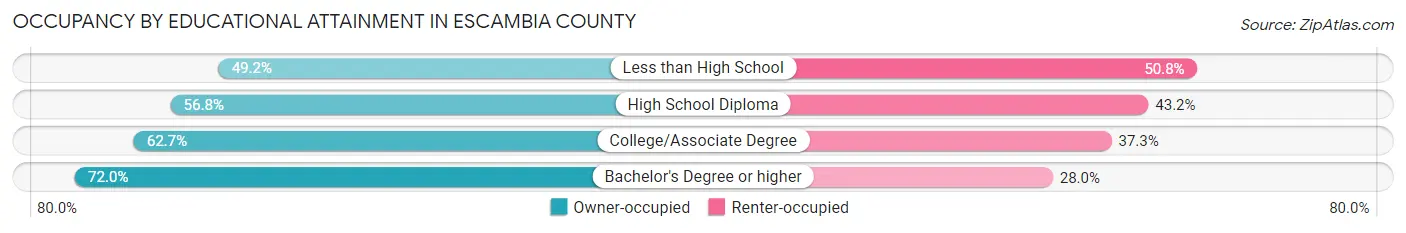
| Household Size | Owner-occupied | Renter-occupied |
| Less than High School | 4,575 (49.2%) | 4,721 (50.8%) |
| High School Diploma | 17,296 (56.8%) | 13,141 (43.2%) |
| College/Associate Degree | 30,074 (62.7%) | 17,911 (37.3%) |
| Bachelor's Degree or higher | 27,946 (72.0%) | 10,873 (28.0%) |
Occupancy by Age of Householder in Escambia County
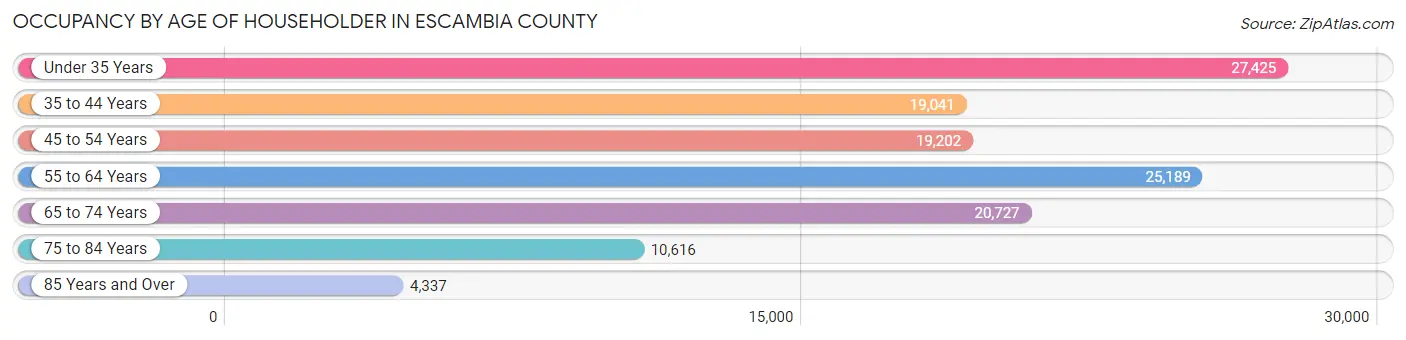
| Age Bracket | # Households | % Households |
| Under 35 Years | 27,425 | 21.7% |
| 35 to 44 Years | 19,041 | 15.0% |
| 45 to 54 Years | 19,202 | 15.2% |
| 55 to 64 Years | 25,189 | 19.9% |
| 65 to 74 Years | 20,727 | 16.4% |
| 75 to 84 Years | 10,616 | 8.4% |
| 85 Years and Over | 4,337 | 3.4% |
| Total | 126,537 | 100.0% |
Housing Finances in Escambia County
Median Income by Occupancy in Escambia County
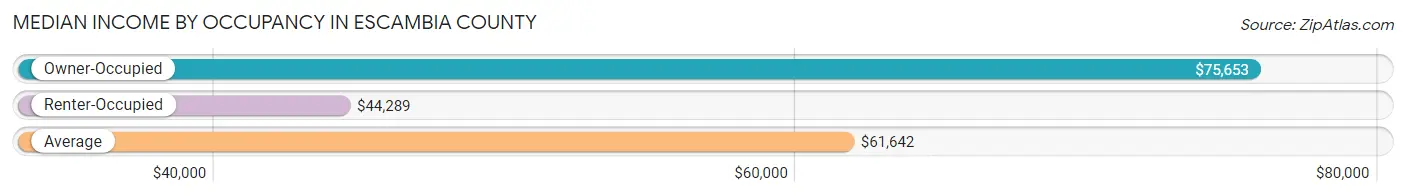
| Occupancy Type | # Households | Median Income |
| Owner-Occupied | 79,891 (63.1%) | $75,653 |
| Renter-Occupied | 46,646 (36.9%) | $44,289 |
| Average | 126,537 (100.0%) | $61,642 |
Occupancy by Householder Income Bracket in Escambia County
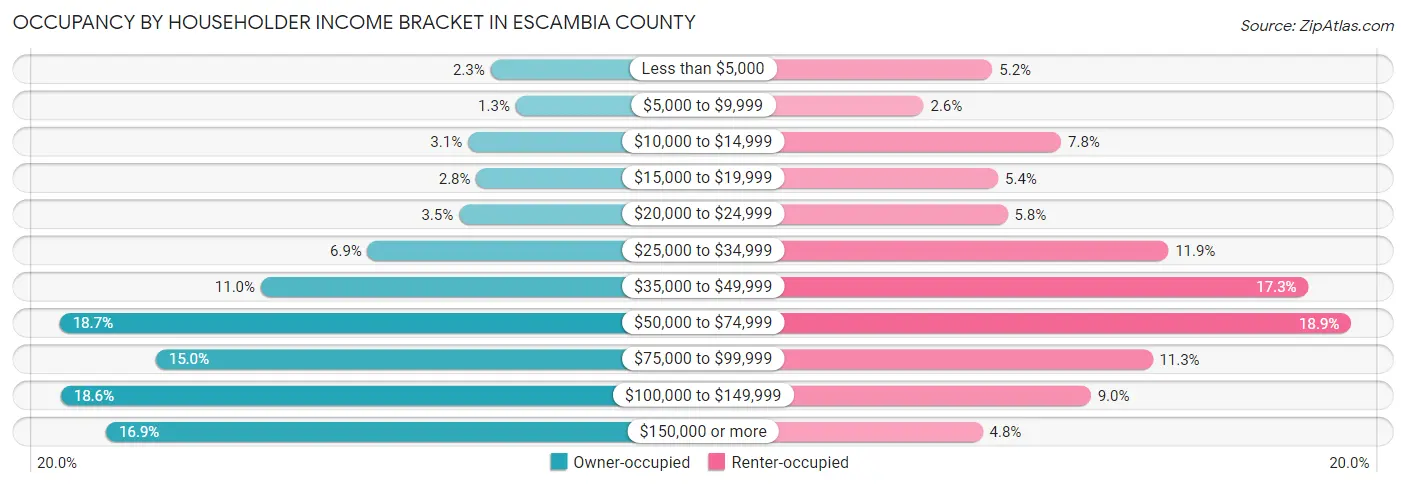
| Income Bracket | Owner-occupied | Renter-occupied |
| Less than $5,000 | 1,799 (2.2%) | 2,431 (5.2%) |
| $5,000 to $9,999 | 1,033 (1.3%) | 1,209 (2.6%) |
| $10,000 to $14,999 | 2,485 (3.1%) | 3,653 (7.8%) |
| $15,000 to $19,999 | 2,227 (2.8%) | 2,532 (5.4%) |
| $20,000 to $24,999 | 2,755 (3.5%) | 2,699 (5.8%) |
| $25,000 to $34,999 | 5,534 (6.9%) | 5,557 (11.9%) |
| $35,000 to $49,999 | 8,791 (11.0%) | 8,047 (17.2%) |
| $50,000 to $74,999 | 14,907 (18.7%) | 8,809 (18.9%) |
| $75,000 to $99,999 | 11,982 (15.0%) | 5,274 (11.3%) |
| $100,000 to $149,999 | 14,878 (18.6%) | 4,178 (9.0%) |
| $150,000 or more | 13,500 (16.9%) | 2,257 (4.8%) |
| Total | 79,891 (100.0%) | 46,646 (100.0%) |
Monthly Housing Cost Tiers in Escambia County
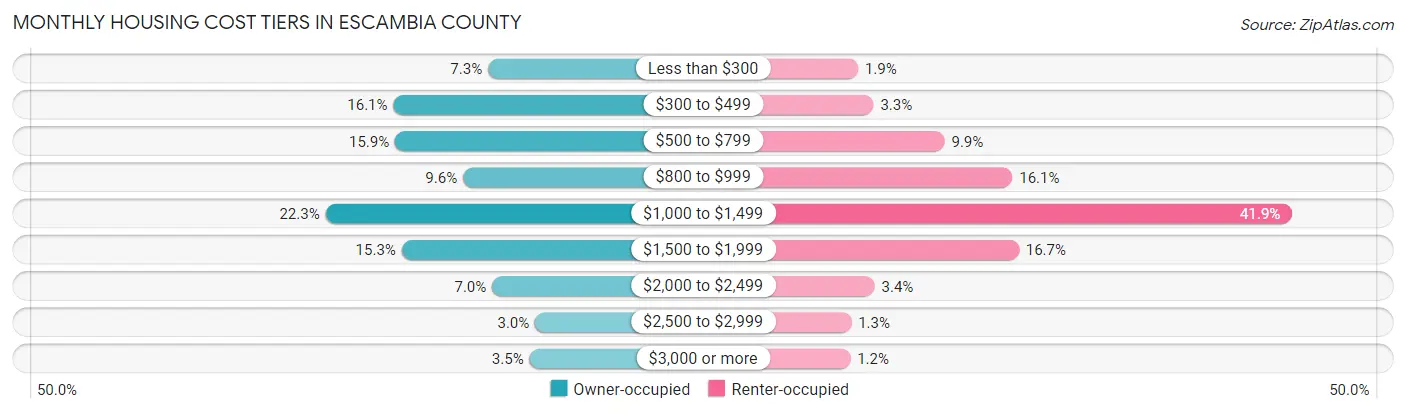
| Monthly Cost | Owner-occupied | Renter-occupied |
| Less than $300 | 5,863 (7.3%) | 880 (1.9%) |
| $300 to $499 | 12,823 (16.1%) | 1,549 (3.3%) |
| $500 to $799 | 12,701 (15.9%) | 4,597 (9.9%) |
| $800 to $999 | 7,699 (9.6%) | 7,509 (16.1%) |
| $1,000 to $1,499 | 17,816 (22.3%) | 19,525 (41.9%) |
| $1,500 to $1,999 | 12,217 (15.3%) | 7,792 (16.7%) |
| $2,000 to $2,499 | 5,563 (7.0%) | 1,597 (3.4%) |
| $2,500 to $2,999 | 2,394 (3.0%) | 592 (1.3%) |
| $3,000 or more | 2,815 (3.5%) | 549 (1.2%) |
| Total | 79,891 (100.0%) | 46,646 (100.0%) |
Physical Housing Characteristics in Escambia County
Housing Structures in Escambia County
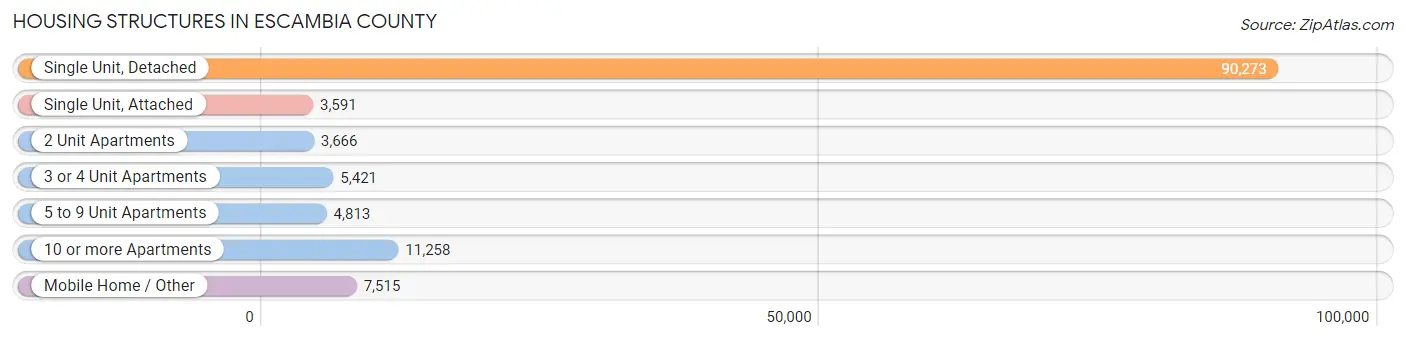
| Structure Type | # Housing Units | % Housing Units |
| Single Unit, Detached | 90,273 | 71.3% |
| Single Unit, Attached | 3,591 | 2.8% |
| 2 Unit Apartments | 3,666 | 2.9% |
| 3 or 4 Unit Apartments | 5,421 | 4.3% |
| 5 to 9 Unit Apartments | 4,813 | 3.8% |
| 10 or more Apartments | 11,258 | 8.9% |
| Mobile Home / Other | 7,515 | 5.9% |
| Total | 126,537 | 100.0% |
Housing Structures by Occupancy in Escambia County
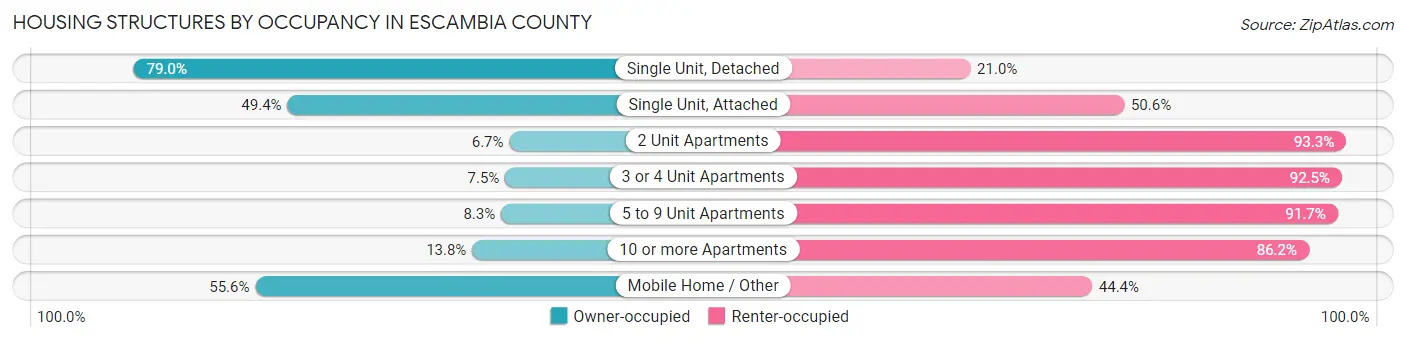
| Structure Type | Owner-occupied | Renter-occupied |
| Single Unit, Detached | 71,337 (79.0%) | 18,936 (21.0%) |
| Single Unit, Attached | 1,774 (49.4%) | 1,817 (50.6%) |
| 2 Unit Apartments | 244 (6.7%) | 3,422 (93.3%) |
| 3 or 4 Unit Apartments | 405 (7.5%) | 5,016 (92.5%) |
| 5 to 9 Unit Apartments | 398 (8.3%) | 4,415 (91.7%) |
| 10 or more Apartments | 1,556 (13.8%) | 9,702 (86.2%) |
| Mobile Home / Other | 4,177 (55.6%) | 3,338 (44.4%) |
| Total | 79,891 (63.1%) | 46,646 (36.9%) |
Housing Structures by Number of Rooms in Escambia County
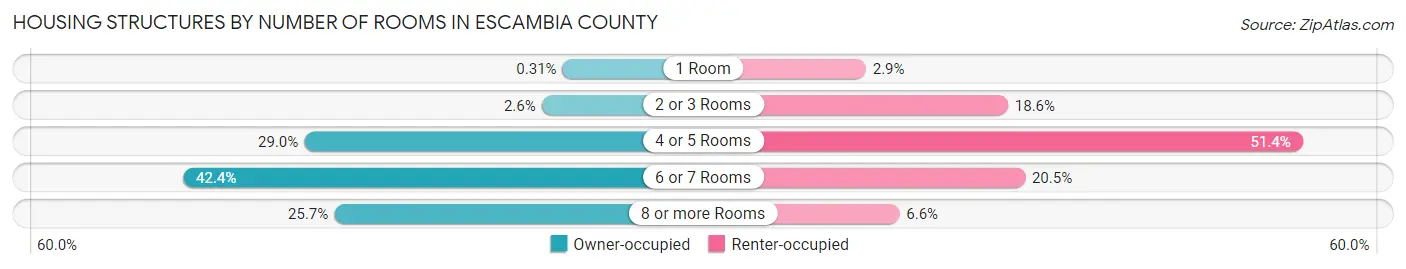
| Number of Rooms | Owner-occupied | Renter-occupied |
| 1 Room | 250 (0.3%) | 1,340 (2.9%) |
| 2 or 3 Rooms | 2,100 (2.6%) | 8,693 (18.6%) |
| 4 or 5 Rooms | 23,154 (29.0%) | 23,953 (51.3%) |
| 6 or 7 Rooms | 33,892 (42.4%) | 9,580 (20.5%) |
| 8 or more Rooms | 20,495 (25.7%) | 3,080 (6.6%) |
| Total | 79,891 (100.0%) | 46,646 (100.0%) |
Housing Structure by Heating Type in Escambia County
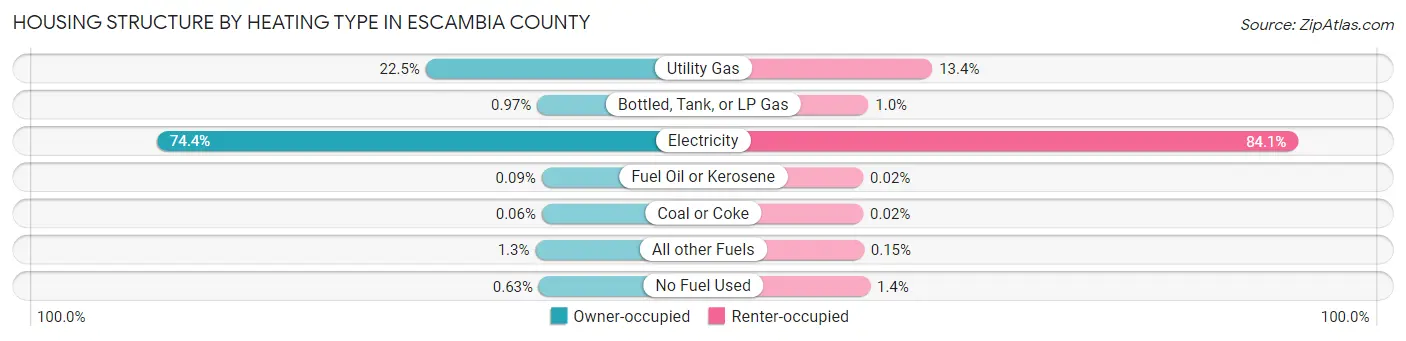
| Heating Type | Owner-occupied | Renter-occupied |
| Utility Gas | 17,972 (22.5%) | 6,236 (13.4%) |
| Bottled, Tank, or LP Gas | 771 (1.0%) | 478 (1.0%) |
| Electricity | 59,465 (74.4%) | 39,218 (84.1%) |
| Fuel Oil or Kerosene | 73 (0.1%) | 7 (0.0%) |
| Coal or Coke | 49 (0.1%) | 7 (0.0%) |
| All other Fuels | 1,056 (1.3%) | 70 (0.2%) |
| No Fuel Used | 505 (0.6%) | 630 (1.3%) |
| Total | 79,891 (100.0%) | 46,646 (100.0%) |
Household Vehicle Usage in Escambia County
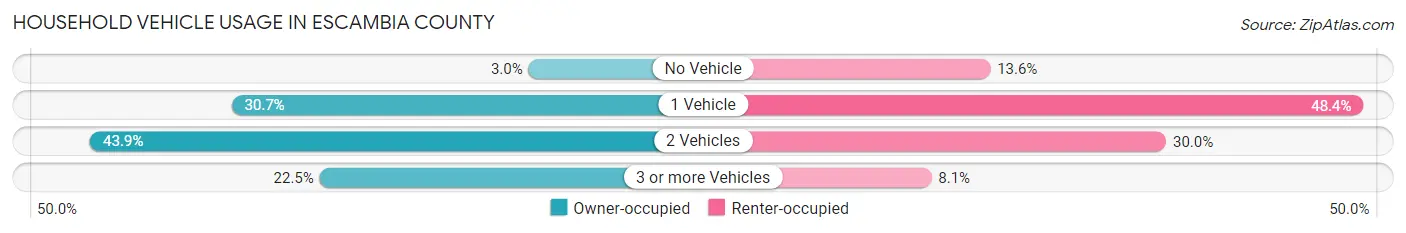
| Vehicles per Household | Owner-occupied | Renter-occupied |
| No Vehicle | 2,364 (3.0%) | 6,325 (13.6%) |
| 1 Vehicle | 24,517 (30.7%) | 22,574 (48.4%) |
| 2 Vehicles | 35,063 (43.9%) | 13,983 (30.0%) |
| 3 or more Vehicles | 17,947 (22.5%) | 3,764 (8.1%) |
| Total | 79,891 (100.0%) | 46,646 (100.0%) |
Real Estate & Mortgages in Escambia County
Real Estate and Mortgage Overview in Escambia County
| Characteristic | Without Mortgage | With Mortgage |
| Housing Units | 33,432 | 46,459 |
| Median Property Value | $177,400 | $222,100 |
| Median Household Income | $57,873 | $9,449 |
| Monthly Housing Costs | $475 | $2,786 |
| Real Estate Taxes | $1,031 | $2,720 |
Property Value by Mortgage Status in Escambia County
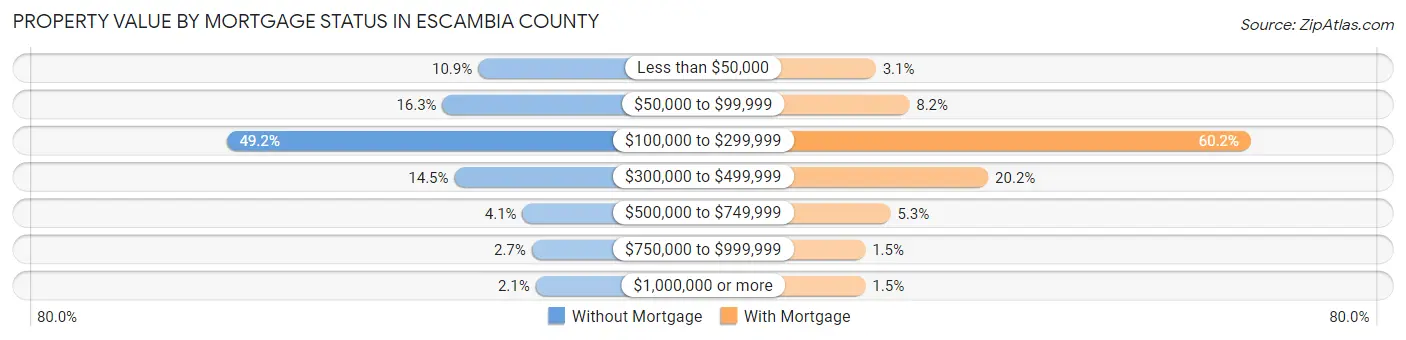
| Property Value | Without Mortgage | With Mortgage |
| Less than $50,000 | 3,648 (10.9%) | 1,430 (3.1%) |
| $50,000 to $99,999 | 5,461 (16.3%) | 3,804 (8.2%) |
| $100,000 to $299,999 | 16,460 (49.2%) | 27,983 (60.2%) |
| $300,000 to $499,999 | 4,850 (14.5%) | 9,390 (20.2%) |
| $500,000 to $749,999 | 1,383 (4.1%) | 2,473 (5.3%) |
| $750,000 to $999,999 | 915 (2.7%) | 684 (1.5%) |
| $1,000,000 or more | 715 (2.1%) | 695 (1.5%) |
| Total | 33,432 (100.0%) | 46,459 (100.0%) |
Household Income by Mortgage Status in Escambia County
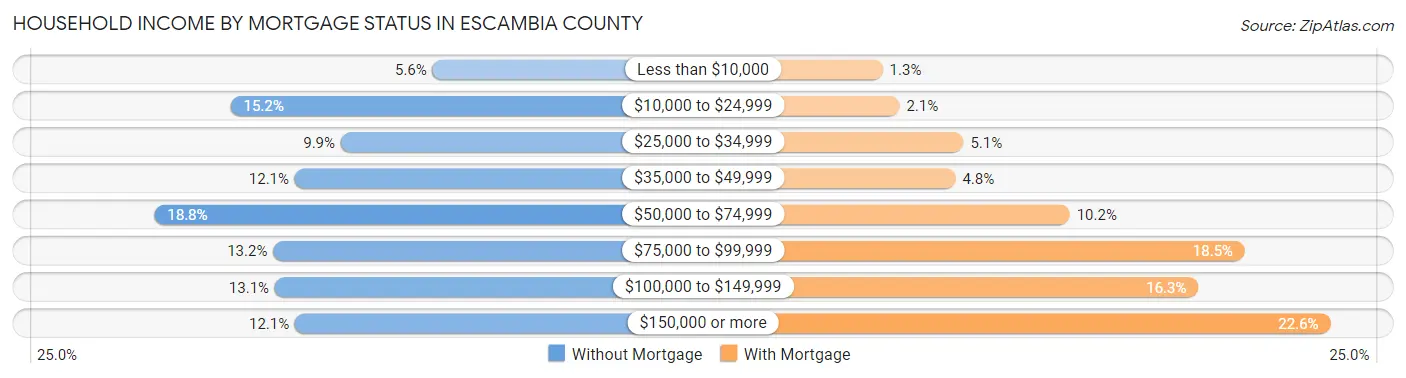
| Household Income | Without Mortgage | With Mortgage |
| Less than $10,000 | 1,861 (5.6%) | 601 (1.3%) |
| $10,000 to $24,999 | 5,077 (15.2%) | 971 (2.1%) |
| $25,000 to $34,999 | 3,323 (9.9%) | 2,390 (5.1%) |
| $35,000 to $49,999 | 4,054 (12.1%) | 2,211 (4.8%) |
| $50,000 to $74,999 | 6,293 (18.8%) | 4,737 (10.2%) |
| $75,000 to $99,999 | 4,400 (13.2%) | 8,614 (18.5%) |
| $100,000 to $149,999 | 4,373 (13.1%) | 7,582 (16.3%) |
| $150,000 or more | 4,051 (12.1%) | 10,505 (22.6%) |
| Total | 33,432 (100.0%) | 46,459 (100.0%) |
Property Value to Household Income Ratio in Escambia County
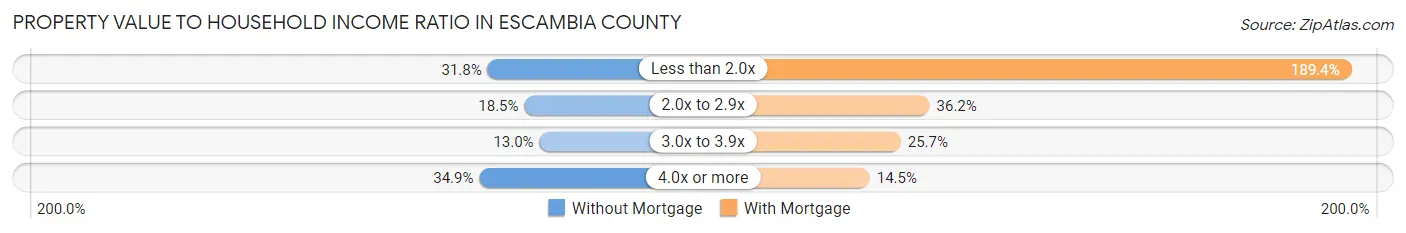
| Value-to-Income Ratio | Without Mortgage | With Mortgage |
| Less than 2.0x | 10,645 (31.8%) | 88,011 (189.4%) |
| 2.0x to 2.9x | 6,178 (18.5%) | 16,822 (36.2%) |
| 3.0x to 3.9x | 4,347 (13.0%) | 11,960 (25.7%) |
| 4.0x or more | 11,653 (34.9%) | 6,727 (14.5%) |
| Total | 33,432 (100.0%) | 46,459 (100.0%) |
Real Estate Taxes by Mortgage Status in Escambia County
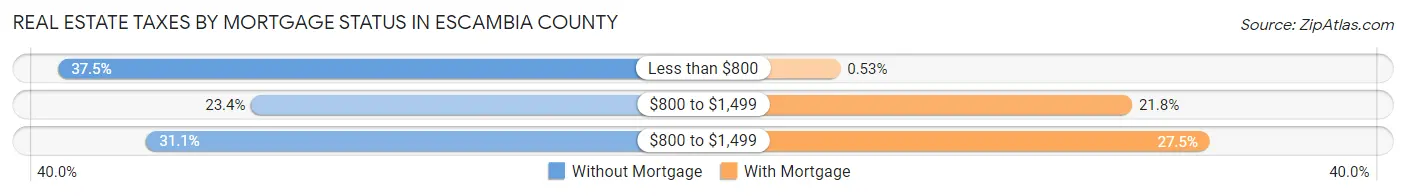
| Property Taxes | Without Mortgage | With Mortgage |
| Less than $800 | 12,550 (37.5%) | 246 (0.5%) |
| $800 to $1,499 | 7,835 (23.4%) | 10,146 (21.8%) |
| $800 to $1,499 | 10,397 (31.1%) | 12,785 (27.5%) |
| Total | 33,432 (100.0%) | 46,459 (100.0%) |
Health & Disability in Escambia County
Health Insurance Coverage by Age in Escambia County
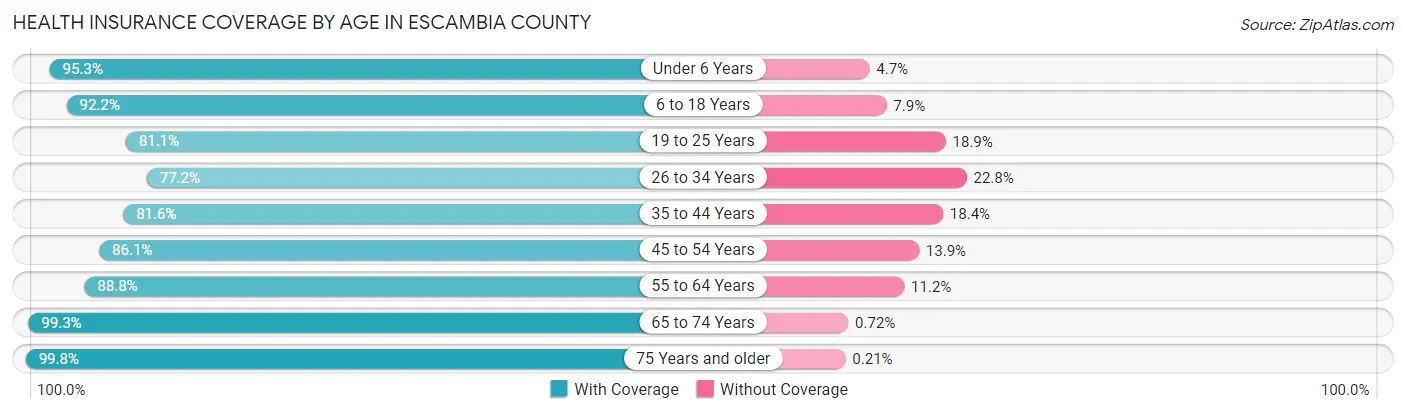
| Age Bracket | With Coverage | Without Coverage |
| Under 6 Years | 21,037 (95.3%) | 1,030 (4.7%) |
| 6 to 18 Years | 44,984 (92.1%) | 3,834 (7.9%) |
| 19 to 25 Years | 24,293 (81.1%) | 5,659 (18.9%) |
| 26 to 34 Years | 29,542 (77.2%) | 8,718 (22.8%) |
| 35 to 44 Years | 28,269 (81.6%) | 6,369 (18.4%) |
| 45 to 54 Years | 29,976 (86.1%) | 4,844 (13.9%) |
| 55 to 64 Years | 37,875 (88.8%) | 4,756 (11.2%) |
| 65 to 74 Years | 32,161 (99.3%) | 234 (0.7%) |
| 75 Years and older | 21,284 (99.8%) | 45 (0.2%) |
| Total | 269,421 (88.4%) | 35,489 (11.6%) |
Health Insurance Coverage by Citizenship Status in Escambia County
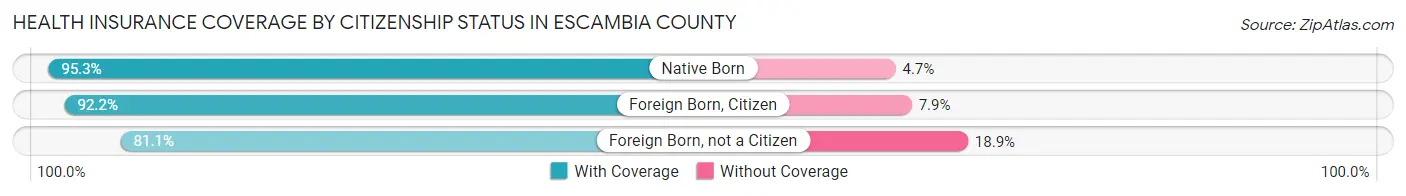
| Citizenship Status | With Coverage | Without Coverage |
| Native Born | 21,037 (95.3%) | 1,030 (4.7%) |
| Foreign Born, Citizen | 44,984 (92.1%) | 3,834 (7.9%) |
| Foreign Born, not a Citizen | 24,293 (81.1%) | 5,659 (18.9%) |
Health Insurance Coverage by Household Income in Escambia County
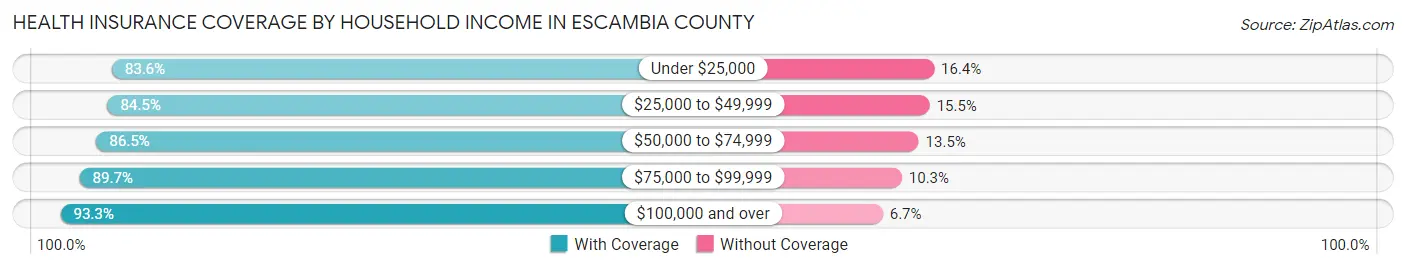
| Household Income | With Coverage | Without Coverage |
| Under $25,000 | 33,057 (83.6%) | 6,464 (16.4%) |
| $25,000 to $49,999 | 49,347 (84.5%) | 9,073 (15.5%) |
| $50,000 to $74,999 | 49,914 (86.5%) | 7,762 (13.5%) |
| $75,000 to $99,999 | 39,686 (89.7%) | 4,568 (10.3%) |
| $100,000 and over | 90,975 (93.3%) | 6,579 (6.7%) |
Public vs Private Health Insurance Coverage by Age in Escambia County
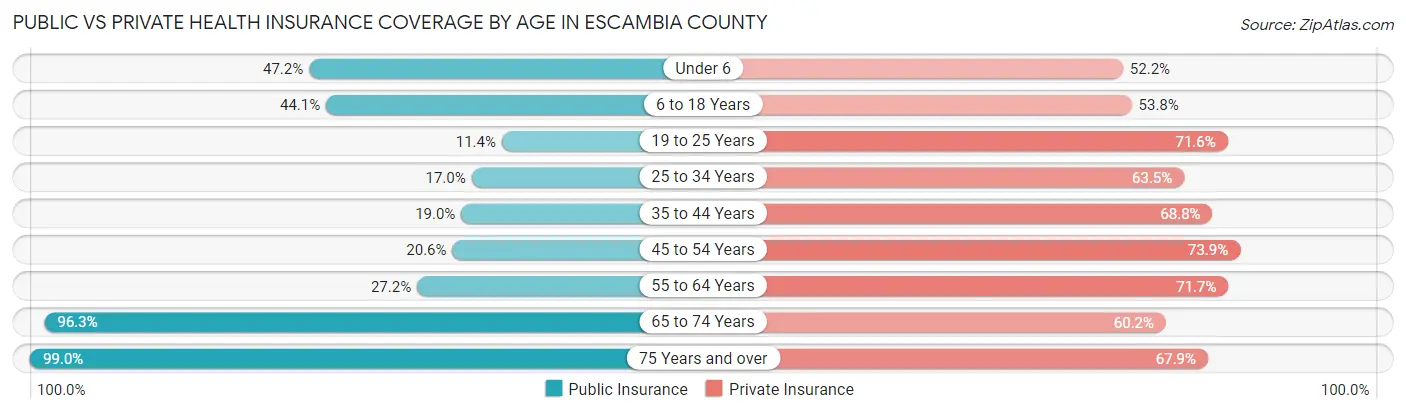
| Age Bracket | Public Insurance | Private Insurance |
| Under 6 | 10,415 (47.2%) | 11,514 (52.2%) |
| 6 to 18 Years | 21,506 (44.1%) | 26,260 (53.8%) |
| 19 to 25 Years | 3,421 (11.4%) | 21,447 (71.6%) |
| 25 to 34 Years | 6,520 (17.0%) | 24,308 (63.5%) |
| 35 to 44 Years | 6,567 (19.0%) | 23,829 (68.8%) |
| 45 to 54 Years | 7,172 (20.6%) | 25,734 (73.9%) |
| 55 to 64 Years | 11,583 (27.2%) | 30,584 (71.7%) |
| 65 to 74 Years | 31,209 (96.3%) | 19,485 (60.2%) |
| 75 Years and over | 21,115 (99.0%) | 14,491 (67.9%) |
| Total | 119,508 (39.2%) | 197,652 (64.8%) |
Disability Status by Sex by Age in Escambia County
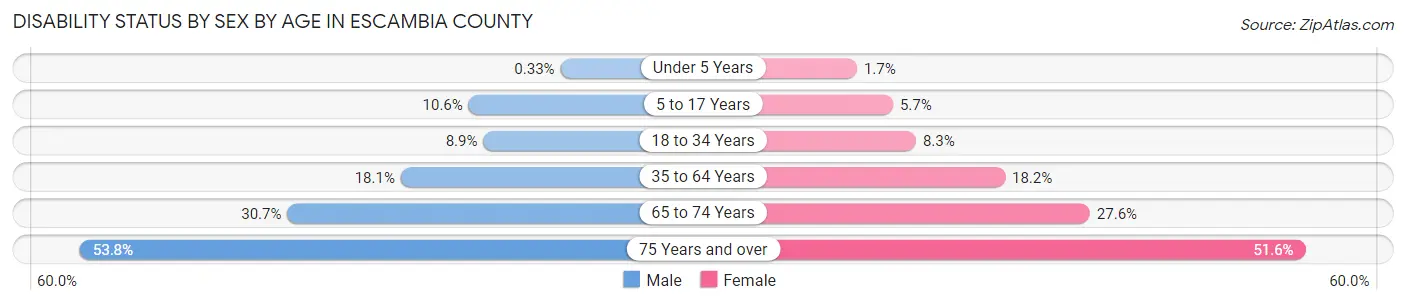
| Age Bracket | Male | Female |
| Under 5 Years | 32 (0.3%) | 154 (1.7%) |
| 5 to 17 Years | 2,601 (10.5%) | 1,335 (5.7%) |
| 18 to 34 Years | 3,179 (8.9%) | 3,033 (8.3%) |
| 35 to 64 Years | 9,700 (18.1%) | 10,638 (18.2%) |
| 65 to 74 Years | 4,529 (30.7%) | 4,880 (27.6%) |
| 75 Years and over | 4,744 (53.8%) | 6,462 (51.6%) |
Disability Class by Sex by Age in Escambia County
Disability Class: Hearing Difficulty
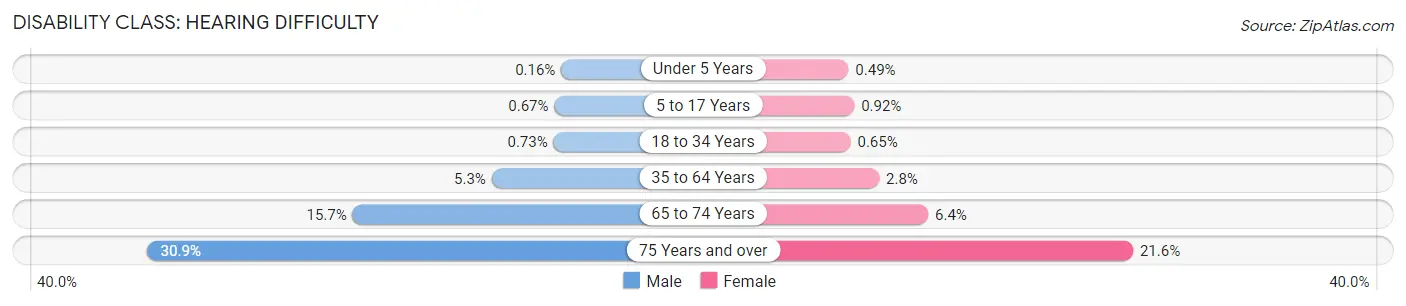
| Age Bracket | Male | Female |
| Under 5 Years | 15 (0.2%) | 45 (0.5%) |
| 5 to 17 Years | 165 (0.7%) | 215 (0.9%) |
| 18 to 34 Years | 260 (0.7%) | 237 (0.6%) |
| 35 to 64 Years | 2,847 (5.3%) | 1,621 (2.8%) |
| 65 to 74 Years | 2,305 (15.7%) | 1,132 (6.4%) |
| 75 Years and over | 2,719 (30.9%) | 2,706 (21.6%) |
Disability Class: Vision Difficulty
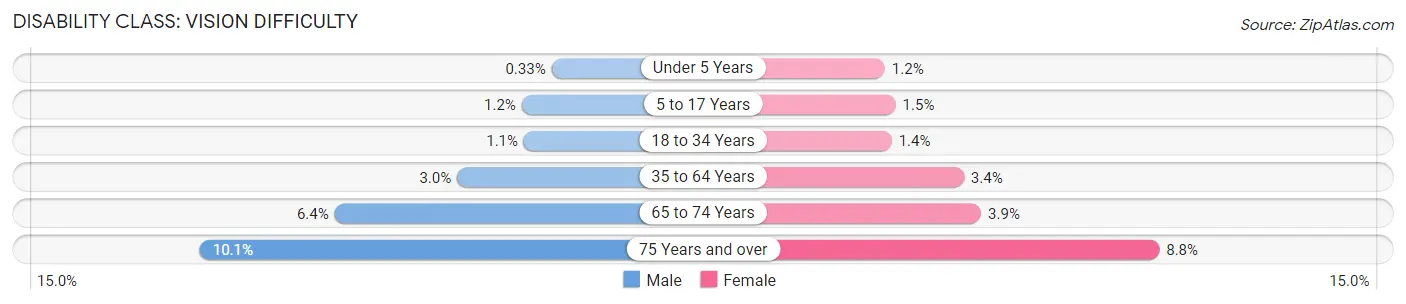
| Age Bracket | Male | Female |
| Under 5 Years | 32 (0.3%) | 109 (1.2%) |
| 5 to 17 Years | 286 (1.2%) | 351 (1.5%) |
| 18 to 34 Years | 393 (1.1%) | 511 (1.4%) |
| 35 to 64 Years | 1,583 (3.0%) | 1,990 (3.4%) |
| 65 to 74 Years | 938 (6.4%) | 686 (3.9%) |
| 75 Years and over | 892 (10.1%) | 1,107 (8.8%) |
Disability Class: Cognitive Difficulty
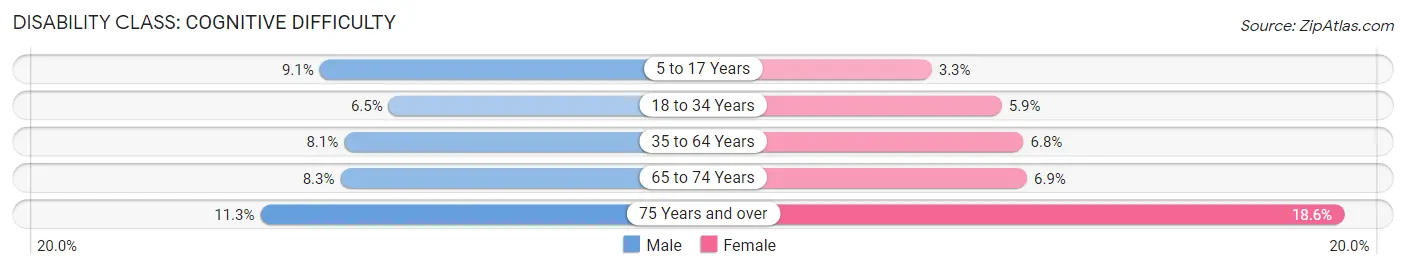
| Age Bracket | Male | Female |
| 5 to 17 Years | 2,232 (9.0%) | 783 (3.3%) |
| 18 to 34 Years | 2,313 (6.5%) | 2,182 (5.9%) |
| 35 to 64 Years | 4,362 (8.1%) | 3,950 (6.8%) |
| 65 to 74 Years | 1,220 (8.3%) | 1,216 (6.9%) |
| 75 Years and over | 991 (11.3%) | 2,333 (18.6%) |
Disability Class: Ambulatory Difficulty
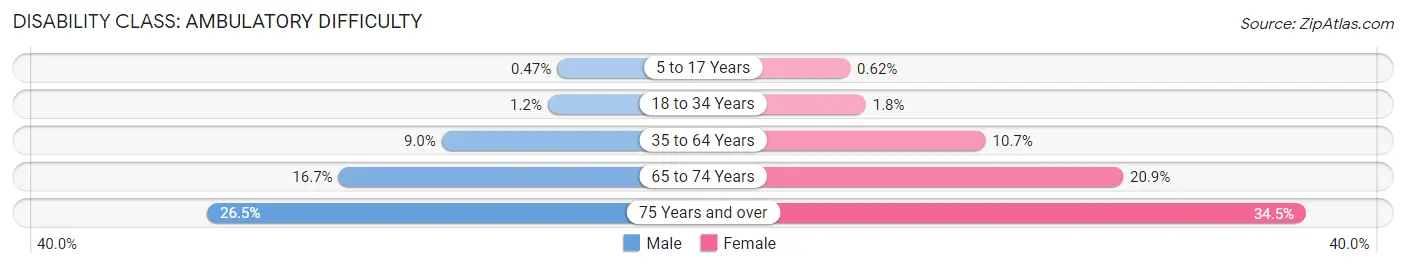
| Age Bracket | Male | Female |
| 5 to 17 Years | 116 (0.5%) | 146 (0.6%) |
| 18 to 34 Years | 414 (1.2%) | 652 (1.8%) |
| 35 to 64 Years | 4,841 (9.0%) | 6,248 (10.7%) |
| 65 to 74 Years | 2,460 (16.7%) | 3,689 (20.9%) |
| 75 Years and over | 2,331 (26.5%) | 4,313 (34.5%) |
Disability Class: Self-Care Difficulty
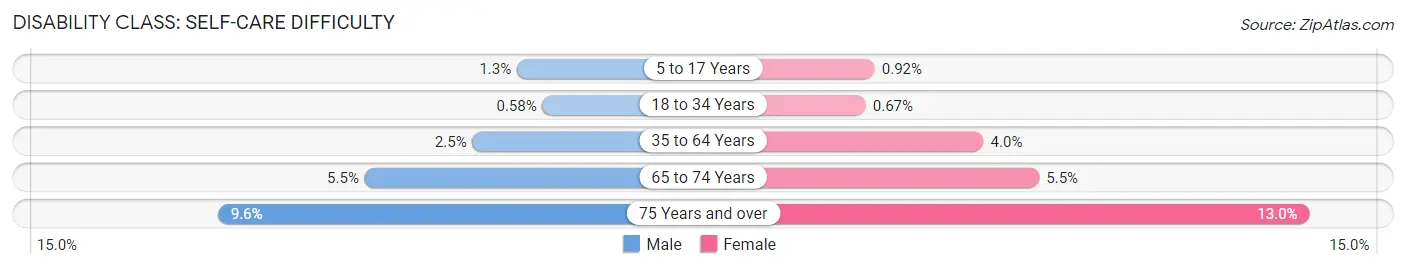
| Age Bracket | Male | Female |
| 5 to 17 Years | 317 (1.3%) | 215 (0.9%) |
| 18 to 34 Years | 207 (0.6%) | 245 (0.7%) |
| 35 to 64 Years | 1,355 (2.5%) | 2,311 (4.0%) |
| 65 to 74 Years | 814 (5.5%) | 972 (5.5%) |
| 75 Years and over | 848 (9.6%) | 1,630 (13.0%) |
Technology Access in Escambia County
Computing Device Access in Escambia County
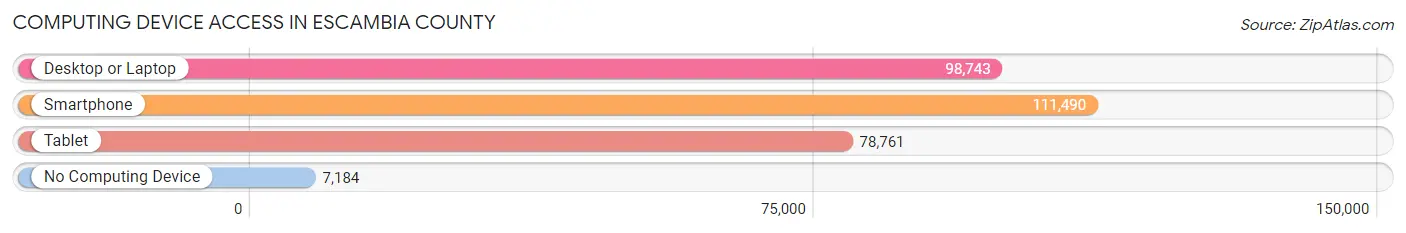
| Device Type | # Households | % Households |
| Desktop or Laptop | 98,743 | 78.0% |
| Smartphone | 111,490 | 88.1% |
| Tablet | 78,761 | 62.2% |
| No Computing Device | 7,184 | 5.7% |
| Total | 126,537 | 100.0% |
Internet Access in Escambia County
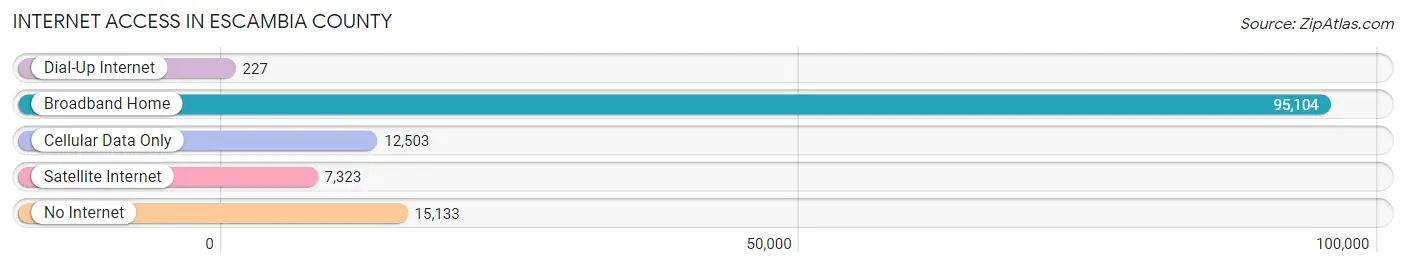
| Internet Type | # Households | % Households |
| Dial-Up Internet | 227 | 0.2% |
| Broadband Home | 95,104 | 75.2% |
| Cellular Data Only | 12,503 | 9.9% |
| Satellite Internet | 7,323 | 5.8% |
| No Internet | 15,133 | 12.0% |
| Total | 126,537 | 100.0% |
Escambia County Summary
Escambia County is located in the northwestern corner of Florida, and is bordered by Santa Rosa County to the east, Baldwin County, Alabama to the north, and the Gulf of Mexico to the south. The county seat is Pensacola, and the county is part of the Pensacola-Ferry Pass-Brent Metropolitan Statistical Area. As of the 2010 census, the population of Escambia County was 297,619.
History
Escambia County was established in 1821, and is one of the oldest counties in Florida. The county was named after the Escambia River, which was named by Spanish explorers in the 16th century. The area was originally inhabited by Native American tribes, including the Creek, Choctaw, and Seminole. The first European settlers arrived in the area in the late 17th century, and the area was part of the Spanish colony of West Florida until 1821, when it became part of the United States.
In the early 19th century, the area was part of the Territory of Florida, and in 1821, it became part of the newly formed state of Florida. The county was created in 1821, and Pensacola was designated as the county seat. The county was initially divided into two districts, Escambia and Santa Rosa, and the county was later divided into four districts.
In the early 20th century, the county was a major center for the timber industry, and the county was also home to a large naval base. During World War II, the county was home to several military bases, and the population of the county increased significantly.
Geography
Escambia County covers an area of 875 square miles, and is located in the northwestern corner of Florida. The county is bordered by Santa Rosa County to the east, Baldwin County, Alabama to the north, and the Gulf of Mexico to the south. The county is part of the Pensacola-Ferry Pass-Brent Metropolitan Statistical Area.
The county is mostly flat, with some rolling hills in the northern part of the county. The Escambia River runs through the county, and there are several other rivers and creeks in the area. The county is home to several lakes, including Big Lagoon, Bayou Chico, and Bayou Texar.
The climate of Escambia County is humid subtropical, with hot, humid summers and mild winters. The average annual temperature is 68 degrees Fahrenheit, and the average annual precipitation is 62 inches.
Economy
The economy of Escambia County is largely based on the military, tourism, and manufacturing. The county is home to several military bases, including Naval Air Station Pensacola, Corry Station, and Saufley Field. The military is the largest employer in the county, and the military bases contribute significantly to the local economy.
The county is also home to several tourist attractions, including the Pensacola Naval Air Station Museum, the National Naval Aviation Museum, and the Pensacola Lighthouse. Tourism is a major industry in the county, and the county is home to several resorts and hotels.
Manufacturing is also an important part of the economy of Escambia County. The county is home to several manufacturing companies, including International Paper, Gulf Power, and Gulf Coast Shipbuilding.
Demographics
As of the 2010 census, the population of Escambia County was 297,619. The population is 53.3% white, 37.3% African American, 4.2% Hispanic or Latino, 2.2% Asian, and 0.7% Native American. The median household income is $44,922, and the median per capita income is $22,845. The poverty rate is 19.3%.
Conclusion
Escambia County is located in the northwestern corner of Florida, and is bordered by Santa Rosa County to the east, Baldwin County, Alabama to the north, and the Gulf of Mexico to the south. The county was established in 1821, and is one of the oldest counties in Florida. The economy of Escambia County is largely based on the military, tourism, and manufacturing. As of the 2010 census, the population of Escambia County was 297,619, and the median household income is $44,922.
Common Questions
What is Per Capita Income in Escambia County?
Per Capita income in Escambia County is $33,656.
What is the Median Family Income in Escambia County?
Median Family Income in Escambia County is $74,479.
What is the Median Household income in Escambia County?
Median Household Income in Escambia County is $61,642.
What is Income or Wage Gap in Escambia County?
Income or Wage Gap in Escambia County is 20.2%.
Women in Escambia County earn 79.8 cents for every dollar earned by a man.
What is Family Income Deficit in Escambia County?
Family Income Deficit in Escambia County is $10,650.
Families that are below poverty line in Escambia County earn $10,650 less on average than the poverty threshold level.
What is Inequality or Gini Index in Escambia County?
Inequality or Gini Index in Escambia County is 0.45.
What is the Total Population of Escambia County?
Total Population of Escambia County is 321,296.
What is the Total Male Population of Escambia County?
Total Male Population of Escambia County is 159,191.
What is the Total Female Population of Escambia County?
Total Female Population of Escambia County is 162,105.
What is the Ratio of Males per 100 Females in Escambia County?
There are 98.20 Males per 100 Females in Escambia County.
What is the Ratio of Females per 100 Males in Escambia County?
There are 101.83 Females per 100 Males in Escambia County.
What is the Median Population Age in Escambia County?
Median Population Age in Escambia County is 38.1 Years.
What is the Average Family Size in Escambia County
Average Family Size in Escambia County is 3.0 People.
What is the Average Household Size in Escambia County
Average Household Size in Escambia County is 2.4 People.
How Large is the Labor Force in Escambia County?
There are 159,140 People in the Labor Forcein in Escambia County.
What is the Percentage of People in the Labor Force in Escambia County?
60.8% of People are in the Labor Force in Escambia County.
What is the Unemployment Rate in Escambia County?
Unemployment Rate in Escambia County is 6.2%.