Polk County, FL Map & Demographics
Polk County Map
Polk County Overview
$30,262
PER CAPITA INCOME
$69,667
AVG FAMILY INCOME
$60,901
AVG HOUSEHOLD INCOME
24.2%
WAGE / INCOME GAP [ % ]
75.8¢/ $1
WAGE / INCOME GAP [ $ ]
$11,654
FAMILY INCOME DEFICIT
0.45
INEQUALITY / GINI INDEX
736,229
TOTAL POPULATION
363,269
MALE POPULATION
372,960
FEMALE POPULATION
97.40
MALES / 100 FEMALES
102.67
FEMALES / 100 MALES
39.8
MEDIAN AGE
3.2
AVG FAMILY SIZE
2.7
AVG HOUSEHOLD SIZE
336,279
LABOR FORCE [ PEOPLE ]
56.6%
PERCENT IN LABOR FORCE
4.6%
UNEMPLOYMENT RATE
Income in Polk County
Income Overview in Polk County
Per Capita Income in Polk County is $30,262, while median incomes of families and households are $69,667 and $60,901 respectively.
| Characteristic | Number | Measure |
| Per Capita Income | 736,229 | $30,262 |
| Median Family Income | 181,451 | $69,667 |
| Mean Family Income | 181,451 | $90,095 |
| Median Household Income | 264,145 | $60,901 |
| Mean Household Income | 264,145 | $80,027 |
| Income Deficit | 181,451 | $11,654 |
| Wage / Income Gap (%) | 736,229 | 24.20% |
| Wage / Income Gap ($) | 736,229 | 75.80¢ per $1 |
| Gini / Inequality Index | 736,229 | 0.45 |
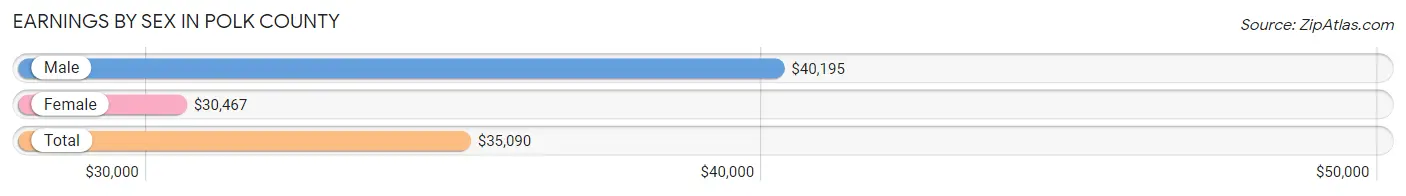
Earnings by Sex in Polk County
Average Earnings in Polk County are $35,090, $40,195 for men and $30,467 for women, a difference of 24.2%.
| Sex | Number | Average Earnings |
| Male | 182,684 (52.8%) | $40,195 |
| Female | 163,533 (47.2%) | $30,467 |
| Total | 346,217 (100.0%) | $35,090 |
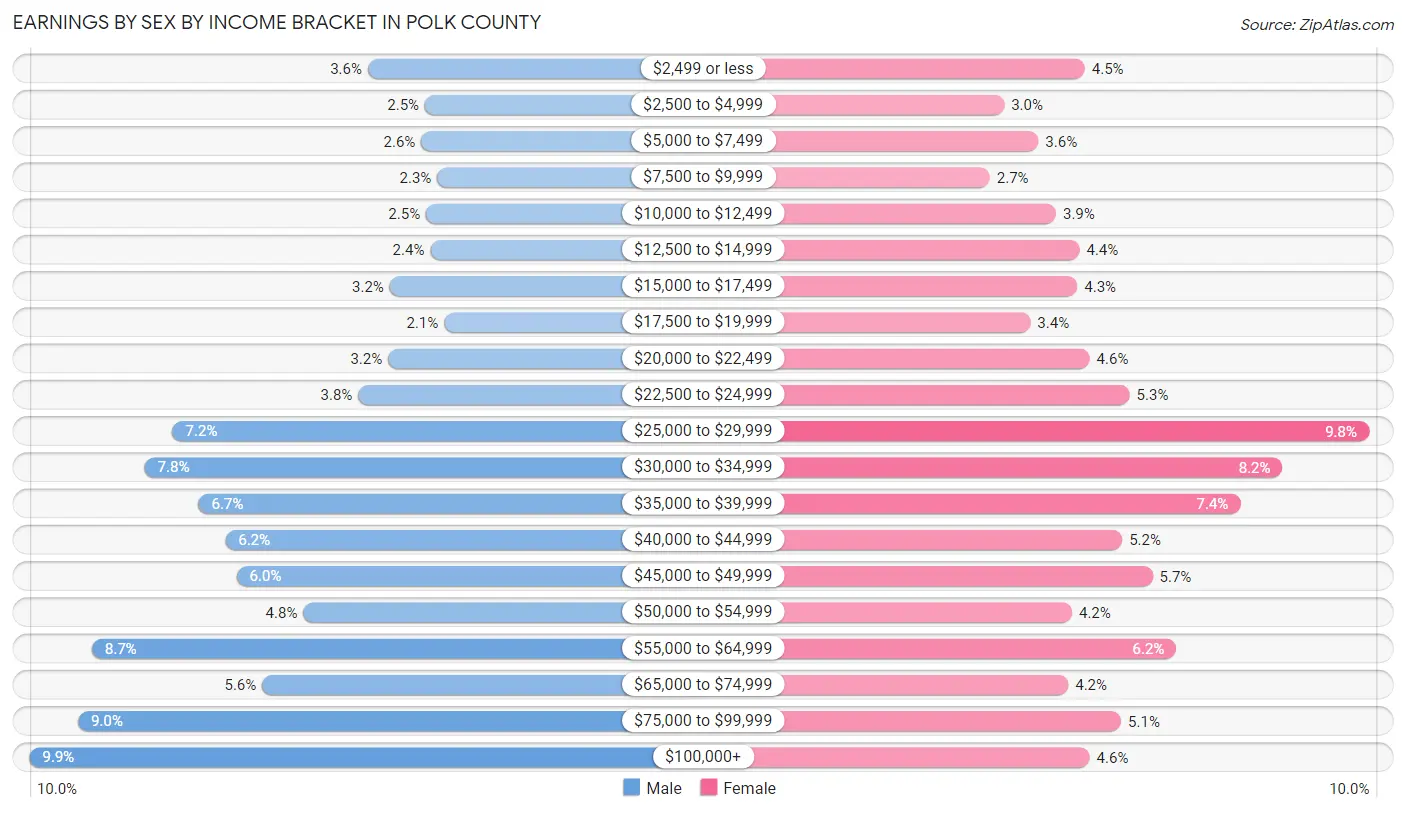
Earnings by Sex by Income Bracket in Polk County
The most common earnings brackets in Polk County are $100,000+ for men (18,100 | 9.9%) and $25,000 to $29,999 for women (16,001 | 9.8%).
| Income | Male | Female |
| $2,499 or less | 6,530 (3.6%) | 7,286 (4.5%) |
| $2,500 to $4,999 | 4,559 (2.5%) | 4,831 (2.9%) |
| $5,000 to $7,499 | 4,694 (2.6%) | 5,868 (3.6%) |
| $7,500 to $9,999 | 4,155 (2.3%) | 4,382 (2.7%) |
| $10,000 to $12,499 | 4,531 (2.5%) | 6,409 (3.9%) |
| $12,500 to $14,999 | 4,390 (2.4%) | 7,129 (4.4%) |
| $15,000 to $17,499 | 5,768 (3.2%) | 7,061 (4.3%) |
| $17,500 to $19,999 | 3,915 (2.1%) | 5,630 (3.4%) |
| $20,000 to $22,499 | 5,835 (3.2%) | 7,435 (4.5%) |
| $22,500 to $24,999 | 6,842 (3.7%) | 8,670 (5.3%) |
| $25,000 to $29,999 | 13,202 (7.2%) | 16,001 (9.8%) |
| $30,000 to $34,999 | 14,162 (7.7%) | 13,351 (8.2%) |
| $35,000 to $39,999 | 12,317 (6.7%) | 12,057 (7.4%) |
| $40,000 to $44,999 | 11,397 (6.2%) | 8,436 (5.2%) |
| $45,000 to $49,999 | 11,011 (6.0%) | 9,367 (5.7%) |
| $50,000 to $54,999 | 8,733 (4.8%) | 6,896 (4.2%) |
| $55,000 to $64,999 | 15,960 (8.7%) | 10,097 (6.2%) |
| $65,000 to $74,999 | 10,143 (5.6%) | 6,784 (4.2%) |
| $75,000 to $99,999 | 16,440 (9.0%) | 8,400 (5.1%) |
| $100,000+ | 18,100 (9.9%) | 7,443 (4.5%) |
| Total | 182,684 (100.0%) | 163,533 (100.0%) |
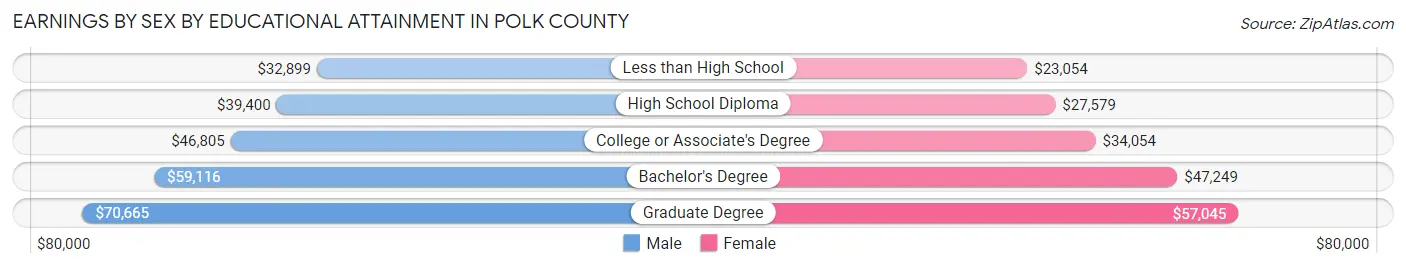
Earnings by Sex by Educational Attainment in Polk County
Average earnings in Polk County are $44,420 for men and $34,087 for women, a difference of 23.3%. Men with an educational attainment of graduate degree enjoy the highest average annual earnings of $70,665, while those with less than high school education earn the least with $32,899. Women with an educational attainment of graduate degree earn the most with the average annual earnings of $57,045, while those with less than high school education have the smallest earnings of $23,054.
| Educational Attainment | Male Income | Female Income |
| Less than High School | $32,899 | $23,054 |
| High School Diploma | $39,400 | $27,579 |
| College or Associate's Degree | $46,805 | $34,054 |
| Bachelor's Degree | $59,116 | $47,249 |
| Graduate Degree | $70,665 | $57,045 |
| Total | $44,420 | $34,087 |
Family Income in Polk County
Family Income Brackets in Polk County
According to the Polk County family income data, there are 37,197 families falling into the $50,000 to $74,999 income range, which is the most common income bracket and makes up 20.5% of all families. Conversely, the $10,000 to $14,999 income bracket is the least frequent group with only 3,448 families (1.9%) belonging to this category.
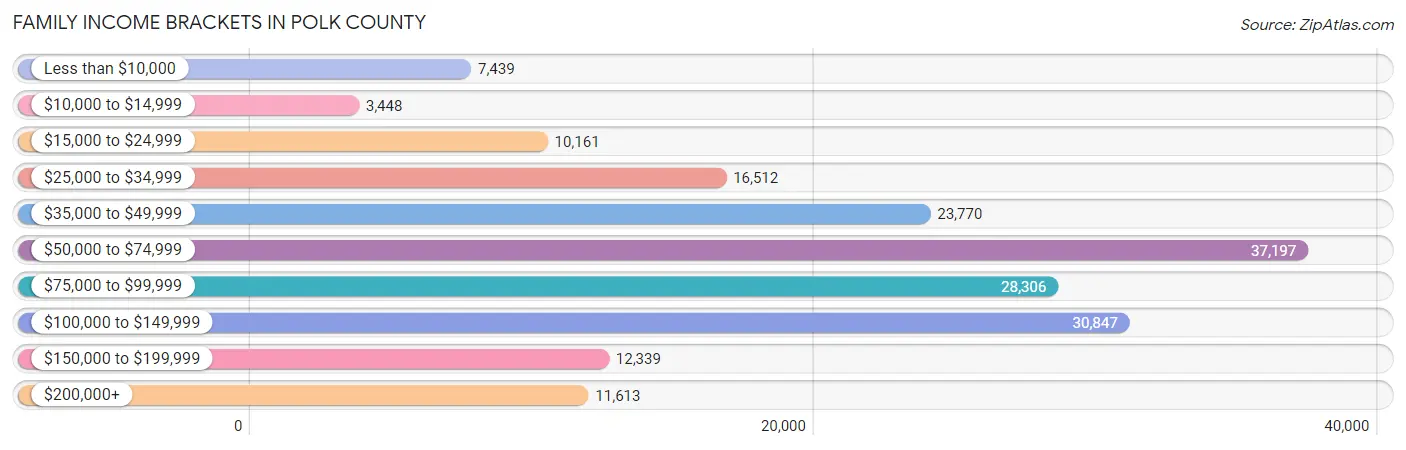
| Income Bracket | # Families | % Families |
| Less than $10,000 | 7,439 | 4.1% |
| $10,000 to $14,999 | 3,448 | 1.9% |
| $15,000 to $24,999 | 10,161 | 5.6% |
| $25,000 to $34,999 | 16,512 | 9.1% |
| $35,000 to $49,999 | 23,770 | 13.1% |
| $50,000 to $74,999 | 37,197 | 20.5% |
| $75,000 to $99,999 | 28,306 | 15.6% |
| $100,000 to $149,999 | 30,847 | 17.0% |
| $150,000 to $199,999 | 12,339 | 6.8% |
| $200,000+ | 11,613 | 6.4% |
Family Income by Famaliy Size in Polk County
5-person families (14,827 | 8.2%) account for the highest median family income in Polk County with $82,771 per family, while 2-person families (88,320 | 48.7%) have the highest median income of $31,598 per family member.
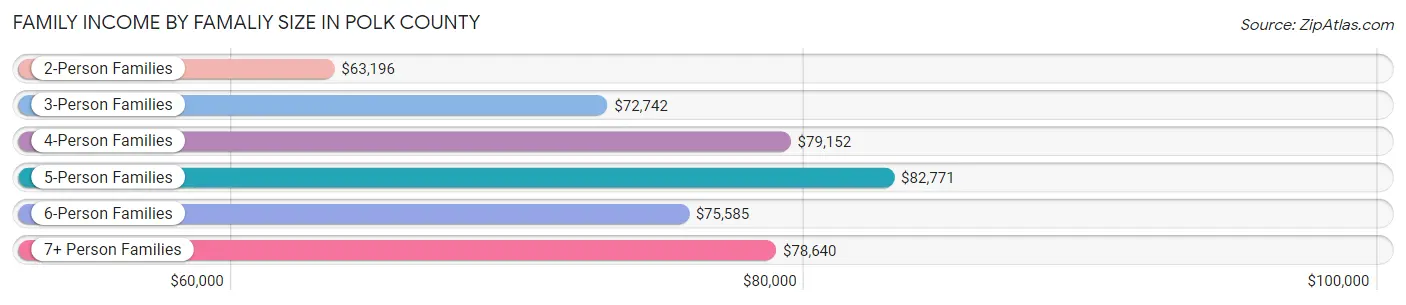
| Income Bracket | # Families | Median Income |
| 2-Person Families | 88,320 (48.7%) | $63,196 |
| 3-Person Families | 37,463 (20.6%) | $72,742 |
| 4-Person Families | 30,434 (16.8%) | $79,152 |
| 5-Person Families | 14,827 (8.2%) | $82,771 |
| 6-Person Families | 6,188 (3.4%) | $75,585 |
| 7+ Person Families | 4,219 (2.3%) | $78,640 |
| Total | 181,451 (100.0%) | $69,667 |
Family Income by Number of Earners in Polk County
The median family income in Polk County is $69,667, with families comprising 3+ earners (19,087) having the highest median family income of $118,599, while families with no earners (39,489) have the lowest median family income of $42,567, accounting for 10.5% and 21.8% of families, respectively.
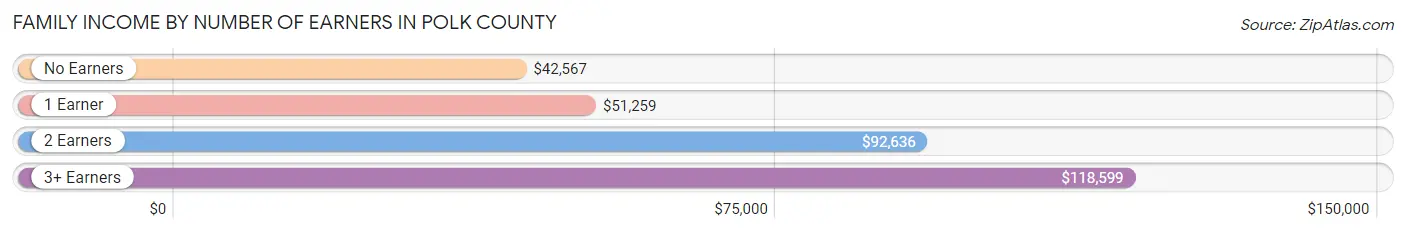
| Number of Earners | # Families | Median Income |
| No Earners | 39,489 (21.8%) | $42,567 |
| 1 Earner | 60,234 (33.2%) | $51,259 |
| 2 Earners | 62,641 (34.5%) | $92,636 |
| 3+ Earners | 19,087 (10.5%) | $118,599 |
| Total | 181,451 (100.0%) | $69,667 |
Household Income in Polk County
Household Income Brackets in Polk County
With 52,037 households falling in the category, the $50,000 to $74,999 income range is the most frequent in Polk County, accounting for 19.7% of all households. In contrast, only 9,773 households (3.7%) fall into the $10,000 to $14,999 income bracket, making it the least populous group.
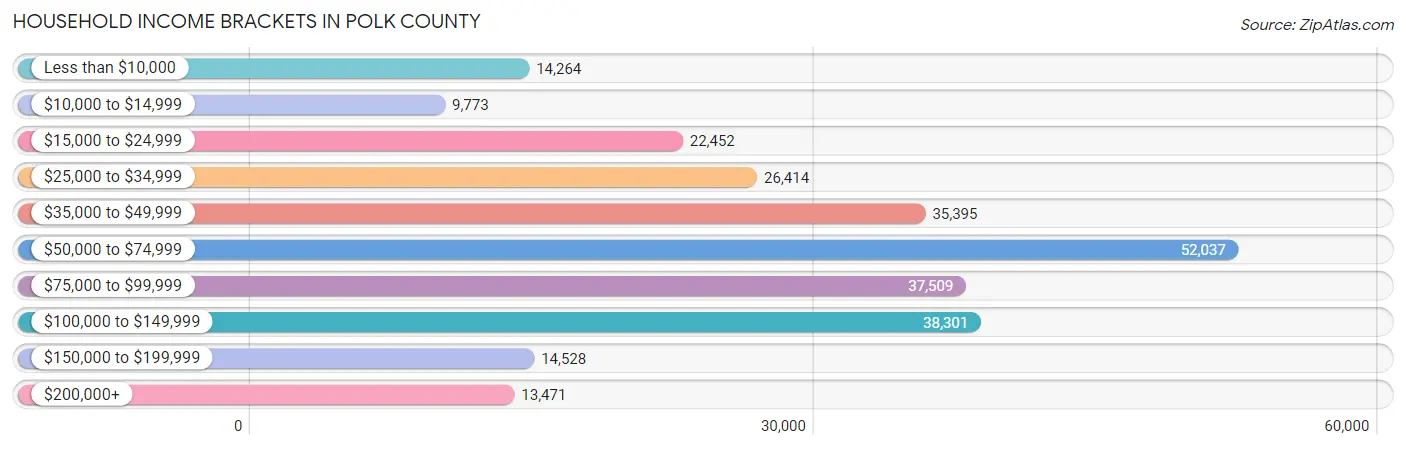
| Income Bracket | # Households | % Households |
| Less than $10,000 | 14,264 | 5.4% |
| $10,000 to $14,999 | 9,773 | 3.7% |
| $15,000 to $24,999 | 22,452 | 8.5% |
| $25,000 to $34,999 | 26,414 | 10.0% |
| $35,000 to $49,999 | 35,395 | 13.4% |
| $50,000 to $74,999 | 52,037 | 19.7% |
| $75,000 to $99,999 | 37,509 | 14.2% |
| $100,000 to $149,999 | 38,301 | 14.5% |
| $150,000 to $199,999 | 14,528 | 5.5% |
| $200,000+ | 13,471 | 5.1% |
Household Income by Householder Age in Polk County
The median household income in Polk County is $60,901, with the highest median household income of $72,836 found in the 45 to 64 years age bracket for the primary householder. A total of 90,612 households (34.3%) fall into this category. Meanwhile, the 15 to 24 years age bracket for the primary householder has the lowest median household income of $46,746, with 7,700 households (2.9%) in this group.
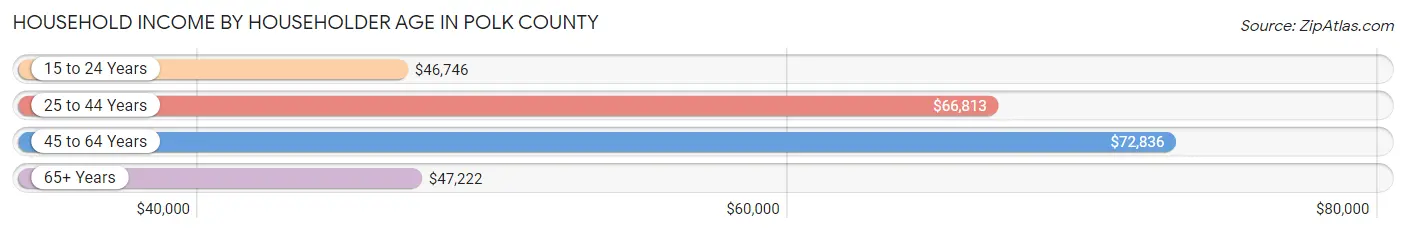
| Income Bracket | # Households | Median Income |
| 15 to 24 Years | 7,700 (2.9%) | $46,746 |
| 25 to 44 Years | 79,131 (30.0%) | $66,813 |
| 45 to 64 Years | 90,612 (34.3%) | $72,836 |
| 65+ Years | 86,702 (32.8%) | $47,222 |
| Total | 264,145 (100.0%) | $60,901 |
Poverty in Polk County
Income Below Poverty by Sex and Age in Polk County
With 13.6% poverty level for males and 16.0% for females among the residents of Polk County, 6 to 11 year old males and 5 year old females are the most vulnerable to poverty, with 6,746 males (24.7%) and 951 females (26.1%) in their respective age groups living below the poverty level.
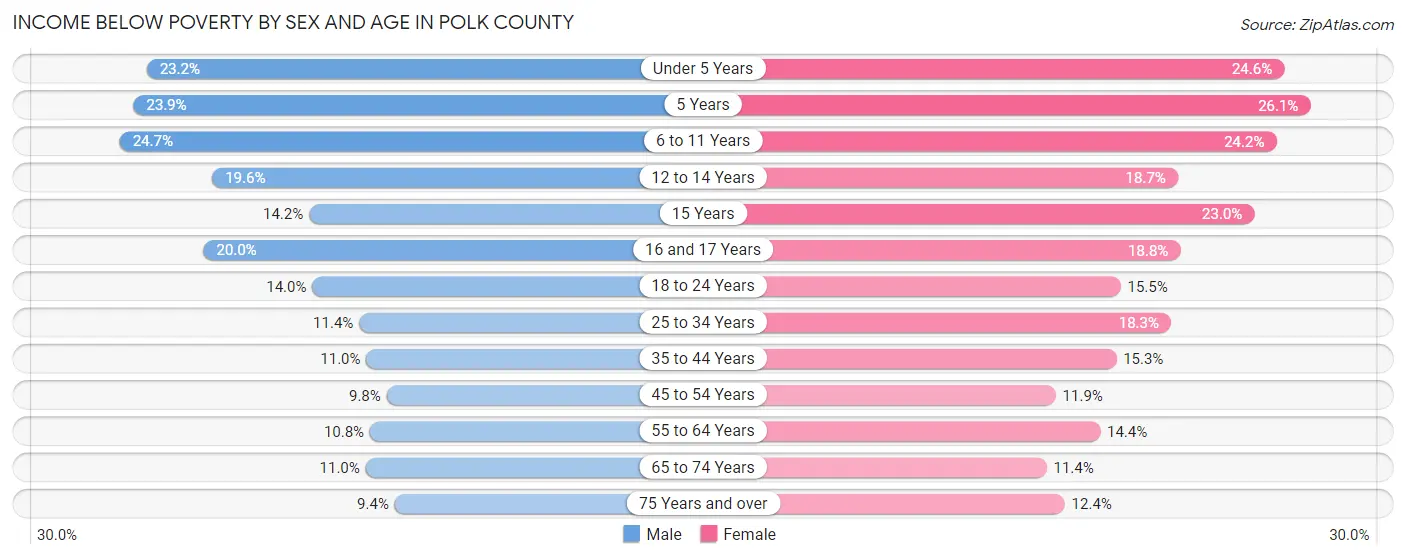
| Age Bracket | Male | Female |
| Under 5 Years | 4,784 (23.2%) | 4,827 (24.6%) |
| 5 Years | 956 (23.9%) | 951 (26.1%) |
| 6 to 11 Years | 6,746 (24.7%) | 6,388 (24.2%) |
| 12 to 14 Years | 2,909 (19.6%) | 2,604 (18.7%) |
| 15 Years | 612 (14.2%) | 1,159 (23.0%) |
| 16 and 17 Years | 2,041 (20.0%) | 1,641 (18.8%) |
| 18 to 24 Years | 4,177 (14.0%) | 4,596 (15.5%) |
| 25 to 34 Years | 5,411 (11.4%) | 8,757 (18.3%) |
| 35 to 44 Years | 4,827 (11.0%) | 6,924 (15.3%) |
| 45 to 54 Years | 4,214 (9.8%) | 5,150 (11.9%) |
| 55 to 64 Years | 4,550 (10.8%) | 6,539 (14.4%) |
| 65 to 74 Years | 4,117 (11.0%) | 4,944 (11.4%) |
| 75 Years and over | 2,698 (9.4%) | 4,206 (12.4%) |
| Total | 48,042 (13.6%) | 58,686 (16.0%) |
Income Above Poverty by Sex and Age in Polk County
According to the poverty statistics in Polk County, males aged 75 years and over and females aged 65 to 74 years are the age groups that are most secure financially, with 90.6% of males and 88.6% of females in these age groups living above the poverty line.
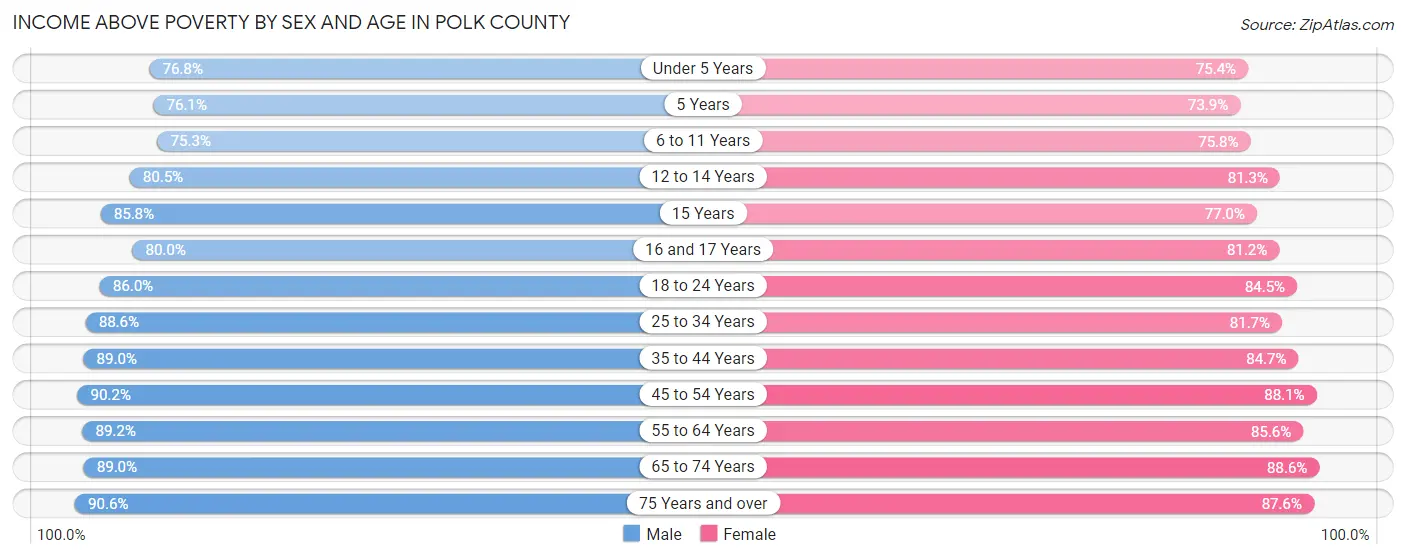
| Age Bracket | Male | Female |
| Under 5 Years | 15,838 (76.8%) | 14,778 (75.4%) |
| 5 Years | 3,037 (76.1%) | 2,696 (73.9%) |
| 6 to 11 Years | 20,561 (75.3%) | 20,023 (75.8%) |
| 12 to 14 Years | 11,968 (80.4%) | 11,324 (81.3%) |
| 15 Years | 3,711 (85.8%) | 3,889 (77.0%) |
| 16 and 17 Years | 8,143 (80.0%) | 7,070 (81.2%) |
| 18 to 24 Years | 25,712 (86.0%) | 25,011 (84.5%) |
| 25 to 34 Years | 42,196 (88.6%) | 39,045 (81.7%) |
| 35 to 44 Years | 39,167 (89.0%) | 38,404 (84.7%) |
| 45 to 54 Years | 38,593 (90.2%) | 38,108 (88.1%) |
| 55 to 64 Years | 37,683 (89.2%) | 38,935 (85.6%) |
| 65 to 74 Years | 33,277 (89.0%) | 38,425 (88.6%) |
| 75 Years and over | 26,023 (90.6%) | 29,685 (87.6%) |
| Total | 305,909 (86.4%) | 307,393 (84.0%) |
Income Below Poverty Among Married-Couple Families in Polk County
The poverty statistics for married-couple families in Polk County show that 6.4% or 8,199 of the total 128,727 families live below the poverty line. Families with 5 or more children have the highest poverty rate of 24.8%, comprising of 299 families. On the other hand, families with no children have the lowest poverty rate of 4.6%, which includes 3,667 families.
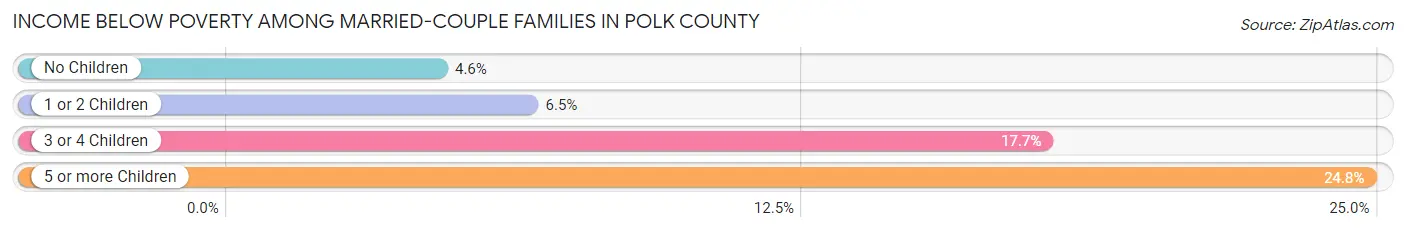
| Children | Above Poverty | Below Poverty |
| No Children | 76,626 (95.4%) | 3,667 (4.6%) |
| 1 or 2 Children | 34,585 (93.5%) | 2,420 (6.5%) |
| 3 or 4 Children | 8,409 (82.3%) | 1,813 (17.7%) |
| 5 or more Children | 908 (75.2%) | 299 (24.8%) |
| Total | 120,528 (93.6%) | 8,199 (6.4%) |
Income Below Poverty Among Single-Parent Households in Polk County
According to the poverty data in Polk County, 15.6% or 2,320 single-father households and 26.3% or 9,960 single-mother households are living below the poverty line. Among single-father households, those with 5 or more children have the highest poverty rate, with 106 households (46.5%) experiencing poverty. Likewise, among single-mother households, those with 3 or 4 children have the highest poverty rate, with 2,873 households (59.5%) falling below the poverty line.
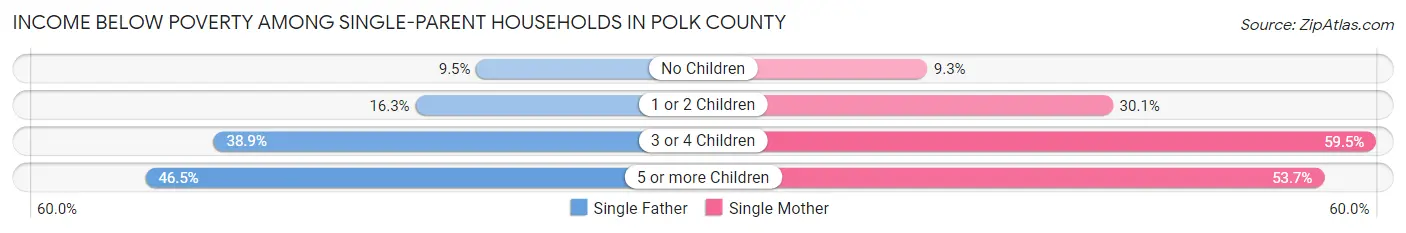
| Children | Single Father | Single Mother |
| No Children | 657 (9.5%) | 1,344 (9.3%) |
| 1 or 2 Children | 1,062 (16.3%) | 5,351 (30.1%) |
| 3 or 4 Children | 495 (38.9%) | 2,873 (59.5%) |
| 5 or more Children | 106 (46.5%) | 392 (53.7%) |
| Total | 2,320 (15.6%) | 9,960 (26.3%) |
Income Below Poverty Among Married-Couple vs Single-Parent Households in Polk County
The poverty data for Polk County shows that 8,199 of the married-couple family households (6.4%) and 12,280 of the single-parent households (23.3%) are living below the poverty level. Within the married-couple family households, those with 5 or more children have the highest poverty rate, with 299 households (24.8%) falling below the poverty line. Among the single-parent households, those with 3 or 4 children have the highest poverty rate, with 3,368 household (55.2%) living below poverty.
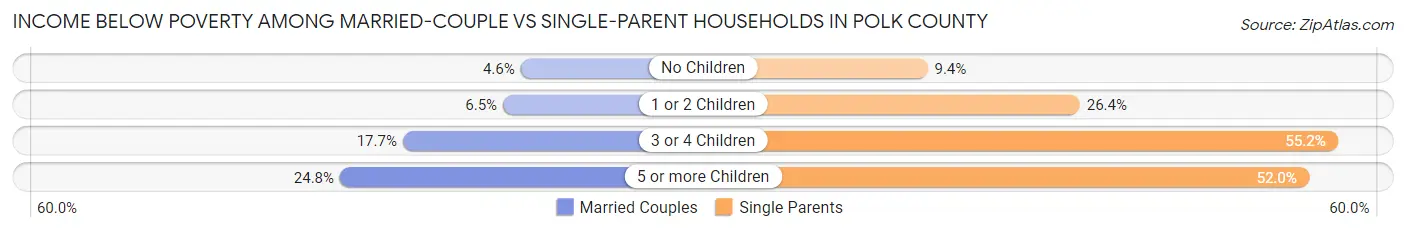
| Children | Married-Couple Families | Single-Parent Households |
| No Children | 3,667 (4.6%) | 2,001 (9.4%) |
| 1 or 2 Children | 2,420 (6.5%) | 6,413 (26.4%) |
| 3 or 4 Children | 1,813 (17.7%) | 3,368 (55.2%) |
| 5 or more Children | 299 (24.8%) | 498 (52.0%) |
| Total | 8,199 (6.4%) | 12,280 (23.3%) |
Race in Polk County
The most populous races in Polk County are White / Caucasian (474,356 | 64.4%), Hispanic or Latino (192,804 | 26.2%), and Black / African American (109,389 | 14.9%).
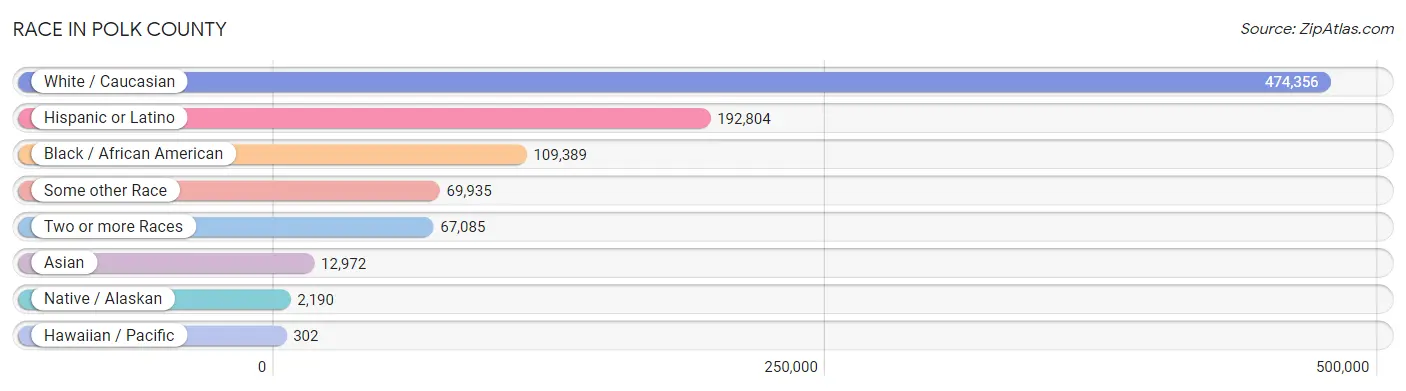
| Race | # Population | % Population |
| Asian | 12,972 | 1.8% |
| Black / African American | 109,389 | 14.9% |
| Hawaiian / Pacific | 302 | 0.0% |
| Hispanic or Latino | 192,804 | 26.2% |
| Native / Alaskan | 2,190 | 0.3% |
| White / Caucasian | 474,356 | 64.4% |
| Two or more Races | 67,085 | 9.1% |
| Some other Race | 69,935 | 9.5% |
| Total | 736,229 | 100.0% |
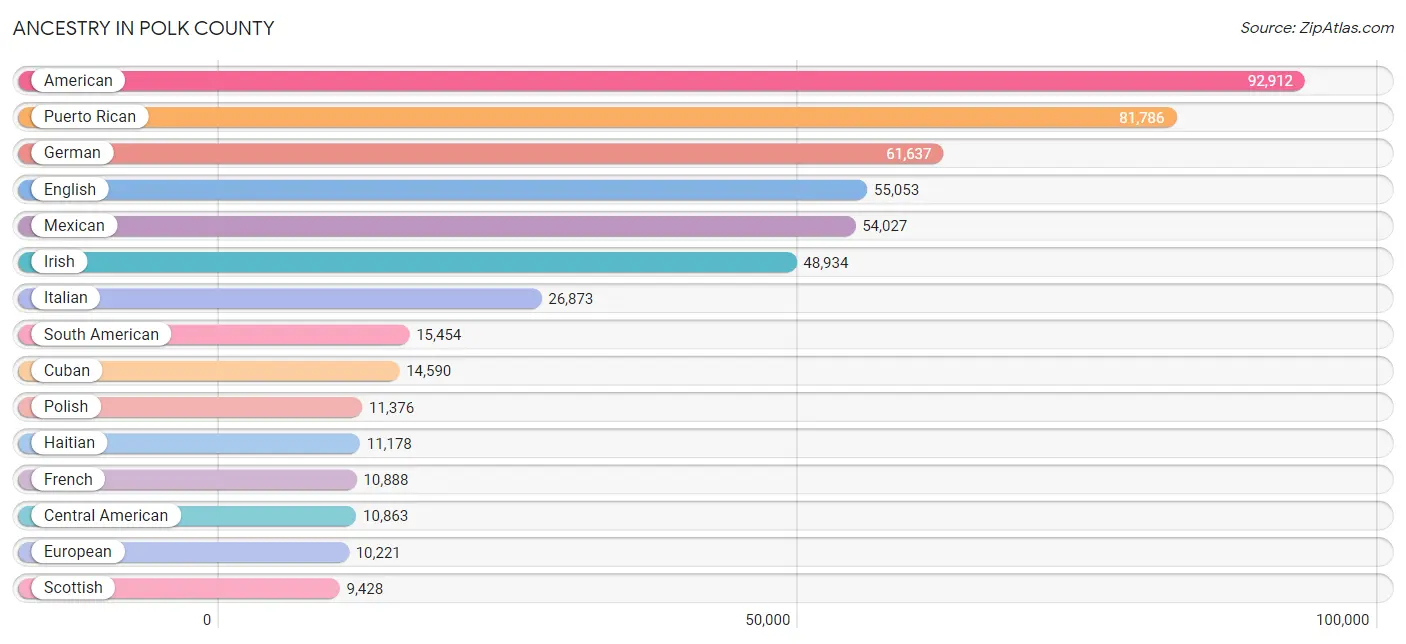
Ancestry in Polk County
The most populous ancestries reported in Polk County are American (92,912 | 12.6%), Puerto Rican (81,786 | 11.1%), German (61,637 | 8.4%), English (55,053 | 7.5%), and Mexican (54,027 | 7.3%), together accounting for 46.9% of all Polk County residents.
| Ancestry | # Population | % Population |
| African | 3,927 | 0.5% |
| Albanian | 17 | 0.0% |
| Aleut | 7 | 0.0% |
| Alsatian | 21 | 0.0% |
| American | 92,912 | 12.6% |
| Apache | 231 | 0.0% |
| Arab | 1,917 | 0.3% |
| Argentinean | 258 | 0.0% |
| Armenian | 207 | 0.0% |
| Assyrian / Chaldean / Syriac | 14 | 0.0% |
| Australian | 96 | 0.0% |
| Austrian | 688 | 0.1% |
| Bahamian | 258 | 0.0% |
| Bangladeshi | 122 | 0.0% |
| Barbadian | 250 | 0.0% |
| Basque | 14 | 0.0% |
| Belgian | 509 | 0.1% |
| Belizean | 297 | 0.0% |
| Bermudan | 30 | 0.0% |
| Bhutanese | 909 | 0.1% |
| Blackfeet | 198 | 0.0% |
| Bolivian | 389 | 0.1% |
| Brazilian | 1,478 | 0.2% |
| British | 3,903 | 0.5% |
| British West Indian | 373 | 0.1% |
| Bulgarian | 8 | 0.0% |
| Burmese | 1,148 | 0.2% |
| Cajun | 30 | 0.0% |
| Canadian | 1,982 | 0.3% |
| Cape Verdean | 175 | 0.0% |
| Carpatho Rusyn | 14 | 0.0% |
| Celtic | 89 | 0.0% |
| Central American | 10,863 | 1.5% |
| Central American Indian | 1,268 | 0.2% |
| Cherokee | 1,816 | 0.3% |
| Chickasaw | 31 | 0.0% |
| Chilean | 1,008 | 0.1% |
| Chippewa | 39 | 0.0% |
| Choctaw | 90 | 0.0% |
| Colombian | 4,645 | 0.6% |
| Costa Rican | 918 | 0.1% |
| Creek | 107 | 0.0% |
| Croatian | 582 | 0.1% |
| Cuban | 14,590 | 2.0% |
| Czech | 999 | 0.1% |
| Czechoslovakian | 540 | 0.1% |
| Danish | 1,078 | 0.2% |
| Delaware | 16 | 0.0% |
| Dominican | 7,593 | 1.0% |
| Dutch | 4,737 | 0.6% |
| Dutch West Indian | 75 | 0.0% |
| Eastern European | 646 | 0.1% |
| Ecuadorian | 1,649 | 0.2% |
| Egyptian | 184 | 0.0% |
| English | 55,053 | 7.5% |
| Estonian | 37 | 0.0% |
| Ethiopian | 12 | 0.0% |
| European | 10,221 | 1.4% |
| Fijian | 9 | 0.0% |
| Filipino | 93 | 0.0% |
| Finnish | 828 | 0.1% |
| French | 10,888 | 1.5% |
| French American Indian | 11 | 0.0% |
| French Canadian | 3,217 | 0.4% |
| German | 61,637 | 8.4% |
| German Russian | 52 | 0.0% |
| Ghanaian | 135 | 0.0% |
| Greek | 1,580 | 0.2% |
| Guamanian / Chamorro | 27 | 0.0% |
| Guatemalan | 2,664 | 0.4% |
| Guyanese | 795 | 0.1% |
| Haitian | 11,178 | 1.5% |
| Honduran | 2,472 | 0.3% |
| Hopi | 14 | 0.0% |
| Hungarian | 1,944 | 0.3% |
| Icelander | 37 | 0.0% |
| Indian (Asian) | 2,037 | 0.3% |
| Indonesian | 370 | 0.1% |
| Inupiat | 28 | 0.0% |
| Iranian | 335 | 0.1% |
| Iraqi | 86 | 0.0% |
| Irish | 48,934 | 6.7% |
| Iroquois | 51 | 0.0% |
| Israeli | 55 | 0.0% |
| Italian | 26,873 | 3.6% |
| Jamaican | 6,651 | 0.9% |
| Japanese | 215 | 0.0% |
| Kenyan | 29 | 0.0% |
| Korean | 4,316 | 0.6% |
| Laotian | 126 | 0.0% |
| Latvian | 98 | 0.0% |
| Lebanese | 546 | 0.1% |
| Liberian | 65 | 0.0% |
| Lithuanian | 884 | 0.1% |
| Lumbee | 42 | 0.0% |
| Malaysian | 635 | 0.1% |
| Maltese | 31 | 0.0% |
| Menominee | 24 | 0.0% |
| Mexican | 54,027 | 7.3% |
| Mexican American Indian | 352 | 0.1% |
| Mongolian | 31 | 0.0% |
| Moroccan | 456 | 0.1% |
| Native Hawaiian | 170 | 0.0% |
| Navajo | 305 | 0.0% |
| New Zealander | 13 | 0.0% |
| Nicaraguan | 1,938 | 0.3% |
| Nigerian | 282 | 0.0% |
| Northern European | 821 | 0.1% |
| Norwegian | 3,080 | 0.4% |
| Osage | 19 | 0.0% |
| Ottawa | 39 | 0.0% |
| Pakistani | 370 | 0.1% |
| Palestinian | 82 | 0.0% |
| Panamanian | 958 | 0.1% |
| Paraguayan | 16 | 0.0% |
| Pennsylvania German | 237 | 0.0% |
| Peruvian | 1,778 | 0.2% |
| Polish | 11,376 | 1.5% |
| Portuguese | 1,746 | 0.2% |
| Pueblo | 3 | 0.0% |
| Puerto Rican | 81,786 | 11.1% |
| Romanian | 997 | 0.1% |
| Russian | 2,035 | 0.3% |
| Salvadoran | 1,430 | 0.2% |
| Samoan | 9 | 0.0% |
| Scandinavian | 752 | 0.1% |
| Scotch-Irish | 5,272 | 0.7% |
| Scottish | 9,428 | 1.3% |
| Seminole | 105 | 0.0% |
| Serbian | 140 | 0.0% |
| Sierra Leonean | 17 | 0.0% |
| Sioux | 122 | 0.0% |
| Slavic | 154 | 0.0% |
| Slovak | 469 | 0.1% |
| Slovene | 65 | 0.0% |
| Somali | 3 | 0.0% |
| South African | 73 | 0.0% |
| South American | 15,454 | 2.1% |
| South American Indian | 404 | 0.1% |
| Spaniard | 1,850 | 0.3% |
| Spanish | 799 | 0.1% |
| Spanish American | 25 | 0.0% |
| Spanish American Indian | 55 | 0.0% |
| Sri Lankan | 1,048 | 0.1% |
| Subsaharan African | 4,797 | 0.6% |
| Sudanese | 52 | 0.0% |
| Swedish | 3,472 | 0.5% |
| Swiss | 782 | 0.1% |
| Syrian | 237 | 0.0% |
| Thai | 4,954 | 0.7% |
| Tlingit-Haida | 7 | 0.0% |
| Trinidadian and Tobagonian | 613 | 0.1% |
| Turkish | 126 | 0.0% |
| U.S. Virgin Islander | 296 | 0.0% |
| Ukrainian | 1,162 | 0.2% |
| Uruguayan | 203 | 0.0% |
| Ute | 35 | 0.0% |
| Venezuelan | 5,488 | 0.7% |
| Vietnamese | 53 | 0.0% |
| Welsh | 2,731 | 0.4% |
| West Indian | 817 | 0.1% |
| Yaqui | 5 | 0.0% |
| Yugoslavian | 113 | 0.0% | View All 163 Rows |
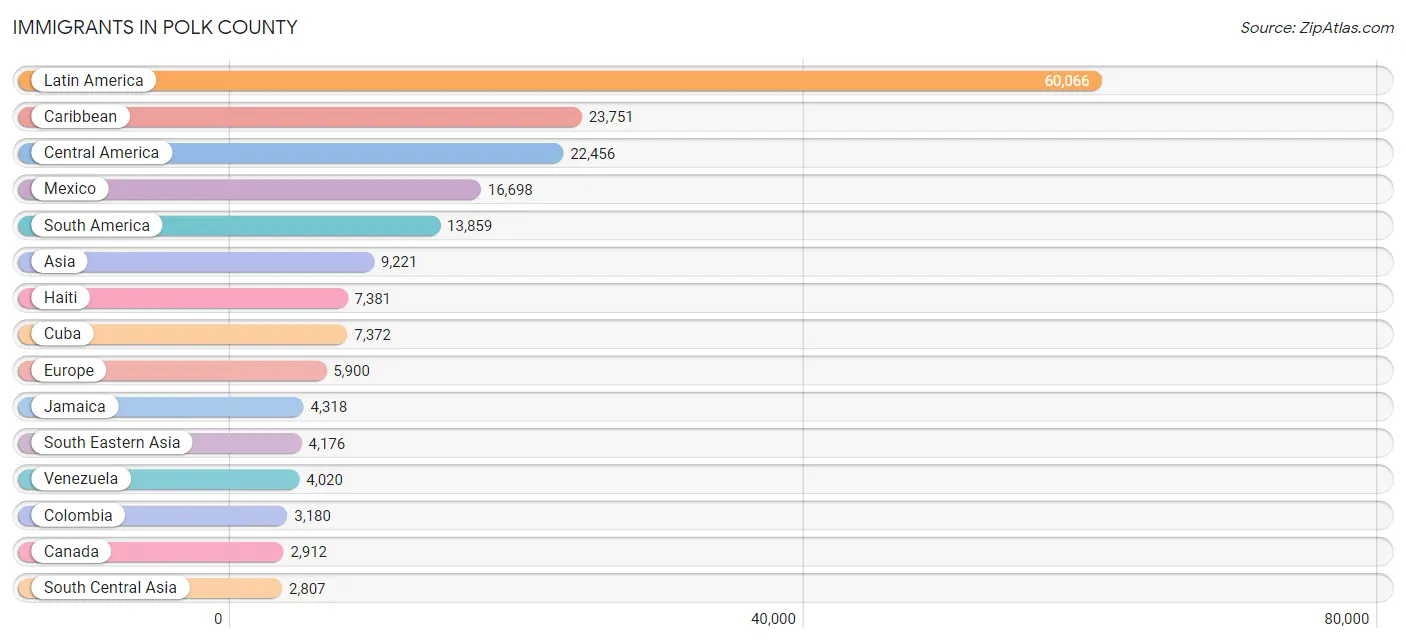
Immigrants in Polk County
The most numerous immigrant groups reported in Polk County came from Latin America (60,066 | 8.2%), Caribbean (23,751 | 3.2%), Central America (22,456 | 3.0%), Mexico (16,698 | 2.3%), and South America (13,859 | 1.9%), together accounting for 18.6% of all Polk County residents.
| Immigration Origin | # Population | % Population |
| Africa | 1,643 | 0.2% |
| Argentina | 265 | 0.0% |
| Asia | 9,221 | 1.3% |
| Australia | 70 | 0.0% |
| Austria | 50 | 0.0% |
| Bahamas | 175 | 0.0% |
| Bangladesh | 247 | 0.0% |
| Barbados | 178 | 0.0% |
| Belgium | 168 | 0.0% |
| Belize | 177 | 0.0% |
| Bolivia | 432 | 0.1% |
| Bosnia and Herzegovina | 1 | 0.0% |
| Brazil | 1,368 | 0.2% |
| Bulgaria | 48 | 0.0% |
| Cabo Verde | 206 | 0.0% |
| Cambodia | 112 | 0.0% |
| Cameroon | 17 | 0.0% |
| Canada | 2,912 | 0.4% |
| Caribbean | 23,751 | 3.2% |
| Central America | 22,456 | 3.0% |
| Chile | 559 | 0.1% |
| China | 900 | 0.1% |
| Colombia | 3,180 | 0.4% |
| Costa Rica | 421 | 0.1% |
| Cuba | 7,372 | 1.0% |
| Czechoslovakia | 26 | 0.0% |
| Denmark | 24 | 0.0% |
| Dominica | 133 | 0.0% |
| Dominican Republic | 2,772 | 0.4% |
| Eastern Africa | 187 | 0.0% |
| Eastern Asia | 1,573 | 0.2% |
| Eastern Europe | 1,550 | 0.2% |
| Ecuador | 1,054 | 0.1% |
| Egypt | 127 | 0.0% |
| El Salvador | 654 | 0.1% |
| England | 912 | 0.1% |
| Europe | 5,900 | 0.8% |
| France | 199 | 0.0% |
| Germany | 696 | 0.1% |
| Ghana | 148 | 0.0% |
| Greece | 145 | 0.0% |
| Grenada | 51 | 0.0% |
| Guatemala | 1,686 | 0.2% |
| Guyana | 1,487 | 0.2% |
| Haiti | 7,381 | 1.0% |
| Honduras | 1,317 | 0.2% |
| Hong Kong | 23 | 0.0% |
| Hungary | 111 | 0.0% |
| India | 2,268 | 0.3% |
| Indonesia | 215 | 0.0% |
| Iran | 142 | 0.0% |
| Iraq | 49 | 0.0% |
| Ireland | 75 | 0.0% |
| Israel | 37 | 0.0% |
| Italy | 295 | 0.0% |
| Jamaica | 4,318 | 0.6% |
| Japan | 246 | 0.0% |
| Jordan | 6 | 0.0% |
| Kazakhstan | 33 | 0.0% |
| Kenya | 40 | 0.0% |
| Korea | 427 | 0.1% |
| Kuwait | 28 | 0.0% |
| Laos | 349 | 0.1% |
| Latin America | 60,066 | 8.2% |
| Latvia | 9 | 0.0% |
| Lebanon | 57 | 0.0% |
| Liberia | 52 | 0.0% |
| Lithuania | 38 | 0.0% |
| Malaysia | 14 | 0.0% |
| Mexico | 16,698 | 2.3% |
| Middle Africa | 17 | 0.0% |
| Moldova | 61 | 0.0% |
| Morocco | 272 | 0.0% |
| Nepal | 11 | 0.0% |
| Netherlands | 111 | 0.0% |
| Nicaragua | 794 | 0.1% |
| Nigeria | 130 | 0.0% |
| Northern Africa | 571 | 0.1% |
| Northern Europe | 2,243 | 0.3% |
| Norway | 10 | 0.0% |
| Oceania | 117 | 0.0% |
| Pakistan | 85 | 0.0% |
| Panama | 709 | 0.1% |
| Peru | 1,029 | 0.1% |
| Philippines | 2,094 | 0.3% |
| Poland | 91 | 0.0% |
| Portugal | 208 | 0.0% |
| Romania | 596 | 0.1% |
| Russia | 243 | 0.0% |
| Saudi Arabia | 3 | 0.0% |
| Scotland | 107 | 0.0% |
| South Africa | 249 | 0.0% |
| South America | 13,859 | 1.9% |
| South Central Asia | 2,807 | 0.4% |
| South Eastern Asia | 4,176 | 0.6% |
| Southern Europe | 809 | 0.1% |
| Spain | 161 | 0.0% |
| Sri Lanka | 8 | 0.0% |
| Sudan | 172 | 0.0% |
| Switzerland | 23 | 0.0% |
| Syria | 81 | 0.0% |
| Taiwan | 136 | 0.0% |
| Thailand | 363 | 0.1% |
| Trinidad and Tobago | 933 | 0.1% |
| Turkey | 100 | 0.0% |
| Uganda | 8 | 0.0% |
| Ukraine | 292 | 0.0% |
| Uruguay | 189 | 0.0% |
| Uzbekistan | 13 | 0.0% |
| Venezuela | 4,020 | 0.5% |
| Vietnam | 720 | 0.1% |
| West Indies | 39 | 0.0% |
| Western Africa | 536 | 0.1% |
| Western Asia | 403 | 0.1% |
| Western Europe | 1,267 | 0.2% |
| Yemen | 5 | 0.0% |
| Zimbabwe | 29 | 0.0% | View All 117 Rows |
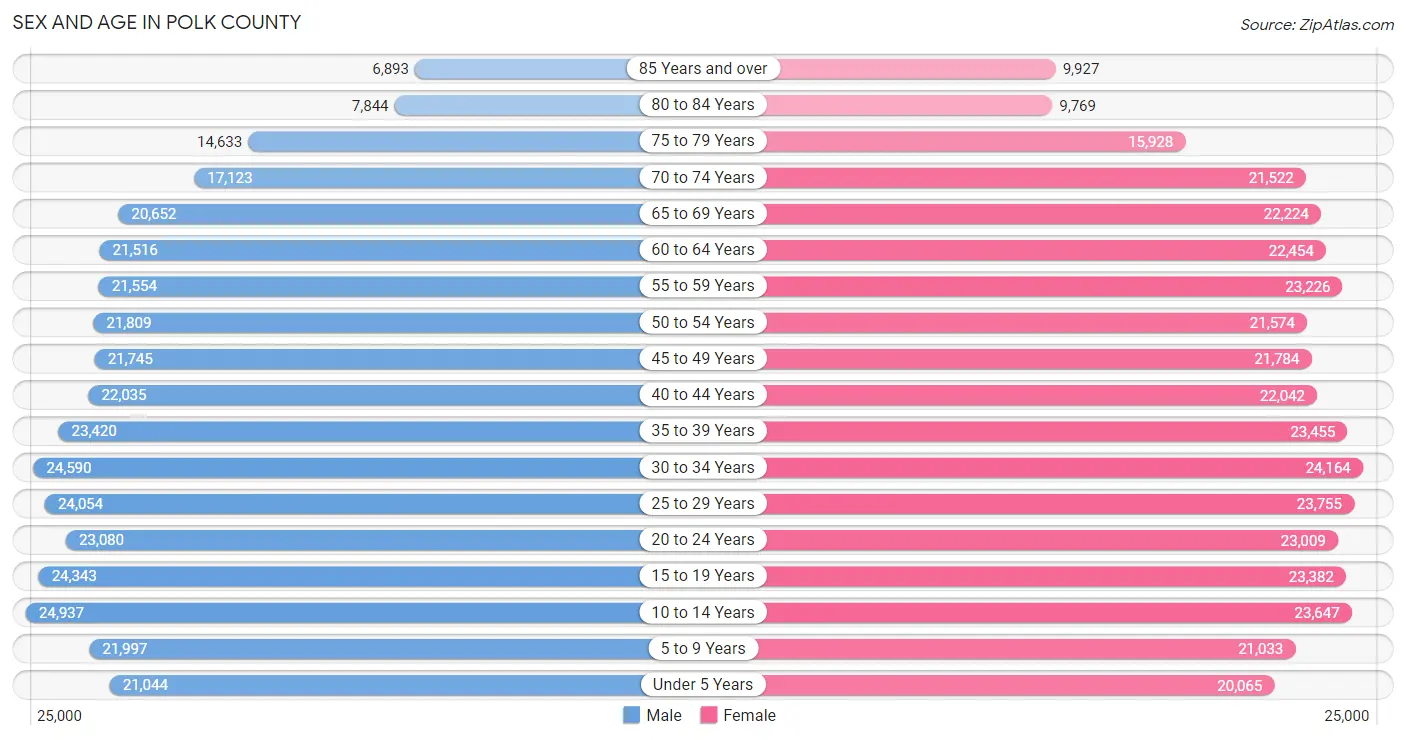
Sex and Age in Polk County
Sex and Age in Polk County
The most populous age groups in Polk County are 10 to 14 Years (24,937 | 6.9%) for men and 30 to 34 Years (24,164 | 6.5%) for women.
| Age Bracket | Male | Female |
| Under 5 Years | 21,044 (5.8%) | 20,065 (5.4%) |
| 5 to 9 Years | 21,997 (6.1%) | 21,033 (5.6%) |
| 10 to 14 Years | 24,937 (6.9%) | 23,647 (6.3%) |
| 15 to 19 Years | 24,343 (6.7%) | 23,382 (6.3%) |
| 20 to 24 Years | 23,080 (6.4%) | 23,009 (6.2%) |
| 25 to 29 Years | 24,054 (6.6%) | 23,755 (6.4%) |
| 30 to 34 Years | 24,590 (6.8%) | 24,164 (6.5%) |
| 35 to 39 Years | 23,420 (6.5%) | 23,455 (6.3%) |
| 40 to 44 Years | 22,035 (6.1%) | 22,042 (5.9%) |
| 45 to 49 Years | 21,745 (6.0%) | 21,784 (5.8%) |
| 50 to 54 Years | 21,809 (6.0%) | 21,574 (5.8%) |
| 55 to 59 Years | 21,554 (5.9%) | 23,226 (6.2%) |
| 60 to 64 Years | 21,516 (5.9%) | 22,454 (6.0%) |
| 65 to 69 Years | 20,652 (5.7%) | 22,224 (6.0%) |
| 70 to 74 Years | 17,123 (4.7%) | 21,522 (5.8%) |
| 75 to 79 Years | 14,633 (4.0%) | 15,928 (4.3%) |
| 80 to 84 Years | 7,844 (2.2%) | 9,769 (2.6%) |
| 85 Years and over | 6,893 (1.9%) | 9,927 (2.7%) |
| Total | 363,269 (100.0%) | 372,960 (100.0%) |
Families and Households in Polk County
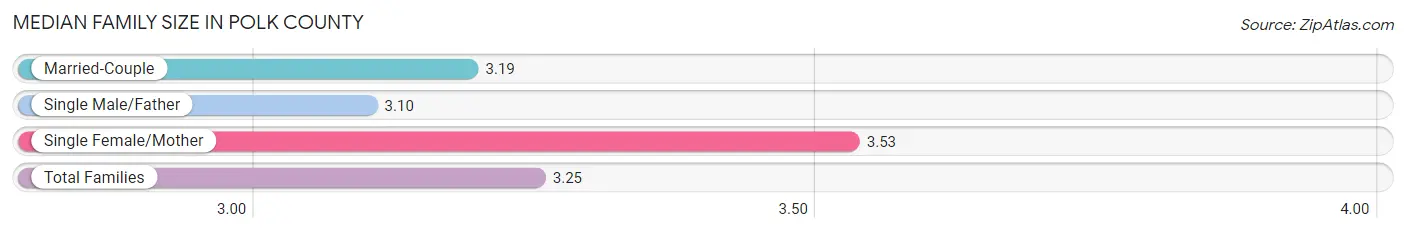
Median Family Size in Polk County
The median family size in Polk County is 3.25 persons per family, with single female/mother families (37,812 | 20.8%) accounting for the largest median family size of 3.53 persons per family. On the other hand, single male/father families (14,912 | 8.2%) represent the smallest median family size with 3.10 persons per family.
| Family Type | # Families | Family Size |
| Married-Couple | 128,727 (70.9%) | 3.19 |
| Single Male/Father | 14,912 (8.2%) | 3.10 |
| Single Female/Mother | 37,812 (20.8%) | 3.53 |
| Total Families | 181,451 (100.0%) | 3.25 |
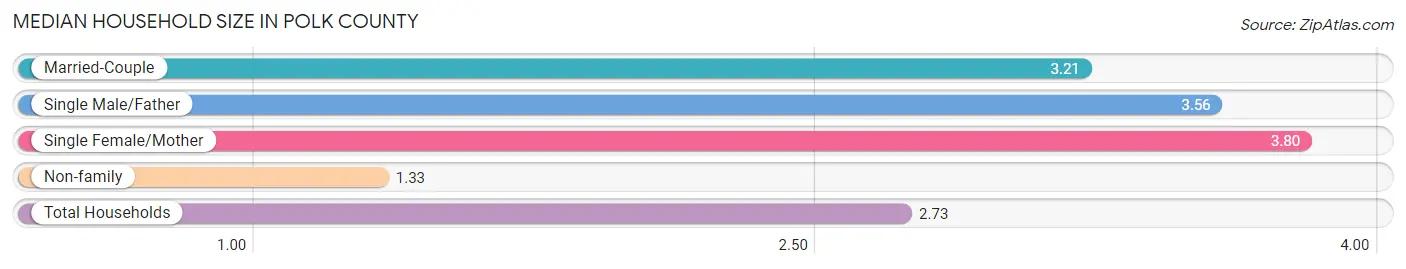
Median Household Size in Polk County
The median household size in Polk County is 2.73 persons per household, with single female/mother households (37,812 | 14.3%) accounting for the largest median household size of 3.8 persons per household. non-family households (82,694 | 31.3%) represent the smallest median household size with 1.33 persons per household.
| Household Type | # Households | Household Size |
| Married-Couple | 128,727 (48.7%) | 3.21 |
| Single Male/Father | 14,912 (5.7%) | 3.56 |
| Single Female/Mother | 37,812 (14.3%) | 3.80 |
| Non-family | 82,694 (31.3%) | 1.33 |
| Total Households | 264,145 (100.0%) | 2.73 |
Household Size by Marriage Status in Polk County
Out of a total of 264,145 households in Polk County, 181,451 (68.7%) are family households, while 82,694 (31.3%) are nonfamily households. The most numerous type of family households are 2-person households, comprising 82,091, and the most common type of nonfamily households are 1-person households, comprising 64,584.
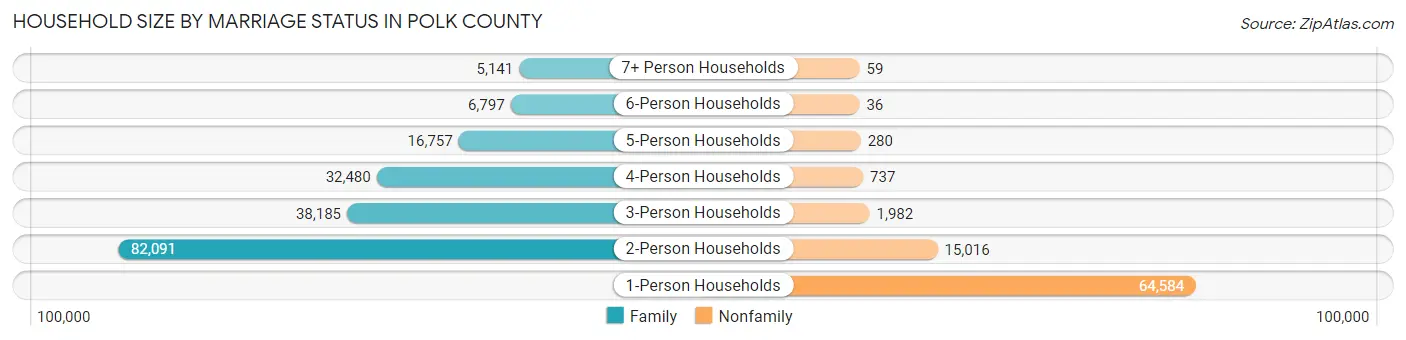
| Household Size | Family Households | Nonfamily Households |
| 1-Person Households | - | 64,584 (24.4%) |
| 2-Person Households | 82,091 (31.1%) | 15,016 (5.7%) |
| 3-Person Households | 38,185 (14.5%) | 1,982 (0.7%) |
| 4-Person Households | 32,480 (12.3%) | 737 (0.3%) |
| 5-Person Households | 16,757 (6.3%) | 280 (0.1%) |
| 6-Person Households | 6,797 (2.6%) | 36 (0.0%) |
| 7+ Person Households | 5,141 (1.9%) | 59 (0.0%) |
| Total | 181,451 (68.7%) | 82,694 (31.3%) |
Female Fertility in Polk County
Fertility by Age in Polk County
Average fertility rate in Polk County is 45.0 births per 1,000 women. Women in the age bracket of 20 to 34 years have the highest fertility rate with 74.0 births per 1,000 women. Women in the age bracket of 20 to 34 years acount for 69.1% of all women with births.
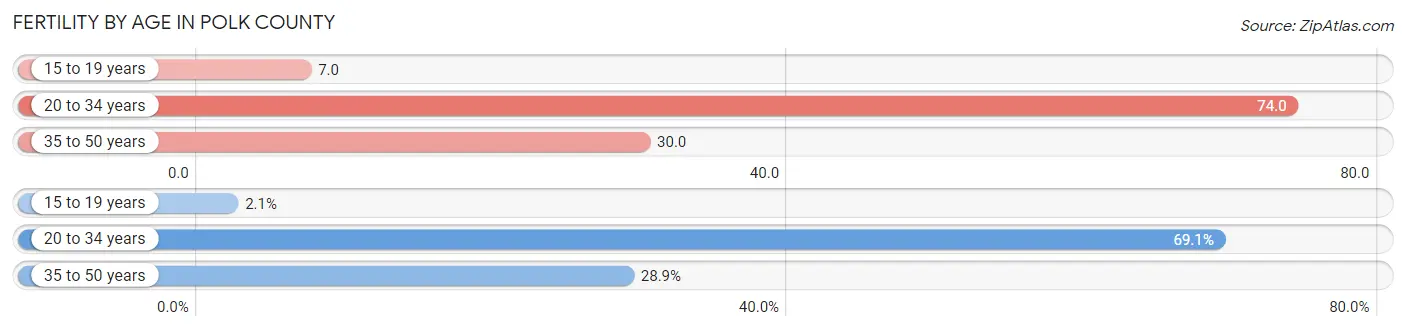
| Age Bracket | Women with Births | Births / 1,000 Women |
| 15 to 19 years | 155 (2.1%) | 7.0 |
| 20 to 34 years | 5,230 (69.1%) | 74.0 |
| 35 to 50 years | 2,189 (28.9%) | 30.0 |
| Total | 7,574 (100.0%) | 45.0 |
Fertility by Age by Marriage Status in Polk County
57.8% of women with births (7,574) in Polk County are married. The highest percentage of unmarried women with births falls into 15 to 19 years age bracket with 58.1% of them unmarried at the time of birth, while the lowest percentage of unmarried women with births belong to 20 to 34 years age bracket with 41.8% of them unmarried.
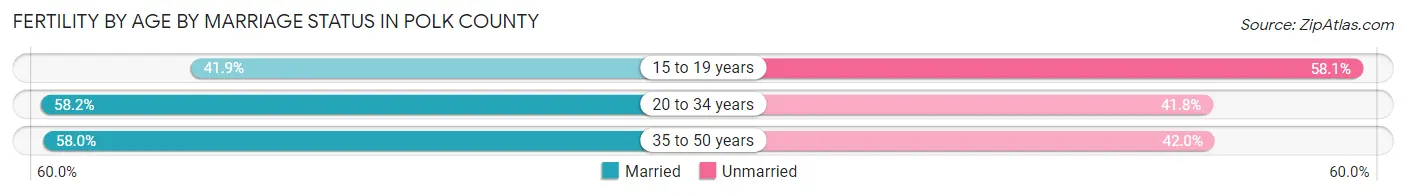
| Age Bracket | Married | Unmarried |
| 15 to 19 years | 65 (41.9%) | 90 (58.1%) |
| 20 to 34 years | 3,044 (58.2%) | 2,186 (41.8%) |
| 35 to 50 years | 1,270 (58.0%) | 919 (42.0%) |
| Total | 4,378 (57.8%) | 3,196 (42.2%) |
Fertility by Education in Polk County
Average fertility rate in Polk County is 45.0 births per 1,000 women. Women with the education attainment of graduate degree have the highest fertility rate of 61.0 births per 1,000 women, while women with the education attainment of less than high school have the lowest fertility at 31.0 births per 1,000 women. Women with the education attainment of college or associate's degree represent 32.2% of all women with births.
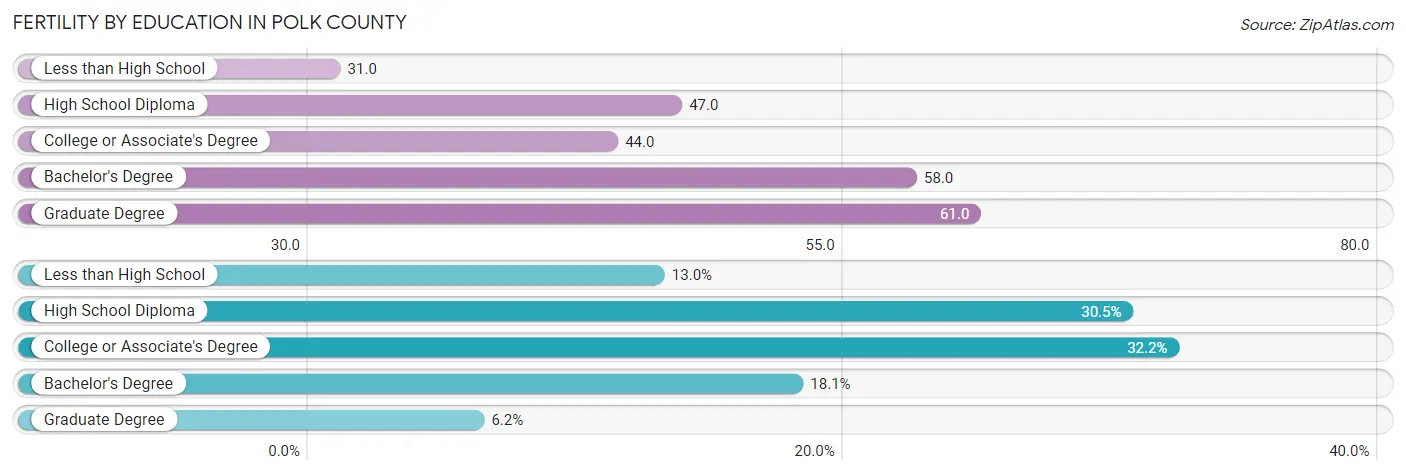
| Educational Attainment | Women with Births | Births / 1,000 Women |
| Less than High School | 981 (13.0%) | 31.0 |
| High School Diploma | 2,310 (30.5%) | 47.0 |
| College or Associate's Degree | 2,440 (32.2%) | 44.0 |
| Bachelor's Degree | 1,374 (18.1%) | 58.0 |
| Graduate Degree | 469 (6.2%) | 61.0 |
| Total | 7,574 (100.0%) | 45.0 |
Fertility by Education by Marriage Status in Polk County
42.2% of women with births in Polk County are unmarried. Women with the educational attainment of graduate degree are most likely to be married with 86.8% of them married at childbirth, while women with the educational attainment of high school diploma are least likely to be married with 56.8% of them unmarried at childbirth.
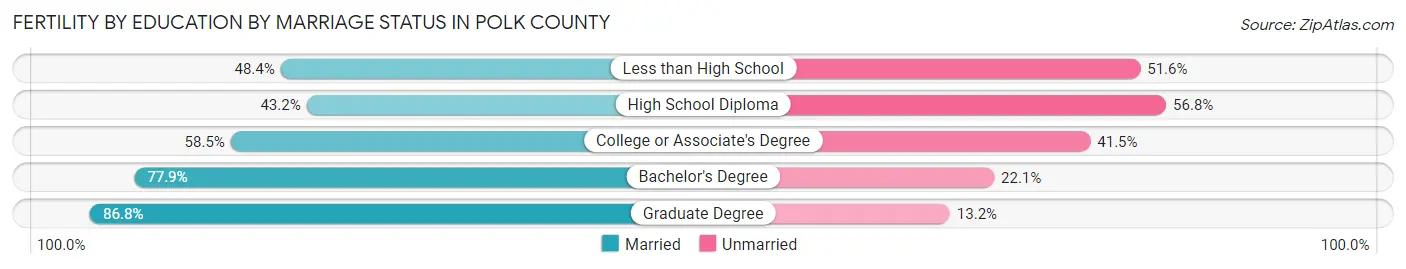
| Educational Attainment | Married | Unmarried |
| Less than High School | 475 (48.4%) | 506 (51.6%) |
| High School Diploma | 998 (43.2%) | 1,312 (56.8%) |
| College or Associate's Degree | 1,427 (58.5%) | 1,013 (41.5%) |
| Bachelor's Degree | 1,070 (77.9%) | 304 (22.1%) |
| Graduate Degree | 407 (86.8%) | 62 (13.2%) |
| Total | 4,378 (57.8%) | 3,196 (42.2%) |
Employment Characteristics in Polk County
Employment by Class of Employer in Polk County
Among the 315,558 employed individuals in Polk County, private company employees (236,037 | 74.8%), local government employees (21,714 | 6.9%), and not-for-profit organizations (19,081 | 6.0%) make up the most common classes of employment.
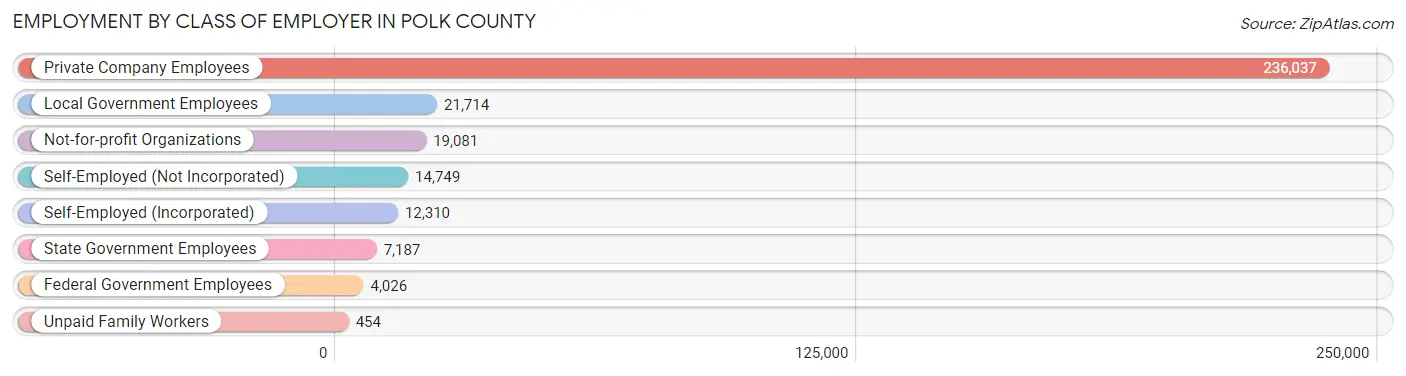
| Employer Class | # Employees | % Employees |
| Private Company Employees | 236,037 | 74.8% |
| Self-Employed (Incorporated) | 12,310 | 3.9% |
| Self-Employed (Not Incorporated) | 14,749 | 4.7% |
| Not-for-profit Organizations | 19,081 | 6.0% |
| Local Government Employees | 21,714 | 6.9% |
| State Government Employees | 7,187 | 2.3% |
| Federal Government Employees | 4,026 | 1.3% |
| Unpaid Family Workers | 454 | 0.1% |
| Total | 315,558 | 100.0% |
Employment Status by Age in Polk County
According to the labor force statistics for Polk County, out of the total population over 16 years of age (594,132), 56.6% or 336,279 individuals are in the labor force, with 4.6% or 15,469 of them unemployed. The age group with the highest labor force participation rate is 25 to 29 years, with 81.4% or 38,917 individuals in the labor force. Within the labor force, the 16 to 19 years age range has the highest percentage of unemployed individuals, with 12.6% or 1,513 of them being unemployed.
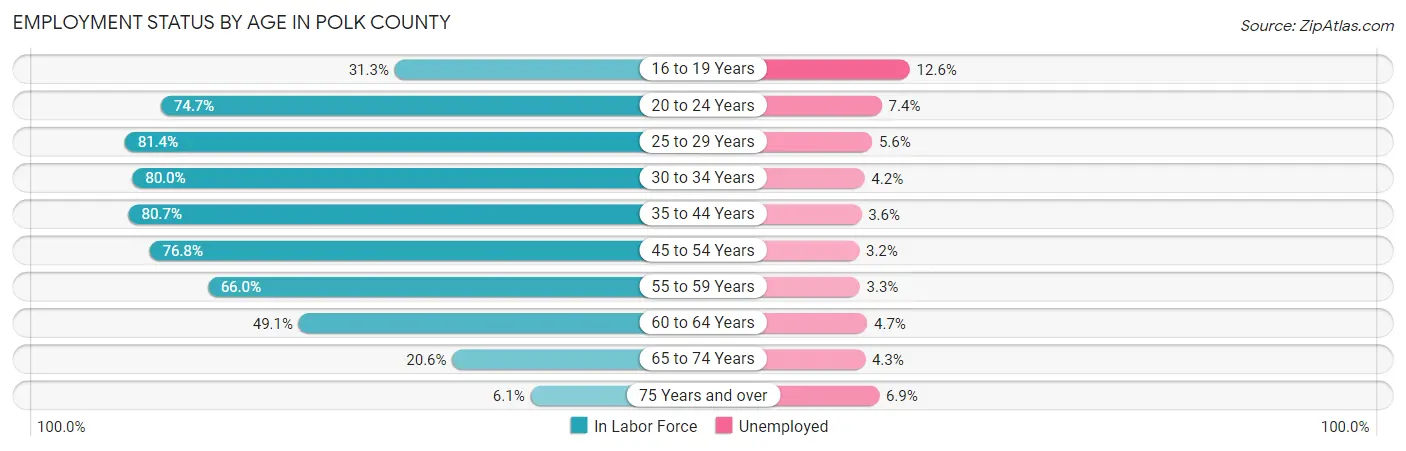
| Age Bracket | In Labor Force | Unemployed |
| 16 to 19 Years | 12,004 (31.3%) | 1,513 (12.6%) |
| 20 to 24 Years | 34,428 (74.7%) | 2,548 (7.4%) |
| 25 to 29 Years | 38,917 (81.4%) | 2,179 (5.6%) |
| 30 to 34 Years | 39,003 (80.0%) | 1,638 (4.2%) |
| 35 to 44 Years | 73,398 (80.7%) | 2,642 (3.6%) |
| 45 to 54 Years | 66,748 (76.8%) | 2,136 (3.2%) |
| 55 to 59 Years | 29,555 (66.0%) | 975 (3.3%) |
| 60 to 64 Years | 21,589 (49.1%) | 1,015 (4.7%) |
| 65 to 74 Years | 16,793 (20.6%) | 722 (4.3%) |
| 75 Years and over | 3,965 (6.1%) | 274 (6.9%) |
| Total | 336,279 (56.6%) | 15,469 (4.6%) |
Employment Status by Educational Attainment in Polk County
According to labor force statistics for Polk County, 74.1% of individuals (269,114) out of the total population between 25 and 64 years of age (363,177) are in the labor force, with 3.9% or 10,495 of them being unemployed. The group with the highest labor force participation rate are those with the educational attainment of bachelor's degree or higher, with 85.0% or 65,503 individuals in the labor force. Within the labor force, individuals with less than high school education have the highest percentage of unemployment, with 5.6% or 1,479 of them being unemployed.
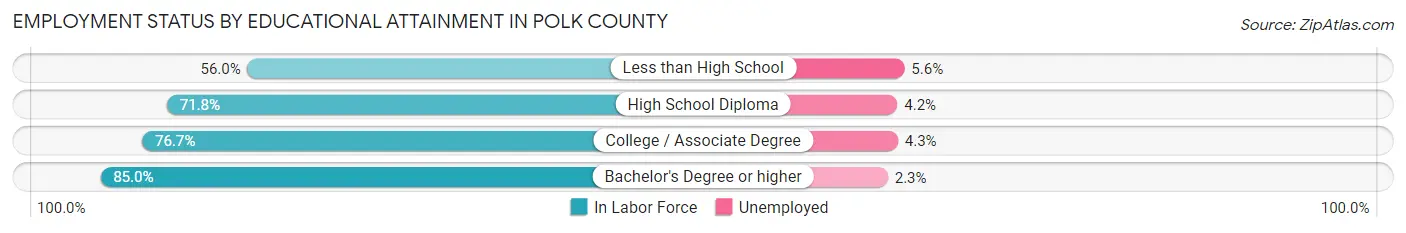
| Educational Attainment | In Labor Force | Unemployed |
| Less than High School | 26,405 (56.0%) | 2,640 (5.6%) |
| High School Diploma | 86,988 (71.8%) | 5,088 (4.2%) |
| College / Associate Degree | 90,361 (76.7%) | 5,066 (4.3%) |
| Bachelor's Degree or higher | 65,503 (85.0%) | 1,772 (2.3%) |
| Total | 269,114 (74.1%) | 14,164 (3.9%) |
Employment Occupations by Sex in Polk County
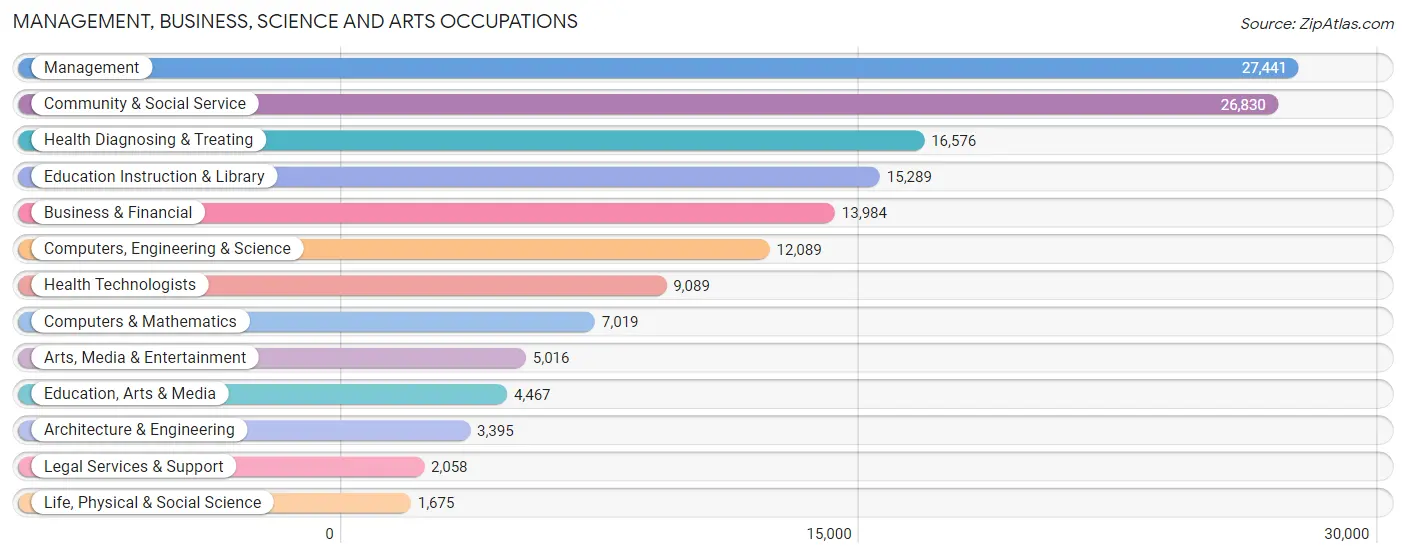
Management, Business, Science and Arts Occupations
The most common Management, Business, Science and Arts occupations in Polk County are Management (27,441 | 8.6%), Community & Social Service (26,830 | 8.4%), Health Diagnosing & Treating (16,576 | 5.2%), Education Instruction & Library (15,289 | 4.8%), and Business & Financial (13,984 | 4.4%).
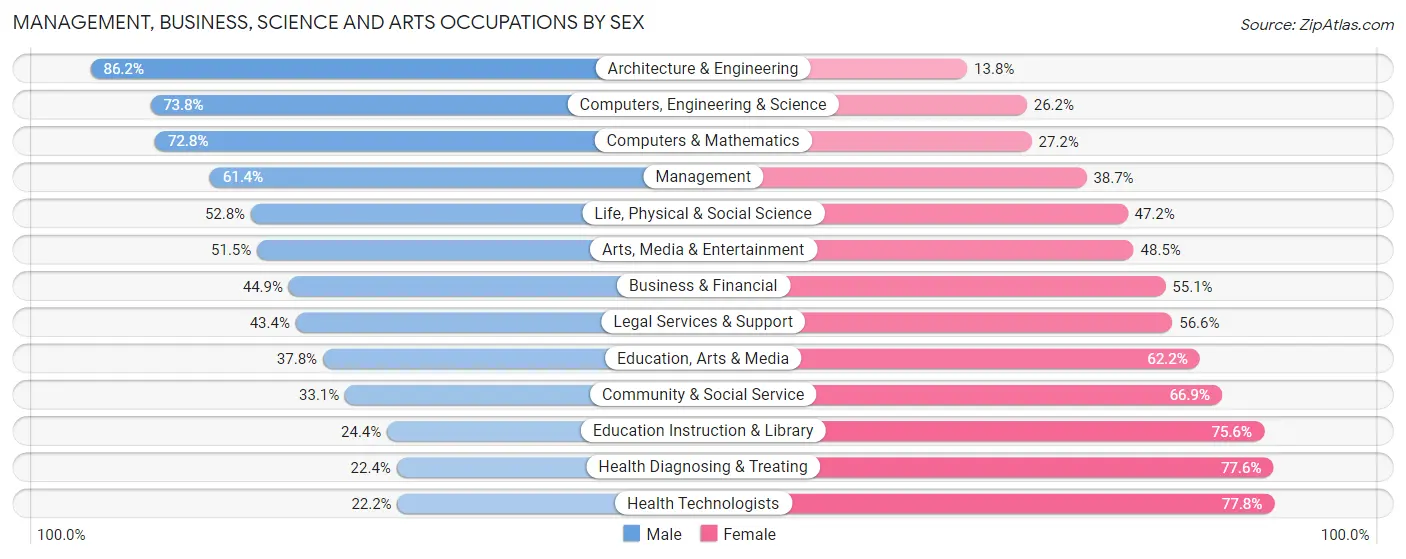
Management, Business, Science and Arts Occupations by Sex
Within the Management, Business, Science and Arts occupations in Polk County, the most male-oriented occupations are Architecture & Engineering (86.2%), Computers, Engineering & Science (73.8%), and Computers & Mathematics (72.8%), while the most female-oriented occupations are Health Technologists (77.8%), Health Diagnosing & Treating (77.6%), and Education Instruction & Library (75.6%).
| Occupation | Male | Female |
| Management | 16,834 (61.4%) | 10,607 (38.7%) |
| Business & Financial | 6,276 (44.9%) | 7,708 (55.1%) |
| Computers, Engineering & Science | 8,921 (73.8%) | 3,168 (26.2%) |
| Computers & Mathematics | 5,109 (72.8%) | 1,910 (27.2%) |
| Architecture & Engineering | 2,928 (86.2%) | 467 (13.8%) |
| Life, Physical & Social Science | 884 (52.8%) | 791 (47.2%) |
| Community & Social Service | 8,892 (33.1%) | 17,938 (66.9%) |
| Education, Arts & Media | 1,687 (37.8%) | 2,780 (62.2%) |
| Legal Services & Support | 894 (43.4%) | 1,164 (56.6%) |
| Education Instruction & Library | 3,728 (24.4%) | 11,561 (75.6%) |
| Arts, Media & Entertainment | 2,583 (51.5%) | 2,433 (48.5%) |
| Health Diagnosing & Treating | 3,711 (22.4%) | 12,865 (77.6%) |
| Health Technologists | 2,020 (22.2%) | 7,069 (77.8%) |
| Total (Category) | 44,634 (46.1%) | 52,286 (53.9%) |
| Total (Overall) | 169,471 (52.9%) | 150,752 (47.1%) |
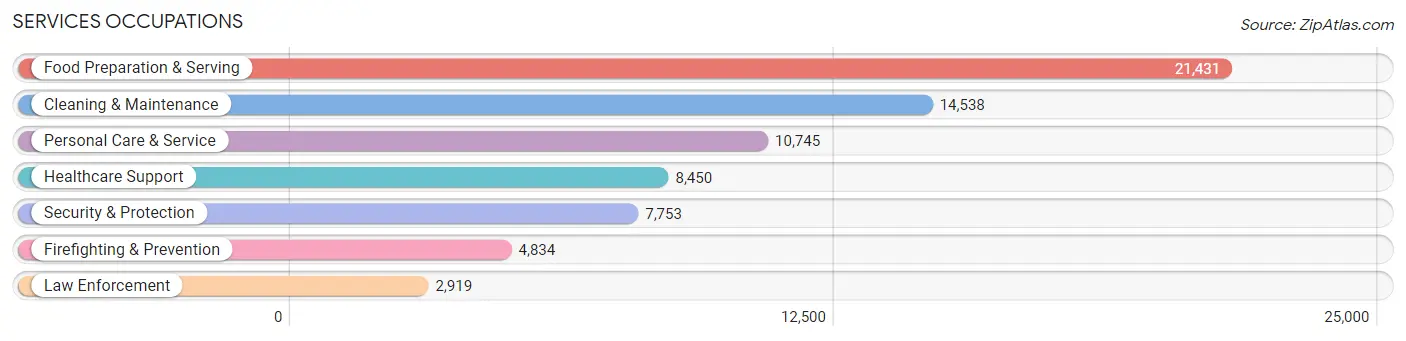
Services Occupations
The most common Services occupations in Polk County are Food Preparation & Serving (21,431 | 6.7%), Cleaning & Maintenance (14,538 | 4.5%), Personal Care & Service (10,745 | 3.4%), Healthcare Support (8,450 | 2.6%), and Security & Protection (7,753 | 2.4%).
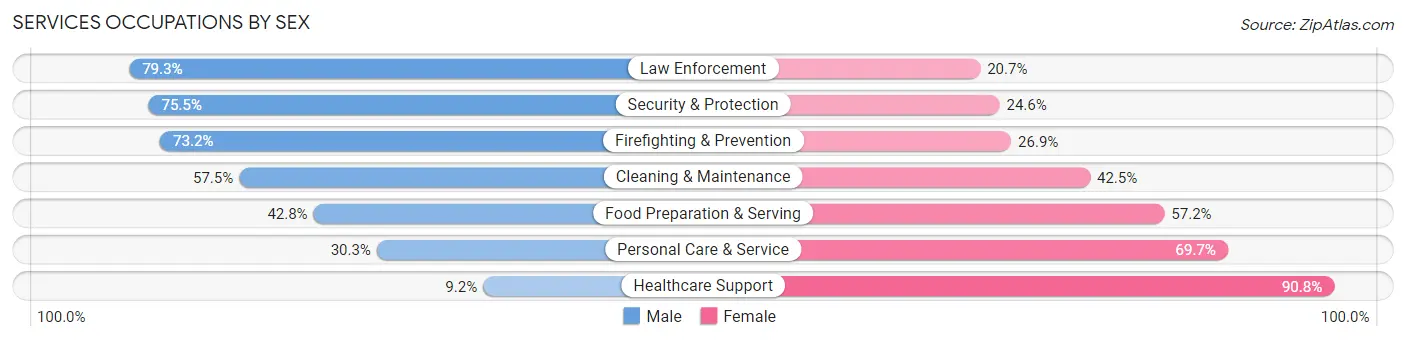
Services Occupations by Sex
Within the Services occupations in Polk County, the most male-oriented occupations are Law Enforcement (79.3%), Security & Protection (75.4%), and Firefighting & Prevention (73.2%), while the most female-oriented occupations are Healthcare Support (90.8%), Personal Care & Service (69.7%), and Food Preparation & Serving (57.2%).
| Occupation | Male | Female |
| Healthcare Support | 780 (9.2%) | 7,670 (90.8%) |
| Security & Protection | 5,850 (75.4%) | 1,903 (24.5%) |
| Firefighting & Prevention | 3,536 (73.2%) | 1,298 (26.9%) |
| Law Enforcement | 2,314 (79.3%) | 605 (20.7%) |
| Food Preparation & Serving | 9,172 (42.8%) | 12,259 (57.2%) |
| Cleaning & Maintenance | 8,363 (57.5%) | 6,175 (42.5%) |
| Personal Care & Service | 3,254 (30.3%) | 7,491 (69.7%) |
| Total (Category) | 27,419 (43.6%) | 35,498 (56.4%) |
| Total (Overall) | 169,471 (52.9%) | 150,752 (47.1%) |
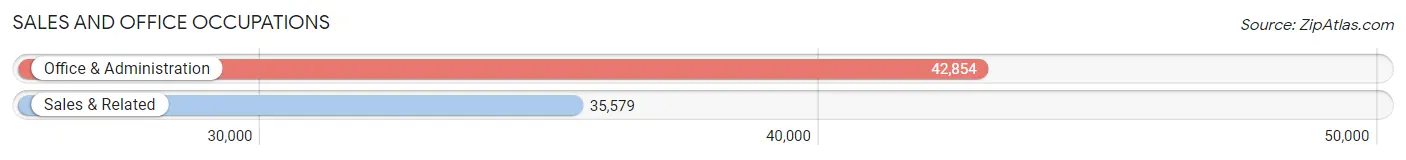
Sales and Office Occupations
The most common Sales and Office occupations in Polk County are Office & Administration (42,854 | 13.4%), and Sales & Related (35,579 | 11.1%).
Sales and Office Occupations by Sex
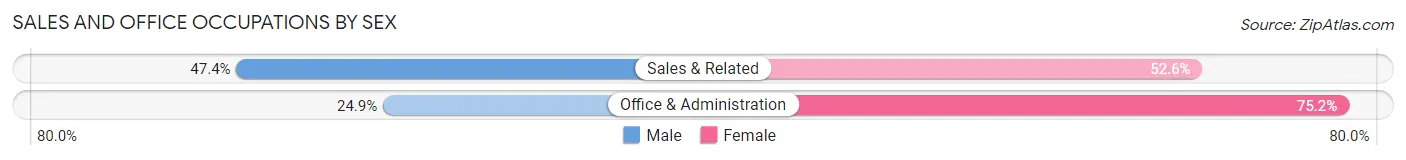
| Occupation | Male | Female |
| Sales & Related | 16,867 (47.4%) | 18,712 (52.6%) |
| Office & Administration | 10,649 (24.8%) | 32,205 (75.1%) |
| Total (Category) | 27,516 (35.1%) | 50,917 (64.9%) |
| Total (Overall) | 169,471 (52.9%) | 150,752 (47.1%) |
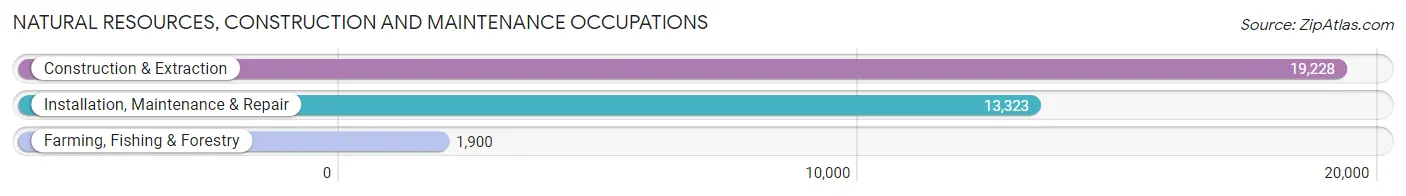
Natural Resources, Construction and Maintenance Occupations
The most common Natural Resources, Construction and Maintenance occupations in Polk County are Construction & Extraction (19,228 | 6.0%), Installation, Maintenance & Repair (13,323 | 4.2%), and Farming, Fishing & Forestry (1,900 | 0.6%).
Natural Resources, Construction and Maintenance Occupations by Sex
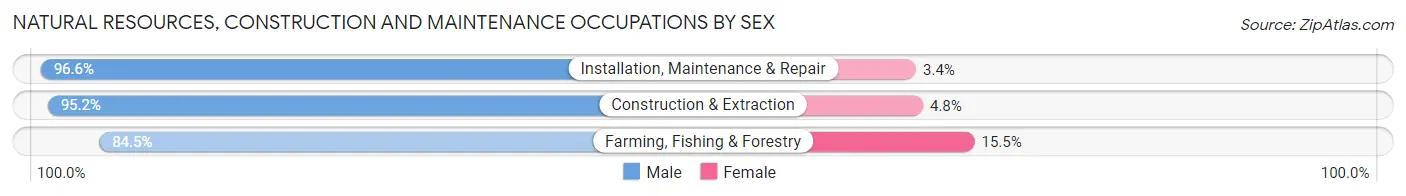
| Occupation | Male | Female |
| Farming, Fishing & Forestry | 1,605 (84.5%) | 295 (15.5%) |
| Construction & Extraction | 18,303 (95.2%) | 925 (4.8%) |
| Installation, Maintenance & Repair | 12,875 (96.6%) | 448 (3.4%) |
| Total (Category) | 32,783 (95.2%) | 1,668 (4.8%) |
| Total (Overall) | 169,471 (52.9%) | 150,752 (47.1%) |
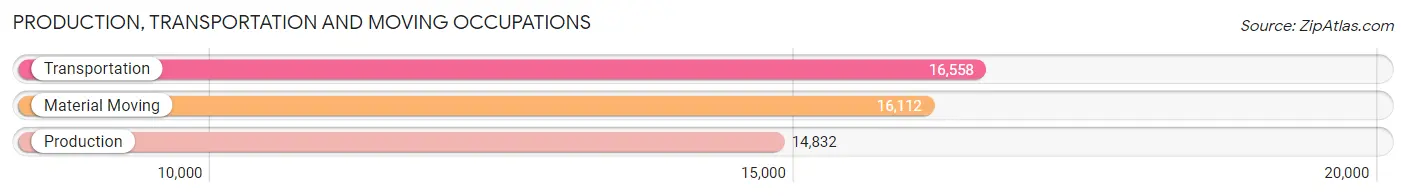
Production, Transportation and Moving Occupations
The most common Production, Transportation and Moving occupations in Polk County are Transportation (16,558 | 5.2%), Material Moving (16,112 | 5.0%), and Production (14,832 | 4.6%).
Production, Transportation and Moving Occupations by Sex
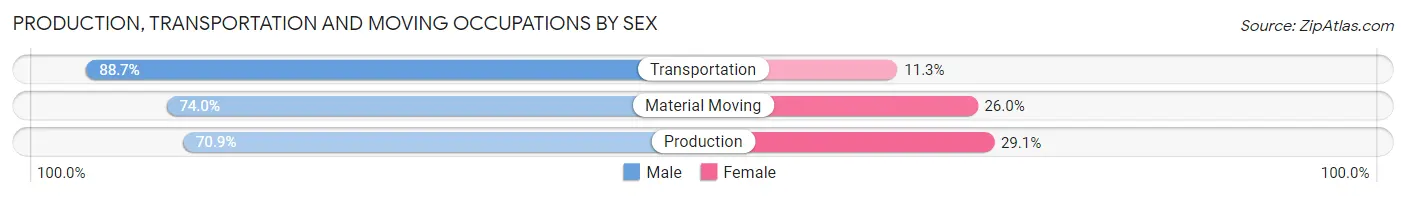
| Occupation | Male | Female |
| Production | 10,521 (70.9%) | 4,311 (29.1%) |
| Transportation | 14,681 (88.7%) | 1,877 (11.3%) |
| Material Moving | 11,917 (74.0%) | 4,195 (26.0%) |
| Total (Category) | 37,119 (78.1%) | 10,383 (21.9%) |
| Total (Overall) | 169,471 (52.9%) | 150,752 (47.1%) |
Employment Industries by Sex in Polk County
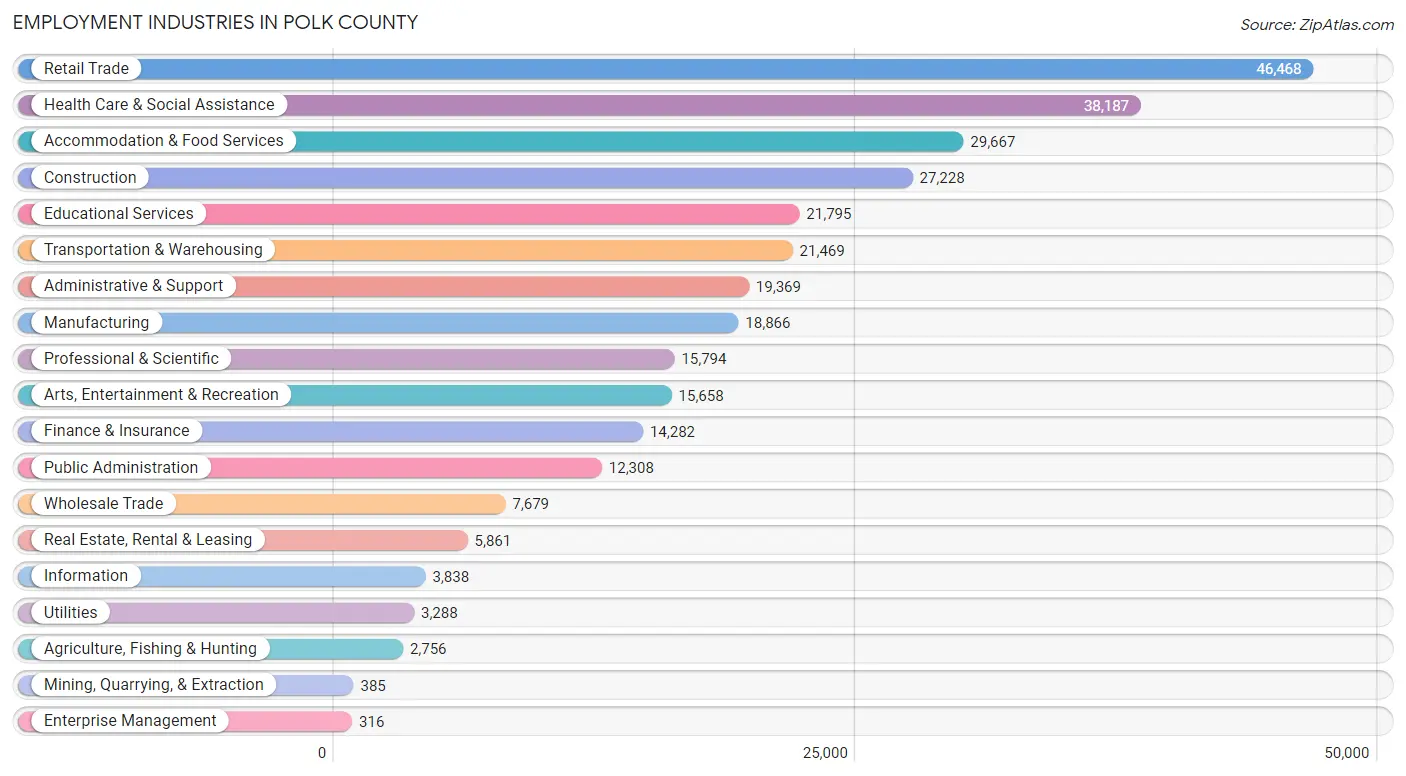
Employment Industries in Polk County
The major employment industries in Polk County include Retail Trade (46,468 | 14.5%), Health Care & Social Assistance (38,187 | 11.9%), Accommodation & Food Services (29,667 | 9.3%), Construction (27,228 | 8.5%), and Educational Services (21,795 | 6.8%).
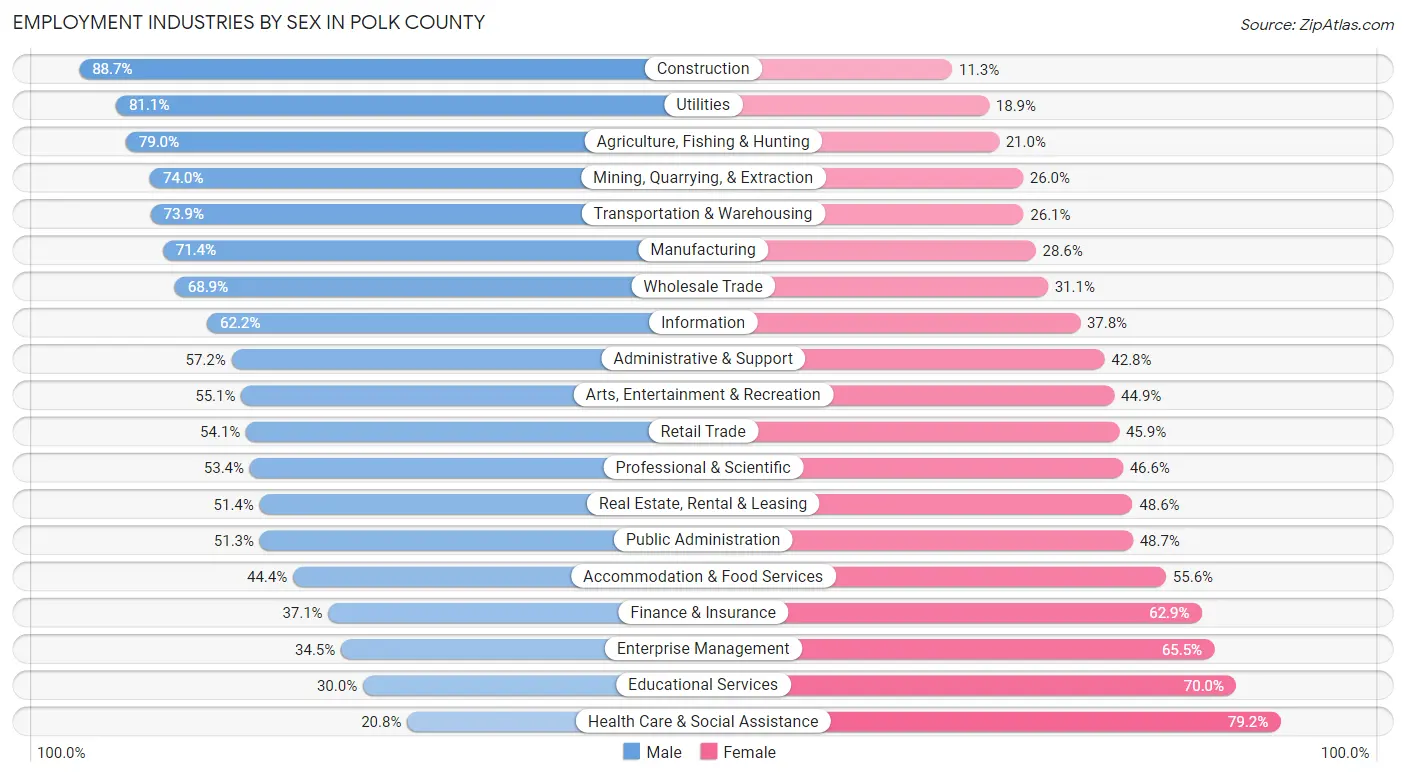
Employment Industries by Sex in Polk County
The Polk County industries that see more men than women are Construction (88.7%), Utilities (81.1%), and Agriculture, Fishing & Hunting (79.0%), whereas the industries that tend to have a higher number of women are Health Care & Social Assistance (79.2%), Educational Services (70.0%), and Enterprise Management (65.5%).
| Industry | Male | Female |
| Agriculture, Fishing & Hunting | 2,178 (79.0%) | 578 (21.0%) |
| Mining, Quarrying, & Extraction | 285 (74.0%) | 100 (26.0%) |
| Construction | 24,148 (88.7%) | 3,080 (11.3%) |
| Manufacturing | 13,468 (71.4%) | 5,398 (28.6%) |
| Wholesale Trade | 5,290 (68.9%) | 2,389 (31.1%) |
| Retail Trade | 25,157 (54.1%) | 21,311 (45.9%) |
| Transportation & Warehousing | 15,871 (73.9%) | 5,598 (26.1%) |
| Utilities | 2,666 (81.1%) | 622 (18.9%) |
| Information | 2,388 (62.2%) | 1,450 (37.8%) |
| Finance & Insurance | 5,300 (37.1%) | 8,982 (62.9%) |
| Real Estate, Rental & Leasing | 3,010 (51.4%) | 2,851 (48.6%) |
| Professional & Scientific | 8,429 (53.4%) | 7,365 (46.6%) |
| Enterprise Management | 109 (34.5%) | 207 (65.5%) |
| Administrative & Support | 11,074 (57.2%) | 8,295 (42.8%) |
| Educational Services | 6,530 (30.0%) | 15,265 (70.0%) |
| Health Care & Social Assistance | 7,942 (20.8%) | 30,245 (79.2%) |
| Arts, Entertainment & Recreation | 8,634 (55.1%) | 7,024 (44.9%) |
| Accommodation & Food Services | 13,182 (44.4%) | 16,485 (55.6%) |
| Public Administration | 6,314 (51.3%) | 5,994 (48.7%) |
| Total | 169,471 (52.9%) | 150,752 (47.1%) |
Education in Polk County
School Enrollment in Polk County
The most common levels of schooling among the 164,086 students in Polk County are middle school (38,874 | 23.7%), high school (36,737 | 22.4%), and elementary school (34,935 | 21.3%).
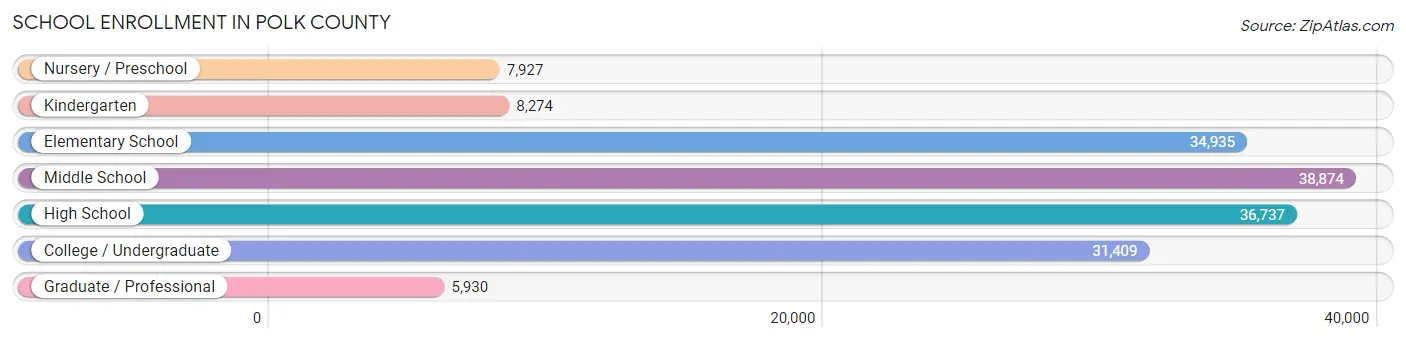
| School Level | # Students | % Students |
| Nursery / Preschool | 7,927 | 4.8% |
| Kindergarten | 8,274 | 5.0% |
| Elementary School | 34,935 | 21.3% |
| Middle School | 38,874 | 23.7% |
| High School | 36,737 | 22.4% |
| College / Undergraduate | 31,409 | 19.1% |
| Graduate / Professional | 5,930 | 3.6% |
| Total | 164,086 | 100.0% |
School Enrollment by Age by Funding Source in Polk County
Out of a total of 164,086 students who are enrolled in schools in Polk County, 32,817 (20.0%) attend a private institution, while the remaining 131,269 (80.0%) are enrolled in public schools. The age group of 35 years and over has the highest likelihood of being enrolled in private schools, with 3,218 (34.6% in the age bracket) enrolled. Conversely, the age group of 15 to 17 year olds has the lowest likelihood of being enrolled in a private school, with 23,467 (87.5% in the age bracket) attending a public institution.
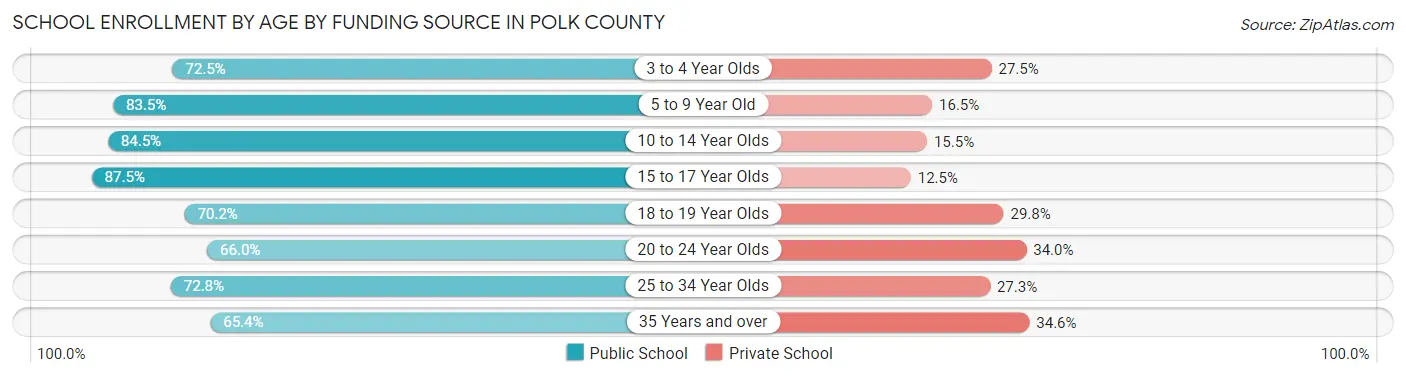
| Age Bracket | Public School | Private School |
| 3 to 4 Year Olds | 4,336 (72.5%) | 1,648 (27.5%) |
| 5 to 9 Year Old | 33,796 (83.5%) | 6,663 (16.5%) |
| 10 to 14 Year Olds | 40,027 (84.5%) | 7,351 (15.5%) |
| 15 to 17 Year Olds | 23,467 (87.5%) | 3,353 (12.5%) |
| 18 to 19 Year Olds | 8,839 (70.2%) | 3,748 (29.8%) |
| 20 to 24 Year Olds | 8,802 (66.0%) | 4,537 (34.0%) |
| 25 to 34 Year Olds | 5,978 (72.8%) | 2,239 (27.3%) |
| 35 Years and over | 6,084 (65.4%) | 3,218 (34.6%) |
| Total | 131,269 (80.0%) | 32,817 (20.0%) |
Educational Attainment by Field of Study in Polk County
Business (27,552 | 23.5%), education (18,591 | 15.9%), science & technology (11,692 | 10.0%), arts & humanities (8,217 | 7.0%), and social sciences (7,171 | 6.1%) are the most common fields of study among 117,165 individuals in Polk County who have obtained a bachelor's degree or higher.
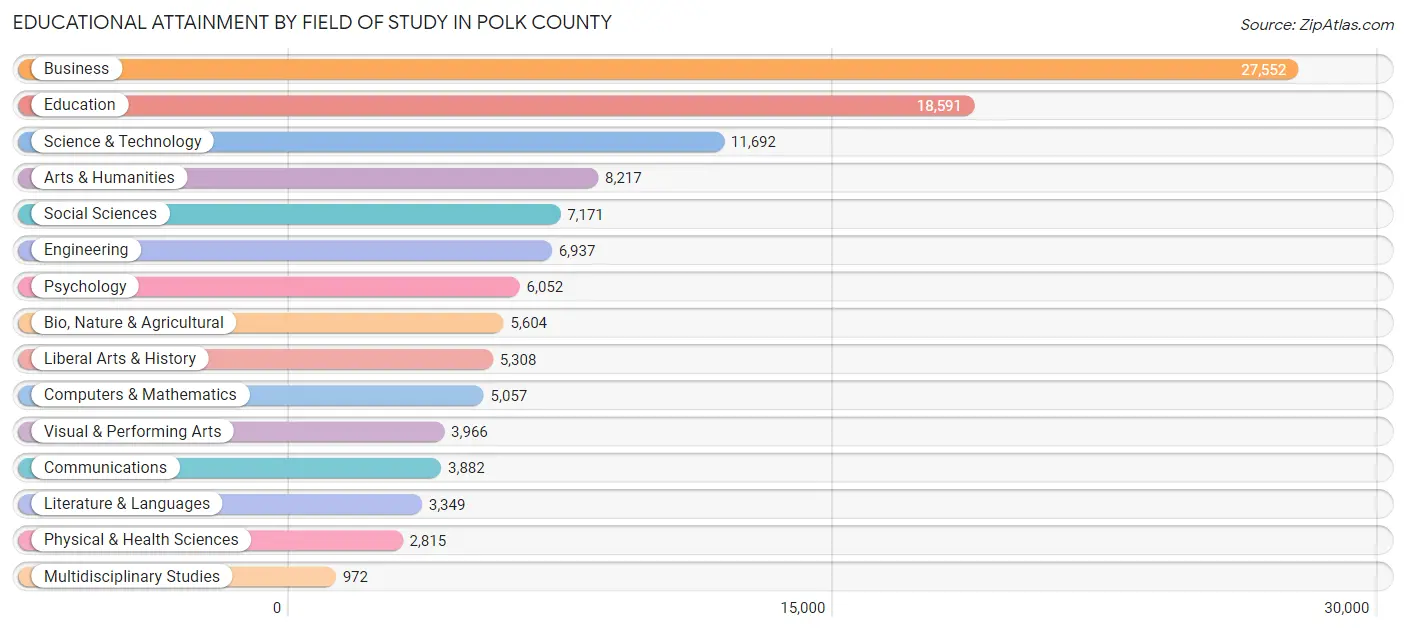
| Field of Study | # Graduates | % Graduates |
| Computers & Mathematics | 5,057 | 4.3% |
| Bio, Nature & Agricultural | 5,604 | 4.8% |
| Physical & Health Sciences | 2,815 | 2.4% |
| Psychology | 6,052 | 5.2% |
| Social Sciences | 7,171 | 6.1% |
| Engineering | 6,937 | 5.9% |
| Multidisciplinary Studies | 972 | 0.8% |
| Science & Technology | 11,692 | 10.0% |
| Business | 27,552 | 23.5% |
| Education | 18,591 | 15.9% |
| Literature & Languages | 3,349 | 2.9% |
| Liberal Arts & History | 5,308 | 4.5% |
| Visual & Performing Arts | 3,966 | 3.4% |
| Communications | 3,882 | 3.3% |
| Arts & Humanities | 8,217 | 7.0% |
| Total | 117,165 | 100.0% |
Transportation & Commute in Polk County
Vehicle Availability by Sex in Polk County
The most prevalent vehicle ownership categories in Polk County are males with 2 vehicles (76,715, accounting for 46.1%) and females with 2 vehicles (62,837, making up 52.0%).
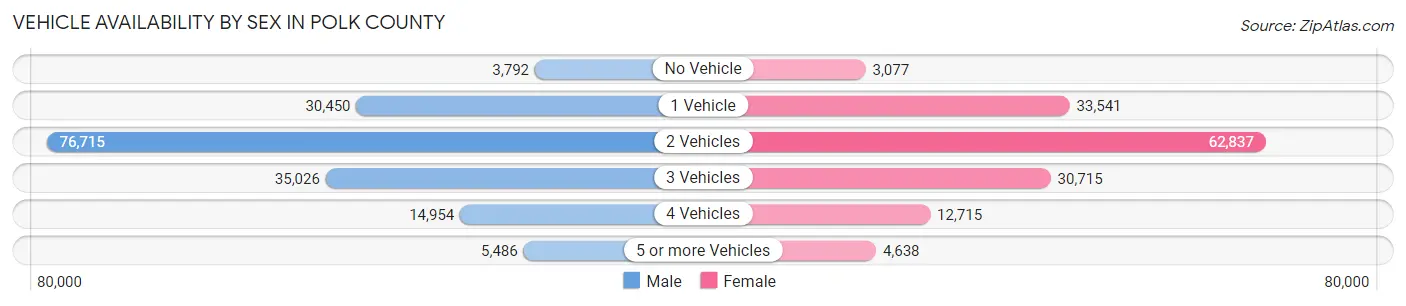
| Vehicles Available | Male | Female |
| No Vehicle | 3,792 (2.3%) | 3,077 (2.1%) |
| 1 Vehicle | 30,450 (18.3%) | 33,541 (22.7%) |
| 2 Vehicles | 76,715 (46.1%) | 62,837 (42.6%) |
| 3 Vehicles | 35,026 (21.0%) | 30,715 (20.8%) |
| 4 Vehicles | 14,954 (9.0%) | 12,715 (8.6%) |
| 5 or more Vehicles | 5,486 (3.3%) | 4,638 (3.1%) |
| Total | 166,423 (100.0%) | 147,523 (100.0%) |
Commute Time in Polk County
The most frequently occuring commute durations in Polk County are 15 to 19 minutes (44,492 commuters, 15.5%), 20 to 24 minutes (42,900 commuters, 14.9%), and 30 to 34 minutes (39,545 commuters, 13.8%).
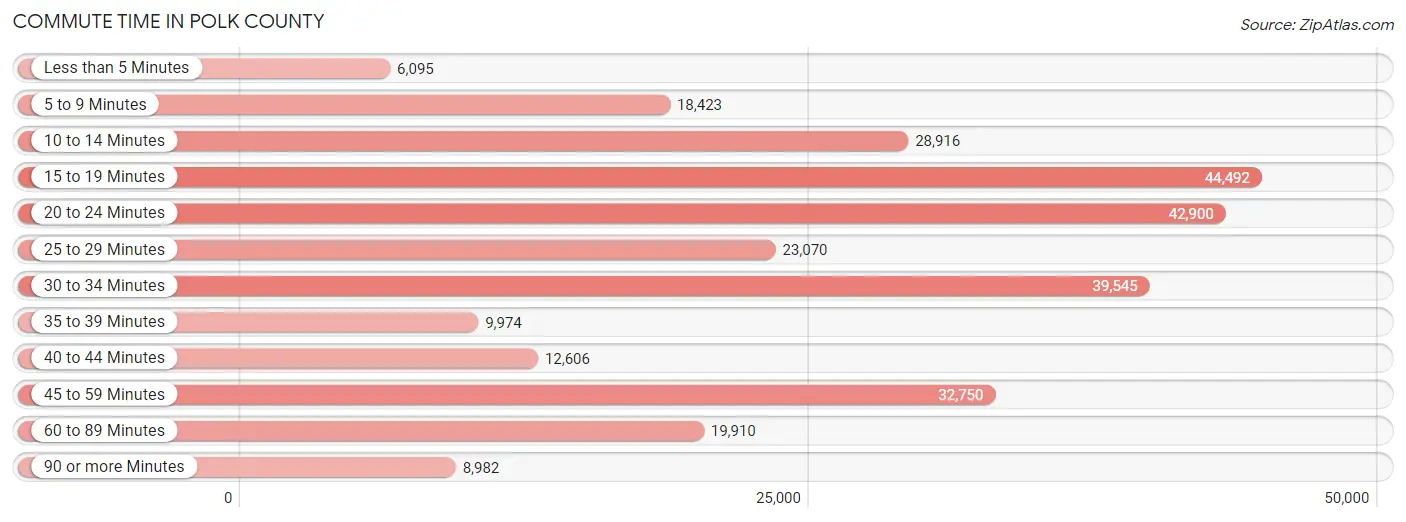
| Commute Time | # Commuters | % Commuters |
| Less than 5 Minutes | 6,095 | 2.1% |
| 5 to 9 Minutes | 18,423 | 6.4% |
| 10 to 14 Minutes | 28,916 | 10.1% |
| 15 to 19 Minutes | 44,492 | 15.5% |
| 20 to 24 Minutes | 42,900 | 14.9% |
| 25 to 29 Minutes | 23,070 | 8.0% |
| 30 to 34 Minutes | 39,545 | 13.8% |
| 35 to 39 Minutes | 9,974 | 3.5% |
| 40 to 44 Minutes | 12,606 | 4.4% |
| 45 to 59 Minutes | 32,750 | 11.4% |
| 60 to 89 Minutes | 19,910 | 6.9% |
| 90 or more Minutes | 8,982 | 3.1% |
Commute Time by Sex in Polk County
The most common commute times in Polk County are 15 to 19 minutes (23,119 commuters, 15.0%) for males and 20 to 24 minutes (22,134 commuters, 16.6%) for females.
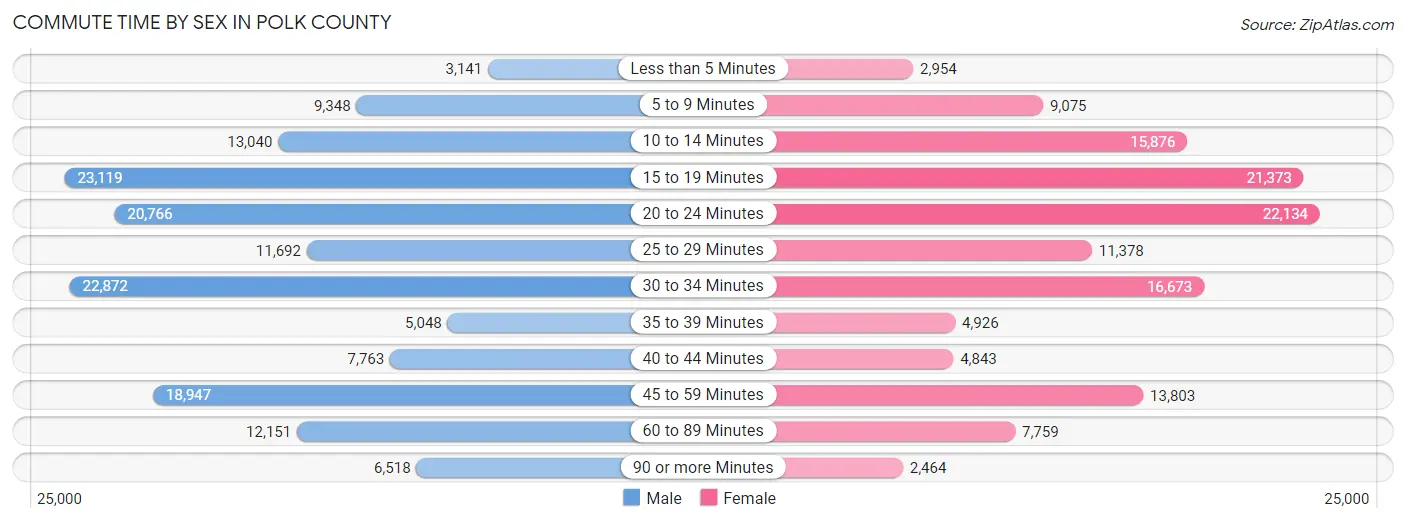
| Commute Time | Male | Female |
| Less than 5 Minutes | 3,141 (2.0%) | 2,954 (2.2%) |
| 5 to 9 Minutes | 9,348 (6.0%) | 9,075 (6.8%) |
| 10 to 14 Minutes | 13,040 (8.5%) | 15,876 (11.9%) |
| 15 to 19 Minutes | 23,119 (15.0%) | 21,373 (16.0%) |
| 20 to 24 Minutes | 20,766 (13.5%) | 22,134 (16.6%) |
| 25 to 29 Minutes | 11,692 (7.6%) | 11,378 (8.5%) |
| 30 to 34 Minutes | 22,872 (14.8%) | 16,673 (12.5%) |
| 35 to 39 Minutes | 5,048 (3.3%) | 4,926 (3.7%) |
| 40 to 44 Minutes | 7,763 (5.0%) | 4,843 (3.6%) |
| 45 to 59 Minutes | 18,947 (12.3%) | 13,803 (10.4%) |
| 60 to 89 Minutes | 12,151 (7.9%) | 7,759 (5.8%) |
| 90 or more Minutes | 6,518 (4.2%) | 2,464 (1.8%) |
Time of Departure to Work by Sex in Polk County
The most frequent times of departure to work in Polk County are 7:00 AM to 7:29 AM (21,830, 14.1%) for males and 7:00 AM to 7:29 AM (23,190, 17.4%) for females.
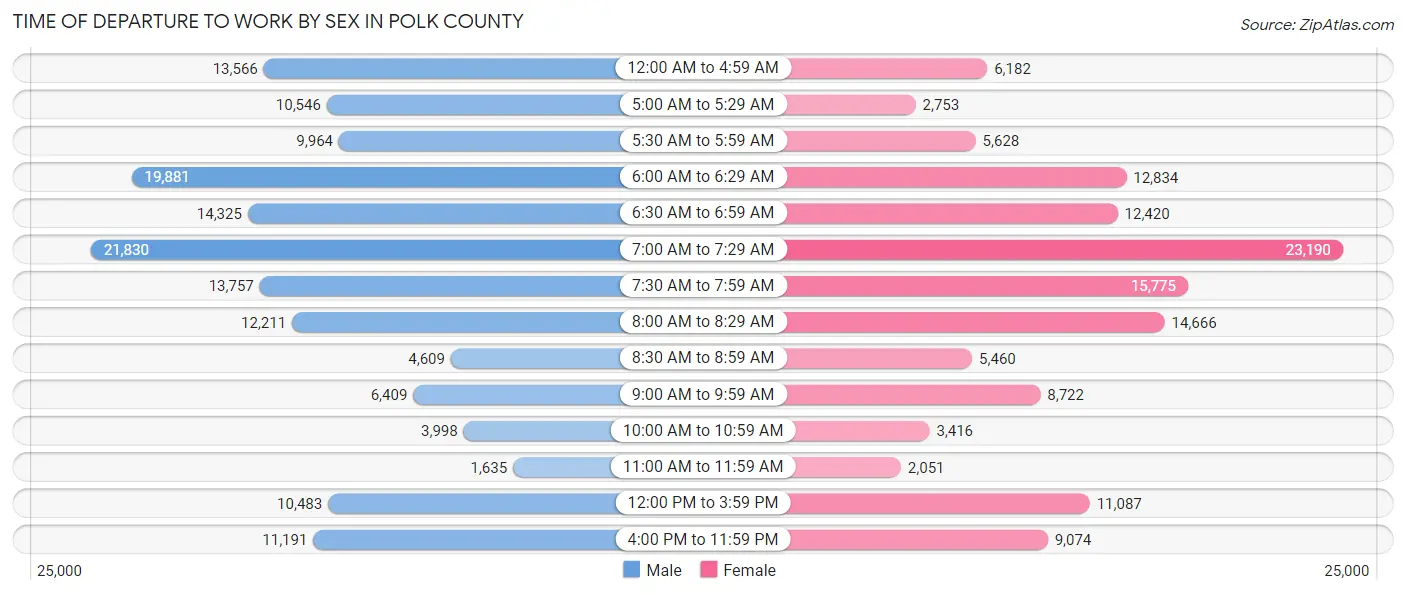
| Time of Departure | Male | Female |
| 12:00 AM to 4:59 AM | 13,566 (8.8%) | 6,182 (4.6%) |
| 5:00 AM to 5:29 AM | 10,546 (6.8%) | 2,753 (2.1%) |
| 5:30 AM to 5:59 AM | 9,964 (6.5%) | 5,628 (4.2%) |
| 6:00 AM to 6:29 AM | 19,881 (12.9%) | 12,834 (9.6%) |
| 6:30 AM to 6:59 AM | 14,325 (9.3%) | 12,420 (9.3%) |
| 7:00 AM to 7:29 AM | 21,830 (14.1%) | 23,190 (17.4%) |
| 7:30 AM to 7:59 AM | 13,757 (8.9%) | 15,775 (11.8%) |
| 8:00 AM to 8:29 AM | 12,211 (7.9%) | 14,666 (11.0%) |
| 8:30 AM to 8:59 AM | 4,609 (3.0%) | 5,460 (4.1%) |
| 9:00 AM to 9:59 AM | 6,409 (4.2%) | 8,722 (6.6%) |
| 10:00 AM to 10:59 AM | 3,998 (2.6%) | 3,416 (2.6%) |
| 11:00 AM to 11:59 AM | 1,635 (1.1%) | 2,051 (1.5%) |
| 12:00 PM to 3:59 PM | 10,483 (6.8%) | 11,087 (8.3%) |
| 4:00 PM to 11:59 PM | 11,191 (7.2%) | 9,074 (6.8%) |
| Total | 154,405 (100.0%) | 133,258 (100.0%) |
Housing Occupancy in Polk County
Occupancy by Ownership in Polk County
Of the total 264,145 dwellings in Polk County, owner-occupied units account for 184,335 (69.8%), while renter-occupied units make up 79,810 (30.2%).
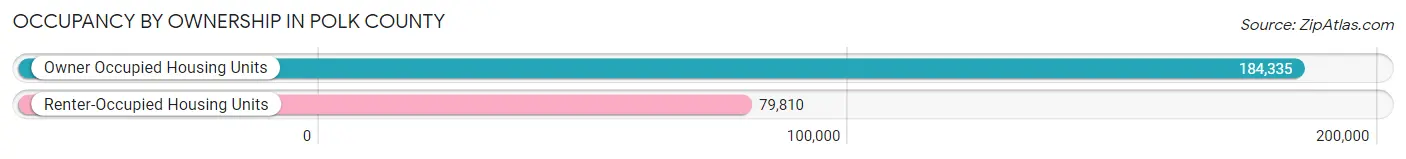
| Occupancy | # Housing Units | % Housing Units |
| Owner Occupied Housing Units | 184,335 | 69.8% |
| Renter-Occupied Housing Units | 79,810 | 30.2% |
| Total Occupied Housing Units | 264,145 | 100.0% |
Occupancy by Household Size in Polk County
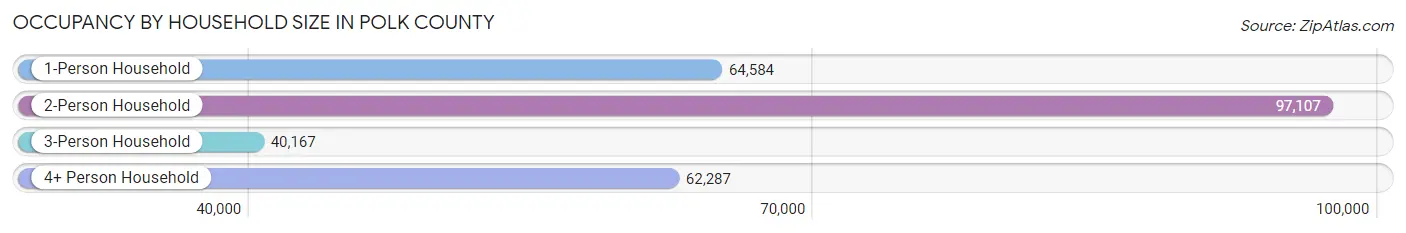
| Household Size | # Housing Units | % Housing Units |
| 1-Person Household | 64,584 | 24.4% |
| 2-Person Household | 97,107 | 36.8% |
| 3-Person Household | 40,167 | 15.2% |
| 4+ Person Household | 62,287 | 23.6% |
| Total Housing Units | 264,145 | 100.0% |
Occupancy by Ownership by Household Size in Polk County
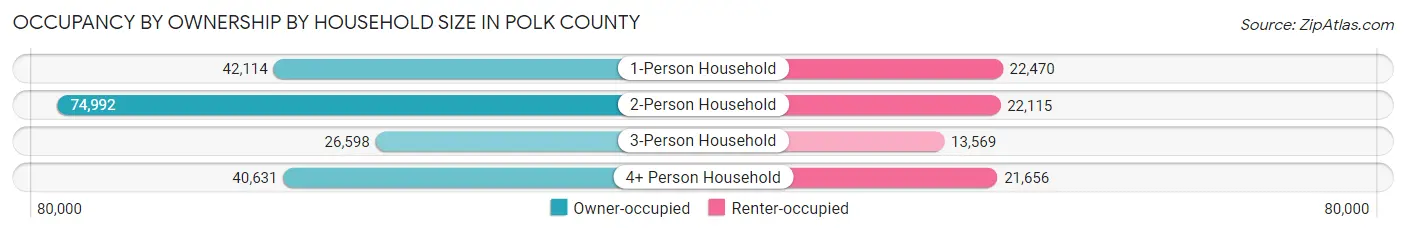
| Household Size | Owner-occupied | Renter-occupied |
| 1-Person Household | 42,114 (65.2%) | 22,470 (34.8%) |
| 2-Person Household | 74,992 (77.2%) | 22,115 (22.8%) |
| 3-Person Household | 26,598 (66.2%) | 13,569 (33.8%) |
| 4+ Person Household | 40,631 (65.2%) | 21,656 (34.8%) |
| Total Housing Units | 184,335 (69.8%) | 79,810 (30.2%) |
Occupancy by Educational Attainment in Polk County
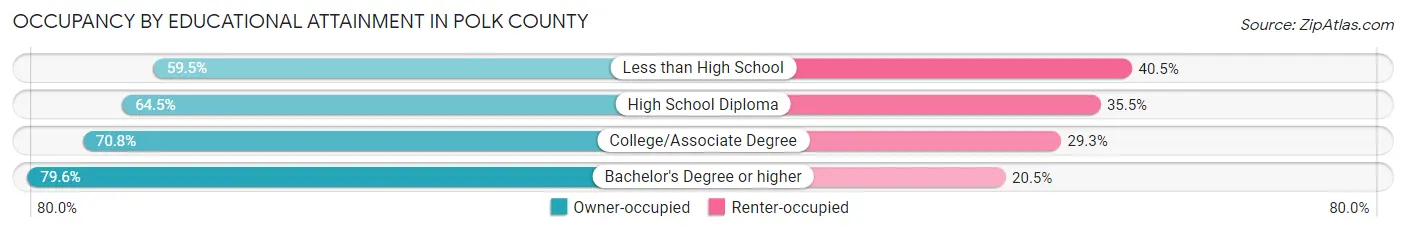
| Household Size | Owner-occupied | Renter-occupied |
| Less than High School | 16,396 (59.5%) | 11,159 (40.5%) |
| High School Diploma | 53,110 (64.5%) | 29,220 (35.5%) |
| College/Associate Degree | 63,413 (70.8%) | 26,214 (29.2%) |
| Bachelor's Degree or higher | 51,416 (79.5%) | 13,217 (20.4%) |
Occupancy by Age of Householder in Polk County
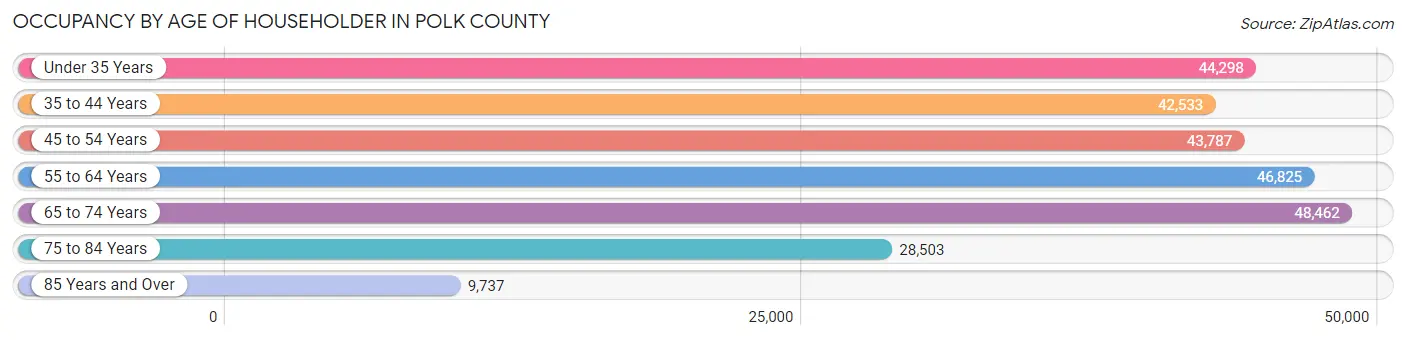
| Age Bracket | # Households | % Households |
| Under 35 Years | 44,298 | 16.8% |
| 35 to 44 Years | 42,533 | 16.1% |
| 45 to 54 Years | 43,787 | 16.6% |
| 55 to 64 Years | 46,825 | 17.7% |
| 65 to 74 Years | 48,462 | 18.3% |
| 75 to 84 Years | 28,503 | 10.8% |
| 85 Years and Over | 9,737 | 3.7% |
| Total | 264,145 | 100.0% |
Housing Finances in Polk County
Median Income by Occupancy in Polk County
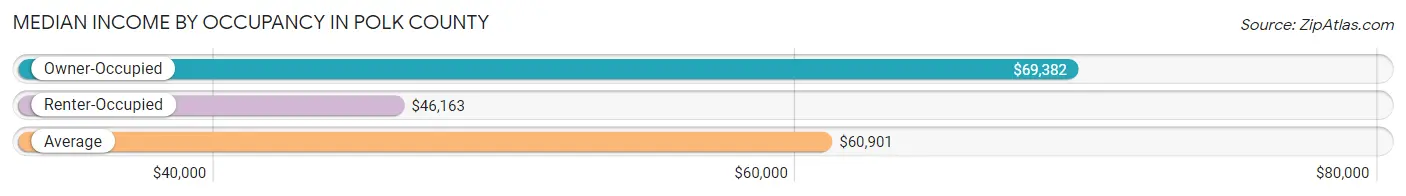
| Occupancy Type | # Households | Median Income |
| Owner-Occupied | 184,335 (69.8%) | $69,382 |
| Renter-Occupied | 79,810 (30.2%) | $46,163 |
| Average | 264,145 (100.0%) | $60,901 |
Occupancy by Householder Income Bracket in Polk County
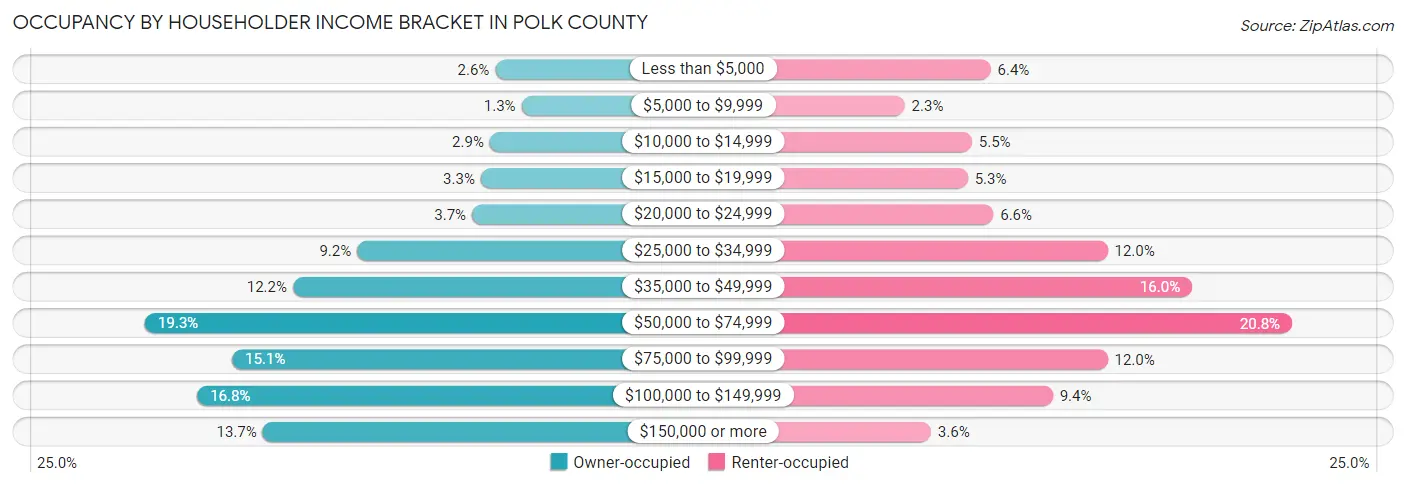
| Income Bracket | Owner-occupied | Renter-occupied |
| Less than $5,000 | 4,773 (2.6%) | 5,135 (6.4%) |
| $5,000 to $9,999 | 2,471 (1.3%) | 1,866 (2.3%) |
| $10,000 to $14,999 | 5,257 (2.9%) | 4,420 (5.5%) |
| $15,000 to $19,999 | 6,050 (3.3%) | 4,261 (5.3%) |
| $20,000 to $24,999 | 6,817 (3.7%) | 5,237 (6.6%) |
| $25,000 to $34,999 | 16,900 (9.2%) | 9,579 (12.0%) |
| $35,000 to $49,999 | 22,537 (12.2%) | 12,789 (16.0%) |
| $50,000 to $74,999 | 35,515 (19.3%) | 16,585 (20.8%) |
| $75,000 to $99,999 | 27,878 (15.1%) | 9,577 (12.0%) |
| $100,000 to $149,999 | 30,934 (16.8%) | 7,496 (9.4%) |
| $150,000 or more | 25,203 (13.7%) | 2,865 (3.6%) |
| Total | 184,335 (100.0%) | 79,810 (100.0%) |
Monthly Housing Cost Tiers in Polk County
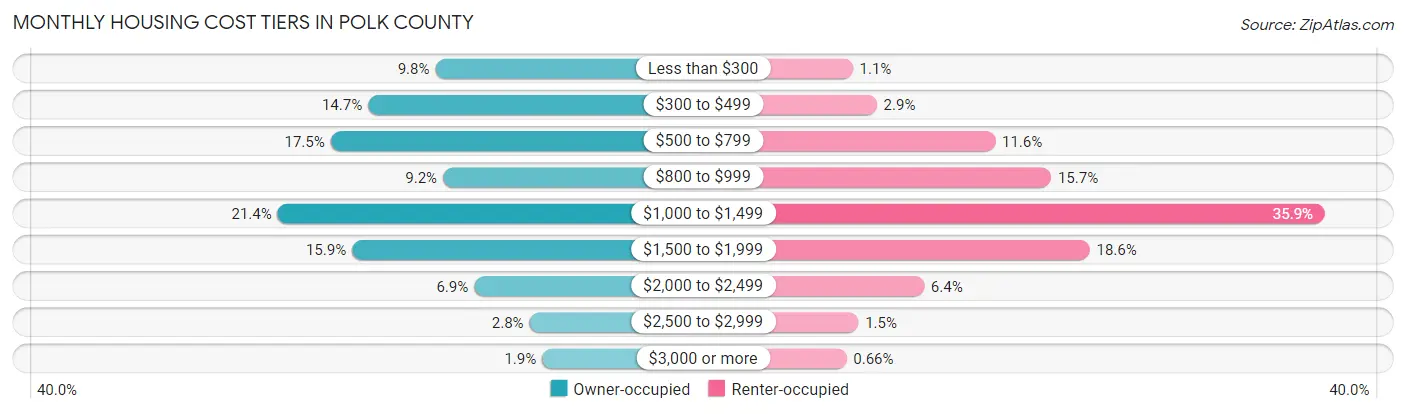
| Monthly Cost | Owner-occupied | Renter-occupied |
| Less than $300 | 17,981 (9.8%) | 891 (1.1%) |
| $300 to $499 | 27,117 (14.7%) | 2,308 (2.9%) |
| $500 to $799 | 32,207 (17.5%) | 9,263 (11.6%) |
| $800 to $999 | 16,947 (9.2%) | 12,558 (15.7%) |
| $1,000 to $1,499 | 39,400 (21.4%) | 28,648 (35.9%) |
| $1,500 to $1,999 | 29,291 (15.9%) | 14,819 (18.6%) |
| $2,000 to $2,499 | 12,713 (6.9%) | 5,083 (6.4%) |
| $2,500 to $2,999 | 5,197 (2.8%) | 1,224 (1.5%) |
| $3,000 or more | 3,482 (1.9%) | 527 (0.7%) |
| Total | 184,335 (100.0%) | 79,810 (100.0%) |
Physical Housing Characteristics in Polk County
Housing Structures in Polk County
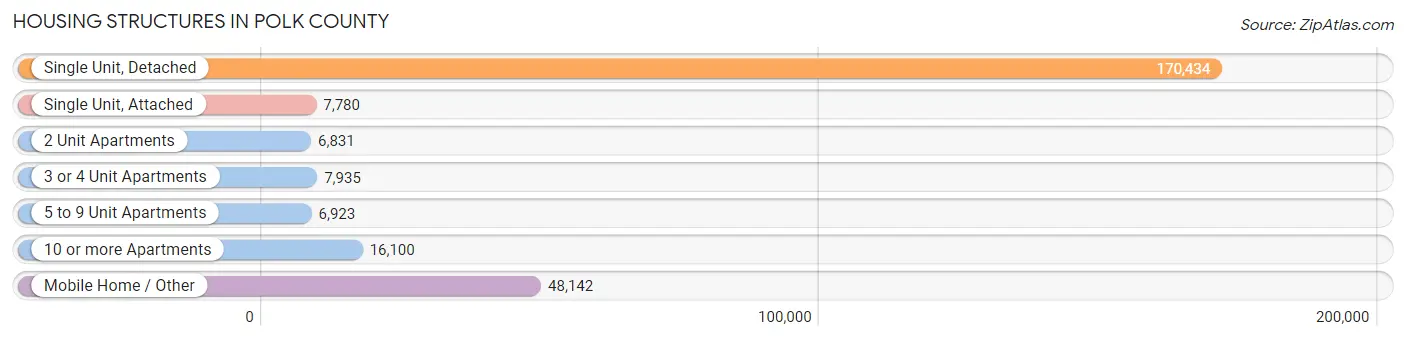
| Structure Type | # Housing Units | % Housing Units |
| Single Unit, Detached | 170,434 | 64.5% |
| Single Unit, Attached | 7,780 | 2.9% |
| 2 Unit Apartments | 6,831 | 2.6% |
| 3 or 4 Unit Apartments | 7,935 | 3.0% |
| 5 to 9 Unit Apartments | 6,923 | 2.6% |
| 10 or more Apartments | 16,100 | 6.1% |
| Mobile Home / Other | 48,142 | 18.2% |
| Total | 264,145 | 100.0% |
Housing Structures by Occupancy in Polk County
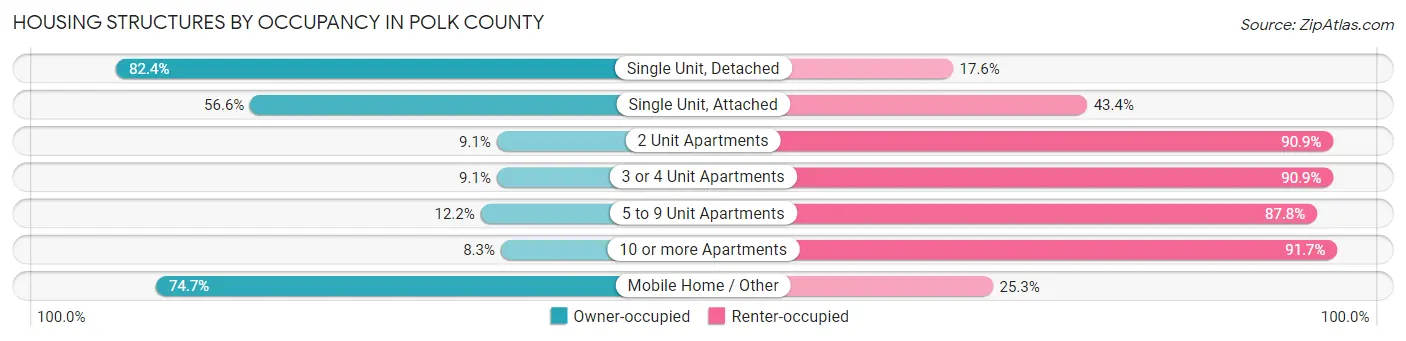
| Structure Type | Owner-occupied | Renter-occupied |
| Single Unit, Detached | 140,442 (82.4%) | 29,992 (17.6%) |
| Single Unit, Attached | 4,401 (56.6%) | 3,379 (43.4%) |
| 2 Unit Apartments | 622 (9.1%) | 6,209 (90.9%) |
| 3 or 4 Unit Apartments | 721 (9.1%) | 7,214 (90.9%) |
| 5 to 9 Unit Apartments | 846 (12.2%) | 6,077 (87.8%) |
| 10 or more Apartments | 1,340 (8.3%) | 14,760 (91.7%) |
| Mobile Home / Other | 35,963 (74.7%) | 12,179 (25.3%) |
| Total | 184,335 (69.8%) | 79,810 (30.2%) |
Housing Structures by Number of Rooms in Polk County
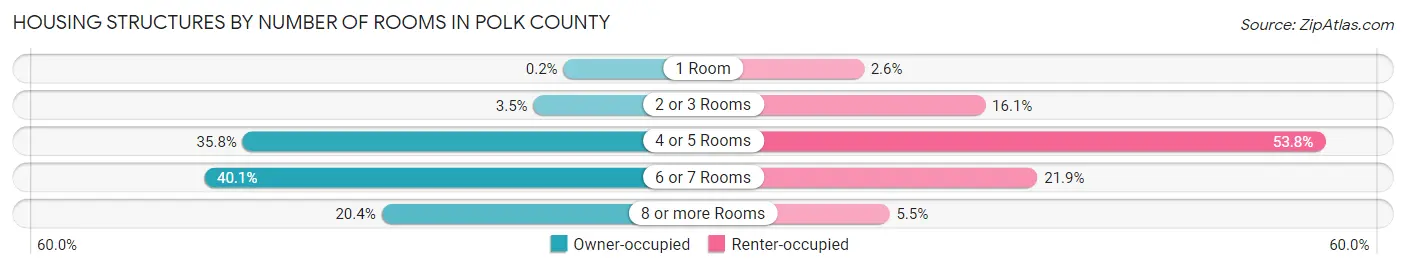
| Number of Rooms | Owner-occupied | Renter-occupied |
| 1 Room | 362 (0.2%) | 2,106 (2.6%) |
| 2 or 3 Rooms | 6,503 (3.5%) | 12,863 (16.1%) |
| 4 or 5 Rooms | 65,998 (35.8%) | 42,967 (53.8%) |
| 6 or 7 Rooms | 73,877 (40.1%) | 17,484 (21.9%) |
| 8 or more Rooms | 37,595 (20.4%) | 4,390 (5.5%) |
| Total | 184,335 (100.0%) | 79,810 (100.0%) |
Housing Structure by Heating Type in Polk County
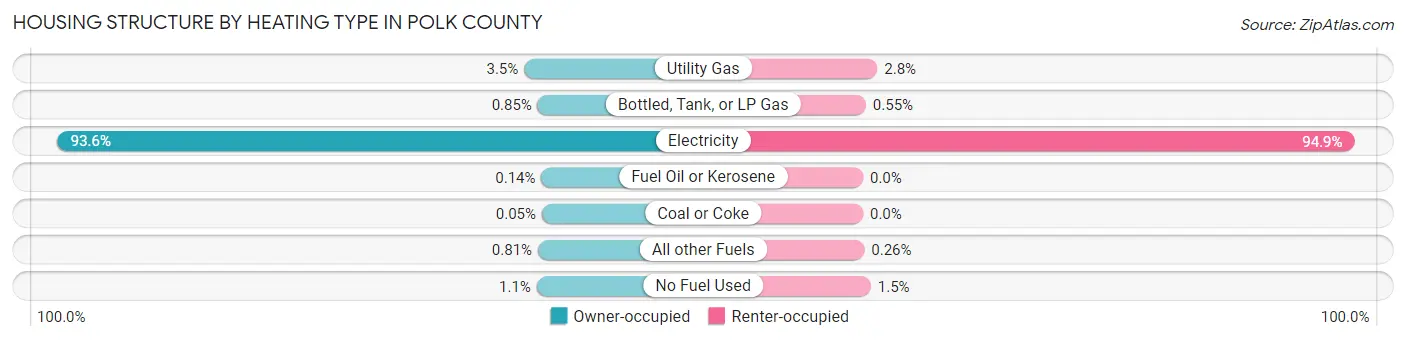
| Heating Type | Owner-occupied | Renter-occupied |
| Utility Gas | 6,401 (3.5%) | 2,205 (2.8%) |
| Bottled, Tank, or LP Gas | 1,559 (0.9%) | 436 (0.5%) |
| Electricity | 172,593 (93.6%) | 75,763 (94.9%) |
| Fuel Oil or Kerosene | 264 (0.1%) | 0 (0.0%) |
| Coal or Coke | 91 (0.1%) | 0 (0.0%) |
| All other Fuels | 1,498 (0.8%) | 204 (0.3%) |
| No Fuel Used | 1,929 (1.1%) | 1,202 (1.5%) |
| Total | 184,335 (100.0%) | 79,810 (100.0%) |
Household Vehicle Usage in Polk County
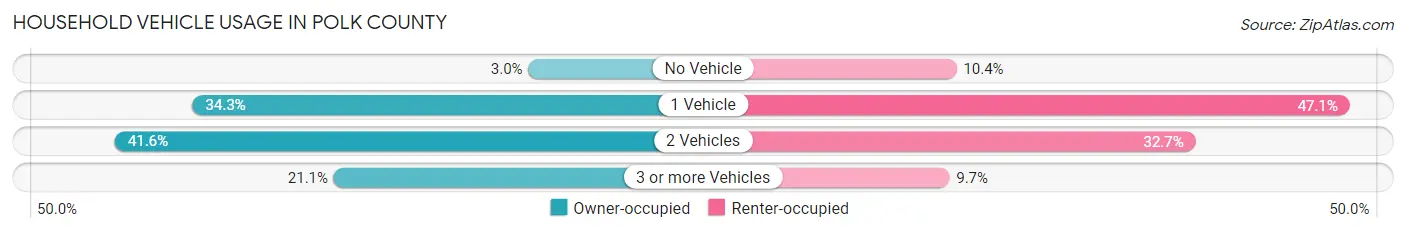
| Vehicles per Household | Owner-occupied | Renter-occupied |
| No Vehicle | 5,472 (3.0%) | 8,306 (10.4%) |
| 1 Vehicle | 63,274 (34.3%) | 37,604 (47.1%) |
| 2 Vehicles | 76,637 (41.6%) | 26,124 (32.7%) |
| 3 or more Vehicles | 38,952 (21.1%) | 7,776 (9.7%) |
| Total | 184,335 (100.0%) | 79,810 (100.0%) |
Real Estate & Mortgages in Polk County
Real Estate and Mortgage Overview in Polk County
| Characteristic | Without Mortgage | With Mortgage |
| Housing Units | 83,517 | 100,818 |
| Median Property Value | $157,800 | $243,100 |
| Median Household Income | $53,919 | $17,178 |
| Monthly Housing Costs | $481 | $3,426 |
| Real Estate Taxes | $1,193 | $4,232 |
Property Value by Mortgage Status in Polk County
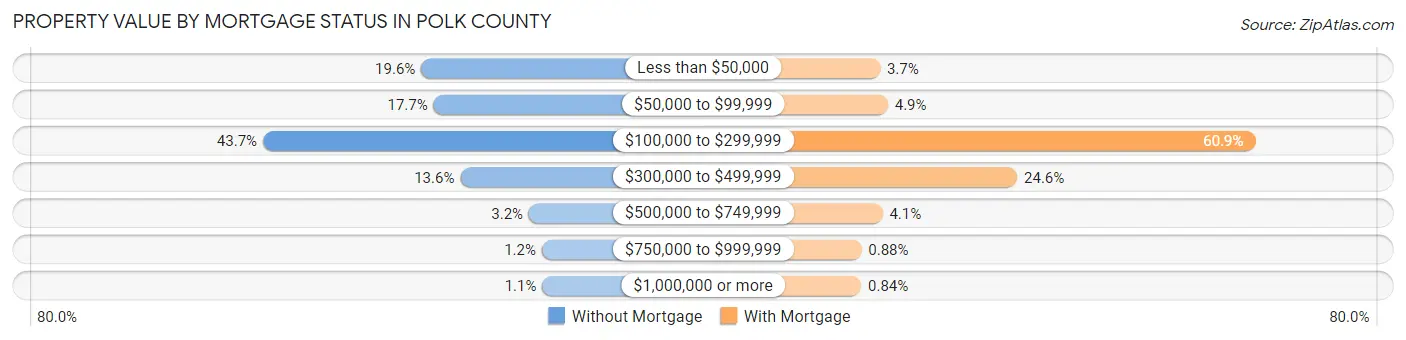
| Property Value | Without Mortgage | With Mortgage |
| Less than $50,000 | 16,341 (19.6%) | 3,746 (3.7%) |
| $50,000 to $99,999 | 14,764 (17.7%) | 4,953 (4.9%) |
| $100,000 to $299,999 | 36,489 (43.7%) | 61,423 (60.9%) |
| $300,000 to $499,999 | 11,379 (13.6%) | 24,824 (24.6%) |
| $500,000 to $749,999 | 2,627 (3.2%) | 4,138 (4.1%) |
| $750,000 to $999,999 | 991 (1.2%) | 889 (0.9%) |
| $1,000,000 or more | 926 (1.1%) | 845 (0.8%) |
| Total | 83,517 (100.0%) | 100,818 (100.0%) |
Household Income by Mortgage Status in Polk County
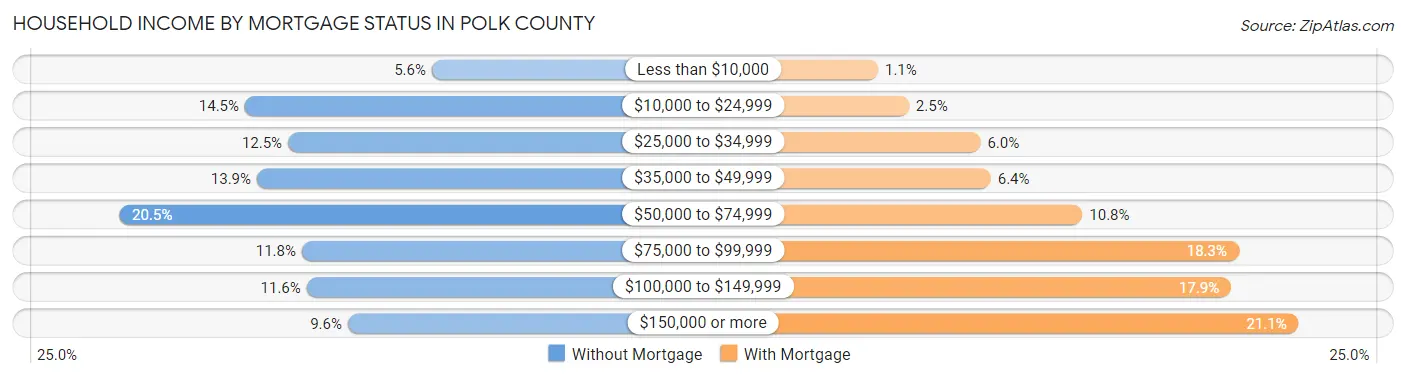
| Household Income | Without Mortgage | With Mortgage |
| Less than $10,000 | 4,686 (5.6%) | 1,080 (1.1%) |
| $10,000 to $24,999 | 12,122 (14.5%) | 2,558 (2.5%) |
| $25,000 to $34,999 | 10,407 (12.5%) | 6,002 (5.9%) |
| $35,000 to $49,999 | 11,644 (13.9%) | 6,493 (6.4%) |
| $50,000 to $74,999 | 17,119 (20.5%) | 10,893 (10.8%) |
| $75,000 to $99,999 | 9,851 (11.8%) | 18,396 (18.2%) |
| $100,000 to $149,999 | 9,663 (11.6%) | 18,027 (17.9%) |
| $150,000 or more | 8,025 (9.6%) | 21,271 (21.1%) |
| Total | 83,517 (100.0%) | 100,818 (100.0%) |
Property Value to Household Income Ratio in Polk County
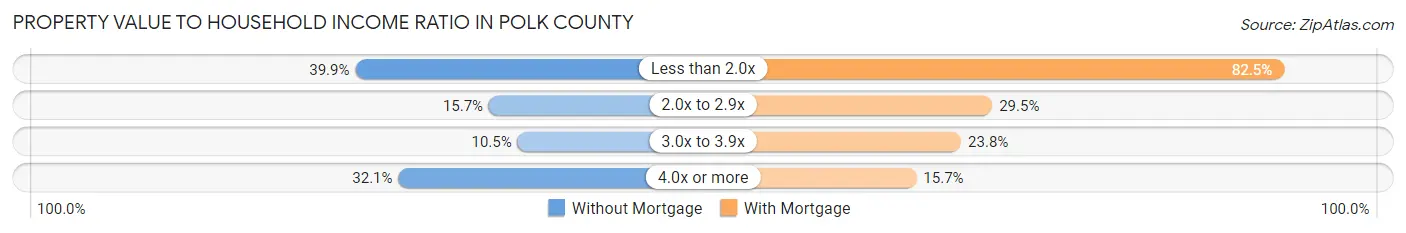
| Value-to-Income Ratio | Without Mortgage | With Mortgage |
| Less than 2.0x | 33,360 (39.9%) | 83,139 (82.5%) |
| 2.0x to 2.9x | 13,090 (15.7%) | 29,725 (29.5%) |
| 3.0x to 3.9x | 8,743 (10.5%) | 24,020 (23.8%) |
| 4.0x or more | 26,825 (32.1%) | 15,838 (15.7%) |
| Total | 83,517 (100.0%) | 100,818 (100.0%) |
Real Estate Taxes by Mortgage Status in Polk County
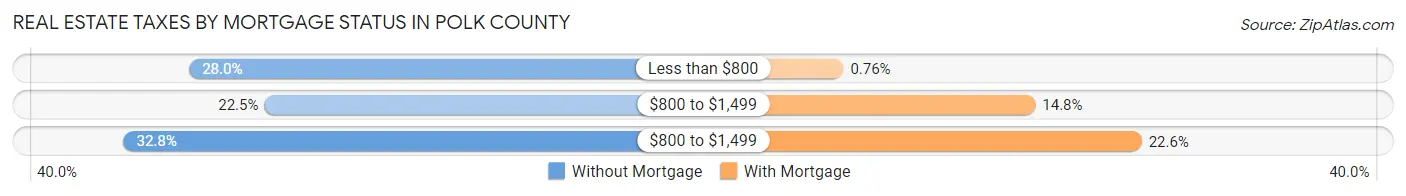
| Property Taxes | Without Mortgage | With Mortgage |
| Less than $800 | 23,360 (28.0%) | 765 (0.8%) |
| $800 to $1,499 | 18,780 (22.5%) | 14,896 (14.8%) |
| $800 to $1,499 | 27,365 (32.8%) | 22,730 (22.6%) |
| Total | 83,517 (100.0%) | 100,818 (100.0%) |
Health & Disability in Polk County
Health Insurance Coverage by Age in Polk County
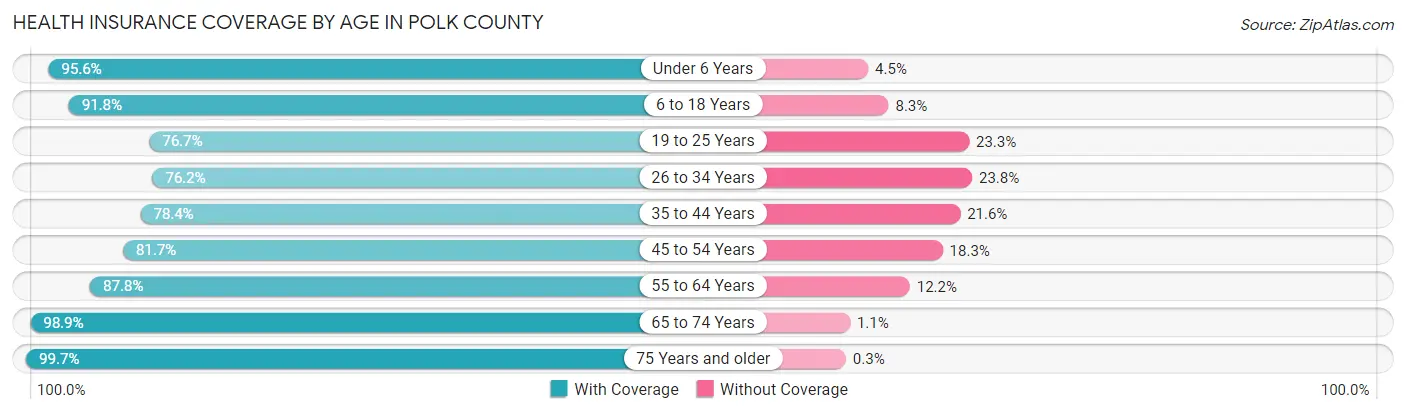
| Age Bracket | With Coverage | Without Coverage |
| Under 6 Years | 46,760 (95.6%) | 2,180 (4.4%) |
| 6 to 18 Years | 112,257 (91.7%) | 10,096 (8.3%) |
| 19 to 25 Years | 49,844 (76.7%) | 15,112 (23.3%) |
| 26 to 34 Years | 64,558 (76.2%) | 20,185 (23.8%) |
| 35 to 44 Years | 69,954 (78.4%) | 19,283 (21.6%) |
| 45 to 54 Years | 70,245 (81.7%) | 15,773 (18.3%) |
| 55 to 64 Years | 76,991 (87.8%) | 10,711 (12.2%) |
| 65 to 74 Years | 79,904 (98.9%) | 859 (1.1%) |
| 75 Years and older | 62,426 (99.7%) | 186 (0.3%) |
| Total | 632,939 (87.0%) | 94,385 (13.0%) |
Health Insurance Coverage by Citizenship Status in Polk County
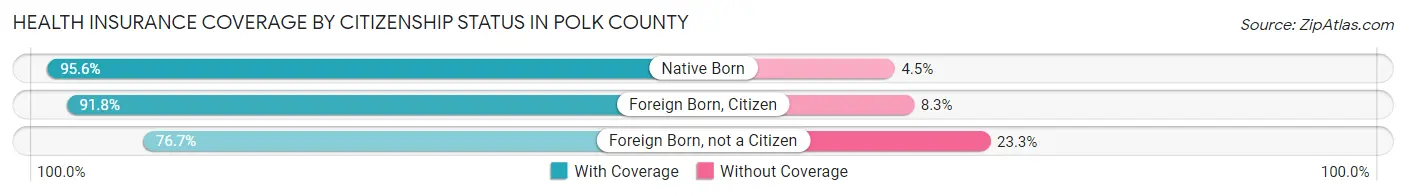
| Citizenship Status | With Coverage | Without Coverage |
| Native Born | 46,760 (95.6%) | 2,180 (4.4%) |
| Foreign Born, Citizen | 112,257 (91.7%) | 10,096 (8.3%) |
| Foreign Born, not a Citizen | 49,844 (76.7%) | 15,112 (23.3%) |
Health Insurance Coverage by Household Income in Polk County
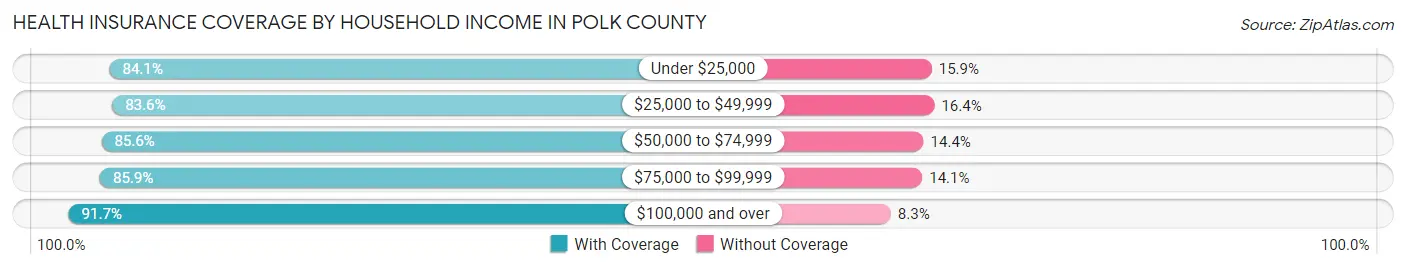
| Household Income | With Coverage | Without Coverage |
| Under $25,000 | 74,000 (84.1%) | 14,010 (15.9%) |
| $25,000 to $49,999 | 121,320 (83.6%) | 23,847 (16.4%) |
| $50,000 to $74,999 | 123,592 (85.6%) | 20,788 (14.4%) |
| $75,000 to $99,999 | 99,638 (85.9%) | 16,409 (14.1%) |
| $100,000 and over | 207,977 (91.7%) | 18,728 (8.3%) |
Public vs Private Health Insurance Coverage by Age in Polk County
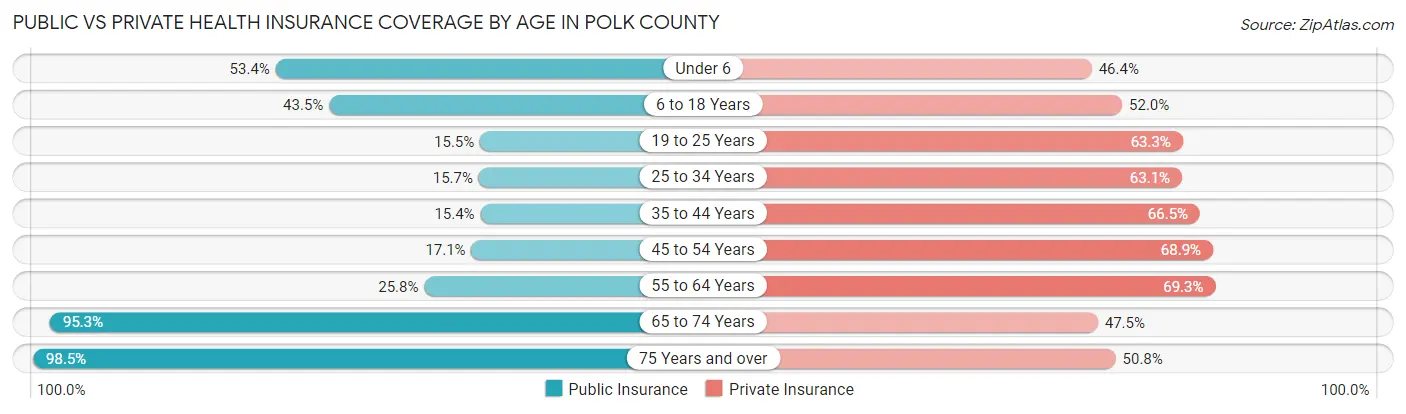
| Age Bracket | Public Insurance | Private Insurance |
| Under 6 | 26,136 (53.4%) | 22,704 (46.4%) |
| 6 to 18 Years | 53,187 (43.5%) | 63,660 (52.0%) |
| 19 to 25 Years | 10,036 (15.4%) | 41,099 (63.3%) |
| 25 to 34 Years | 13,299 (15.7%) | 53,489 (63.1%) |
| 35 to 44 Years | 13,733 (15.4%) | 59,310 (66.5%) |
| 45 to 54 Years | 14,671 (17.1%) | 59,249 (68.9%) |
| 55 to 64 Years | 22,640 (25.8%) | 60,795 (69.3%) |
| 65 to 74 Years | 76,983 (95.3%) | 38,379 (47.5%) |
| 75 Years and over | 61,643 (98.5%) | 31,825 (50.8%) |
| Total | 292,328 (40.2%) | 430,510 (59.2%) |
Disability Status by Sex by Age in Polk County
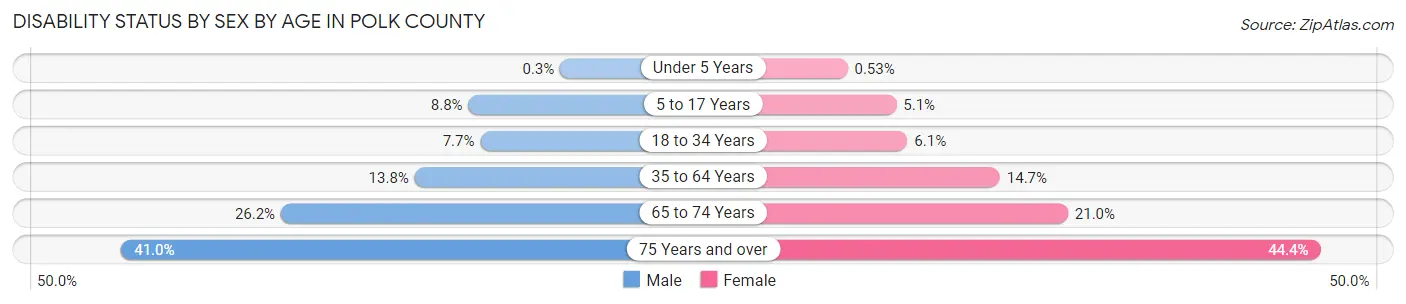
| Age Bracket | Male | Female |
| Under 5 Years | 63 (0.3%) | 107 (0.5%) |
| 5 to 17 Years | 5,410 (8.8%) | 2,955 (5.1%) |
| 18 to 34 Years | 6,155 (7.7%) | 4,889 (6.1%) |
| 35 to 64 Years | 17,785 (13.8%) | 19,671 (14.7%) |
| 65 to 74 Years | 9,801 (26.2%) | 9,099 (21.0%) |
| 75 Years and over | 11,781 (41.0%) | 15,056 (44.4%) |
Disability Class by Sex by Age in Polk County
Disability Class: Hearing Difficulty
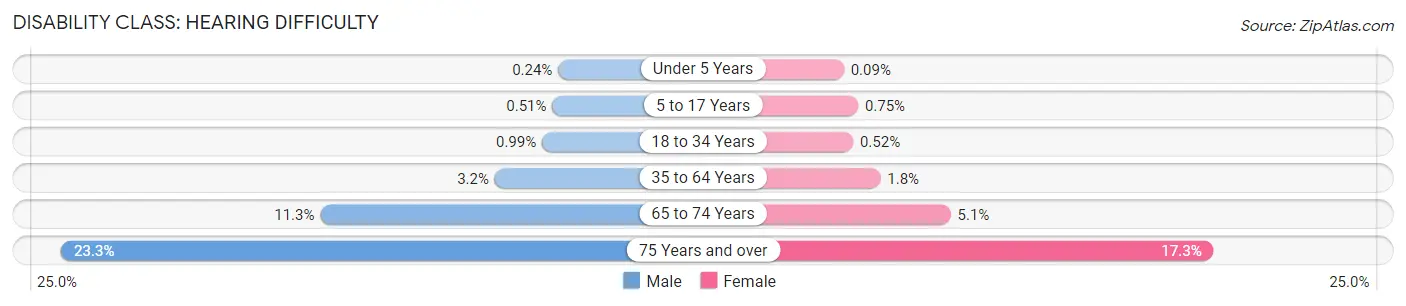
| Age Bracket | Male | Female |
| Under 5 Years | 51 (0.2%) | 19 (0.1%) |
| 5 to 17 Years | 315 (0.5%) | 439 (0.7%) |
| 18 to 34 Years | 786 (1.0%) | 415 (0.5%) |
| 35 to 64 Years | 4,104 (3.2%) | 2,396 (1.8%) |
| 65 to 74 Years | 4,218 (11.3%) | 2,189 (5.1%) |
| 75 Years and over | 6,694 (23.3%) | 5,845 (17.2%) |
Disability Class: Vision Difficulty
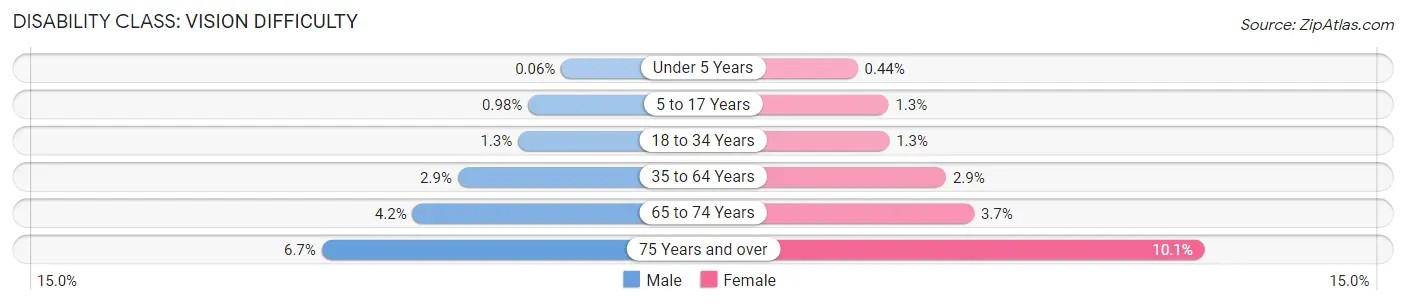
| Age Bracket | Male | Female |
| Under 5 Years | 12 (0.1%) | 88 (0.4%) |
| 5 to 17 Years | 604 (1.0%) | 760 (1.3%) |
| 18 to 34 Years | 1,004 (1.3%) | 1,056 (1.3%) |
| 35 to 64 Years | 3,784 (2.9%) | 3,884 (2.9%) |
| 65 to 74 Years | 1,570 (4.2%) | 1,596 (3.7%) |
| 75 Years and over | 1,932 (6.7%) | 3,423 (10.1%) |
Disability Class: Cognitive Difficulty
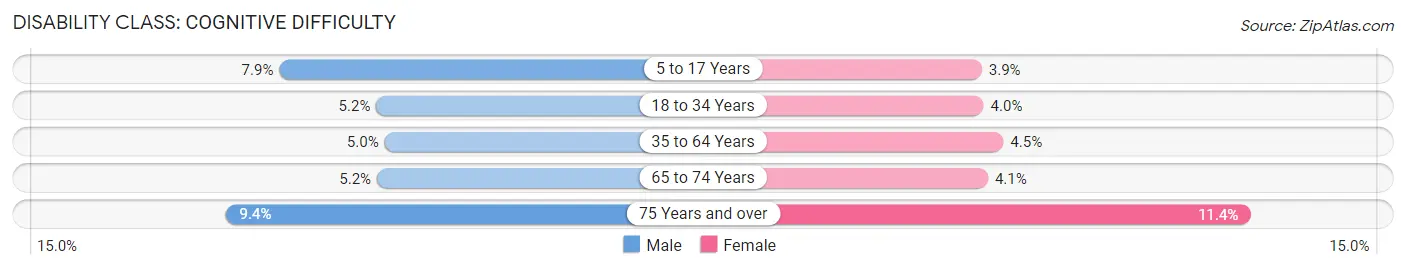
| Age Bracket | Male | Female |
| 5 to 17 Years | 4,857 (7.9%) | 2,279 (3.9%) |
| 18 to 34 Years | 4,156 (5.2%) | 3,167 (4.0%) |
| 35 to 64 Years | 6,418 (5.0%) | 6,039 (4.5%) |
| 65 to 74 Years | 1,940 (5.2%) | 1,765 (4.1%) |
| 75 Years and over | 2,694 (9.4%) | 3,852 (11.4%) |
Disability Class: Ambulatory Difficulty
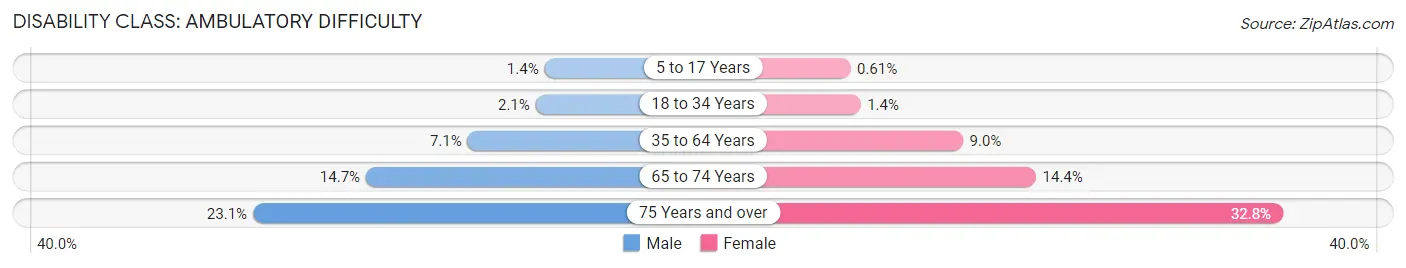
| Age Bracket | Male | Female |
| 5 to 17 Years | 861 (1.4%) | 356 (0.6%) |
| 18 to 34 Years | 1,641 (2.1%) | 1,102 (1.4%) |
| 35 to 64 Years | 9,170 (7.1%) | 12,022 (9.0%) |
| 65 to 74 Years | 5,481 (14.7%) | 6,242 (14.4%) |
| 75 Years and over | 6,621 (23.1%) | 11,099 (32.8%) |
Disability Class: Self-Care Difficulty
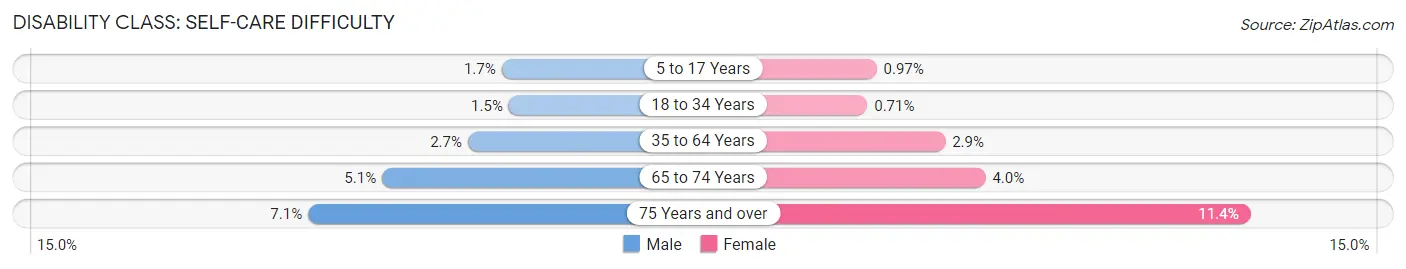
| Age Bracket | Male | Female |
| 5 to 17 Years | 1,058 (1.7%) | 568 (1.0%) |
| 18 to 34 Years | 1,216 (1.5%) | 571 (0.7%) |
| 35 to 64 Years | 3,432 (2.7%) | 3,863 (2.9%) |
| 65 to 74 Years | 1,889 (5.1%) | 1,735 (4.0%) |
| 75 Years and over | 2,041 (7.1%) | 3,857 (11.4%) |
Technology Access in Polk County
Computing Device Access in Polk County
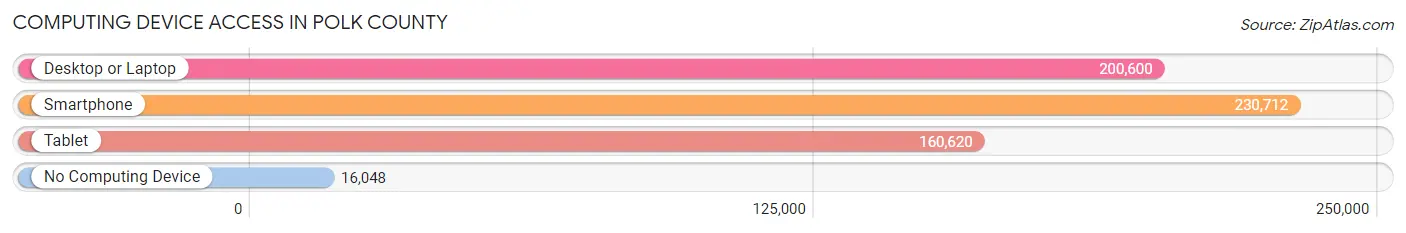
| Device Type | # Households | % Households |
| Desktop or Laptop | 200,600 | 75.9% |
| Smartphone | 230,712 | 87.3% |
| Tablet | 160,620 | 60.8% |
| No Computing Device | 16,048 | 6.1% |
| Total | 264,145 | 100.0% |
Internet Access in Polk County
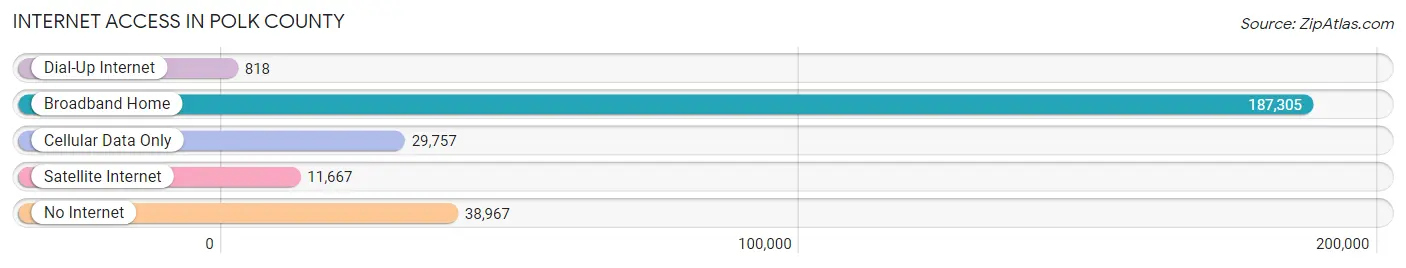
| Internet Type | # Households | % Households |
| Dial-Up Internet | 818 | 0.3% |
| Broadband Home | 187,305 | 70.9% |
| Cellular Data Only | 29,757 | 11.3% |
| Satellite Internet | 11,667 | 4.4% |
| No Internet | 38,967 | 14.7% |
| Total | 264,145 | 100.0% |
Polk County Summary
Polk County, Florida is located in the central part of the state and is part of the Tampa Bay metropolitan area. It is bordered by Hillsborough County to the north, Hardee County to the east, Highlands County to the south, and Osceola County to the west. The county seat is Bartow, and the largest city is Lakeland. The county was established in 1861 and named after James K. Polk, the 11th President of the United States.
Geography
Polk County covers an area of 2,010 square miles and is the fourth-largest county in Florida. It is mostly flat, with some rolling hills in the northern part of the county. The highest point in the county is Iron Mountain, which is located in the Green Swamp and rises to an elevation of 295 feet. The county is home to several lakes, including Lake Hancock, Lake Kissimmee, Lake Tohopekaliga, and Lake Weohyakapka. The county is also home to several rivers, including the Peace River, the Alafia River, and the Hillsborough River.
Climate
Polk County has a humid subtropical climate, with hot, humid summers and mild, dry winters. The average annual temperature is 73°F, and the average annual precipitation is 51 inches. The area is prone to hurricanes and tropical storms, and the county is often affected by flooding.
Demographics
As of the 2010 census, Polk County had a population of 602,095. The population was spread out, with 24.3% under the age of 18, 10.2% from 18 to 24, 28.2% from 25 to 44, 22.7% from 45 to 64, and 14.6% who were 65 years of age or older. The median age was 35.4 years. The racial makeup of the county was 68.2% White, 22.3% Hispanic or Latino, 8.2% African American, 0.7% Native American, 1.7% Asian, 0.1% Pacific Islander, and 2.1% from two or more races.
Economy
The economy of Polk County is largely based on agriculture, tourism, and manufacturing. The county is home to several large agricultural operations, including citrus groves, cattle ranches, and vegetable farms. Tourism is also a major industry in the county, with attractions such as Legoland Florida, Bok Tower Gardens, and the Polk County Historical Museum. The county is also home to several large manufacturing companies, including Publix Super Markets, Florida's Natural Growers, and Mosaic.
Polk County is home to several major highways, including Interstate 4, U.S. Route 27, and U.S. Route 98. The county is served by the Lakeland Linder International Airport, which offers flights to several major cities in the United States. The county is also served by Amtrak, with the Silver Star line running through the county.
Conclusion
Polk County, Florida is a large county located in the central part of the state. It is home to a diverse population and a strong economy based on agriculture, tourism, and manufacturing. The county is served by several major highways and an international airport, and is a popular destination for tourists.
Common Questions
What is Per Capita Income in Polk County?
Per Capita income in Polk County is $30,262.
What is the Median Family Income in Polk County?
Median Family Income in Polk County is $69,667.
What is the Median Household income in Polk County?
Median Household Income in Polk County is $60,901.
What is Income or Wage Gap in Polk County?
Income or Wage Gap in Polk County is 24.2%.
Women in Polk County earn 75.8 cents for every dollar earned by a man.
What is Family Income Deficit in Polk County?
Family Income Deficit in Polk County is $11,654.
Families that are below poverty line in Polk County earn $11,654 less on average than the poverty threshold level.
What is Inequality or Gini Index in Polk County?
Inequality or Gini Index in Polk County is 0.45.
What is the Total Population of Polk County?
Total Population of Polk County is 736,229.
What is the Total Male Population of Polk County?
Total Male Population of Polk County is 363,269.
What is the Total Female Population of Polk County?
Total Female Population of Polk County is 372,960.
What is the Ratio of Males per 100 Females in Polk County?
There are 97.40 Males per 100 Females in Polk County.
What is the Ratio of Females per 100 Males in Polk County?
There are 102.67 Females per 100 Males in Polk County.
What is the Median Population Age in Polk County?
Median Population Age in Polk County is 39.8 Years.
What is the Average Family Size in Polk County
Average Family Size in Polk County is 3.2 People.
What is the Average Household Size in Polk County
Average Household Size in Polk County is 2.7 People.
How Large is the Labor Force in Polk County?
There are 336,279 People in the Labor Forcein in Polk County.
What is the Percentage of People in the Labor Force in Polk County?
56.6% of People are in the Labor Force in Polk County.
What is the Unemployment Rate in Polk County?
Unemployment Rate in Polk County is 4.6%.