St. Lucie County, FL Map & Demographics
St. Lucie County Map
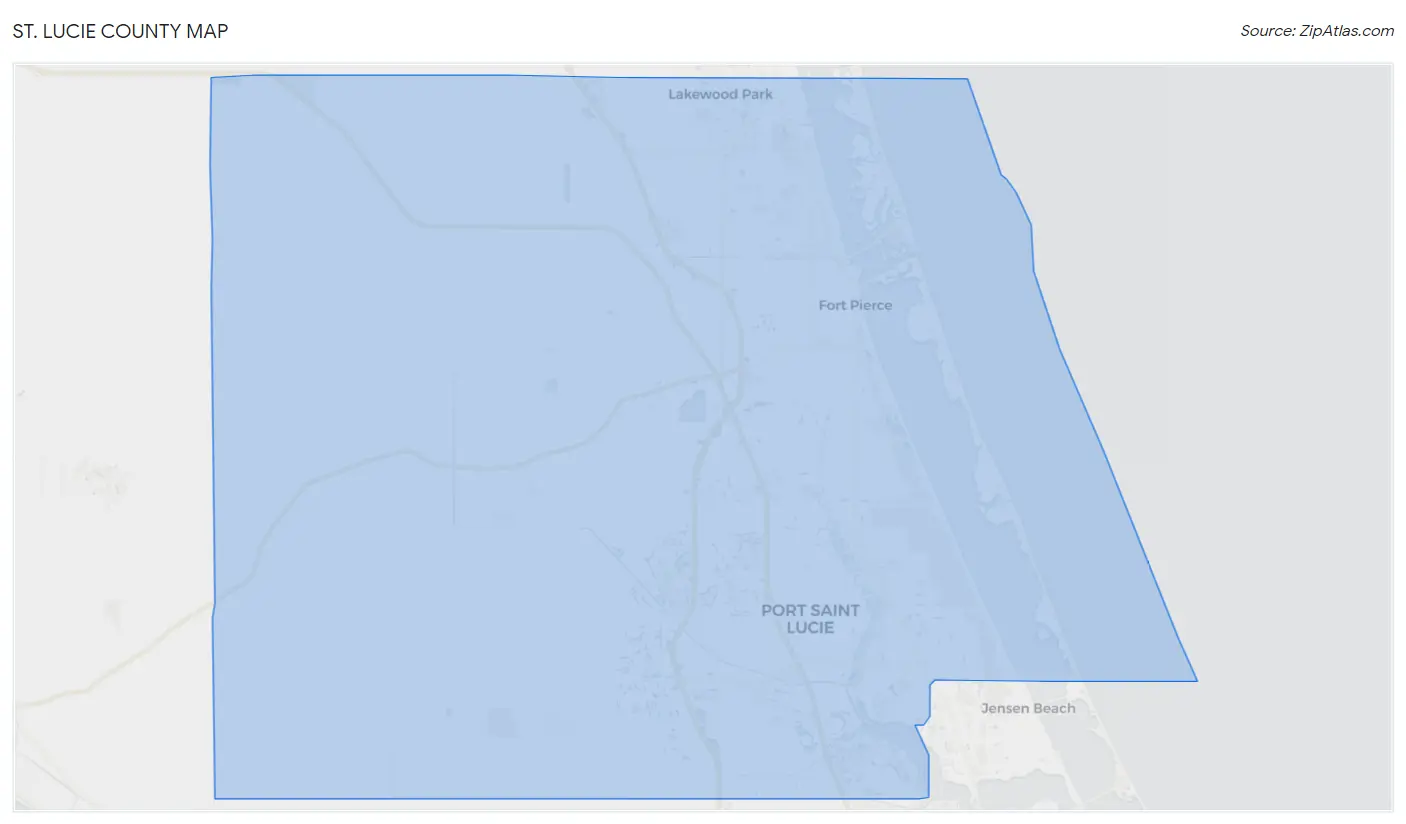
St. Lucie County Overview
$33,847
PER CAPITA INCOME
$75,649
AVG FAMILY INCOME
$66,154
AVG HOUSEHOLD INCOME
23.3%
WAGE / INCOME GAP [ % ]
76.7¢/ $1
WAGE / INCOME GAP [ $ ]
$10,675
FAMILY INCOME DEFICIT
0.44
INEQUALITY / GINI INDEX
334,682
TOTAL POPULATION
164,702
MALE POPULATION
169,980
FEMALE POPULATION
96.89
MALES / 100 FEMALES
103.20
FEMALES / 100 MALES
45.3
MEDIAN AGE
3.1
AVG FAMILY SIZE
2.6
AVG HOUSEHOLD SIZE
154,679
LABOR FORCE [ PEOPLE ]
55.9%
PERCENT IN LABOR FORCE
6.0%
UNEMPLOYMENT RATE
St. Lucie County Area Codes
Income in St. Lucie County
Income Overview in St. Lucie County
Per Capita Income in St. Lucie County is $33,847, while median incomes of families and households are $75,649 and $66,154 respectively.
| Characteristic | Number | Measure |
| Per Capita Income | 334,682 | $33,847 |
| Median Family Income | 87,040 | $75,649 |
| Mean Family Income | 87,040 | $96,525 |
| Median Household Income | 126,443 | $66,154 |
| Mean Household Income | 126,443 | $85,019 |
| Income Deficit | 87,040 | $10,675 |
| Wage / Income Gap (%) | 334,682 | 23.30% |
| Wage / Income Gap ($) | 334,682 | 76.70¢ per $1 |
| Gini / Inequality Index | 334,682 | 0.44 |
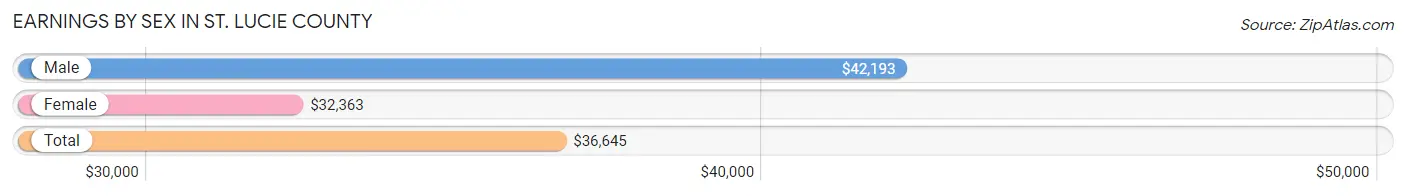
Earnings by Sex in St. Lucie County
Average Earnings in St. Lucie County are $36,645, $42,193 for men and $32,363 for women, a difference of 23.3%.
| Sex | Number | Average Earnings |
| Male | 82,163 (52.1%) | $42,193 |
| Female | 75,675 (47.9%) | $32,363 |
| Total | 157,838 (100.0%) | $36,645 |
Earnings by Sex by Income Bracket in St. Lucie County
The most common earnings brackets in St. Lucie County are $100,000+ for men (9,925 | 12.1%) and $30,000 to $34,999 for women (6,848 | 9.0%).
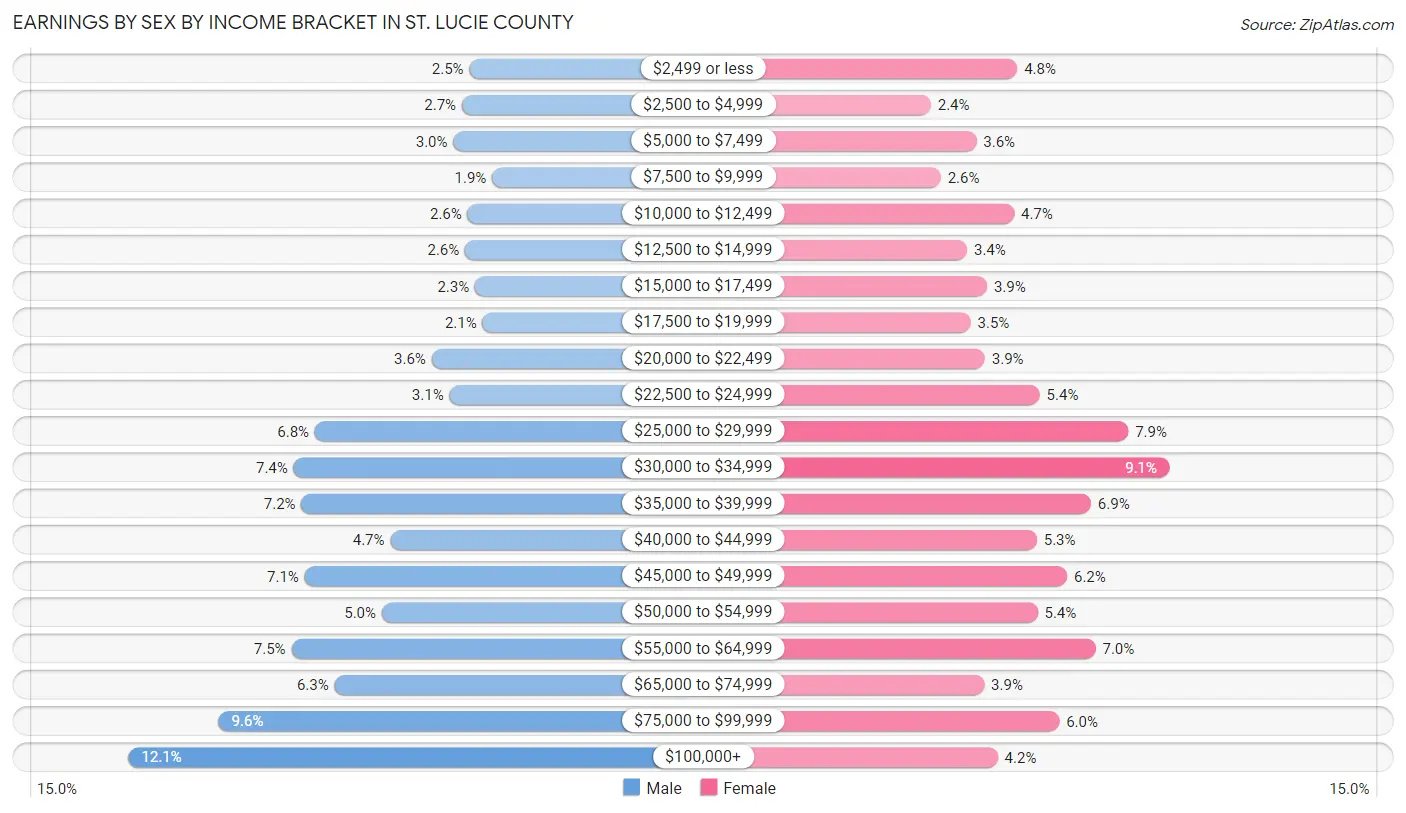
| Income | Male | Female |
| $2,499 or less | 2,055 (2.5%) | 3,628 (4.8%) |
| $2,500 to $4,999 | 2,228 (2.7%) | 1,787 (2.4%) |
| $5,000 to $7,499 | 2,422 (2.9%) | 2,758 (3.6%) |
| $7,500 to $9,999 | 1,531 (1.9%) | 1,997 (2.6%) |
| $10,000 to $12,499 | 2,099 (2.5%) | 3,553 (4.7%) |
| $12,500 to $14,999 | 2,150 (2.6%) | 2,560 (3.4%) |
| $15,000 to $17,499 | 1,921 (2.3%) | 2,978 (3.9%) |
| $17,500 to $19,999 | 1,754 (2.1%) | 2,631 (3.5%) |
| $20,000 to $22,499 | 2,924 (3.6%) | 2,938 (3.9%) |
| $22,500 to $24,999 | 2,517 (3.1%) | 4,104 (5.4%) |
| $25,000 to $29,999 | 5,619 (6.8%) | 5,989 (7.9%) |
| $30,000 to $34,999 | 6,110 (7.4%) | 6,848 (9.0%) |
| $35,000 to $39,999 | 5,929 (7.2%) | 5,188 (6.9%) |
| $40,000 to $44,999 | 3,877 (4.7%) | 4,041 (5.3%) |
| $45,000 to $49,999 | 5,856 (7.1%) | 4,684 (6.2%) |
| $50,000 to $54,999 | 4,074 (5.0%) | 4,055 (5.4%) |
| $55,000 to $64,999 | 6,164 (7.5%) | 5,287 (7.0%) |
| $65,000 to $74,999 | 5,165 (6.3%) | 2,922 (3.9%) |
| $75,000 to $99,999 | 7,843 (9.6%) | 4,518 (6.0%) |
| $100,000+ | 9,925 (12.1%) | 3,209 (4.2%) |
| Total | 82,163 (100.0%) | 75,675 (100.0%) |
Earnings by Sex by Educational Attainment in St. Lucie County
Average earnings in St. Lucie County are $46,544 for men and $34,985 for women, a difference of 24.8%. Men with an educational attainment of graduate degree enjoy the highest average annual earnings of $62,284, while those with less than high school education earn the least with $37,694. Women with an educational attainment of graduate degree earn the most with the average annual earnings of $54,158, while those with less than high school education have the smallest earnings of $25,715.
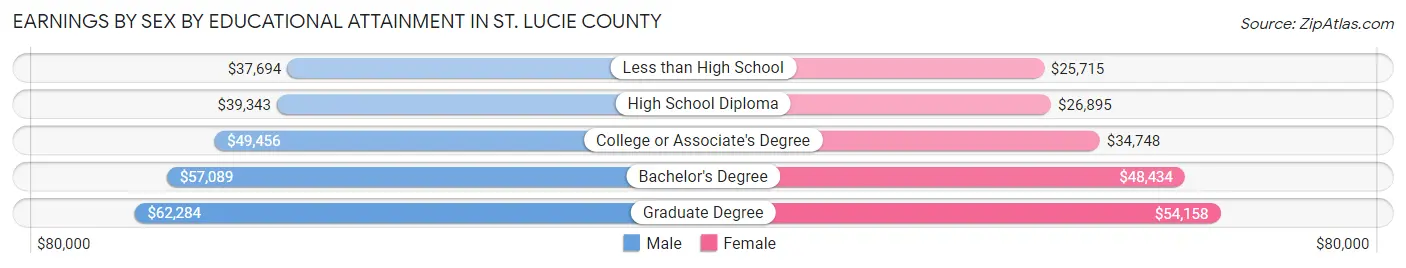
| Educational Attainment | Male Income | Female Income |
| Less than High School | $37,694 | $25,715 |
| High School Diploma | $39,343 | $26,895 |
| College or Associate's Degree | $49,456 | $34,748 |
| Bachelor's Degree | $57,089 | $48,434 |
| Graduate Degree | $62,284 | $54,158 |
| Total | $46,544 | $34,985 |
Family Income in St. Lucie County
Family Income Brackets in St. Lucie County
According to the St. Lucie County family income data, there are 18,540 families falling into the $50,000 to $74,999 income range, which is the most common income bracket and makes up 21.3% of all families. Conversely, the $10,000 to $14,999 income bracket is the least frequent group with only 1,393 families (1.6%) belonging to this category.
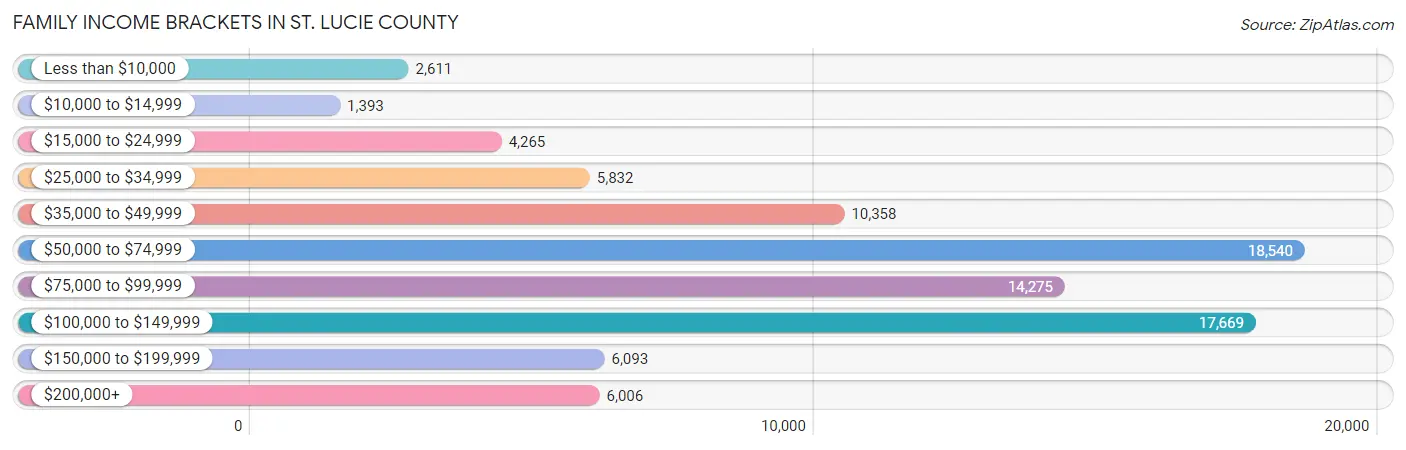
| Income Bracket | # Families | % Families |
| Less than $10,000 | 2,611 | 3.0% |
| $10,000 to $14,999 | 1,393 | 1.6% |
| $15,000 to $24,999 | 4,265 | 4.9% |
| $25,000 to $34,999 | 5,832 | 6.7% |
| $35,000 to $49,999 | 10,358 | 11.9% |
| $50,000 to $74,999 | 18,540 | 21.3% |
| $75,000 to $99,999 | 14,275 | 16.4% |
| $100,000 to $149,999 | 17,669 | 20.3% |
| $150,000 to $199,999 | 6,093 | 7.0% |
| $200,000+ | 6,006 | 6.9% |
Family Income by Famaliy Size in St. Lucie County
5-person families (5,436 | 6.2%) account for the highest median family income in St. Lucie County with $86,536 per family, while 2-person families (46,061 | 52.9%) have the highest median income of $34,630 per family member.
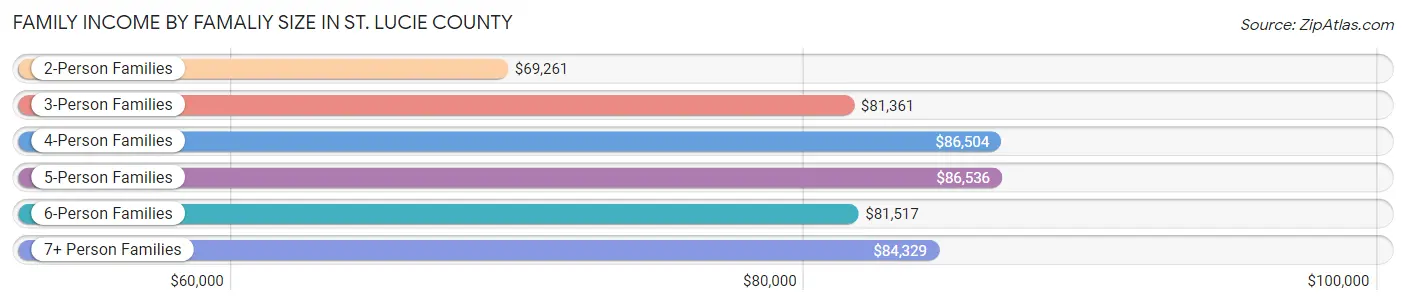
| Income Bracket | # Families | Median Income |
| 2-Person Families | 46,061 (52.9%) | $69,261 |
| 3-Person Families | 19,378 (22.3%) | $81,361 |
| 4-Person Families | 12,633 (14.5%) | $86,504 |
| 5-Person Families | 5,436 (6.2%) | $86,536 |
| 6-Person Families | 2,385 (2.7%) | $81,517 |
| 7+ Person Families | 1,147 (1.3%) | $84,329 |
| Total | 87,040 (100.0%) | $75,649 |
Family Income by Number of Earners in St. Lucie County
The median family income in St. Lucie County is $75,649, with families comprising 3+ earners (9,048) having the highest median family income of $118,560, while families with no earners (20,015) have the lowest median family income of $53,842, accounting for 10.4% and 23.0% of families, respectively.
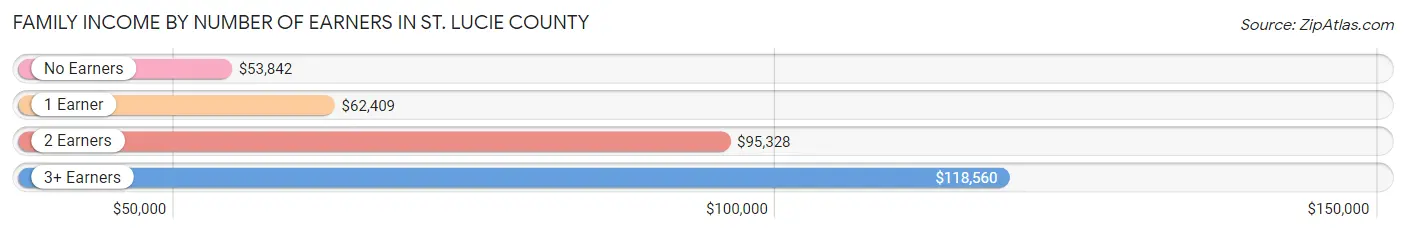
| Number of Earners | # Families | Median Income |
| No Earners | 20,015 (23.0%) | $53,842 |
| 1 Earner | 29,692 (34.1%) | $62,409 |
| 2 Earners | 28,285 (32.5%) | $95,328 |
| 3+ Earners | 9,048 (10.4%) | $118,560 |
| Total | 87,040 (100.0%) | $75,649 |
Household Income in St. Lucie County
Household Income Brackets in St. Lucie County
With 25,921 households falling in the category, the $50,000 to $74,999 income range is the most frequent in St. Lucie County, accounting for 20.5% of all households. In contrast, only 3,920 households (3.1%) fall into the $10,000 to $14,999 income bracket, making it the least populous group.
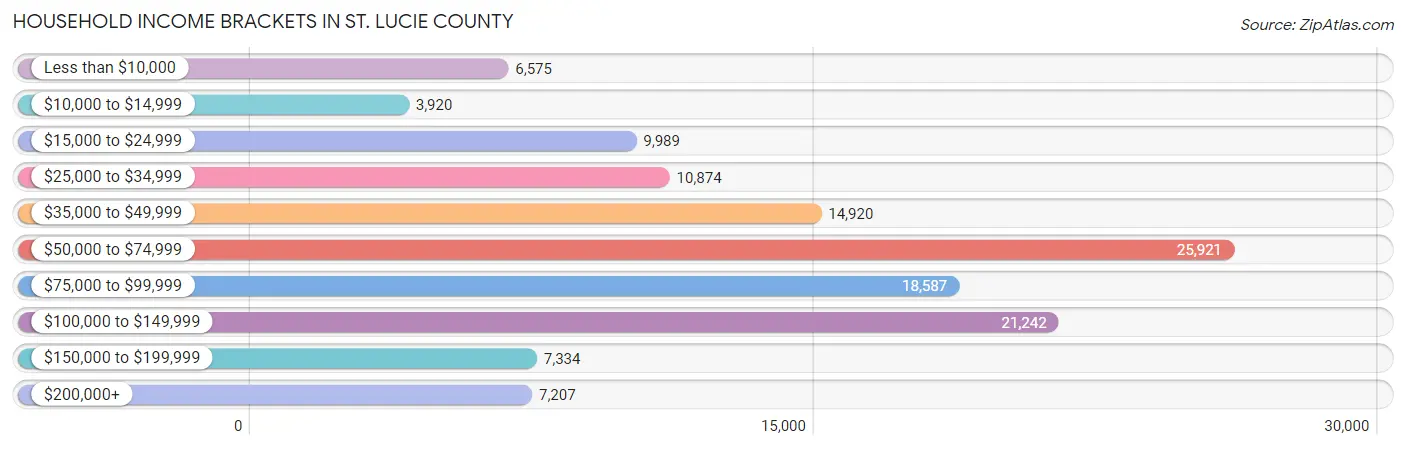
| Income Bracket | # Households | % Households |
| Less than $10,000 | 6,575 | 5.2% |
| $10,000 to $14,999 | 3,920 | 3.1% |
| $15,000 to $24,999 | 9,989 | 7.9% |
| $25,000 to $34,999 | 10,874 | 8.6% |
| $35,000 to $49,999 | 14,920 | 11.8% |
| $50,000 to $74,999 | 25,921 | 20.5% |
| $75,000 to $99,999 | 18,587 | 14.7% |
| $100,000 to $149,999 | 21,242 | 16.8% |
| $150,000 to $199,999 | 7,334 | 5.8% |
| $200,000+ | 7,207 | 5.7% |
Household Income by Householder Age in St. Lucie County
The median household income in St. Lucie County is $66,154, with the highest median household income of $73,504 found in the 25 to 44 years age bracket for the primary householder. A total of 30,673 households (24.3%) fall into this category. Meanwhile, the 15 to 24 years age bracket for the primary householder has the lowest median household income of $37,361, with 1,948 households (1.5%) in this group.
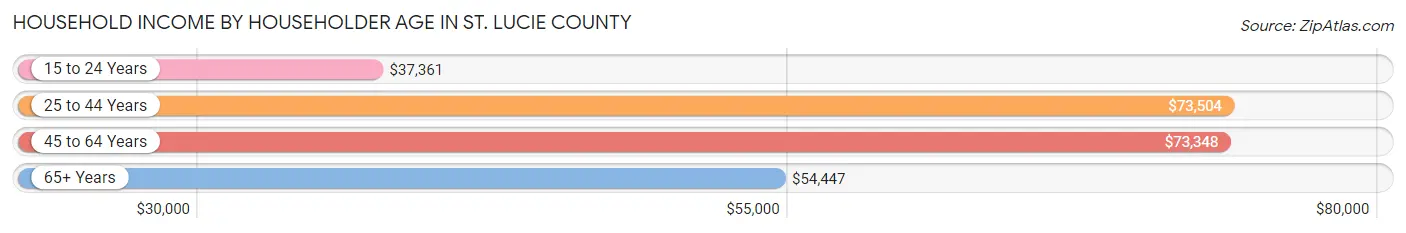
| Income Bracket | # Households | Median Income |
| 15 to 24 Years | 1,948 (1.5%) | $37,361 |
| 25 to 44 Years | 30,673 (24.3%) | $73,504 |
| 45 to 64 Years | 46,886 (37.1%) | $73,348 |
| 65+ Years | 46,936 (37.1%) | $54,447 |
| Total | 126,443 (100.0%) | $66,154 |
Poverty in St. Lucie County
Income Below Poverty by Sex and Age in St. Lucie County
With 10.7% poverty level for males and 14.2% for females among the residents of St. Lucie County, 15 year old males and 5 year old females are the most vulnerable to poverty, with 567 males (22.3%) and 484 females (31.7%) in their respective age groups living below the poverty level.
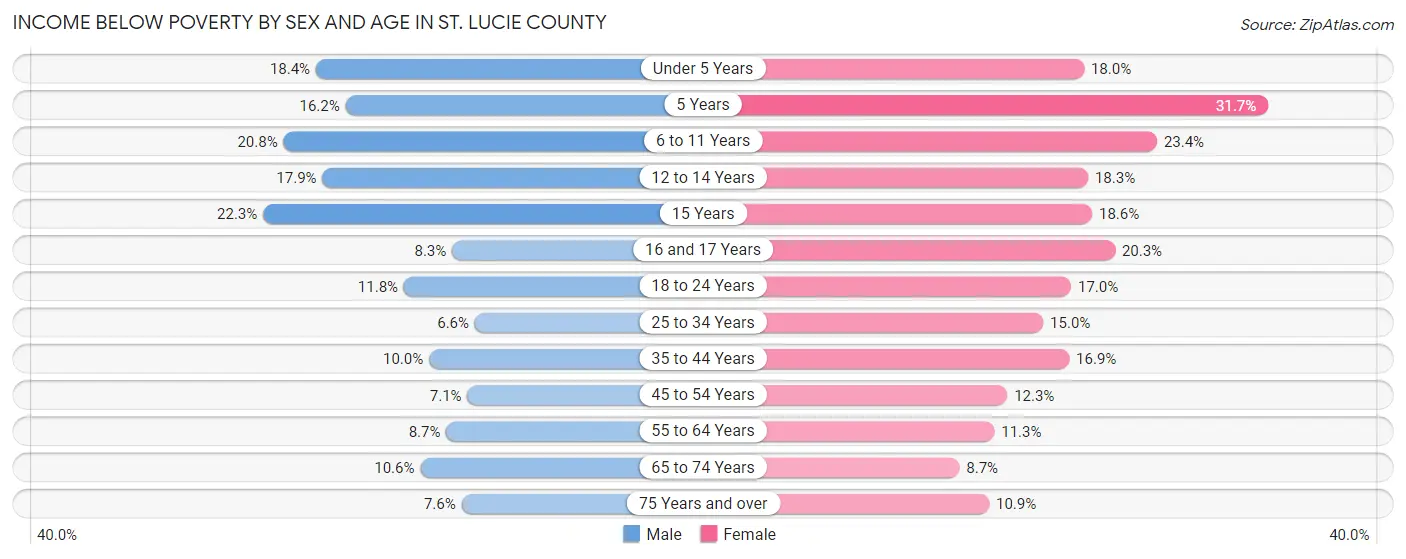
| Age Bracket | Male | Female |
| Under 5 Years | 1,519 (18.4%) | 1,428 (18.0%) |
| 5 Years | 274 (16.2%) | 484 (31.7%) |
| 6 to 11 Years | 2,105 (20.8%) | 2,316 (23.4%) |
| 12 to 14 Years | 1,234 (17.9%) | 1,180 (18.3%) |
| 15 Years | 567 (22.3%) | 304 (18.6%) |
| 16 and 17 Years | 305 (8.3%) | 807 (20.3%) |
| 18 to 24 Years | 1,467 (11.8%) | 1,975 (17.0%) |
| 25 to 34 Years | 1,249 (6.6%) | 2,827 (14.9%) |
| 35 to 44 Years | 1,828 (10.0%) | 3,207 (16.9%) |
| 45 to 54 Years | 1,387 (7.1%) | 2,514 (12.3%) |
| 55 to 64 Years | 1,945 (8.7%) | 2,780 (11.3%) |
| 65 to 74 Years | 2,204 (10.6%) | 2,057 (8.7%) |
| 75 Years and over | 1,287 (7.6%) | 2,087 (10.9%) |
| Total | 17,371 (10.7%) | 23,966 (14.2%) |
Income Above Poverty by Sex and Age in St. Lucie County
According to the poverty statistics in St. Lucie County, males aged 25 to 34 years and females aged 65 to 74 years are the age groups that are most secure financially, with 93.4% of males and 91.3% of females in these age groups living above the poverty line.
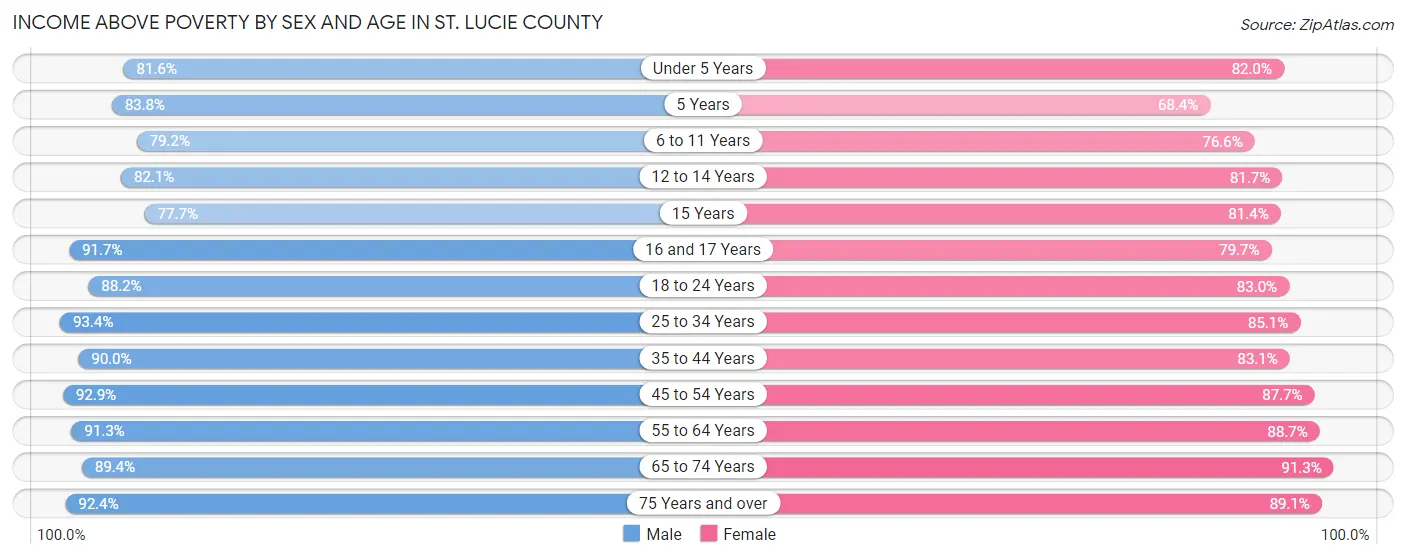
| Age Bracket | Male | Female |
| Under 5 Years | 6,748 (81.6%) | 6,515 (82.0%) |
| 5 Years | 1,420 (83.8%) | 1,045 (68.3%) |
| 6 to 11 Years | 8,023 (79.2%) | 7,580 (76.6%) |
| 12 to 14 Years | 5,663 (82.1%) | 5,275 (81.7%) |
| 15 Years | 1,977 (77.7%) | 1,332 (81.4%) |
| 16 and 17 Years | 3,386 (91.7%) | 3,173 (79.7%) |
| 18 to 24 Years | 10,920 (88.2%) | 9,632 (83.0%) |
| 25 to 34 Years | 17,760 (93.4%) | 16,081 (85.1%) |
| 35 to 44 Years | 16,510 (90.0%) | 15,788 (83.1%) |
| 45 to 54 Years | 18,082 (92.9%) | 17,966 (87.7%) |
| 55 to 64 Years | 20,440 (91.3%) | 21,777 (88.7%) |
| 65 to 74 Years | 18,546 (89.4%) | 21,511 (91.3%) |
| 75 Years and over | 15,731 (92.4%) | 17,005 (89.1%) |
| Total | 145,206 (89.3%) | 144,680 (85.8%) |
Income Below Poverty Among Married-Couple Families in St. Lucie County
The poverty statistics for married-couple families in St. Lucie County show that 5.3% or 3,331 of the total 63,161 families live below the poverty line. Families with 5 or more children have the highest poverty rate of 18.1%, comprising of 59 families. On the other hand, families with 1 or 2 children have the lowest poverty rate of 4.4%, which includes 690 families.
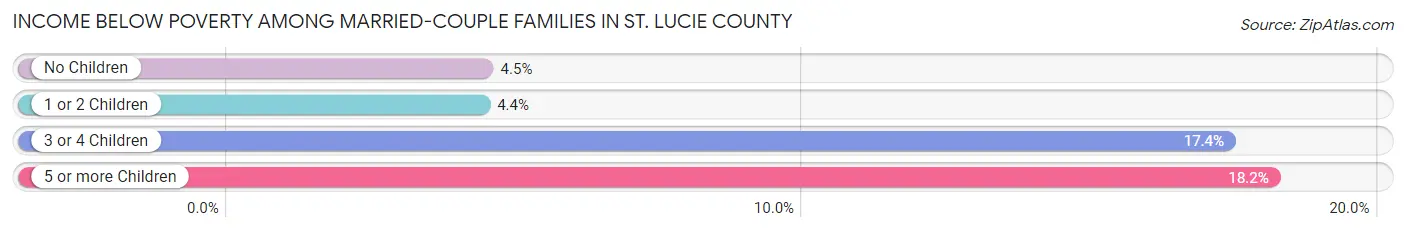
| Children | Above Poverty | Below Poverty |
| No Children | 41,440 (95.6%) | 1,928 (4.4%) |
| 1 or 2 Children | 15,012 (95.6%) | 690 (4.4%) |
| 3 or 4 Children | 3,112 (82.6%) | 654 (17.4%) |
| 5 or more Children | 266 (81.9%) | 59 (18.1%) |
| Total | 59,830 (94.7%) | 3,331 (5.3%) |
Income Below Poverty Among Single-Parent Households in St. Lucie County
According to the poverty data in St. Lucie County, 6.4% or 412 single-father households and 21.0% or 3,669 single-mother households are living below the poverty line. Among single-father households, those with 3 or 4 children have the highest poverty rate, with 86 households (33.6%) experiencing poverty. Likewise, among single-mother households, those with 5 or more children have the highest poverty rate, with 104 households (78.8%) falling below the poverty line.
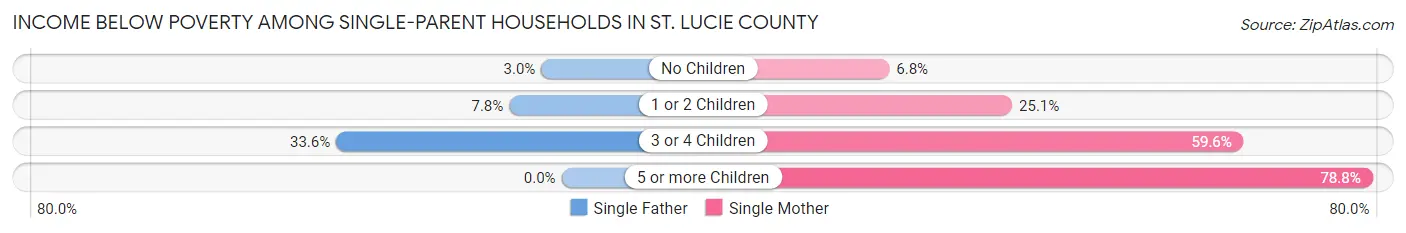
| Children | Single Father | Single Mother |
| No Children | 99 (3.0%) | 484 (6.8%) |
| 1 or 2 Children | 227 (7.8%) | 2,180 (25.1%) |
| 3 or 4 Children | 86 (33.6%) | 901 (59.6%) |
| 5 or more Children | 0 (0.0%) | 104 (78.8%) |
| Total | 412 (6.4%) | 3,669 (21.0%) |
Income Below Poverty Among Married-Couple vs Single-Parent Households in St. Lucie County
The poverty data for St. Lucie County shows that 3,331 of the married-couple family households (5.3%) and 4,081 of the single-parent households (17.1%) are living below the poverty level. Within the married-couple family households, those with 5 or more children have the highest poverty rate, with 59 households (18.1%) falling below the poverty line. Among the single-parent households, those with 5 or more children have the highest poverty rate, with 104 household (78.8%) living below poverty.
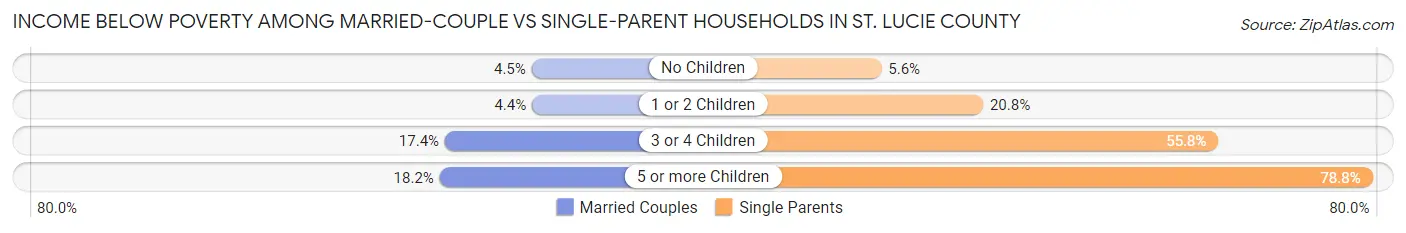
| Children | Married-Couple Families | Single-Parent Households |
| No Children | 1,928 (4.4%) | 583 (5.6%) |
| 1 or 2 Children | 690 (4.4%) | 2,407 (20.8%) |
| 3 or 4 Children | 654 (17.4%) | 987 (55.8%) |
| 5 or more Children | 59 (18.1%) | 104 (78.8%) |
| Total | 3,331 (5.3%) | 4,081 (17.1%) |
Race in St. Lucie County
The most populous races in St. Lucie County are White / Caucasian (211,265 | 63.1%), Hispanic or Latino (69,088 | 20.6%), and Black / African American (68,373 | 20.4%).
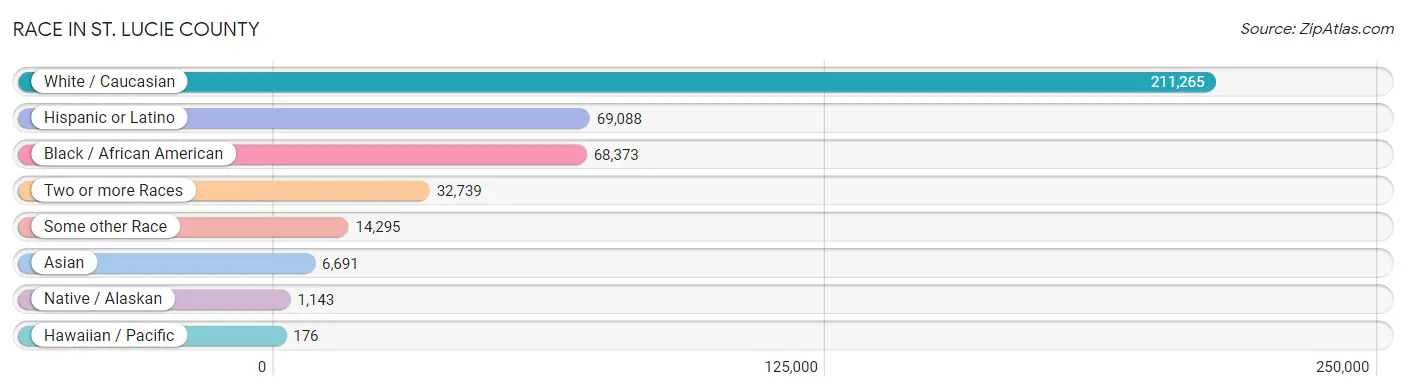
| Race | # Population | % Population |
| Asian | 6,691 | 2.0% |
| Black / African American | 68,373 | 20.4% |
| Hawaiian / Pacific | 176 | 0.1% |
| Hispanic or Latino | 69,088 | 20.6% |
| Native / Alaskan | 1,143 | 0.3% |
| White / Caucasian | 211,265 | 63.1% |
| Two or more Races | 32,739 | 9.8% |
| Some other Race | 14,295 | 4.3% |
| Total | 334,682 | 100.0% |
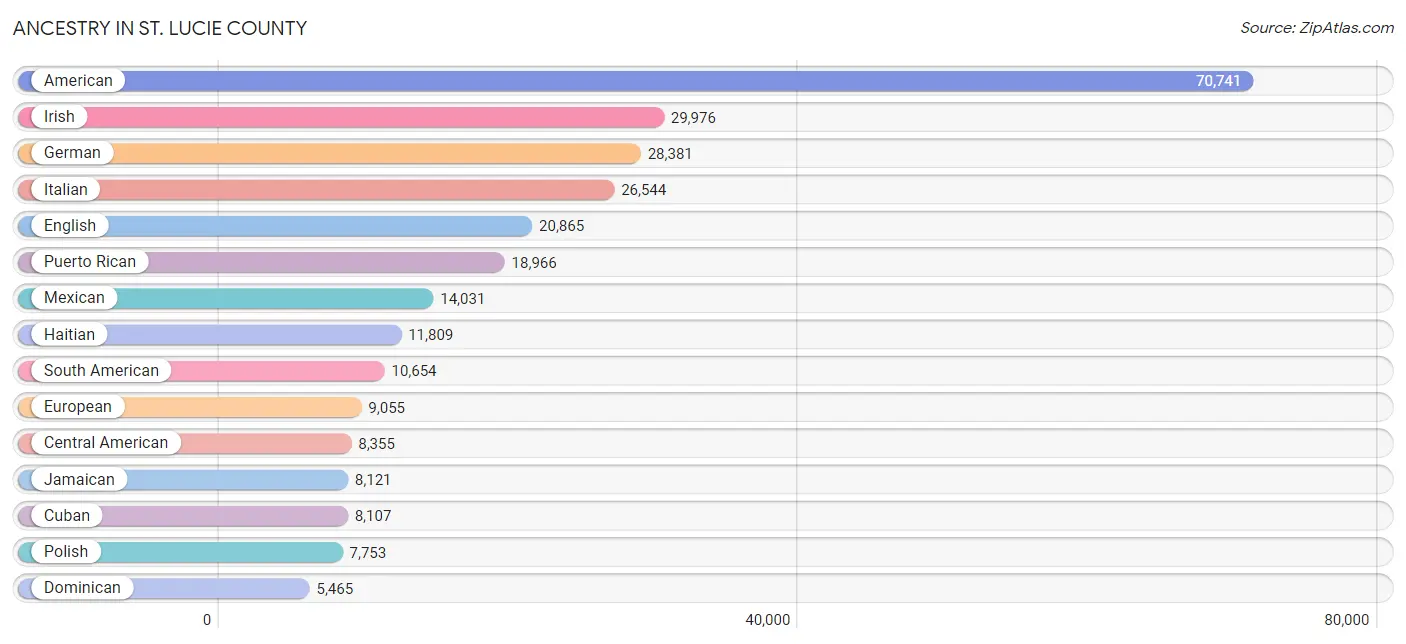
Ancestry in St. Lucie County
The most populous ancestries reported in St. Lucie County are American (70,741 | 21.1%), Irish (29,976 | 9.0%), German (28,381 | 8.5%), Italian (26,544 | 7.9%), and English (20,865 | 6.2%), together accounting for 52.7% of all St. Lucie County residents.
| Ancestry | # Population | % Population |
| Afghan | 7 | 0.0% |
| African | 1,306 | 0.4% |
| Alaskan Athabascan | 15 | 0.0% |
| American | 70,741 | 21.1% |
| Apache | 308 | 0.1% |
| Arab | 1,100 | 0.3% |
| Argentinean | 564 | 0.2% |
| Armenian | 171 | 0.1% |
| Austrian | 887 | 0.3% |
| Bahamian | 524 | 0.2% |
| Barbadian | 114 | 0.0% |
| Basque | 45 | 0.0% |
| Belgian | 161 | 0.1% |
| Belizean | 48 | 0.0% |
| Bhutanese | 621 | 0.2% |
| Blackfeet | 117 | 0.0% |
| Bolivian | 555 | 0.2% |
| Brazilian | 2,358 | 0.7% |
| British | 1,546 | 0.5% |
| British West Indian | 621 | 0.2% |
| Burmese | 458 | 0.1% |
| Canadian | 983 | 0.3% |
| Cape Verdean | 21 | 0.0% |
| Carpatho Rusyn | 12 | 0.0% |
| Central American | 8,355 | 2.5% |
| Central American Indian | 512 | 0.2% |
| Cherokee | 690 | 0.2% |
| Cheyenne | 15 | 0.0% |
| Chickasaw | 44 | 0.0% |
| Chilean | 386 | 0.1% |
| Choctaw | 18 | 0.0% |
| Colombian | 3,256 | 1.0% |
| Costa Rican | 412 | 0.1% |
| Creek | 8 | 0.0% |
| Croatian | 299 | 0.1% |
| Cuban | 8,107 | 2.4% |
| Czech | 474 | 0.1% |
| Czechoslovakian | 145 | 0.0% |
| Danish | 567 | 0.2% |
| Dominican | 5,465 | 1.6% |
| Dutch | 2,309 | 0.7% |
| Eastern European | 606 | 0.2% |
| Ecuadorian | 1,746 | 0.5% |
| Egyptian | 31 | 0.0% |
| English | 20,865 | 6.2% |
| Estonian | 45 | 0.0% |
| Ethiopian | 140 | 0.0% |
| European | 9,055 | 2.7% |
| Finnish | 637 | 0.2% |
| French | 5,304 | 1.6% |
| French American Indian | 55 | 0.0% |
| French Canadian | 2,099 | 0.6% |
| German | 28,381 | 8.5% |
| German Russian | 51 | 0.0% |
| Ghanaian | 53 | 0.0% |
| Greek | 776 | 0.2% |
| Guamanian / Chamorro | 38 | 0.0% |
| Guatemalan | 2,316 | 0.7% |
| Guyanese | 361 | 0.1% |
| Haitian | 11,809 | 3.5% |
| Honduran | 2,733 | 0.8% |
| Houma | 9 | 0.0% |
| Hungarian | 1,774 | 0.5% |
| Icelander | 10 | 0.0% |
| Indian (Asian) | 905 | 0.3% |
| Iranian | 87 | 0.0% |
| Irish | 29,976 | 9.0% |
| Iroquois | 63 | 0.0% |
| Israeli | 159 | 0.1% |
| Italian | 26,544 | 7.9% |
| Jamaican | 8,121 | 2.4% |
| Japanese | 52 | 0.0% |
| Jordanian | 53 | 0.0% |
| Korean | 2,721 | 0.8% |
| Laotian | 20 | 0.0% |
| Latvian | 58 | 0.0% |
| Lebanese | 389 | 0.1% |
| Lithuanian | 418 | 0.1% |
| Lumbee | 93 | 0.0% |
| Malaysian | 73 | 0.0% |
| Maltese | 93 | 0.0% |
| Mexican | 14,031 | 4.2% |
| Mexican American Indian | 189 | 0.1% |
| Moroccan | 199 | 0.1% |
| Native Hawaiian | 153 | 0.1% |
| Navajo | 44 | 0.0% |
| New Zealander | 10 | 0.0% |
| Nicaraguan | 1,428 | 0.4% |
| Nigerian | 525 | 0.2% |
| Northern European | 165 | 0.1% |
| Norwegian | 1,710 | 0.5% |
| Okinawan | 15 | 0.0% |
| Pakistani | 233 | 0.1% |
| Palestinian | 279 | 0.1% |
| Panamanian | 474 | 0.1% |
| Paraguayan | 12 | 0.0% |
| Pennsylvania German | 155 | 0.1% |
| Peruvian | 2,236 | 0.7% |
| Polish | 7,753 | 2.3% |
| Portuguese | 1,721 | 0.5% |
| Puerto Rican | 18,966 | 5.7% |
| Romanian | 442 | 0.1% |
| Russian | 1,823 | 0.5% |
| Salvadoran | 992 | 0.3% |
| Samoan | 109 | 0.0% |
| Scandinavian | 409 | 0.1% |
| Scotch-Irish | 1,667 | 0.5% |
| Scottish | 2,759 | 0.8% |
| Seminole | 46 | 0.0% |
| Serbian | 53 | 0.0% |
| Sioux | 125 | 0.0% |
| Slavic | 137 | 0.0% |
| Slovak | 568 | 0.2% |
| Slovene | 42 | 0.0% |
| South African | 190 | 0.1% |
| South American | 10,654 | 3.2% |
| South American Indian | 122 | 0.0% |
| Spaniard | 614 | 0.2% |
| Spanish | 656 | 0.2% |
| Spanish American | 9 | 0.0% |
| Sri Lankan | 1,005 | 0.3% |
| Subsaharan African | 2,275 | 0.7% |
| Swedish | 1,969 | 0.6% |
| Swiss | 319 | 0.1% |
| Syrian | 70 | 0.0% |
| Thai | 1,464 | 0.4% |
| Tlingit-Haida | 10 | 0.0% |
| Trinidadian and Tobagonian | 1,538 | 0.5% |
| Turkish | 48 | 0.0% |
| U.S. Virgin Islander | 192 | 0.1% |
| Ukrainian | 830 | 0.3% |
| Uruguayan | 113 | 0.0% |
| Venezuelan | 1,764 | 0.5% |
| Vietnamese | 13 | 0.0% |
| Welsh | 1,014 | 0.3% |
| West Indian | 377 | 0.1% |
| Yaqui | 41 | 0.0% |
| Yugoslavian | 131 | 0.0% | View All 138 Rows |
Immigrants in St. Lucie County
The most numerous immigrant groups reported in St. Lucie County came from Latin America (44,105 | 13.2%), Caribbean (25,872 | 7.7%), South America (9,551 | 2.9%), Haiti (9,071 | 2.7%), and Central America (8,682 | 2.6%), together accounting for 29.1% of all St. Lucie County residents.
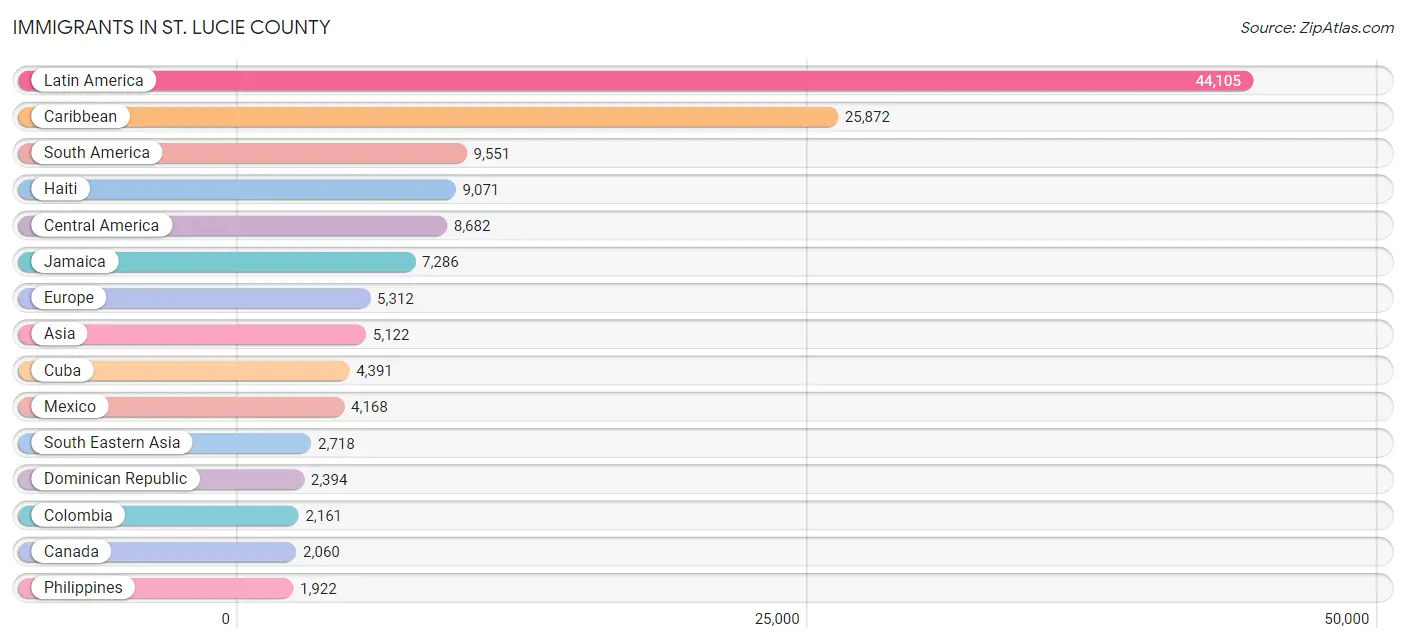
| Immigration Origin | # Population | % Population |
| Afghanistan | 2 | 0.0% |
| Africa | 978 | 0.3% |
| Argentina | 278 | 0.1% |
| Asia | 5,122 | 1.5% |
| Australia | 27 | 0.0% |
| Austria | 17 | 0.0% |
| Bahamas | 249 | 0.1% |
| Bangladesh | 8 | 0.0% |
| Barbados | 132 | 0.0% |
| Belarus | 39 | 0.0% |
| Belgium | 109 | 0.0% |
| Belize | 18 | 0.0% |
| Bolivia | 334 | 0.1% |
| Bosnia and Herzegovina | 110 | 0.0% |
| Brazil | 1,850 | 0.5% |
| Canada | 2,060 | 0.6% |
| Caribbean | 25,872 | 7.7% |
| Central America | 8,682 | 2.6% |
| Chile | 384 | 0.1% |
| China | 425 | 0.1% |
| Colombia | 2,161 | 0.6% |
| Costa Rica | 278 | 0.1% |
| Cuba | 4,391 | 1.3% |
| Czechoslovakia | 84 | 0.0% |
| Denmark | 7 | 0.0% |
| Dominica | 129 | 0.0% |
| Dominican Republic | 2,394 | 0.7% |
| Eastern Africa | 102 | 0.0% |
| Eastern Asia | 1,017 | 0.3% |
| Eastern Europe | 1,196 | 0.4% |
| Ecuador | 961 | 0.3% |
| Egypt | 49 | 0.0% |
| El Salvador | 397 | 0.1% |
| England | 631 | 0.2% |
| Ethiopia | 47 | 0.0% |
| Europe | 5,312 | 1.6% |
| France | 193 | 0.1% |
| Germany | 626 | 0.2% |
| Ghana | 242 | 0.1% |
| Greece | 101 | 0.0% |
| Grenada | 173 | 0.1% |
| Guatemala | 1,055 | 0.3% |
| Guyana | 920 | 0.3% |
| Haiti | 9,071 | 2.7% |
| Honduras | 1,645 | 0.5% |
| Hong Kong | 10 | 0.0% |
| Hungary | 201 | 0.1% |
| India | 585 | 0.2% |
| Indonesia | 20 | 0.0% |
| Iran | 90 | 0.0% |
| Ireland | 189 | 0.1% |
| Israel | 101 | 0.0% |
| Italy | 555 | 0.2% |
| Jamaica | 7,286 | 2.2% |
| Japan | 292 | 0.1% |
| Jordan | 32 | 0.0% |
| Kazakhstan | 18 | 0.0% |
| Kenya | 41 | 0.0% |
| Korea | 300 | 0.1% |
| Laos | 23 | 0.0% |
| Latin America | 44,105 | 13.2% |
| Latvia | 18 | 0.0% |
| Lebanon | 251 | 0.1% |
| Lithuania | 23 | 0.0% |
| Malaysia | 24 | 0.0% |
| Mexico | 4,168 | 1.3% |
| Micronesia | 26 | 0.0% |
| Middle Africa | 29 | 0.0% |
| Moldova | 72 | 0.0% |
| Morocco | 97 | 0.0% |
| Netherlands | 113 | 0.0% |
| Nicaragua | 926 | 0.3% |
| Nigeria | 102 | 0.0% |
| North Macedonia | 8 | 0.0% |
| Northern Africa | 162 | 0.1% |
| Northern Europe | 1,607 | 0.5% |
| Norway | 41 | 0.0% |
| Oceania | 63 | 0.0% |
| Pakistan | 228 | 0.1% |
| Panama | 195 | 0.1% |
| Peru | 1,336 | 0.4% |
| Philippines | 1,922 | 0.6% |
| Poland | 149 | 0.0% |
| Portugal | 532 | 0.2% |
| Romania | 93 | 0.0% |
| Russia | 189 | 0.1% |
| Saudi Arabia | 7 | 0.0% |
| Scotland | 106 | 0.0% |
| Singapore | 15 | 0.0% |
| South Africa | 284 | 0.1% |
| South America | 9,551 | 2.9% |
| South Central Asia | 938 | 0.3% |
| South Eastern Asia | 2,718 | 0.8% |
| Southern Europe | 1,415 | 0.4% |
| Spain | 181 | 0.1% |
| St. Vincent and the Grenadines | 222 | 0.1% |
| Sweden | 64 | 0.0% |
| Switzerland | 36 | 0.0% |
| Taiwan | 124 | 0.0% |
| Thailand | 221 | 0.1% |
| Trinidad and Tobago | 1,440 | 0.4% |
| Turkey | 17 | 0.0% |
| Ukraine | 125 | 0.0% |
| Uruguay | 73 | 0.0% |
| Venezuela | 1,242 | 0.4% |
| Vietnam | 493 | 0.2% |
| Western Africa | 344 | 0.1% |
| Western Asia | 408 | 0.1% |
| Western Europe | 1,094 | 0.3% |
| Zaire | 21 | 0.0% |
| Zimbabwe | 14 | 0.0% | View All 111 Rows |
Sex and Age in St. Lucie County
Sex and Age in St. Lucie County
The most populous age groups in St. Lucie County are 60 to 64 Years (11,344 | 6.9%) for men and 60 to 64 Years (12,333 | 7.3%) for women.
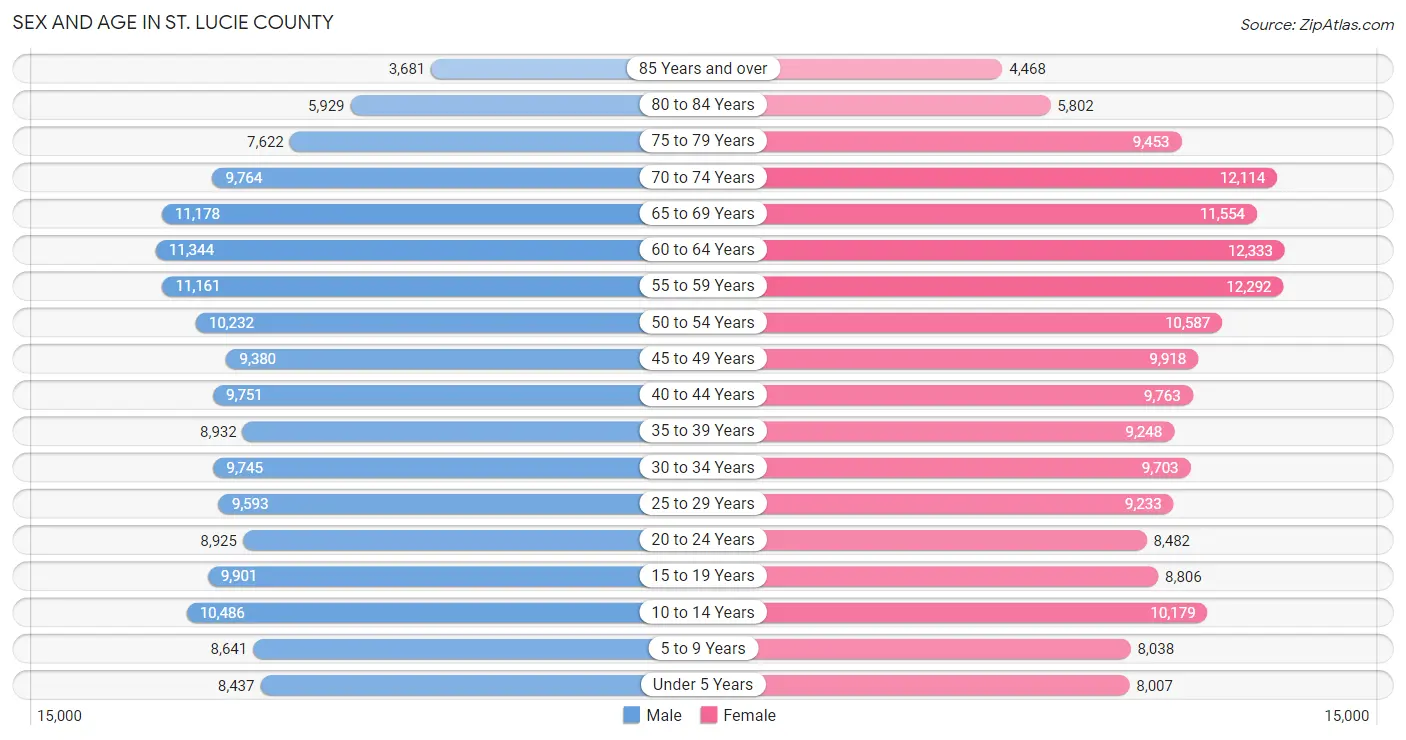
| Age Bracket | Male | Female |
| Under 5 Years | 8,437 (5.1%) | 8,007 (4.7%) |
| 5 to 9 Years | 8,641 (5.2%) | 8,038 (4.7%) |
| 10 to 14 Years | 10,486 (6.4%) | 10,179 (6.0%) |
| 15 to 19 Years | 9,901 (6.0%) | 8,806 (5.2%) |
| 20 to 24 Years | 8,925 (5.4%) | 8,482 (5.0%) |
| 25 to 29 Years | 9,593 (5.8%) | 9,233 (5.4%) |
| 30 to 34 Years | 9,745 (5.9%) | 9,703 (5.7%) |
| 35 to 39 Years | 8,932 (5.4%) | 9,248 (5.4%) |
| 40 to 44 Years | 9,751 (5.9%) | 9,763 (5.7%) |
| 45 to 49 Years | 9,380 (5.7%) | 9,918 (5.8%) |
| 50 to 54 Years | 10,232 (6.2%) | 10,587 (6.2%) |
| 55 to 59 Years | 11,161 (6.8%) | 12,292 (7.2%) |
| 60 to 64 Years | 11,344 (6.9%) | 12,333 (7.3%) |
| 65 to 69 Years | 11,178 (6.8%) | 11,554 (6.8%) |
| 70 to 74 Years | 9,764 (5.9%) | 12,114 (7.1%) |
| 75 to 79 Years | 7,622 (4.6%) | 9,453 (5.6%) |
| 80 to 84 Years | 5,929 (3.6%) | 5,802 (3.4%) |
| 85 Years and over | 3,681 (2.2%) | 4,468 (2.6%) |
| Total | 164,702 (100.0%) | 169,980 (100.0%) |
Families and Households in St. Lucie County
Median Family Size in St. Lucie County
The median family size in St. Lucie County is 3.12 persons per family, with single female/mother families (17,438 | 20.0%) accounting for the largest median family size of 3.43 persons per family. On the other hand, single male/father families (6,441 | 7.4%) represent the smallest median family size with 2.97 persons per family.
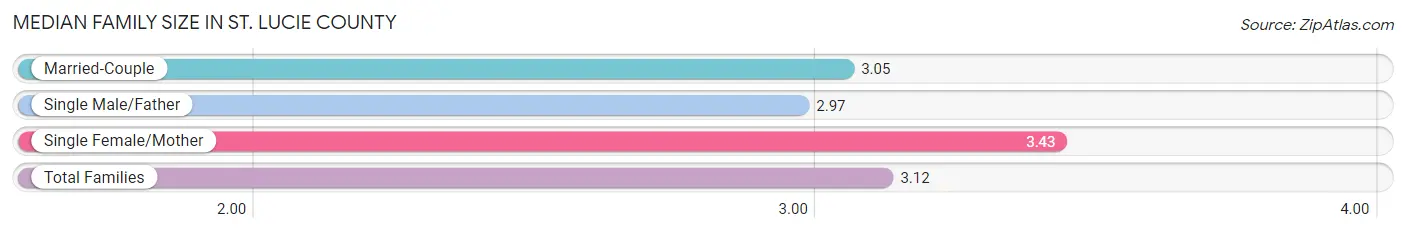
| Family Type | # Families | Family Size |
| Married-Couple | 63,161 (72.6%) | 3.05 |
| Single Male/Father | 6,441 (7.4%) | 2.97 |
| Single Female/Mother | 17,438 (20.0%) | 3.43 |
| Total Families | 87,040 (100.0%) | 3.12 |
Median Household Size in St. Lucie County
The median household size in St. Lucie County is 2.62 persons per household, with single female/mother households (17,438 | 13.8%) accounting for the largest median household size of 3.66 persons per household. non-family households (39,403 | 31.2%) represent the smallest median household size with 1.26 persons per household.
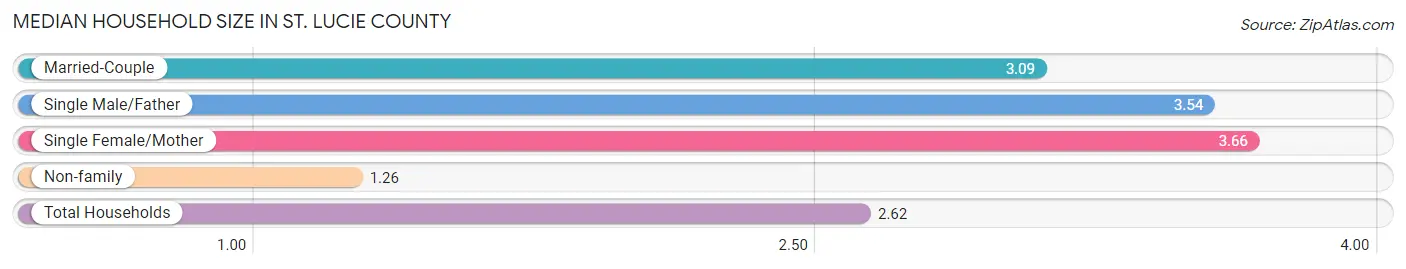
| Household Type | # Households | Household Size |
| Married-Couple | 63,161 (49.9%) | 3.09 |
| Single Male/Father | 6,441 (5.1%) | 3.54 |
| Single Female/Mother | 17,438 (13.8%) | 3.66 |
| Non-family | 39,403 (31.2%) | 1.26 |
| Total Households | 126,443 (100.0%) | 2.62 |
Household Size by Marriage Status in St. Lucie County
Out of a total of 126,443 households in St. Lucie County, 87,040 (68.8%) are family households, while 39,403 (31.2%) are nonfamily households. The most numerous type of family households are 2-person households, comprising 42,799, and the most common type of nonfamily households are 1-person households, comprising 32,456.
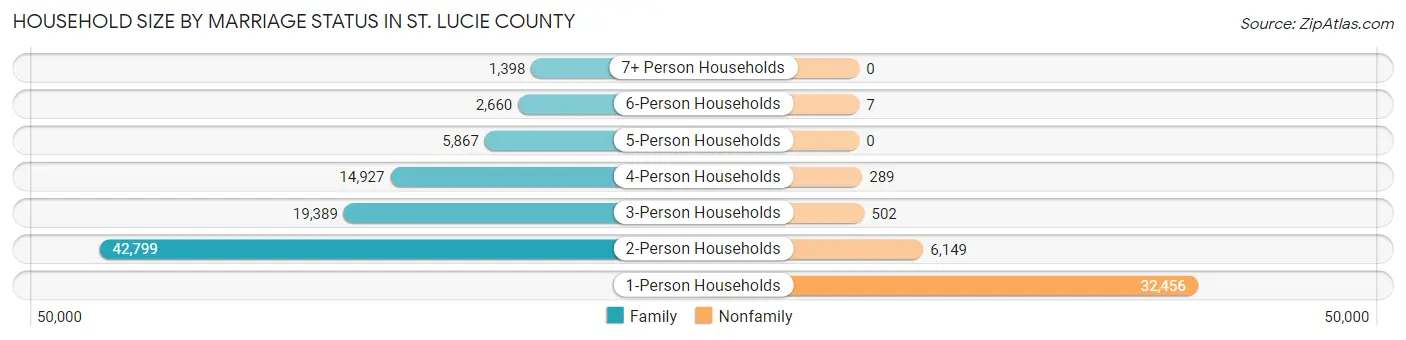
| Household Size | Family Households | Nonfamily Households |
| 1-Person Households | - | 32,456 (25.7%) |
| 2-Person Households | 42,799 (33.9%) | 6,149 (4.9%) |
| 3-Person Households | 19,389 (15.3%) | 502 (0.4%) |
| 4-Person Households | 14,927 (11.8%) | 289 (0.2%) |
| 5-Person Households | 5,867 (4.6%) | 0 (0.0%) |
| 6-Person Households | 2,660 (2.1%) | 7 (0.0%) |
| 7+ Person Households | 1,398 (1.1%) | 0 (0.0%) |
| Total | 87,040 (68.8%) | 39,403 (31.2%) |
Female Fertility in St. Lucie County
Fertility by Age in St. Lucie County
Average fertility rate in St. Lucie County is 61.0 births per 1,000 women. Women in the age bracket of 20 to 34 years have the highest fertility rate with 108.0 births per 1,000 women. Women in the age bracket of 20 to 34 years acount for 72.7% of all women with births.
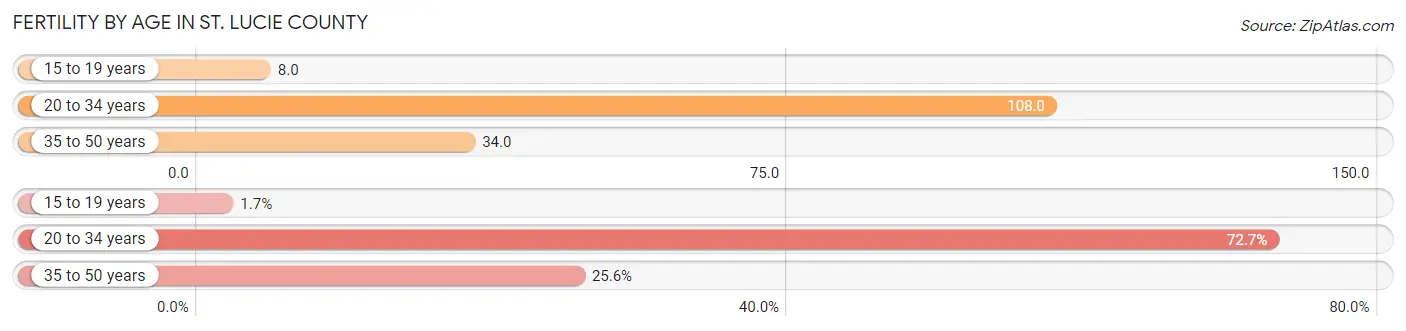
| Age Bracket | Women with Births | Births / 1,000 Women |
| 15 to 19 years | 70 (1.7%) | 8.0 |
| 20 to 34 years | 2,955 (72.7%) | 108.0 |
| 35 to 50 years | 1,040 (25.6%) | 34.0 |
| Total | 4,065 (100.0%) | 61.0 |
Fertility by Age by Marriage Status in St. Lucie County
53.8% of women with births (4,065) in St. Lucie County are married. The highest percentage of unmarried women with births falls into 15 to 19 years age bracket with 100.0% of them unmarried at the time of birth, while the lowest percentage of unmarried women with births belong to 20 to 34 years age bracket with 44.1% of them unmarried.
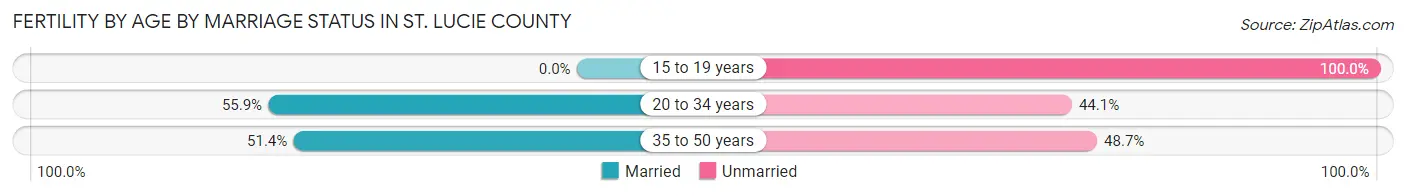
| Age Bracket | Married | Unmarried |
| 15 to 19 years | 0 (0.0%) | 70 (100.0%) |
| 20 to 34 years | 1,652 (55.9%) | 1,303 (44.1%) |
| 35 to 50 years | 534 (51.3%) | 506 (48.6%) |
| Total | 2,187 (53.8%) | 1,878 (46.2%) |
Fertility by Education in St. Lucie County
Average fertility rate in St. Lucie County is 61.0 births per 1,000 women. Women with the education attainment of graduate degree have the highest fertility rate of 123.0 births per 1,000 women, while women with the education attainment of less than high school have the lowest fertility at 37.0 births per 1,000 women. Women with the education attainment of college or associate's degree represent 30.9% of all women with births.
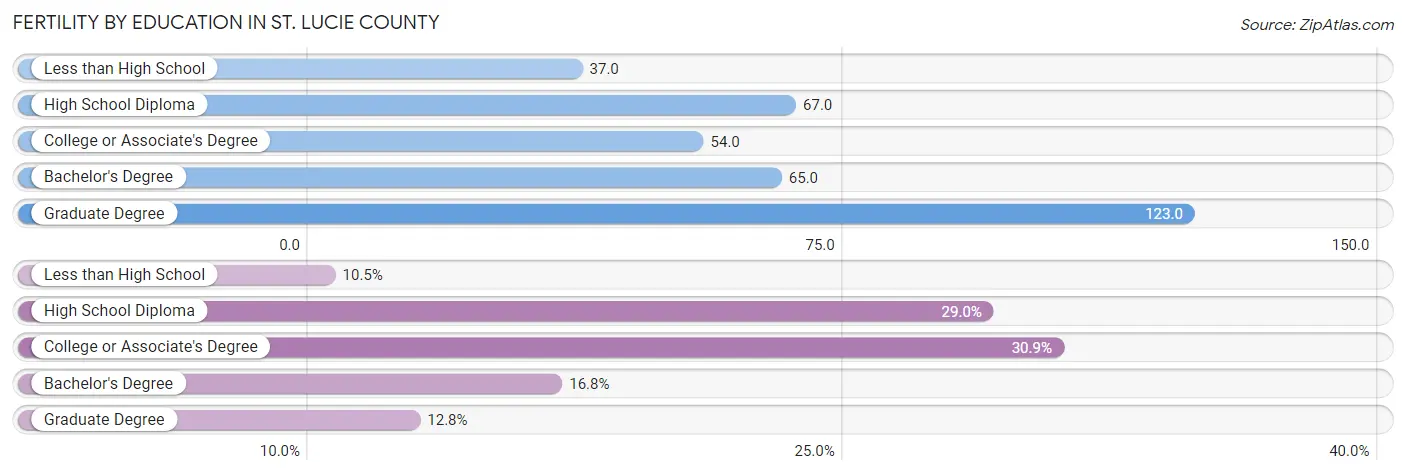
| Educational Attainment | Women with Births | Births / 1,000 Women |
| Less than High School | 425 (10.5%) | 37.0 |
| High School Diploma | 1,177 (28.9%) | 67.0 |
| College or Associate's Degree | 1,257 (30.9%) | 54.0 |
| Bachelor's Degree | 684 (16.8%) | 65.0 |
| Graduate Degree | 522 (12.8%) | 123.0 |
| Total | 4,065 (100.0%) | 61.0 |
Fertility by Education by Marriage Status in St. Lucie County
46.2% of women with births in St. Lucie County are unmarried. Women with the educational attainment of graduate degree are most likely to be married with 82.4% of them married at childbirth, while women with the educational attainment of high school diploma are least likely to be married with 77.7% of them unmarried at childbirth.
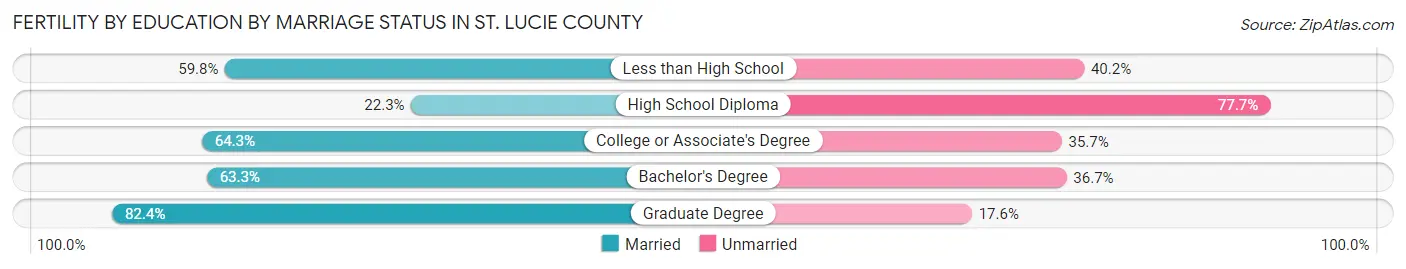
| Educational Attainment | Married | Unmarried |
| Less than High School | 254 (59.8%) | 171 (40.2%) |
| High School Diploma | 262 (22.3%) | 915 (77.7%) |
| College or Associate's Degree | 808 (64.3%) | 449 (35.7%) |
| Bachelor's Degree | 433 (63.3%) | 251 (36.7%) |
| Graduate Degree | 430 (82.4%) | 92 (17.6%) |
| Total | 2,187 (53.8%) | 1,878 (46.2%) |
Employment Characteristics in St. Lucie County
Employment by Class of Employer in St. Lucie County
Among the 142,823 employed individuals in St. Lucie County, private company employees (98,748 | 69.1%), local government employees (10,824 | 7.6%), and not-for-profit organizations (9,806 | 6.9%) make up the most common classes of employment.
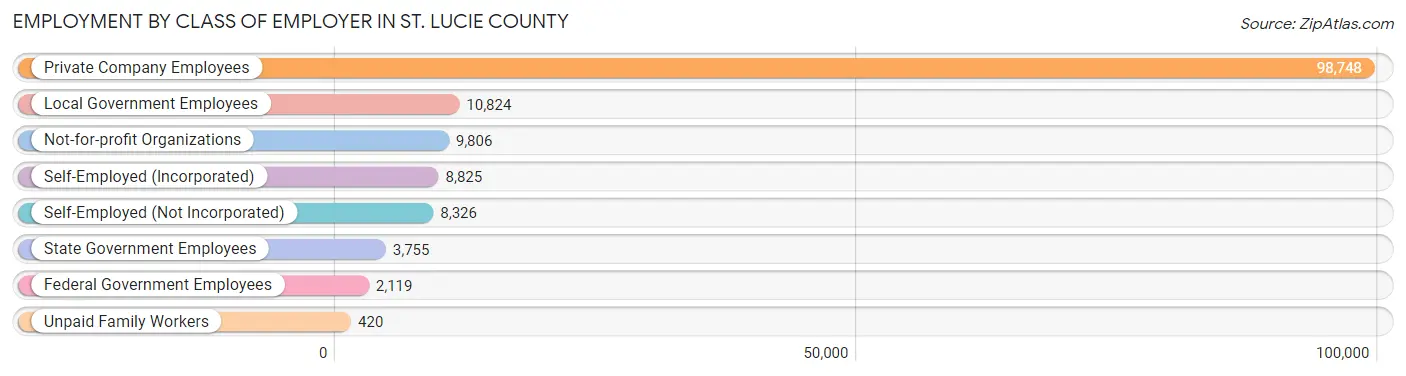
| Employer Class | # Employees | % Employees |
| Private Company Employees | 98,748 | 69.1% |
| Self-Employed (Incorporated) | 8,825 | 6.2% |
| Self-Employed (Not Incorporated) | 8,326 | 5.8% |
| Not-for-profit Organizations | 9,806 | 6.9% |
| Local Government Employees | 10,824 | 7.6% |
| State Government Employees | 3,755 | 2.6% |
| Federal Government Employees | 2,119 | 1.5% |
| Unpaid Family Workers | 420 | 0.3% |
| Total | 142,823 | 100.0% |
Employment Status by Age in St. Lucie County
According to the labor force statistics for St. Lucie County, out of the total population over 16 years of age (276,707), 55.9% or 154,679 individuals are in the labor force, with 6.0% or 9,281 of them unemployed. The age group with the highest labor force participation rate is 30 to 34 years, with 84.9% or 16,511 individuals in the labor force. Within the labor force, the 16 to 19 years age range has the highest percentage of unemployed individuals, with 19.0% or 1,090 of them being unemployed.
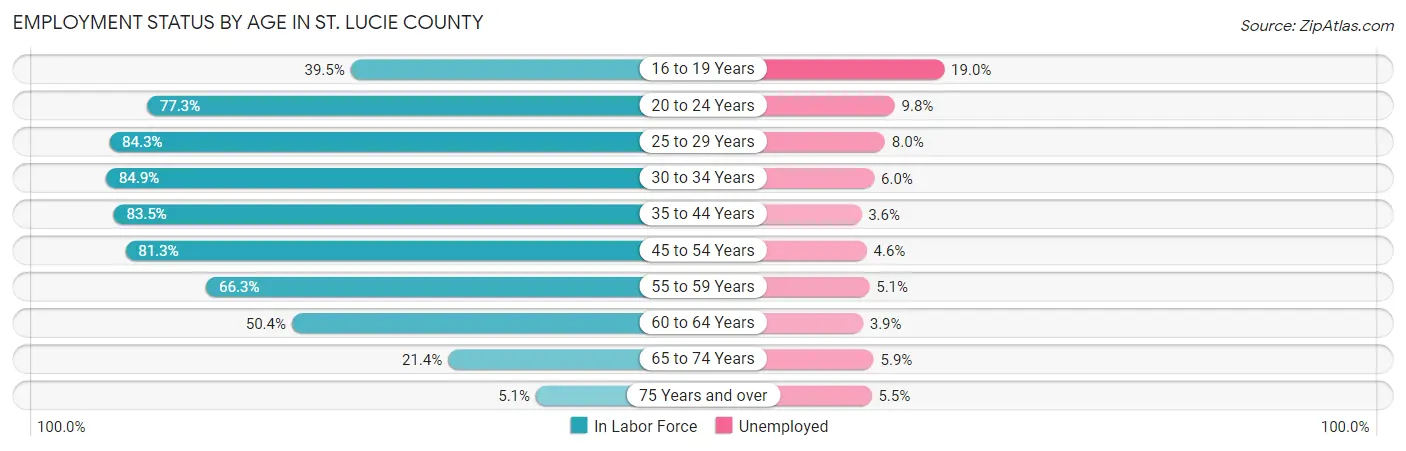
| Age Bracket | In Labor Force | Unemployed |
| 16 to 19 Years | 5,735 (39.5%) | 1,090 (19.0%) |
| 20 to 24 Years | 13,456 (77.3%) | 1,319 (9.8%) |
| 25 to 29 Years | 15,870 (84.3%) | 1,270 (8.0%) |
| 30 to 34 Years | 16,511 (84.9%) | 991 (6.0%) |
| 35 to 44 Years | 31,474 (83.5%) | 1,133 (3.6%) |
| 45 to 54 Years | 32,615 (81.3%) | 1,500 (4.6%) |
| 55 to 59 Years | 15,549 (66.3%) | 793 (5.1%) |
| 60 to 64 Years | 11,933 (50.4%) | 465 (3.9%) |
| 65 to 74 Years | 9,547 (21.4%) | 563 (5.9%) |
| 75 Years and over | 1,885 (5.1%) | 104 (5.5%) |
| Total | 154,679 (55.9%) | 9,281 (6.0%) |
Employment Status by Educational Attainment in St. Lucie County
According to labor force statistics for St. Lucie County, 76.0% of individuals (124,043) out of the total population between 25 and 64 years of age (163,215) are in the labor force, with 5.0% or 6,202 of them being unemployed. The group with the highest labor force participation rate are those with the educational attainment of bachelor's degree or higher, with 81.9% or 32,711 individuals in the labor force. Within the labor force, individuals with less than high school education have the highest percentage of unemployment, with 10.3% or 1,074 of them being unemployed.
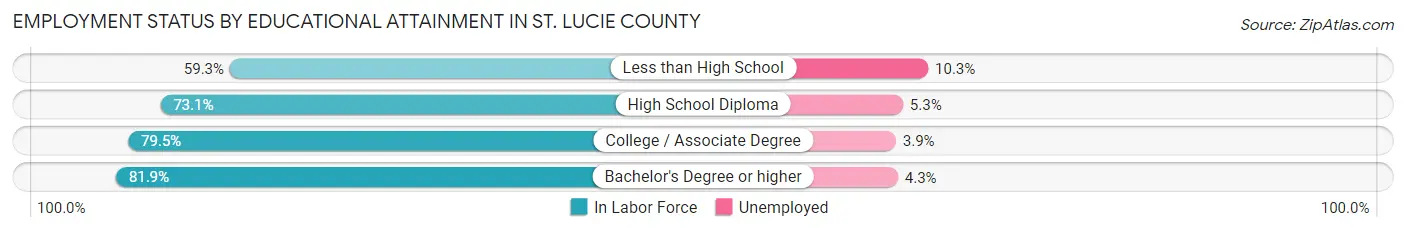
| Educational Attainment | In Labor Force | Unemployed |
| Less than High School | 10,431 (59.3%) | 1,812 (10.3%) |
| High School Diploma | 36,967 (73.1%) | 2,680 (5.3%) |
| College / Associate Degree | 43,816 (79.5%) | 2,149 (3.9%) |
| Bachelor's Degree or higher | 32,711 (81.9%) | 1,717 (4.3%) |
| Total | 124,043 (76.0%) | 8,161 (5.0%) |
Employment Occupations by Sex in St. Lucie County
Management, Business, Science and Arts Occupations
The most common Management, Business, Science and Arts occupations in St. Lucie County are Management (14,747 | 10.2%), Community & Social Service (10,826 | 7.5%), Health Diagnosing & Treating (9,982 | 6.9%), Education Instruction & Library (6,530 | 4.5%), and Health Technologists (6,122 | 4.2%).
Management, Business, Science and Arts Occupations by Sex
Within the Management, Business, Science and Arts occupations in St. Lucie County, the most male-oriented occupations are Architecture & Engineering (93.3%), Computers, Engineering & Science (70.7%), and Computers & Mathematics (68.5%), while the most female-oriented occupations are Health Technologists (74.0%), Health Diagnosing & Treating (74.0%), and Education Instruction & Library (69.9%).
| Occupation | Male | Female |
| Management | 8,514 (57.7%) | 6,233 (42.3%) |
| Business & Financial | 3,020 (50.1%) | 3,011 (49.9%) |
| Computers, Engineering & Science | 3,851 (70.7%) | 1,598 (29.3%) |
| Computers & Mathematics | 1,992 (68.5%) | 914 (31.5%) |
| Architecture & Engineering | 1,272 (93.3%) | 91 (6.7%) |
| Life, Physical & Social Science | 587 (49.7%) | 593 (50.2%) |
| Community & Social Service | 4,185 (38.7%) | 6,641 (61.3%) |
| Education, Arts & Media | 830 (45.7%) | 987 (54.3%) |
| Legal Services & Support | 406 (46.5%) | 467 (53.5%) |
| Education Instruction & Library | 1,964 (30.1%) | 4,566 (69.9%) |
| Arts, Media & Entertainment | 985 (61.3%) | 621 (38.7%) |
| Health Diagnosing & Treating | 2,595 (26.0%) | 7,387 (74.0%) |
| Health Technologists | 1,590 (26.0%) | 4,532 (74.0%) |
| Total (Category) | 22,165 (47.1%) | 24,870 (52.9%) |
| Total (Overall) | 75,538 (52.1%) | 69,542 (47.9%) |
Services Occupations
The most common Services occupations in St. Lucie County are Food Preparation & Serving (8,585 | 5.9%), Healthcare Support (7,019 | 4.8%), Cleaning & Maintenance (6,203 | 4.3%), Personal Care & Service (4,603 | 3.2%), and Security & Protection (3,023 | 2.1%).
Services Occupations by Sex
Within the Services occupations in St. Lucie County, the most male-oriented occupations are Firefighting & Prevention (79.4%), Security & Protection (72.9%), and Law Enforcement (65.3%), while the most female-oriented occupations are Healthcare Support (82.1%), Personal Care & Service (68.0%), and Food Preparation & Serving (52.5%).
| Occupation | Male | Female |
| Healthcare Support | 1,259 (17.9%) | 5,760 (82.1%) |
| Security & Protection | 2,205 (72.9%) | 818 (27.1%) |
| Firefighting & Prevention | 1,300 (79.4%) | 337 (20.6%) |
| Law Enforcement | 905 (65.3%) | 481 (34.7%) |
| Food Preparation & Serving | 4,078 (47.5%) | 4,507 (52.5%) |
| Cleaning & Maintenance | 3,499 (56.4%) | 2,704 (43.6%) |
| Personal Care & Service | 1,471 (32.0%) | 3,132 (68.0%) |
| Total (Category) | 12,512 (42.5%) | 16,921 (57.5%) |
| Total (Overall) | 75,538 (52.1%) | 69,542 (47.9%) |
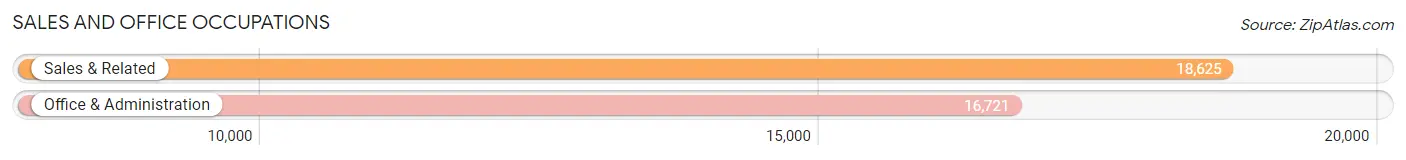
Sales and Office Occupations
The most common Sales and Office occupations in St. Lucie County are Sales & Related (18,625 | 12.8%), and Office & Administration (16,721 | 11.5%).
Sales and Office Occupations by Sex
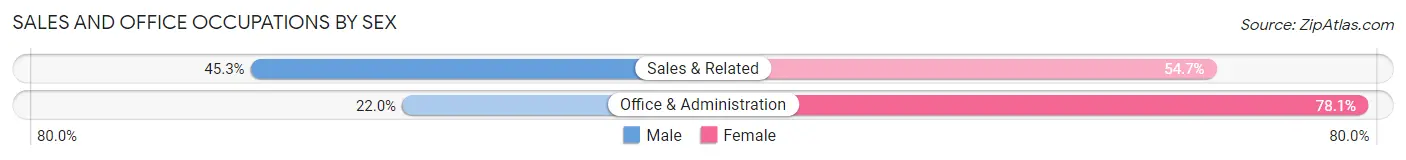
| Occupation | Male | Female |
| Sales & Related | 8,429 (45.3%) | 10,196 (54.7%) |
| Office & Administration | 3,670 (22.0%) | 13,051 (78.0%) |
| Total (Category) | 12,099 (34.2%) | 23,247 (65.8%) |
| Total (Overall) | 75,538 (52.1%) | 69,542 (47.9%) |
Natural Resources, Construction and Maintenance Occupations
The most common Natural Resources, Construction and Maintenance occupations in St. Lucie County are Construction & Extraction (8,324 | 5.7%), Installation, Maintenance & Repair (6,661 | 4.6%), and Farming, Fishing & Forestry (497 | 0.3%).

Natural Resources, Construction and Maintenance Occupations by Sex
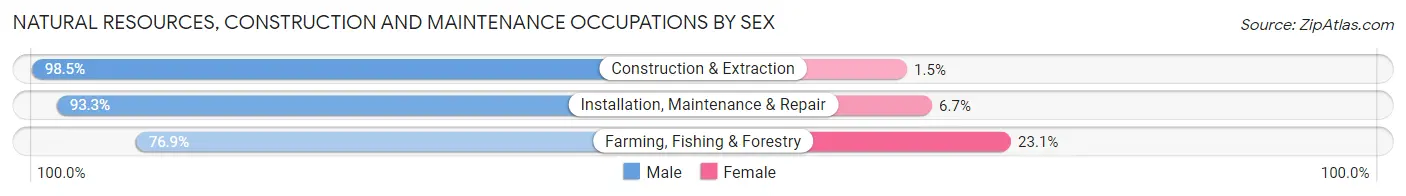
| Occupation | Male | Female |
| Farming, Fishing & Forestry | 382 (76.9%) | 115 (23.1%) |
| Construction & Extraction | 8,198 (98.5%) | 126 (1.5%) |
| Installation, Maintenance & Repair | 6,214 (93.3%) | 447 (6.7%) |
| Total (Category) | 14,794 (95.6%) | 688 (4.4%) |
| Total (Overall) | 75,538 (52.1%) | 69,542 (47.9%) |
Production, Transportation and Moving Occupations
The most common Production, Transportation and Moving occupations in St. Lucie County are Transportation (6,809 | 4.7%), Production (6,081 | 4.2%), and Material Moving (4,894 | 3.4%).
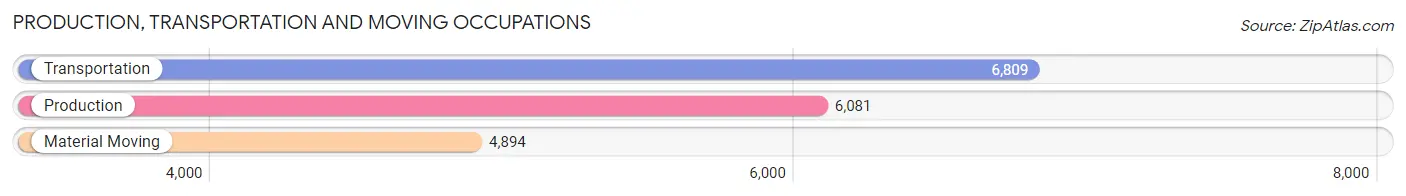
Production, Transportation and Moving Occupations by Sex
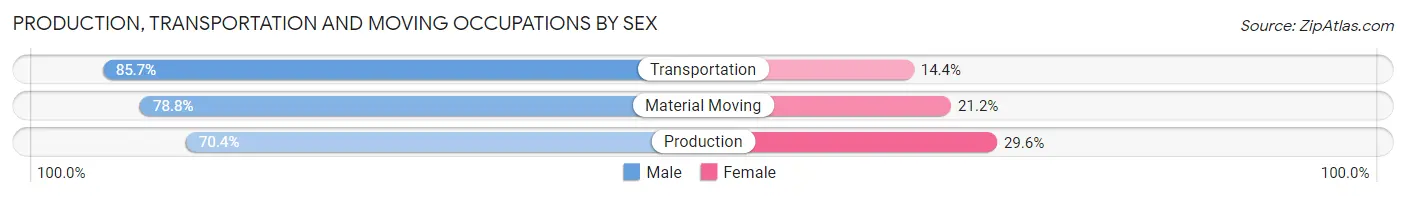
| Occupation | Male | Female |
| Production | 4,280 (70.4%) | 1,801 (29.6%) |
| Transportation | 5,832 (85.7%) | 977 (14.3%) |
| Material Moving | 3,856 (78.8%) | 1,038 (21.2%) |
| Total (Category) | 13,968 (78.5%) | 3,816 (21.5%) |
| Total (Overall) | 75,538 (52.1%) | 69,542 (47.9%) |
Employment Industries by Sex in St. Lucie County
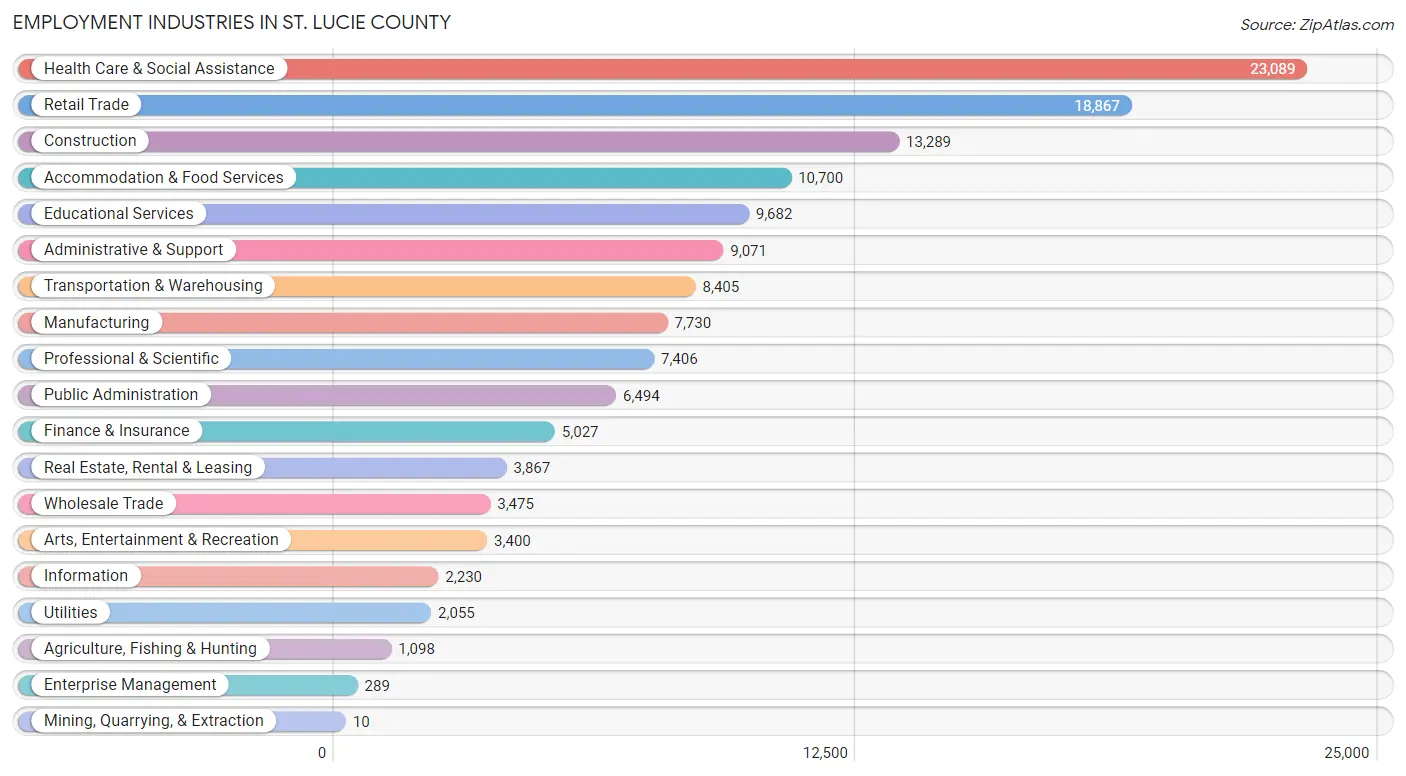
Employment Industries in St. Lucie County
The major employment industries in St. Lucie County include Health Care & Social Assistance (23,089 | 15.9%), Retail Trade (18,867 | 13.0%), Construction (13,289 | 9.2%), Accommodation & Food Services (10,700 | 7.4%), and Educational Services (9,682 | 6.7%).
Employment Industries by Sex in St. Lucie County
The St. Lucie County industries that see more men than women are Mining, Quarrying, & Extraction (100.0%), Construction (90.1%), and Utilities (75.6%), whereas the industries that tend to have a higher number of women are Health Care & Social Assistance (76.7%), Enterprise Management (71.3%), and Educational Services (66.3%).
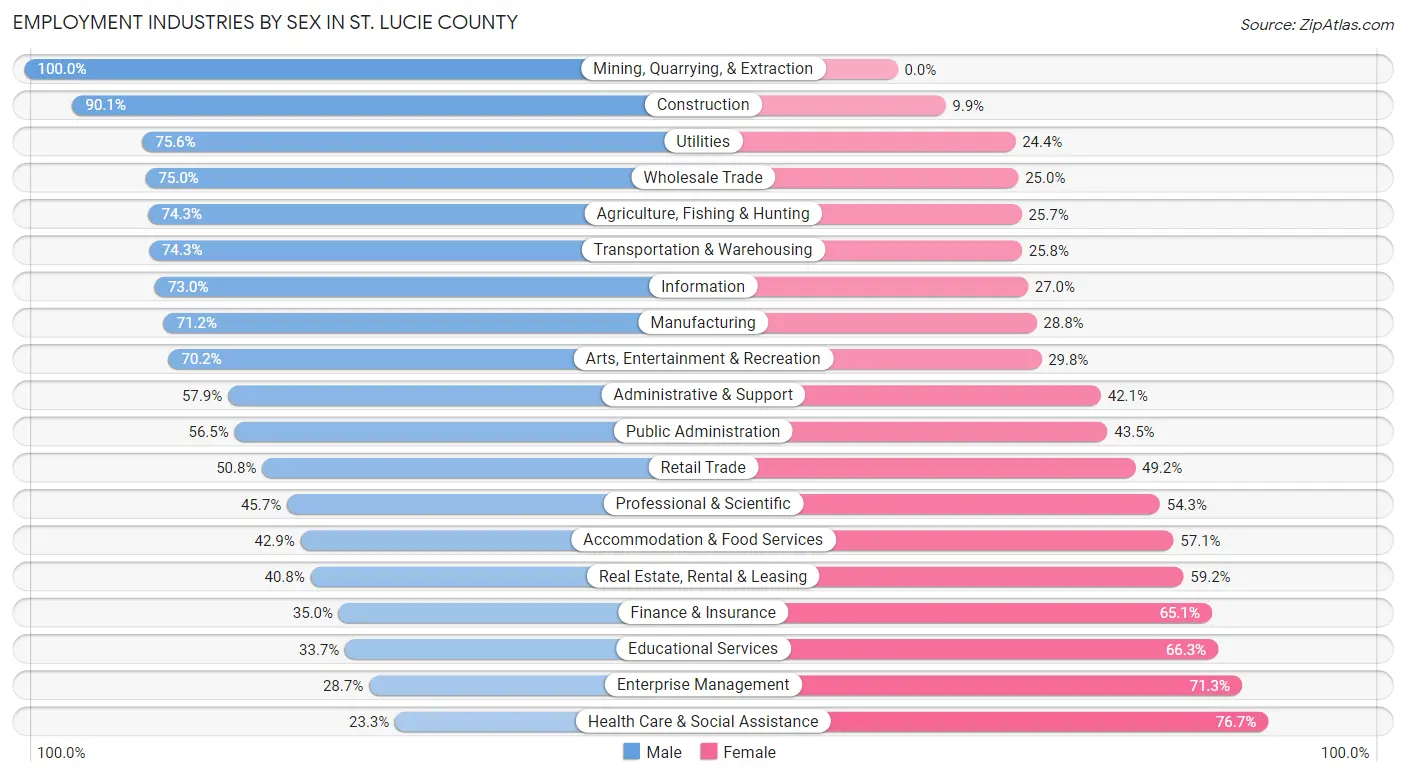
| Industry | Male | Female |
| Agriculture, Fishing & Hunting | 816 (74.3%) | 282 (25.7%) |
| Mining, Quarrying, & Extraction | 10 (100.0%) | 0 (0.0%) |
| Construction | 11,971 (90.1%) | 1,318 (9.9%) |
| Manufacturing | 5,506 (71.2%) | 2,224 (28.8%) |
| Wholesale Trade | 2,606 (75.0%) | 869 (25.0%) |
| Retail Trade | 9,587 (50.8%) | 9,280 (49.2%) |
| Transportation & Warehousing | 6,241 (74.3%) | 2,164 (25.8%) |
| Utilities | 1,554 (75.6%) | 501 (24.4%) |
| Information | 1,628 (73.0%) | 602 (27.0%) |
| Finance & Insurance | 1,757 (34.9%) | 3,270 (65.0%) |
| Real Estate, Rental & Leasing | 1,578 (40.8%) | 2,289 (59.2%) |
| Professional & Scientific | 3,384 (45.7%) | 4,022 (54.3%) |
| Enterprise Management | 83 (28.7%) | 206 (71.3%) |
| Administrative & Support | 5,252 (57.9%) | 3,819 (42.1%) |
| Educational Services | 3,259 (33.7%) | 6,423 (66.3%) |
| Health Care & Social Assistance | 5,383 (23.3%) | 17,706 (76.7%) |
| Arts, Entertainment & Recreation | 2,388 (70.2%) | 1,012 (29.8%) |
| Accommodation & Food Services | 4,588 (42.9%) | 6,112 (57.1%) |
| Public Administration | 3,672 (56.5%) | 2,822 (43.5%) |
| Total | 75,538 (52.1%) | 69,542 (47.9%) |
Education in St. Lucie County
School Enrollment in St. Lucie County
The most common levels of schooling among the 70,968 students in St. Lucie County are middle school (17,491 | 24.6%), high school (16,451 | 23.2%), and college / undergraduate (13,462 | 19.0%).
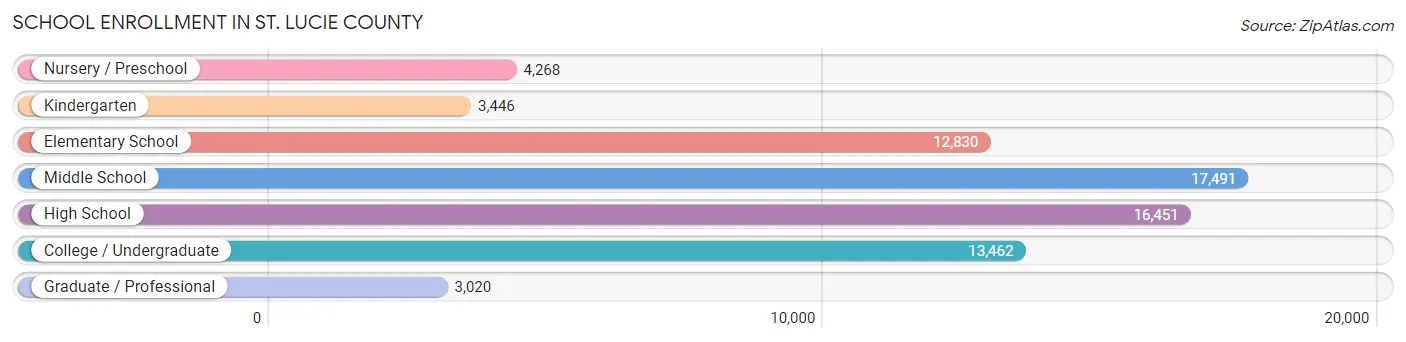
| School Level | # Students | % Students |
| Nursery / Preschool | 4,268 | 6.0% |
| Kindergarten | 3,446 | 4.9% |
| Elementary School | 12,830 | 18.1% |
| Middle School | 17,491 | 24.6% |
| High School | 16,451 | 23.2% |
| College / Undergraduate | 13,462 | 19.0% |
| Graduate / Professional | 3,020 | 4.3% |
| Total | 70,968 | 100.0% |
School Enrollment by Age by Funding Source in St. Lucie County
Out of a total of 70,968 students who are enrolled in schools in St. Lucie County, 11,852 (16.7%) attend a private institution, while the remaining 59,116 (83.3%) are enrolled in public schools. The age group of 3 to 4 year olds has the highest likelihood of being enrolled in private schools, with 1,385 (39.1% in the age bracket) enrolled. Conversely, the age group of 15 to 17 year olds has the lowest likelihood of being enrolled in a private school, with 10,519 (90.6% in the age bracket) attending a public institution.
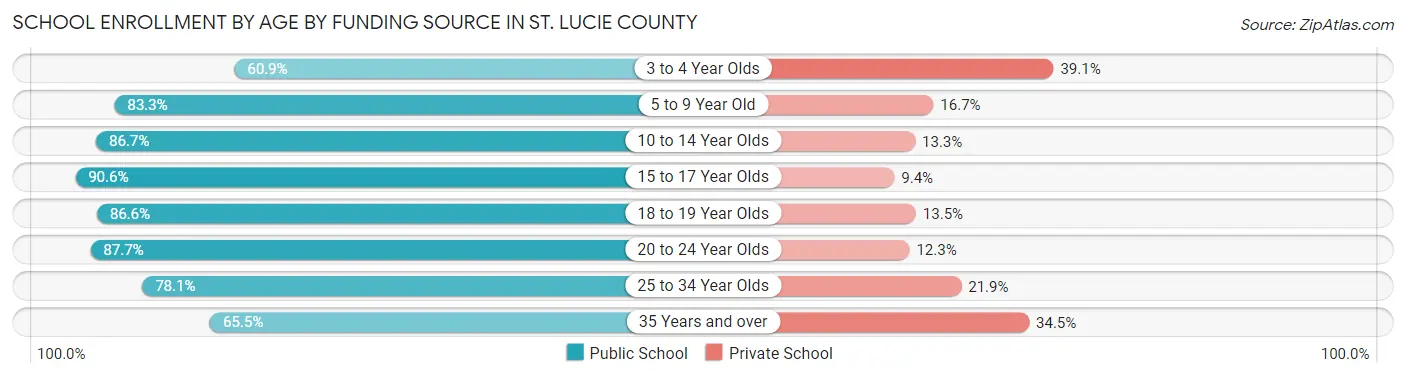
| Age Bracket | Public School | Private School |
| 3 to 4 Year Olds | 2,159 (60.9%) | 1,385 (39.1%) |
| 5 to 9 Year Old | 13,264 (83.3%) | 2,661 (16.7%) |
| 10 to 14 Year Olds | 17,658 (86.7%) | 2,711 (13.3%) |
| 15 to 17 Year Olds | 10,519 (90.6%) | 1,096 (9.4%) |
| 18 to 19 Year Olds | 3,733 (86.6%) | 580 (13.5%) |
| 20 to 24 Year Olds | 4,974 (87.7%) | 695 (12.3%) |
| 25 to 34 Year Olds | 3,515 (78.1%) | 986 (21.9%) |
| 35 Years and over | 3,294 (65.5%) | 1,738 (34.5%) |
| Total | 59,116 (83.3%) | 11,852 (16.7%) |
Educational Attainment by Field of Study in St. Lucie County
Business (15,636 | 24.2%), education (8,486 | 13.1%), science & technology (7,650 | 11.8%), arts & humanities (5,837 | 9.0%), and social sciences (4,132 | 6.4%) are the most common fields of study among 64,673 individuals in St. Lucie County who have obtained a bachelor's degree or higher.
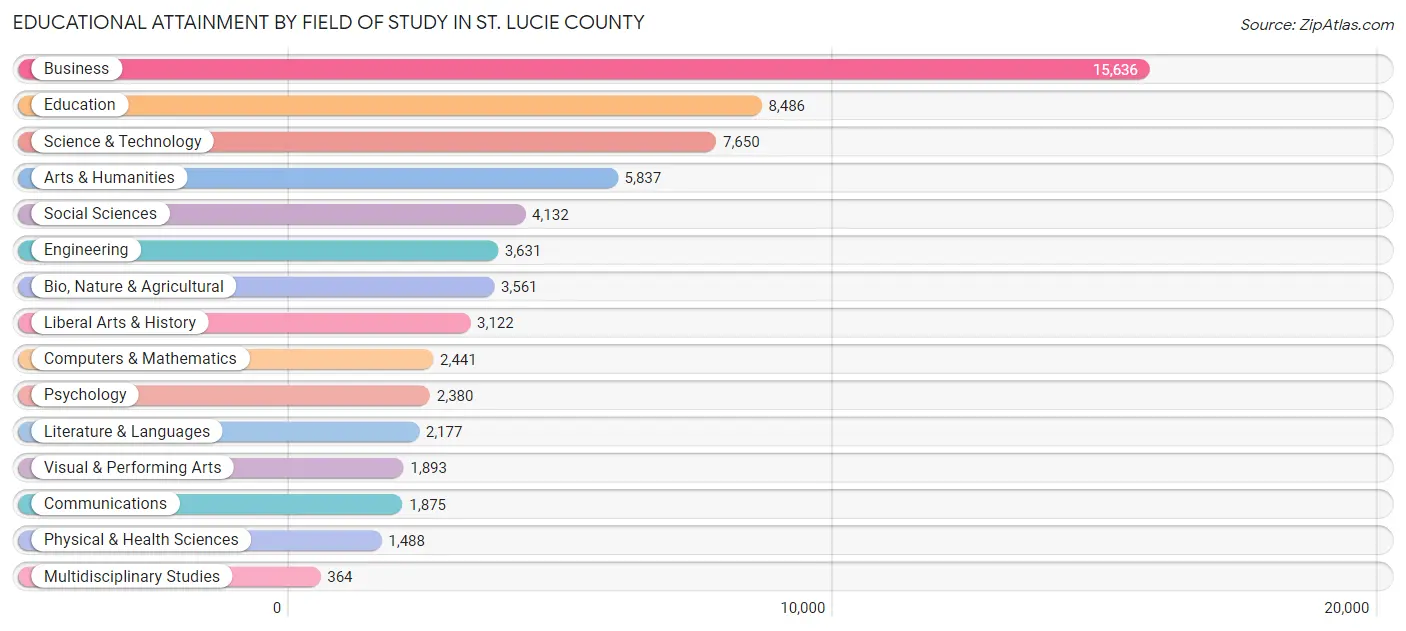
| Field of Study | # Graduates | % Graduates |
| Computers & Mathematics | 2,441 | 3.8% |
| Bio, Nature & Agricultural | 3,561 | 5.5% |
| Physical & Health Sciences | 1,488 | 2.3% |
| Psychology | 2,380 | 3.7% |
| Social Sciences | 4,132 | 6.4% |
| Engineering | 3,631 | 5.6% |
| Multidisciplinary Studies | 364 | 0.6% |
| Science & Technology | 7,650 | 11.8% |
| Business | 15,636 | 24.2% |
| Education | 8,486 | 13.1% |
| Literature & Languages | 2,177 | 3.4% |
| Liberal Arts & History | 3,122 | 4.8% |
| Visual & Performing Arts | 1,893 | 2.9% |
| Communications | 1,875 | 2.9% |
| Arts & Humanities | 5,837 | 9.0% |
| Total | 64,673 | 100.0% |
Transportation & Commute in St. Lucie County
Vehicle Availability by Sex in St. Lucie County
The most prevalent vehicle ownership categories in St. Lucie County are males with 2 vehicles (34,155, accounting for 45.9%) and females with 2 vehicles (27,177, making up 50.0%).
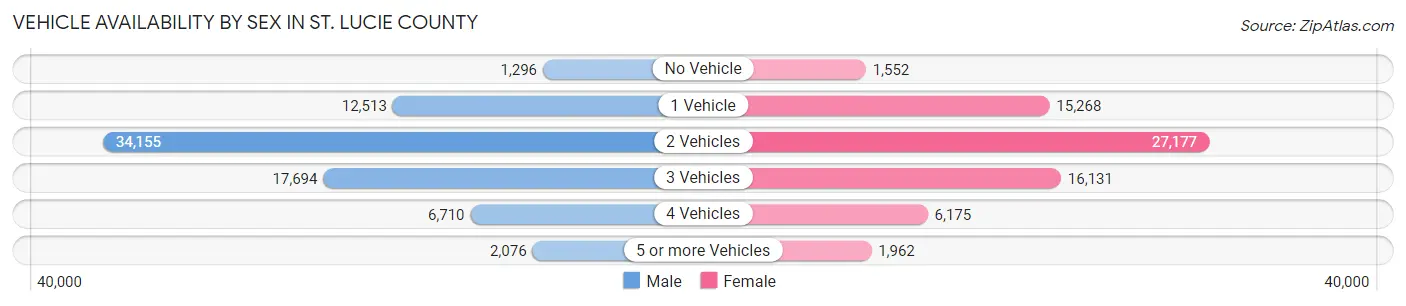
| Vehicles Available | Male | Female |
| No Vehicle | 1,296 (1.7%) | 1,552 (2.3%) |
| 1 Vehicle | 12,513 (16.8%) | 15,268 (22.4%) |
| 2 Vehicles | 34,155 (45.9%) | 27,177 (39.8%) |
| 3 Vehicles | 17,694 (23.8%) | 16,131 (23.6%) |
| 4 Vehicles | 6,710 (9.0%) | 6,175 (9.0%) |
| 5 or more Vehicles | 2,076 (2.8%) | 1,962 (2.9%) |
| Total | 74,444 (100.0%) | 68,265 (100.0%) |
Commute Time in St. Lucie County
The most frequently occuring commute durations in St. Lucie County are 30 to 34 minutes (23,522 commuters, 18.0%), 15 to 19 minutes (21,566 commuters, 16.6%), and 20 to 24 minutes (20,833 commuters, 16.0%).
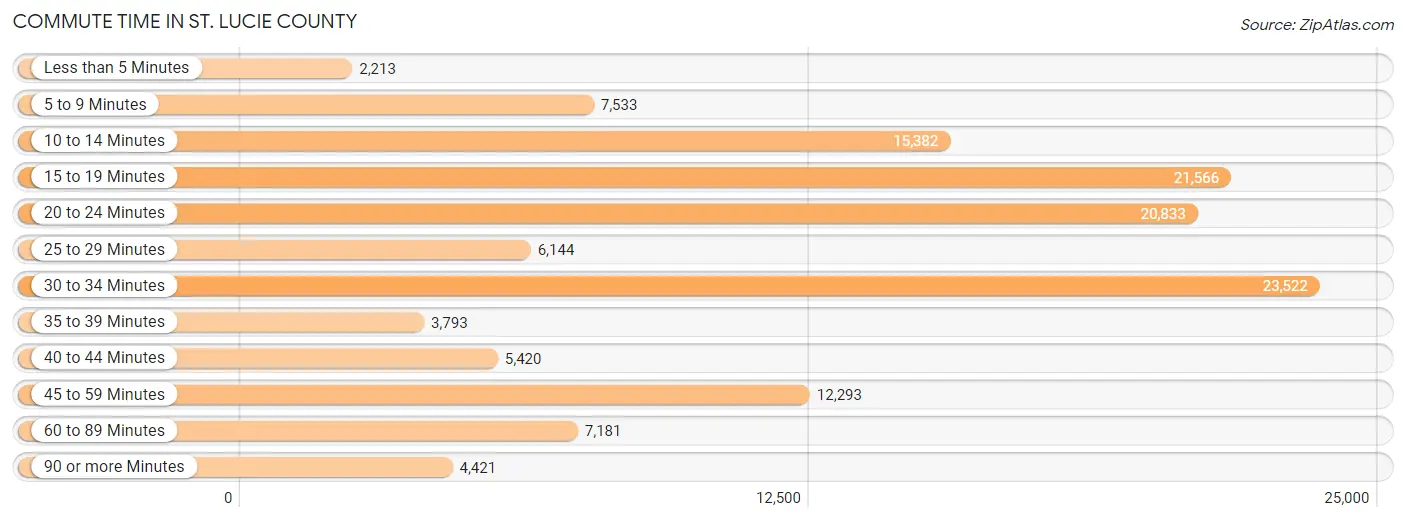
| Commute Time | # Commuters | % Commuters |
| Less than 5 Minutes | 2,213 | 1.7% |
| 5 to 9 Minutes | 7,533 | 5.8% |
| 10 to 14 Minutes | 15,382 | 11.8% |
| 15 to 19 Minutes | 21,566 | 16.6% |
| 20 to 24 Minutes | 20,833 | 16.0% |
| 25 to 29 Minutes | 6,144 | 4.7% |
| 30 to 34 Minutes | 23,522 | 18.0% |
| 35 to 39 Minutes | 3,793 | 2.9% |
| 40 to 44 Minutes | 5,420 | 4.2% |
| 45 to 59 Minutes | 12,293 | 9.4% |
| 60 to 89 Minutes | 7,181 | 5.5% |
| 90 or more Minutes | 4,421 | 3.4% |
Commute Time by Sex in St. Lucie County
The most common commute times in St. Lucie County are 30 to 34 minutes (13,042 commuters, 18.9%) for males and 15 to 19 minutes (11,078 commuters, 18.1%) for females.
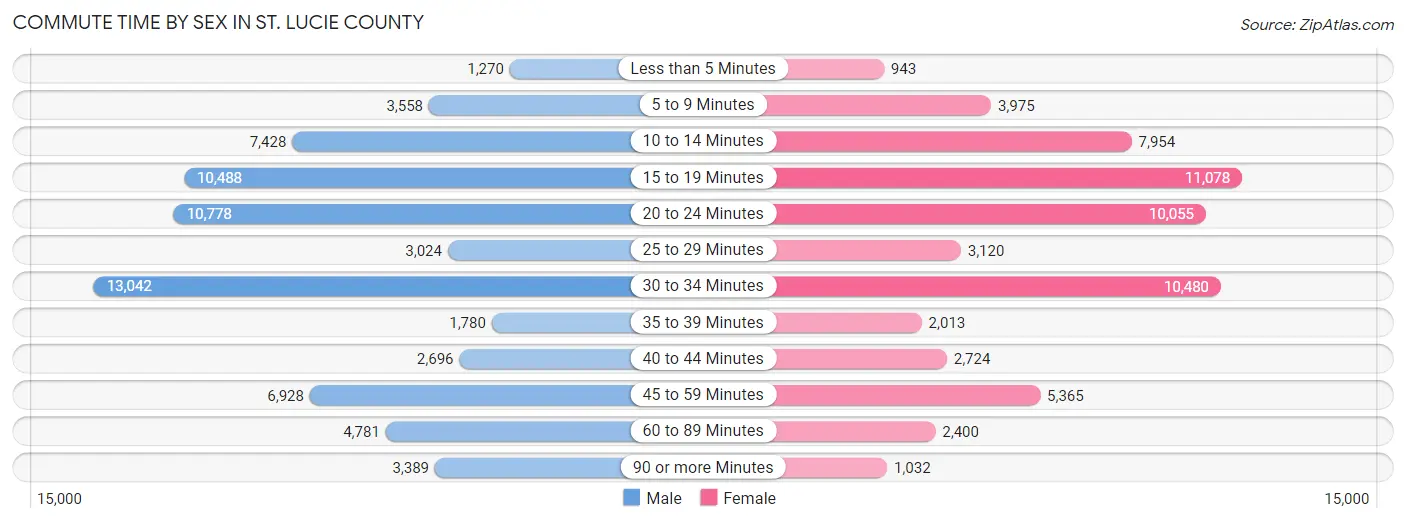
| Commute Time | Male | Female |
| Less than 5 Minutes | 1,270 (1.8%) | 943 (1.5%) |
| 5 to 9 Minutes | 3,558 (5.1%) | 3,975 (6.5%) |
| 10 to 14 Minutes | 7,428 (10.7%) | 7,954 (13.0%) |
| 15 to 19 Minutes | 10,488 (15.2%) | 11,078 (18.1%) |
| 20 to 24 Minutes | 10,778 (15.6%) | 10,055 (16.5%) |
| 25 to 29 Minutes | 3,024 (4.4%) | 3,120 (5.1%) |
| 30 to 34 Minutes | 13,042 (18.9%) | 10,480 (17.1%) |
| 35 to 39 Minutes | 1,780 (2.6%) | 2,013 (3.3%) |
| 40 to 44 Minutes | 2,696 (3.9%) | 2,724 (4.5%) |
| 45 to 59 Minutes | 6,928 (10.0%) | 5,365 (8.8%) |
| 60 to 89 Minutes | 4,781 (6.9%) | 2,400 (3.9%) |
| 90 or more Minutes | 3,389 (4.9%) | 1,032 (1.7%) |
Time of Departure to Work by Sex in St. Lucie County
The most frequent times of departure to work in St. Lucie County are 7:00 AM to 7:29 AM (10,376, 15.0%) for males and 8:00 AM to 8:29 AM (8,627, 14.1%) for females.
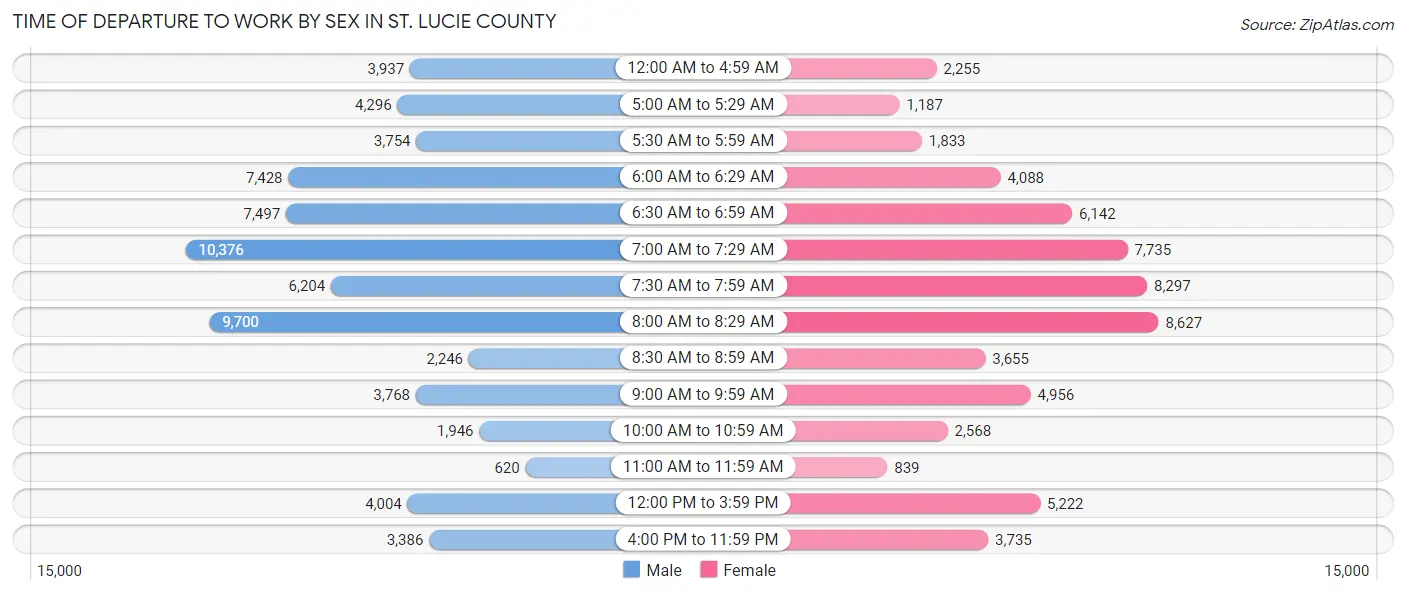
| Time of Departure | Male | Female |
| 12:00 AM to 4:59 AM | 3,937 (5.7%) | 2,255 (3.7%) |
| 5:00 AM to 5:29 AM | 4,296 (6.2%) | 1,187 (1.9%) |
| 5:30 AM to 5:59 AM | 3,754 (5.4%) | 1,833 (3.0%) |
| 6:00 AM to 6:29 AM | 7,428 (10.7%) | 4,088 (6.7%) |
| 6:30 AM to 6:59 AM | 7,497 (10.8%) | 6,142 (10.1%) |
| 7:00 AM to 7:29 AM | 10,376 (15.0%) | 7,735 (12.7%) |
| 7:30 AM to 7:59 AM | 6,204 (9.0%) | 8,297 (13.6%) |
| 8:00 AM to 8:29 AM | 9,700 (14.0%) | 8,627 (14.1%) |
| 8:30 AM to 8:59 AM | 2,246 (3.3%) | 3,655 (6.0%) |
| 9:00 AM to 9:59 AM | 3,768 (5.4%) | 4,956 (8.1%) |
| 10:00 AM to 10:59 AM | 1,946 (2.8%) | 2,568 (4.2%) |
| 11:00 AM to 11:59 AM | 620 (0.9%) | 839 (1.4%) |
| 12:00 PM to 3:59 PM | 4,004 (5.8%) | 5,222 (8.5%) |
| 4:00 PM to 11:59 PM | 3,386 (4.9%) | 3,735 (6.1%) |
| Total | 69,162 (100.0%) | 61,139 (100.0%) |
Housing Occupancy in St. Lucie County
Occupancy by Ownership in St. Lucie County
Of the total 126,443 dwellings in St. Lucie County, owner-occupied units account for 97,475 (77.1%), while renter-occupied units make up 28,968 (22.9%).
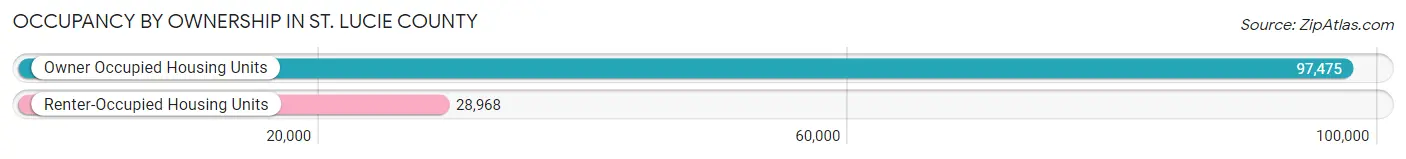
| Occupancy | # Housing Units | % Housing Units |
| Owner Occupied Housing Units | 97,475 | 77.1% |
| Renter-Occupied Housing Units | 28,968 | 22.9% |
| Total Occupied Housing Units | 126,443 | 100.0% |
Occupancy by Household Size in St. Lucie County
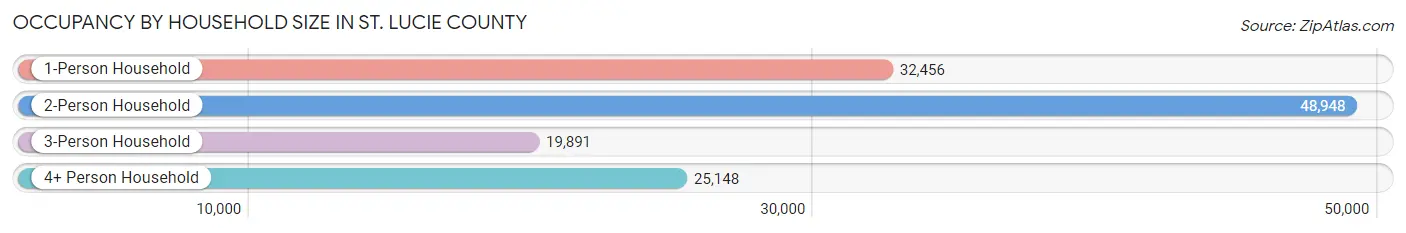
| Household Size | # Housing Units | % Housing Units |
| 1-Person Household | 32,456 | 25.7% |
| 2-Person Household | 48,948 | 38.7% |
| 3-Person Household | 19,891 | 15.7% |
| 4+ Person Household | 25,148 | 19.9% |
| Total Housing Units | 126,443 | 100.0% |
Occupancy by Ownership by Household Size in St. Lucie County
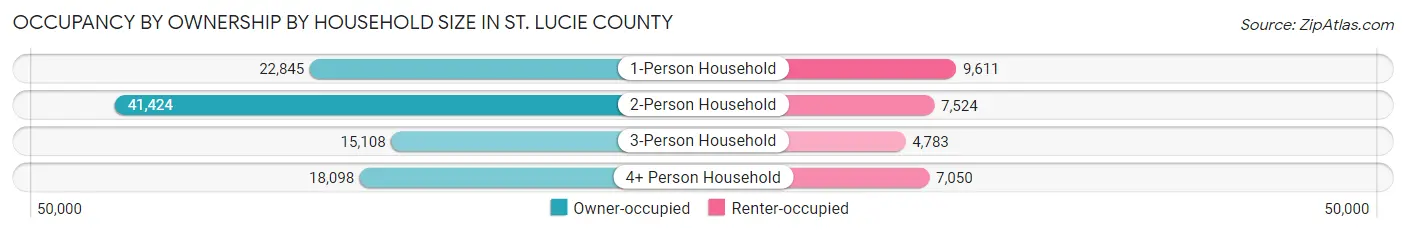
| Household Size | Owner-occupied | Renter-occupied |
| 1-Person Household | 22,845 (70.4%) | 9,611 (29.6%) |
| 2-Person Household | 41,424 (84.6%) | 7,524 (15.4%) |
| 3-Person Household | 15,108 (75.9%) | 4,783 (24.0%) |
| 4+ Person Household | 18,098 (72.0%) | 7,050 (28.0%) |
| Total Housing Units | 97,475 (77.1%) | 28,968 (22.9%) |
Occupancy by Educational Attainment in St. Lucie County
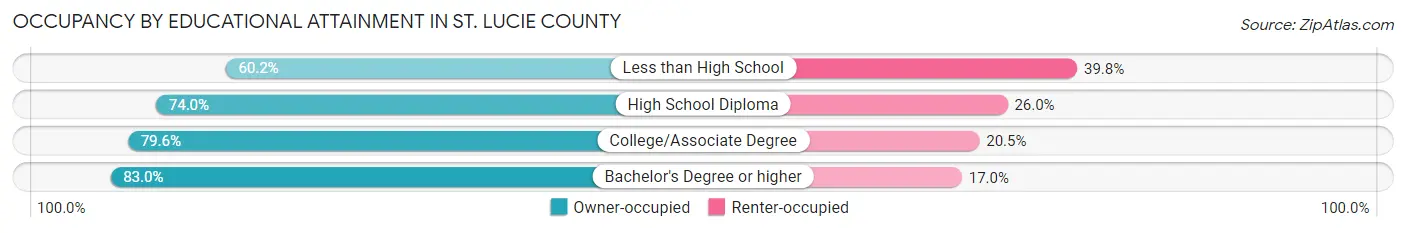
| Household Size | Owner-occupied | Renter-occupied |
| Less than High School | 7,722 (60.2%) | 5,112 (39.8%) |
| High School Diploma | 24,088 (74.0%) | 8,478 (26.0%) |
| College/Associate Degree | 37,142 (79.5%) | 9,546 (20.4%) |
| Bachelor's Degree or higher | 28,523 (83.0%) | 5,832 (17.0%) |
Occupancy by Age of Householder in St. Lucie County
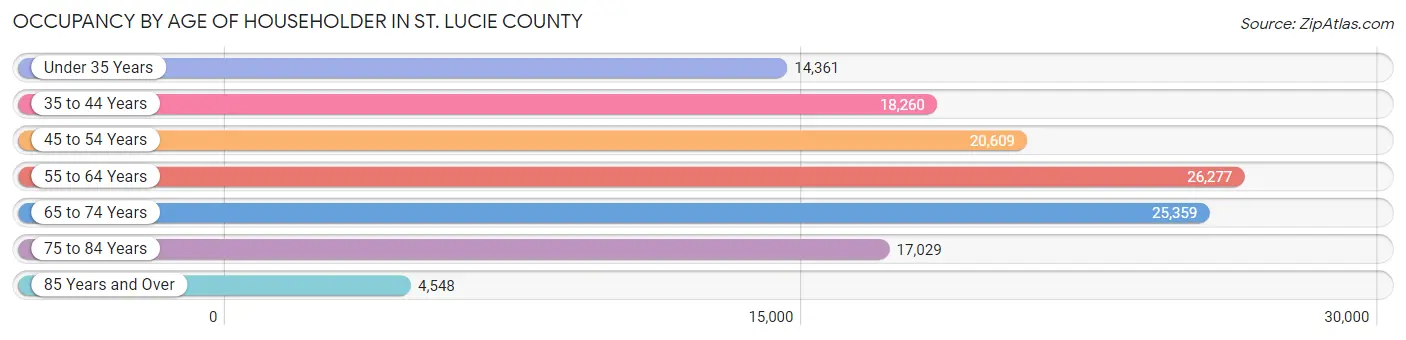
| Age Bracket | # Households | % Households |
| Under 35 Years | 14,361 | 11.4% |
| 35 to 44 Years | 18,260 | 14.4% |
| 45 to 54 Years | 20,609 | 16.3% |
| 55 to 64 Years | 26,277 | 20.8% |
| 65 to 74 Years | 25,359 | 20.1% |
| 75 to 84 Years | 17,029 | 13.5% |
| 85 Years and Over | 4,548 | 3.6% |
| Total | 126,443 | 100.0% |
Housing Finances in St. Lucie County
Median Income by Occupancy in St. Lucie County
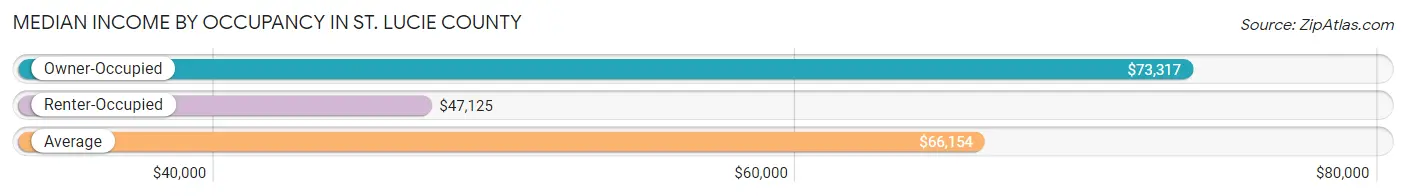
| Occupancy Type | # Households | Median Income |
| Owner-Occupied | 97,475 (77.1%) | $73,317 |
| Renter-Occupied | 28,968 (22.9%) | $47,125 |
| Average | 126,443 (100.0%) | $66,154 |
Occupancy by Householder Income Bracket in St. Lucie County
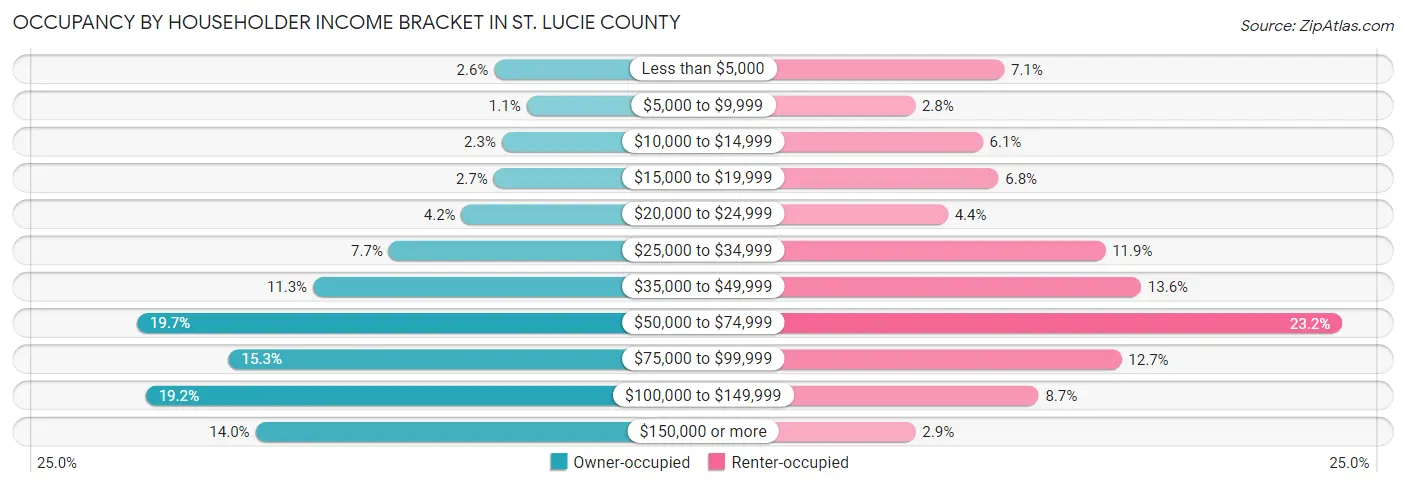
| Income Bracket | Owner-occupied | Renter-occupied |
| Less than $5,000 | 2,577 (2.6%) | 2,048 (7.1%) |
| $5,000 to $9,999 | 1,077 (1.1%) | 819 (2.8%) |
| $10,000 to $14,999 | 2,227 (2.3%) | 1,753 (6.0%) |
| $15,000 to $19,999 | 2,598 (2.7%) | 1,969 (6.8%) |
| $20,000 to $24,999 | 4,097 (4.2%) | 1,271 (4.4%) |
| $25,000 to $34,999 | 7,466 (7.7%) | 3,443 (11.9%) |
| $35,000 to $49,999 | 10,982 (11.3%) | 3,938 (13.6%) |
| $50,000 to $74,999 | 19,149 (19.7%) | 6,712 (23.2%) |
| $75,000 to $99,999 | 14,899 (15.3%) | 3,668 (12.7%) |
| $100,000 to $149,999 | 18,744 (19.2%) | 2,522 (8.7%) |
| $150,000 or more | 13,659 (14.0%) | 825 (2.9%) |
| Total | 97,475 (100.0%) | 28,968 (100.0%) |
Monthly Housing Cost Tiers in St. Lucie County
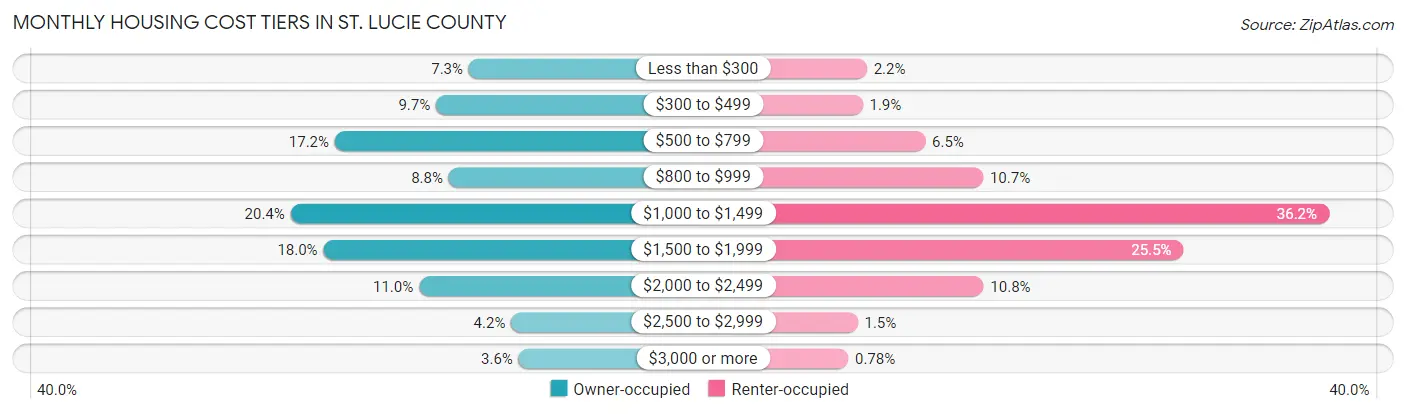
| Monthly Cost | Owner-occupied | Renter-occupied |
| Less than $300 | 7,099 (7.3%) | 626 (2.2%) |
| $300 to $499 | 9,456 (9.7%) | 536 (1.8%) |
| $500 to $799 | 16,716 (17.2%) | 1,871 (6.5%) |
| $800 to $999 | 8,537 (8.8%) | 3,106 (10.7%) |
| $1,000 to $1,499 | 19,891 (20.4%) | 10,483 (36.2%) |
| $1,500 to $1,999 | 17,533 (18.0%) | 7,381 (25.5%) |
| $2,000 to $2,499 | 10,671 (11.0%) | 3,113 (10.7%) |
| $2,500 to $2,999 | 4,052 (4.2%) | 428 (1.5%) |
| $3,000 or more | 3,520 (3.6%) | 227 (0.8%) |
| Total | 97,475 (100.0%) | 28,968 (100.0%) |
Physical Housing Characteristics in St. Lucie County
Housing Structures in St. Lucie County
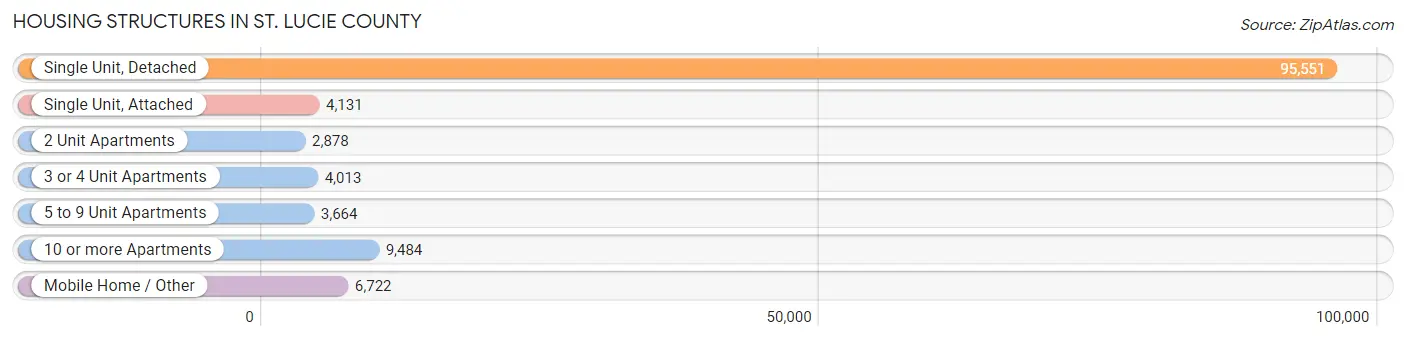
| Structure Type | # Housing Units | % Housing Units |
| Single Unit, Detached | 95,551 | 75.6% |
| Single Unit, Attached | 4,131 | 3.3% |
| 2 Unit Apartments | 2,878 | 2.3% |
| 3 or 4 Unit Apartments | 4,013 | 3.2% |
| 5 to 9 Unit Apartments | 3,664 | 2.9% |
| 10 or more Apartments | 9,484 | 7.5% |
| Mobile Home / Other | 6,722 | 5.3% |
| Total | 126,443 | 100.0% |
Housing Structures by Occupancy in St. Lucie County
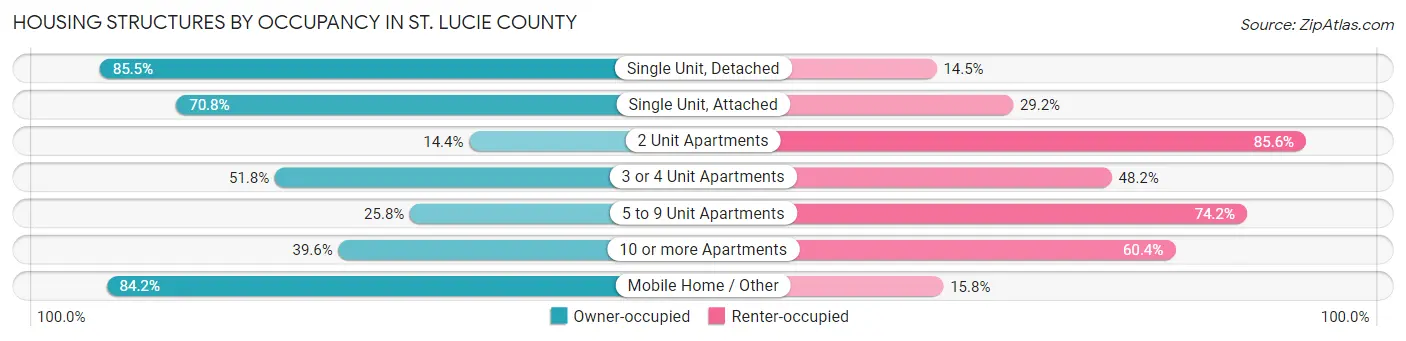
| Structure Type | Owner-occupied | Renter-occupied |
| Single Unit, Detached | 81,703 (85.5%) | 13,848 (14.5%) |
| Single Unit, Attached | 2,924 (70.8%) | 1,207 (29.2%) |
| 2 Unit Apartments | 414 (14.4%) | 2,464 (85.6%) |
| 3 or 4 Unit Apartments | 2,078 (51.8%) | 1,935 (48.2%) |
| 5 to 9 Unit Apartments | 944 (25.8%) | 2,720 (74.2%) |
| 10 or more Apartments | 3,752 (39.6%) | 5,732 (60.4%) |
| Mobile Home / Other | 5,660 (84.2%) | 1,062 (15.8%) |
| Total | 97,475 (77.1%) | 28,968 (22.9%) |
Housing Structures by Number of Rooms in St. Lucie County
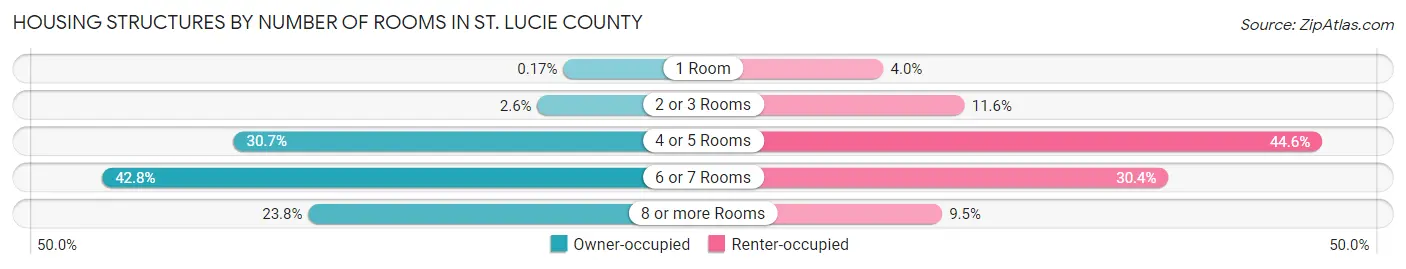
| Number of Rooms | Owner-occupied | Renter-occupied |
| 1 Room | 164 (0.2%) | 1,171 (4.0%) |
| 2 or 3 Rooms | 2,507 (2.6%) | 3,346 (11.6%) |
| 4 or 5 Rooms | 29,900 (30.7%) | 12,915 (44.6%) |
| 6 or 7 Rooms | 41,742 (42.8%) | 8,797 (30.4%) |
| 8 or more Rooms | 23,162 (23.8%) | 2,739 (9.5%) |
| Total | 97,475 (100.0%) | 28,968 (100.0%) |
Housing Structure by Heating Type in St. Lucie County
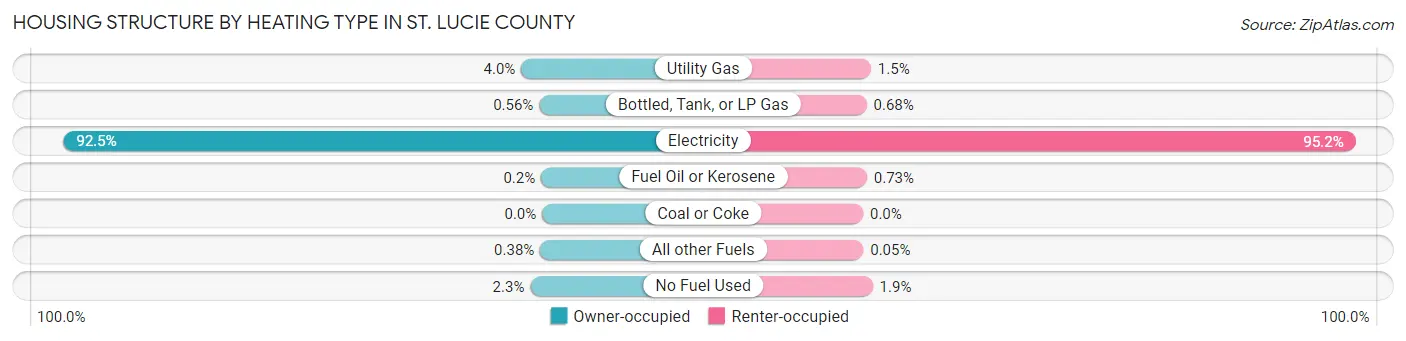
| Heating Type | Owner-occupied | Renter-occupied |
| Utility Gas | 3,937 (4.0%) | 441 (1.5%) |
| Bottled, Tank, or LP Gas | 549 (0.6%) | 198 (0.7%) |
| Electricity | 90,182 (92.5%) | 27,565 (95.2%) |
| Fuel Oil or Kerosene | 199 (0.2%) | 211 (0.7%) |
| Coal or Coke | 0 (0.0%) | 0 (0.0%) |
| All other Fuels | 372 (0.4%) | 15 (0.1%) |
| No Fuel Used | 2,236 (2.3%) | 538 (1.9%) |
| Total | 97,475 (100.0%) | 28,968 (100.0%) |
Household Vehicle Usage in St. Lucie County
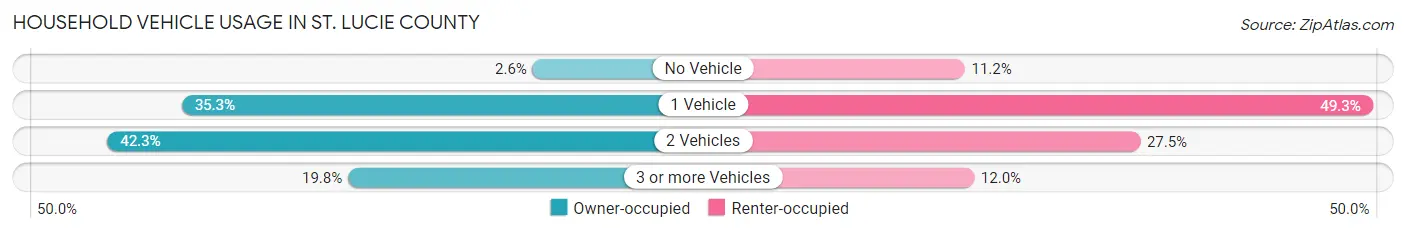
| Vehicles per Household | Owner-occupied | Renter-occupied |
| No Vehicle | 2,509 (2.6%) | 3,235 (11.2%) |
| 1 Vehicle | 34,439 (35.3%) | 14,268 (49.2%) |
| 2 Vehicles | 41,215 (42.3%) | 7,977 (27.5%) |
| 3 or more Vehicles | 19,312 (19.8%) | 3,488 (12.0%) |
| Total | 97,475 (100.0%) | 28,968 (100.0%) |
Real Estate & Mortgages in St. Lucie County
Real Estate and Mortgage Overview in St. Lucie County
| Characteristic | Without Mortgage | With Mortgage |
| Housing Units | 42,184 | 55,291 |
| Median Property Value | $245,800 | $294,300 |
| Median Household Income | $54,478 | $9,395 |
| Monthly Housing Costs | $595 | $3,403 |
| Real Estate Taxes | $2,389 | $1,440 |
Property Value by Mortgage Status in St. Lucie County
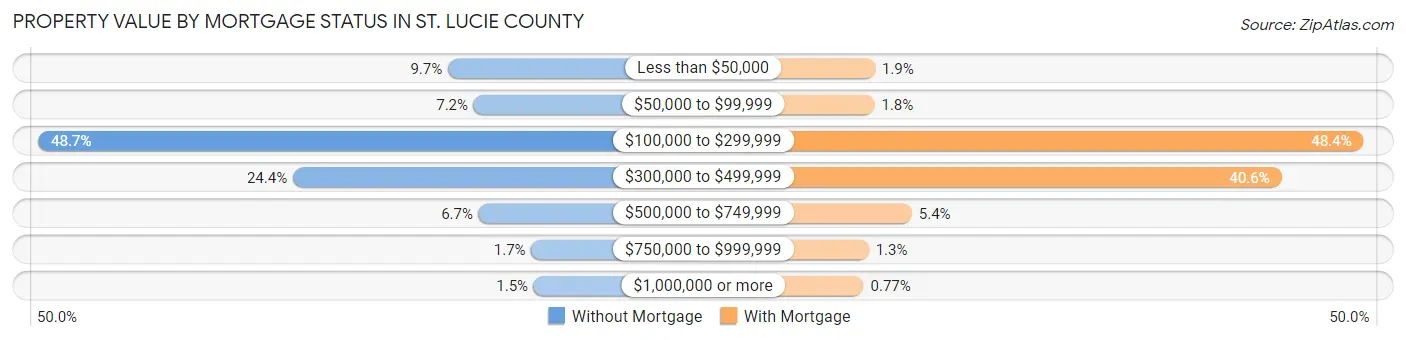
| Property Value | Without Mortgage | With Mortgage |
| Less than $50,000 | 4,079 (9.7%) | 1,021 (1.8%) |
| $50,000 to $99,999 | 3,041 (7.2%) | 1,002 (1.8%) |
| $100,000 to $299,999 | 20,548 (48.7%) | 26,750 (48.4%) |
| $300,000 to $499,999 | 10,311 (24.4%) | 22,438 (40.6%) |
| $500,000 to $749,999 | 2,844 (6.7%) | 2,963 (5.4%) |
| $750,000 to $999,999 | 731 (1.7%) | 692 (1.3%) |
| $1,000,000 or more | 630 (1.5%) | 425 (0.8%) |
| Total | 42,184 (100.0%) | 55,291 (100.0%) |
Household Income by Mortgage Status in St. Lucie County
| Household Income | Without Mortgage | With Mortgage |
| Less than $10,000 | 2,283 (5.4%) | 827 (1.5%) |
| $10,000 to $24,999 | 6,234 (14.8%) | 1,371 (2.5%) |
| $25,000 to $34,999 | 4,706 (11.2%) | 2,688 (4.9%) |
| $35,000 to $49,999 | 5,944 (14.1%) | 2,760 (5.0%) |
| $50,000 to $74,999 | 8,148 (19.3%) | 5,038 (9.1%) |
| $75,000 to $99,999 | 5,414 (12.8%) | 11,001 (19.9%) |
| $100,000 to $149,999 | 5,191 (12.3%) | 9,485 (17.2%) |
| $150,000 or more | 4,264 (10.1%) | 13,553 (24.5%) |
| Total | 42,184 (100.0%) | 55,291 (100.0%) |
Property Value to Household Income Ratio in St. Lucie County
| Value-to-Income Ratio | Without Mortgage | With Mortgage |
| Less than 2.0x | 9,665 (22.9%) | 87,497 (158.3%) |
| 2.0x to 2.9x | 5,863 (13.9%) | 10,836 (19.6%) |
| 3.0x to 3.9x | 5,748 (13.6%) | 13,463 (24.3%) |
| 4.0x or more | 20,115 (47.7%) | 9,532 (17.2%) |
| Total | 42,184 (100.0%) | 55,291 (100.0%) |
Real Estate Taxes by Mortgage Status in St. Lucie County
| Property Taxes | Without Mortgage | With Mortgage |
| Less than $800 | 6,203 (14.7%) | 380 (0.7%) |
| $800 to $1,499 | 6,170 (14.6%) | 2,188 (4.0%) |
| $800 to $1,499 | 26,062 (61.8%) | 7,060 (12.8%) |
| Total | 42,184 (100.0%) | 55,291 (100.0%) |
Health & Disability in St. Lucie County
Health Insurance Coverage by Age in St. Lucie County
| Age Bracket | With Coverage | Without Coverage |
| Under 6 Years | 18,378 (93.4%) | 1,288 (6.6%) |
| 6 to 18 Years | 44,387 (90.3%) | 4,777 (9.7%) |
| 19 to 25 Years | 17,950 (74.9%) | 6,017 (25.1%) |
| 26 to 34 Years | 26,618 (76.7%) | 8,063 (23.3%) |
| 35 to 44 Years | 29,072 (78.1%) | 8,166 (21.9%) |
| 45 to 54 Years | 32,768 (82.1%) | 7,142 (17.9%) |
| 55 to 64 Years | 41,132 (87.6%) | 5,807 (12.4%) |
| 65 to 74 Years | 44,006 (99.3%) | 312 (0.7%) |
| 75 Years and older | 35,921 (99.5%) | 189 (0.5%) |
| Total | 290,232 (87.4%) | 41,761 (12.6%) |
Health Insurance Coverage by Citizenship Status in St. Lucie County
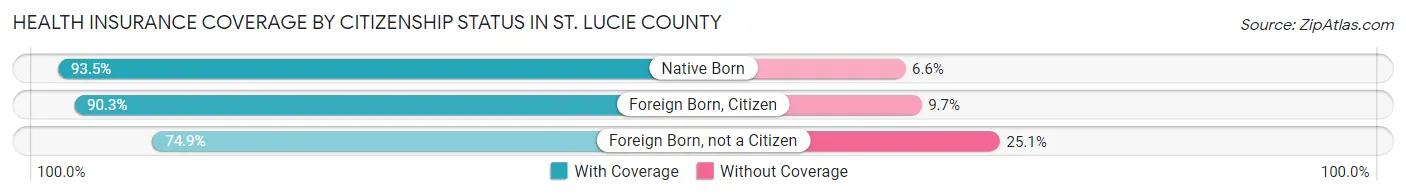
| Citizenship Status | With Coverage | Without Coverage |
| Native Born | 18,378 (93.4%) | 1,288 (6.6%) |
| Foreign Born, Citizen | 44,387 (90.3%) | 4,777 (9.7%) |
| Foreign Born, not a Citizen | 17,950 (74.9%) | 6,017 (25.1%) |
Health Insurance Coverage by Household Income in St. Lucie County
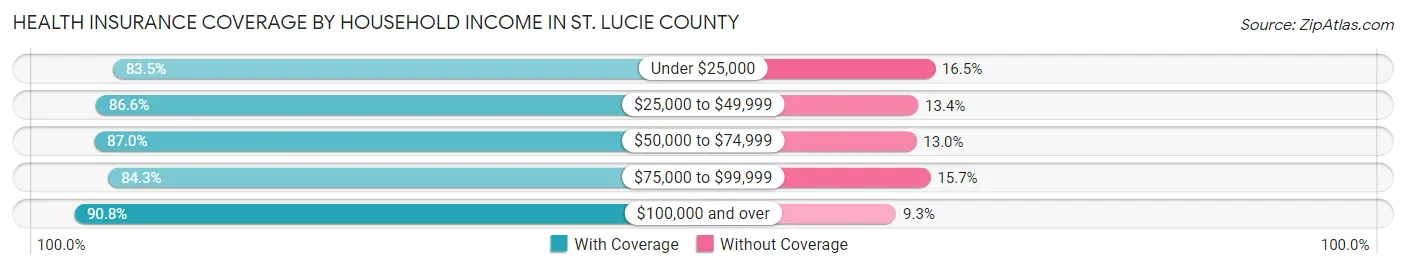
| Household Income | With Coverage | Without Coverage |
| Under $25,000 | 30,220 (83.5%) | 5,981 (16.5%) |
| $25,000 to $49,999 | 50,934 (86.6%) | 7,854 (13.4%) |
| $50,000 to $74,999 | 57,441 (87.0%) | 8,607 (13.0%) |
| $75,000 to $99,999 | 45,362 (84.3%) | 8,426 (15.7%) |
| $100,000 and over | 105,535 (90.7%) | 10,752 (9.2%) |
Public vs Private Health Insurance Coverage by Age in St. Lucie County
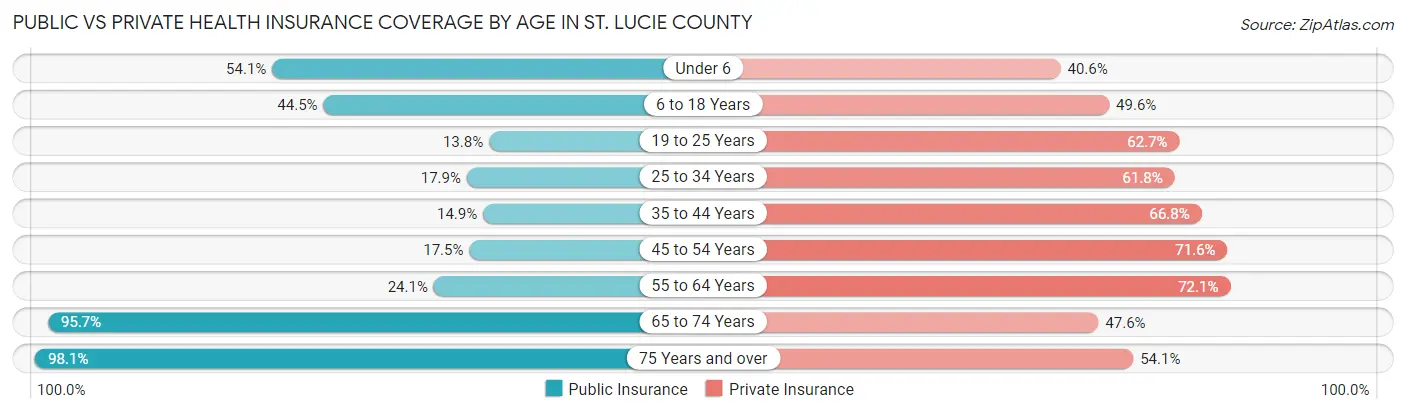
| Age Bracket | Public Insurance | Private Insurance |
| Under 6 | 10,629 (54.0%) | 7,986 (40.6%) |
| 6 to 18 Years | 21,898 (44.5%) | 24,401 (49.6%) |
| 19 to 25 Years | 3,307 (13.8%) | 15,018 (62.7%) |
| 25 to 34 Years | 6,214 (17.9%) | 21,424 (61.8%) |
| 35 to 44 Years | 5,548 (14.9%) | 24,865 (66.8%) |
| 45 to 54 Years | 6,967 (17.5%) | 28,562 (71.6%) |
| 55 to 64 Years | 11,292 (24.1%) | 33,836 (72.1%) |
| 65 to 74 Years | 42,403 (95.7%) | 21,108 (47.6%) |
| 75 Years and over | 35,411 (98.1%) | 19,537 (54.1%) |
| Total | 143,669 (43.3%) | 196,737 (59.3%) |
Disability Status by Sex by Age in St. Lucie County
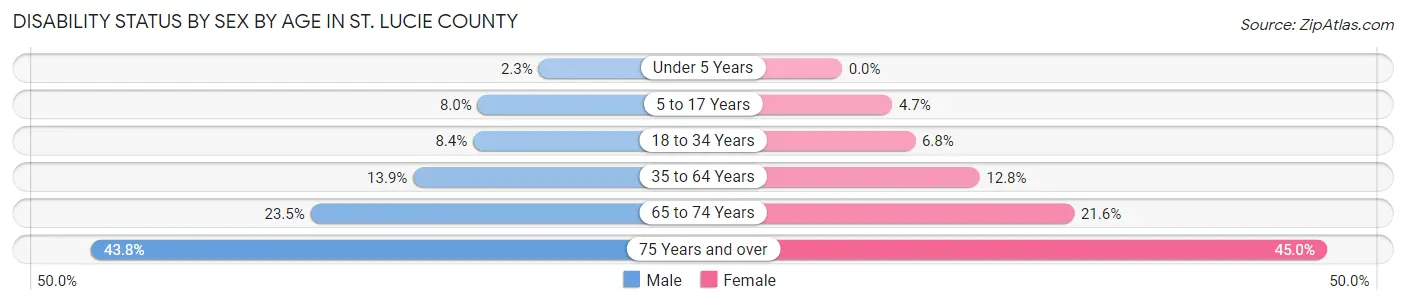
| Age Bracket | Male | Female |
| Under 5 Years | 194 (2.3%) | 0 (0.0%) |
| 5 to 17 Years | 2,018 (8.0%) | 1,110 (4.7%) |
| 18 to 34 Years | 2,625 (8.4%) | 2,074 (6.8%) |
| 35 to 64 Years | 8,371 (13.9%) | 8,174 (12.8%) |
| 65 to 74 Years | 4,868 (23.5%) | 5,080 (21.5%) |
| 75 Years and over | 7,459 (43.8%) | 8,593 (45.0%) |
Disability Class by Sex by Age in St. Lucie County
Disability Class: Hearing Difficulty
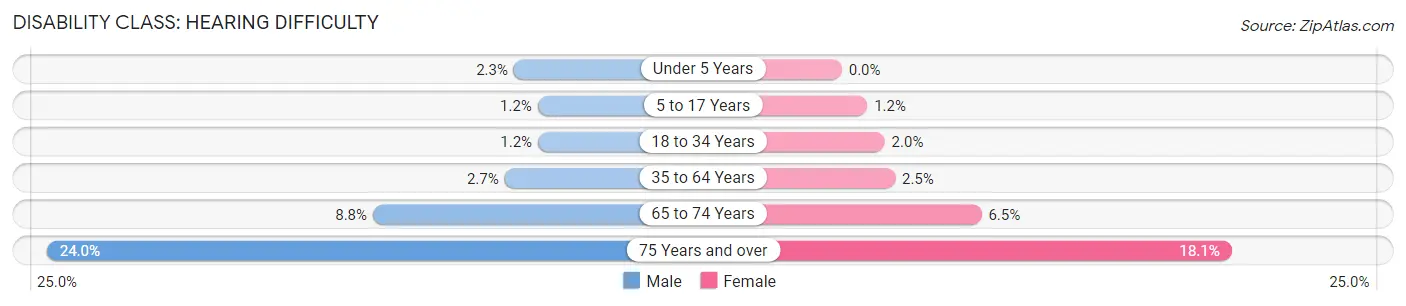
| Age Bracket | Male | Female |
| Under 5 Years | 194 (2.3%) | 0 (0.0%) |
| 5 to 17 Years | 302 (1.2%) | 282 (1.2%) |
| 18 to 34 Years | 371 (1.2%) | 607 (2.0%) |
| 35 to 64 Years | 1,638 (2.7%) | 1,582 (2.5%) |
| 65 to 74 Years | 1,834 (8.8%) | 1,528 (6.5%) |
| 75 Years and over | 4,080 (24.0%) | 3,453 (18.1%) |
Disability Class: Vision Difficulty
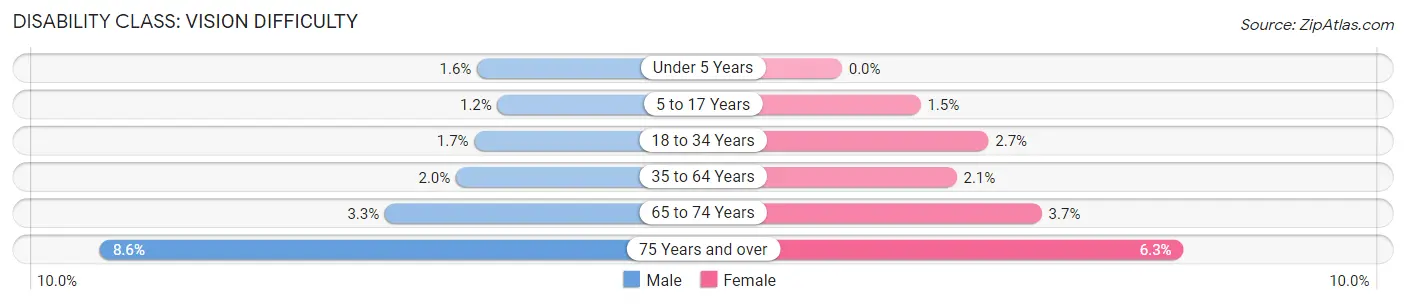
| Age Bracket | Male | Female |
| Under 5 Years | 135 (1.6%) | 0 (0.0%) |
| 5 to 17 Years | 310 (1.2%) | 348 (1.5%) |
| 18 to 34 Years | 518 (1.7%) | 831 (2.7%) |
| 35 to 64 Years | 1,196 (2.0%) | 1,362 (2.1%) |
| 65 to 74 Years | 687 (3.3%) | 875 (3.7%) |
| 75 Years and over | 1,464 (8.6%) | 1,210 (6.3%) |
Disability Class: Cognitive Difficulty
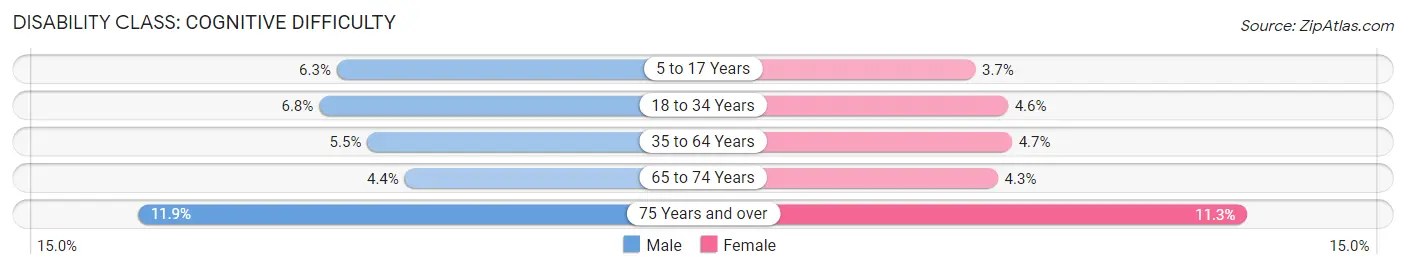
| Age Bracket | Male | Female |
| 5 to 17 Years | 1,601 (6.3%) | 884 (3.7%) |
| 18 to 34 Years | 2,131 (6.8%) | 1,411 (4.6%) |
| 35 to 64 Years | 3,281 (5.5%) | 3,028 (4.7%) |
| 65 to 74 Years | 918 (4.4%) | 1,023 (4.3%) |
| 75 Years and over | 2,016 (11.8%) | 2,156 (11.3%) |
Disability Class: Ambulatory Difficulty
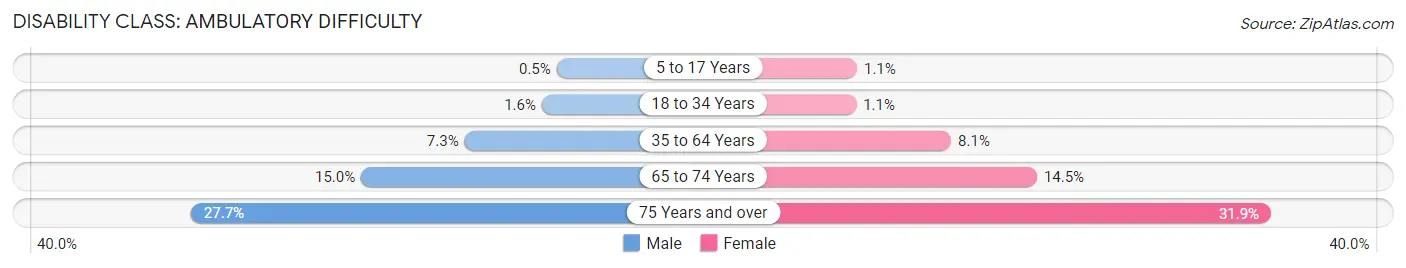
| Age Bracket | Male | Female |
| 5 to 17 Years | 127 (0.5%) | 269 (1.1%) |
| 18 to 34 Years | 500 (1.6%) | 328 (1.1%) |
| 35 to 64 Years | 4,406 (7.3%) | 5,198 (8.1%) |
| 65 to 74 Years | 3,116 (15.0%) | 3,415 (14.5%) |
| 75 Years and over | 4,706 (27.7%) | 6,083 (31.9%) |
Disability Class: Self-Care Difficulty
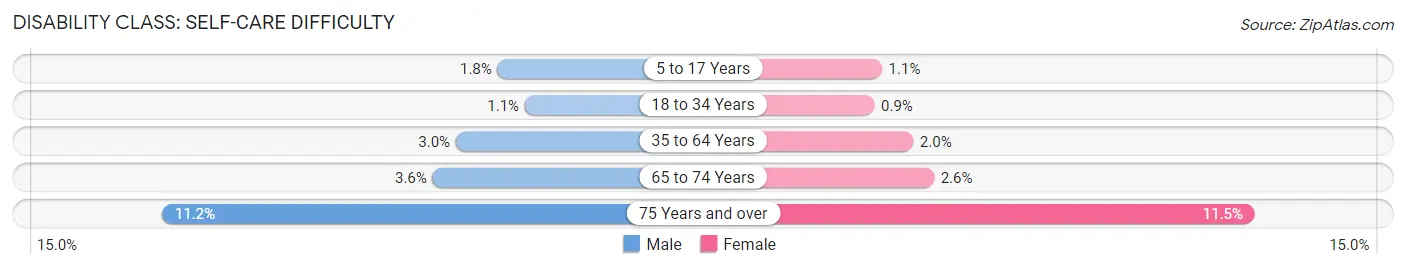
| Age Bracket | Male | Female |
| 5 to 17 Years | 464 (1.8%) | 264 (1.1%) |
| 18 to 34 Years | 335 (1.1%) | 274 (0.9%) |
| 35 to 64 Years | 1,797 (3.0%) | 1,265 (2.0%) |
| 65 to 74 Years | 756 (3.6%) | 604 (2.6%) |
| 75 Years and over | 1,902 (11.2%) | 2,196 (11.5%) |
Technology Access in St. Lucie County
Computing Device Access in St. Lucie County
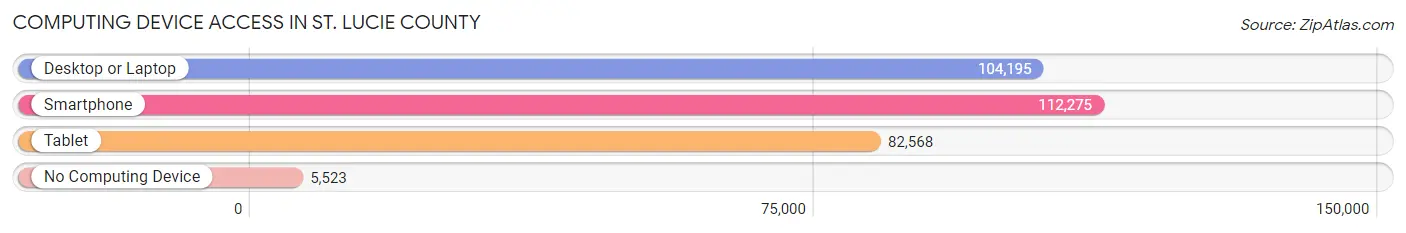
| Device Type | # Households | % Households |
| Desktop or Laptop | 104,195 | 82.4% |
| Smartphone | 112,275 | 88.8% |
| Tablet | 82,568 | 65.3% |
| No Computing Device | 5,523 | 4.4% |
| Total | 126,443 | 100.0% |
Internet Access in St. Lucie County
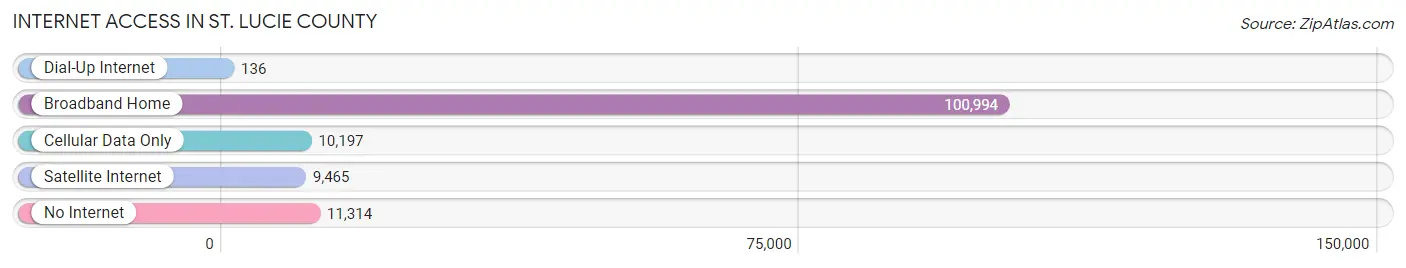
| Internet Type | # Households | % Households |
| Dial-Up Internet | 136 | 0.1% |
| Broadband Home | 100,994 | 79.9% |
| Cellular Data Only | 10,197 | 8.1% |
| Satellite Internet | 9,465 | 7.5% |
| No Internet | 11,314 | 8.9% |
| Total | 126,443 | 100.0% |
St. Lucie County Summary
St. Lucie County is located in the east-central part of the state of Florida, along the Atlantic Coast. It is part of the Treasure Coast region, and is bordered by Indian River County to the north, Martin County to the south, and Okeechobee County to the west. The county seat is Fort Pierce, and the largest city is Port St. Lucie.
History
St. Lucie County was created in 1905, when it was carved out of the southern portion of Brevard County. It was named for the St. Lucie River, which was named by Spanish explorers in the 16th century. The area was originally inhabited by the Ais and Jeaga tribes, and was later settled by Europeans in the 19th century. The county was largely agricultural until the 1950s, when the population began to grow rapidly due to the development of the aerospace industry in nearby Brevard County.
Geography
St. Lucie County covers an area of 658 square miles, of which 645 square miles is land and 13 square miles is water. The county is located on the Atlantic Coast, and is bordered by Indian River County to the north, Martin County to the south, and Okeechobee County to the west. The St. Lucie River forms the northern boundary of the county, and the Indian River Lagoon forms the eastern boundary. The county is home to several parks and preserves, including the St. Lucie Inlet Preserve State Park, the Savannas Preserve State Park, and the St. Lucie County Aquatic Preserve.
Economy
St. Lucie County has a diverse economy, with a mix of industries including tourism, manufacturing, agriculture, and technology. The county is home to several major employers, including the St. Lucie Nuclear Power Plant, the St. Lucie County School District, and the St. Lucie County Sheriff's Office. Tourism is a major industry in the county, with visitors drawn to the area's beaches, parks, and other attractions. Agriculture is also an important part of the local economy, with the county producing a variety of crops, including citrus, sugarcane, and vegetables.
Demographics
As of the 2010 census, St. Lucie County had a population of 277,789. The population was spread out, with 24.3% under the age of 18, 8.3% from 18 to 24, 28.2% from 25 to 44, 24.2% from 45 to 64, and 14.0% who were 65 years of age or older. The median age was 38.2 years. The racial makeup of the county was 74.2% White, 16.3% African American, 0.4% Native American, 2.2% Asian, 0.1% Pacific Islander, 4.2% from other races, and 2.6% from two or more races. Hispanic or Latino of any race were 15.3% of the population.
St. Lucie County is a diverse and vibrant community, with a rich history and a bright future. The county is home to a variety of industries, attractions, and activities, making it an ideal place to live, work, and play.
Common Questions
What is Per Capita Income in St. Lucie County?
Per Capita income in St. Lucie County is $33,847.
What is the Median Family Income in St. Lucie County?
Median Family Income in St. Lucie County is $75,649.
What is the Median Household income in St. Lucie County?
Median Household Income in St. Lucie County is $66,154.
What is Income or Wage Gap in St. Lucie County?
Income or Wage Gap in St. Lucie County is 23.3%.
Women in St. Lucie County earn 76.7 cents for every dollar earned by a man.
What is Family Income Deficit in St. Lucie County?
Family Income Deficit in St. Lucie County is $10,675.
Families that are below poverty line in St. Lucie County earn $10,675 less on average than the poverty threshold level.
What is Inequality or Gini Index in St. Lucie County?
Inequality or Gini Index in St. Lucie County is 0.44.
What is the Total Population of St. Lucie County?
Total Population of St. Lucie County is 334,682.
What is the Total Male Population of St. Lucie County?
Total Male Population of St. Lucie County is 164,702.
What is the Total Female Population of St. Lucie County?
Total Female Population of St. Lucie County is 169,980.
What is the Ratio of Males per 100 Females in St. Lucie County?
There are 96.89 Males per 100 Females in St. Lucie County.
What is the Ratio of Females per 100 Males in St. Lucie County?
There are 103.20 Females per 100 Males in St. Lucie County.
What is the Median Population Age in St. Lucie County?
Median Population Age in St. Lucie County is 45.3 Years.
What is the Average Family Size in St. Lucie County
Average Family Size in St. Lucie County is 3.1 People.
What is the Average Household Size in St. Lucie County
Average Household Size in St. Lucie County is 2.6 People.
How Large is the Labor Force in St. Lucie County?
There are 154,679 People in the Labor Forcein in St. Lucie County.
What is the Percentage of People in the Labor Force in St. Lucie County?
55.9% of People are in the Labor Force in St. Lucie County.
What is the Unemployment Rate in St. Lucie County?
Unemployment Rate in St. Lucie County is 6.0%.