Area Code 786 Map & Demographics
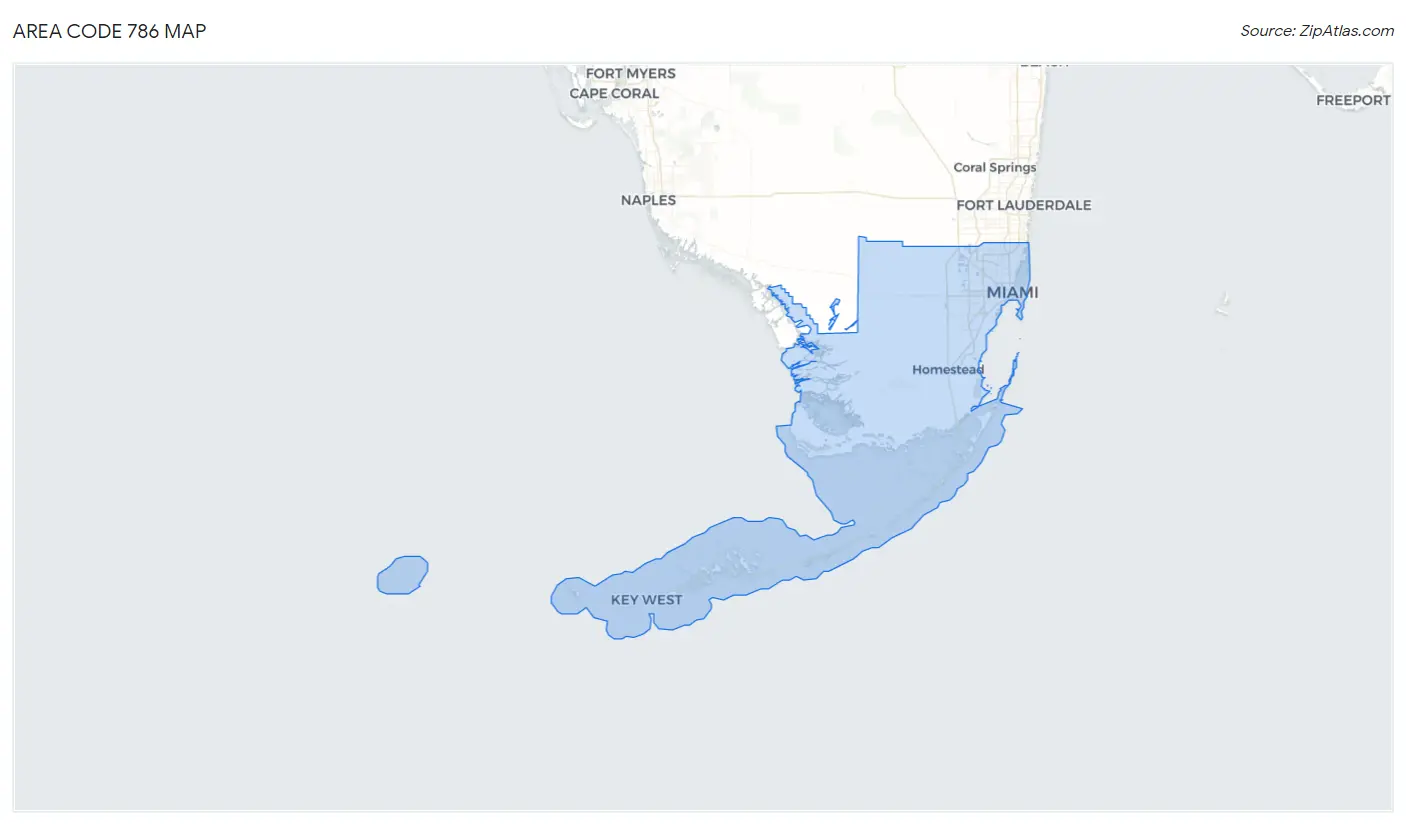
Area Code 786 Map
Area Code 786 Overview
$43,413
PER CAPITA INCOME
$84,905
AVG FAMILY INCOME
$74,219
AVG HOUSEHOLD INCOME
21.9%
WAGE / INCOME GAP [ % ]
78.1¢/ $1
WAGE / INCOME GAP [ $ ]
$9,778
FAMILY INCOME DEFICIT
33.53
INEQUALITY / GINI INDEX
2,474,918
TOTAL POPULATION
1,218,122
MALE POPULATION
1,256,796
FEMALE POPULATION
96.92
MALES / 100 FEMALES
103.17
FEMALES / 100 MALES
40.8
MEDIAN AGE
3.3
AVG FAMILY SIZE
2.8
AVG HOUSEHOLD SIZE
1,295,732
LABOR FORCE [ PEOPLE ]
63.6%
PERCENT IN LABOR FORCE
4.6%
UNEMPLOYMENT RATE
Income in Area Code 786
Income Overview in Area Code 786
Per Capita Income in Area Code 786 is $43,413, while median incomes of families and households are $84,905 and $74,219 respectively.
| Characteristic | Number | Measure |
| Per Capita Income | 2,474,918 | $43,413 |
| Median Family Income | 596,868 | $84,905 |
| Mean Family Income | 596,868 | $9,117,973 |
| Median Household Income | 877,251 | $74,219 |
| Mean Household Income | 877,251 | $8,059,863 |
| Income Deficit | 596,868 | $9,778 |
| Wage / Income Gap (%) | 2,474,918 | 21.95% |
| Wage / Income Gap ($) | 2,474,918 | 78.05¢ per $1 |
| Gini / Inequality Index | 2,474,918 | 33.53 |
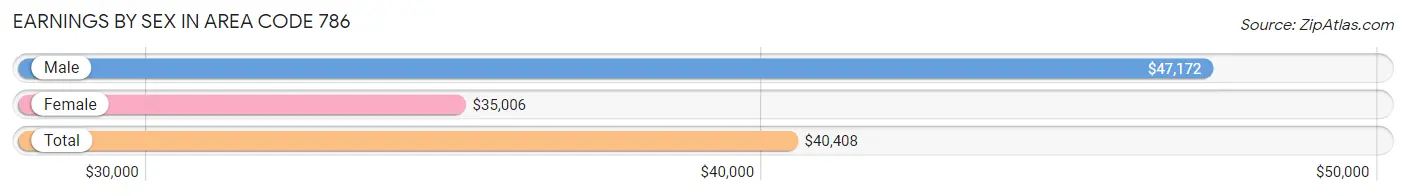
Earnings by Sex in Area Code 786
Average Earnings in Area Code 786 are $40,408, $47,172 for men and $35,006 for women, a difference of 25.8%.
| Sex | Number | Average Earnings |
| Male | 705,763 (53.3%) | $47,172 |
| Female | 618,661 (46.7%) | $35,006 |
| Total | 1,324,424 (100.0%) | $40,408 |
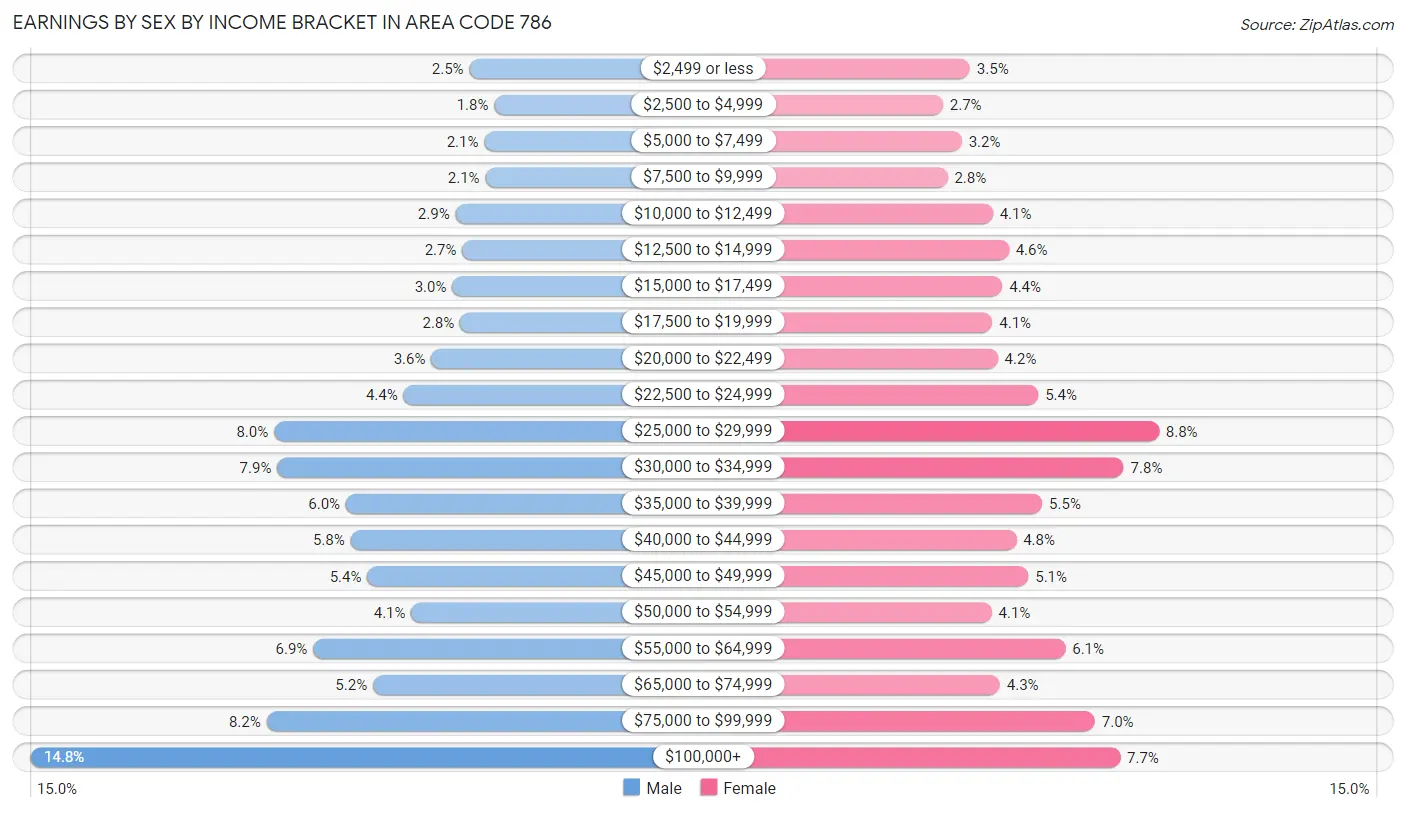
Earnings by Sex by Income Bracket in Area Code 786
The most common earnings brackets in Area Code 786 are $100,000+ for men (104,562 | 14.8%) and $25,000 to $29,999 for women (54,241 | 8.8%).
| Income | Male | Female |
| $2,499 or less | 17,658 (2.5%) | 21,402 (3.5%) |
| $2,500 to $4,999 | 12,673 (1.8%) | 16,714 (2.7%) |
| $5,000 to $7,499 | 14,656 (2.1%) | 19,958 (3.2%) |
| $7,500 to $9,999 | 14,497 (2.1%) | 17,513 (2.8%) |
| $10,000 to $12,499 | 20,431 (2.9%) | 25,381 (4.1%) |
| $12,500 to $14,999 | 19,062 (2.7%) | 28,119 (4.5%) |
| $15,000 to $17,499 | 21,062 (3.0%) | 27,035 (4.4%) |
| $17,500 to $19,999 | 19,511 (2.8%) | 25,330 (4.1%) |
| $20,000 to $22,499 | 25,204 (3.6%) | 26,252 (4.2%) |
| $22,500 to $24,999 | 30,697 (4.3%) | 33,295 (5.4%) |
| $25,000 to $29,999 | 56,399 (8.0%) | 54,241 (8.8%) |
| $30,000 to $34,999 | 55,772 (7.9%) | 48,129 (7.8%) |
| $35,000 to $39,999 | 42,144 (6.0%) | 33,934 (5.5%) |
| $40,000 to $44,999 | 41,205 (5.8%) | 29,426 (4.8%) |
| $45,000 to $49,999 | 37,879 (5.4%) | 31,574 (5.1%) |
| $50,000 to $54,999 | 29,115 (4.1%) | 25,176 (4.1%) |
| $55,000 to $64,999 | 48,628 (6.9%) | 37,971 (6.1%) |
| $65,000 to $74,999 | 36,768 (5.2%) | 26,573 (4.3%) |
| $75,000 to $99,999 | 57,840 (8.2%) | 43,104 (7.0%) |
| $100,000+ | 104,562 (14.8%) | 47,534 (7.7%) |
| Total | 705,763 (100.0%) | 618,661 (100.0%) |
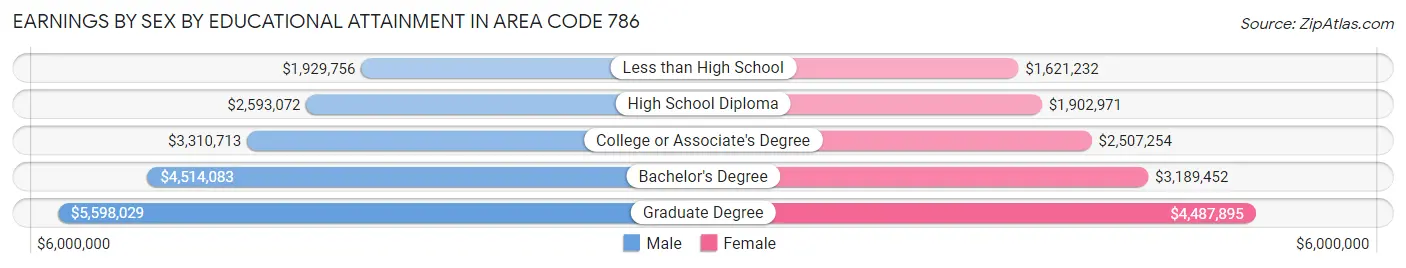
Earnings by Sex by Educational Attainment in Area Code 786
Average earnings in Area Code 786 are $3,683,682 for men and $2,673,608 for women, a difference of 27.4%. Men with an educational attainment of graduate degree enjoy the highest average annual earnings of $5,598,029, while those with less than high school education earn the least with $1,929,756. Women with an educational attainment of graduate degree earn the most with the average annual earnings of $4,487,895, while those with less than high school education have the smallest earnings of $1,621,232.
| Educational Attainment | Male Income | Female Income |
| Less than High School | $1,929,756 | $1,621,232 |
| High School Diploma | $2,593,072 | $1,902,971 |
| College or Associate's Degree | $3,310,713 | $2,507,254 |
| Bachelor's Degree | $4,514,083 | $3,189,452 |
| Graduate Degree | $5,598,029 | $4,487,895 |
| Total | $3,683,682 | $2,673,608 |
Family Income in Area Code 786
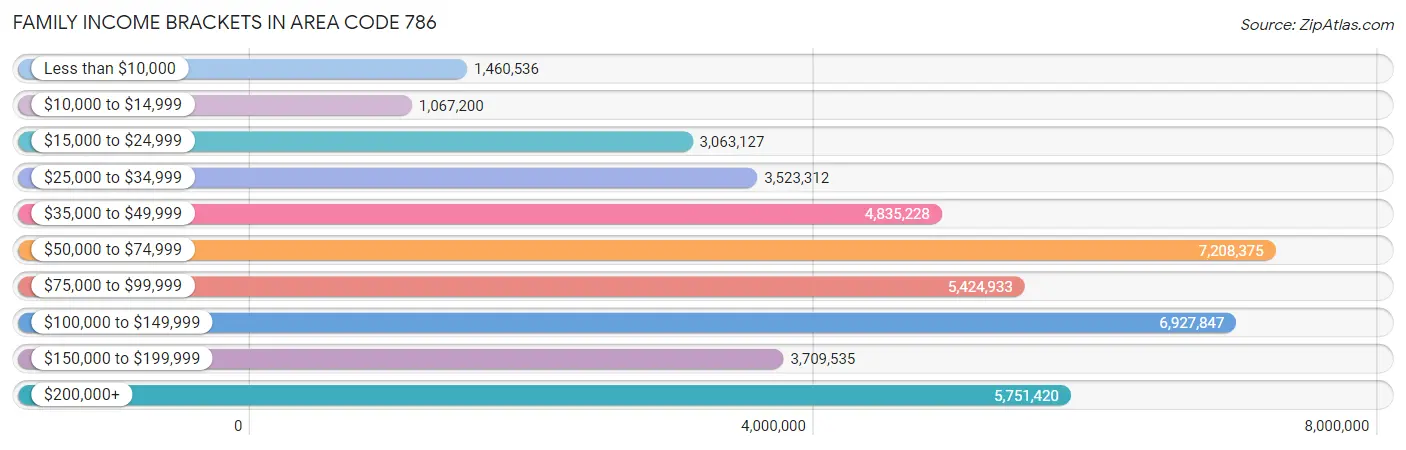
Family Income Brackets in Area Code 786
According to the Area Code 786 family income data, there are 7,208,375 families falling into the $50,000 to $74,999 income range, which is the most common income bracket and makes up 1,207.7% of all families. Conversely, the $10,000 to $14,999 income bracket is the least frequent group with only 1,067,200 families (178.8%) belonging to this category.
| Income Bracket | # Families | % Families |
| Less than $10,000 | 1,460,536 | 244.7% |
| $10,000 to $14,999 | 1,067,200 | 178.8% |
| $15,000 to $24,999 | 3,063,127 | 513.2% |
| $25,000 to $34,999 | 3,523,312 | 590.3% |
| $35,000 to $49,999 | 4,835,228 | 810.1% |
| $50,000 to $74,999 | 7,208,375 | 1,207.7% |
| $75,000 to $99,999 | 5,424,933 | 908.9% |
| $100,000 to $149,999 | 6,927,847 | 1,160.7% |
| $150,000 to $199,999 | 3,709,535 | 621.5% |
| $200,000+ | 5,751,420 | 963.6% |
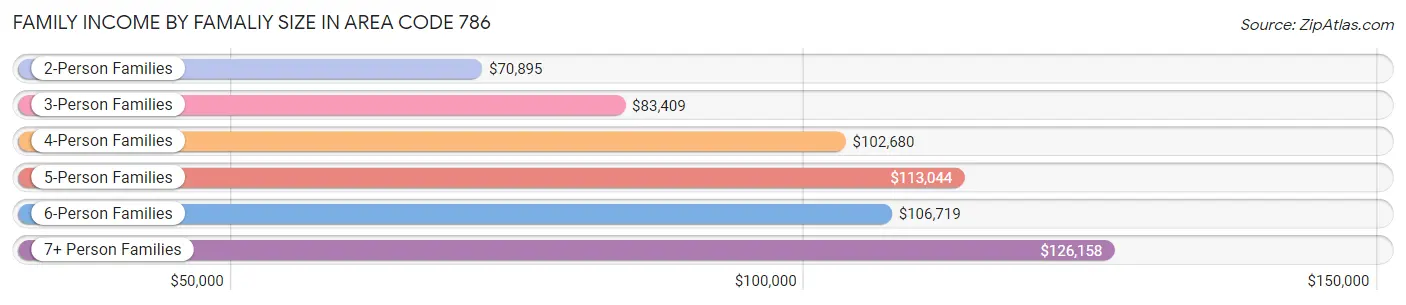
Family Income by Famaliy Size in Area Code 786
7+ person families (9,756 | 1.6%) account for the highest median family income in Area Code 786 with $126,158 per family, while 2-person families (239,812 | 40.2%) have the highest median income of $35,447 per family member.
| Income Bracket | # Families | Median Income |
| 2-Person Families | 239,812 (40.2%) | $70,895 |
| 3-Person Families | 159,750 (26.8%) | $83,409 |
| 4-Person Families | 118,823 (19.9%) | $102,680 |
| 5-Person Families | 50,731 (8.5%) | $113,044 |
| 6-Person Families | 17,996 (3.0%) | $106,719 |
| 7+ Person Families | 9,756 (1.6%) | $126,158 |
| Total | 596,868 (100.0%) | $84,905 |
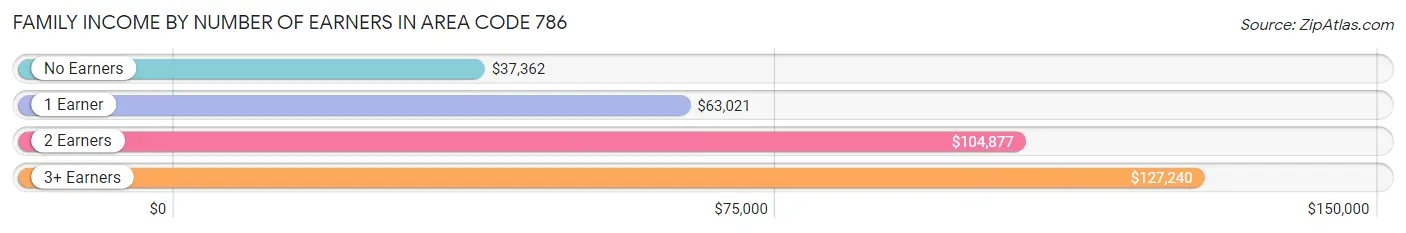
Family Income by Number of Earners in Area Code 786
The median family income in Area Code 786 is $84,905, with families comprising 3+ earners (86,597) having the highest median family income of $127,240, while families with no earners (69,794) have the lowest median family income of $37,362, accounting for 14.5% and 11.7% of families, respectively.
| Number of Earners | # Families | Median Income |
| No Earners | 69,794 (11.7%) | $37,362 |
| 1 Earner | 199,614 (33.4%) | $63,021 |
| 2 Earners | 240,863 (40.4%) | $104,877 |
| 3+ Earners | 86,597 (14.5%) | $127,240 |
| Total | 596,868 (100.0%) | $84,905 |
Household Income in Area Code 786
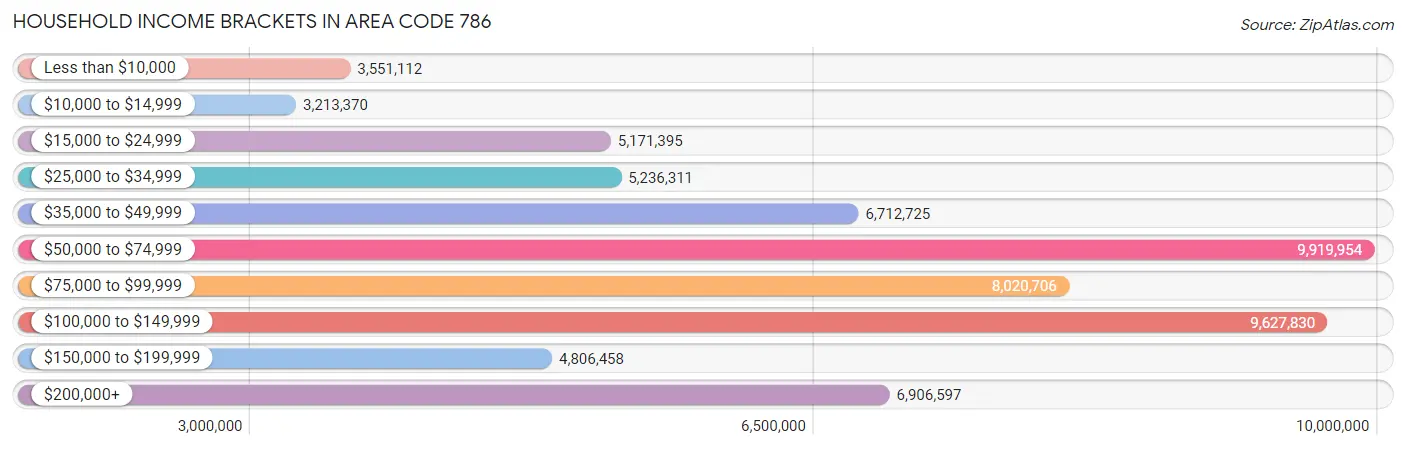
Household Income Brackets in Area Code 786
With 9,919,954 households falling in the category, the $50,000 to $74,999 income range is the most frequent in Area Code 786, accounting for 1,130.8% of all households. In contrast, only 3,213,370 households (366.3%) fall into the $10,000 to $14,999 income bracket, making it the least populous group.
| Income Bracket | # Households | % Households |
| Less than $10,000 | 3,551,112 | 404.8% |
| $10,000 to $14,999 | 3,213,370 | 366.3% |
| $15,000 to $24,999 | 5,171,395 | 589.5% |
| $25,000 to $34,999 | 5,236,311 | 596.9% |
| $35,000 to $49,999 | 6,712,725 | 765.2% |
| $50,000 to $74,999 | 9,919,954 | 1,130.8% |
| $75,000 to $99,999 | 8,020,706 | 914.3% |
| $100,000 to $149,999 | 9,627,830 | 1,097.5% |
| $150,000 to $199,999 | 4,806,458 | 547.9% |
| $200,000+ | 6,906,597 | 787.3% |
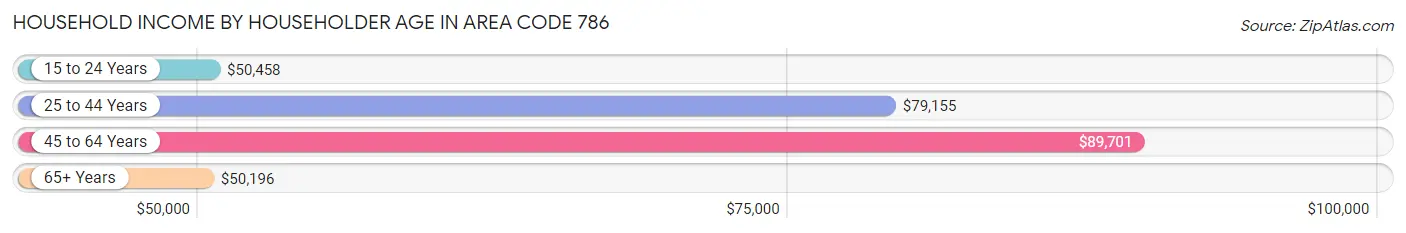
Household Income by Householder Age in Area Code 786
The median household income in Area Code 786 is $74,219, with the highest median household income of $89,701 found in the 45 to 64 years age bracket for the primary householder. A total of 357,634 households (40.8%) fall into this category. Meanwhile, the 65+ years age bracket for the primary householder has the lowest median household income of $50,196, with 221,537 households (25.3%) in this group.
| Income Bracket | # Households | Median Income |
| 15 to 24 Years | 18,616 (2.1%) | $50,458 |
| 25 to 44 Years | 279,464 (31.9%) | $79,155 |
| 45 to 64 Years | 357,634 (40.8%) | $89,701 |
| 65+ Years | 221,537 (25.3%) | $50,196 |
| Total | 877,251 (100.0%) | $74,219 |
Poverty in Area Code 786
Income Below Poverty by Sex and Age in Area Code 786
With 13.6% poverty level for males and 16.7% for females among the residents of Area Code 786, 15 year old males and 75 year old and over females are the most vulnerable to poverty, with 3,260 males (23.6%) and 28,927 females (26.0%) in their respective age groups living below the poverty level.
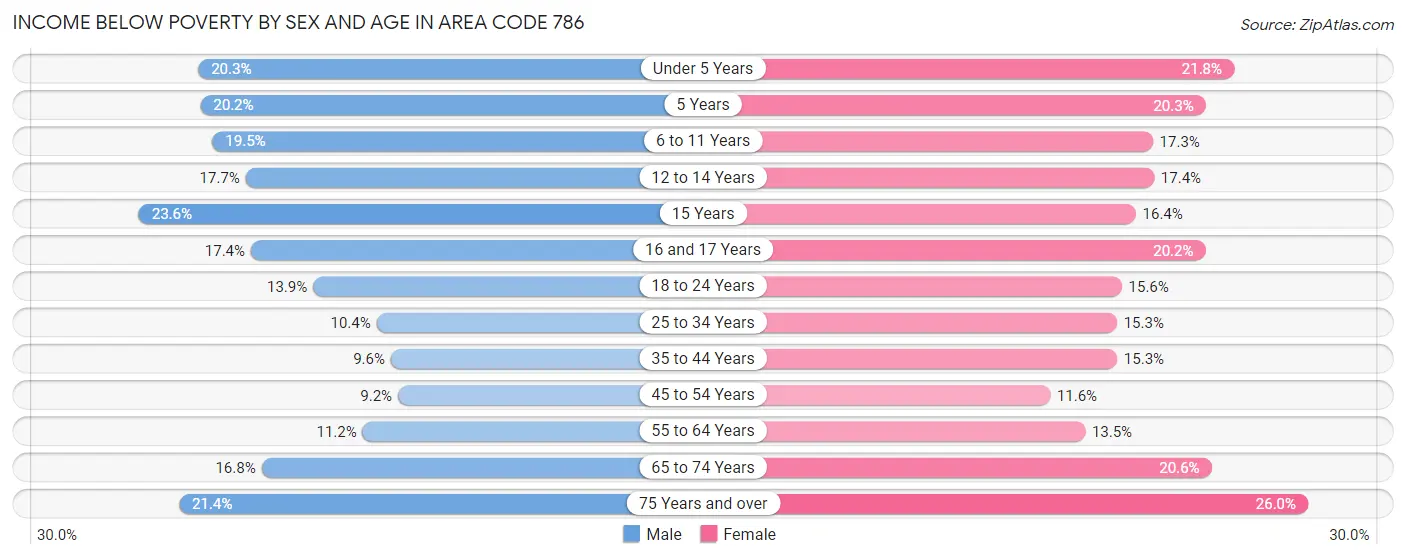
| Age Bracket | Male | Female |
| Under 5 Years | 14,106 (20.3%) | 14,254 (21.8%) |
| 5 Years | 2,663 (20.2%) | 2,393 (20.3%) |
| 6 to 11 Years | 15,721 (19.5%) | 13,657 (17.3%) |
| 12 to 14 Years | 7,544 (17.7%) | 7,188 (17.4%) |
| 15 Years | 3,260 (23.6%) | 2,284 (16.4%) |
| 16 and 17 Years | 5,168 (17.4%) | 5,579 (20.2%) |
| 18 to 24 Years | 14,265 (13.9%) | 15,102 (15.6%) |
| 25 to 34 Years | 17,990 (10.4%) | 25,230 (15.3%) |
| 35 to 44 Years | 16,423 (9.6%) | 25,466 (15.3%) |
| 45 to 54 Years | 16,417 (9.2%) | 20,364 (11.6%) |
| 55 to 64 Years | 17,051 (11.2%) | 22,441 (13.5%) |
| 65 to 74 Years | 16,658 (16.8%) | 24,617 (20.6%) |
| 75 Years and over | 15,046 (21.4%) | 28,927 (26.0%) |
| Total | 162,312 (13.6%) | 207,502 (16.7%) |
Income Above Poverty by Sex and Age in Area Code 786
According to the poverty statistics in Area Code 786, males aged 45 to 54 years and females aged 45 to 54 years are the age groups that are most secure financially, with 90.8% of males and 88.4% of females in these age groups living above the poverty line.
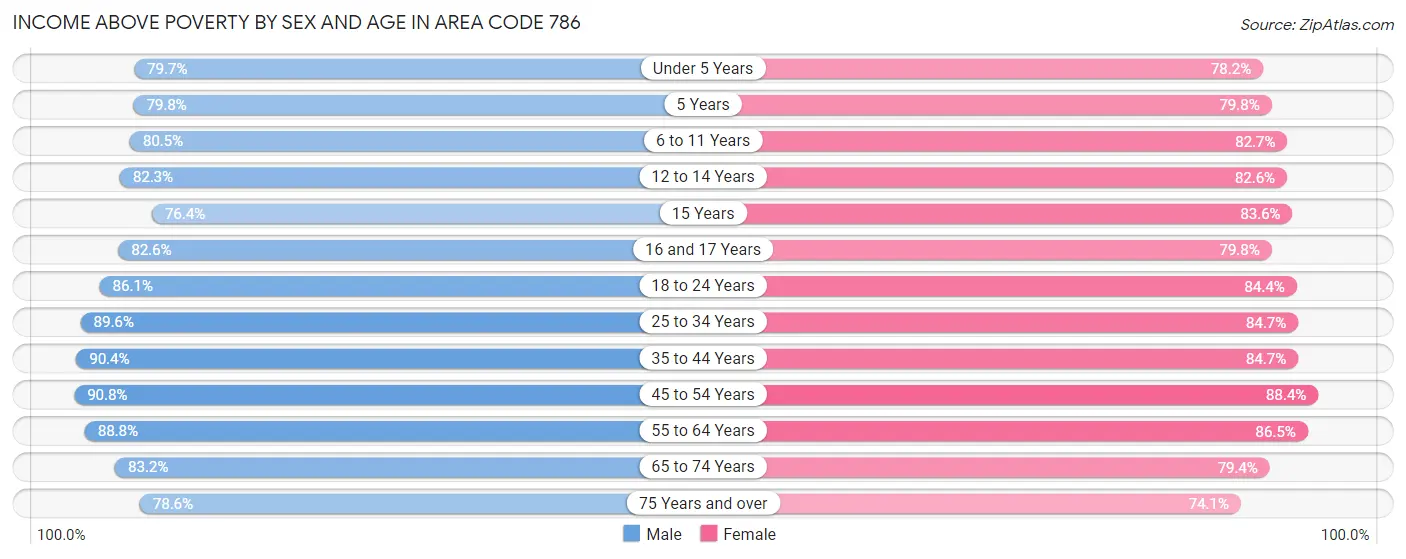
| Age Bracket | Male | Female |
| Under 5 Years | 55,269 (79.7%) | 51,044 (78.2%) |
| 5 Years | 10,511 (79.8%) | 9,425 (79.7%) |
| 6 to 11 Years | 64,719 (80.5%) | 65,240 (82.7%) |
| 12 to 14 Years | 35,092 (82.3%) | 34,166 (82.6%) |
| 15 Years | 10,533 (76.4%) | 11,673 (83.6%) |
| 16 and 17 Years | 24,537 (82.6%) | 21,988 (79.8%) |
| 18 to 24 Years | 88,062 (86.1%) | 81,844 (84.4%) |
| 25 to 34 Years | 155,066 (89.6%) | 139,611 (84.7%) |
| 35 to 44 Years | 154,392 (90.4%) | 140,746 (84.7%) |
| 45 to 54 Years | 161,782 (90.8%) | 155,401 (88.4%) |
| 55 to 64 Years | 135,456 (88.8%) | 143,329 (86.5%) |
| 65 to 74 Years | 82,432 (83.2%) | 95,004 (79.4%) |
| 75 Years and over | 55,277 (78.6%) | 82,554 (74.1%) |
| Total | 1,033,128 (86.4%) | 1,032,025 (83.3%) |
Income Below Poverty Among Married-Couple Families in Area Code 786
The poverty statistics for married-couple families in Area Code 786 show that 7.9% or 29,793 of the total 375,703 families live below the poverty line. Families with 5 or more children have the highest poverty rate of 28.3%, comprising of 328 families. On the other hand, families with 1 or 2 children have the lowest poverty rate of 7.4%, which includes 10,142 families.
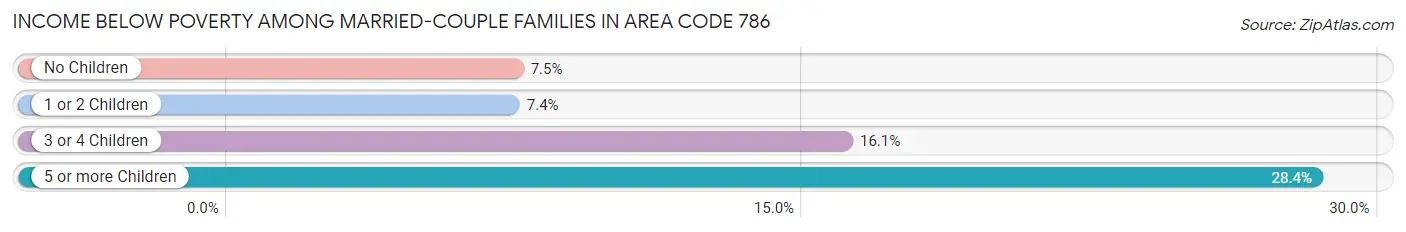
| Children | Above Poverty | Below Poverty |
| No Children | 201,227 (92.5%) | 16,212 (7.5%) |
| 1 or 2 Children | 127,589 (92.6%) | 10,142 (7.4%) |
| 3 or 4 Children | 16,265 (83.9%) | 3,111 (16.1%) |
| 5 or more Children | 829 (71.7%) | 328 (28.3%) |
| Total | 345,910 (92.1%) | 29,793 (7.9%) |
Income Below Poverty Among Single-Parent Households in Area Code 786
According to the poverty data in Area Code 786, 11.6% or 7,679 single-father households and 21.1% or 32,789 single-mother households are living below the poverty line. Among single-father households, those with 5 or more children have the highest poverty rate, with 23 households (39.0%) experiencing poverty. Likewise, among single-mother households, those with 5 or more children have the highest poverty rate, with 691 households (82.1%) falling below the poverty line.
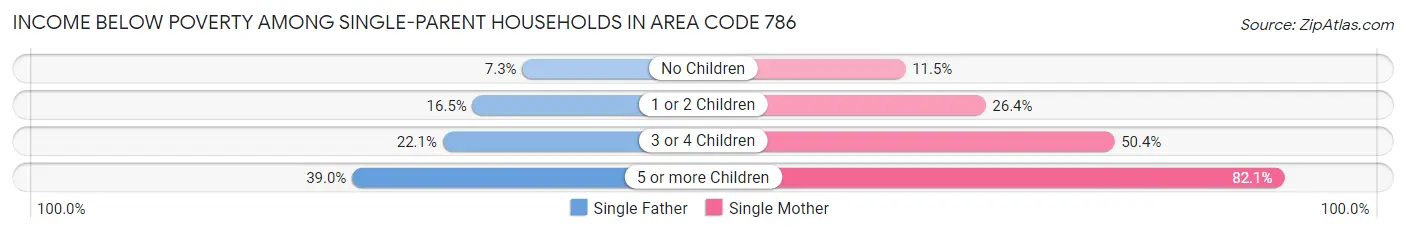
| Children | Single Father | Single Mother |
| No Children | 2,672 (7.3%) | 8,443 (11.5%) |
| 1 or 2 Children | 4,400 (16.5%) | 18,629 (26.4%) |
| 3 or 4 Children | 584 (22.1%) | 5,026 (50.4%) |
| 5 or more Children | 23 (39.0%) | 691 (82.1%) |
| Total | 7,679 (11.6%) | 32,789 (21.1%) |
Income Below Poverty Among Married-Couple vs Single-Parent Households in Area Code 786
The poverty data for Area Code 786 shows that 29,793 of the married-couple family households (7.9%) and 40,468 of the single-parent households (18.3%) are living below the poverty level. Within the married-couple family households, those with 5 or more children have the highest poverty rate, with 328 households (28.3%) falling below the poverty line. Among the single-parent households, those with 5 or more children have the highest poverty rate, with 714 household (79.2%) living below poverty.
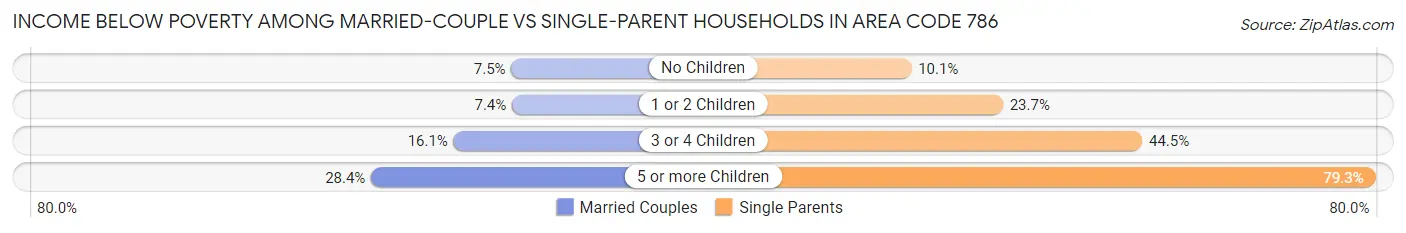
| Children | Married-Couple Families | Single-Parent Households |
| No Children | 16,212 (7.5%) | 11,115 (10.1%) |
| 1 or 2 Children | 10,142 (7.4%) | 23,029 (23.7%) |
| 3 or 4 Children | 3,111 (16.1%) | 5,610 (44.5%) |
| 5 or more Children | 328 (28.3%) | 714 (79.2%) |
| Total | 29,793 (7.9%) | 40,468 (18.3%) |
Race in Area Code 786
The most populous races in Area Code 786 are Hispanic or Latino (1,698,642 | 68.6%), White / Caucasian (1,163,902 | 47.0%), and Two or more Races (718,945 | 29.0%).
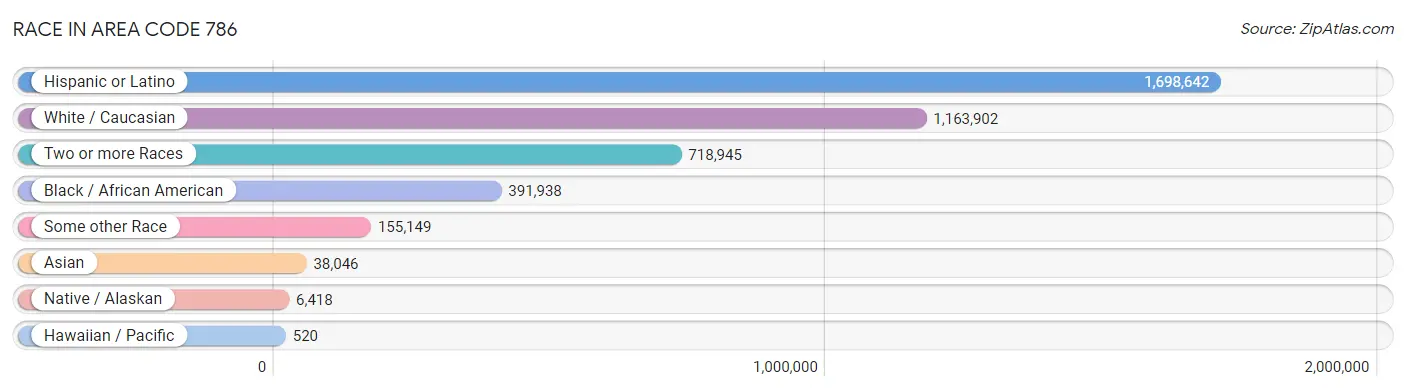
| Race | # Population | % Population |
| Asian | 38,046 | 1.5% |
| Black / African American | 391,938 | 15.8% |
| Hawaiian / Pacific | 520 | 0.0% |
| Hispanic or Latino | 1,698,642 | 68.6% |
| Native / Alaskan | 6,418 | 0.3% |
| White / Caucasian | 1,163,902 | 47.0% |
| Two or more Races | 718,945 | 29.0% |
| Some other Race | 155,149 | 6.3% |
| Total | 2,474,918 | 100.0% |
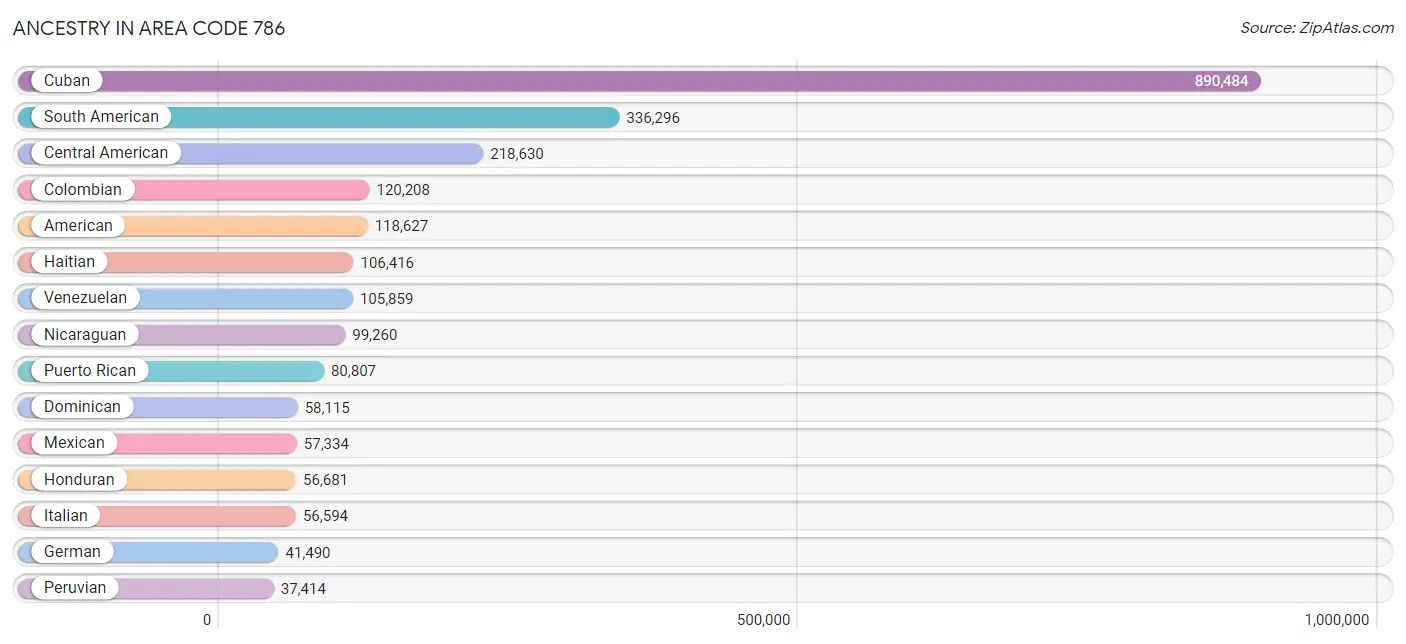
Ancestry in Area Code 786
The most populous ancestries reported in Area Code 786 are Cuban (890,484 | 36.0%), South American (336,296 | 13.6%), Central American (218,630 | 8.8%), Colombian (120,208 | 4.9%), and American (118,627 | 4.8%), together accounting for 68.1% of all Area Code 786 residents.
| Ancestry | # Population | % Population |
| Afghan | 221 | 0.0% |
| African | 7,391 | 0.3% |
| Alaska Native | 4 | 0.0% |
| Alaskan Athabascan | 5 | 0.0% |
| Albanian | 102 | 0.0% |
| Aleut | 6 | 0.0% |
| Alsatian | 4 | 0.0% |
| American | 118,627 | 4.8% |
| Apache | 224 | 0.0% |
| Arab | 16,740 | 0.7% |
| Arapaho | 131 | 0.0% |
| Argentinean | 27,670 | 1.1% |
| Armenian | 1,079 | 0.0% |
| Assyrian / Chaldean / Syriac | 9 | 0.0% |
| Australian | 641 | 0.0% |
| Austrian | 2,493 | 0.1% |
| Bahamian | 6,843 | 0.3% |
| Bangladeshi | 37 | 0.0% |
| Barbadian | 623 | 0.0% |
| Basque | 799 | 0.0% |
| Belgian | 1,097 | 0.0% |
| Belizean | 632 | 0.0% |
| Bermudan | 108 | 0.0% |
| Bhutanese | 2,298 | 0.1% |
| Blackfeet | 266 | 0.0% |
| Bolivian | 4,457 | 0.2% |
| Brazilian | 12,859 | 0.5% |
| British | 5,175 | 0.2% |
| British West Indian | 2,402 | 0.1% |
| Bulgarian | 740 | 0.0% |
| Burmese | 3,289 | 0.1% |
| Cajun | 47 | 0.0% |
| Cambodian | 38 | 0.0% |
| Canadian | 2,202 | 0.1% |
| Cape Verdean | 118 | 0.0% |
| Celtic | 69 | 0.0% |
| Central American | 218,630 | 8.8% |
| Central American Indian | 4,161 | 0.2% |
| Cherokee | 1,338 | 0.1% |
| Chickasaw | 71 | 0.0% |
| Chilean | 11,428 | 0.5% |
| Chippewa | 80 | 0.0% |
| Choctaw | 49 | 0.0% |
| Colombian | 120,208 | 4.9% |
| Comanche | 33 | 0.0% |
| Costa Rican | 5,731 | 0.2% |
| Creek | 138 | 0.0% |
| Croatian | 777 | 0.0% |
| Cuban | 890,484 | 36.0% |
| Cypriot | 28 | 0.0% |
| Czech | 1,279 | 0.1% |
| Czechoslovakian | 212 | 0.0% |
| Danish | 1,428 | 0.1% |
| Dominican | 58,115 | 2.4% |
| Dutch | 3,535 | 0.1% |
| Dutch West Indian | 483 | 0.0% |
| Eastern European | 4,756 | 0.2% |
| Ecuadorian | 22,300 | 0.9% |
| Egyptian | 832 | 0.0% |
| English | 28,234 | 1.1% |
| Estonian | 172 | 0.0% |
| Ethiopian | 240 | 0.0% |
| European | 12,432 | 0.5% |
| Filipino | 643 | 0.0% |
| Finnish | 573 | 0.0% |
| French | 19,918 | 0.8% |
| French American Indian | 79 | 0.0% |
| French Canadian | 1,761 | 0.1% |
| German | 41,490 | 1.7% |
| German Russian | 29 | 0.0% |
| Ghanaian | 125 | 0.0% |
| Greek | 4,371 | 0.2% |
| Guamanian / Chamorro | 146 | 0.0% |
| Guatemalan | 27,349 | 1.1% |
| Guyanese | 1,419 | 0.1% |
| Haitian | 106,416 | 4.3% |
| Honduran | 56,681 | 2.3% |
| Hungarian | 3,477 | 0.1% |
| Icelander | 57 | 0.0% |
| Indian (Asian) | 16,471 | 0.7% |
| Indonesian | 260 | 0.0% |
| Inupiat | 13 | 0.0% |
| Iranian | 2,298 | 0.1% |
| Iraqi | 122 | 0.0% |
| Irish | 33,927 | 1.4% |
| Iroquois | 131 | 0.0% |
| Israeli | 3,162 | 0.1% |
| Italian | 56,594 | 2.3% |
| Jamaican | 33,786 | 1.4% |
| Japanese | 406 | 0.0% |
| Jordanian | 771 | 0.0% |
| Kenyan | 142 | 0.0% |
| Korean | 6,894 | 0.3% |
| Laotian | 190 | 0.0% |
| Latvian | 107 | 0.0% |
| Lebanese | 7,349 | 0.3% |
| Lithuanian | 1,329 | 0.1% |
| Lumbee | 35 | 0.0% |
| Luxembourger | 63 | 0.0% |
| Macedonian | 77 | 0.0% |
| Malaysian | 217 | 0.0% |
| Maltese | 119 | 0.0% |
| Mexican | 57,334 | 2.3% |
| Mexican American Indian | 1,090 | 0.0% |
| Mongolian | 95 | 0.0% |
| Moroccan | 1,354 | 0.1% |
| Native Hawaiian | 344 | 0.0% |
| Navajo | 39 | 0.0% |
| New Zealander | 43 | 0.0% |
| Nicaraguan | 99,260 | 4.0% |
| Nigerian | 2,100 | 0.1% |
| Northern European | 520 | 0.0% |
| Norwegian | 2,799 | 0.1% |
| Okinawan | 4 | 0.0% |
| Osage | 3 | 0.0% |
| Ottawa | 10 | 0.0% |
| Pakistani | 1,621 | 0.1% |
| Palestinian | 568 | 0.0% |
| Panamanian | 7,775 | 0.3% |
| Paraguayan | 1,232 | 0.1% |
| Pennsylvania German | 68 | 0.0% |
| Peruvian | 37,414 | 1.5% |
| Polish | 15,738 | 0.6% |
| Portuguese | 8,467 | 0.3% |
| Potawatomi | 48 | 0.0% |
| Pueblo | 13 | 0.0% |
| Puerto Rican | 80,807 | 3.3% |
| Romanian | 2,651 | 0.1% |
| Russian | 16,240 | 0.7% |
| Salvadoran | 21,259 | 0.9% |
| Samoan | 190 | 0.0% |
| Scandinavian | 798 | 0.0% |
| Scotch-Irish | 2,095 | 0.1% |
| Scottish | 6,071 | 0.3% |
| Seminole | 217 | 0.0% |
| Senegalese | 48 | 0.0% |
| Serbian | 572 | 0.0% |
| Sioux | 82 | 0.0% |
| Slavic | 230 | 0.0% |
| Slovak | 704 | 0.0% |
| Slovene | 91 | 0.0% |
| South African | 237 | 0.0% |
| South American | 336,296 | 13.6% |
| South American Indian | 971 | 0.0% |
| Spaniard | 15,406 | 0.6% |
| Spanish | 6,066 | 0.3% |
| Spanish American | 359 | 0.0% |
| Spanish American Indian | 79 | 0.0% |
| Sri Lankan | 2,640 | 0.1% |
| Subsaharan African | 11,536 | 0.5% |
| Sudanese | 41 | 0.0% |
| Swedish | 3,548 | 0.1% |
| Swiss | 1,185 | 0.1% |
| Syrian | 1,801 | 0.1% |
| Taiwanese | 89 | 0.0% |
| Thai | 13,526 | 0.5% |
| Tongan | 98 | 0.0% |
| Trinidadian and Tobagonian | 4,163 | 0.2% |
| Turkish | 2,319 | 0.1% |
| U.S. Virgin Islander | 764 | 0.0% |
| Ugandan | 7 | 0.0% |
| Ukrainian | 3,513 | 0.1% |
| Uruguayan | 5,421 | 0.2% |
| Venezuelan | 105,859 | 4.3% |
| Vietnamese | 807 | 0.0% |
| Welsh | 1,340 | 0.1% |
| West Indian | 3,053 | 0.1% |
| Yaqui | 14 | 0.0% |
| Yugoslavian | 311 | 0.0% |
| Yup'ik | 22 | 0.0% |
| Zimbabwean | 51 | 0.0% | View All 171 Rows |
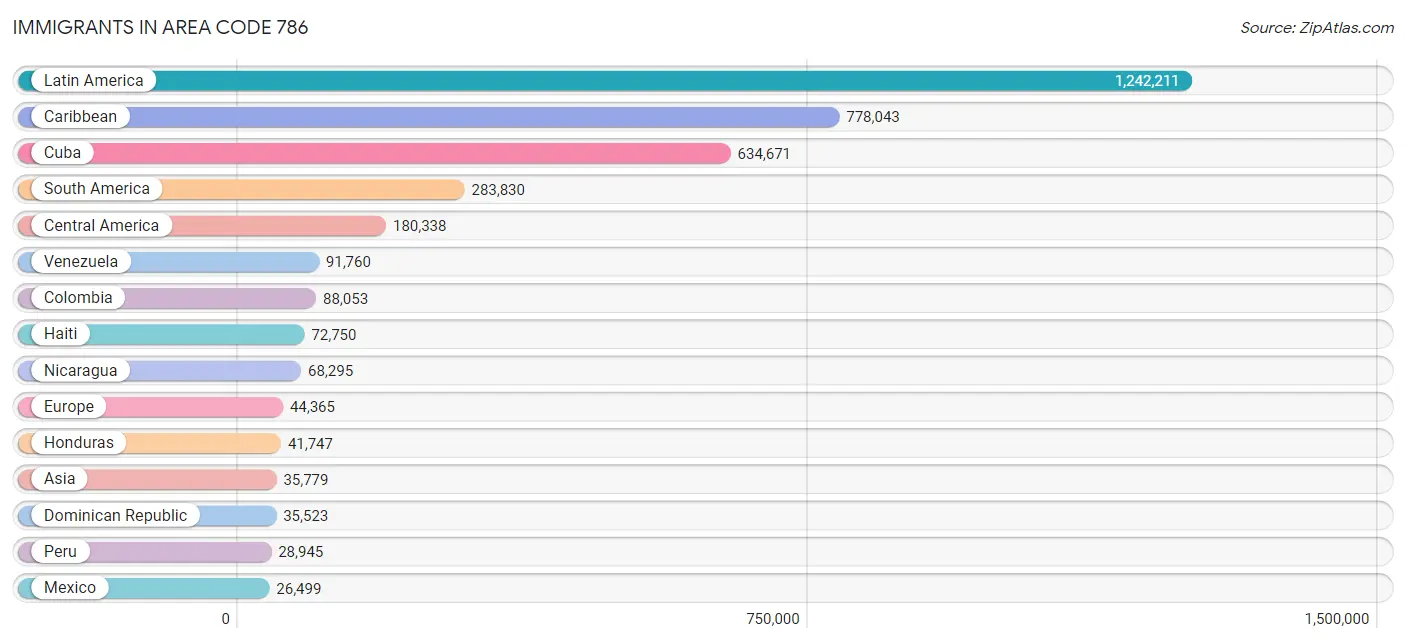
Immigrants in Area Code 786
The most numerous immigrant groups reported in Area Code 786 came from Latin America (1,242,211 | 50.2%), Caribbean (778,043 | 31.4%), Cuba (634,671 | 25.6%), South America (283,830 | 11.5%), and Central America (180,338 | 7.3%), together accounting for 126.0% of all Area Code 786 residents.
| Immigration Origin | # Population | % Population |
| Afghanistan | 153 | 0.0% |
| Africa | 6,811 | 0.3% |
| Albania | 67 | 0.0% |
| Argentina | 23,057 | 0.9% |
| Armenia | 45 | 0.0% |
| Asia | 35,779 | 1.5% |
| Australia | 469 | 0.0% |
| Austria | 312 | 0.0% |
| Bahamas | 3,889 | 0.2% |
| Bangladesh | 1,475 | 0.1% |
| Barbados | 177 | 0.0% |
| Belarus | 588 | 0.0% |
| Belgium | 491 | 0.0% |
| Belize | 474 | 0.0% |
| Bolivia | 3,619 | 0.2% |
| Bosnia and Herzegovina | 110 | 0.0% |
| Brazil | 15,953 | 0.6% |
| Bulgaria | 588 | 0.0% |
| Cambodia | 315 | 0.0% |
| Cameroon | 385 | 0.0% |
| Canada | 4,834 | 0.2% |
| Caribbean | 778,043 | 31.4% |
| Central America | 180,338 | 7.3% |
| Chile | 8,432 | 0.3% |
| China | 6,639 | 0.3% |
| Colombia | 88,053 | 3.6% |
| Costa Rica | 4,316 | 0.2% |
| Croatia | 216 | 0.0% |
| Cuba | 634,671 | 25.6% |
| Czechoslovakia | 347 | 0.0% |
| Denmark | 145 | 0.0% |
| Dominica | 826 | 0.0% |
| Dominican Republic | 35,523 | 1.4% |
| Eastern Africa | 1,050 | 0.0% |
| Eastern Asia | 8,784 | 0.4% |
| Eastern Europe | 13,312 | 0.5% |
| Ecuador | 15,963 | 0.6% |
| Egypt | 678 | 0.0% |
| El Salvador | 13,720 | 0.5% |
| England | 1,657 | 0.1% |
| Ethiopia | 155 | 0.0% |
| Europe | 44,365 | 1.8% |
| Fiji | 29 | 0.0% |
| France | 5,369 | 0.2% |
| Germany | 2,871 | 0.1% |
| Ghana | 51 | 0.0% |
| Greece | 828 | 0.0% |
| Grenada | 230 | 0.0% |
| Guatemala | 19,432 | 0.8% |
| Guyana | 2,030 | 0.1% |
| Haiti | 72,750 | 2.9% |
| Honduras | 41,747 | 1.7% |
| Hong Kong | 295 | 0.0% |
| Hungary | 645 | 0.0% |
| India | 5,958 | 0.2% |
| Indonesia | 149 | 0.0% |
| Iran | 1,287 | 0.1% |
| Iraq | 185 | 0.0% |
| Ireland | 569 | 0.0% |
| Israel | 1,866 | 0.1% |
| Italy | 4,995 | 0.2% |
| Jamaica | 22,405 | 0.9% |
| Japan | 857 | 0.0% |
| Jordan | 930 | 0.0% |
| Kazakhstan | 333 | 0.0% |
| Kenya | 192 | 0.0% |
| Korea | 1,269 | 0.1% |
| Kuwait | 247 | 0.0% |
| Laos | 73 | 0.0% |
| Latin America | 1,242,211 | 50.2% |
| Latvia | 151 | 0.0% |
| Lebanon | 1,216 | 0.1% |
| Liberia | 9 | 0.0% |
| Lithuania | 134 | 0.0% |
| Malaysia | 280 | 0.0% |
| Mexico | 26,499 | 1.1% |
| Micronesia | 35 | 0.0% |
| Middle Africa | 572 | 0.0% |
| Moldova | 420 | 0.0% |
| Morocco | 963 | 0.0% |
| Nepal | 130 | 0.0% |
| Netherlands | 467 | 0.0% |
| Nicaragua | 68,295 | 2.8% |
| Nigeria | 1,938 | 0.1% |
| North Macedonia | 9 | 0.0% |
| Northern Africa | 2,160 | 0.1% |
| Northern Europe | 5,076 | 0.2% |
| Norway | 167 | 0.0% |
| Oceania | 700 | 0.0% |
| Pakistan | 1,203 | 0.1% |
| Panama | 5,633 | 0.2% |
| Peru | 28,945 | 1.2% |
| Philippines | 4,004 | 0.2% |
| Poland | 1,156 | 0.1% |
| Portugal | 528 | 0.0% |
| Romania | 856 | 0.0% |
| Russia | 4,677 | 0.2% |
| Saudi Arabia | 845 | 0.0% |
| Scotland | 211 | 0.0% |
| Senegal | 51 | 0.0% |
| Serbia | 225 | 0.0% |
| Sierra Leone | 7 | 0.0% |
| Singapore | 170 | 0.0% |
| Somalia | 12 | 0.0% |
| South Africa | 574 | 0.0% |
| South America | 283,830 | 11.5% |
| South Central Asia | 11,052 | 0.4% |
| South Eastern Asia | 7,699 | 0.3% |
| Southern Europe | 15,780 | 0.6% |
| Spain | 9,413 | 0.4% |
| Sri Lanka | 283 | 0.0% |
| St. Vincent and the Grenadines | 474 | 0.0% |
| Sudan | 68 | 0.0% |
| Sweden | 494 | 0.0% |
| Switzerland | 671 | 0.0% |
| Syria | 666 | 0.0% |
| Taiwan | 625 | 0.0% |
| Thailand | 1,087 | 0.0% |
| Trinidad and Tobago | 4,116 | 0.2% |
| Turkey | 1,605 | 0.1% |
| Uganda | 72 | 0.0% |
| Ukraine | 2,504 | 0.1% |
| Uruguay | 4,665 | 0.2% |
| Uzbekistan | 189 | 0.0% |
| Venezuela | 91,760 | 3.7% |
| Vietnam | 1,489 | 0.1% |
| West Indies | 271 | 0.0% |
| Western Africa | 2,206 | 0.1% |
| Western Asia | 8,061 | 0.3% |
| Western Europe | 10,186 | 0.4% |
| Yemen | 9 | 0.0% |
| Zaire | 27 | 0.0% |
| Zimbabwe | 90 | 0.0% | View All 133 Rows |
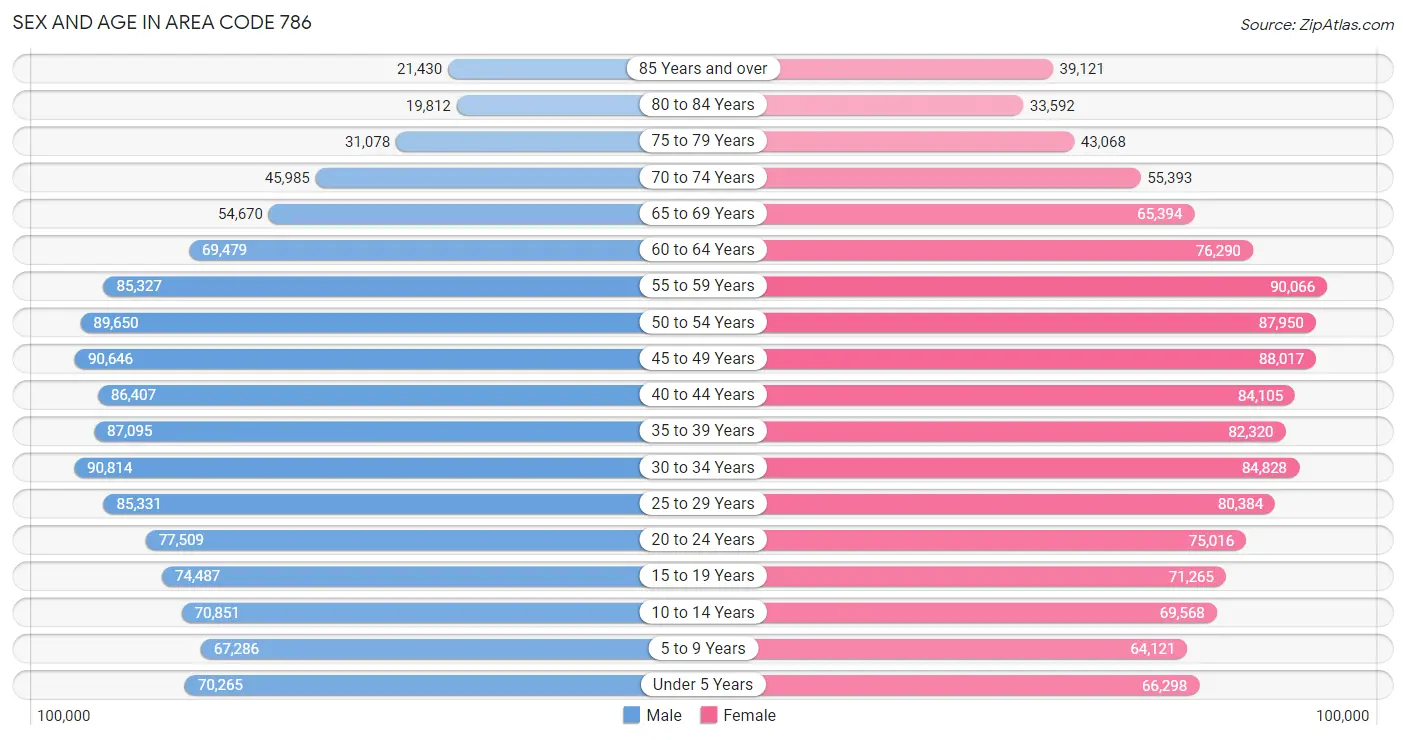
Sex and Age in Area Code 786
Sex and Age in Area Code 786
The most populous age groups in Area Code 786 are 30 to 34 Years (90,814 | 7.5%) for men and 55 to 59 Years (90,066 | 7.2%) for women.
| Age Bracket | Male | Female |
| Under 5 Years | 70,265 (5.8%) | 66,298 (5.3%) |
| 5 to 9 Years | 67,286 (5.5%) | 64,121 (5.1%) |
| 10 to 14 Years | 70,851 (5.8%) | 69,568 (5.5%) |
| 15 to 19 Years | 74,487 (6.1%) | 71,265 (5.7%) |
| 20 to 24 Years | 77,509 (6.4%) | 75,016 (6.0%) |
| 25 to 29 Years | 85,331 (7.0%) | 80,384 (6.4%) |
| 30 to 34 Years | 90,814 (7.5%) | 84,828 (6.8%) |
| 35 to 39 Years | 87,095 (7.1%) | 82,320 (6.6%) |
| 40 to 44 Years | 86,407 (7.1%) | 84,105 (6.7%) |
| 45 to 49 Years | 90,646 (7.4%) | 88,017 (7.0%) |
| 50 to 54 Years | 89,650 (7.4%) | 87,950 (7.0%) |
| 55 to 59 Years | 85,327 (7.0%) | 90,066 (7.2%) |
| 60 to 64 Years | 69,479 (5.7%) | 76,290 (6.1%) |
| 65 to 69 Years | 54,670 (4.5%) | 65,394 (5.2%) |
| 70 to 74 Years | 45,985 (3.8%) | 55,393 (4.4%) |
| 75 to 79 Years | 31,078 (2.5%) | 43,068 (3.4%) |
| 80 to 84 Years | 19,812 (1.6%) | 33,592 (2.7%) |
| 85 Years and over | 21,430 (1.8%) | 39,121 (3.1%) |
| Total | 1,218,122 (100.0%) | 1,256,796 (100.0%) |
Families and Households in Area Code 786
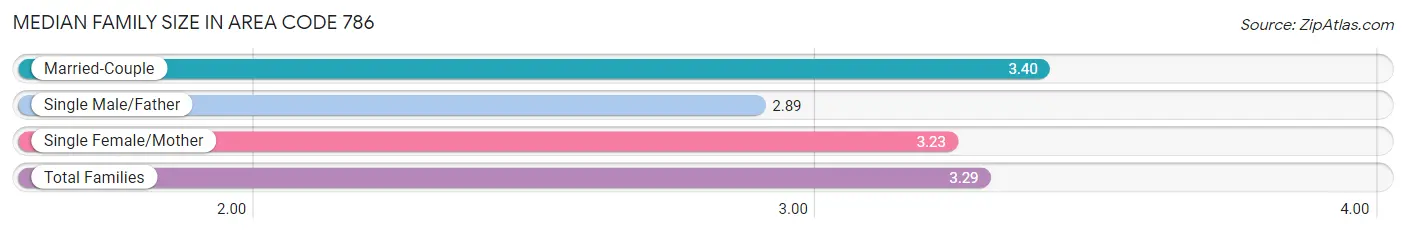
Median Family Size in Area Code 786
The median family size in Area Code 786 is 3.29 persons per family, with married-couple families (375,703 | 62.9%) accounting for the largest median family size of 3.39819 persons per family. On the other hand, single male/father families (66,088 | 11.1%) represent the smallest median family size with 2.89 persons per family.
| Family Type | # Families | Family Size |
| Married-Couple | 375,703 (62.9%) | 3.40 |
| Single Male/Father | 66,088 (11.1%) | 2.89 |
| Single Female/Mother | 155,077 (26.0%) | 3.23 |
| Total Families | 596,868 (100.0%) | 3.29 |
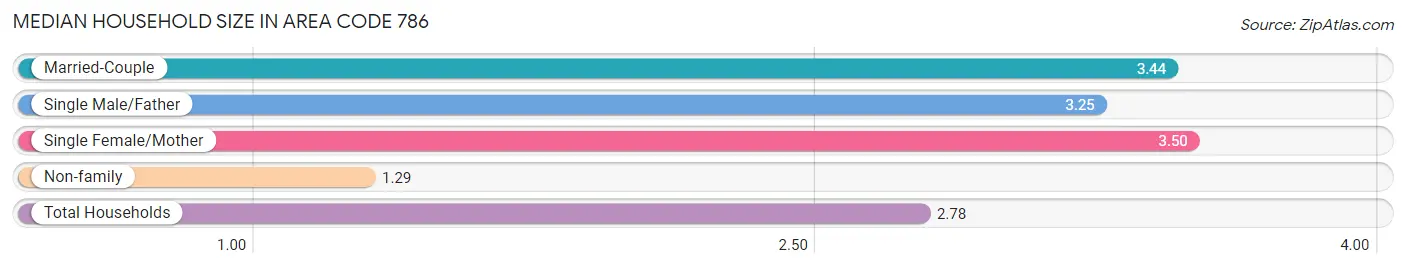
Median Household Size in Area Code 786
The median household size in Area Code 786 is 2.78 persons per household, with single female/mother households (155,077 | 17.7%) accounting for the largest median household size of 3.49914 persons per household. non-family households (280,383 | 32.0%) represent the smallest median household size with 1.29 persons per household.
| Household Type | # Households | Household Size |
| Married-Couple | 375,703 (42.8%) | 3.44 |
| Single Male/Father | 66,088 (7.5%) | 3.25 |
| Single Female/Mother | 155,077 (17.7%) | 3.50 |
| Non-family | 280,383 (32.0%) | 1.29 |
| Total Households | 877,251 (100.0%) | 2.78 |
Household Size by Marriage Status in Area Code 786
Out of a total of 877,251 households in Area Code 786, 596,868 (68.0%) are family households, while 280,383 (32.0%) are nonfamily households. The most numerous type of family households are 2-person households, comprising 211,692, and the most common type of nonfamily households are 1-person households, comprising 223,817.
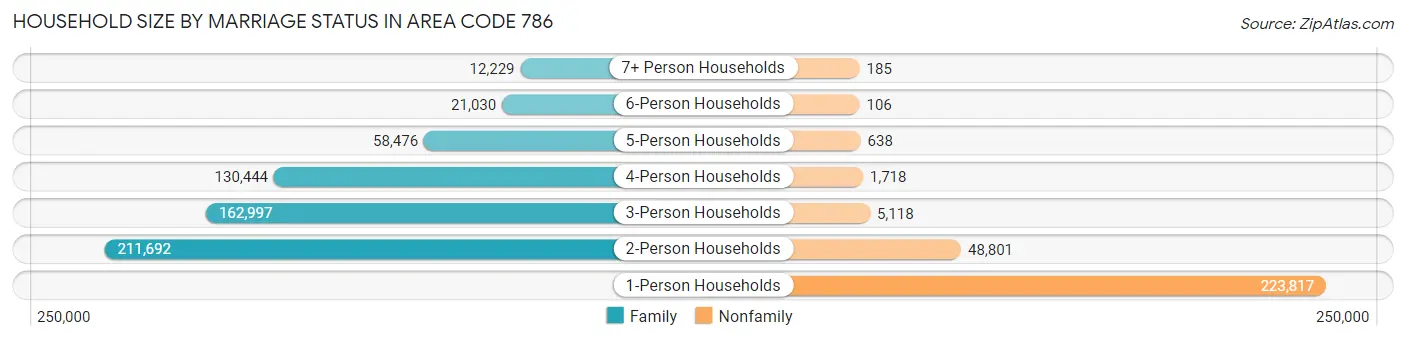
| Household Size | Family Households | Nonfamily Households |
| 1-Person Households | - | 223,817 (25.5%) |
| 2-Person Households | 211,692 (24.1%) | 48,801 (5.6%) |
| 3-Person Households | 162,997 (18.6%) | 5,118 (0.6%) |
| 4-Person Households | 130,444 (14.9%) | 1,718 (0.2%) |
| 5-Person Households | 58,476 (6.7%) | 638 (0.1%) |
| 6-Person Households | 21,030 (2.4%) | 106 (0.0%) |
| 7+ Person Households | 12,229 (1.4%) | 185 (0.0%) |
| Total | 596,868 (68.0%) | 280,383 (32.0%) |
Female Fertility in Area Code 786
Fertility by Age in Area Code 786
Average fertility rate in Area Code 786 is 45.2 births per 1,000 women. Women in the age bracket of 20 to 34 years have the highest fertility rate with 68.2 births per 1,000 women. Women in the age bracket of 20 to 34 years acount for 62.5% of all women with births.
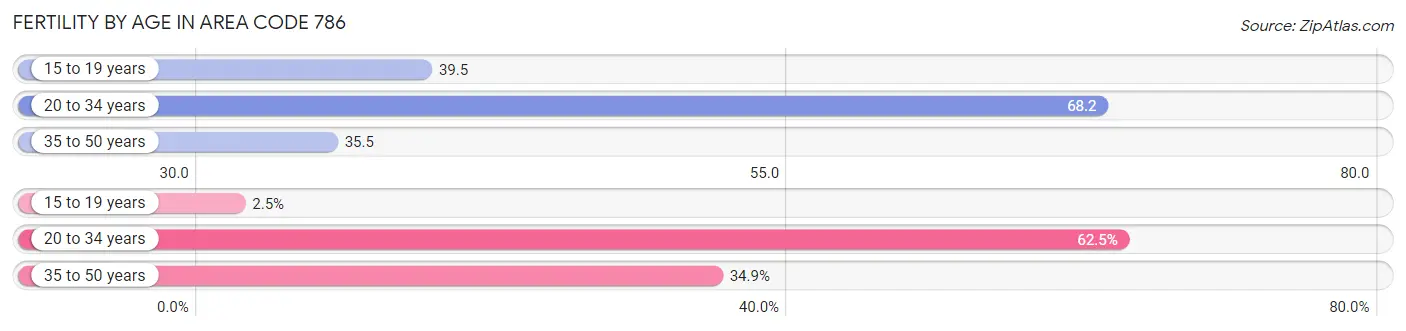
| Age Bracket | Women with Births | Births / 1,000 Women |
| 15 to 19 years | 669 (2.5%) | 39.5 |
| 20 to 34 years | 16,570 (62.5%) | 68.2 |
| 35 to 50 years | 9,254 (34.9%) | 35.5 |
| Total | 26,493 (100.0%) | 45.2 |
Fertility by Age by Marriage Status in Area Code 786
56.4% of women with births (26,493) in Area Code 786 are married. The highest percentage of unmarried women with births falls into 15 to 19 years age bracket with 100.0% of them unmarried at the time of birth, while the lowest percentage of unmarried women with births belong to 35 to 50 years age bracket with 39.6% of them unmarried.
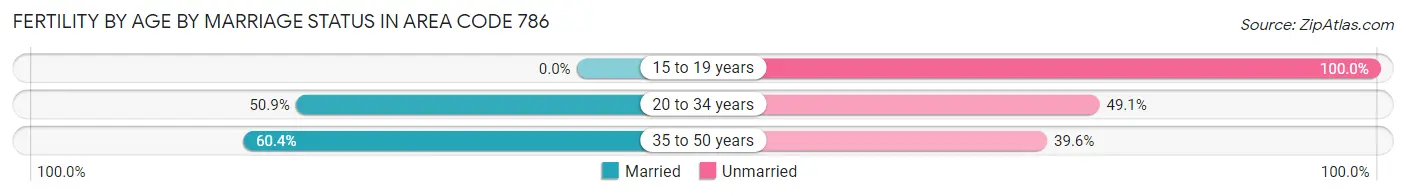
| Age Bracket | Married | Unmarried |
| 15 to 19 years | 0 (0.0%) | 669 (100.0%) |
| 20 to 34 years | 8,437 (50.9%) | 8,133 (49.1%) |
| 35 to 50 years | 5,591 (60.4%) | 3,663 (39.6%) |
| Total | 14,954 (56.5%) | 11,539 (43.5%) |
Fertility by Education in Area Code 786
Average fertility rate in Area Code 786 is 45.2 births per 1,000 women. Women with the education attainment of graduate degree have the highest fertility rate of 62.4 births per 1,000 women, while women with the education attainment of college or associate's degree have the lowest fertility at 38.6 births per 1,000 women. Women with the education attainment of high school diploma represent 25.7% of all women with births.
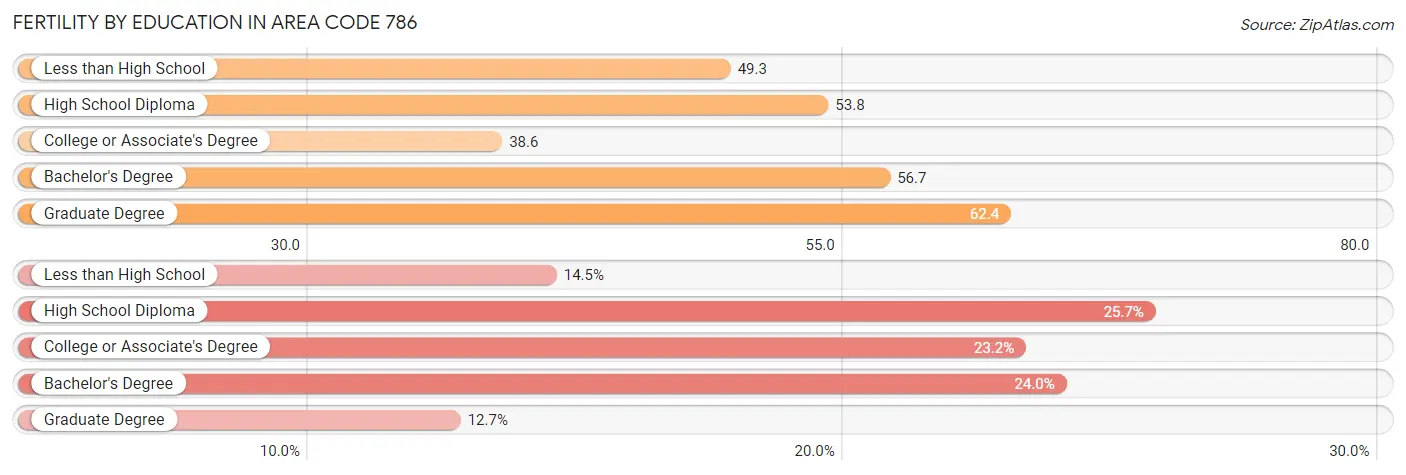
| Educational Attainment | Women with Births | Births / 1,000 Women |
| Less than High School | 3,827 (14.4%) | 49.3 |
| High School Diploma | 6,801 (25.7%) | 53.8 |
| College or Associate's Degree | 6,156 (23.2%) | 38.6 |
| Bachelor's Degree | 6,358 (24.0%) | 56.7 |
| Graduate Degree | 3,351 (12.7%) | 62.4 |
| Total | 26,493 (100.0%) | 45.2 |
Fertility by Education by Marriage Status in Area Code 786
43.5% of women with births in Area Code 786 are unmarried. Women with the educational attainment of bachelor's degree are most likely to be married with 57.2% of them married at childbirth, while women with the educational attainment of less than high school are least likely to be married with 66.1% of them unmarried at childbirth.
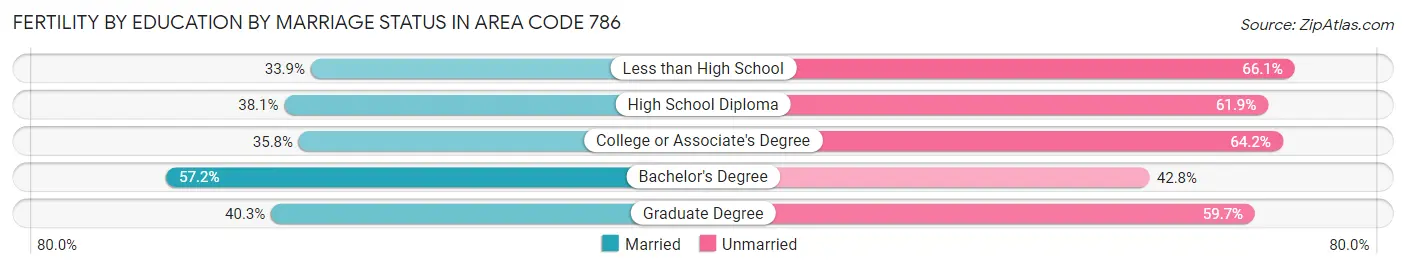
| Educational Attainment | Married | Unmarried |
| Less than High School | 1,296 (33.9%) | 2,531 (66.1%) |
| High School Diploma | 2,593 (38.1%) | 4,208 (61.9%) |
| College or Associate's Degree | 2,203 (35.8%) | 3,953 (64.2%) |
| Bachelor's Degree | 3,636 (57.2%) | 2,722 (42.8%) |
| Graduate Degree | 1,349 (40.3%) | 2,002 (59.7%) |
| Total | 14,954 (56.5%) | 11,539 (43.5%) |
Employment Characteristics in Area Code 786
Employment by Class of Employer in Area Code 786
Among the 1,219,189 employed individuals in Area Code 786, private company employees (852,557 | 69.9%), self-employed (not incorporated) (98,626 | 8.1%), and self-employed (incorporated) (84,288 | 6.9%) make up the most common classes of employment.
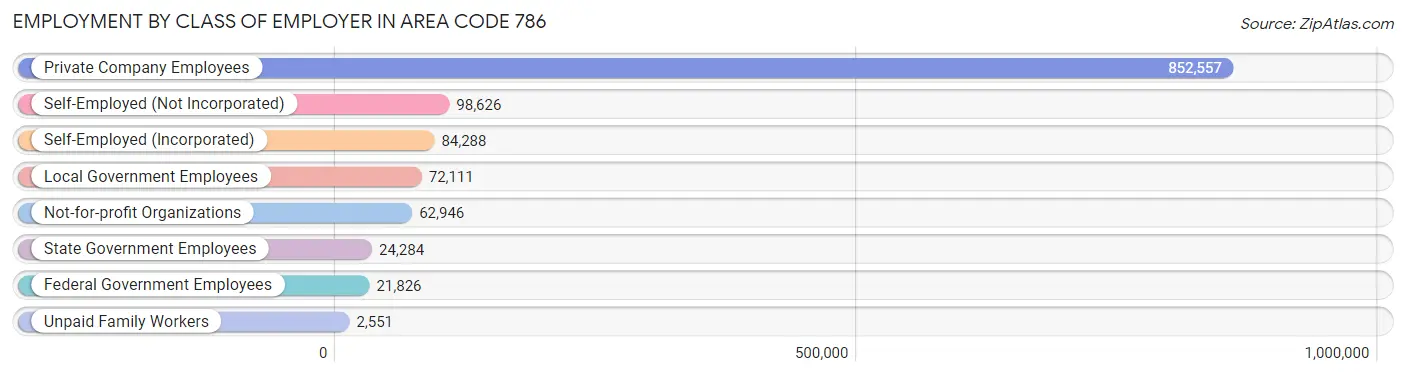
| Employer Class | # Employees | % Employees |
| Private Company Employees | 852,557 | 69.9% |
| Self-Employed (Incorporated) | 84,288 | 6.9% |
| Self-Employed (Not Incorporated) | 98,626 | 8.1% |
| Not-for-profit Organizations | 62,946 | 5.2% |
| Local Government Employees | 72,111 | 5.9% |
| State Government Employees | 24,284 | 2.0% |
| Federal Government Employees | 21,826 | 1.8% |
| Unpaid Family Workers | 2,551 | 0.2% |
| Total | 1,219,189 | 100.0% |
Employment Status by Age in Area Code 786
According to the labor force statistics for Area Code 786, out of the total population over 16 years of age (2,038,740), 63.6% or 1,295,823 individuals are in the labor force, with 4.6% or 59,478 of them unemployed. The age group with the highest labor force participation rate is 35 to 44 years, with 84.2% or 286,253 individuals in the labor force. Within the labor force, the 16 to 19 years age range has the highest percentage of unemployed individuals, with 1,030.7% or 289,245 of them being unemployed.
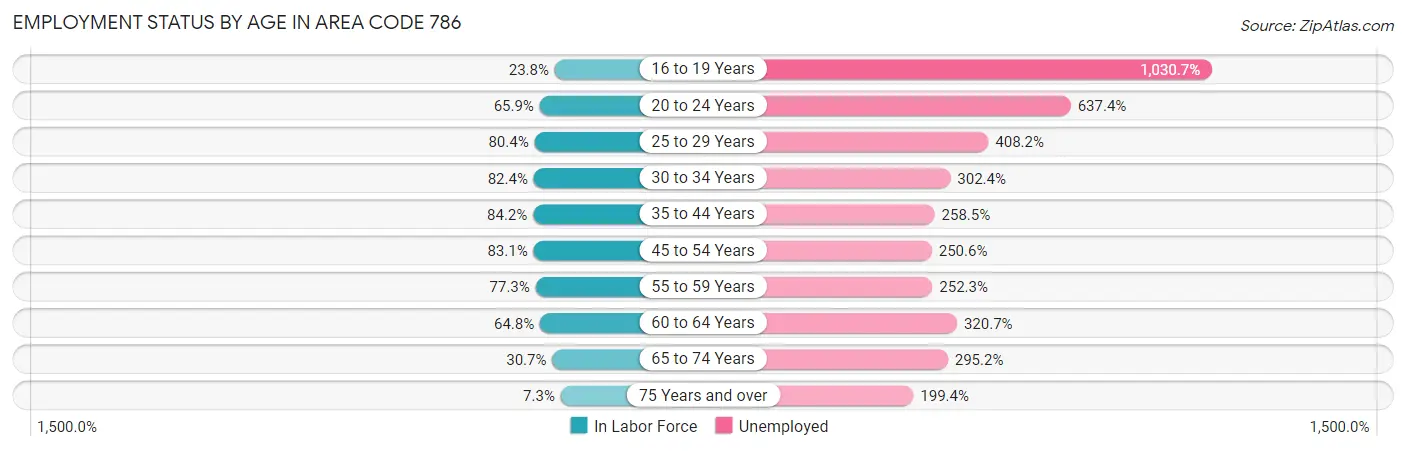
| Age Bracket | In Labor Force | Unemployed |
| 16 to 19 Years | 28,067 (23.8%) | 289,245 (1,030.7%) |
| 20 to 24 Years | 100,469 (65.9%) | 640,383 (637.4%) |
| 25 to 29 Years | 133,144 (80.3%) | 543,526 (408.2%) |
| 30 to 34 Years | 144,802 (82.4%) | 437,872 (302.4%) |
| 35 to 44 Years | 286,261 (84.2%) | 739,964 (258.5%) |
| 45 to 54 Years | 296,188 (83.1%) | 742,270 (250.6%) |
| 55 to 59 Years | 135,496 (77.2%) | 341,844 (252.3%) |
| 60 to 64 Years | 94,438 (64.8%) | 302,882 (320.7%) |
| 65 to 74 Years | 67,906 (30.7%) | 200,488 (295.2%) |
| 75 Years and over | 13,663 (7.3%) | 27,230 (199.4%) |
| Total | 1,295,732 (63.6%) | 59,462 (4.6%) |
Employment Status by Educational Attainment in Area Code 786
According to labor force statistics for Area Code 786, 80.2% of individuals (1,089,820) out of the total population between 25 and 64 years of age (1,358,709) are in the labor force, with 281.5% or 3,067,843 of them being unemployed. The group with the highest labor force participation rate are those with the educational attainment of bachelor's degree or higher, with 86.5% or 406,387 individuals in the labor force. Within the labor force, individuals with less than high school education have the highest percentage of unemployment, with 356.2% or 429,267 of them being unemployed.
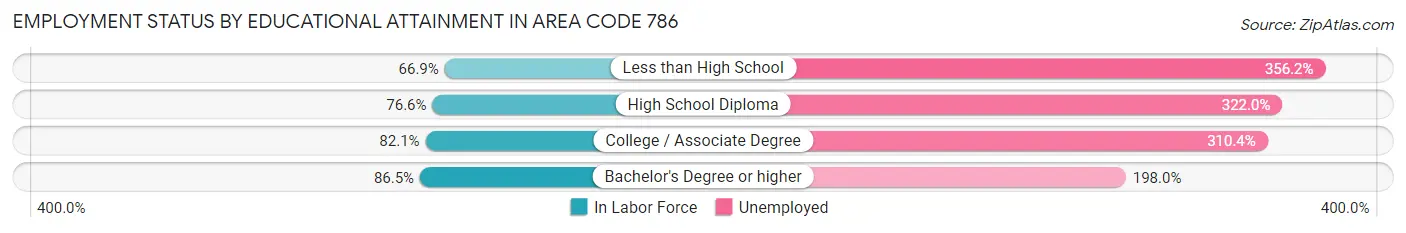
| Educational Attainment | In Labor Force | Unemployed |
| Less than High School | 120,518 (66.9%) | 641,655 (356.2%) |
| High School Diploma | 280,070 (76.6%) | 1,177,019 (322.0%) |
| College / Associate Degree | 281,664 (82.1%) | 1,064,526 (310.4%) |
| Bachelor's Degree or higher | 406,387 (86.5%) | 930,764 (198.0%) |
| Total | 1,089,817 (80.2%) | 3,824,766 (281.5%) |
Employment Occupations by Sex in Area Code 786
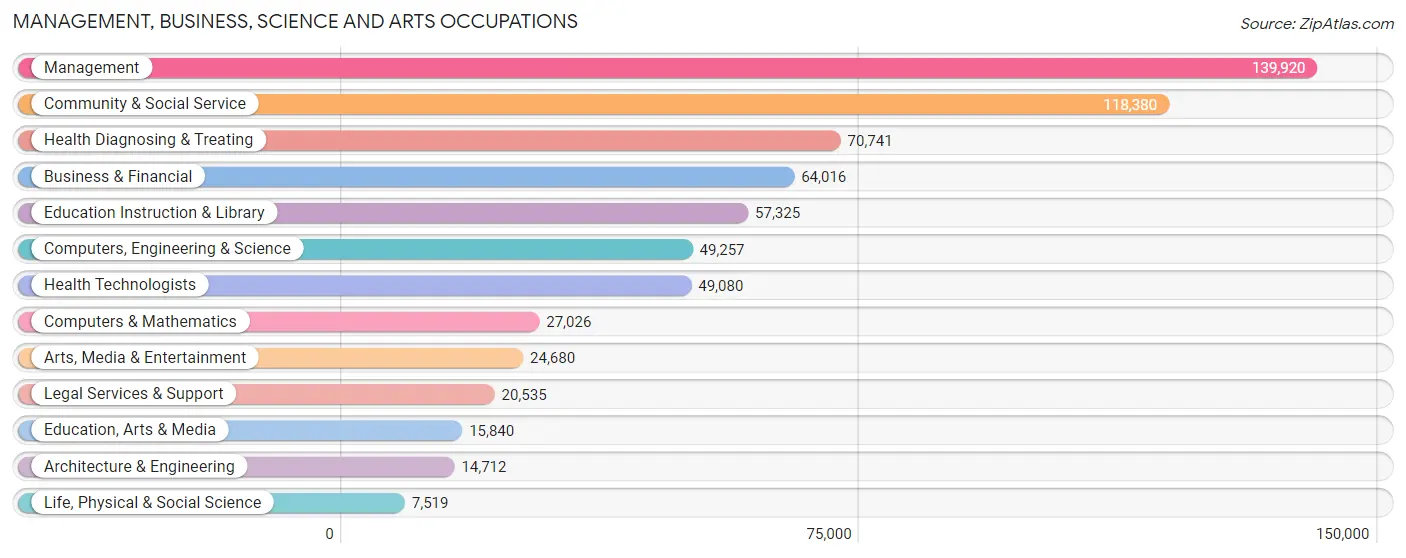
Management, Business, Science and Arts Occupations
The most common Management, Business, Science and Arts occupations in Area Code 786 are Management (139,920 | 11.3%), Community & Social Service (118,380 | 9.5%), Health Diagnosing & Treating (70,741 | 5.7%), Business & Financial (64,016 | 5.2%), and Education Instruction & Library (57,325 | 4.6%).
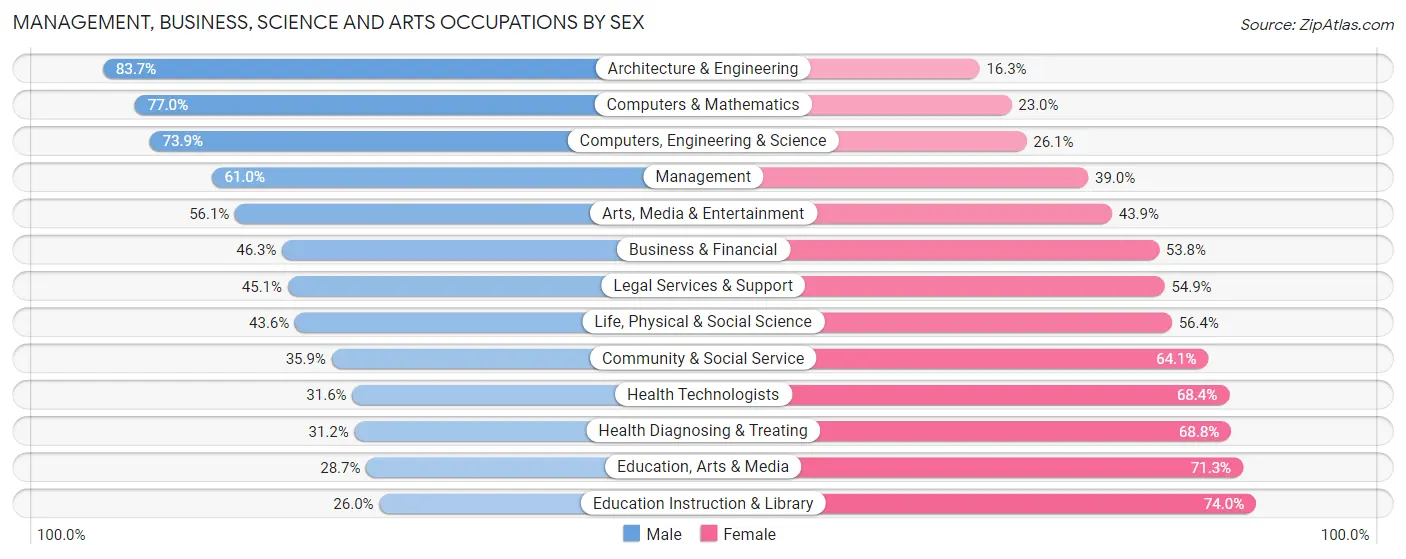
Management, Business, Science and Arts Occupations by Sex
Within the Management, Business, Science and Arts occupations in Area Code 786, the most male-oriented occupations are Architecture & Engineering (83.7%), Computers & Mathematics (77.0%), and Computers, Engineering & Science (73.9%), while the most female-oriented occupations are Education Instruction & Library (74.0%), Education, Arts & Media (71.3%), and Health Diagnosing & Treating (68.8%).
| Occupation | Male | Female |
| Management | 85,367 (61.0%) | 54,553 (39.0%) |
| Business & Financial | 29,609 (46.3%) | 34,407 (53.7%) |
| Computers, Engineering & Science | 36,399 (73.9%) | 12,858 (26.1%) |
| Computers & Mathematics | 20,813 (77.0%) | 6,213 (23.0%) |
| Architecture & Engineering | 12,310 (83.7%) | 2,402 (16.3%) |
| Life, Physical & Social Science | 3,276 (43.6%) | 4,243 (56.4%) |
| Community & Social Service | 42,544 (35.9%) | 75,836 (64.1%) |
| Education, Arts & Media | 4,550 (28.7%) | 11,290 (71.3%) |
| Legal Services & Support | 9,258 (45.1%) | 11,277 (54.9%) |
| Education Instruction & Library | 14,898 (26.0%) | 42,427 (74.0%) |
| Arts, Media & Entertainment | 13,838 (56.1%) | 10,842 (43.9%) |
| Health Diagnosing & Treating | 22,051 (31.2%) | 48,690 (68.8%) |
| Health Technologists | 15,517 (31.6%) | 33,563 (68.4%) |
| Total (Category) | 215,970 (48.8%) | 226,344 (51.2%) |
| Total (Overall) | 663,924 (53.5%) | 576,778 (46.5%) |
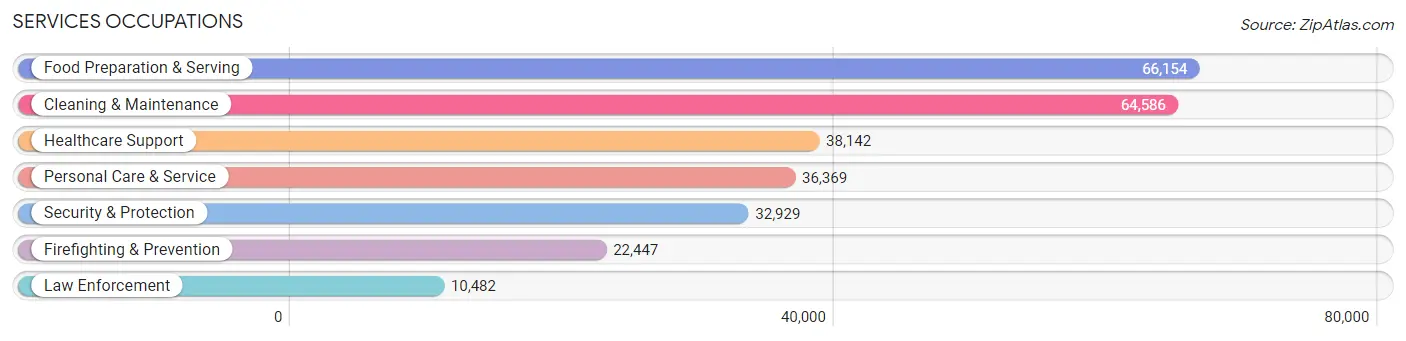
Services Occupations
The most common Services occupations in Area Code 786 are Food Preparation & Serving (66,154 | 5.3%), Cleaning & Maintenance (64,586 | 5.2%), Healthcare Support (38,142 | 3.1%), Personal Care & Service (36,369 | 2.9%), and Security & Protection (32,929 | 2.6%).
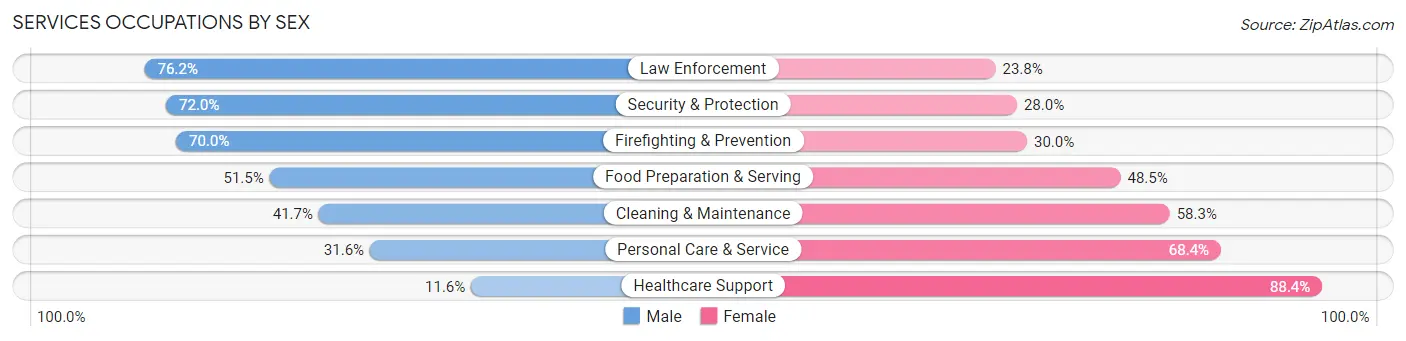
Services Occupations by Sex
Within the Services occupations in Area Code 786, the most male-oriented occupations are Law Enforcement (76.2%), Security & Protection (72.0%), and Firefighting & Prevention (70.0%), while the most female-oriented occupations are Healthcare Support (88.4%), Personal Care & Service (68.4%), and Cleaning & Maintenance (58.3%).
| Occupation | Male | Female |
| Healthcare Support | 4,416 (11.6%) | 33,726 (88.4%) |
| Security & Protection | 23,704 (72.0%) | 9,225 (28.0%) |
| Firefighting & Prevention | 15,713 (70.0%) | 6,734 (30.0%) |
| Law Enforcement | 7,991 (76.2%) | 2,491 (23.8%) |
| Food Preparation & Serving | 34,064 (51.5%) | 32,090 (48.5%) |
| Cleaning & Maintenance | 26,959 (41.7%) | 37,627 (58.3%) |
| Personal Care & Service | 11,500 (31.6%) | 24,869 (68.4%) |
| Total (Category) | 100,643 (42.3%) | 137,537 (57.7%) |
| Total (Overall) | 663,924 (53.5%) | 576,778 (46.5%) |
Sales and Office Occupations
The most common Sales and Office occupations in Area Code 786 are Office & Administration (146,523 | 11.8%), and Sales & Related (141,614 | 11.4%).
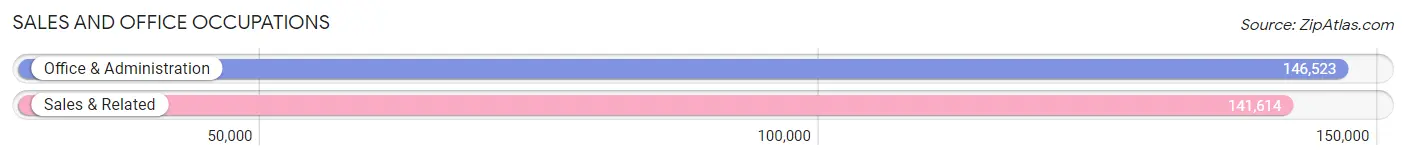
Sales and Office Occupations by Sex
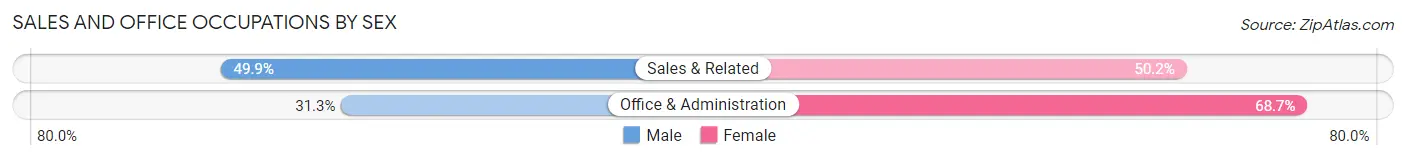
| Occupation | Male | Female |
| Sales & Related | 70,592 (49.8%) | 71,022 (50.1%) |
| Office & Administration | 45,836 (31.3%) | 100,687 (68.7%) |
| Total (Category) | 116,428 (40.4%) | 171,709 (59.6%) |
| Total (Overall) | 663,924 (53.5%) | 576,778 (46.5%) |
Natural Resources, Construction and Maintenance Occupations
The most common Natural Resources, Construction and Maintenance occupations in Area Code 786 are Construction & Extraction (78,491 | 6.3%), Installation, Maintenance & Repair (41,152 | 3.3%), and Farming, Fishing & Forestry (5,514 | 0.4%).
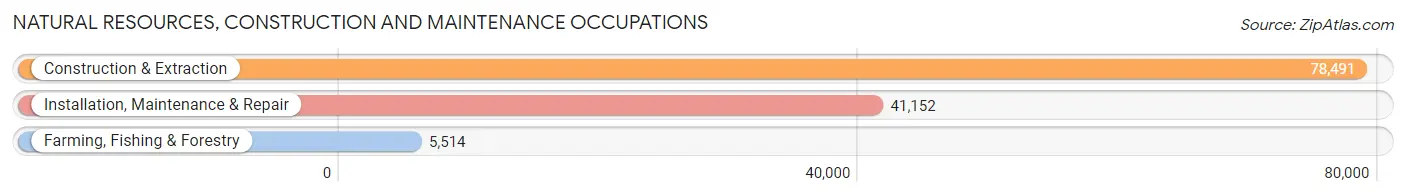
Natural Resources, Construction and Maintenance Occupations by Sex
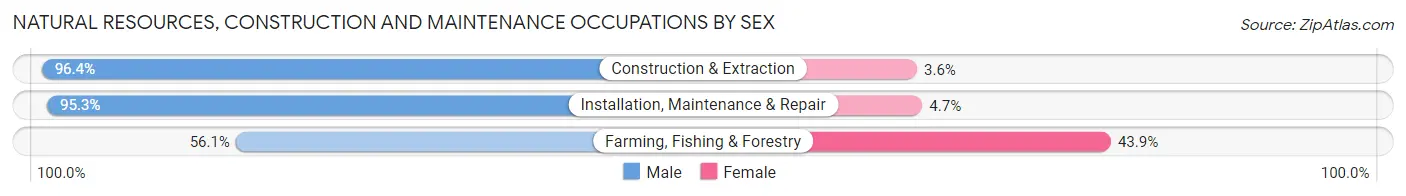
| Occupation | Male | Female |
| Farming, Fishing & Forestry | 3,092 (56.1%) | 2,422 (43.9%) |
| Construction & Extraction | 75,688 (96.4%) | 2,803 (3.6%) |
| Installation, Maintenance & Repair | 39,225 (95.3%) | 1,927 (4.7%) |
| Total (Category) | 118,005 (94.3%) | 7,152 (5.7%) |
| Total (Overall) | 663,924 (53.5%) | 576,778 (46.5%) |
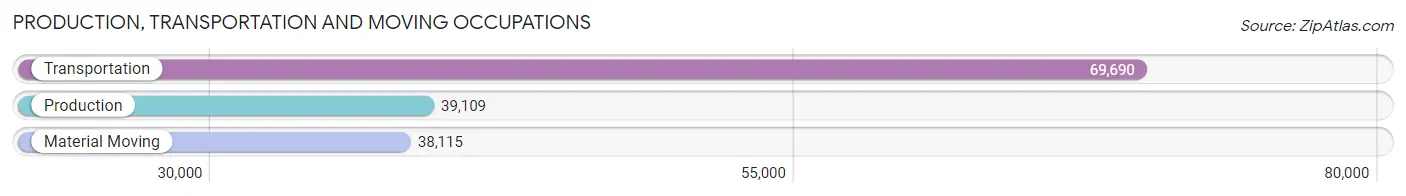
Production, Transportation and Moving Occupations
The most common Production, Transportation and Moving occupations in Area Code 786 are Transportation (69,690 | 5.6%), Production (39,109 | 3.2%), and Material Moving (38,115 | 3.1%).
Production, Transportation and Moving Occupations by Sex
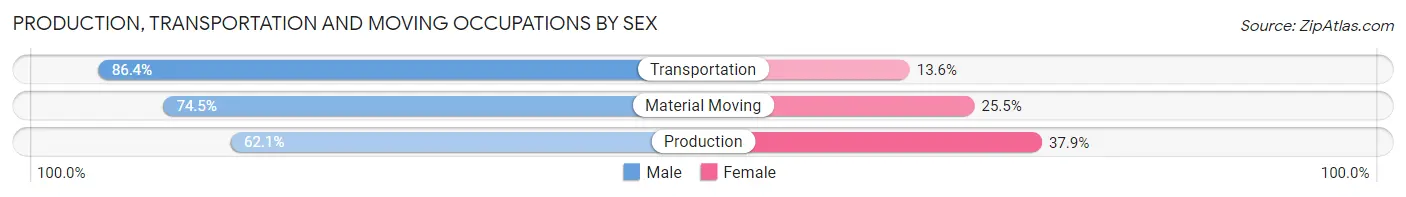
| Occupation | Male | Female |
| Production | 24,290 (62.1%) | 14,819 (37.9%) |
| Transportation | 60,194 (86.4%) | 9,496 (13.6%) |
| Material Moving | 28,394 (74.5%) | 9,721 (25.5%) |
| Total (Category) | 112,878 (76.8%) | 34,036 (23.2%) |
| Total (Overall) | 663,924 (53.5%) | 576,778 (46.5%) |
Employment Industries by Sex in Area Code 786
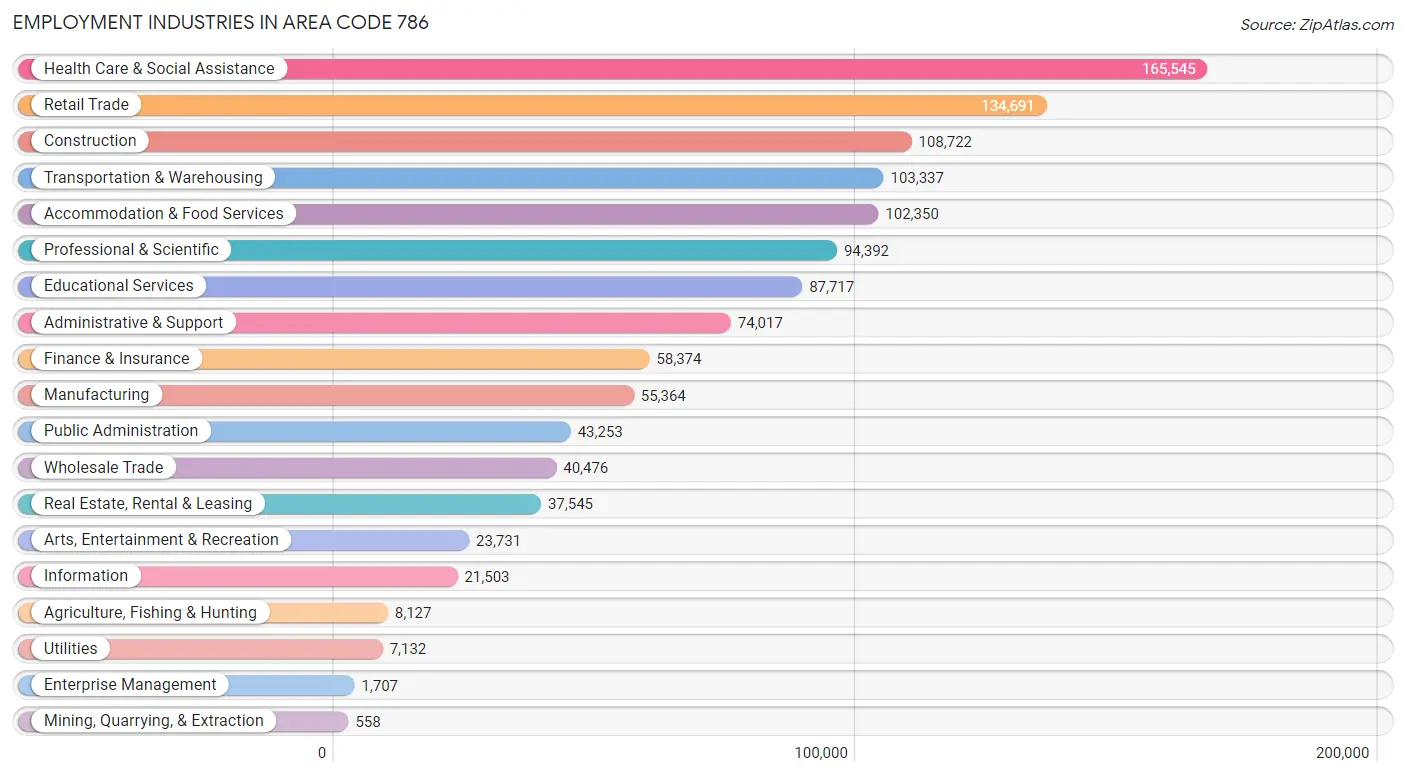
Employment Industries in Area Code 786
The major employment industries in Area Code 786 include Health Care & Social Assistance (165,545 | 13.3%), Retail Trade (134,691 | 10.9%), Construction (108,722 | 8.8%), Transportation & Warehousing (103,337 | 8.3%), and Accommodation & Food Services (102,350 | 8.3%).
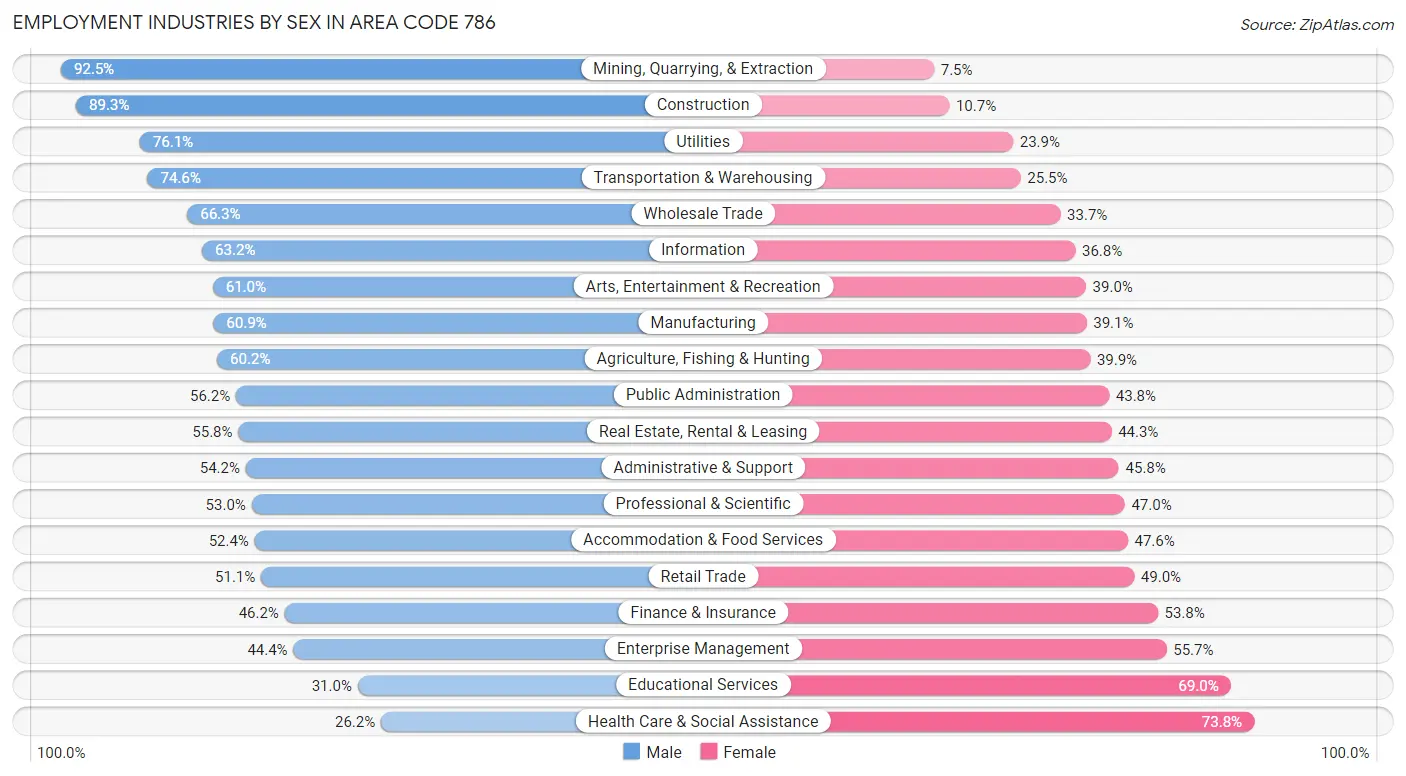
Employment Industries by Sex in Area Code 786
The Area Code 786 industries that see more men than women are Mining, Quarrying, & Extraction (92.5%), Construction (89.3%), and Utilities (76.1%), whereas the industries that tend to have a higher number of women are Health Care & Social Assistance (73.8%), Educational Services (69.0%), and Enterprise Management (55.6%).
| Industry | Male | Female |
| Agriculture, Fishing & Hunting | 4,888 (60.2%) | 3,239 (39.9%) |
| Mining, Quarrying, & Extraction | 516 (92.5%) | 42 (7.5%) |
| Construction | 97,122 (89.3%) | 11,600 (10.7%) |
| Manufacturing | 33,722 (60.9%) | 21,642 (39.1%) |
| Wholesale Trade | 26,844 (66.3%) | 13,632 (33.7%) |
| Retail Trade | 68,764 (51.0%) | 65,927 (48.9%) |
| Transportation & Warehousing | 77,041 (74.6%) | 26,296 (25.5%) |
| Utilities | 5,429 (76.1%) | 1,703 (23.9%) |
| Information | 13,598 (63.2%) | 7,905 (36.8%) |
| Finance & Insurance | 26,944 (46.2%) | 31,430 (53.8%) |
| Real Estate, Rental & Leasing | 20,931 (55.7%) | 16,614 (44.3%) |
| Professional & Scientific | 50,024 (53.0%) | 44,368 (47.0%) |
| Enterprise Management | 757 (44.4%) | 950 (55.6%) |
| Administrative & Support | 40,132 (54.2%) | 33,885 (45.8%) |
| Educational Services | 27,231 (31.0%) | 60,486 (69.0%) |
| Health Care & Social Assistance | 43,399 (26.2%) | 122,146 (73.8%) |
| Arts, Entertainment & Recreation | 14,485 (61.0%) | 9,246 (39.0%) |
| Accommodation & Food Services | 53,597 (52.4%) | 48,753 (47.6%) |
| Public Administration | 24,325 (56.2%) | 18,928 (43.8%) |
| Total | 663,924 (53.5%) | 576,778 (46.5%) |
Education in Area Code 786
School Enrollment in Area Code 786
The most common levels of schooling among the 592,699 students in Area Code 786 are college / undergraduate (146,408 | 24.7%), high school (118,382 | 20.0%), and middle school (112,204 | 18.9%).
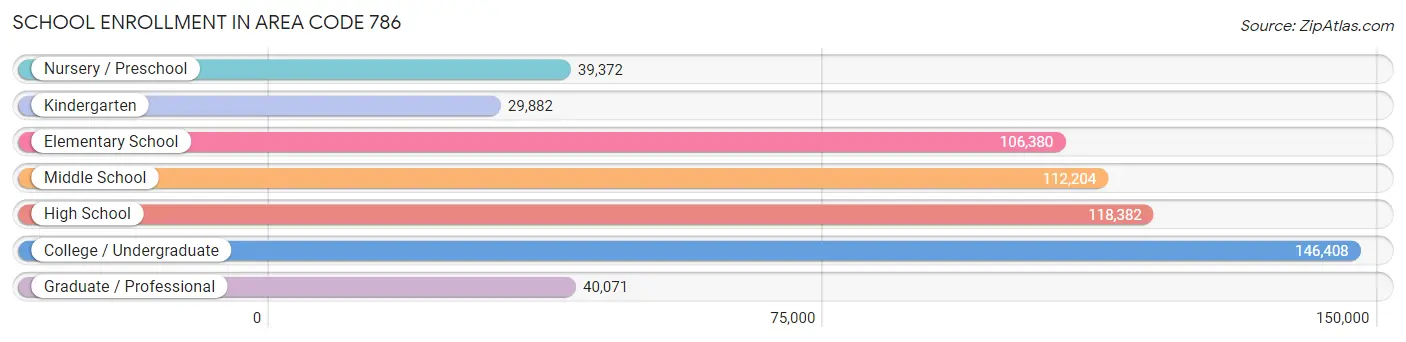
| School Level | # Students | % Students |
| Nursery / Preschool | 39,372 | 6.6% |
| Kindergarten | 29,882 | 5.0% |
| Elementary School | 106,380 | 17.9% |
| Middle School | 112,204 | 18.9% |
| High School | 118,382 | 20.0% |
| College / Undergraduate | 146,408 | 24.7% |
| Graduate / Professional | 40,071 | 6.8% |
| Total | 592,699 | 100.0% |
School Enrollment by Age by Funding Source in Area Code 786
Out of a total of 592,699 students who are enrolled in schools in Area Code 786, 125,979 (21.3%) attend a private institution, while the remaining 466,720 (78.7%) are enrolled in public schools. The age group of 3 to 4 year olds has the highest likelihood of being enrolled in private schools, with 15,557 (43.9% in the age bracket) enrolled. Conversely, the age group of 15 to 17 year olds has the lowest likelihood of being enrolled in a private school, with 70,267 (86.4% in the age bracket) attending a public institution.
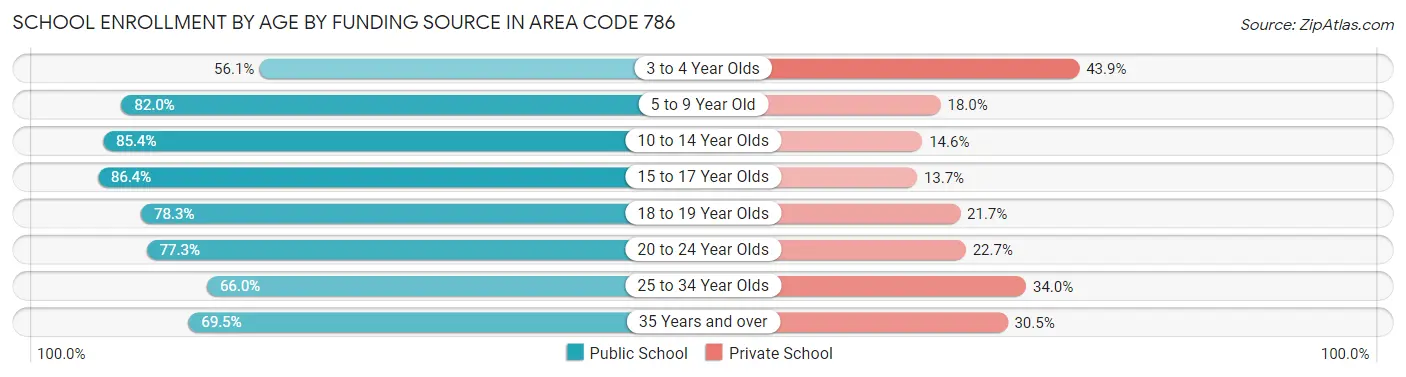
| Age Bracket | Public School | Private School |
| 3 to 4 Year Olds | 19,894 (56.1%) | 15,557 (43.9%) |
| 5 to 9 Year Old | 103,101 (82.0%) | 22,698 (18.0%) |
| 10 to 14 Year Olds | 116,843 (85.4%) | 20,030 (14.6%) |
| 15 to 17 Year Olds | 70,267 (86.4%) | 11,111 (13.7%) |
| 18 to 19 Year Olds | 37,859 (78.3%) | 10,486 (21.7%) |
| 20 to 24 Year Olds | 57,187 (77.3%) | 16,833 (22.7%) |
| 25 to 34 Year Olds | 29,475 (66.0%) | 15,162 (34.0%) |
| 35 Years and over | 32,102 (69.5%) | 14,094 (30.5%) |
| Total | 466,720 (78.7%) | 125,979 (21.3%) |
Educational Attainment by Field of Study in Area Code 786
Business (158,434 | 26.5%), science & technology (66,511 | 11.1%), education (62,714 | 10.5%), engineering (59,369 | 9.9%), and social sciences (42,099 | 7.0%) are the most common fields of study among 596,983 individuals in Area Code 786 who have obtained a bachelor's degree or higher.
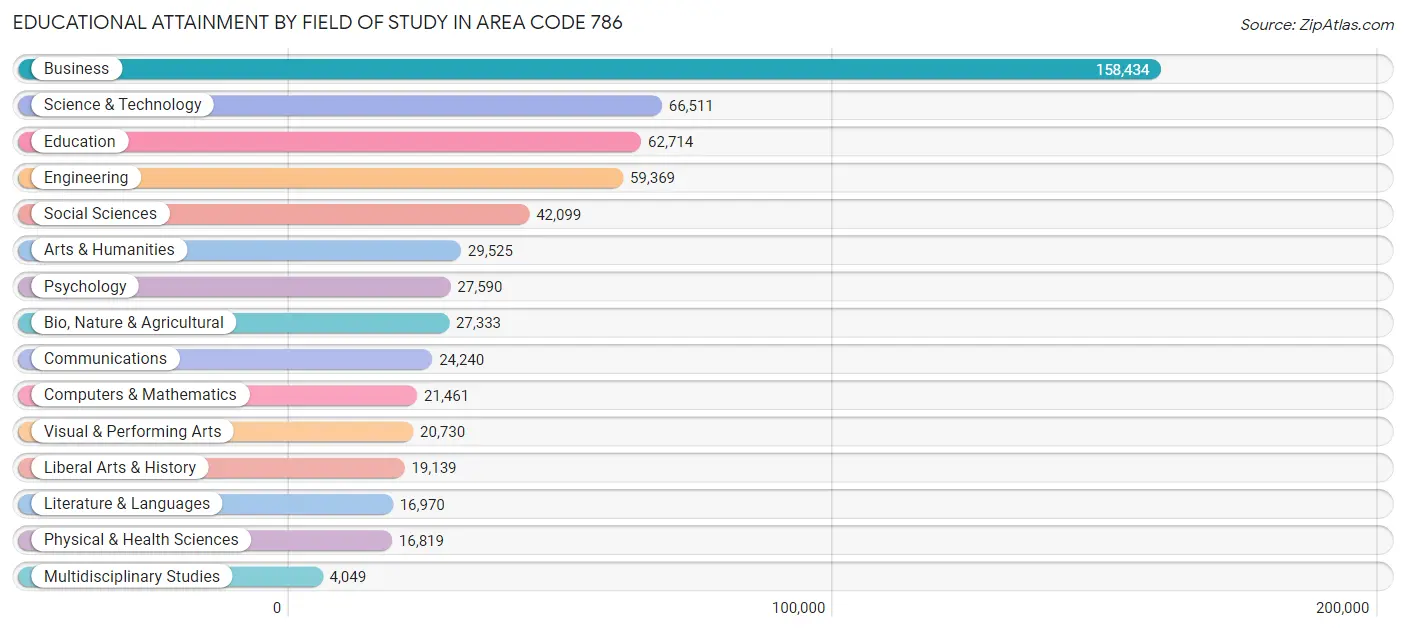
| Field of Study | # Graduates | % Graduates |
| Computers & Mathematics | 21,461 | 3.6% |
| Bio, Nature & Agricultural | 27,333 | 4.6% |
| Physical & Health Sciences | 16,819 | 2.8% |
| Psychology | 27,590 | 4.6% |
| Social Sciences | 42,099 | 7.0% |
| Engineering | 59,369 | 9.9% |
| Multidisciplinary Studies | 4,049 | 0.7% |
| Science & Technology | 66,511 | 11.1% |
| Business | 158,434 | 26.5% |
| Education | 62,714 | 10.5% |
| Literature & Languages | 16,970 | 2.8% |
| Liberal Arts & History | 19,139 | 3.2% |
| Visual & Performing Arts | 20,730 | 3.5% |
| Communications | 24,240 | 4.1% |
| Arts & Humanities | 29,525 | 5.0% |
| Total | 596,983 | 100.0% |
Transportation & Commute in Area Code 786
Vehicle Availability by Sex in Area Code 786
The most prevalent vehicle ownership categories in Area Code 786 are males with 2 vehicles (271,382, accounting for 41.6%) and females with 2 vehicles (223,178, making up 48.3%).
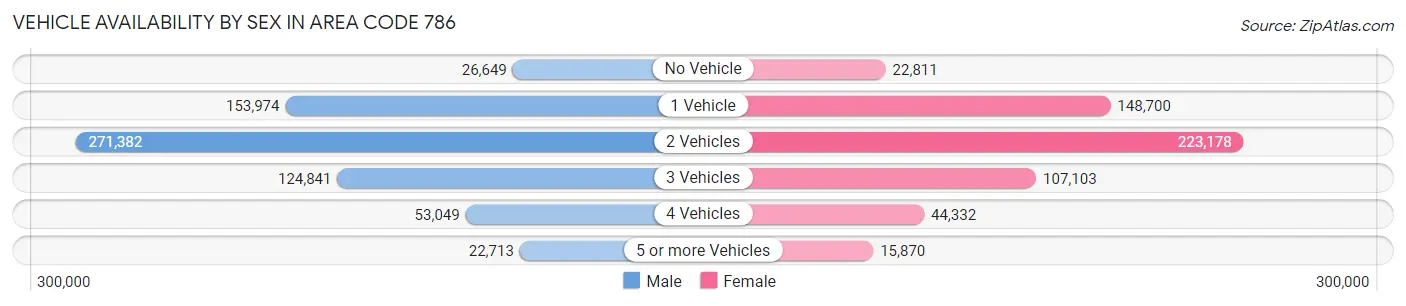
| Vehicles Available | Male | Female |
| No Vehicle | 26,649 (4.1%) | 22,811 (4.1%) |
| 1 Vehicle | 153,974 (23.6%) | 148,700 (26.5%) |
| 2 Vehicles | 271,382 (41.6%) | 223,178 (39.7%) |
| 3 Vehicles | 124,841 (19.1%) | 107,103 (19.1%) |
| 4 Vehicles | 53,049 (8.1%) | 44,332 (7.9%) |
| 5 or more Vehicles | 22,713 (3.5%) | 15,870 (2.8%) |
| Total | 652,608 (100.0%) | 561,994 (100.0%) |
Commute Time in Area Code 786
The most frequently occuring commute durations in Area Code 786 are 30 to 34 minutes (219,439 commuters, 20.1%), 20 to 24 minutes (162,364 commuters, 14.8%), and 45 to 59 minutes (124,988 commuters, 11.4%).
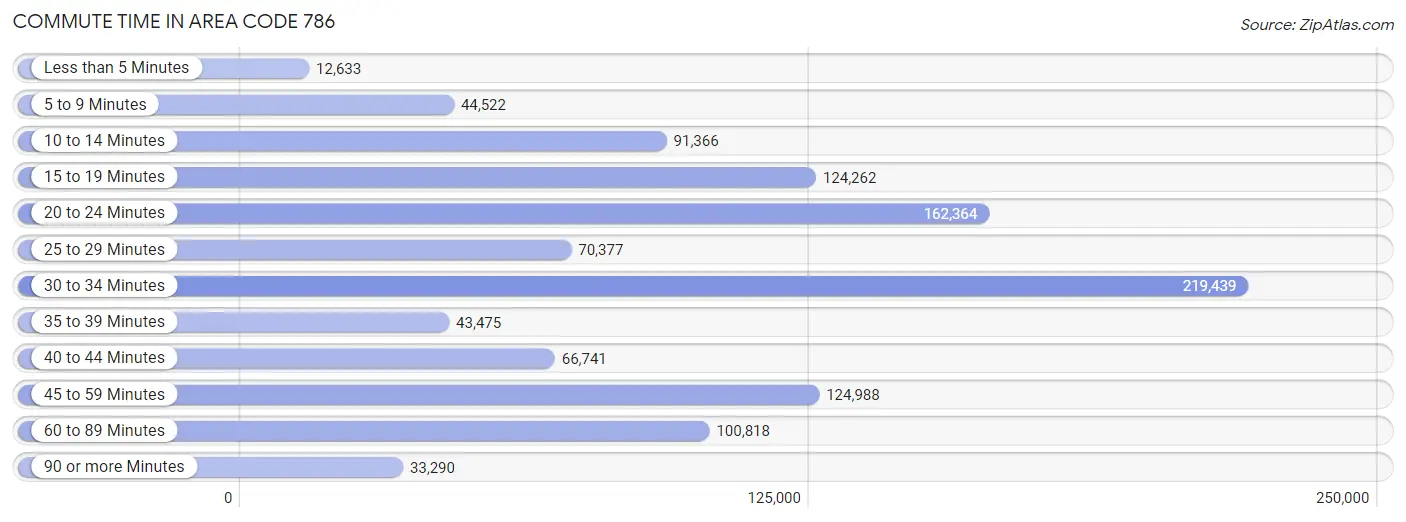
| Commute Time | # Commuters | % Commuters |
| Less than 5 Minutes | 12,633 | 1.1% |
| 5 to 9 Minutes | 44,522 | 4.1% |
| 10 to 14 Minutes | 91,366 | 8.4% |
| 15 to 19 Minutes | 124,262 | 11.4% |
| 20 to 24 Minutes | 162,364 | 14.8% |
| 25 to 29 Minutes | 70,377 | 6.4% |
| 30 to 34 Minutes | 219,439 | 20.1% |
| 35 to 39 Minutes | 43,475 | 4.0% |
| 40 to 44 Minutes | 66,741 | 6.1% |
| 45 to 59 Minutes | 124,988 | 11.4% |
| 60 to 89 Minutes | 100,818 | 9.2% |
| 90 or more Minutes | 33,290 | 3.0% |
Commute Time by Sex in Area Code 786
The most common commute times in Area Code 786 are 30 to 34 minutes (120,504 commuters, 20.4%) for males and 30 to 34 minutes (98,935 commuters, 19.6%) for females.
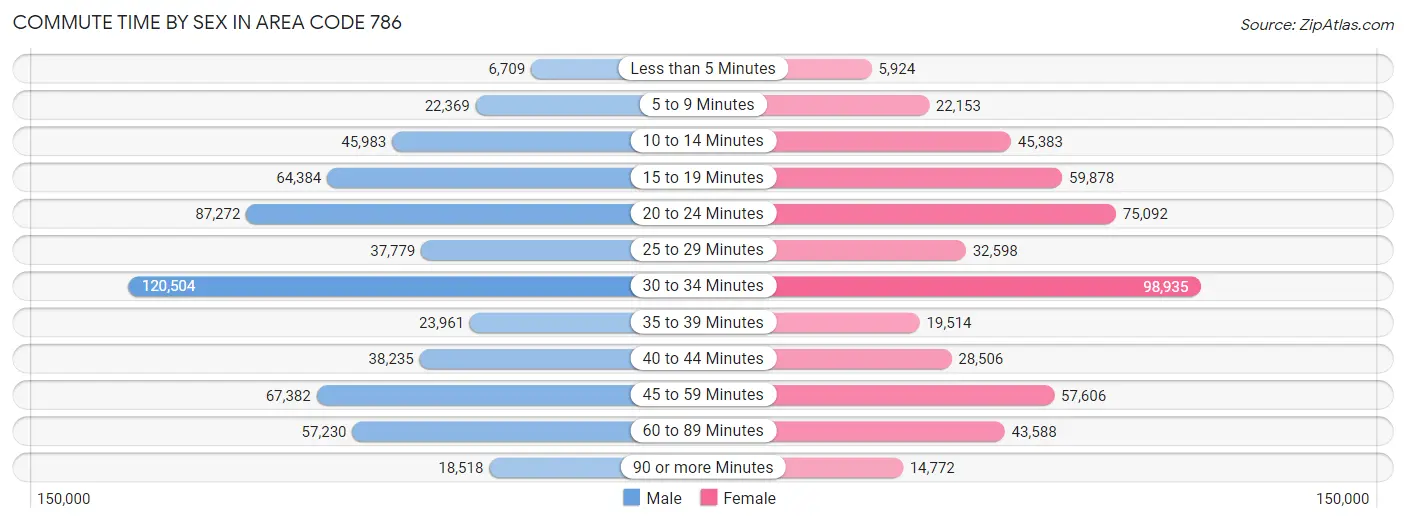
| Commute Time | Male | Female |
| Less than 5 Minutes | 6,709 (1.1%) | 5,924 (1.2%) |
| 5 to 9 Minutes | 22,369 (3.8%) | 22,153 (4.4%) |
| 10 to 14 Minutes | 45,983 (7.8%) | 45,383 (9.0%) |
| 15 to 19 Minutes | 64,384 (10.9%) | 59,878 (11.9%) |
| 20 to 24 Minutes | 87,272 (14.8%) | 75,092 (14.9%) |
| 25 to 29 Minutes | 37,779 (6.4%) | 32,598 (6.5%) |
| 30 to 34 Minutes | 120,504 (20.4%) | 98,935 (19.6%) |
| 35 to 39 Minutes | 23,961 (4.1%) | 19,514 (3.9%) |
| 40 to 44 Minutes | 38,235 (6.5%) | 28,506 (5.7%) |
| 45 to 59 Minutes | 67,382 (11.4%) | 57,606 (11.4%) |
| 60 to 89 Minutes | 57,230 (9.7%) | 43,588 (8.6%) |
| 90 or more Minutes | 18,518 (3.1%) | 14,772 (2.9%) |
Time of Departure to Work by Sex in Area Code 786
The most frequent times of departure to work in Area Code 786 are 8:00 AM to 8:29 AM (94,692, 16.0%) for males and 8:00 AM to 8:29 AM (91,937, 18.2%) for females.
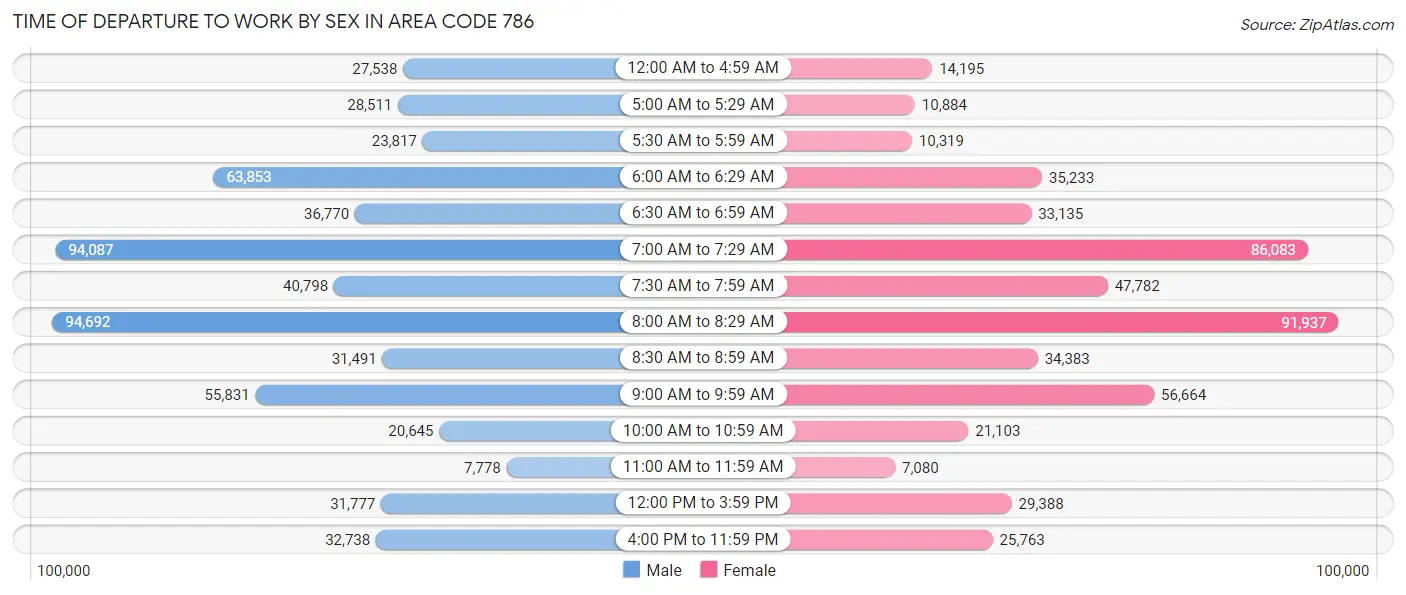
| Time of Departure | Male | Female |
| 12:00 AM to 4:59 AM | 27,538 (4.7%) | 14,195 (2.8%) |
| 5:00 AM to 5:29 AM | 28,511 (4.8%) | 10,884 (2.2%) |
| 5:30 AM to 5:59 AM | 23,817 (4.0%) | 10,319 (2.1%) |
| 6:00 AM to 6:29 AM | 63,853 (10.8%) | 35,233 (7.0%) |
| 6:30 AM to 6:59 AM | 36,770 (6.2%) | 33,135 (6.6%) |
| 7:00 AM to 7:29 AM | 94,087 (15.9%) | 86,083 (17.1%) |
| 7:30 AM to 7:59 AM | 40,798 (6.9%) | 47,782 (9.5%) |
| 8:00 AM to 8:29 AM | 94,692 (16.0%) | 91,937 (18.2%) |
| 8:30 AM to 8:59 AM | 31,491 (5.3%) | 34,383 (6.8%) |
| 9:00 AM to 9:59 AM | 55,831 (9.5%) | 56,664 (11.2%) |
| 10:00 AM to 10:59 AM | 20,645 (3.5%) | 21,103 (4.2%) |
| 11:00 AM to 11:59 AM | 7,778 (1.3%) | 7,080 (1.4%) |
| 12:00 PM to 3:59 PM | 31,777 (5.4%) | 29,388 (5.8%) |
| 4:00 PM to 11:59 PM | 32,738 (5.6%) | 25,763 (5.1%) |
| Total | 590,326 (100.0%) | 503,949 (100.0%) |
Housing Occupancy in Area Code 786
Occupancy by Ownership in Area Code 786
Of the total 877,251 dwellings in Area Code 786, owner-occupied units account for 451,762 (51.5%), while renter-occupied units make up 425,489 (48.5%).
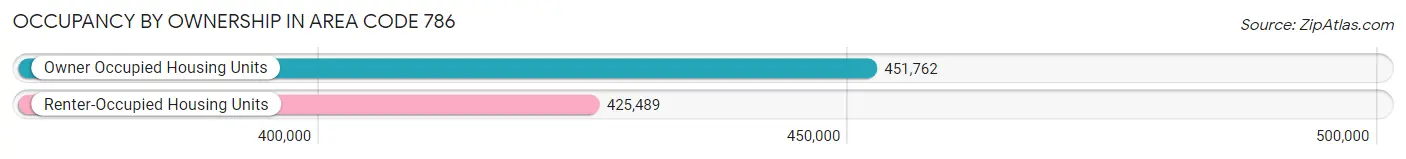
| Occupancy | # Housing Units | % Housing Units |
| Owner Occupied Housing Units | 451,762 | 51.5% |
| Renter-Occupied Housing Units | 425,489 | 48.5% |
| Total Occupied Housing Units | 877,251 | 100.0% |
Occupancy by Household Size in Area Code 786
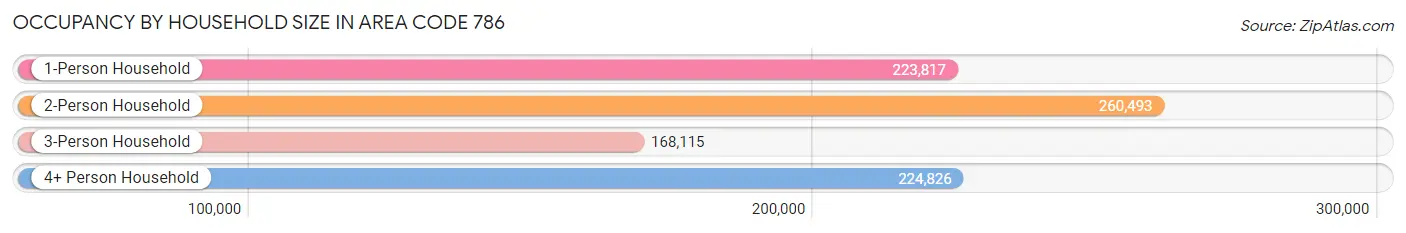
| Household Size | # Housing Units | % Housing Units |
| 1-Person Household | 223,817 | 25.5% |
| 2-Person Household | 260,493 | 29.7% |
| 3-Person Household | 168,115 | 19.2% |
| 4+ Person Household | 224,826 | 25.6% |
| Total Housing Units | 877,251 | 100.0% |
Occupancy by Ownership by Household Size in Area Code 786
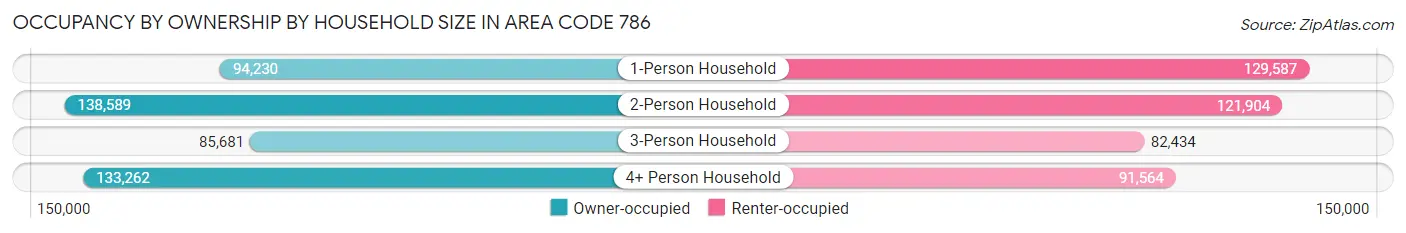
| Household Size | Owner-occupied | Renter-occupied |
| 1-Person Household | 94,230 (42.1%) | 129,587 (57.9%) |
| 2-Person Household | 138,589 (53.2%) | 121,904 (46.8%) |
| 3-Person Household | 85,681 (51.0%) | 82,434 (49.0%) |
| 4+ Person Household | 133,262 (59.3%) | 91,564 (40.7%) |
| Total Housing Units | 451,762 (51.5%) | 425,489 (48.5%) |
Occupancy by Educational Attainment in Area Code 786
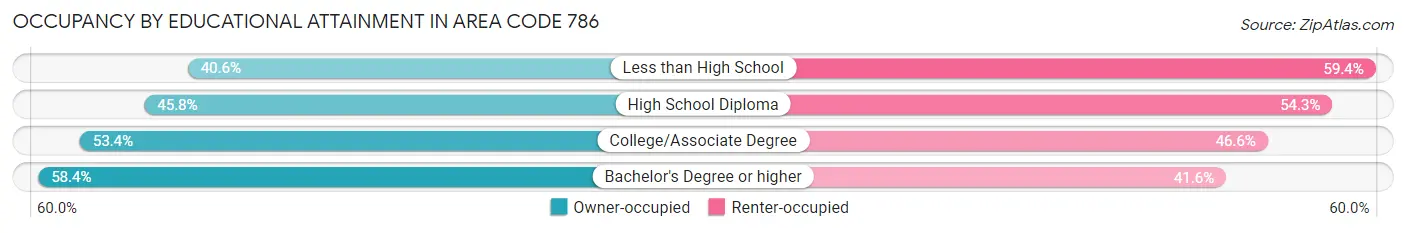
| Household Size | Owner-occupied | Renter-occupied |
| Less than High School | 53,314 (40.6%) | 78,036 (59.4%) |
| High School Diploma | 94,455 (45.8%) | 111,992 (54.2%) |
| College/Associate Degree | 118,067 (53.4%) | 102,892 (46.6%) |
| Bachelor's Degree or higher | 185,926 (58.4%) | 132,569 (41.6%) |
Occupancy by Age of Householder in Area Code 786
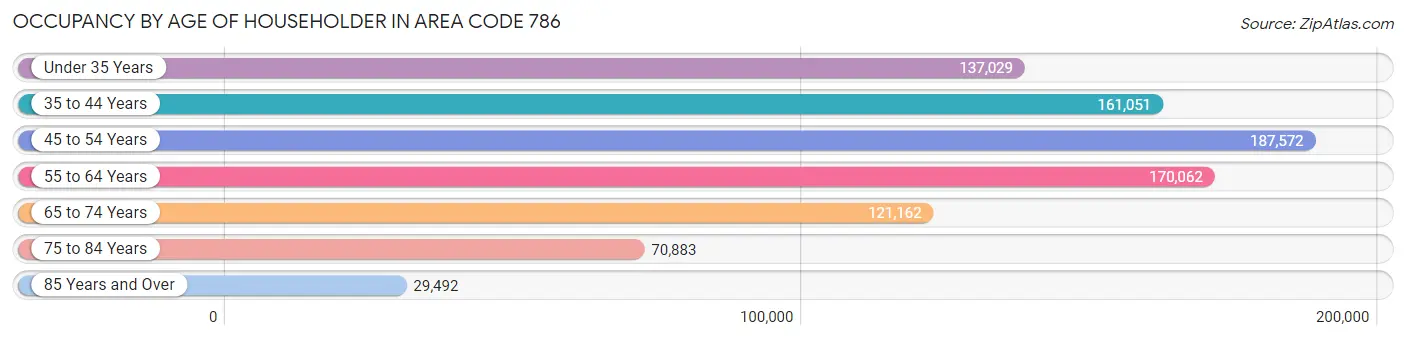
| Age Bracket | # Households | % Households |
| Under 35 Years | 137,029 | 15.6% |
| 35 to 44 Years | 161,051 | 18.4% |
| 45 to 54 Years | 187,572 | 21.4% |
| 55 to 64 Years | 170,062 | 19.4% |
| 65 to 74 Years | 121,162 | 13.8% |
| 75 to 84 Years | 70,883 | 8.1% |
| 85 Years and Over | 29,492 | 3.4% |
| Total | 877,251 | 100.0% |
Housing Finances in Area Code 786
Median Income by Occupancy in Area Code 786
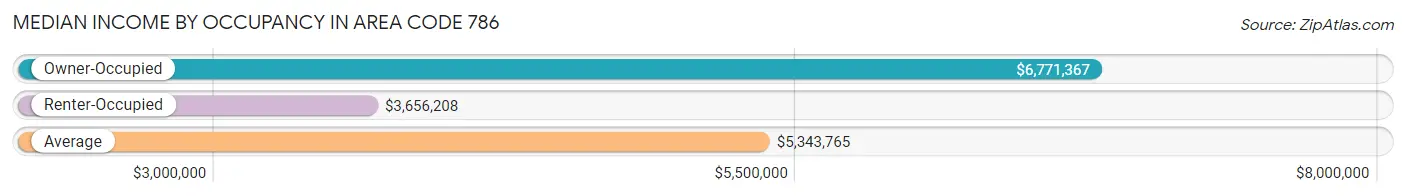
| Occupancy Type | # Households | Median Income |
| Owner-Occupied | 451,762 (51.5%) | $6,771,367 |
| Renter-Occupied | 425,489 (48.5%) | $3,656,208 |
| Average | 877,251 (100.0%) | $5,343,765 |
Occupancy by Householder Income Bracket in Area Code 786
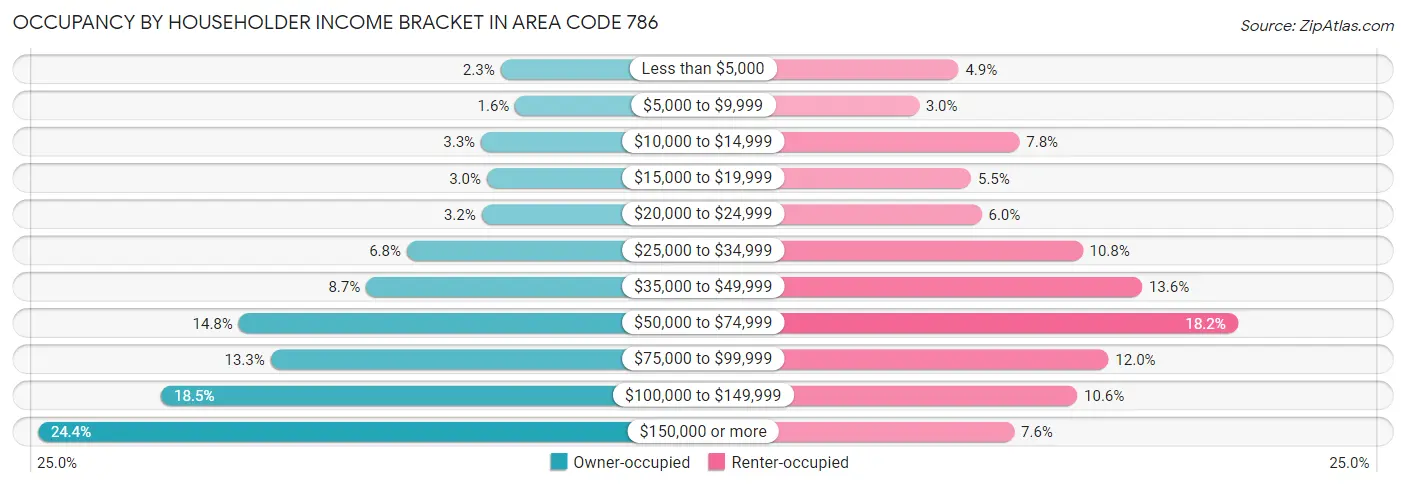
| Income Bracket | Owner-occupied | Renter-occupied |
| Less than $5,000 | 10,591 (2.3%) | 20,845 (4.9%) |
| $5,000 to $9,999 | 7,426 (1.6%) | 12,819 (3.0%) |
| $10,000 to $14,999 | 14,786 (3.3%) | 33,204 (7.8%) |
| $15,000 to $19,999 | 13,516 (3.0%) | 23,404 (5.5%) |
| $20,000 to $24,999 | 14,636 (3.2%) | 25,518 (6.0%) |
| $25,000 to $34,999 | 30,699 (6.8%) | 46,007 (10.8%) |
| $35,000 to $49,999 | 39,481 (8.7%) | 58,056 (13.6%) |
| $50,000 to $74,999 | 66,895 (14.8%) | 77,397 (18.2%) |
| $75,000 to $99,999 | 60,037 (13.3%) | 51,212 (12.0%) |
| $100,000 to $149,999 | 83,581 (18.5%) | 44,904 (10.5%) |
| $150,000 or more | 110,114 (24.4%) | 32,123 (7.5%) |
| Total | 451,762 (100.0%) | 425,489 (100.0%) |
Monthly Housing Cost Tiers in Area Code 786
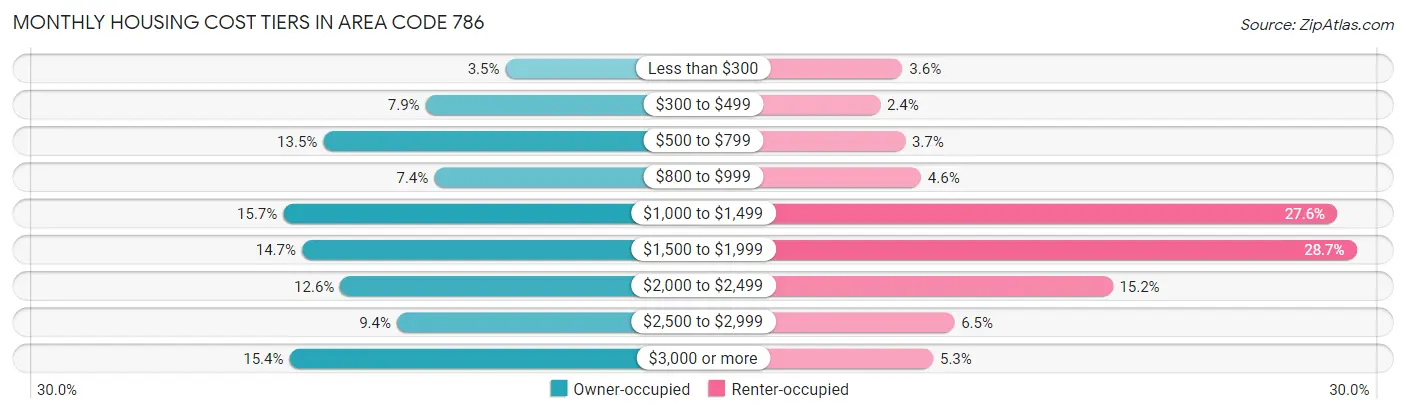
| Monthly Cost | Owner-occupied | Renter-occupied |
| Less than $300 | 15,581 (3.5%) | 15,261 (3.6%) |
| $300 to $499 | 35,497 (7.9%) | 10,017 (2.4%) |
| $500 to $799 | 61,043 (13.5%) | 15,862 (3.7%) |
| $800 to $999 | 33,343 (7.4%) | 19,619 (4.6%) |
| $1,000 to $1,499 | 71,011 (15.7%) | 117,393 (27.6%) |
| $1,500 to $1,999 | 66,385 (14.7%) | 121,942 (28.7%) |
| $2,000 to $2,499 | 56,802 (12.6%) | 64,650 (15.2%) |
| $2,500 to $2,999 | 42,635 (9.4%) | 27,449 (6.5%) |
| $3,000 or more | 69,465 (15.4%) | 22,450 (5.3%) |
| Total | 451,762 (100.0%) | 425,489 (100.0%) |
Physical Housing Characteristics in Area Code 786
Housing Structures in Area Code 786
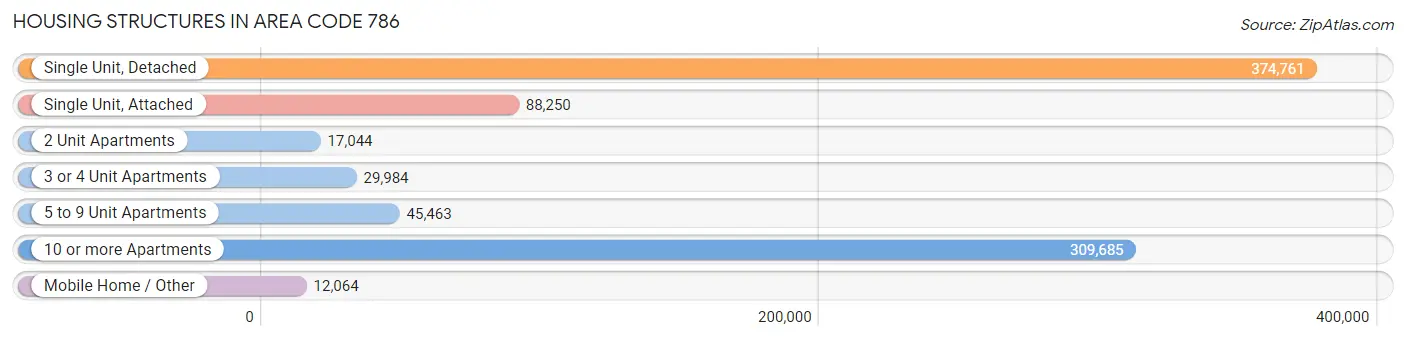
| Structure Type | # Housing Units | % Housing Units |
| Single Unit, Detached | 374,761 | 42.7% |
| Single Unit, Attached | 88,250 | 10.1% |
| 2 Unit Apartments | 17,044 | 1.9% |
| 3 or 4 Unit Apartments | 29,984 | 3.4% |
| 5 to 9 Unit Apartments | 45,463 | 5.2% |
| 10 or more Apartments | 309,685 | 35.3% |
| Mobile Home / Other | 12,064 | 1.4% |
| Total | 877,251 | 100.0% |
Housing Structures by Occupancy in Area Code 786
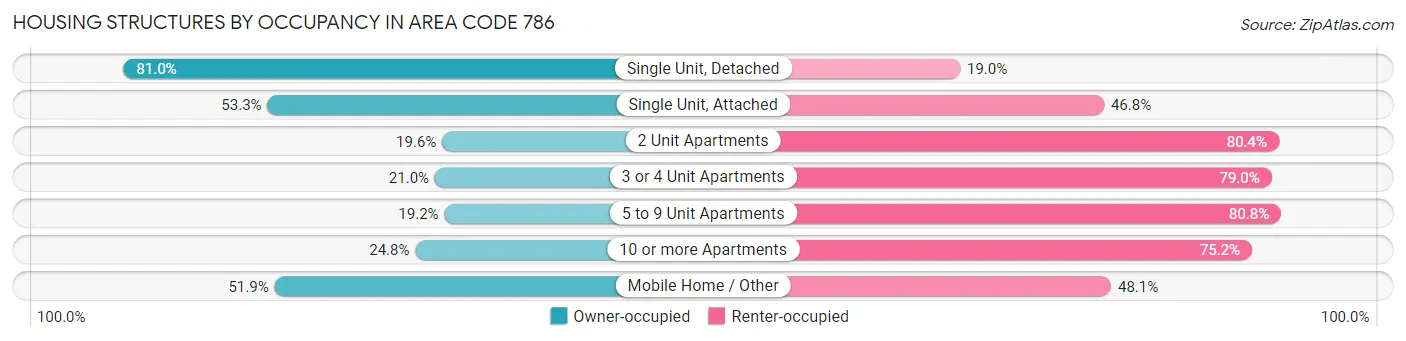
| Structure Type | Owner-occupied | Renter-occupied |
| Single Unit, Detached | 303,435 (81.0%) | 71,326 (19.0%) |
| Single Unit, Attached | 46,995 (53.2%) | 41,255 (46.8%) |
| 2 Unit Apartments | 3,340 (19.6%) | 13,704 (80.4%) |
| 3 or 4 Unit Apartments | 6,297 (21.0%) | 23,687 (79.0%) |
| 5 to 9 Unit Apartments | 8,714 (19.2%) | 36,749 (80.8%) |
| 10 or more Apartments | 76,721 (24.8%) | 232,964 (75.2%) |
| Mobile Home / Other | 6,260 (51.9%) | 5,804 (48.1%) |
| Total | 451,762 (51.5%) | 425,489 (48.5%) |
Housing Structures by Number of Rooms in Area Code 786
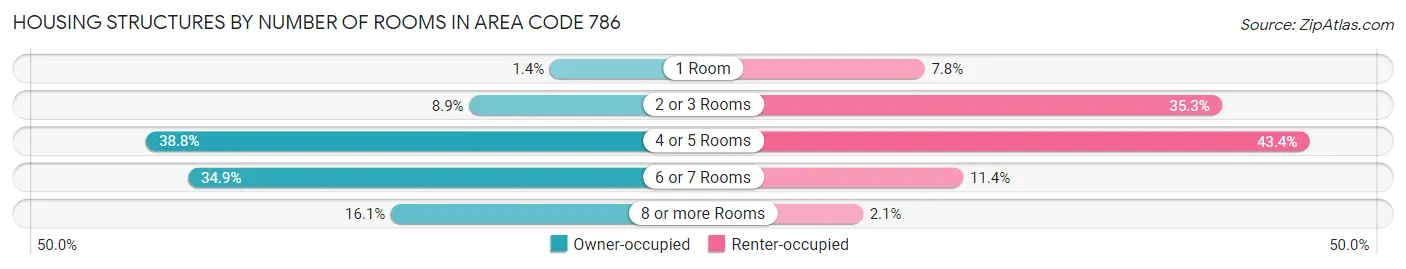
| Number of Rooms | Owner-occupied | Renter-occupied |
| 1 Room | 6,309 (1.4%) | 33,260 (7.8%) |
| 2 or 3 Rooms | 40,038 (8.9%) | 150,136 (35.3%) |
| 4 or 5 Rooms | 175,093 (38.8%) | 184,648 (43.4%) |
| 6 or 7 Rooms | 157,573 (34.9%) | 48,454 (11.4%) |
| 8 or more Rooms | 72,749 (16.1%) | 8,991 (2.1%) |
| Total | 451,762 (100.0%) | 425,489 (100.0%) |
Housing Structure by Heating Type in Area Code 786
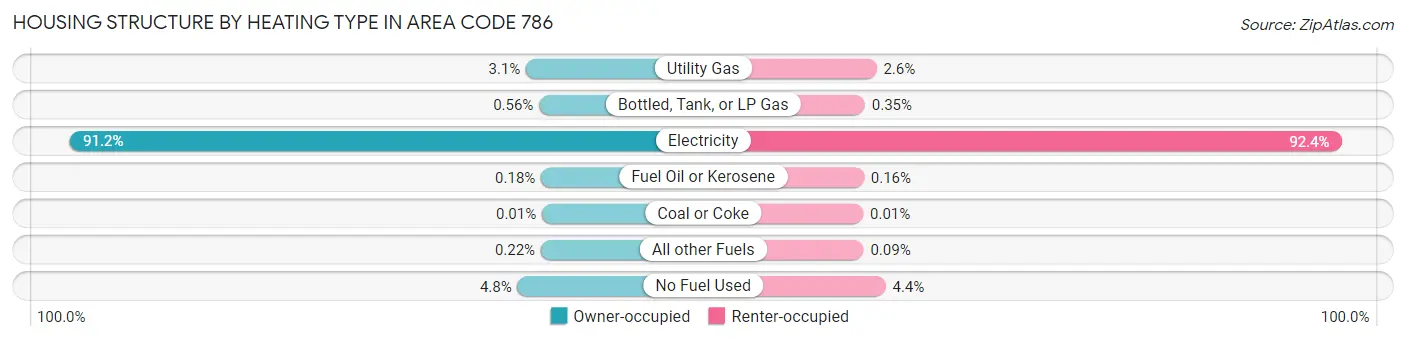
| Heating Type | Owner-occupied | Renter-occupied |
| Utility Gas | 13,856 (3.1%) | 11,044 (2.6%) |
| Bottled, Tank, or LP Gas | 2,543 (0.6%) | 1,481 (0.4%) |
| Electricity | 412,064 (91.2%) | 393,341 (92.4%) |
| Fuel Oil or Kerosene | 831 (0.2%) | 678 (0.2%) |
| Coal or Coke | 31 (0.0%) | 31 (0.0%) |
| All other Fuels | 984 (0.2%) | 386 (0.1%) |
| No Fuel Used | 21,453 (4.8%) | 18,528 (4.3%) |
| Total | 451,762 (100.0%) | 425,489 (100.0%) |
Household Vehicle Usage in Area Code 786
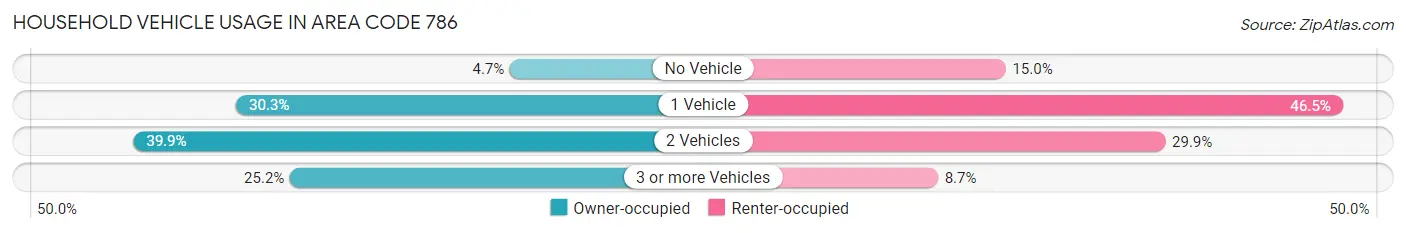
| Vehicles per Household | Owner-occupied | Renter-occupied |
| No Vehicle | 21,131 (4.7%) | 63,782 (15.0%) |
| 1 Vehicle | 136,717 (30.3%) | 197,671 (46.5%) |
| 2 Vehicles | 180,030 (39.9%) | 127,181 (29.9%) |
| 3 or more Vehicles | 113,884 (25.2%) | 36,855 (8.7%) |
| Total | 451,762 (100.0%) | 425,489 (100.0%) |
Real Estate & Mortgages in Area Code 786
Real Estate and Mortgage Overview in Area Code 786
| Characteristic | Without Mortgage | With Mortgage |
| Housing Units | 180,507 | 271,255 |
| Median Property Value | $30,271,901 | $30,381,100 |
| Median Household Income | $5,229,013 | $76,069 |
| Monthly Housing Costs | $56,980 | $64,097 |
| Real Estate Taxes | $239,669 | $6,750 |
Property Value by Mortgage Status in Area Code 786
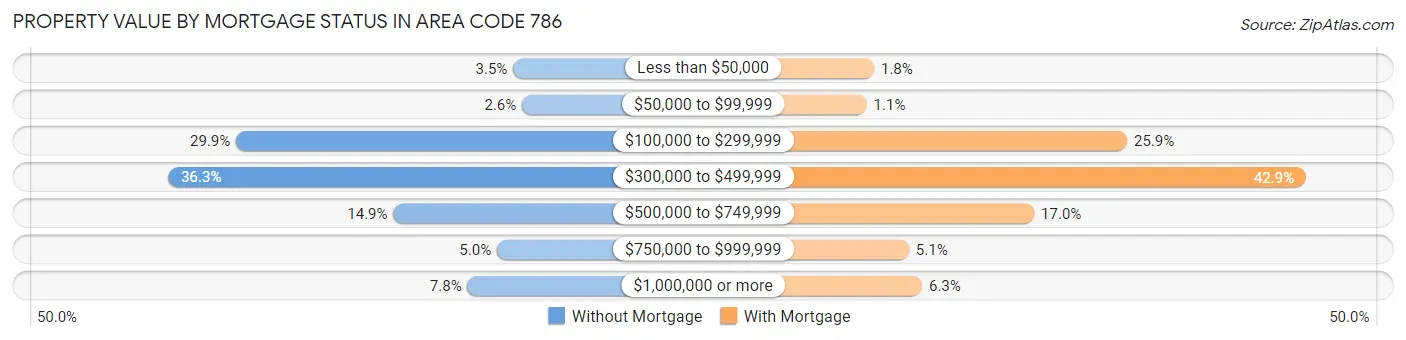
| Property Value | Without Mortgage | With Mortgage |
| Less than $50,000 | 6,268 (3.5%) | 4,766 (1.8%) |
| $50,000 to $99,999 | 4,736 (2.6%) | 2,872 (1.1%) |
| $100,000 to $299,999 | 53,897 (29.9%) | 70,138 (25.9%) |
| $300,000 to $499,999 | 65,589 (36.3%) | 116,370 (42.9%) |
| $500,000 to $749,999 | 26,857 (14.9%) | 46,140 (17.0%) |
| $750,000 to $999,999 | 9,036 (5.0%) | 13,789 (5.1%) |
| $1,000,000 or more | 14,124 (7.8%) | 17,180 (6.3%) |
| Total | 180,507 (100.0%) | 271,255 (100.0%) |
Household Income by Mortgage Status in Area Code 786
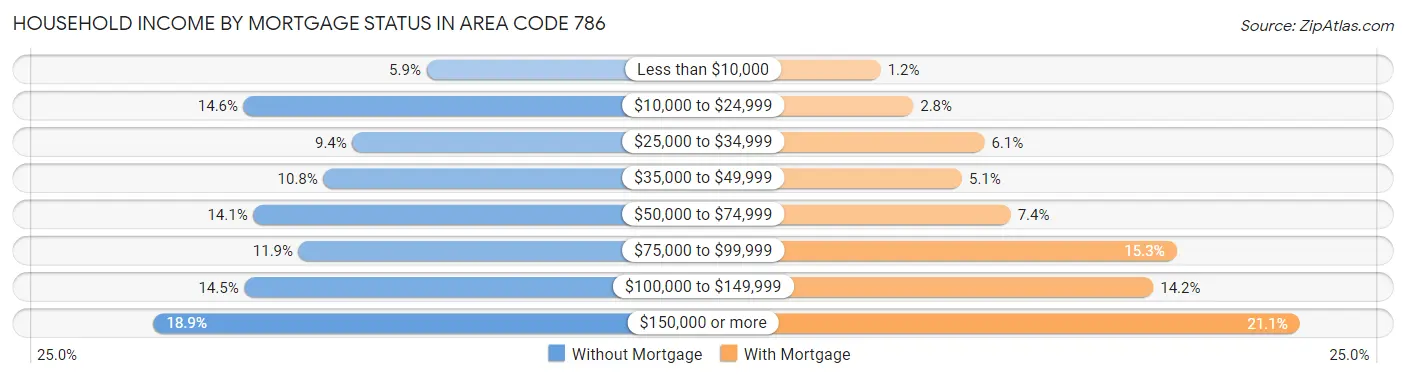
| Household Income | Without Mortgage | With Mortgage |
| Less than $10,000 | 10,567 (5.9%) | 3,261 (1.2%) |
| $10,000 to $24,999 | 26,281 (14.6%) | 7,450 (2.8%) |
| $25,000 to $34,999 | 16,933 (9.4%) | 16,657 (6.1%) |
| $35,000 to $49,999 | 19,431 (10.8%) | 13,766 (5.1%) |
| $50,000 to $74,999 | 25,456 (14.1%) | 20,050 (7.4%) |
| $75,000 to $99,999 | 21,561 (11.9%) | 41,439 (15.3%) |
| $100,000 to $149,999 | 26,233 (14.5%) | 38,476 (14.2%) |
| $150,000 or more | 34,045 (18.9%) | 57,348 (21.1%) |
| Total | 180,507 (100.0%) | 271,255 (100.0%) |
Property Value to Household Income Ratio in Area Code 786
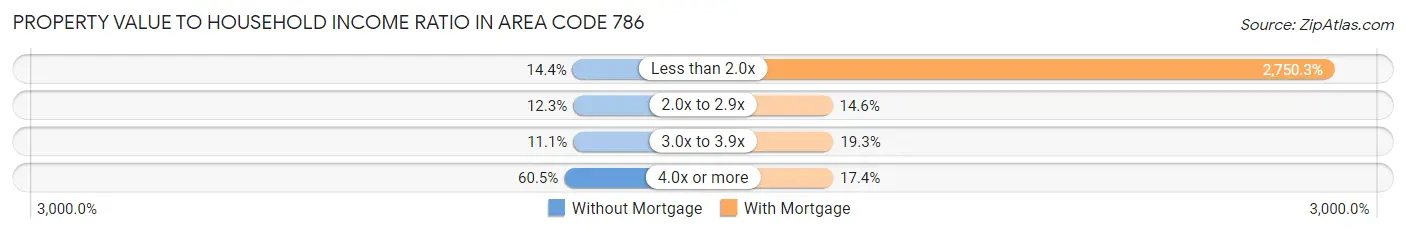
| Value-to-Income Ratio | Without Mortgage | With Mortgage |
| Less than 2.0x | 25,915 (14.4%) | 7,460,265 (2,750.3%) |
| 2.0x to 2.9x | 22,221 (12.3%) | 39,562 (14.6%) |
| 3.0x to 3.9x | 20,039 (11.1%) | 52,287 (19.3%) |
| 4.0x or more | 109,117 (60.5%) | 47,083 (17.4%) |
| Total | 180,507 (100.0%) | 271,255 (100.0%) |
Real Estate Taxes by Mortgage Status in Area Code 786
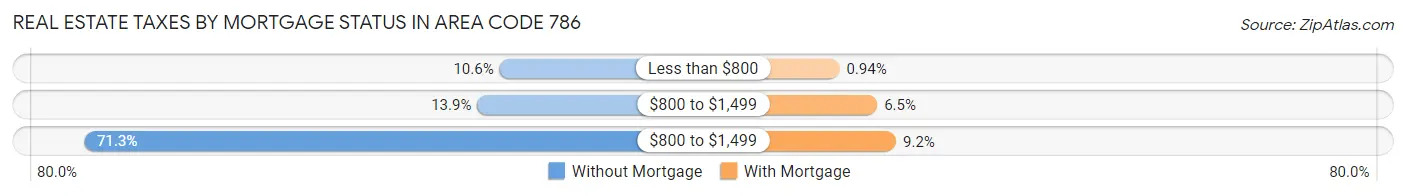
| Property Taxes | Without Mortgage | With Mortgage |
| Less than $800 | 19,146 (10.6%) | 2,547 (0.9%) |
| $800 to $1,499 | 25,019 (13.9%) | 17,511 (6.5%) |
| $800 to $1,499 | 128,745 (71.3%) | 24,980 (9.2%) |
| Total | 180,507 (100.0%) | 271,255 (100.0%) |
Health & Disability in Area Code 786
Health Insurance Coverage by Age in Area Code 786
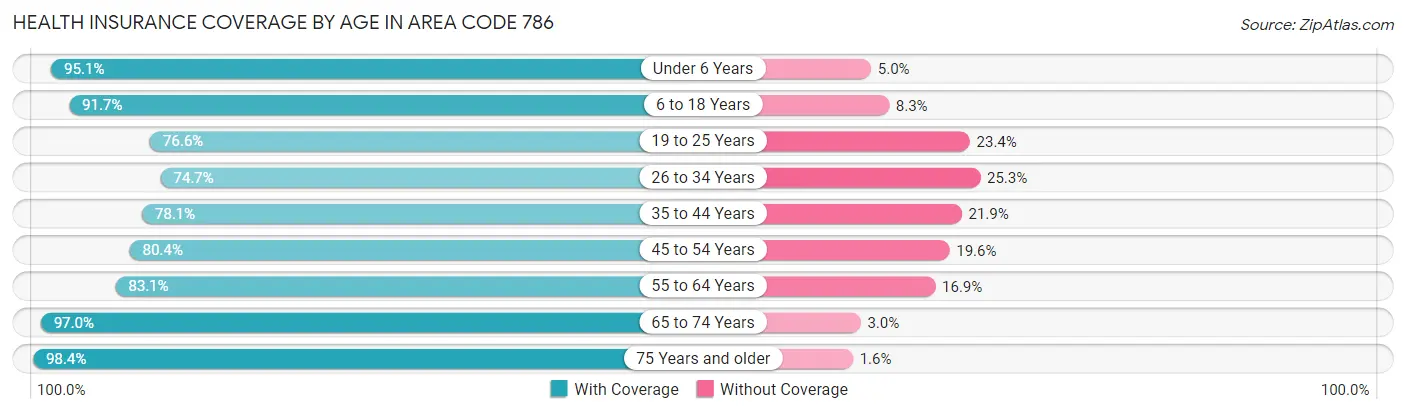
| Age Bracket | With Coverage | Without Coverage |
| Under 6 Years | 154,048 (95.1%) | 8,031 (5.0%) |
| 6 to 18 Years | 331,158 (91.7%) | 30,030 (8.3%) |
| 19 to 25 Years | 163,910 (76.6%) | 49,988 (23.4%) |
| 26 to 34 Years | 227,609 (74.7%) | 77,184 (25.3%) |
| 35 to 44 Years | 262,889 (78.1%) | 73,571 (21.9%) |
| 45 to 54 Years | 284,557 (80.4%) | 69,265 (19.6%) |
| 55 to 64 Years | 264,382 (83.1%) | 53,868 (16.9%) |
| 65 to 74 Years | 212,122 (97.0%) | 6,589 (3.0%) |
| 75 Years and older | 178,951 (98.4%) | 2,853 (1.6%) |
| Total | 2,079,626 (84.9%) | 371,379 (15.1%) |
Health Insurance Coverage by Citizenship Status in Area Code 786
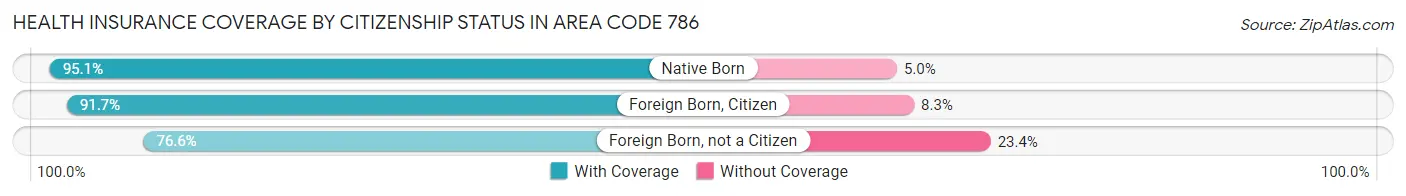
| Citizenship Status | With Coverage | Without Coverage |
| Native Born | 154,048 (95.1%) | 8,031 (5.0%) |
| Foreign Born, Citizen | 331,158 (91.7%) | 30,030 (8.3%) |
| Foreign Born, not a Citizen | 163,910 (76.6%) | 49,988 (23.4%) |
Health Insurance Coverage by Household Income in Area Code 786
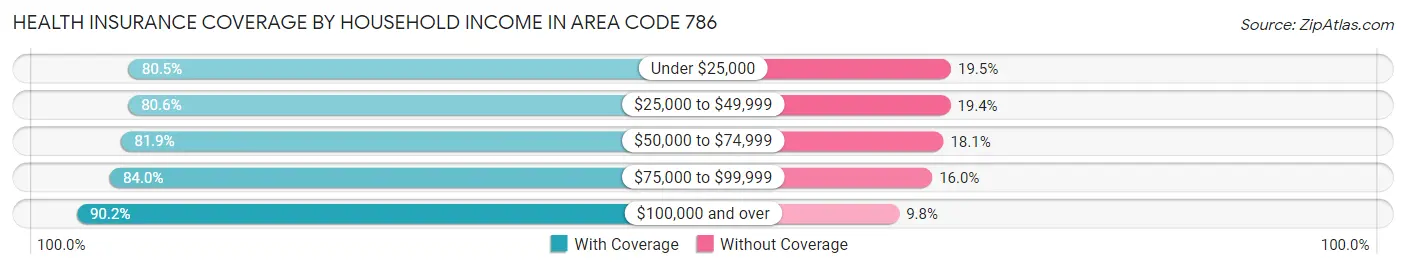
| Household Income | With Coverage | Without Coverage |
| Under $25,000 | 262,922 (80.5%) | 63,863 (19.5%) |
| $25,000 to $49,999 | 351,866 (80.6%) | 84,791 (19.4%) |
| $50,000 to $74,999 | 335,744 (81.9%) | 74,319 (18.1%) |
| $75,000 to $99,999 | 289,681 (84.0%) | 55,183 (16.0%) |
| $100,000 and over | 819,560 (90.2%) | 89,246 (9.8%) |
Public vs Private Health Insurance Coverage by Age in Area Code 786
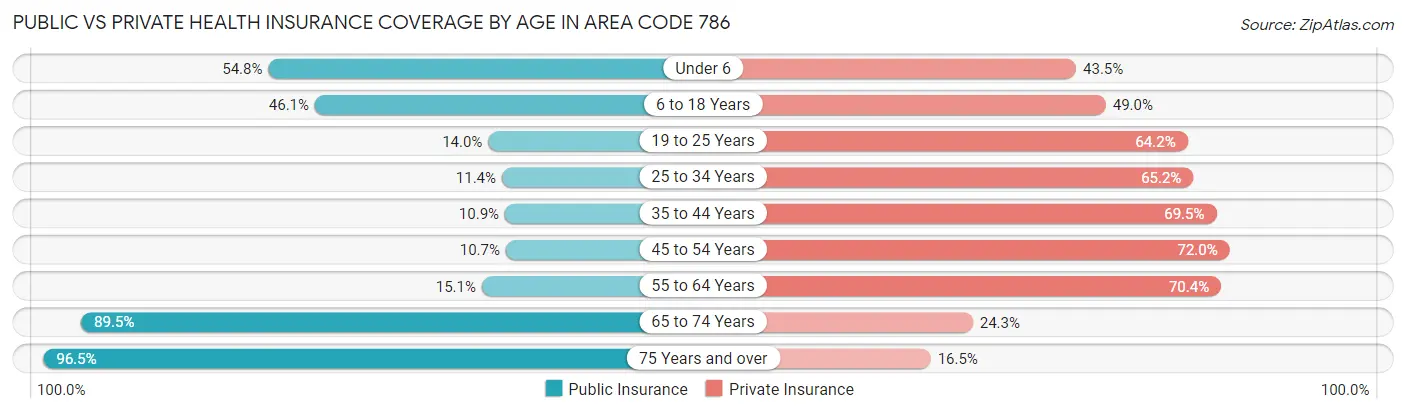
| Age Bracket | Public Insurance | Private Insurance |
| Under 6 | 88,777 (54.8%) | 70,482 (43.5%) |
| 6 to 18 Years | 166,596 (46.1%) | 176,992 (49.0%) |
| 19 to 25 Years | 29,849 (14.0%) | 137,237 (64.2%) |
| 25 to 34 Years | 34,765 (11.4%) | 198,773 (65.2%) |
| 35 to 44 Years | 36,495 (10.8%) | 233,858 (69.5%) |
| 45 to 54 Years | 37,833 (10.7%) | 254,645 (72.0%) |
| 55 to 64 Years | 48,191 (15.1%) | 223,987 (70.4%) |
| 65 to 74 Years | 195,771 (89.5%) | 53,164 (24.3%) |
| 75 Years and over | 175,480 (96.5%) | 29,990 (16.5%) |
| Total | 813,757 (33.2%) | 1,379,128 (56.3%) |
Disability Status by Sex by Age in Area Code 786
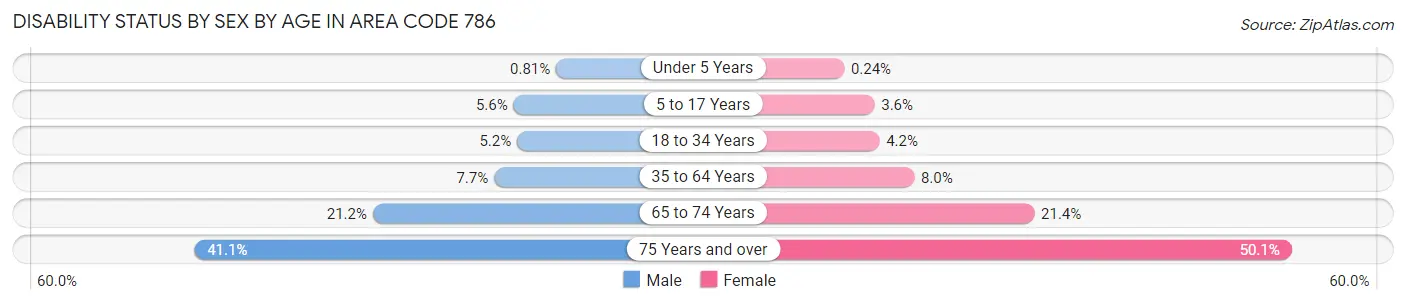
| Age Bracket | Male | Female |
| Under 5 Years | 571 (0.8%) | 157 (0.2%) |
| 5 to 17 Years | 10,081 (5.6%) | 6,347 (3.6%) |
| 18 to 34 Years | 14,409 (5.2%) | 11,236 (4.2%) |
| 35 to 64 Years | 38,663 (7.7%) | 40,804 (8.0%) |
| 65 to 74 Years | 21,027 (21.2%) | 25,625 (21.4%) |
| 75 Years and over | 28,908 (41.1%) | 55,856 (50.1%) |
Disability Class by Sex by Age in Area Code 786
Disability Class: Hearing Difficulty
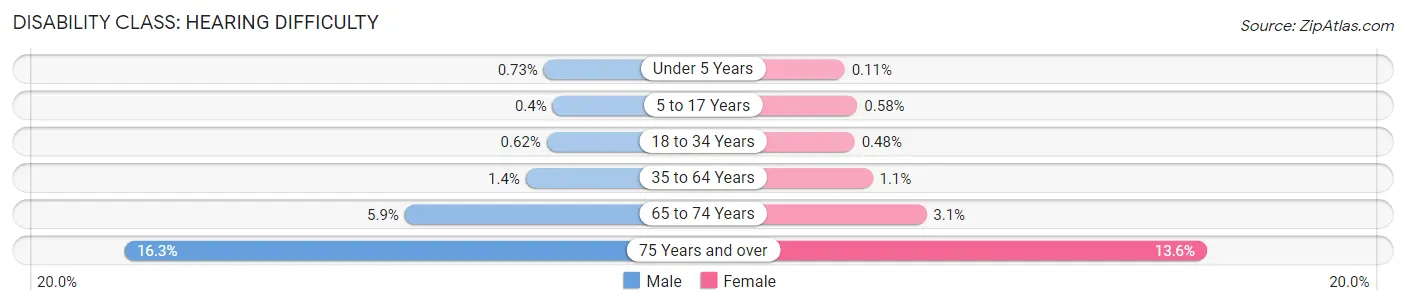
| Age Bracket | Male | Female |
| Under 5 Years | 513 (0.7%) | 75 (0.1%) |
| 5 to 17 Years | 735 (0.4%) | 1,015 (0.6%) |
| 18 to 34 Years | 1,744 (0.6%) | 1,285 (0.5%) |
| 35 to 64 Years | 6,990 (1.4%) | 5,793 (1.1%) |
| 65 to 74 Years | 5,836 (5.9%) | 3,758 (3.1%) |
| 75 Years and over | 11,467 (16.3%) | 15,111 (13.6%) |
Disability Class: Vision Difficulty
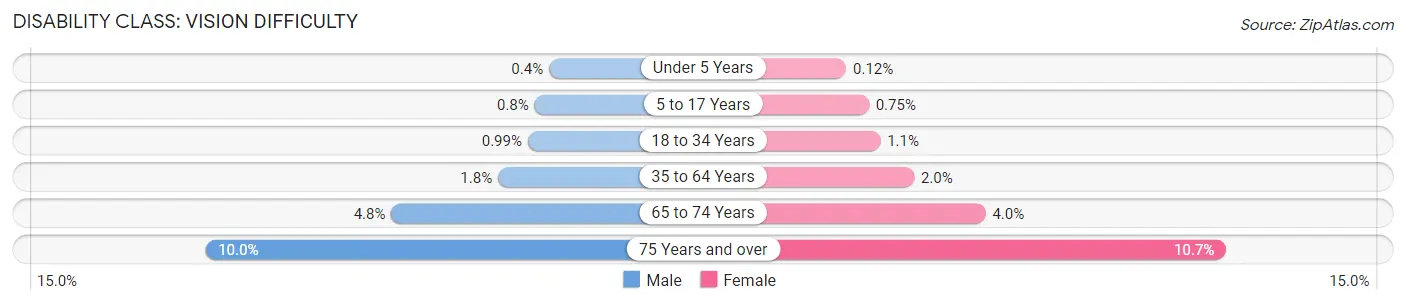
| Age Bracket | Male | Female |
| Under 5 Years | 280 (0.4%) | 82 (0.1%) |
| 5 to 17 Years | 1,460 (0.8%) | 1,323 (0.7%) |
| 18 to 34 Years | 2,756 (1.0%) | 2,892 (1.1%) |
| 35 to 64 Years | 9,108 (1.8%) | 10,178 (2.0%) |
| 65 to 74 Years | 4,745 (4.8%) | 4,785 (4.0%) |
| 75 Years and over | 7,010 (10.0%) | 11,923 (10.7%) |
Disability Class: Cognitive Difficulty
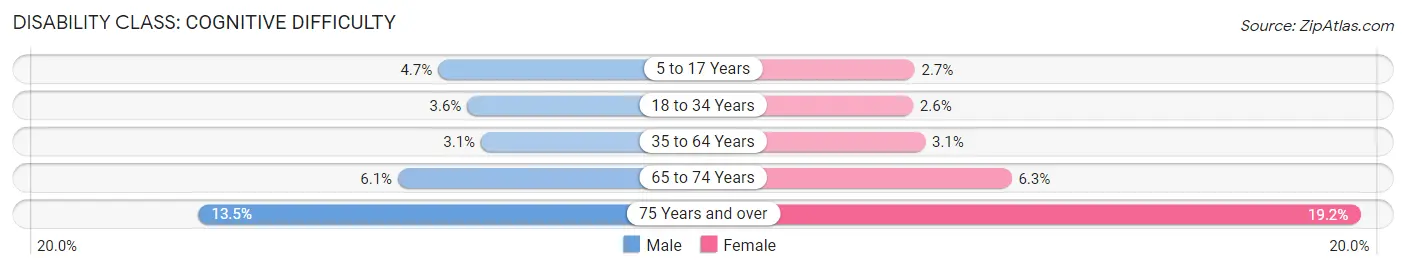
| Age Bracket | Male | Female |
| 5 to 17 Years | 8,450 (4.6%) | 4,732 (2.7%) |
| 18 to 34 Years | 9,971 (3.6%) | 7,107 (2.6%) |
| 35 to 64 Years | 15,343 (3.1%) | 15,705 (3.1%) |
| 65 to 74 Years | 6,081 (6.1%) | 7,537 (6.3%) |
| 75 Years and over | 9,523 (13.5%) | 21,454 (19.2%) |
Disability Class: Ambulatory Difficulty
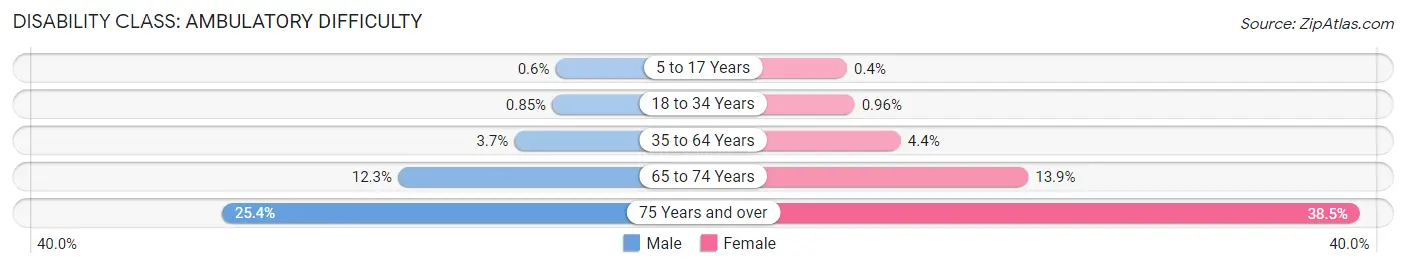
| Age Bracket | Male | Female |
| 5 to 17 Years | 1,090 (0.6%) | 699 (0.4%) |
| 18 to 34 Years | 2,372 (0.9%) | 2,592 (1.0%) |
| 35 to 64 Years | 18,340 (3.7%) | 22,305 (4.4%) |
| 65 to 74 Years | 12,183 (12.3%) | 16,566 (13.9%) |
| 75 Years and over | 17,829 (25.4%) | 42,866 (38.5%) |
Disability Class: Self-Care Difficulty
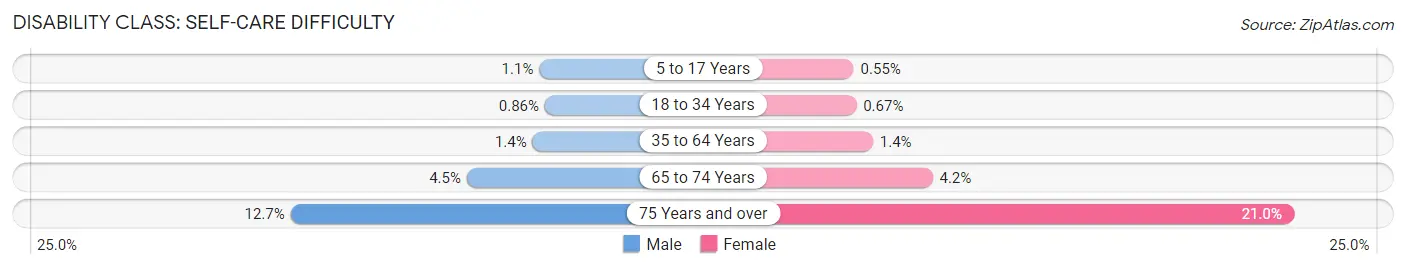
| Age Bracket | Male | Female |
| 5 to 17 Years | 2,042 (1.1%) | 966 (0.5%) |
| 18 to 34 Years | 2,387 (0.9%) | 1,807 (0.7%) |
| 35 to 64 Years | 7,161 (1.4%) | 7,290 (1.4%) |
| 65 to 74 Years | 4,442 (4.5%) | 5,042 (4.2%) |
| 75 Years and over | 8,904 (12.7%) | 23,374 (21.0%) |
Technology Access in Area Code 786
Computing Device Access in Area Code 786
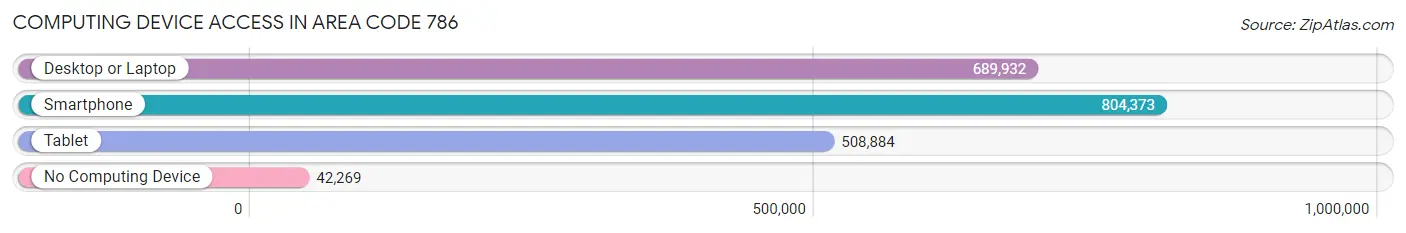
| Device Type | # Households | % Households |
| Desktop or Laptop | 689,932 | 78.6% |
| Smartphone | 804,373 | 91.7% |
| Tablet | 508,884 | 58.0% |
| No Computing Device | 42,269 | 4.8% |
| Total | 877,251 | 100.0% |
Internet Access in Area Code 786
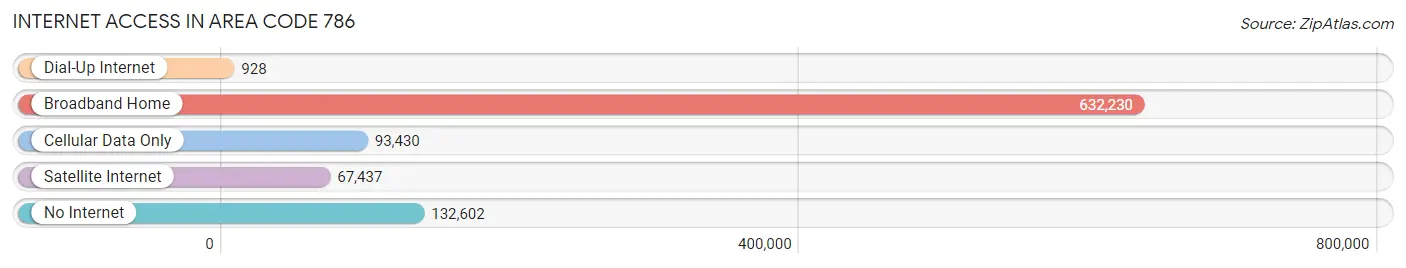
| Internet Type | # Households | % Households |
| Dial-Up Internet | 928 | 0.1% |
| Broadband Home | 632,230 | 72.1% |
| Cellular Data Only | 93,430 | 10.6% |
| Satellite Internet | 67,437 | 7.7% |
| No Internet | 132,602 | 15.1% |
| Total | 877,251 | 100.0% |
Area Code 786 Summary
Geography
Area code 786 is located in the state of Florida and covers the Miami metropolitan area. It includes the cities of Miami, Miami Beach, Hialeah, and Homestead.
Social
Area code 786 is a culturally diverse area, with a large Hispanic population. It is home to many different cultures, including Cuban, Haitian, and Caribbean.
Economics
Area code 786 is an economically vibrant area, with a strong tourism industry. It is home to many businesses, including the Port of Miami, which is one of the busiest ports in the world.
Demographics
Area code 786 has a population of over 2 million people. The majority of the population is Hispanic, with a large Cuban population. The median household income is $41,000, and the median age is 38.
Common Questions
What is Per Capita Income in Area Code 786?
Per Capita income in Area Code 786 is $43,413.
What is the Median Family Income in Area Code 786?
Median Family Income in Area Code 786 is $84,905.
What is the Median Household income in Area Code 786?
Median Household Income in Area Code 786 is $74,219.
What is Income or Wage Gap in Area Code 786?
Income or Wage Gap in Area Code 786 is 21.9%.
Women in Area Code 786 earn 78.1 cents for every dollar earned by a man.
What is Family Income Deficit in Area Code 786?
Family Income Deficit in Area Code 786 is $9,778.
Families that are below poverty line in Area Code 786 earn $9,778 less on average than the poverty threshold level.
What is Inequality or Gini Index in Area Code 786?
Inequality or Gini Index in Area Code 786 is 33.53.
What is the Total Population of Area Code 786?
Total Population of Area Code 786 is 2,474,918.
What is the Total Male Population of Area Code 786?
Total Male Population of Area Code 786 is 1,218,122.
What is the Total Female Population of Area Code 786?
Total Female Population of Area Code 786 is 1,256,796.
What is the Ratio of Males per 100 Females in Area Code 786?
There are 96.92 Males per 100 Females in Area Code 786.
What is the Ratio of Females per 100 Males in Area Code 786?
There are 103.17 Females per 100 Males in Area Code 786.
What is the Median Population Age in Area Code 786?
Median Population Age in Area Code 786 is 40.8 Years.
What is the Average Family Size in Area Code 786
Average Family Size in Area Code 786 is 3.3 People.
What is the Average Household Size in Area Code 786
Average Household Size in Area Code 786 is 2.8 People.
How Large is the Labor Force in Area Code 786?
There are 1,295,732 People in the Labor Forcein in Area Code 786.
What is the Percentage of People in the Labor Force in Area Code 786?
63.6% of People are in the Labor Force in Area Code 786.
What is the Unemployment Rate in Area Code 786?
Unemployment Rate in Area Code 786 is 4.6%.