Hillsborough County, FL Map & Demographics
Hillsborough County Overview
$39,509
PER CAPITA INCOME
$86,250
AVG FAMILY INCOME
$70,612
AVG HOUSEHOLD INCOME
21.5%
WAGE / INCOME GAP [ % ]
78.5¢/ $1
WAGE / INCOME GAP [ $ ]
$11,470
FAMILY INCOME DEFICIT
0.48
INEQUALITY / GINI INDEX
1,468,560
TOTAL POPULATION
724,235
MALE POPULATION
744,325
FEMALE POPULATION
97.30
MALES / 100 FEMALES
102.77
FEMALES / 100 MALES
37.6
MEDIAN AGE
3.2
AVG FAMILY SIZE
2.6
AVG HOUSEHOLD SIZE
773,669
LABOR FORCE [ PEOPLE ]
65.3%
PERCENT IN LABOR FORCE
4.8%
UNEMPLOYMENT RATE
Income in Hillsborough County
Income Overview in Hillsborough County
Per Capita Income in Hillsborough County is $39,509, while median incomes of families and households are $86,250 and $70,612 respectively.
| Characteristic | Number | Measure |
| Per Capita Income | 1,468,560 | $39,509 |
| Median Family Income | 352,794 | $86,250 |
| Mean Family Income | 352,794 | $118,132 |
| Median Household Income | 559,970 | $70,612 |
| Mean Household Income | 559,970 | $100,434 |
| Income Deficit | 352,794 | $11,470 |
| Wage / Income Gap (%) | 1,468,560 | 21.45% |
| Wage / Income Gap ($) | 1,468,560 | 78.55¢ per $1 |
| Gini / Inequality Index | 1,468,560 | 0.48 |
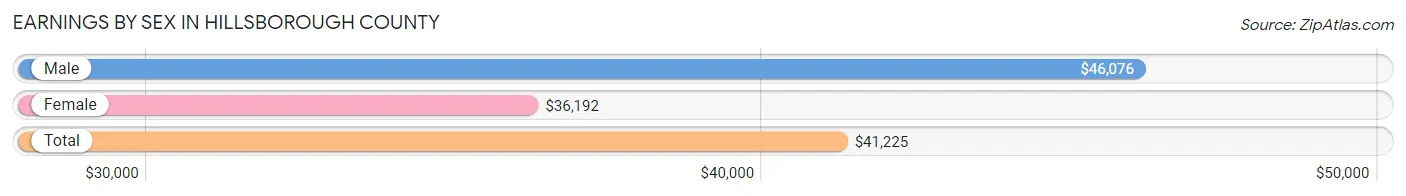
Earnings by Sex in Hillsborough County
Average Earnings in Hillsborough County are $41,225, $46,076 for men and $36,192 for women, a difference of 21.4%.
| Sex | Number | Average Earnings |
| Male | 416,900 (52.4%) | $46,076 |
| Female | 377,953 (47.5%) | $36,192 |
| Total | 794,853 (100.0%) | $41,225 |
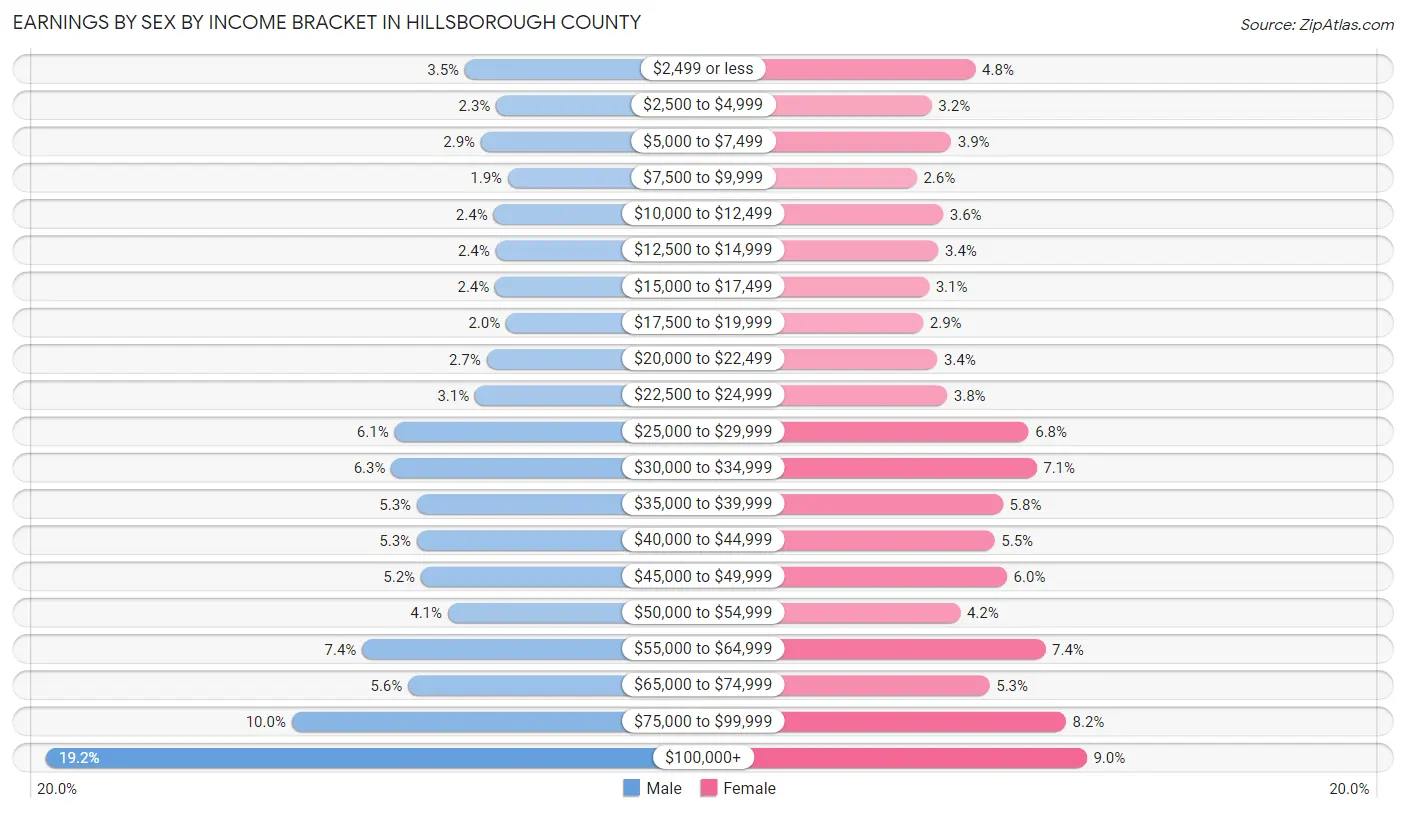
Earnings by Sex by Income Bracket in Hillsborough County
The most common earnings brackets in Hillsborough County are $100,000+ for men (80,008 | 19.2%) and $100,000+ for women (33,952 | 9.0%).
| Income | Male | Female |
| $2,499 or less | 14,597 (3.5%) | 18,161 (4.8%) |
| $2,500 to $4,999 | 9,731 (2.3%) | 11,967 (3.2%) |
| $5,000 to $7,499 | 12,070 (2.9%) | 14,750 (3.9%) |
| $7,500 to $9,999 | 7,873 (1.9%) | 9,861 (2.6%) |
| $10,000 to $12,499 | 10,148 (2.4%) | 13,595 (3.6%) |
| $12,500 to $14,999 | 9,791 (2.4%) | 12,920 (3.4%) |
| $15,000 to $17,499 | 9,894 (2.4%) | 11,598 (3.1%) |
| $17,500 to $19,999 | 8,189 (2.0%) | 10,775 (2.9%) |
| $20,000 to $22,499 | 11,221 (2.7%) | 12,761 (3.4%) |
| $22,500 to $24,999 | 13,020 (3.1%) | 14,176 (3.7%) |
| $25,000 to $29,999 | 25,585 (6.1%) | 25,697 (6.8%) |
| $30,000 to $34,999 | 26,098 (6.3%) | 26,845 (7.1%) |
| $35,000 to $39,999 | 22,092 (5.3%) | 22,063 (5.8%) |
| $40,000 to $44,999 | 22,084 (5.3%) | 20,910 (5.5%) |
| $45,000 to $49,999 | 21,475 (5.1%) | 22,650 (6.0%) |
| $50,000 to $54,999 | 17,263 (4.1%) | 16,026 (4.2%) |
| $55,000 to $64,999 | 30,641 (7.3%) | 28,069 (7.4%) |
| $65,000 to $74,999 | 23,490 (5.6%) | 20,169 (5.3%) |
| $75,000 to $99,999 | 41,630 (10.0%) | 31,008 (8.2%) |
| $100,000+ | 80,008 (19.2%) | 33,952 (9.0%) |
| Total | 416,900 (100.0%) | 377,953 (100.0%) |
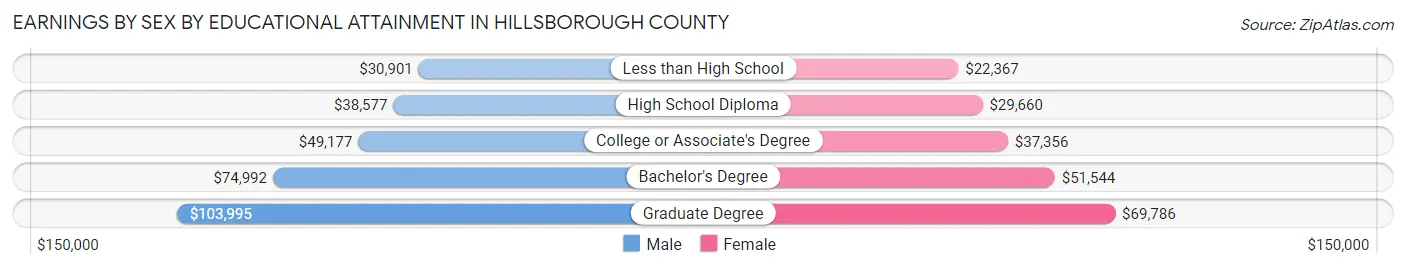
Earnings by Sex by Educational Attainment in Hillsborough County
Average earnings in Hillsborough County are $52,158 for men and $41,403 for women, a difference of 20.6%. Men with an educational attainment of graduate degree enjoy the highest average annual earnings of $103,995, while those with less than high school education earn the least with $30,901. Women with an educational attainment of graduate degree earn the most with the average annual earnings of $69,786, while those with less than high school education have the smallest earnings of $22,367.
| Educational Attainment | Male Income | Female Income |
| Less than High School | $30,901 | $22,367 |
| High School Diploma | $38,577 | $29,660 |
| College or Associate's Degree | $49,177 | $37,356 |
| Bachelor's Degree | $74,992 | $51,544 |
| Graduate Degree | $103,995 | $69,786 |
| Total | $52,158 | $41,403 |
Family Income in Hillsborough County
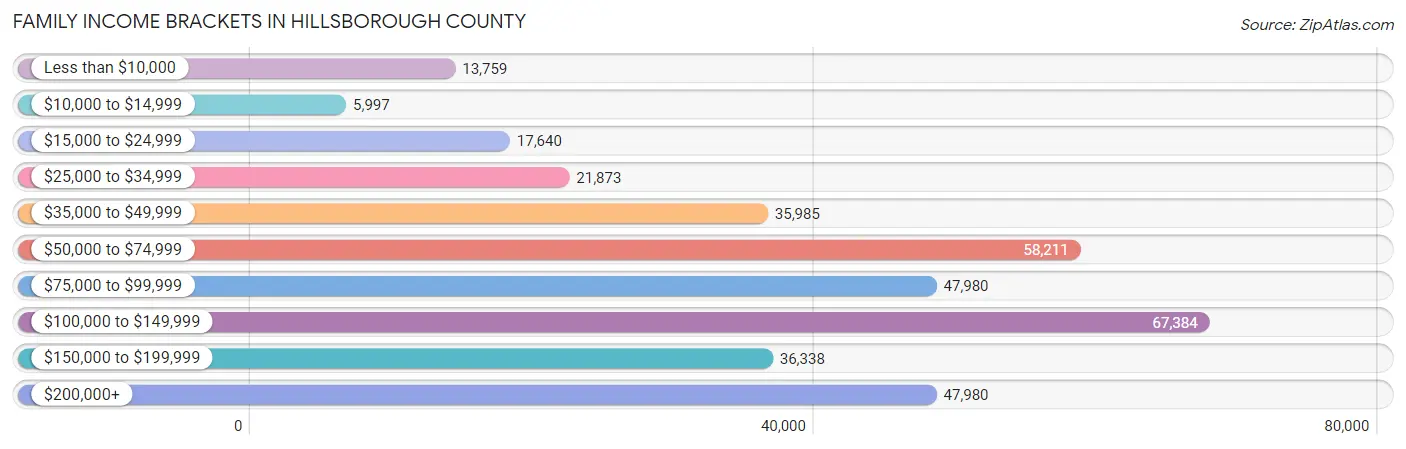
Family Income Brackets in Hillsborough County
According to the Hillsborough County family income data, there are 67,384 families falling into the $100,000 to $149,999 income range, which is the most common income bracket and makes up 19.1% of all families. Conversely, the $10,000 to $14,999 income bracket is the least frequent group with only 5,997 families (1.7%) belonging to this category.
| Income Bracket | # Families | % Families |
| Less than $10,000 | 13,759 | 3.9% |
| $10,000 to $14,999 | 5,997 | 1.7% |
| $15,000 to $24,999 | 17,640 | 5.0% |
| $25,000 to $34,999 | 21,873 | 6.2% |
| $35,000 to $49,999 | 35,985 | 10.2% |
| $50,000 to $74,999 | 58,211 | 16.5% |
| $75,000 to $99,999 | 47,980 | 13.6% |
| $100,000 to $149,999 | 67,384 | 19.1% |
| $150,000 to $199,999 | 36,338 | 10.3% |
| $200,000+ | 47,980 | 13.6% |
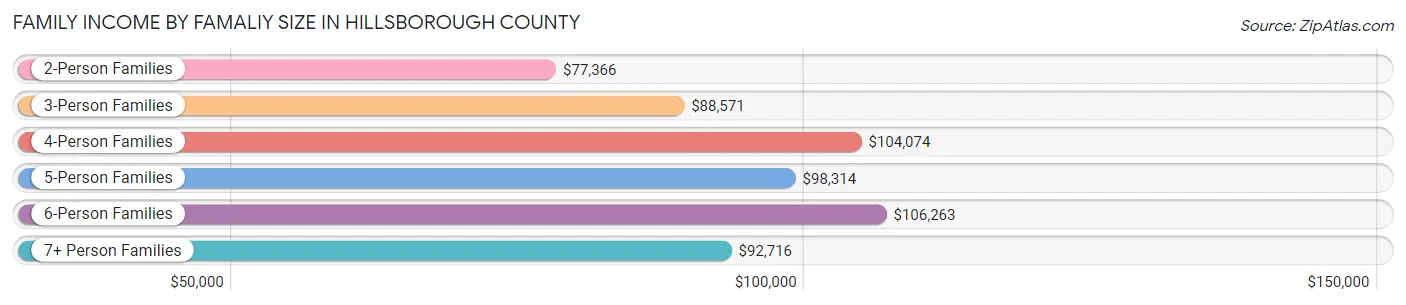
Family Income by Famaliy Size in Hillsborough County
6-person families (9,423 | 2.7%) account for the highest median family income in Hillsborough County with $106,263 per family, while 2-person families (160,973 | 45.6%) have the highest median income of $38,683 per family member.
| Income Bracket | # Families | Median Income |
| 2-Person Families | 160,973 (45.6%) | $77,366 |
| 3-Person Families | 86,164 (24.4%) | $88,571 |
| 4-Person Families | 64,539 (18.3%) | $104,074 |
| 5-Person Families | 26,612 (7.5%) | $98,314 |
| 6-Person Families | 9,423 (2.7%) | $106,263 |
| 7+ Person Families | 5,083 (1.4%) | $92,716 |
| Total | 352,794 (100.0%) | $86,250 |
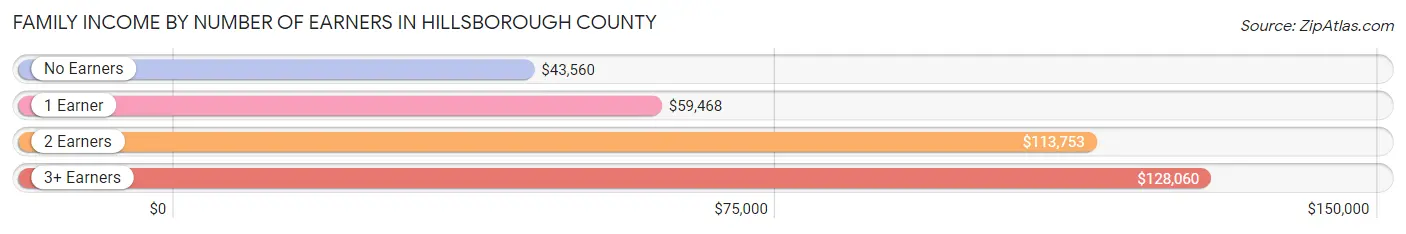
Family Income by Number of Earners in Hillsborough County
The median family income in Hillsborough County is $86,250, with families comprising 3+ earners (36,209) having the highest median family income of $128,060, while families with no earners (48,349) have the lowest median family income of $43,560, accounting for 10.3% and 13.7% of families, respectively.
| Number of Earners | # Families | Median Income |
| No Earners | 48,349 (13.7%) | $43,560 |
| 1 Earner | 120,161 (34.1%) | $59,468 |
| 2 Earners | 148,075 (42.0%) | $113,753 |
| 3+ Earners | 36,209 (10.3%) | $128,060 |
| Total | 352,794 (100.0%) | $86,250 |
Household Income in Hillsborough County
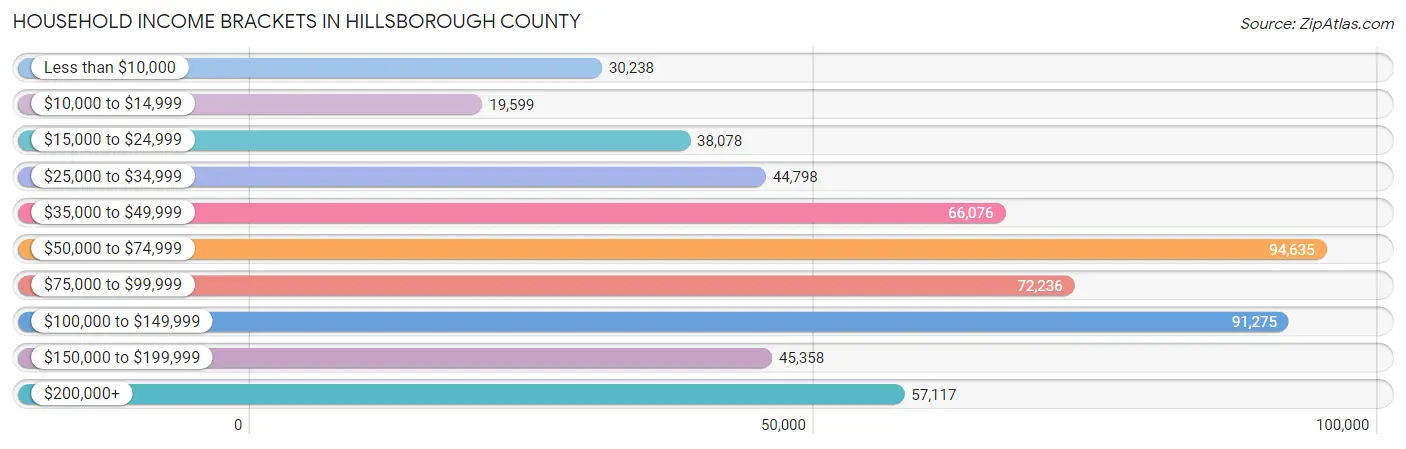
Household Income Brackets in Hillsborough County
With 94,635 households falling in the category, the $50,000 to $74,999 income range is the most frequent in Hillsborough County, accounting for 16.9% of all households. In contrast, only 19,599 households (3.5%) fall into the $10,000 to $14,999 income bracket, making it the least populous group.
| Income Bracket | # Households | % Households |
| Less than $10,000 | 30,238 | 5.4% |
| $10,000 to $14,999 | 19,599 | 3.5% |
| $15,000 to $24,999 | 38,078 | 6.8% |
| $25,000 to $34,999 | 44,798 | 8.0% |
| $35,000 to $49,999 | 66,076 | 11.8% |
| $50,000 to $74,999 | 94,635 | 16.9% |
| $75,000 to $99,999 | 72,236 | 12.9% |
| $100,000 to $149,999 | 91,275 | 16.3% |
| $150,000 to $199,999 | 45,358 | 8.1% |
| $200,000+ | 57,117 | 10.2% |
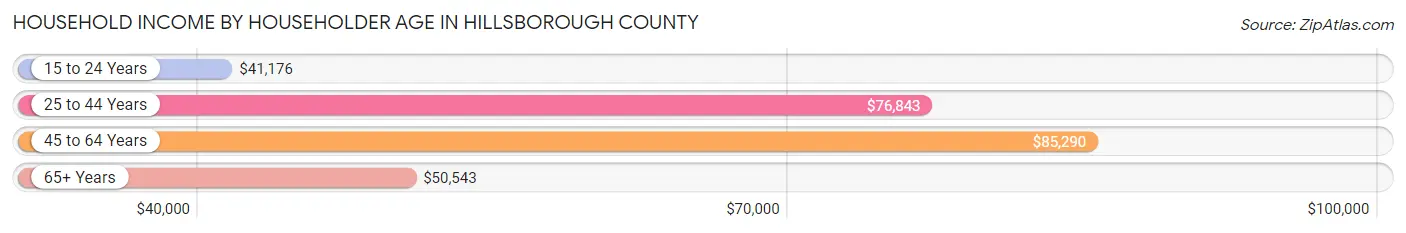
Household Income by Householder Age in Hillsborough County
The median household income in Hillsborough County is $70,612, with the highest median household income of $85,290 found in the 45 to 64 years age bracket for the primary householder. A total of 205,856 households (36.8%) fall into this category. Meanwhile, the 15 to 24 years age bracket for the primary householder has the lowest median household income of $41,176, with 22,942 households (4.1%) in this group.
| Income Bracket | # Households | Median Income |
| 15 to 24 Years | 22,942 (4.1%) | $41,176 |
| 25 to 44 Years | 207,223 (37.0%) | $76,843 |
| 45 to 64 Years | 205,856 (36.8%) | $85,290 |
| 65+ Years | 123,949 (22.1%) | $50,543 |
| Total | 559,970 (100.0%) | $70,612 |
Poverty in Hillsborough County
Income Below Poverty by Sex and Age in Hillsborough County
With 12.4% poverty level for males and 14.9% for females among the residents of Hillsborough County, 6 to 11 year old males and 18 to 24 year old females are the most vulnerable to poverty, with 9,987 males (18.3%) and 14,530 females (23.8%) in their respective age groups living below the poverty level.
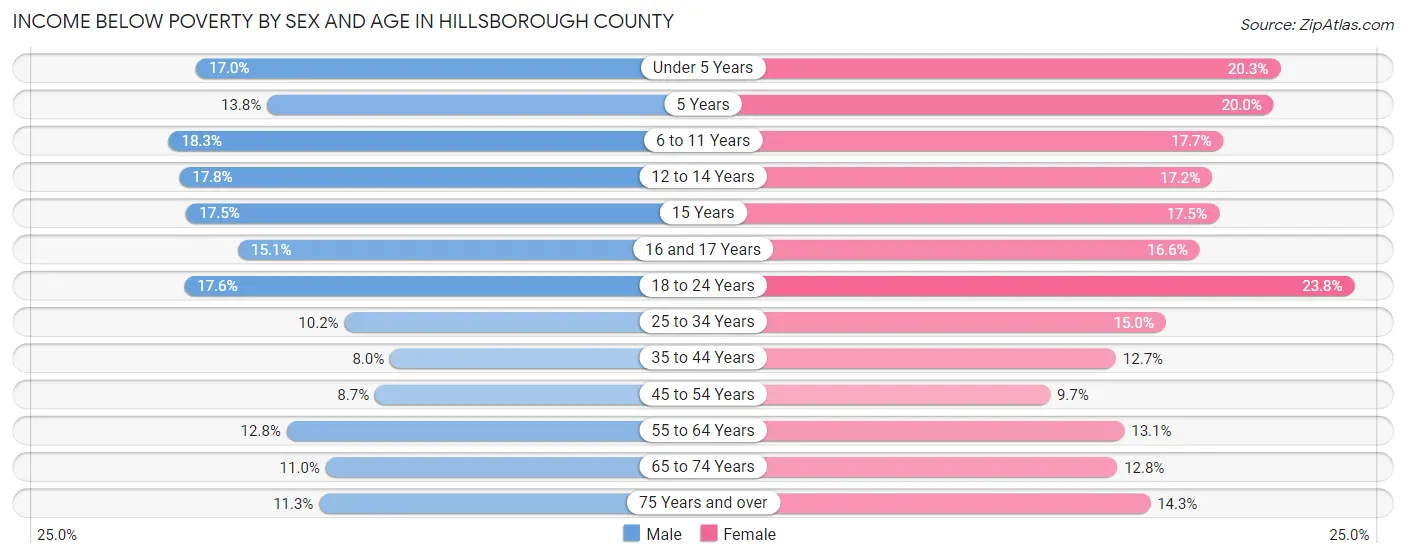
| Age Bracket | Male | Female |
| Under 5 Years | 7,303 (17.0%) | 8,272 (20.3%) |
| 5 Years | 1,106 (13.8%) | 1,785 (20.0%) |
| 6 to 11 Years | 9,987 (18.3%) | 8,983 (17.7%) |
| 12 to 14 Years | 5,140 (17.8%) | 4,619 (17.2%) |
| 15 Years | 1,644 (17.5%) | 1,463 (17.5%) |
| 16 and 17 Years | 2,777 (15.1%) | 2,988 (16.6%) |
| 18 to 24 Years | 11,169 (17.6%) | 14,530 (23.8%) |
| 25 to 34 Years | 11,074 (10.2%) | 16,487 (15.0%) |
| 35 to 44 Years | 8,202 (8.0%) | 13,049 (12.7%) |
| 45 to 54 Years | 8,404 (8.7%) | 9,322 (9.7%) |
| 55 to 64 Years | 11,088 (12.8%) | 11,855 (13.1%) |
| 65 to 74 Years | 6,465 (11.0%) | 8,696 (12.8%) |
| 75 Years and over | 3,921 (11.3%) | 7,040 (14.3%) |
| Total | 88,280 (12.4%) | 109,089 (14.9%) |
Income Above Poverty by Sex and Age in Hillsborough County
According to the poverty statistics in Hillsborough County, males aged 35 to 44 years and females aged 45 to 54 years are the age groups that are most secure financially, with 92.0% of males and 90.3% of females in these age groups living above the poverty line.
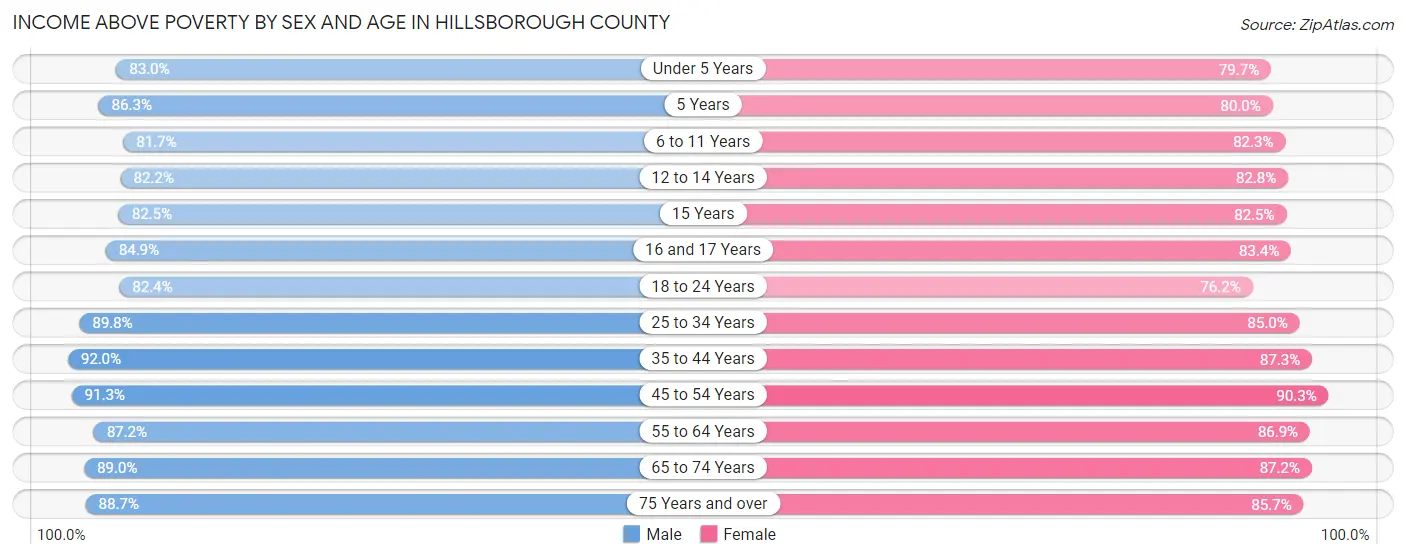
| Age Bracket | Male | Female |
| Under 5 Years | 35,549 (83.0%) | 32,394 (79.7%) |
| 5 Years | 6,938 (86.3%) | 7,122 (80.0%) |
| 6 to 11 Years | 44,525 (81.7%) | 41,759 (82.3%) |
| 12 to 14 Years | 23,700 (82.2%) | 22,274 (82.8%) |
| 15 Years | 7,754 (82.5%) | 6,900 (82.5%) |
| 16 and 17 Years | 15,621 (84.9%) | 15,009 (83.4%) |
| 18 to 24 Years | 52,324 (82.4%) | 46,562 (76.2%) |
| 25 to 34 Years | 97,901 (89.8%) | 93,189 (85.0%) |
| 35 to 44 Years | 93,785 (92.0%) | 89,507 (87.3%) |
| 45 to 54 Years | 87,728 (91.3%) | 87,148 (90.3%) |
| 55 to 64 Years | 75,287 (87.2%) | 78,559 (86.9%) |
| 65 to 74 Years | 52,137 (89.0%) | 59,341 (87.2%) |
| 75 Years and over | 30,694 (88.7%) | 42,172 (85.7%) |
| Total | 623,943 (87.6%) | 621,936 (85.1%) |
Income Below Poverty Among Married-Couple Families in Hillsborough County
The poverty statistics for married-couple families in Hillsborough County show that 5.6% or 13,835 of the total 247,381 families live below the poverty line. Families with 5 or more children have the highest poverty rate of 43.5%, comprising of 732 families. On the other hand, families with no children have the lowest poverty rate of 4.4%, which includes 6,262 families.
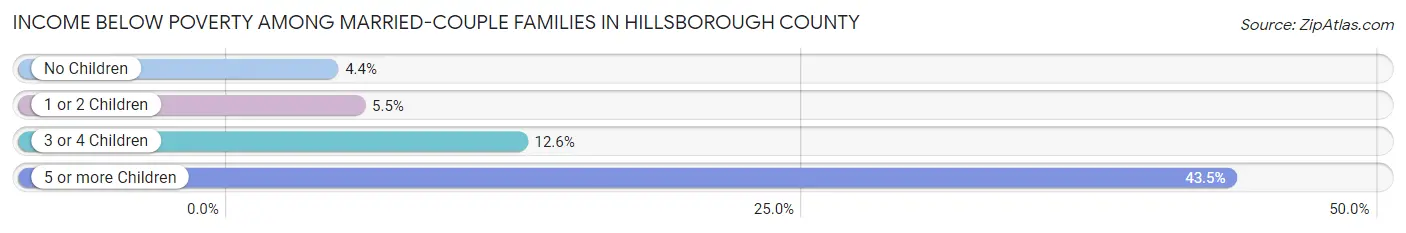
| Children | Above Poverty | Below Poverty |
| No Children | 137,356 (95.6%) | 6,262 (4.4%) |
| 1 or 2 Children | 80,499 (94.5%) | 4,716 (5.5%) |
| 3 or 4 Children | 14,740 (87.4%) | 2,125 (12.6%) |
| 5 or more Children | 951 (56.5%) | 732 (43.5%) |
| Total | 233,546 (94.4%) | 13,835 (5.6%) |
Income Below Poverty Among Single-Parent Households in Hillsborough County
According to the poverty data in Hillsborough County, 12.8% or 3,928 single-father households and 23.1% or 17,270 single-mother households are living below the poverty line. Among single-father households, those with 3 or 4 children have the highest poverty rate, with 744 households (32.3%) experiencing poverty. Likewise, among single-mother households, those with 5 or more children have the highest poverty rate, with 450 households (60.2%) falling below the poverty line.
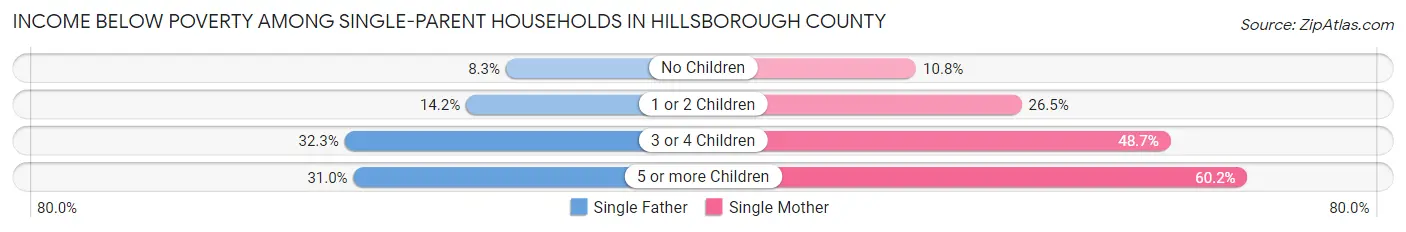
| Children | Single Father | Single Mother |
| No Children | 1,230 (8.3%) | 3,080 (10.8%) |
| 1 or 2 Children | 1,923 (14.2%) | 10,004 (26.5%) |
| 3 or 4 Children | 744 (32.3%) | 3,736 (48.7%) |
| 5 or more Children | 31 (31.0%) | 450 (60.2%) |
| Total | 3,928 (12.8%) | 17,270 (23.1%) |
Income Below Poverty Among Married-Couple vs Single-Parent Households in Hillsborough County
The poverty data for Hillsborough County shows that 13,835 of the married-couple family households (5.6%) and 21,198 of the single-parent households (20.1%) are living below the poverty level. Within the married-couple family households, those with 5 or more children have the highest poverty rate, with 732 households (43.5%) falling below the poverty line. Among the single-parent households, those with 5 or more children have the highest poverty rate, with 481 household (56.7%) living below poverty.
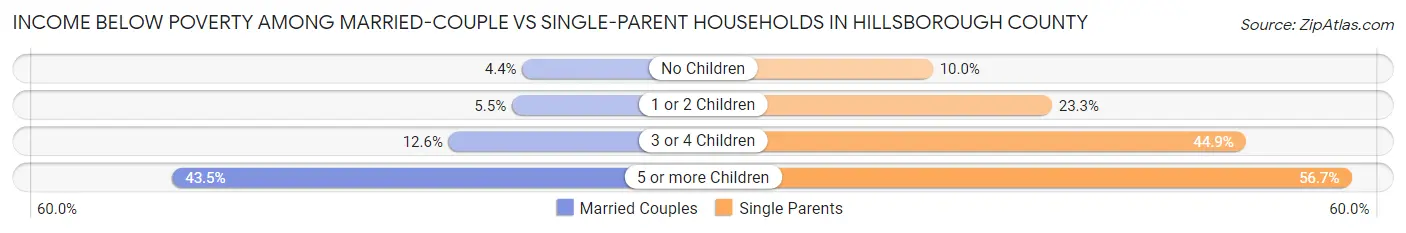
| Children | Married-Couple Families | Single-Parent Households |
| No Children | 6,262 (4.4%) | 4,310 (10.0%) |
| 1 or 2 Children | 4,716 (5.5%) | 11,927 (23.3%) |
| 3 or 4 Children | 2,125 (12.6%) | 4,480 (44.9%) |
| 5 or more Children | 732 (43.5%) | 481 (56.7%) |
| Total | 13,835 (5.6%) | 21,198 (20.1%) |
Race in Hillsborough County
The most populous races in Hillsborough County are White / Caucasian (864,562 | 58.9%), Hispanic or Latino (439,450 | 29.9%), and Black / African American (241,312 | 16.4%).
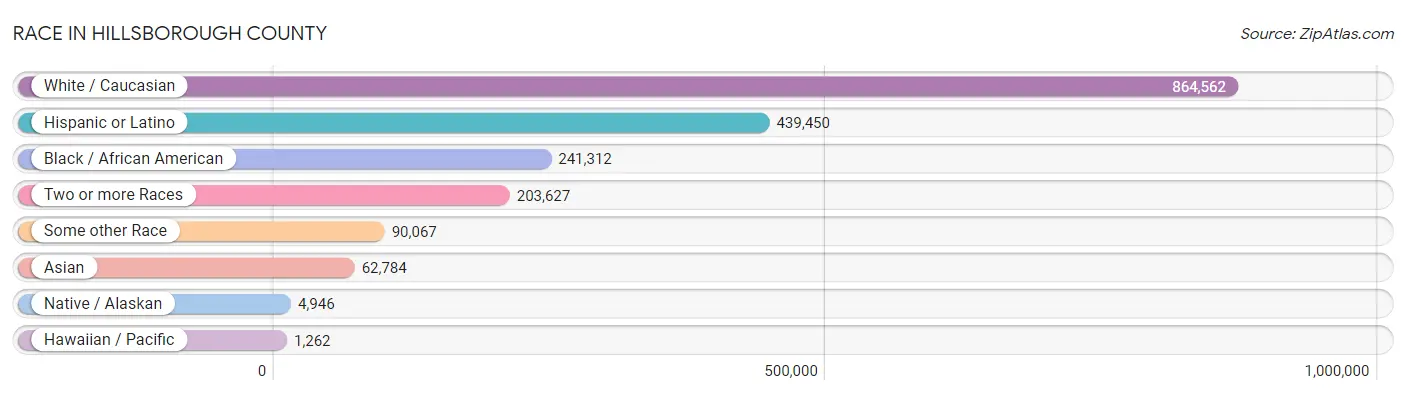
| Race | # Population | % Population |
| Asian | 62,784 | 4.3% |
| Black / African American | 241,312 | 16.4% |
| Hawaiian / Pacific | 1,262 | 0.1% |
| Hispanic or Latino | 439,450 | 29.9% |
| Native / Alaskan | 4,946 | 0.3% |
| White / Caucasian | 864,562 | 58.9% |
| Two or more Races | 203,627 | 13.9% |
| Some other Race | 90,067 | 6.1% |
| Total | 1,468,560 | 100.0% |
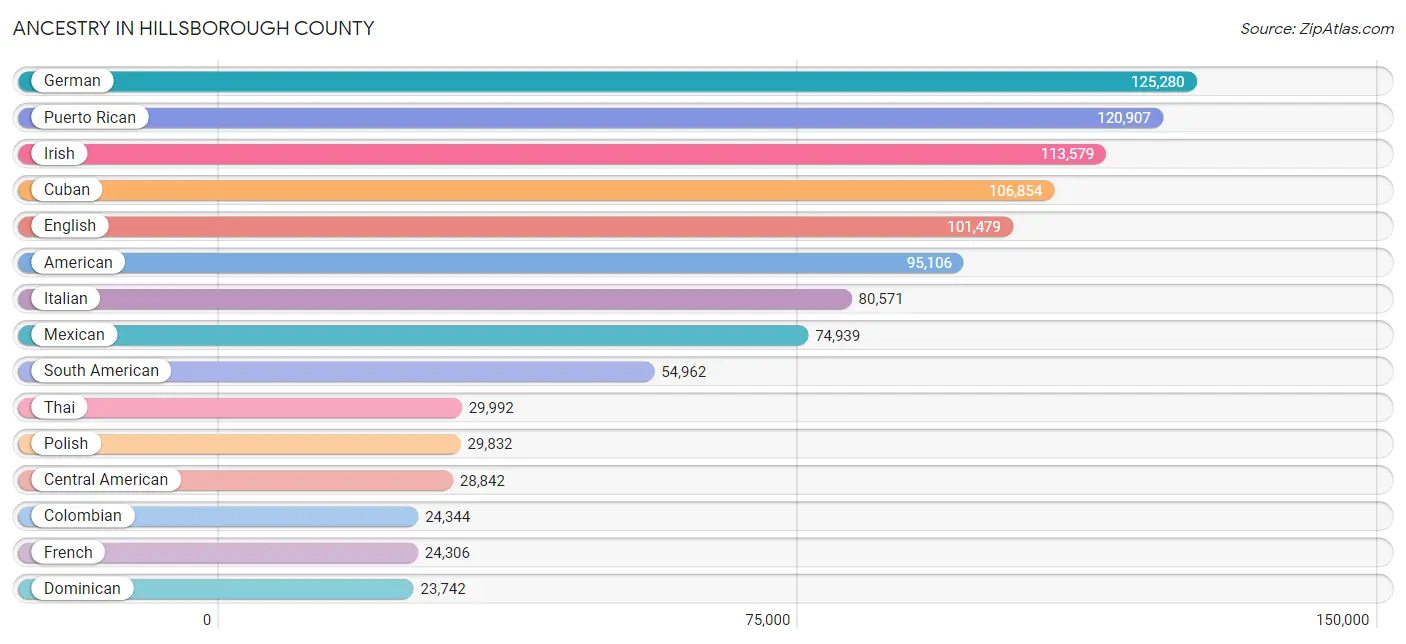
Ancestry in Hillsborough County
The most populous ancestries reported in Hillsborough County are German (125,280 | 8.5%), Puerto Rican (120,907 | 8.2%), Irish (113,579 | 7.7%), Cuban (106,854 | 7.3%), and English (101,479 | 6.9%), together accounting for 38.7% of all Hillsborough County residents.
| Ancestry | # Population | % Population |
| Afghan | 811 | 0.1% |
| African | 7,729 | 0.5% |
| Alaska Native | 26 | 0.0% |
| Alaskan Athabascan | 8 | 0.0% |
| Albanian | 940 | 0.1% |
| Alsatian | 14 | 0.0% |
| American | 95,106 | 6.5% |
| Apache | 86 | 0.0% |
| Arab | 14,507 | 1.0% |
| Argentinean | 2,574 | 0.2% |
| Armenian | 789 | 0.1% |
| Assyrian / Chaldean / Syriac | 88 | 0.0% |
| Australian | 506 | 0.0% |
| Austrian | 1,951 | 0.1% |
| Bahamian | 1,515 | 0.1% |
| Bangladeshi | 318 | 0.0% |
| Barbadian | 329 | 0.0% |
| Basque | 140 | 0.0% |
| Belgian | 896 | 0.1% |
| Belizean | 811 | 0.1% |
| Bermudan | 22 | 0.0% |
| Bhutanese | 2,784 | 0.2% |
| Blackfeet | 518 | 0.0% |
| Bolivian | 993 | 0.1% |
| Brazilian | 4,374 | 0.3% |
| British | 10,090 | 0.7% |
| British West Indian | 2,572 | 0.2% |
| Bulgarian | 854 | 0.1% |
| Burmese | 4,761 | 0.3% |
| Cajun | 88 | 0.0% |
| Cambodian | 17 | 0.0% |
| Canadian | 3,274 | 0.2% |
| Cape Verdean | 329 | 0.0% |
| Carpatho Rusyn | 53 | 0.0% |
| Celtic | 330 | 0.0% |
| Central American | 28,842 | 2.0% |
| Central American Indian | 2,280 | 0.2% |
| Cherokee | 3,472 | 0.2% |
| Chickasaw | 65 | 0.0% |
| Chilean | 741 | 0.1% |
| Chippewa | 240 | 0.0% |
| Choctaw | 273 | 0.0% |
| Colombian | 24,344 | 1.7% |
| Comanche | 13 | 0.0% |
| Costa Rican | 2,019 | 0.1% |
| Cree | 39 | 0.0% |
| Creek | 208 | 0.0% |
| Croatian | 1,256 | 0.1% |
| Crow | 12 | 0.0% |
| Cuban | 106,854 | 7.3% |
| Cypriot | 85 | 0.0% |
| Czech | 2,998 | 0.2% |
| Czechoslovakian | 840 | 0.1% |
| Danish | 2,626 | 0.2% |
| Delaware | 14 | 0.0% |
| Dominican | 23,742 | 1.6% |
| Dutch | 9,831 | 0.7% |
| Dutch West Indian | 241 | 0.0% |
| Eastern European | 3,297 | 0.2% |
| Ecuadorian | 5,027 | 0.3% |
| Egyptian | 2,099 | 0.1% |
| English | 101,479 | 6.9% |
| Estonian | 125 | 0.0% |
| Ethiopian | 1,846 | 0.1% |
| European | 17,857 | 1.2% |
| Fijian | 7 | 0.0% |
| Filipino | 729 | 0.1% |
| Finnish | 1,531 | 0.1% |
| French | 24,306 | 1.7% |
| French American Indian | 59 | 0.0% |
| French Canadian | 5,789 | 0.4% |
| German | 125,280 | 8.5% |
| German Russian | 98 | 0.0% |
| Ghanaian | 359 | 0.0% |
| Greek | 7,365 | 0.5% |
| Guamanian / Chamorro | 219 | 0.0% |
| Guatemalan | 7,037 | 0.5% |
| Guyanese | 1,551 | 0.1% |
| Haitian | 14,382 | 1.0% |
| Honduran | 9,559 | 0.6% |
| Houma | 39 | 0.0% |
| Hungarian | 4,856 | 0.3% |
| Icelander | 215 | 0.0% |
| Indian (Asian) | 11,884 | 0.8% |
| Indonesian | 184 | 0.0% |
| Inupiat | 55 | 0.0% |
| Iranian | 1,388 | 0.1% |
| Iraqi | 801 | 0.1% |
| Irish | 113,579 | 7.7% |
| Iroquois | 423 | 0.0% |
| Israeli | 1,028 | 0.1% |
| Italian | 80,571 | 5.5% |
| Jamaican | 12,330 | 0.8% |
| Japanese | 552 | 0.0% |
| Jordanian | 1,226 | 0.1% |
| Kenyan | 353 | 0.0% |
| Korean | 12,270 | 0.8% |
| Laotian | 207 | 0.0% |
| Latvian | 165 | 0.0% |
| Lebanese | 3,240 | 0.2% |
| Liberian | 185 | 0.0% |
| Lithuanian | 2,028 | 0.1% |
| Lumbee | 67 | 0.0% |
| Luxembourger | 52 | 0.0% |
| Macedonian | 150 | 0.0% |
| Malaysian | 392 | 0.0% |
| Maltese | 182 | 0.0% |
| Mexican | 74,939 | 5.1% |
| Mexican American Indian | 2,593 | 0.2% |
| Mongolian | 24 | 0.0% |
| Moroccan | 1,816 | 0.1% |
| Native Hawaiian | 1,171 | 0.1% |
| Navajo | 34 | 0.0% |
| New Zealander | 83 | 0.0% |
| Nicaraguan | 2,963 | 0.2% |
| Nigerian | 2,185 | 0.2% |
| Northern European | 1,448 | 0.1% |
| Norwegian | 7,834 | 0.5% |
| Osage | 7 | 0.0% |
| Pakistani | 2,123 | 0.1% |
| Palestinian | 1,419 | 0.1% |
| Panamanian | 3,145 | 0.2% |
| Paraguayan | 322 | 0.0% |
| Pennsylvania German | 514 | 0.0% |
| Peruvian | 6,516 | 0.4% |
| Polish | 29,832 | 2.0% |
| Portuguese | 5,276 | 0.4% |
| Pueblo | 14 | 0.0% |
| Puerto Rican | 120,907 | 8.2% |
| Romanian | 1,195 | 0.1% |
| Russian | 8,614 | 0.6% |
| Salvadoran | 4,073 | 0.3% |
| Samoan | 506 | 0.0% |
| Scandinavian | 2,856 | 0.2% |
| Scotch-Irish | 8,383 | 0.6% |
| Scottish | 18,913 | 1.3% |
| Seminole | 246 | 0.0% |
| Senegalese | 275 | 0.0% |
| Serbian | 473 | 0.0% |
| Shoshone | 30 | 0.0% |
| Sierra Leonean | 288 | 0.0% |
| Sioux | 365 | 0.0% |
| Slavic | 635 | 0.0% |
| Slovak | 2,662 | 0.2% |
| Slovene | 1,017 | 0.1% |
| Somali | 12 | 0.0% |
| South African | 414 | 0.0% |
| South American | 54,962 | 3.7% |
| South American Indian | 308 | 0.0% |
| Spaniard | 9,775 | 0.7% |
| Spanish | 4,686 | 0.3% |
| Spanish American | 251 | 0.0% |
| Spanish American Indian | 53 | 0.0% |
| Sri Lankan | 9,559 | 0.6% |
| Subsaharan African | 15,590 | 1.1% |
| Sudanese | 329 | 0.0% |
| Swedish | 8,990 | 0.6% |
| Swiss | 1,849 | 0.1% |
| Syrian | 954 | 0.1% |
| Thai | 29,992 | 2.0% |
| Tongan | 21 | 0.0% |
| Trinidadian and Tobagonian | 3,532 | 0.2% |
| Tsimshian | 20 | 0.0% |
| Turkish | 1,430 | 0.1% |
| U.S. Virgin Islander | 813 | 0.1% |
| Ugandan | 97 | 0.0% |
| Ukrainian | 3,589 | 0.2% |
| Uruguayan | 835 | 0.1% |
| Venezuelan | 13,486 | 0.9% |
| Vietnamese | 500 | 0.0% |
| Welsh | 5,716 | 0.4% |
| West Indian | 3,068 | 0.2% |
| Yugoslavian | 1,035 | 0.1% |
| Yup'ik | 11 | 0.0% |
| Zimbabwean | 66 | 0.0% | View All 175 Rows |
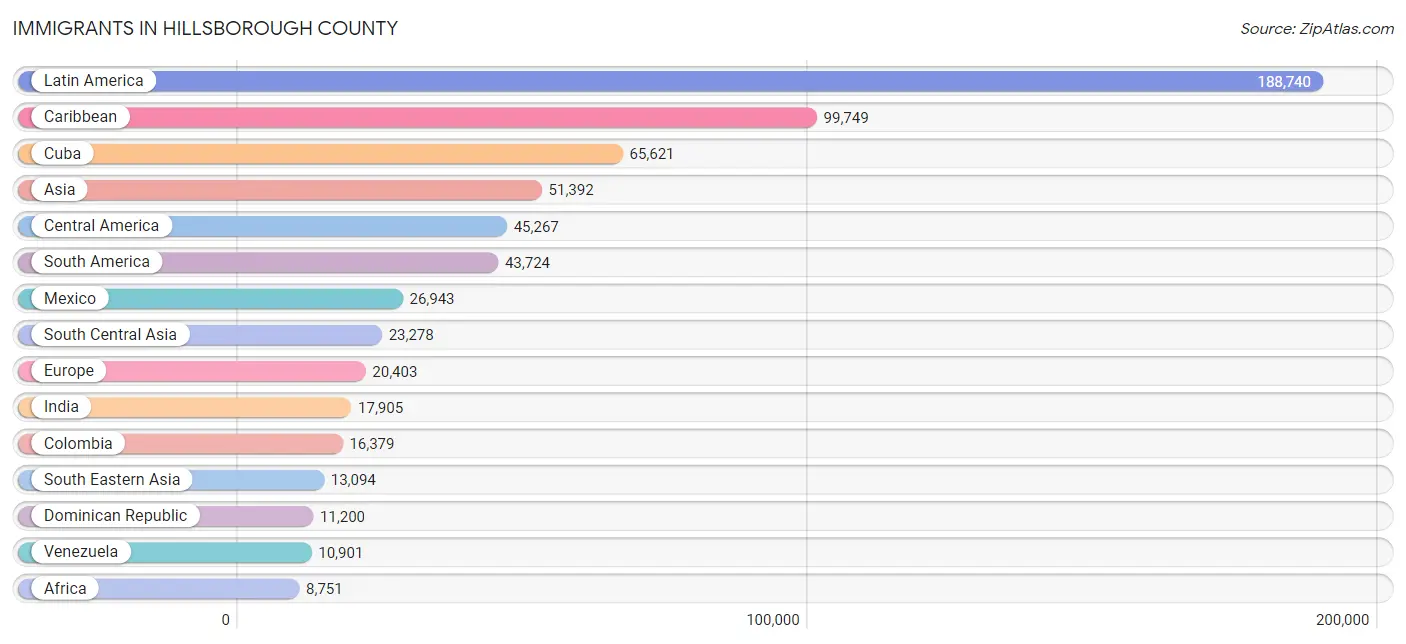
Immigrants in Hillsborough County
The most numerous immigrant groups reported in Hillsborough County came from Latin America (188,740 | 12.9%), Caribbean (99,749 | 6.8%), Cuba (65,621 | 4.5%), Asia (51,392 | 3.5%), and Central America (45,267 | 3.1%), together accounting for 30.7% of all Hillsborough County residents.
| Immigration Origin | # Population | % Population |
| Afghanistan | 565 | 0.0% |
| Africa | 8,751 | 0.6% |
| Albania | 385 | 0.0% |
| Argentina | 1,535 | 0.1% |
| Armenia | 90 | 0.0% |
| Asia | 51,392 | 3.5% |
| Australia | 571 | 0.0% |
| Austria | 125 | 0.0% |
| Azores | 23 | 0.0% |
| Bahamas | 907 | 0.1% |
| Bangladesh | 903 | 0.1% |
| Barbados | 281 | 0.0% |
| Belarus | 159 | 0.0% |
| Belgium | 84 | 0.0% |
| Belize | 769 | 0.1% |
| Bolivia | 510 | 0.0% |
| Bosnia and Herzegovina | 518 | 0.0% |
| Brazil | 4,121 | 0.3% |
| Bulgaria | 703 | 0.1% |
| Cabo Verde | 115 | 0.0% |
| Cambodia | 79 | 0.0% |
| Cameroon | 190 | 0.0% |
| Canada | 5,025 | 0.3% |
| Caribbean | 99,749 | 6.8% |
| Central America | 45,267 | 3.1% |
| Chile | 410 | 0.0% |
| China | 5,525 | 0.4% |
| Colombia | 16,379 | 1.1% |
| Congo | 96 | 0.0% |
| Costa Rica | 1,070 | 0.1% |
| Croatia | 149 | 0.0% |
| Cuba | 65,621 | 4.5% |
| Czechoslovakia | 387 | 0.0% |
| Denmark | 92 | 0.0% |
| Dominica | 773 | 0.1% |
| Dominican Republic | 11,200 | 0.8% |
| Eastern Africa | 2,398 | 0.2% |
| Eastern Asia | 7,868 | 0.5% |
| Eastern Europe | 7,930 | 0.5% |
| Ecuador | 2,234 | 0.2% |
| Egypt | 937 | 0.1% |
| El Salvador | 2,197 | 0.2% |
| England | 2,335 | 0.2% |
| Eritrea | 477 | 0.0% |
| Ethiopia | 576 | 0.0% |
| Europe | 20,403 | 1.4% |
| Fiji | 12 | 0.0% |
| France | 772 | 0.1% |
| Germany | 2,611 | 0.2% |
| Ghana | 261 | 0.0% |
| Greece | 335 | 0.0% |
| Grenada | 180 | 0.0% |
| Guatemala | 3,996 | 0.3% |
| Guyana | 1,801 | 0.1% |
| Haiti | 8,268 | 0.6% |
| Honduras | 6,713 | 0.5% |
| Hong Kong | 251 | 0.0% |
| Hungary | 358 | 0.0% |
| India | 17,905 | 1.2% |
| Indonesia | 201 | 0.0% |
| Iran | 908 | 0.1% |
| Iraq | 737 | 0.1% |
| Ireland | 374 | 0.0% |
| Israel | 550 | 0.0% |
| Italy | 1,013 | 0.1% |
| Jamaica | 7,497 | 0.5% |
| Japan | 834 | 0.1% |
| Jordan | 1,069 | 0.1% |
| Kazakhstan | 328 | 0.0% |
| Kenya | 318 | 0.0% |
| Korea | 1,500 | 0.1% |
| Kuwait | 512 | 0.0% |
| Laos | 195 | 0.0% |
| Latin America | 188,740 | 12.9% |
| Latvia | 31 | 0.0% |
| Lebanon | 841 | 0.1% |
| Liberia | 179 | 0.0% |
| Lithuania | 94 | 0.0% |
| Malaysia | 383 | 0.0% |
| Mexico | 26,943 | 1.8% |
| Middle Africa | 319 | 0.0% |
| Moldova | 62 | 0.0% |
| Morocco | 1,281 | 0.1% |
| Nepal | 205 | 0.0% |
| Netherlands | 594 | 0.0% |
| Nicaragua | 1,798 | 0.1% |
| Nigeria | 1,243 | 0.1% |
| Northern Africa | 2,575 | 0.2% |
| Northern Europe | 5,418 | 0.4% |
| Norway | 33 | 0.0% |
| Oceania | 846 | 0.1% |
| Pakistan | 1,312 | 0.1% |
| Panama | 1,781 | 0.1% |
| Peru | 4,661 | 0.3% |
| Philippines | 5,395 | 0.4% |
| Poland | 1,313 | 0.1% |
| Portugal | 621 | 0.0% |
| Romania | 261 | 0.0% |
| Russia | 2,033 | 0.1% |
| Saudi Arabia | 632 | 0.0% |
| Scotland | 300 | 0.0% |
| Senegal | 227 | 0.0% |
| Serbia | 8 | 0.0% |
| Sierra Leone | 158 | 0.0% |
| Singapore | 49 | 0.0% |
| Somalia | 10 | 0.0% |
| South Africa | 659 | 0.0% |
| South America | 43,724 | 3.0% |
| South Central Asia | 23,278 | 1.6% |
| South Eastern Asia | 13,094 | 0.9% |
| Southern Europe | 2,743 | 0.2% |
| Spain | 695 | 0.1% |
| Sri Lanka | 908 | 0.1% |
| St. Vincent and the Grenadines | 261 | 0.0% |
| Sudan | 76 | 0.0% |
| Sweden | 254 | 0.0% |
| Switzerland | 81 | 0.0% |
| Syria | 749 | 0.1% |
| Taiwan | 708 | 0.1% |
| Thailand | 1,096 | 0.1% |
| Trinidad and Tobago | 3,193 | 0.2% |
| Turkey | 1,148 | 0.1% |
| Uganda | 130 | 0.0% |
| Ukraine | 819 | 0.1% |
| Uruguay | 673 | 0.1% |
| Uzbekistan | 67 | 0.0% |
| Venezuela | 10,901 | 0.7% |
| Vietnam | 5,538 | 0.4% |
| West Indies | 147 | 0.0% |
| Western Africa | 2,601 | 0.2% |
| Western Asia | 6,740 | 0.5% |
| Western Europe | 4,276 | 0.3% |
| Yemen | 23 | 0.0% |
| Zimbabwe | 70 | 0.0% | View All 134 Rows |
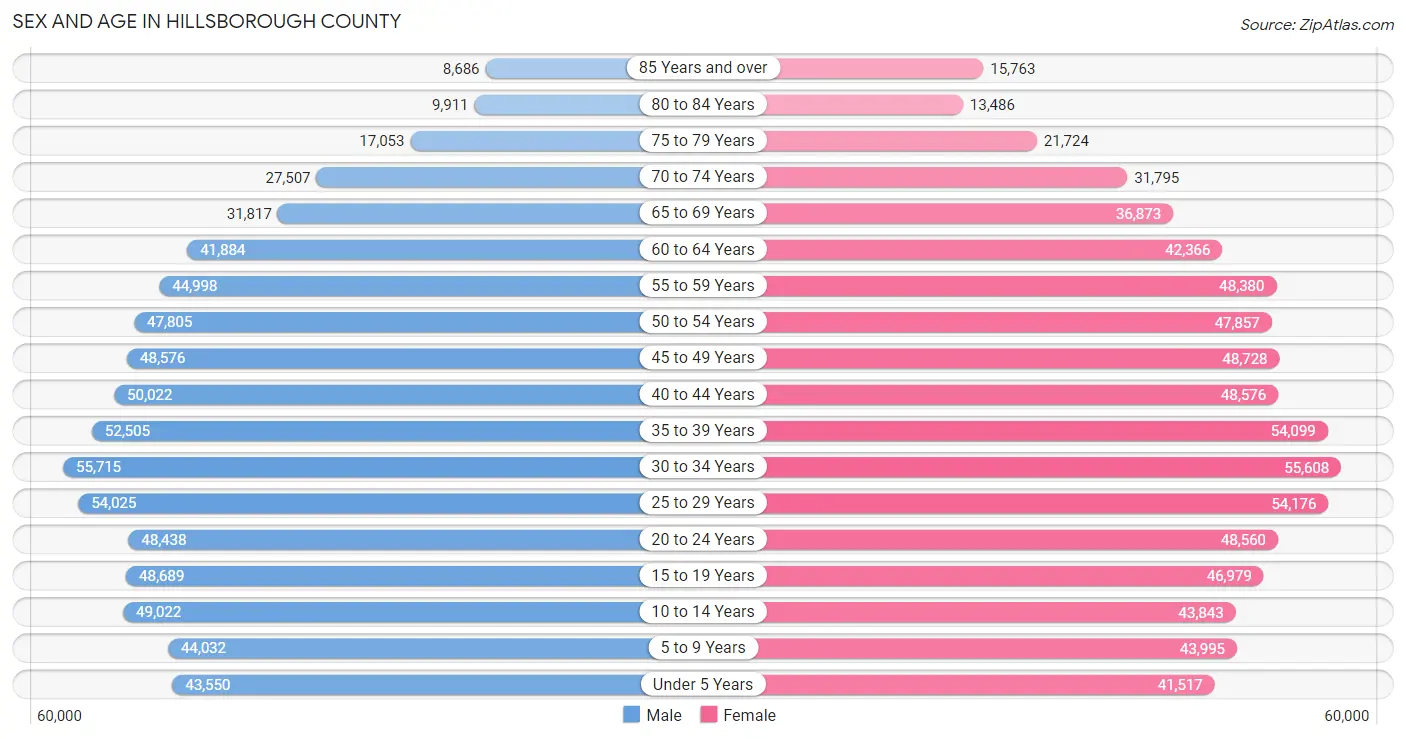
Sex and Age in Hillsborough County
Sex and Age in Hillsborough County
The most populous age groups in Hillsborough County are 30 to 34 Years (55,715 | 7.7%) for men and 30 to 34 Years (55,608 | 7.5%) for women.
| Age Bracket | Male | Female |
| Under 5 Years | 43,550 (6.0%) | 41,517 (5.6%) |
| 5 to 9 Years | 44,032 (6.1%) | 43,995 (5.9%) |
| 10 to 14 Years | 49,022 (6.8%) | 43,843 (5.9%) |
| 15 to 19 Years | 48,689 (6.7%) | 46,979 (6.3%) |
| 20 to 24 Years | 48,438 (6.7%) | 48,560 (6.5%) |
| 25 to 29 Years | 54,025 (7.5%) | 54,176 (7.3%) |
| 30 to 34 Years | 55,715 (7.7%) | 55,608 (7.5%) |
| 35 to 39 Years | 52,505 (7.2%) | 54,099 (7.3%) |
| 40 to 44 Years | 50,022 (6.9%) | 48,576 (6.5%) |
| 45 to 49 Years | 48,576 (6.7%) | 48,728 (6.6%) |
| 50 to 54 Years | 47,805 (6.6%) | 47,857 (6.4%) |
| 55 to 59 Years | 44,998 (6.2%) | 48,380 (6.5%) |
| 60 to 64 Years | 41,884 (5.8%) | 42,366 (5.7%) |
| 65 to 69 Years | 31,817 (4.4%) | 36,873 (5.0%) |
| 70 to 74 Years | 27,507 (3.8%) | 31,795 (4.3%) |
| 75 to 79 Years | 17,053 (2.4%) | 21,724 (2.9%) |
| 80 to 84 Years | 9,911 (1.4%) | 13,486 (1.8%) |
| 85 Years and over | 8,686 (1.2%) | 15,763 (2.1%) |
| Total | 724,235 (100.0%) | 744,325 (100.0%) |
Families and Households in Hillsborough County
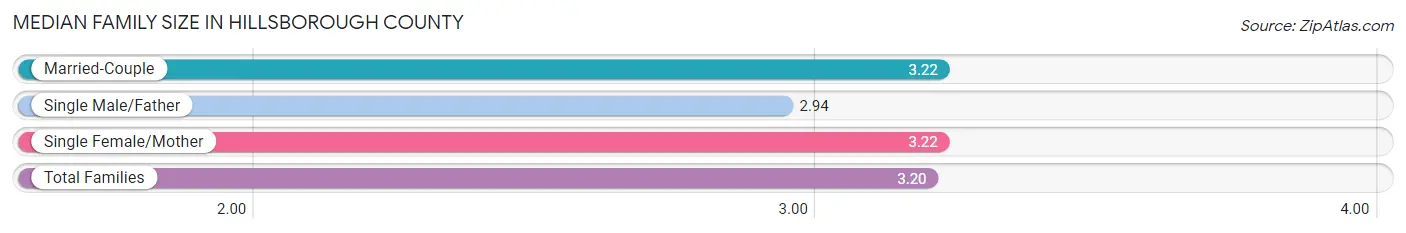
Median Family Size in Hillsborough County
The median family size in Hillsborough County is 3.20 persons per family, with married-couple families (247,381 | 70.1%) accounting for the largest median family size of 3.22 persons per family. On the other hand, single male/father families (30,726 | 8.7%) represent the smallest median family size with 2.94 persons per family.
| Family Type | # Families | Family Size |
| Married-Couple | 247,381 (70.1%) | 3.22 |
| Single Male/Father | 30,726 (8.7%) | 2.94 |
| Single Female/Mother | 74,687 (21.2%) | 3.22 |
| Total Families | 352,794 (100.0%) | 3.20 |
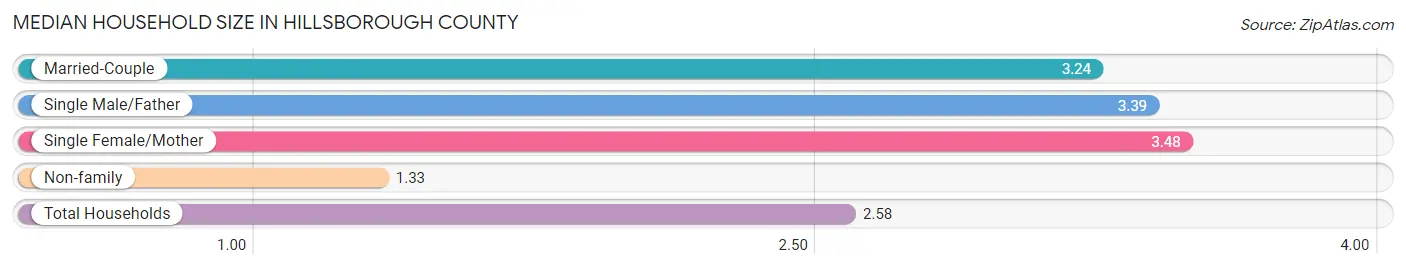
Median Household Size in Hillsborough County
The median household size in Hillsborough County is 2.58 persons per household, with single female/mother households (74,687 | 13.3%) accounting for the largest median household size of 3.48 persons per household. non-family households (207,176 | 37.0%) represent the smallest median household size with 1.33 persons per household.
| Household Type | # Households | Household Size |
| Married-Couple | 247,381 (44.2%) | 3.24 |
| Single Male/Father | 30,726 (5.5%) | 3.39 |
| Single Female/Mother | 74,687 (13.3%) | 3.48 |
| Non-family | 207,176 (37.0%) | 1.33 |
| Total Households | 559,970 (100.0%) | 2.58 |
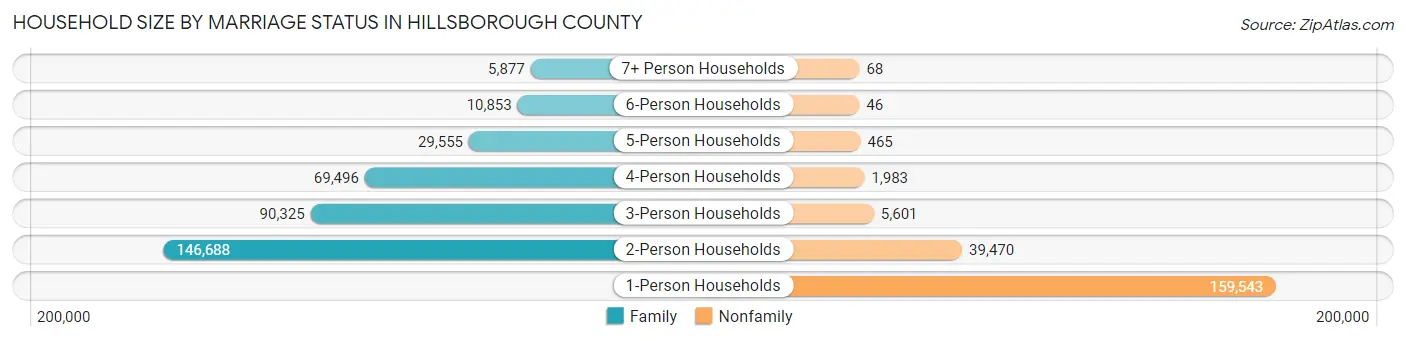
Household Size by Marriage Status in Hillsborough County
Out of a total of 559,970 households in Hillsborough County, 352,794 (63.0%) are family households, while 207,176 (37.0%) are nonfamily households. The most numerous type of family households are 2-person households, comprising 146,688, and the most common type of nonfamily households are 1-person households, comprising 159,543.
| Household Size | Family Households | Nonfamily Households |
| 1-Person Households | - | 159,543 (28.5%) |
| 2-Person Households | 146,688 (26.2%) | 39,470 (7.0%) |
| 3-Person Households | 90,325 (16.1%) | 5,601 (1.0%) |
| 4-Person Households | 69,496 (12.4%) | 1,983 (0.4%) |
| 5-Person Households | 29,555 (5.3%) | 465 (0.1%) |
| 6-Person Households | 10,853 (1.9%) | 46 (0.0%) |
| 7+ Person Households | 5,877 (1.1%) | 68 (0.0%) |
| Total | 352,794 (63.0%) | 207,176 (37.0%) |
Female Fertility in Hillsborough County
Fertility by Age in Hillsborough County
Average fertility rate in Hillsborough County is 48.0 births per 1,000 women. Women in the age bracket of 20 to 34 years have the highest fertility rate with 78.0 births per 1,000 women. Women in the age bracket of 20 to 34 years acount for 70.2% of all women with births.
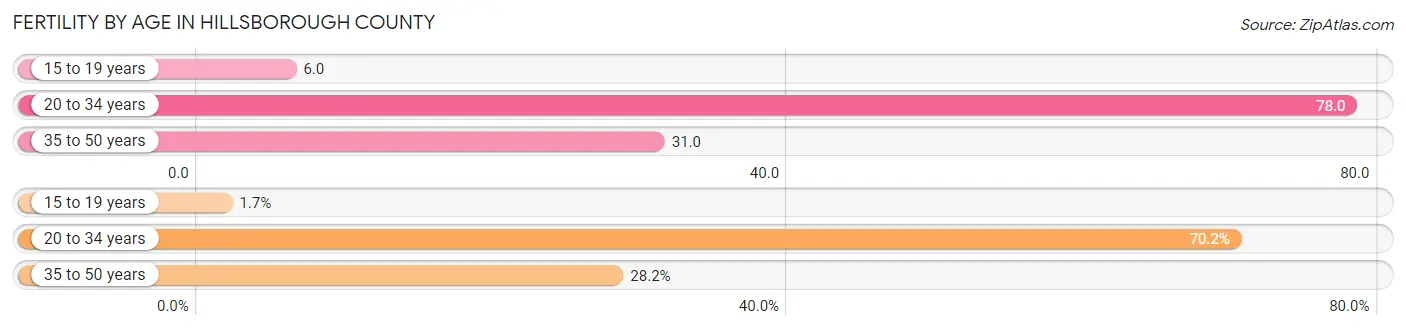
| Age Bracket | Women with Births | Births / 1,000 Women |
| 15 to 19 years | 291 (1.7%) | 6.0 |
| 20 to 34 years | 12,286 (70.2%) | 78.0 |
| 35 to 50 years | 4,937 (28.2%) | 31.0 |
| Total | 17,514 (100.0%) | 48.0 |
Fertility by Age by Marriage Status in Hillsborough County
62.8% of women with births (17,514) in Hillsborough County are married. The highest percentage of unmarried women with births falls into 15 to 19 years age bracket with 88.3% of them unmarried at the time of birth, while the lowest percentage of unmarried women with births belong to 35 to 50 years age bracket with 30.0% of them unmarried.
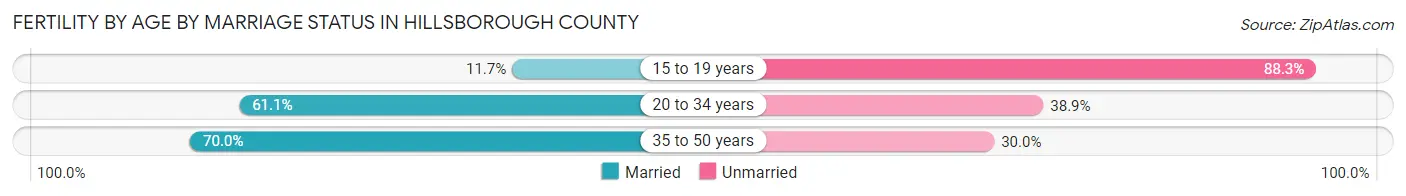
| Age Bracket | Married | Unmarried |
| 15 to 19 years | 34 (11.7%) | 257 (88.3%) |
| 20 to 34 years | 7,507 (61.1%) | 4,779 (38.9%) |
| 35 to 50 years | 3,456 (70.0%) | 1,481 (30.0%) |
| Total | 10,999 (62.8%) | 6,515 (37.2%) |
Fertility by Education in Hillsborough County
Average fertility rate in Hillsborough County is 48.0 births per 1,000 women. Women with the education attainment of graduate degree have the highest fertility rate of 56.0 births per 1,000 women, while women with the education attainment of less than high school have the lowest fertility at 37.0 births per 1,000 women. Women with the education attainment of college or associate's degree represent 32.2% of all women with births.
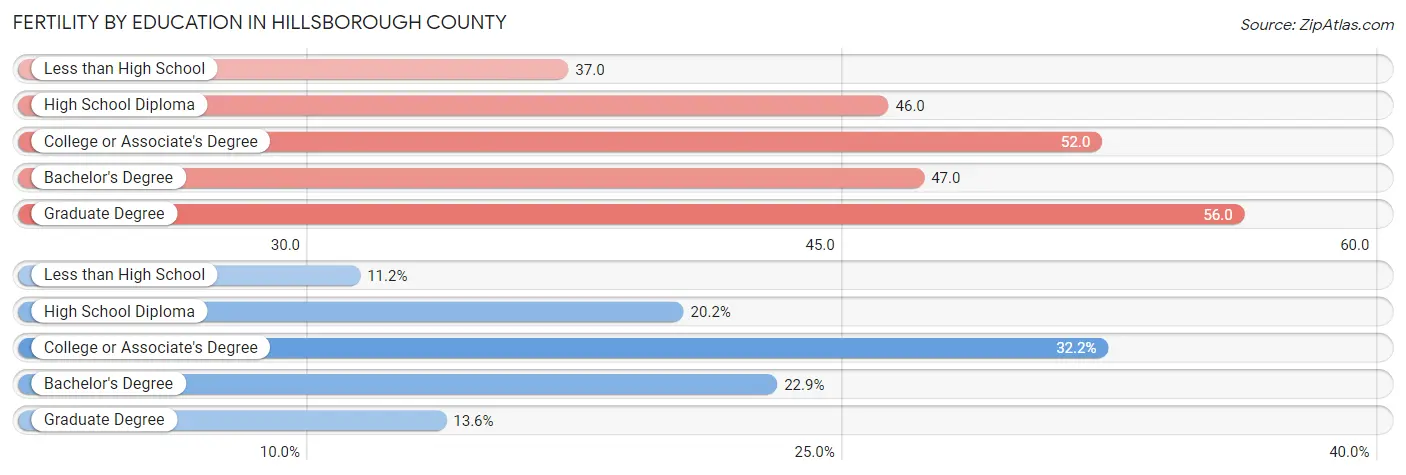
| Educational Attainment | Women with Births | Births / 1,000 Women |
| Less than High School | 1,953 (11.2%) | 37.0 |
| High School Diploma | 3,545 (20.2%) | 46.0 |
| College or Associate's Degree | 5,634 (32.2%) | 52.0 |
| Bachelor's Degree | 4,006 (22.9%) | 47.0 |
| Graduate Degree | 2,376 (13.6%) | 56.0 |
| Total | 17,514 (100.0%) | 48.0 |
Fertility by Education by Marriage Status in Hillsborough County
37.2% of women with births in Hillsborough County are unmarried. Women with the educational attainment of graduate degree are most likely to be married with 90.6% of them married at childbirth, while women with the educational attainment of high school diploma are least likely to be married with 64.4% of them unmarried at childbirth.
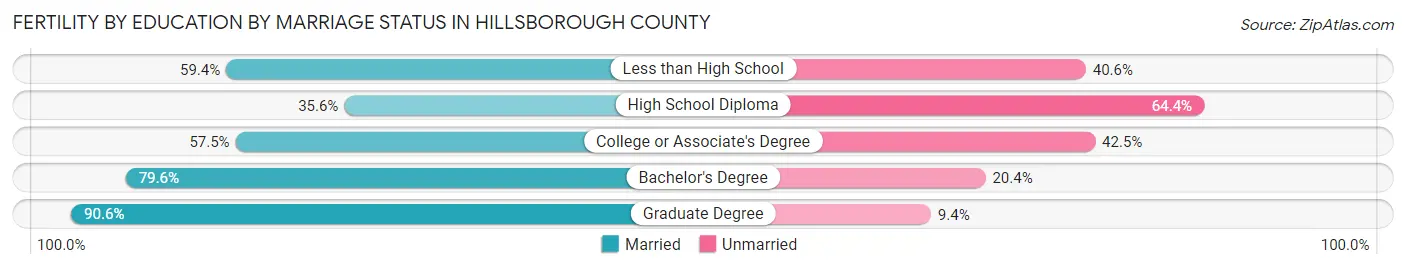
| Educational Attainment | Married | Unmarried |
| Less than High School | 1,160 (59.4%) | 793 (40.6%) |
| High School Diploma | 1,262 (35.6%) | 2,283 (64.4%) |
| College or Associate's Degree | 3,240 (57.5%) | 2,394 (42.5%) |
| Bachelor's Degree | 3,189 (79.6%) | 817 (20.4%) |
| Graduate Degree | 2,153 (90.6%) | 223 (9.4%) |
| Total | 10,999 (62.8%) | 6,515 (37.2%) |
Employment Characteristics in Hillsborough County
Employment by Class of Employer in Hillsborough County
Among the 723,695 employed individuals in Hillsborough County, private company employees (516,322 | 71.4%), not-for-profit organizations (48,461 | 6.7%), and local government employees (41,999 | 5.8%) make up the most common classes of employment.
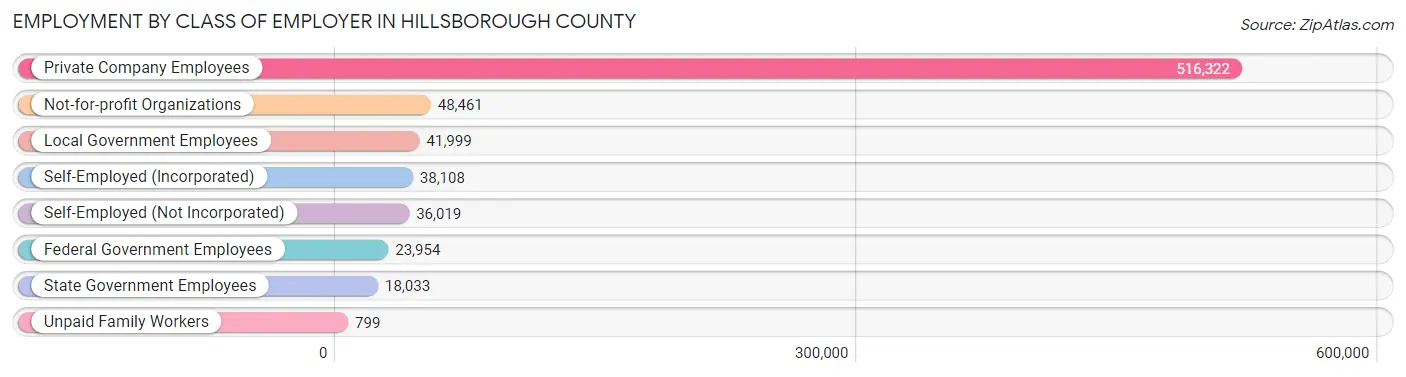
| Employer Class | # Employees | % Employees |
| Private Company Employees | 516,322 | 71.4% |
| Self-Employed (Incorporated) | 38,108 | 5.3% |
| Self-Employed (Not Incorporated) | 36,019 | 5.0% |
| Not-for-profit Organizations | 48,461 | 6.7% |
| Local Government Employees | 41,999 | 5.8% |
| State Government Employees | 18,033 | 2.5% |
| Federal Government Employees | 23,954 | 3.3% |
| Unpaid Family Workers | 799 | 0.1% |
| Total | 723,695 | 100.0% |
Employment Status by Age in Hillsborough County
According to the labor force statistics for Hillsborough County, out of the total population over 16 years of age (1,184,791), 65.3% or 773,669 individuals are in the labor force, with 4.8% or 37,136 of them unemployed. The age group with the highest labor force participation rate is 25 to 29 years, with 86.0% or 93,053 individuals in the labor force. Within the labor force, the 16 to 19 years age range has the highest percentage of unemployed individuals, with 16.7% or 4,642 of them being unemployed.
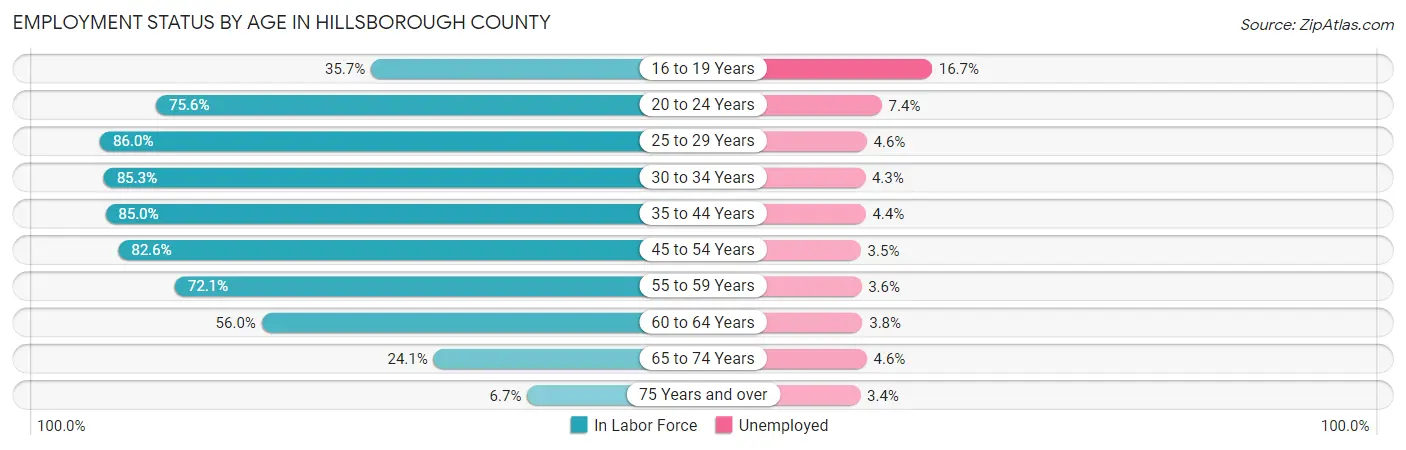
| Age Bracket | In Labor Force | Unemployed |
| 16 to 19 Years | 27,795 (35.7%) | 4,642 (16.7%) |
| 20 to 24 Years | 73,330 (75.6%) | 5,426 (7.4%) |
| 25 to 29 Years | 93,053 (86.0%) | 4,280 (4.6%) |
| 30 to 34 Years | 94,959 (85.3%) | 4,083 (4.3%) |
| 35 to 44 Years | 174,422 (85.0%) | 7,675 (4.4%) |
| 45 to 54 Years | 159,390 (82.6%) | 5,579 (3.5%) |
| 55 to 59 Years | 67,326 (72.1%) | 2,424 (3.6%) |
| 60 to 64 Years | 47,180 (56.0%) | 1,793 (3.8%) |
| 65 to 74 Years | 30,846 (24.1%) | 1,419 (4.6%) |
| 75 Years and over | 5,804 (6.7%) | 197 (3.4%) |
| Total | 773,669 (65.3%) | 37,136 (4.8%) |
Employment Status by Educational Attainment in Hillsborough County
According to labor force statistics for Hillsborough County, 80.0% of individuals (636,256) out of the total population between 25 and 64 years of age (795,320) are in the labor force, with 4.1% or 26,086 of them being unemployed. The group with the highest labor force participation rate are those with the educational attainment of bachelor's degree or higher, with 86.7% or 262,617 individuals in the labor force. Within the labor force, individuals with less than high school education have the highest percentage of unemployment, with 7.3% or 3,656 of them being unemployed.
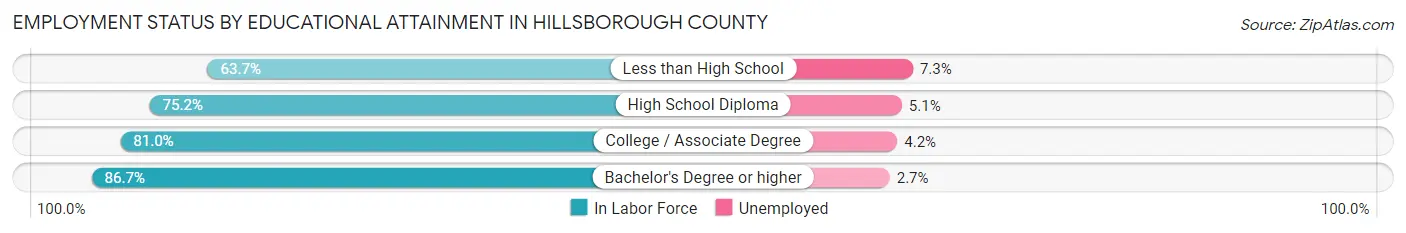
| Educational Attainment | In Labor Force | Unemployed |
| Less than High School | 50,086 (63.7%) | 5,740 (7.3%) |
| High School Diploma | 147,554 (75.2%) | 10,007 (5.1%) |
| College / Associate Degree | 176,235 (81.0%) | 9,138 (4.2%) |
| Bachelor's Degree or higher | 262,617 (86.7%) | 8,178 (2.7%) |
| Total | 636,256 (80.0%) | 32,608 (4.1%) |
Employment Occupations by Sex in Hillsborough County
Management, Business, Science and Arts Occupations
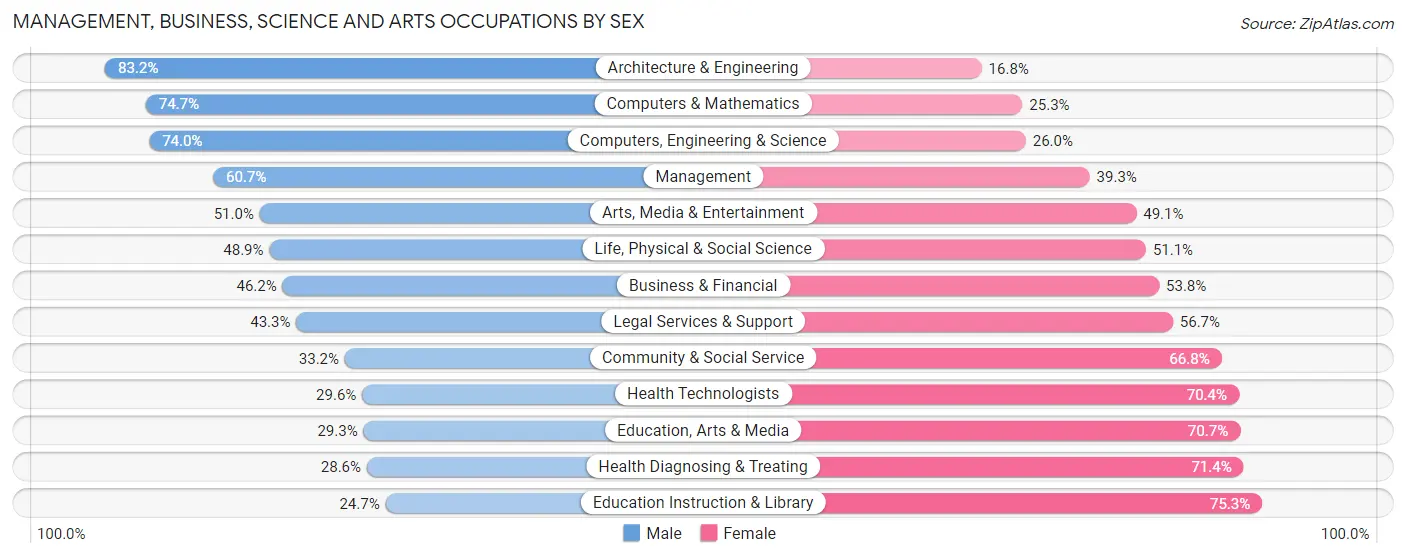
The most common Management, Business, Science and Arts occupations in Hillsborough County are Management (81,583 | 11.2%), Community & Social Service (71,506 | 9.8%), Business & Financial (52,809 | 7.2%), Computers, Engineering & Science (49,735 | 6.8%), and Health Diagnosing & Treating (46,997 | 6.4%).
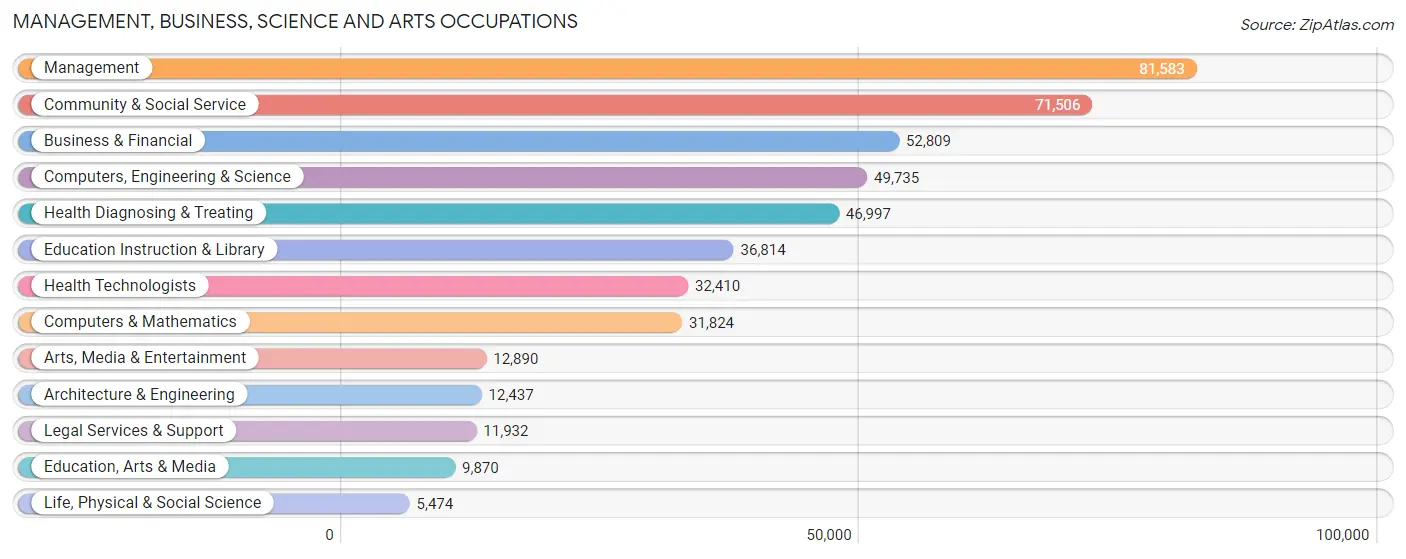
Management, Business, Science and Arts Occupations by Sex
Within the Management, Business, Science and Arts occupations in Hillsborough County, the most male-oriented occupations are Architecture & Engineering (83.2%), Computers & Mathematics (74.7%), and Computers, Engineering & Science (74.0%), while the most female-oriented occupations are Education Instruction & Library (75.3%), Health Diagnosing & Treating (71.4%), and Education, Arts & Media (70.7%).
| Occupation | Male | Female |
| Management | 49,506 (60.7%) | 32,077 (39.3%) |
| Business & Financial | 24,391 (46.2%) | 28,418 (53.8%) |
| Computers, Engineering & Science | 36,805 (74.0%) | 12,930 (26.0%) |
| Computers & Mathematics | 23,777 (74.7%) | 8,047 (25.3%) |
| Architecture & Engineering | 10,349 (83.2%) | 2,088 (16.8%) |
| Life, Physical & Social Science | 2,679 (48.9%) | 2,795 (51.1%) |
| Community & Social Service | 23,731 (33.2%) | 47,775 (66.8%) |
| Education, Arts & Media | 2,893 (29.3%) | 6,977 (70.7%) |
| Legal Services & Support | 5,170 (43.3%) | 6,762 (56.7%) |
| Education Instruction & Library | 9,100 (24.7%) | 27,714 (75.3%) |
| Arts, Media & Entertainment | 6,568 (50.9%) | 6,322 (49.0%) |
| Health Diagnosing & Treating | 13,439 (28.6%) | 33,558 (71.4%) |
| Health Technologists | 9,588 (29.6%) | 22,822 (70.4%) |
| Total (Category) | 147,872 (48.9%) | 154,758 (51.1%) |
| Total (Overall) | 384,128 (52.6%) | 346,274 (47.4%) |
Services Occupations
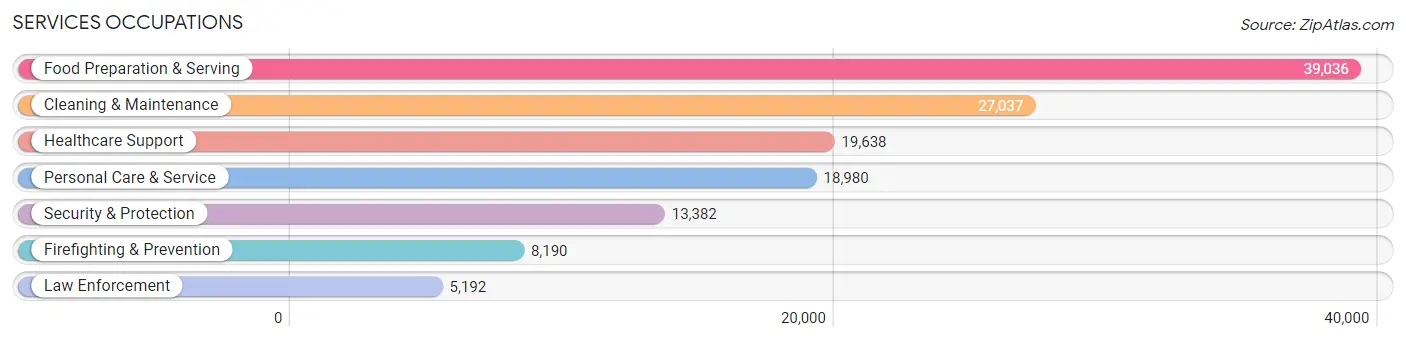
The most common Services occupations in Hillsborough County are Food Preparation & Serving (39,036 | 5.3%), Cleaning & Maintenance (27,037 | 3.7%), Healthcare Support (19,638 | 2.7%), Personal Care & Service (18,980 | 2.6%), and Security & Protection (13,382 | 1.8%).
Services Occupations by Sex
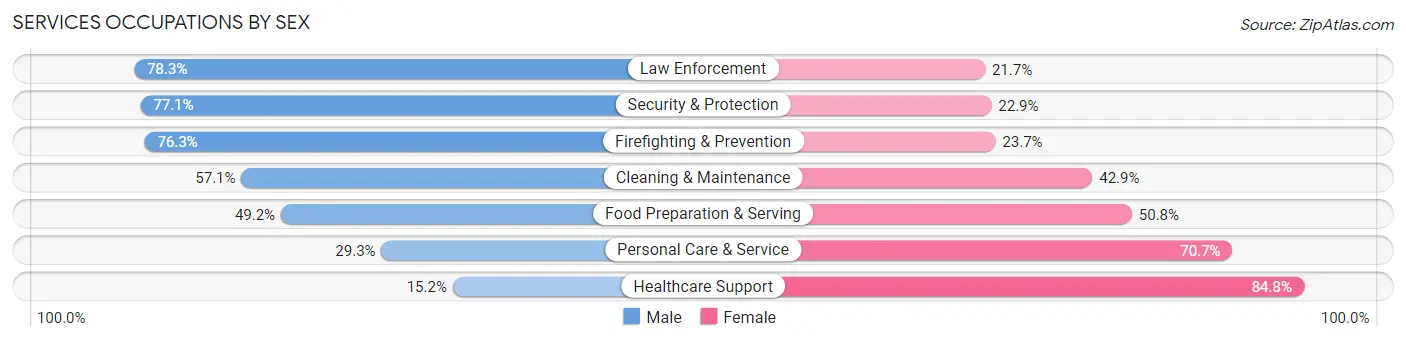
Within the Services occupations in Hillsborough County, the most male-oriented occupations are Law Enforcement (78.3%), Security & Protection (77.1%), and Firefighting & Prevention (76.3%), while the most female-oriented occupations are Healthcare Support (84.8%), Personal Care & Service (70.7%), and Food Preparation & Serving (50.8%).
| Occupation | Male | Female |
| Healthcare Support | 2,988 (15.2%) | 16,650 (84.8%) |
| Security & Protection | 10,313 (77.1%) | 3,069 (22.9%) |
| Firefighting & Prevention | 6,246 (76.3%) | 1,944 (23.7%) |
| Law Enforcement | 4,067 (78.3%) | 1,125 (21.7%) |
| Food Preparation & Serving | 19,223 (49.2%) | 19,813 (50.8%) |
| Cleaning & Maintenance | 15,433 (57.1%) | 11,604 (42.9%) |
| Personal Care & Service | 5,569 (29.3%) | 13,411 (70.7%) |
| Total (Category) | 53,526 (45.3%) | 64,547 (54.7%) |
| Total (Overall) | 384,128 (52.6%) | 346,274 (47.4%) |
Sales and Office Occupations
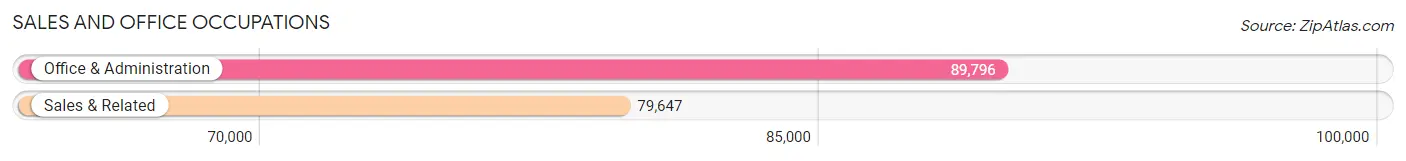
The most common Sales and Office occupations in Hillsborough County are Office & Administration (89,796 | 12.3%), and Sales & Related (79,647 | 10.9%).
Sales and Office Occupations by Sex
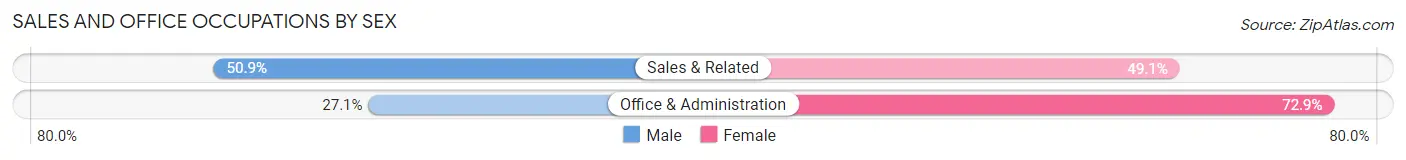
| Occupation | Male | Female |
| Sales & Related | 40,552 (50.9%) | 39,095 (49.1%) |
| Office & Administration | 24,342 (27.1%) | 65,454 (72.9%) |
| Total (Category) | 64,894 (38.3%) | 104,549 (61.7%) |
| Total (Overall) | 384,128 (52.6%) | 346,274 (47.4%) |
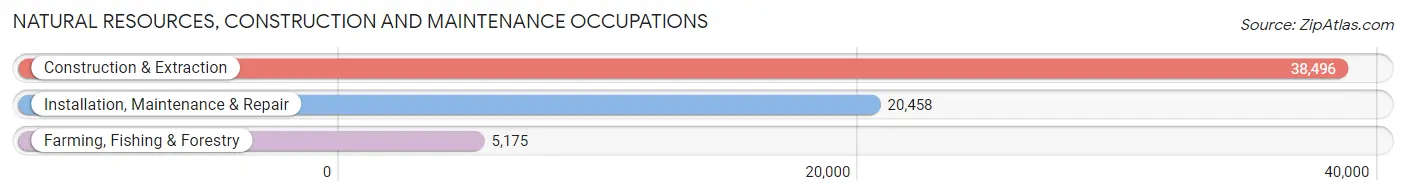
Natural Resources, Construction and Maintenance Occupations
The most common Natural Resources, Construction and Maintenance occupations in Hillsborough County are Construction & Extraction (38,496 | 5.3%), Installation, Maintenance & Repair (20,458 | 2.8%), and Farming, Fishing & Forestry (5,175 | 0.7%).
Natural Resources, Construction and Maintenance Occupations by Sex
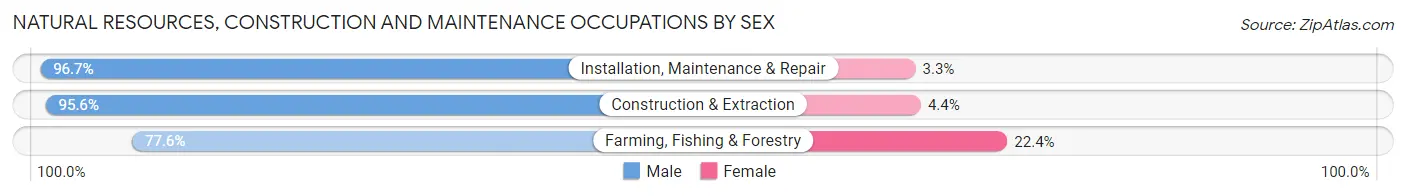
| Occupation | Male | Female |
| Farming, Fishing & Forestry | 4,018 (77.6%) | 1,157 (22.4%) |
| Construction & Extraction | 36,811 (95.6%) | 1,685 (4.4%) |
| Installation, Maintenance & Repair | 19,791 (96.7%) | 667 (3.3%) |
| Total (Category) | 60,620 (94.5%) | 3,509 (5.5%) |
| Total (Overall) | 384,128 (52.6%) | 346,274 (47.4%) |
Production, Transportation and Moving Occupations
The most common Production, Transportation and Moving occupations in Hillsborough County are Transportation (28,840 | 4.0%), Material Moving (23,785 | 3.3%), and Production (23,502 | 3.2%).
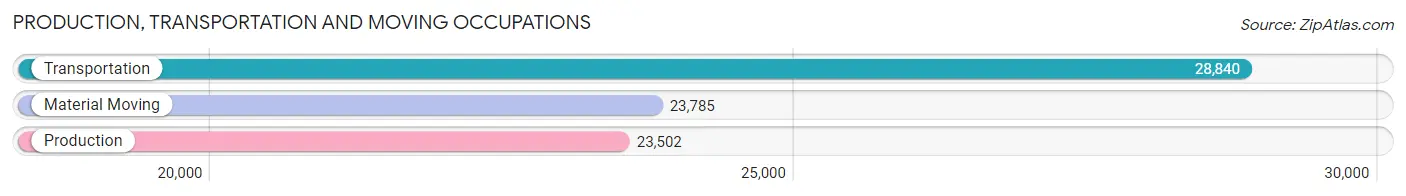
Production, Transportation and Moving Occupations by Sex
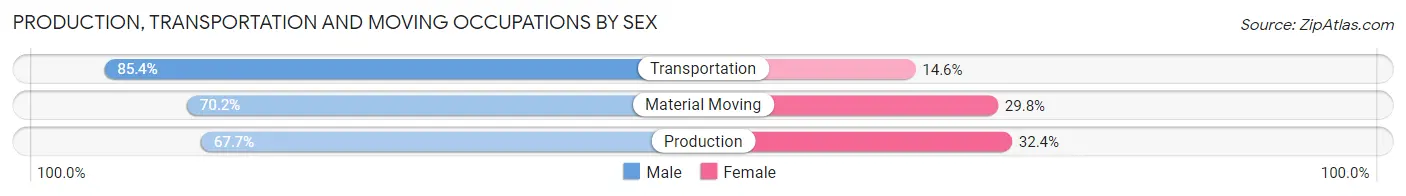
| Occupation | Male | Female |
| Production | 15,898 (67.6%) | 7,604 (32.4%) |
| Transportation | 24,618 (85.4%) | 4,222 (14.6%) |
| Material Moving | 16,700 (70.2%) | 7,085 (29.8%) |
| Total (Category) | 57,216 (75.2%) | 18,911 (24.8%) |
| Total (Overall) | 384,128 (52.6%) | 346,274 (47.4%) |
Employment Industries by Sex in Hillsborough County
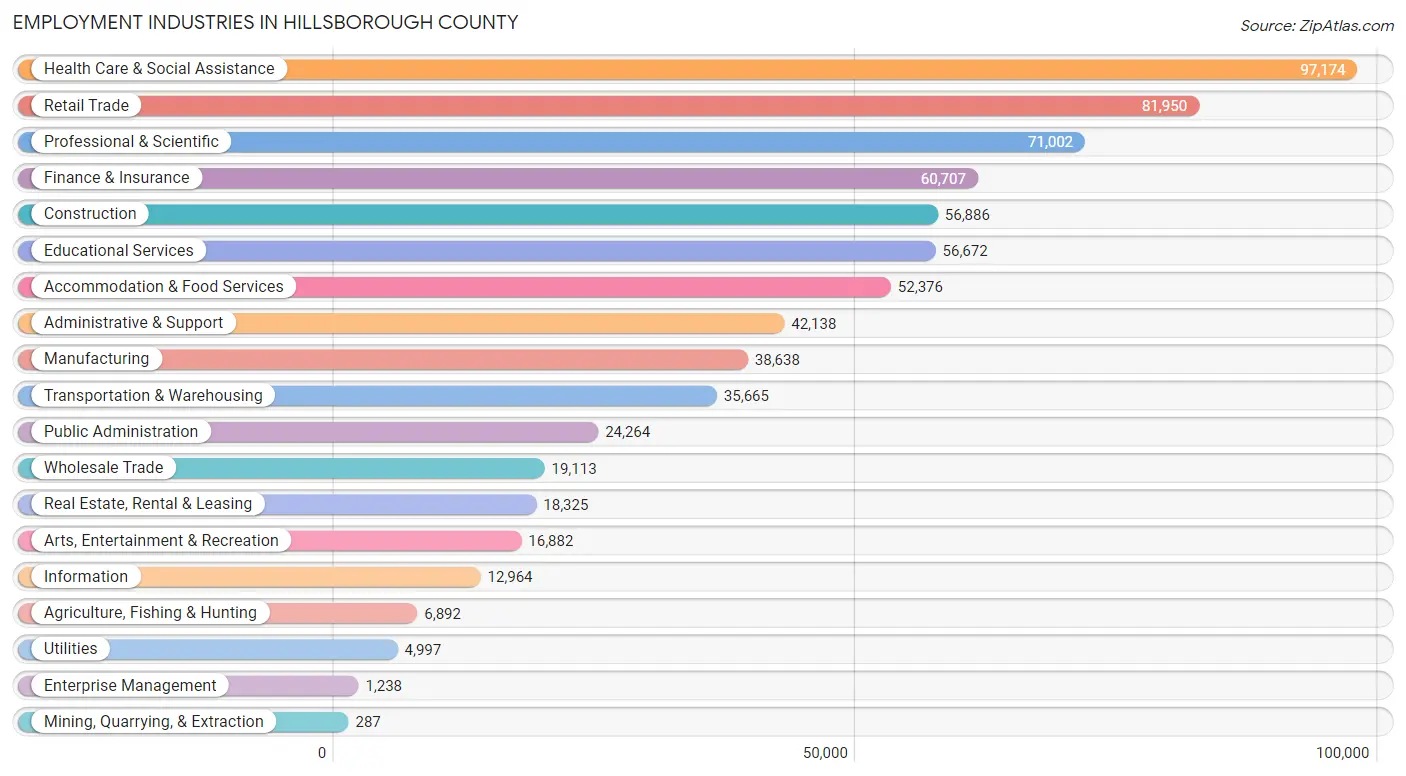
Employment Industries in Hillsborough County
The major employment industries in Hillsborough County include Health Care & Social Assistance (97,174 | 13.3%), Retail Trade (81,950 | 11.2%), Professional & Scientific (71,002 | 9.7%), Finance & Insurance (60,707 | 8.3%), and Construction (56,886 | 7.8%).
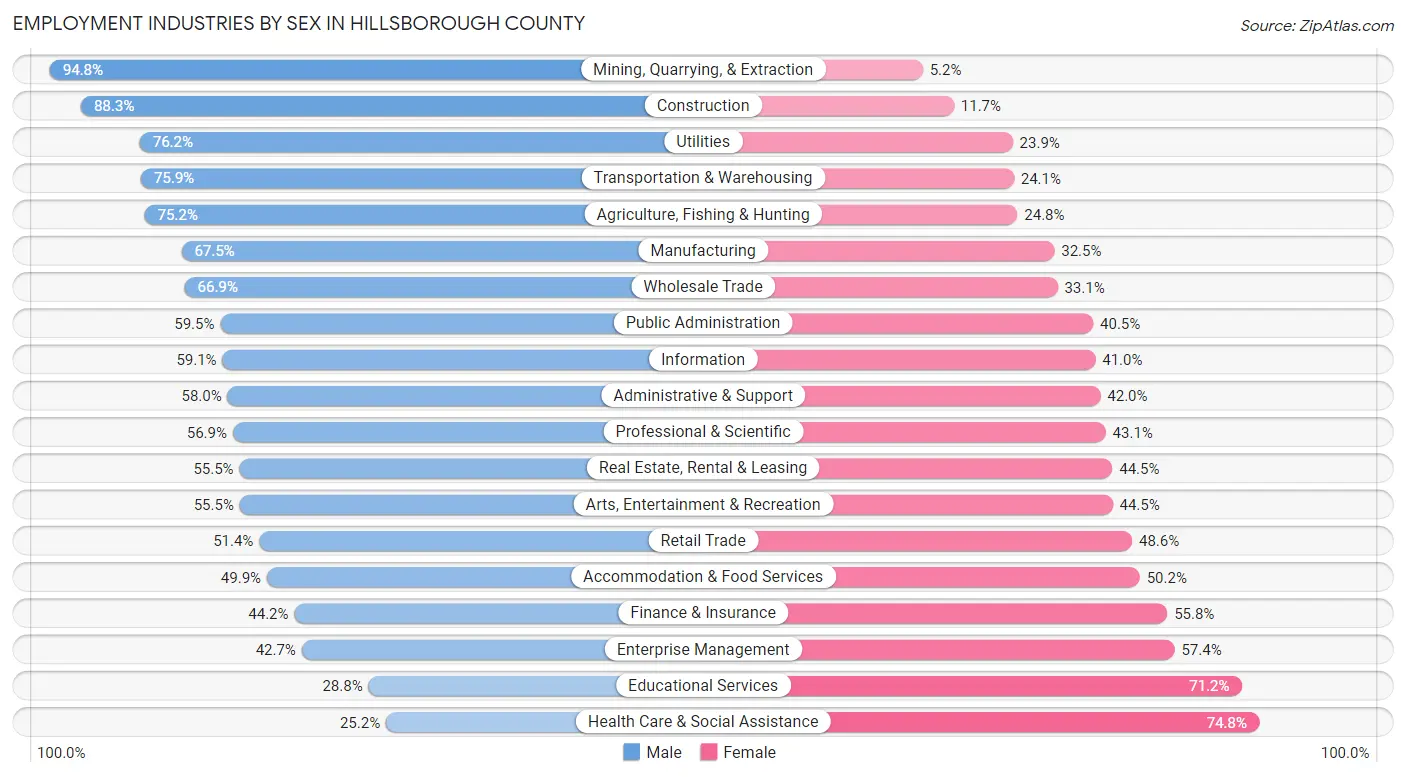
Employment Industries by Sex in Hillsborough County
The Hillsborough County industries that see more men than women are Mining, Quarrying, & Extraction (94.8%), Construction (88.3%), and Utilities (76.1%), whereas the industries that tend to have a higher number of women are Health Care & Social Assistance (74.8%), Educational Services (71.2%), and Enterprise Management (57.4%).
| Industry | Male | Female |
| Agriculture, Fishing & Hunting | 5,181 (75.2%) | 1,711 (24.8%) |
| Mining, Quarrying, & Extraction | 272 (94.8%) | 15 (5.2%) |
| Construction | 50,240 (88.3%) | 6,646 (11.7%) |
| Manufacturing | 26,093 (67.5%) | 12,545 (32.5%) |
| Wholesale Trade | 12,781 (66.9%) | 6,332 (33.1%) |
| Retail Trade | 42,152 (51.4%) | 39,798 (48.6%) |
| Transportation & Warehousing | 27,075 (75.9%) | 8,590 (24.1%) |
| Utilities | 3,805 (76.1%) | 1,192 (23.8%) |
| Information | 7,655 (59.1%) | 5,309 (40.9%) |
| Finance & Insurance | 26,808 (44.2%) | 33,899 (55.8%) |
| Real Estate, Rental & Leasing | 10,176 (55.5%) | 8,149 (44.5%) |
| Professional & Scientific | 40,399 (56.9%) | 30,603 (43.1%) |
| Enterprise Management | 528 (42.6%) | 710 (57.4%) |
| Administrative & Support | 24,434 (58.0%) | 17,704 (42.0%) |
| Educational Services | 16,335 (28.8%) | 40,337 (71.2%) |
| Health Care & Social Assistance | 24,487 (25.2%) | 72,687 (74.8%) |
| Arts, Entertainment & Recreation | 9,365 (55.5%) | 7,517 (44.5%) |
| Accommodation & Food Services | 26,109 (49.8%) | 26,267 (50.1%) |
| Public Administration | 14,436 (59.5%) | 9,828 (40.5%) |
| Total | 384,128 (52.6%) | 346,274 (47.4%) |
Education in Hillsborough County
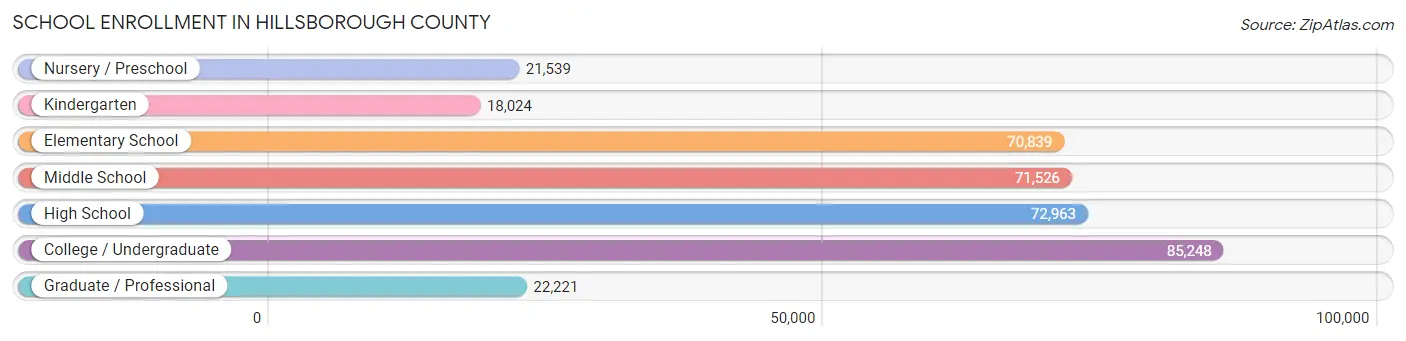
School Enrollment in Hillsborough County
The most common levels of schooling among the 362,360 students in Hillsborough County are college / undergraduate (85,248 | 23.5%), high school (72,963 | 20.1%), and middle school (71,526 | 19.7%).
| School Level | # Students | % Students |
| Nursery / Preschool | 21,539 | 5.9% |
| Kindergarten | 18,024 | 5.0% |
| Elementary School | 70,839 | 19.6% |
| Middle School | 71,526 | 19.7% |
| High School | 72,963 | 20.1% |
| College / Undergraduate | 85,248 | 23.5% |
| Graduate / Professional | 22,221 | 6.1% |
| Total | 362,360 | 100.0% |
School Enrollment by Age by Funding Source in Hillsborough County
Out of a total of 362,360 students who are enrolled in schools in Hillsborough County, 69,573 (19.2%) attend a private institution, while the remaining 292,787 (80.8%) are enrolled in public schools. The age group of 3 to 4 year olds has the highest likelihood of being enrolled in private schools, with 7,394 (41.3% in the age bracket) enrolled. Conversely, the age group of 15 to 17 year olds has the lowest likelihood of being enrolled in a private school, with 46,351 (88.0% in the age bracket) attending a public institution.
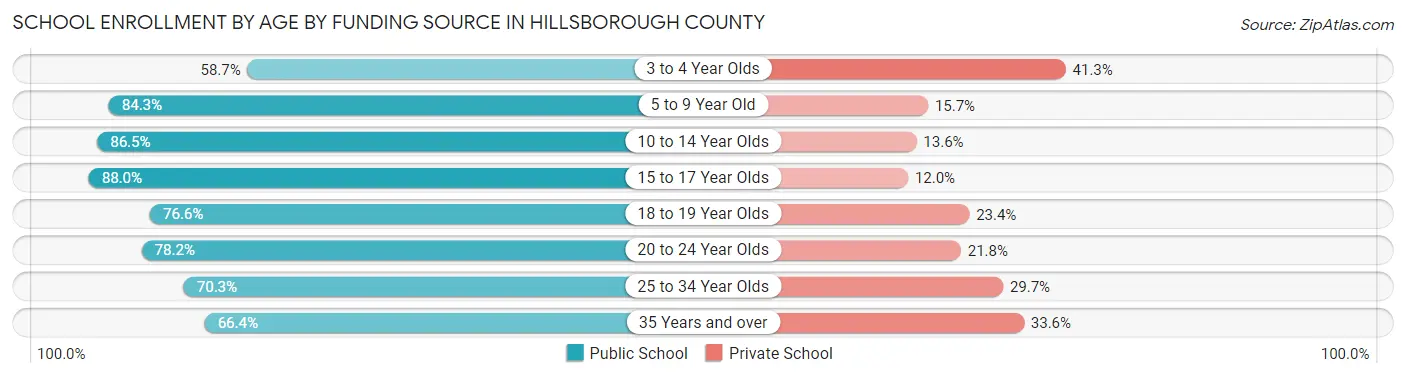
| Age Bracket | Public School | Private School |
| 3 to 4 Year Olds | 10,490 (58.7%) | 7,394 (41.3%) |
| 5 to 9 Year Old | 70,155 (84.3%) | 13,067 (15.7%) |
| 10 to 14 Year Olds | 78,437 (86.5%) | 12,296 (13.6%) |
| 15 to 17 Year Olds | 46,351 (88.0%) | 6,303 (12.0%) |
| 18 to 19 Year Olds | 23,539 (76.6%) | 7,182 (23.4%) |
| 20 to 24 Year Olds | 31,940 (78.2%) | 8,909 (21.8%) |
| 25 to 34 Year Olds | 18,159 (70.3%) | 7,660 (29.7%) |
| 35 Years and over | 13,606 (66.4%) | 6,872 (33.6%) |
| Total | 292,787 (80.8%) | 69,573 (19.2%) |
Educational Attainment by Field of Study in Hillsborough County
Business (92,629 | 23.8%), science & technology (40,398 | 10.4%), education (38,510 | 9.9%), social sciences (33,689 | 8.6%), and engineering (28,064 | 7.2%) are the most common fields of study among 389,875 individuals in Hillsborough County who have obtained a bachelor's degree or higher.
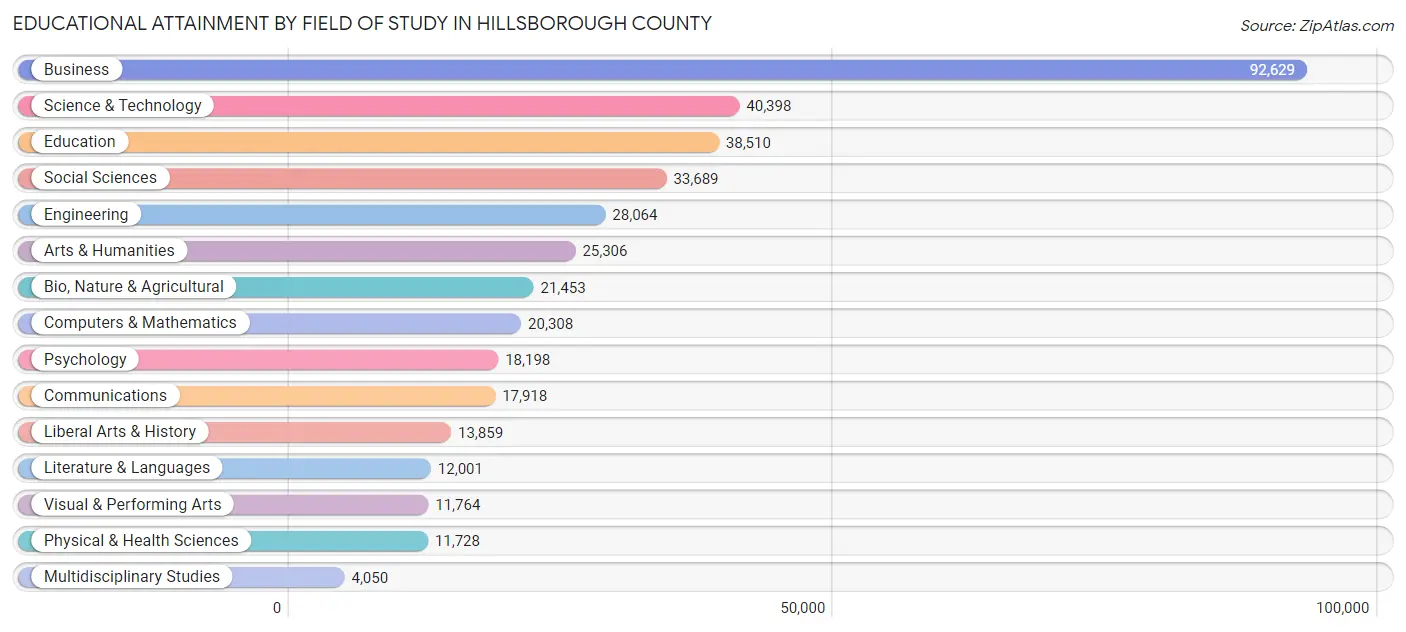
| Field of Study | # Graduates | % Graduates |
| Computers & Mathematics | 20,308 | 5.2% |
| Bio, Nature & Agricultural | 21,453 | 5.5% |
| Physical & Health Sciences | 11,728 | 3.0% |
| Psychology | 18,198 | 4.7% |
| Social Sciences | 33,689 | 8.6% |
| Engineering | 28,064 | 7.2% |
| Multidisciplinary Studies | 4,050 | 1.0% |
| Science & Technology | 40,398 | 10.4% |
| Business | 92,629 | 23.8% |
| Education | 38,510 | 9.9% |
| Literature & Languages | 12,001 | 3.1% |
| Liberal Arts & History | 13,859 | 3.5% |
| Visual & Performing Arts | 11,764 | 3.0% |
| Communications | 17,918 | 4.6% |
| Arts & Humanities | 25,306 | 6.5% |
| Total | 389,875 | 100.0% |
Transportation & Commute in Hillsborough County
Vehicle Availability by Sex in Hillsborough County
The most prevalent vehicle ownership categories in Hillsborough County are males with 2 vehicles (178,269, accounting for 46.9%) and females with 2 vehicles (148,765, making up 52.8%).
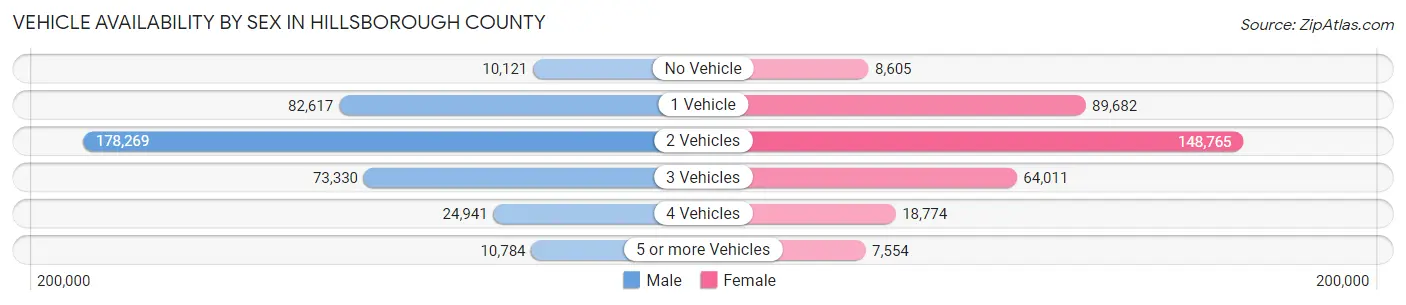
| Vehicles Available | Male | Female |
| No Vehicle | 10,121 (2.7%) | 8,605 (2.5%) |
| 1 Vehicle | 82,617 (21.7%) | 89,682 (26.6%) |
| 2 Vehicles | 178,269 (46.9%) | 148,765 (44.1%) |
| 3 Vehicles | 73,330 (19.3%) | 64,011 (19.0%) |
| 4 Vehicles | 24,941 (6.6%) | 18,774 (5.6%) |
| 5 or more Vehicles | 10,784 (2.8%) | 7,554 (2.2%) |
| Total | 380,062 (100.0%) | 337,391 (100.0%) |
Commute Time in Hillsborough County
The most frequently occuring commute durations in Hillsborough County are 30 to 34 minutes (107,192 commuters, 17.5%), 20 to 24 minutes (89,601 commuters, 14.7%), and 15 to 19 minutes (83,025 commuters, 13.6%).
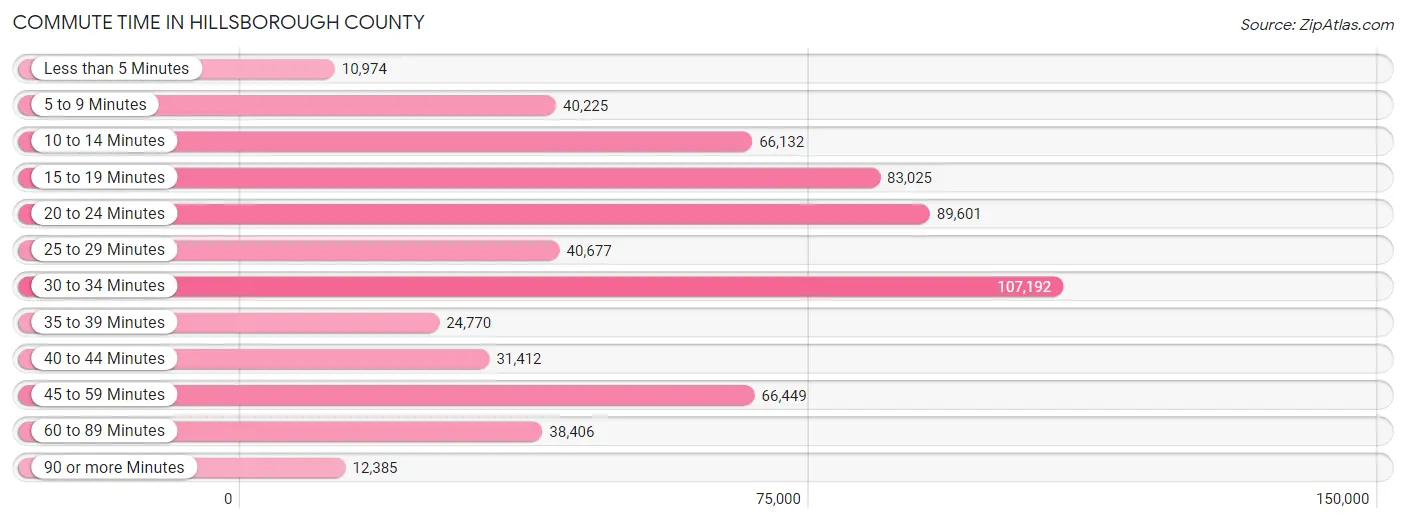
| Commute Time | # Commuters | % Commuters |
| Less than 5 Minutes | 10,974 | 1.8% |
| 5 to 9 Minutes | 40,225 | 6.6% |
| 10 to 14 Minutes | 66,132 | 10.8% |
| 15 to 19 Minutes | 83,025 | 13.6% |
| 20 to 24 Minutes | 89,601 | 14.7% |
| 25 to 29 Minutes | 40,677 | 6.7% |
| 30 to 34 Minutes | 107,192 | 17.5% |
| 35 to 39 Minutes | 24,770 | 4.1% |
| 40 to 44 Minutes | 31,412 | 5.1% |
| 45 to 59 Minutes | 66,449 | 10.9% |
| 60 to 89 Minutes | 38,406 | 6.3% |
| 90 or more Minutes | 12,385 | 2.0% |
Commute Time by Sex in Hillsborough County
The most common commute times in Hillsborough County are 30 to 34 minutes (60,350 commuters, 18.4%) for males and 30 to 34 minutes (46,842 commuters, 16.6%) for females.
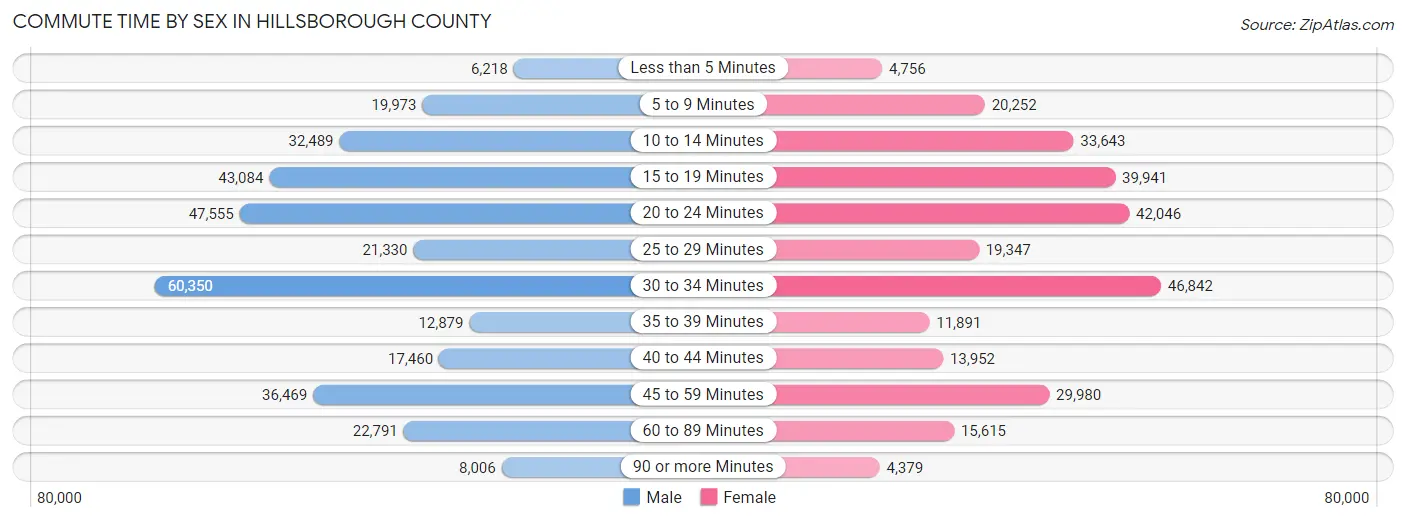
| Commute Time | Male | Female |
| Less than 5 Minutes | 6,218 (1.9%) | 4,756 (1.7%) |
| 5 to 9 Minutes | 19,973 (6.1%) | 20,252 (7.2%) |
| 10 to 14 Minutes | 32,489 (9.9%) | 33,643 (11.9%) |
| 15 to 19 Minutes | 43,084 (13.1%) | 39,941 (14.1%) |
| 20 to 24 Minutes | 47,555 (14.5%) | 42,046 (14.9%) |
| 25 to 29 Minutes | 21,330 (6.5%) | 19,347 (6.9%) |
| 30 to 34 Minutes | 60,350 (18.4%) | 46,842 (16.6%) |
| 35 to 39 Minutes | 12,879 (3.9%) | 11,891 (4.2%) |
| 40 to 44 Minutes | 17,460 (5.3%) | 13,952 (4.9%) |
| 45 to 59 Minutes | 36,469 (11.1%) | 29,980 (10.6%) |
| 60 to 89 Minutes | 22,791 (6.9%) | 15,615 (5.5%) |
| 90 or more Minutes | 8,006 (2.4%) | 4,379 (1.5%) |
Time of Departure to Work by Sex in Hillsborough County
The most frequent times of departure to work in Hillsborough County are 7:00 AM to 7:29 AM (47,935, 14.6%) for males and 7:00 AM to 7:29 AM (46,215, 16.4%) for females.
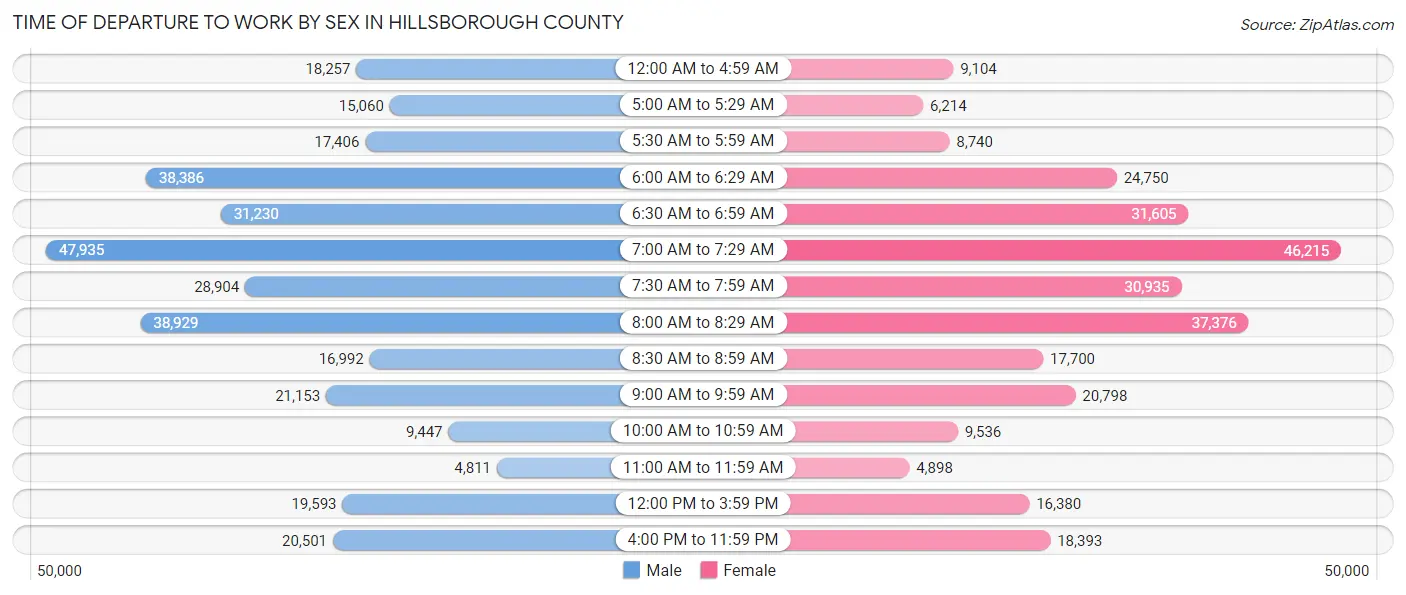
| Time of Departure | Male | Female |
| 12:00 AM to 4:59 AM | 18,257 (5.6%) | 9,104 (3.2%) |
| 5:00 AM to 5:29 AM | 15,060 (4.6%) | 6,214 (2.2%) |
| 5:30 AM to 5:59 AM | 17,406 (5.3%) | 8,740 (3.1%) |
| 6:00 AM to 6:29 AM | 38,386 (11.7%) | 24,750 (8.8%) |
| 6:30 AM to 6:59 AM | 31,230 (9.5%) | 31,605 (11.2%) |
| 7:00 AM to 7:29 AM | 47,935 (14.6%) | 46,215 (16.4%) |
| 7:30 AM to 7:59 AM | 28,904 (8.8%) | 30,935 (10.9%) |
| 8:00 AM to 8:29 AM | 38,929 (11.8%) | 37,376 (13.2%) |
| 8:30 AM to 8:59 AM | 16,992 (5.2%) | 17,700 (6.3%) |
| 9:00 AM to 9:59 AM | 21,153 (6.4%) | 20,798 (7.4%) |
| 10:00 AM to 10:59 AM | 9,447 (2.9%) | 9,536 (3.4%) |
| 11:00 AM to 11:59 AM | 4,811 (1.5%) | 4,898 (1.7%) |
| 12:00 PM to 3:59 PM | 19,593 (6.0%) | 16,380 (5.8%) |
| 4:00 PM to 11:59 PM | 20,501 (6.2%) | 18,393 (6.5%) |
| Total | 328,604 (100.0%) | 282,644 (100.0%) |
Housing Occupancy in Hillsborough County
Occupancy by Ownership in Hillsborough County
Of the total 559,970 dwellings in Hillsborough County, owner-occupied units account for 338,533 (60.5%), while renter-occupied units make up 221,437 (39.5%).
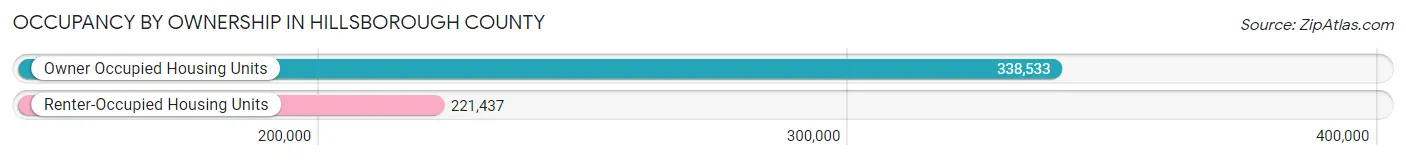
| Occupancy | # Housing Units | % Housing Units |
| Owner Occupied Housing Units | 338,533 | 60.5% |
| Renter-Occupied Housing Units | 221,437 | 39.5% |
| Total Occupied Housing Units | 559,970 | 100.0% |
Occupancy by Household Size in Hillsborough County
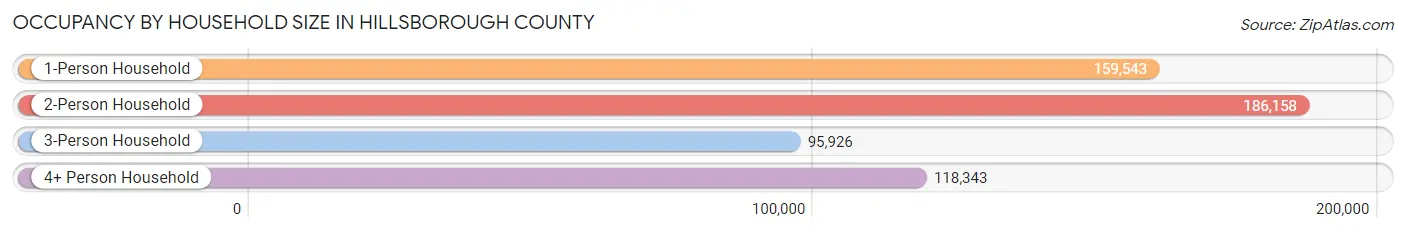
| Household Size | # Housing Units | % Housing Units |
| 1-Person Household | 159,543 | 28.5% |
| 2-Person Household | 186,158 | 33.2% |
| 3-Person Household | 95,926 | 17.1% |
| 4+ Person Household | 118,343 | 21.1% |
| Total Housing Units | 559,970 | 100.0% |
Occupancy by Ownership by Household Size in Hillsborough County
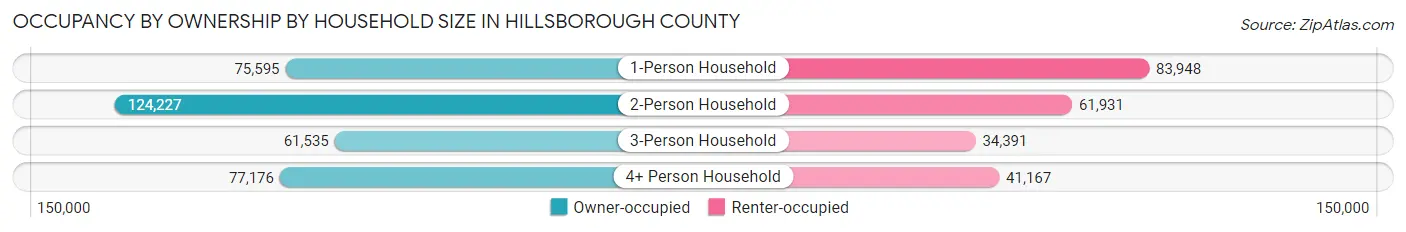
| Household Size | Owner-occupied | Renter-occupied |
| 1-Person Household | 75,595 (47.4%) | 83,948 (52.6%) |
| 2-Person Household | 124,227 (66.7%) | 61,931 (33.3%) |
| 3-Person Household | 61,535 (64.1%) | 34,391 (35.8%) |
| 4+ Person Household | 77,176 (65.2%) | 41,167 (34.8%) |
| Total Housing Units | 338,533 (60.5%) | 221,437 (39.5%) |
Occupancy by Educational Attainment in Hillsborough County
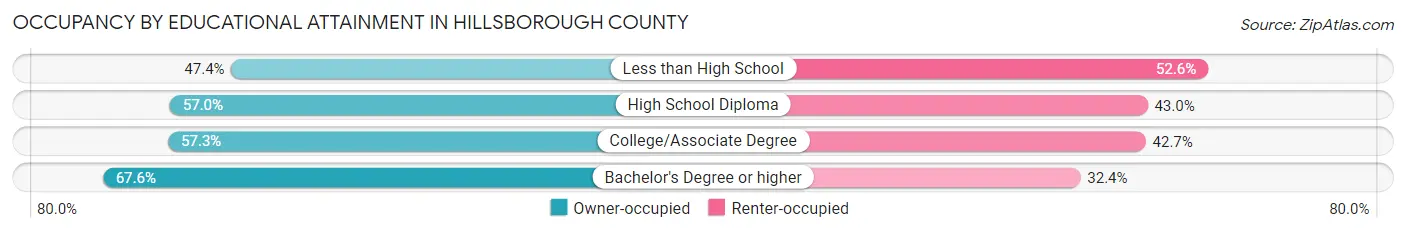
| Household Size | Owner-occupied | Renter-occupied |
| Less than High School | 22,611 (47.4%) | 25,128 (52.6%) |
| High School Diploma | 71,778 (57.0%) | 54,204 (43.0%) |
| College/Associate Degree | 94,118 (57.3%) | 70,248 (42.7%) |
| Bachelor's Degree or higher | 150,026 (67.6%) | 71,857 (32.4%) |
Occupancy by Age of Householder in Hillsborough County
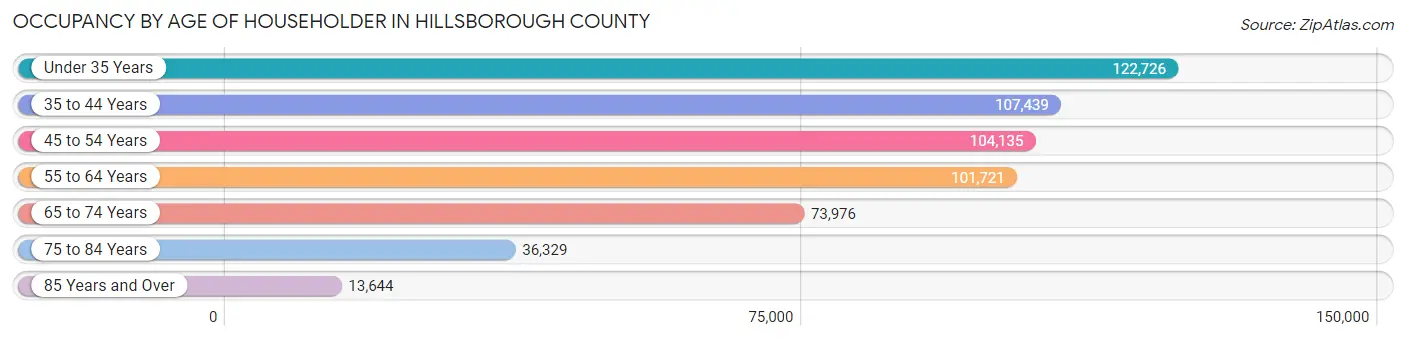
| Age Bracket | # Households | % Households |
| Under 35 Years | 122,726 | 21.9% |
| 35 to 44 Years | 107,439 | 19.2% |
| 45 to 54 Years | 104,135 | 18.6% |
| 55 to 64 Years | 101,721 | 18.2% |
| 65 to 74 Years | 73,976 | 13.2% |
| 75 to 84 Years | 36,329 | 6.5% |
| 85 Years and Over | 13,644 | 2.4% |
| Total | 559,970 | 100.0% |
Housing Finances in Hillsborough County
Median Income by Occupancy in Hillsborough County
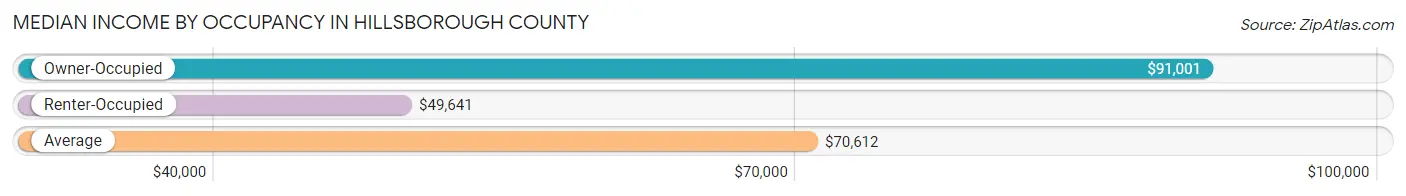
| Occupancy Type | # Households | Median Income |
| Owner-Occupied | 338,533 (60.5%) | $91,001 |
| Renter-Occupied | 221,437 (39.5%) | $49,641 |
| Average | 559,970 (100.0%) | $70,612 |
Occupancy by Householder Income Bracket in Hillsborough County
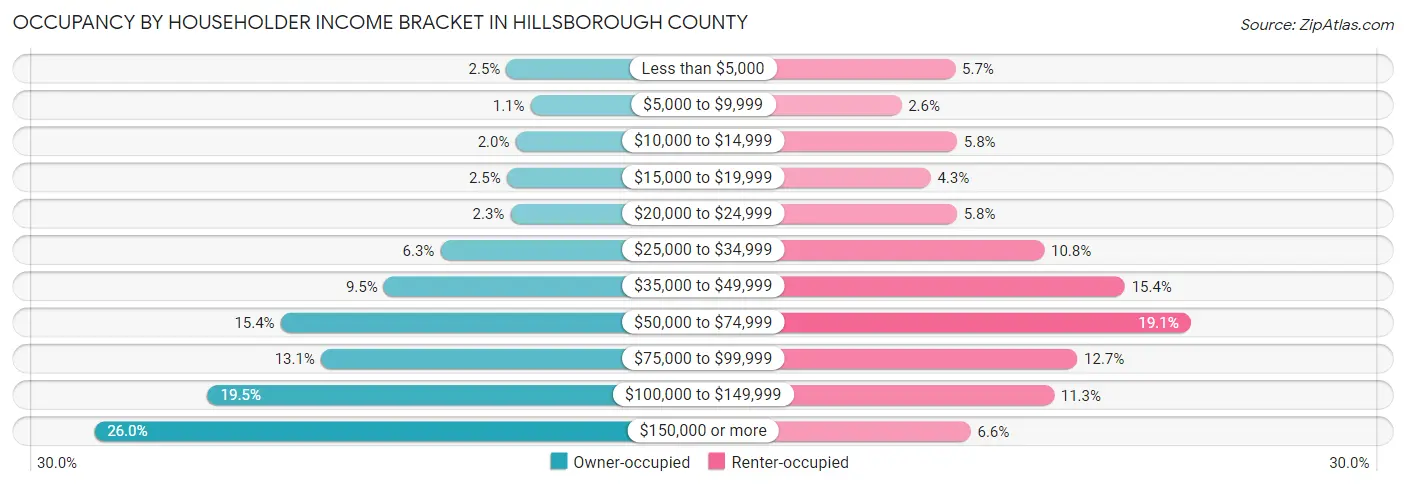
| Income Bracket | Owner-occupied | Renter-occupied |
| Less than $5,000 | 8,408 (2.5%) | 12,596 (5.7%) |
| $5,000 to $9,999 | 3,709 (1.1%) | 5,786 (2.6%) |
| $10,000 to $14,999 | 6,634 (2.0%) | 12,816 (5.8%) |
| $15,000 to $19,999 | 8,318 (2.5%) | 9,475 (4.3%) |
| $20,000 to $24,999 | 7,612 (2.2%) | 12,807 (5.8%) |
| $25,000 to $34,999 | 21,153 (6.2%) | 23,855 (10.8%) |
| $35,000 to $49,999 | 32,134 (9.5%) | 34,062 (15.4%) |
| $50,000 to $74,999 | 52,069 (15.4%) | 42,374 (19.1%) |
| $75,000 to $99,999 | 44,273 (13.1%) | 28,028 (12.7%) |
| $100,000 to $149,999 | 66,136 (19.5%) | 25,085 (11.3%) |
| $150,000 or more | 88,087 (26.0%) | 14,553 (6.6%) |
| Total | 338,533 (100.0%) | 221,437 (100.0%) |
Monthly Housing Cost Tiers in Hillsborough County
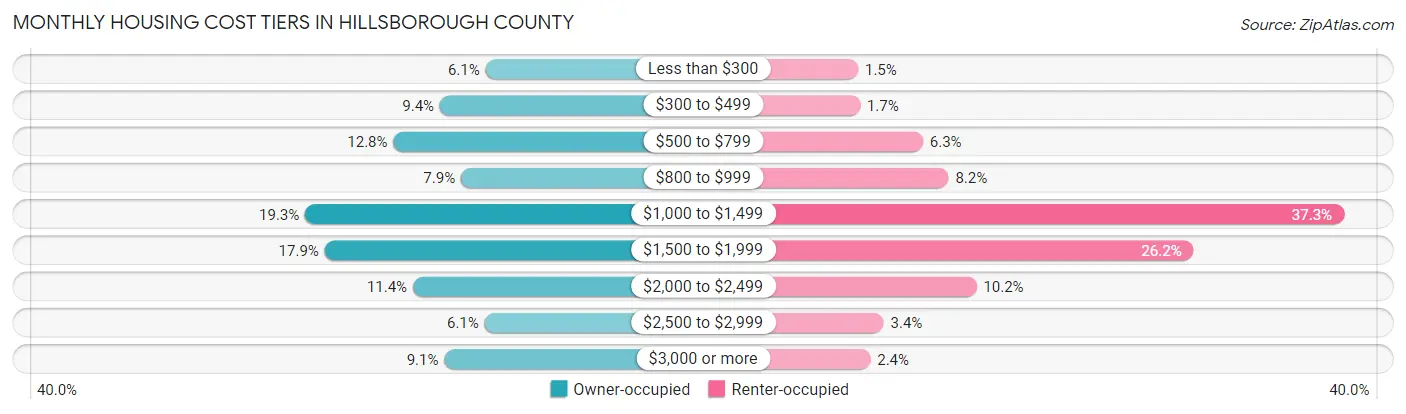
| Monthly Cost | Owner-occupied | Renter-occupied |
| Less than $300 | 20,483 (6.0%) | 3,358 (1.5%) |
| $300 to $499 | 31,842 (9.4%) | 3,682 (1.7%) |
| $500 to $799 | 43,467 (12.8%) | 13,926 (6.3%) |
| $800 to $999 | 26,605 (7.9%) | 18,109 (8.2%) |
| $1,000 to $1,499 | 65,458 (19.3%) | 82,604 (37.3%) |
| $1,500 to $1,999 | 60,612 (17.9%) | 58,057 (26.2%) |
| $2,000 to $2,499 | 38,576 (11.4%) | 22,668 (10.2%) |
| $2,500 to $2,999 | 20,721 (6.1%) | 7,529 (3.4%) |
| $3,000 or more | 30,769 (9.1%) | 5,351 (2.4%) |
| Total | 338,533 (100.0%) | 221,437 (100.0%) |
Physical Housing Characteristics in Hillsborough County
Housing Structures in Hillsborough County
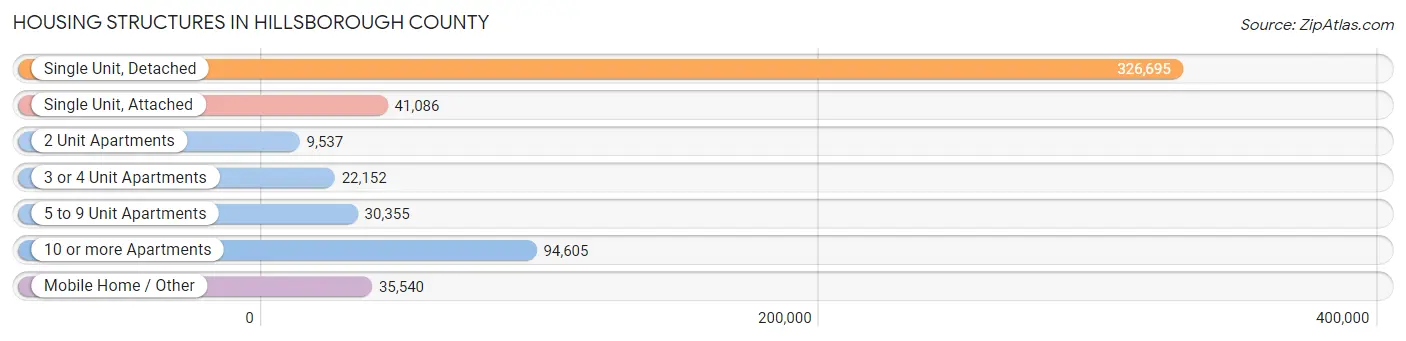
| Structure Type | # Housing Units | % Housing Units |
| Single Unit, Detached | 326,695 | 58.3% |
| Single Unit, Attached | 41,086 | 7.3% |
| 2 Unit Apartments | 9,537 | 1.7% |
| 3 or 4 Unit Apartments | 22,152 | 4.0% |
| 5 to 9 Unit Apartments | 30,355 | 5.4% |
| 10 or more Apartments | 94,605 | 16.9% |
| Mobile Home / Other | 35,540 | 6.4% |
| Total | 559,970 | 100.0% |
Housing Structures by Occupancy in Hillsborough County
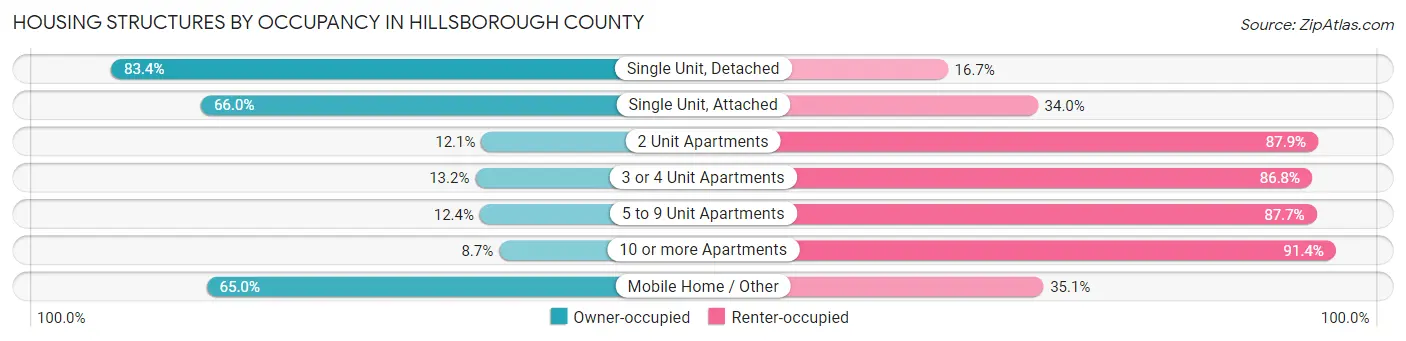
| Structure Type | Owner-occupied | Renter-occupied |
| Single Unit, Detached | 272,307 (83.4%) | 54,388 (16.7%) |
| Single Unit, Attached | 27,130 (66.0%) | 13,956 (34.0%) |
| 2 Unit Apartments | 1,151 (12.1%) | 8,386 (87.9%) |
| 3 or 4 Unit Apartments | 2,931 (13.2%) | 19,221 (86.8%) |
| 5 to 9 Unit Apartments | 3,750 (12.3%) | 26,605 (87.6%) |
| 10 or more Apartments | 8,182 (8.6%) | 86,423 (91.3%) |
| Mobile Home / Other | 23,082 (64.9%) | 12,458 (35.0%) |
| Total | 338,533 (60.5%) | 221,437 (39.5%) |
Housing Structures by Number of Rooms in Hillsborough County
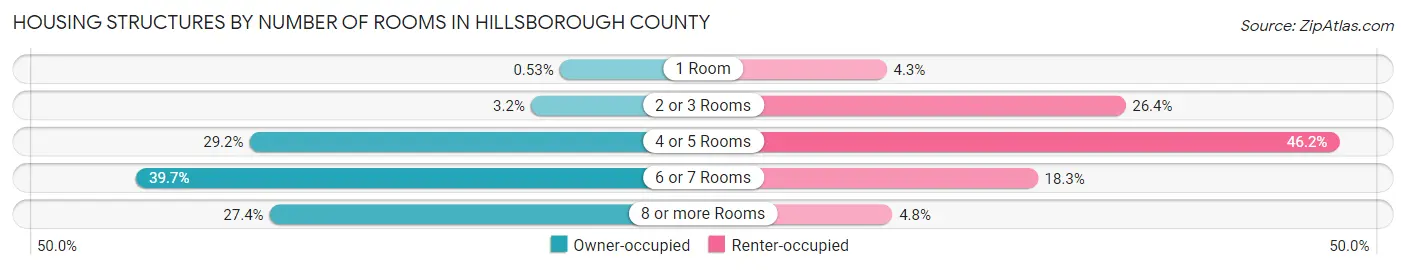
| Number of Rooms | Owner-occupied | Renter-occupied |
| 1 Room | 1,800 (0.5%) | 9,551 (4.3%) |
| 2 or 3 Rooms | 10,809 (3.2%) | 58,448 (26.4%) |
| 4 or 5 Rooms | 98,931 (29.2%) | 102,243 (46.2%) |
| 6 or 7 Rooms | 134,380 (39.7%) | 40,479 (18.3%) |
| 8 or more Rooms | 92,613 (27.4%) | 10,716 (4.8%) |
| Total | 338,533 (100.0%) | 221,437 (100.0%) |
Housing Structure by Heating Type in Hillsborough County
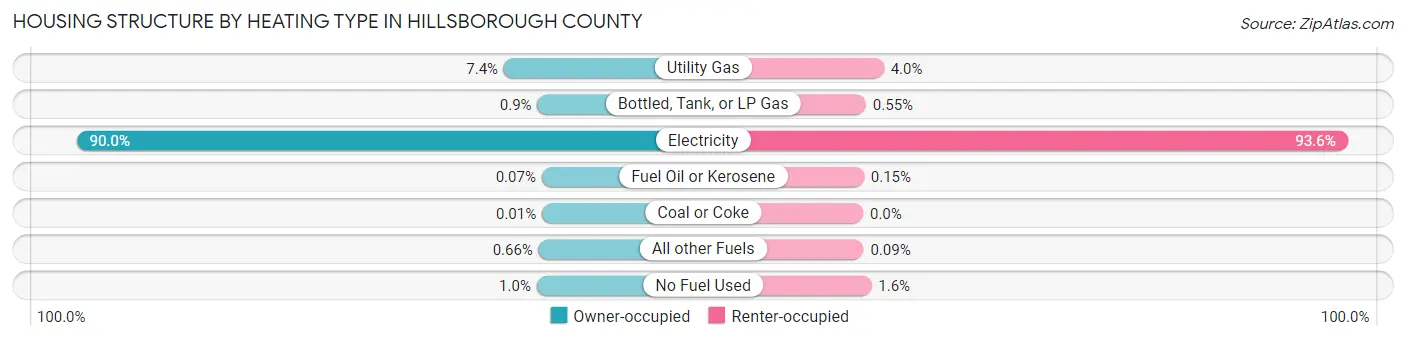
| Heating Type | Owner-occupied | Renter-occupied |
| Utility Gas | 24,967 (7.4%) | 8,839 (4.0%) |
| Bottled, Tank, or LP Gas | 3,061 (0.9%) | 1,215 (0.5%) |
| Electricity | 304,527 (89.9%) | 207,311 (93.6%) |
| Fuel Oil or Kerosene | 224 (0.1%) | 329 (0.2%) |
| Coal or Coke | 22 (0.0%) | 9 (0.0%) |
| All other Fuels | 2,224 (0.7%) | 201 (0.1%) |
| No Fuel Used | 3,508 (1.0%) | 3,533 (1.6%) |
| Total | 338,533 (100.0%) | 221,437 (100.0%) |
Household Vehicle Usage in Hillsborough County
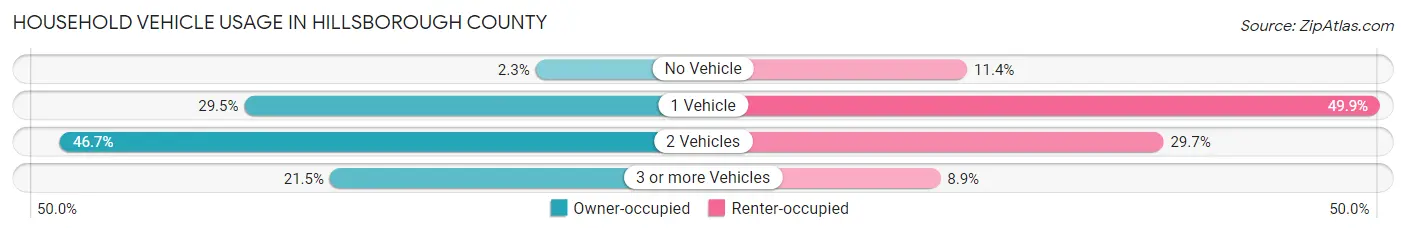
| Vehicles per Household | Owner-occupied | Renter-occupied |
| No Vehicle | 7,820 (2.3%) | 25,265 (11.4%) |
| 1 Vehicle | 99,848 (29.5%) | 110,596 (49.9%) |
| 2 Vehicles | 158,039 (46.7%) | 65,853 (29.7%) |
| 3 or more Vehicles | 72,826 (21.5%) | 19,723 (8.9%) |
| Total | 338,533 (100.0%) | 221,437 (100.0%) |
Real Estate & Mortgages in Hillsborough County
Real Estate and Mortgage Overview in Hillsborough County
| Characteristic | Without Mortgage | With Mortgage |
| Housing Units | 118,991 | 219,542 |
| Median Property Value | $258,500 | $313,200 |
| Median Household Income | $64,724 | $67,357 |
| Monthly Housing Costs | $560 | $29,453 |
| Real Estate Taxes | $1,995 | $6,276 |
Property Value by Mortgage Status in Hillsborough County
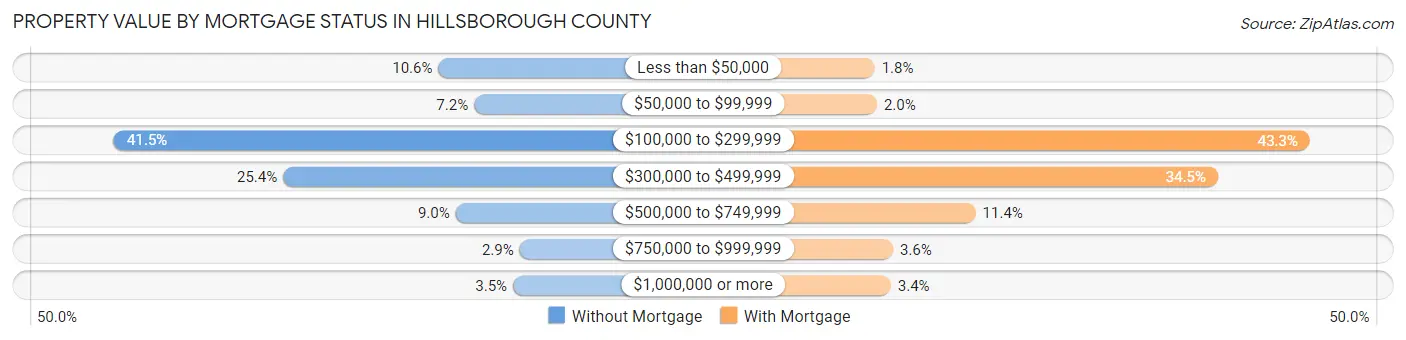
| Property Value | Without Mortgage | With Mortgage |
| Less than $50,000 | 12,614 (10.6%) | 4,023 (1.8%) |
| $50,000 to $99,999 | 8,573 (7.2%) | 4,479 (2.0%) |
| $100,000 to $299,999 | 49,374 (41.5%) | 94,970 (43.3%) |
| $300,000 to $499,999 | 30,216 (25.4%) | 75,742 (34.5%) |
| $500,000 to $749,999 | 10,661 (9.0%) | 25,112 (11.4%) |
| $750,000 to $999,999 | 3,402 (2.9%) | 7,832 (3.6%) |
| $1,000,000 or more | 4,151 (3.5%) | 7,384 (3.4%) |
| Total | 118,991 (100.0%) | 219,542 (100.0%) |
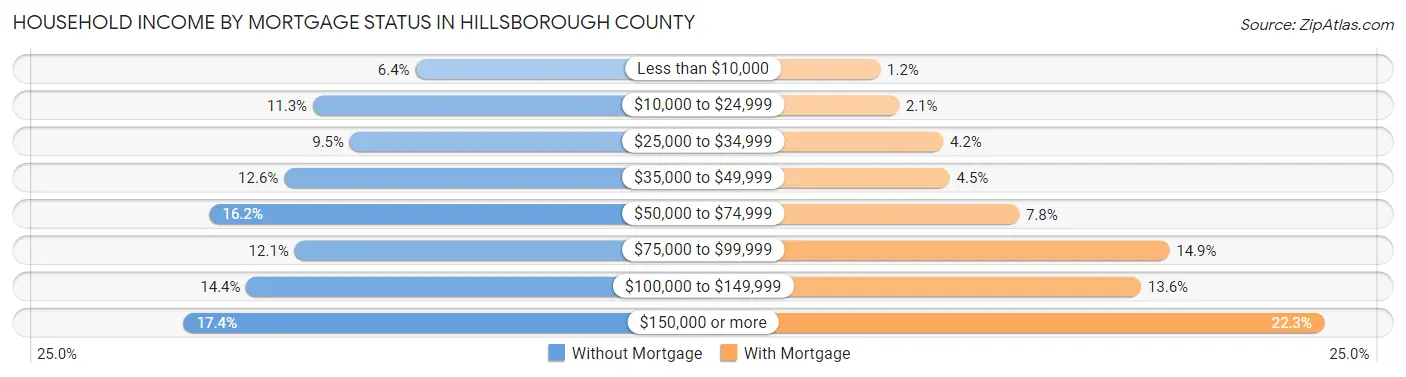
Household Income by Mortgage Status in Hillsborough County
| Household Income | Without Mortgage | With Mortgage |
| Less than $10,000 | 7,602 (6.4%) | 2,561 (1.2%) |
| $10,000 to $24,999 | 13,407 (11.3%) | 4,515 (2.1%) |
| $25,000 to $34,999 | 11,314 (9.5%) | 9,157 (4.2%) |
| $35,000 to $49,999 | 15,045 (12.6%) | 9,839 (4.5%) |
| $50,000 to $74,999 | 19,268 (16.2%) | 17,089 (7.8%) |
| $75,000 to $99,999 | 14,444 (12.1%) | 32,801 (14.9%) |
| $100,000 to $149,999 | 17,181 (14.4%) | 29,829 (13.6%) |
| $150,000 or more | 20,730 (17.4%) | 48,955 (22.3%) |
| Total | 118,991 (100.0%) | 219,542 (100.0%) |
Property Value to Household Income Ratio in Hillsborough County
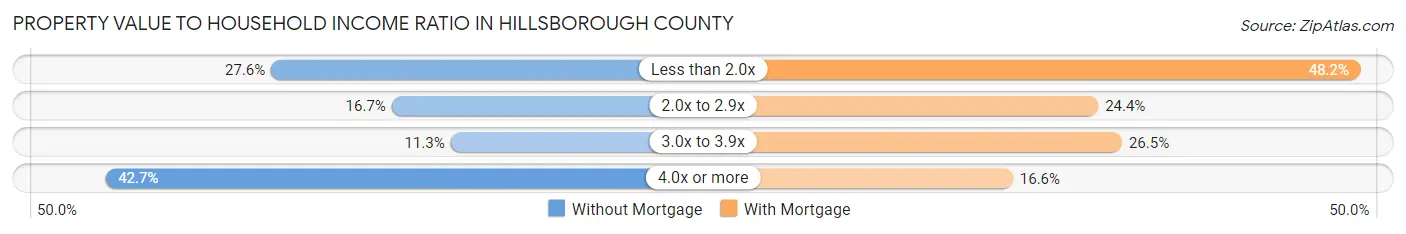
| Value-to-Income Ratio | Without Mortgage | With Mortgage |
| Less than 2.0x | 32,870 (27.6%) | 105,814 (48.2%) |
| 2.0x to 2.9x | 19,836 (16.7%) | 53,483 (24.4%) |
| 3.0x to 3.9x | 13,475 (11.3%) | 58,222 (26.5%) |
| 4.0x or more | 50,785 (42.7%) | 36,464 (16.6%) |
| Total | 118,991 (100.0%) | 219,542 (100.0%) |
Real Estate Taxes by Mortgage Status in Hillsborough County
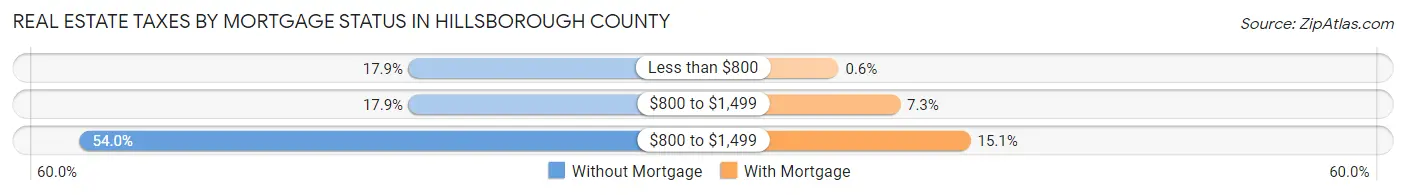
| Property Taxes | Without Mortgage | With Mortgage |
| Less than $800 | 21,296 (17.9%) | 1,322 (0.6%) |
| $800 to $1,499 | 21,272 (17.9%) | 16,123 (7.3%) |
| $800 to $1,499 | 64,205 (54.0%) | 33,090 (15.1%) |
| Total | 118,991 (100.0%) | 219,542 (100.0%) |
Health & Disability in Hillsborough County
Health Insurance Coverage by Age in Hillsborough County
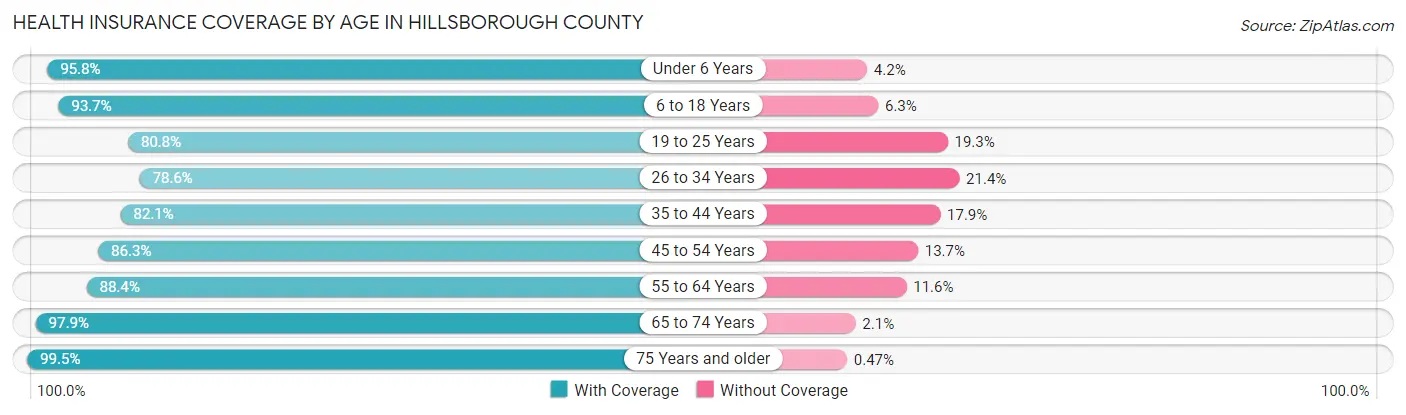
| Age Bracket | With Coverage | Without Coverage |
| Under 6 Years | 97,922 (95.8%) | 4,311 (4.2%) |
| 6 to 18 Years | 223,742 (93.7%) | 15,013 (6.3%) |
| 19 to 25 Years | 110,874 (80.7%) | 26,439 (19.3%) |
| 26 to 34 Years | 153,302 (78.6%) | 41,779 (21.4%) |
| 35 to 44 Years | 165,881 (82.1%) | 36,082 (17.9%) |
| 45 to 54 Years | 165,748 (86.3%) | 26,345 (13.7%) |
| 55 to 64 Years | 156,162 (88.4%) | 20,419 (11.6%) |
| 65 to 74 Years | 124,015 (97.9%) | 2,624 (2.1%) |
| 75 Years and older | 83,436 (99.5%) | 391 (0.5%) |
| Total | 1,281,082 (88.1%) | 173,403 (11.9%) |
Health Insurance Coverage by Citizenship Status in Hillsborough County
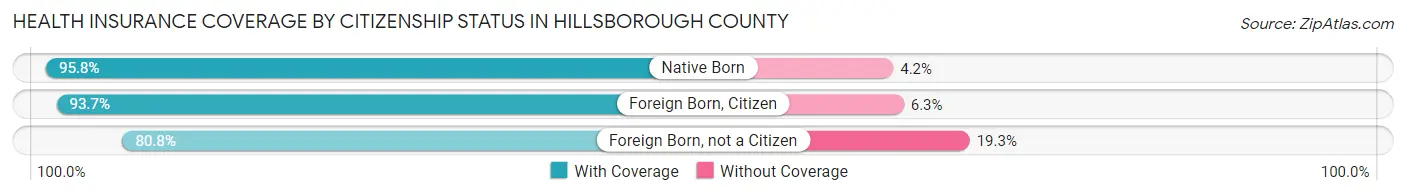
| Citizenship Status | With Coverage | Without Coverage |
| Native Born | 97,922 (95.8%) | 4,311 (4.2%) |
| Foreign Born, Citizen | 223,742 (93.7%) | 15,013 (6.3%) |
| Foreign Born, not a Citizen | 110,874 (80.7%) | 26,439 (19.3%) |
Health Insurance Coverage by Household Income in Hillsborough County
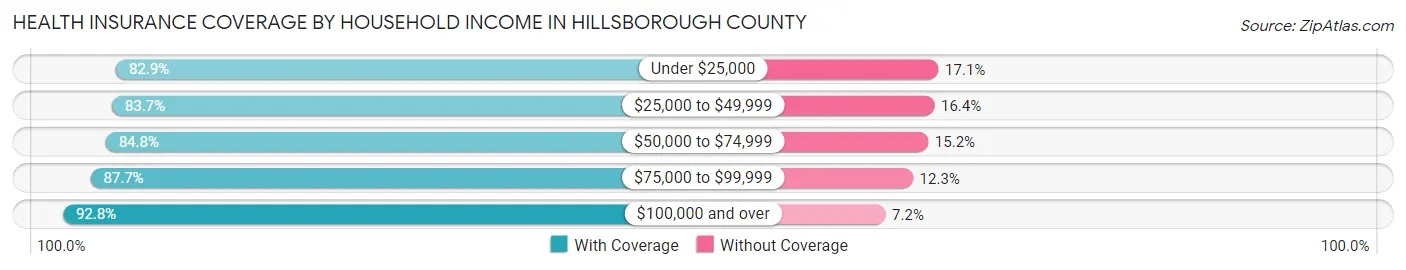
| Household Income | With Coverage | Without Coverage |
| Under $25,000 | 135,093 (82.9%) | 27,901 (17.1%) |
| $25,000 to $49,999 | 203,637 (83.7%) | 39,803 (16.4%) |
| $50,000 to $74,999 | 198,109 (84.8%) | 35,520 (15.2%) |
| $75,000 to $99,999 | 169,814 (87.7%) | 23,903 (12.3%) |
| $100,000 and over | 559,301 (92.8%) | 43,331 (7.2%) |
Public vs Private Health Insurance Coverage by Age in Hillsborough County
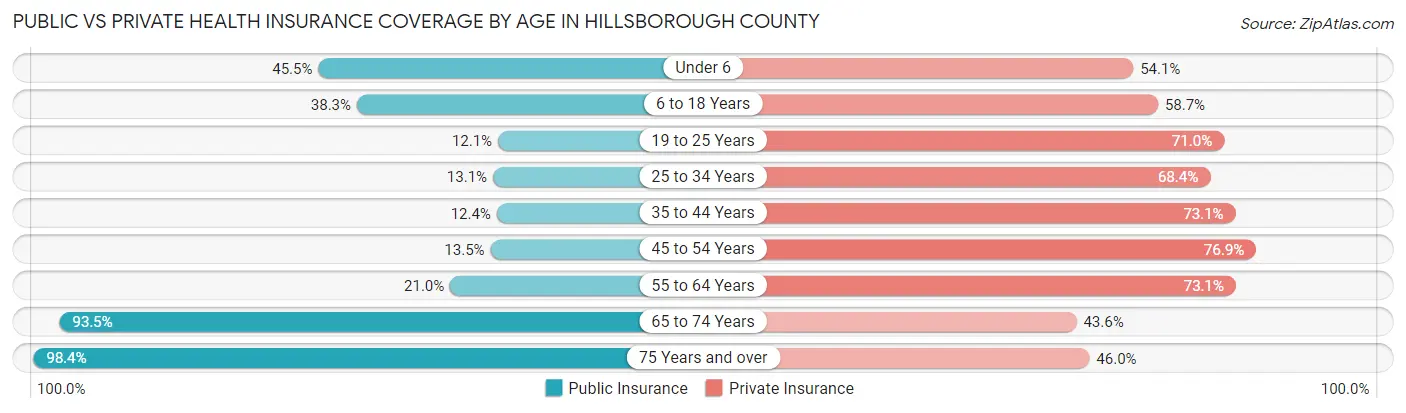
| Age Bracket | Public Insurance | Private Insurance |
| Under 6 | 46,506 (45.5%) | 55,299 (54.1%) |
| 6 to 18 Years | 91,522 (38.3%) | 140,102 (58.7%) |
| 19 to 25 Years | 16,663 (12.1%) | 97,430 (71.0%) |
| 25 to 34 Years | 25,507 (13.1%) | 133,341 (68.3%) |
| 35 to 44 Years | 24,992 (12.4%) | 147,553 (73.1%) |
| 45 to 54 Years | 26,014 (13.5%) | 147,735 (76.9%) |
| 55 to 64 Years | 37,112 (21.0%) | 129,126 (73.1%) |
| 65 to 74 Years | 118,455 (93.5%) | 55,162 (43.6%) |
| 75 Years and over | 82,466 (98.4%) | 38,531 (46.0%) |
| Total | 469,237 (32.3%) | 944,279 (64.9%) |
Disability Status by Sex by Age in Hillsborough County
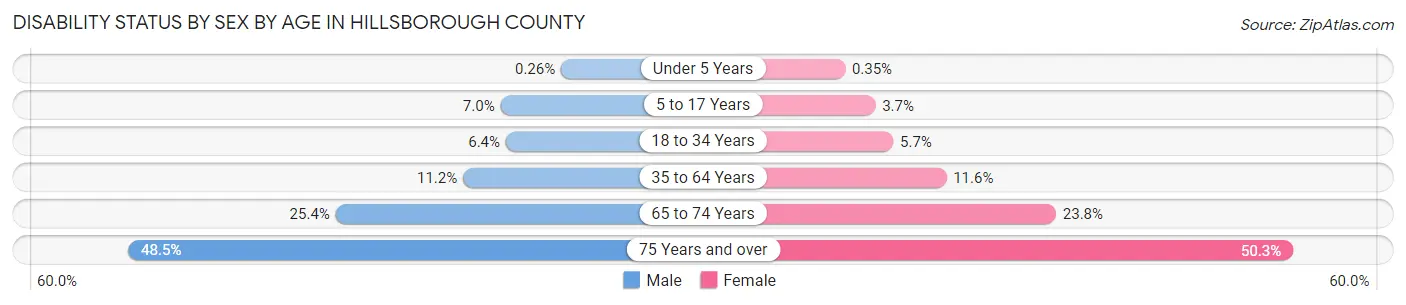
| Age Bracket | Male | Female |
| Under 5 Years | 114 (0.3%) | 145 (0.4%) |
| 5 to 17 Years | 8,464 (7.0%) | 4,251 (3.7%) |
| 18 to 34 Years | 11,208 (6.4%) | 10,170 (5.7%) |
| 35 to 64 Years | 31,482 (11.2%) | 33,575 (11.6%) |
| 65 to 74 Years | 14,864 (25.4%) | 16,222 (23.8%) |
| 75 Years and over | 16,781 (48.5%) | 24,731 (50.2%) |
Disability Class by Sex by Age in Hillsborough County
Disability Class: Hearing Difficulty
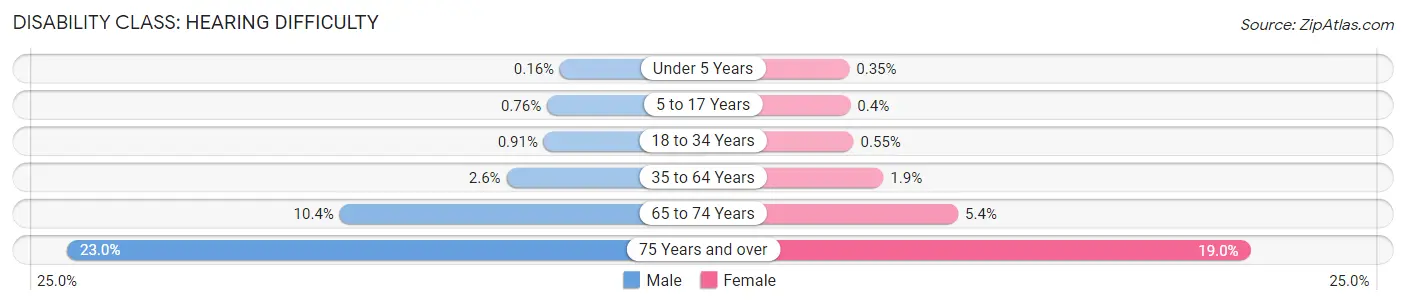
| Age Bracket | Male | Female |
| Under 5 Years | 69 (0.2%) | 145 (0.4%) |
| 5 to 17 Years | 920 (0.8%) | 460 (0.4%) |
| 18 to 34 Years | 1,590 (0.9%) | 972 (0.5%) |
| 35 to 64 Years | 7,438 (2.6%) | 5,583 (1.9%) |
| 65 to 74 Years | 6,082 (10.4%) | 3,673 (5.4%) |
| 75 Years and over | 7,971 (23.0%) | 9,333 (19.0%) |
Disability Class: Vision Difficulty
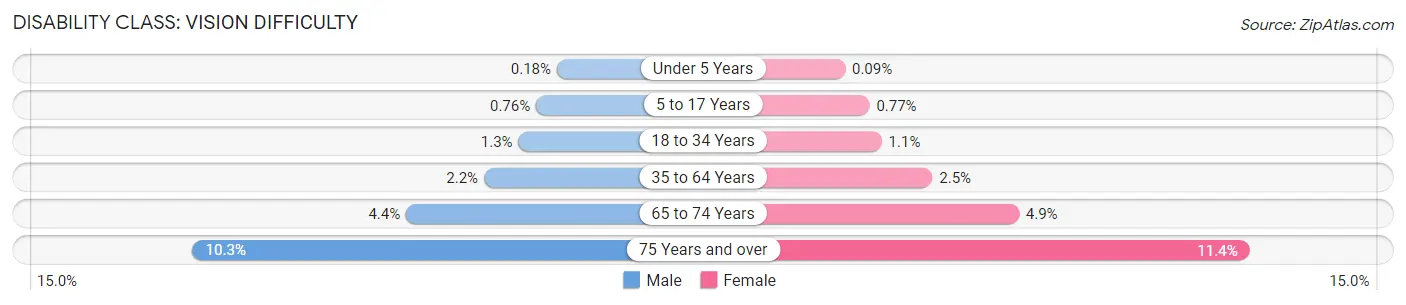
| Age Bracket | Male | Female |
| Under 5 Years | 77 (0.2%) | 37 (0.1%) |
| 5 to 17 Years | 924 (0.8%) | 875 (0.8%) |
| 18 to 34 Years | 2,194 (1.3%) | 1,972 (1.1%) |
| 35 to 64 Years | 6,222 (2.2%) | 7,270 (2.5%) |
| 65 to 74 Years | 2,564 (4.4%) | 3,353 (4.9%) |
| 75 Years and over | 3,571 (10.3%) | 5,586 (11.4%) |
Disability Class: Cognitive Difficulty
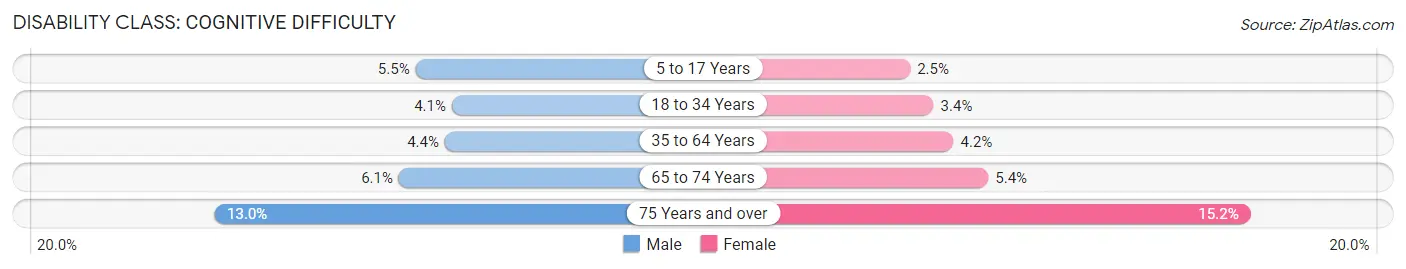
| Age Bracket | Male | Female |
| 5 to 17 Years | 6,644 (5.5%) | 2,898 (2.5%) |
| 18 to 34 Years | 7,255 (4.1%) | 6,069 (3.4%) |
| 35 to 64 Years | 12,410 (4.4%) | 11,980 (4.2%) |
| 65 to 74 Years | 3,582 (6.1%) | 3,703 (5.4%) |
| 75 Years and over | 4,489 (13.0%) | 7,467 (15.2%) |
Disability Class: Ambulatory Difficulty
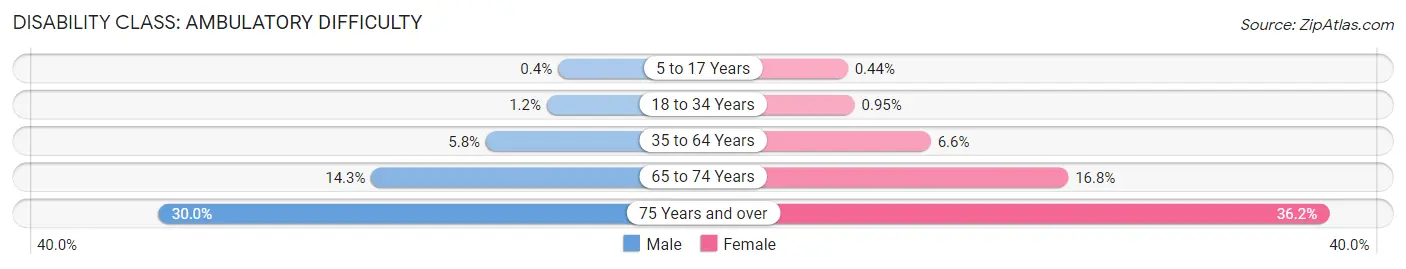
| Age Bracket | Male | Female |
| 5 to 17 Years | 483 (0.4%) | 504 (0.4%) |
| 18 to 34 Years | 2,164 (1.2%) | 1,686 (0.9%) |
| 35 to 64 Years | 16,219 (5.8%) | 19,069 (6.6%) |
| 65 to 74 Years | 8,356 (14.3%) | 11,439 (16.8%) |
| 75 Years and over | 10,395 (30.0%) | 17,802 (36.2%) |
Disability Class: Self-Care Difficulty
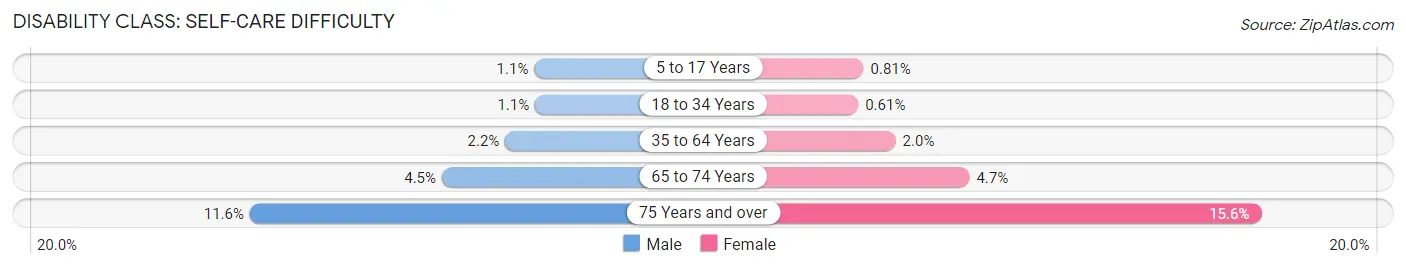
| Age Bracket | Male | Female |
| 5 to 17 Years | 1,303 (1.1%) | 924 (0.8%) |
| 18 to 34 Years | 1,845 (1.1%) | 1,087 (0.6%) |
| 35 to 64 Years | 6,085 (2.2%) | 5,785 (2.0%) |
| 65 to 74 Years | 2,644 (4.5%) | 3,223 (4.7%) |
| 75 Years and over | 4,028 (11.6%) | 7,663 (15.6%) |
Technology Access in Hillsborough County
Computing Device Access in Hillsborough County
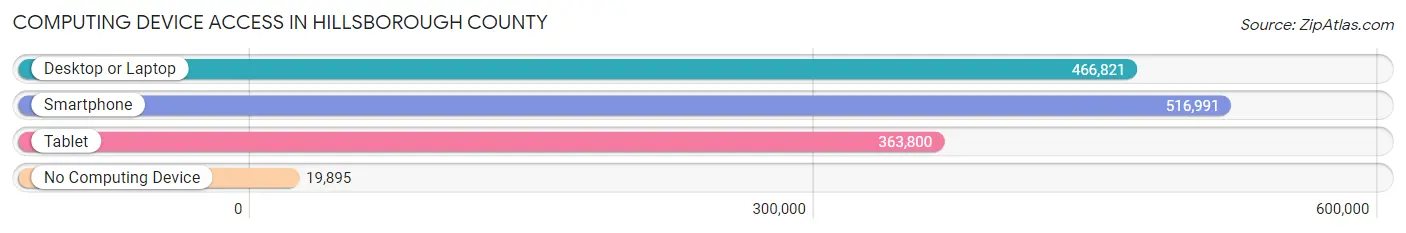
| Device Type | # Households | % Households |
| Desktop or Laptop | 466,821 | 83.4% |
| Smartphone | 516,991 | 92.3% |
| Tablet | 363,800 | 65.0% |
| No Computing Device | 19,895 | 3.5% |
| Total | 559,970 | 100.0% |
Internet Access in Hillsborough County
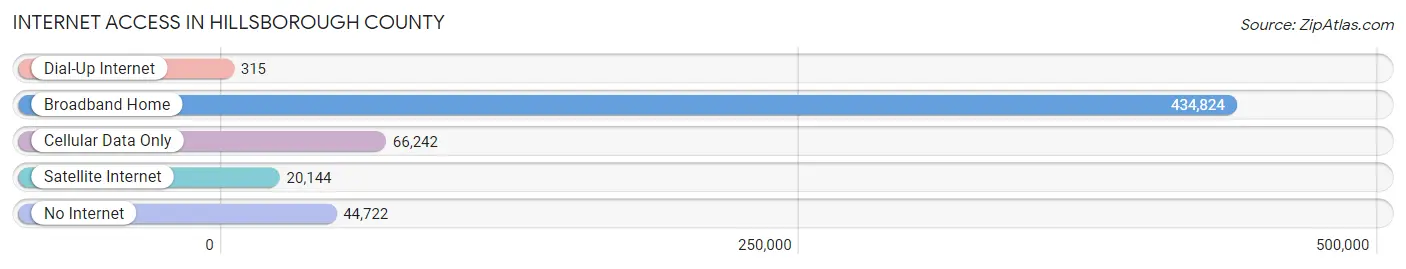
| Internet Type | # Households | % Households |
| Dial-Up Internet | 315 | 0.1% |
| Broadband Home | 434,824 | 77.6% |
| Cellular Data Only | 66,242 | 11.8% |
| Satellite Internet | 20,144 | 3.6% |
| No Internet | 44,722 | 8.0% |
| Total | 559,970 | 100.0% |
Hillsborough County Summary
Hillsborough County, Florida is located in the central part of the state and is the fourth most populous county in the state. It is bordered by Pasco County to the north, Polk County to the east, Manatee County to the south, and Pinellas County to the west. The county seat is Tampa, which is also the largest city in the county.
History
Hillsborough County was created in 1834 from parts of Alachua, Hillsborough, and Monroe counties. It was named for Wills Hill, the Earl of Hillsborough, who served as the British Secretary of State for the Colonies from 1768 to 1772. The county was originally divided into four districts: Hillsborough, Manatee, Pinellas, and Polk.
In the late 19th century, the county experienced a period of rapid growth due to the development of the phosphate industry. This led to the establishment of several towns, including Plant City, which was founded in 1885.
In the early 20th century, the county experienced a period of rapid population growth due to the development of the cigar industry in Tampa. This led to the establishment of several new towns, including Temple Terrace, which was founded in 1921.
In the mid-20th century, the county experienced a period of rapid growth due to the development of the aerospace industry in Tampa. This led to the establishment of several new towns, including Brandon, which was founded in 1957.
Geography
Hillsborough County covers an area of 1,266 square miles and is located in the central part of the state. It is bordered by Pasco County to the north, Polk County to the east, Manatee County to the south, and Pinellas County to the west. The county is divided into three distinct geographic regions: the Coastal Plain, the Central Hillsborough Plain, and the Southern Hillsborough Plain.
The Coastal Plain is located along the Gulf of Mexico and is characterized by flat terrain and sandy soils. The Central Hillsborough Plain is located in the center of the county and is characterized by rolling hills and sandy soils. The Southern Hillsborough Plain is located in the southern part of the county and is characterized by flat terrain and clay soils.
Economy
Hillsborough County has a diverse economy that is driven by several industries, including tourism, manufacturing, healthcare, and finance. The county is home to several major employers, including the University of South Florida, Tampa General Hospital, and Raymond James Financial.
Tourism is a major industry in Hillsborough County, with the county being home to several popular attractions, including Busch Gardens Tampa Bay, the Florida Aquarium, and the Lowry Park Zoo. The county is also home to several major sporting events, including the Outback Bowl and the Gasparilla Pirate Festival.
Manufacturing is another major industry in Hillsborough County, with the county being home to several major manufacturers, including Jabil Circuit, Sypris Solutions, and Tech Data Corporation.
Healthcare is also a major industry in Hillsborough County, with the county being home to several major hospitals, including Tampa General Hospital, St. Joseph's Hospital, and Florida Hospital Tampa.
Demographics
As of the 2010 census, Hillsborough County had a population of 1,229,226. The racial makeup of the county was 68.2% White, 22.3% Black or African American, 0.5% Native American, 3.2% Asian, 0.1% Pacific Islander, 3.3% from other races, and 2.4% from two or more races. Hispanic or Latino of any race were 17.2% of the population.
The median household income in Hillsborough County was $48,845, and the median family income was $58,890. The per capita income was $26,945. About 13.2% of the population was below the poverty line.
Common Questions
What is Per Capita Income in Hillsborough County?
Per Capita income in Hillsborough County is $39,509.
What is the Median Family Income in Hillsborough County?
Median Family Income in Hillsborough County is $86,250.
What is the Median Household income in Hillsborough County?
Median Household Income in Hillsborough County is $70,612.
What is Income or Wage Gap in Hillsborough County?
Income or Wage Gap in Hillsborough County is 21.5%.
Women in Hillsborough County earn 78.5 cents for every dollar earned by a man.
What is Family Income Deficit in Hillsborough County?
Family Income Deficit in Hillsborough County is $11,470.
Families that are below poverty line in Hillsborough County earn $11,470 less on average than the poverty threshold level.
What is Inequality or Gini Index in Hillsborough County?
Inequality or Gini Index in Hillsborough County is 0.48.
What is the Total Population of Hillsborough County?
Total Population of Hillsborough County is 1,468,560.
What is the Total Male Population of Hillsborough County?
Total Male Population of Hillsborough County is 724,235.
What is the Total Female Population of Hillsborough County?
Total Female Population of Hillsborough County is 744,325.
What is the Ratio of Males per 100 Females in Hillsborough County?
There are 97.30 Males per 100 Females in Hillsborough County.
What is the Ratio of Females per 100 Males in Hillsborough County?
There are 102.77 Females per 100 Males in Hillsborough County.
What is the Median Population Age in Hillsborough County?
Median Population Age in Hillsborough County is 37.6 Years.
What is the Average Family Size in Hillsborough County
Average Family Size in Hillsborough County is 3.2 People.
What is the Average Household Size in Hillsborough County
Average Household Size in Hillsborough County is 2.6 People.
How Large is the Labor Force in Hillsborough County?
There are 773,669 People in the Labor Forcein in Hillsborough County.
What is the Percentage of People in the Labor Force in Hillsborough County?
65.3% of People are in the Labor Force in Hillsborough County.
What is the Unemployment Rate in Hillsborough County?
Unemployment Rate in Hillsborough County is 4.8%.