Charlotte County, FL Map & Demographics
Charlotte County Overview
$38,466
PER CAPITA INCOME
$73,880
AVG FAMILY INCOME
$62,164
AVG HOUSEHOLD INCOME
13.6%
WAGE / INCOME GAP [ % ]
86.4¢/ $1
WAGE / INCOME GAP [ $ ]
$10,916
FAMILY INCOME DEFICIT
0.45
INEQUALITY / GINI INDEX
189,900
TOTAL POPULATION
93,505
MALE POPULATION
96,395
FEMALE POPULATION
97.00
MALES / 100 FEMALES
103.09
FEMALES / 100 MALES
59.9
MEDIAN AGE
2.6
AVG FAMILY SIZE
2.2
AVG HOUSEHOLD SIZE
72,233
LABOR FORCE [ PEOPLE ]
42.4%
PERCENT IN LABOR FORCE
5.7%
UNEMPLOYMENT RATE
Charlotte County Area Codes
Income in Charlotte County
Income Overview in Charlotte County
Per Capita Income in Charlotte County is $38,466, while median incomes of families and households are $73,880 and $62,164 respectively.
| Characteristic | Number | Measure |
| Per Capita Income | 189,900 | $38,466 |
| Median Family Income | 55,218 | $73,880 |
| Mean Family Income | 55,218 | $96,588 |
| Median Household Income | 84,671 | $62,164 |
| Mean Household Income | 84,671 | $83,154 |
| Income Deficit | 55,218 | $10,916 |
| Wage / Income Gap (%) | 189,900 | 13.57% |
| Wage / Income Gap ($) | 189,900 | 86.43¢ per $1 |
| Gini / Inequality Index | 189,900 | 0.45 |
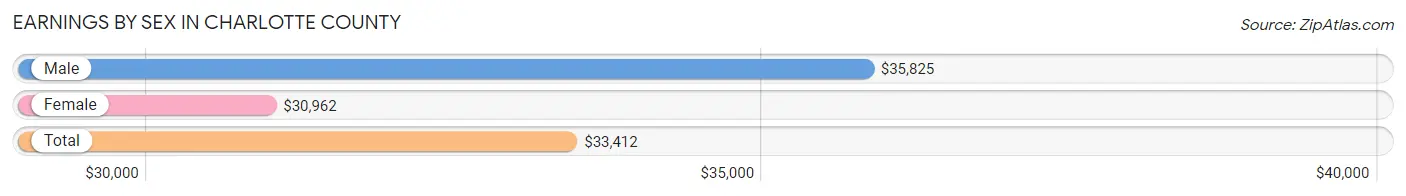
Earnings by Sex in Charlotte County
Average Earnings in Charlotte County are $33,412, $35,825 for men and $30,962 for women, a difference of 13.6%.
| Sex | Number | Average Earnings |
| Male | 39,411 (51.7%) | $35,825 |
| Female | 36,785 (48.3%) | $30,962 |
| Total | 76,196 (100.0%) | $33,412 |
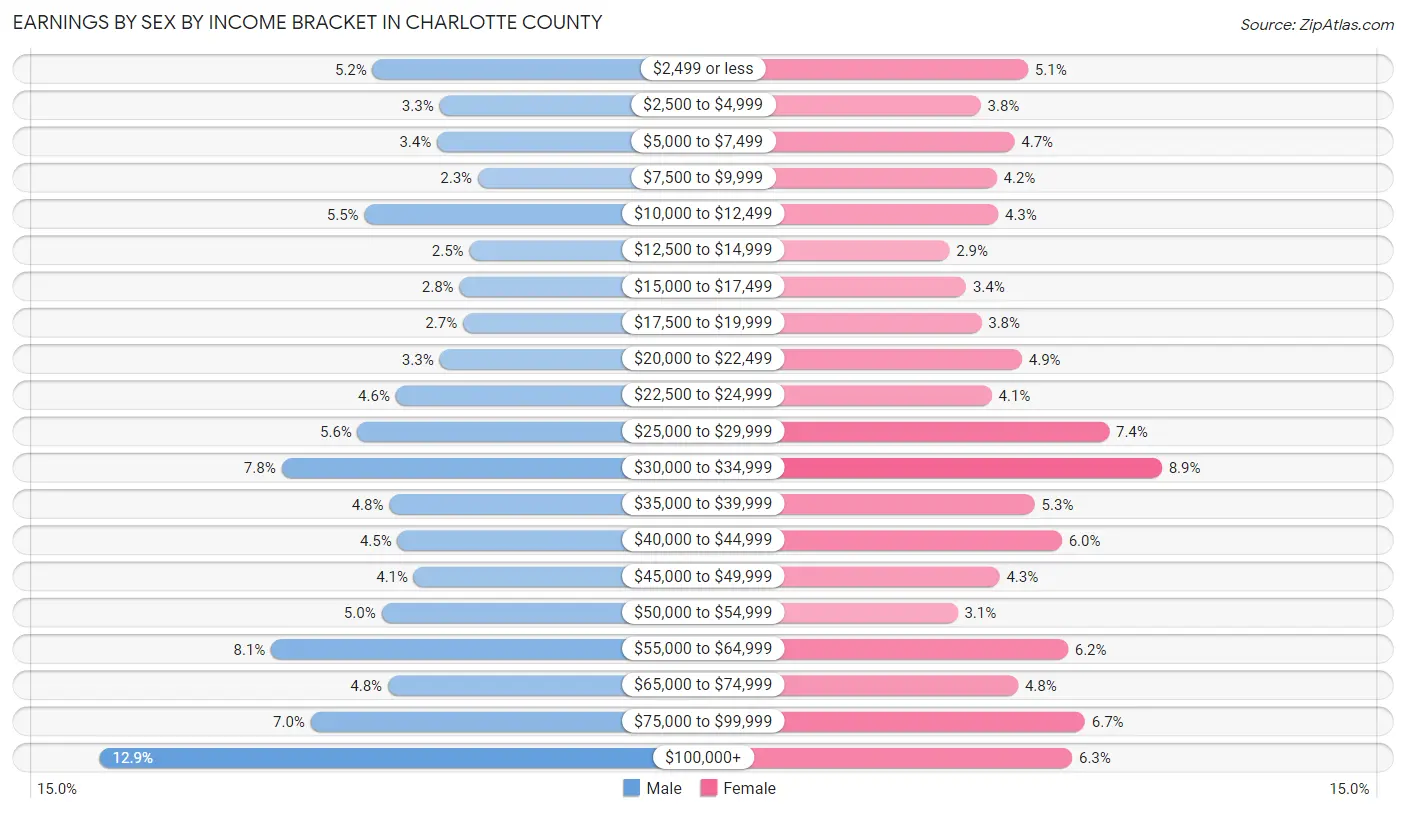
Earnings by Sex by Income Bracket in Charlotte County
The most common earnings brackets in Charlotte County are $100,000+ for men (5,081 | 12.9%) and $30,000 to $34,999 for women (3,255 | 8.8%).
| Income | Male | Female |
| $2,499 or less | 2,056 (5.2%) | 1,874 (5.1%) |
| $2,500 to $4,999 | 1,318 (3.3%) | 1,383 (3.8%) |
| $5,000 to $7,499 | 1,345 (3.4%) | 1,732 (4.7%) |
| $7,500 to $9,999 | 892 (2.3%) | 1,548 (4.2%) |
| $10,000 to $12,499 | 2,149 (5.4%) | 1,563 (4.3%) |
| $12,500 to $14,999 | 984 (2.5%) | 1,060 (2.9%) |
| $15,000 to $17,499 | 1,096 (2.8%) | 1,232 (3.4%) |
| $17,500 to $19,999 | 1,057 (2.7%) | 1,391 (3.8%) |
| $20,000 to $22,499 | 1,318 (3.3%) | 1,811 (4.9%) |
| $22,500 to $24,999 | 1,802 (4.6%) | 1,498 (4.1%) |
| $25,000 to $29,999 | 2,222 (5.6%) | 2,711 (7.4%) |
| $30,000 to $34,999 | 3,067 (7.8%) | 3,255 (8.8%) |
| $35,000 to $39,999 | 1,872 (4.8%) | 1,943 (5.3%) |
| $40,000 to $44,999 | 1,783 (4.5%) | 2,220 (6.0%) |
| $45,000 to $49,999 | 1,599 (4.1%) | 1,577 (4.3%) |
| $50,000 to $54,999 | 1,959 (5.0%) | 1,145 (3.1%) |
| $55,000 to $64,999 | 3,180 (8.1%) | 2,285 (6.2%) |
| $65,000 to $74,999 | 1,888 (4.8%) | 1,770 (4.8%) |
| $75,000 to $99,999 | 2,743 (7.0%) | 2,460 (6.7%) |
| $100,000+ | 5,081 (12.9%) | 2,327 (6.3%) |
| Total | 39,411 (100.0%) | 36,785 (100.0%) |
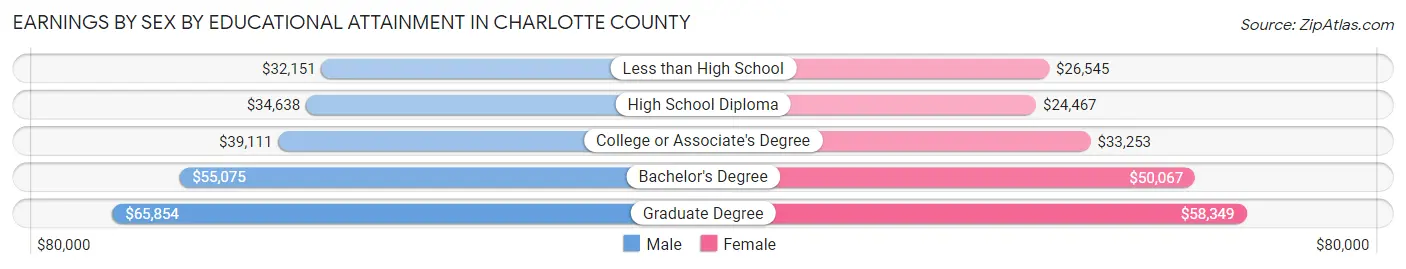
Earnings by Sex by Educational Attainment in Charlotte County
Average earnings in Charlotte County are $40,765 for men and $33,213 for women, a difference of 18.5%. Men with an educational attainment of graduate degree enjoy the highest average annual earnings of $65,854, while those with less than high school education earn the least with $32,151. Women with an educational attainment of graduate degree earn the most with the average annual earnings of $58,349, while those with high school diploma education have the smallest earnings of $24,467.
| Educational Attainment | Male Income | Female Income |
| Less than High School | $32,151 | $26,545 |
| High School Diploma | $34,638 | $24,467 |
| College or Associate's Degree | $39,111 | $33,253 |
| Bachelor's Degree | $55,075 | $50,067 |
| Graduate Degree | $65,854 | $58,349 |
| Total | $40,765 | $33,213 |
Family Income in Charlotte County
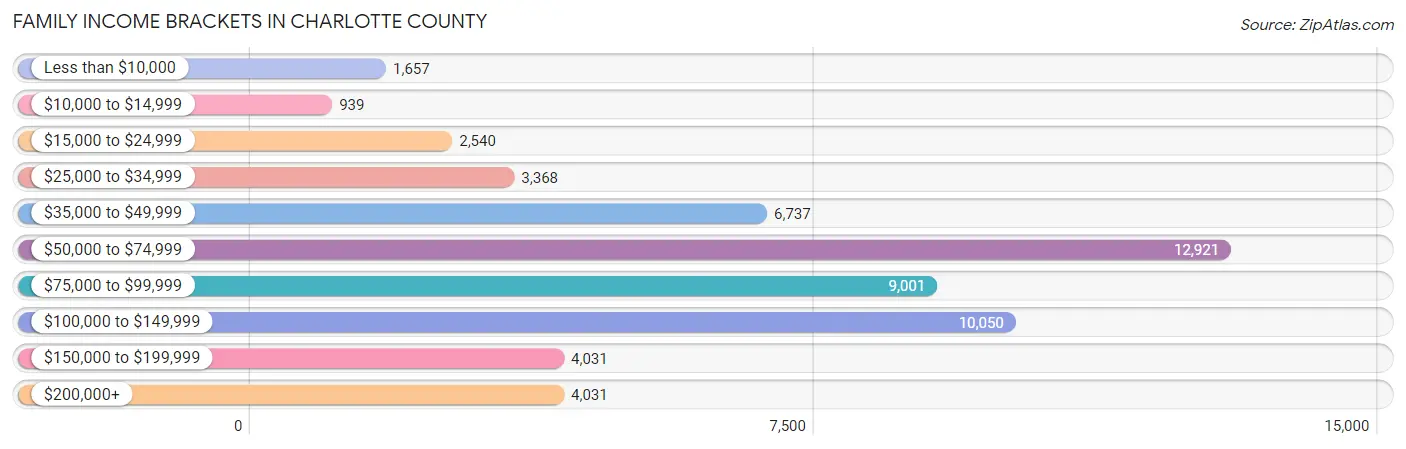
Family Income Brackets in Charlotte County
According to the Charlotte County family income data, there are 12,921 families falling into the $50,000 to $74,999 income range, which is the most common income bracket and makes up 23.4% of all families. Conversely, the $10,000 to $14,999 income bracket is the least frequent group with only 939 families (1.7%) belonging to this category.
| Income Bracket | # Families | % Families |
| Less than $10,000 | 1,657 | 3.0% |
| $10,000 to $14,999 | 939 | 1.7% |
| $15,000 to $24,999 | 2,540 | 4.6% |
| $25,000 to $34,999 | 3,368 | 6.1% |
| $35,000 to $49,999 | 6,737 | 12.2% |
| $50,000 to $74,999 | 12,921 | 23.4% |
| $75,000 to $99,999 | 9,001 | 16.3% |
| $100,000 to $149,999 | 10,050 | 18.2% |
| $150,000 to $199,999 | 4,031 | 7.3% |
| $200,000+ | 4,031 | 7.3% |
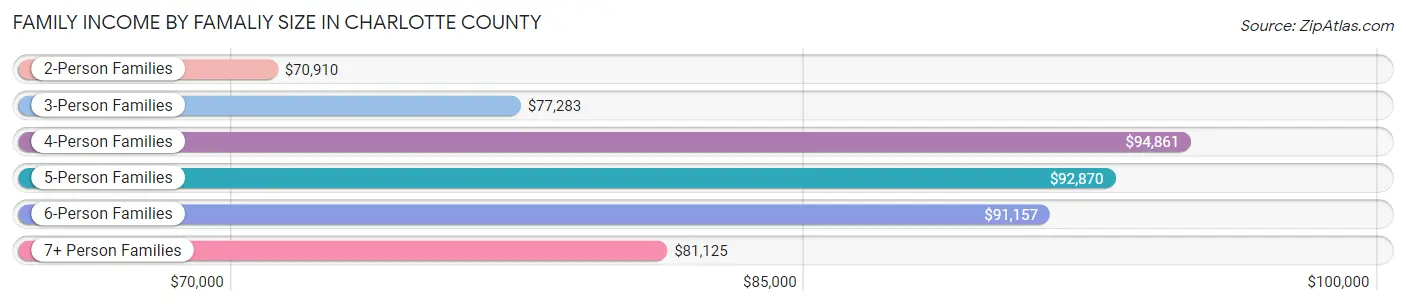
Family Income by Famaliy Size in Charlotte County
4-person families (5,275 | 9.6%) account for the highest median family income in Charlotte County with $94,861 per family, while 2-person families (37,841 | 68.5%) have the highest median income of $35,455 per family member.
| Income Bracket | # Families | Median Income |
| 2-Person Families | 37,841 (68.5%) | $70,910 |
| 3-Person Families | 9,550 (17.3%) | $77,283 |
| 4-Person Families | 5,275 (9.6%) | $94,861 |
| 5-Person Families | 1,616 (2.9%) | $92,870 |
| 6-Person Families | 651 (1.2%) | $91,157 |
| 7+ Person Families | 285 (0.5%) | $81,125 |
| Total | 55,218 (100.0%) | $73,880 |
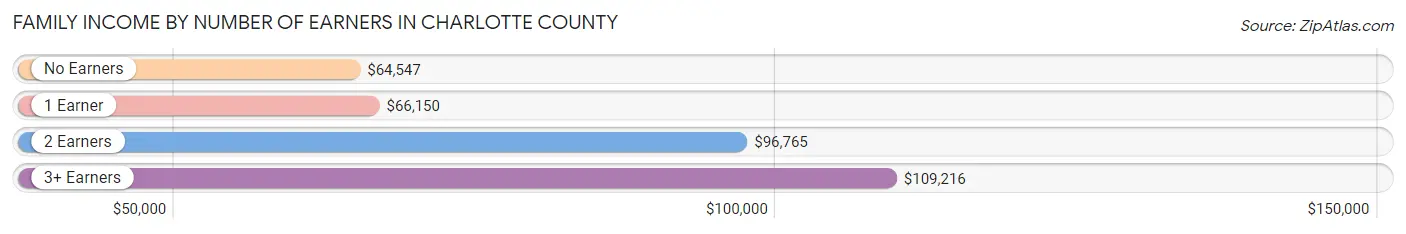
Family Income by Number of Earners in Charlotte County
The median family income in Charlotte County is $73,880, with families comprising 3+ earners (3,490) having the highest median family income of $109,216, while families with no earners (20,963) have the lowest median family income of $64,547, accounting for 6.3% and 38.0% of families, respectively.
| Number of Earners | # Families | Median Income |
| No Earners | 20,963 (38.0%) | $64,547 |
| 1 Earner | 16,186 (29.3%) | $66,150 |
| 2 Earners | 14,579 (26.4%) | $96,765 |
| 3+ Earners | 3,490 (6.3%) | $109,216 |
| Total | 55,218 (100.0%) | $73,880 |
Household Income in Charlotte County
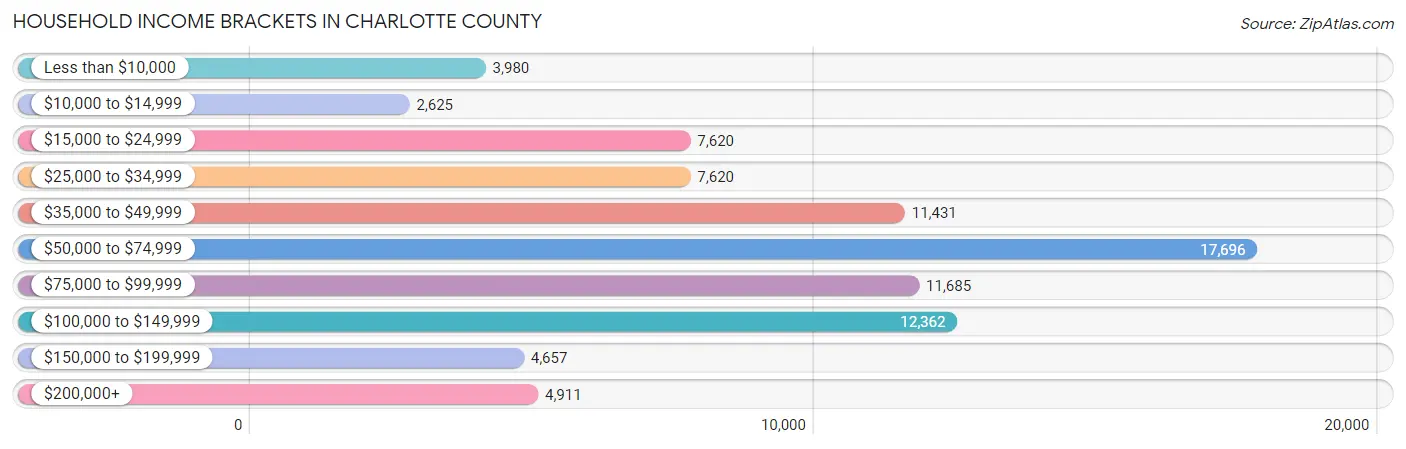
Household Income Brackets in Charlotte County
With 17,696 households falling in the category, the $50,000 to $74,999 income range is the most frequent in Charlotte County, accounting for 20.9% of all households. In contrast, only 2,625 households (3.1%) fall into the $10,000 to $14,999 income bracket, making it the least populous group.
| Income Bracket | # Households | % Households |
| Less than $10,000 | 3,980 | 4.7% |
| $10,000 to $14,999 | 2,625 | 3.1% |
| $15,000 to $24,999 | 7,620 | 9.0% |
| $25,000 to $34,999 | 7,620 | 9.0% |
| $35,000 to $49,999 | 11,431 | 13.5% |
| $50,000 to $74,999 | 17,696 | 20.9% |
| $75,000 to $99,999 | 11,685 | 13.8% |
| $100,000 to $149,999 | 12,362 | 14.6% |
| $150,000 to $199,999 | 4,657 | 5.5% |
| $200,000+ | 4,911 | 5.8% |
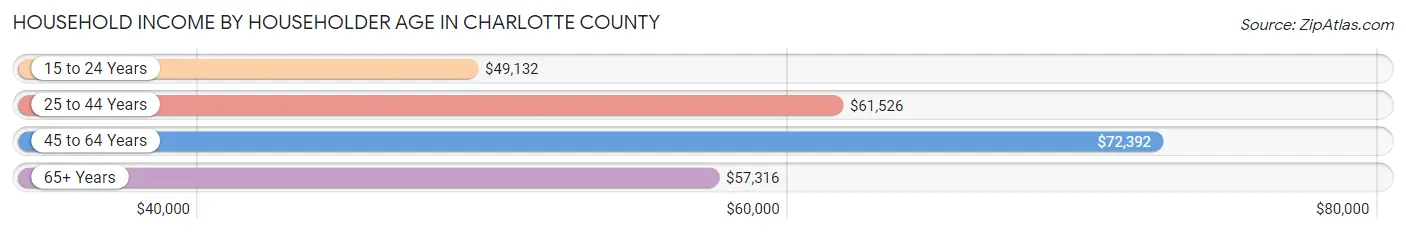
Household Income by Householder Age in Charlotte County
The median household income in Charlotte County is $62,164, with the highest median household income of $72,392 found in the 45 to 64 years age bracket for the primary householder. A total of 26,581 households (31.4%) fall into this category. Meanwhile, the 15 to 24 years age bracket for the primary householder has the lowest median household income of $49,132, with 763 households (0.9%) in this group.
| Income Bracket | # Households | Median Income |
| 15 to 24 Years | 763 (0.9%) | $49,132 |
| 25 to 44 Years | 11,587 (13.7%) | $61,526 |
| 45 to 64 Years | 26,581 (31.4%) | $72,392 |
| 65+ Years | 45,740 (54.0%) | $57,316 |
| Total | 84,671 (100.0%) | $62,164 |
Poverty in Charlotte County
Income Below Poverty by Sex and Age in Charlotte County
With 10.2% poverty level for males and 10.7% for females among the residents of Charlotte County, 5 year old males and under 5 year old females are the most vulnerable to poverty, with 370 males (42.1%) and 584 females (22.8%) in their respective age groups living below the poverty level.
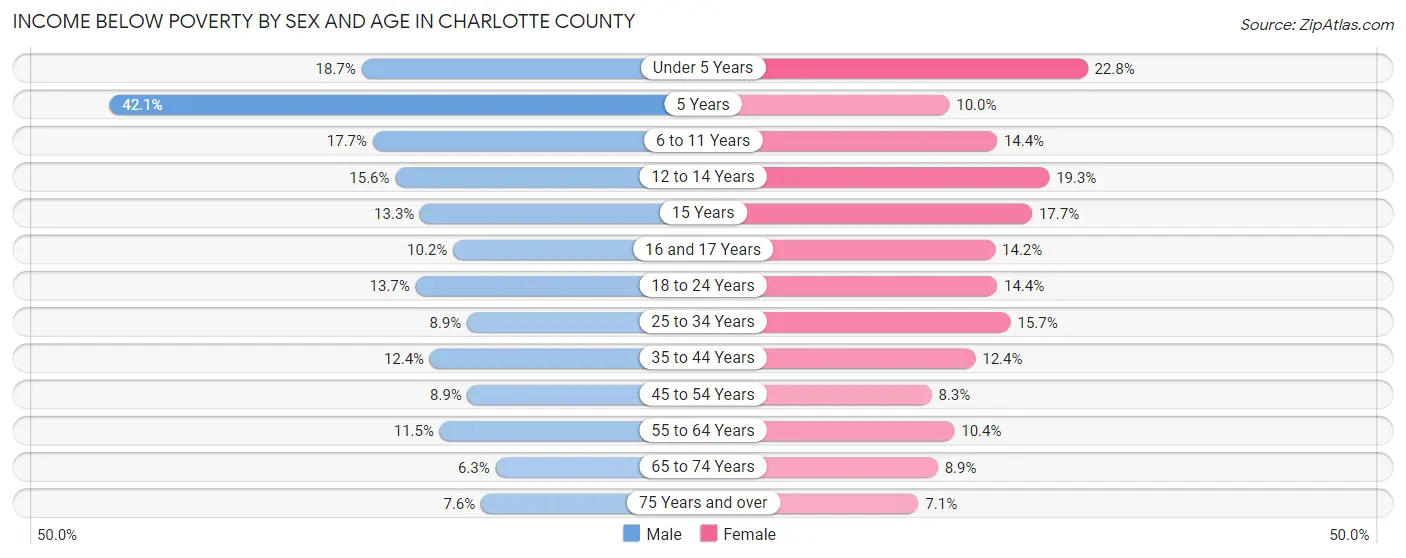
| Age Bracket | Male | Female |
| Under 5 Years | 498 (18.7%) | 584 (22.8%) |
| 5 Years | 370 (42.1%) | 40 (10.0%) |
| 6 to 11 Years | 613 (17.7%) | 505 (14.4%) |
| 12 to 14 Years | 343 (15.6%) | 382 (19.3%) |
| 15 Years | 92 (13.3%) | 143 (17.6%) |
| 16 and 17 Years | 158 (10.2%) | 189 (14.2%) |
| 18 to 24 Years | 696 (13.7%) | 636 (14.4%) |
| 25 to 34 Years | 647 (8.9%) | 1,049 (15.7%) |
| 35 to 44 Years | 857 (12.4%) | 890 (12.4%) |
| 45 to 54 Years | 785 (8.9%) | 815 (8.3%) |
| 55 to 64 Years | 1,736 (11.5%) | 1,825 (10.4%) |
| 65 to 74 Years | 1,222 (6.3%) | 1,863 (8.9%) |
| 75 Years and over | 1,283 (7.6%) | 1,269 (7.1%) |
| Total | 9,300 (10.2%) | 10,190 (10.7%) |
Income Above Poverty by Sex and Age in Charlotte County
According to the poverty statistics in Charlotte County, males aged 65 to 74 years and females aged 75 years and over are the age groups that are most secure financially, with 93.7% of males and 92.9% of females in these age groups living above the poverty line.
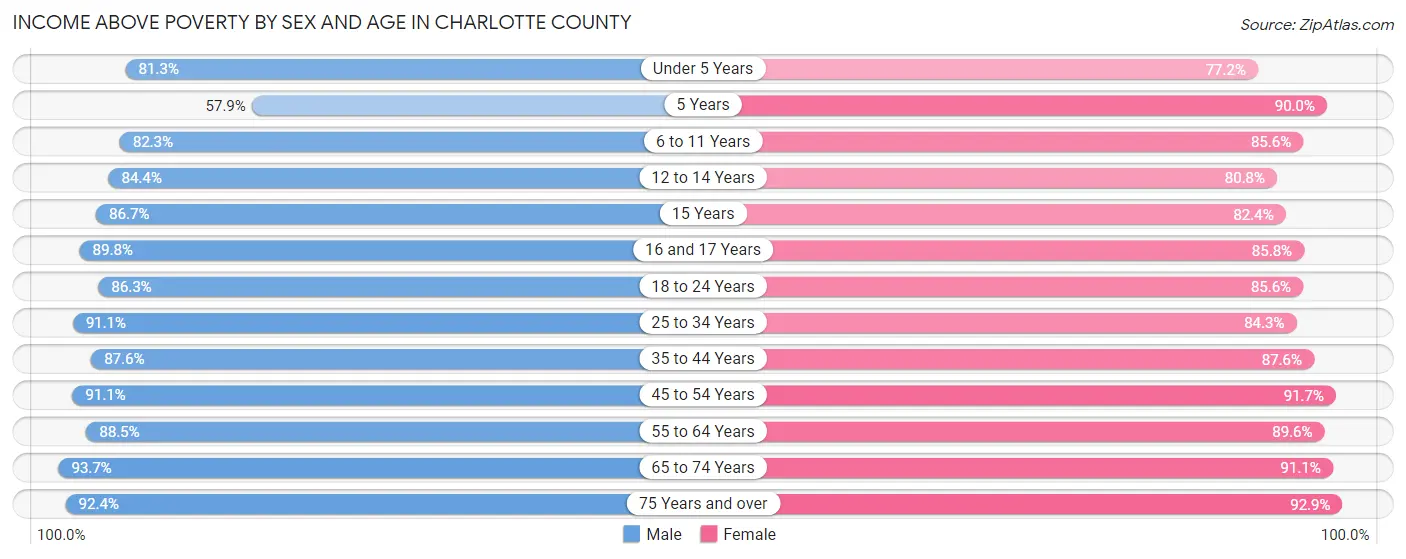
| Age Bracket | Male | Female |
| Under 5 Years | 2,161 (81.3%) | 1,977 (77.2%) |
| 5 Years | 508 (57.9%) | 361 (90.0%) |
| 6 to 11 Years | 2,854 (82.3%) | 3,001 (85.6%) |
| 12 to 14 Years | 1,857 (84.4%) | 1,602 (80.7%) |
| 15 Years | 600 (86.7%) | 667 (82.4%) |
| 16 and 17 Years | 1,387 (89.8%) | 1,139 (85.8%) |
| 18 to 24 Years | 4,380 (86.3%) | 3,777 (85.6%) |
| 25 to 34 Years | 6,596 (91.1%) | 5,650 (84.3%) |
| 35 to 44 Years | 6,064 (87.6%) | 6,291 (87.6%) |
| 45 to 54 Years | 8,059 (91.1%) | 8,979 (91.7%) |
| 55 to 64 Years | 13,394 (88.5%) | 15,654 (89.6%) |
| 65 to 74 Years | 18,203 (93.7%) | 19,069 (91.1%) |
| 75 Years and over | 15,528 (92.4%) | 16,587 (92.9%) |
| Total | 81,591 (89.8%) | 84,754 (89.3%) |
Income Below Poverty Among Married-Couple Families in Charlotte County
The poverty statistics for married-couple families in Charlotte County show that 5.4% or 2,474 of the total 45,588 families live below the poverty line. Families with 5 or more children have the highest poverty rate of 26.0%, comprising of 44 families. On the other hand, families with no children have the lowest poverty rate of 4.5%, which includes 1,673 families.
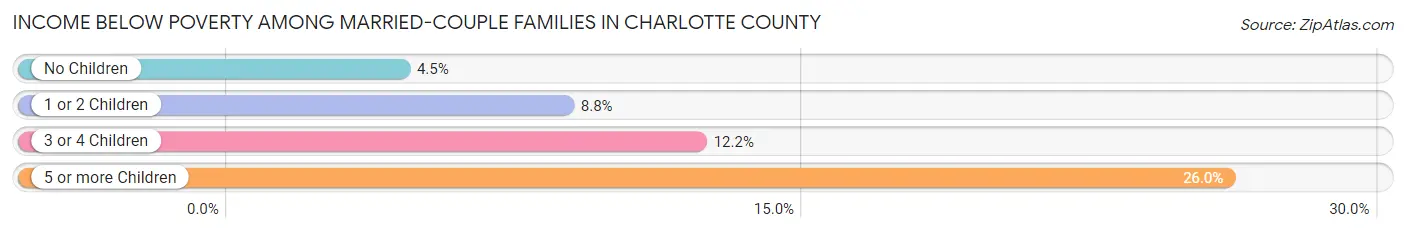
| Children | Above Poverty | Below Poverty |
| No Children | 35,565 (95.5%) | 1,673 (4.5%) |
| 1 or 2 Children | 6,420 (91.2%) | 617 (8.8%) |
| 3 or 4 Children | 1,004 (87.8%) | 140 (12.2%) |
| 5 or more Children | 125 (74.0%) | 44 (26.0%) |
| Total | 43,114 (94.6%) | 2,474 (5.4%) |
Income Below Poverty Among Single-Parent Households in Charlotte County
According to the poverty data in Charlotte County, 14.9% or 415 single-father households and 16.1% or 1,101 single-mother households are living below the poverty line. Among single-father households, those with 3 or 4 children have the highest poverty rate, with 53 households (60.9%) experiencing poverty. Likewise, among single-mother households, those with 5 or more children have the highest poverty rate, with 40 households (100.0%) falling below the poverty line.
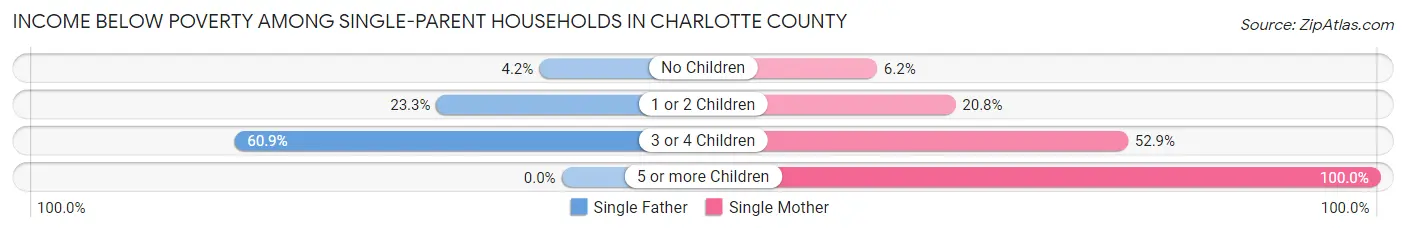
| Children | Single Father | Single Mother |
| No Children | 57 (4.2%) | 211 (6.2%) |
| 1 or 2 Children | 305 (23.3%) | 615 (20.8%) |
| 3 or 4 Children | 53 (60.9%) | 235 (52.9%) |
| 5 or more Children | 0 (0.0%) | 40 (100.0%) |
| Total | 415 (14.9%) | 1,101 (16.1%) |
Income Below Poverty Among Married-Couple vs Single-Parent Households in Charlotte County
The poverty data for Charlotte County shows that 2,474 of the married-couple family households (5.4%) and 1,516 of the single-parent households (15.7%) are living below the poverty level. Within the married-couple family households, those with 5 or more children have the highest poverty rate, with 44 households (26.0%) falling below the poverty line. Among the single-parent households, those with 5 or more children have the highest poverty rate, with 40 household (75.5%) living below poverty.
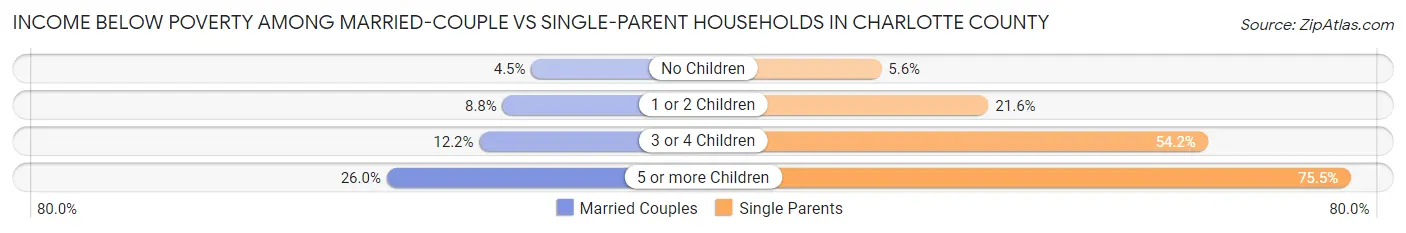
| Children | Married-Couple Families | Single-Parent Households |
| No Children | 1,673 (4.5%) | 268 (5.6%) |
| 1 or 2 Children | 617 (8.8%) | 920 (21.6%) |
| 3 or 4 Children | 140 (12.2%) | 288 (54.2%) |
| 5 or more Children | 44 (26.0%) | 40 (75.5%) |
| Total | 2,474 (5.4%) | 1,516 (15.7%) |
Race in Charlotte County
The most populous races in Charlotte County are White / Caucasian (162,761 | 85.7%), Hispanic or Latino (15,266 | 8.0%), and Two or more Races (11,152 | 5.9%).
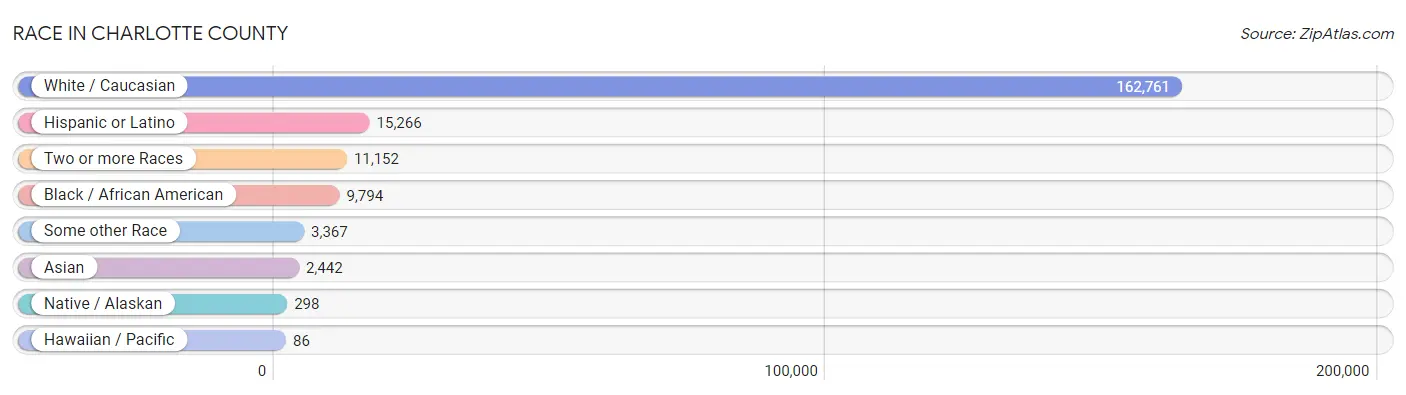
| Race | # Population | % Population |
| Asian | 2,442 | 1.3% |
| Black / African American | 9,794 | 5.2% |
| Hawaiian / Pacific | 86 | 0.1% |
| Hispanic or Latino | 15,266 | 8.0% |
| Native / Alaskan | 298 | 0.2% |
| White / Caucasian | 162,761 | 85.7% |
| Two or more Races | 11,152 | 5.9% |
| Some other Race | 3,367 | 1.8% |
| Total | 189,900 | 100.0% |
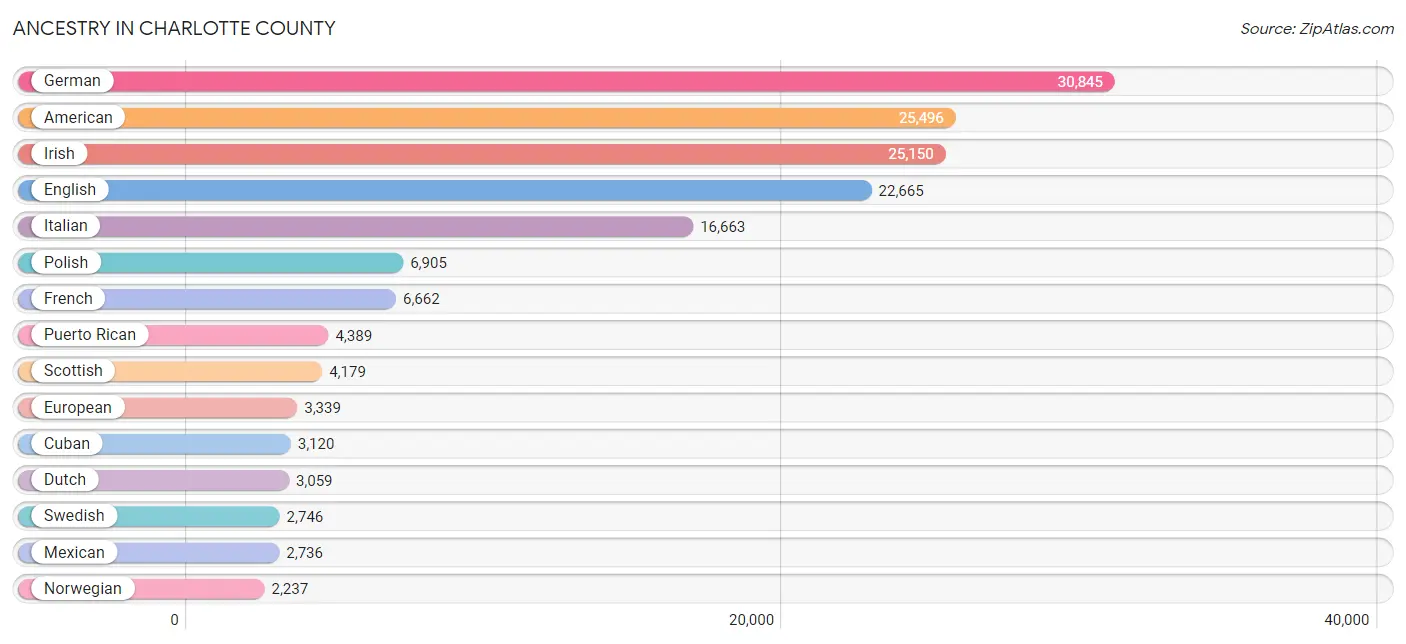
Ancestry in Charlotte County
The most populous ancestries reported in Charlotte County are German (30,845 | 16.2%), American (25,496 | 13.4%), Irish (25,150 | 13.2%), English (22,665 | 11.9%), and Italian (16,663 | 8.8%), together accounting for 63.6% of all Charlotte County residents.
| Ancestry | # Population | % Population |
| African | 174 | 0.1% |
| Albanian | 30 | 0.0% |
| American | 25,496 | 13.4% |
| Apache | 3 | 0.0% |
| Arab | 730 | 0.4% |
| Argentinean | 87 | 0.1% |
| Armenian | 142 | 0.1% |
| Australian | 112 | 0.1% |
| Austrian | 384 | 0.2% |
| Bahamian | 65 | 0.0% |
| Barbadian | 73 | 0.0% |
| Belgian | 248 | 0.1% |
| Bhutanese | 289 | 0.2% |
| Blackfeet | 126 | 0.1% |
| Brazilian | 183 | 0.1% |
| British | 1,452 | 0.8% |
| British West Indian | 87 | 0.1% |
| Bulgarian | 63 | 0.0% |
| Burmese | 99 | 0.1% |
| Cajun | 42 | 0.0% |
| Canadian | 1,277 | 0.7% |
| Cape Verdean | 99 | 0.1% |
| Carpatho Rusyn | 13 | 0.0% |
| Celtic | 54 | 0.0% |
| Central American | 953 | 0.5% |
| Central American Indian | 56 | 0.0% |
| Cherokee | 258 | 0.1% |
| Chickasaw | 37 | 0.0% |
| Chilean | 254 | 0.1% |
| Chippewa | 16 | 0.0% |
| Colombian | 720 | 0.4% |
| Costa Rican | 12 | 0.0% |
| Creek | 94 | 0.1% |
| Croatian | 119 | 0.1% |
| Cuban | 3,120 | 1.6% |
| Czech | 1,184 | 0.6% |
| Czechoslovakian | 211 | 0.1% |
| Danish | 777 | 0.4% |
| Delaware | 12 | 0.0% |
| Dominican | 714 | 0.4% |
| Dutch | 3,059 | 1.6% |
| Eastern European | 426 | 0.2% |
| Ecuadorian | 55 | 0.0% |
| Egyptian | 91 | 0.1% |
| English | 22,665 | 11.9% |
| Estonian | 45 | 0.0% |
| European | 3,339 | 1.8% |
| Finnish | 315 | 0.2% |
| French | 6,662 | 3.5% |
| French American Indian | 19 | 0.0% |
| French Canadian | 2,120 | 1.1% |
| German | 30,845 | 16.2% |
| Greek | 619 | 0.3% |
| Guamanian / Chamorro | 36 | 0.0% |
| Guatemalan | 213 | 0.1% |
| Guyanese | 480 | 0.3% |
| Haitian | 1,210 | 0.6% |
| Honduran | 170 | 0.1% |
| Hopi | 18 | 0.0% |
| Hungarian | 1,917 | 1.0% |
| Icelander | 55 | 0.0% |
| Indian (Asian) | 645 | 0.3% |
| Iranian | 143 | 0.1% |
| Irish | 25,150 | 13.2% |
| Iroquois | 40 | 0.0% |
| Israeli | 19 | 0.0% |
| Italian | 16,663 | 8.8% |
| Jamaican | 1,839 | 1.0% |
| Japanese | 98 | 0.1% |
| Jordanian | 5 | 0.0% |
| Kiowa | 9 | 0.0% |
| Korean | 1,220 | 0.6% |
| Laotian | 77 | 0.0% |
| Latvian | 198 | 0.1% |
| Lebanese | 359 | 0.2% |
| Liberian | 5 | 0.0% |
| Lithuanian | 323 | 0.2% |
| Luxembourger | 45 | 0.0% |
| Macedonian | 42 | 0.0% |
| Maltese | 38 | 0.0% |
| Mexican | 2,736 | 1.4% |
| Mexican American Indian | 23 | 0.0% |
| Native Hawaiian | 139 | 0.1% |
| Navajo | 7 | 0.0% |
| New Zealander | 9 | 0.0% |
| Nicaraguan | 24 | 0.0% |
| Nigerian | 46 | 0.0% |
| Northern European | 223 | 0.1% |
| Norwegian | 2,237 | 1.2% |
| Pakistani | 112 | 0.1% |
| Palestinian | 118 | 0.1% |
| Panamanian | 164 | 0.1% |
| Paraguayan | 16 | 0.0% |
| Pennsylvania German | 85 | 0.0% |
| Peruvian | 246 | 0.1% |
| Polish | 6,905 | 3.6% |
| Portuguese | 1,239 | 0.6% |
| Puerto Rican | 4,389 | 2.3% |
| Romanian | 267 | 0.1% |
| Russian | 1,683 | 0.9% |
| Salvadoran | 370 | 0.2% |
| Scandinavian | 794 | 0.4% |
| Scotch-Irish | 2,014 | 1.1% |
| Scottish | 4,179 | 2.2% |
| Seminole | 17 | 0.0% |
| Serbian | 86 | 0.1% |
| Slavic | 132 | 0.1% |
| Slovak | 583 | 0.3% |
| Slovene | 133 | 0.1% |
| South African | 11 | 0.0% |
| South American | 2,082 | 1.1% |
| South American Indian | 30 | 0.0% |
| Spaniard | 224 | 0.1% |
| Spanish | 228 | 0.1% |
| Sri Lankan | 338 | 0.2% |
| Subsaharan African | 345 | 0.2% |
| Swedish | 2,746 | 1.5% |
| Swiss | 434 | 0.2% |
| Syrian | 36 | 0.0% |
| Thai | 407 | 0.2% |
| Tongan | 14 | 0.0% |
| Trinidadian and Tobagonian | 147 | 0.1% |
| Turkish | 46 | 0.0% |
| Ukrainian | 809 | 0.4% |
| Uruguayan | 100 | 0.1% |
| Venezuelan | 527 | 0.3% |
| Welsh | 1,085 | 0.6% |
| West Indian | 567 | 0.3% |
| Yugoslavian | 127 | 0.1% | View All 129 Rows |
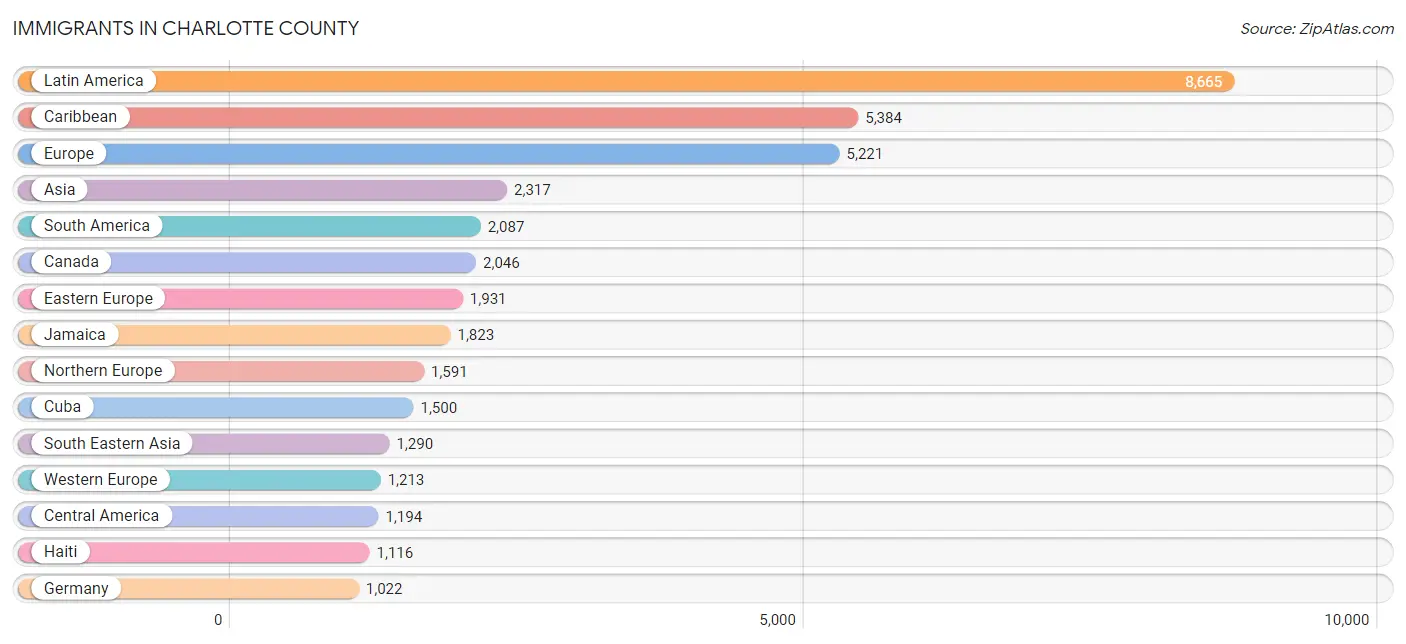
Immigrants in Charlotte County
The most numerous immigrant groups reported in Charlotte County came from Latin America (8,665 | 4.6%), Caribbean (5,384 | 2.8%), Europe (5,221 | 2.8%), Asia (2,317 | 1.2%), and South America (2,087 | 1.1%), together accounting for 12.5% of all Charlotte County residents.
| Immigration Origin | # Population | % Population |
| Afghanistan | 32 | 0.0% |
| Africa | 184 | 0.1% |
| Argentina | 8 | 0.0% |
| Armenia | 2 | 0.0% |
| Asia | 2,317 | 1.2% |
| Australia | 98 | 0.1% |
| Austria | 45 | 0.0% |
| Barbados | 124 | 0.1% |
| Belize | 12 | 0.0% |
| Bosnia and Herzegovina | 38 | 0.0% |
| Brazil | 82 | 0.0% |
| Bulgaria | 57 | 0.0% |
| Cabo Verde | 20 | 0.0% |
| Cambodia | 54 | 0.0% |
| Canada | 2,046 | 1.1% |
| Caribbean | 5,384 | 2.8% |
| Central America | 1,194 | 0.6% |
| Chile | 205 | 0.1% |
| China | 149 | 0.1% |
| Colombia | 623 | 0.3% |
| Croatia | 15 | 0.0% |
| Cuba | 1,500 | 0.8% |
| Czechoslovakia | 145 | 0.1% |
| Denmark | 33 | 0.0% |
| Dominican Republic | 553 | 0.3% |
| Eastern Africa | 39 | 0.0% |
| Eastern Asia | 364 | 0.2% |
| Eastern Europe | 1,931 | 1.0% |
| Ecuador | 55 | 0.0% |
| Egypt | 28 | 0.0% |
| El Salvador | 272 | 0.1% |
| England | 735 | 0.4% |
| Europe | 5,221 | 2.8% |
| France | 64 | 0.0% |
| Germany | 1,022 | 0.5% |
| Greece | 34 | 0.0% |
| Grenada | 16 | 0.0% |
| Guatemala | 121 | 0.1% |
| Guyana | 382 | 0.2% |
| Haiti | 1,116 | 0.6% |
| Honduras | 84 | 0.0% |
| Hong Kong | 37 | 0.0% |
| Hungary | 231 | 0.1% |
| India | 151 | 0.1% |
| Indonesia | 15 | 0.0% |
| Iran | 128 | 0.1% |
| Ireland | 57 | 0.0% |
| Israel | 19 | 0.0% |
| Italy | 390 | 0.2% |
| Jamaica | 1,823 | 1.0% |
| Japan | 130 | 0.1% |
| Jordan | 10 | 0.0% |
| Korea | 85 | 0.0% |
| Kuwait | 93 | 0.1% |
| Latin America | 8,665 | 4.6% |
| Latvia | 69 | 0.0% |
| Lebanon | 9 | 0.0% |
| Lithuania | 20 | 0.0% |
| Mexico | 587 | 0.3% |
| Morocco | 11 | 0.0% |
| Netherlands | 63 | 0.0% |
| Nicaragua | 54 | 0.0% |
| Nigeria | 62 | 0.0% |
| Northern Africa | 39 | 0.0% |
| Northern Europe | 1,591 | 0.8% |
| Norway | 13 | 0.0% |
| Oceania | 125 | 0.1% |
| Pakistan | 11 | 0.0% |
| Panama | 64 | 0.0% |
| Peru | 248 | 0.1% |
| Philippines | 818 | 0.4% |
| Poland | 256 | 0.1% |
| Portugal | 14 | 0.0% |
| Romania | 140 | 0.1% |
| Russia | 354 | 0.2% |
| Scotland | 90 | 0.1% |
| Serbia | 61 | 0.0% |
| South Africa | 24 | 0.0% |
| South America | 2,087 | 1.1% |
| South Central Asia | 322 | 0.2% |
| South Eastern Asia | 1,290 | 0.7% |
| Southern Europe | 486 | 0.3% |
| Spain | 27 | 0.0% |
| Sweden | 87 | 0.1% |
| Switzerland | 19 | 0.0% |
| Taiwan | 12 | 0.0% |
| Thailand | 80 | 0.0% |
| Trinidad and Tobago | 195 | 0.1% |
| Turkey | 36 | 0.0% |
| Ukraine | 480 | 0.3% |
| Uruguay | 38 | 0.0% |
| Venezuela | 416 | 0.2% |
| Vietnam | 321 | 0.2% |
| Western Africa | 82 | 0.0% |
| Western Asia | 177 | 0.1% |
| Western Europe | 1,213 | 0.6% |
| Zimbabwe | 34 | 0.0% | View All 97 Rows |
Sex and Age in Charlotte County
Sex and Age in Charlotte County
The most populous age groups in Charlotte County are 65 to 69 Years (10,297 | 11.0%) for men and 70 to 74 Years (10,644 | 11.0%) for women.
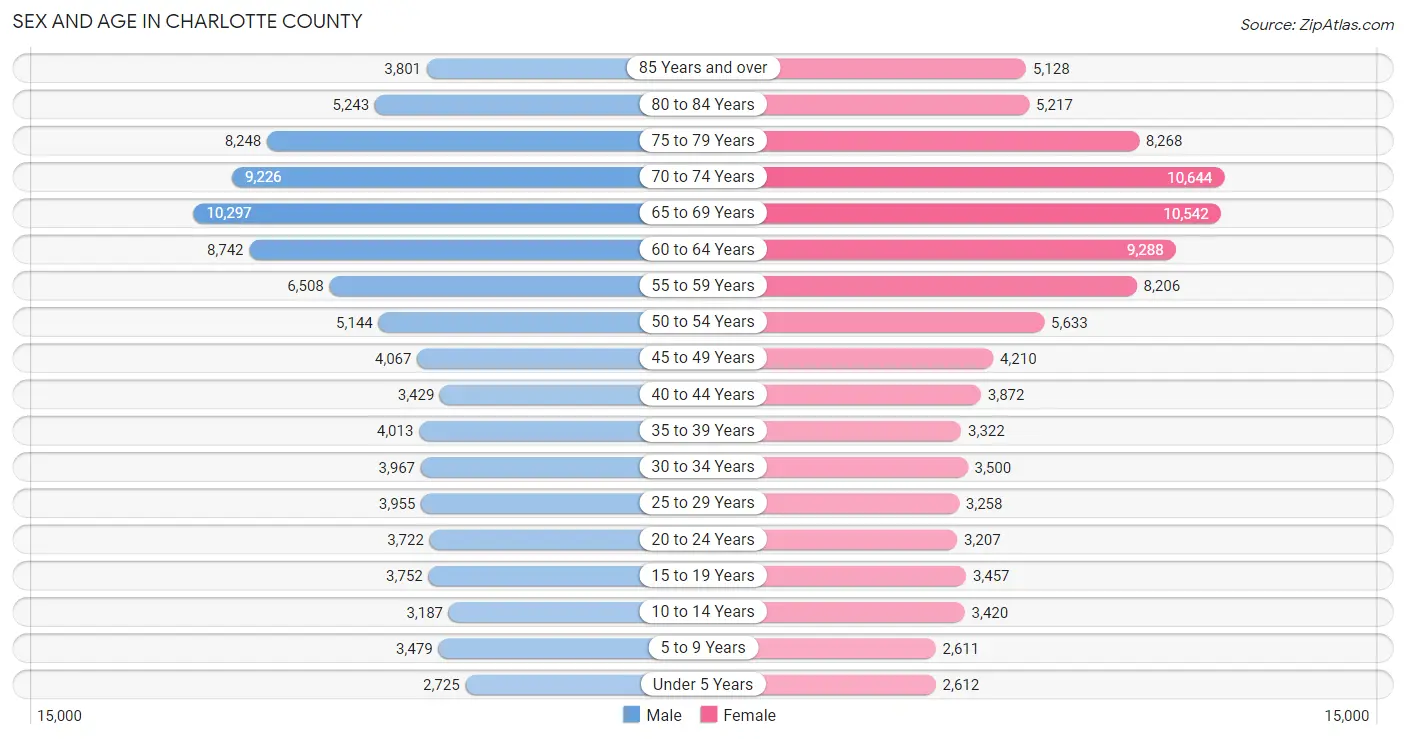
| Age Bracket | Male | Female |
| Under 5 Years | 2,725 (2.9%) | 2,612 (2.7%) |
| 5 to 9 Years | 3,479 (3.7%) | 2,611 (2.7%) |
| 10 to 14 Years | 3,187 (3.4%) | 3,420 (3.5%) |
| 15 to 19 Years | 3,752 (4.0%) | 3,457 (3.6%) |
| 20 to 24 Years | 3,722 (4.0%) | 3,207 (3.3%) |
| 25 to 29 Years | 3,955 (4.2%) | 3,258 (3.4%) |
| 30 to 34 Years | 3,967 (4.2%) | 3,500 (3.6%) |
| 35 to 39 Years | 4,013 (4.3%) | 3,322 (3.5%) |
| 40 to 44 Years | 3,429 (3.7%) | 3,872 (4.0%) |
| 45 to 49 Years | 4,067 (4.3%) | 4,210 (4.4%) |
| 50 to 54 Years | 5,144 (5.5%) | 5,633 (5.8%) |
| 55 to 59 Years | 6,508 (7.0%) | 8,206 (8.5%) |
| 60 to 64 Years | 8,742 (9.3%) | 9,288 (9.6%) |
| 65 to 69 Years | 10,297 (11.0%) | 10,542 (10.9%) |
| 70 to 74 Years | 9,226 (9.9%) | 10,644 (11.0%) |
| 75 to 79 Years | 8,248 (8.8%) | 8,268 (8.6%) |
| 80 to 84 Years | 5,243 (5.6%) | 5,217 (5.4%) |
| 85 Years and over | 3,801 (4.1%) | 5,128 (5.3%) |
| Total | 93,505 (100.0%) | 96,395 (100.0%) |
Families and Households in Charlotte County
Median Family Size in Charlotte County
The median family size in Charlotte County is 2.65 persons per family, with single female/mother families (6,851 | 12.4%) accounting for the largest median family size of 3.08 persons per family. On the other hand, married-couple families (45,588 | 82.6%) represent the smallest median family size with 2.58 persons per family.
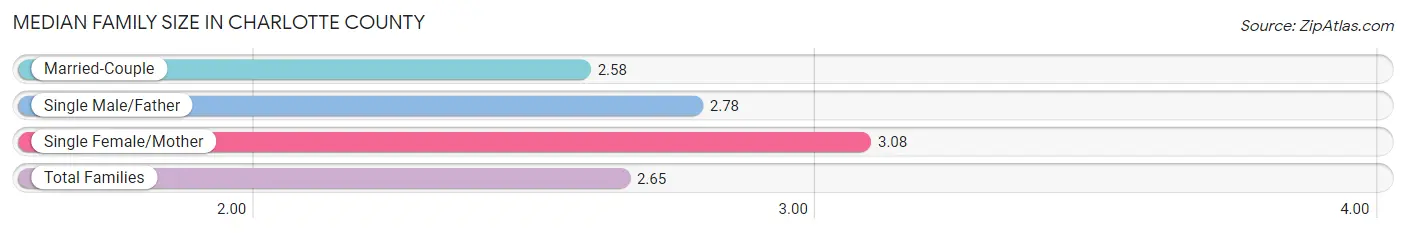
| Family Type | # Families | Family Size |
| Married-Couple | 45,588 (82.6%) | 2.58 |
| Single Male/Father | 2,779 (5.0%) | 2.78 |
| Single Female/Mother | 6,851 (12.4%) | 3.08 |
| Total Families | 55,218 (100.0%) | 2.65 |
Median Household Size in Charlotte County
The median household size in Charlotte County is 2.20 persons per household, with single female/mother households (6,851 | 8.1%) accounting for the largest median household size of 3.33 persons per household. non-family households (29,453 | 34.8%) represent the smallest median household size with 1.22 persons per household.
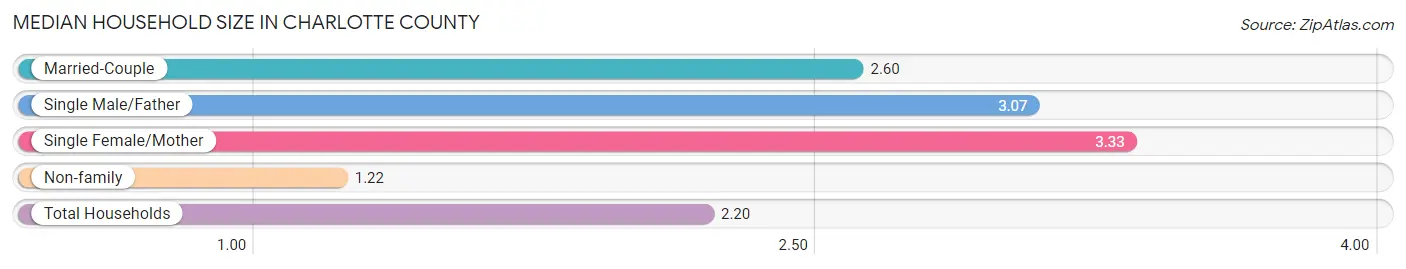
| Household Type | # Households | Household Size |
| Married-Couple | 45,588 (53.8%) | 2.60 |
| Single Male/Father | 2,779 (3.3%) | 3.07 |
| Single Female/Mother | 6,851 (8.1%) | 3.33 |
| Non-family | 29,453 (34.8%) | 1.22 |
| Total Households | 84,671 (100.0%) | 2.20 |
Household Size by Marriage Status in Charlotte County
Out of a total of 84,671 households in Charlotte County, 55,218 (65.2%) are family households, while 29,453 (34.8%) are nonfamily households. The most numerous type of family households are 2-person households, comprising 36,888, and the most common type of nonfamily households are 1-person households, comprising 24,153.
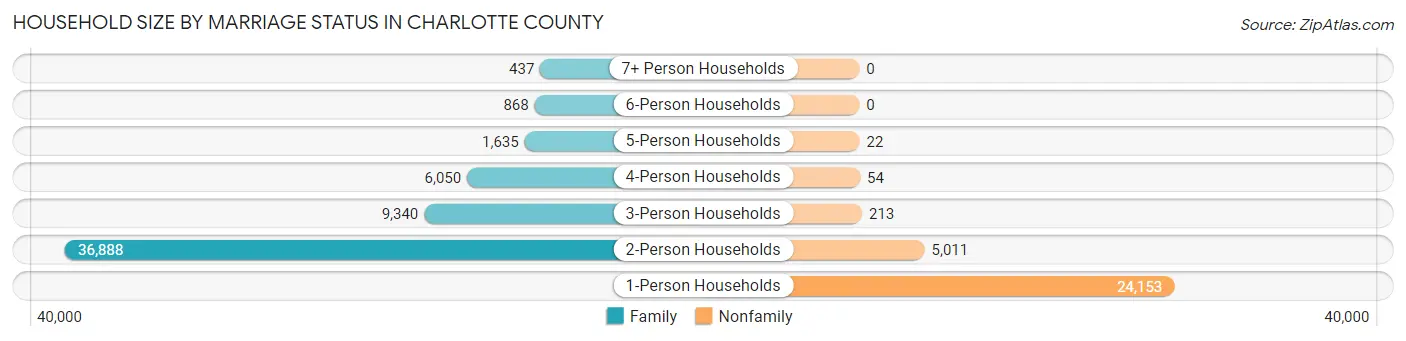
| Household Size | Family Households | Nonfamily Households |
| 1-Person Households | - | 24,153 (28.5%) |
| 2-Person Households | 36,888 (43.6%) | 5,011 (5.9%) |
| 3-Person Households | 9,340 (11.0%) | 213 (0.3%) |
| 4-Person Households | 6,050 (7.1%) | 54 (0.1%) |
| 5-Person Households | 1,635 (1.9%) | 22 (0.0%) |
| 6-Person Households | 868 (1.0%) | 0 (0.0%) |
| 7+ Person Households | 437 (0.5%) | 0 (0.0%) |
| Total | 55,218 (65.2%) | 29,453 (34.8%) |
Female Fertility in Charlotte County
Fertility by Age in Charlotte County
Average fertility rate in Charlotte County is 67.0 births per 1,000 women. Women in the age bracket of 20 to 34 years have the highest fertility rate with 143.0 births per 1,000 women. Women in the age bracket of 20 to 34 years acount for 80.9% of all women with births.
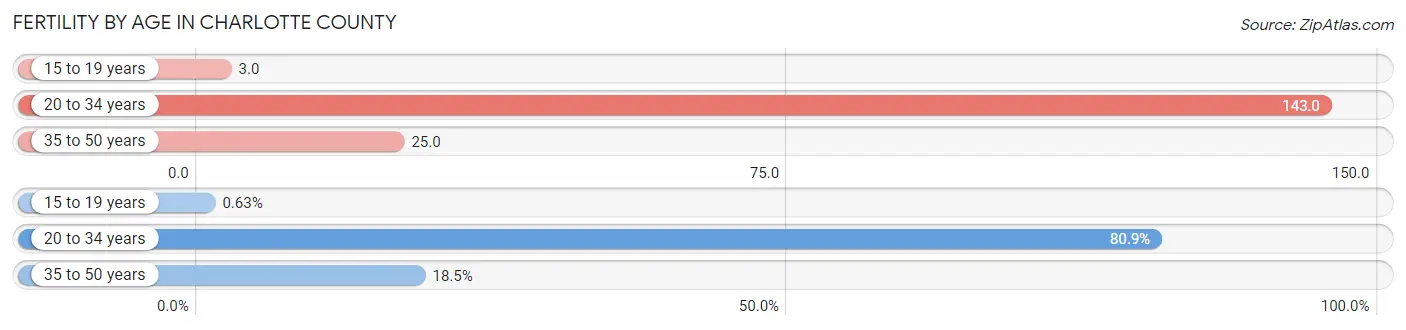
| Age Bracket | Women with Births | Births / 1,000 Women |
| 15 to 19 years | 11 (0.6%) | 3.0 |
| 20 to 34 years | 1,421 (80.9%) | 143.0 |
| 35 to 50 years | 324 (18.4%) | 25.0 |
| Total | 1,756 (100.0%) | 67.0 |
Fertility by Age by Marriage Status in Charlotte County
50.9% of women with births (1,756) in Charlotte County are married. The highest percentage of unmarried women with births falls into 15 to 19 years age bracket with 100.0% of them unmarried at the time of birth, while the lowest percentage of unmarried women with births belong to 35 to 50 years age bracket with 35.2% of them unmarried.
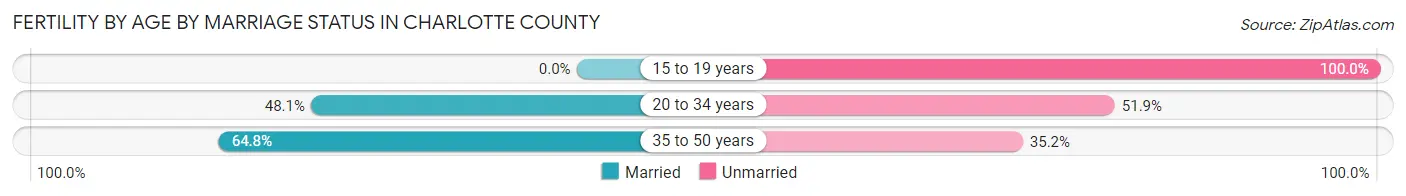
| Age Bracket | Married | Unmarried |
| 15 to 19 years | 0 (0.0%) | 11 (100.0%) |
| 20 to 34 years | 684 (48.1%) | 737 (51.9%) |
| 35 to 50 years | 210 (64.8%) | 114 (35.2%) |
| Total | 894 (50.9%) | 862 (49.1%) |
Fertility by Education in Charlotte County
Average fertility rate in Charlotte County is 67.0 births per 1,000 women. Women with the education attainment of college or associate's degree have the highest fertility rate of 94.0 births per 1,000 women, while women with the education attainment of graduate degree have the lowest fertility at 5.0 births per 1,000 women. Women with the education attainment of college or associate's degree represent 54.7% of all women with births.
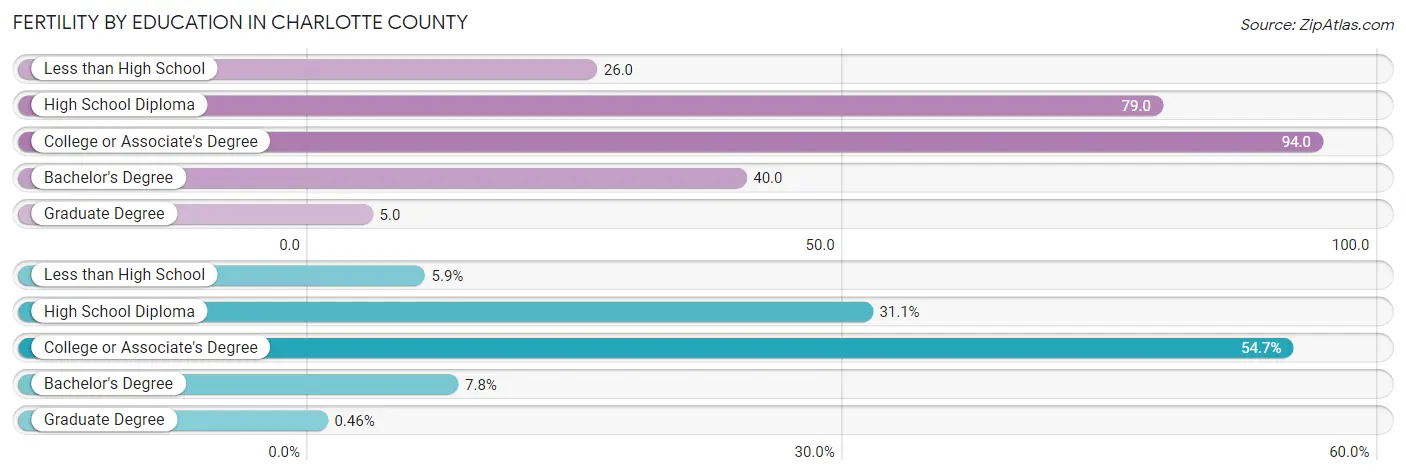
| Educational Attainment | Women with Births | Births / 1,000 Women |
| Less than High School | 104 (5.9%) | 26.0 |
| High School Diploma | 546 (31.1%) | 79.0 |
| College or Associate's Degree | 961 (54.7%) | 94.0 |
| Bachelor's Degree | 137 (7.8%) | 40.0 |
| Graduate Degree | 8 (0.5%) | 5.0 |
| Total | 1,756 (100.0%) | 67.0 |
Fertility by Education by Marriage Status in Charlotte County
49.1% of women with births in Charlotte County are unmarried. Women with the educational attainment of graduate degree are most likely to be married with 100.0% of them married at childbirth, while women with the educational attainment of less than high school are least likely to be married with 100.0% of them unmarried at childbirth.
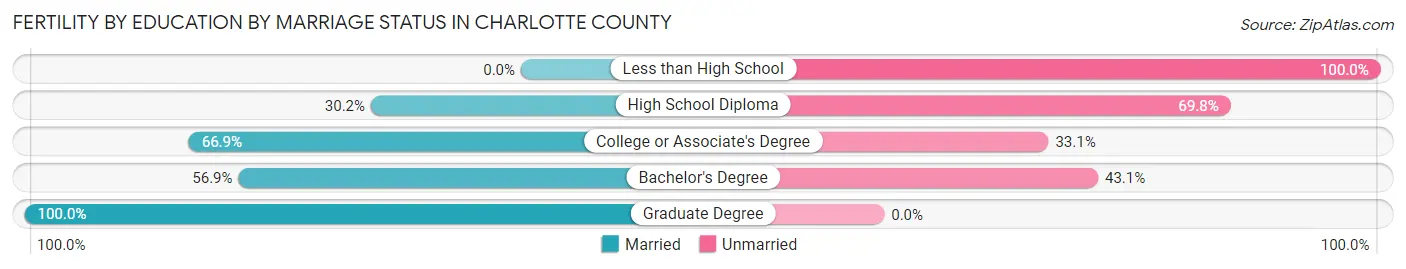
| Educational Attainment | Married | Unmarried |
| Less than High School | 0 (0.0%) | 104 (100.0%) |
| High School Diploma | 165 (30.2%) | 381 (69.8%) |
| College or Associate's Degree | 643 (66.9%) | 318 (33.1%) |
| Bachelor's Degree | 78 (56.9%) | 59 (43.1%) |
| Graduate Degree | 8 (100.0%) | 0 (0.0%) |
| Total | 894 (50.9%) | 862 (49.1%) |
Employment Characteristics in Charlotte County
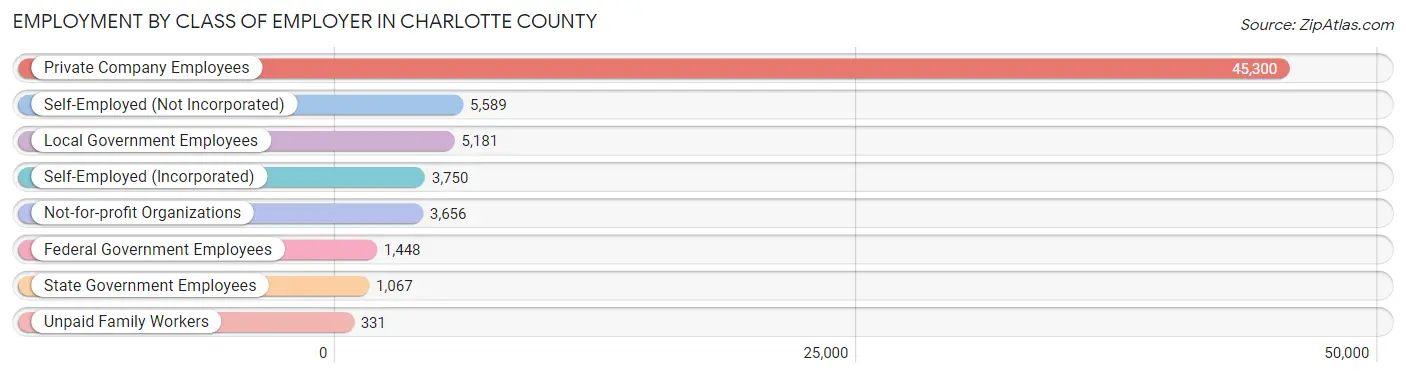
Employment by Class of Employer in Charlotte County
Among the 66,322 employed individuals in Charlotte County, private company employees (45,300 | 68.3%), self-employed (not incorporated) (5,589 | 8.4%), and local government employees (5,181 | 7.8%) make up the most common classes of employment.
| Employer Class | # Employees | % Employees |
| Private Company Employees | 45,300 | 68.3% |
| Self-Employed (Incorporated) | 3,750 | 5.7% |
| Self-Employed (Not Incorporated) | 5,589 | 8.4% |
| Not-for-profit Organizations | 3,656 | 5.5% |
| Local Government Employees | 5,181 | 7.8% |
| State Government Employees | 1,067 | 1.6% |
| Federal Government Employees | 1,448 | 2.2% |
| Unpaid Family Workers | 331 | 0.5% |
| Total | 66,322 | 100.0% |
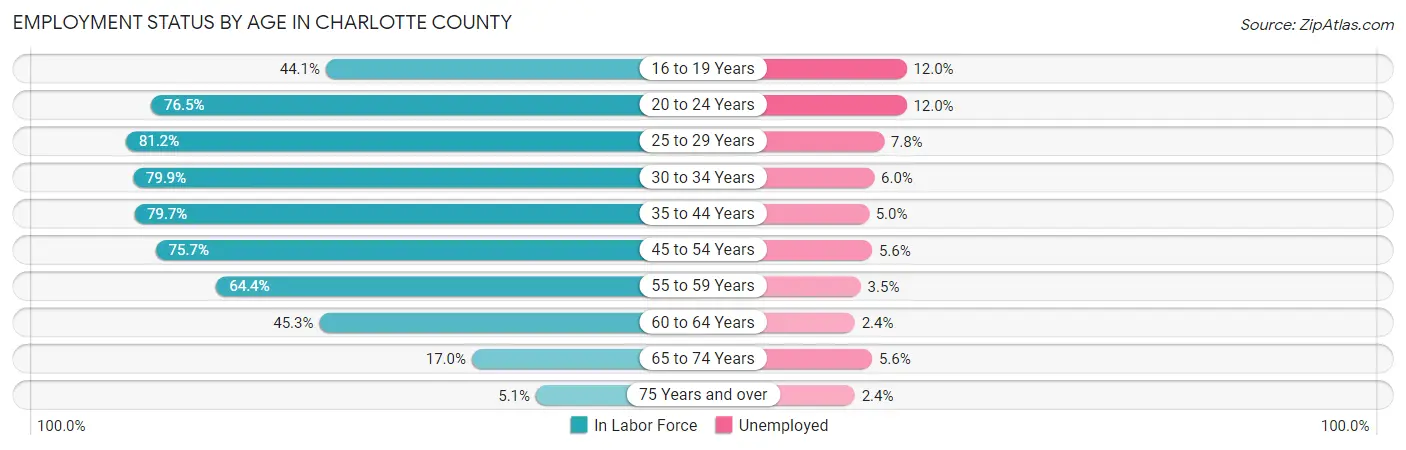
Employment Status by Age in Charlotte County
According to the labor force statistics for Charlotte County, out of the total population over 16 years of age (170,362), 42.4% or 72,233 individuals are in the labor force, with 5.7% or 4,117 of them unemployed. The age group with the highest labor force participation rate is 25 to 29 years, with 81.2% or 5,857 individuals in the labor force. Within the labor force, the 16 to 19 years age range has the highest percentage of unemployed individuals, with 12.0% or 302 of them being unemployed.
| Age Bracket | In Labor Force | Unemployed |
| 16 to 19 Years | 2,516 (44.1%) | 302 (12.0%) |
| 20 to 24 Years | 5,301 (76.5%) | 636 (12.0%) |
| 25 to 29 Years | 5,857 (81.2%) | 457 (7.8%) |
| 30 to 34 Years | 5,966 (79.9%) | 358 (6.0%) |
| 35 to 44 Years | 11,665 (79.7%) | 583 (5.0%) |
| 45 to 54 Years | 14,424 (75.7%) | 808 (5.6%) |
| 55 to 59 Years | 9,476 (64.4%) | 332 (3.5%) |
| 60 to 64 Years | 8,168 (45.3%) | 196 (2.4%) |
| 65 to 74 Years | 6,921 (17.0%) | 388 (5.6%) |
| 75 Years and over | 1,831 (5.1%) | 44 (2.4%) |
| Total | 72,233 (42.4%) | 4,117 (5.7%) |
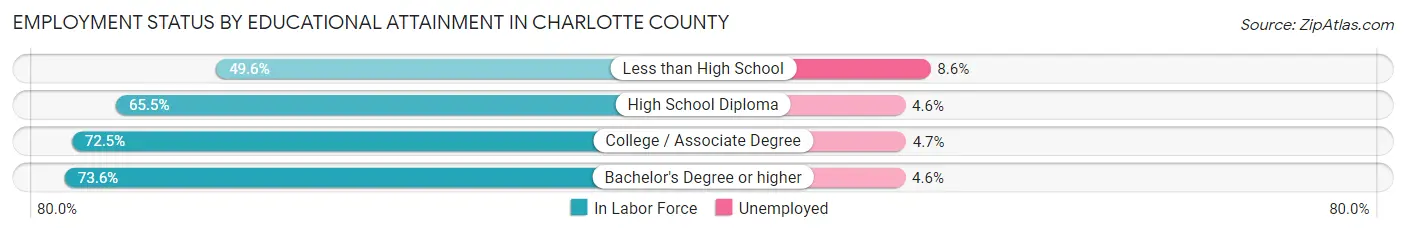
Employment Status by Educational Attainment in Charlotte County
According to labor force statistics for Charlotte County, 68.5% of individuals (55,563) out of the total population between 25 and 64 years of age (81,114) are in the labor force, with 4.9% or 2,723 of them being unemployed. The group with the highest labor force participation rate are those with the educational attainment of bachelor's degree or higher, with 73.6% or 13,534 individuals in the labor force. Within the labor force, individuals with less than high school education have the highest percentage of unemployment, with 8.6% or 281 of them being unemployed.
| Educational Attainment | In Labor Force | Unemployed |
| Less than High School | 3,263 (49.6%) | 566 (8.6%) |
| High School Diploma | 18,382 (65.5%) | 1,291 (4.6%) |
| College / Associate Degree | 20,359 (72.5%) | 1,320 (4.7%) |
| Bachelor's Degree or higher | 13,534 (73.6%) | 846 (4.6%) |
| Total | 55,563 (68.5%) | 3,975 (4.9%) |
Employment Occupations by Sex in Charlotte County
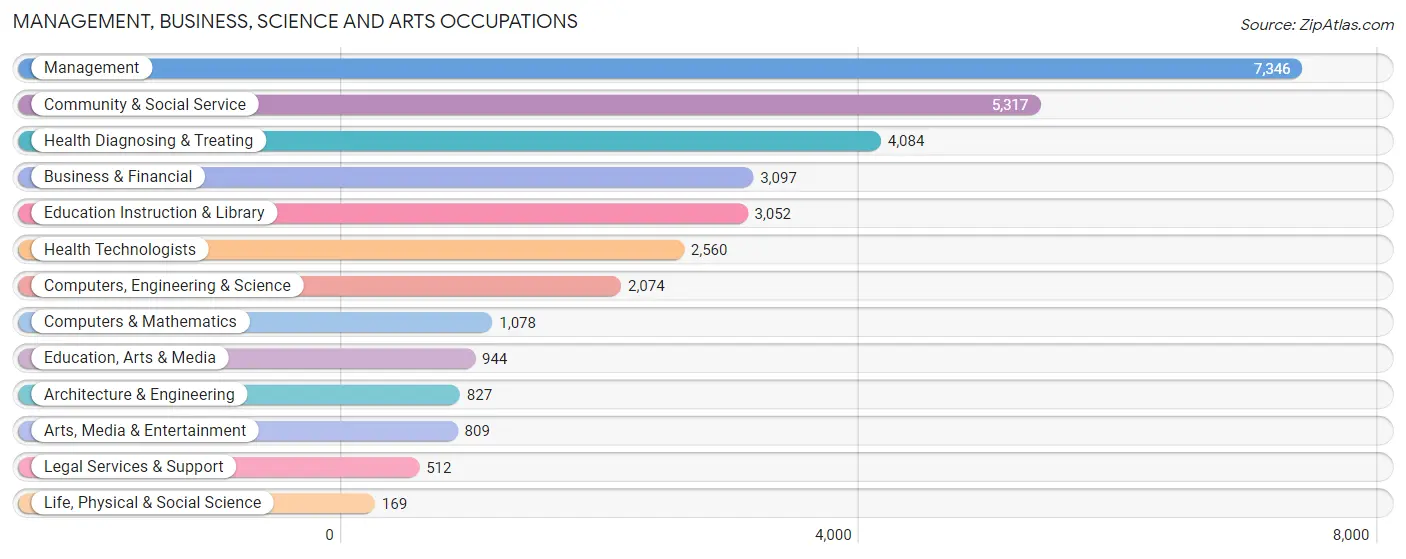
Management, Business, Science and Arts Occupations
The most common Management, Business, Science and Arts occupations in Charlotte County are Management (7,346 | 10.8%), Community & Social Service (5,317 | 7.8%), Health Diagnosing & Treating (4,084 | 6.0%), Business & Financial (3,097 | 4.5%), and Education Instruction & Library (3,052 | 4.5%).
Management, Business, Science and Arts Occupations by Sex
Within the Management, Business, Science and Arts occupations in Charlotte County, the most male-oriented occupations are Architecture & Engineering (90.4%), Computers, Engineering & Science (71.6%), and Computers & Mathematics (61.4%), while the most female-oriented occupations are Health Diagnosing & Treating (80.2%), Health Technologists (76.3%), and Education Instruction & Library (71.1%).
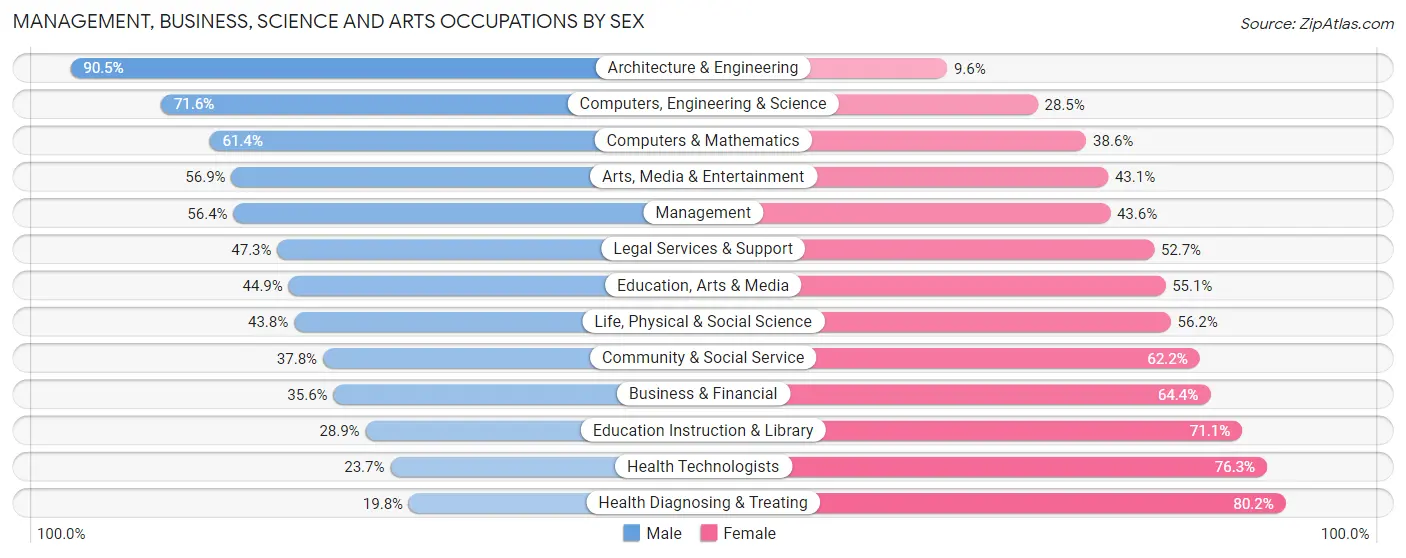
| Occupation | Male | Female |
| Management | 4,146 (56.4%) | 3,200 (43.6%) |
| Business & Financial | 1,102 (35.6%) | 1,995 (64.4%) |
| Computers, Engineering & Science | 1,484 (71.6%) | 590 (28.4%) |
| Computers & Mathematics | 662 (61.4%) | 416 (38.6%) |
| Architecture & Engineering | 748 (90.4%) | 79 (9.6%) |
| Life, Physical & Social Science | 74 (43.8%) | 95 (56.2%) |
| Community & Social Service | 2,008 (37.8%) | 3,309 (62.2%) |
| Education, Arts & Media | 424 (44.9%) | 520 (55.1%) |
| Legal Services & Support | 242 (47.3%) | 270 (52.7%) |
| Education Instruction & Library | 882 (28.9%) | 2,170 (71.1%) |
| Arts, Media & Entertainment | 460 (56.9%) | 349 (43.1%) |
| Health Diagnosing & Treating | 810 (19.8%) | 3,274 (80.2%) |
| Health Technologists | 607 (23.7%) | 1,953 (76.3%) |
| Total (Category) | 9,550 (43.6%) | 12,368 (56.4%) |
| Total (Overall) | 34,648 (51.0%) | 33,346 (49.0%) |
Services Occupations
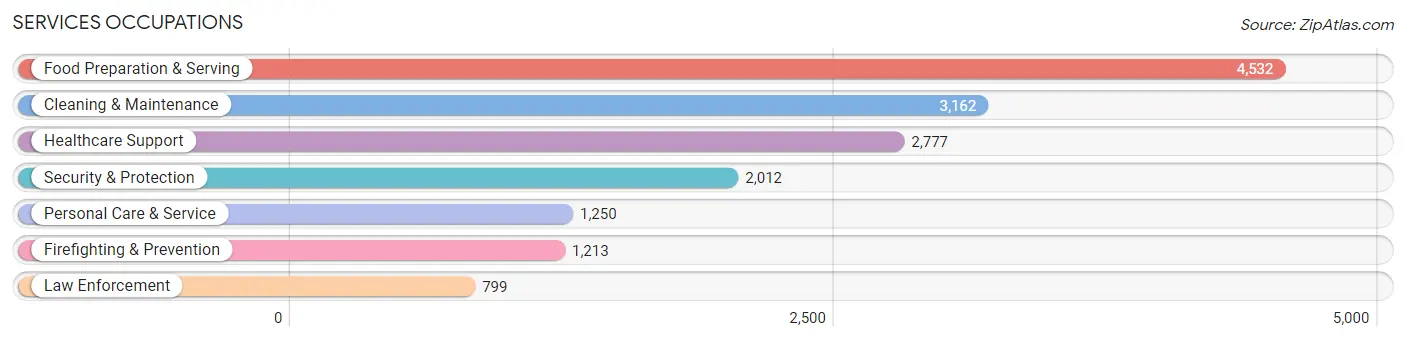
The most common Services occupations in Charlotte County are Food Preparation & Serving (4,532 | 6.7%), Cleaning & Maintenance (3,162 | 4.6%), Healthcare Support (2,777 | 4.1%), Security & Protection (2,012 | 3.0%), and Personal Care & Service (1,250 | 1.8%).
Services Occupations by Sex
Within the Services occupations in Charlotte County, the most male-oriented occupations are Law Enforcement (84.5%), Security & Protection (81.9%), and Firefighting & Prevention (80.2%), while the most female-oriented occupations are Healthcare Support (89.0%), Personal Care & Service (76.7%), and Food Preparation & Serving (60.7%).
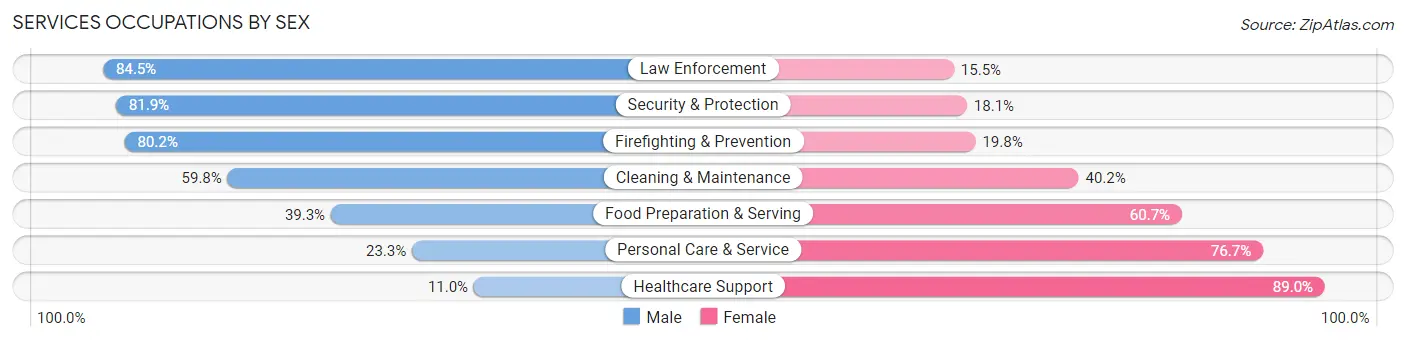
| Occupation | Male | Female |
| Healthcare Support | 306 (11.0%) | 2,471 (89.0%) |
| Security & Protection | 1,648 (81.9%) | 364 (18.1%) |
| Firefighting & Prevention | 973 (80.2%) | 240 (19.8%) |
| Law Enforcement | 675 (84.5%) | 124 (15.5%) |
| Food Preparation & Serving | 1,783 (39.3%) | 2,749 (60.7%) |
| Cleaning & Maintenance | 1,891 (59.8%) | 1,271 (40.2%) |
| Personal Care & Service | 291 (23.3%) | 959 (76.7%) |
| Total (Category) | 5,919 (43.1%) | 7,814 (56.9%) |
| Total (Overall) | 34,648 (51.0%) | 33,346 (49.0%) |
Sales and Office Occupations
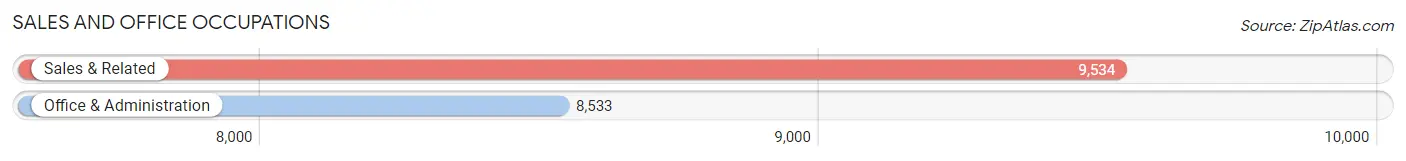
The most common Sales and Office occupations in Charlotte County are Sales & Related (9,534 | 14.0%), and Office & Administration (8,533 | 12.6%).
Sales and Office Occupations by Sex
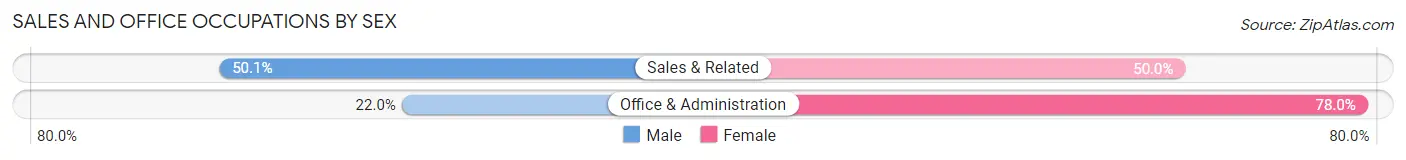
| Occupation | Male | Female |
| Sales & Related | 4,772 (50.0%) | 4,762 (49.9%) |
| Office & Administration | 1,876 (22.0%) | 6,657 (78.0%) |
| Total (Category) | 6,648 (36.8%) | 11,419 (63.2%) |
| Total (Overall) | 34,648 (51.0%) | 33,346 (49.0%) |
Natural Resources, Construction and Maintenance Occupations
The most common Natural Resources, Construction and Maintenance occupations in Charlotte County are Construction & Extraction (4,048 | 5.9%), Installation, Maintenance & Repair (2,327 | 3.4%), and Farming, Fishing & Forestry (267 | 0.4%).

Natural Resources, Construction and Maintenance Occupations by Sex
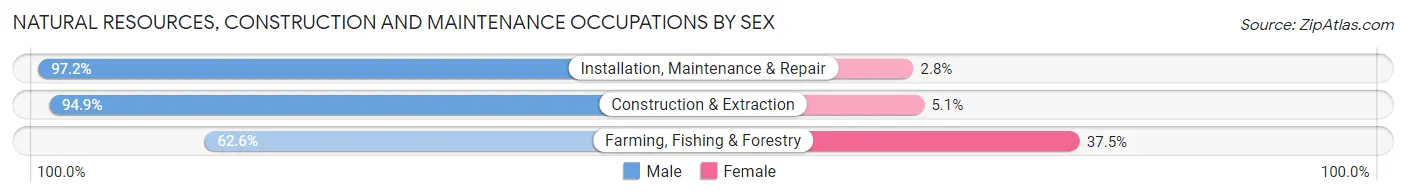
| Occupation | Male | Female |
| Farming, Fishing & Forestry | 167 (62.5%) | 100 (37.4%) |
| Construction & Extraction | 3,841 (94.9%) | 207 (5.1%) |
| Installation, Maintenance & Repair | 2,261 (97.2%) | 66 (2.8%) |
| Total (Category) | 6,269 (94.4%) | 373 (5.6%) |
| Total (Overall) | 34,648 (51.0%) | 33,346 (49.0%) |
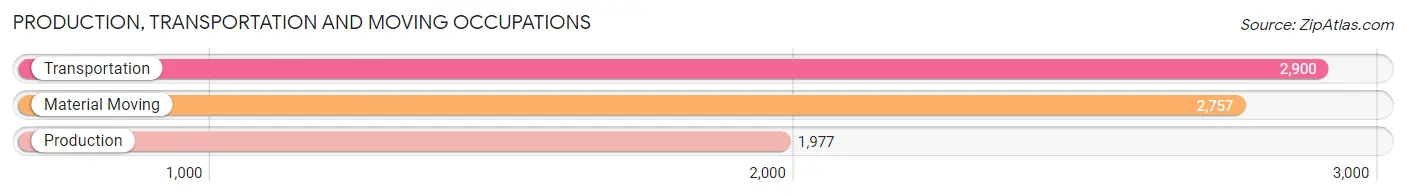
Production, Transportation and Moving Occupations
The most common Production, Transportation and Moving occupations in Charlotte County are Transportation (2,900 | 4.3%), Material Moving (2,757 | 4.1%), and Production (1,977 | 2.9%).
Production, Transportation and Moving Occupations by Sex
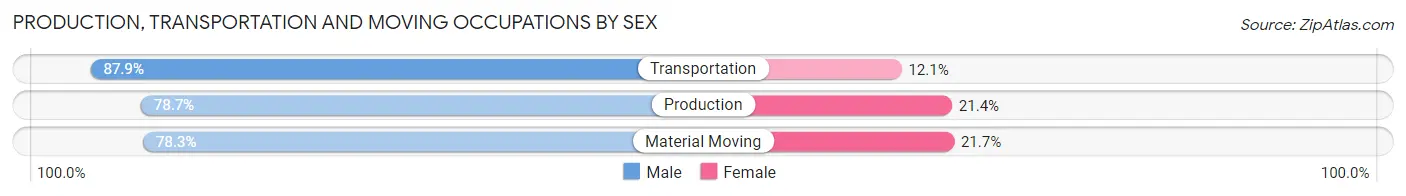
| Occupation | Male | Female |
| Production | 1,555 (78.6%) | 422 (21.3%) |
| Transportation | 2,549 (87.9%) | 351 (12.1%) |
| Material Moving | 2,158 (78.3%) | 599 (21.7%) |
| Total (Category) | 6,262 (82.0%) | 1,372 (18.0%) |
| Total (Overall) | 34,648 (51.0%) | 33,346 (49.0%) |
Employment Industries by Sex in Charlotte County
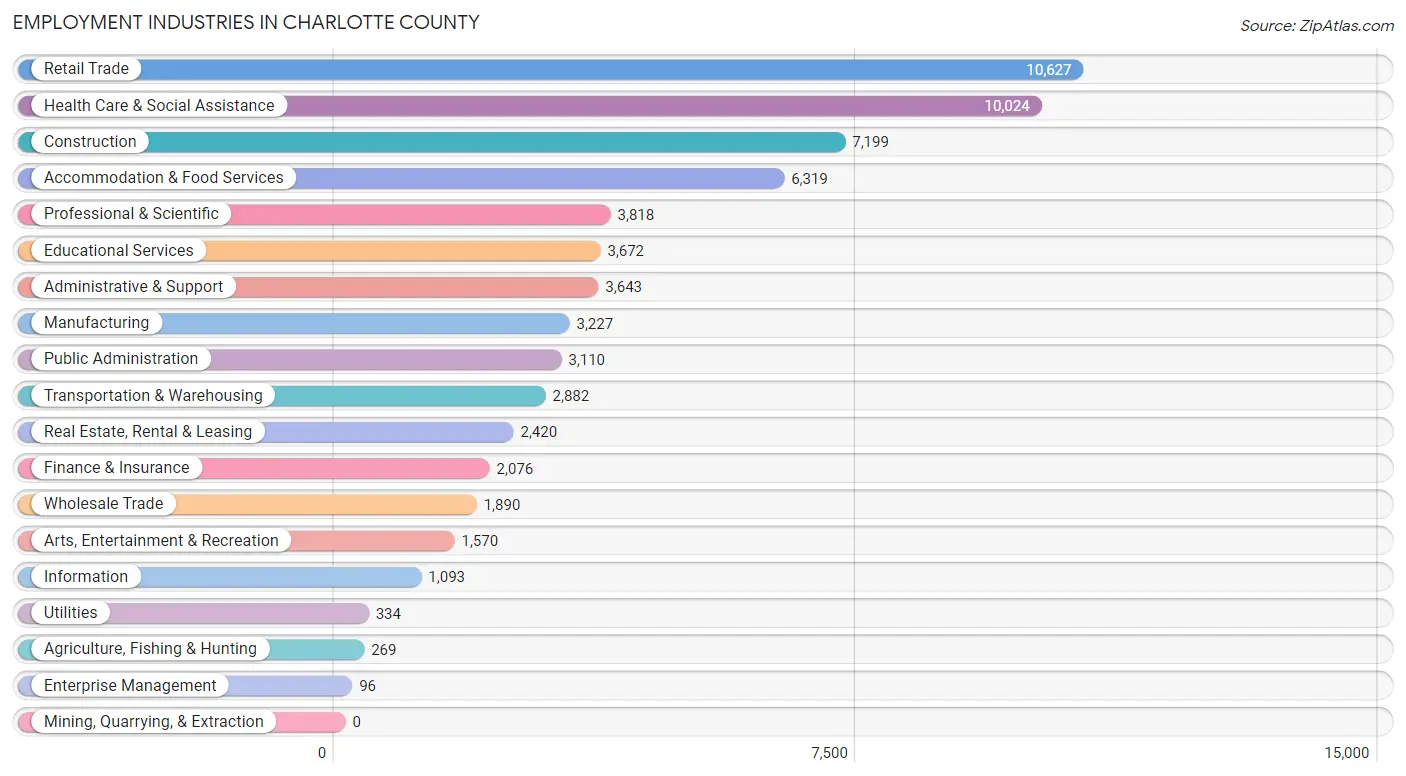
Employment Industries in Charlotte County
The major employment industries in Charlotte County include Retail Trade (10,627 | 15.6%), Health Care & Social Assistance (10,024 | 14.7%), Construction (7,199 | 10.6%), Accommodation & Food Services (6,319 | 9.3%), and Professional & Scientific (3,818 | 5.6%).
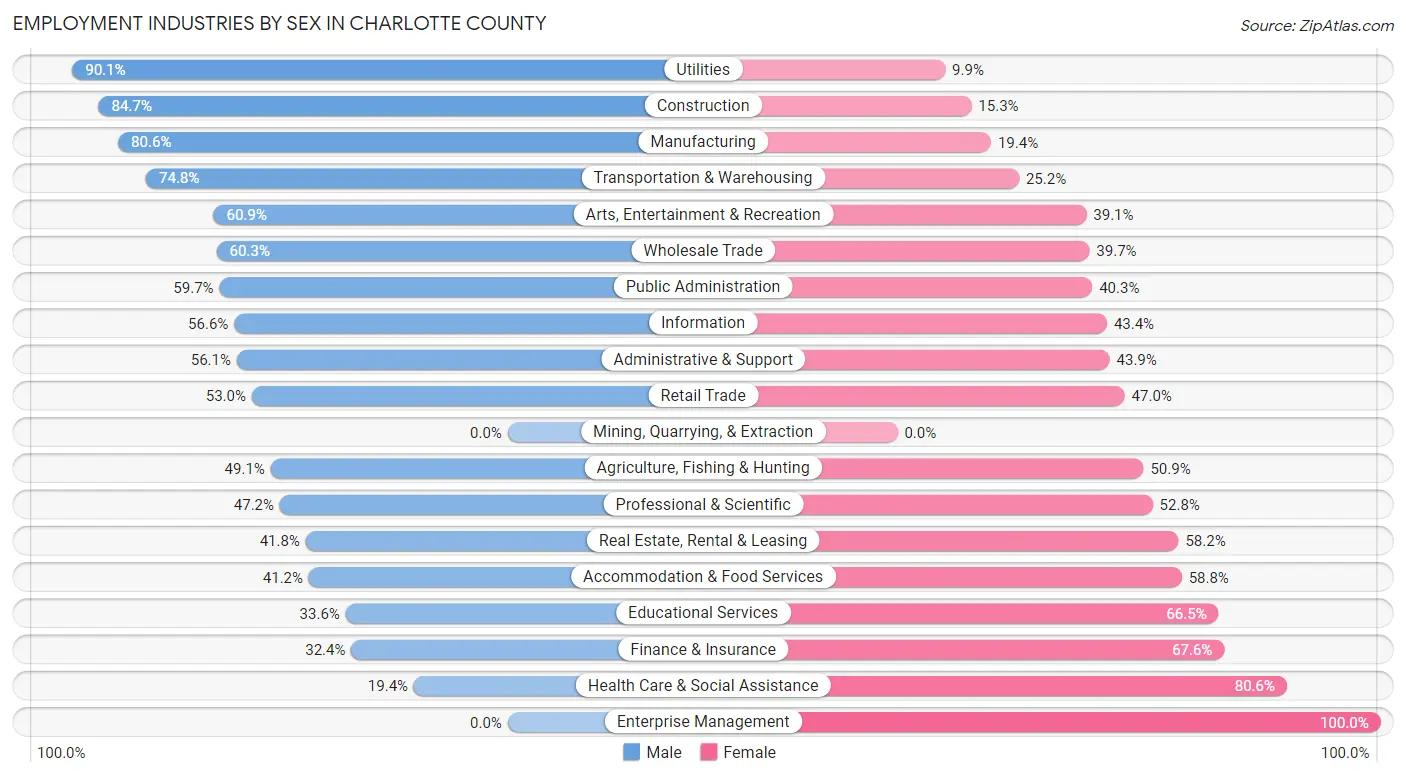
Employment Industries by Sex in Charlotte County
The Charlotte County industries that see more men than women are Utilities (90.1%), Construction (84.7%), and Manufacturing (80.6%), whereas the industries that tend to have a higher number of women are Enterprise Management (100.0%), Health Care & Social Assistance (80.6%), and Finance & Insurance (67.6%).
| Industry | Male | Female |
| Agriculture, Fishing & Hunting | 132 (49.1%) | 137 (50.9%) |
| Mining, Quarrying, & Extraction | 0 (0.0%) | 0 (0.0%) |
| Construction | 6,097 (84.7%) | 1,102 (15.3%) |
| Manufacturing | 2,602 (80.6%) | 625 (19.4%) |
| Wholesale Trade | 1,139 (60.3%) | 751 (39.7%) |
| Retail Trade | 5,629 (53.0%) | 4,998 (47.0%) |
| Transportation & Warehousing | 2,157 (74.8%) | 725 (25.2%) |
| Utilities | 301 (90.1%) | 33 (9.9%) |
| Information | 619 (56.6%) | 474 (43.4%) |
| Finance & Insurance | 672 (32.4%) | 1,404 (67.6%) |
| Real Estate, Rental & Leasing | 1,012 (41.8%) | 1,408 (58.2%) |
| Professional & Scientific | 1,801 (47.2%) | 2,017 (52.8%) |
| Enterprise Management | 0 (0.0%) | 96 (100.0%) |
| Administrative & Support | 2,043 (56.1%) | 1,600 (43.9%) |
| Educational Services | 1,232 (33.6%) | 2,440 (66.4%) |
| Health Care & Social Assistance | 1,947 (19.4%) | 8,077 (80.6%) |
| Arts, Entertainment & Recreation | 956 (60.9%) | 614 (39.1%) |
| Accommodation & Food Services | 2,601 (41.2%) | 3,718 (58.8%) |
| Public Administration | 1,856 (59.7%) | 1,254 (40.3%) |
| Total | 34,648 (51.0%) | 33,346 (49.0%) |
Education in Charlotte County
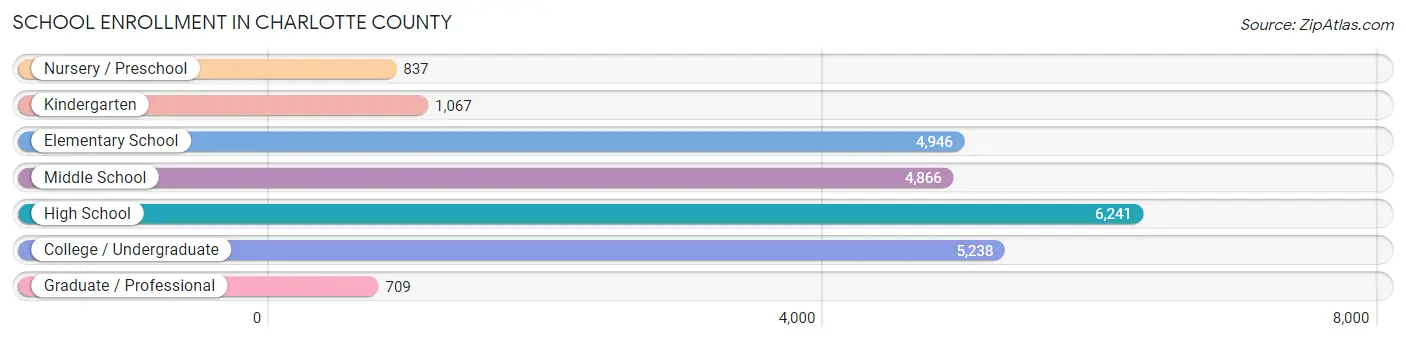
School Enrollment in Charlotte County
The most common levels of schooling among the 23,904 students in Charlotte County are high school (6,241 | 26.1%), college / undergraduate (5,238 | 21.9%), and elementary school (4,946 | 20.7%).
| School Level | # Students | % Students |
| Nursery / Preschool | 837 | 3.5% |
| Kindergarten | 1,067 | 4.5% |
| Elementary School | 4,946 | 20.7% |
| Middle School | 4,866 | 20.4% |
| High School | 6,241 | 26.1% |
| College / Undergraduate | 5,238 | 21.9% |
| Graduate / Professional | 709 | 3.0% |
| Total | 23,904 | 100.0% |
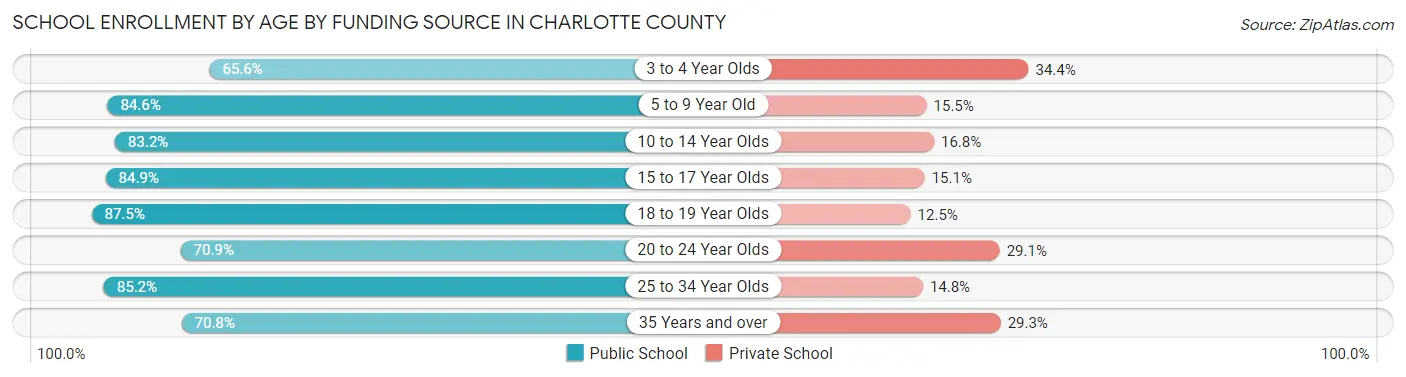
School Enrollment by Age by Funding Source in Charlotte County
Out of a total of 23,904 students who are enrolled in schools in Charlotte County, 4,398 (18.4%) attend a private institution, while the remaining 19,506 (81.6%) are enrolled in public schools. The age group of 3 to 4 year olds has the highest likelihood of being enrolled in private schools, with 208 (34.4% in the age bracket) enrolled. Conversely, the age group of 18 to 19 year olds has the lowest likelihood of being enrolled in a private school, with 1,403 (87.5% in the age bracket) attending a public institution.
| Age Bracket | Public School | Private School |
| 3 to 4 Year Olds | 396 (65.6%) | 208 (34.4%) |
| 5 to 9 Year Old | 4,679 (84.6%) | 855 (15.4%) |
| 10 to 14 Year Olds | 5,184 (83.2%) | 1,049 (16.8%) |
| 15 to 17 Year Olds | 3,525 (84.9%) | 627 (15.1%) |
| 18 to 19 Year Olds | 1,403 (87.5%) | 200 (12.5%) |
| 20 to 24 Year Olds | 1,815 (70.9%) | 744 (29.1%) |
| 25 to 34 Year Olds | 1,298 (85.2%) | 225 (14.8%) |
| 35 Years and over | 1,200 (70.8%) | 496 (29.2%) |
| Total | 19,506 (81.6%) | 4,398 (18.4%) |
Educational Attainment by Field of Study in Charlotte County
Business (9,741 | 22.9%), education (7,438 | 17.5%), science & technology (4,911 | 11.5%), engineering (3,443 | 8.1%), and arts & humanities (2,575 | 6.0%) are the most common fields of study among 42,603 individuals in Charlotte County who have obtained a bachelor's degree or higher.
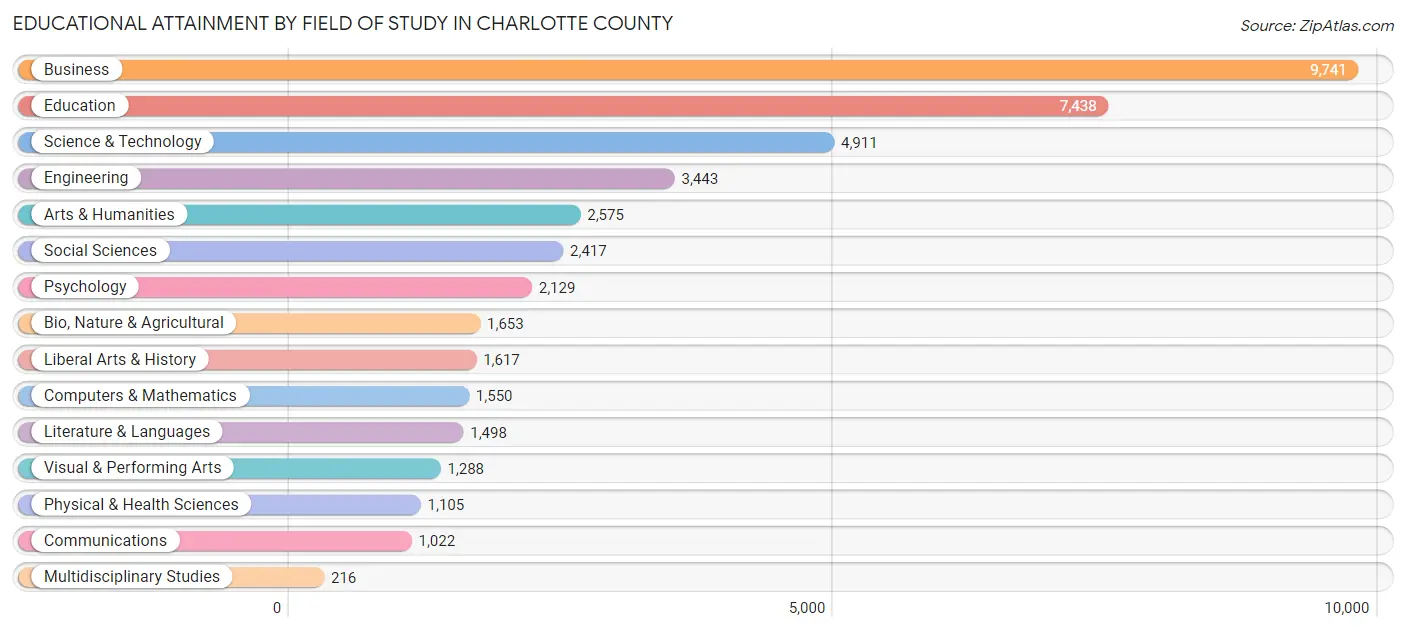
| Field of Study | # Graduates | % Graduates |
| Computers & Mathematics | 1,550 | 3.6% |
| Bio, Nature & Agricultural | 1,653 | 3.9% |
| Physical & Health Sciences | 1,105 | 2.6% |
| Psychology | 2,129 | 5.0% |
| Social Sciences | 2,417 | 5.7% |
| Engineering | 3,443 | 8.1% |
| Multidisciplinary Studies | 216 | 0.5% |
| Science & Technology | 4,911 | 11.5% |
| Business | 9,741 | 22.9% |
| Education | 7,438 | 17.5% |
| Literature & Languages | 1,498 | 3.5% |
| Liberal Arts & History | 1,617 | 3.8% |
| Visual & Performing Arts | 1,288 | 3.0% |
| Communications | 1,022 | 2.4% |
| Arts & Humanities | 2,575 | 6.0% |
| Total | 42,603 | 100.0% |
Transportation & Commute in Charlotte County
Vehicle Availability by Sex in Charlotte County
The most prevalent vehicle ownership categories in Charlotte County are males with 2 vehicles (15,966, accounting for 47.2%) and females with 2 vehicles (14,325, making up 49.2%).
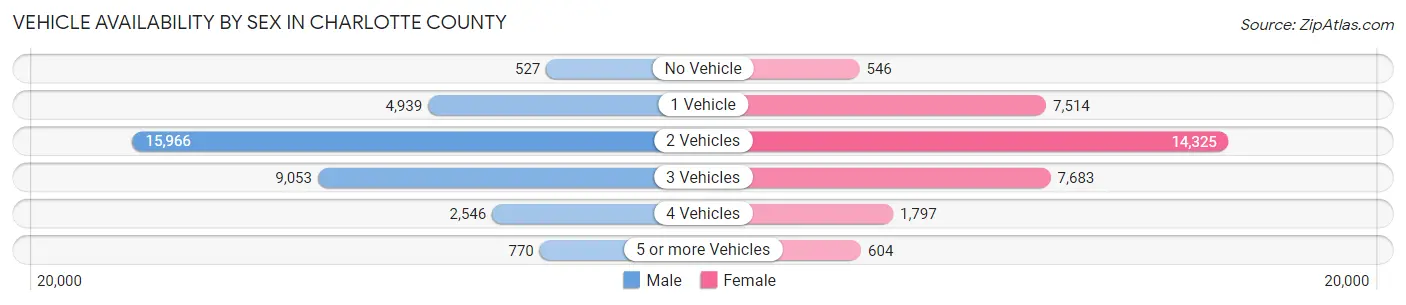
| Vehicles Available | Male | Female |
| No Vehicle | 527 (1.6%) | 546 (1.7%) |
| 1 Vehicle | 4,939 (14.6%) | 7,514 (23.1%) |
| 2 Vehicles | 15,966 (47.2%) | 14,325 (44.1%) |
| 3 Vehicles | 9,053 (26.8%) | 7,683 (23.7%) |
| 4 Vehicles | 2,546 (7.5%) | 1,797 (5.5%) |
| 5 or more Vehicles | 770 (2.3%) | 604 (1.9%) |
| Total | 33,801 (100.0%) | 32,469 (100.0%) |
Commute Time in Charlotte County
The most frequently occuring commute durations in Charlotte County are 15 to 19 minutes (11,362 commuters, 19.9%), 10 to 14 minutes (9,086 commuters, 15.9%), and 20 to 24 minutes (8,363 commuters, 14.6%).
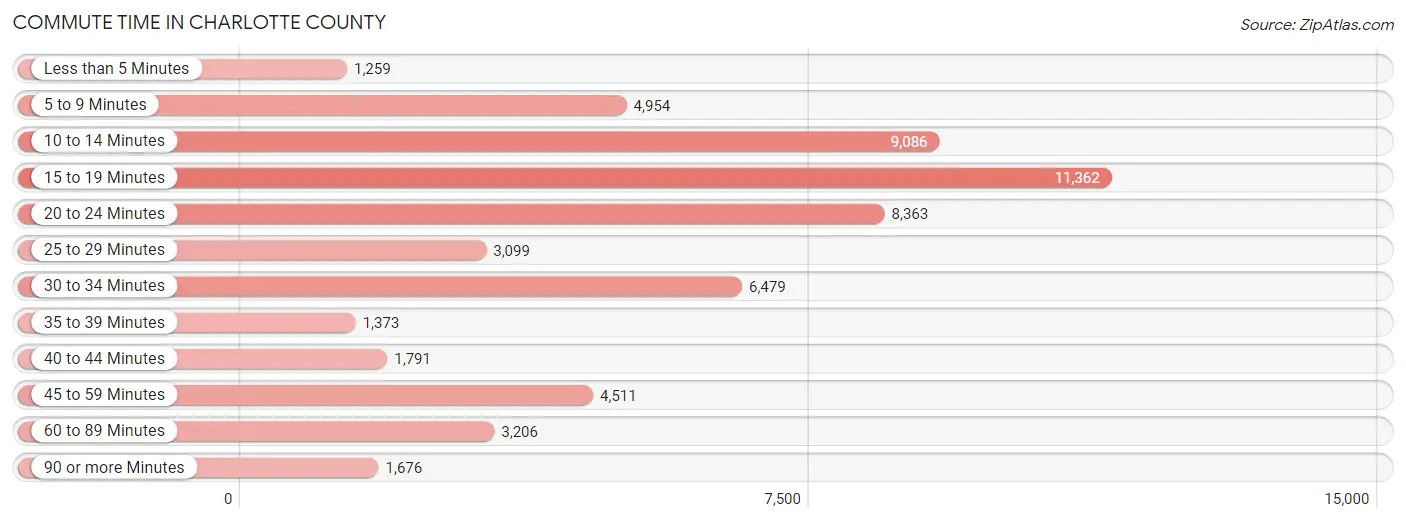
| Commute Time | # Commuters | % Commuters |
| Less than 5 Minutes | 1,259 | 2.2% |
| 5 to 9 Minutes | 4,954 | 8.7% |
| 10 to 14 Minutes | 9,086 | 15.9% |
| 15 to 19 Minutes | 11,362 | 19.9% |
| 20 to 24 Minutes | 8,363 | 14.6% |
| 25 to 29 Minutes | 3,099 | 5.4% |
| 30 to 34 Minutes | 6,479 | 11.3% |
| 35 to 39 Minutes | 1,373 | 2.4% |
| 40 to 44 Minutes | 1,791 | 3.1% |
| 45 to 59 Minutes | 4,511 | 7.9% |
| 60 to 89 Minutes | 3,206 | 5.6% |
| 90 or more Minutes | 1,676 | 2.9% |
Commute Time by Sex in Charlotte County
The most common commute times in Charlotte County are 15 to 19 minutes (5,116 commuters, 17.6%) for males and 15 to 19 minutes (6,246 commuters, 22.3%) for females.
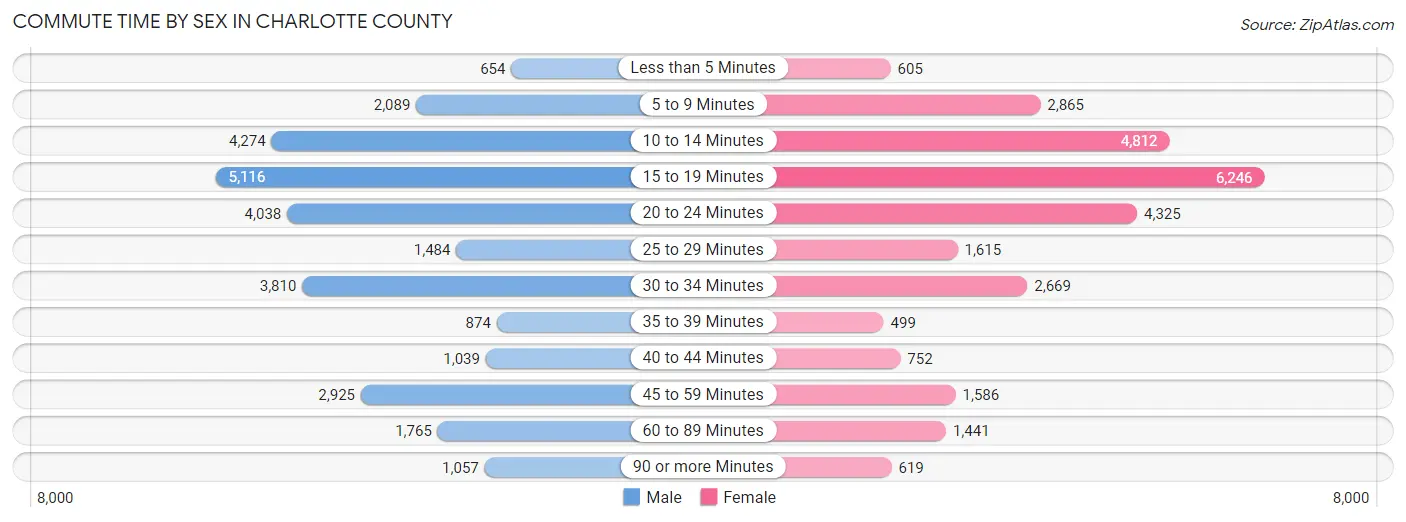
| Commute Time | Male | Female |
| Less than 5 Minutes | 654 (2.2%) | 605 (2.2%) |
| 5 to 9 Minutes | 2,089 (7.2%) | 2,865 (10.2%) |
| 10 to 14 Minutes | 4,274 (14.7%) | 4,812 (17.2%) |
| 15 to 19 Minutes | 5,116 (17.6%) | 6,246 (22.3%) |
| 20 to 24 Minutes | 4,038 (13.9%) | 4,325 (15.4%) |
| 25 to 29 Minutes | 1,484 (5.1%) | 1,615 (5.8%) |
| 30 to 34 Minutes | 3,810 (13.1%) | 2,669 (9.5%) |
| 35 to 39 Minutes | 874 (3.0%) | 499 (1.8%) |
| 40 to 44 Minutes | 1,039 (3.6%) | 752 (2.7%) |
| 45 to 59 Minutes | 2,925 (10.0%) | 1,586 (5.7%) |
| 60 to 89 Minutes | 1,765 (6.1%) | 1,441 (5.1%) |
| 90 or more Minutes | 1,057 (3.6%) | 619 (2.2%) |
Time of Departure to Work by Sex in Charlotte County
The most frequent times of departure to work in Charlotte County are 7:00 AM to 7:29 AM (4,399, 15.1%) for males and 7:30 AM to 7:59 AM (4,046, 14.4%) for females.
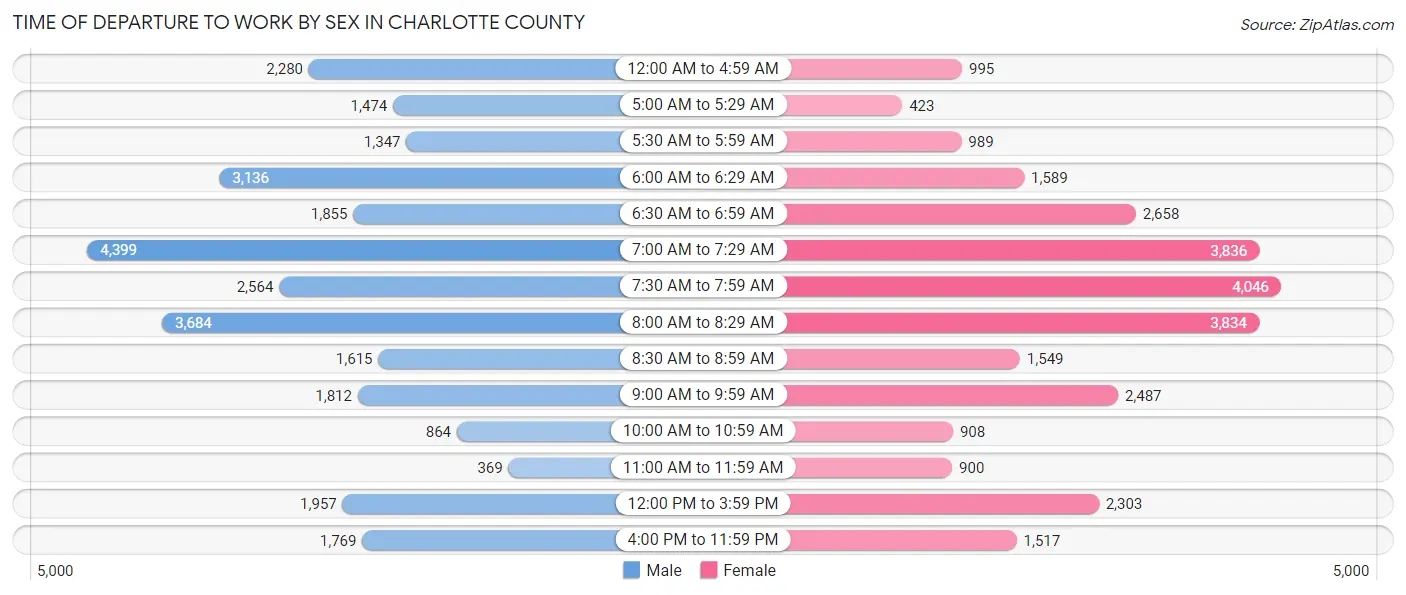
| Time of Departure | Male | Female |
| 12:00 AM to 4:59 AM | 2,280 (7.8%) | 995 (3.5%) |
| 5:00 AM to 5:29 AM | 1,474 (5.1%) | 423 (1.5%) |
| 5:30 AM to 5:59 AM | 1,347 (4.6%) | 989 (3.5%) |
| 6:00 AM to 6:29 AM | 3,136 (10.8%) | 1,589 (5.7%) |
| 6:30 AM to 6:59 AM | 1,855 (6.4%) | 2,658 (9.5%) |
| 7:00 AM to 7:29 AM | 4,399 (15.1%) | 3,836 (13.7%) |
| 7:30 AM to 7:59 AM | 2,564 (8.8%) | 4,046 (14.4%) |
| 8:00 AM to 8:29 AM | 3,684 (12.7%) | 3,834 (13.7%) |
| 8:30 AM to 8:59 AM | 1,615 (5.6%) | 1,549 (5.5%) |
| 9:00 AM to 9:59 AM | 1,812 (6.2%) | 2,487 (8.9%) |
| 10:00 AM to 10:59 AM | 864 (3.0%) | 908 (3.2%) |
| 11:00 AM to 11:59 AM | 369 (1.3%) | 900 (3.2%) |
| 12:00 PM to 3:59 PM | 1,957 (6.7%) | 2,303 (8.2%) |
| 4:00 PM to 11:59 PM | 1,769 (6.1%) | 1,517 (5.4%) |
| Total | 29,125 (100.0%) | 28,034 (100.0%) |
Housing Occupancy in Charlotte County
Occupancy by Ownership in Charlotte County
Of the total 84,671 dwellings in Charlotte County, owner-occupied units account for 69,787 (82.4%), while renter-occupied units make up 14,884 (17.6%).
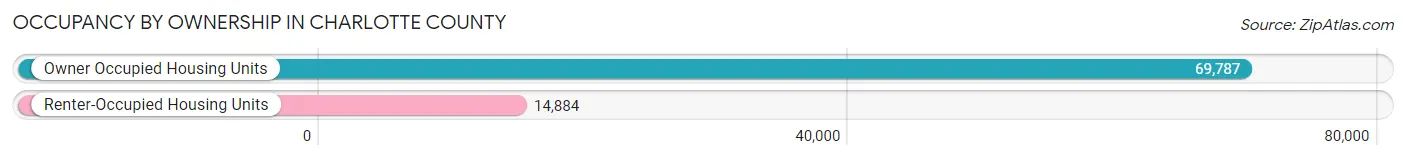
| Occupancy | # Housing Units | % Housing Units |
| Owner Occupied Housing Units | 69,787 | 82.4% |
| Renter-Occupied Housing Units | 14,884 | 17.6% |
| Total Occupied Housing Units | 84,671 | 100.0% |
Occupancy by Household Size in Charlotte County
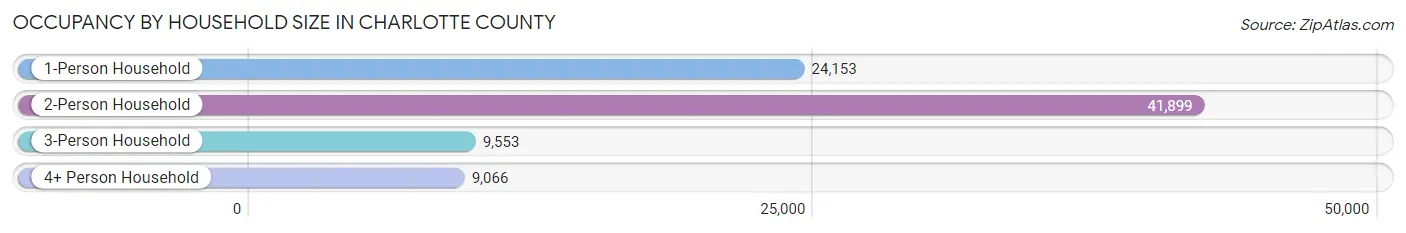
| Household Size | # Housing Units | % Housing Units |
| 1-Person Household | 24,153 | 28.5% |
| 2-Person Household | 41,899 | 49.5% |
| 3-Person Household | 9,553 | 11.3% |
| 4+ Person Household | 9,066 | 10.7% |
| Total Housing Units | 84,671 | 100.0% |
Occupancy by Ownership by Household Size in Charlotte County
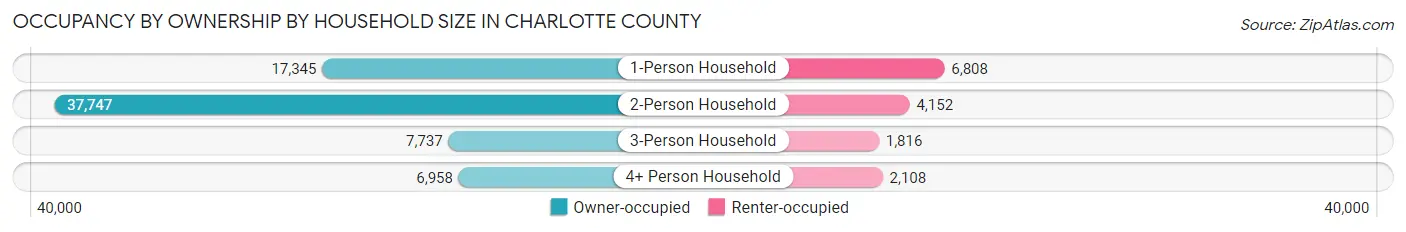
| Household Size | Owner-occupied | Renter-occupied |
| 1-Person Household | 17,345 (71.8%) | 6,808 (28.2%) |
| 2-Person Household | 37,747 (90.1%) | 4,152 (9.9%) |
| 3-Person Household | 7,737 (81.0%) | 1,816 (19.0%) |
| 4+ Person Household | 6,958 (76.7%) | 2,108 (23.3%) |
| Total Housing Units | 69,787 (82.4%) | 14,884 (17.6%) |
Occupancy by Educational Attainment in Charlotte County
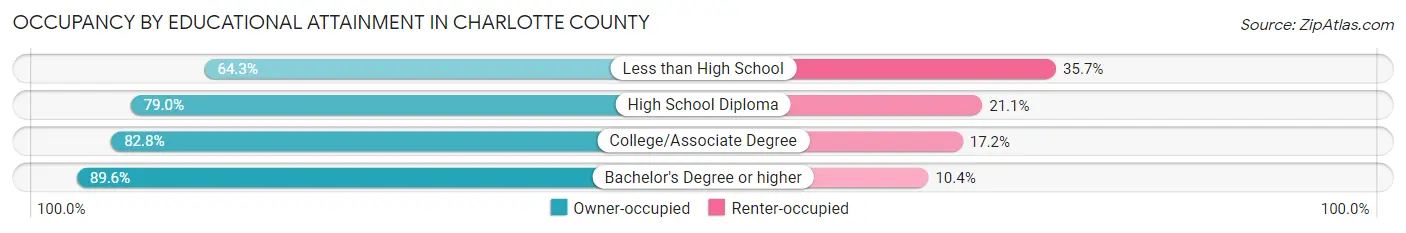
| Household Size | Owner-occupied | Renter-occupied |
| Less than High School | 3,428 (64.3%) | 1,902 (35.7%) |
| High School Diploma | 19,932 (78.9%) | 5,315 (21.0%) |
| College/Associate Degree | 25,013 (82.8%) | 5,190 (17.2%) |
| Bachelor's Degree or higher | 21,414 (89.6%) | 2,477 (10.4%) |
Occupancy by Age of Householder in Charlotte County
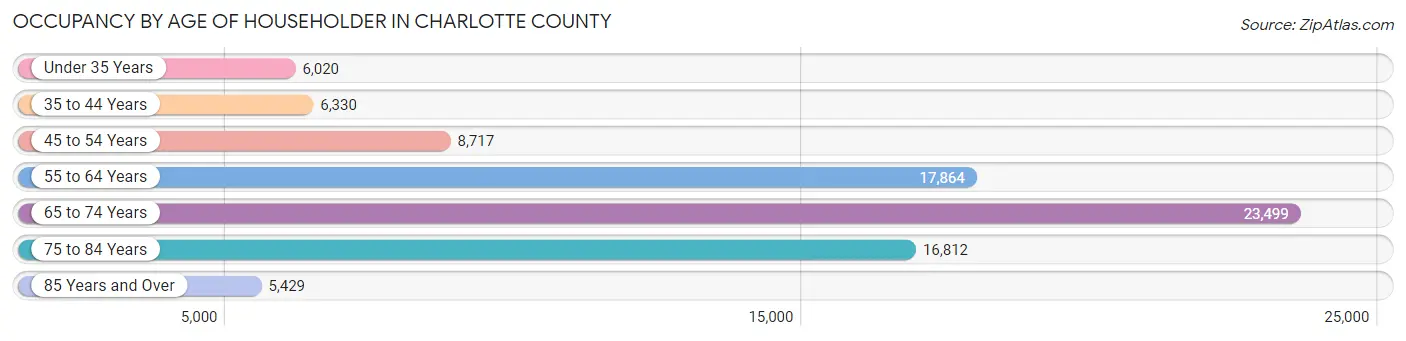
| Age Bracket | # Households | % Households |
| Under 35 Years | 6,020 | 7.1% |
| 35 to 44 Years | 6,330 | 7.5% |
| 45 to 54 Years | 8,717 | 10.3% |
| 55 to 64 Years | 17,864 | 21.1% |
| 65 to 74 Years | 23,499 | 27.8% |
| 75 to 84 Years | 16,812 | 19.9% |
| 85 Years and Over | 5,429 | 6.4% |
| Total | 84,671 | 100.0% |
Housing Finances in Charlotte County
Median Income by Occupancy in Charlotte County
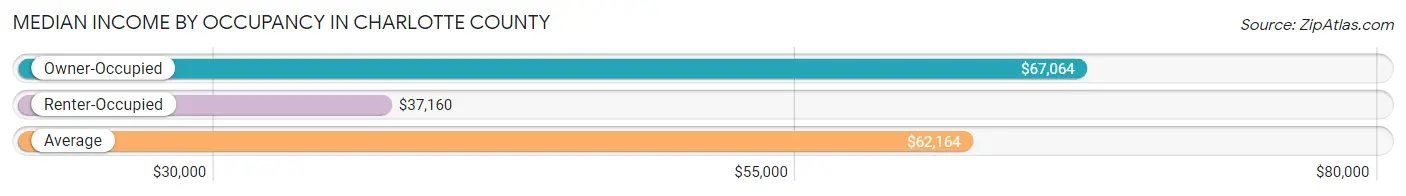
| Occupancy Type | # Households | Median Income |
| Owner-Occupied | 69,787 (82.4%) | $67,064 |
| Renter-Occupied | 14,884 (17.6%) | $37,160 |
| Average | 84,671 (100.0%) | $62,164 |
Occupancy by Householder Income Bracket in Charlotte County
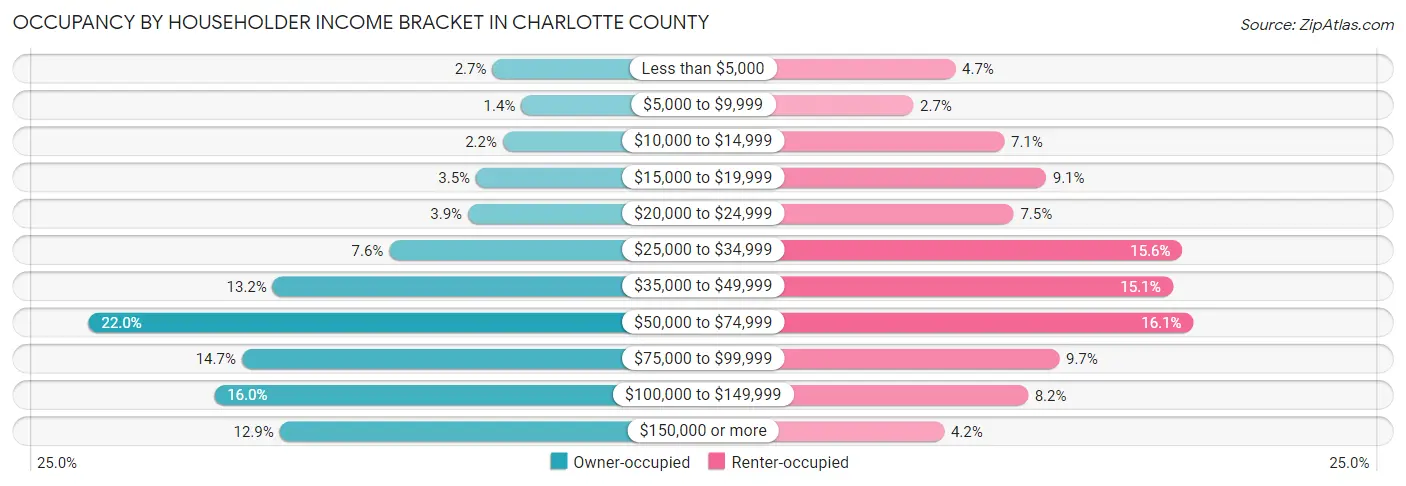
| Income Bracket | Owner-occupied | Renter-occupied |
| Less than $5,000 | 1,903 (2.7%) | 706 (4.7%) |
| $5,000 to $9,999 | 945 (1.3%) | 408 (2.7%) |
| $10,000 to $14,999 | 1,557 (2.2%) | 1,053 (7.1%) |
| $15,000 to $19,999 | 2,451 (3.5%) | 1,349 (9.1%) |
| $20,000 to $24,999 | 2,718 (3.9%) | 1,120 (7.5%) |
| $25,000 to $34,999 | 5,332 (7.6%) | 2,316 (15.6%) |
| $35,000 to $49,999 | 9,206 (13.2%) | 2,246 (15.1%) |
| $50,000 to $74,999 | 15,326 (22.0%) | 2,395 (16.1%) |
| $75,000 to $99,999 | 10,228 (14.7%) | 1,443 (9.7%) |
| $100,000 to $149,999 | 11,148 (16.0%) | 1,221 (8.2%) |
| $150,000 or more | 8,973 (12.9%) | 627 (4.2%) |
| Total | 69,787 (100.0%) | 14,884 (100.0%) |
Monthly Housing Cost Tiers in Charlotte County
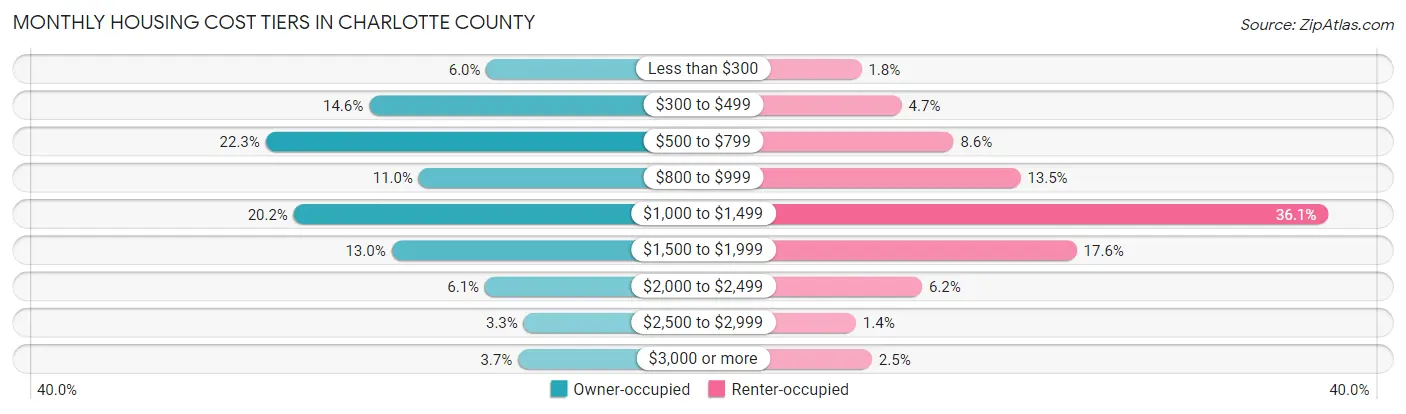
| Monthly Cost | Owner-occupied | Renter-occupied |
| Less than $300 | 4,177 (6.0%) | 263 (1.8%) |
| $300 to $499 | 10,209 (14.6%) | 704 (4.7%) |
| $500 to $799 | 15,525 (22.3%) | 1,272 (8.6%) |
| $800 to $999 | 7,654 (11.0%) | 2,007 (13.5%) |
| $1,000 to $1,499 | 14,085 (20.2%) | 5,379 (36.1%) |
| $1,500 to $1,999 | 9,055 (13.0%) | 2,622 (17.6%) |
| $2,000 to $2,499 | 4,260 (6.1%) | 927 (6.2%) |
| $2,500 to $2,999 | 2,269 (3.3%) | 202 (1.4%) |
| $3,000 or more | 2,553 (3.7%) | 378 (2.5%) |
| Total | 69,787 (100.0%) | 14,884 (100.0%) |
Physical Housing Characteristics in Charlotte County
Housing Structures in Charlotte County
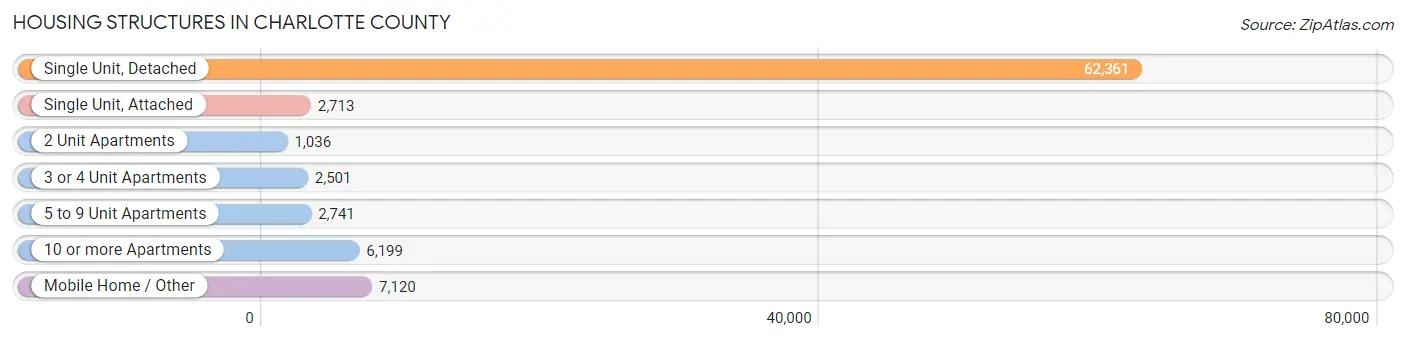
| Structure Type | # Housing Units | % Housing Units |
| Single Unit, Detached | 62,361 | 73.7% |
| Single Unit, Attached | 2,713 | 3.2% |
| 2 Unit Apartments | 1,036 | 1.2% |
| 3 or 4 Unit Apartments | 2,501 | 2.9% |
| 5 to 9 Unit Apartments | 2,741 | 3.2% |
| 10 or more Apartments | 6,199 | 7.3% |
| Mobile Home / Other | 7,120 | 8.4% |
| Total | 84,671 | 100.0% |
Housing Structures by Occupancy in Charlotte County
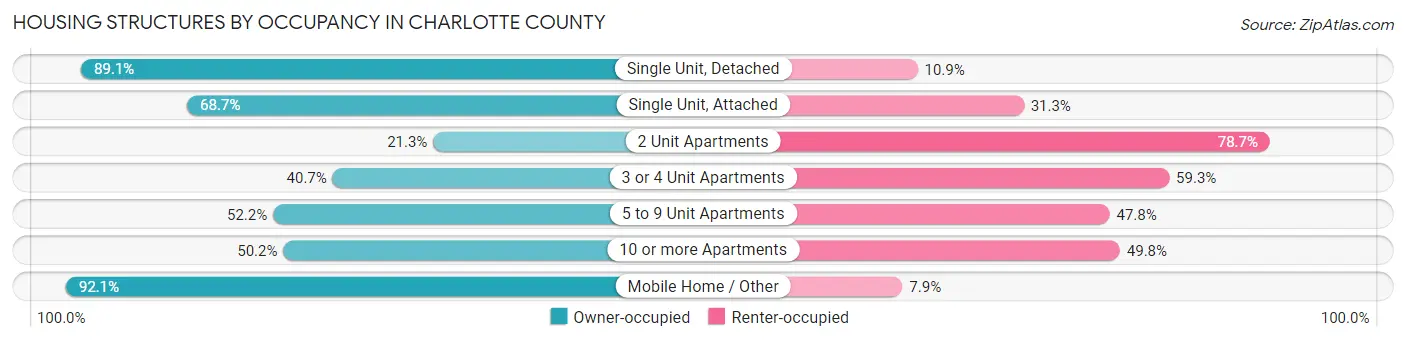
| Structure Type | Owner-occupied | Renter-occupied |
| Single Unit, Detached | 55,588 (89.1%) | 6,773 (10.9%) |
| Single Unit, Attached | 1,864 (68.7%) | 849 (31.3%) |
| 2 Unit Apartments | 221 (21.3%) | 815 (78.7%) |
| 3 or 4 Unit Apartments | 1,018 (40.7%) | 1,483 (59.3%) |
| 5 to 9 Unit Apartments | 1,430 (52.2%) | 1,311 (47.8%) |
| 10 or more Apartments | 3,111 (50.2%) | 3,088 (49.8%) |
| Mobile Home / Other | 6,555 (92.1%) | 565 (7.9%) |
| Total | 69,787 (82.4%) | 14,884 (17.6%) |
Housing Structures by Number of Rooms in Charlotte County
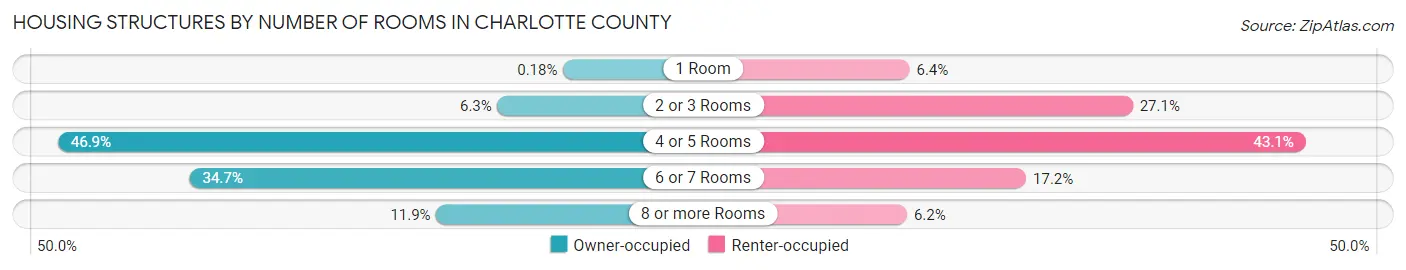
| Number of Rooms | Owner-occupied | Renter-occupied |
| 1 Room | 123 (0.2%) | 958 (6.4%) |
| 2 or 3 Rooms | 4,364 (6.2%) | 4,030 (27.1%) |
| 4 or 5 Rooms | 32,744 (46.9%) | 6,410 (43.1%) |
| 6 or 7 Rooms | 24,243 (34.7%) | 2,563 (17.2%) |
| 8 or more Rooms | 8,313 (11.9%) | 923 (6.2%) |
| Total | 69,787 (100.0%) | 14,884 (100.0%) |
Housing Structure by Heating Type in Charlotte County
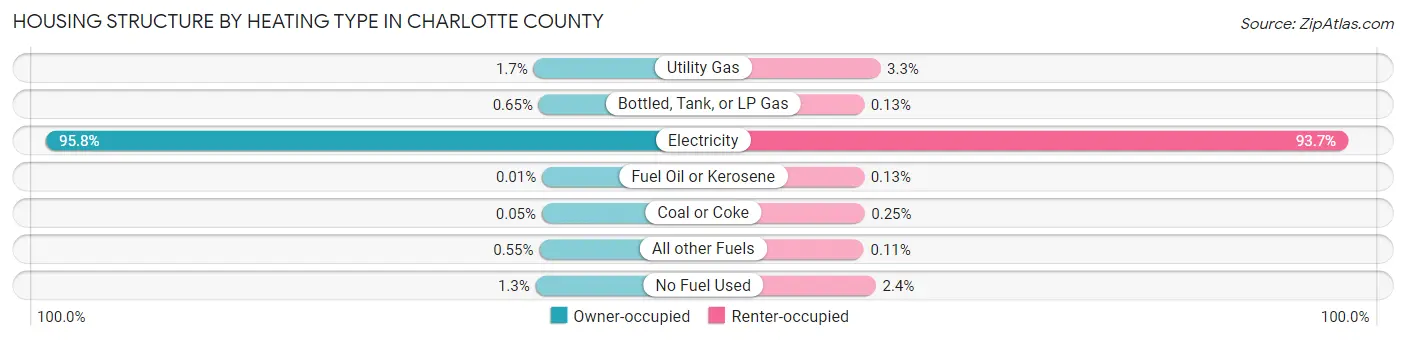
| Heating Type | Owner-occupied | Renter-occupied |
| Utility Gas | 1,151 (1.7%) | 489 (3.3%) |
| Bottled, Tank, or LP Gas | 456 (0.6%) | 19 (0.1%) |
| Electricity | 66,878 (95.8%) | 13,945 (93.7%) |
| Fuel Oil or Kerosene | 6 (0.0%) | 19 (0.1%) |
| Coal or Coke | 33 (0.1%) | 37 (0.3%) |
| All other Fuels | 387 (0.5%) | 16 (0.1%) |
| No Fuel Used | 876 (1.3%) | 359 (2.4%) |
| Total | 69,787 (100.0%) | 14,884 (100.0%) |
Household Vehicle Usage in Charlotte County
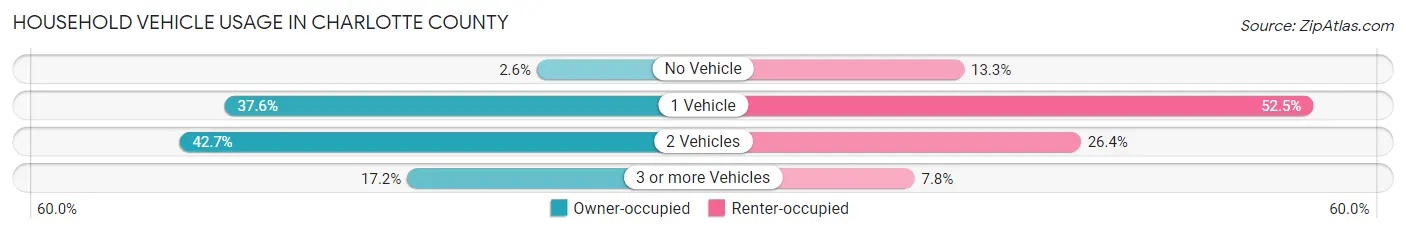
| Vehicles per Household | Owner-occupied | Renter-occupied |
| No Vehicle | 1,826 (2.6%) | 1,986 (13.3%) |
| 1 Vehicle | 26,232 (37.6%) | 7,806 (52.4%) |
| 2 Vehicles | 29,764 (42.6%) | 3,931 (26.4%) |
| 3 or more Vehicles | 11,965 (17.2%) | 1,161 (7.8%) |
| Total | 69,787 (100.0%) | 14,884 (100.0%) |
Real Estate & Mortgages in Charlotte County
Real Estate and Mortgage Overview in Charlotte County
| Characteristic | Without Mortgage | With Mortgage |
| Housing Units | 38,168 | 31,619 |
| Median Property Value | $258,000 | $273,700 |
| Median Household Income | $57,272 | $5,146 |
| Monthly Housing Costs | $591 | $2,391 |
| Real Estate Taxes | $2,289 | $632 |
Property Value by Mortgage Status in Charlotte County
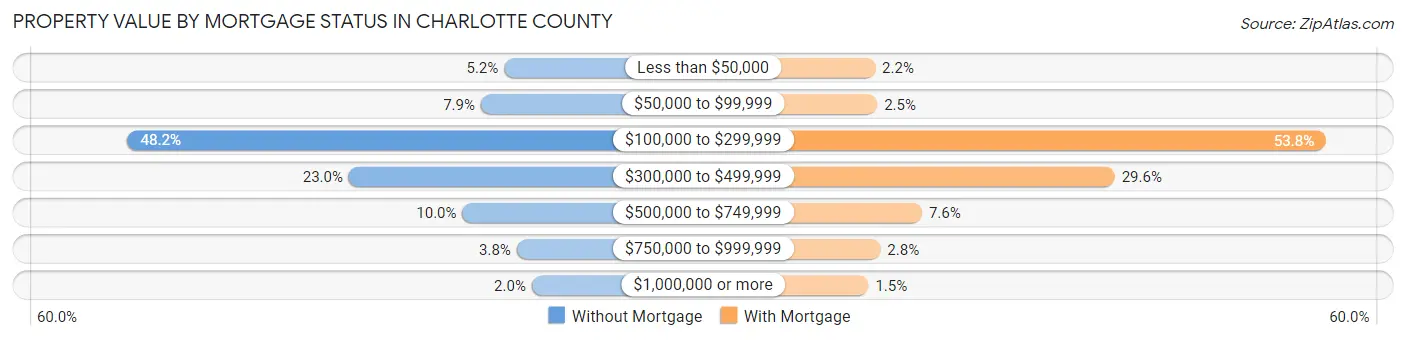
| Property Value | Without Mortgage | With Mortgage |
| Less than $50,000 | 1,985 (5.2%) | 707 (2.2%) |
| $50,000 to $99,999 | 3,001 (7.9%) | 783 (2.5%) |
| $100,000 to $299,999 | 18,403 (48.2%) | 16,997 (53.8%) |
| $300,000 to $499,999 | 8,761 (23.0%) | 9,365 (29.6%) |
| $500,000 to $749,999 | 3,804 (10.0%) | 2,401 (7.6%) |
| $750,000 to $999,999 | 1,436 (3.8%) | 898 (2.8%) |
| $1,000,000 or more | 778 (2.0%) | 468 (1.5%) |
| Total | 38,168 (100.0%) | 31,619 (100.0%) |
Household Income by Mortgage Status in Charlotte County
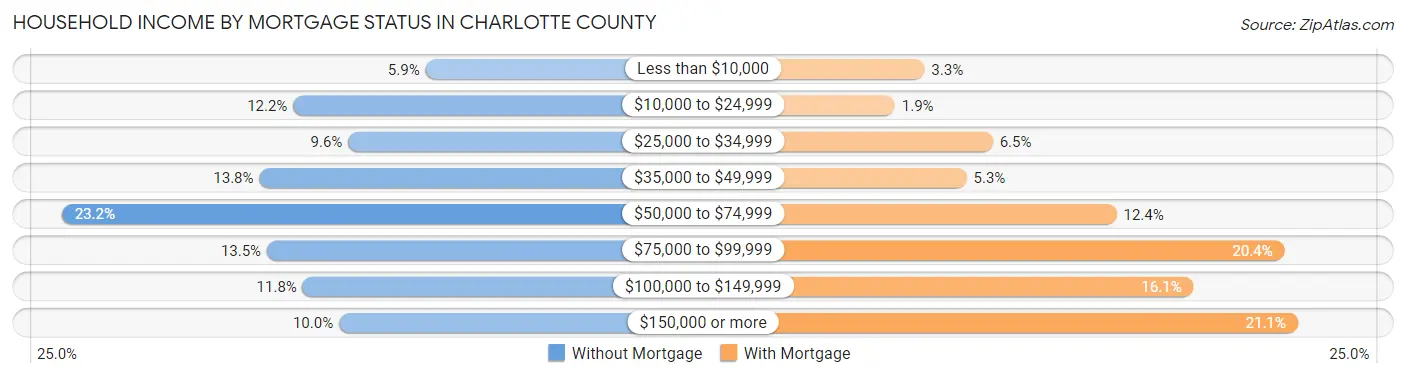
| Household Income | Without Mortgage | With Mortgage |
| Less than $10,000 | 2,257 (5.9%) | 1,038 (3.3%) |
| $10,000 to $24,999 | 4,660 (12.2%) | 591 (1.9%) |
| $25,000 to $34,999 | 3,659 (9.6%) | 2,066 (6.5%) |
| $35,000 to $49,999 | 5,275 (13.8%) | 1,673 (5.3%) |
| $50,000 to $74,999 | 8,866 (23.2%) | 3,931 (12.4%) |
| $75,000 to $99,999 | 5,136 (13.5%) | 6,460 (20.4%) |
| $100,000 to $149,999 | 4,488 (11.8%) | 5,092 (16.1%) |
| $150,000 or more | 3,827 (10.0%) | 6,660 (21.1%) |
| Total | 38,168 (100.0%) | 31,619 (100.0%) |
Property Value to Household Income Ratio in Charlotte County
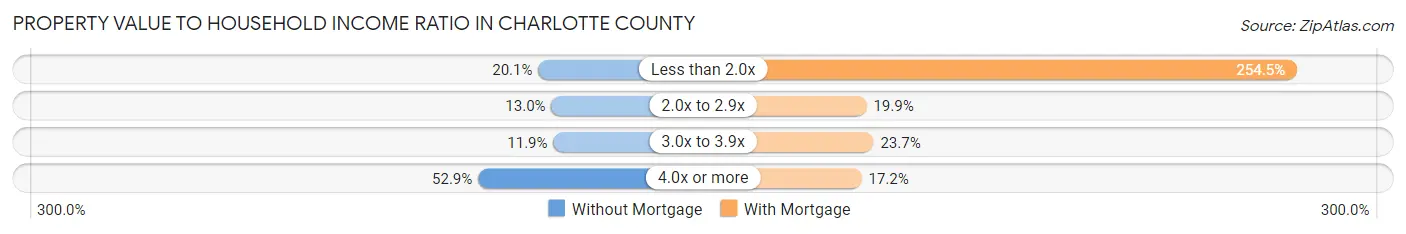
| Value-to-Income Ratio | Without Mortgage | With Mortgage |
| Less than 2.0x | 7,684 (20.1%) | 80,473 (254.5%) |
| 2.0x to 2.9x | 4,959 (13.0%) | 6,296 (19.9%) |
| 3.0x to 3.9x | 4,549 (11.9%) | 7,504 (23.7%) |
| 4.0x or more | 20,189 (52.9%) | 5,446 (17.2%) |
| Total | 38,168 (100.0%) | 31,619 (100.0%) |
Real Estate Taxes by Mortgage Status in Charlotte County
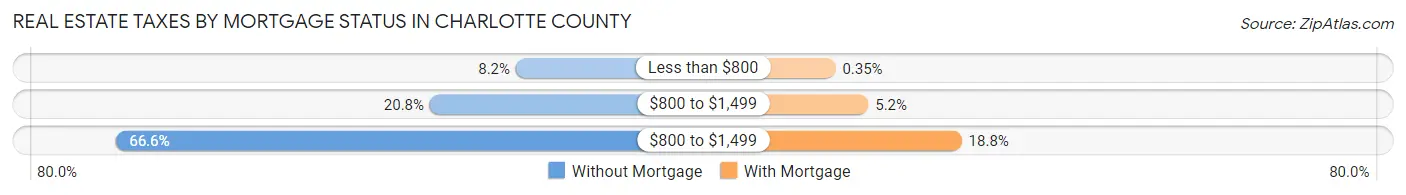
| Property Taxes | Without Mortgage | With Mortgage |
| Less than $800 | 3,139 (8.2%) | 112 (0.4%) |
| $800 to $1,499 | 7,931 (20.8%) | 1,629 (5.1%) |
| $800 to $1,499 | 25,418 (66.6%) | 5,942 (18.8%) |
| Total | 38,168 (100.0%) | 31,619 (100.0%) |
Health & Disability in Charlotte County
Health Insurance Coverage by Age in Charlotte County
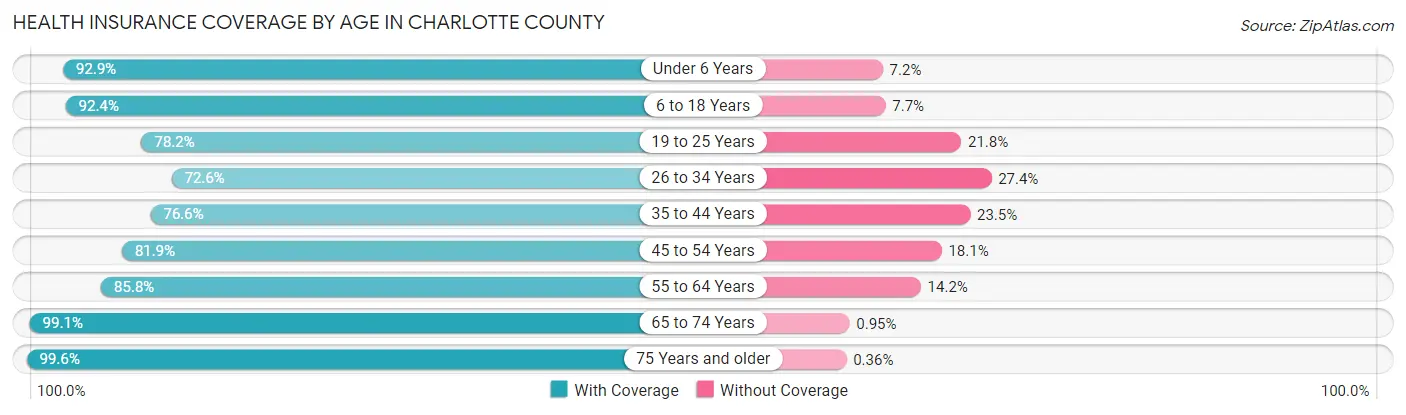
| Age Bracket | With Coverage | Without Coverage |
| Under 6 Years | 6,143 (92.8%) | 473 (7.1%) |
| 6 to 18 Years | 16,240 (92.3%) | 1,346 (7.6%) |
| 19 to 25 Years | 7,098 (78.2%) | 1,976 (21.8%) |
| 26 to 34 Years | 9,189 (72.6%) | 3,466 (27.4%) |
| 35 to 44 Years | 10,785 (76.5%) | 3,303 (23.4%) |
| 45 to 54 Years | 15,214 (81.9%) | 3,366 (18.1%) |
| 55 to 64 Years | 27,965 (85.8%) | 4,644 (14.2%) |
| 65 to 74 Years | 39,974 (99.1%) | 383 (0.9%) |
| 75 Years and older | 34,542 (99.6%) | 125 (0.4%) |
| Total | 167,150 (89.7%) | 19,082 (10.2%) |
Health Insurance Coverage by Citizenship Status in Charlotte County
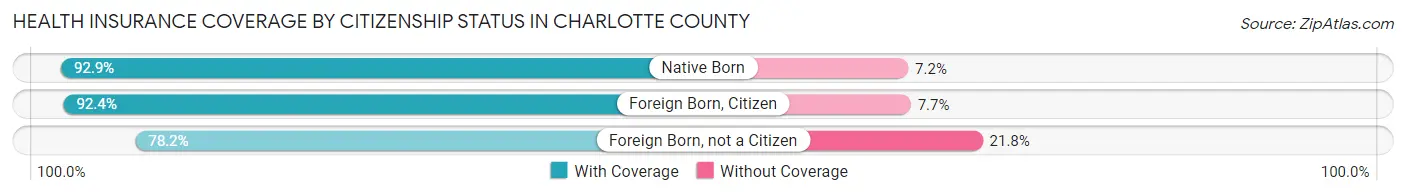
| Citizenship Status | With Coverage | Without Coverage |
| Native Born | 6,143 (92.8%) | 473 (7.1%) |
| Foreign Born, Citizen | 16,240 (92.3%) | 1,346 (7.6%) |
| Foreign Born, not a Citizen | 7,098 (78.2%) | 1,976 (21.8%) |
Health Insurance Coverage by Household Income in Charlotte County
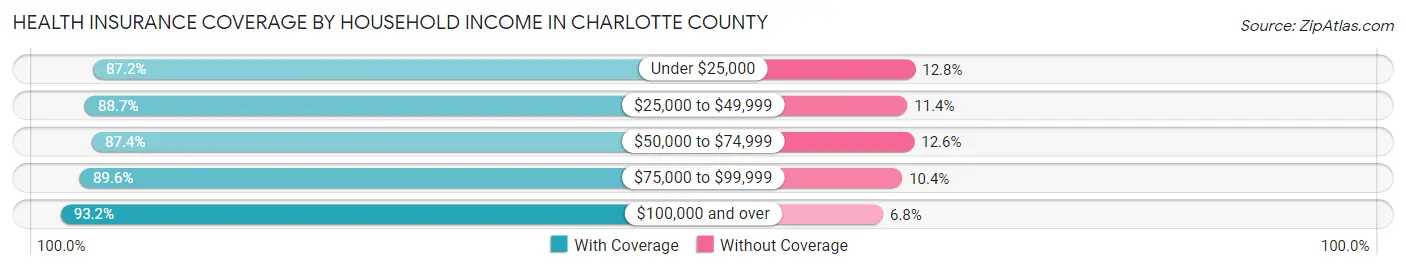
| Household Income | With Coverage | Without Coverage |
| Under $25,000 | 19,339 (87.2%) | 2,847 (12.8%) |
| $25,000 to $49,999 | 31,915 (88.6%) | 4,086 (11.4%) |
| $50,000 to $74,999 | 35,177 (87.4%) | 5,089 (12.6%) |
| $75,000 to $99,999 | 25,259 (89.6%) | 2,926 (10.4%) |
| $100,000 and over | 55,165 (93.2%) | 4,018 (6.8%) |
Public vs Private Health Insurance Coverage by Age in Charlotte County
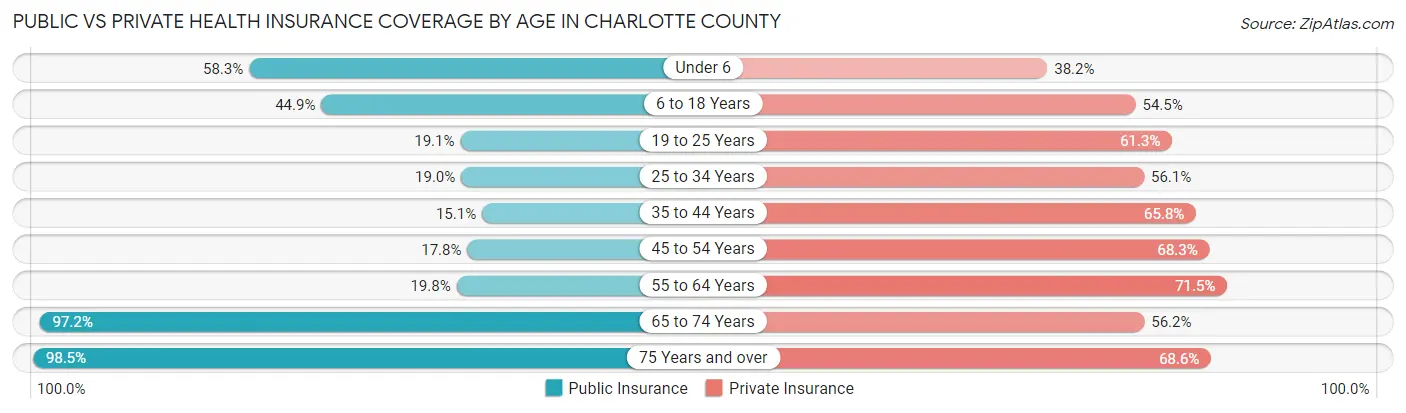
| Age Bracket | Public Insurance | Private Insurance |
| Under 6 | 3,860 (58.3%) | 2,524 (38.2%) |
| 6 to 18 Years | 7,904 (44.9%) | 9,590 (54.5%) |
| 19 to 25 Years | 1,735 (19.1%) | 5,565 (61.3%) |
| 25 to 34 Years | 2,402 (19.0%) | 7,100 (56.1%) |
| 35 to 44 Years | 2,127 (15.1%) | 9,266 (65.8%) |
| 45 to 54 Years | 3,312 (17.8%) | 12,682 (68.3%) |
| 55 to 64 Years | 6,468 (19.8%) | 23,329 (71.5%) |
| 65 to 74 Years | 39,236 (97.2%) | 22,662 (56.1%) |
| 75 Years and over | 34,132 (98.5%) | 23,769 (68.6%) |
| Total | 101,176 (54.3%) | 116,487 (62.5%) |
Disability Status by Sex by Age in Charlotte County
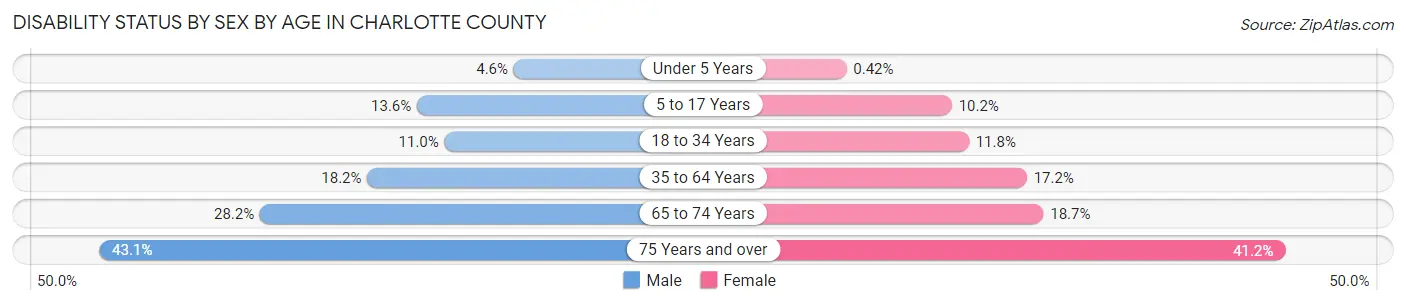
| Age Bracket | Male | Female |
| Under 5 Years | 125 (4.6%) | 11 (0.4%) |
| 5 to 17 Years | 1,207 (13.6%) | 833 (10.2%) |
| 18 to 34 Years | 1,358 (11.0%) | 1,321 (11.8%) |
| 35 to 64 Years | 5,607 (18.2%) | 5,913 (17.2%) |
| 65 to 74 Years | 5,469 (28.1%) | 3,915 (18.7%) |
| 75 Years and over | 7,242 (43.1%) | 7,347 (41.1%) |
Disability Class by Sex by Age in Charlotte County
Disability Class: Hearing Difficulty
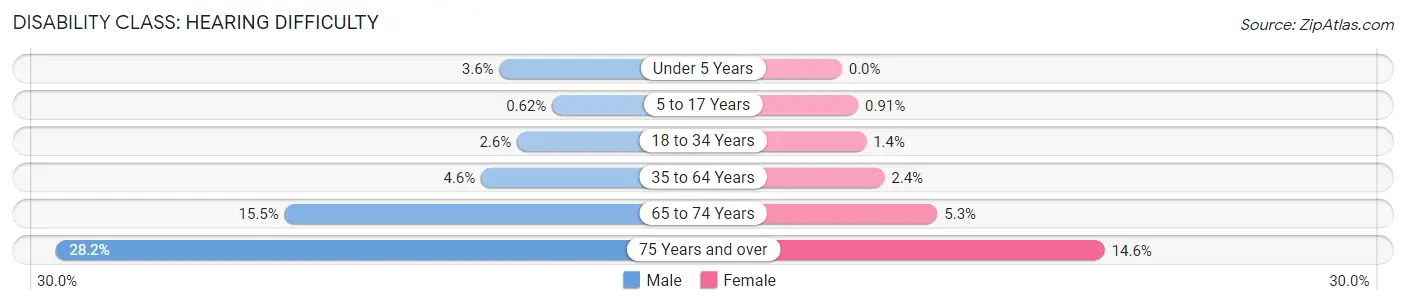
| Age Bracket | Male | Female |
| Under 5 Years | 97 (3.6%) | 0 (0.0%) |
| 5 to 17 Years | 55 (0.6%) | 74 (0.9%) |
| 18 to 34 Years | 318 (2.6%) | 153 (1.4%) |
| 35 to 64 Years | 1,411 (4.6%) | 817 (2.4%) |
| 65 to 74 Years | 3,014 (15.5%) | 1,113 (5.3%) |
| 75 Years and over | 4,745 (28.2%) | 2,615 (14.6%) |
Disability Class: Vision Difficulty
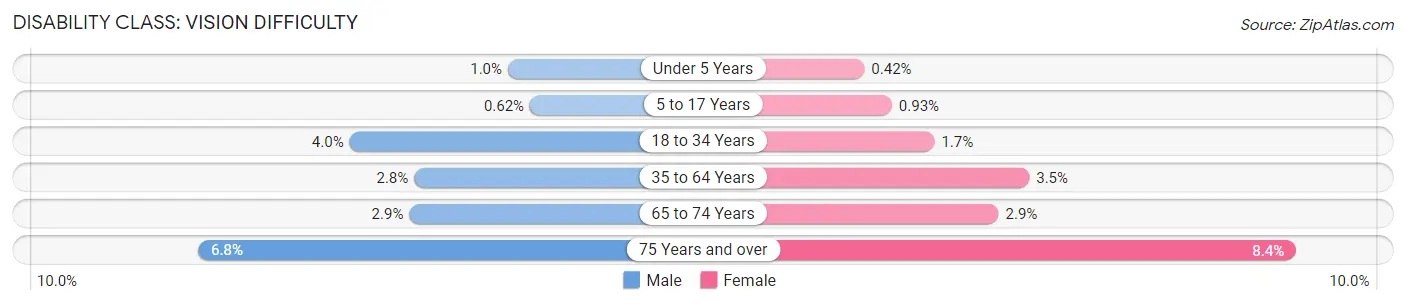
| Age Bracket | Male | Female |
| Under 5 Years | 28 (1.0%) | 11 (0.4%) |
| 5 to 17 Years | 55 (0.6%) | 76 (0.9%) |
| 18 to 34 Years | 489 (4.0%) | 193 (1.7%) |
| 35 to 64 Years | 854 (2.8%) | 1,199 (3.5%) |
| 65 to 74 Years | 555 (2.9%) | 610 (2.9%) |
| 75 Years and over | 1,140 (6.8%) | 1,505 (8.4%) |
Disability Class: Cognitive Difficulty
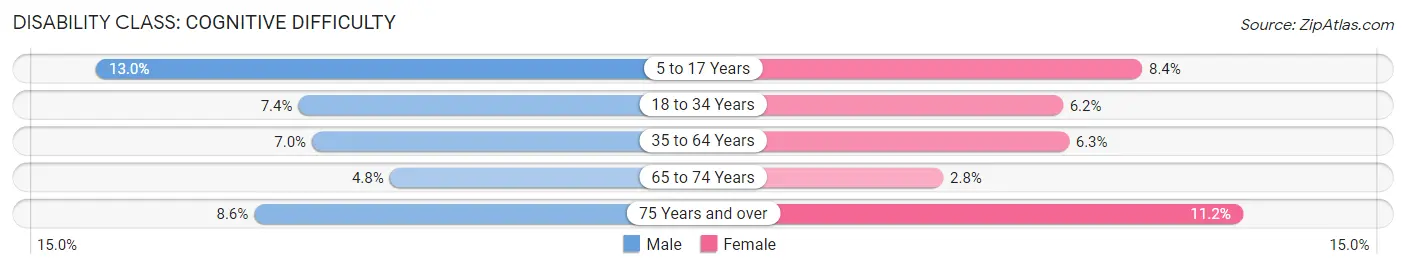
| Age Bracket | Male | Female |
| 5 to 17 Years | 1,157 (13.0%) | 683 (8.4%) |
| 18 to 34 Years | 909 (7.4%) | 690 (6.1%) |
| 35 to 64 Years | 2,159 (7.0%) | 2,179 (6.3%) |
| 65 to 74 Years | 940 (4.8%) | 590 (2.8%) |
| 75 Years and over | 1,448 (8.6%) | 1,992 (11.2%) |
Disability Class: Ambulatory Difficulty
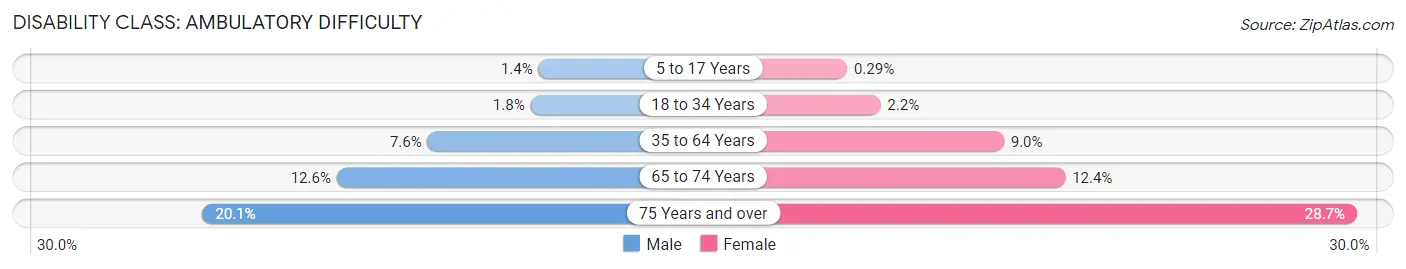
| Age Bracket | Male | Female |
| 5 to 17 Years | 123 (1.4%) | 24 (0.3%) |
| 18 to 34 Years | 225 (1.8%) | 241 (2.1%) |
| 35 to 64 Years | 2,331 (7.6%) | 3,108 (9.0%) |
| 65 to 74 Years | 2,451 (12.6%) | 2,604 (12.4%) |
| 75 Years and over | 3,379 (20.1%) | 5,121 (28.7%) |
Disability Class: Self-Care Difficulty
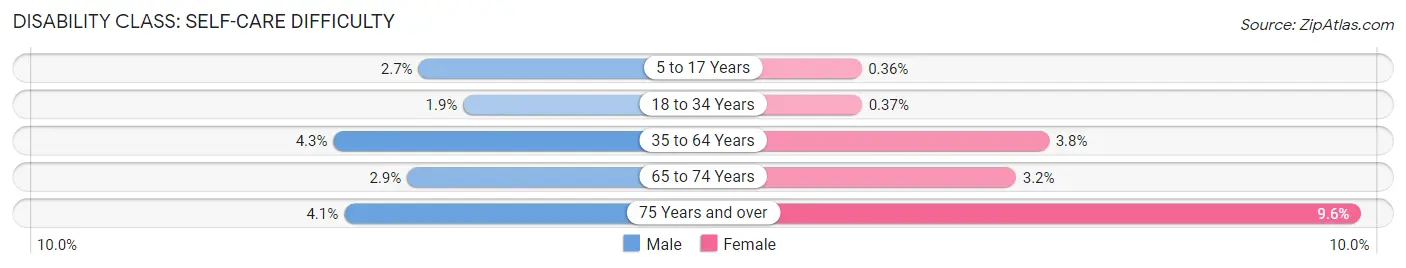
| Age Bracket | Male | Female |
| 5 to 17 Years | 239 (2.7%) | 29 (0.4%) |
| 18 to 34 Years | 229 (1.9%) | 41 (0.4%) |
| 35 to 64 Years | 1,316 (4.3%) | 1,324 (3.8%) |
| 65 to 74 Years | 563 (2.9%) | 676 (3.2%) |
| 75 Years and over | 685 (4.1%) | 1,722 (9.6%) |
Technology Access in Charlotte County
Computing Device Access in Charlotte County
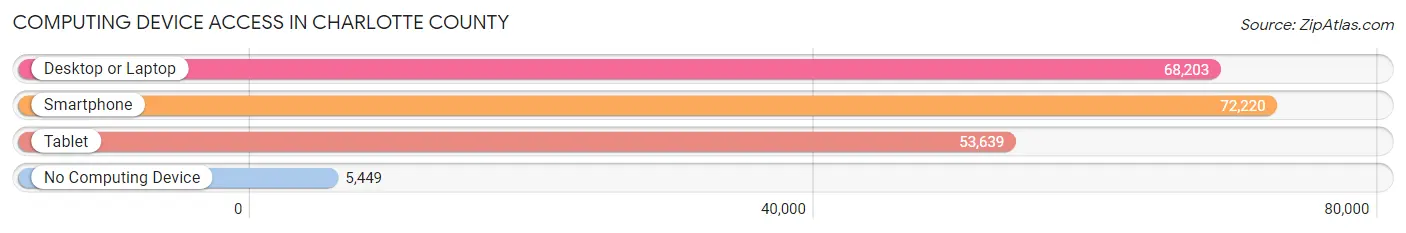
| Device Type | # Households | % Households |
| Desktop or Laptop | 68,203 | 80.5% |
| Smartphone | 72,220 | 85.3% |
| Tablet | 53,639 | 63.3% |
| No Computing Device | 5,449 | 6.4% |
| Total | 84,671 | 100.0% |
Internet Access in Charlotte County
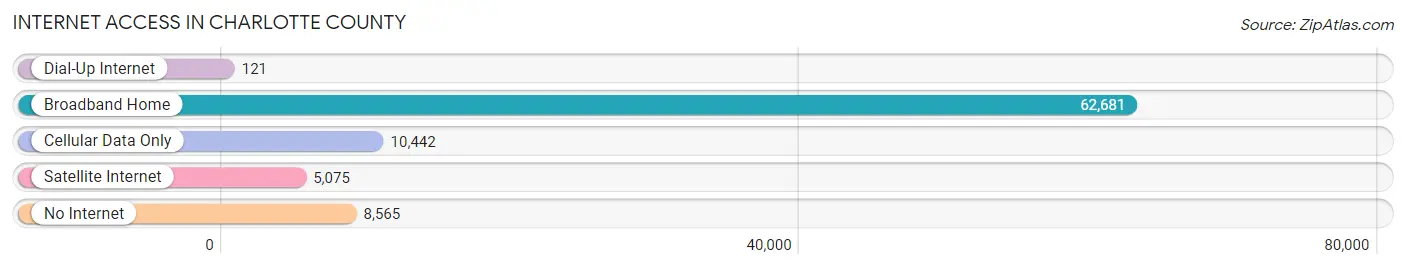
| Internet Type | # Households | % Households |
| Dial-Up Internet | 121 | 0.1% |
| Broadband Home | 62,681 | 74.0% |
| Cellular Data Only | 10,442 | 12.3% |
| Satellite Internet | 5,075 | 6.0% |
| No Internet | 8,565 | 10.1% |
| Total | 84,671 | 100.0% |
Charlotte County Summary
Charlotte County, Florida is located in the southwestern part of the state, on the Gulf Coast. It is bordered by Sarasota County to the north, DeSoto County to the east, and Lee County to the south. The county seat is Punta Gorda, and the county is part of the Punta Gorda Metropolitan Statistical Area. As of the 2010 census, the population of Charlotte County was 159,978, making it the 16th most populous county in Florida.
History
The area that is now Charlotte County was originally inhabited by the Calusa Indians. The first European to explore the area was Ponce de Leon in 1513. The area was later explored by Hernando de Soto in 1539. The area was part of the Spanish colony of Florida until 1821, when it became part of the United States.
In 1921, Charlotte County was created from parts of DeSoto and Manatee counties. The county was named for Charlotte Harbor, which was named for the daughter of the Spanish governor of Florida, Carlos de Grandy.
Geography
Charlotte County is located in the southwestern part of the state, on the Gulf Coast. It is bordered by Sarasota County to the north, DeSoto County to the east, and Lee County to the south. The county has a total area of 858 square miles, of which 790 square miles is land and 68 square miles is water.
The county is divided into two distinct regions: the mainland and the barrier islands. The mainland is mostly flat and is covered with pine forests and wetlands. The barrier islands are made up of sandy beaches and mangrove forests.
Economy
The economy of Charlotte County is largely based on tourism and agriculture. The county is home to several resorts and golf courses, as well as a number of marinas and fishing charters. Agriculture is also an important part of the economy, with citrus, vegetables, and cattle being the main products.
The county is also home to several large employers, including Peace River Citrus Products, Charlotte County Public Schools, and Charlotte Regional Medical Center.
Demographics
As of the 2010 census, the population of Charlotte County was 159,978. The population was spread out, with 24.3% under the age of 18, 8.2% from 18 to 24, 28.2% from 25 to 44, 24.3% from 45 to 64, and 14.0% who were 65 years of age or older. The median age was 38.4 years.
The racial makeup of the county was 87.2% White, 8.2% African American, 0.5% Native American, 1.3% Asian, 0.1% Pacific Islander, 1.3% from other races, and 1.5% from two or more races. Hispanic or Latino of any race were 8.2% of the population.
The median income for a household in the county was $45,890, and the median income for a family was $54,817. The per capita income for the county was $25,945. About 11.2% of families and 14.7% of the population were below the poverty line, including 21.2% of those under age 18 and 6.7% of those age 65 or over.
Common Questions
What is Per Capita Income in Charlotte County?
Per Capita income in Charlotte County is $38,466.
What is the Median Family Income in Charlotte County?
Median Family Income in Charlotte County is $73,880.
What is the Median Household income in Charlotte County?
Median Household Income in Charlotte County is $62,164.
What is Income or Wage Gap in Charlotte County?
Income or Wage Gap in Charlotte County is 13.6%.
Women in Charlotte County earn 86.4 cents for every dollar earned by a man.
What is Family Income Deficit in Charlotte County?
Family Income Deficit in Charlotte County is $10,916.
Families that are below poverty line in Charlotte County earn $10,916 less on average than the poverty threshold level.
What is Inequality or Gini Index in Charlotte County?
Inequality or Gini Index in Charlotte County is 0.45.
What is the Total Population of Charlotte County?
Total Population of Charlotte County is 189,900.
What is the Total Male Population of Charlotte County?
Total Male Population of Charlotte County is 93,505.
What is the Total Female Population of Charlotte County?
Total Female Population of Charlotte County is 96,395.
What is the Ratio of Males per 100 Females in Charlotte County?
There are 97.00 Males per 100 Females in Charlotte County.
What is the Ratio of Females per 100 Males in Charlotte County?
There are 103.09 Females per 100 Males in Charlotte County.
What is the Median Population Age in Charlotte County?
Median Population Age in Charlotte County is 59.9 Years.
What is the Average Family Size in Charlotte County
Average Family Size in Charlotte County is 2.6 People.
What is the Average Household Size in Charlotte County
Average Household Size in Charlotte County is 2.2 People.
How Large is the Labor Force in Charlotte County?
There are 72,233 People in the Labor Forcein in Charlotte County.
What is the Percentage of People in the Labor Force in Charlotte County?
42.4% of People are in the Labor Force in Charlotte County.
What is the Unemployment Rate in Charlotte County?
Unemployment Rate in Charlotte County is 5.7%.