Leon County, FL Map & Demographics
Leon County Overview
$36,823
PER CAPITA INCOME
$89,114
AVG FAMILY INCOME
$61,317
AVG HOUSEHOLD INCOME
16.2%
WAGE / INCOME GAP [ % ]
83.8¢/ $1
WAGE / INCOME GAP [ $ ]
$10,829
FAMILY INCOME DEFICIT
0.51
INEQUALITY / GINI INDEX
294,128
TOTAL POPULATION
139,638
MALE POPULATION
154,490
FEMALE POPULATION
90.39
MALES / 100 FEMALES
110.64
FEMALES / 100 MALES
31.4
MEDIAN AGE
3.0
AVG FAMILY SIZE
2.3
AVG HOUSEHOLD SIZE
159,814
LABOR FORCE [ PEOPLE ]
65.0%
PERCENT IN LABOR FORCE
5.7%
UNEMPLOYMENT RATE
Leon County Area Codes
Income in Leon County
Income Overview in Leon County
Per Capita Income in Leon County is $36,823, while median incomes of families and households are $89,114 and $61,317 respectively.
| Characteristic | Number | Measure |
| Per Capita Income | 294,128 | $36,823 |
| Median Family Income | 62,807 | $89,114 |
| Mean Family Income | 62,807 | $120,202 |
| Median Household Income | 118,755 | $61,317 |
| Mean Household Income | 118,755 | $89,489 |
| Income Deficit | 62,807 | $10,829 |
| Wage / Income Gap (%) | 294,128 | 16.19% |
| Wage / Income Gap ($) | 294,128 | 83.81¢ per $1 |
| Gini / Inequality Index | 294,128 | 0.51 |
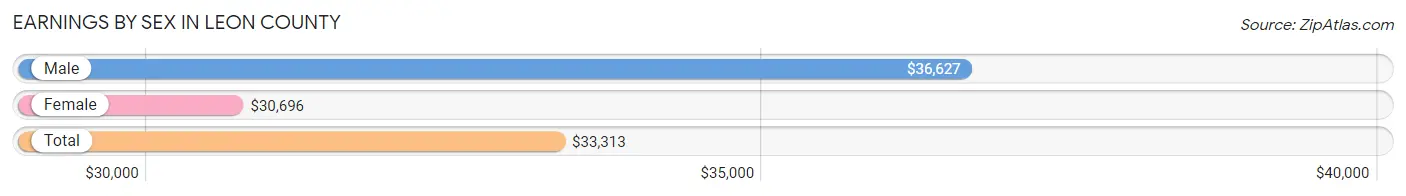
Earnings by Sex in Leon County
Average Earnings in Leon County are $33,313, $36,627 for men and $30,696 for women, a difference of 16.2%.
| Sex | Number | Average Earnings |
| Male | 82,123 (48.4%) | $36,627 |
| Female | 87,396 (51.6%) | $30,696 |
| Total | 169,519 (100.0%) | $33,313 |
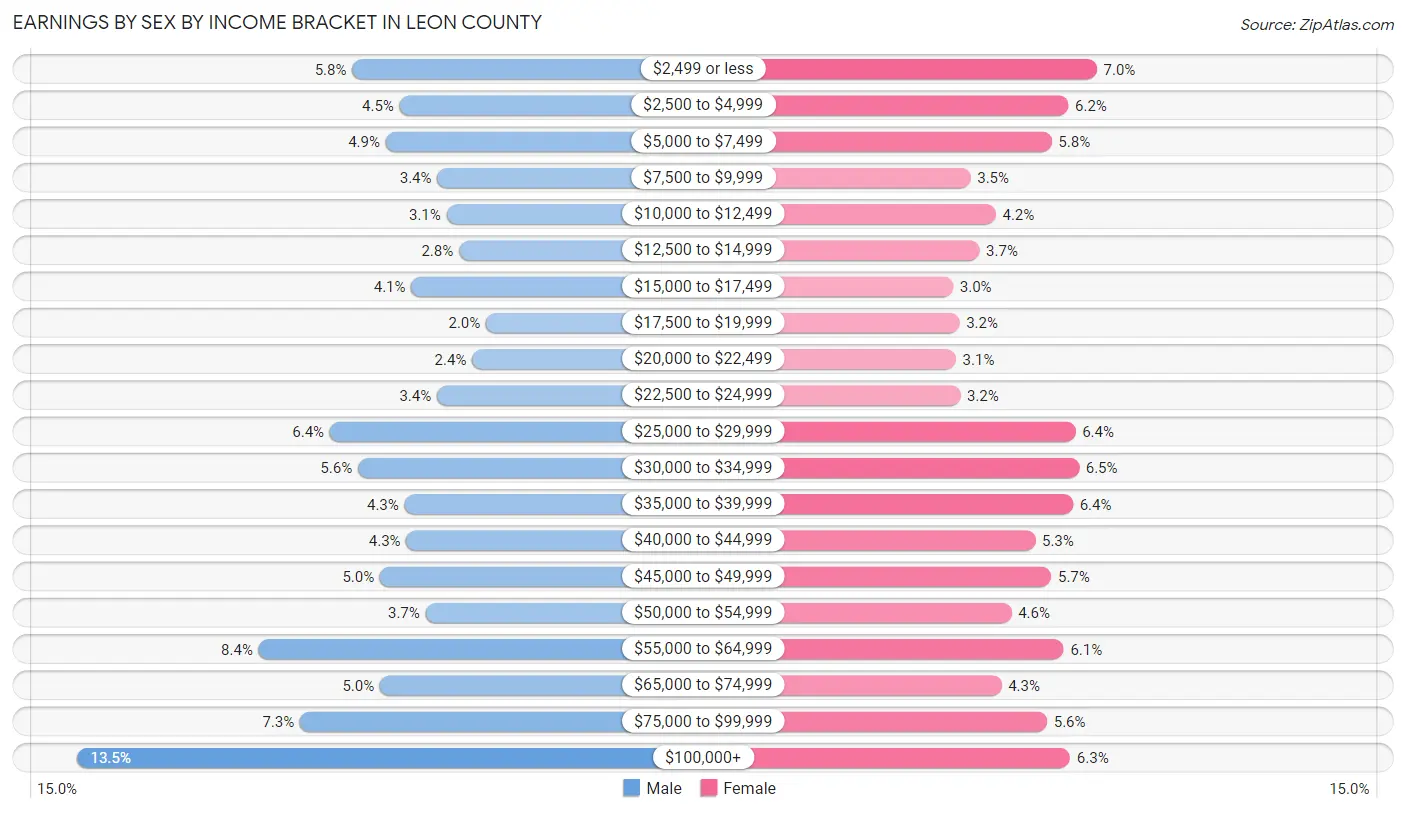
Earnings by Sex by Income Bracket in Leon County
The most common earnings brackets in Leon County are $100,000+ for men (11,094 | 13.5%) and $2,499 or less for women (6,131 | 7.0%).
| Income | Male | Female |
| $2,499 or less | 4,758 (5.8%) | 6,131 (7.0%) |
| $2,500 to $4,999 | 3,666 (4.5%) | 5,435 (6.2%) |
| $5,000 to $7,499 | 3,982 (4.9%) | 5,028 (5.8%) |
| $7,500 to $9,999 | 2,791 (3.4%) | 3,032 (3.5%) |
| $10,000 to $12,499 | 2,579 (3.1%) | 3,657 (4.2%) |
| $12,500 to $14,999 | 2,291 (2.8%) | 3,248 (3.7%) |
| $15,000 to $17,499 | 3,394 (4.1%) | 2,604 (3.0%) |
| $17,500 to $19,999 | 1,667 (2.0%) | 2,762 (3.2%) |
| $20,000 to $22,499 | 1,984 (2.4%) | 2,678 (3.1%) |
| $22,500 to $24,999 | 2,800 (3.4%) | 2,781 (3.2%) |
| $25,000 to $29,999 | 5,272 (6.4%) | 5,608 (6.4%) |
| $30,000 to $34,999 | 4,624 (5.6%) | 5,695 (6.5%) |
| $35,000 to $39,999 | 3,547 (4.3%) | 5,553 (6.4%) |
| $40,000 to $44,999 | 3,509 (4.3%) | 4,619 (5.3%) |
| $45,000 to $49,999 | 4,112 (5.0%) | 5,020 (5.7%) |
| $50,000 to $54,999 | 3,062 (3.7%) | 4,036 (4.6%) |
| $55,000 to $64,999 | 6,916 (8.4%) | 5,326 (6.1%) |
| $65,000 to $74,999 | 4,111 (5.0%) | 3,792 (4.3%) |
| $75,000 to $99,999 | 5,964 (7.3%) | 4,910 (5.6%) |
| $100,000+ | 11,094 (13.5%) | 5,481 (6.3%) |
| Total | 82,123 (100.0%) | 87,396 (100.0%) |
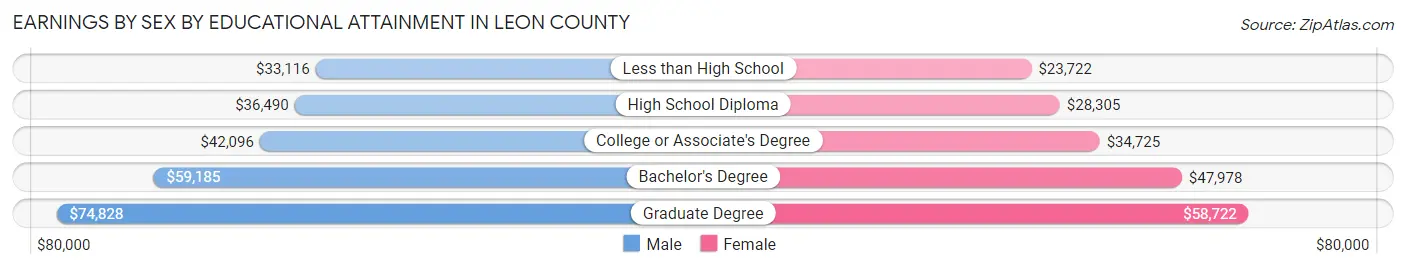
Earnings by Sex by Educational Attainment in Leon County
Average earnings in Leon County are $50,360 for men and $41,789 for women, a difference of 17.0%. Men with an educational attainment of graduate degree enjoy the highest average annual earnings of $74,828, while those with less than high school education earn the least with $33,116. Women with an educational attainment of graduate degree earn the most with the average annual earnings of $58,722, while those with less than high school education have the smallest earnings of $23,722.
| Educational Attainment | Male Income | Female Income |
| Less than High School | $33,116 | $23,722 |
| High School Diploma | $36,490 | $28,305 |
| College or Associate's Degree | $42,096 | $34,725 |
| Bachelor's Degree | $59,185 | $47,978 |
| Graduate Degree | $74,828 | $58,722 |
| Total | $50,360 | $41,789 |
Family Income in Leon County
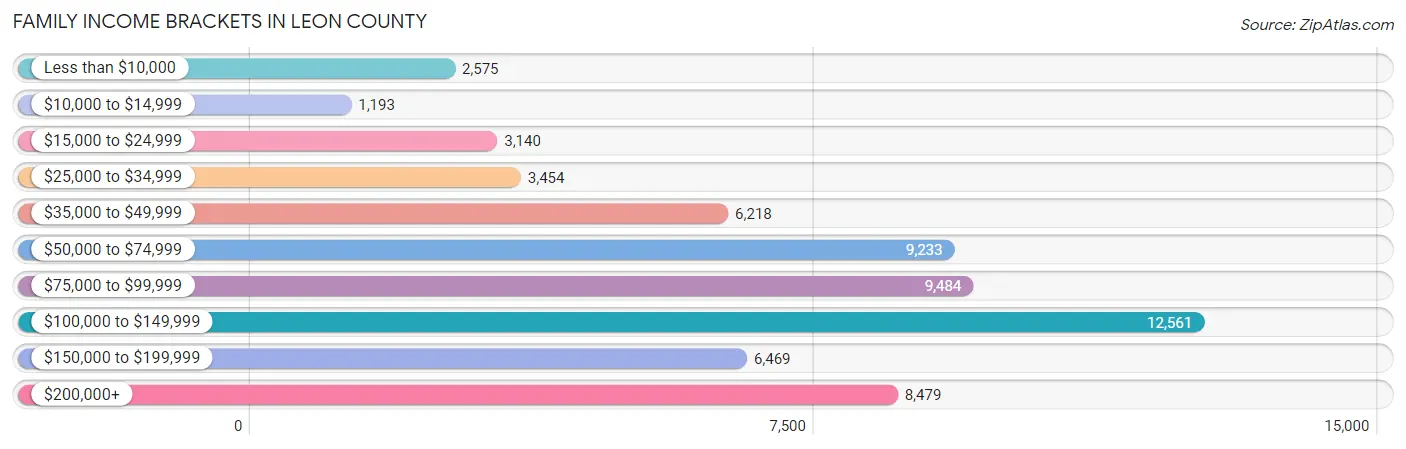
Family Income Brackets in Leon County
According to the Leon County family income data, there are 12,561 families falling into the $100,000 to $149,999 income range, which is the most common income bracket and makes up 20.0% of all families. Conversely, the $10,000 to $14,999 income bracket is the least frequent group with only 1,193 families (1.9%) belonging to this category.
| Income Bracket | # Families | % Families |
| Less than $10,000 | 2,575 | 4.1% |
| $10,000 to $14,999 | 1,193 | 1.9% |
| $15,000 to $24,999 | 3,140 | 5.0% |
| $25,000 to $34,999 | 3,454 | 5.5% |
| $35,000 to $49,999 | 6,218 | 9.9% |
| $50,000 to $74,999 | 9,233 | 14.7% |
| $75,000 to $99,999 | 9,484 | 15.1% |
| $100,000 to $149,999 | 12,561 | 20.0% |
| $150,000 to $199,999 | 6,469 | 10.3% |
| $200,000+ | 8,479 | 13.5% |
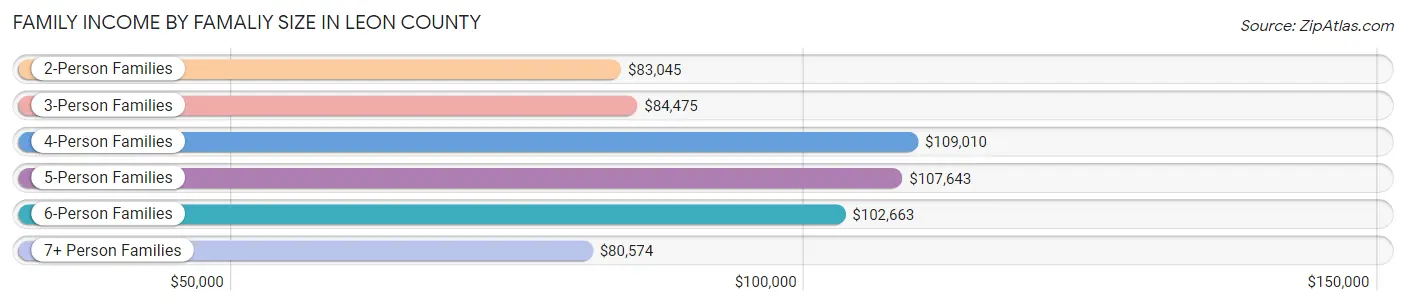
Family Income by Famaliy Size in Leon County
4-person families (10,330 | 16.5%) account for the highest median family income in Leon County with $109,010 per family, while 2-person families (32,879 | 52.3%) have the highest median income of $41,522 per family member.
| Income Bracket | # Families | Median Income |
| 2-Person Families | 32,879 (52.3%) | $83,045 |
| 3-Person Families | 14,041 (22.4%) | $84,475 |
| 4-Person Families | 10,330 (16.5%) | $109,010 |
| 5-Person Families | 3,760 (6.0%) | $107,643 |
| 6-Person Families | 1,366 (2.2%) | $102,663 |
| 7+ Person Families | 431 (0.7%) | $80,574 |
| Total | 62,807 (100.0%) | $89,114 |
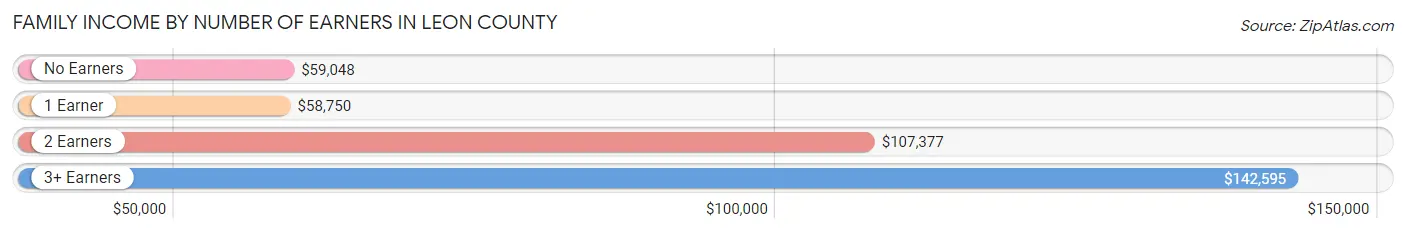
Family Income by Number of Earners in Leon County
The median family income in Leon County is $89,114, with families comprising 3+ earners (4,835) having the highest median family income of $142,595, while families with 1 earner (21,256) have the lowest median family income of $58,750, accounting for 7.7% and 33.8% of families, respectively.
| Number of Earners | # Families | Median Income |
| No Earners | 8,822 (14.1%) | $59,048 |
| 1 Earner | 21,256 (33.8%) | $58,750 |
| 2 Earners | 27,894 (44.4%) | $107,377 |
| 3+ Earners | 4,835 (7.7%) | $142,595 |
| Total | 62,807 (100.0%) | $89,114 |
Household Income in Leon County
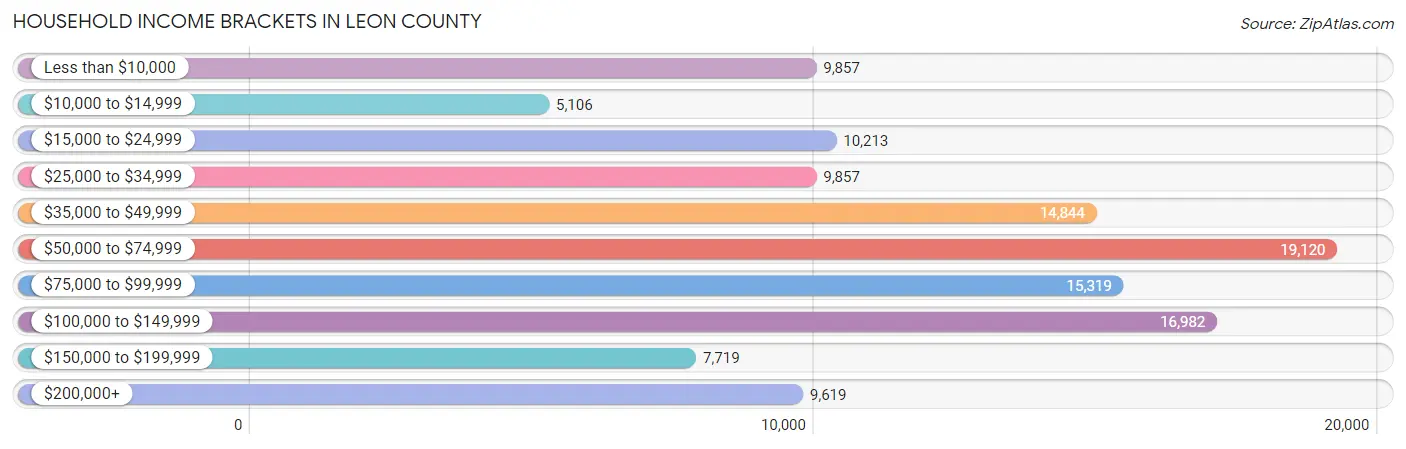
Household Income Brackets in Leon County
With 19,120 households falling in the category, the $50,000 to $74,999 income range is the most frequent in Leon County, accounting for 16.1% of all households. In contrast, only 5,106 households (4.3%) fall into the $10,000 to $14,999 income bracket, making it the least populous group.
| Income Bracket | # Households | % Households |
| Less than $10,000 | 9,857 | 8.3% |
| $10,000 to $14,999 | 5,106 | 4.3% |
| $15,000 to $24,999 | 10,213 | 8.6% |
| $25,000 to $34,999 | 9,857 | 8.3% |
| $35,000 to $49,999 | 14,844 | 12.5% |
| $50,000 to $74,999 | 19,120 | 16.1% |
| $75,000 to $99,999 | 15,319 | 12.9% |
| $100,000 to $149,999 | 16,982 | 14.3% |
| $150,000 to $199,999 | 7,719 | 6.5% |
| $200,000+ | 9,619 | 8.1% |
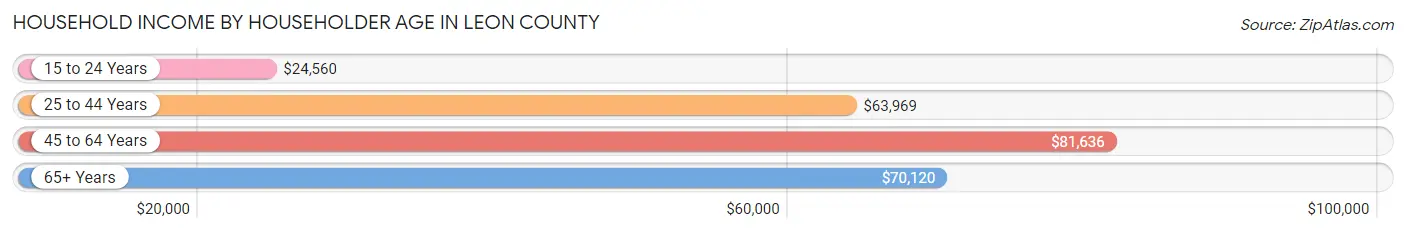
Household Income by Householder Age in Leon County
The median household income in Leon County is $61,317, with the highest median household income of $81,636 found in the 45 to 64 years age bracket for the primary householder. A total of 35,854 households (30.2%) fall into this category. Meanwhile, the 15 to 24 years age bracket for the primary householder has the lowest median household income of $24,560, with 17,973 households (15.1%) in this group.
| Income Bracket | # Households | Median Income |
| 15 to 24 Years | 17,973 (15.1%) | $24,560 |
| 25 to 44 Years | 38,930 (32.8%) | $63,969 |
| 45 to 64 Years | 35,854 (30.2%) | $81,636 |
| 65+ Years | 25,998 (21.9%) | $70,120 |
| Total | 118,755 (100.0%) | $61,317 |
Poverty in Leon County
Income Below Poverty by Sex and Age in Leon County
With 18.4% poverty level for males and 20.4% for females among the residents of Leon County, 18 to 24 year old males and 18 to 24 year old females are the most vulnerable to poverty, with 11,281 males (44.1%) and 13,009 females (48.4%) in their respective age groups living below the poverty level.
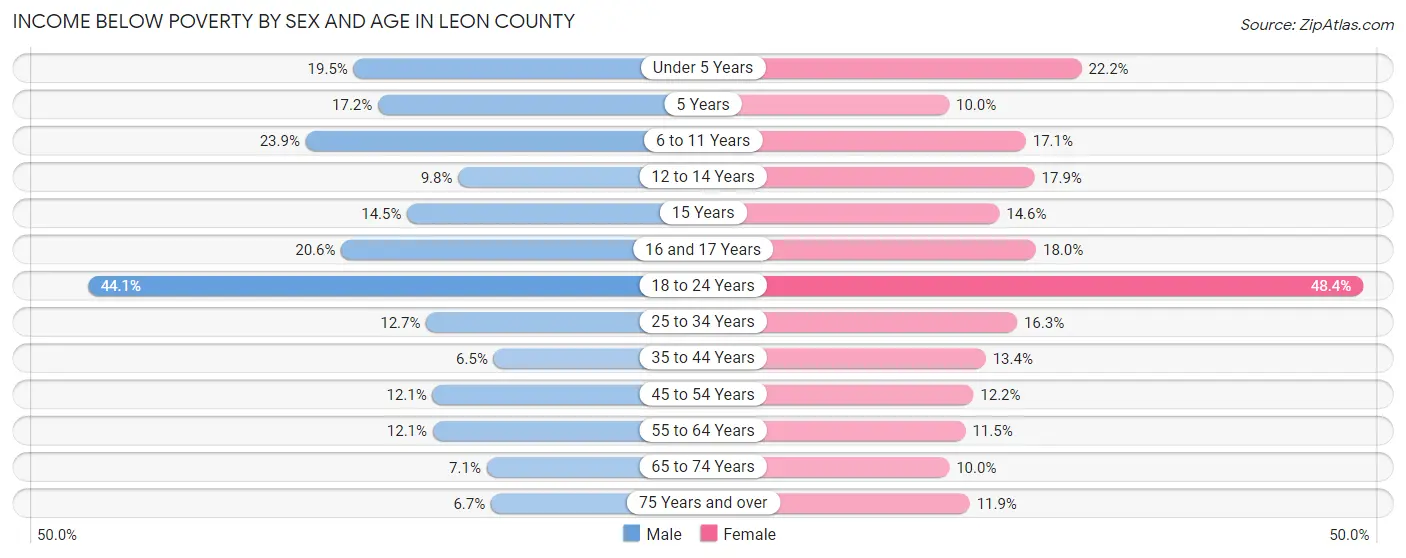
| Age Bracket | Male | Female |
| Under 5 Years | 1,416 (19.5%) | 1,534 (22.2%) |
| 5 Years | 245 (17.2%) | 107 (10.0%) |
| 6 to 11 Years | 2,125 (23.9%) | 1,579 (17.1%) |
| 12 to 14 Years | 469 (9.8%) | 742 (17.9%) |
| 15 Years | 225 (14.5%) | 274 (14.6%) |
| 16 and 17 Years | 632 (20.6%) | 486 (18.0%) |
| 18 to 24 Years | 11,281 (44.1%) | 13,009 (48.4%) |
| 25 to 34 Years | 2,496 (12.7%) | 3,324 (16.3%) |
| 35 to 44 Years | 1,009 (6.5%) | 2,238 (13.4%) |
| 45 to 54 Years | 1,709 (12.1%) | 1,835 (12.2%) |
| 55 to 64 Years | 1,704 (12.1%) | 1,859 (11.5%) |
| 65 to 74 Years | 821 (7.1%) | 1,357 (10.0%) |
| 75 Years and over | 416 (6.7%) | 1,048 (11.9%) |
| Total | 24,548 (18.4%) | 29,392 (20.4%) |
Income Above Poverty by Sex and Age in Leon County
According to the poverty statistics in Leon County, males aged 35 to 44 years and females aged 5 years are the age groups that are most secure financially, with 93.5% of males and 90.0% of females in these age groups living above the poverty line.
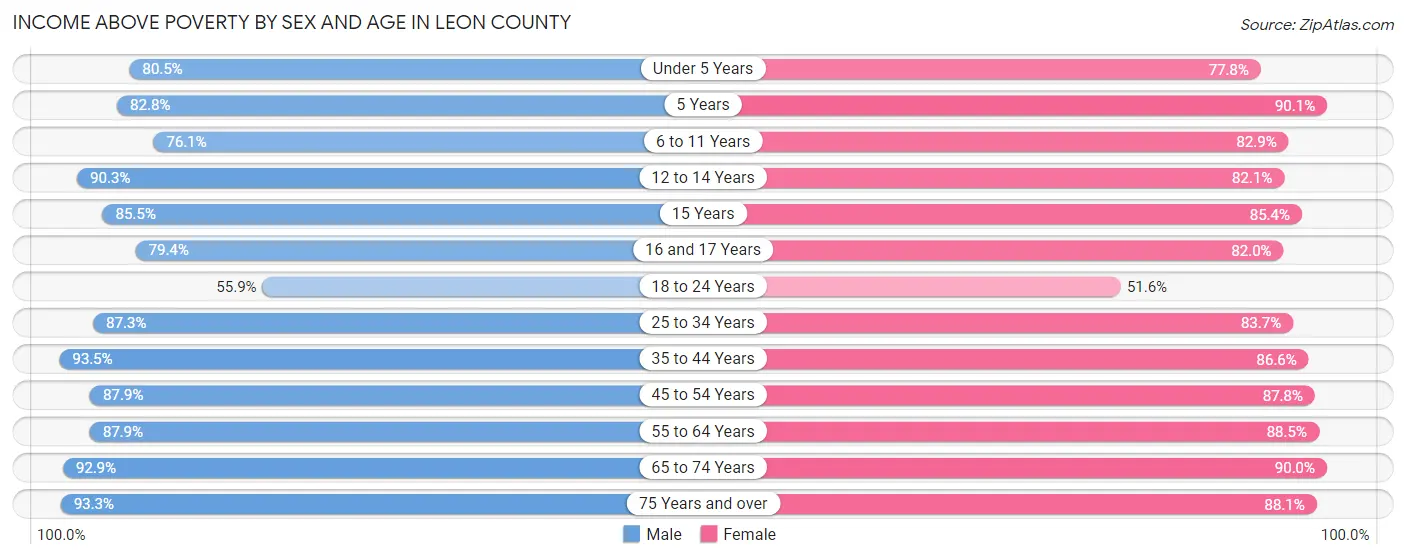
| Age Bracket | Male | Female |
| Under 5 Years | 5,859 (80.5%) | 5,363 (77.8%) |
| 5 Years | 1,180 (82.8%) | 968 (90.0%) |
| 6 to 11 Years | 6,762 (76.1%) | 7,664 (82.9%) |
| 12 to 14 Years | 4,341 (90.2%) | 3,404 (82.1%) |
| 15 Years | 1,329 (85.5%) | 1,600 (85.4%) |
| 16 and 17 Years | 2,434 (79.4%) | 2,209 (82.0%) |
| 18 to 24 Years | 14,275 (55.9%) | 13,887 (51.6%) |
| 25 to 34 Years | 17,125 (87.3%) | 17,120 (83.7%) |
| 35 to 44 Years | 14,607 (93.5%) | 14,518 (86.6%) |
| 45 to 54 Years | 12,369 (87.9%) | 13,198 (87.8%) |
| 55 to 64 Years | 12,364 (87.9%) | 14,341 (88.5%) |
| 65 to 74 Years | 10,731 (92.9%) | 12,250 (90.0%) |
| 75 Years and over | 5,781 (93.3%) | 7,780 (88.1%) |
| Total | 109,157 (81.6%) | 114,302 (79.5%) |
Income Below Poverty Among Married-Couple Families in Leon County
The poverty statistics for married-couple families in Leon County show that 3.4% or 1,391 of the total 41,477 families live below the poverty line. Families with 5 or more children have the highest poverty rate of 38.9%, comprising of 95 families. On the other hand, families with no children have the lowest poverty rate of 2.2%, which includes 562 families.
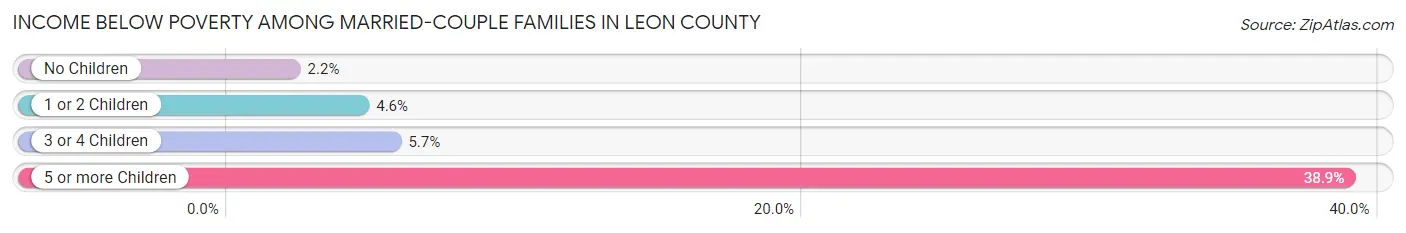
| Children | Above Poverty | Below Poverty |
| No Children | 25,252 (97.8%) | 562 (2.2%) |
| 1 or 2 Children | 12,250 (95.4%) | 587 (4.6%) |
| 3 or 4 Children | 2,435 (94.3%) | 147 (5.7%) |
| 5 or more Children | 149 (61.1%) | 95 (38.9%) |
| Total | 40,086 (96.7%) | 1,391 (3.4%) |
Income Below Poverty Among Single-Parent Households in Leon County
According to the poverty data in Leon County, 18.1% or 960 single-father households and 26.5% or 4,250 single-mother households are living below the poverty line. Among single-father households, those with 3 or 4 children have the highest poverty rate, with 126 households (32.8%) experiencing poverty. Likewise, among single-mother households, those with 5 or more children have the highest poverty rate, with 204 households (95.8%) falling below the poverty line.
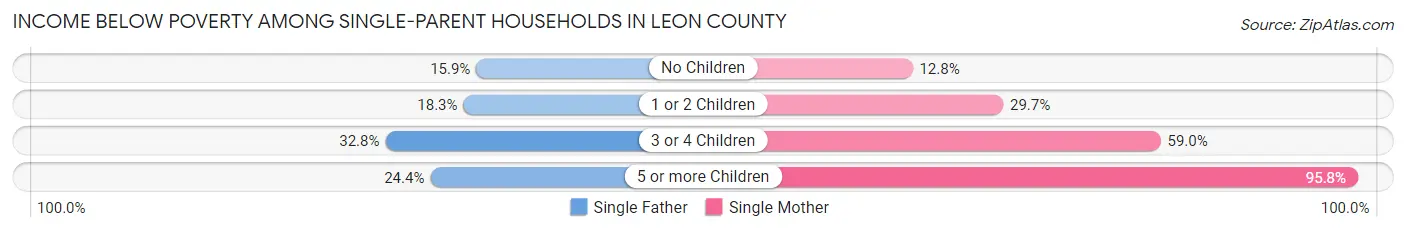
| Children | Single Father | Single Mother |
| No Children | 446 (15.9%) | 745 (12.8%) |
| 1 or 2 Children | 377 (18.3%) | 2,637 (29.7%) |
| 3 or 4 Children | 126 (32.8%) | 664 (59.0%) |
| 5 or more Children | 11 (24.4%) | 204 (95.8%) |
| Total | 960 (18.1%) | 4,250 (26.5%) |
Income Below Poverty Among Married-Couple vs Single-Parent Households in Leon County
The poverty data for Leon County shows that 1,391 of the married-couple family households (3.4%) and 5,210 of the single-parent households (24.4%) are living below the poverty level. Within the married-couple family households, those with 5 or more children have the highest poverty rate, with 95 households (38.9%) falling below the poverty line. Among the single-parent households, those with 5 or more children have the highest poverty rate, with 215 household (83.3%) living below poverty.
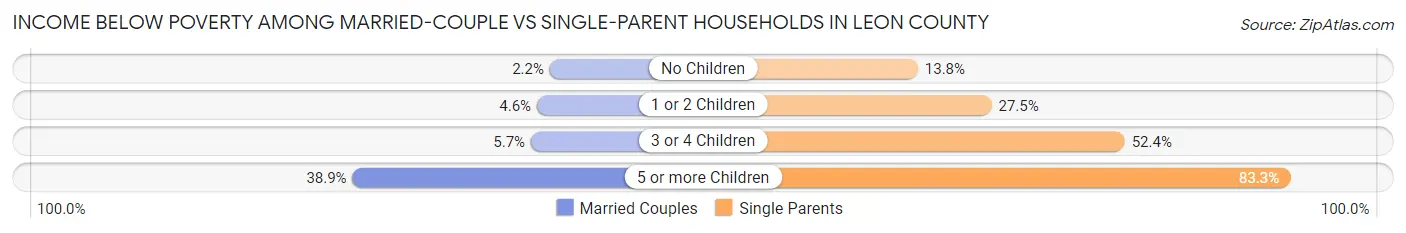
| Children | Married-Couple Families | Single-Parent Households |
| No Children | 562 (2.2%) | 1,191 (13.8%) |
| 1 or 2 Children | 587 (4.6%) | 3,014 (27.5%) |
| 3 or 4 Children | 147 (5.7%) | 790 (52.3%) |
| 5 or more Children | 95 (38.9%) | 215 (83.3%) |
| Total | 1,391 (3.4%) | 5,210 (24.4%) |
Race in Leon County
The most populous races in Leon County are White / Caucasian (170,168 | 57.9%), Black / African American (91,031 | 30.9%), and Hispanic or Latino (20,385 | 6.9%).
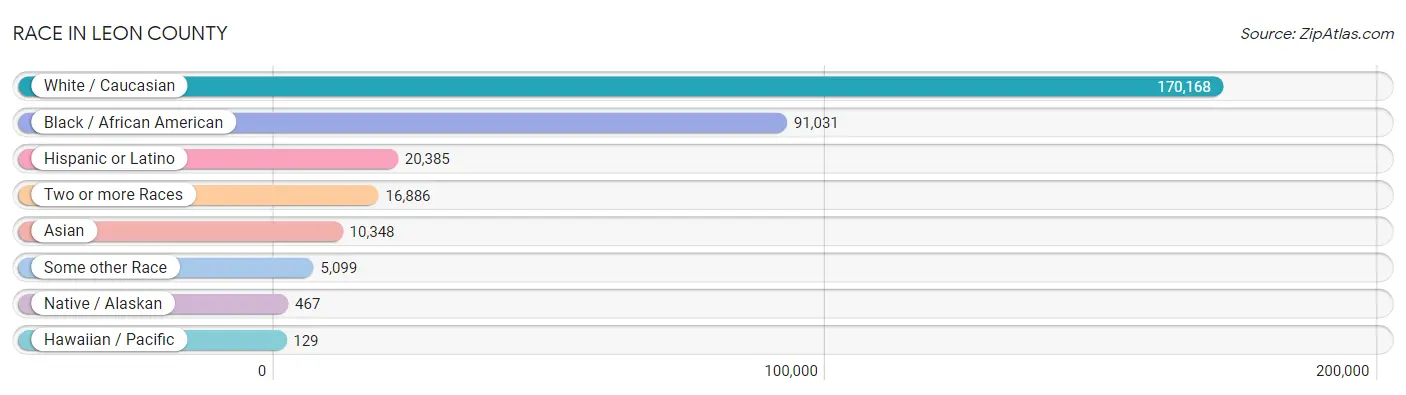
| Race | # Population | % Population |
| Asian | 10,348 | 3.5% |
| Black / African American | 91,031 | 30.9% |
| Hawaiian / Pacific | 129 | 0.0% |
| Hispanic or Latino | 20,385 | 6.9% |
| Native / Alaskan | 467 | 0.2% |
| White / Caucasian | 170,168 | 57.9% |
| Two or more Races | 16,886 | 5.7% |
| Some other Race | 5,099 | 1.7% |
| Total | 294,128 | 100.0% |
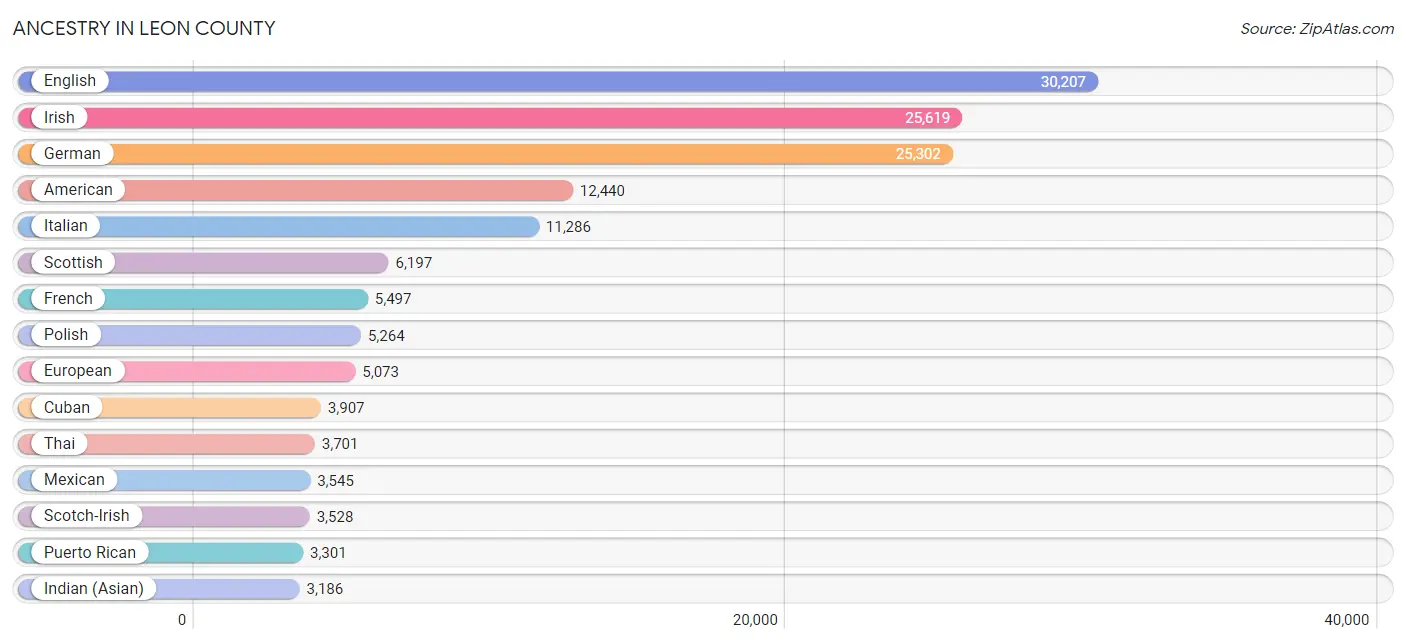
Ancestry in Leon County
The most populous ancestries reported in Leon County are English (30,207 | 10.3%), Irish (25,619 | 8.7%), German (25,302 | 8.6%), American (12,440 | 4.2%), and Italian (11,286 | 3.8%), together accounting for 35.6% of all Leon County residents.
| Ancestry | # Population | % Population |
| African | 1,892 | 0.6% |
| Albanian | 27 | 0.0% |
| American | 12,440 | 4.2% |
| Apache | 12 | 0.0% |
| Arab | 1,452 | 0.5% |
| Argentinean | 165 | 0.1% |
| Armenian | 153 | 0.1% |
| Australian | 108 | 0.0% |
| Austrian | 423 | 0.1% |
| Bahamian | 395 | 0.1% |
| Barbadian | 18 | 0.0% |
| Basque | 98 | 0.0% |
| Belgian | 175 | 0.1% |
| Belizean | 14 | 0.0% |
| Bhutanese | 957 | 0.3% |
| Blackfeet | 61 | 0.0% |
| Bolivian | 9 | 0.0% |
| Brazilian | 498 | 0.2% |
| British | 2,761 | 0.9% |
| British West Indian | 39 | 0.0% |
| Bulgarian | 51 | 0.0% |
| Burmese | 834 | 0.3% |
| Cajun | 35 | 0.0% |
| Canadian | 489 | 0.2% |
| Carpatho Rusyn | 6 | 0.0% |
| Celtic | 89 | 0.0% |
| Central American | 2,550 | 0.9% |
| Central American Indian | 151 | 0.1% |
| Cherokee | 823 | 0.3% |
| Cheyenne | 24 | 0.0% |
| Chickasaw | 6 | 0.0% |
| Chilean | 257 | 0.1% |
| Chippewa | 36 | 0.0% |
| Choctaw | 41 | 0.0% |
| Colombian | 1,043 | 0.4% |
| Costa Rican | 201 | 0.1% |
| Creek | 148 | 0.1% |
| Croatian | 168 | 0.1% |
| Cuban | 3,907 | 1.3% |
| Czech | 582 | 0.2% |
| Czechoslovakian | 147 | 0.1% |
| Danish | 755 | 0.3% |
| Delaware | 12 | 0.0% |
| Dominican | 847 | 0.3% |
| Dutch | 1,957 | 0.7% |
| Eastern European | 854 | 0.3% |
| Ecuadorian | 180 | 0.1% |
| Egyptian | 158 | 0.1% |
| English | 30,207 | 10.3% |
| Ethiopian | 21 | 0.0% |
| European | 5,073 | 1.7% |
| Filipino | 171 | 0.1% |
| Finnish | 267 | 0.1% |
| French | 5,497 | 1.9% |
| French Canadian | 870 | 0.3% |
| German | 25,302 | 8.6% |
| German Russian | 6 | 0.0% |
| Ghanaian | 65 | 0.0% |
| Greek | 1,096 | 0.4% |
| Guamanian / Chamorro | 85 | 0.0% |
| Guatemalan | 282 | 0.1% |
| Guyanese | 105 | 0.0% |
| Haitian | 1,993 | 0.7% |
| Honduran | 308 | 0.1% |
| Hungarian | 656 | 0.2% |
| Icelander | 74 | 0.0% |
| Indian (Asian) | 3,186 | 1.1% |
| Indonesian | 42 | 0.0% |
| Iranian | 248 | 0.1% |
| Iraqi | 22 | 0.0% |
| Irish | 25,619 | 8.7% |
| Iroquois | 39 | 0.0% |
| Israeli | 113 | 0.0% |
| Italian | 11,286 | 3.8% |
| Jamaican | 1,646 | 0.6% |
| Japanese | 67 | 0.0% |
| Jordanian | 41 | 0.0% |
| Korean | 1,878 | 0.6% |
| Laotian | 9 | 0.0% |
| Latvian | 93 | 0.0% |
| Lebanese | 468 | 0.2% |
| Liberian | 19 | 0.0% |
| Lithuanian | 377 | 0.1% |
| Lumbee | 33 | 0.0% |
| Luxembourger | 10 | 0.0% |
| Macedonian | 21 | 0.0% |
| Malaysian | 33 | 0.0% |
| Maltese | 12 | 0.0% |
| Mexican | 3,545 | 1.2% |
| Mexican American Indian | 221 | 0.1% |
| Mongolian | 41 | 0.0% |
| Moroccan | 26 | 0.0% |
| Native Hawaiian | 63 | 0.0% |
| Navajo | 21 | 0.0% |
| Nicaraguan | 584 | 0.2% |
| Nigerian | 893 | 0.3% |
| Northern European | 543 | 0.2% |
| Norwegian | 1,605 | 0.5% |
| Osage | 6 | 0.0% |
| Pakistani | 421 | 0.1% |
| Palestinian | 36 | 0.0% |
| Panamanian | 489 | 0.2% |
| Paraguayan | 115 | 0.0% |
| Pennsylvania German | 14 | 0.0% |
| Peruvian | 336 | 0.1% |
| Polish | 5,264 | 1.8% |
| Portuguese | 448 | 0.2% |
| Puerto Rican | 3,301 | 1.1% |
| Romanian | 136 | 0.1% |
| Russian | 2,171 | 0.7% |
| Salvadoran | 686 | 0.2% |
| Samoan | 99 | 0.0% |
| Scandinavian | 707 | 0.2% |
| Scotch-Irish | 3,528 | 1.2% |
| Scottish | 6,197 | 2.1% |
| Seminole | 50 | 0.0% |
| Serbian | 127 | 0.0% |
| Sierra Leonean | 8 | 0.0% |
| Sioux | 42 | 0.0% |
| Slavic | 148 | 0.1% |
| Slovak | 181 | 0.1% |
| Slovene | 97 | 0.0% |
| Somali | 9 | 0.0% |
| South African | 25 | 0.0% |
| South American | 2,806 | 0.9% |
| Spaniard | 1,215 | 0.4% |
| Spanish | 578 | 0.2% |
| Sri Lankan | 1,259 | 0.4% |
| Subsaharan African | 3,158 | 1.1% |
| Sudanese | 27 | 0.0% |
| Swedish | 1,541 | 0.5% |
| Swiss | 562 | 0.2% |
| Syrian | 154 | 0.1% |
| Thai | 3,701 | 1.3% |
| Trinidadian and Tobagonian | 112 | 0.0% |
| Turkish | 449 | 0.2% |
| U.S. Virgin Islander | 78 | 0.0% |
| Ugandan | 18 | 0.0% |
| Ukrainian | 566 | 0.2% |
| Uruguayan | 8 | 0.0% |
| Venezuelan | 693 | 0.2% |
| Vietnamese | 150 | 0.1% |
| Welsh | 2,146 | 0.7% |
| West Indian | 1,044 | 0.4% |
| Yugoslavian | 44 | 0.0% |
| Zimbabwean | 5 | 0.0% | View All 146 Rows |
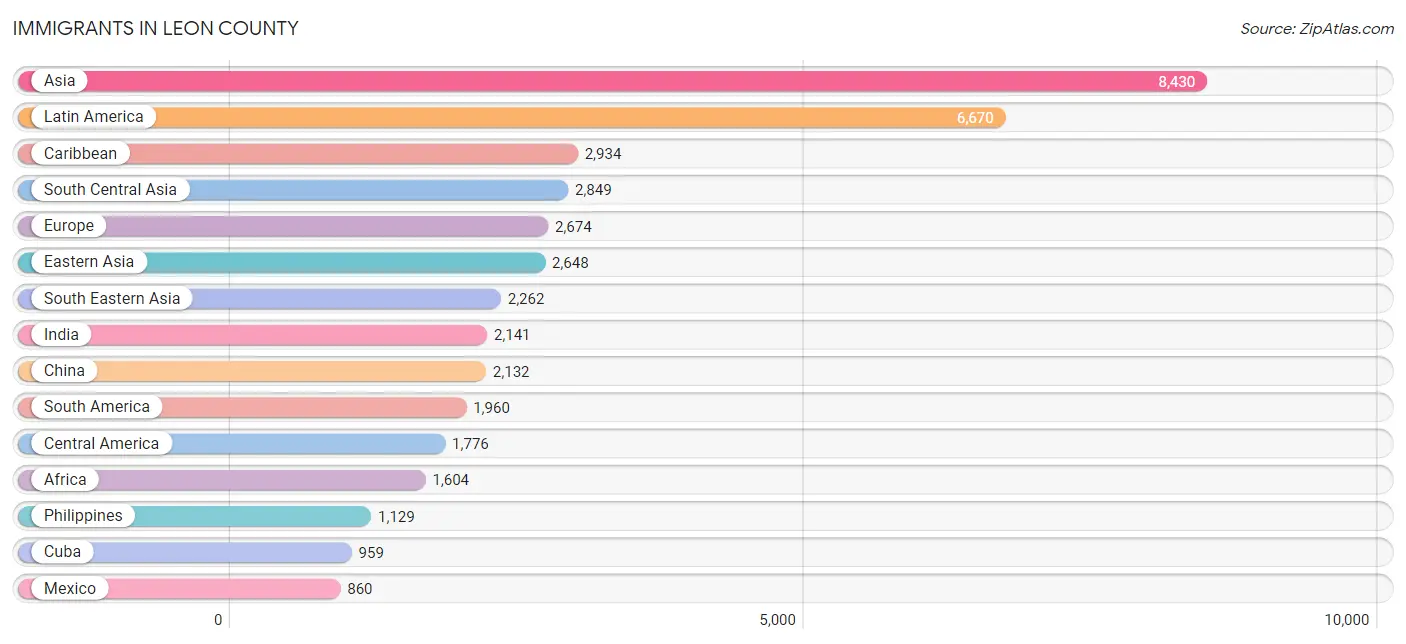
Immigrants in Leon County
The most numerous immigrant groups reported in Leon County came from Asia (8,430 | 2.9%), Latin America (6,670 | 2.3%), Caribbean (2,934 | 1.0%), South Central Asia (2,849 | 1.0%), and Europe (2,674 | 0.9%), together accounting for 8.0% of all Leon County residents.
| Immigration Origin | # Population | % Population |
| Africa | 1,604 | 0.5% |
| Albania | 35 | 0.0% |
| Argentina | 49 | 0.0% |
| Asia | 8,430 | 2.9% |
| Australia | 27 | 0.0% |
| Austria | 5 | 0.0% |
| Azores | 4 | 0.0% |
| Bahamas | 131 | 0.0% |
| Bangladesh | 130 | 0.0% |
| Belize | 6 | 0.0% |
| Bolivia | 13 | 0.0% |
| Bosnia and Herzegovina | 32 | 0.0% |
| Brazil | 468 | 0.2% |
| Bulgaria | 31 | 0.0% |
| Cameroon | 19 | 0.0% |
| Canada | 593 | 0.2% |
| Caribbean | 2,934 | 1.0% |
| Central America | 1,776 | 0.6% |
| Chile | 8 | 0.0% |
| China | 2,132 | 0.7% |
| Colombia | 331 | 0.1% |
| Costa Rica | 14 | 0.0% |
| Croatia | 10 | 0.0% |
| Cuba | 959 | 0.3% |
| Denmark | 19 | 0.0% |
| Dominica | 14 | 0.0% |
| Dominican Republic | 168 | 0.1% |
| Eastern Africa | 424 | 0.1% |
| Eastern Asia | 2,648 | 0.9% |
| Eastern Europe | 859 | 0.3% |
| Ecuador | 64 | 0.0% |
| Egypt | 134 | 0.1% |
| El Salvador | 306 | 0.1% |
| England | 227 | 0.1% |
| Ethiopia | 29 | 0.0% |
| Europe | 2,674 | 0.9% |
| France | 100 | 0.0% |
| Germany | 576 | 0.2% |
| Ghana | 109 | 0.0% |
| Greece | 26 | 0.0% |
| Guatemala | 147 | 0.1% |
| Guyana | 212 | 0.1% |
| Haiti | 557 | 0.2% |
| Honduras | 126 | 0.0% |
| Hong Kong | 58 | 0.0% |
| Hungary | 39 | 0.0% |
| India | 2,141 | 0.7% |
| Indonesia | 9 | 0.0% |
| Iran | 284 | 0.1% |
| Iraq | 16 | 0.0% |
| Israel | 170 | 0.1% |
| Italy | 45 | 0.0% |
| Jamaica | 659 | 0.2% |
| Japan | 195 | 0.1% |
| Jordan | 71 | 0.0% |
| Kazakhstan | 16 | 0.0% |
| Kenya | 228 | 0.1% |
| Korea | 321 | 0.1% |
| Kuwait | 6 | 0.0% |
| Laos | 16 | 0.0% |
| Latin America | 6,670 | 2.3% |
| Lebanon | 15 | 0.0% |
| Liberia | 19 | 0.0% |
| Lithuania | 13 | 0.0% |
| Malaysia | 43 | 0.0% |
| Mexico | 860 | 0.3% |
| Middle Africa | 110 | 0.0% |
| Morocco | 6 | 0.0% |
| Nepal | 109 | 0.0% |
| Netherlands | 54 | 0.0% |
| Nicaragua | 120 | 0.0% |
| Nigeria | 491 | 0.2% |
| Northern Africa | 167 | 0.1% |
| Northern Europe | 713 | 0.2% |
| Oceania | 49 | 0.0% |
| Pakistan | 134 | 0.1% |
| Panama | 197 | 0.1% |
| Peru | 104 | 0.0% |
| Philippines | 1,129 | 0.4% |
| Poland | 22 | 0.0% |
| Portugal | 10 | 0.0% |
| Romania | 80 | 0.0% |
| Russia | 397 | 0.1% |
| Saudi Arabia | 56 | 0.0% |
| Scotland | 20 | 0.0% |
| Serbia | 77 | 0.0% |
| Sierra Leone | 48 | 0.0% |
| South Africa | 115 | 0.0% |
| South America | 1,960 | 0.7% |
| South Central Asia | 2,849 | 1.0% |
| South Eastern Asia | 2,262 | 0.8% |
| Southern Europe | 367 | 0.1% |
| Spain | 286 | 0.1% |
| Sri Lanka | 10 | 0.0% |
| St. Vincent and the Grenadines | 10 | 0.0% |
| Sudan | 12 | 0.0% |
| Sweden | 49 | 0.0% |
| Syria | 82 | 0.0% |
| Taiwan | 360 | 0.1% |
| Thailand | 184 | 0.1% |
| Trinidad and Tobago | 87 | 0.0% |
| Turkey | 205 | 0.1% |
| Ukraine | 78 | 0.0% |
| Uruguay | 8 | 0.0% |
| Uzbekistan | 25 | 0.0% |
| Venezuela | 615 | 0.2% |
| Vietnam | 832 | 0.3% |
| Western Africa | 766 | 0.3% |
| Western Asia | 645 | 0.2% |
| Western Europe | 735 | 0.3% |
| Zaire | 91 | 0.0% |
| Zimbabwe | 30 | 0.0% | View All 112 Rows |
Sex and Age in Leon County
Sex and Age in Leon County
The most populous age groups in Leon County are 20 to 24 Years (21,622 | 15.5%) for men and 20 to 24 Years (24,117 | 15.6%) for women.
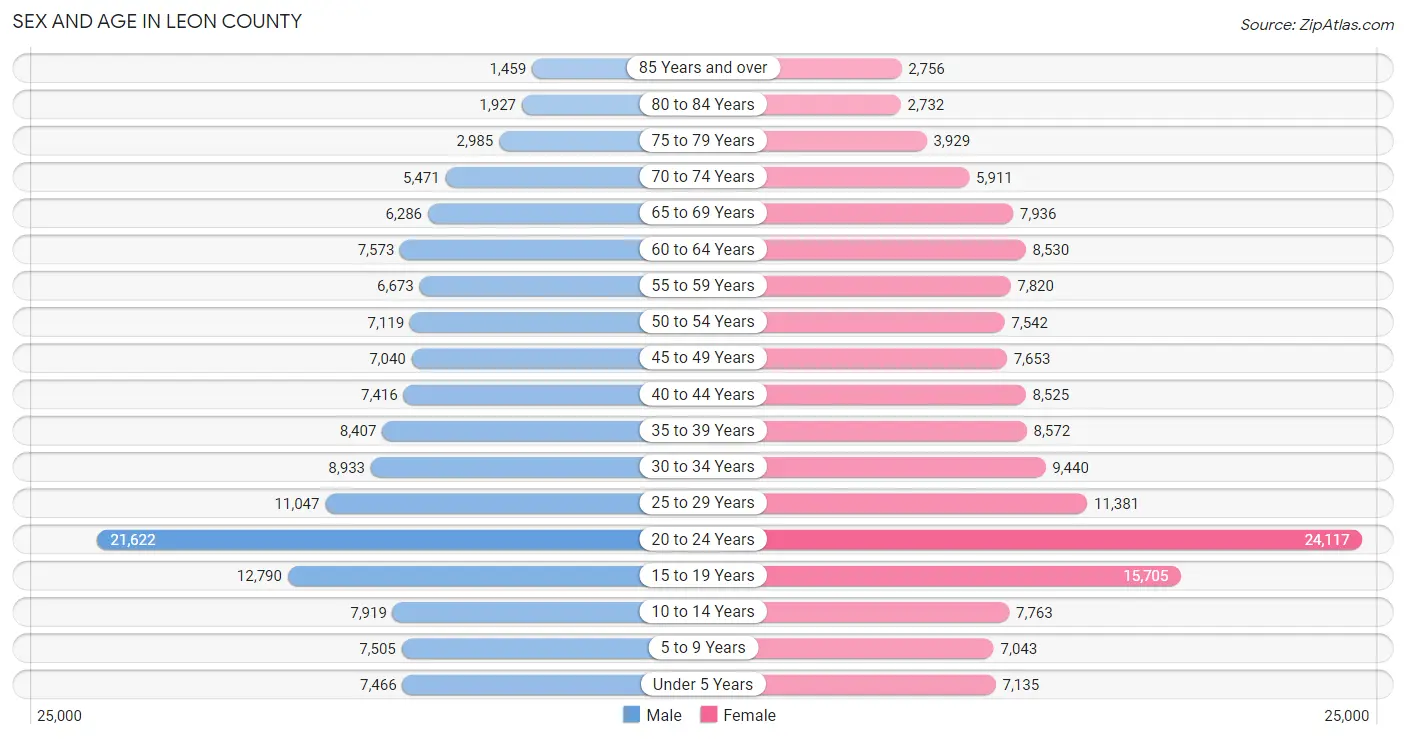
| Age Bracket | Male | Female |
| Under 5 Years | 7,466 (5.3%) | 7,135 (4.6%) |
| 5 to 9 Years | 7,505 (5.4%) | 7,043 (4.6%) |
| 10 to 14 Years | 7,919 (5.7%) | 7,763 (5.0%) |
| 15 to 19 Years | 12,790 (9.2%) | 15,705 (10.2%) |
| 20 to 24 Years | 21,622 (15.5%) | 24,117 (15.6%) |
| 25 to 29 Years | 11,047 (7.9%) | 11,381 (7.4%) |
| 30 to 34 Years | 8,933 (6.4%) | 9,440 (6.1%) |
| 35 to 39 Years | 8,407 (6.0%) | 8,572 (5.6%) |
| 40 to 44 Years | 7,416 (5.3%) | 8,525 (5.5%) |
| 45 to 49 Years | 7,040 (5.0%) | 7,653 (5.0%) |
| 50 to 54 Years | 7,119 (5.1%) | 7,542 (4.9%) |
| 55 to 59 Years | 6,673 (4.8%) | 7,820 (5.1%) |
| 60 to 64 Years | 7,573 (5.4%) | 8,530 (5.5%) |
| 65 to 69 Years | 6,286 (4.5%) | 7,936 (5.1%) |
| 70 to 74 Years | 5,471 (3.9%) | 5,911 (3.8%) |
| 75 to 79 Years | 2,985 (2.1%) | 3,929 (2.5%) |
| 80 to 84 Years | 1,927 (1.4%) | 2,732 (1.8%) |
| 85 Years and over | 1,459 (1.0%) | 2,756 (1.8%) |
| Total | 139,638 (100.0%) | 154,490 (100.0%) |
Families and Households in Leon County
Median Family Size in Leon County
The median family size in Leon County is 3.00 persons per family, with single female/mother families (16,029 | 25.5%) accounting for the largest median family size of 3.04 persons per family. On the other hand, single male/father families (5,301 | 8.4%) represent the smallest median family size with 2.77 persons per family.
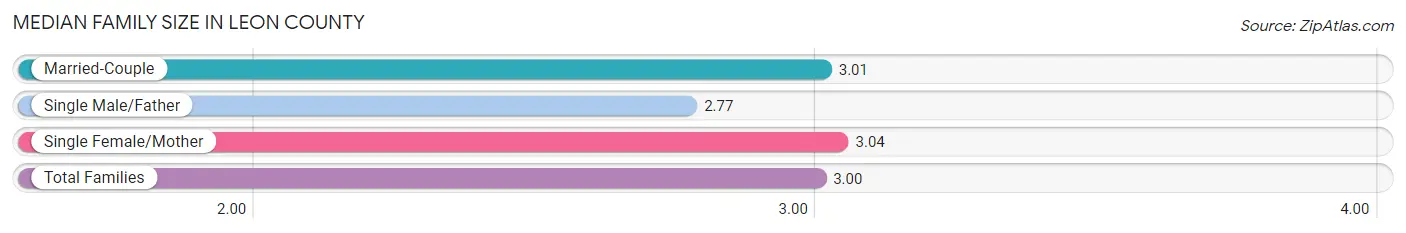
| Family Type | # Families | Family Size |
| Married-Couple | 41,477 (66.0%) | 3.01 |
| Single Male/Father | 5,301 (8.4%) | 2.77 |
| Single Female/Mother | 16,029 (25.5%) | 3.04 |
| Total Families | 62,807 (100.0%) | 3.00 |
Median Household Size in Leon County
The median household size in Leon County is 2.33 persons per household, with single male/father households (5,301 | 4.5%) accounting for the largest median household size of 3.22 persons per household. non-family households (55,948 | 47.1%) represent the smallest median household size with 1.47 persons per household.
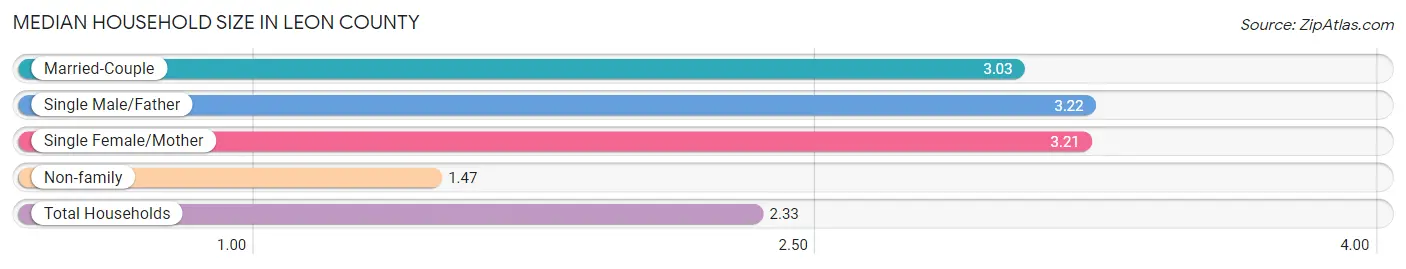
| Household Type | # Households | Household Size |
| Married-Couple | 41,477 (34.9%) | 3.03 |
| Single Male/Father | 5,301 (4.5%) | 3.22 |
| Single Female/Mother | 16,029 (13.5%) | 3.21 |
| Non-family | 55,948 (47.1%) | 1.47 |
| Total Households | 118,755 (100.0%) | 2.33 |
Household Size by Marriage Status in Leon County
Out of a total of 118,755 households in Leon County, 62,807 (52.9%) are family households, while 55,948 (47.1%) are nonfamily households. The most numerous type of family households are 2-person households, comprising 30,626, and the most common type of nonfamily households are 1-person households, comprising 39,208.
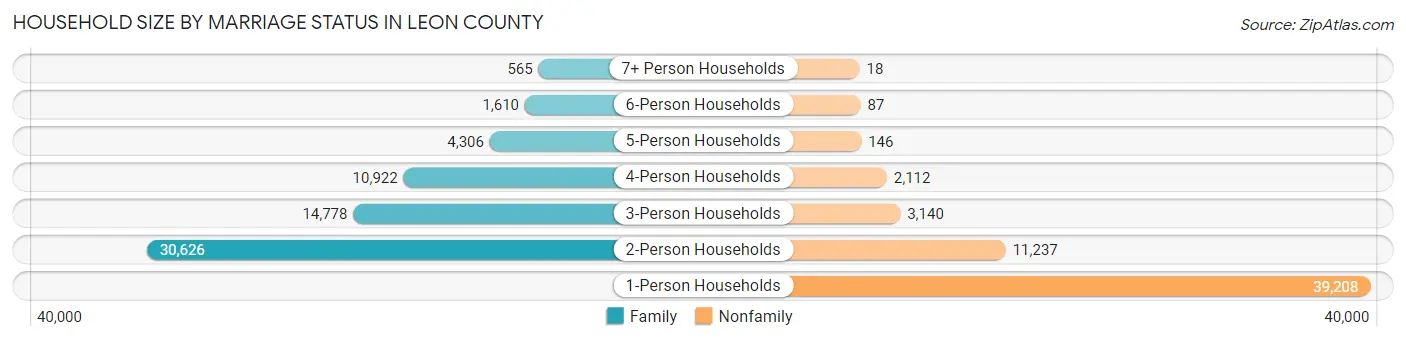
| Household Size | Family Households | Nonfamily Households |
| 1-Person Households | - | 39,208 (33.0%) |
| 2-Person Households | 30,626 (25.8%) | 11,237 (9.5%) |
| 3-Person Households | 14,778 (12.4%) | 3,140 (2.6%) |
| 4-Person Households | 10,922 (9.2%) | 2,112 (1.8%) |
| 5-Person Households | 4,306 (3.6%) | 146 (0.1%) |
| 6-Person Households | 1,610 (1.4%) | 87 (0.1%) |
| 7+ Person Households | 565 (0.5%) | 18 (0.0%) |
| Total | 62,807 (52.9%) | 55,948 (47.1%) |
Female Fertility in Leon County
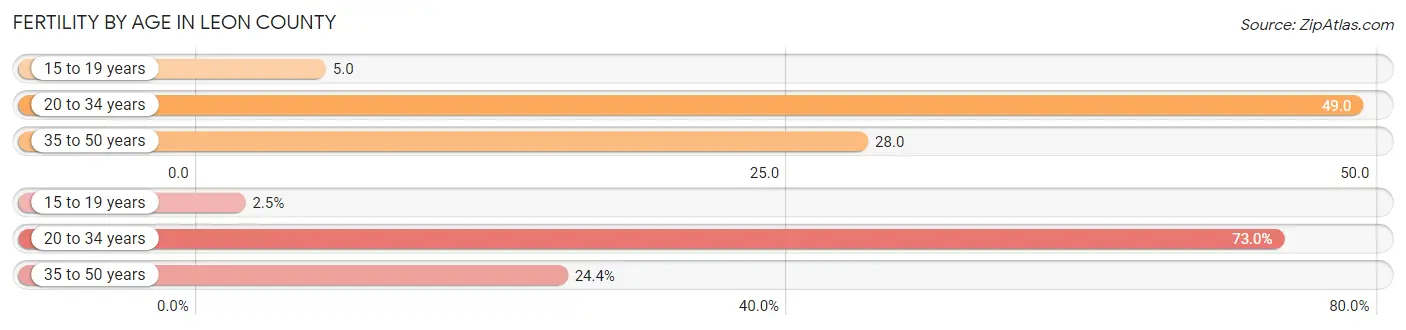
Fertility by Age in Leon County
Average fertility rate in Leon County is 35.0 births per 1,000 women. Women in the age bracket of 20 to 34 years have the highest fertility rate with 49.0 births per 1,000 women. Women in the age bracket of 20 to 34 years acount for 73.0% of all women with births.
| Age Bracket | Women with Births | Births / 1,000 Women |
| 15 to 19 years | 77 (2.5%) | 5.0 |
| 20 to 34 years | 2,211 (73.0%) | 49.0 |
| 35 to 50 years | 739 (24.4%) | 28.0 |
| Total | 3,027 (100.0%) | 35.0 |
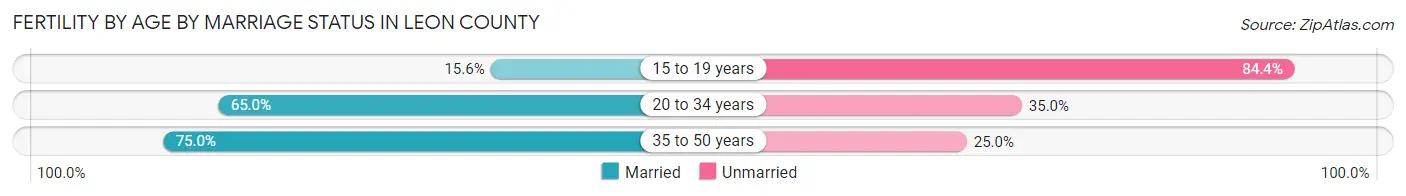
Fertility by Age by Marriage Status in Leon County
66.2% of women with births (3,027) in Leon County are married. The highest percentage of unmarried women with births falls into 15 to 19 years age bracket with 84.4% of them unmarried at the time of birth, while the lowest percentage of unmarried women with births belong to 35 to 50 years age bracket with 25.0% of them unmarried.
| Age Bracket | Married | Unmarried |
| 15 to 19 years | 12 (15.6%) | 65 (84.4%) |
| 20 to 34 years | 1,437 (65.0%) | 774 (35.0%) |
| 35 to 50 years | 554 (75.0%) | 185 (25.0%) |
| Total | 2,004 (66.2%) | 1,023 (33.8%) |
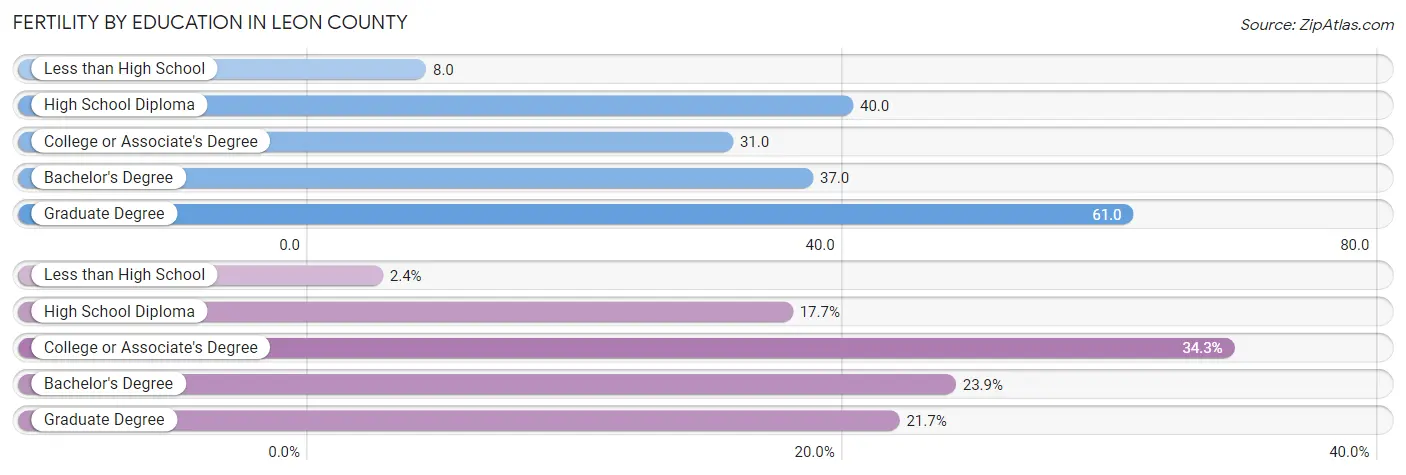
Fertility by Education in Leon County
Average fertility rate in Leon County is 35.0 births per 1,000 women. Women with the education attainment of graduate degree have the highest fertility rate of 61.0 births per 1,000 women, while women with the education attainment of less than high school have the lowest fertility at 8.0 births per 1,000 women. Women with the education attainment of college or associate's degree represent 34.3% of all women with births.
| Educational Attainment | Women with Births | Births / 1,000 Women |
| Less than High School | 72 (2.4%) | 8.0 |
| High School Diploma | 537 (17.7%) | 40.0 |
| College or Associate's Degree | 1,038 (34.3%) | 31.0 |
| Bachelor's Degree | 722 (23.8%) | 37.0 |
| Graduate Degree | 658 (21.7%) | 61.0 |
| Total | 3,027 (100.0%) | 35.0 |
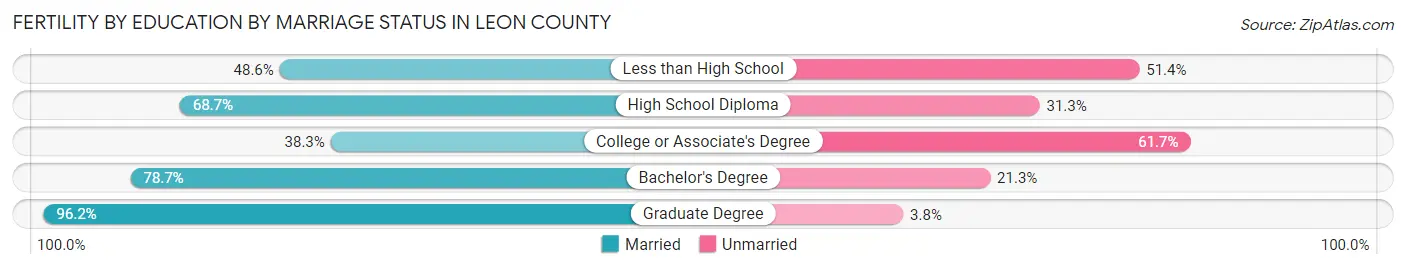
Fertility by Education by Marriage Status in Leon County
33.8% of women with births in Leon County are unmarried. Women with the educational attainment of graduate degree are most likely to be married with 96.2% of them married at childbirth, while women with the educational attainment of college or associate's degree are least likely to be married with 61.7% of them unmarried at childbirth.
| Educational Attainment | Married | Unmarried |
| Less than High School | 35 (48.6%) | 37 (51.4%) |
| High School Diploma | 369 (68.7%) | 168 (31.3%) |
| College or Associate's Degree | 398 (38.3%) | 640 (61.7%) |
| Bachelor's Degree | 568 (78.7%) | 154 (21.3%) |
| Graduate Degree | 633 (96.2%) | 25 (3.8%) |
| Total | 2,004 (66.2%) | 1,023 (33.8%) |
Employment Characteristics in Leon County
Employment by Class of Employer in Leon County
Among the 147,179 employed individuals in Leon County, private company employees (79,606 | 54.1%), state government employees (30,567 | 20.8%), and not-for-profit organizations (12,319 | 8.4%) make up the most common classes of employment.
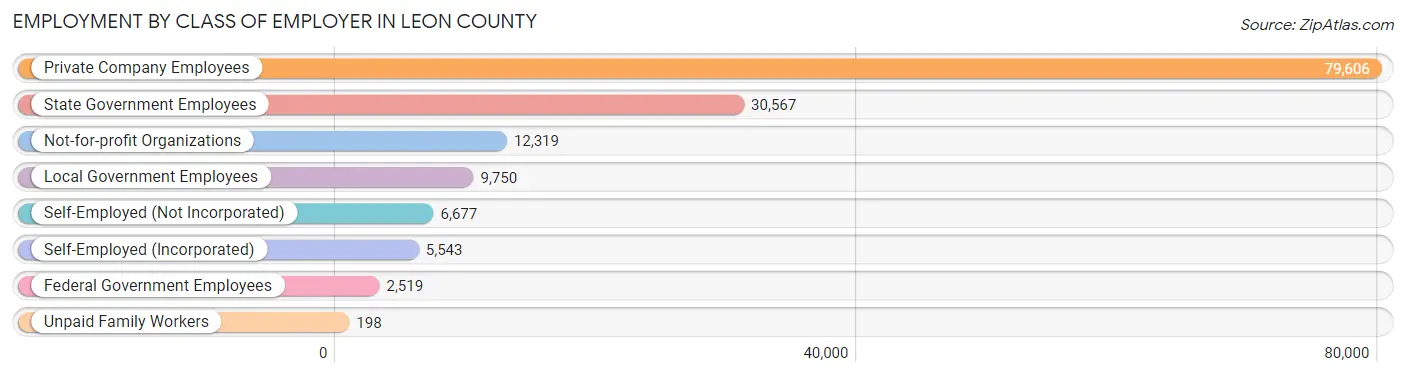
| Employer Class | # Employees | % Employees |
| Private Company Employees | 79,606 | 54.1% |
| Self-Employed (Incorporated) | 5,543 | 3.8% |
| Self-Employed (Not Incorporated) | 6,677 | 4.5% |
| Not-for-profit Organizations | 12,319 | 8.4% |
| Local Government Employees | 9,750 | 6.6% |
| State Government Employees | 30,567 | 20.8% |
| Federal Government Employees | 2,519 | 1.7% |
| Unpaid Family Workers | 198 | 0.1% |
| Total | 147,179 | 100.0% |
Employment Status by Age in Leon County
According to the labor force statistics for Leon County, out of the total population over 16 years of age (245,867), 65.0% or 159,814 individuals are in the labor force, with 5.7% or 9,109 of them unemployed. The age group with the highest labor force participation rate is 30 to 34 years, with 86.5% or 15,893 individuals in the labor force. Within the labor force, the 16 to 19 years age range has the highest percentage of unemployed individuals, with 24.4% or 2,165 of them being unemployed.
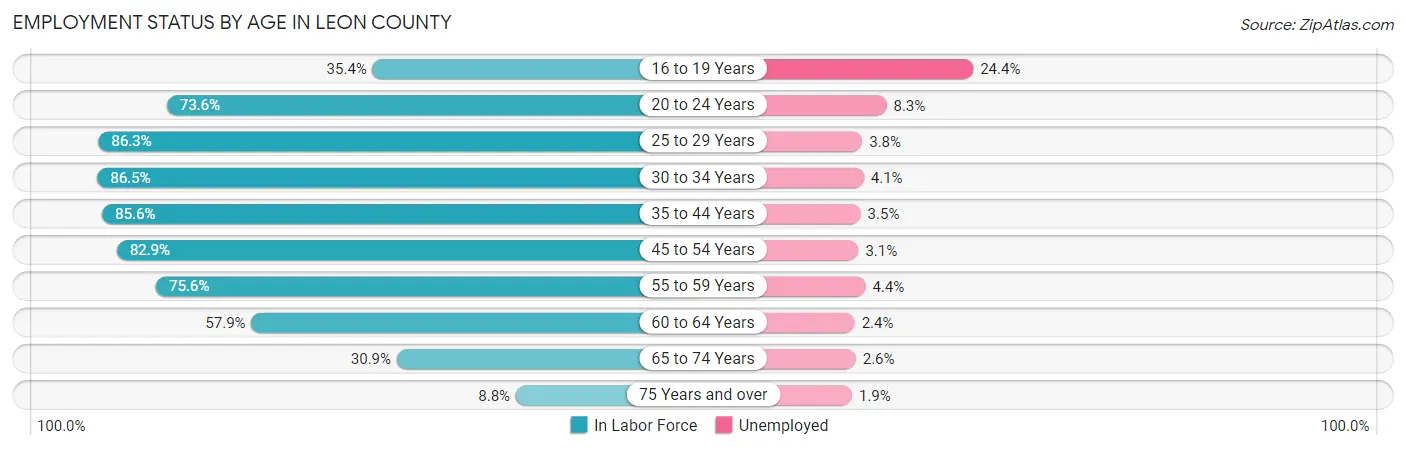
| Age Bracket | In Labor Force | Unemployed |
| 16 to 19 Years | 8,873 (35.4%) | 2,165 (24.4%) |
| 20 to 24 Years | 33,664 (73.6%) | 2,794 (8.3%) |
| 25 to 29 Years | 19,355 (86.3%) | 735 (3.8%) |
| 30 to 34 Years | 15,893 (86.5%) | 652 (4.1%) |
| 35 to 44 Years | 28,180 (85.6%) | 986 (3.5%) |
| 45 to 54 Years | 24,334 (82.9%) | 754 (3.1%) |
| 55 to 59 Years | 10,957 (75.6%) | 482 (4.4%) |
| 60 to 64 Years | 9,324 (57.9%) | 224 (2.4%) |
| 65 to 74 Years | 7,912 (30.9%) | 206 (2.6%) |
| 75 Years and over | 1,389 (8.8%) | 26 (1.9%) |
| Total | 159,814 (65.0%) | 9,109 (5.7%) |
Employment Status by Educational Attainment in Leon County
According to labor force statistics for Leon County, 80.8% of individuals (108,006) out of the total population between 25 and 64 years of age (133,671) are in the labor force, with 3.6% or 3,888 of them being unemployed. The group with the highest labor force participation rate are those with the educational attainment of bachelor's degree or higher, with 88.2% or 56,482 individuals in the labor force. Within the labor force, individuals with less than high school education have the highest percentage of unemployment, with 8.6% or 433 of them being unemployed.
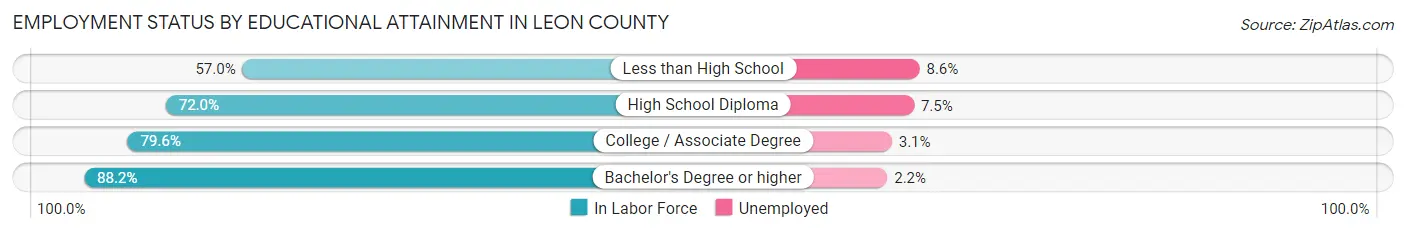
| Educational Attainment | In Labor Force | Unemployed |
| Less than High School | 5,035 (57.0%) | 760 (8.6%) |
| High School Diploma | 17,533 (72.0%) | 1,826 (7.5%) |
| College / Associate Degree | 29,013 (79.6%) | 1,130 (3.1%) |
| Bachelor's Degree or higher | 56,482 (88.2%) | 1,409 (2.2%) |
| Total | 108,006 (80.8%) | 4,812 (3.6%) |
Employment Occupations by Sex in Leon County
Management, Business, Science and Arts Occupations
The most common Management, Business, Science and Arts occupations in Leon County are Community & Social Service (25,338 | 16.8%), Management (15,800 | 10.5%), Education Instruction & Library (14,032 | 9.3%), Computers, Engineering & Science (11,717 | 7.8%), and Business & Financial (9,590 | 6.4%).
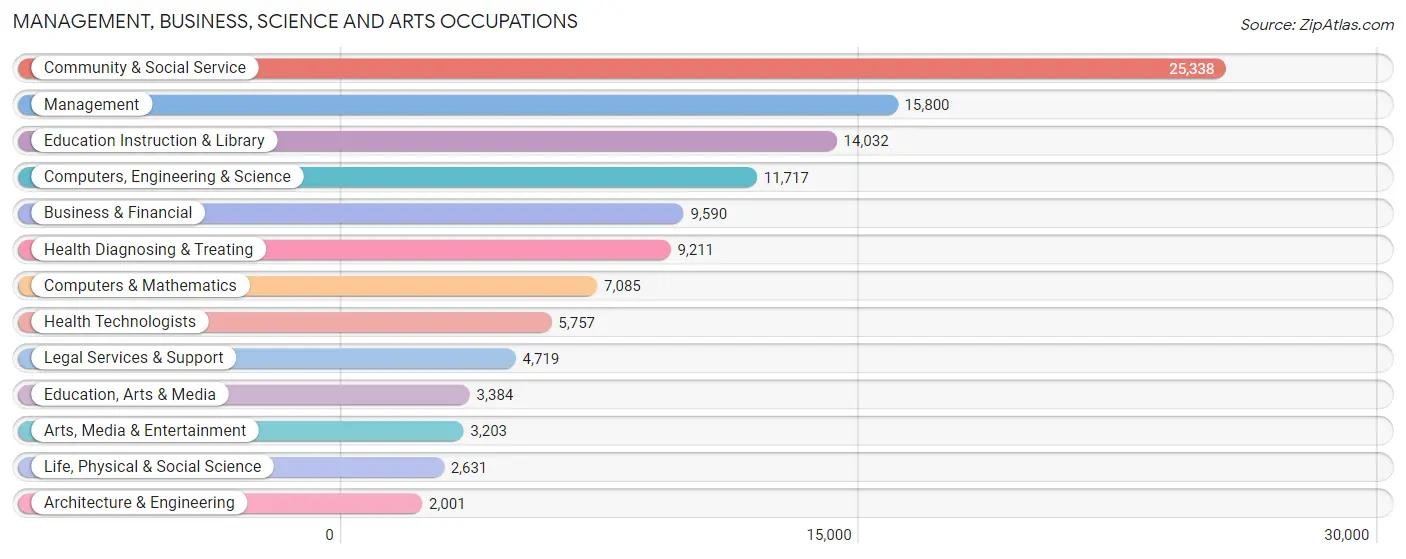
Management, Business, Science and Arts Occupations by Sex
Within the Management, Business, Science and Arts occupations in Leon County, the most male-oriented occupations are Architecture & Engineering (81.9%), Computers & Mathematics (63.3%), and Computers, Engineering & Science (62.0%), while the most female-oriented occupations are Health Diagnosing & Treating (74.5%), Health Technologists (72.2%), and Education, Arts & Media (66.8%).
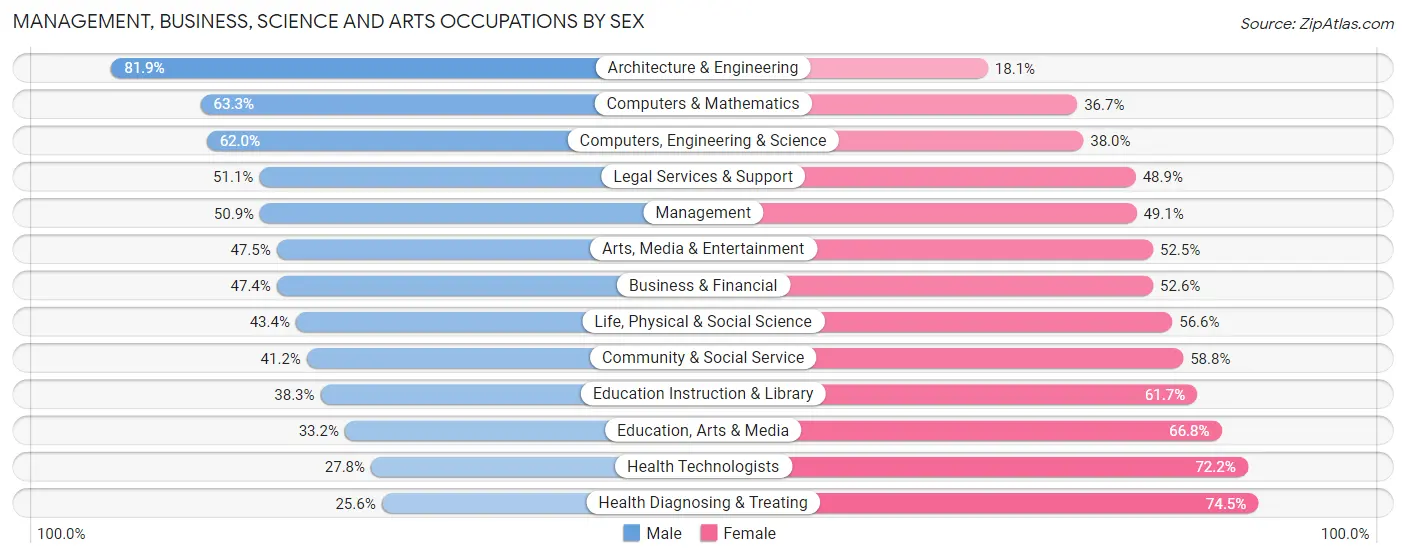
| Occupation | Male | Female |
| Management | 8,043 (50.9%) | 7,757 (49.1%) |
| Business & Financial | 4,549 (47.4%) | 5,041 (52.6%) |
| Computers, Engineering & Science | 7,265 (62.0%) | 4,452 (38.0%) |
| Computers & Mathematics | 4,483 (63.3%) | 2,602 (36.7%) |
| Architecture & Engineering | 1,639 (81.9%) | 362 (18.1%) |
| Life, Physical & Social Science | 1,143 (43.4%) | 1,488 (56.6%) |
| Community & Social Service | 10,428 (41.2%) | 14,910 (58.8%) |
| Education, Arts & Media | 1,124 (33.2%) | 2,260 (66.8%) |
| Legal Services & Support | 2,410 (51.1%) | 2,309 (48.9%) |
| Education Instruction & Library | 5,374 (38.3%) | 8,658 (61.7%) |
| Arts, Media & Entertainment | 1,520 (47.5%) | 1,683 (52.5%) |
| Health Diagnosing & Treating | 2,353 (25.6%) | 6,858 (74.5%) |
| Health Technologists | 1,599 (27.8%) | 4,158 (72.2%) |
| Total (Category) | 32,638 (45.6%) | 39,018 (54.4%) |
| Total (Overall) | 73,426 (48.8%) | 77,071 (51.2%) |
Services Occupations
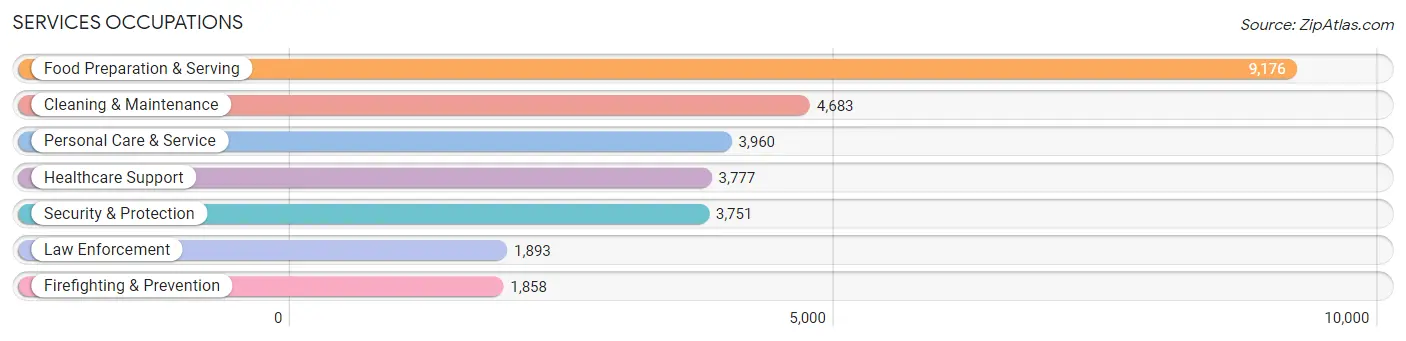
The most common Services occupations in Leon County are Food Preparation & Serving (9,176 | 6.1%), Cleaning & Maintenance (4,683 | 3.1%), Personal Care & Service (3,960 | 2.6%), Healthcare Support (3,777 | 2.5%), and Security & Protection (3,751 | 2.5%).
Services Occupations by Sex
Within the Services occupations in Leon County, the most male-oriented occupations are Law Enforcement (70.2%), Cleaning & Maintenance (68.1%), and Security & Protection (65.1%), while the most female-oriented occupations are Healthcare Support (80.7%), Personal Care & Service (67.9%), and Food Preparation & Serving (48.5%).
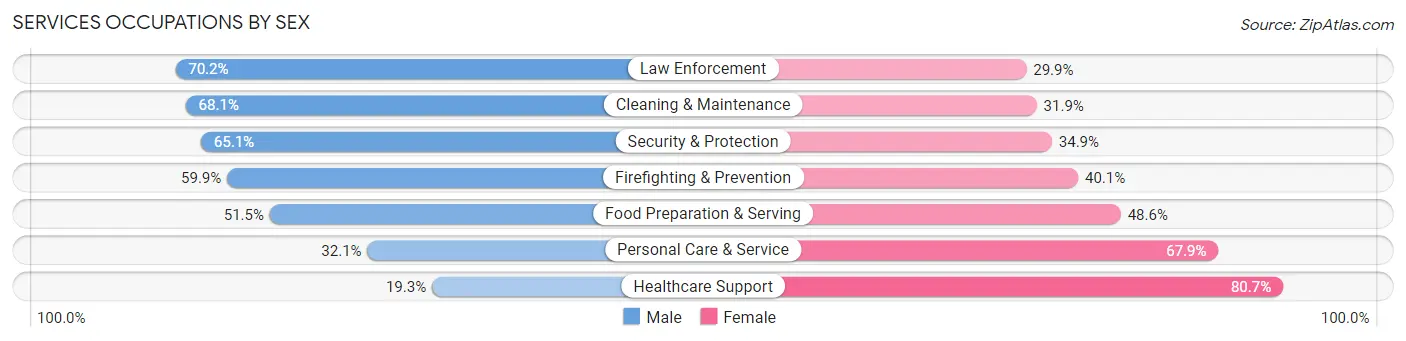
| Occupation | Male | Female |
| Healthcare Support | 730 (19.3%) | 3,047 (80.7%) |
| Security & Protection | 2,441 (65.1%) | 1,310 (34.9%) |
| Firefighting & Prevention | 1,113 (59.9%) | 745 (40.1%) |
| Law Enforcement | 1,328 (70.2%) | 565 (29.8%) |
| Food Preparation & Serving | 4,721 (51.4%) | 4,455 (48.5%) |
| Cleaning & Maintenance | 3,189 (68.1%) | 1,494 (31.9%) |
| Personal Care & Service | 1,272 (32.1%) | 2,688 (67.9%) |
| Total (Category) | 12,353 (48.7%) | 12,994 (51.3%) |
| Total (Overall) | 73,426 (48.8%) | 77,071 (51.2%) |
Sales and Office Occupations
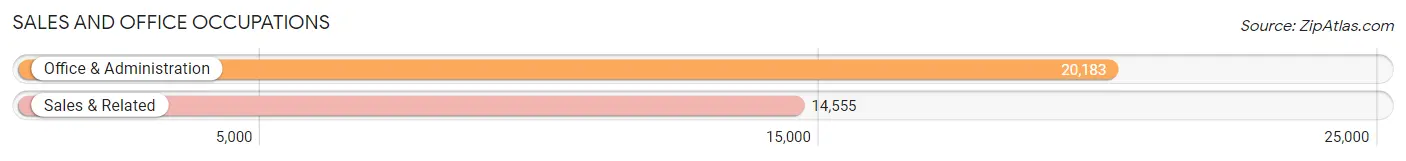
The most common Sales and Office occupations in Leon County are Office & Administration (20,183 | 13.4%), and Sales & Related (14,555 | 9.7%).
Sales and Office Occupations by Sex
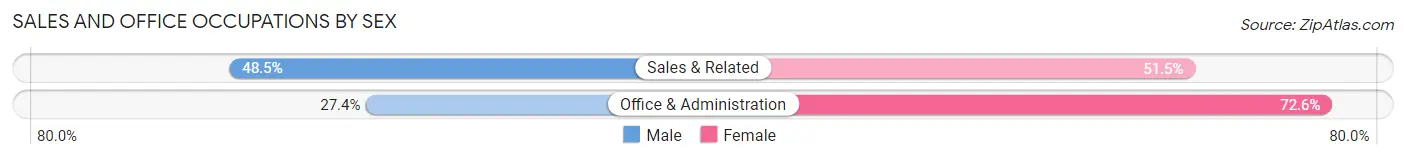
| Occupation | Male | Female |
| Sales & Related | 7,059 (48.5%) | 7,496 (51.5%) |
| Office & Administration | 5,536 (27.4%) | 14,647 (72.6%) |
| Total (Category) | 12,595 (36.3%) | 22,143 (63.7%) |
| Total (Overall) | 73,426 (48.8%) | 77,071 (51.2%) |
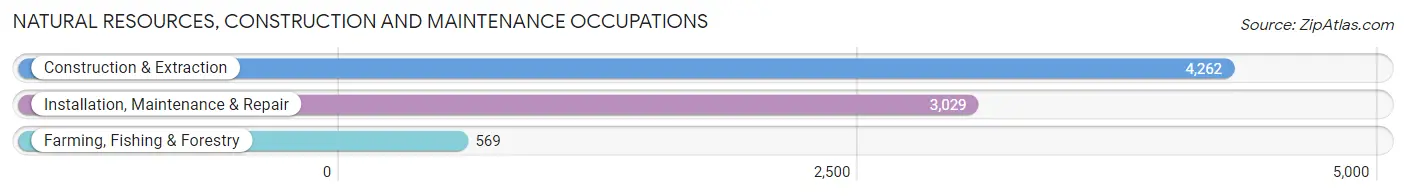
Natural Resources, Construction and Maintenance Occupations
The most common Natural Resources, Construction and Maintenance occupations in Leon County are Construction & Extraction (4,262 | 2.8%), Installation, Maintenance & Repair (3,029 | 2.0%), and Farming, Fishing & Forestry (569 | 0.4%).
Natural Resources, Construction and Maintenance Occupations by Sex
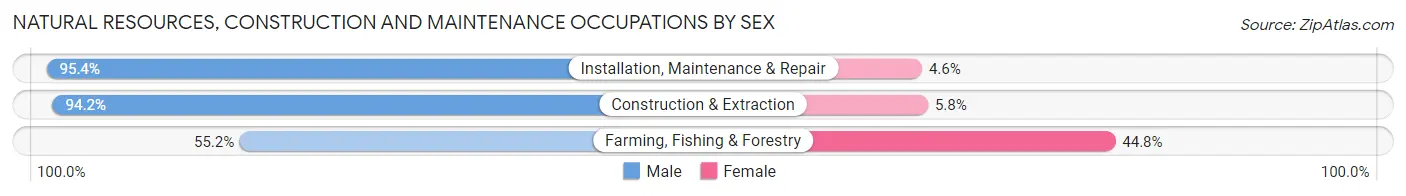
| Occupation | Male | Female |
| Farming, Fishing & Forestry | 314 (55.2%) | 255 (44.8%) |
| Construction & Extraction | 4,013 (94.2%) | 249 (5.8%) |
| Installation, Maintenance & Repair | 2,890 (95.4%) | 139 (4.6%) |
| Total (Category) | 7,217 (91.8%) | 643 (8.2%) |
| Total (Overall) | 73,426 (48.8%) | 77,071 (51.2%) |
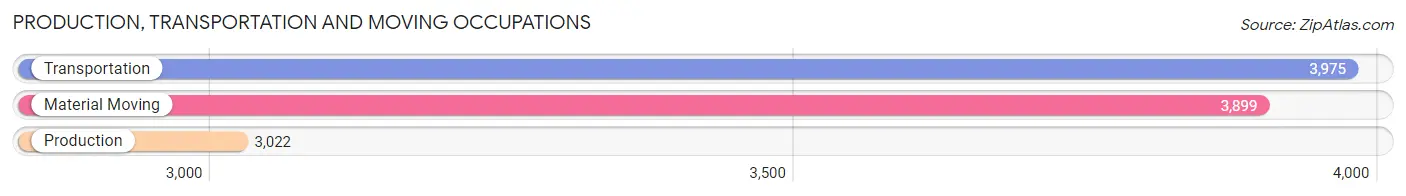
Production, Transportation and Moving Occupations
The most common Production, Transportation and Moving occupations in Leon County are Transportation (3,975 | 2.6%), Material Moving (3,899 | 2.6%), and Production (3,022 | 2.0%).
Production, Transportation and Moving Occupations by Sex
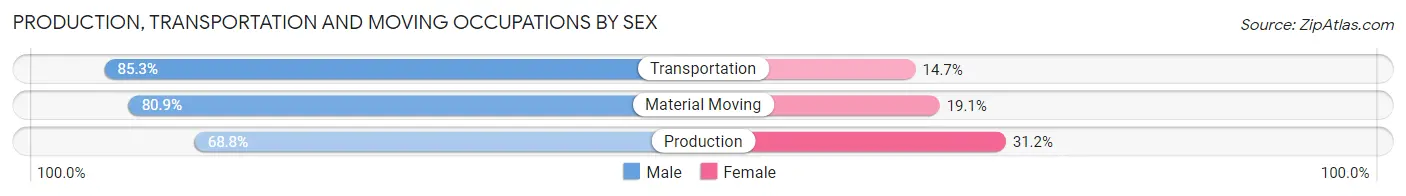
| Occupation | Male | Female |
| Production | 2,078 (68.8%) | 944 (31.2%) |
| Transportation | 3,391 (85.3%) | 584 (14.7%) |
| Material Moving | 3,154 (80.9%) | 745 (19.1%) |
| Total (Category) | 8,623 (79.1%) | 2,273 (20.9%) |
| Total (Overall) | 73,426 (48.8%) | 77,071 (51.2%) |
Employment Industries by Sex in Leon County
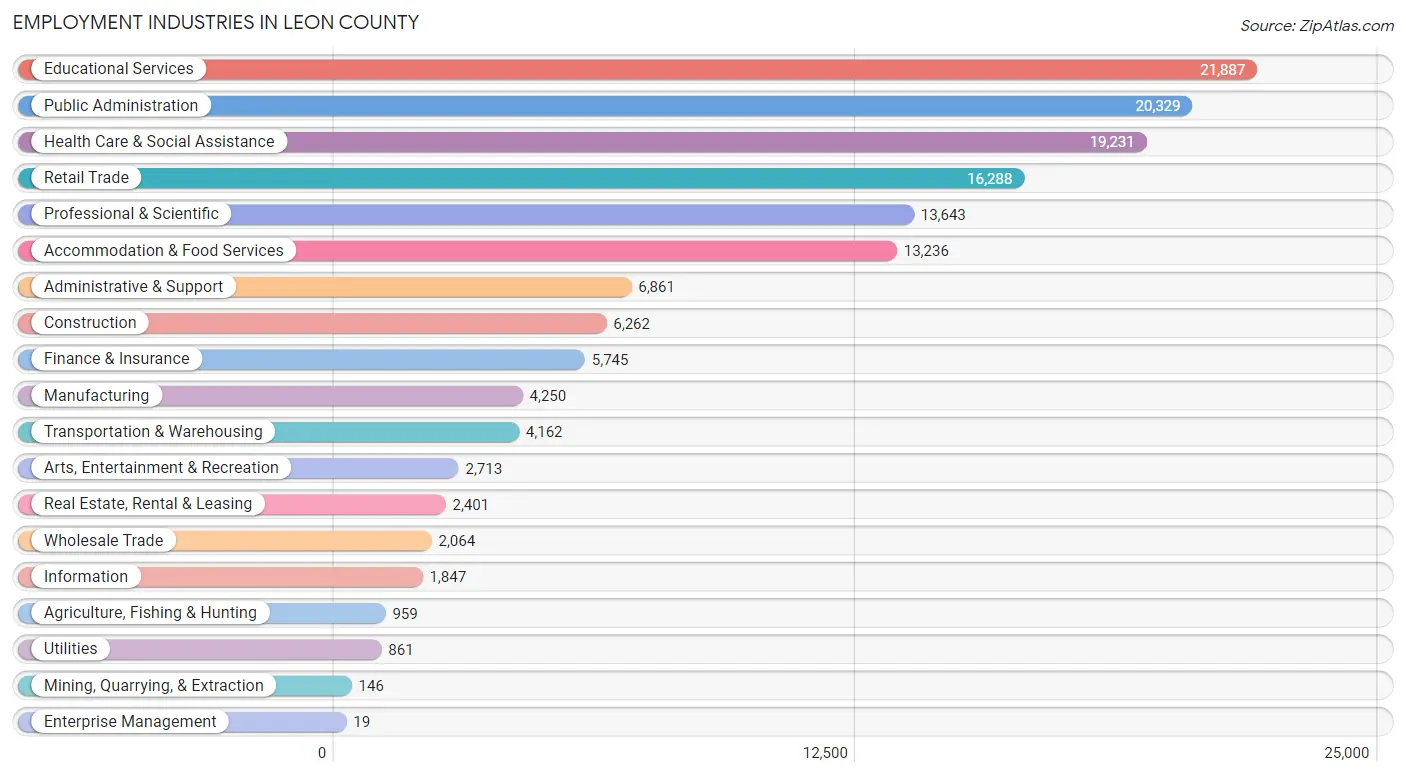
Employment Industries in Leon County
The major employment industries in Leon County include Educational Services (21,887 | 14.5%), Public Administration (20,329 | 13.5%), Health Care & Social Assistance (19,231 | 12.8%), Retail Trade (16,288 | 10.8%), and Professional & Scientific (13,643 | 9.1%).
Employment Industries by Sex in Leon County
The Leon County industries that see more men than women are Enterprise Management (94.7%), Construction (84.9%), and Utilities (83.5%), whereas the industries that tend to have a higher number of women are Health Care & Social Assistance (76.1%), Educational Services (59.5%), and Finance & Insurance (57.7%).
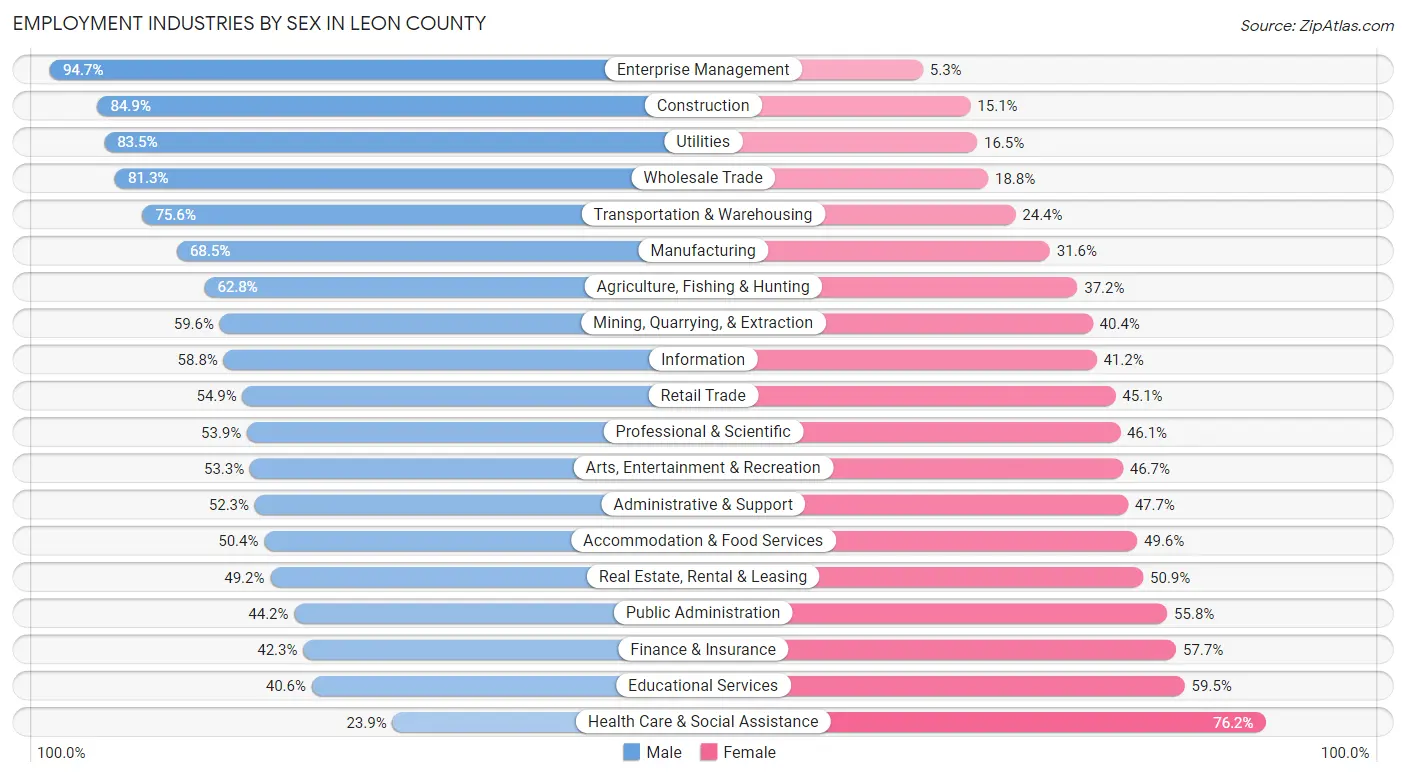
| Industry | Male | Female |
| Agriculture, Fishing & Hunting | 602 (62.8%) | 357 (37.2%) |
| Mining, Quarrying, & Extraction | 87 (59.6%) | 59 (40.4%) |
| Construction | 5,316 (84.9%) | 946 (15.1%) |
| Manufacturing | 2,909 (68.4%) | 1,341 (31.6%) |
| Wholesale Trade | 1,677 (81.2%) | 387 (18.8%) |
| Retail Trade | 8,939 (54.9%) | 7,349 (45.1%) |
| Transportation & Warehousing | 3,146 (75.6%) | 1,016 (24.4%) |
| Utilities | 719 (83.5%) | 142 (16.5%) |
| Information | 1,086 (58.8%) | 761 (41.2%) |
| Finance & Insurance | 2,431 (42.3%) | 3,314 (57.7%) |
| Real Estate, Rental & Leasing | 1,180 (49.1%) | 1,221 (50.8%) |
| Professional & Scientific | 7,359 (53.9%) | 6,284 (46.1%) |
| Enterprise Management | 18 (94.7%) | 1 (5.3%) |
| Administrative & Support | 3,591 (52.3%) | 3,270 (47.7%) |
| Educational Services | 8,875 (40.6%) | 13,012 (59.5%) |
| Health Care & Social Assistance | 4,587 (23.8%) | 14,644 (76.1%) |
| Arts, Entertainment & Recreation | 1,447 (53.3%) | 1,266 (46.7%) |
| Accommodation & Food Services | 6,669 (50.4%) | 6,567 (49.6%) |
| Public Administration | 8,980 (44.2%) | 11,349 (55.8%) |
| Total | 73,426 (48.8%) | 77,071 (51.2%) |
Education in Leon County
School Enrollment in Leon County
The most common levels of schooling among the 102,189 students in Leon County are college / undergraduate (46,598 | 45.6%), high school (13,619 | 13.3%), and middle school (12,234 | 12.0%).
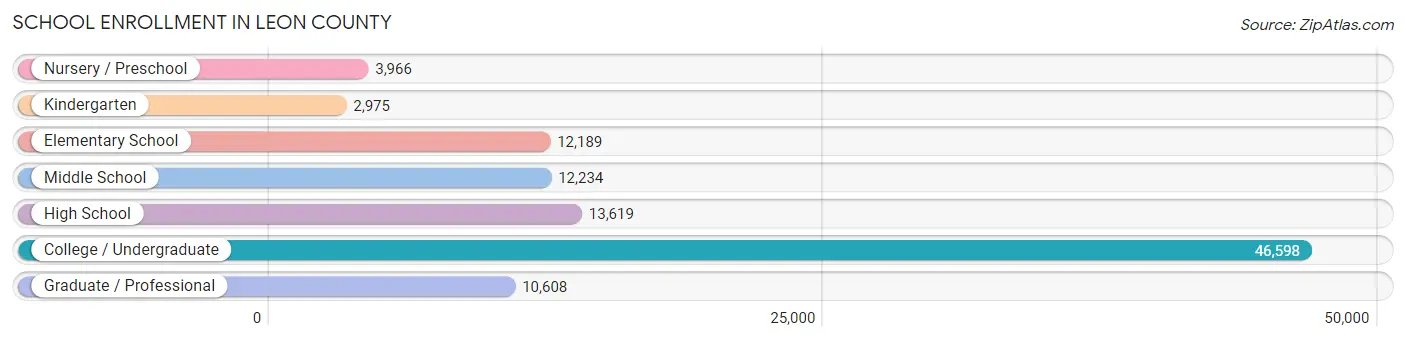
| School Level | # Students | % Students |
| Nursery / Preschool | 3,966 | 3.9% |
| Kindergarten | 2,975 | 2.9% |
| Elementary School | 12,189 | 11.9% |
| Middle School | 12,234 | 12.0% |
| High School | 13,619 | 13.3% |
| College / Undergraduate | 46,598 | 45.6% |
| Graduate / Professional | 10,608 | 10.4% |
| Total | 102,189 | 100.0% |
School Enrollment by Age by Funding Source in Leon County
Out of a total of 102,189 students who are enrolled in schools in Leon County, 10,934 (10.7%) attend a private institution, while the remaining 91,255 (89.3%) are enrolled in public schools. The age group of 3 to 4 year olds has the highest likelihood of being enrolled in private schools, with 1,554 (50.2% in the age bracket) enrolled. Conversely, the age group of 18 to 19 year olds has the lowest likelihood of being enrolled in a private school, with 17,305 (98.4% in the age bracket) attending a public institution.
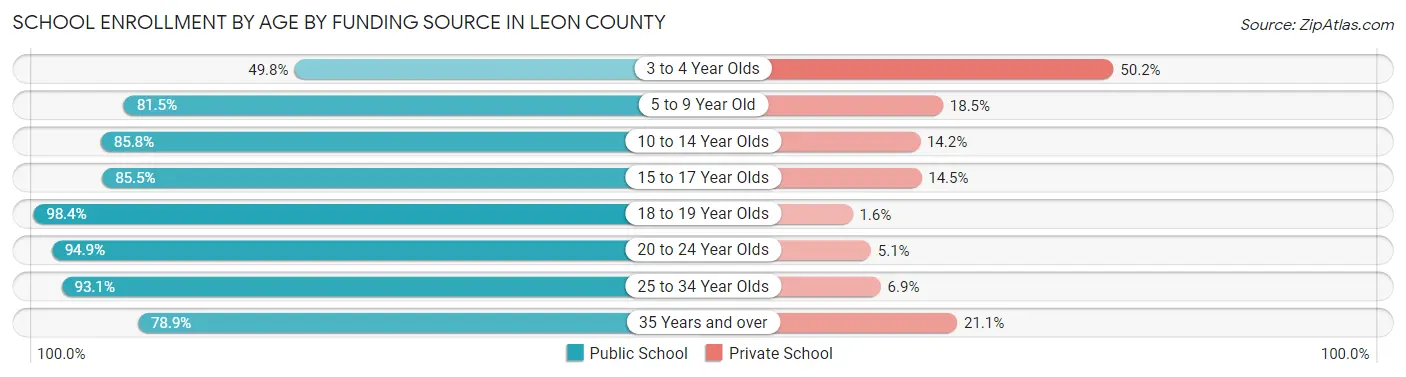
| Age Bracket | Public School | Private School |
| 3 to 4 Year Olds | 1,539 (49.8%) | 1,554 (50.2%) |
| 5 to 9 Year Old | 11,426 (81.5%) | 2,589 (18.5%) |
| 10 to 14 Year Olds | 13,232 (85.8%) | 2,192 (14.2%) |
| 15 to 17 Year Olds | 7,788 (85.5%) | 1,316 (14.5%) |
| 18 to 19 Year Olds | 17,305 (98.4%) | 286 (1.6%) |
| 20 to 24 Year Olds | 28,567 (94.9%) | 1,523 (5.1%) |
| 25 to 34 Year Olds | 8,374 (93.1%) | 620 (6.9%) |
| 35 Years and over | 3,059 (78.9%) | 819 (21.1%) |
| Total | 91,255 (89.3%) | 10,934 (10.7%) |
Educational Attainment by Field of Study in Leon County
Business (15,380 | 17.0%), social sciences (11,859 | 13.1%), education (8,833 | 9.8%), science & technology (7,653 | 8.5%), and arts & humanities (7,638 | 8.5%) are the most common fields of study among 90,250 individuals in Leon County who have obtained a bachelor's degree or higher.
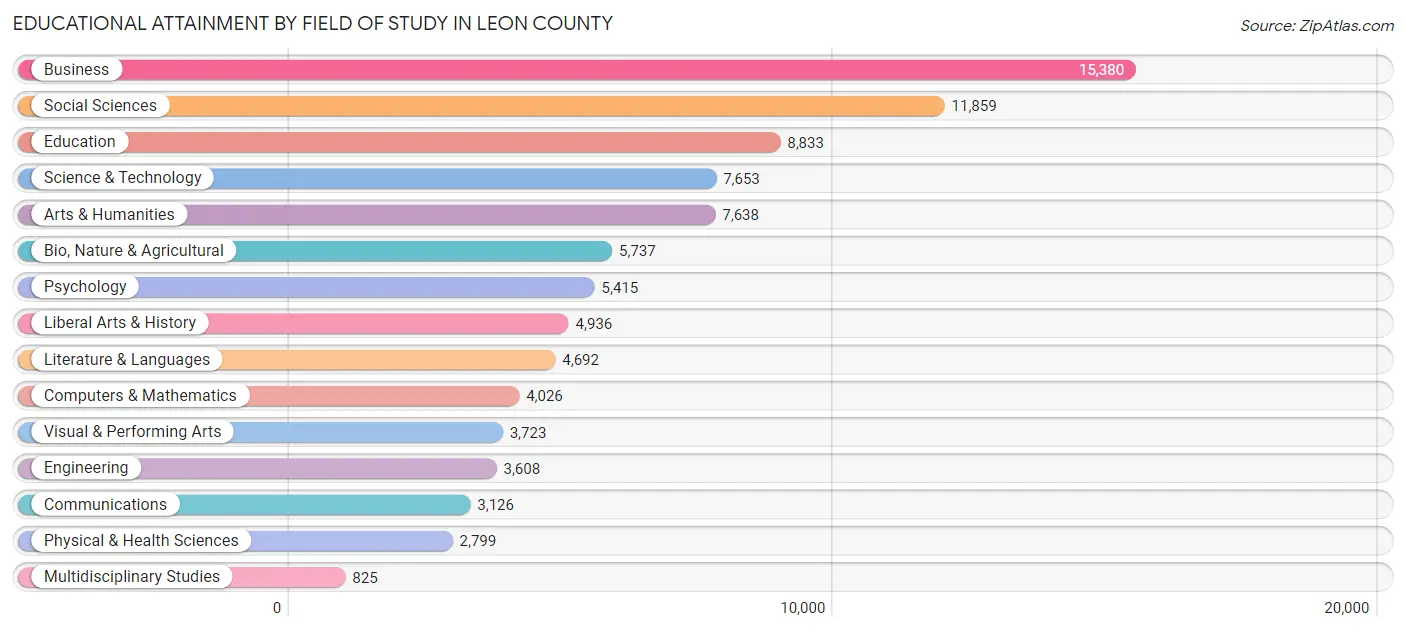
| Field of Study | # Graduates | % Graduates |
| Computers & Mathematics | 4,026 | 4.5% |
| Bio, Nature & Agricultural | 5,737 | 6.4% |
| Physical & Health Sciences | 2,799 | 3.1% |
| Psychology | 5,415 | 6.0% |
| Social Sciences | 11,859 | 13.1% |
| Engineering | 3,608 | 4.0% |
| Multidisciplinary Studies | 825 | 0.9% |
| Science & Technology | 7,653 | 8.5% |
| Business | 15,380 | 17.0% |
| Education | 8,833 | 9.8% |
| Literature & Languages | 4,692 | 5.2% |
| Liberal Arts & History | 4,936 | 5.5% |
| Visual & Performing Arts | 3,723 | 4.1% |
| Communications | 3,126 | 3.5% |
| Arts & Humanities | 7,638 | 8.5% |
| Total | 90,250 | 100.0% |
Transportation & Commute in Leon County
Vehicle Availability by Sex in Leon County
The most prevalent vehicle ownership categories in Leon County are males with 2 vehicles (32,579, accounting for 46.2%) and females with 2 vehicles (31,600, making up 44.4%).
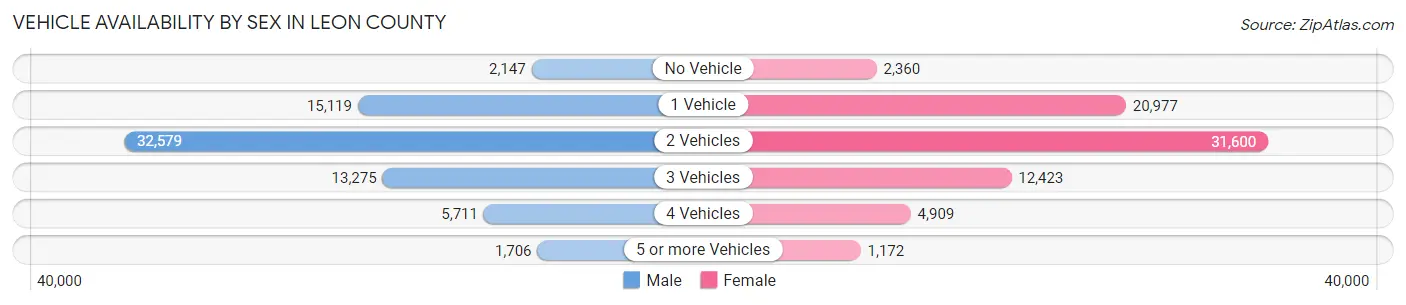
| Vehicles Available | Male | Female |
| No Vehicle | 2,147 (3.0%) | 2,360 (3.2%) |
| 1 Vehicle | 15,119 (21.4%) | 20,977 (28.6%) |
| 2 Vehicles | 32,579 (46.2%) | 31,600 (43.0%) |
| 3 Vehicles | 13,275 (18.8%) | 12,423 (16.9%) |
| 4 Vehicles | 5,711 (8.1%) | 4,909 (6.7%) |
| 5 or more Vehicles | 1,706 (2.4%) | 1,172 (1.6%) |
| Total | 70,537 (100.0%) | 73,441 (100.0%) |
Commute Time in Leon County
The most frequently occuring commute durations in Leon County are 15 to 19 minutes (28,879 commuters, 22.1%), 20 to 24 minutes (24,146 commuters, 18.5%), and 10 to 14 minutes (21,900 commuters, 16.8%).
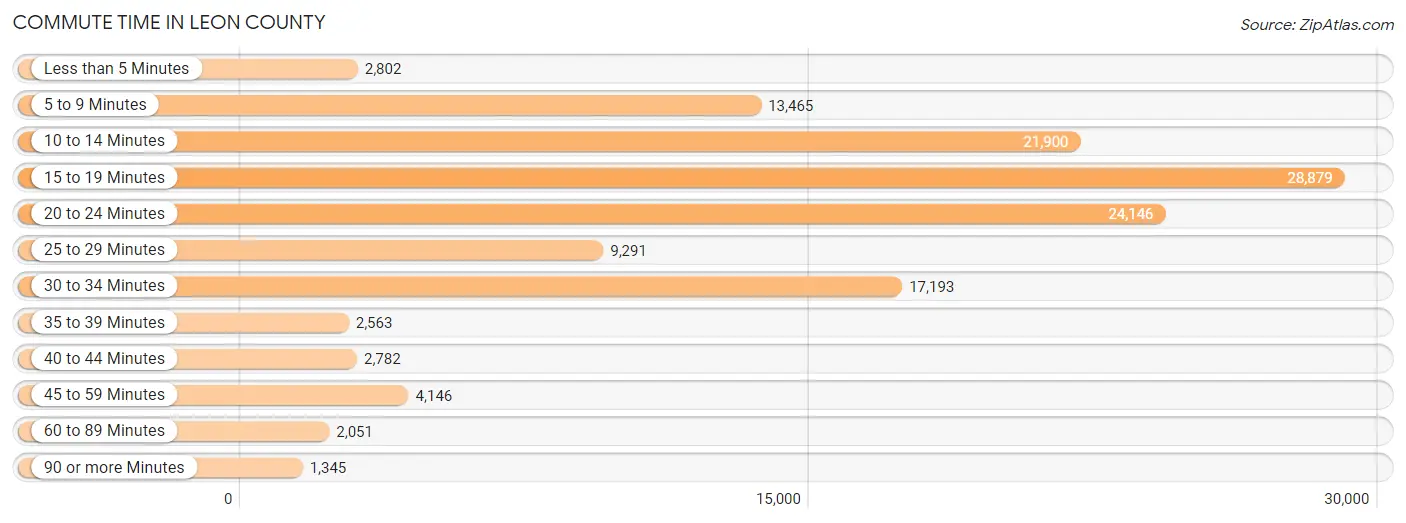
| Commute Time | # Commuters | % Commuters |
| Less than 5 Minutes | 2,802 | 2.1% |
| 5 to 9 Minutes | 13,465 | 10.3% |
| 10 to 14 Minutes | 21,900 | 16.8% |
| 15 to 19 Minutes | 28,879 | 22.1% |
| 20 to 24 Minutes | 24,146 | 18.5% |
| 25 to 29 Minutes | 9,291 | 7.1% |
| 30 to 34 Minutes | 17,193 | 13.2% |
| 35 to 39 Minutes | 2,563 | 2.0% |
| 40 to 44 Minutes | 2,782 | 2.1% |
| 45 to 59 Minutes | 4,146 | 3.2% |
| 60 to 89 Minutes | 2,051 | 1.6% |
| 90 or more Minutes | 1,345 | 1.0% |
Commute Time by Sex in Leon County
The most common commute times in Leon County are 15 to 19 minutes (14,682 commuters, 22.9%) for males and 15 to 19 minutes (14,197 commuters, 21.3%) for females.
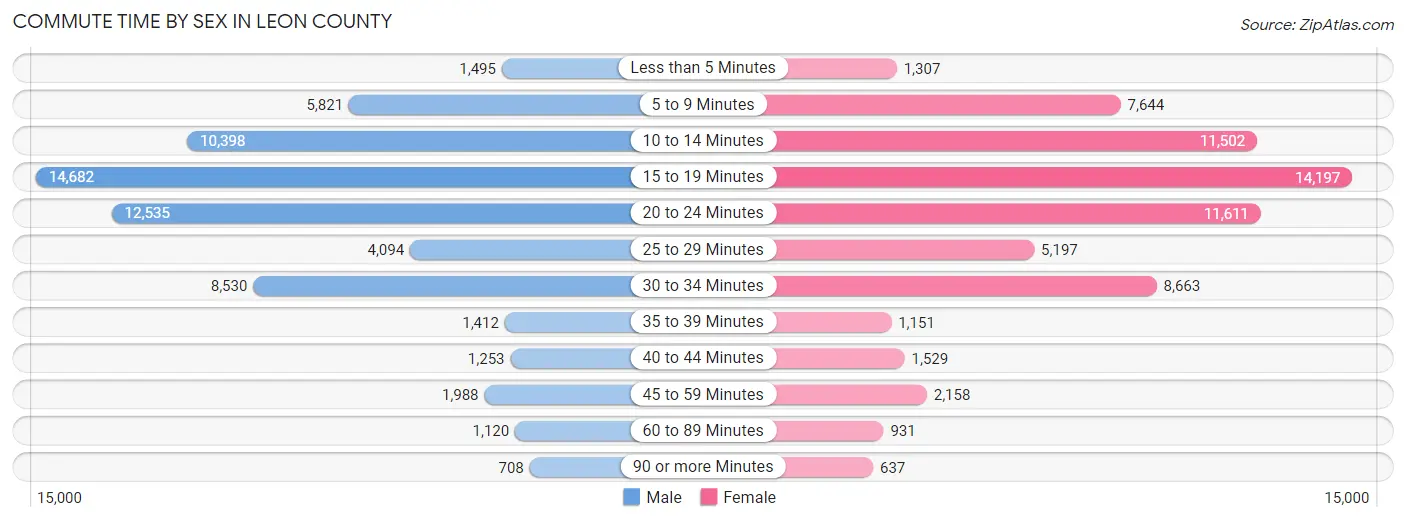
| Commute Time | Male | Female |
| Less than 5 Minutes | 1,495 (2.3%) | 1,307 (2.0%) |
| 5 to 9 Minutes | 5,821 (9.1%) | 7,644 (11.5%) |
| 10 to 14 Minutes | 10,398 (16.2%) | 11,502 (17.3%) |
| 15 to 19 Minutes | 14,682 (22.9%) | 14,197 (21.3%) |
| 20 to 24 Minutes | 12,535 (19.6%) | 11,611 (17.4%) |
| 25 to 29 Minutes | 4,094 (6.4%) | 5,197 (7.8%) |
| 30 to 34 Minutes | 8,530 (13.3%) | 8,663 (13.0%) |
| 35 to 39 Minutes | 1,412 (2.2%) | 1,151 (1.7%) |
| 40 to 44 Minutes | 1,253 (2.0%) | 1,529 (2.3%) |
| 45 to 59 Minutes | 1,988 (3.1%) | 2,158 (3.2%) |
| 60 to 89 Minutes | 1,120 (1.8%) | 931 (1.4%) |
| 90 or more Minutes | 708 (1.1%) | 637 (1.0%) |
Time of Departure to Work by Sex in Leon County
The most frequent times of departure to work in Leon County are 7:30 AM to 7:59 AM (10,009, 15.6%) for males and 7:30 AM to 7:59 AM (13,470, 20.3%) for females.
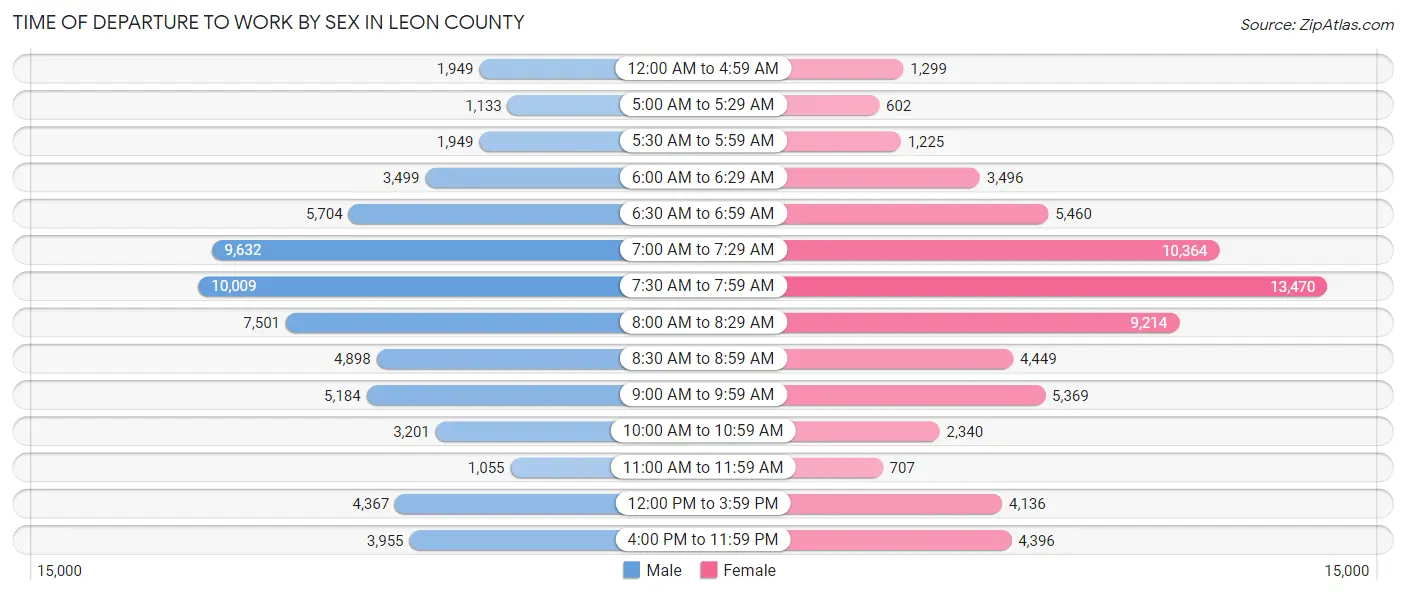
| Time of Departure | Male | Female |
| 12:00 AM to 4:59 AM | 1,949 (3.0%) | 1,299 (1.9%) |
| 5:00 AM to 5:29 AM | 1,133 (1.8%) | 602 (0.9%) |
| 5:30 AM to 5:59 AM | 1,949 (3.0%) | 1,225 (1.8%) |
| 6:00 AM to 6:29 AM | 3,499 (5.5%) | 3,496 (5.3%) |
| 6:30 AM to 6:59 AM | 5,704 (8.9%) | 5,460 (8.2%) |
| 7:00 AM to 7:29 AM | 9,632 (15.0%) | 10,364 (15.6%) |
| 7:30 AM to 7:59 AM | 10,009 (15.6%) | 13,470 (20.3%) |
| 8:00 AM to 8:29 AM | 7,501 (11.7%) | 9,214 (13.9%) |
| 8:30 AM to 8:59 AM | 4,898 (7.6%) | 4,449 (6.7%) |
| 9:00 AM to 9:59 AM | 5,184 (8.1%) | 5,369 (8.1%) |
| 10:00 AM to 10:59 AM | 3,201 (5.0%) | 2,340 (3.5%) |
| 11:00 AM to 11:59 AM | 1,055 (1.7%) | 707 (1.1%) |
| 12:00 PM to 3:59 PM | 4,367 (6.8%) | 4,136 (6.2%) |
| 4:00 PM to 11:59 PM | 3,955 (6.2%) | 4,396 (6.6%) |
| Total | 64,036 (100.0%) | 66,527 (100.0%) |
Housing Occupancy in Leon County
Occupancy by Ownership in Leon County
Of the total 118,755 dwellings in Leon County, owner-occupied units account for 61,897 (52.1%), while renter-occupied units make up 56,858 (47.9%).
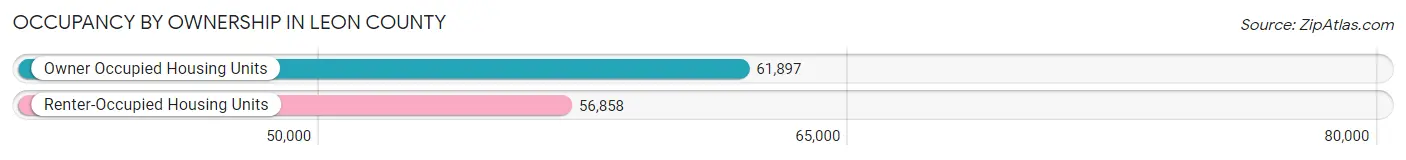
| Occupancy | # Housing Units | % Housing Units |
| Owner Occupied Housing Units | 61,897 | 52.1% |
| Renter-Occupied Housing Units | 56,858 | 47.9% |
| Total Occupied Housing Units | 118,755 | 100.0% |
Occupancy by Household Size in Leon County
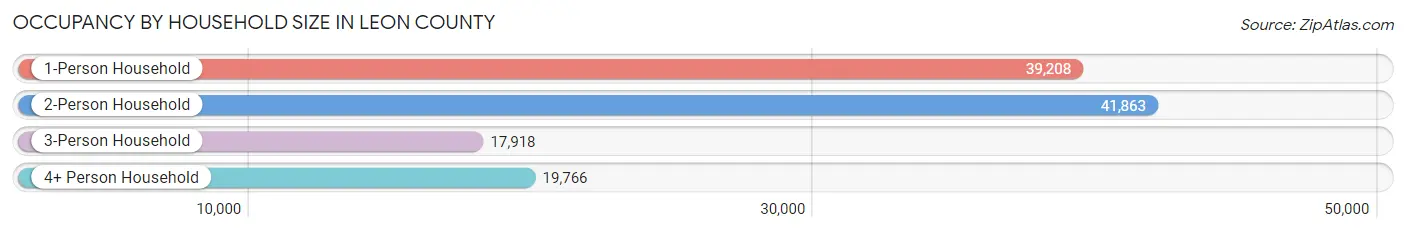
| Household Size | # Housing Units | % Housing Units |
| 1-Person Household | 39,208 | 33.0% |
| 2-Person Household | 41,863 | 35.2% |
| 3-Person Household | 17,918 | 15.1% |
| 4+ Person Household | 19,766 | 16.6% |
| Total Housing Units | 118,755 | 100.0% |
Occupancy by Ownership by Household Size in Leon County
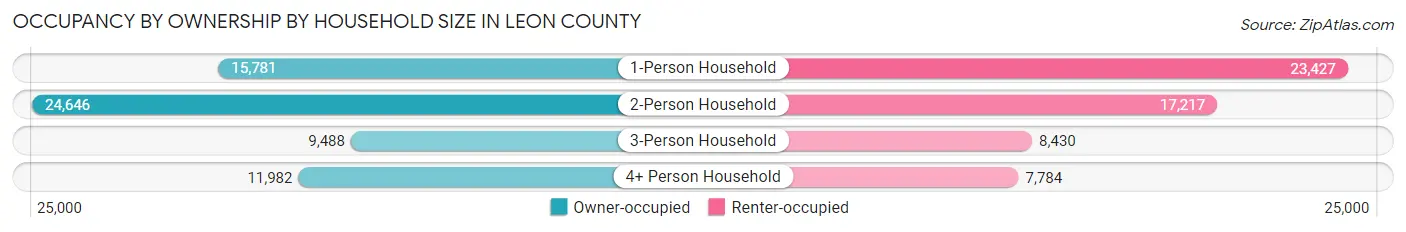
| Household Size | Owner-occupied | Renter-occupied |
| 1-Person Household | 15,781 (40.3%) | 23,427 (59.8%) |
| 2-Person Household | 24,646 (58.9%) | 17,217 (41.1%) |
| 3-Person Household | 9,488 (52.9%) | 8,430 (47.0%) |
| 4+ Person Household | 11,982 (60.6%) | 7,784 (39.4%) |
| Total Housing Units | 61,897 (52.1%) | 56,858 (47.9%) |
Occupancy by Educational Attainment in Leon County
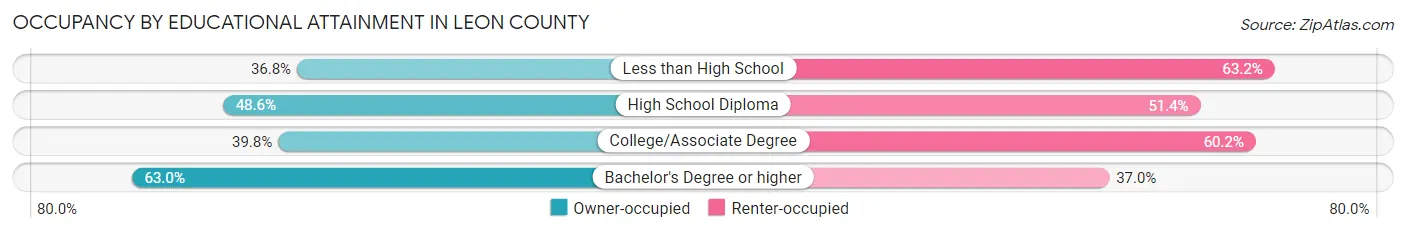
| Household Size | Owner-occupied | Renter-occupied |
| Less than High School | 2,297 (36.8%) | 3,945 (63.2%) |
| High School Diploma | 8,506 (48.6%) | 9,008 (51.4%) |
| College/Associate Degree | 15,056 (39.8%) | 22,775 (60.2%) |
| Bachelor's Degree or higher | 36,038 (63.0%) | 21,130 (37.0%) |
Occupancy by Age of Householder in Leon County
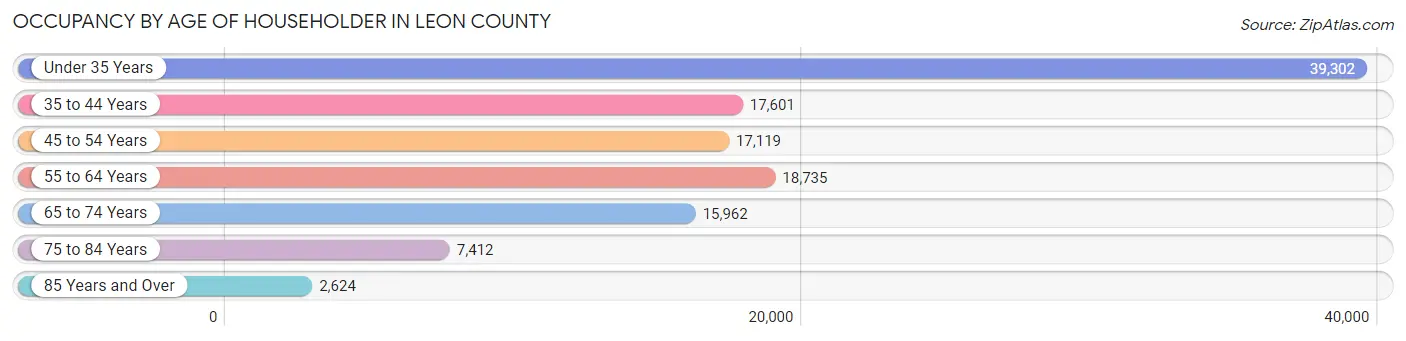
| Age Bracket | # Households | % Households |
| Under 35 Years | 39,302 | 33.1% |
| 35 to 44 Years | 17,601 | 14.8% |
| 45 to 54 Years | 17,119 | 14.4% |
| 55 to 64 Years | 18,735 | 15.8% |
| 65 to 74 Years | 15,962 | 13.4% |
| 75 to 84 Years | 7,412 | 6.2% |
| 85 Years and Over | 2,624 | 2.2% |
| Total | 118,755 | 100.0% |
Housing Finances in Leon County
Median Income by Occupancy in Leon County
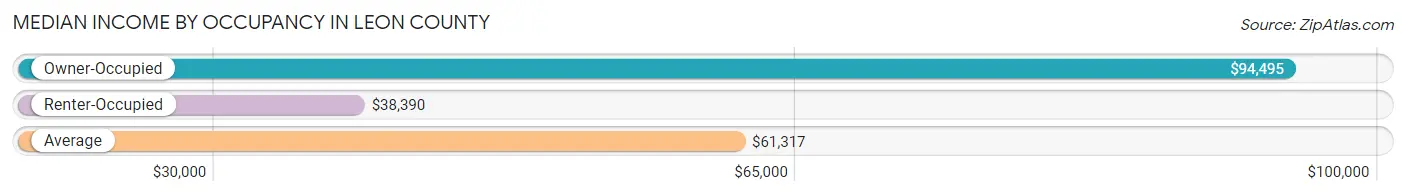
| Occupancy Type | # Households | Median Income |
| Owner-Occupied | 61,897 (52.1%) | $94,495 |
| Renter-Occupied | 56,858 (47.9%) | $38,390 |
| Average | 118,755 (100.0%) | $61,317 |
Occupancy by Householder Income Bracket in Leon County
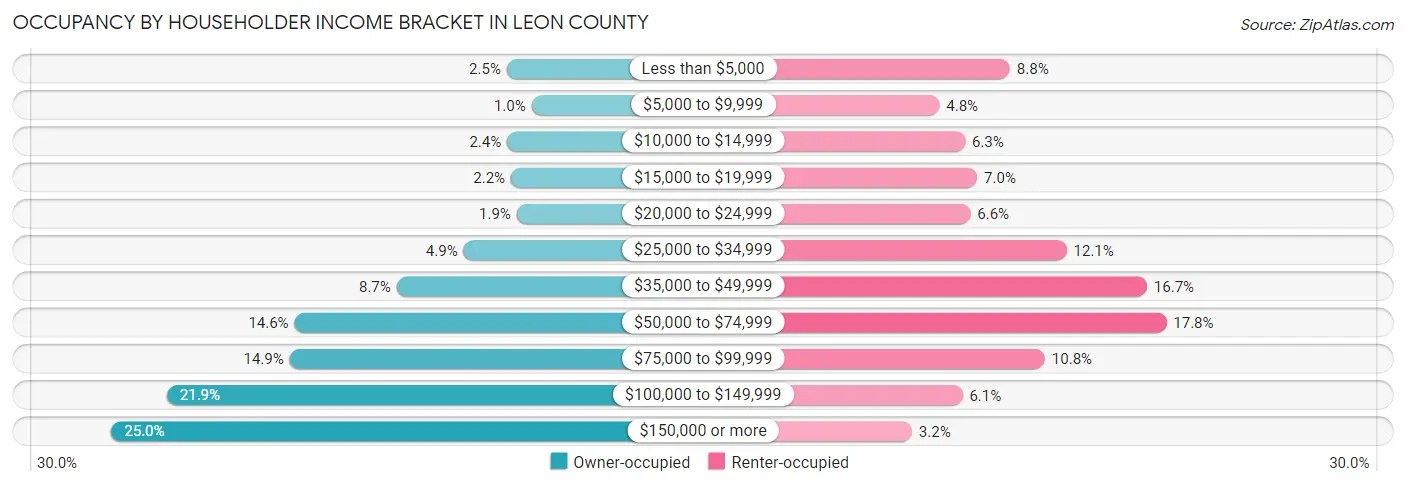
| Income Bracket | Owner-occupied | Renter-occupied |
| Less than $5,000 | 1,516 (2.5%) | 5,016 (8.8%) |
| $5,000 to $9,999 | 640 (1.0%) | 2,725 (4.8%) |
| $10,000 to $14,999 | 1,505 (2.4%) | 3,555 (6.2%) |
| $15,000 to $19,999 | 1,366 (2.2%) | 3,950 (7.0%) |
| $20,000 to $24,999 | 1,162 (1.9%) | 3,731 (6.6%) |
| $25,000 to $34,999 | 3,043 (4.9%) | 6,857 (12.1%) |
| $35,000 to $49,999 | 5,407 (8.7%) | 9,469 (16.7%) |
| $50,000 to $74,999 | 9,024 (14.6%) | 10,096 (17.8%) |
| $75,000 to $99,999 | 9,197 (14.9%) | 6,154 (10.8%) |
| $100,000 to $149,999 | 13,539 (21.9%) | 3,474 (6.1%) |
| $150,000 or more | 15,498 (25.0%) | 1,831 (3.2%) |
| Total | 61,897 (100.0%) | 56,858 (100.0%) |
Monthly Housing Cost Tiers in Leon County
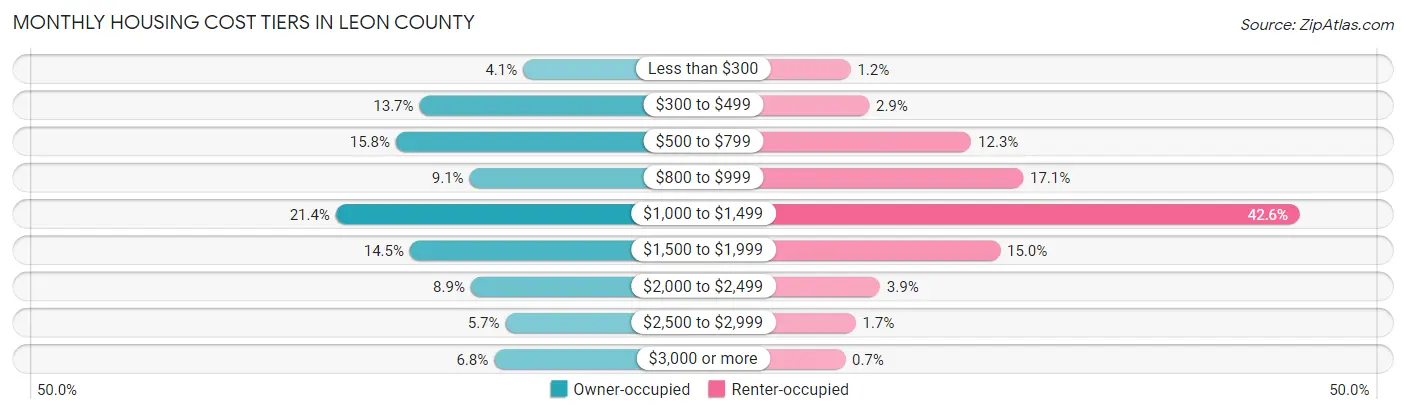
| Monthly Cost | Owner-occupied | Renter-occupied |
| Less than $300 | 2,541 (4.1%) | 683 (1.2%) |
| $300 to $499 | 8,457 (13.7%) | 1,652 (2.9%) |
| $500 to $799 | 9,798 (15.8%) | 6,997 (12.3%) |
| $800 to $999 | 5,604 (9.0%) | 9,716 (17.1%) |
| $1,000 to $1,499 | 13,220 (21.4%) | 24,202 (42.6%) |
| $1,500 to $1,999 | 9,000 (14.5%) | 8,509 (15.0%) |
| $2,000 to $2,499 | 5,528 (8.9%) | 2,222 (3.9%) |
| $2,500 to $2,999 | 3,553 (5.7%) | 949 (1.7%) |
| $3,000 or more | 4,196 (6.8%) | 398 (0.7%) |
| Total | 61,897 (100.0%) | 56,858 (100.0%) |
Physical Housing Characteristics in Leon County
Housing Structures in Leon County
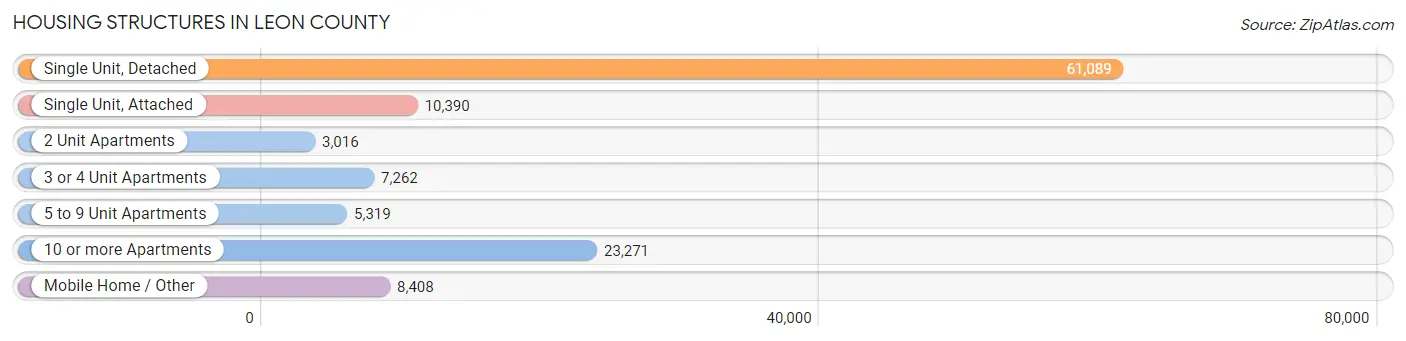
| Structure Type | # Housing Units | % Housing Units |
| Single Unit, Detached | 61,089 | 51.4% |
| Single Unit, Attached | 10,390 | 8.7% |
| 2 Unit Apartments | 3,016 | 2.5% |
| 3 or 4 Unit Apartments | 7,262 | 6.1% |
| 5 to 9 Unit Apartments | 5,319 | 4.5% |
| 10 or more Apartments | 23,271 | 19.6% |
| Mobile Home / Other | 8,408 | 7.1% |
| Total | 118,755 | 100.0% |
Housing Structures by Occupancy in Leon County
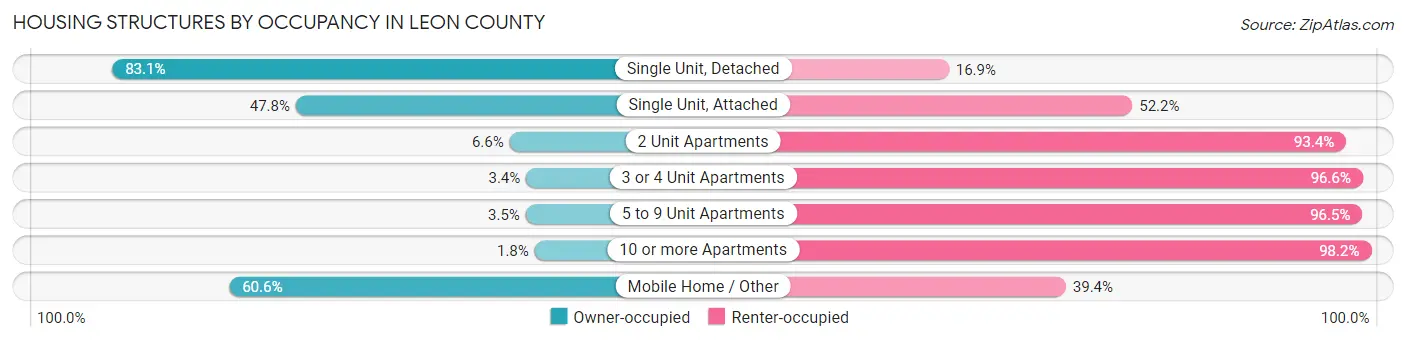
| Structure Type | Owner-occupied | Renter-occupied |
| Single Unit, Detached | 50,781 (83.1%) | 10,308 (16.9%) |
| Single Unit, Attached | 4,965 (47.8%) | 5,425 (52.2%) |
| 2 Unit Apartments | 200 (6.6%) | 2,816 (93.4%) |
| 3 or 4 Unit Apartments | 250 (3.4%) | 7,012 (96.6%) |
| 5 to 9 Unit Apartments | 188 (3.5%) | 5,131 (96.5%) |
| 10 or more Apartments | 419 (1.8%) | 22,852 (98.2%) |
| Mobile Home / Other | 5,094 (60.6%) | 3,314 (39.4%) |
| Total | 61,897 (52.1%) | 56,858 (47.9%) |
Housing Structures by Number of Rooms in Leon County
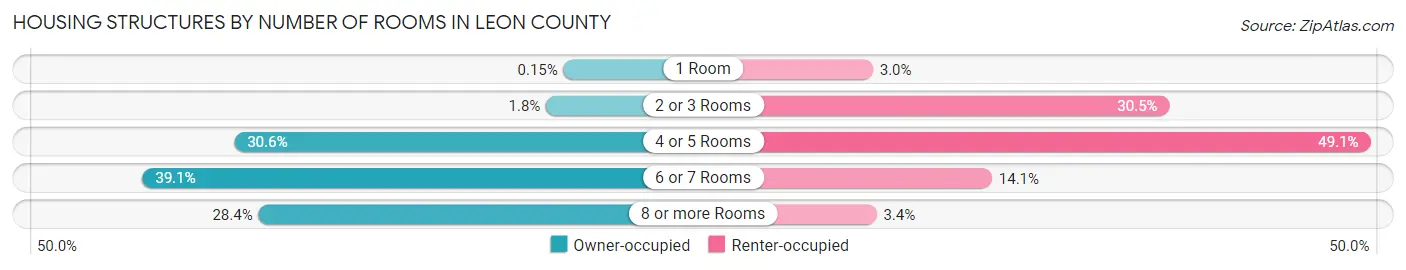
| Number of Rooms | Owner-occupied | Renter-occupied |
| 1 Room | 94 (0.2%) | 1,728 (3.0%) |
| 2 or 3 Rooms | 1,089 (1.8%) | 17,326 (30.5%) |
| 4 or 5 Rooms | 18,948 (30.6%) | 27,896 (49.1%) |
| 6 or 7 Rooms | 24,206 (39.1%) | 7,988 (14.1%) |
| 8 or more Rooms | 17,560 (28.4%) | 1,920 (3.4%) |
| Total | 61,897 (100.0%) | 56,858 (100.0%) |
Housing Structure by Heating Type in Leon County
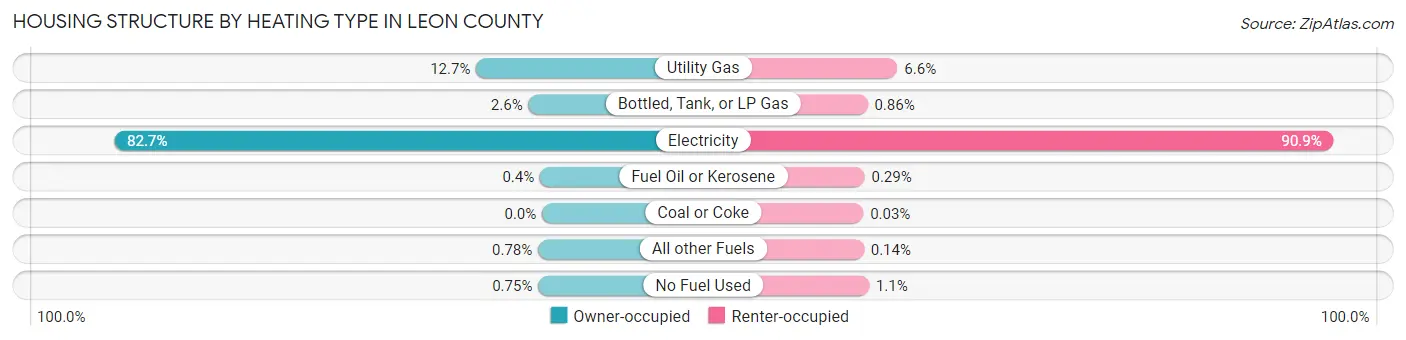
| Heating Type | Owner-occupied | Renter-occupied |
| Utility Gas | 7,877 (12.7%) | 3,775 (6.6%) |
| Bottled, Tank, or LP Gas | 1,630 (2.6%) | 487 (0.9%) |
| Electricity | 51,195 (82.7%) | 51,692 (90.9%) |
| Fuel Oil or Kerosene | 245 (0.4%) | 164 (0.3%) |
| Coal or Coke | 0 (0.0%) | 16 (0.0%) |
| All other Fuels | 485 (0.8%) | 77 (0.1%) |
| No Fuel Used | 465 (0.7%) | 647 (1.1%) |
| Total | 61,897 (100.0%) | 56,858 (100.0%) |
Household Vehicle Usage in Leon County
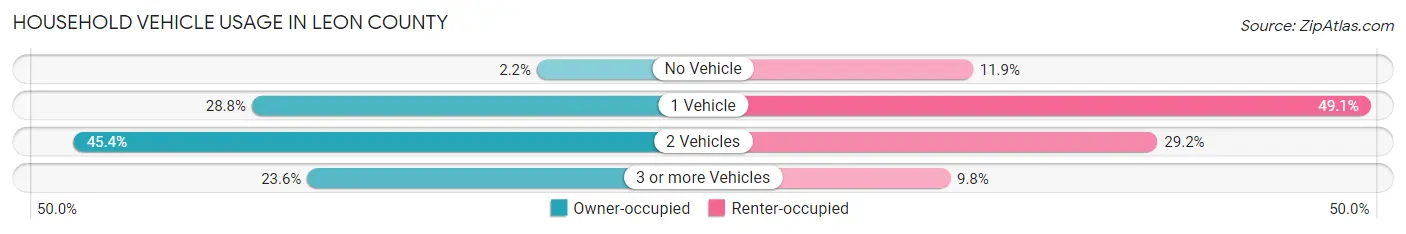
| Vehicles per Household | Owner-occupied | Renter-occupied |
| No Vehicle | 1,351 (2.2%) | 6,790 (11.9%) |
| 1 Vehicle | 17,821 (28.8%) | 27,902 (49.1%) |
| 2 Vehicles | 28,106 (45.4%) | 16,588 (29.2%) |
| 3 or more Vehicles | 14,619 (23.6%) | 5,578 (9.8%) |
| Total | 61,897 (100.0%) | 56,858 (100.0%) |
Real Estate & Mortgages in Leon County
Real Estate and Mortgage Overview in Leon County
| Characteristic | Without Mortgage | With Mortgage |
| Housing Units | 23,319 | 38,578 |
| Median Property Value | $246,200 | $262,600 |
| Median Household Income | $78,788 | $10,800 |
| Monthly Housing Costs | $527 | $4,135 |
| Real Estate Taxes | $1,956 | $1,065 |
Property Value by Mortgage Status in Leon County
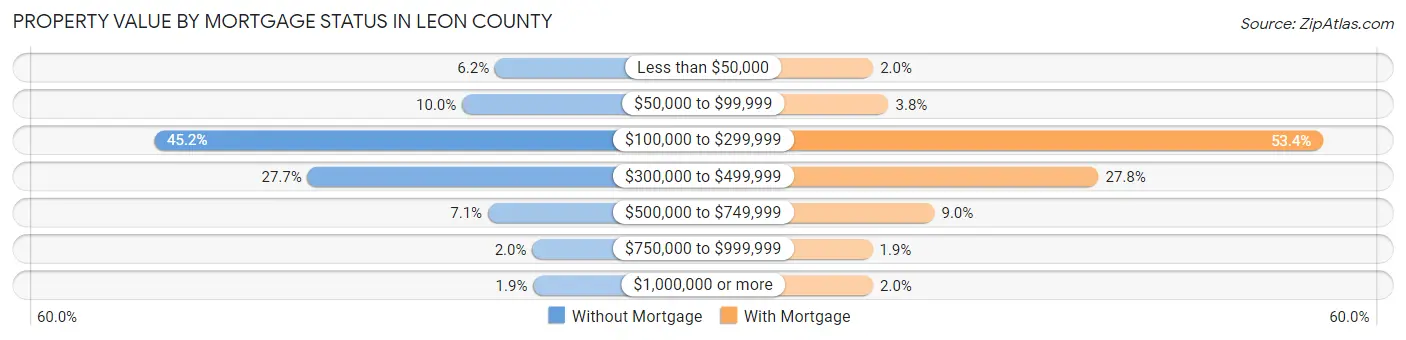
| Property Value | Without Mortgage | With Mortgage |
| Less than $50,000 | 1,454 (6.2%) | 779 (2.0%) |
| $50,000 to $99,999 | 2,332 (10.0%) | 1,459 (3.8%) |
| $100,000 to $299,999 | 10,543 (45.2%) | 20,617 (53.4%) |
| $300,000 to $499,999 | 6,449 (27.7%) | 10,714 (27.8%) |
| $500,000 to $749,999 | 1,644 (7.0%) | 3,482 (9.0%) |
| $750,000 to $999,999 | 462 (2.0%) | 750 (1.9%) |
| $1,000,000 or more | 435 (1.9%) | 777 (2.0%) |
| Total | 23,319 (100.0%) | 38,578 (100.0%) |
Household Income by Mortgage Status in Leon County
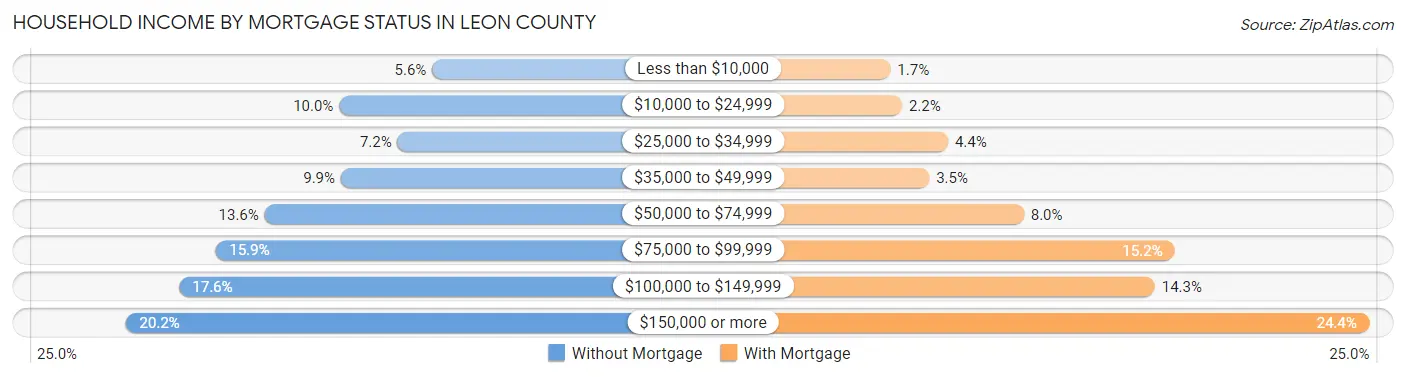
| Household Income | Without Mortgage | With Mortgage |
| Less than $10,000 | 1,304 (5.6%) | 642 (1.7%) |
| $10,000 to $24,999 | 2,337 (10.0%) | 852 (2.2%) |
| $25,000 to $34,999 | 1,688 (7.2%) | 1,696 (4.4%) |
| $35,000 to $49,999 | 2,317 (9.9%) | 1,355 (3.5%) |
| $50,000 to $74,999 | 3,164 (13.6%) | 3,090 (8.0%) |
| $75,000 to $99,999 | 3,700 (15.9%) | 5,860 (15.2%) |
| $100,000 to $149,999 | 4,111 (17.6%) | 5,497 (14.2%) |
| $150,000 or more | 4,698 (20.2%) | 9,428 (24.4%) |
| Total | 23,319 (100.0%) | 38,578 (100.0%) |
Property Value to Household Income Ratio in Leon County
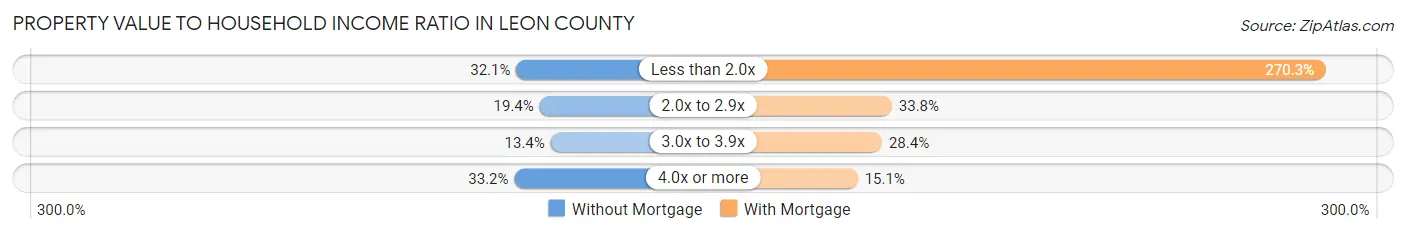
| Value-to-Income Ratio | Without Mortgage | With Mortgage |
| Less than 2.0x | 7,488 (32.1%) | 104,259 (270.3%) |
| 2.0x to 2.9x | 4,528 (19.4%) | 13,024 (33.8%) |
| 3.0x to 3.9x | 3,125 (13.4%) | 10,939 (28.4%) |
| 4.0x or more | 7,735 (33.2%) | 5,839 (15.1%) |
| Total | 23,319 (100.0%) | 38,578 (100.0%) |
Real Estate Taxes by Mortgage Status in Leon County
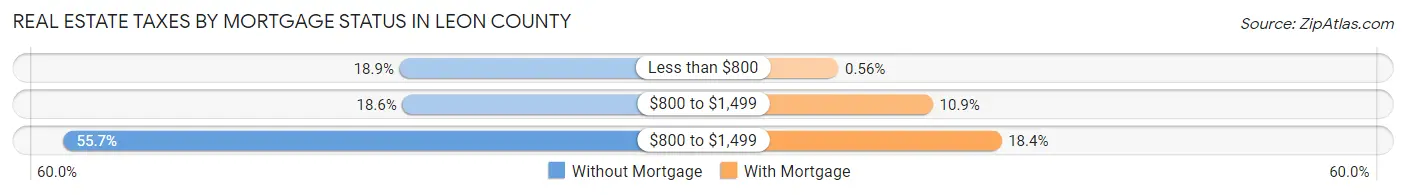
| Property Taxes | Without Mortgage | With Mortgage |
| Less than $800 | 4,406 (18.9%) | 216 (0.6%) |
| $800 to $1,499 | 4,333 (18.6%) | 4,210 (10.9%) |
| $800 to $1,499 | 12,993 (55.7%) | 7,111 (18.4%) |
| Total | 23,319 (100.0%) | 38,578 (100.0%) |
Health & Disability in Leon County
Health Insurance Coverage by Age in Leon County
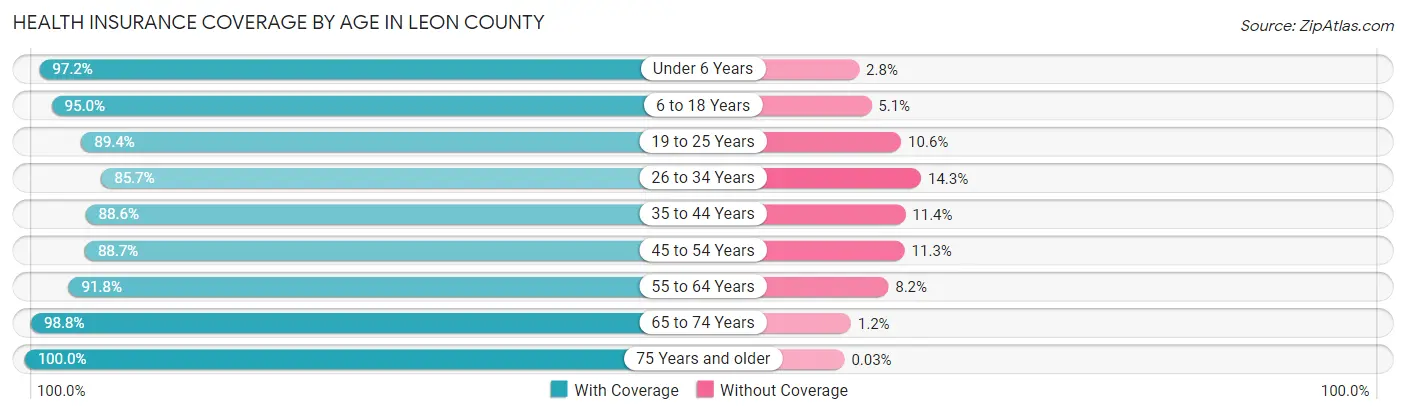
| Age Bracket | With Coverage | Without Coverage |
| Under 6 Years | 16,711 (97.2%) | 476 (2.8%) |
| 6 to 18 Years | 43,666 (95.0%) | 2,323 (5.1%) |
| 19 to 25 Years | 54,270 (89.4%) | 6,437 (10.6%) |
| 26 to 34 Years | 29,820 (85.7%) | 4,979 (14.3%) |
| 35 to 44 Years | 28,671 (88.6%) | 3,684 (11.4%) |
| 45 to 54 Years | 25,726 (88.7%) | 3,265 (11.3%) |
| 55 to 64 Years | 27,777 (91.8%) | 2,482 (8.2%) |
| 65 to 74 Years | 24,852 (98.8%) | 307 (1.2%) |
| 75 Years and older | 15,020 (100.0%) | 5 (0.0%) |
| Total | 266,513 (91.7%) | 23,958 (8.3%) |
Health Insurance Coverage by Citizenship Status in Leon County
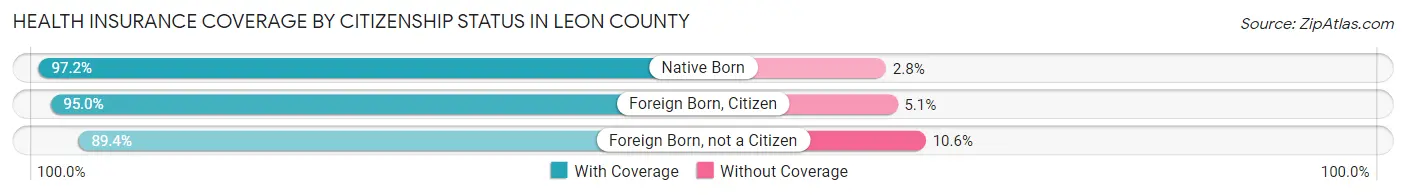
| Citizenship Status | With Coverage | Without Coverage |
| Native Born | 16,711 (97.2%) | 476 (2.8%) |
| Foreign Born, Citizen | 43,666 (95.0%) | 2,323 (5.1%) |
| Foreign Born, not a Citizen | 54,270 (89.4%) | 6,437 (10.6%) |
Health Insurance Coverage by Household Income in Leon County
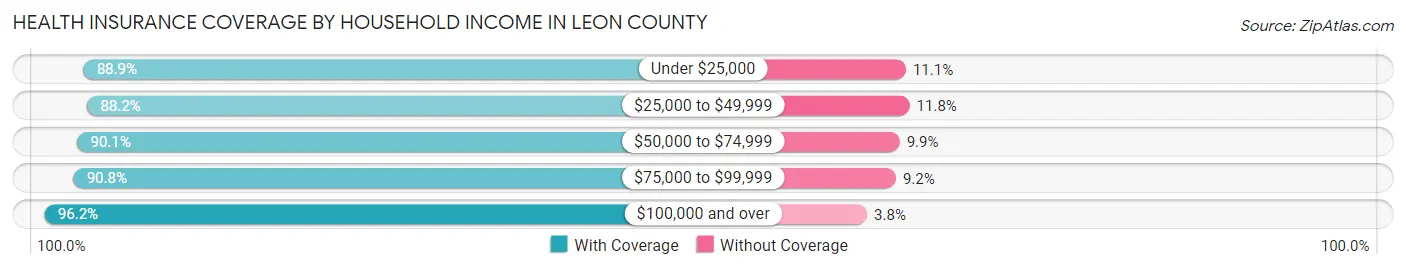
| Household Income | With Coverage | Without Coverage |
| Under $25,000 | 38,835 (88.9%) | 4,844 (11.1%) |
| $25,000 to $49,999 | 43,584 (88.2%) | 5,818 (11.8%) |
| $50,000 to $74,999 | 39,605 (90.1%) | 4,356 (9.9%) |
| $75,000 to $99,999 | 35,243 (90.8%) | 3,574 (9.2%) |
| $100,000 and over | 96,236 (96.2%) | 3,812 (3.8%) |
Public vs Private Health Insurance Coverage by Age in Leon County
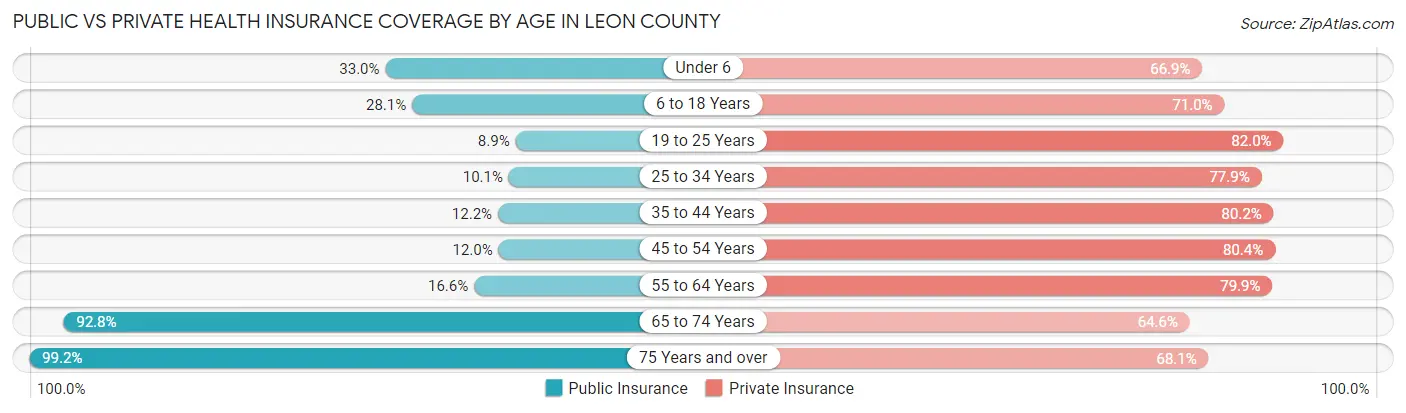
| Age Bracket | Public Insurance | Private Insurance |
| Under 6 | 5,678 (33.0%) | 11,499 (66.9%) |
| 6 to 18 Years | 12,915 (28.1%) | 32,662 (71.0%) |
| 19 to 25 Years | 5,390 (8.9%) | 49,764 (82.0%) |
| 25 to 34 Years | 3,523 (10.1%) | 27,106 (77.9%) |
| 35 to 44 Years | 3,931 (12.1%) | 25,932 (80.1%) |
| 45 to 54 Years | 3,489 (12.0%) | 23,311 (80.4%) |
| 55 to 64 Years | 5,017 (16.6%) | 24,179 (79.9%) |
| 65 to 74 Years | 23,350 (92.8%) | 16,251 (64.6%) |
| 75 Years and over | 14,898 (99.2%) | 10,228 (68.1%) |
| Total | 78,191 (26.9%) | 220,932 (76.1%) |
Disability Status by Sex by Age in Leon County
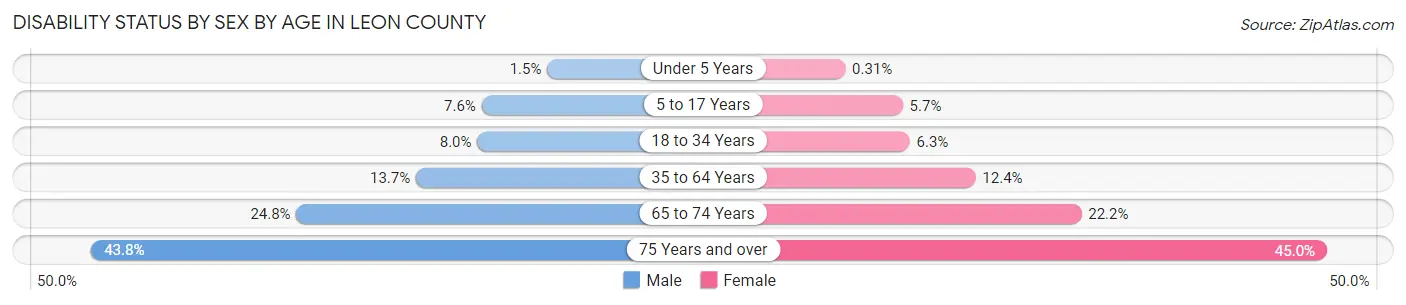
| Age Bracket | Male | Female |
| Under 5 Years | 111 (1.5%) | 22 (0.3%) |
| 5 to 17 Years | 1,522 (7.6%) | 1,095 (5.7%) |
| 18 to 34 Years | 3,908 (8.0%) | 3,499 (6.3%) |
| 35 to 64 Years | 5,964 (13.7%) | 5,949 (12.4%) |
| 65 to 74 Years | 2,862 (24.8%) | 3,025 (22.2%) |
| 75 Years and over | 2,715 (43.8%) | 3,974 (45.0%) |
Disability Class by Sex by Age in Leon County
Disability Class: Hearing Difficulty
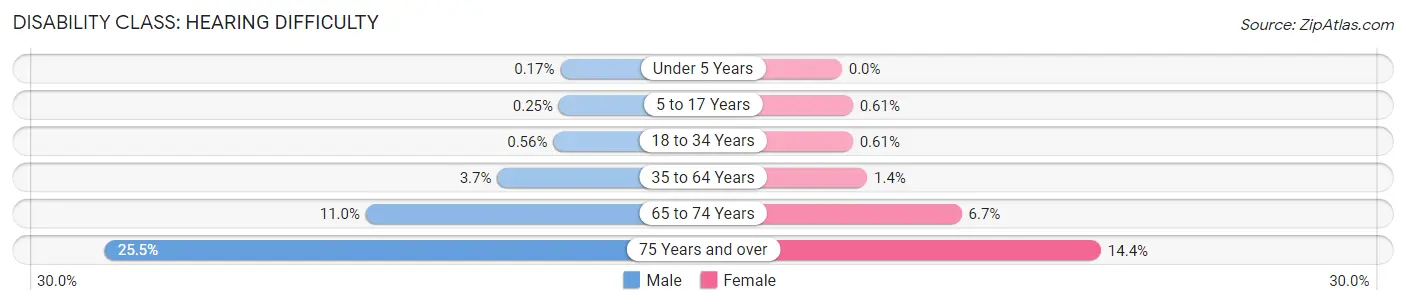
| Age Bracket | Male | Female |
| Under 5 Years | 13 (0.2%) | 0 (0.0%) |
| 5 to 17 Years | 50 (0.3%) | 119 (0.6%) |
| 18 to 34 Years | 275 (0.6%) | 340 (0.6%) |
| 35 to 64 Years | 1,606 (3.7%) | 675 (1.4%) |
| 65 to 74 Years | 1,271 (11.0%) | 907 (6.7%) |
| 75 Years and over | 1,582 (25.5%) | 1,274 (14.4%) |
Disability Class: Vision Difficulty
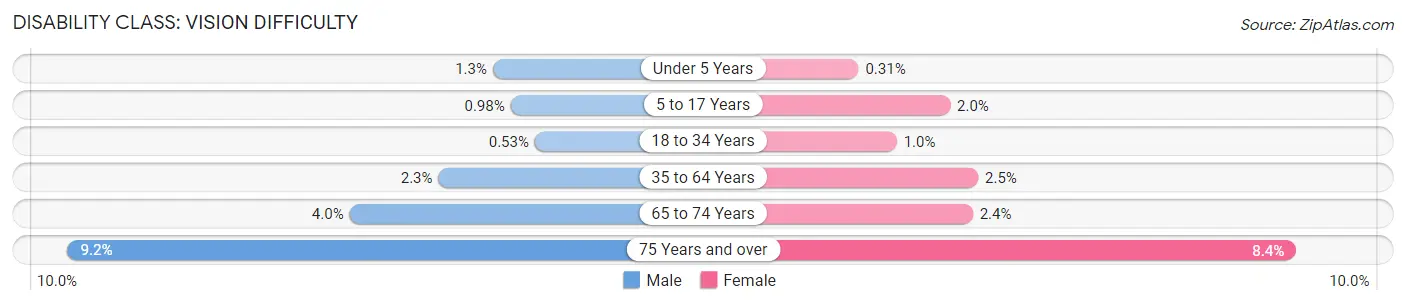
| Age Bracket | Male | Female |
| Under 5 Years | 98 (1.3%) | 22 (0.3%) |
| 5 to 17 Years | 197 (1.0%) | 389 (2.0%) |
| 18 to 34 Years | 262 (0.5%) | 566 (1.0%) |
| 35 to 64 Years | 1,014 (2.3%) | 1,213 (2.5%) |
| 65 to 74 Years | 459 (4.0%) | 330 (2.4%) |
| 75 Years and over | 570 (9.2%) | 744 (8.4%) |
Disability Class: Cognitive Difficulty
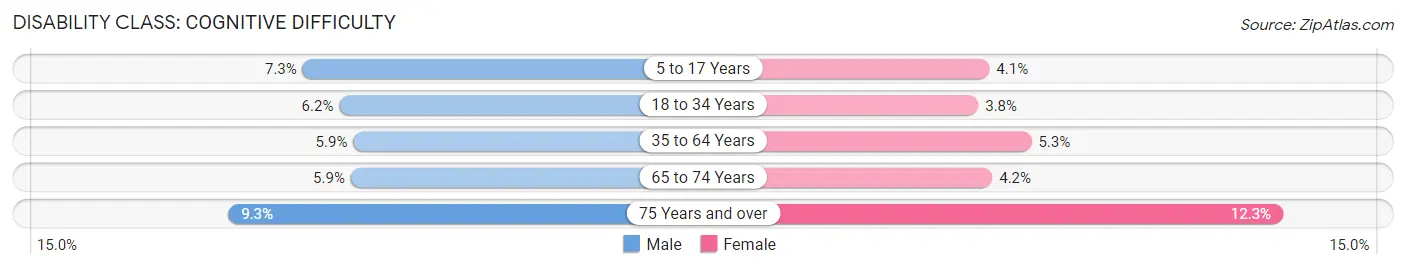
| Age Bracket | Male | Female |
| 5 to 17 Years | 1,457 (7.3%) | 796 (4.1%) |
| 18 to 34 Years | 3,055 (6.2%) | 2,116 (3.8%) |
| 35 to 64 Years | 2,553 (5.9%) | 2,533 (5.3%) |
| 65 to 74 Years | 684 (5.9%) | 570 (4.2%) |
| 75 Years and over | 578 (9.3%) | 1,084 (12.3%) |
Disability Class: Ambulatory Difficulty
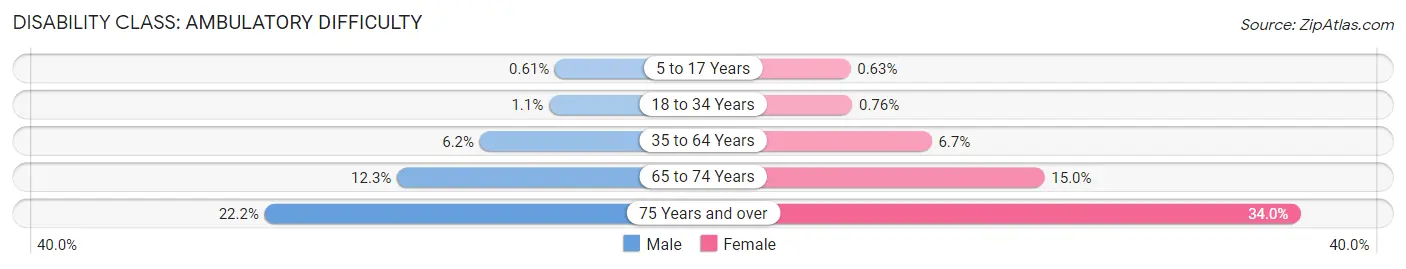
| Age Bracket | Male | Female |
| 5 to 17 Years | 122 (0.6%) | 122 (0.6%) |
| 18 to 34 Years | 520 (1.1%) | 424 (0.8%) |
| 35 to 64 Years | 2,703 (6.2%) | 3,196 (6.7%) |
| 65 to 74 Years | 1,425 (12.3%) | 2,047 (15.0%) |
| 75 Years and over | 1,374 (22.2%) | 3,004 (34.0%) |
Disability Class: Self-Care Difficulty
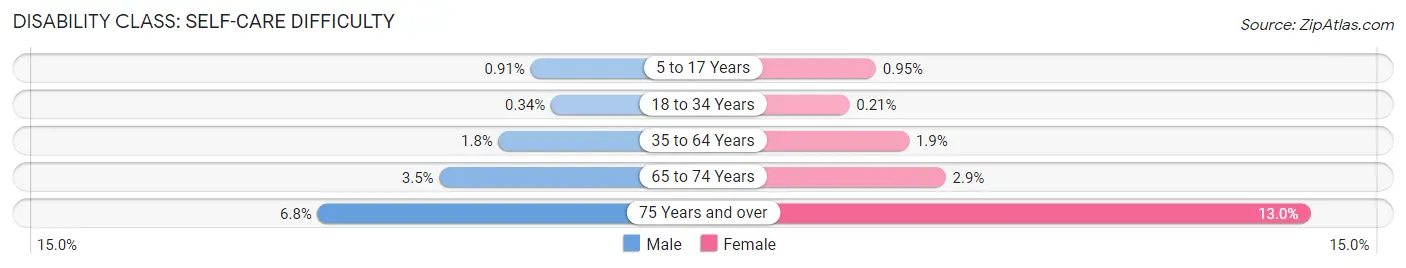
| Age Bracket | Male | Female |
| 5 to 17 Years | 182 (0.9%) | 184 (0.9%) |
| 18 to 34 Years | 169 (0.3%) | 116 (0.2%) |
| 35 to 64 Years | 787 (1.8%) | 895 (1.9%) |
| 65 to 74 Years | 399 (3.5%) | 393 (2.9%) |
| 75 Years and over | 424 (6.8%) | 1,151 (13.0%) |
Technology Access in Leon County
Computing Device Access in Leon County
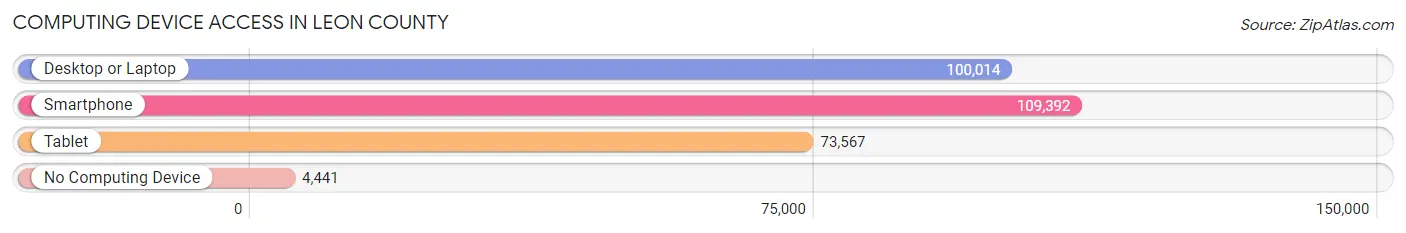
| Device Type | # Households | % Households |
| Desktop or Laptop | 100,014 | 84.2% |
| Smartphone | 109,392 | 92.1% |
| Tablet | 73,567 | 62.0% |
| No Computing Device | 4,441 | 3.7% |
| Total | 118,755 | 100.0% |
Internet Access in Leon County
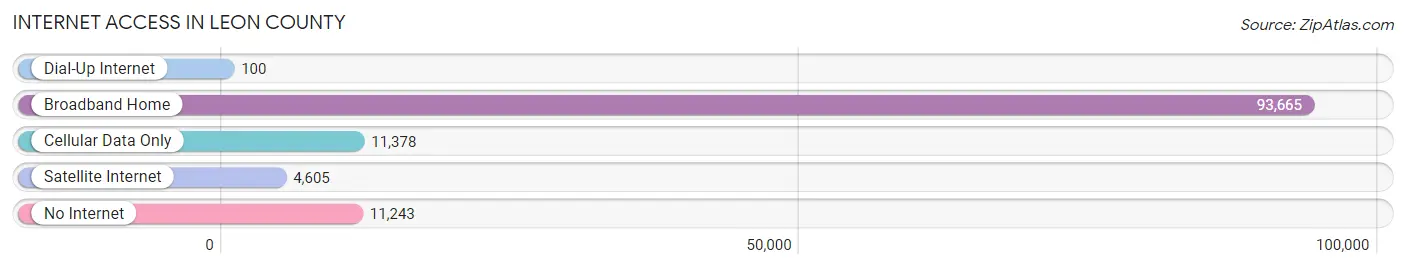
| Internet Type | # Households | % Households |
| Dial-Up Internet | 100 | 0.1% |
| Broadband Home | 93,665 | 78.9% |
| Cellular Data Only | 11,378 | 9.6% |
| Satellite Internet | 4,605 | 3.9% |
| No Internet | 11,243 | 9.5% |
| Total | 118,755 | 100.0% |
Leon County Summary
Leon County is located in the Big Bend region of the Florida Panhandle. It is the state’s twenty-second most populous county, with a population of 284,895 as of the 2020 census. The county seat is Tallahassee, the state capital. Leon County is bordered by Wakulla County to the south, Gadsden County to the west, Jefferson County to the north, and Liberty County to the east.
History
Leon County was created in 1824 from a portion of Escambia County. It was named for the Spanish explorer Juan Ponce de Leon, who explored the area in 1513. The county was originally part of the Apalachee Province, a region of Native American tribes that occupied the area prior to European settlement.
In 1827, the county seat was moved from St. Marks to Tallahassee, which was chosen as the state capital in 1845. The county was divided into two districts in 1832, with the eastern district becoming Wakulla County in 1843.
In the mid-1800s, Leon County was a major center of the cotton industry. The county was also home to several large plantations, including the Goodwood Plantation, which was owned by the prominent Florida politician William Pope Duval.
In the early 1900s, Leon County experienced a period of rapid growth as the state capital and nearby universities attracted new residents. The county’s population increased from 28,000 in 1900 to over 100,000 by 1950.
Geography
Leon County covers an area of 757 square miles, making it the state’s twenty-third largest county. The county is located in the Big Bend region of the Florida Panhandle, and is bordered by Wakulla County to the south, Gadsden County to the west, Jefferson County to the north, and Liberty County to the east.
The county is mostly flat, with an average elevation of just 100 feet above sea level. The highest point in the county is the summit of Mount Pleasant, which rises to an elevation of 295 feet.
The county is home to several rivers, including the Ochlockonee, St. Marks, and Wakulla Rivers. The county also contains several lakes, including Lake Jackson, Lake Lafayette, and Lake Talquin.
Economy
Leon County’s economy is largely driven by government and education. The county is home to several state government offices, including the Florida Department of Education, the Florida Department of Environmental Protection, and the Florida Department of Transportation.
The county is also home to several universities, including Florida State University, Florida A&M University, and Tallahassee Community College. These institutions employ thousands of people and attract students from around the world.
In addition to government and education, Leon County’s economy is also supported by agriculture, manufacturing, and tourism. The county is home to several large farms, including the Goodwood Plantation, which produces cotton, corn, and soybeans. The county is also home to several manufacturing companies, including the St. Joe Company, which produces paper products.
Tourism is also an important part of the county’s economy. The county is home to several popular attractions, including the Tallahassee Museum, the Alfred B. Maclay Gardens State Park, and the Wakulla Springs State Park.
Demographics
As of the 2020 census, Leon County had a population of 284,895. The population is 53.3% White, 34.2% Black or African American, 5.2% Hispanic or Latino, 4.2% Asian, and 3.1% other.
The median household income in the county is $50,945, and the median home value is $179,400. The county’s poverty rate is 17.2%, and the unemployment rate is 4.2%.
Conclusion
Leon County is located in the Big Bend region of the Florida Panhandle. It was created in 1824 and named for the Spanish explorer Juan Ponce de Leon. The county is home to several state government offices, universities, farms, and manufacturing companies. The county’s economy is largely driven by government and education, and it is also supported by agriculture, manufacturing, and tourism. As of the 2020 census, Leon County had a population of 284,895. The median household income in the county is $50,945, and the median home value is $179,400.
Common Questions
What is Per Capita Income in Leon County?
Per Capita income in Leon County is $36,823.
What is the Median Family Income in Leon County?
Median Family Income in Leon County is $89,114.
What is the Median Household income in Leon County?
Median Household Income in Leon County is $61,317.
What is Income or Wage Gap in Leon County?
Income or Wage Gap in Leon County is 16.2%.
Women in Leon County earn 83.8 cents for every dollar earned by a man.
What is Family Income Deficit in Leon County?
Family Income Deficit in Leon County is $10,829.
Families that are below poverty line in Leon County earn $10,829 less on average than the poverty threshold level.
What is Inequality or Gini Index in Leon County?
Inequality or Gini Index in Leon County is 0.51.
What is the Total Population of Leon County?
Total Population of Leon County is 294,128.
What is the Total Male Population of Leon County?
Total Male Population of Leon County is 139,638.
What is the Total Female Population of Leon County?
Total Female Population of Leon County is 154,490.
What is the Ratio of Males per 100 Females in Leon County?
There are 90.39 Males per 100 Females in Leon County.
What is the Ratio of Females per 100 Males in Leon County?
There are 110.64 Females per 100 Males in Leon County.
What is the Median Population Age in Leon County?
Median Population Age in Leon County is 31.4 Years.
What is the Average Family Size in Leon County
Average Family Size in Leon County is 3.0 People.
What is the Average Household Size in Leon County
Average Household Size in Leon County is 2.3 People.
How Large is the Labor Force in Leon County?
There are 159,814 People in the Labor Forcein in Leon County.
What is the Percentage of People in the Labor Force in Leon County?
65.0% of People are in the Labor Force in Leon County.
What is the Unemployment Rate in Leon County?
Unemployment Rate in Leon County is 5.7%.