Area Code 813 Map & Demographics
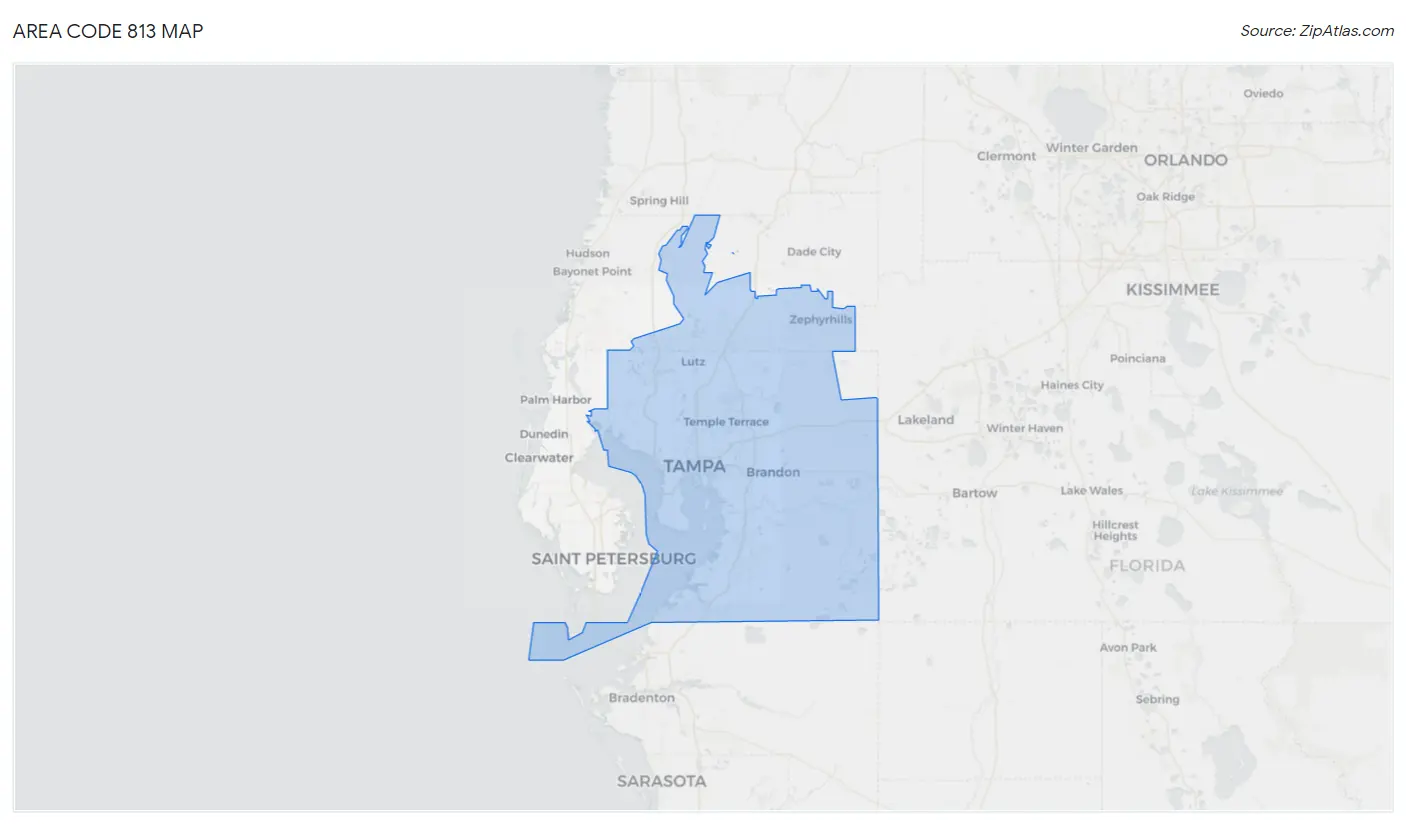
Area Code 813 Map
Area Code 813 Overview
$39,544
PER CAPITA INCOME
$93,427
AVG FAMILY INCOME
$78,449
AVG HOUSEHOLD INCOME
22.6%
WAGE / INCOME GAP [ % ]
77.4¢/ $1
WAGE / INCOME GAP [ $ ]
$11,448
FAMILY INCOME DEFICIT
28.91
INEQUALITY / GINI INDEX
1,812,690
TOTAL POPULATION
894,016
MALE POPULATION
918,674
FEMALE POPULATION
97.32
MALES / 100 FEMALES
102.76
FEMALES / 100 MALES
39.7
MEDIAN AGE
3.2
AVG FAMILY SIZE
2.6
AVG HOUSEHOLD SIZE
925,385
LABOR FORCE [ PEOPLE ]
63.2%
PERCENT IN LABOR FORCE
4.9%
UNEMPLOYMENT RATE
Income in Area Code 813
Income Overview in Area Code 813
Per Capita Income in Area Code 813 is $39,544, while median incomes of families and households are $93,427 and $78,449 respectively.
| Characteristic | Number | Measure |
| Per Capita Income | 1,812,690 | $39,544 |
| Median Family Income | 440,215 | $93,427 |
| Mean Family Income | 440,215 | $7,877,705 |
| Median Household Income | 687,997 | $78,449 |
| Mean Household Income | 687,997 | $6,797,799 |
| Income Deficit | 440,215 | $11,448 |
| Wage / Income Gap (%) | 1,812,690 | 22.58% |
| Wage / Income Gap ($) | 1,812,690 | 77.42¢ per $1 |
| Gini / Inequality Index | 1,812,690 | 28.91 |
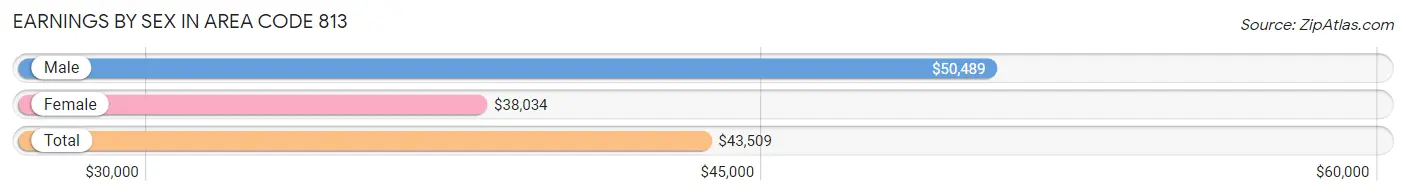
Earnings by Sex in Area Code 813
Average Earnings in Area Code 813 are $43,509, $50,489 for men and $38,034 for women, a difference of 24.7%.
| Sex | Number | Average Earnings |
| Male | 506,324 (52.3%) | $50,489 |
| Female | 460,834 (47.6%) | $38,034 |
| Total | 967,158 (100.0%) | $43,509 |
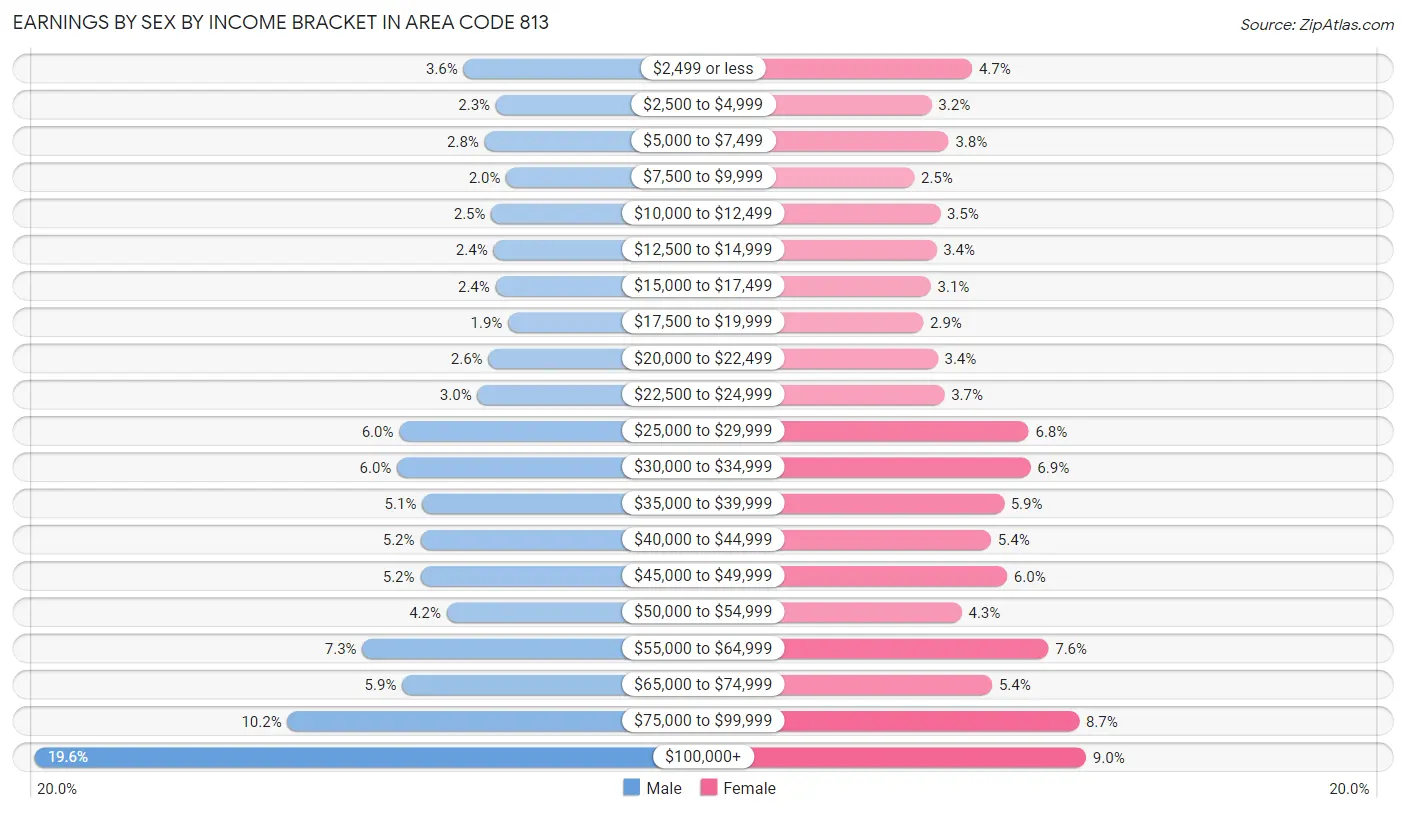
Earnings by Sex by Income Bracket in Area Code 813
The most common earnings brackets in Area Code 813 are $100,000+ for men (99,328 | 19.6%) and $100,000+ for women (41,270 | 9.0%).
| Income | Male | Female |
| $2,499 or less | 17,957 (3.5%) | 21,616 (4.7%) |
| $2,500 to $4,999 | 11,836 (2.3%) | 14,617 (3.2%) |
| $5,000 to $7,499 | 13,989 (2.8%) | 17,574 (3.8%) |
| $7,500 to $9,999 | 9,864 (1.9%) | 11,632 (2.5%) |
| $10,000 to $12,499 | 12,731 (2.5%) | 16,077 (3.5%) |
| $12,500 to $14,999 | 12,281 (2.4%) | 15,445 (3.4%) |
| $15,000 to $17,499 | 11,905 (2.4%) | 14,480 (3.1%) |
| $17,500 to $19,999 | 9,496 (1.9%) | 13,167 (2.9%) |
| $20,000 to $22,499 | 13,275 (2.6%) | 15,682 (3.4%) |
| $22,500 to $24,999 | 15,364 (3.0%) | 16,827 (3.6%) |
| $25,000 to $29,999 | 30,158 (6.0%) | 31,402 (6.8%) |
| $30,000 to $34,999 | 30,586 (6.0%) | 31,687 (6.9%) |
| $35,000 to $39,999 | 25,828 (5.1%) | 27,084 (5.9%) |
| $40,000 to $44,999 | 26,183 (5.2%) | 24,870 (5.4%) |
| $45,000 to $49,999 | 26,190 (5.2%) | 27,651 (6.0%) |
| $50,000 to $54,999 | 21,173 (4.2%) | 19,802 (4.3%) |
| $55,000 to $64,999 | 37,162 (7.3%) | 34,813 (7.5%) |
| $65,000 to $74,999 | 29,644 (5.9%) | 25,068 (5.4%) |
| $75,000 to $99,999 | 51,374 (10.2%) | 40,070 (8.7%) |
| $100,000+ | 99,328 (19.6%) | 41,270 (9.0%) |
| Total | 506,324 (100.0%) | 460,834 (100.0%) |
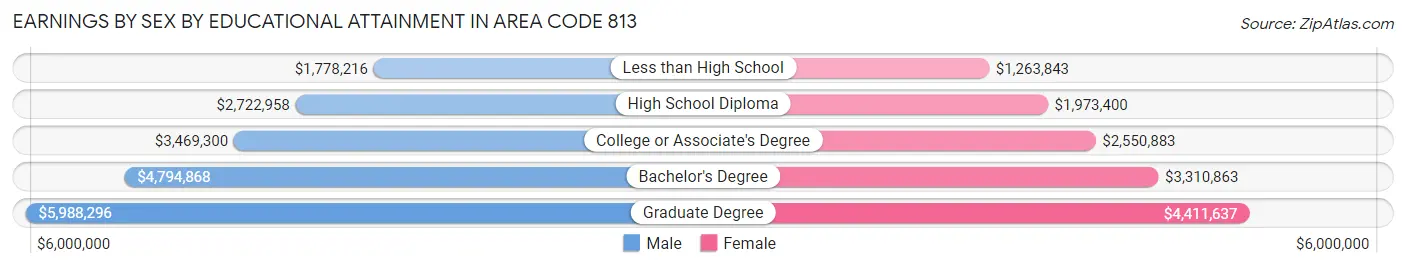
Earnings by Sex by Educational Attainment in Area Code 813
Average earnings in Area Code 813 are $3,775,800 for men and $2,870,511 for women, a difference of 24.0%. Men with an educational attainment of graduate degree enjoy the highest average annual earnings of $5,988,296, while those with less than high school education earn the least with $1,778,216. Women with an educational attainment of graduate degree earn the most with the average annual earnings of $4,411,637, while those with less than high school education have the smallest earnings of $1,263,843.
| Educational Attainment | Male Income | Female Income |
| Less than High School | $1,778,216 | $1,263,843 |
| High School Diploma | $2,722,958 | $1,973,400 |
| College or Associate's Degree | $3,469,300 | $2,550,883 |
| Bachelor's Degree | $4,794,868 | $3,310,863 |
| Graduate Degree | $5,988,296 | $4,411,637 |
| Total | $3,775,800 | $2,870,511 |
Family Income in Area Code 813
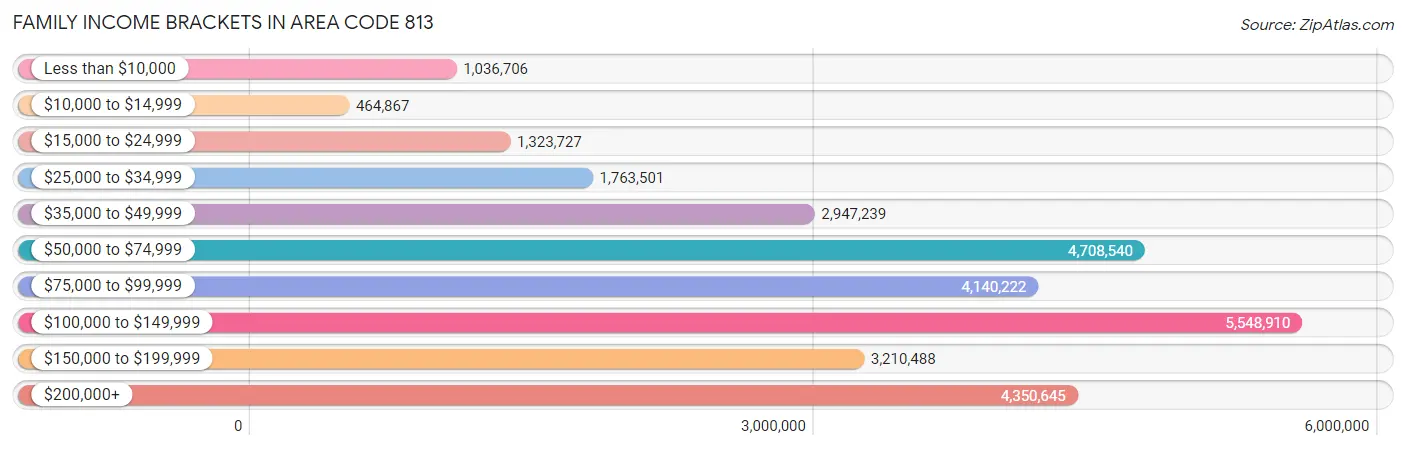
Family Income Brackets in Area Code 813
According to the Area Code 813 family income data, there are 5,548,910 families falling into the $100,000 to $149,999 income range, which is the most common income bracket and makes up 1,260.5% of all families. Conversely, the $10,000 to $14,999 income bracket is the least frequent group with only 464,867 families (105.6%) belonging to this category.
| Income Bracket | # Families | % Families |
| Less than $10,000 | 1,036,706 | 235.5% |
| $10,000 to $14,999 | 464,867 | 105.6% |
| $15,000 to $24,999 | 1,323,727 | 300.7% |
| $25,000 to $34,999 | 1,763,501 | 400.6% |
| $35,000 to $49,999 | 2,947,239 | 669.5% |
| $50,000 to $74,999 | 4,708,540 | 1,069.6% |
| $75,000 to $99,999 | 4,140,222 | 940.5% |
| $100,000 to $149,999 | 5,548,910 | 1,260.5% |
| $150,000 to $199,999 | 3,210,488 | 729.3% |
| $200,000+ | 4,350,645 | 988.3% |
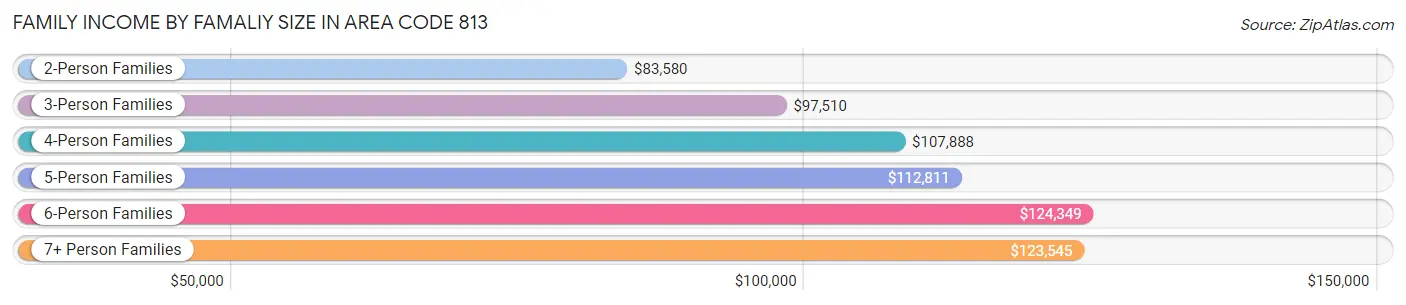
Family Income by Famaliy Size in Area Code 813
6-person families (11,670 | 2.6%) account for the highest median family income in Area Code 813 with $124,349 per family, while 2-person families (201,677 | 45.8%) have the highest median income of $41,790 per family member.
| Income Bracket | # Families | Median Income |
| 2-Person Families | 201,677 (45.8%) | $83,580 |
| 3-Person Families | 105,455 (24.0%) | $97,510 |
| 4-Person Families | 81,537 (18.5%) | $107,888 |
| 5-Person Families | 33,735 (7.7%) | $112,811 |
| 6-Person Families | 11,670 (2.6%) | $124,349 |
| 7+ Person Families | 6,141 (1.4%) | $123,545 |
| Total | 440,215 (100.0%) | $93,427 |
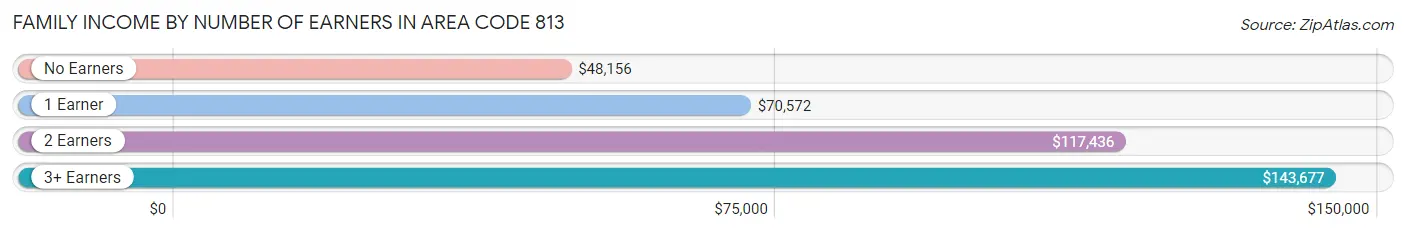
Family Income by Number of Earners in Area Code 813
The median family income in Area Code 813 is $93,427, with families comprising 3+ earners (45,521) having the highest median family income of $143,677, while families with no earners (64,217) have the lowest median family income of $48,156, accounting for 10.3% and 14.6% of families, respectively.
| Number of Earners | # Families | Median Income |
| No Earners | 64,217 (14.6%) | $48,156 |
| 1 Earner | 147,393 (33.5%) | $70,572 |
| 2 Earners | 183,084 (41.6%) | $117,436 |
| 3+ Earners | 45,521 (10.3%) | $143,677 |
| Total | 440,215 (100.0%) | $93,427 |
Household Income in Area Code 813
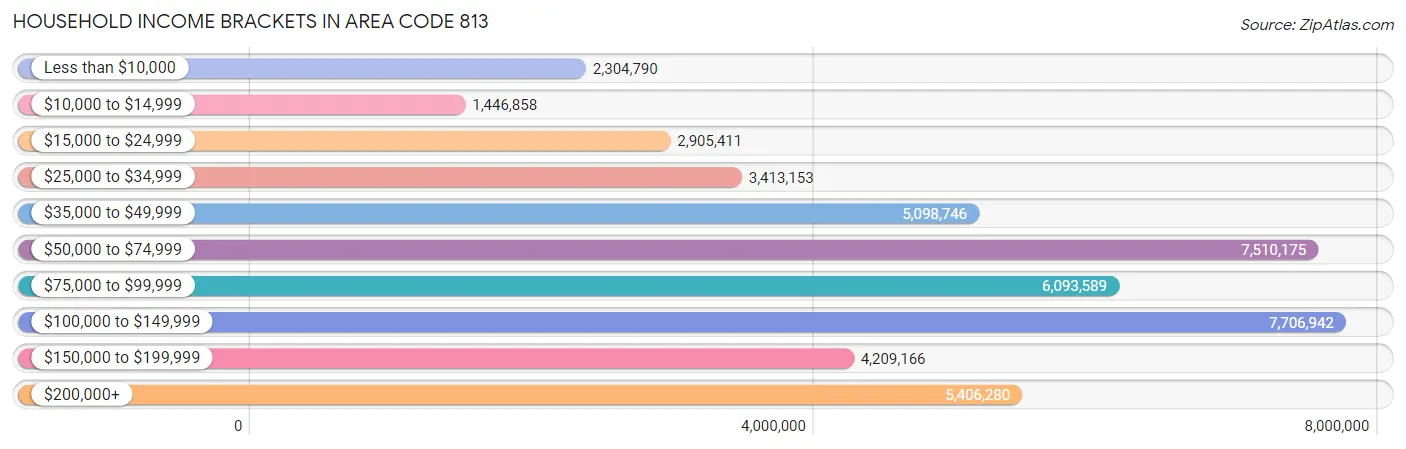
Household Income Brackets in Area Code 813
With 7,706,942 households falling in the category, the $100,000 to $149,999 income range is the most frequent in Area Code 813, accounting for 1,120.2% of all households. In contrast, only 1,446,858 households (210.3%) fall into the $10,000 to $14,999 income bracket, making it the least populous group.
| Income Bracket | # Households | % Households |
| Less than $10,000 | 2,304,790 | 335.0% |
| $10,000 to $14,999 | 1,446,858 | 210.3% |
| $15,000 to $24,999 | 2,905,411 | 422.3% |
| $25,000 to $34,999 | 3,413,153 | 496.1% |
| $35,000 to $49,999 | 5,098,746 | 741.1% |
| $50,000 to $74,999 | 7,510,175 | 1,091.6% |
| $75,000 to $99,999 | 6,093,589 | 885.7% |
| $100,000 to $149,999 | 7,706,942 | 1,120.2% |
| $150,000 to $199,999 | 4,209,166 | 611.8% |
| $200,000+ | 5,406,280 | 785.8% |
Household Income by Householder Age in Area Code 813
The median household income in Area Code 813 is $78,449, with the highest median household income of $95,307 found in the 45 to 64 years age bracket for the primary householder. A total of 254,372 households (37.0%) fall into this category. Meanwhile, the 15 to 24 years age bracket for the primary householder has the lowest median household income of $49,660, with 25,760 households (3.7%) in this group.
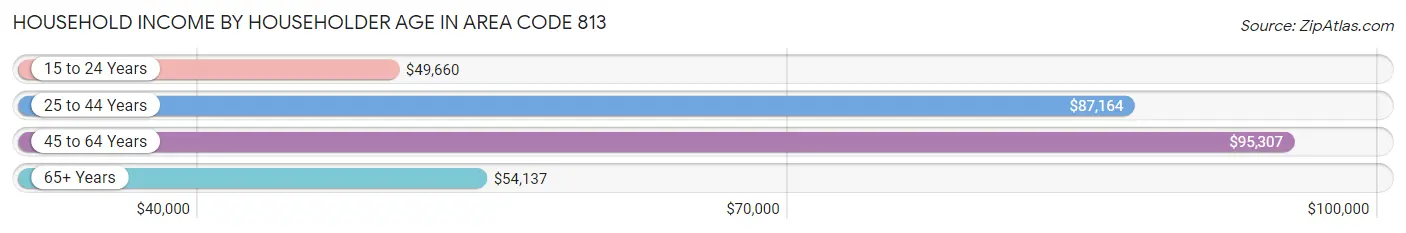
| Income Bracket | # Households | Median Income |
| 15 to 24 Years | 25,760 (3.7%) | $49,660 |
| 25 to 44 Years | 245,701 (35.7%) | $87,164 |
| 45 to 64 Years | 254,372 (37.0%) | $95,307 |
| 65+ Years | 162,164 (23.6%) | $54,137 |
| Total | 687,997 (100.0%) | $78,449 |
Poverty in Area Code 813
Income Below Poverty by Sex and Age in Area Code 813
With 11.8% poverty level for males and 14.1% for females among the residents of Area Code 813, under 5 year old males and 18 to 24 year old females are the most vulnerable to poverty, with 8,872 males (17.2%) and 16,106 females (21.9%) in their respective age groups living below the poverty level.
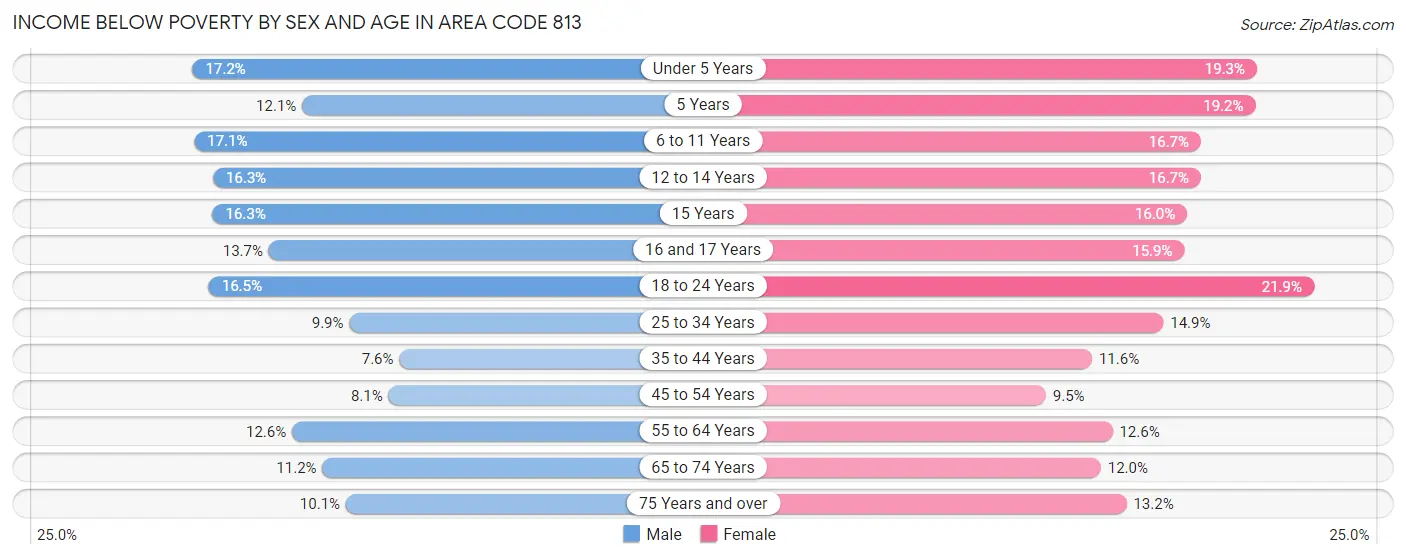
| Age Bracket | Male | Female |
| Under 5 Years | 8,872 (17.2%) | 9,426 (19.3%) |
| 5 Years | 1,234 (12.1%) | 2,075 (19.2%) |
| 6 to 11 Years | 11,539 (17.1%) | 10,510 (16.7%) |
| 12 to 14 Years | 5,755 (16.3%) | 5,715 (16.7%) |
| 15 Years | 1,878 (16.3%) | 1,675 (16.0%) |
| 16 and 17 Years | 3,128 (13.7%) | 3,445 (15.9%) |
| 18 to 24 Years | 12,631 (16.5%) | 16,106 (21.9%) |
| 25 to 34 Years | 12,798 (9.9%) | 19,439 (14.9%) |
| 35 to 44 Years | 9,436 (7.6%) | 14,649 (11.6%) |
| 45 to 54 Years | 9,576 (8.1%) | 11,222 (9.5%) |
| 55 to 64 Years | 13,476 (12.6%) | 14,210 (12.6%) |
| 65 to 74 Years | 8,480 (11.2%) | 10,576 (12.0%) |
| 75 Years and over | 4,834 (10.1%) | 8,496 (13.2%) |
| Total | 103,637 (11.8%) | 127,544 (14.1%) |
Income Above Poverty by Sex and Age in Area Code 813
According to the poverty statistics in Area Code 813, males aged 35 to 44 years and females aged 45 to 54 years are the age groups that are most secure financially, with 92.4% of males and 90.5% of females in these age groups living above the poverty line.
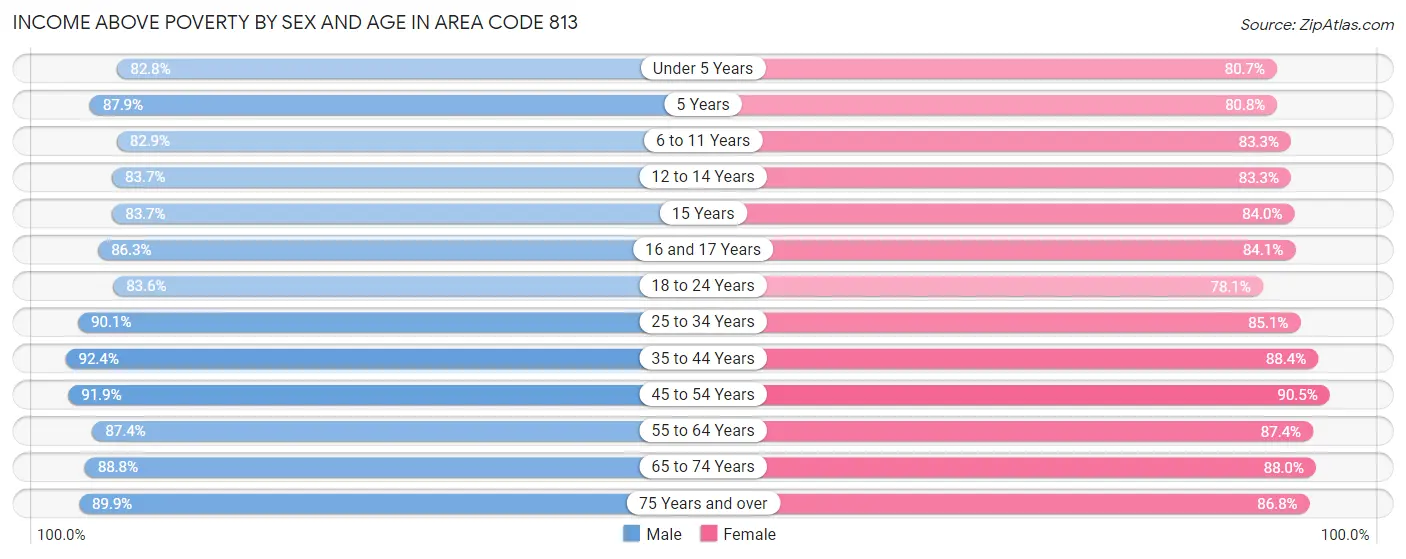
| Age Bracket | Male | Female |
| Under 5 Years | 42,683 (82.8%) | 39,517 (80.7%) |
| 5 Years | 8,945 (87.9%) | 8,737 (80.8%) |
| 6 to 11 Years | 55,807 (82.9%) | 52,575 (83.3%) |
| 12 to 14 Years | 29,642 (83.7%) | 28,584 (83.3%) |
| 15 Years | 9,657 (83.7%) | 8,779 (84.0%) |
| 16 and 17 Years | 19,760 (86.3%) | 18,238 (84.1%) |
| 18 to 24 Years | 64,153 (83.6%) | 57,451 (78.1%) |
| 25 to 34 Years | 116,089 (90.1%) | 110,887 (85.1%) |
| 35 to 44 Years | 114,480 (92.4%) | 111,492 (88.4%) |
| 45 to 54 Years | 108,467 (91.9%) | 107,291 (90.5%) |
| 55 to 64 Years | 93,593 (87.4%) | 98,951 (87.4%) |
| 65 to 74 Years | 67,349 (88.8%) | 77,436 (88.0%) |
| 75 Years and over | 43,090 (89.9%) | 55,802 (86.8%) |
| Total | 773,715 (88.2%) | 775,740 (85.9%) |
Income Below Poverty Among Married-Couple Families in Area Code 813
The poverty statistics for married-couple families in Area Code 813 show that 5.2% or 16,285 of the total 315,611 families live below the poverty line. Families with 5 or more children have the highest poverty rate of 41.3%, comprising of 812 families. On the other hand, families with no children have the lowest poverty rate of 4.2%, which includes 7,641 families.
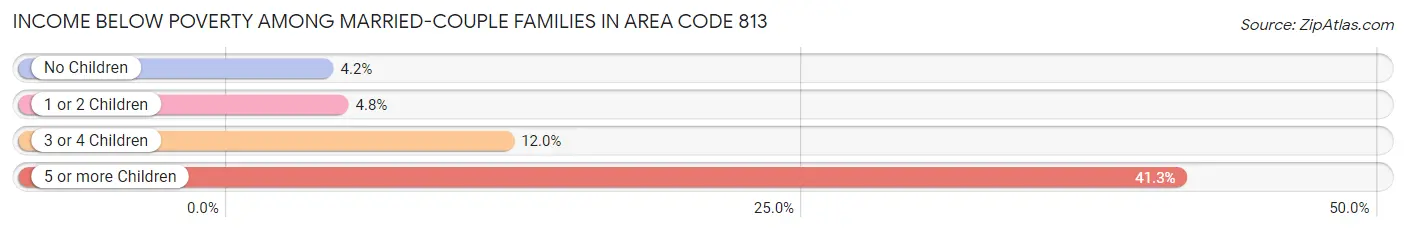
| Children | Above Poverty | Below Poverty |
| No Children | 175,974 (95.8%) | 7,641 (4.2%) |
| 1 or 2 Children | 103,005 (95.2%) | 5,209 (4.8%) |
| 3 or 4 Children | 19,194 (88.0%) | 2,623 (12.0%) |
| 5 or more Children | 1,153 (58.7%) | 812 (41.3%) |
| Total | 299,326 (94.8%) | 16,285 (5.2%) |
Income Below Poverty Among Single-Parent Households in Area Code 813
According to the poverty data in Area Code 813, 12.6% or 4,581 single-father households and 22.7% or 20,072 single-mother households are living below the poverty line. Among single-father households, those with 3 or 4 children have the highest poverty rate, with 847 households (31.8%) experiencing poverty. Likewise, among single-mother households, those with 5 or more children have the highest poverty rate, with 494 households (62.4%) falling below the poverty line.
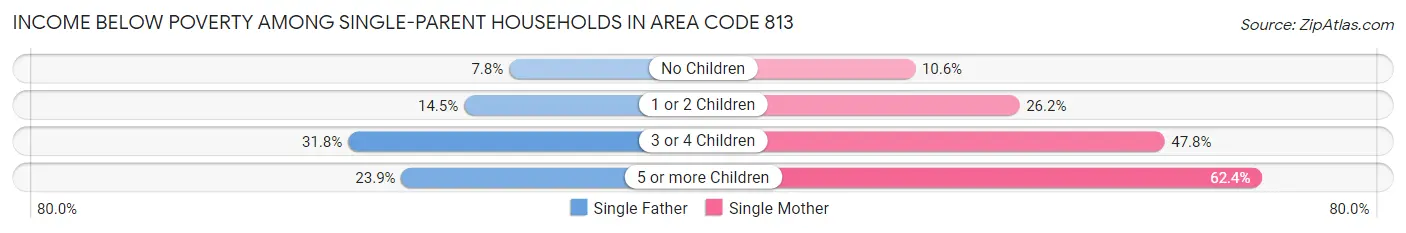
| Children | Single Father | Single Mother |
| No Children | 1,346 (7.8%) | 3,623 (10.6%) |
| 1 or 2 Children | 2,357 (14.5%) | 11,587 (26.2%) |
| 3 or 4 Children | 847 (31.8%) | 4,368 (47.8%) |
| 5 or more Children | 31 (23.8%) | 494 (62.4%) |
| Total | 4,581 (12.6%) | 20,072 (22.7%) |
Income Below Poverty Among Married-Couple vs Single-Parent Households in Area Code 813
The poverty data for Area Code 813 shows that 16,285 of the married-couple family households (5.2%) and 24,653 of the single-parent households (19.8%) are living below the poverty level. Within the married-couple family households, those with 5 or more children have the highest poverty rate, with 812 households (41.3%) falling below the poverty line. Among the single-parent households, those with 5 or more children have the highest poverty rate, with 525 household (56.9%) living below poverty.
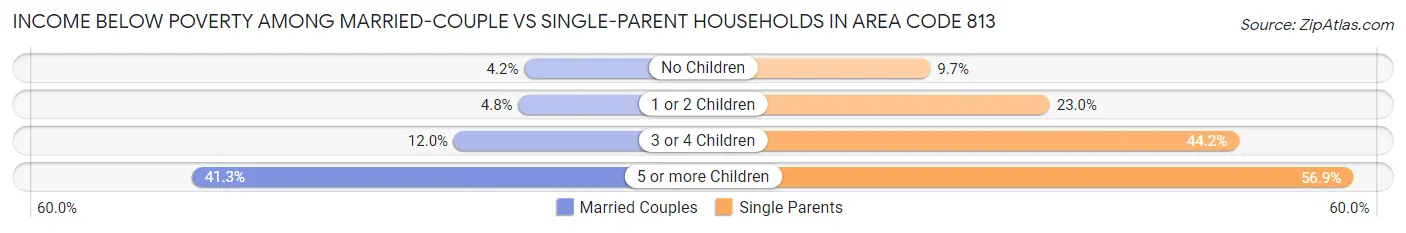
| Children | Married-Couple Families | Single-Parent Households |
| No Children | 7,641 (4.2%) | 4,969 (9.7%) |
| 1 or 2 Children | 5,209 (4.8%) | 13,944 (23.0%) |
| 3 or 4 Children | 2,623 (12.0%) | 5,215 (44.2%) |
| 5 or more Children | 812 (41.3%) | 525 (56.9%) |
| Total | 16,285 (5.2%) | 24,653 (19.8%) |
Race in Area Code 813
The most populous races in Area Code 813 are White / Caucasian (1,115,949 | 61.6%), Hispanic or Latino (505,983 | 27.9%), and Black / African American (267,536 | 14.8%).
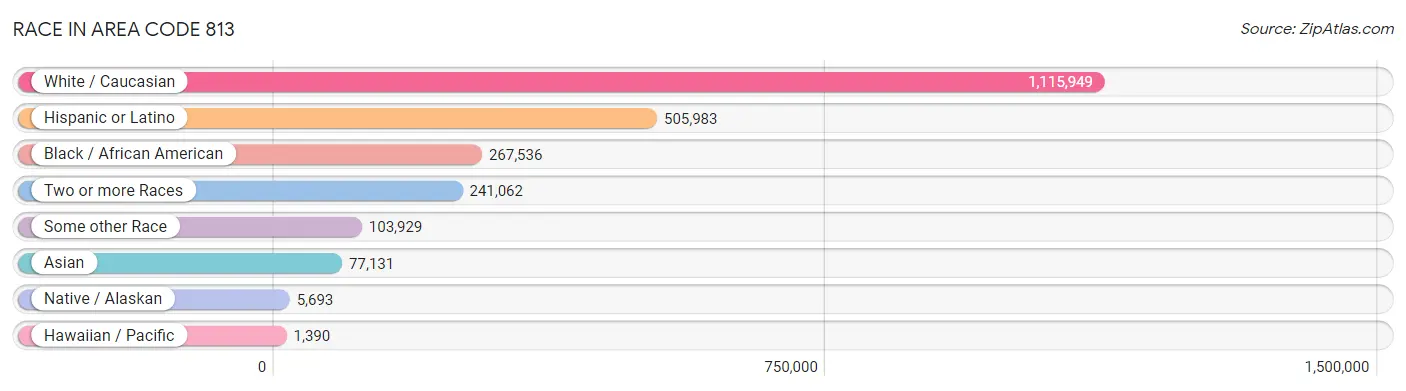
| Race | # Population | % Population |
| Asian | 77,131 | 4.3% |
| Black / African American | 267,536 | 14.8% |
| Hawaiian / Pacific | 1,390 | 0.1% |
| Hispanic or Latino | 505,983 | 27.9% |
| Native / Alaskan | 5,693 | 0.3% |
| White / Caucasian | 1,115,949 | 61.6% |
| Two or more Races | 241,062 | 13.3% |
| Some other Race | 103,929 | 5.7% |
| Total | 1,812,690 | 100.0% |
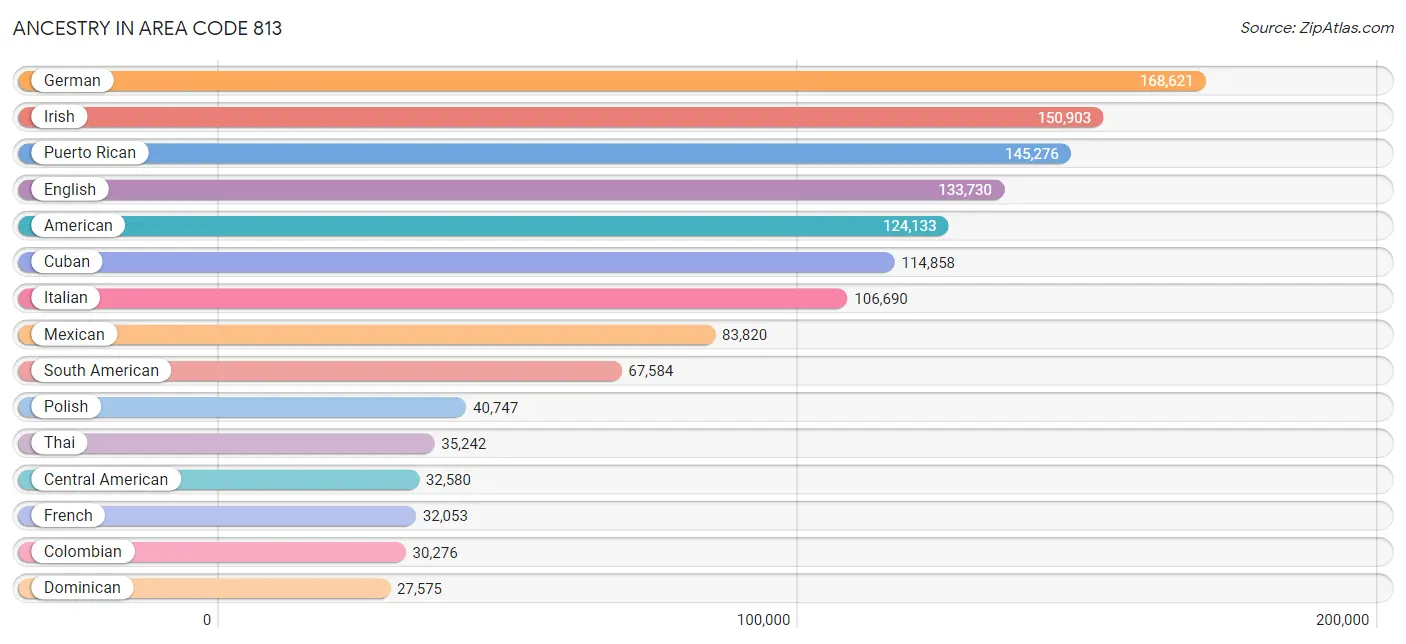
Ancestry in Area Code 813
The most populous ancestries reported in Area Code 813 are German (168,621 | 9.3%), Irish (150,903 | 8.3%), Puerto Rican (145,276 | 8.0%), English (133,730 | 7.4%), and American (124,133 | 6.9%), together accounting for 39.9% of all Area Code 813 residents.
| Ancestry | # Population | % Population |
| Afghan | 850 | 0.1% |
| African | 9,181 | 0.5% |
| Alaska Native | 26 | 0.0% |
| Alaskan Athabascan | 8 | 0.0% |
| Albanian | 1,373 | 0.1% |
| Aleut | 33 | 0.0% |
| Alsatian | 14 | 0.0% |
| American | 124,133 | 6.9% |
| Apache | 175 | 0.0% |
| Arab | 17,714 | 1.0% |
| Argentinean | 3,105 | 0.2% |
| Armenian | 962 | 0.1% |
| Assyrian / Chaldean / Syriac | 88 | 0.0% |
| Australian | 775 | 0.0% |
| Austrian | 2,611 | 0.1% |
| Bahamian | 1,586 | 0.1% |
| Bangladeshi | 462 | 0.0% |
| Barbadian | 525 | 0.0% |
| Basque | 140 | 0.0% |
| Belgian | 1,051 | 0.1% |
| Belizean | 898 | 0.1% |
| Bermudan | 85 | 0.0% |
| Bhutanese | 4,173 | 0.2% |
| Blackfeet | 617 | 0.0% |
| Bolivian | 1,138 | 0.1% |
| Brazilian | 5,389 | 0.3% |
| British | 12,269 | 0.7% |
| British West Indian | 2,640 | 0.2% |
| Bulgarian | 1,042 | 0.1% |
| Burmese | 5,801 | 0.3% |
| Cajun | 214 | 0.0% |
| Cambodian | 59 | 0.0% |
| Canadian | 4,711 | 0.3% |
| Cape Verdean | 494 | 0.0% |
| Carpatho Rusyn | 83 | 0.0% |
| Celtic | 336 | 0.0% |
| Central American | 32,580 | 1.8% |
| Central American Indian | 2,886 | 0.2% |
| Cherokee | 4,538 | 0.3% |
| Chickasaw | 65 | 0.0% |
| Chilean | 827 | 0.1% |
| Chinese | 29 | 0.0% |
| Chippewa | 282 | 0.0% |
| Choctaw | 340 | 0.0% |
| Colombian | 30,276 | 1.7% |
| Comanche | 33 | 0.0% |
| Costa Rican | 2,433 | 0.1% |
| Cree | 39 | 0.0% |
| Creek | 381 | 0.0% |
| Croatian | 1,656 | 0.1% |
| Crow | 12 | 0.0% |
| Cuban | 114,858 | 6.3% |
| Cypriot | 112 | 0.0% |
| Czech | 3,934 | 0.2% |
| Czechoslovakian | 1,054 | 0.1% |
| Danish | 3,466 | 0.2% |
| Delaware | 69 | 0.0% |
| Dominican | 27,575 | 1.5% |
| Dutch | 13,284 | 0.7% |
| Dutch West Indian | 258 | 0.0% |
| Eastern European | 4,139 | 0.2% |
| Ecuadorian | 6,606 | 0.4% |
| Egyptian | 2,518 | 0.1% |
| English | 133,730 | 7.4% |
| Estonian | 140 | 0.0% |
| Ethiopian | 1,925 | 0.1% |
| European | 23,243 | 1.3% |
| Fijian | 7 | 0.0% |
| Filipino | 774 | 0.0% |
| Finnish | 2,045 | 0.1% |
| French | 32,053 | 1.8% |
| French American Indian | 73 | 0.0% |
| French Canadian | 7,844 | 0.4% |
| German | 168,621 | 9.3% |
| German Russian | 98 | 0.0% |
| Ghanaian | 401 | 0.0% |
| Greek | 9,321 | 0.5% |
| Guamanian / Chamorro | 411 | 0.0% |
| Guatemalan | 7,660 | 0.4% |
| Guyanese | 1,942 | 0.1% |
| Haitian | 16,031 | 0.9% |
| Honduran | 10,301 | 0.6% |
| Hopi | 35 | 0.0% |
| Houma | 39 | 0.0% |
| Hungarian | 6,520 | 0.4% |
| Icelander | 226 | 0.0% |
| Indian (Asian) | 14,571 | 0.8% |
| Indonesian | 251 | 0.0% |
| Inupiat | 84 | 0.0% |
| Iranian | 1,653 | 0.1% |
| Iraqi | 801 | 0.0% |
| Irish | 150,903 | 8.3% |
| Iroquois | 534 | 0.0% |
| Israeli | 1,057 | 0.1% |
| Italian | 106,690 | 5.9% |
| Jamaican | 14,600 | 0.8% |
| Japanese | 600 | 0.0% |
| Jordanian | 1,668 | 0.1% |
| Kenyan | 353 | 0.0% |
| Korean | 16,710 | 0.9% |
| Laotian | 404 | 0.0% |
| Latvian | 200 | 0.0% |
| Lebanese | 3,757 | 0.2% |
| Liberian | 185 | 0.0% |
| Lithuanian | 2,654 | 0.2% |
| Lumbee | 76 | 0.0% |
| Luxembourger | 55 | 0.0% |
| Macedonian | 212 | 0.0% |
| Malaysian | 986 | 0.1% |
| Maltese | 198 | 0.0% |
| Mexican | 83,820 | 4.6% |
| Mexican American Indian | 2,721 | 0.2% |
| Mongolian | 55 | 0.0% |
| Moroccan | 2,793 | 0.2% |
| Native Hawaiian | 1,398 | 0.1% |
| Navajo | 74 | 0.0% |
| New Zealander | 122 | 0.0% |
| Nicaraguan | 3,640 | 0.2% |
| Nigerian | 2,527 | 0.1% |
| Northern European | 1,661 | 0.1% |
| Norwegian | 9,788 | 0.5% |
| Osage | 7 | 0.0% |
| Pakistani | 2,357 | 0.1% |
| Palestinian | 2,234 | 0.1% |
| Panamanian | 3,953 | 0.2% |
| Paraguayan | 322 | 0.0% |
| Pennsylvania German | 649 | 0.0% |
| Peruvian | 7,963 | 0.4% |
| Polish | 40,747 | 2.2% |
| Portuguese | 7,058 | 0.4% |
| Potawatomi | 3 | 0.0% |
| Pueblo | 30 | 0.0% |
| Puerto Rican | 145,276 | 8.0% |
| Romanian | 1,696 | 0.1% |
| Russian | 10,636 | 0.6% |
| Salvadoran | 4,456 | 0.3% |
| Samoan | 695 | 0.0% |
| Scandinavian | 3,556 | 0.2% |
| Scotch-Irish | 11,371 | 0.6% |
| Scottish | 23,990 | 1.3% |
| Seminole | 314 | 0.0% |
| Senegalese | 280 | 0.0% |
| Serbian | 841 | 0.1% |
| Shoshone | 30 | 0.0% |
| Sierra Leonean | 288 | 0.0% |
| Sioux | 617 | 0.0% |
| Slavic | 907 | 0.1% |
| Slovak | 3,496 | 0.2% |
| Slovene | 1,168 | 0.1% |
| Somali | 12 | 0.0% |
| South African | 629 | 0.0% |
| South American | 67,584 | 3.7% |
| South American Indian | 308 | 0.0% |
| Spaniard | 12,015 | 0.7% |
| Spanish | 5,965 | 0.3% |
| Spanish American | 251 | 0.0% |
| Spanish American Indian | 79 | 0.0% |
| Sri Lankan | 11,695 | 0.6% |
| Subsaharan African | 18,113 | 1.0% |
| Sudanese | 364 | 0.0% |
| Swedish | 12,318 | 0.7% |
| Swiss | 2,493 | 0.1% |
| Syrian | 1,017 | 0.1% |
| Thai | 35,242 | 1.9% |
| Tongan | 21 | 0.0% |
| Trinidadian and Tobagonian | 3,989 | 0.2% |
| Tsimshian | 20 | 0.0% |
| Turkish | 1,640 | 0.1% |
| U.S. Virgin Islander | 813 | 0.0% |
| Ugandan | 97 | 0.0% |
| Ukrainian | 4,613 | 0.3% |
| Uruguayan | 1,181 | 0.1% |
| Ute | 11 | 0.0% |
| Venezuelan | 16,039 | 0.9% |
| Vietnamese | 542 | 0.0% |
| Welsh | 8,432 | 0.5% |
| West Indian | 3,877 | 0.2% |
| Yugoslavian | 1,900 | 0.1% |
| Yup'ik | 11 | 0.0% |
| Zimbabwean | 141 | 0.0% | View All 180 Rows |
Immigrants in Area Code 813
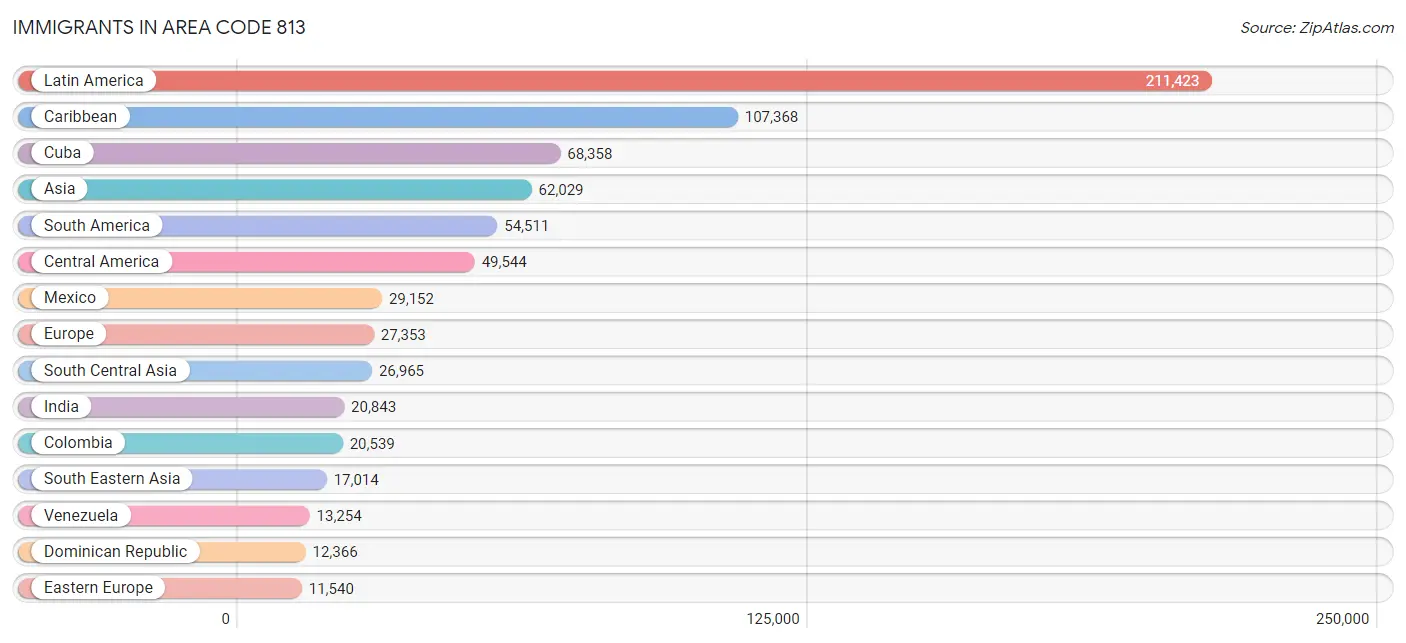
The most numerous immigrant groups reported in Area Code 813 came from Latin America (211,423 | 11.7%), Caribbean (107,368 | 5.9%), Cuba (68,358 | 3.8%), Asia (62,029 | 3.4%), and South America (54,511 | 3.0%), together accounting for 27.8% of all Area Code 813 residents.
| Immigration Origin | # Population | % Population |
| Afghanistan | 569 | 0.0% |
| Africa | 10,310 | 0.6% |
| Albania | 560 | 0.0% |
| Argentina | 1,756 | 0.1% |
| Armenia | 96 | 0.0% |
| Asia | 62,029 | 3.4% |
| Australia | 680 | 0.0% |
| Austria | 142 | 0.0% |
| Azores | 23 | 0.0% |
| Bahamas | 984 | 0.1% |
| Bangladesh | 930 | 0.1% |
| Barbados | 361 | 0.0% |
| Belarus | 222 | 0.0% |
| Belgium | 84 | 0.0% |
| Belize | 814 | 0.0% |
| Bolivia | 609 | 0.0% |
| Bosnia and Herzegovina | 885 | 0.1% |
| Brazil | 5,016 | 0.3% |
| Bulgaria | 870 | 0.1% |
| Cabo Verde | 115 | 0.0% |
| Cambodia | 112 | 0.0% |
| Cameroon | 215 | 0.0% |
| Canada | 7,789 | 0.4% |
| Caribbean | 107,368 | 5.9% |
| Central America | 49,544 | 2.7% |
| Chile | 463 | 0.0% |
| China | 6,867 | 0.4% |
| Colombia | 20,539 | 1.1% |
| Congo | 96 | 0.0% |
| Costa Rica | 1,198 | 0.1% |
| Croatia | 561 | 0.0% |
| Cuba | 68,358 | 3.8% |
| Czechoslovakia | 432 | 0.0% |
| Denmark | 161 | 0.0% |
| Dominica | 930 | 0.1% |
| Dominican Republic | 12,366 | 0.7% |
| Eastern Africa | 2,538 | 0.1% |
| Eastern Asia | 9,614 | 0.5% |
| Eastern Europe | 11,540 | 0.6% |
| Ecuador | 3,110 | 0.2% |
| Egypt | 1,255 | 0.1% |
| El Salvador | 2,403 | 0.1% |
| England | 2,999 | 0.2% |
| Eritrea | 477 | 0.0% |
| Ethiopia | 589 | 0.0% |
| Europe | 27,353 | 1.5% |
| Fiji | 12 | 0.0% |
| France | 1,092 | 0.1% |
| Germany | 3,470 | 0.2% |
| Ghana | 333 | 0.0% |
| Greece | 439 | 0.0% |
| Grenada | 217 | 0.0% |
| Guatemala | 4,291 | 0.2% |
| Guyana | 2,453 | 0.1% |
| Haiti | 8,829 | 0.5% |
| Honduras | 7,235 | 0.4% |
| Hong Kong | 299 | 0.0% |
| Hungary | 548 | 0.0% |
| India | 20,843 | 1.1% |
| Indonesia | 213 | 0.0% |
| Iran | 1,118 | 0.1% |
| Iraq | 737 | 0.0% |
| Ireland | 528 | 0.0% |
| Israel | 947 | 0.1% |
| Italy | 1,329 | 0.1% |
| Jamaica | 9,317 | 0.5% |
| Japan | 930 | 0.1% |
| Jordan | 1,187 | 0.1% |
| Kazakhstan | 339 | 0.0% |
| Kenya | 377 | 0.0% |
| Korea | 1,808 | 0.1% |
| Kuwait | 599 | 0.0% |
| Laos | 524 | 0.0% |
| Latin America | 211,423 | 11.7% |
| Latvia | 68 | 0.0% |
| Lebanon | 1,010 | 0.1% |
| Liberia | 179 | 0.0% |
| Lithuania | 100 | 0.0% |
| Malaysia | 420 | 0.0% |
| Mexico | 29,152 | 1.6% |
| Micronesia | 4 | 0.0% |
| Middle Africa | 409 | 0.0% |
| Moldova | 86 | 0.0% |
| Morocco | 1,631 | 0.1% |
| Nepal | 205 | 0.0% |
| Netherlands | 637 | 0.0% |
| Nicaragua | 2,280 | 0.1% |
| Nigeria | 1,307 | 0.1% |
| North Macedonia | 25 | 0.0% |
| Northern Africa | 3,295 | 0.2% |
| Northern Europe | 7,036 | 0.4% |
| Norway | 83 | 0.0% |
| Oceania | 974 | 0.1% |
| Pakistan | 1,636 | 0.1% |
| Panama | 2,171 | 0.1% |
| Peru | 5,793 | 0.3% |
| Philippines | 7,768 | 0.4% |
| Poland | 2,046 | 0.1% |
| Portugal | 643 | 0.0% |
| Romania | 384 | 0.0% |
| Russia | 2,513 | 0.1% |
| Saudi Arabia | 795 | 0.0% |
| Scotland | 400 | 0.0% |
| Senegal | 244 | 0.0% |
| Serbia | 103 | 0.0% |
| Sierra Leone | 158 | 0.0% |
| Singapore | 66 | 0.0% |
| Somalia | 10 | 0.0% |
| South Africa | 904 | 0.1% |
| South America | 54,511 | 3.0% |
| South Central Asia | 26,965 | 1.5% |
| South Eastern Asia | 17,014 | 0.9% |
| Southern Europe | 3,210 | 0.2% |
| Spain | 710 | 0.0% |
| Sri Lanka | 1,044 | 0.1% |
| St. Vincent and the Grenadines | 261 | 0.0% |
| Sudan | 95 | 0.0% |
| Sweden | 279 | 0.0% |
| Switzerland | 97 | 0.0% |
| Syria | 886 | 0.1% |
| Taiwan | 849 | 0.1% |
| Thailand | 1,226 | 0.1% |
| Trinidad and Tobago | 3,978 | 0.2% |
| Turkey | 1,315 | 0.1% |
| Uganda | 130 | 0.0% |
| Ukraine | 1,352 | 0.1% |
| Uruguay | 902 | 0.1% |
| Uzbekistan | 82 | 0.0% |
| Venezuela | 13,254 | 0.7% |
| Vietnam | 6,515 | 0.4% |
| West Indies | 160 | 0.0% |
| Western Africa | 2,859 | 0.2% |
| Western Asia | 8,011 | 0.4% |
| Western Europe | 5,531 | 0.3% |
| Yemen | 23 | 0.0% |
| Zaire | 65 | 0.0% |
| Zimbabwe | 133 | 0.0% | View All 137 Rows |
Sex and Age in Area Code 813
Sex and Age in Area Code 813
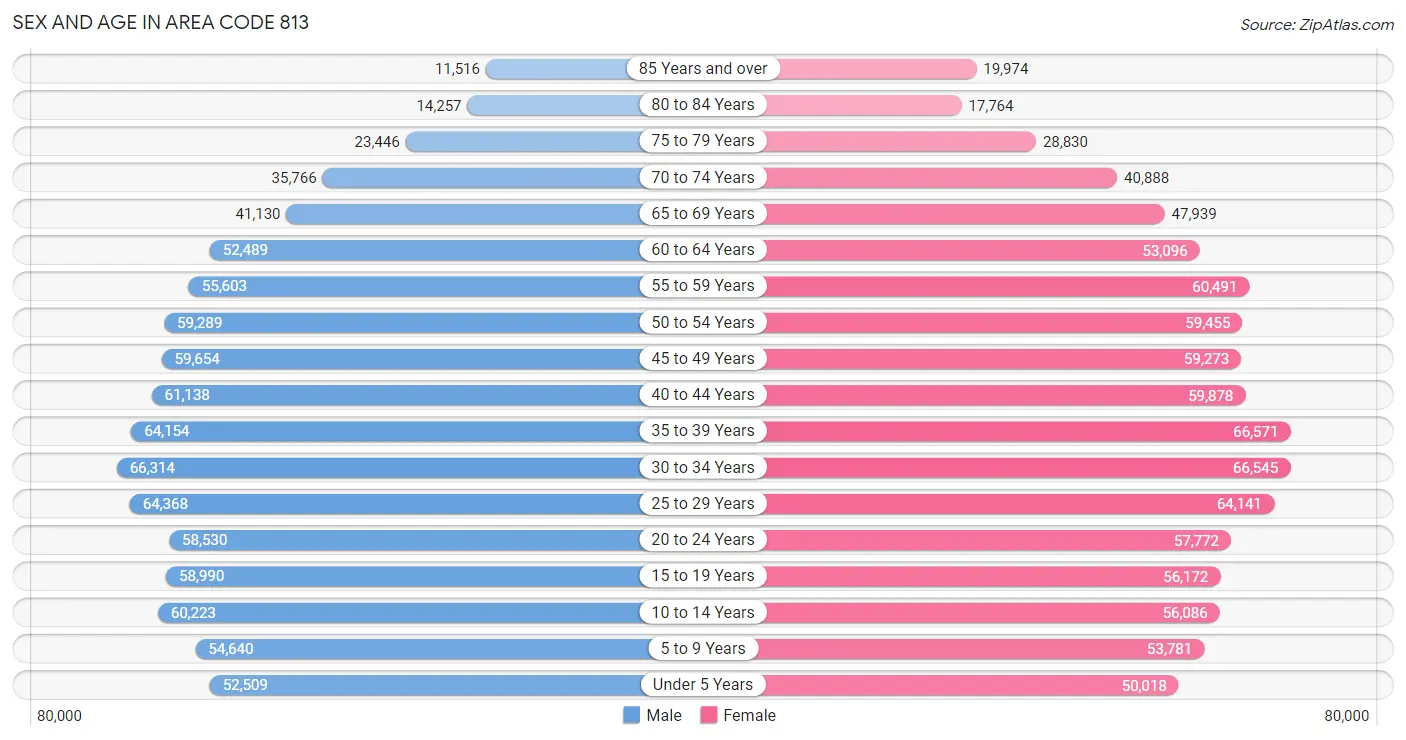
The most populous age groups in Area Code 813 are 30 to 34 Years (66,314 | 7.4%) for men and 35 to 39 Years (66,571 | 7.2%) for women.
| Age Bracket | Male | Female |
| Under 5 Years | 52,509 (5.9%) | 50,018 (5.4%) |
| 5 to 9 Years | 54,640 (6.1%) | 53,781 (5.9%) |
| 10 to 14 Years | 60,223 (6.7%) | 56,086 (6.1%) |
| 15 to 19 Years | 58,990 (6.6%) | 56,172 (6.1%) |
| 20 to 24 Years | 58,530 (6.6%) | 57,772 (6.3%) |
| 25 to 29 Years | 64,368 (7.2%) | 64,141 (7.0%) |
| 30 to 34 Years | 66,314 (7.4%) | 66,545 (7.2%) |
| 35 to 39 Years | 64,154 (7.2%) | 66,571 (7.2%) |
| 40 to 44 Years | 61,138 (6.8%) | 59,878 (6.5%) |
| 45 to 49 Years | 59,654 (6.7%) | 59,273 (6.5%) |
| 50 to 54 Years | 59,289 (6.6%) | 59,455 (6.5%) |
| 55 to 59 Years | 55,603 (6.2%) | 60,491 (6.6%) |
| 60 to 64 Years | 52,489 (5.9%) | 53,096 (5.8%) |
| 65 to 69 Years | 41,130 (4.6%) | 47,939 (5.2%) |
| 70 to 74 Years | 35,766 (4.0%) | 40,888 (4.4%) |
| 75 to 79 Years | 23,446 (2.6%) | 28,830 (3.1%) |
| 80 to 84 Years | 14,257 (1.6%) | 17,764 (1.9%) |
| 85 Years and over | 11,516 (1.3%) | 19,974 (2.2%) |
| Total | 894,016 (100.0%) | 918,674 (100.0%) |
Families and Households in Area Code 813
Median Family Size in Area Code 813
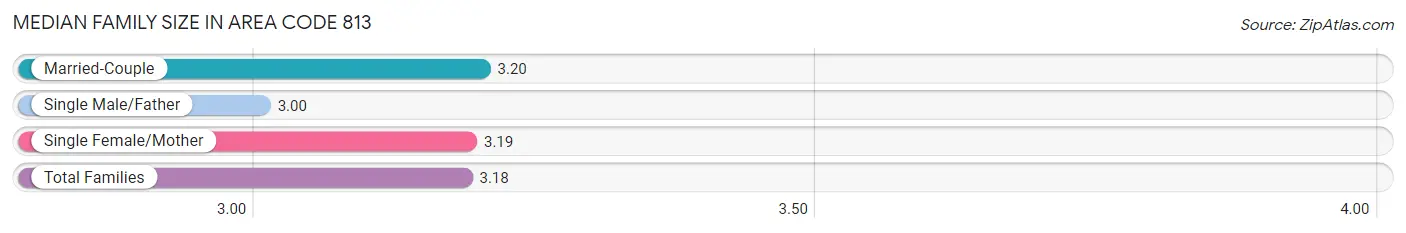
The median family size in Area Code 813 is 3.18 persons per family, with married-couple families (315,611 | 71.7%) accounting for the largest median family size of 3.20074 persons per family. On the other hand, single male/father families (36,255 | 8.2%) represent the smallest median family size with 3.00 persons per family.
| Family Type | # Families | Family Size |
| Married-Couple | 315,611 (71.7%) | 3.20 |
| Single Male/Father | 36,255 (8.2%) | 3.00 |
| Single Female/Mother | 88,349 (20.1%) | 3.19 |
| Total Families | 440,215 (100.0%) | 3.18 |
Median Household Size in Area Code 813
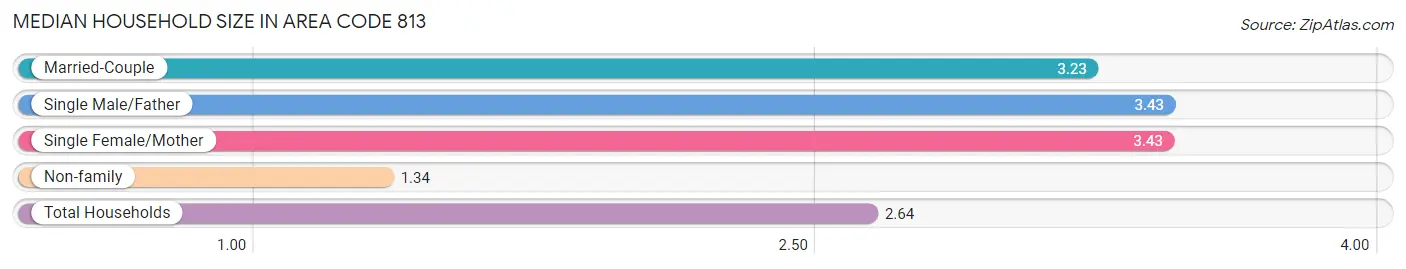
The median household size in Area Code 813 is 2.64 persons per household, with single male/father households (36,255 | 5.3%) accounting for the largest median household size of 3.43492 persons per household. non-family households (247,782 | 36.0%) represent the smallest median household size with 1.34 persons per household.
| Household Type | # Households | Household Size |
| Married-Couple | 315,611 (45.9%) | 3.23 |
| Single Male/Father | 36,255 (5.3%) | 3.43 |
| Single Female/Mother | 88,349 (12.8%) | 3.43 |
| Non-family | 247,782 (36.0%) | 1.34 |
| Total Households | 687,997 (100.0%) | 2.64 |
Household Size by Marriage Status in Area Code 813
Out of a total of 687,997 households in Area Code 813, 440,215 (64.0%) are family households, while 247,782 (36.0%) are nonfamily households. The most numerous type of family households are 2-person households, comprising 184,910, and the most common type of nonfamily households are 1-person households, comprising 191,826.
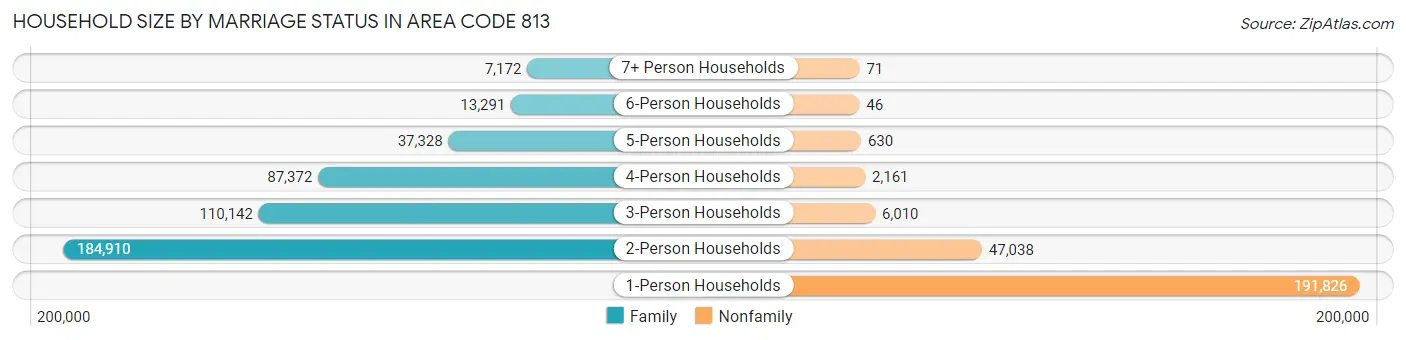
| Household Size | Family Households | Nonfamily Households |
| 1-Person Households | - | 191,826 (27.9%) |
| 2-Person Households | 184,910 (26.9%) | 47,038 (6.8%) |
| 3-Person Households | 110,142 (16.0%) | 6,010 (0.9%) |
| 4-Person Households | 87,372 (12.7%) | 2,161 (0.3%) |
| 5-Person Households | 37,328 (5.4%) | 630 (0.1%) |
| 6-Person Households | 13,291 (1.9%) | 46 (0.0%) |
| 7+ Person Households | 7,172 (1.0%) | 71 (0.0%) |
| Total | 440,215 (64.0%) | 247,782 (36.0%) |
Female Fertility in Area Code 813
Fertility by Age in Area Code 813
Average fertility rate in Area Code 813 is 50.1 births per 1,000 women. Women in the age bracket of 20 to 34 years have the highest fertility rate with 87.0 births per 1,000 women. Women in the age bracket of 20 to 34 years acount for 70.4% of all women with births.
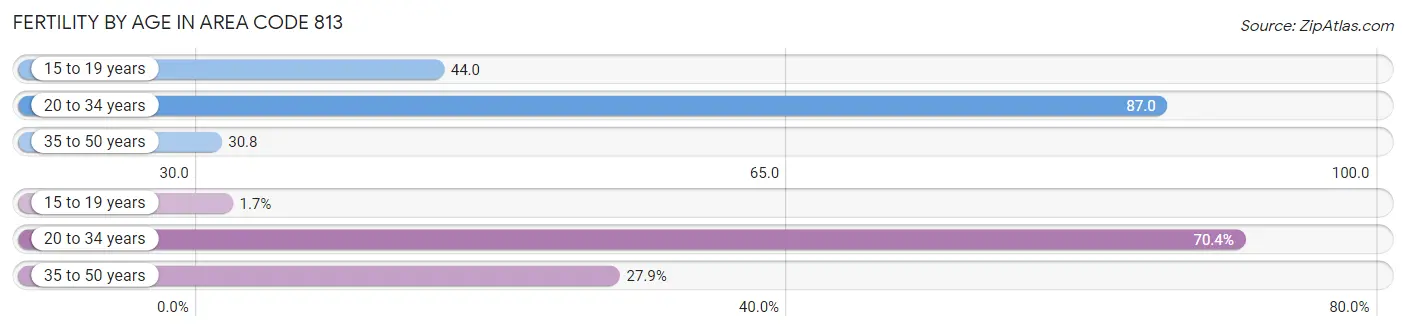
| Age Bracket | Women with Births | Births / 1,000 Women |
| 15 to 19 years | 348 (1.7%) | 44.0 |
| 20 to 34 years | 14,762 (70.4%) | 87.0 |
| 35 to 50 years | 5,856 (27.9%) | 30.8 |
| Total | 20,966 (100.0%) | 50.1 |
Fertility by Age by Marriage Status in Area Code 813
59.4% of women with births (20,966) in Area Code 813 are married. The highest percentage of unmarried women with births falls into 15 to 19 years age bracket with 93.7% of them unmarried at the time of birth, while the lowest percentage of unmarried women with births belong to 20 to 34 years age bracket with 43.3% of them unmarried.
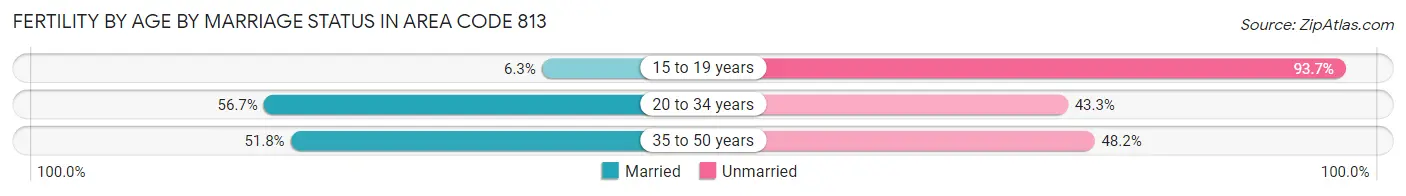
| Age Bracket | Married | Unmarried |
| 15 to 19 years | 22 (6.3%) | 326 (93.7%) |
| 20 to 34 years | 8,369 (56.7%) | 6,393 (43.3%) |
| 35 to 50 years | 3,035 (51.8%) | 2,821 (48.2%) |
| Total | 12,452 (59.4%) | 8,514 (40.6%) |
Fertility by Education in Area Code 813
Average fertility rate in Area Code 813 is 50.1 births per 1,000 women. Women with the education attainment of graduate degree have the highest fertility rate of 66.3 births per 1,000 women, while women with the education attainment of less than high school have the lowest fertility at 52.8 births per 1,000 women. Women with the education attainment of college or associate's degree represent 32.6% of all women with births.
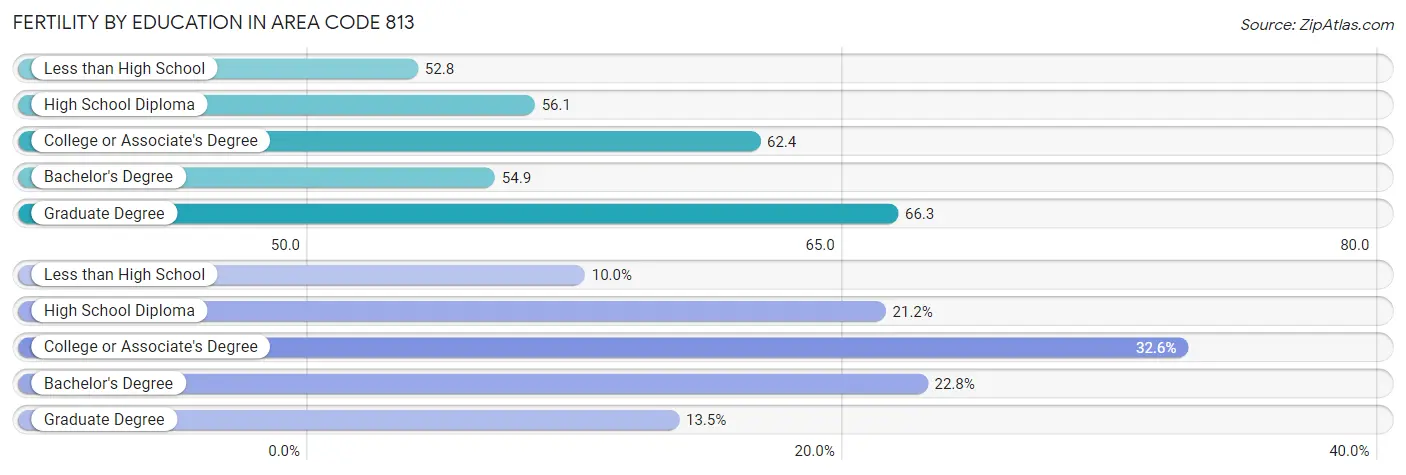
| Educational Attainment | Women with Births | Births / 1,000 Women |
| Less than High School | 2,086 (10.0%) | 52.8 |
| High School Diploma | 4,450 (21.2%) | 56.1 |
| College or Associate's Degree | 6,825 (32.6%) | 62.4 |
| Bachelor's Degree | 4,778 (22.8%) | 54.9 |
| Graduate Degree | 2,827 (13.5%) | 66.3 |
| Total | 20,966 (100.0%) | 50.1 |
Fertility by Education by Marriage Status in Area Code 813
40.6% of women with births in Area Code 813 are unmarried. Women with the educational attainment of bachelor's degree are most likely to be married with 64.6% of them married at childbirth, while women with the educational attainment of high school diploma are least likely to be married with 75.5% of them unmarried at childbirth.
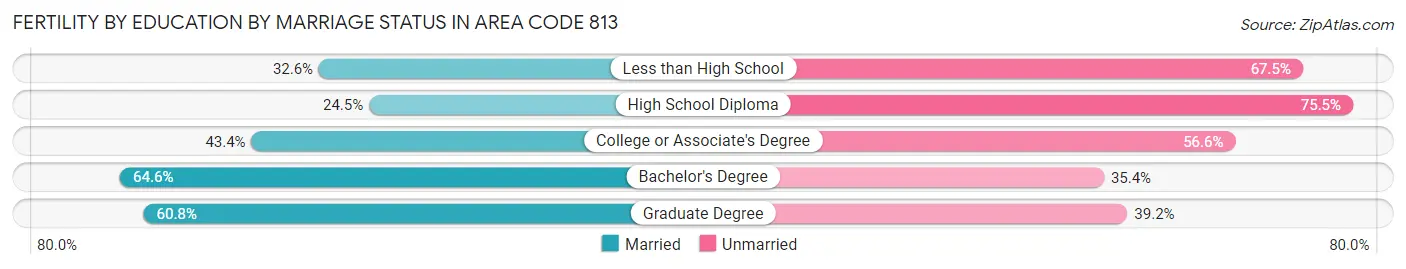
| Educational Attainment | Married | Unmarried |
| Less than High School | 679 (32.6%) | 1,407 (67.4%) |
| High School Diploma | 1,089 (24.5%) | 3,361 (75.5%) |
| College or Associate's Degree | 2,964 (43.4%) | 3,861 (56.6%) |
| Bachelor's Degree | 3,086 (64.6%) | 1,692 (35.4%) |
| Graduate Degree | 1,719 (60.8%) | 1,108 (39.2%) |
| Total | 12,452 (59.4%) | 8,514 (40.6%) |
Employment Characteristics in Area Code 813
Employment by Class of Employer in Area Code 813
Among the 880,004 employed individuals in Area Code 813, private company employees (624,948 | 71.0%), not-for-profit organizations (60,093 | 6.8%), and local government employees (54,436 | 6.2%) make up the most common classes of employment.
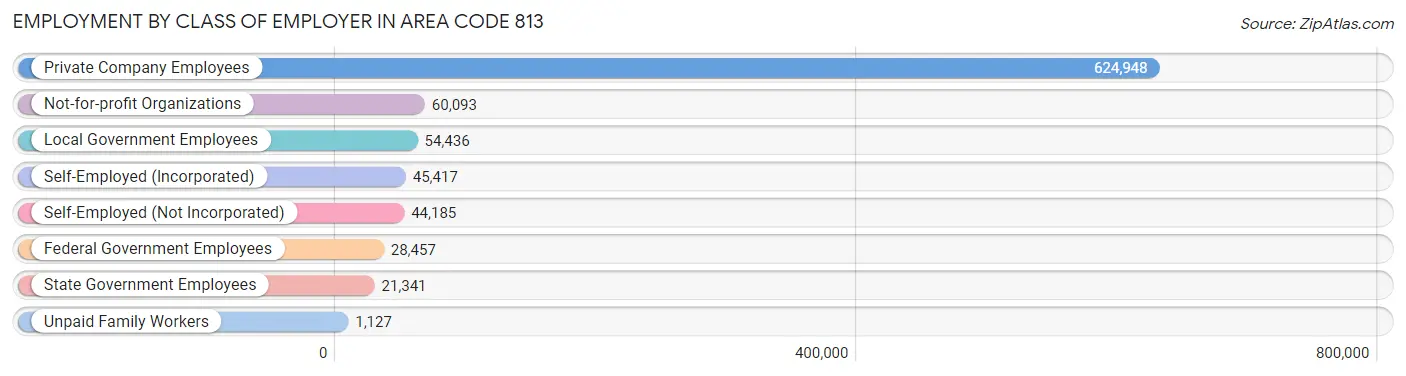
| Employer Class | # Employees | % Employees |
| Private Company Employees | 624,948 | 71.0% |
| Self-Employed (Incorporated) | 45,417 | 5.2% |
| Self-Employed (Not Incorporated) | 44,185 | 5.0% |
| Not-for-profit Organizations | 60,093 | 6.8% |
| Local Government Employees | 54,436 | 6.2% |
| State Government Employees | 21,341 | 2.4% |
| Federal Government Employees | 28,457 | 3.2% |
| Unpaid Family Workers | 1,127 | 0.1% |
| Total | 880,004 | 100.0% |
Employment Status by Age in Area Code 813
According to the labor force statistics for Area Code 813, out of the total population over 16 years of age (1,463,387), 63.2% or 925,446 individuals are in the labor force, with 4.9% or 45,162 of them unemployed. The age group with the highest labor force participation rate is 30 to 34 years, with 85.5% or 113,648 individuals in the labor force. Within the labor force, the 16 to 19 years age range has the highest percentage of unemployed individuals, with 972.8% or 351,920 of them being unemployed.
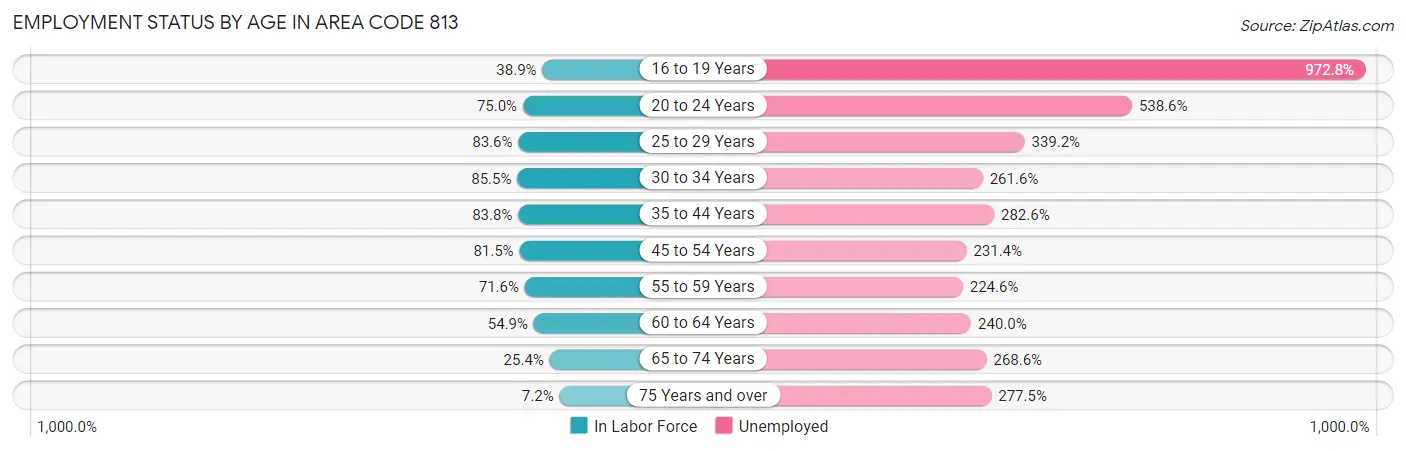
| Age Bracket | In Labor Force | Unemployed |
| 16 to 19 Years | 36,173 (38.9%) | 351,920 (972.8%) |
| 20 to 24 Years | 87,242 (75.0%) | 469,864 (538.6%) |
| 25 to 29 Years | 107,406 (83.6%) | 364,328 (339.2%) |
| 30 to 34 Years | 113,644 (85.5%) | 297,303 (261.6%) |
| 35 to 44 Years | 210,974 (83.8%) | 596,241 (282.6%) |
| 45 to 54 Years | 193,626 (81.5%) | 448,062 (231.4%) |
| 55 to 59 Years | 83,161 (71.6%) | 186,773 (224.6%) |
| 60 to 64 Years | 57,943 (54.9%) | 139,068 (240.0%) |
| 65 to 74 Years | 42,053 (25.4%) | 112,973 (268.6%) |
| 75 Years and over | 8,305 (7.2%) | 23,038 (277.5%) |
| Total | 925,385 (63.2%) | 45,126 (4.9%) |
Employment Status by Educational Attainment in Area Code 813
According to labor force statistics for Area Code 813, 77.9% of individuals (757,448) out of the total population between 25 and 64 years of age (972,459) are in the labor force, with 264.8% or 2,005,722 of them being unemployed. The group with the highest labor force participation rate are those with the educational attainment of bachelor's degree or higher, with 86.4% or 318,308 individuals in the labor force. Within the labor force, individuals with less than high school education have the highest percentage of unemployment, with 481.7% or 268,981 of them being unemployed.
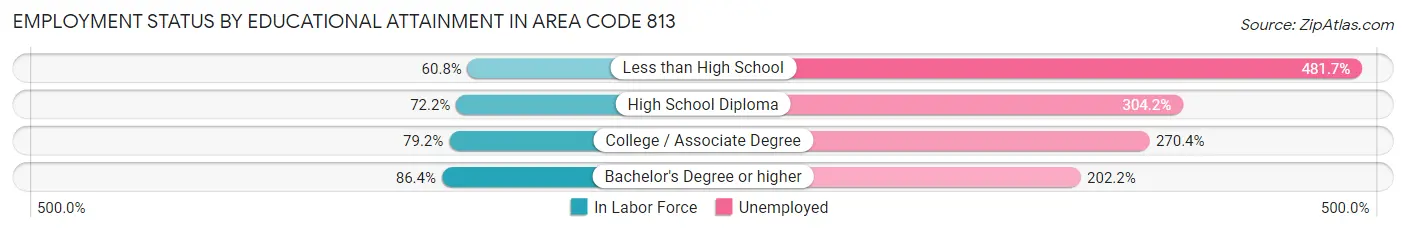
| Educational Attainment | In Labor Force | Unemployed |
| Less than High School | 55,840 (60.8%) | 442,480 (481.7%) |
| High School Diploma | 171,880 (72.2%) | 724,677 (304.2%) |
| College / Associate Degree | 216,933 (79.2%) | 741,031 (270.4%) |
| Bachelor's Degree or higher | 318,296 (86.4%) | 744,757 (202.2%) |
| Total | 757,429 (77.9%) | 2,575,071 (264.8%) |
Employment Occupations by Sex in Area Code 813
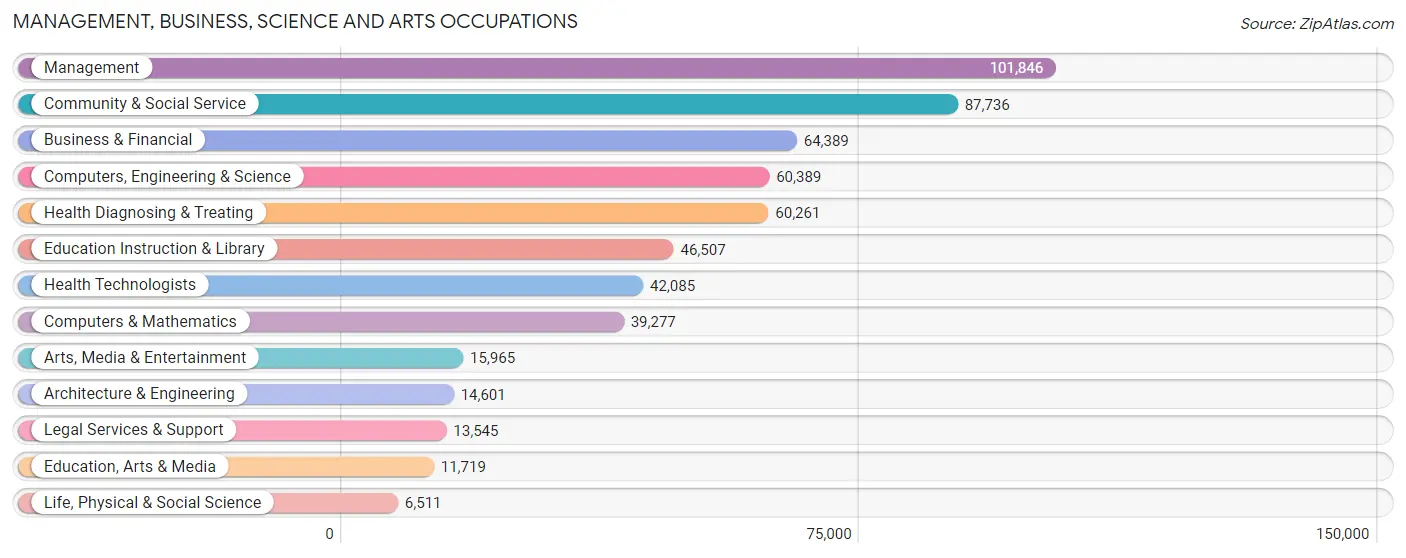
Management, Business, Science and Arts Occupations
The most common Management, Business, Science and Arts occupations in Area Code 813 are Management (101,846 | 11.5%), Community & Social Service (87,736 | 9.9%), Business & Financial (64,389 | 7.2%), Computers, Engineering & Science (60,389 | 6.8%), and Health Diagnosing & Treating (60,261 | 6.8%).
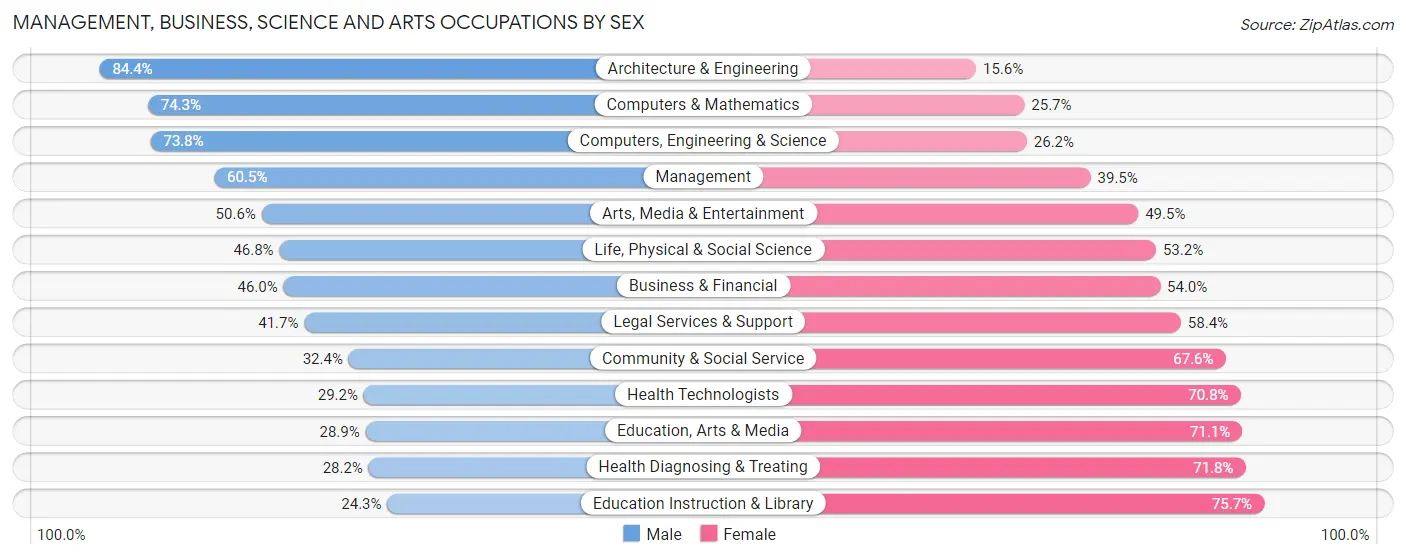
Management, Business, Science and Arts Occupations by Sex
Within the Management, Business, Science and Arts occupations in Area Code 813, the most male-oriented occupations are Architecture & Engineering (84.4%), Computers & Mathematics (74.3%), and Computers, Engineering & Science (73.8%), while the most female-oriented occupations are Education Instruction & Library (75.7%), Health Diagnosing & Treating (71.8%), and Education, Arts & Media (71.1%).
| Occupation | Male | Female |
| Management | 61,595 (60.5%) | 40,251 (39.5%) |
| Business & Financial | 29,609 (46.0%) | 34,780 (54.0%) |
| Computers, Engineering & Science | 44,554 (73.8%) | 15,835 (26.2%) |
| Computers & Mathematics | 29,184 (74.3%) | 10,093 (25.7%) |
| Architecture & Engineering | 12,320 (84.4%) | 2,281 (15.6%) |
| Life, Physical & Social Science | 3,050 (46.8%) | 3,461 (53.2%) |
| Community & Social Service | 28,409 (32.4%) | 59,327 (67.6%) |
| Education, Arts & Media | 3,384 (28.9%) | 8,335 (71.1%) |
| Legal Services & Support | 5,642 (41.6%) | 7,903 (58.4%) |
| Education Instruction & Library | 11,313 (24.3%) | 35,194 (75.7%) |
| Arts, Media & Entertainment | 8,070 (50.5%) | 7,895 (49.4%) |
| Health Diagnosing & Treating | 17,004 (28.2%) | 43,257 (71.8%) |
| Health Technologists | 12,304 (29.2%) | 29,781 (70.8%) |
| Total (Category) | 181,171 (48.4%) | 193,450 (51.6%) |
| Total (Overall) | 465,929 (52.4%) | 423,014 (47.6%) |
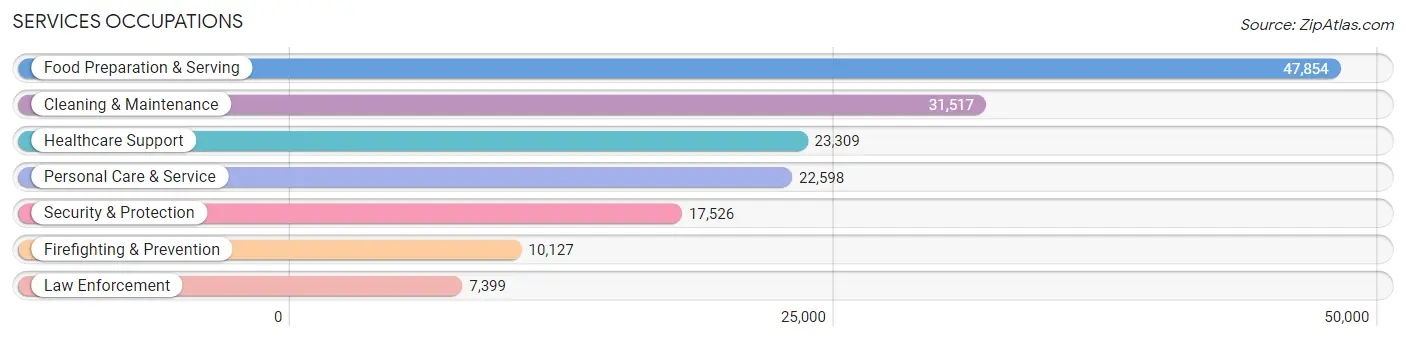
Services Occupations
The most common Services occupations in Area Code 813 are Food Preparation & Serving (47,854 | 5.4%), Cleaning & Maintenance (31,517 | 3.5%), Healthcare Support (23,309 | 2.6%), Personal Care & Service (22,598 | 2.5%), and Security & Protection (17,526 | 2.0%).
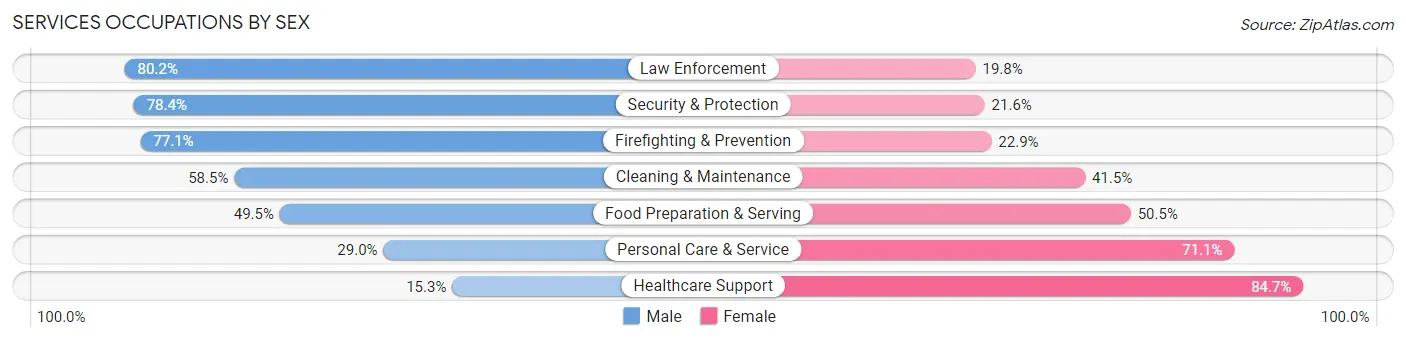
Services Occupations by Sex
Within the Services occupations in Area Code 813, the most male-oriented occupations are Law Enforcement (80.2%), Security & Protection (78.4%), and Firefighting & Prevention (77.1%), while the most female-oriented occupations are Healthcare Support (84.7%), Personal Care & Service (71.1%), and Food Preparation & Serving (50.5%).
| Occupation | Male | Female |
| Healthcare Support | 3,570 (15.3%) | 19,739 (84.7%) |
| Security & Protection | 13,738 (78.4%) | 3,788 (21.6%) |
| Firefighting & Prevention | 7,804 (77.1%) | 2,323 (22.9%) |
| Law Enforcement | 5,934 (80.2%) | 1,465 (19.8%) |
| Food Preparation & Serving | 23,673 (49.5%) | 24,181 (50.5%) |
| Cleaning & Maintenance | 18,435 (58.5%) | 13,082 (41.5%) |
| Personal Care & Service | 6,541 (28.9%) | 16,057 (71.1%) |
| Total (Category) | 65,957 (46.2%) | 76,847 (53.8%) |
| Total (Overall) | 465,929 (52.4%) | 423,014 (47.6%) |
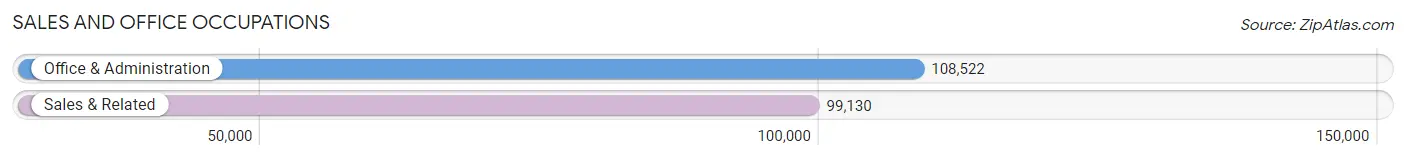
Sales and Office Occupations
The most common Sales and Office occupations in Area Code 813 are Office & Administration (108,522 | 12.2%), and Sales & Related (99,130 | 11.2%).
Sales and Office Occupations by Sex
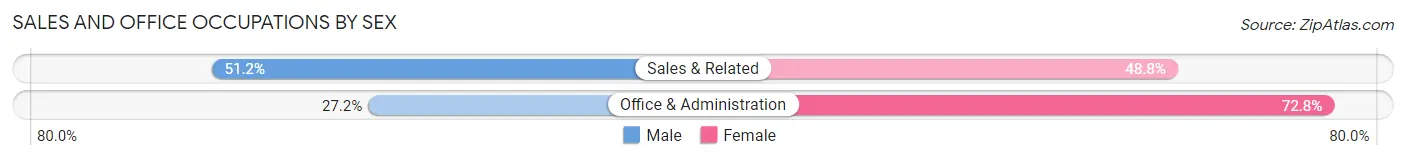
| Occupation | Male | Female |
| Sales & Related | 50,777 (51.2%) | 48,353 (48.8%) |
| Office & Administration | 29,478 (27.2%) | 79,044 (72.8%) |
| Total (Category) | 80,255 (38.7%) | 127,397 (61.4%) |
| Total (Overall) | 465,929 (52.4%) | 423,014 (47.6%) |
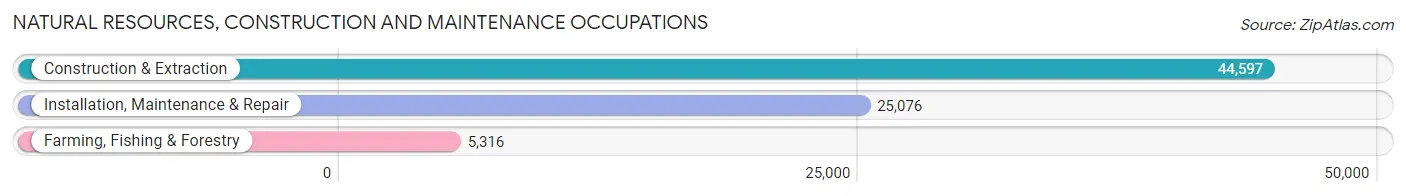
Natural Resources, Construction and Maintenance Occupations
The most common Natural Resources, Construction and Maintenance occupations in Area Code 813 are Construction & Extraction (44,597 | 5.0%), Installation, Maintenance & Repair (25,076 | 2.8%), and Farming, Fishing & Forestry (5,316 | 0.6%).
Natural Resources, Construction and Maintenance Occupations by Sex
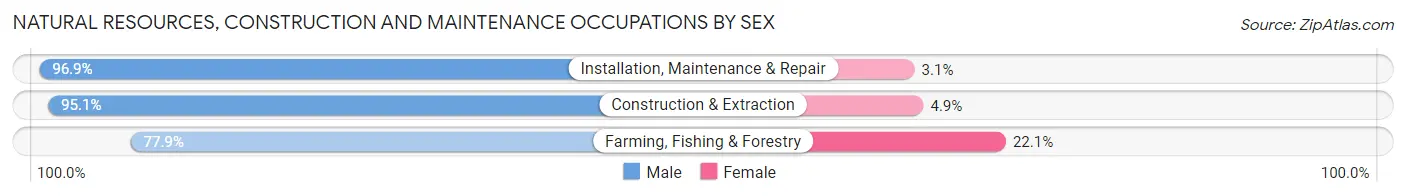
| Occupation | Male | Female |
| Farming, Fishing & Forestry | 4,143 (77.9%) | 1,173 (22.1%) |
| Construction & Extraction | 42,406 (95.1%) | 2,191 (4.9%) |
| Installation, Maintenance & Repair | 24,305 (96.9%) | 771 (3.1%) |
| Total (Category) | 70,854 (94.5%) | 4,135 (5.5%) |
| Total (Overall) | 465,929 (52.4%) | 423,014 (47.6%) |
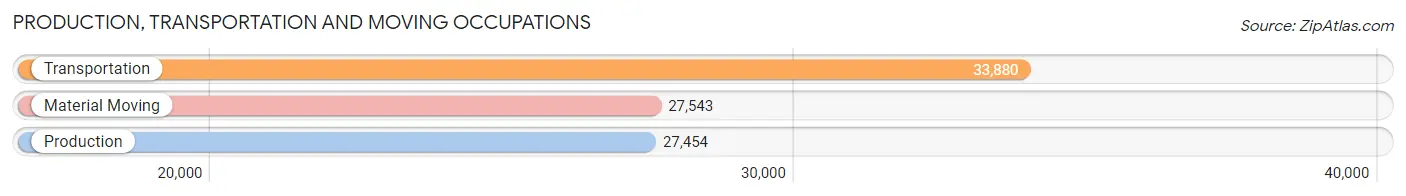
Production, Transportation and Moving Occupations
The most common Production, Transportation and Moving occupations in Area Code 813 are Transportation (33,880 | 3.8%), Material Moving (27,543 | 3.1%), and Production (27,454 | 3.1%).
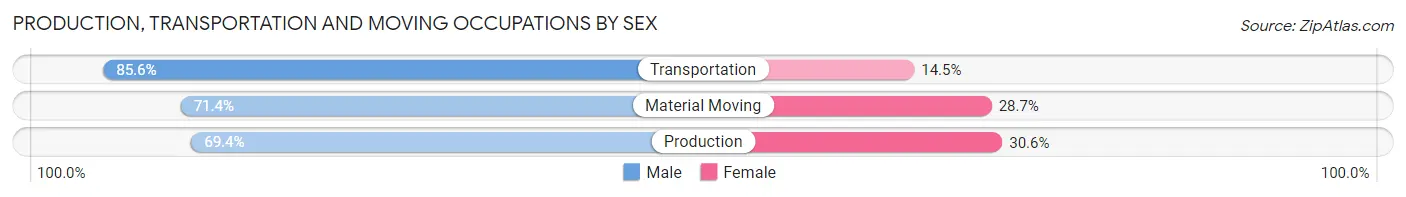
Production, Transportation and Moving Occupations by Sex
| Occupation | Male | Female |
| Production | 19,054 (69.4%) | 8,400 (30.6%) |
| Transportation | 28,986 (85.6%) | 4,894 (14.4%) |
| Material Moving | 19,652 (71.4%) | 7,891 (28.6%) |
| Total (Category) | 67,692 (76.2%) | 21,185 (23.8%) |
| Total (Overall) | 465,929 (52.4%) | 423,014 (47.6%) |
Employment Industries by Sex in Area Code 813
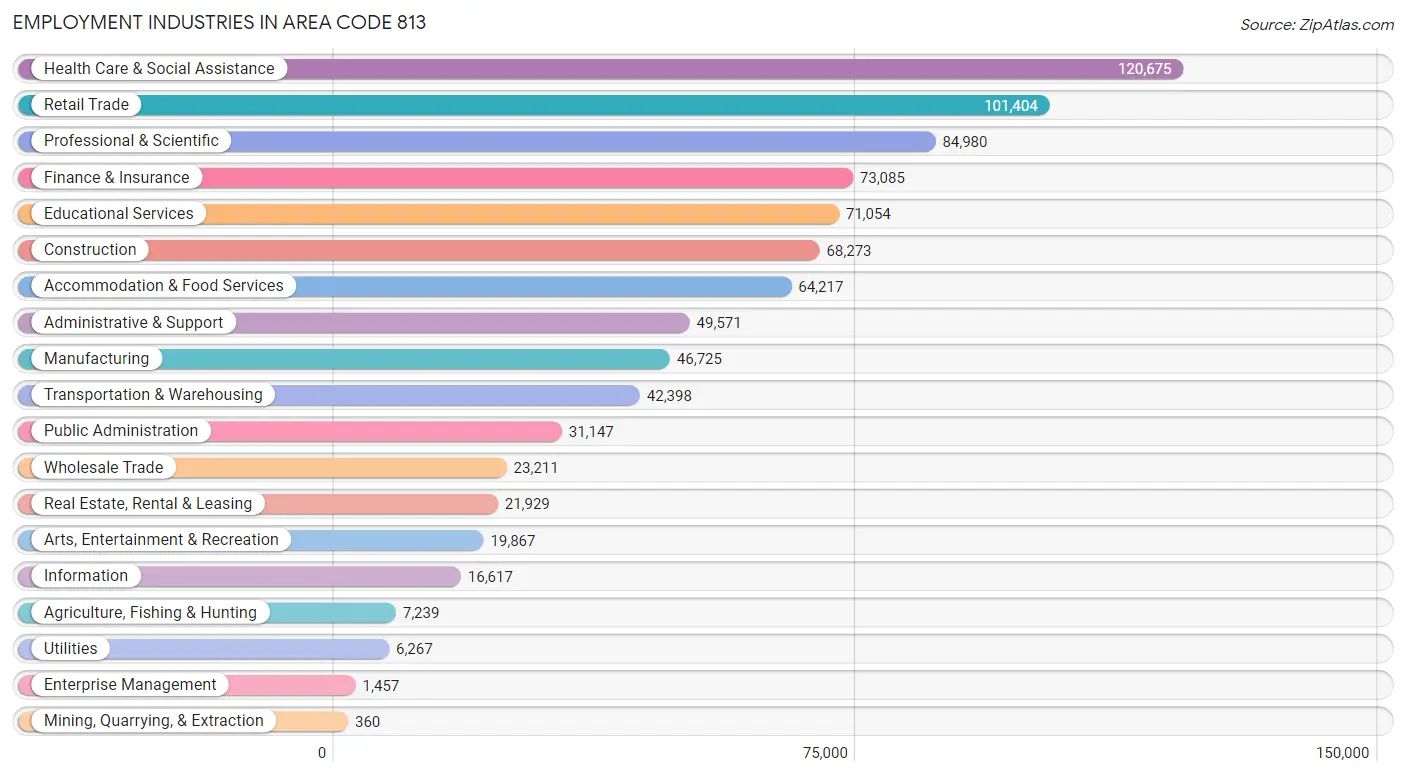
Employment Industries in Area Code 813
The major employment industries in Area Code 813 include Health Care & Social Assistance (120,675 | 13.6%), Retail Trade (101,404 | 11.4%), Professional & Scientific (84,980 | 9.6%), Finance & Insurance (73,085 | 8.2%), and Educational Services (71,054 | 8.0%).
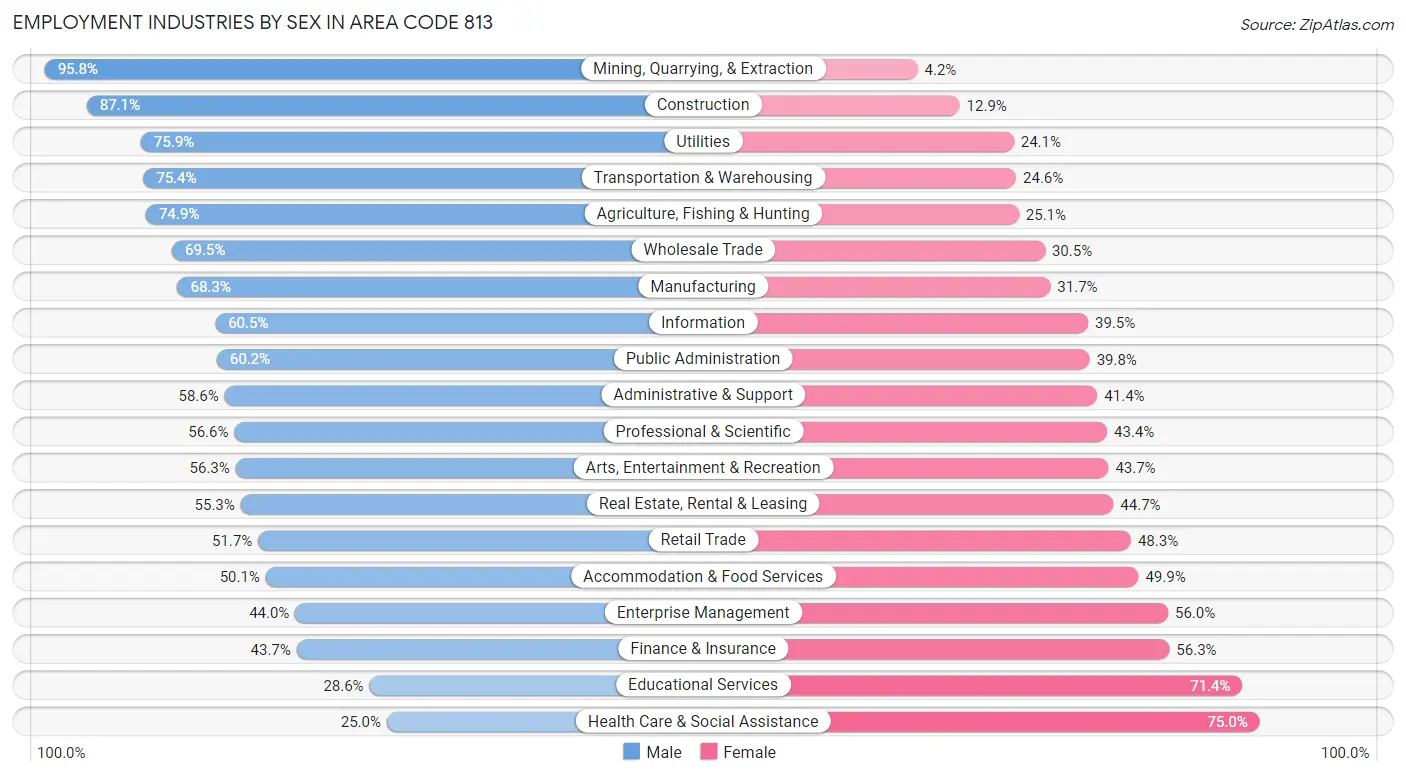
Employment Industries by Sex in Area Code 813
The Area Code 813 industries that see more men than women are Mining, Quarrying, & Extraction (95.8%), Construction (87.1%), and Utilities (75.9%), whereas the industries that tend to have a higher number of women are Health Care & Social Assistance (75.0%), Educational Services (71.4%), and Finance & Insurance (56.3%).
| Industry | Male | Female |
| Agriculture, Fishing & Hunting | 5,420 (74.9%) | 1,819 (25.1%) |
| Mining, Quarrying, & Extraction | 345 (95.8%) | 15 (4.2%) |
| Construction | 59,482 (87.1%) | 8,791 (12.9%) |
| Manufacturing | 31,927 (68.3%) | 14,798 (31.7%) |
| Wholesale Trade | 16,123 (69.5%) | 7,088 (30.5%) |
| Retail Trade | 52,383 (51.7%) | 49,021 (48.3%) |
| Transportation & Warehousing | 31,982 (75.4%) | 10,416 (24.6%) |
| Utilities | 4,758 (75.9%) | 1,509 (24.1%) |
| Information | 10,060 (60.5%) | 6,557 (39.5%) |
| Finance & Insurance | 31,938 (43.7%) | 41,147 (56.3%) |
| Real Estate, Rental & Leasing | 12,125 (55.3%) | 9,804 (44.7%) |
| Professional & Scientific | 48,096 (56.6%) | 36,884 (43.4%) |
| Enterprise Management | 641 (44.0%) | 816 (56.0%) |
| Administrative & Support | 29,054 (58.6%) | 20,517 (41.4%) |
| Educational Services | 20,334 (28.6%) | 50,720 (71.4%) |
| Health Care & Social Assistance | 30,206 (25.0%) | 90,469 (75.0%) |
| Arts, Entertainment & Recreation | 11,190 (56.3%) | 8,677 (43.7%) |
| Accommodation & Food Services | 32,170 (50.1%) | 32,047 (49.9%) |
| Public Administration | 18,752 (60.2%) | 12,395 (39.8%) |
| Total | 465,929 (52.4%) | 423,014 (47.6%) |
Education in Area Code 813
School Enrollment in Area Code 813
The most common levels of schooling among the 442,325 students in Area Code 813 are college / undergraduate (100,822 | 22.8%), middle school (89,783 | 20.3%), and high school (89,585 | 20.3%).
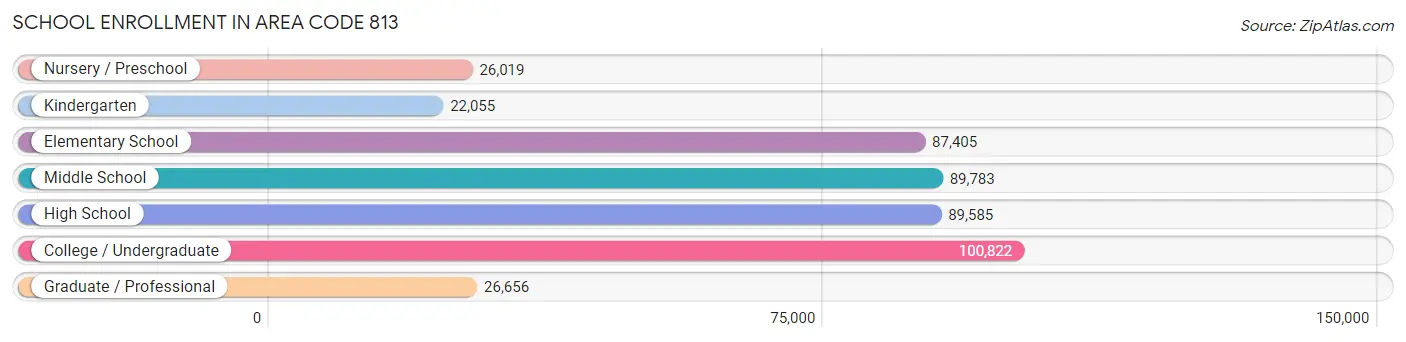
| School Level | # Students | % Students |
| Nursery / Preschool | 26,019 | 5.9% |
| Kindergarten | 22,055 | 5.0% |
| Elementary School | 87,405 | 19.8% |
| Middle School | 89,783 | 20.3% |
| High School | 89,585 | 20.3% |
| College / Undergraduate | 100,822 | 22.8% |
| Graduate / Professional | 26,656 | 6.0% |
| Total | 442,325 | 100.0% |
School Enrollment by Age by Funding Source in Area Code 813
Out of a total of 442,325 students who are enrolled in schools in Area Code 813, 85,133 (19.3%) attend a private institution, while the remaining 357,192 (80.7%) are enrolled in public schools. The age group of 3 to 4 year olds has the highest likelihood of being enrolled in private schools, with 9,019 (43.1% in the age bracket) enrolled. Conversely, the age group of 15 to 17 year olds has the lowest likelihood of being enrolled in a private school, with 56,859 (87.9% in the age bracket) attending a public institution.
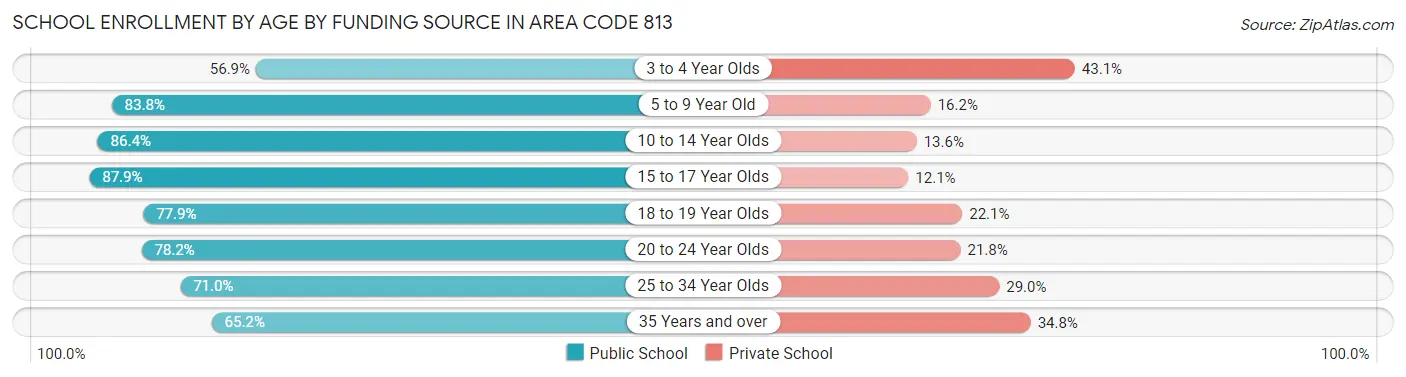
| Age Bracket | Public School | Private School |
| 3 to 4 Year Olds | 11,922 (56.9%) | 9,019 (43.1%) |
| 5 to 9 Year Old | 86,031 (83.8%) | 16,659 (16.2%) |
| 10 to 14 Year Olds | 98,288 (86.4%) | 15,480 (13.6%) |
| 15 to 17 Year Olds | 56,859 (87.9%) | 7,798 (12.1%) |
| 18 to 19 Year Olds | 27,632 (77.9%) | 7,840 (22.1%) |
| 20 to 24 Year Olds | 38,169 (78.2%) | 10,620 (21.8%) |
| 25 to 34 Year Olds | 21,655 (71.0%) | 8,842 (29.0%) |
| 35 Years and over | 16,622 (65.2%) | 8,889 (34.8%) |
| Total | 357,192 (80.7%) | 85,133 (19.3%) |
Educational Attainment by Field of Study in Area Code 813
Business (115,227 | 24.1%), science & technology (51,157 | 10.7%), education (48,557 | 10.2%), social sciences (38,605 | 8.1%), and engineering (33,498 | 7.0%) are the most common fields of study among 477,584 individuals in Area Code 813 who have obtained a bachelor's degree or higher.
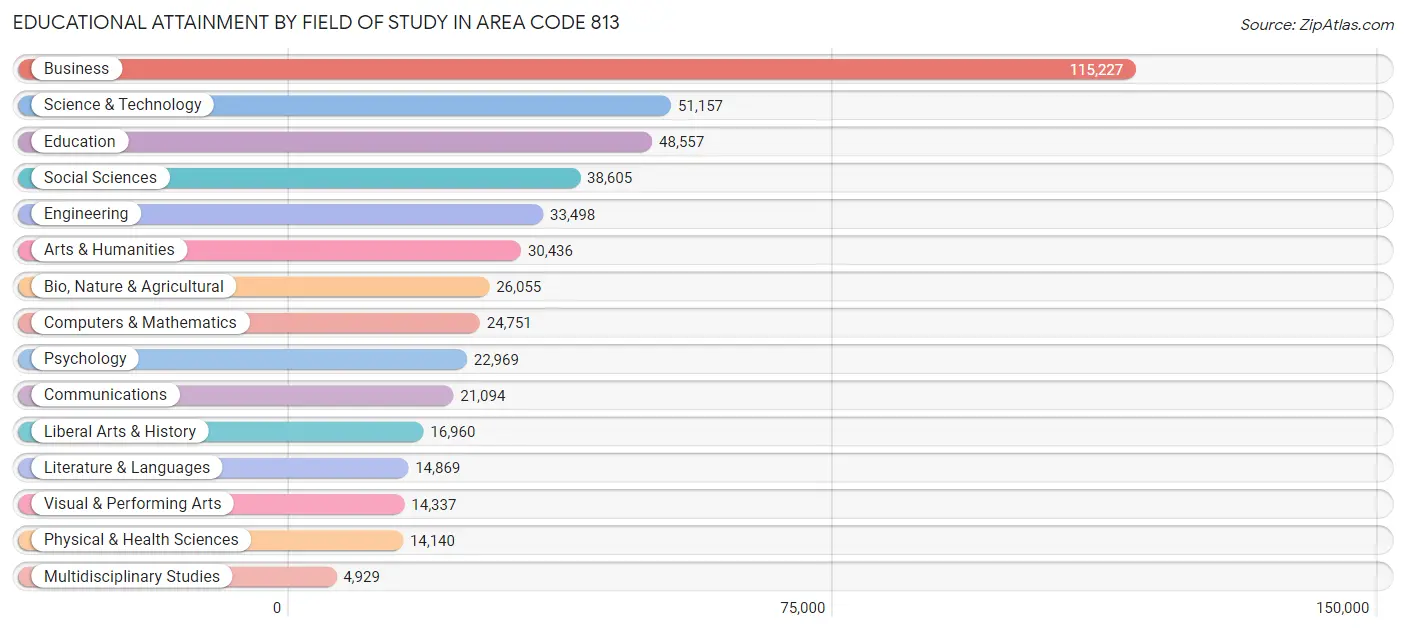
| Field of Study | # Graduates | % Graduates |
| Computers & Mathematics | 24,751 | 5.2% |
| Bio, Nature & Agricultural | 26,055 | 5.5% |
| Physical & Health Sciences | 14,140 | 3.0% |
| Psychology | 22,969 | 4.8% |
| Social Sciences | 38,605 | 8.1% |
| Engineering | 33,498 | 7.0% |
| Multidisciplinary Studies | 4,929 | 1.0% |
| Science & Technology | 51,157 | 10.7% |
| Business | 115,227 | 24.1% |
| Education | 48,557 | 10.2% |
| Literature & Languages | 14,869 | 3.1% |
| Liberal Arts & History | 16,960 | 3.5% |
| Visual & Performing Arts | 14,337 | 3.0% |
| Communications | 21,094 | 4.4% |
| Arts & Humanities | 30,436 | 6.4% |
| Total | 477,584 | 100.0% |
Transportation & Commute in Area Code 813
Vehicle Availability by Sex in Area Code 813
The most prevalent vehicle ownership categories in Area Code 813 are males with 2 vehicles (216,059, accounting for 46.9%) and females with 2 vehicles (182,528, making up 52.3%).
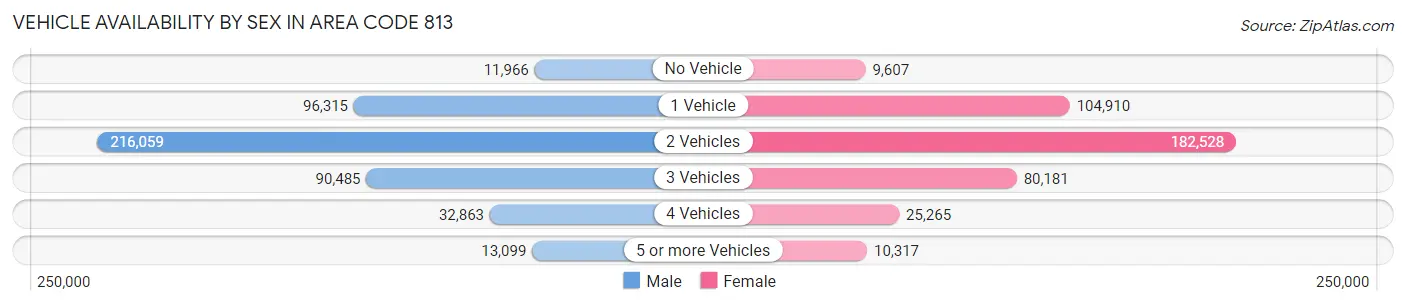
| Vehicles Available | Male | Female |
| No Vehicle | 11,966 (2.6%) | 9,607 (2.3%) |
| 1 Vehicle | 96,315 (20.9%) | 104,910 (25.4%) |
| 2 Vehicles | 216,059 (46.9%) | 182,528 (44.2%) |
| 3 Vehicles | 90,485 (19.6%) | 80,181 (19.4%) |
| 4 Vehicles | 32,863 (7.1%) | 25,265 (6.1%) |
| 5 or more Vehicles | 13,099 (2.8%) | 10,317 (2.5%) |
| Total | 460,787 (100.0%) | 412,808 (100.0%) |
Commute Time in Area Code 813
The most frequently occuring commute durations in Area Code 813 are 30 to 34 minutes (129,082 commuters, 17.5%), 20 to 24 minutes (106,737 commuters, 14.4%), and 15 to 19 minutes (98,125 commuters, 13.3%).
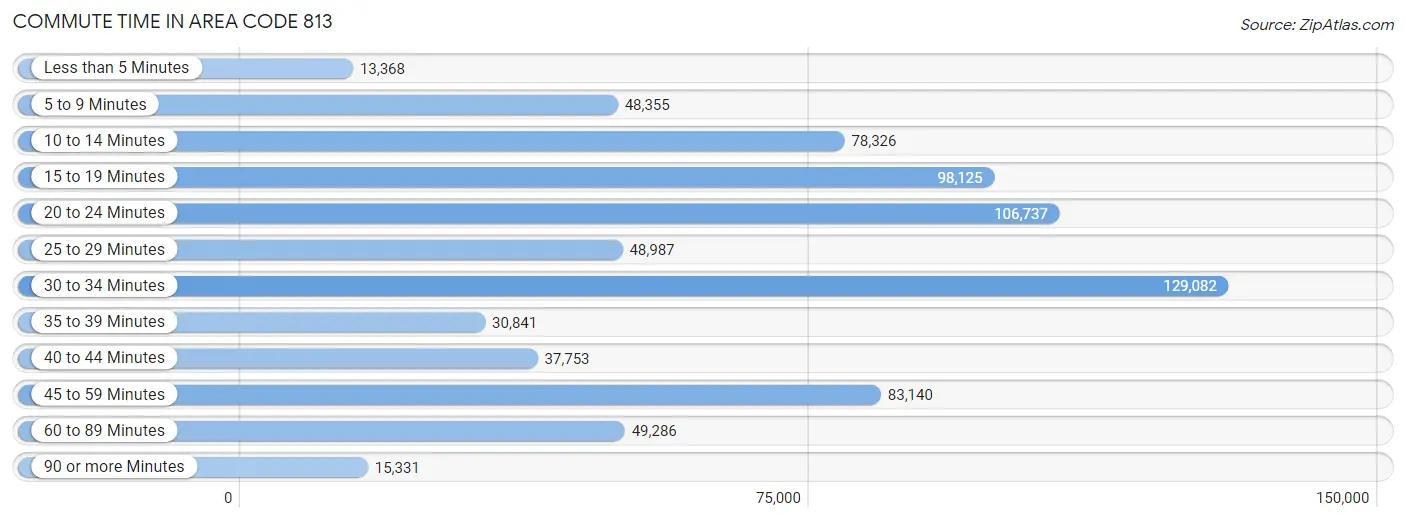
| Commute Time | # Commuters | % Commuters |
| Less than 5 Minutes | 13,368 | 1.8% |
| 5 to 9 Minutes | 48,355 | 6.5% |
| 10 to 14 Minutes | 78,326 | 10.6% |
| 15 to 19 Minutes | 98,125 | 13.3% |
| 20 to 24 Minutes | 106,737 | 14.4% |
| 25 to 29 Minutes | 48,987 | 6.6% |
| 30 to 34 Minutes | 129,082 | 17.5% |
| 35 to 39 Minutes | 30,841 | 4.2% |
| 40 to 44 Minutes | 37,753 | 5.1% |
| 45 to 59 Minutes | 83,140 | 11.3% |
| 60 to 89 Minutes | 49,286 | 6.7% |
| 90 or more Minutes | 15,331 | 2.1% |
Commute Time by Sex in Area Code 813
The most common commute times in Area Code 813 are 30 to 34 minutes (72,042 commuters, 18.2%) for males and 30 to 34 minutes (57,040 commuters, 16.6%) for females.
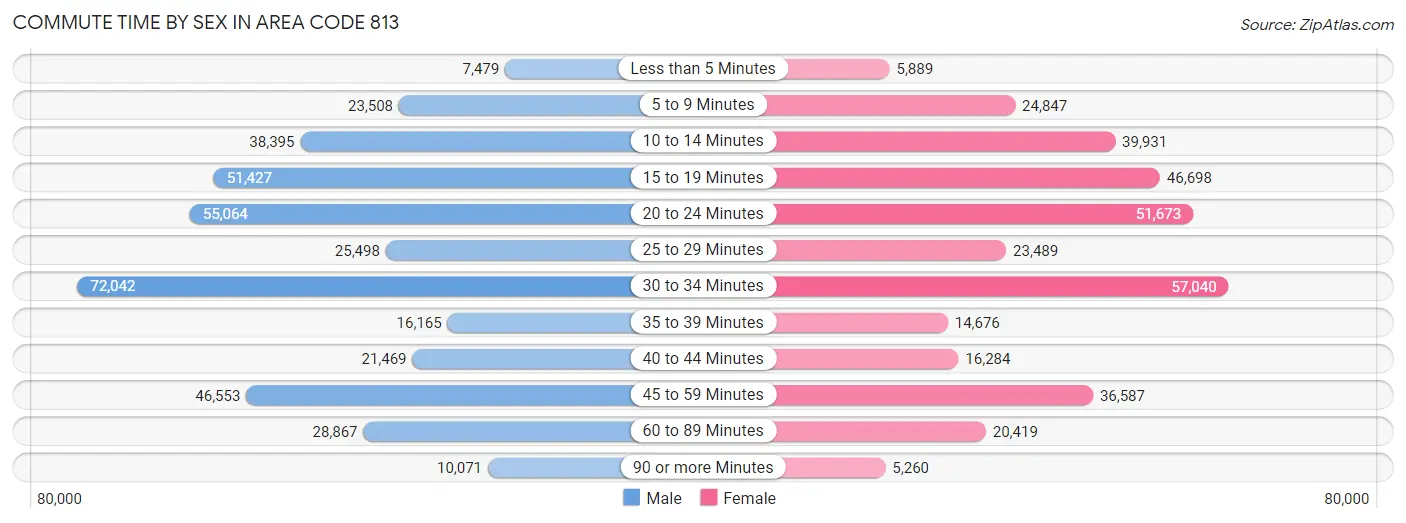
| Commute Time | Male | Female |
| Less than 5 Minutes | 7,479 (1.9%) | 5,889 (1.7%) |
| 5 to 9 Minutes | 23,508 (5.9%) | 24,847 (7.2%) |
| 10 to 14 Minutes | 38,395 (9.7%) | 39,931 (11.7%) |
| 15 to 19 Minutes | 51,427 (13.0%) | 46,698 (13.6%) |
| 20 to 24 Minutes | 55,064 (13.9%) | 51,673 (15.1%) |
| 25 to 29 Minutes | 25,498 (6.4%) | 23,489 (6.9%) |
| 30 to 34 Minutes | 72,042 (18.2%) | 57,040 (16.6%) |
| 35 to 39 Minutes | 16,165 (4.1%) | 14,676 (4.3%) |
| 40 to 44 Minutes | 21,469 (5.4%) | 16,284 (4.8%) |
| 45 to 59 Minutes | 46,553 (11.7%) | 36,587 (10.7%) |
| 60 to 89 Minutes | 28,867 (7.3%) | 20,419 (6.0%) |
| 90 or more Minutes | 10,071 (2.5%) | 5,260 (1.5%) |
Time of Departure to Work by Sex in Area Code 813
The most frequent times of departure to work in Area Code 813 are 7:00 AM to 7:29 AM (56,680, 14.3%) for males and 7:00 AM to 7:29 AM (55,719, 16.3%) for females.
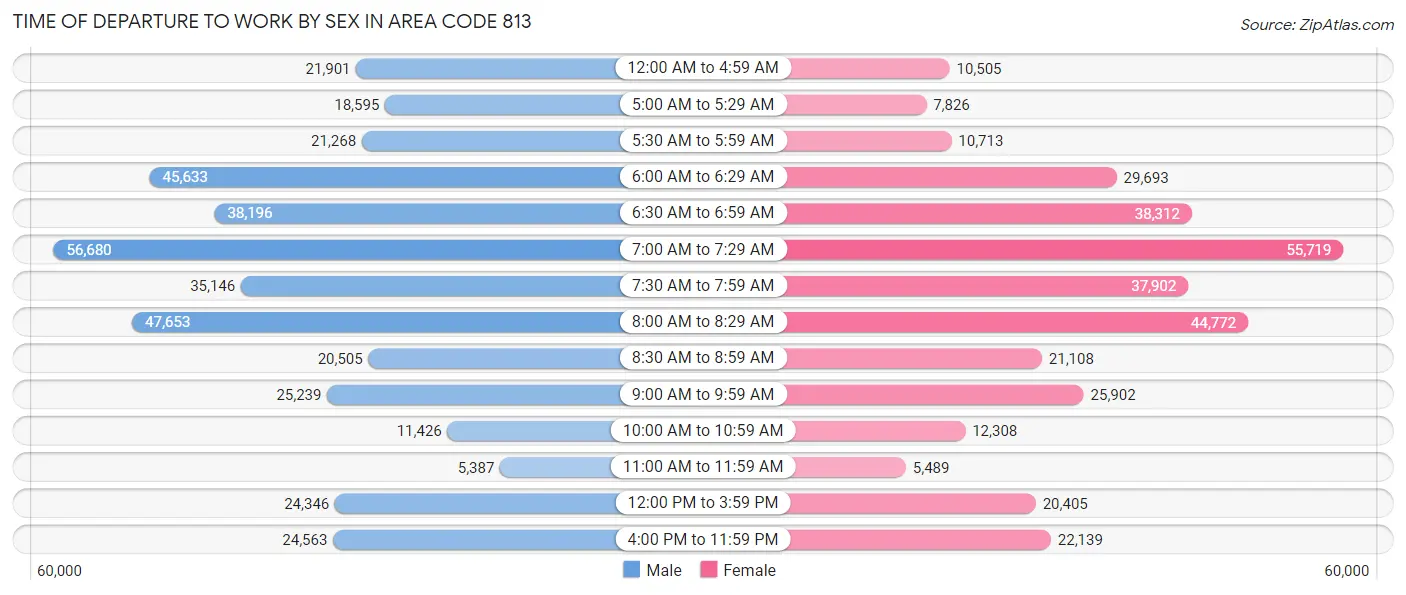
| Time of Departure | Male | Female |
| 12:00 AM to 4:59 AM | 21,901 (5.5%) | 10,505 (3.1%) |
| 5:00 AM to 5:29 AM | 18,595 (4.7%) | 7,826 (2.3%) |
| 5:30 AM to 5:59 AM | 21,268 (5.4%) | 10,713 (3.1%) |
| 6:00 AM to 6:29 AM | 45,633 (11.5%) | 29,693 (8.7%) |
| 6:30 AM to 6:59 AM | 38,196 (9.6%) | 38,312 (11.2%) |
| 7:00 AM to 7:29 AM | 56,680 (14.3%) | 55,719 (16.3%) |
| 7:30 AM to 7:59 AM | 35,146 (8.9%) | 37,902 (11.1%) |
| 8:00 AM to 8:29 AM | 47,653 (12.0%) | 44,772 (13.1%) |
| 8:30 AM to 8:59 AM | 20,505 (5.2%) | 21,108 (6.2%) |
| 9:00 AM to 9:59 AM | 25,239 (6.4%) | 25,902 (7.6%) |
| 10:00 AM to 10:59 AM | 11,426 (2.9%) | 12,308 (3.6%) |
| 11:00 AM to 11:59 AM | 5,387 (1.4%) | 5,489 (1.6%) |
| 12:00 PM to 3:59 PM | 24,346 (6.1%) | 20,405 (5.9%) |
| 4:00 PM to 11:59 PM | 24,563 (6.2%) | 22,139 (6.5%) |
| Total | 396,538 (100.0%) | 342,793 (100.0%) |
Housing Occupancy in Area Code 813
Occupancy by Ownership in Area Code 813
Of the total 687,997 dwellings in Area Code 813, owner-occupied units account for 434,721 (63.2%), while renter-occupied units make up 253,276 (36.8%).
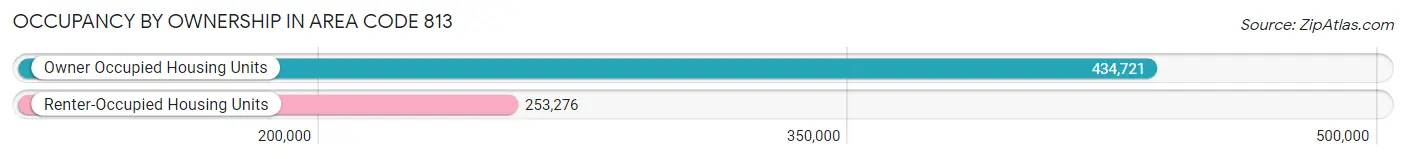
| Occupancy | # Housing Units | % Housing Units |
| Owner Occupied Housing Units | 434,721 | 63.2% |
| Renter-Occupied Housing Units | 253,276 | 36.8% |
| Total Occupied Housing Units | 687,997 | 100.0% |
Occupancy by Household Size in Area Code 813
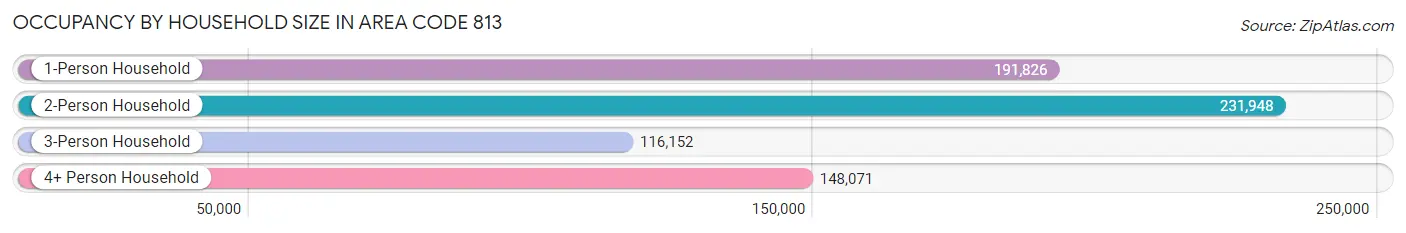
| Household Size | # Housing Units | % Housing Units |
| 1-Person Household | 191,826 | 27.9% |
| 2-Person Household | 231,948 | 33.7% |
| 3-Person Household | 116,152 | 16.9% |
| 4+ Person Household | 148,071 | 21.5% |
| Total Housing Units | 687,997 | 100.0% |
Occupancy by Ownership by Household Size in Area Code 813
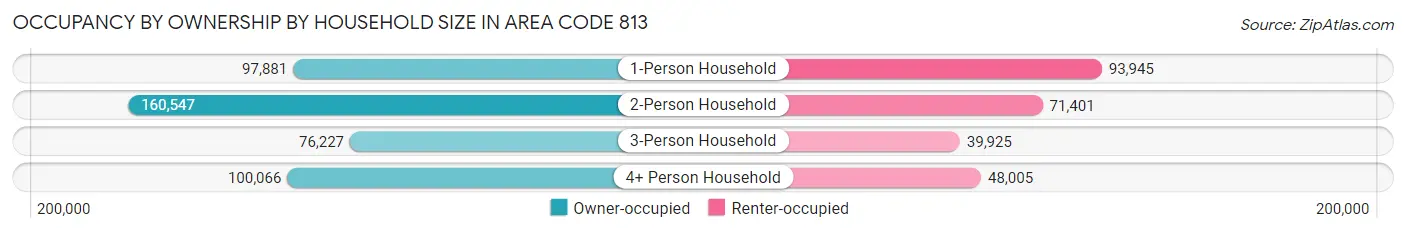
| Household Size | Owner-occupied | Renter-occupied |
| 1-Person Household | 97,881 (51.0%) | 93,945 (49.0%) |
| 2-Person Household | 160,547 (69.2%) | 71,401 (30.8%) |
| 3-Person Household | 76,227 (65.6%) | 39,925 (34.4%) |
| 4+ Person Household | 100,066 (67.6%) | 48,005 (32.4%) |
| Total Housing Units | 434,721 (63.2%) | 253,276 (36.8%) |
Occupancy by Educational Attainment in Area Code 813
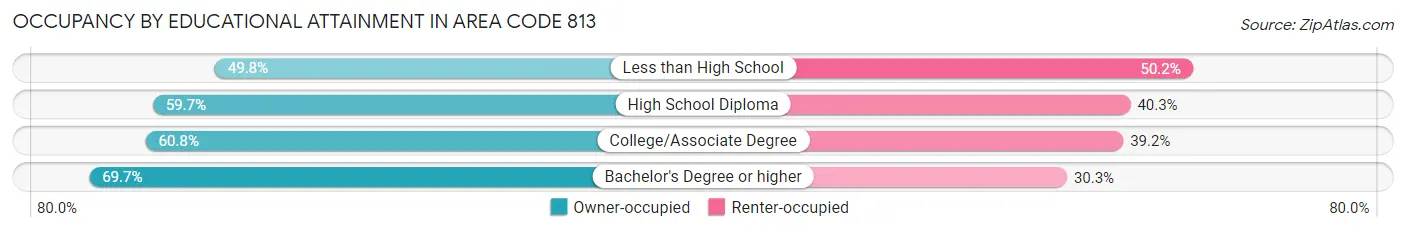
| Household Size | Owner-occupied | Renter-occupied |
| Less than High School | 27,702 (49.8%) | 27,905 (50.2%) |
| High School Diploma | 92,008 (59.7%) | 62,193 (40.3%) |
| College/Associate Degree | 126,027 (60.8%) | 81,178 (39.2%) |
| Bachelor's Degree or higher | 188,984 (69.7%) | 82,000 (30.3%) |
Occupancy by Age of Householder in Area Code 813
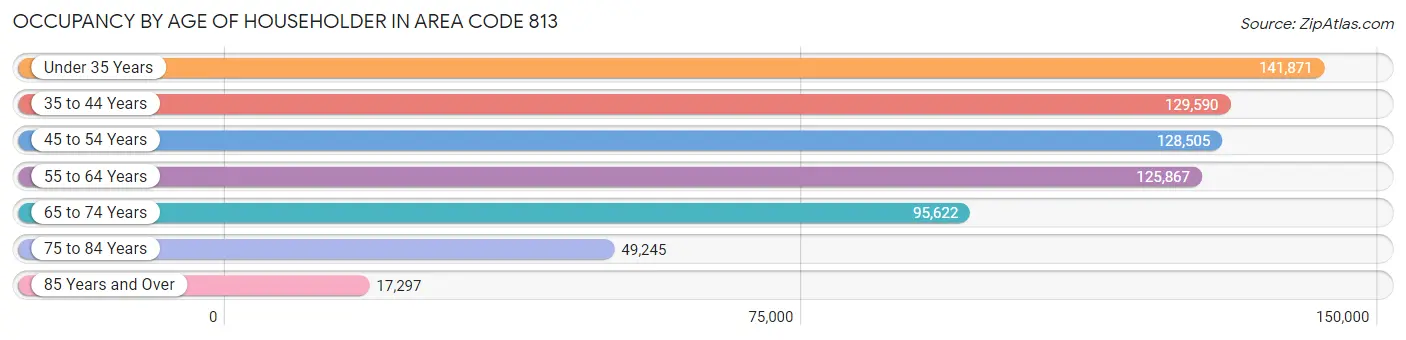
| Age Bracket | # Households | % Households |
| Under 35 Years | 141,871 | 20.6% |
| 35 to 44 Years | 129,590 | 18.8% |
| 45 to 54 Years | 128,505 | 18.7% |
| 55 to 64 Years | 125,867 | 18.3% |
| 65 to 74 Years | 95,622 | 13.9% |
| 75 to 84 Years | 49,245 | 7.2% |
| 85 Years and Over | 17,297 | 2.5% |
| Total | 687,997 | 100.0% |
Housing Finances in Area Code 813
Median Income by Occupancy in Area Code 813
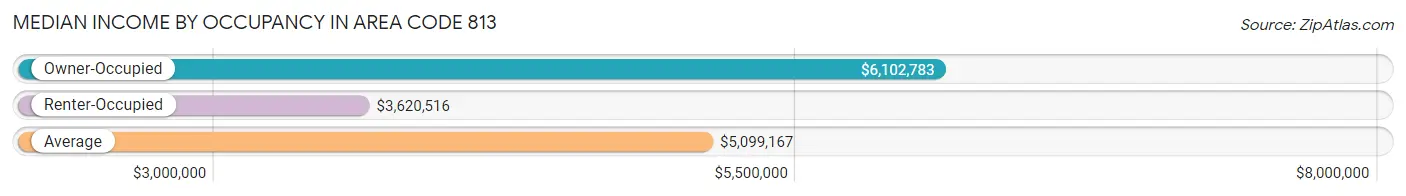
| Occupancy Type | # Households | Median Income |
| Owner-Occupied | 434,721 (63.2%) | $6,102,783 |
| Renter-Occupied | 253,276 (36.8%) | $3,620,516 |
| Average | 687,997 (100.0%) | $5,099,167 |
Occupancy by Householder Income Bracket in Area Code 813
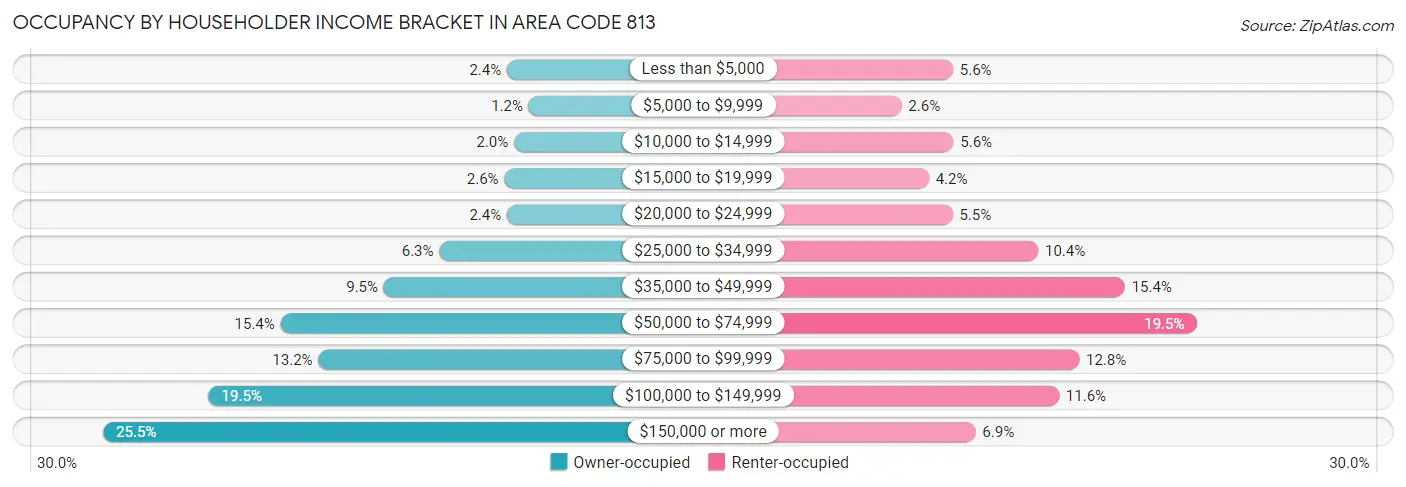
| Income Bracket | Owner-occupied | Renter-occupied |
| Less than $5,000 | 10,565 (2.4%) | 14,085 (5.6%) |
| $5,000 to $9,999 | 5,161 (1.2%) | 6,628 (2.6%) |
| $10,000 to $14,999 | 8,844 (2.0%) | 14,159 (5.6%) |
| $15,000 to $19,999 | 11,200 (2.6%) | 10,597 (4.2%) |
| $20,000 to $24,999 | 10,565 (2.4%) | 14,020 (5.5%) |
| $25,000 to $34,999 | 27,366 (6.3%) | 26,408 (10.4%) |
| $35,000 to $49,999 | 41,170 (9.5%) | 38,962 (15.4%) |
| $50,000 to $74,999 | 66,834 (15.4%) | 49,308 (19.5%) |
| $75,000 to $99,999 | 57,423 (13.2%) | 32,336 (12.8%) |
| $100,000 to $149,999 | 84,694 (19.5%) | 29,436 (11.6%) |
| $150,000 or more | 110,899 (25.5%) | 17,337 (6.9%) |
| Total | 434,721 (100.0%) | 253,276 (100.0%) |
Monthly Housing Cost Tiers in Area Code 813
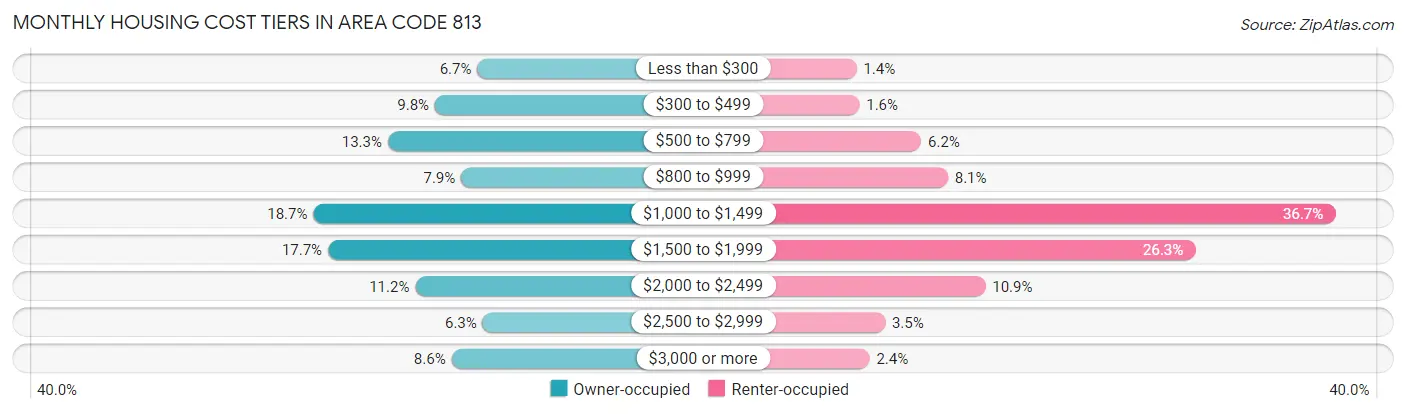
| Monthly Cost | Owner-occupied | Renter-occupied |
| Less than $300 | 28,944 (6.7%) | 3,558 (1.4%) |
| $300 to $499 | 42,519 (9.8%) | 4,081 (1.6%) |
| $500 to $799 | 57,591 (13.3%) | 15,612 (6.2%) |
| $800 to $999 | 34,139 (7.9%) | 20,582 (8.1%) |
| $1,000 to $1,499 | 81,453 (18.7%) | 92,825 (36.6%) |
| $1,500 to $1,999 | 76,776 (17.7%) | 66,723 (26.3%) |
| $2,000 to $2,499 | 48,825 (11.2%) | 27,572 (10.9%) |
| $2,500 to $2,999 | 27,257 (6.3%) | 8,867 (3.5%) |
| $3,000 or more | 37,217 (8.6%) | 5,979 (2.4%) |
| Total | 434,721 (100.0%) | 253,276 (100.0%) |
Physical Housing Characteristics in Area Code 813
Housing Structures in Area Code 813
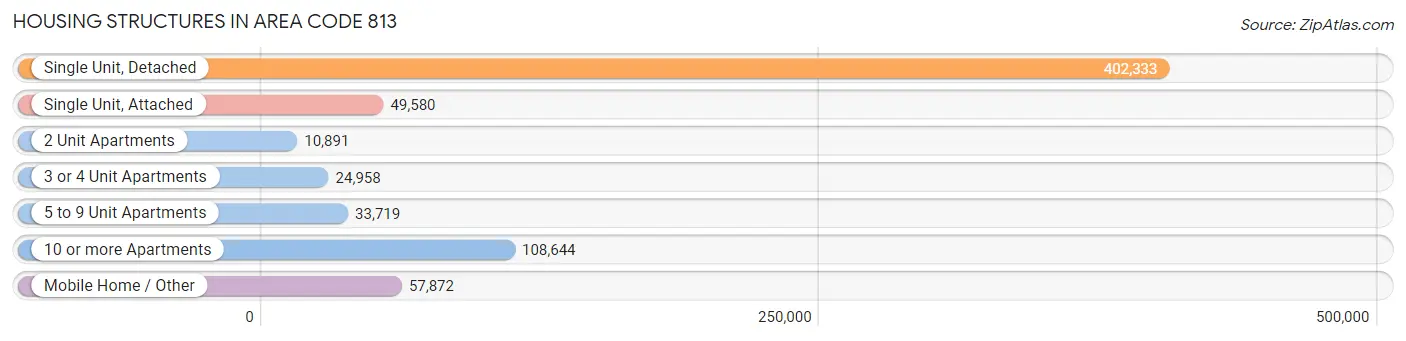
| Structure Type | # Housing Units | % Housing Units |
| Single Unit, Detached | 402,333 | 58.5% |
| Single Unit, Attached | 49,580 | 7.2% |
| 2 Unit Apartments | 10,891 | 1.6% |
| 3 or 4 Unit Apartments | 24,958 | 3.6% |
| 5 to 9 Unit Apartments | 33,719 | 4.9% |
| 10 or more Apartments | 108,644 | 15.8% |
| Mobile Home / Other | 57,872 | 8.4% |
| Total | 687,997 | 100.0% |
Housing Structures by Occupancy in Area Code 813
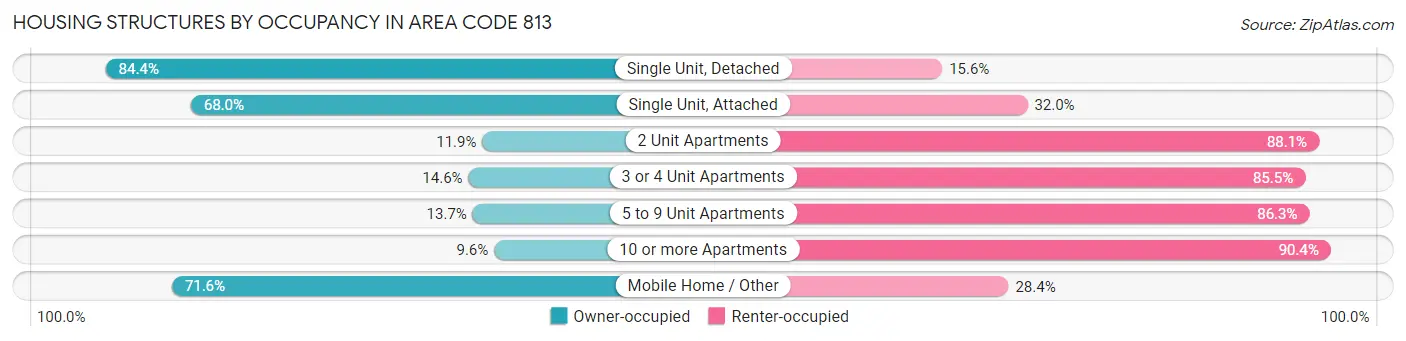
| Structure Type | Owner-occupied | Renter-occupied |
| Single Unit, Detached | 339,566 (84.4%) | 62,767 (15.6%) |
| Single Unit, Attached | 33,709 (68.0%) | 15,871 (32.0%) |
| 2 Unit Apartments | 1,293 (11.9%) | 9,598 (88.1%) |
| 3 or 4 Unit Apartments | 3,631 (14.5%) | 21,327 (85.5%) |
| 5 to 9 Unit Apartments | 4,631 (13.7%) | 29,088 (86.3%) |
| 10 or more Apartments | 10,431 (9.6%) | 98,213 (90.4%) |
| Mobile Home / Other | 41,460 (71.6%) | 16,412 (28.4%) |
| Total | 434,721 (63.2%) | 253,276 (36.8%) |
Housing Structures by Number of Rooms in Area Code 813
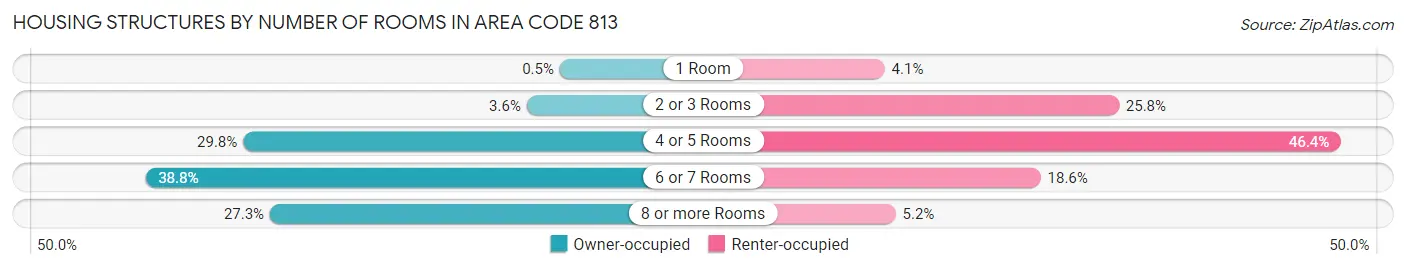
| Number of Rooms | Owner-occupied | Renter-occupied |
| 1 Room | 2,163 (0.5%) | 10,473 (4.1%) |
| 2 or 3 Rooms | 15,470 (3.6%) | 65,354 (25.8%) |
| 4 or 5 Rooms | 129,506 (29.8%) | 117,395 (46.4%) |
| 6 or 7 Rooms | 168,841 (38.8%) | 47,020 (18.6%) |
| 8 or more Rooms | 118,741 (27.3%) | 13,034 (5.1%) |
| Total | 434,721 (100.0%) | 253,276 (100.0%) |
Housing Structure by Heating Type in Area Code 813
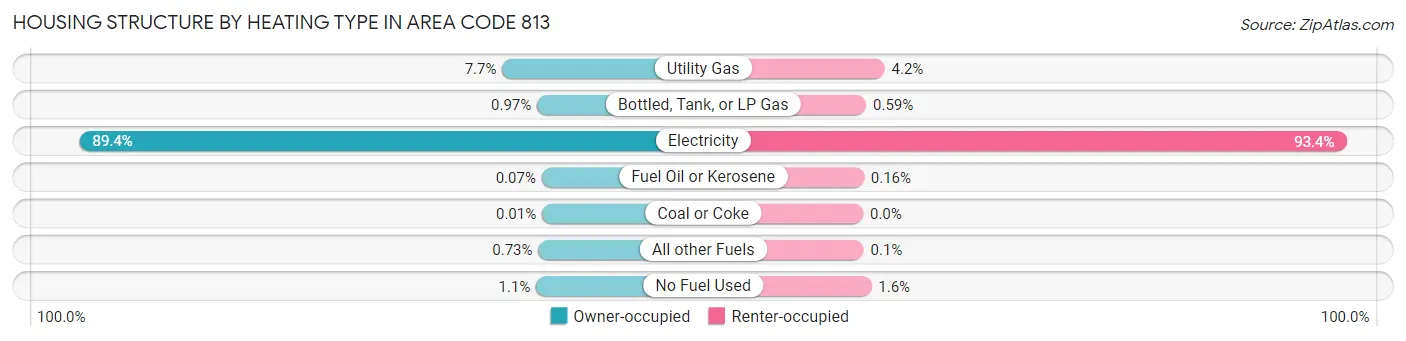
| Heating Type | Owner-occupied | Renter-occupied |
| Utility Gas | 33,424 (7.7%) | 10,532 (4.2%) |
| Bottled, Tank, or LP Gas | 4,229 (1.0%) | 1,491 (0.6%) |
| Electricity | 388,639 (89.4%) | 236,502 (93.4%) |
| Fuel Oil or Kerosene | 297 (0.1%) | 408 (0.2%) |
| Coal or Coke | 22 (0.0%) | 9 (0.0%) |
| All other Fuels | 3,155 (0.7%) | 265 (0.1%) |
| No Fuel Used | 4,955 (1.1%) | 4,069 (1.6%) |
| Total | 434,721 (100.0%) | 253,276 (100.0%) |
Household Vehicle Usage in Area Code 813
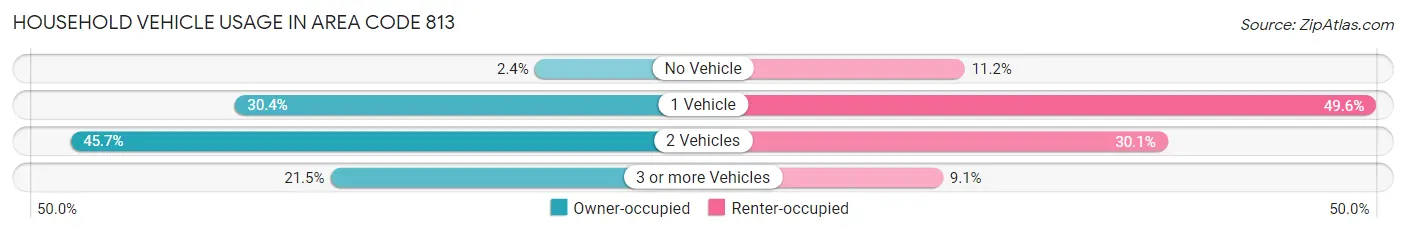
| Vehicles per Household | Owner-occupied | Renter-occupied |
| No Vehicle | 10,369 (2.4%) | 28,320 (11.2%) |
| 1 Vehicle | 132,186 (30.4%) | 125,554 (49.6%) |
| 2 Vehicles | 198,854 (45.7%) | 76,254 (30.1%) |
| 3 or more Vehicles | 93,312 (21.5%) | 23,148 (9.1%) |
| Total | 434,721 (100.0%) | 253,276 (100.0%) |
Real Estate & Mortgages in Area Code 813
Real Estate and Mortgage Overview in Area Code 813
| Characteristic | Without Mortgage | With Mortgage |
| Housing Units | 157,791 | 276,930 |
| Median Property Value | $16,889,800 | $21,282,800 |
| Median Household Income | $4,356,934 | $85,427 |
| Monthly Housing Costs | $36,845 | $35,793 |
| Real Estate Taxes | $137,188 | $7,962 |
Property Value by Mortgage Status in Area Code 813
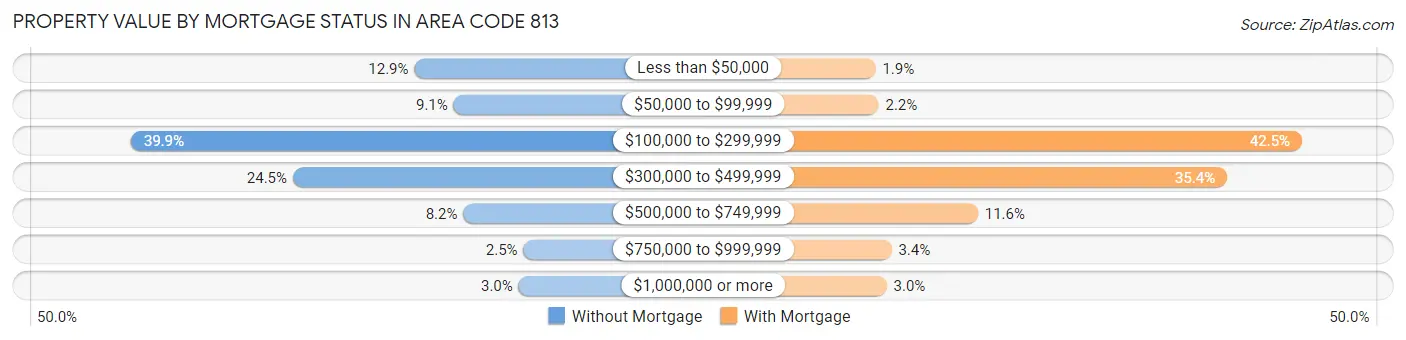
| Property Value | Without Mortgage | With Mortgage |
| Less than $50,000 | 20,322 (12.9%) | 5,260 (1.9%) |
| $50,000 to $99,999 | 14,419 (9.1%) | 6,078 (2.2%) |
| $100,000 to $299,999 | 62,925 (39.9%) | 117,729 (42.5%) |
| $300,000 to $499,999 | 38,575 (24.4%) | 97,967 (35.4%) |
| $500,000 to $749,999 | 12,973 (8.2%) | 32,237 (11.6%) |
| $750,000 to $999,999 | 3,929 (2.5%) | 9,474 (3.4%) |
| $1,000,000 or more | 4,648 (2.9%) | 8,185 (3.0%) |
| Total | 157,791 (100.0%) | 276,930 (100.0%) |
Household Income by Mortgage Status in Area Code 813
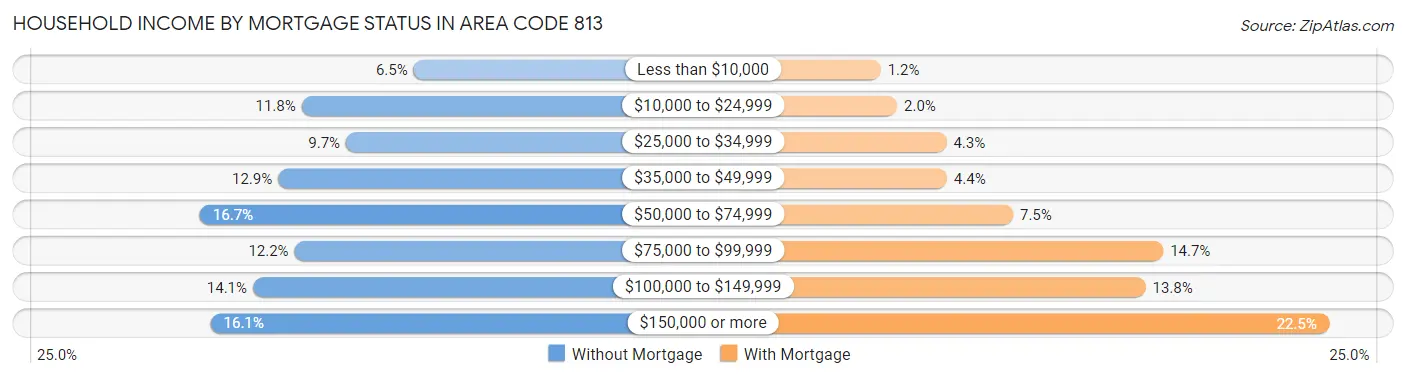
| Household Income | Without Mortgage | With Mortgage |
| Less than $10,000 | 10,230 (6.5%) | 3,317 (1.2%) |
| $10,000 to $24,999 | 18,630 (11.8%) | 5,496 (2.0%) |
| $25,000 to $34,999 | 15,310 (9.7%) | 11,979 (4.3%) |
| $35,000 to $49,999 | 20,409 (12.9%) | 12,056 (4.3%) |
| $50,000 to $74,999 | 26,267 (16.7%) | 20,761 (7.5%) |
| $75,000 to $99,999 | 19,173 (12.1%) | 40,567 (14.6%) |
| $100,000 to $149,999 | 22,300 (14.1%) | 38,250 (13.8%) |
| $150,000 or more | 25,472 (16.1%) | 62,394 (22.5%) |
| Total | 157,791 (100.0%) | 276,930 (100.0%) |
Property Value to Household Income Ratio in Area Code 813
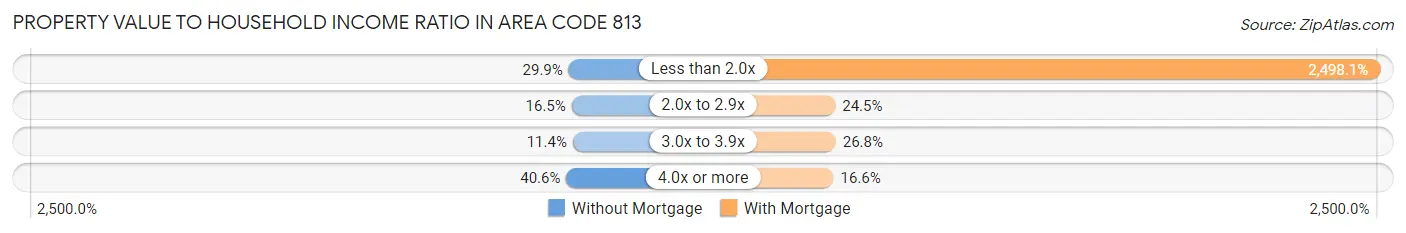
| Value-to-Income Ratio | Without Mortgage | With Mortgage |
| Less than 2.0x | 47,156 (29.9%) | 6,918,022 (2,498.1%) |
| 2.0x to 2.9x | 25,957 (16.5%) | 67,847 (24.5%) |
| 3.0x to 3.9x | 17,903 (11.4%) | 74,250 (26.8%) |
| 4.0x or more | 64,073 (40.6%) | 45,895 (16.6%) |
| Total | 157,791 (100.0%) | 276,930 (100.0%) |
Real Estate Taxes by Mortgage Status in Area Code 813
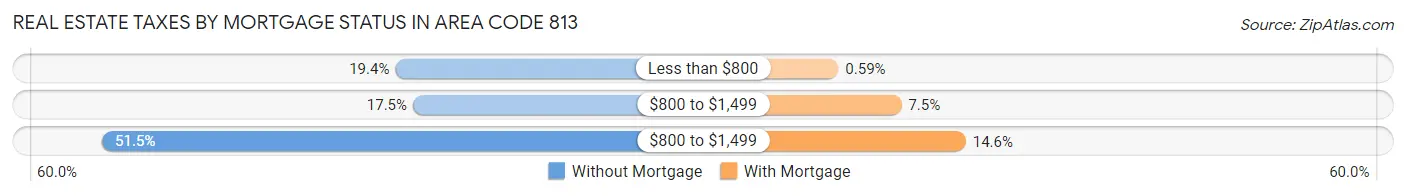
| Property Taxes | Without Mortgage | With Mortgage |
| Less than $800 | 30,575 (19.4%) | 1,632 (0.6%) |
| $800 to $1,499 | 27,532 (17.4%) | 20,780 (7.5%) |
| $800 to $1,499 | 81,258 (51.5%) | 40,292 (14.5%) |
| Total | 157,791 (100.0%) | 276,930 (100.0%) |
Health & Disability in Area Code 813
Health Insurance Coverage by Age in Area Code 813
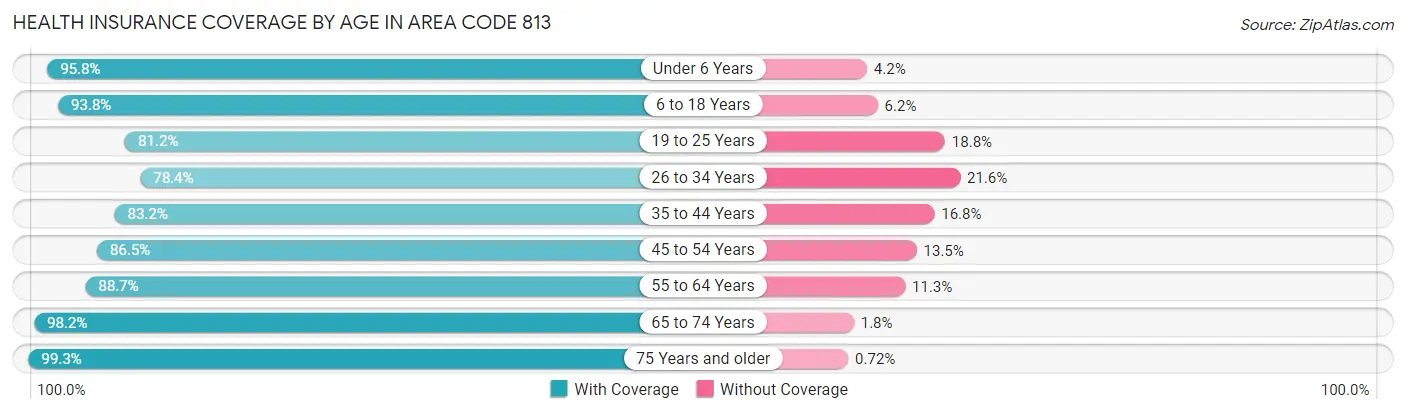
| Age Bracket | With Coverage | Without Coverage |
| Under 6 Years | 118,615 (95.8%) | 5,226 (4.2%) |
| 6 to 18 Years | 275,579 (93.8%) | 18,267 (6.2%) |
| 19 to 25 Years | 133,049 (81.2%) | 30,723 (18.8%) |
| 26 to 34 Years | 181,621 (78.4%) | 49,965 (21.6%) |
| 35 to 44 Years | 205,841 (83.2%) | 41,508 (16.8%) |
| 45 to 54 Years | 203,955 (86.5%) | 31,800 (13.5%) |
| 55 to 64 Years | 195,065 (88.7%) | 24,957 (11.3%) |
| 65 to 74 Years | 160,945 (98.2%) | 2,896 (1.8%) |
| 75 Years and older | 111,413 (99.3%) | 809 (0.7%) |
| Total | 1,586,083 (88.5%) | 206,151 (11.5%) |
Health Insurance Coverage by Citizenship Status in Area Code 813
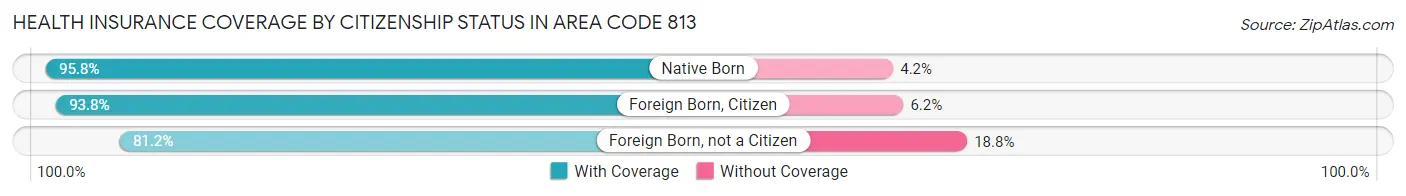
| Citizenship Status | With Coverage | Without Coverage |
| Native Born | 118,615 (95.8%) | 5,226 (4.2%) |
| Foreign Born, Citizen | 275,579 (93.8%) | 18,267 (6.2%) |
| Foreign Born, not a Citizen | 133,049 (81.2%) | 30,723 (18.8%) |
Health Insurance Coverage by Household Income in Area Code 813
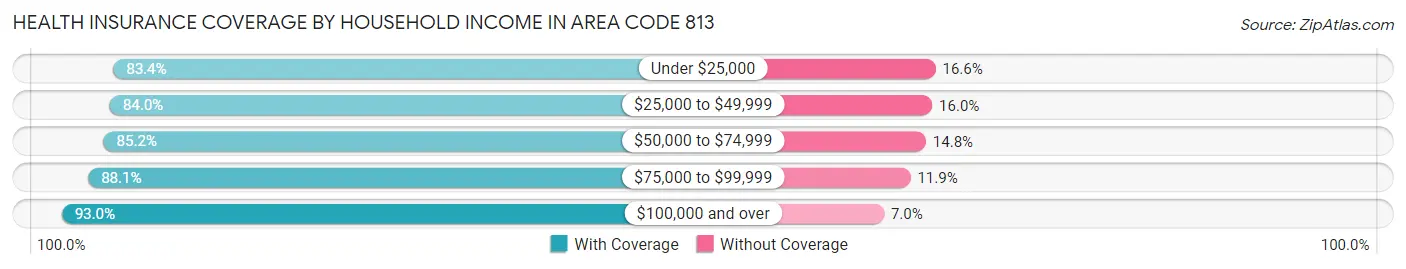
| Household Income | With Coverage | Without Coverage |
| Under $25,000 | 161,578 (83.4%) | 32,235 (16.6%) |
| $25,000 to $49,999 | 244,948 (84.0%) | 46,621 (16.0%) |
| $50,000 to $74,999 | 242,488 (85.2%) | 42,187 (14.8%) |
| $75,000 to $99,999 | 213,944 (88.1%) | 28,988 (11.9%) |
| $100,000 and over | 707,134 (93.0%) | 52,939 (7.0%) |
Public vs Private Health Insurance Coverage by Age in Area Code 813
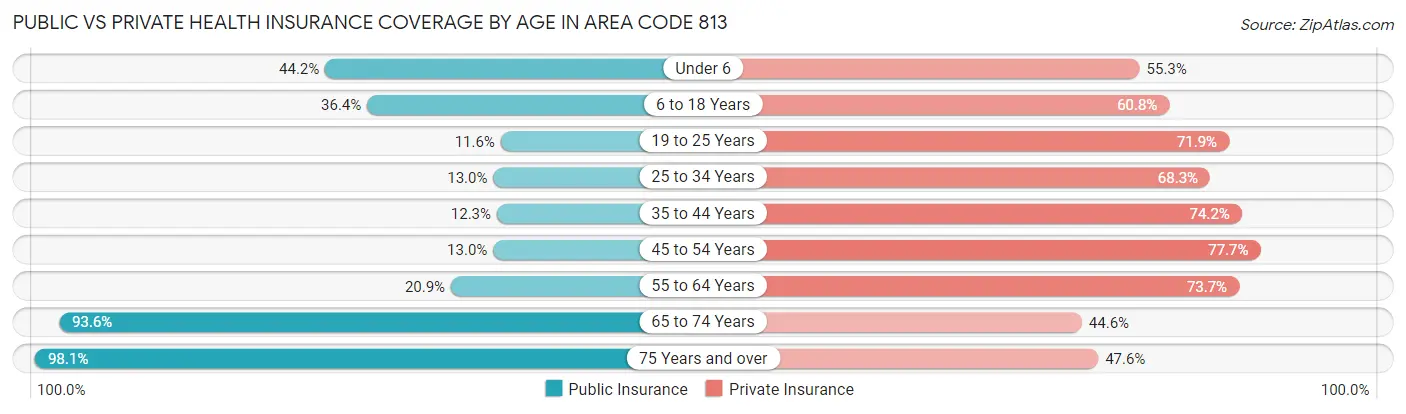
| Age Bracket | Public Insurance | Private Insurance |
| Under 6 | 54,760 (44.2%) | 68,461 (55.3%) |
| 6 to 18 Years | 107,021 (36.4%) | 178,552 (60.8%) |
| 19 to 25 Years | 19,044 (11.6%) | 117,663 (71.9%) |
| 25 to 34 Years | 30,104 (13.0%) | 158,208 (68.3%) |
| 35 to 44 Years | 30,513 (12.3%) | 183,546 (74.2%) |
| 45 to 54 Years | 30,717 (13.0%) | 183,127 (77.7%) |
| 55 to 64 Years | 45,896 (20.9%) | 162,184 (73.7%) |
| 65 to 74 Years | 153,381 (93.6%) | 73,023 (44.6%) |
| 75 Years and over | 110,054 (98.1%) | 53,405 (47.6%) |
| Total | 581,490 (32.4%) | 1,178,169 (65.7%) |
Disability Status by Sex by Age in Area Code 813
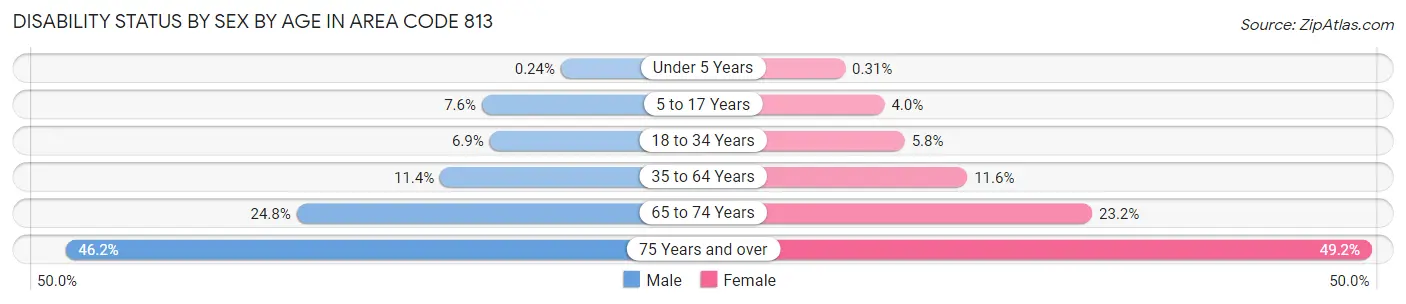
| Age Bracket | Male | Female |
| Under 5 Years | 125 (0.2%) | 157 (0.3%) |
| 5 to 17 Years | 11,302 (7.6%) | 5,618 (4.0%) |
| 18 to 34 Years | 14,259 (6.9%) | 12,333 (5.8%) |
| 35 to 64 Years | 39,601 (11.4%) | 41,571 (11.6%) |
| 65 to 74 Years | 18,778 (24.8%) | 20,444 (23.2%) |
| 75 Years and over | 22,146 (46.2%) | 31,630 (49.2%) |
Disability Class by Sex by Age in Area Code 813
Disability Class: Hearing Difficulty
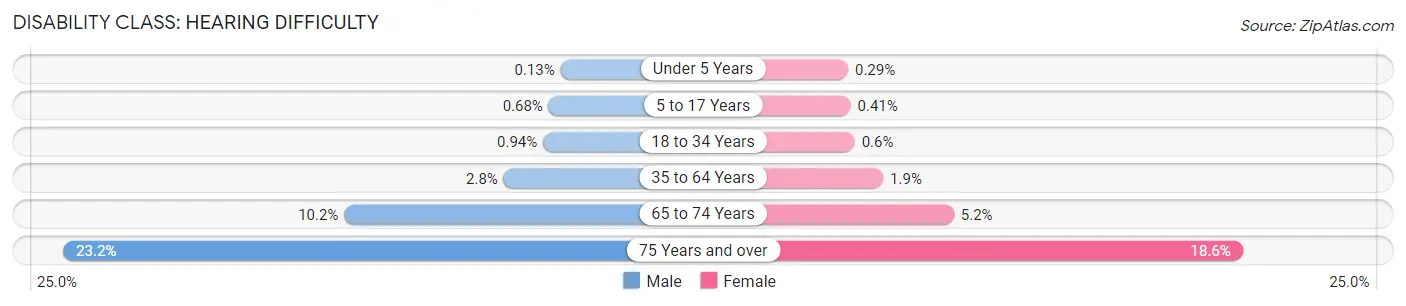
| Age Bracket | Male | Female |
| Under 5 Years | 69 (0.1%) | 145 (0.3%) |
| 5 to 17 Years | 1,009 (0.7%) | 583 (0.4%) |
| 18 to 34 Years | 1,961 (0.9%) | 1,274 (0.6%) |
| 35 to 64 Years | 9,586 (2.8%) | 6,853 (1.9%) |
| 65 to 74 Years | 7,715 (10.2%) | 4,573 (5.2%) |
| 75 Years and over | 11,124 (23.2%) | 11,961 (18.6%) |
Disability Class: Vision Difficulty
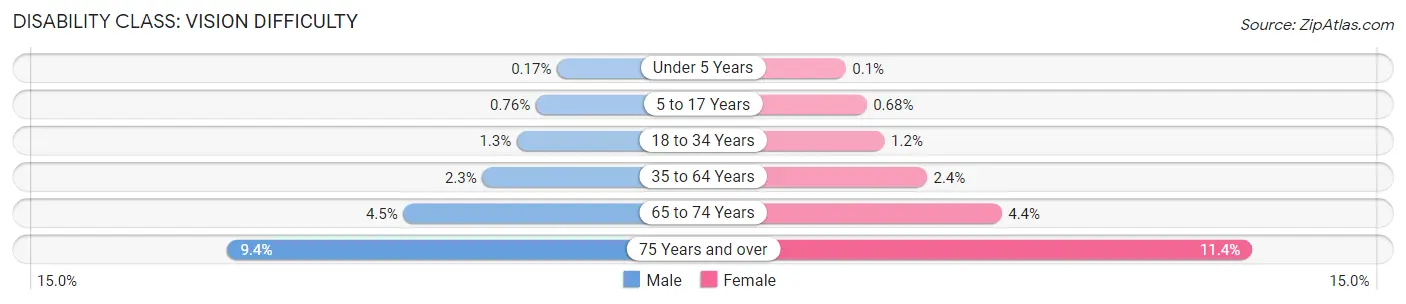
| Age Bracket | Male | Female |
| Under 5 Years | 88 (0.2%) | 49 (0.1%) |
| 5 to 17 Years | 1,138 (0.8%) | 969 (0.7%) |
| 18 to 34 Years | 2,675 (1.3%) | 2,488 (1.2%) |
| 35 to 64 Years | 7,774 (2.2%) | 8,427 (2.4%) |
| 65 to 74 Years | 3,374 (4.4%) | 3,909 (4.4%) |
| 75 Years and over | 4,482 (9.3%) | 7,343 (11.4%) |
Disability Class: Cognitive Difficulty
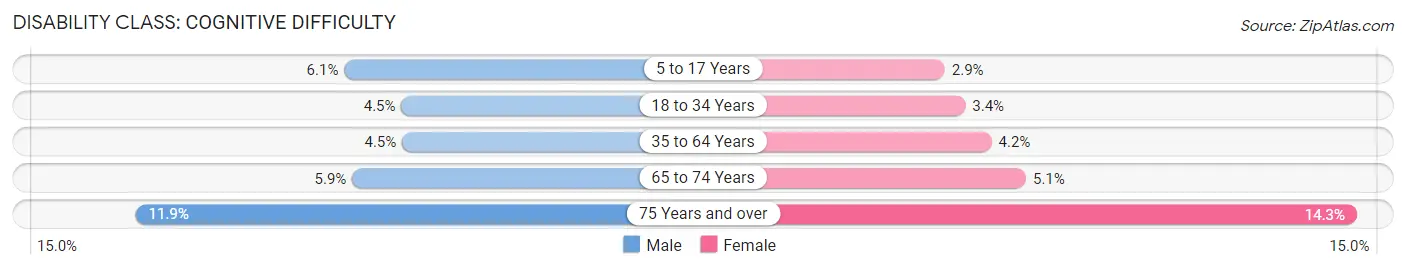
| Age Bracket | Male | Female |
| 5 to 17 Years | 9,110 (6.1%) | 4,081 (2.9%) |
| 18 to 34 Years | 9,390 (4.5%) | 7,252 (3.4%) |
| 35 to 64 Years | 15,533 (4.5%) | 14,874 (4.2%) |
| 65 to 74 Years | 4,460 (5.9%) | 4,514 (5.1%) |
| 75 Years and over | 5,706 (11.9%) | 9,222 (14.3%) |
Disability Class: Ambulatory Difficulty
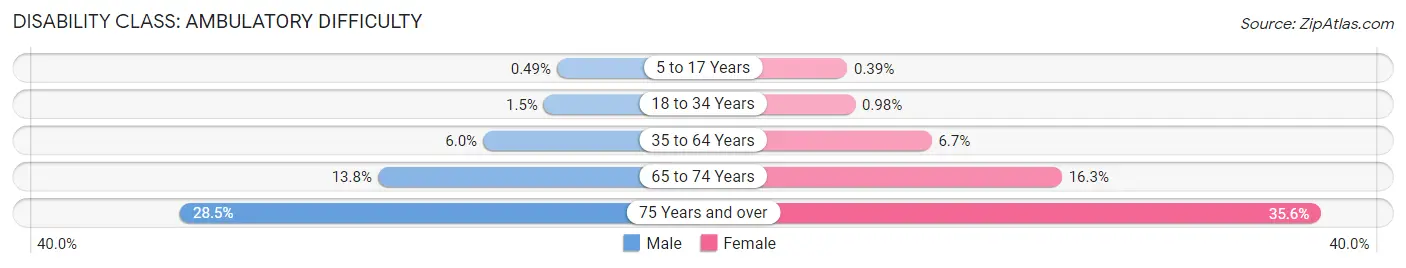
| Age Bracket | Male | Female |
| 5 to 17 Years | 729 (0.5%) | 552 (0.4%) |
| 18 to 34 Years | 3,033 (1.5%) | 2,065 (1.0%) |
| 35 to 64 Years | 20,657 (6.0%) | 23,794 (6.7%) |
| 65 to 74 Years | 10,452 (13.8%) | 14,375 (16.3%) |
| 75 Years and over | 13,632 (28.4%) | 22,880 (35.6%) |
Disability Class: Self-Care Difficulty
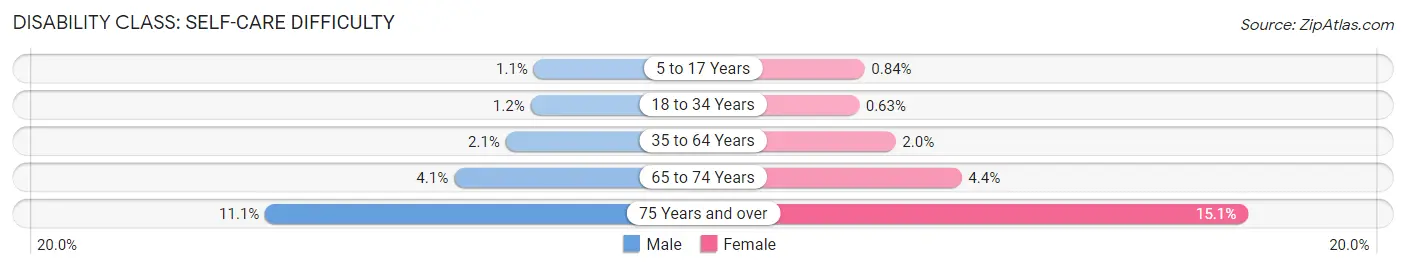
| Age Bracket | Male | Female |
| 5 to 17 Years | 1,639 (1.1%) | 1,193 (0.8%) |
| 18 to 34 Years | 2,533 (1.2%) | 1,334 (0.6%) |
| 35 to 64 Years | 7,412 (2.1%) | 7,108 (2.0%) |
| 65 to 74 Years | 3,082 (4.1%) | 3,911 (4.4%) |
| 75 Years and over | 5,306 (11.1%) | 9,694 (15.1%) |
Technology Access in Area Code 813
Computing Device Access in Area Code 813
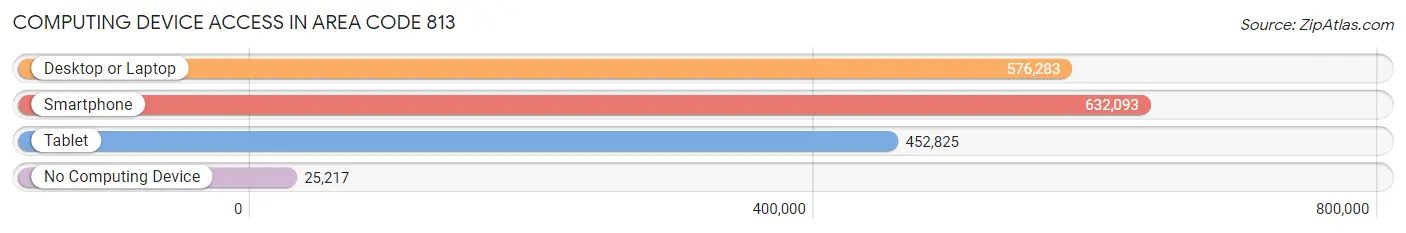
| Device Type | # Households | % Households |
| Desktop or Laptop | 576,283 | 83.8% |
| Smartphone | 632,093 | 91.9% |
| Tablet | 452,825 | 65.8% |
| No Computing Device | 25,217 | 3.7% |
| Total | 687,997 | 100.0% |
Internet Access in Area Code 813
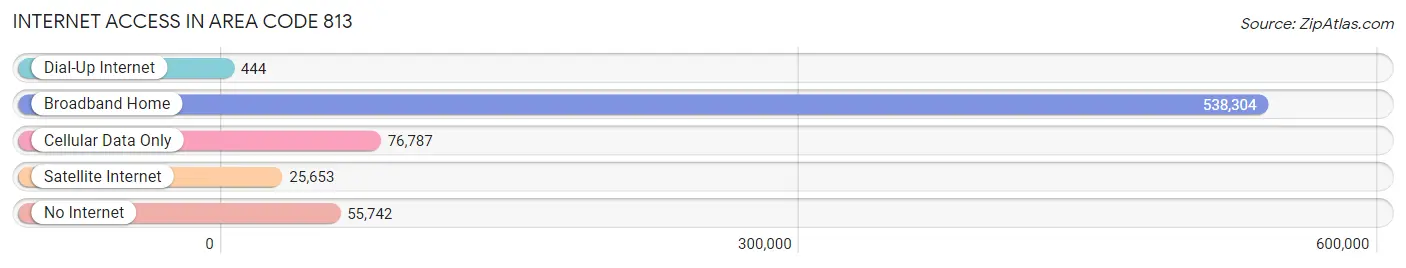
| Internet Type | # Households | % Households |
| Dial-Up Internet | 444 | 0.1% |
| Broadband Home | 538,304 | 78.2% |
| Cellular Data Only | 76,787 | 11.2% |
| Satellite Internet | 25,653 | 3.7% |
| No Internet | 55,742 | 8.1% |
| Total | 687,997 | 100.0% |
Area Code 813 Summary
Geography
Area code 813 is located in the state of Florida and covers the Tampa Bay area, including the cities of Tampa, St. Petersburg, Clearwater, and Brandon. It also covers parts of Pasco, Hillsborough, and Polk counties.
Social
The area code 813 is home to a diverse population of people from all walks of life. The area is known for its vibrant nightlife, cultural attractions, and outdoor activities. It is also home to a number of professional sports teams, including the Tampa Bay Buccaneers, Tampa Bay Rays, and Tampa Bay Lightning.
Economics
The area code 813 is a major economic hub in the state of Florida. It is home to a number of Fortune 500 companies, including Raymond James Financial, TECO Energy, and Jabil Circuit. The area is also home to a number of universities and colleges, including the University of South Florida, University of Tampa, and Hillsborough Community College.
Demographics
The population of area code 813 is estimated to be around 1.8 million people. The area is home to a diverse population, with a large Hispanic population, as well as African American, Asian, and other ethnicities. The median household income in the area is around $50,000, and the median age is around 35 years old.
Common Questions
What is Per Capita Income in Area Code 813?
Per Capita income in Area Code 813 is $39,544.
What is the Median Family Income in Area Code 813?
Median Family Income in Area Code 813 is $93,427.
What is the Median Household income in Area Code 813?
Median Household Income in Area Code 813 is $78,449.
What is Income or Wage Gap in Area Code 813?
Income or Wage Gap in Area Code 813 is 22.6%.
Women in Area Code 813 earn 77.4 cents for every dollar earned by a man.
What is Family Income Deficit in Area Code 813?
Family Income Deficit in Area Code 813 is $11,448.
Families that are below poverty line in Area Code 813 earn $11,448 less on average than the poverty threshold level.
What is Inequality or Gini Index in Area Code 813?
Inequality or Gini Index in Area Code 813 is 28.91.
What is the Total Population of Area Code 813?
Total Population of Area Code 813 is 1,812,690.
What is the Total Male Population of Area Code 813?
Total Male Population of Area Code 813 is 894,016.
What is the Total Female Population of Area Code 813?
Total Female Population of Area Code 813 is 918,674.
What is the Ratio of Males per 100 Females in Area Code 813?
There are 97.32 Males per 100 Females in Area Code 813.
What is the Ratio of Females per 100 Males in Area Code 813?
There are 102.76 Females per 100 Males in Area Code 813.
What is the Median Population Age in Area Code 813?
Median Population Age in Area Code 813 is 39.7 Years.
What is the Average Family Size in Area Code 813
Average Family Size in Area Code 813 is 3.2 People.
What is the Average Household Size in Area Code 813
Average Household Size in Area Code 813 is 2.6 People.
How Large is the Labor Force in Area Code 813?
There are 925,385 People in the Labor Forcein in Area Code 813.
What is the Percentage of People in the Labor Force in Area Code 813?
63.2% of People are in the Labor Force in Area Code 813.
What is the Unemployment Rate in Area Code 813?
Unemployment Rate in Area Code 813 is 4.9%.