Brevard County, FL Map & Demographics
Brevard County Map
Brevard County Overview
$40,111
PER CAPITA INCOME
$87,701
AVG FAMILY INCOME
$71,308
AVG HOUSEHOLD INCOME
30.4%
WAGE / INCOME GAP [ % ]
69.6¢/ $1
WAGE / INCOME GAP [ $ ]
$9,623
FAMILY INCOME DEFICIT
0.45
INEQUALITY / GINI INDEX
610,723
TOTAL POPULATION
300,904
MALE POPULATION
309,819
FEMALE POPULATION
97.12
MALES / 100 FEMALES
102.96
FEMALES / 100 MALES
47.0
MEDIAN AGE
3.0
AVG FAMILY SIZE
2.5
AVG HOUSEHOLD SIZE
288,953
LABOR FORCE [ PEOPLE ]
56.2%
PERCENT IN LABOR FORCE
4.9%
UNEMPLOYMENT RATE
Income in Brevard County
Income Overview in Brevard County
Per Capita Income in Brevard County is $40,111, while median incomes of families and households are $87,701 and $71,308 respectively.
| Characteristic | Number | Measure |
| Per Capita Income | 610,723 | $40,111 |
| Median Family Income | 155,729 | $87,701 |
| Mean Family Income | 155,729 | $112,677 |
| Median Household Income | 246,650 | $71,308 |
| Mean Household Income | 246,650 | $95,587 |
| Income Deficit | 155,729 | $9,623 |
| Wage / Income Gap (%) | 610,723 | 30.35% |
| Wage / Income Gap ($) | 610,723 | 69.65¢ per $1 |
| Gini / Inequality Index | 610,723 | 0.45 |
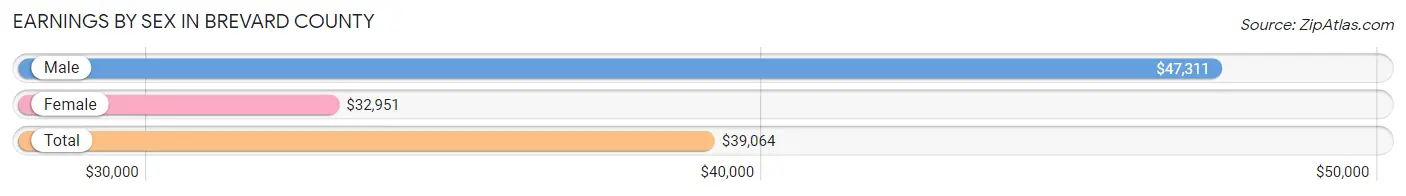
Earnings by Sex in Brevard County
Average Earnings in Brevard County are $39,064, $47,311 for men and $32,951 for women, a difference of 30.3%.
| Sex | Number | Average Earnings |
| Male | 159,304 (53.1%) | $47,311 |
| Female | 140,564 (46.9%) | $32,951 |
| Total | 299,868 (100.0%) | $39,064 |
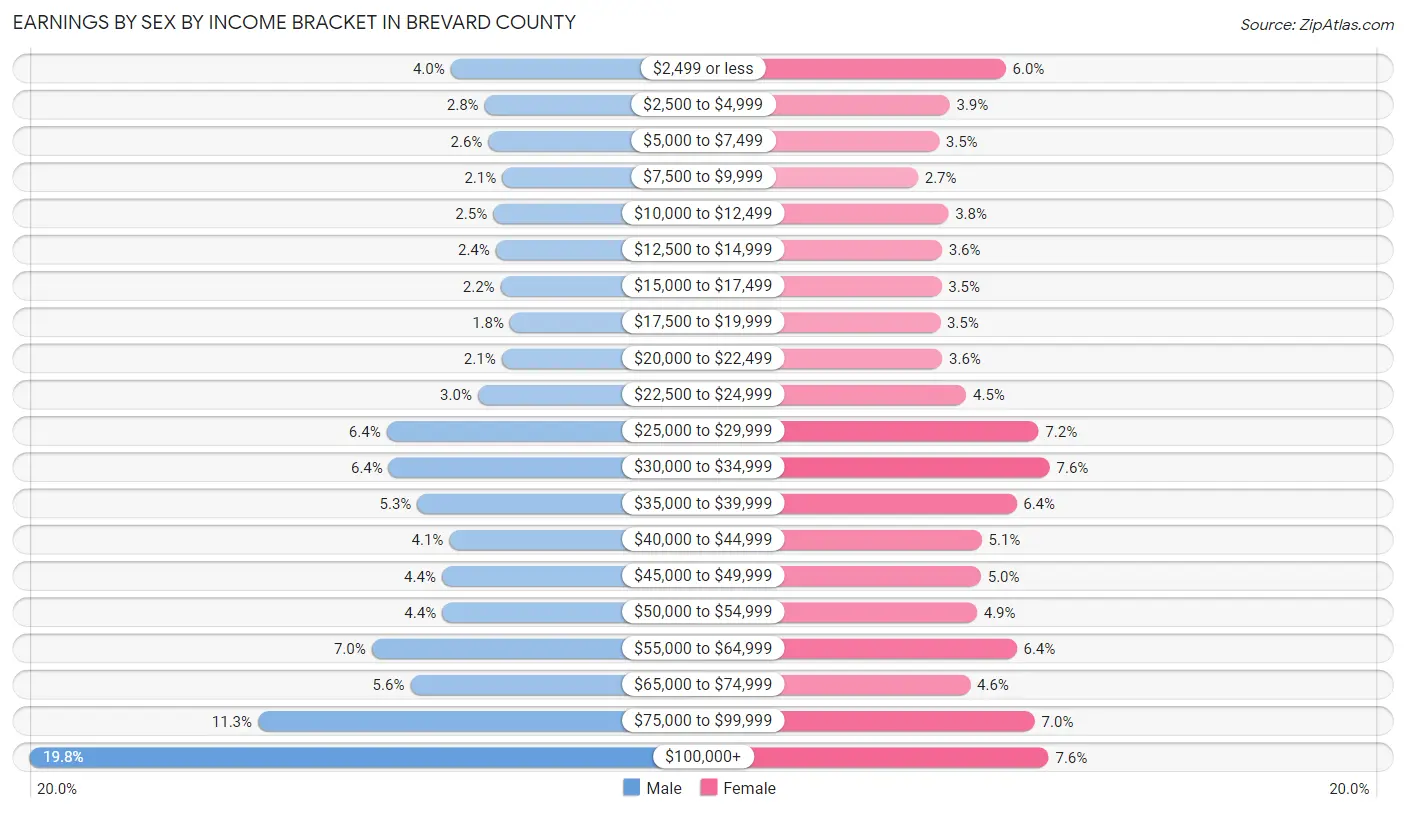
Earnings by Sex by Income Bracket in Brevard County
The most common earnings brackets in Brevard County are $100,000+ for men (31,531 | 19.8%) and $30,000 to $34,999 for women (10,678 | 7.6%).
| Income | Male | Female |
| $2,499 or less | 6,438 (4.0%) | 8,366 (5.9%) |
| $2,500 to $4,999 | 4,408 (2.8%) | 5,405 (3.8%) |
| $5,000 to $7,499 | 4,193 (2.6%) | 4,849 (3.5%) |
| $7,500 to $9,999 | 3,368 (2.1%) | 3,741 (2.7%) |
| $10,000 to $12,499 | 3,897 (2.5%) | 5,348 (3.8%) |
| $12,500 to $14,999 | 3,748 (2.4%) | 5,004 (3.6%) |
| $15,000 to $17,499 | 3,452 (2.2%) | 4,978 (3.5%) |
| $17,500 to $19,999 | 2,893 (1.8%) | 4,908 (3.5%) |
| $20,000 to $22,499 | 3,396 (2.1%) | 5,025 (3.6%) |
| $22,500 to $24,999 | 4,804 (3.0%) | 6,289 (4.5%) |
| $25,000 to $29,999 | 10,253 (6.4%) | 10,087 (7.2%) |
| $30,000 to $34,999 | 10,131 (6.4%) | 10,678 (7.6%) |
| $35,000 to $39,999 | 8,435 (5.3%) | 8,925 (6.4%) |
| $40,000 to $44,999 | 6,516 (4.1%) | 7,095 (5.1%) |
| $45,000 to $49,999 | 6,958 (4.4%) | 7,062 (5.0%) |
| $50,000 to $54,999 | 6,949 (4.4%) | 6,845 (4.9%) |
| $55,000 to $64,999 | 11,146 (7.0%) | 8,942 (6.4%) |
| $65,000 to $74,999 | 8,847 (5.6%) | 6,492 (4.6%) |
| $75,000 to $99,999 | 17,941 (11.3%) | 9,900 (7.0%) |
| $100,000+ | 31,531 (19.8%) | 10,625 (7.6%) |
| Total | 159,304 (100.0%) | 140,564 (100.0%) |
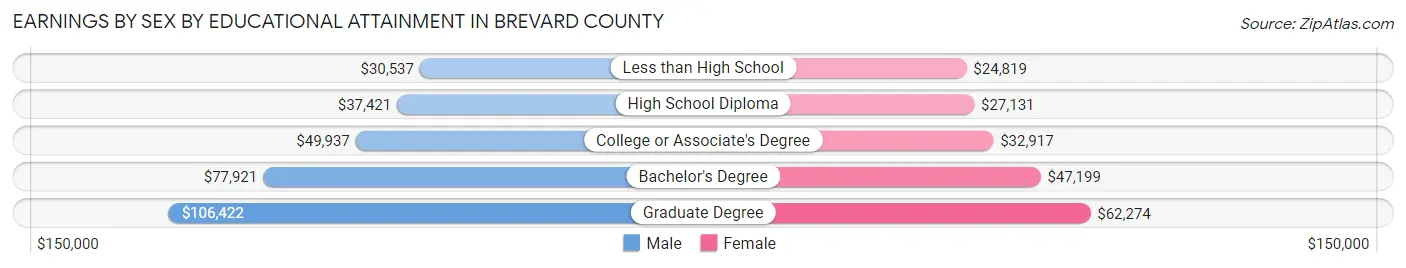
Earnings by Sex by Educational Attainment in Brevard County
Average earnings in Brevard County are $52,632 for men and $36,781 for women, a difference of 30.1%. Men with an educational attainment of graduate degree enjoy the highest average annual earnings of $106,422, while those with less than high school education earn the least with $30,537. Women with an educational attainment of graduate degree earn the most with the average annual earnings of $62,274, while those with less than high school education have the smallest earnings of $24,819.
| Educational Attainment | Male Income | Female Income |
| Less than High School | $30,537 | $24,819 |
| High School Diploma | $37,421 | $27,131 |
| College or Associate's Degree | $49,937 | $32,917 |
| Bachelor's Degree | $77,921 | $47,199 |
| Graduate Degree | $106,422 | $62,274 |
| Total | $52,632 | $36,781 |
Family Income in Brevard County
Family Income Brackets in Brevard County
According to the Brevard County family income data, there are 33,015 families falling into the $100,000 to $149,999 income range, which is the most common income bracket and makes up 21.2% of all families. Conversely, the $10,000 to $14,999 income bracket is the least frequent group with only 2,803 families (1.8%) belonging to this category.
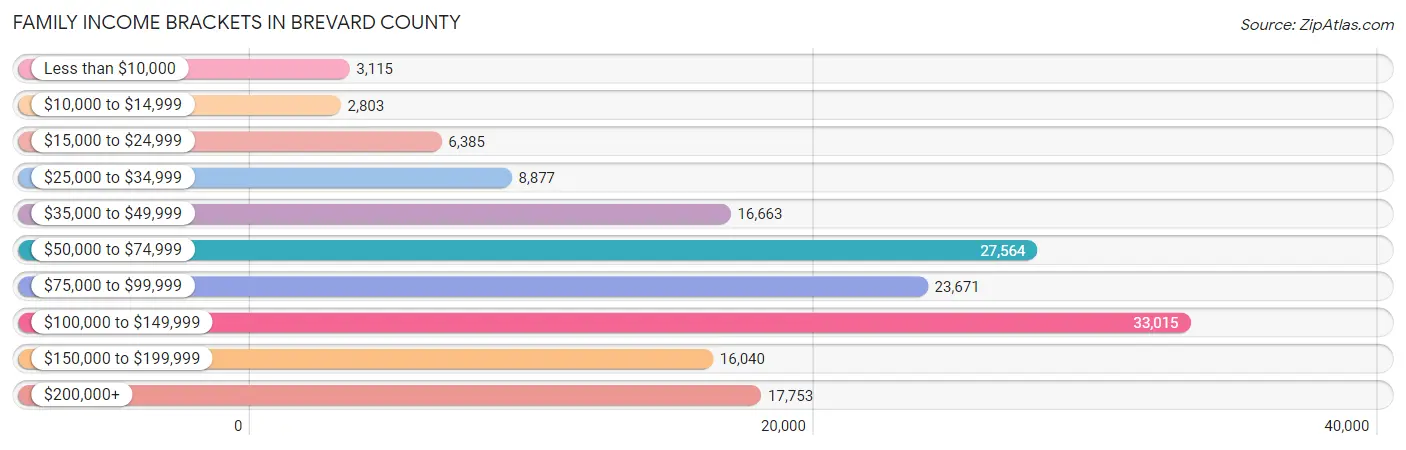
| Income Bracket | # Families | % Families |
| Less than $10,000 | 3,115 | 2.0% |
| $10,000 to $14,999 | 2,803 | 1.8% |
| $15,000 to $24,999 | 6,385 | 4.1% |
| $25,000 to $34,999 | 8,877 | 5.7% |
| $35,000 to $49,999 | 16,663 | 10.7% |
| $50,000 to $74,999 | 27,564 | 17.7% |
| $75,000 to $99,999 | 23,671 | 15.2% |
| $100,000 to $149,999 | 33,015 | 21.2% |
| $150,000 to $199,999 | 16,040 | 10.3% |
| $200,000+ | 17,753 | 11.4% |
Family Income by Famaliy Size in Brevard County
7+ person families (1,469 | 0.9%) account for the highest median family income in Brevard County with $117,364 per family, while 2-person families (86,117 | 55.3%) have the highest median income of $39,455 per family member.
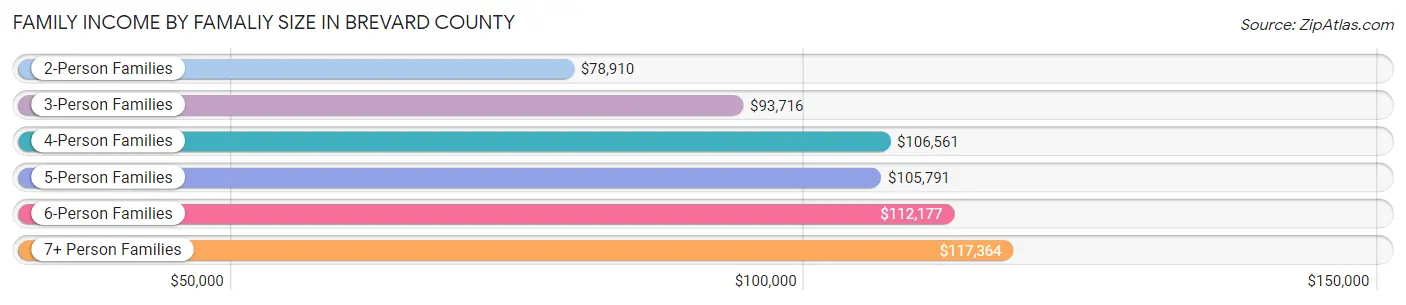
| Income Bracket | # Families | Median Income |
| 2-Person Families | 86,117 (55.3%) | $78,910 |
| 3-Person Families | 32,921 (21.1%) | $93,716 |
| 4-Person Families | 21,559 (13.8%) | $106,561 |
| 5-Person Families | 9,521 (6.1%) | $105,791 |
| 6-Person Families | 4,142 (2.7%) | $112,177 |
| 7+ Person Families | 1,469 (0.9%) | $117,364 |
| Total | 155,729 (100.0%) | $87,701 |
Family Income by Number of Earners in Brevard County
The median family income in Brevard County is $87,701, with families comprising 3+ earners (13,311) having the highest median family income of $133,715, while families with no earners (34,406) have the lowest median family income of $61,119, accounting for 8.6% and 22.1% of families, respectively.
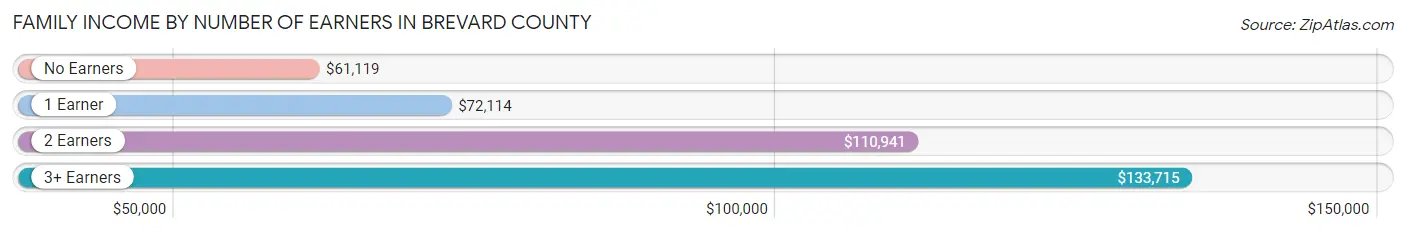
| Number of Earners | # Families | Median Income |
| No Earners | 34,406 (22.1%) | $61,119 |
| 1 Earner | 51,790 (33.3%) | $72,114 |
| 2 Earners | 56,222 (36.1%) | $110,941 |
| 3+ Earners | 13,311 (8.6%) | $133,715 |
| Total | 155,729 (100.0%) | $87,701 |
Household Income in Brevard County
Household Income Brackets in Brevard County
With 44,397 households falling in the category, the $50,000 to $74,999 income range is the most frequent in Brevard County, accounting for 18.0% of all households. In contrast, only 7,893 households (3.2%) fall into the $10,000 to $14,999 income bracket, making it the least populous group.
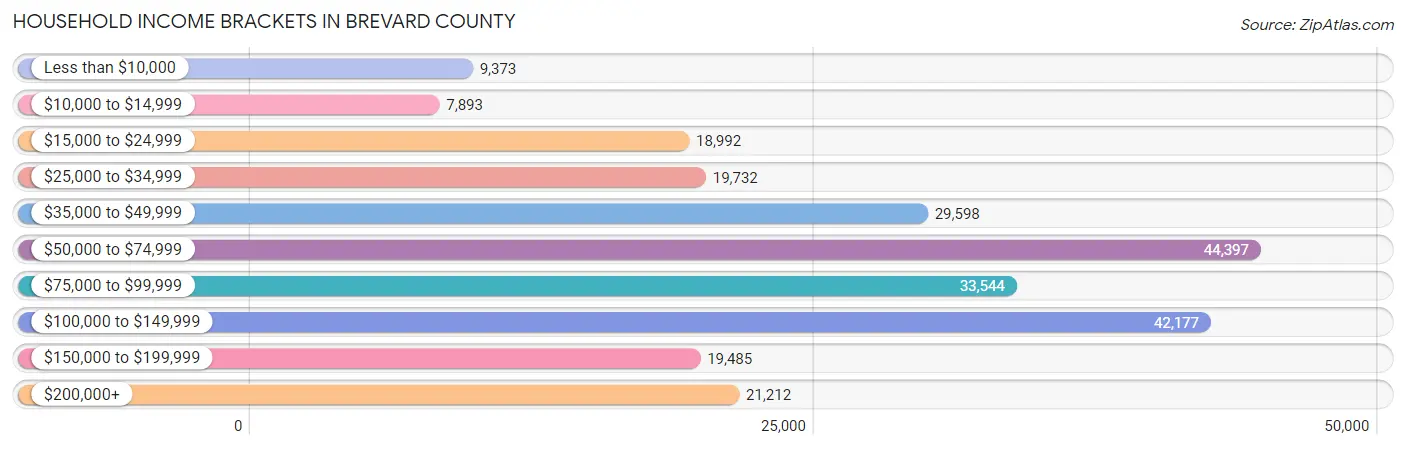
| Income Bracket | # Households | % Households |
| Less than $10,000 | 9,373 | 3.8% |
| $10,000 to $14,999 | 7,893 | 3.2% |
| $15,000 to $24,999 | 18,992 | 7.7% |
| $25,000 to $34,999 | 19,732 | 8.0% |
| $35,000 to $49,999 | 29,598 | 12.0% |
| $50,000 to $74,999 | 44,397 | 18.0% |
| $75,000 to $99,999 | 33,544 | 13.6% |
| $100,000 to $149,999 | 42,177 | 17.1% |
| $150,000 to $199,999 | 19,485 | 7.9% |
| $200,000+ | 21,212 | 8.6% |
Household Income by Householder Age in Brevard County
The median household income in Brevard County is $71,308, with the highest median household income of $85,629 found in the 45 to 64 years age bracket for the primary householder. A total of 94,626 households (38.4%) fall into this category. Meanwhile, the 15 to 24 years age bracket for the primary householder has the lowest median household income of $43,857, with 4,803 households (1.9%) in this group.
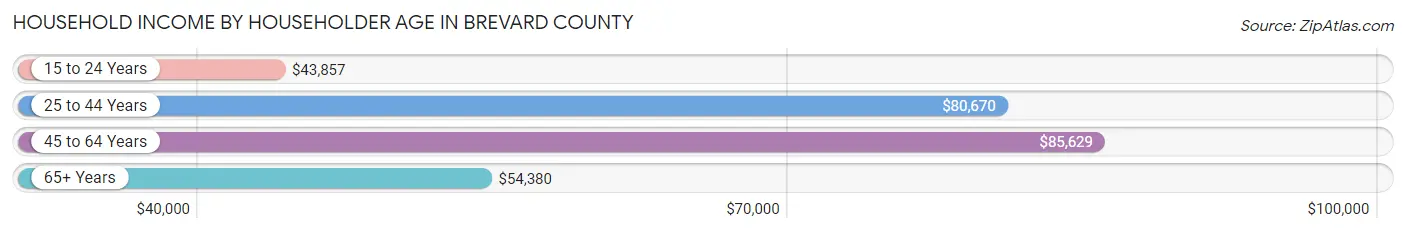
| Income Bracket | # Households | Median Income |
| 15 to 24 Years | 4,803 (1.9%) | $43,857 |
| 25 to 44 Years | 57,827 (23.4%) | $80,670 |
| 45 to 64 Years | 94,626 (38.4%) | $85,629 |
| 65+ Years | 89,394 (36.2%) | $54,380 |
| Total | 246,650 (100.0%) | $71,308 |
Poverty in Brevard County
Income Below Poverty by Sex and Age in Brevard County
With 9.3% poverty level for males and 10.9% for females among the residents of Brevard County, 5 year old males and under 5 year old females are the most vulnerable to poverty, with 388 males (15.2%) and 2,296 females (17.5%) in their respective age groups living below the poverty level.
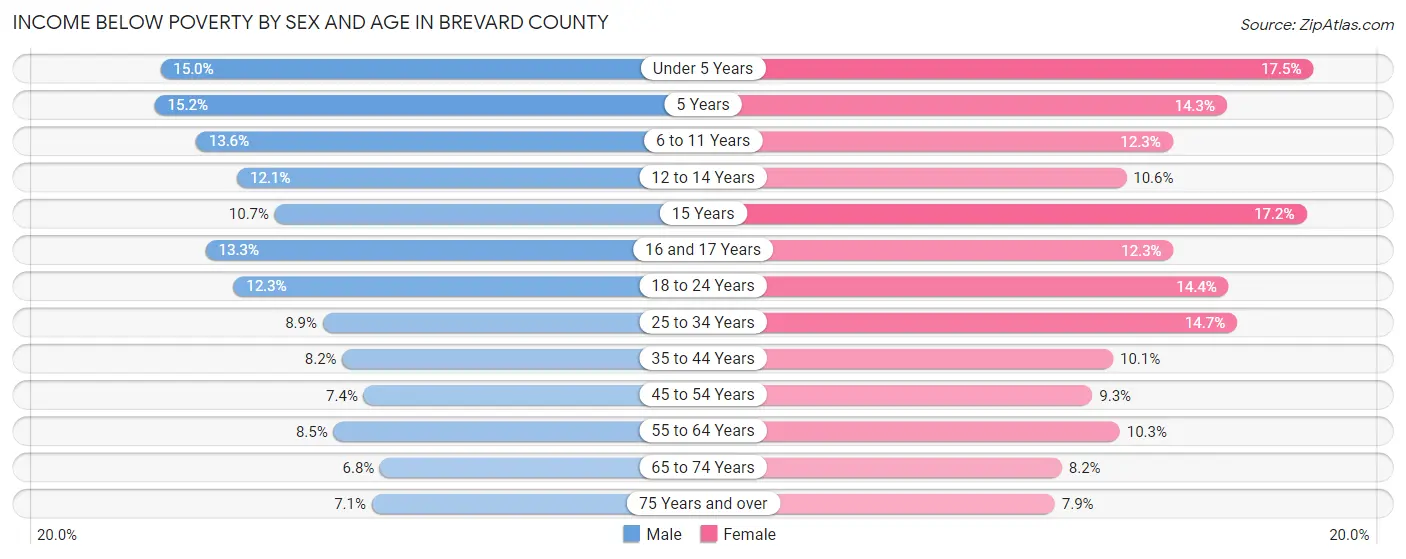
| Age Bracket | Male | Female |
| Under 5 Years | 2,049 (15.0%) | 2,296 (17.5%) |
| 5 Years | 388 (15.2%) | 448 (14.3%) |
| 6 to 11 Years | 2,625 (13.6%) | 2,178 (12.3%) |
| 12 to 14 Years | 1,232 (12.1%) | 973 (10.6%) |
| 15 Years | 364 (10.7%) | 529 (17.2%) |
| 16 and 17 Years | 886 (13.3%) | 848 (12.3%) |
| 18 to 24 Years | 2,732 (12.2%) | 2,895 (14.4%) |
| 25 to 34 Years | 3,170 (8.9%) | 4,891 (14.7%) |
| 35 to 44 Years | 2,684 (8.2%) | 3,373 (10.1%) |
| 45 to 54 Years | 2,681 (7.4%) | 3,490 (9.3%) |
| 55 to 64 Years | 4,077 (8.5%) | 5,258 (10.3%) |
| 65 to 74 Years | 2,602 (6.8%) | 3,421 (8.2%) |
| 75 Years and over | 2,003 (7.1%) | 2,834 (7.9%) |
| Total | 27,493 (9.3%) | 33,434 (10.9%) |
Income Above Poverty by Sex and Age in Brevard County
According to the poverty statistics in Brevard County, males aged 65 to 74 years and females aged 75 years and over are the age groups that are most secure financially, with 93.2% of males and 92.1% of females in these age groups living above the poverty line.
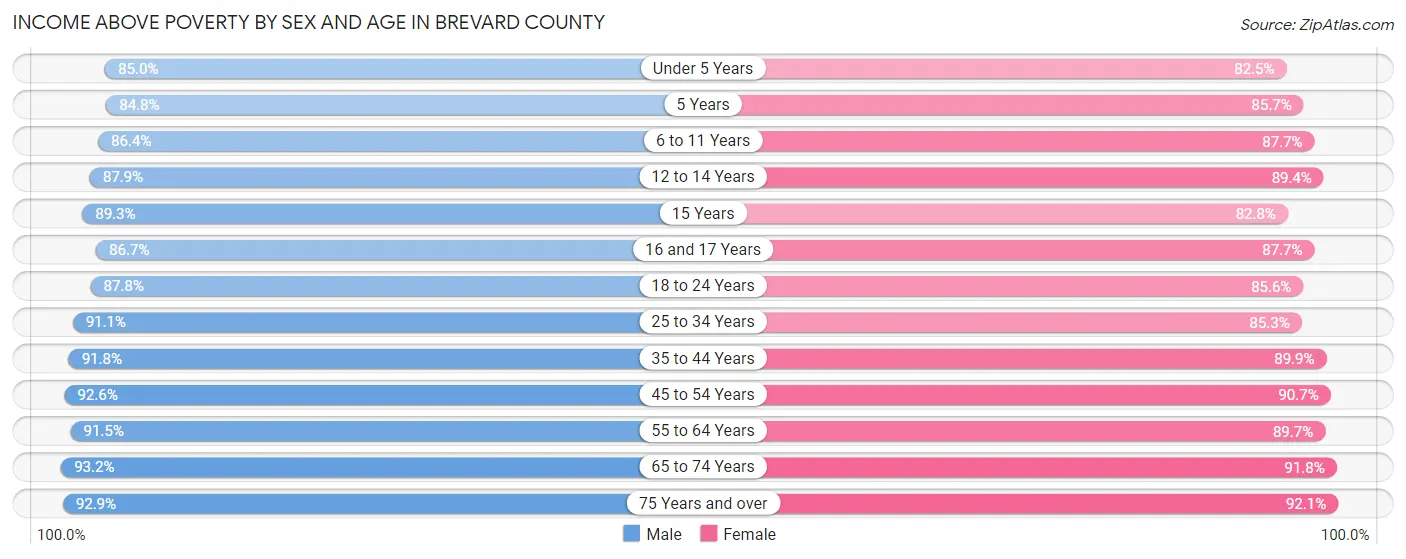
| Age Bracket | Male | Female |
| Under 5 Years | 11,646 (85.0%) | 10,821 (82.5%) |
| 5 Years | 2,169 (84.8%) | 2,686 (85.7%) |
| 6 to 11 Years | 16,626 (86.4%) | 15,564 (87.7%) |
| 12 to 14 Years | 8,939 (87.9%) | 8,243 (89.4%) |
| 15 Years | 3,035 (89.3%) | 2,539 (82.8%) |
| 16 and 17 Years | 5,788 (86.7%) | 6,042 (87.7%) |
| 18 to 24 Years | 19,571 (87.7%) | 17,269 (85.6%) |
| 25 to 34 Years | 32,330 (91.1%) | 28,445 (85.3%) |
| 35 to 44 Years | 30,061 (91.8%) | 30,114 (89.9%) |
| 45 to 54 Years | 33,483 (92.6%) | 34,024 (90.7%) |
| 55 to 64 Years | 43,719 (91.5%) | 45,699 (89.7%) |
| 65 to 74 Years | 35,638 (93.2%) | 38,464 (91.8%) |
| 75 Years and over | 26,155 (92.9%) | 32,974 (92.1%) |
| Total | 269,160 (90.7%) | 272,884 (89.1%) |
Income Below Poverty Among Married-Couple Families in Brevard County
The poverty statistics for married-couple families in Brevard County show that 4.4% or 5,313 of the total 120,719 families live below the poverty line. Families with 5 or more children have the highest poverty rate of 15.6%, comprising of 71 families. On the other hand, families with no children have the lowest poverty rate of 3.5%, which includes 2,934 families.
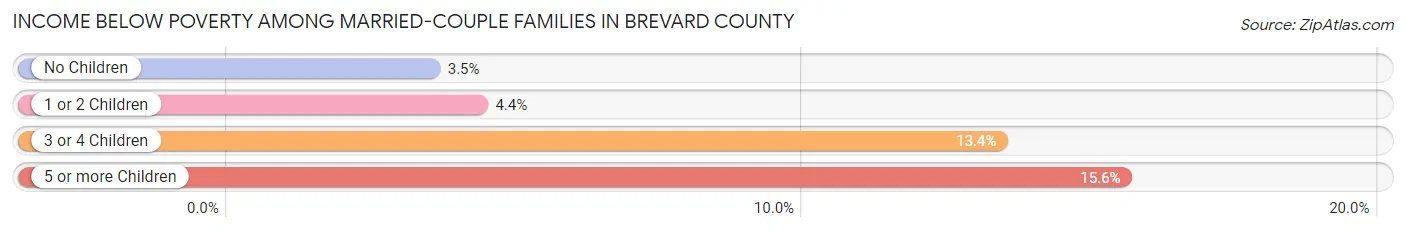
| Children | Above Poverty | Below Poverty |
| No Children | 80,240 (96.5%) | 2,934 (3.5%) |
| 1 or 2 Children | 28,155 (95.6%) | 1,282 (4.4%) |
| 3 or 4 Children | 6,626 (86.6%) | 1,026 (13.4%) |
| 5 or more Children | 385 (84.4%) | 71 (15.6%) |
| Total | 115,406 (95.6%) | 5,313 (4.4%) |
Income Below Poverty Among Single-Parent Households in Brevard County
According to the poverty data in Brevard County, 6.7% or 684 single-father households and 18.6% or 4,612 single-mother households are living below the poverty line. Among single-father households, those with 3 or 4 children have the highest poverty rate, with 88 households (16.6%) experiencing poverty. Likewise, among single-mother households, those with 5 or more children have the highest poverty rate, with 72 households (64.3%) falling below the poverty line.
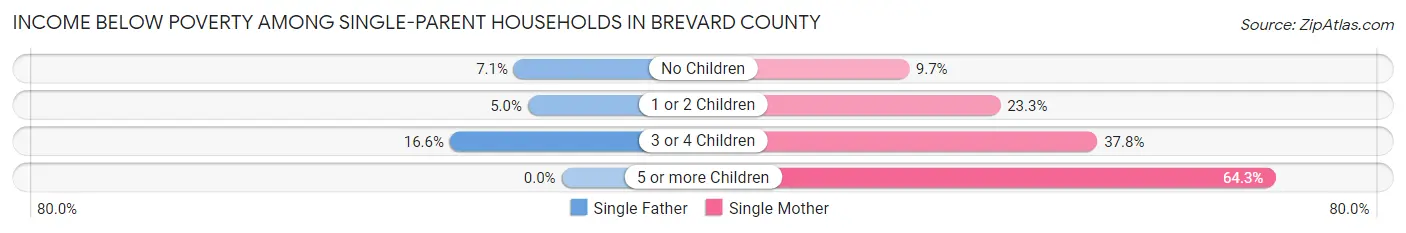
| Children | Single Father | Single Mother |
| No Children | 369 (7.1%) | 1,106 (9.7%) |
| 1 or 2 Children | 227 (5.0%) | 2,554 (23.3%) |
| 3 or 4 Children | 88 (16.6%) | 880 (37.8%) |
| 5 or more Children | 0 (0.0%) | 72 (64.3%) |
| Total | 684 (6.7%) | 4,612 (18.6%) |
Income Below Poverty Among Married-Couple vs Single-Parent Households in Brevard County
The poverty data for Brevard County shows that 5,313 of the married-couple family households (4.4%) and 5,296 of the single-parent households (15.1%) are living below the poverty level. Within the married-couple family households, those with 5 or more children have the highest poverty rate, with 71 households (15.6%) falling below the poverty line. Among the single-parent households, those with 5 or more children have the highest poverty rate, with 72 household (64.3%) living below poverty.
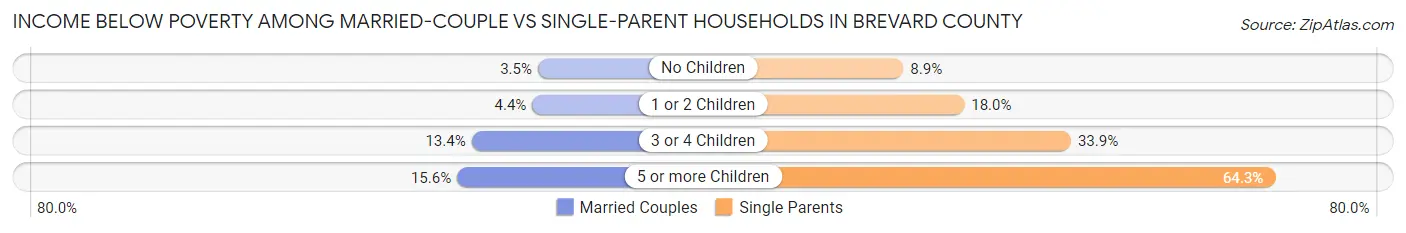
| Children | Married-Couple Families | Single-Parent Households |
| No Children | 2,934 (3.5%) | 1,475 (8.9%) |
| 1 or 2 Children | 1,282 (4.4%) | 2,781 (18.0%) |
| 3 or 4 Children | 1,026 (13.4%) | 968 (33.9%) |
| 5 or more Children | 71 (15.6%) | 72 (64.3%) |
| Total | 5,313 (4.4%) | 5,296 (15.1%) |
Race in Brevard County
The most populous races in Brevard County are White / Caucasian (470,655 | 77.1%), Hispanic or Latino (69,355 | 11.4%), and Black / African American (60,125 | 9.8%).
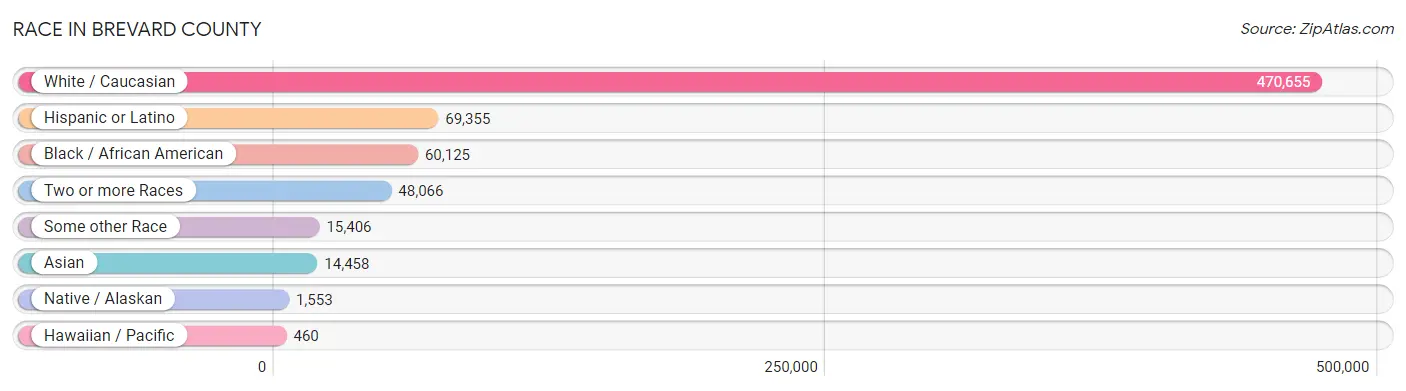
| Race | # Population | % Population |
| Asian | 14,458 | 2.4% |
| Black / African American | 60,125 | 9.8% |
| Hawaiian / Pacific | 460 | 0.1% |
| Hispanic or Latino | 69,355 | 11.4% |
| Native / Alaskan | 1,553 | 0.3% |
| White / Caucasian | 470,655 | 77.1% |
| Two or more Races | 48,066 | 7.9% |
| Some other Race | 15,406 | 2.5% |
| Total | 610,723 | 100.0% |
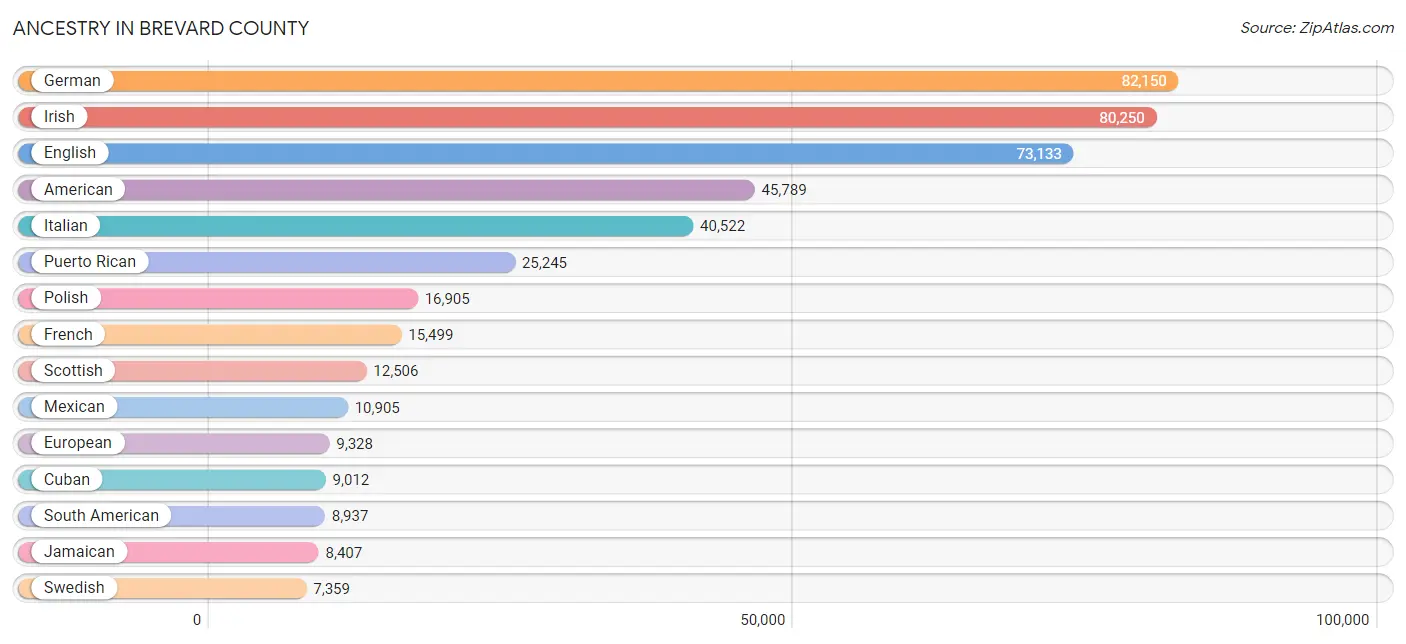
Ancestry in Brevard County
The most populous ancestries reported in Brevard County are German (82,150 | 13.5%), Irish (80,250 | 13.1%), English (73,133 | 12.0%), American (45,789 | 7.5%), and Italian (40,522 | 6.6%), together accounting for 52.7% of all Brevard County residents.
| Ancestry | # Population | % Population |
| Afghan | 18 | 0.0% |
| African | 1,656 | 0.3% |
| Alaska Native | 5 | 0.0% |
| Albanian | 309 | 0.1% |
| Alsatian | 10 | 0.0% |
| American | 45,789 | 7.5% |
| Apache | 55 | 0.0% |
| Arab | 2,582 | 0.4% |
| Argentinean | 509 | 0.1% |
| Armenian | 247 | 0.0% |
| Australian | 292 | 0.1% |
| Austrian | 1,752 | 0.3% |
| Bahamian | 244 | 0.0% |
| Barbadian | 558 | 0.1% |
| Basque | 197 | 0.0% |
| Belgian | 246 | 0.0% |
| Belizean | 98 | 0.0% |
| Bhutanese | 2,562 | 0.4% |
| Blackfeet | 359 | 0.1% |
| Bolivian | 126 | 0.0% |
| Brazilian | 1,513 | 0.3% |
| British | 4,255 | 0.7% |
| British West Indian | 281 | 0.1% |
| Bulgarian | 227 | 0.0% |
| Burmese | 1,567 | 0.3% |
| Cajun | 83 | 0.0% |
| Canadian | 2,388 | 0.4% |
| Cape Verdean | 144 | 0.0% |
| Carpatho Rusyn | 23 | 0.0% |
| Celtic | 122 | 0.0% |
| Central American | 6,250 | 1.0% |
| Central American Indian | 817 | 0.1% |
| Cherokee | 2,345 | 0.4% |
| Chilean | 421 | 0.1% |
| Chinese | 164 | 0.0% |
| Chippewa | 41 | 0.0% |
| Choctaw | 99 | 0.0% |
| Colombian | 4,517 | 0.7% |
| Comanche | 30 | 0.0% |
| Costa Rican | 645 | 0.1% |
| Creek | 131 | 0.0% |
| Croatian | 369 | 0.1% |
| Crow | 15 | 0.0% |
| Cuban | 9,012 | 1.5% |
| Cypriot | 42 | 0.0% |
| Czech | 1,706 | 0.3% |
| Czechoslovakian | 533 | 0.1% |
| Danish | 1,487 | 0.2% |
| Delaware | 34 | 0.0% |
| Dominican | 3,760 | 0.6% |
| Dutch | 6,648 | 1.1% |
| Dutch West Indian | 40 | 0.0% |
| Eastern European | 1,946 | 0.3% |
| Ecuadorian | 560 | 0.1% |
| Egyptian | 278 | 0.1% |
| English | 73,133 | 12.0% |
| Estonian | 76 | 0.0% |
| Ethiopian | 26 | 0.0% |
| European | 9,328 | 1.5% |
| Filipino | 136 | 0.0% |
| Finnish | 930 | 0.2% |
| French | 15,499 | 2.5% |
| French American Indian | 32 | 0.0% |
| French Canadian | 5,018 | 0.8% |
| German | 82,150 | 13.5% |
| Ghanaian | 156 | 0.0% |
| Greek | 2,678 | 0.4% |
| Guamanian / Chamorro | 206 | 0.0% |
| Guatemalan | 1,617 | 0.3% |
| Guyanese | 211 | 0.0% |
| Haitian | 3,678 | 0.6% |
| Honduran | 1,314 | 0.2% |
| Hungarian | 3,345 | 0.5% |
| Icelander | 17 | 0.0% |
| Indian (Asian) | 4,818 | 0.8% |
| Inupiat | 41 | 0.0% |
| Iranian | 381 | 0.1% |
| Iraqi | 63 | 0.0% |
| Irish | 80,250 | 13.1% |
| Iroquois | 331 | 0.1% |
| Israeli | 81 | 0.0% |
| Italian | 40,522 | 6.6% |
| Jamaican | 8,407 | 1.4% |
| Japanese | 112 | 0.0% |
| Jordanian | 45 | 0.0% |
| Kenyan | 121 | 0.0% |
| Kiowa | 11 | 0.0% |
| Korean | 6,785 | 1.1% |
| Laotian | 143 | 0.0% |
| Latvian | 134 | 0.0% |
| Lebanese | 1,031 | 0.2% |
| Lithuanian | 1,706 | 0.3% |
| Lumbee | 7 | 0.0% |
| Luxembourger | 11 | 0.0% |
| Macedonian | 165 | 0.0% |
| Malaysian | 203 | 0.0% |
| Maltese | 101 | 0.0% |
| Mexican | 10,905 | 1.8% |
| Mexican American Indian | 219 | 0.0% |
| Moroccan | 196 | 0.0% |
| Native Hawaiian | 636 | 0.1% |
| Navajo | 68 | 0.0% |
| New Zealander | 205 | 0.0% |
| Nicaraguan | 582 | 0.1% |
| Nigerian | 295 | 0.1% |
| Northern European | 826 | 0.1% |
| Norwegian | 5,371 | 0.9% |
| Okinawan | 41 | 0.0% |
| Osage | 11 | 0.0% |
| Ottawa | 9 | 0.0% |
| Paiute | 17 | 0.0% |
| Pakistani | 1,228 | 0.2% |
| Palestinian | 122 | 0.0% |
| Panamanian | 1,107 | 0.2% |
| Pennsylvania German | 240 | 0.0% |
| Peruvian | 1,048 | 0.2% |
| Pima | 18 | 0.0% |
| Polish | 16,905 | 2.8% |
| Portuguese | 2,518 | 0.4% |
| Puerto Rican | 25,245 | 4.1% |
| Romanian | 573 | 0.1% |
| Russian | 4,042 | 0.7% |
| Salvadoran | 946 | 0.2% |
| Samoan | 169 | 0.0% |
| Scandinavian | 2,886 | 0.5% |
| Scotch-Irish | 6,921 | 1.1% |
| Scottish | 12,506 | 2.1% |
| Seminole | 172 | 0.0% |
| Senegalese | 18 | 0.0% |
| Serbian | 139 | 0.0% |
| Sioux | 71 | 0.0% |
| Slavic | 220 | 0.0% |
| Slovak | 1,052 | 0.2% |
| Slovene | 203 | 0.0% |
| South African | 130 | 0.0% |
| South American | 8,937 | 1.5% |
| South American Indian | 102 | 0.0% |
| Spaniard | 1,264 | 0.2% |
| Spanish | 1,288 | 0.2% |
| Sri Lankan | 2,478 | 0.4% |
| Subsaharan African | 2,728 | 0.4% |
| Swedish | 7,359 | 1.2% |
| Swiss | 1,426 | 0.2% |
| Syrian | 223 | 0.0% |
| Thai | 3,604 | 0.6% |
| Tohono O'Odham | 15 | 0.0% |
| Trinidadian and Tobagonian | 1,665 | 0.3% |
| Turkish | 373 | 0.1% |
| U.S. Virgin Islander | 86 | 0.0% |
| Ugandan | 29 | 0.0% |
| Ukrainian | 1,571 | 0.3% |
| Uruguayan | 462 | 0.1% |
| Venezuelan | 1,294 | 0.2% |
| Vietnamese | 50 | 0.0% |
| Welsh | 4,997 | 0.8% |
| West Indian | 731 | 0.1% |
| Yaqui | 11 | 0.0% |
| Yugoslavian | 196 | 0.0% |
| Zimbabwean | 11 | 0.0% | View All 159 Rows |
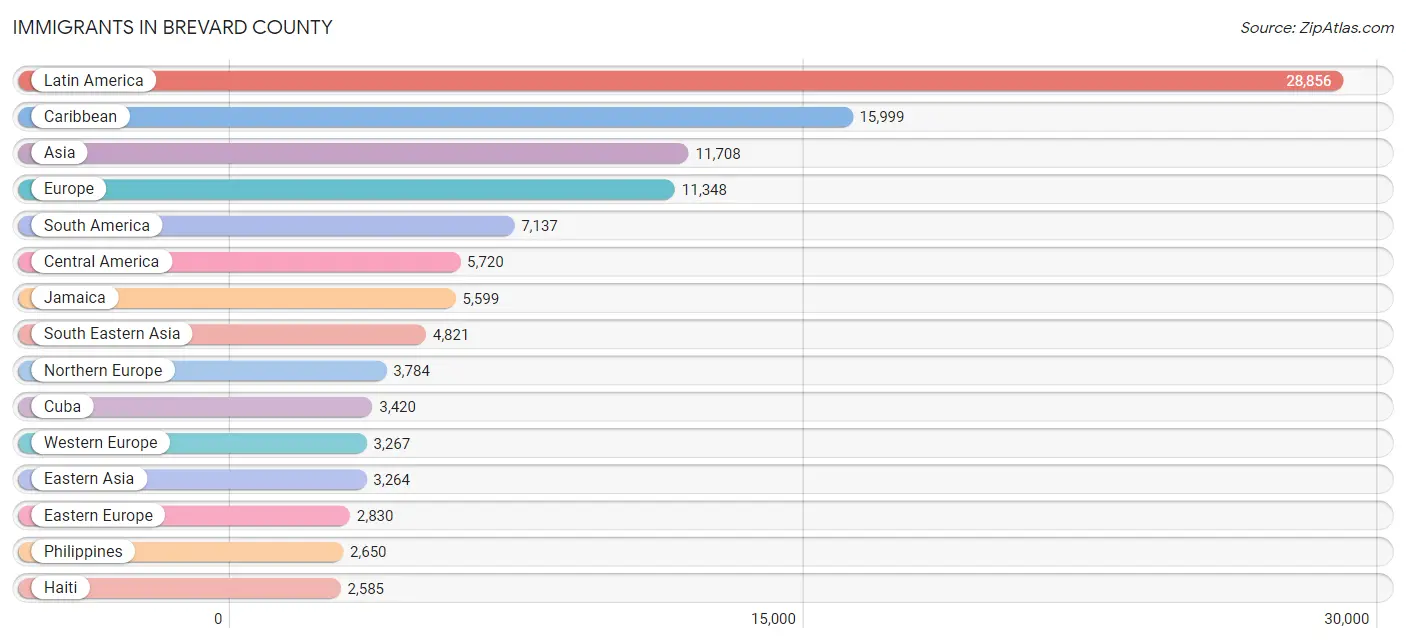
Immigrants in Brevard County
The most numerous immigrant groups reported in Brevard County came from Latin America (28,856 | 4.7%), Caribbean (15,999 | 2.6%), Asia (11,708 | 1.9%), Europe (11,348 | 1.9%), and South America (7,137 | 1.2%), together accounting for 12.3% of all Brevard County residents.
| Immigration Origin | # Population | % Population |
| Africa | 1,544 | 0.3% |
| Albania | 95 | 0.0% |
| Argentina | 227 | 0.0% |
| Asia | 11,708 | 1.9% |
| Australia | 271 | 0.0% |
| Austria | 46 | 0.0% |
| Azores | 68 | 0.0% |
| Bahamas | 217 | 0.0% |
| Bangladesh | 235 | 0.0% |
| Barbados | 233 | 0.0% |
| Belarus | 10 | 0.0% |
| Belgium | 34 | 0.0% |
| Belize | 156 | 0.0% |
| Bolivia | 48 | 0.0% |
| Brazil | 1,696 | 0.3% |
| Bulgaria | 166 | 0.0% |
| Cabo Verde | 54 | 0.0% |
| Cambodia | 48 | 0.0% |
| Canada | 2,136 | 0.4% |
| Caribbean | 15,999 | 2.6% |
| Central America | 5,720 | 0.9% |
| Chile | 191 | 0.0% |
| China | 2,083 | 0.3% |
| Colombia | 2,247 | 0.4% |
| Costa Rica | 245 | 0.0% |
| Croatia | 24 | 0.0% |
| Cuba | 3,420 | 0.6% |
| Czechoslovakia | 200 | 0.0% |
| Denmark | 92 | 0.0% |
| Dominica | 40 | 0.0% |
| Dominican Republic | 1,505 | 0.3% |
| Eastern Africa | 327 | 0.1% |
| Eastern Asia | 3,264 | 0.5% |
| Eastern Europe | 2,830 | 0.5% |
| Ecuador | 207 | 0.0% |
| Egypt | 250 | 0.0% |
| El Salvador | 1,132 | 0.2% |
| England | 1,532 | 0.3% |
| Ethiopia | 13 | 0.0% |
| Europe | 11,348 | 1.9% |
| France | 694 | 0.1% |
| Germany | 2,229 | 0.4% |
| Ghana | 296 | 0.1% |
| Greece | 62 | 0.0% |
| Grenada | 309 | 0.1% |
| Guatemala | 981 | 0.2% |
| Guyana | 297 | 0.1% |
| Haiti | 2,585 | 0.4% |
| Honduras | 431 | 0.1% |
| Hong Kong | 56 | 0.0% |
| Hungary | 155 | 0.0% |
| India | 1,628 | 0.3% |
| Indonesia | 72 | 0.0% |
| Iran | 346 | 0.1% |
| Iraq | 110 | 0.0% |
| Ireland | 400 | 0.1% |
| Israel | 117 | 0.0% |
| Italy | 847 | 0.1% |
| Jamaica | 5,599 | 0.9% |
| Japan | 383 | 0.1% |
| Jordan | 73 | 0.0% |
| Kazakhstan | 45 | 0.0% |
| Kenya | 99 | 0.0% |
| Korea | 798 | 0.1% |
| Laos | 44 | 0.0% |
| Latin America | 28,856 | 4.7% |
| Latvia | 17 | 0.0% |
| Lebanon | 127 | 0.0% |
| Lithuania | 193 | 0.0% |
| Malaysia | 5 | 0.0% |
| Mexico | 2,069 | 0.3% |
| Micronesia | 6 | 0.0% |
| Morocco | 163 | 0.0% |
| Netherlands | 164 | 0.0% |
| Nicaragua | 286 | 0.1% |
| Nigeria | 130 | 0.0% |
| North Macedonia | 153 | 0.0% |
| Northern Africa | 594 | 0.1% |
| Northern Europe | 3,784 | 0.6% |
| Norway | 136 | 0.0% |
| Oceania | 455 | 0.1% |
| Pakistan | 22 | 0.0% |
| Panama | 420 | 0.1% |
| Peru | 673 | 0.1% |
| Philippines | 2,650 | 0.4% |
| Poland | 830 | 0.1% |
| Portugal | 155 | 0.0% |
| Romania | 215 | 0.0% |
| Russia | 514 | 0.1% |
| Saudi Arabia | 144 | 0.0% |
| Scotland | 205 | 0.0% |
| Senegal | 21 | 0.0% |
| Singapore | 48 | 0.0% |
| South Africa | 109 | 0.0% |
| South America | 7,137 | 1.2% |
| South Central Asia | 2,371 | 0.4% |
| South Eastern Asia | 4,821 | 0.8% |
| Southern Europe | 1,467 | 0.2% |
| Spain | 377 | 0.1% |
| St. Vincent and the Grenadines | 207 | 0.0% |
| Sweden | 151 | 0.0% |
| Switzerland | 100 | 0.0% |
| Syria | 40 | 0.0% |
| Taiwan | 246 | 0.0% |
| Thailand | 285 | 0.1% |
| Trinidad and Tobago | 1,534 | 0.3% |
| Turkey | 343 | 0.1% |
| Ukraine | 155 | 0.0% |
| Uruguay | 86 | 0.0% |
| Uzbekistan | 14 | 0.0% |
| Venezuela | 1,381 | 0.2% |
| Vietnam | 1,669 | 0.3% |
| West Indies | 60 | 0.0% |
| Western Africa | 514 | 0.1% |
| Western Asia | 1,252 | 0.2% |
| Western Europe | 3,267 | 0.5% |
| Zimbabwe | 83 | 0.0% | View All 117 Rows |
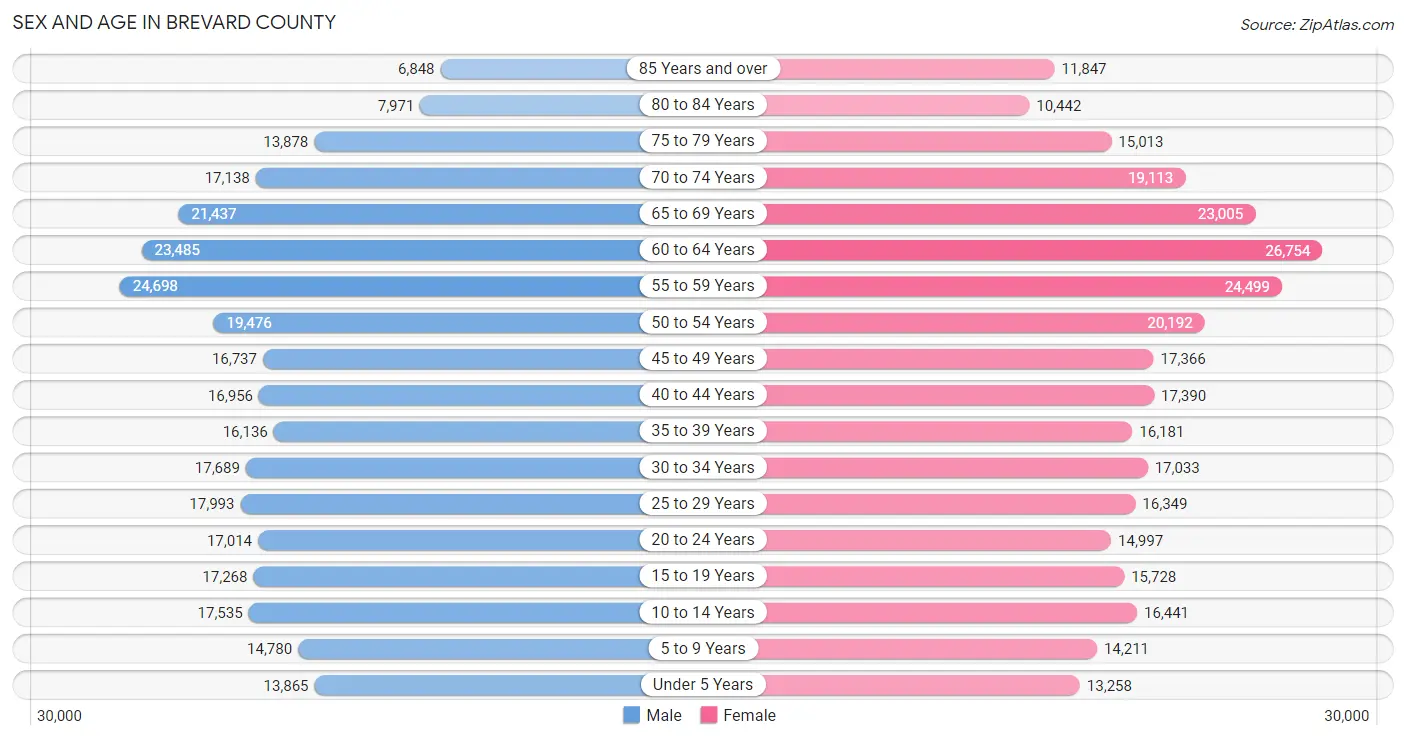
Sex and Age in Brevard County
Sex and Age in Brevard County
The most populous age groups in Brevard County are 55 to 59 Years (24,698 | 8.2%) for men and 60 to 64 Years (26,754 | 8.6%) for women.
| Age Bracket | Male | Female |
| Under 5 Years | 13,865 (4.6%) | 13,258 (4.3%) |
| 5 to 9 Years | 14,780 (4.9%) | 14,211 (4.6%) |
| 10 to 14 Years | 17,535 (5.8%) | 16,441 (5.3%) |
| 15 to 19 Years | 17,268 (5.7%) | 15,728 (5.1%) |
| 20 to 24 Years | 17,014 (5.7%) | 14,997 (4.8%) |
| 25 to 29 Years | 17,993 (6.0%) | 16,349 (5.3%) |
| 30 to 34 Years | 17,689 (5.9%) | 17,033 (5.5%) |
| 35 to 39 Years | 16,136 (5.4%) | 16,181 (5.2%) |
| 40 to 44 Years | 16,956 (5.6%) | 17,390 (5.6%) |
| 45 to 49 Years | 16,737 (5.6%) | 17,366 (5.6%) |
| 50 to 54 Years | 19,476 (6.5%) | 20,192 (6.5%) |
| 55 to 59 Years | 24,698 (8.2%) | 24,499 (7.9%) |
| 60 to 64 Years | 23,485 (7.8%) | 26,754 (8.6%) |
| 65 to 69 Years | 21,437 (7.1%) | 23,005 (7.4%) |
| 70 to 74 Years | 17,138 (5.7%) | 19,113 (6.2%) |
| 75 to 79 Years | 13,878 (4.6%) | 15,013 (4.9%) |
| 80 to 84 Years | 7,971 (2.6%) | 10,442 (3.4%) |
| 85 Years and over | 6,848 (2.3%) | 11,847 (3.8%) |
| Total | 300,904 (100.0%) | 309,819 (100.0%) |
Families and Households in Brevard County
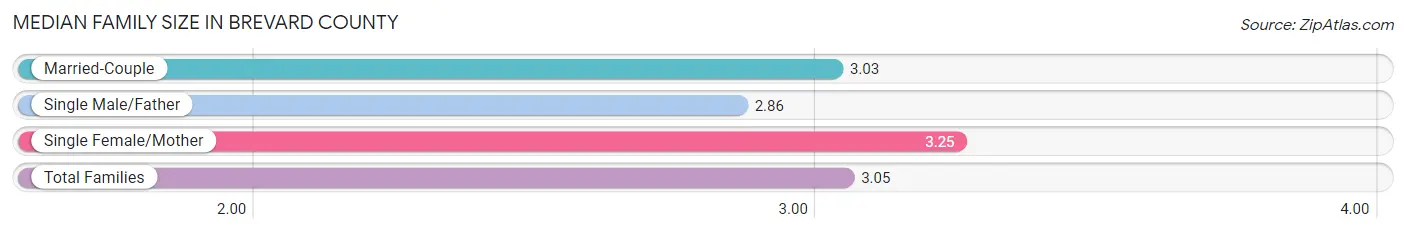
Median Family Size in Brevard County
The median family size in Brevard County is 3.05 persons per family, with single female/mother families (24,771 | 15.9%) accounting for the largest median family size of 3.25 persons per family. On the other hand, single male/father families (10,239 | 6.6%) represent the smallest median family size with 2.86 persons per family.
| Family Type | # Families | Family Size |
| Married-Couple | 120,719 (77.5%) | 3.03 |
| Single Male/Father | 10,239 (6.6%) | 2.86 |
| Single Female/Mother | 24,771 (15.9%) | 3.25 |
| Total Families | 155,729 (100.0%) | 3.05 |
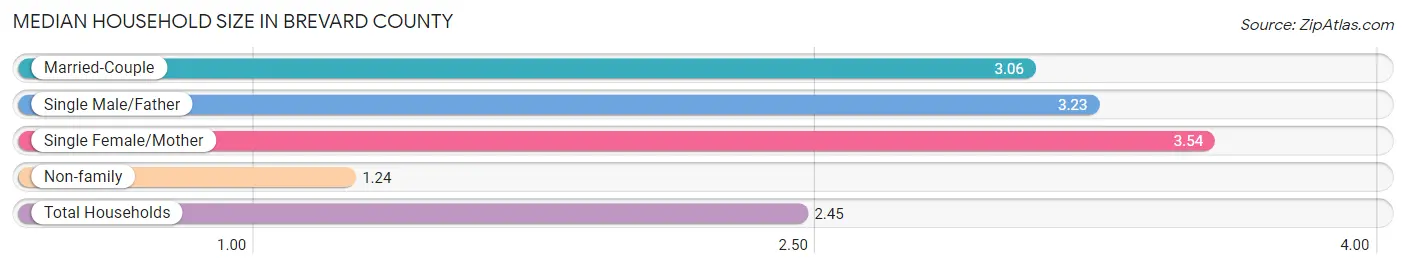
Median Household Size in Brevard County
The median household size in Brevard County is 2.45 persons per household, with single female/mother households (24,771 | 10.0%) accounting for the largest median household size of 3.54 persons per household. non-family households (90,921 | 36.9%) represent the smallest median household size with 1.24 persons per household.
| Household Type | # Households | Household Size |
| Married-Couple | 120,719 (48.9%) | 3.06 |
| Single Male/Father | 10,239 (4.2%) | 3.23 |
| Single Female/Mother | 24,771 (10.0%) | 3.54 |
| Non-family | 90,921 (36.9%) | 1.24 |
| Total Households | 246,650 (100.0%) | 2.45 |
Household Size by Marriage Status in Brevard County
Out of a total of 246,650 households in Brevard County, 155,729 (63.1%) are family households, while 90,921 (36.9%) are nonfamily households. The most numerous type of family households are 2-person households, comprising 81,080, and the most common type of nonfamily households are 1-person households, comprising 75,017.
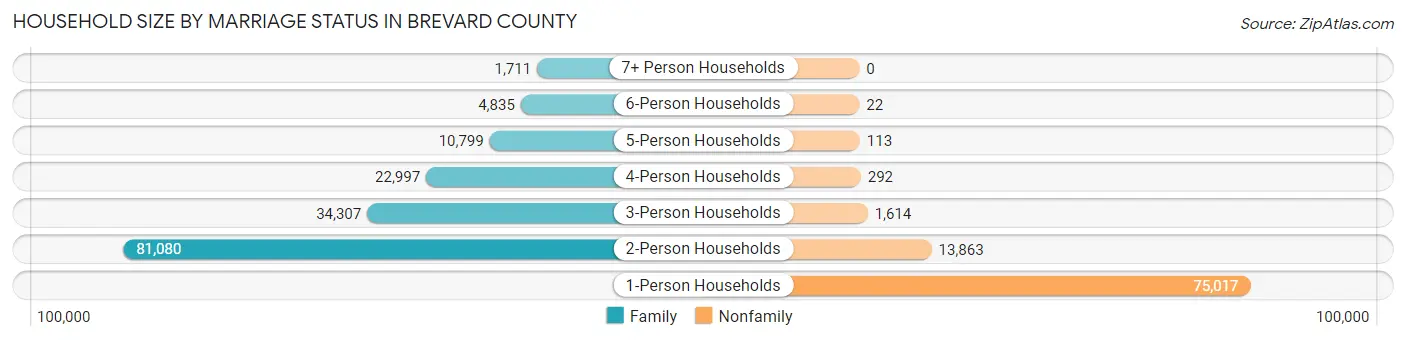
| Household Size | Family Households | Nonfamily Households |
| 1-Person Households | - | 75,017 (30.4%) |
| 2-Person Households | 81,080 (32.9%) | 13,863 (5.6%) |
| 3-Person Households | 34,307 (13.9%) | 1,614 (0.6%) |
| 4-Person Households | 22,997 (9.3%) | 292 (0.1%) |
| 5-Person Households | 10,799 (4.4%) | 113 (0.1%) |
| 6-Person Households | 4,835 (2.0%) | 22 (0.0%) |
| 7+ Person Households | 1,711 (0.7%) | 0 (0.0%) |
| Total | 155,729 (63.1%) | 90,921 (36.9%) |
Female Fertility in Brevard County
Fertility by Age in Brevard County
Average fertility rate in Brevard County is 52.0 births per 1,000 women. Women in the age bracket of 20 to 34 years have the highest fertility rate with 89.0 births per 1,000 women. Women in the age bracket of 20 to 34 years acount for 69.3% of all women with births.
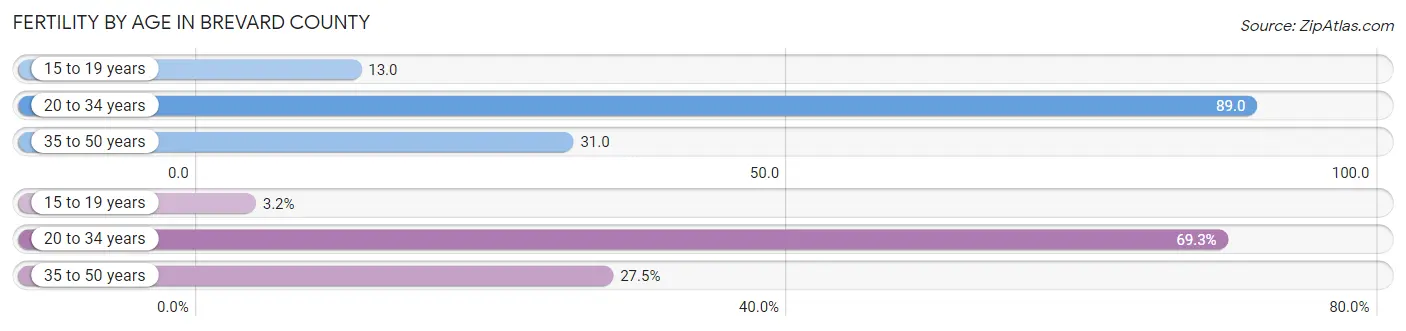
| Age Bracket | Women with Births | Births / 1,000 Women |
| 15 to 19 years | 202 (3.2%) | 13.0 |
| 20 to 34 years | 4,311 (69.3%) | 89.0 |
| 35 to 50 years | 1,712 (27.5%) | 31.0 |
| Total | 6,225 (100.0%) | 52.0 |
Fertility by Age by Marriage Status in Brevard County
62.4% of women with births (6,225) in Brevard County are married. The highest percentage of unmarried women with births falls into 15 to 19 years age bracket with 84.7% of them unmarried at the time of birth, while the lowest percentage of unmarried women with births belong to 35 to 50 years age bracket with 15.7% of them unmarried.
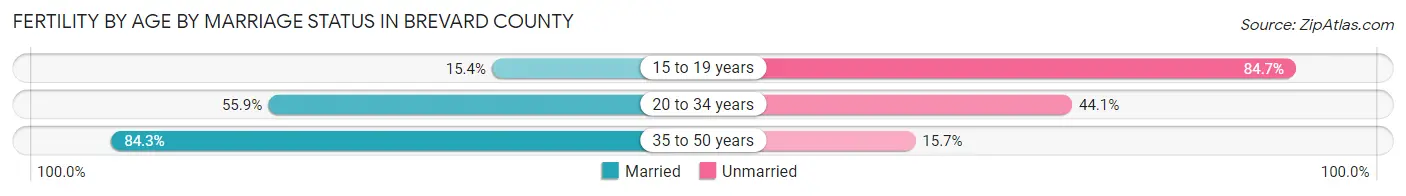
| Age Bracket | Married | Unmarried |
| 15 to 19 years | 31 (15.3%) | 171 (84.7%) |
| 20 to 34 years | 2,410 (55.9%) | 1,901 (44.1%) |
| 35 to 50 years | 1,443 (84.3%) | 269 (15.7%) |
| Total | 3,884 (62.4%) | 2,341 (37.6%) |
Fertility by Education in Brevard County
Average fertility rate in Brevard County is 52.0 births per 1,000 women. Women with the education attainment of graduate degree have the highest fertility rate of 76.0 births per 1,000 women, while women with the education attainment of less than high school have the lowest fertility at 16.0 births per 1,000 women. Women with the education attainment of college or associate's degree represent 34.1% of all women with births.
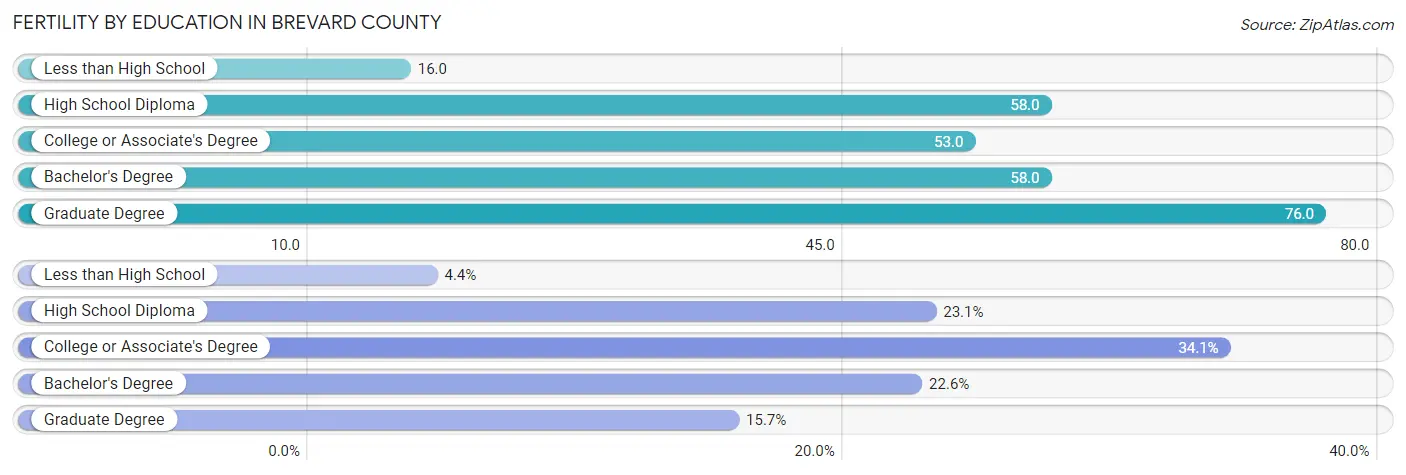
| Educational Attainment | Women with Births | Births / 1,000 Women |
| Less than High School | 276 (4.4%) | 16.0 |
| High School Diploma | 1,439 (23.1%) | 58.0 |
| College or Associate's Degree | 2,125 (34.1%) | 53.0 |
| Bachelor's Degree | 1,406 (22.6%) | 58.0 |
| Graduate Degree | 979 (15.7%) | 76.0 |
| Total | 6,225 (100.0%) | 52.0 |
Fertility by Education by Marriage Status in Brevard County
37.6% of women with births in Brevard County are unmarried. Women with the educational attainment of graduate degree are most likely to be married with 84.8% of them married at childbirth, while women with the educational attainment of high school diploma are least likely to be married with 66.1% of them unmarried at childbirth.
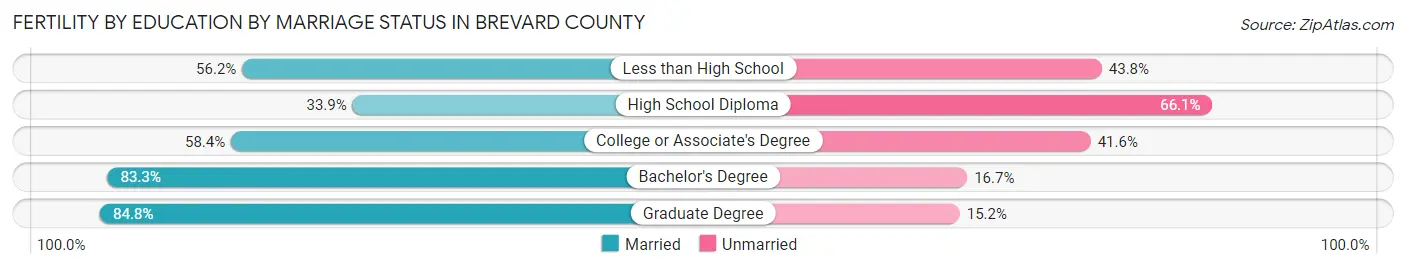
| Educational Attainment | Married | Unmarried |
| Less than High School | 155 (56.2%) | 121 (43.8%) |
| High School Diploma | 488 (33.9%) | 951 (66.1%) |
| College or Associate's Degree | 1,241 (58.4%) | 884 (41.6%) |
| Bachelor's Degree | 1,171 (83.3%) | 235 (16.7%) |
| Graduate Degree | 830 (84.8%) | 149 (15.2%) |
| Total | 3,884 (62.4%) | 2,341 (37.6%) |
Employment Characteristics in Brevard County
Employment by Class of Employer in Brevard County
Among the 269,483 employed individuals in Brevard County, private company employees (185,138 | 68.7%), not-for-profit organizations (19,391 | 7.2%), and local government employees (18,566 | 6.9%) make up the most common classes of employment.
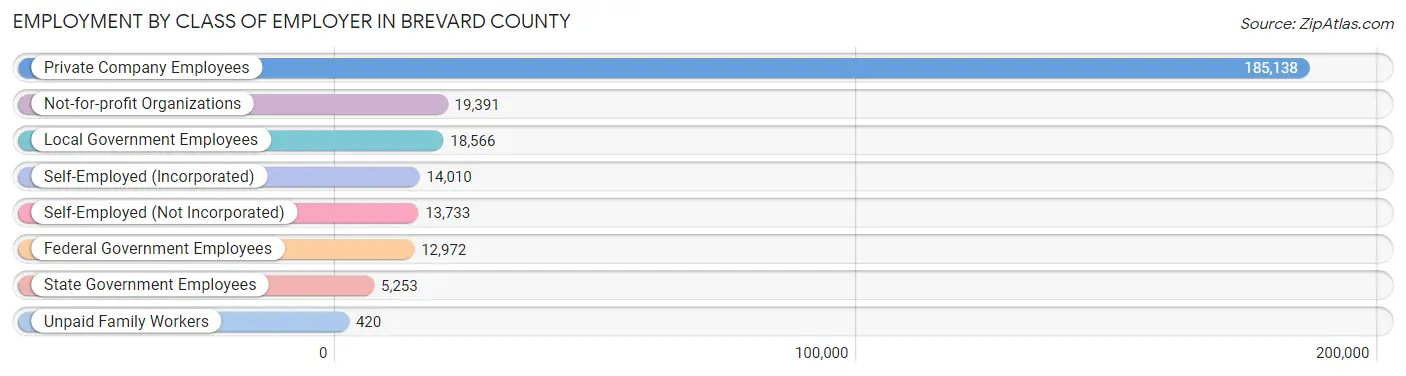
| Employer Class | # Employees | % Employees |
| Private Company Employees | 185,138 | 68.7% |
| Self-Employed (Incorporated) | 14,010 | 5.2% |
| Self-Employed (Not Incorporated) | 13,733 | 5.1% |
| Not-for-profit Organizations | 19,391 | 7.2% |
| Local Government Employees | 18,566 | 6.9% |
| State Government Employees | 5,253 | 1.9% |
| Federal Government Employees | 12,972 | 4.8% |
| Unpaid Family Workers | 420 | 0.2% |
| Total | 269,483 | 100.0% |
Employment Status by Age in Brevard County
According to the labor force statistics for Brevard County, out of the total population over 16 years of age (514,152), 56.2% or 288,953 individuals are in the labor force, with 4.9% or 14,159 of them unemployed. The age group with the highest labor force participation rate is 25 to 29 years, with 83.5% or 28,676 individuals in the labor force. Within the labor force, the 16 to 19 years age range has the highest percentage of unemployed individuals, with 14.7% or 1,516 of them being unemployed.
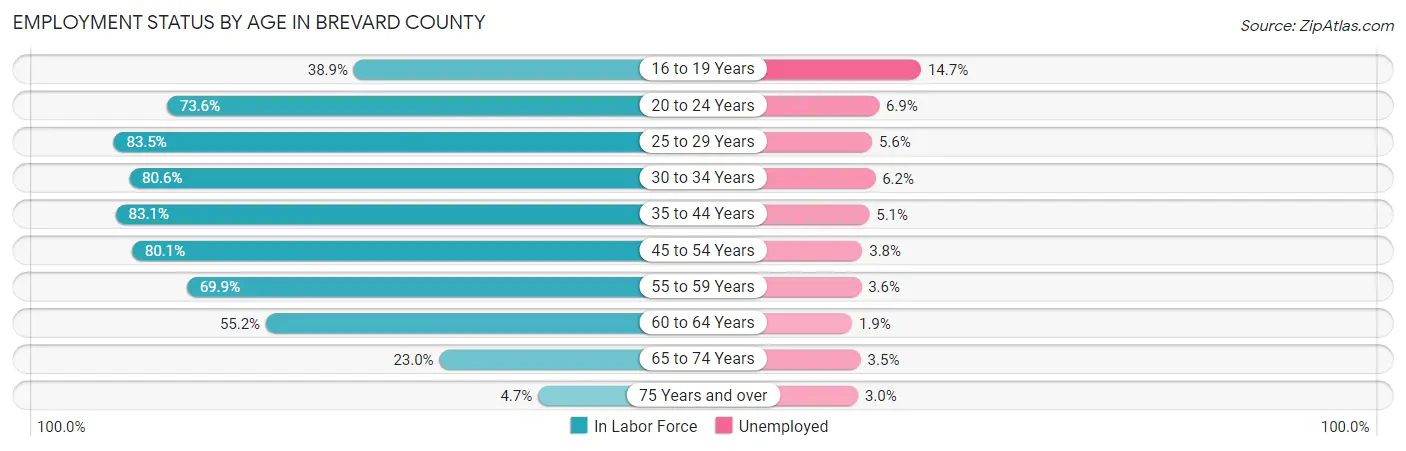
| Age Bracket | In Labor Force | Unemployed |
| 16 to 19 Years | 10,314 (38.9%) | 1,516 (14.7%) |
| 20 to 24 Years | 23,560 (73.6%) | 1,626 (6.9%) |
| 25 to 29 Years | 28,676 (83.5%) | 1,606 (5.6%) |
| 30 to 34 Years | 27,986 (80.6%) | 1,735 (6.2%) |
| 35 to 44 Years | 55,397 (83.1%) | 2,825 (5.1%) |
| 45 to 54 Years | 59,091 (80.1%) | 2,245 (3.8%) |
| 55 to 59 Years | 34,389 (69.9%) | 1,238 (3.6%) |
| 60 to 64 Years | 27,732 (55.2%) | 527 (1.9%) |
| 65 to 74 Years | 18,559 (23.0%) | 650 (3.5%) |
| 75 Years and over | 3,102 (4.7%) | 93 (3.0%) |
| Total | 288,953 (56.2%) | 14,159 (4.9%) |
Employment Status by Educational Attainment in Brevard County
According to labor force statistics for Brevard County, 75.5% of individuals (233,245) out of the total population between 25 and 64 years of age (308,934) are in the labor force, with 4.3% or 10,030 of them being unemployed. The group with the highest labor force participation rate are those with the educational attainment of bachelor's degree or higher, with 81.8% or 86,995 individuals in the labor force. Within the labor force, individuals with less than high school education have the highest percentage of unemployment, with 7.3% or 829 of them being unemployed.
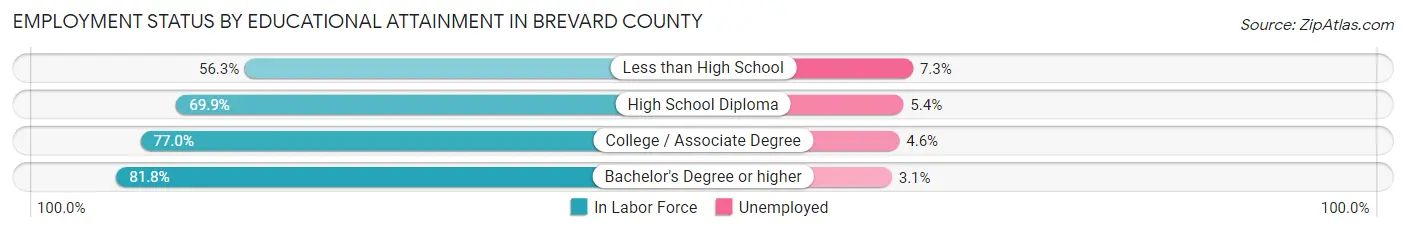
| Educational Attainment | In Labor Force | Unemployed |
| Less than High School | 11,360 (56.3%) | 1,473 (7.3%) |
| High School Diploma | 53,648 (69.9%) | 4,144 (5.4%) |
| College / Associate Degree | 81,356 (77.0%) | 4,860 (4.6%) |
| Bachelor's Degree or higher | 86,995 (81.8%) | 3,297 (3.1%) |
| Total | 233,245 (75.5%) | 13,284 (4.3%) |
Employment Occupations by Sex in Brevard County
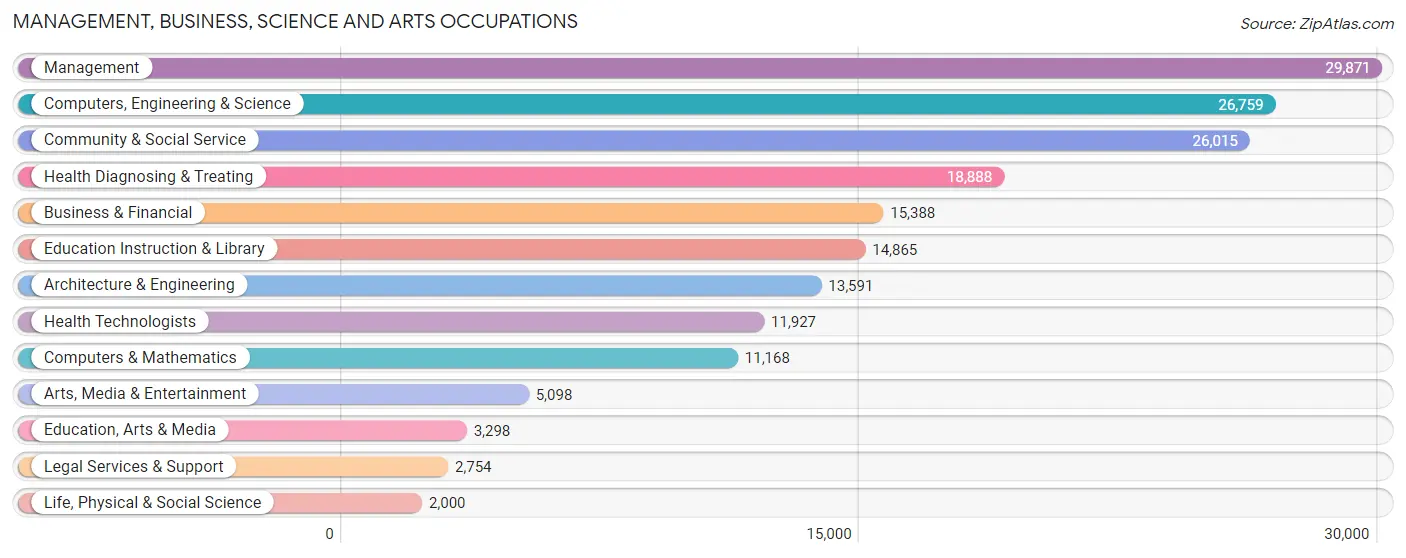
Management, Business, Science and Arts Occupations
The most common Management, Business, Science and Arts occupations in Brevard County are Management (29,871 | 11.0%), Computers, Engineering & Science (26,759 | 9.8%), Community & Social Service (26,015 | 9.6%), Health Diagnosing & Treating (18,888 | 6.9%), and Business & Financial (15,388 | 5.7%).
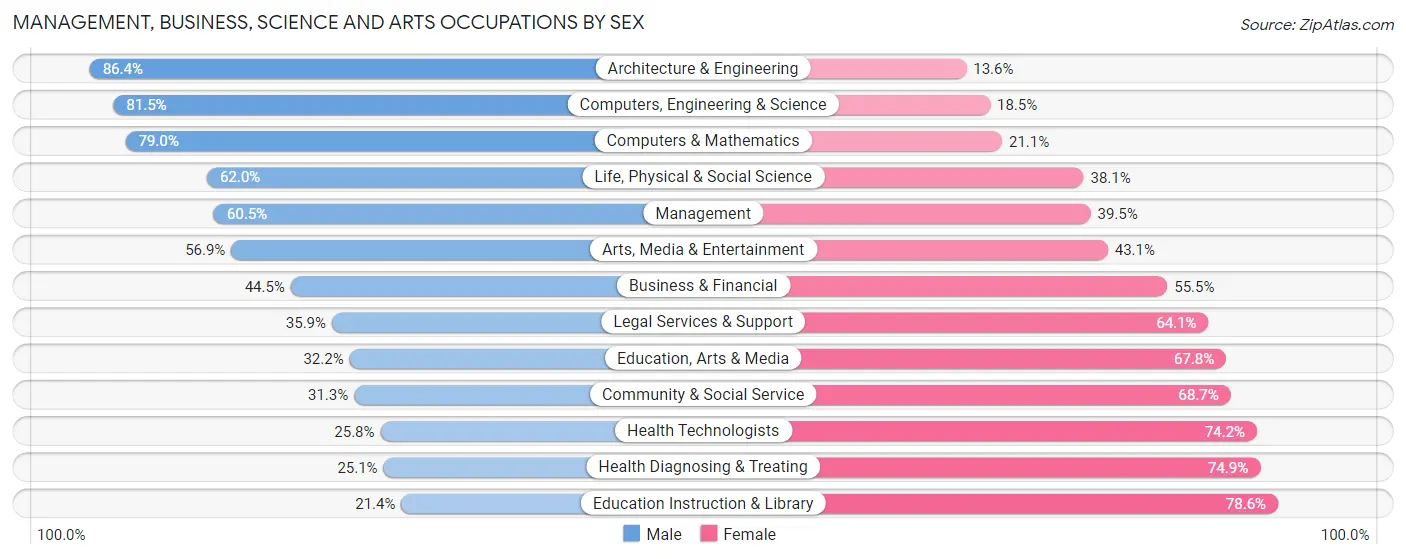
Management, Business, Science and Arts Occupations by Sex
Within the Management, Business, Science and Arts occupations in Brevard County, the most male-oriented occupations are Architecture & Engineering (86.4%), Computers, Engineering & Science (81.5%), and Computers & Mathematics (78.9%), while the most female-oriented occupations are Education Instruction & Library (78.6%), Health Diagnosing & Treating (74.9%), and Health Technologists (74.2%).
| Occupation | Male | Female |
| Management | 18,073 (60.5%) | 11,798 (39.5%) |
| Business & Financial | 6,846 (44.5%) | 8,542 (55.5%) |
| Computers, Engineering & Science | 21,800 (81.5%) | 4,959 (18.5%) |
| Computers & Mathematics | 8,817 (78.9%) | 2,351 (21.0%) |
| Architecture & Engineering | 11,744 (86.4%) | 1,847 (13.6%) |
| Life, Physical & Social Science | 1,239 (62.0%) | 761 (38.1%) |
| Community & Social Service | 8,137 (31.3%) | 17,878 (68.7%) |
| Education, Arts & Media | 1,063 (32.2%) | 2,235 (67.8%) |
| Legal Services & Support | 989 (35.9%) | 1,765 (64.1%) |
| Education Instruction & Library | 3,184 (21.4%) | 11,681 (78.6%) |
| Arts, Media & Entertainment | 2,901 (56.9%) | 2,197 (43.1%) |
| Health Diagnosing & Treating | 4,748 (25.1%) | 14,140 (74.9%) |
| Health Technologists | 3,076 (25.8%) | 8,851 (74.2%) |
| Total (Category) | 59,604 (51.0%) | 57,317 (49.0%) |
| Total (Overall) | 145,415 (53.4%) | 127,036 (46.6%) |
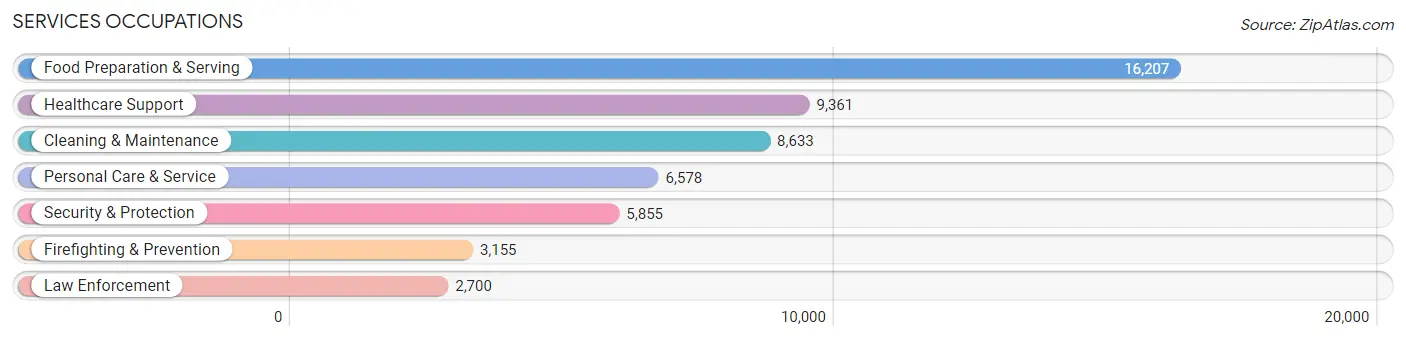
Services Occupations
The most common Services occupations in Brevard County are Food Preparation & Serving (16,207 | 5.9%), Healthcare Support (9,361 | 3.4%), Cleaning & Maintenance (8,633 | 3.2%), Personal Care & Service (6,578 | 2.4%), and Security & Protection (5,855 | 2.1%).
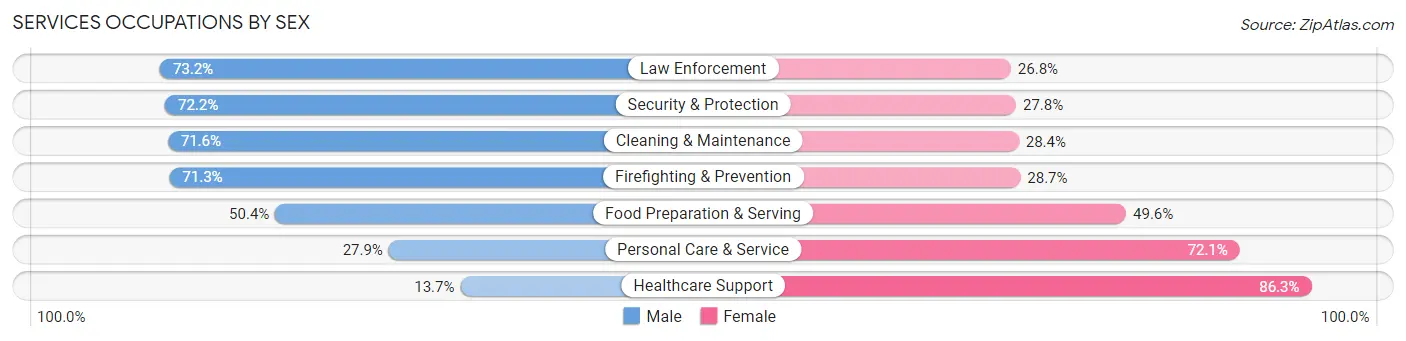
Services Occupations by Sex
Within the Services occupations in Brevard County, the most male-oriented occupations are Law Enforcement (73.2%), Security & Protection (72.2%), and Cleaning & Maintenance (71.6%), while the most female-oriented occupations are Healthcare Support (86.3%), Personal Care & Service (72.1%), and Food Preparation & Serving (49.6%).
| Occupation | Male | Female |
| Healthcare Support | 1,284 (13.7%) | 8,077 (86.3%) |
| Security & Protection | 4,226 (72.2%) | 1,629 (27.8%) |
| Firefighting & Prevention | 2,250 (71.3%) | 905 (28.7%) |
| Law Enforcement | 1,976 (73.2%) | 724 (26.8%) |
| Food Preparation & Serving | 8,165 (50.4%) | 8,042 (49.6%) |
| Cleaning & Maintenance | 6,185 (71.6%) | 2,448 (28.4%) |
| Personal Care & Service | 1,835 (27.9%) | 4,743 (72.1%) |
| Total (Category) | 21,695 (46.5%) | 24,939 (53.5%) |
| Total (Overall) | 145,415 (53.4%) | 127,036 (46.6%) |
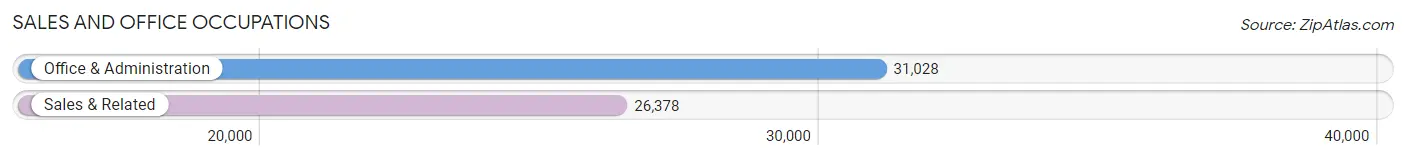
Sales and Office Occupations
The most common Sales and Office occupations in Brevard County are Office & Administration (31,028 | 11.4%), and Sales & Related (26,378 | 9.7%).
Sales and Office Occupations by Sex
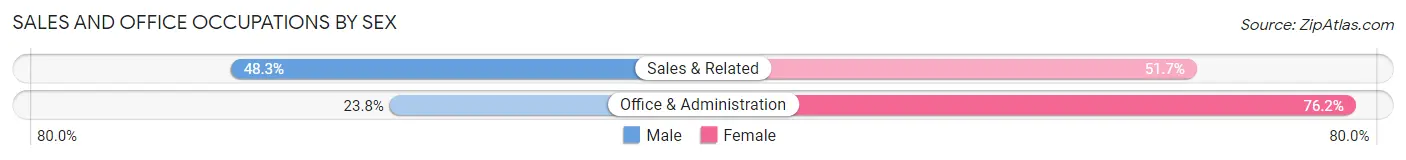
| Occupation | Male | Female |
| Sales & Related | 12,738 (48.3%) | 13,640 (51.7%) |
| Office & Administration | 7,397 (23.8%) | 23,631 (76.2%) |
| Total (Category) | 20,135 (35.1%) | 37,271 (64.9%) |
| Total (Overall) | 145,415 (53.4%) | 127,036 (46.6%) |
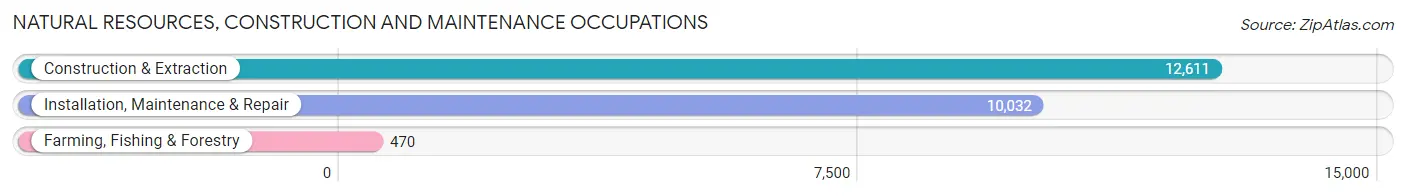
Natural Resources, Construction and Maintenance Occupations
The most common Natural Resources, Construction and Maintenance occupations in Brevard County are Construction & Extraction (12,611 | 4.6%), Installation, Maintenance & Repair (10,032 | 3.7%), and Farming, Fishing & Forestry (470 | 0.2%).
Natural Resources, Construction and Maintenance Occupations by Sex
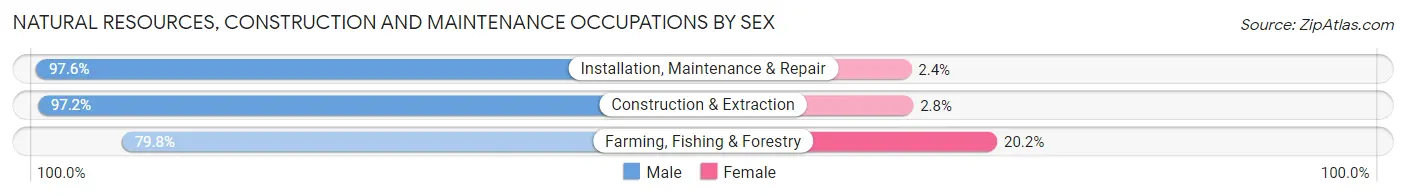
| Occupation | Male | Female |
| Farming, Fishing & Forestry | 375 (79.8%) | 95 (20.2%) |
| Construction & Extraction | 12,262 (97.2%) | 349 (2.8%) |
| Installation, Maintenance & Repair | 9,793 (97.6%) | 239 (2.4%) |
| Total (Category) | 22,430 (97.0%) | 683 (3.0%) |
| Total (Overall) | 145,415 (53.4%) | 127,036 (46.6%) |
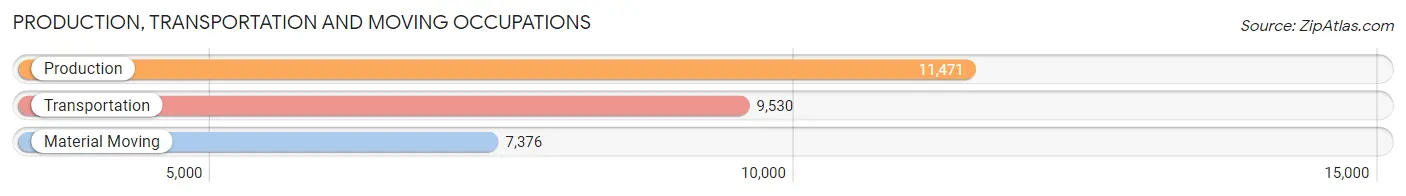
Production, Transportation and Moving Occupations
The most common Production, Transportation and Moving occupations in Brevard County are Production (11,471 | 4.2%), Transportation (9,530 | 3.5%), and Material Moving (7,376 | 2.7%).
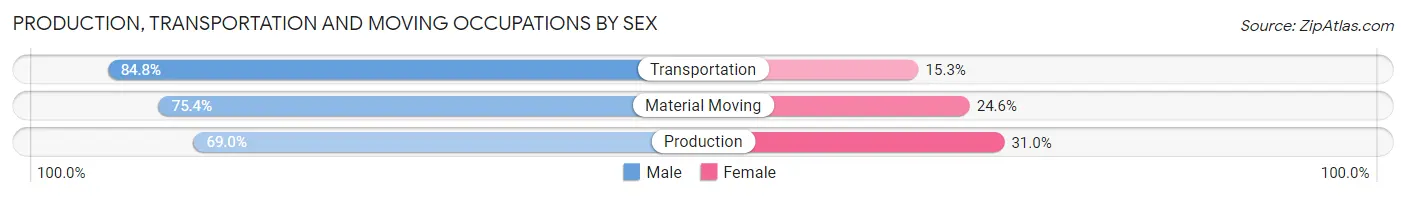
Production, Transportation and Moving Occupations by Sex
| Occupation | Male | Female |
| Production | 7,915 (69.0%) | 3,556 (31.0%) |
| Transportation | 8,077 (84.8%) | 1,453 (15.2%) |
| Material Moving | 5,559 (75.4%) | 1,817 (24.6%) |
| Total (Category) | 21,551 (75.9%) | 6,826 (24.0%) |
| Total (Overall) | 145,415 (53.4%) | 127,036 (46.6%) |
Employment Industries by Sex in Brevard County
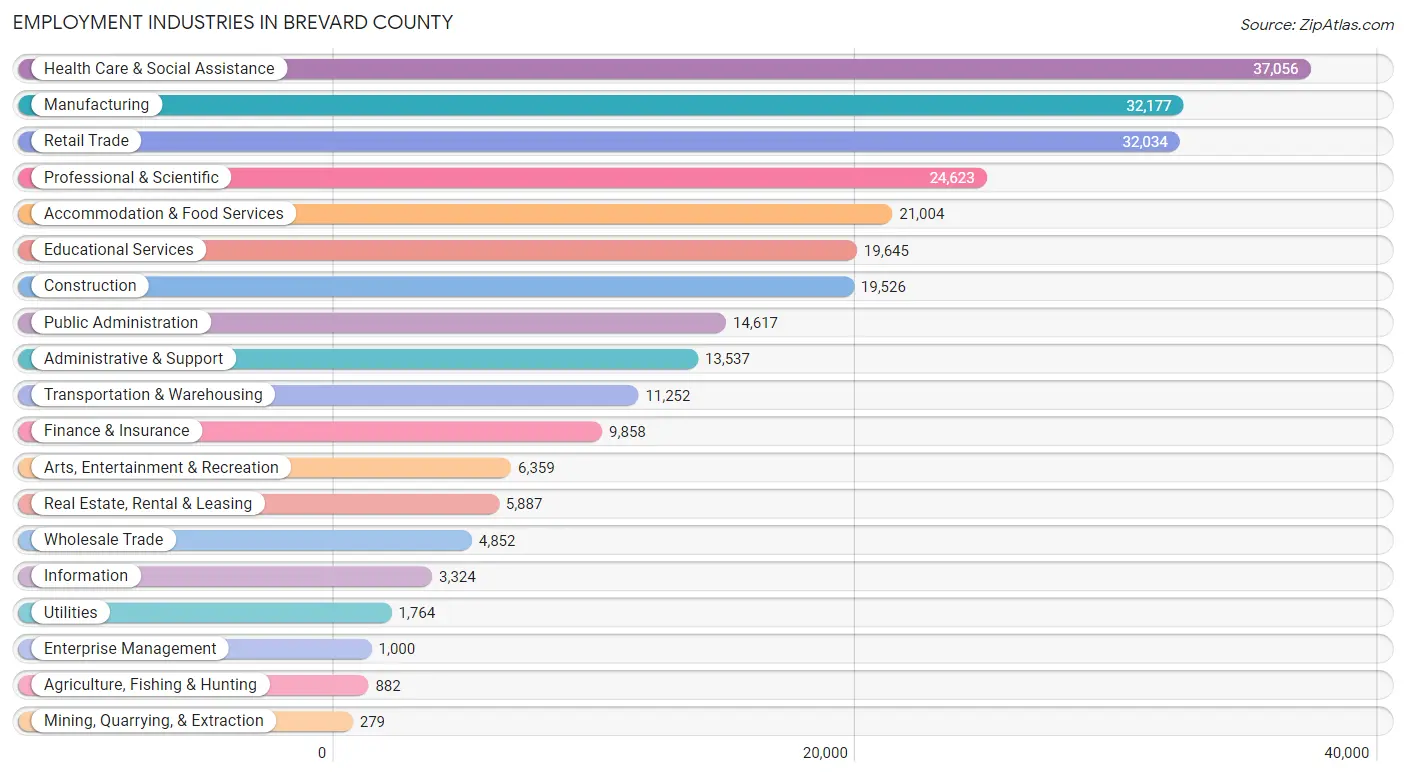
Employment Industries in Brevard County
The major employment industries in Brevard County include Health Care & Social Assistance (37,056 | 13.6%), Manufacturing (32,177 | 11.8%), Retail Trade (32,034 | 11.8%), Professional & Scientific (24,623 | 9.0%), and Accommodation & Food Services (21,004 | 7.7%).
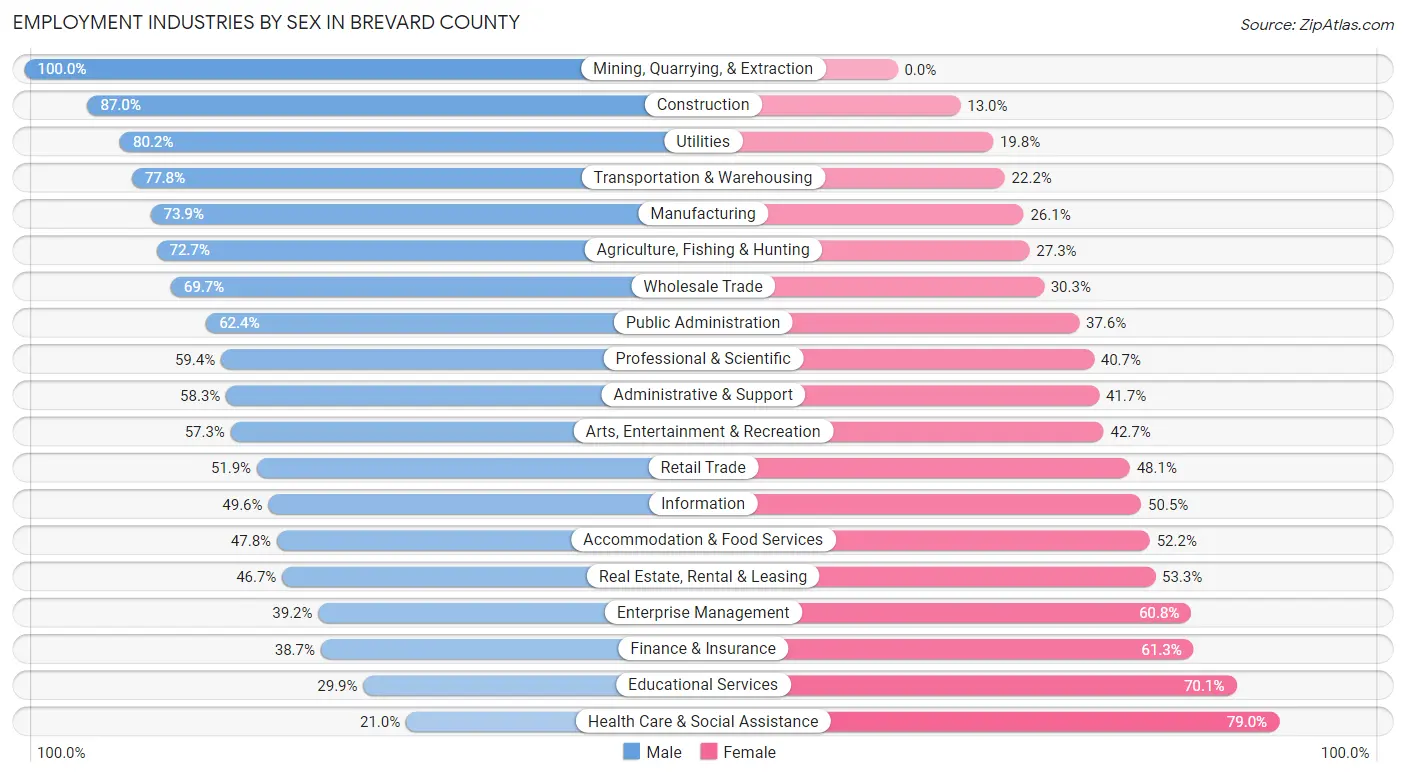
Employment Industries by Sex in Brevard County
The Brevard County industries that see more men than women are Mining, Quarrying, & Extraction (100.0%), Construction (87.0%), and Utilities (80.2%), whereas the industries that tend to have a higher number of women are Health Care & Social Assistance (79.0%), Educational Services (70.1%), and Finance & Insurance (61.3%).
| Industry | Male | Female |
| Agriculture, Fishing & Hunting | 641 (72.7%) | 241 (27.3%) |
| Mining, Quarrying, & Extraction | 279 (100.0%) | 0 (0.0%) |
| Construction | 16,982 (87.0%) | 2,544 (13.0%) |
| Manufacturing | 23,782 (73.9%) | 8,395 (26.1%) |
| Wholesale Trade | 3,383 (69.7%) | 1,469 (30.3%) |
| Retail Trade | 16,628 (51.9%) | 15,406 (48.1%) |
| Transportation & Warehousing | 8,754 (77.8%) | 2,498 (22.2%) |
| Utilities | 1,415 (80.2%) | 349 (19.8%) |
| Information | 1,647 (49.5%) | 1,677 (50.4%) |
| Finance & Insurance | 3,815 (38.7%) | 6,043 (61.3%) |
| Real Estate, Rental & Leasing | 2,748 (46.7%) | 3,139 (53.3%) |
| Professional & Scientific | 14,613 (59.4%) | 10,010 (40.6%) |
| Enterprise Management | 392 (39.2%) | 608 (60.8%) |
| Administrative & Support | 7,889 (58.3%) | 5,648 (41.7%) |
| Educational Services | 5,870 (29.9%) | 13,775 (70.1%) |
| Health Care & Social Assistance | 7,796 (21.0%) | 29,260 (79.0%) |
| Arts, Entertainment & Recreation | 3,646 (57.3%) | 2,713 (42.7%) |
| Accommodation & Food Services | 10,035 (47.8%) | 10,969 (52.2%) |
| Public Administration | 9,121 (62.4%) | 5,496 (37.6%) |
| Total | 145,415 (53.4%) | 127,036 (46.6%) |
Education in Brevard County
School Enrollment in Brevard County
The most common levels of schooling among the 123,723 students in Brevard County are middle school (27,502 | 22.2%), high school (26,530 | 21.4%), and college / undergraduate (26,270 | 21.2%).
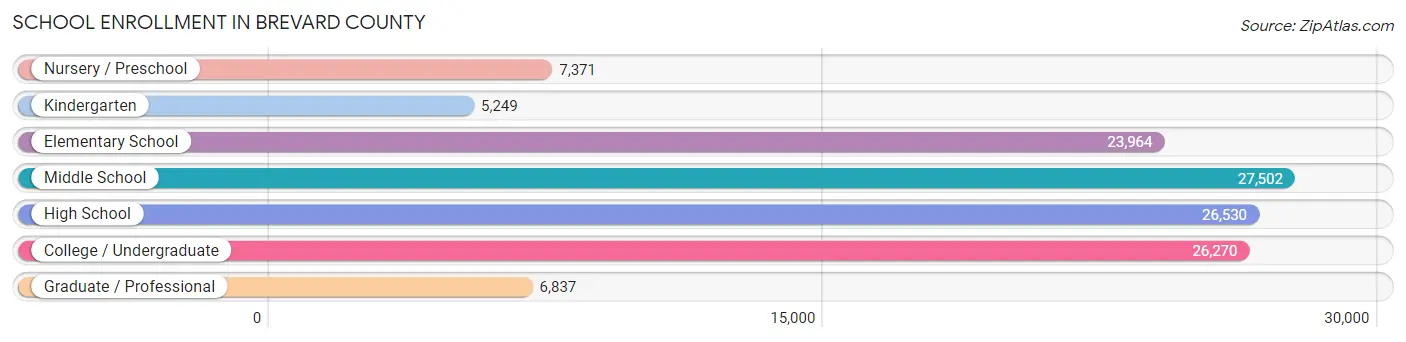
| School Level | # Students | % Students |
| Nursery / Preschool | 7,371 | 6.0% |
| Kindergarten | 5,249 | 4.2% |
| Elementary School | 23,964 | 19.4% |
| Middle School | 27,502 | 22.2% |
| High School | 26,530 | 21.4% |
| College / Undergraduate | 26,270 | 21.2% |
| Graduate / Professional | 6,837 | 5.5% |
| Total | 123,723 | 100.0% |
School Enrollment by Age by Funding Source in Brevard County
Out of a total of 123,723 students who are enrolled in schools in Brevard County, 27,343 (22.1%) attend a private institution, while the remaining 96,380 (77.9%) are enrolled in public schools. The age group of 35 years and over has the highest likelihood of being enrolled in private schools, with 3,946 (41.5% in the age bracket) enrolled. Conversely, the age group of 15 to 17 year olds has the lowest likelihood of being enrolled in a private school, with 16,972 (86.8% in the age bracket) attending a public institution.
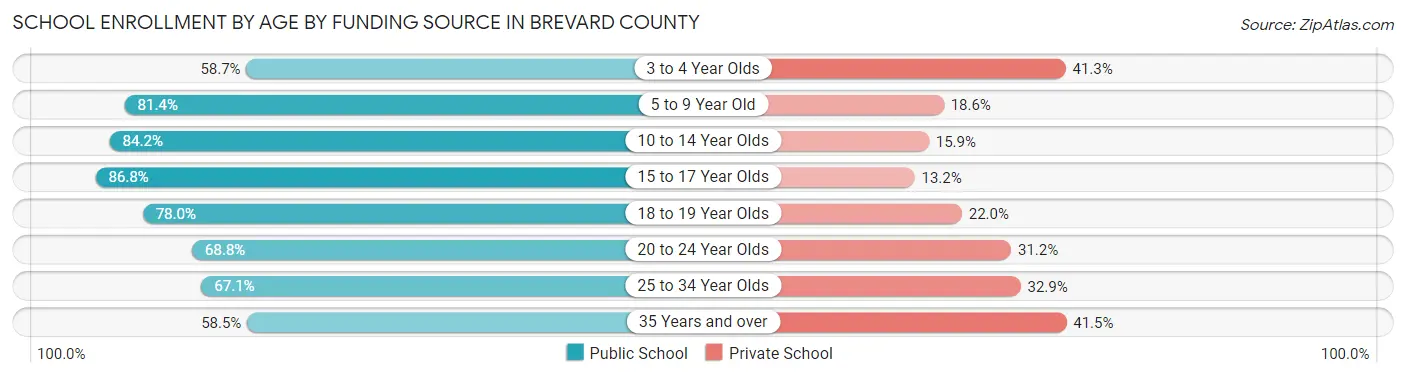
| Age Bracket | Public School | Private School |
| 3 to 4 Year Olds | 3,046 (58.7%) | 2,145 (41.3%) |
| 5 to 9 Year Old | 22,600 (81.4%) | 5,175 (18.6%) |
| 10 to 14 Year Olds | 27,875 (84.2%) | 5,250 (15.9%) |
| 15 to 17 Year Olds | 16,972 (86.8%) | 2,580 (13.2%) |
| 18 to 19 Year Olds | 7,011 (78.0%) | 1,977 (22.0%) |
| 20 to 24 Year Olds | 8,346 (68.8%) | 3,780 (31.2%) |
| 25 to 34 Year Olds | 4,995 (67.1%) | 2,454 (32.9%) |
| 35 Years and over | 5,571 (58.5%) | 3,946 (41.5%) |
| Total | 96,380 (77.9%) | 27,343 (22.1%) |
Educational Attainment by Field of Study in Brevard County
Business (32,794 | 20.5%), engineering (23,563 | 14.7%), education (18,280 | 11.4%), science & technology (17,842 | 11.1%), and arts & humanities (10,547 | 6.6%) are the most common fields of study among 160,111 individuals in Brevard County who have obtained a bachelor's degree or higher.
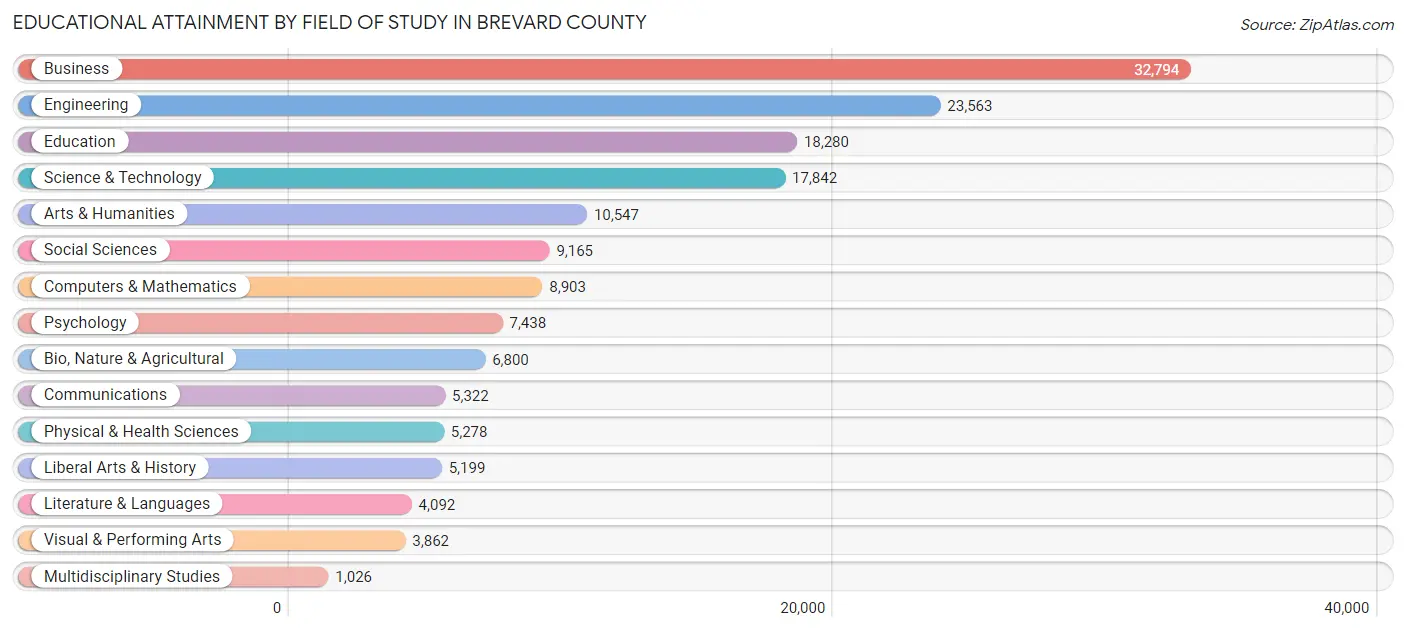
| Field of Study | # Graduates | % Graduates |
| Computers & Mathematics | 8,903 | 5.6% |
| Bio, Nature & Agricultural | 6,800 | 4.3% |
| Physical & Health Sciences | 5,278 | 3.3% |
| Psychology | 7,438 | 4.6% |
| Social Sciences | 9,165 | 5.7% |
| Engineering | 23,563 | 14.7% |
| Multidisciplinary Studies | 1,026 | 0.6% |
| Science & Technology | 17,842 | 11.1% |
| Business | 32,794 | 20.5% |
| Education | 18,280 | 11.4% |
| Literature & Languages | 4,092 | 2.6% |
| Liberal Arts & History | 5,199 | 3.3% |
| Visual & Performing Arts | 3,862 | 2.4% |
| Communications | 5,322 | 3.3% |
| Arts & Humanities | 10,547 | 6.6% |
| Total | 160,111 | 100.0% |
Transportation & Commute in Brevard County
Vehicle Availability by Sex in Brevard County
The most prevalent vehicle ownership categories in Brevard County are males with 2 vehicles (66,305, accounting for 45.8%) and females with 2 vehicles (53,126, making up 53.4%).
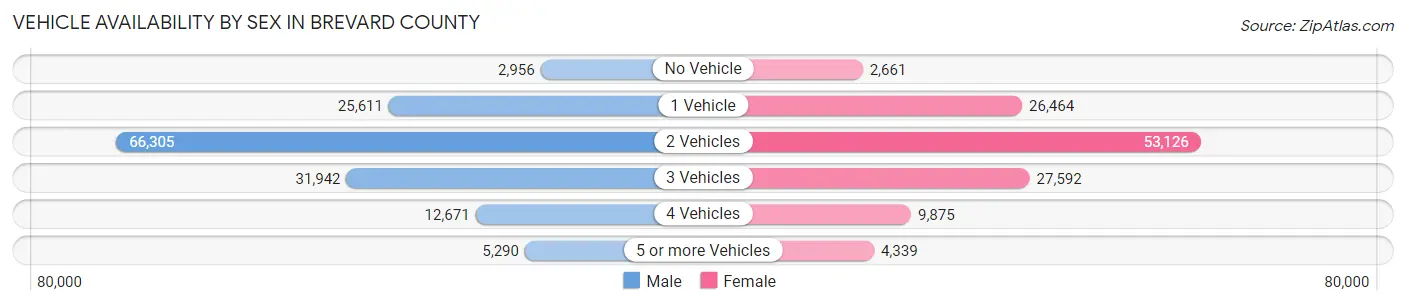
| Vehicles Available | Male | Female |
| No Vehicle | 2,956 (2.0%) | 2,661 (2.1%) |
| 1 Vehicle | 25,611 (17.7%) | 26,464 (21.3%) |
| 2 Vehicles | 66,305 (45.8%) | 53,126 (42.8%) |
| 3 Vehicles | 31,942 (22.1%) | 27,592 (22.2%) |
| 4 Vehicles | 12,671 (8.7%) | 9,875 (8.0%) |
| 5 or more Vehicles | 5,290 (3.6%) | 4,339 (3.5%) |
| Total | 144,775 (100.0%) | 124,057 (100.0%) |
Commute Time in Brevard County
The most frequently occuring commute durations in Brevard County are 15 to 19 minutes (41,304 commuters, 17.3%), 20 to 24 minutes (40,703 commuters, 17.1%), and 30 to 34 minutes (34,679 commuters, 14.5%).
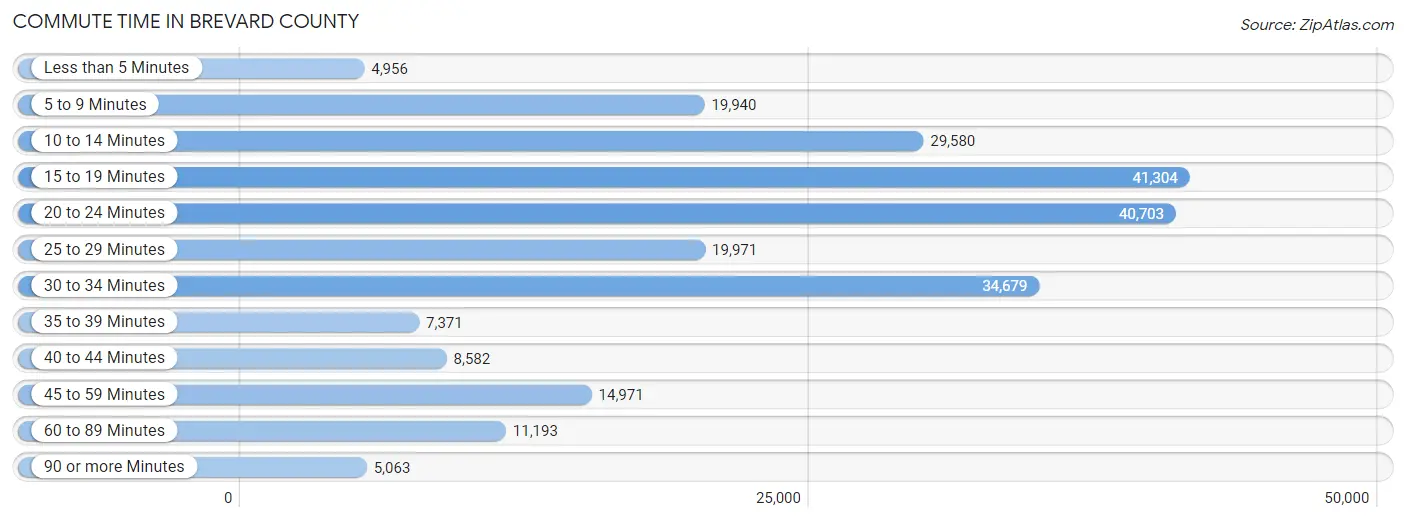
| Commute Time | # Commuters | % Commuters |
| Less than 5 Minutes | 4,956 | 2.1% |
| 5 to 9 Minutes | 19,940 | 8.4% |
| 10 to 14 Minutes | 29,580 | 12.4% |
| 15 to 19 Minutes | 41,304 | 17.3% |
| 20 to 24 Minutes | 40,703 | 17.1% |
| 25 to 29 Minutes | 19,971 | 8.4% |
| 30 to 34 Minutes | 34,679 | 14.5% |
| 35 to 39 Minutes | 7,371 | 3.1% |
| 40 to 44 Minutes | 8,582 | 3.6% |
| 45 to 59 Minutes | 14,971 | 6.3% |
| 60 to 89 Minutes | 11,193 | 4.7% |
| 90 or more Minutes | 5,063 | 2.1% |
Commute Time by Sex in Brevard County
The most common commute times in Brevard County are 15 to 19 minutes (21,140 commuters, 16.3%) for males and 15 to 19 minutes (20,164 commuters, 18.5%) for females.
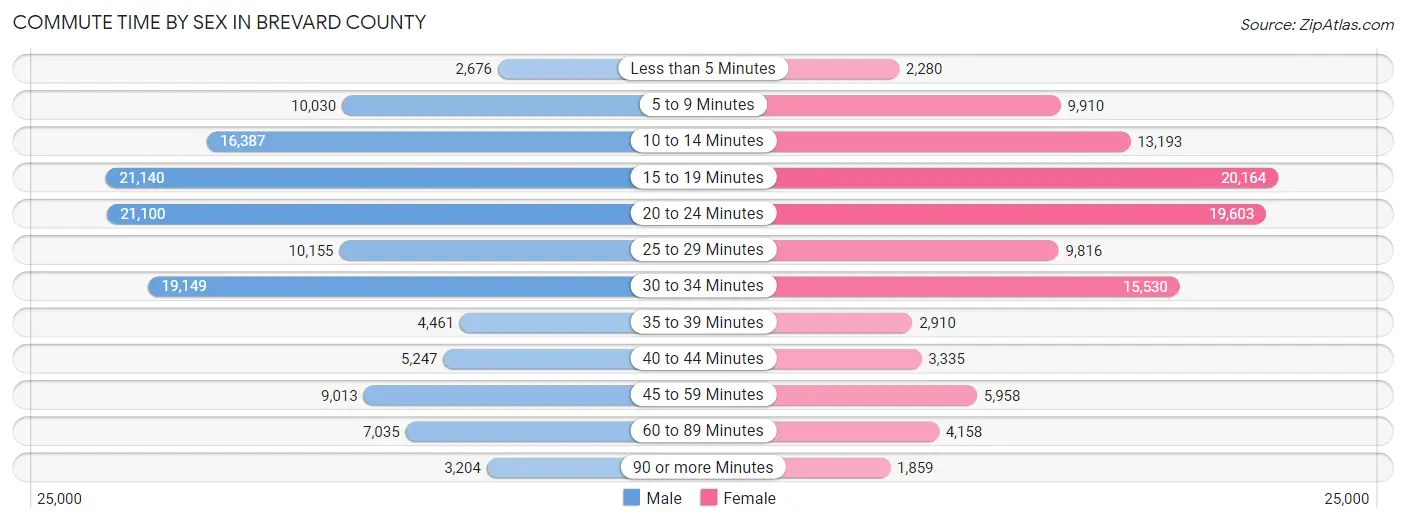
| Commute Time | Male | Female |
| Less than 5 Minutes | 2,676 (2.1%) | 2,280 (2.1%) |
| 5 to 9 Minutes | 10,030 (7.7%) | 9,910 (9.1%) |
| 10 to 14 Minutes | 16,387 (12.6%) | 13,193 (12.1%) |
| 15 to 19 Minutes | 21,140 (16.3%) | 20,164 (18.5%) |
| 20 to 24 Minutes | 21,100 (16.3%) | 19,603 (18.0%) |
| 25 to 29 Minutes | 10,155 (7.8%) | 9,816 (9.0%) |
| 30 to 34 Minutes | 19,149 (14.8%) | 15,530 (14.3%) |
| 35 to 39 Minutes | 4,461 (3.4%) | 2,910 (2.7%) |
| 40 to 44 Minutes | 5,247 (4.1%) | 3,335 (3.1%) |
| 45 to 59 Minutes | 9,013 (7.0%) | 5,958 (5.5%) |
| 60 to 89 Minutes | 7,035 (5.4%) | 4,158 (3.8%) |
| 90 or more Minutes | 3,204 (2.5%) | 1,859 (1.7%) |
Time of Departure to Work by Sex in Brevard County
The most frequent times of departure to work in Brevard County are 7:00 AM to 7:29 AM (20,821, 16.1%) for males and 7:00 AM to 7:29 AM (17,633, 16.2%) for females.
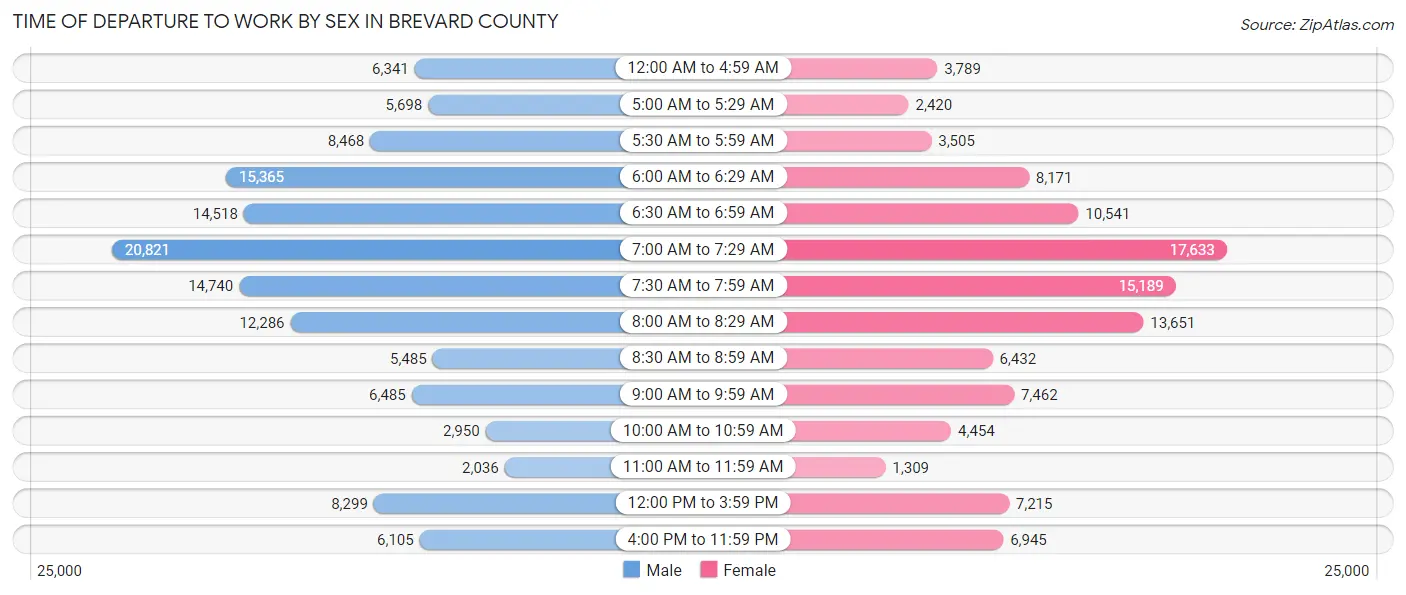
| Time of Departure | Male | Female |
| 12:00 AM to 4:59 AM | 6,341 (4.9%) | 3,789 (3.5%) |
| 5:00 AM to 5:29 AM | 5,698 (4.4%) | 2,420 (2.2%) |
| 5:30 AM to 5:59 AM | 8,468 (6.5%) | 3,505 (3.2%) |
| 6:00 AM to 6:29 AM | 15,365 (11.9%) | 8,171 (7.5%) |
| 6:30 AM to 6:59 AM | 14,518 (11.2%) | 10,541 (9.7%) |
| 7:00 AM to 7:29 AM | 20,821 (16.1%) | 17,633 (16.2%) |
| 7:30 AM to 7:59 AM | 14,740 (11.4%) | 15,189 (14.0%) |
| 8:00 AM to 8:29 AM | 12,286 (9.5%) | 13,651 (12.6%) |
| 8:30 AM to 8:59 AM | 5,485 (4.2%) | 6,432 (5.9%) |
| 9:00 AM to 9:59 AM | 6,485 (5.0%) | 7,462 (6.9%) |
| 10:00 AM to 10:59 AM | 2,950 (2.3%) | 4,454 (4.1%) |
| 11:00 AM to 11:59 AM | 2,036 (1.6%) | 1,309 (1.2%) |
| 12:00 PM to 3:59 PM | 8,299 (6.4%) | 7,215 (6.6%) |
| 4:00 PM to 11:59 PM | 6,105 (4.7%) | 6,945 (6.4%) |
| Total | 129,597 (100.0%) | 108,716 (100.0%) |
Housing Occupancy in Brevard County
Occupancy by Ownership in Brevard County
Of the total 246,650 dwellings in Brevard County, owner-occupied units account for 189,103 (76.7%), while renter-occupied units make up 57,547 (23.3%).
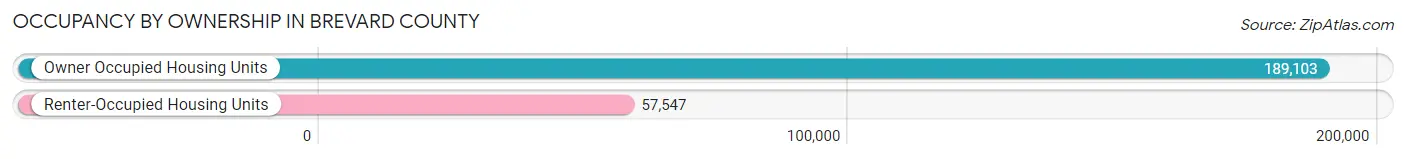
| Occupancy | # Housing Units | % Housing Units |
| Owner Occupied Housing Units | 189,103 | 76.7% |
| Renter-Occupied Housing Units | 57,547 | 23.3% |
| Total Occupied Housing Units | 246,650 | 100.0% |
Occupancy by Household Size in Brevard County
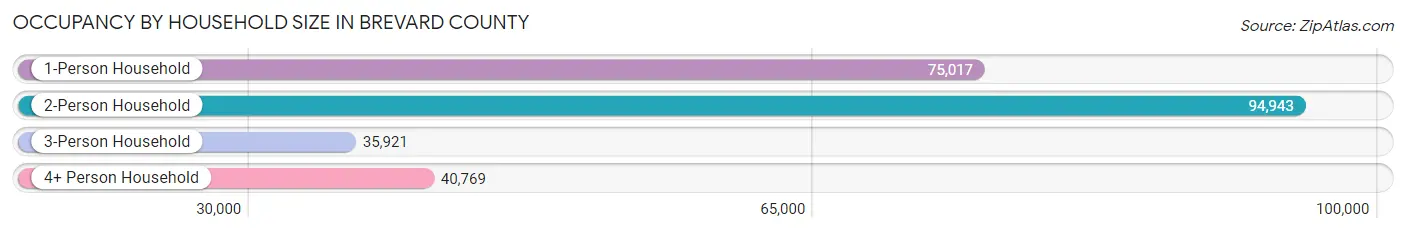
| Household Size | # Housing Units | % Housing Units |
| 1-Person Household | 75,017 | 30.4% |
| 2-Person Household | 94,943 | 38.5% |
| 3-Person Household | 35,921 | 14.6% |
| 4+ Person Household | 40,769 | 16.5% |
| Total Housing Units | 246,650 | 100.0% |
Occupancy by Ownership by Household Size in Brevard County
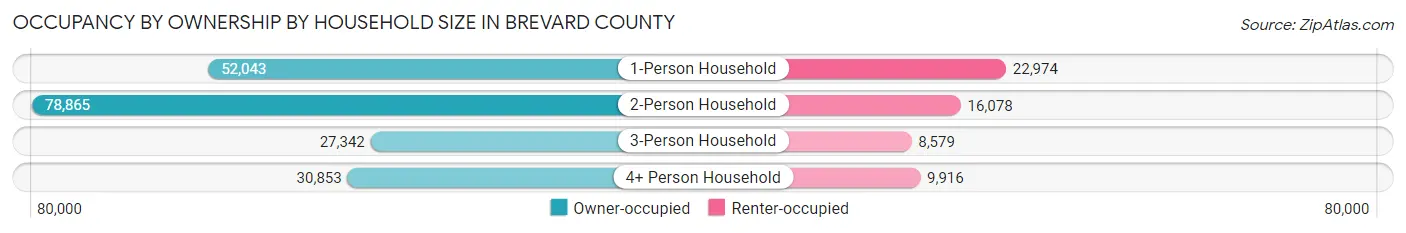
| Household Size | Owner-occupied | Renter-occupied |
| 1-Person Household | 52,043 (69.4%) | 22,974 (30.6%) |
| 2-Person Household | 78,865 (83.1%) | 16,078 (16.9%) |
| 3-Person Household | 27,342 (76.1%) | 8,579 (23.9%) |
| 4+ Person Household | 30,853 (75.7%) | 9,916 (24.3%) |
| Total Housing Units | 189,103 (76.7%) | 57,547 (23.3%) |
Occupancy by Educational Attainment in Brevard County
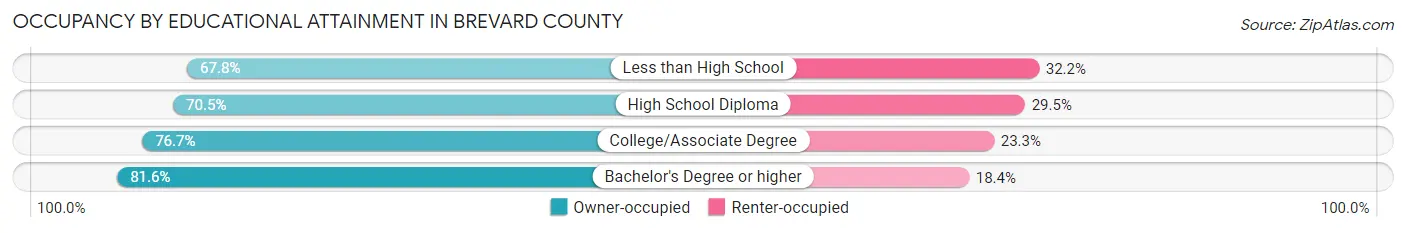
| Household Size | Owner-occupied | Renter-occupied |
| Less than High School | 9,525 (67.8%) | 4,533 (32.2%) |
| High School Diploma | 38,388 (70.5%) | 16,029 (29.5%) |
| College/Associate Degree | 65,852 (76.7%) | 20,026 (23.3%) |
| Bachelor's Degree or higher | 75,338 (81.6%) | 16,959 (18.4%) |
Occupancy by Age of Householder in Brevard County
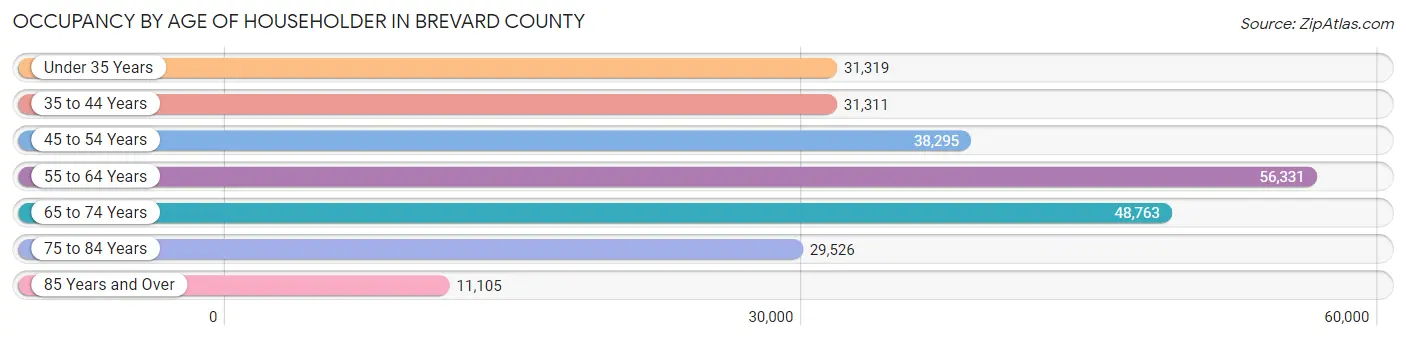
| Age Bracket | # Households | % Households |
| Under 35 Years | 31,319 | 12.7% |
| 35 to 44 Years | 31,311 | 12.7% |
| 45 to 54 Years | 38,295 | 15.5% |
| 55 to 64 Years | 56,331 | 22.8% |
| 65 to 74 Years | 48,763 | 19.8% |
| 75 to 84 Years | 29,526 | 12.0% |
| 85 Years and Over | 11,105 | 4.5% |
| Total | 246,650 | 100.0% |
Housing Finances in Brevard County
Median Income by Occupancy in Brevard County
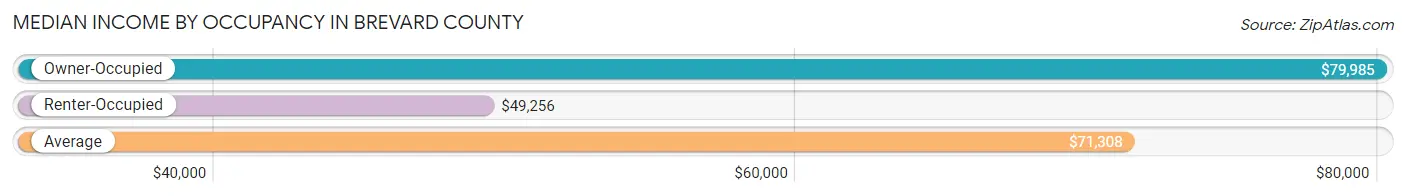
| Occupancy Type | # Households | Median Income |
| Owner-Occupied | 189,103 (76.7%) | $79,985 |
| Renter-Occupied | 57,547 (23.3%) | $49,256 |
| Average | 246,650 (100.0%) | $71,308 |
Occupancy by Householder Income Bracket in Brevard County
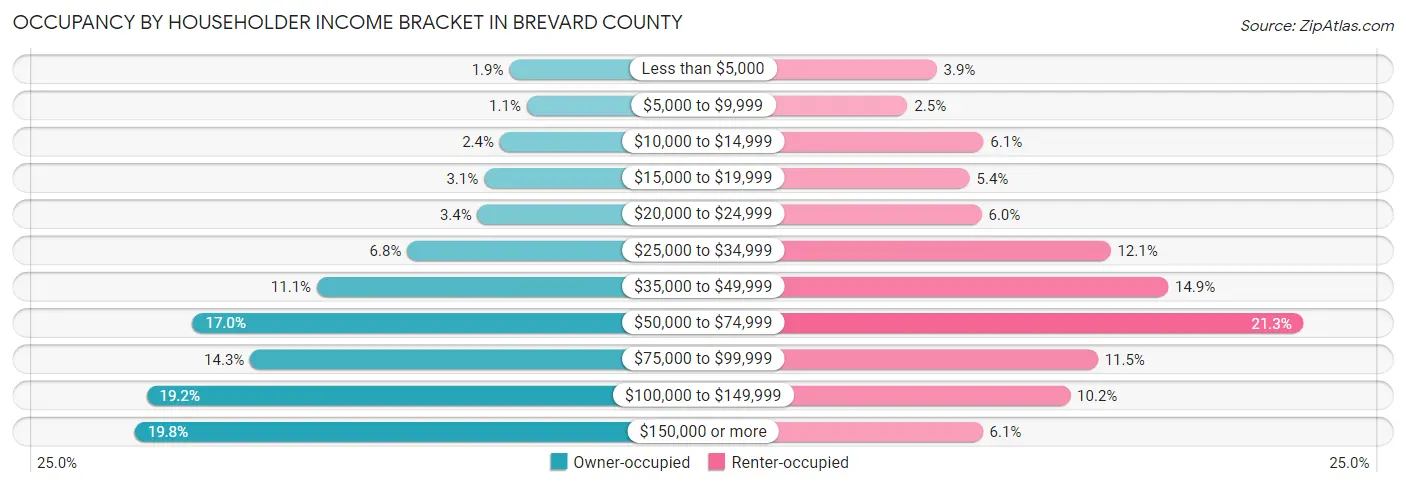
| Income Bracket | Owner-occupied | Renter-occupied |
| Less than $5,000 | 3,626 (1.9%) | 2,224 (3.9%) |
| $5,000 to $9,999 | 2,067 (1.1%) | 1,421 (2.5%) |
| $10,000 to $14,999 | 4,490 (2.4%) | 3,502 (6.1%) |
| $15,000 to $19,999 | 5,909 (3.1%) | 3,124 (5.4%) |
| $20,000 to $24,999 | 6,479 (3.4%) | 3,455 (6.0%) |
| $25,000 to $34,999 | 12,822 (6.8%) | 6,984 (12.1%) |
| $35,000 to $49,999 | 20,956 (11.1%) | 8,563 (14.9%) |
| $50,000 to $74,999 | 32,142 (17.0%) | 12,277 (21.3%) |
| $75,000 to $99,999 | 26,968 (14.3%) | 6,634 (11.5%) |
| $100,000 to $149,999 | 36,290 (19.2%) | 5,883 (10.2%) |
| $150,000 or more | 37,354 (19.8%) | 3,480 (6.0%) |
| Total | 189,103 (100.0%) | 57,547 (100.0%) |
Monthly Housing Cost Tiers in Brevard County
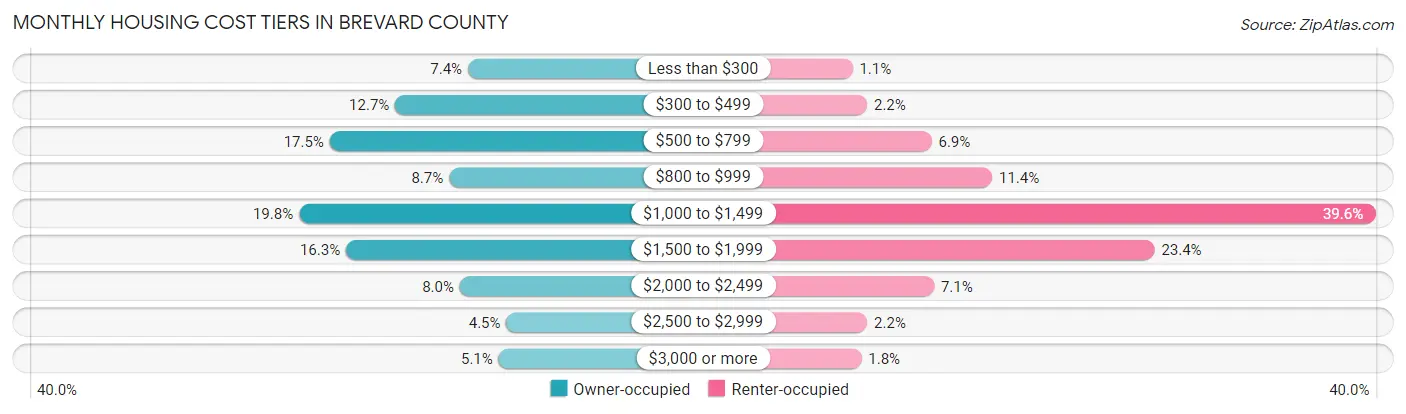
| Monthly Cost | Owner-occupied | Renter-occupied |
| Less than $300 | 13,892 (7.3%) | 637 (1.1%) |
| $300 to $499 | 24,027 (12.7%) | 1,255 (2.2%) |
| $500 to $799 | 33,152 (17.5%) | 3,988 (6.9%) |
| $800 to $999 | 16,520 (8.7%) | 6,557 (11.4%) |
| $1,000 to $1,499 | 37,432 (19.8%) | 22,781 (39.6%) |
| $1,500 to $1,999 | 30,884 (16.3%) | 13,439 (23.4%) |
| $2,000 to $2,499 | 15,034 (8.0%) | 4,090 (7.1%) |
| $2,500 to $2,999 | 8,542 (4.5%) | 1,260 (2.2%) |
| $3,000 or more | 9,620 (5.1%) | 1,012 (1.8%) |
| Total | 189,103 (100.0%) | 57,547 (100.0%) |
Physical Housing Characteristics in Brevard County
Housing Structures in Brevard County
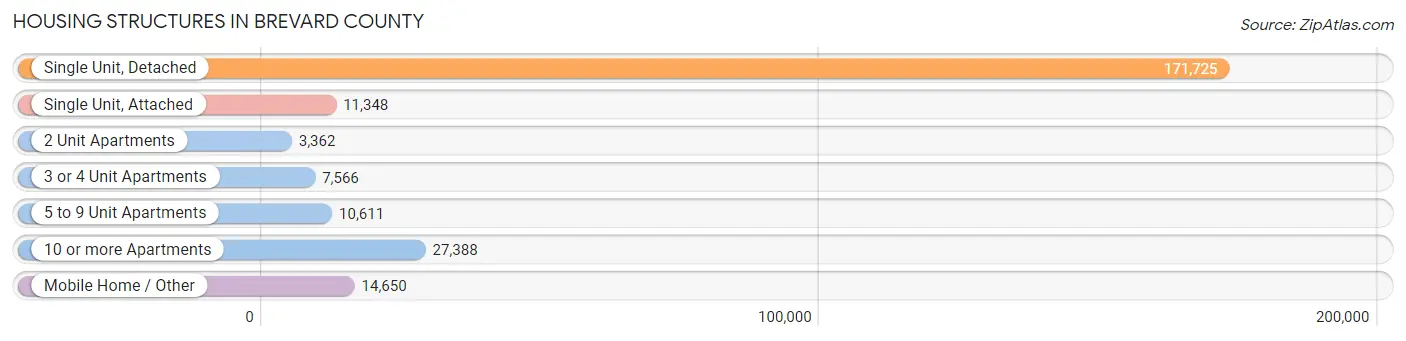
| Structure Type | # Housing Units | % Housing Units |
| Single Unit, Detached | 171,725 | 69.6% |
| Single Unit, Attached | 11,348 | 4.6% |
| 2 Unit Apartments | 3,362 | 1.4% |
| 3 or 4 Unit Apartments | 7,566 | 3.1% |
| 5 to 9 Unit Apartments | 10,611 | 4.3% |
| 10 or more Apartments | 27,388 | 11.1% |
| Mobile Home / Other | 14,650 | 5.9% |
| Total | 246,650 | 100.0% |
Housing Structures by Occupancy in Brevard County
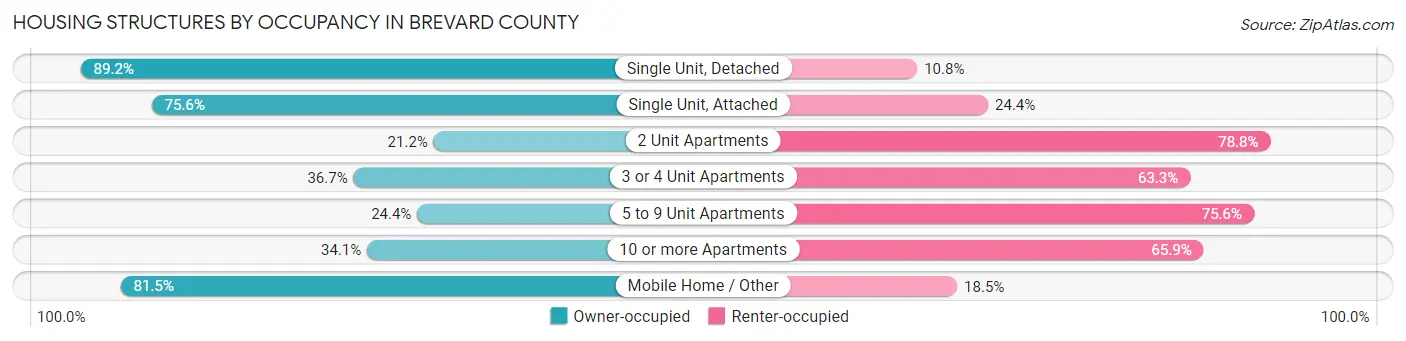
| Structure Type | Owner-occupied | Renter-occupied |
| Single Unit, Detached | 153,181 (89.2%) | 18,544 (10.8%) |
| Single Unit, Attached | 8,574 (75.6%) | 2,774 (24.4%) |
| 2 Unit Apartments | 714 (21.2%) | 2,648 (78.8%) |
| 3 or 4 Unit Apartments | 2,775 (36.7%) | 4,791 (63.3%) |
| 5 to 9 Unit Apartments | 2,590 (24.4%) | 8,021 (75.6%) |
| 10 or more Apartments | 9,327 (34.1%) | 18,061 (65.9%) |
| Mobile Home / Other | 11,942 (81.5%) | 2,708 (18.5%) |
| Total | 189,103 (76.7%) | 57,547 (23.3%) |
Housing Structures by Number of Rooms in Brevard County
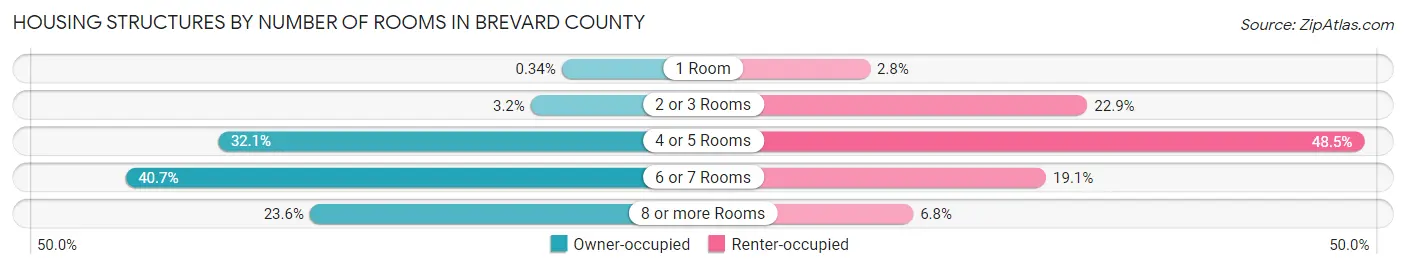
| Number of Rooms | Owner-occupied | Renter-occupied |
| 1 Room | 643 (0.3%) | 1,601 (2.8%) |
| 2 or 3 Rooms | 6,050 (3.2%) | 13,173 (22.9%) |
| 4 or 5 Rooms | 60,772 (32.1%) | 27,897 (48.5%) |
| 6 or 7 Rooms | 76,948 (40.7%) | 10,975 (19.1%) |
| 8 or more Rooms | 44,690 (23.6%) | 3,901 (6.8%) |
| Total | 189,103 (100.0%) | 57,547 (100.0%) |
Housing Structure by Heating Type in Brevard County
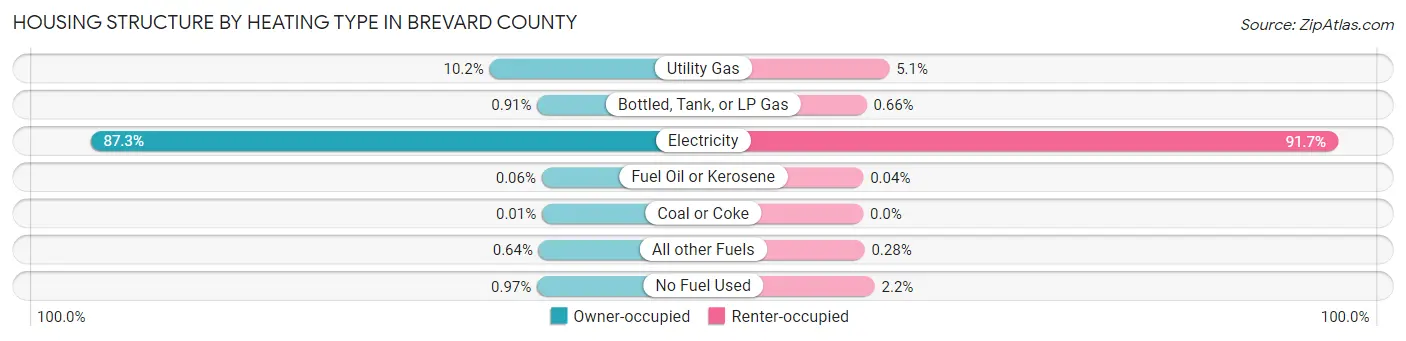
| Heating Type | Owner-occupied | Renter-occupied |
| Utility Gas | 19,212 (10.2%) | 2,909 (5.1%) |
| Bottled, Tank, or LP Gas | 1,715 (0.9%) | 379 (0.7%) |
| Electricity | 165,001 (87.3%) | 52,787 (91.7%) |
| Fuel Oil or Kerosene | 112 (0.1%) | 24 (0.0%) |
| Coal or Coke | 19 (0.0%) | 0 (0.0%) |
| All other Fuels | 1,211 (0.6%) | 162 (0.3%) |
| No Fuel Used | 1,833 (1.0%) | 1,286 (2.2%) |
| Total | 189,103 (100.0%) | 57,547 (100.0%) |
Household Vehicle Usage in Brevard County
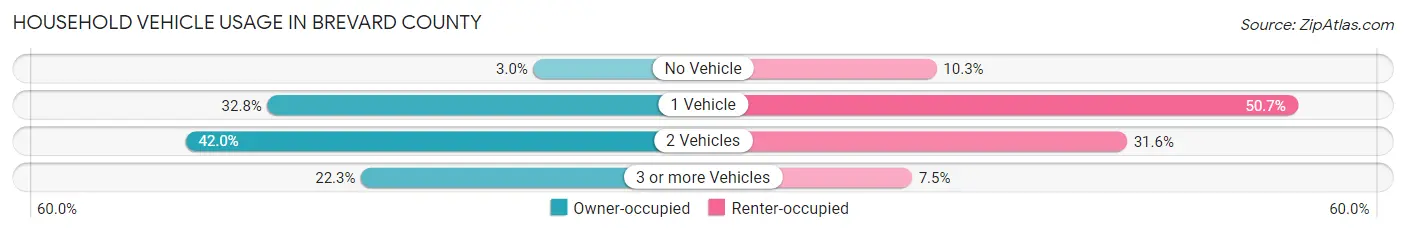
| Vehicles per Household | Owner-occupied | Renter-occupied |
| No Vehicle | 5,614 (3.0%) | 5,897 (10.2%) |
| 1 Vehicle | 61,973 (32.8%) | 29,175 (50.7%) |
| 2 Vehicles | 79,381 (42.0%) | 18,169 (31.6%) |
| 3 or more Vehicles | 42,135 (22.3%) | 4,306 (7.5%) |
| Total | 189,103 (100.0%) | 57,547 (100.0%) |
Real Estate & Mortgages in Brevard County
Real Estate and Mortgage Overview in Brevard County
| Characteristic | Without Mortgage | With Mortgage |
| Housing Units | 81,062 | 108,041 |
| Median Property Value | $259,900 | $290,100 |
| Median Household Income | $62,496 | $25,196 |
| Monthly Housing Costs | $533 | $9,453 |
| Real Estate Taxes | $1,804 | $2,899 |
Property Value by Mortgage Status in Brevard County
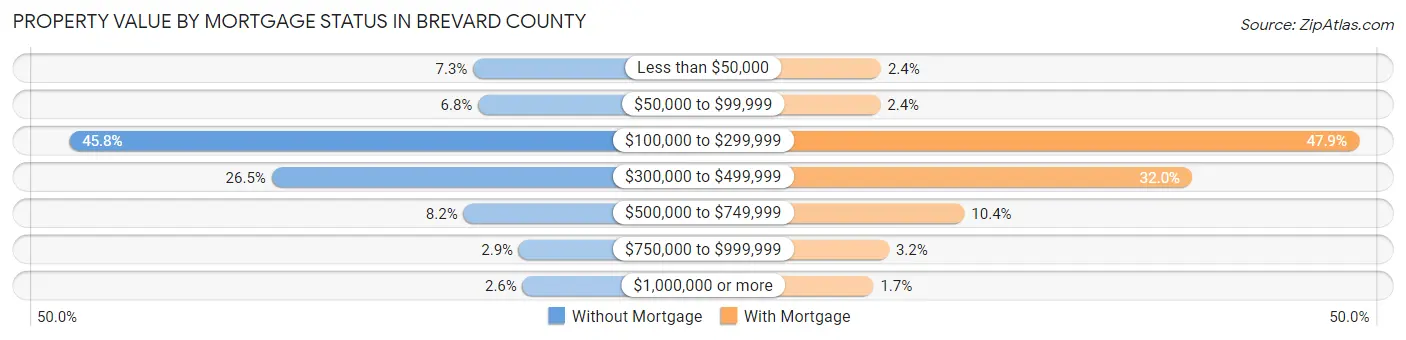
| Property Value | Without Mortgage | With Mortgage |
| Less than $50,000 | 5,903 (7.3%) | 2,615 (2.4%) |
| $50,000 to $99,999 | 5,515 (6.8%) | 2,548 (2.4%) |
| $100,000 to $299,999 | 37,088 (45.8%) | 51,780 (47.9%) |
| $300,000 to $499,999 | 21,461 (26.5%) | 34,605 (32.0%) |
| $500,000 to $749,999 | 6,650 (8.2%) | 11,207 (10.4%) |
| $750,000 to $999,999 | 2,363 (2.9%) | 3,438 (3.2%) |
| $1,000,000 or more | 2,082 (2.6%) | 1,848 (1.7%) |
| Total | 81,062 (100.0%) | 108,041 (100.0%) |
Household Income by Mortgage Status in Brevard County
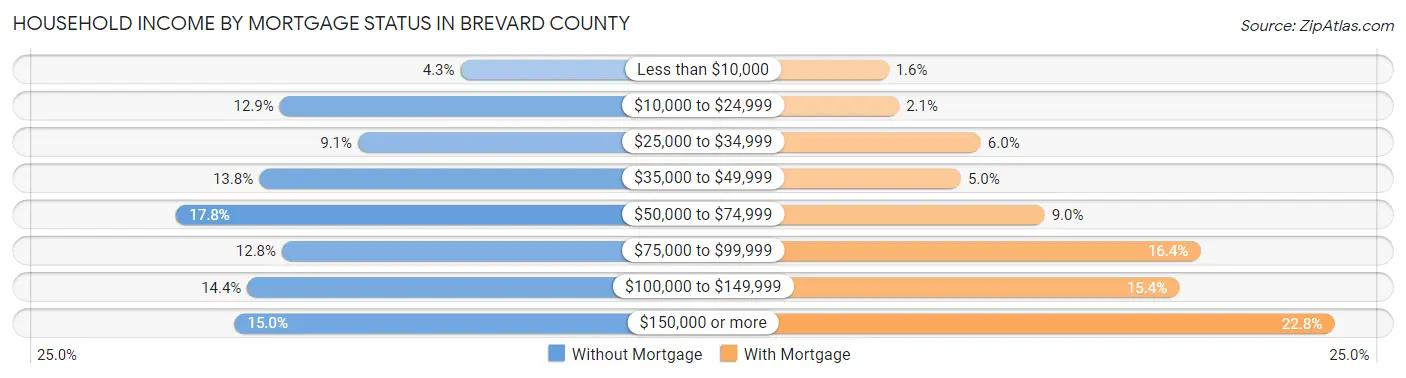
| Household Income | Without Mortgage | With Mortgage |
| Less than $10,000 | 3,446 (4.3%) | 1,707 (1.6%) |
| $10,000 to $24,999 | 10,428 (12.9%) | 2,247 (2.1%) |
| $25,000 to $34,999 | 7,398 (9.1%) | 6,450 (6.0%) |
| $35,000 to $49,999 | 11,220 (13.8%) | 5,424 (5.0%) |
| $50,000 to $74,999 | 14,408 (17.8%) | 9,736 (9.0%) |
| $75,000 to $99,999 | 10,334 (12.8%) | 17,734 (16.4%) |
| $100,000 to $149,999 | 11,670 (14.4%) | 16,634 (15.4%) |
| $150,000 or more | 12,158 (15.0%) | 24,620 (22.8%) |
| Total | 81,062 (100.0%) | 108,041 (100.0%) |
Property Value to Household Income Ratio in Brevard County
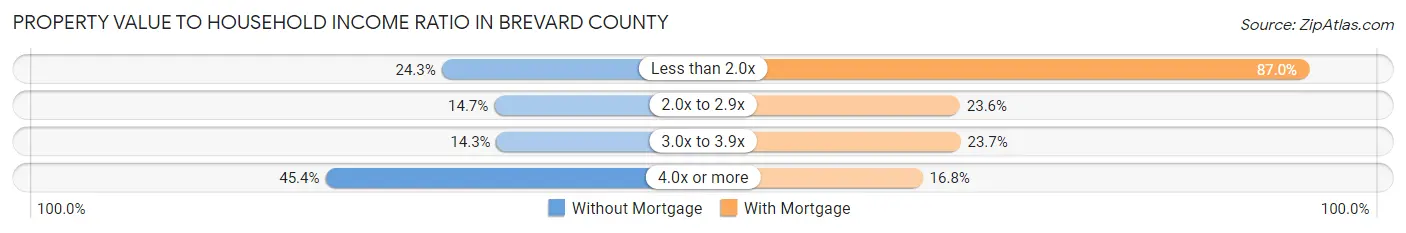
| Value-to-Income Ratio | Without Mortgage | With Mortgage |
| Less than 2.0x | 19,675 (24.3%) | 93,990 (87.0%) |
| 2.0x to 2.9x | 11,943 (14.7%) | 25,499 (23.6%) |
| 3.0x to 3.9x | 11,603 (14.3%) | 25,627 (23.7%) |
| 4.0x or more | 36,793 (45.4%) | 18,193 (16.8%) |
| Total | 81,062 (100.0%) | 108,041 (100.0%) |
Real Estate Taxes by Mortgage Status in Brevard County
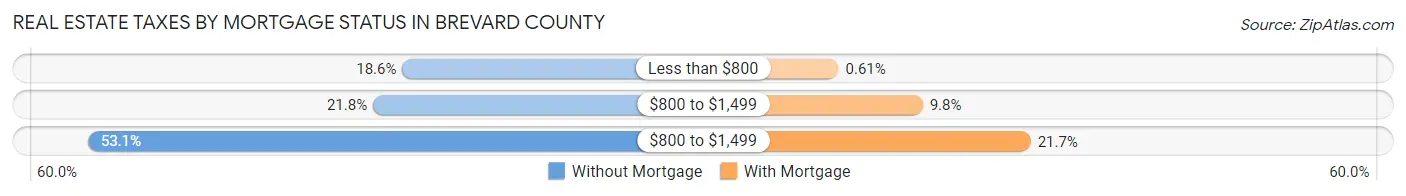
| Property Taxes | Without Mortgage | With Mortgage |
| Less than $800 | 15,085 (18.6%) | 662 (0.6%) |
| $800 to $1,499 | 17,689 (21.8%) | 10,621 (9.8%) |
| $800 to $1,499 | 43,020 (53.1%) | 23,401 (21.7%) |
| Total | 81,062 (100.0%) | 108,041 (100.0%) |
Health & Disability in Brevard County
Health Insurance Coverage by Age in Brevard County
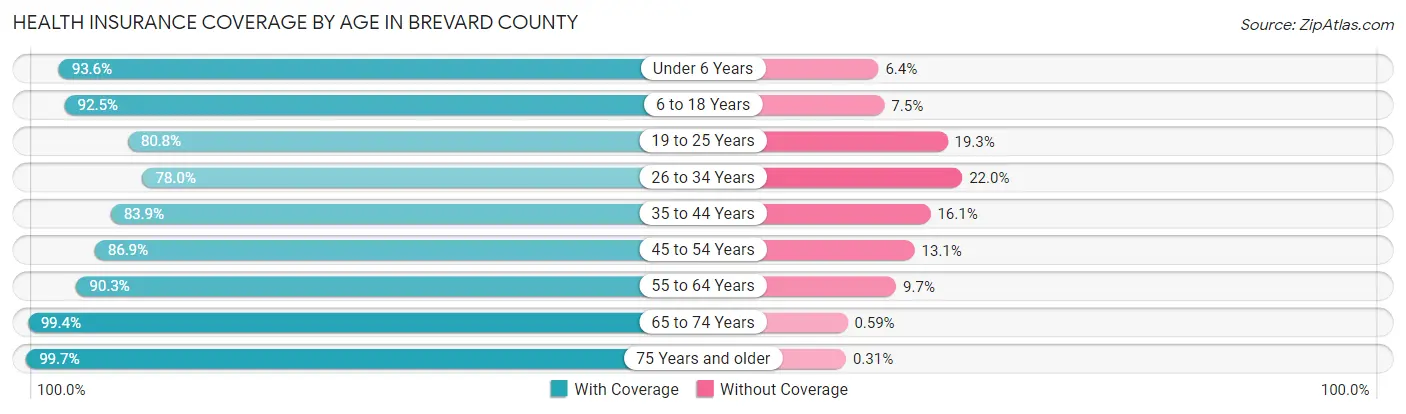
| Age Bracket | With Coverage | Without Coverage |
| Under 6 Years | 30,732 (93.6%) | 2,096 (6.4%) |
| 6 to 18 Years | 78,205 (92.5%) | 6,327 (7.5%) |
| 19 to 25 Years | 36,842 (80.7%) | 8,780 (19.3%) |
| 26 to 34 Years | 46,369 (78.0%) | 13,068 (22.0%) |
| 35 to 44 Years | 55,048 (83.9%) | 10,541 (16.1%) |
| 45 to 54 Years | 63,684 (86.9%) | 9,608 (13.1%) |
| 55 to 64 Years | 89,192 (90.3%) | 9,553 (9.7%) |
| 65 to 74 Years | 79,649 (99.4%) | 476 (0.6%) |
| 75 Years and older | 63,767 (99.7%) | 199 (0.3%) |
| Total | 543,488 (90.0%) | 60,648 (10.0%) |
Health Insurance Coverage by Citizenship Status in Brevard County
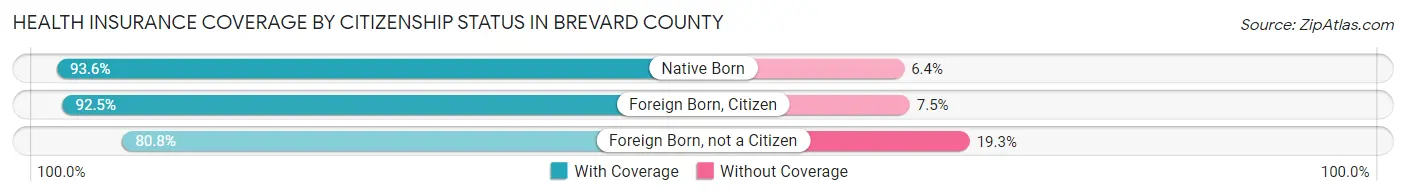
| Citizenship Status | With Coverage | Without Coverage |
| Native Born | 30,732 (93.6%) | 2,096 (6.4%) |
| Foreign Born, Citizen | 78,205 (92.5%) | 6,327 (7.5%) |
| Foreign Born, not a Citizen | 36,842 (80.7%) | 8,780 (19.3%) |
Health Insurance Coverage by Household Income in Brevard County
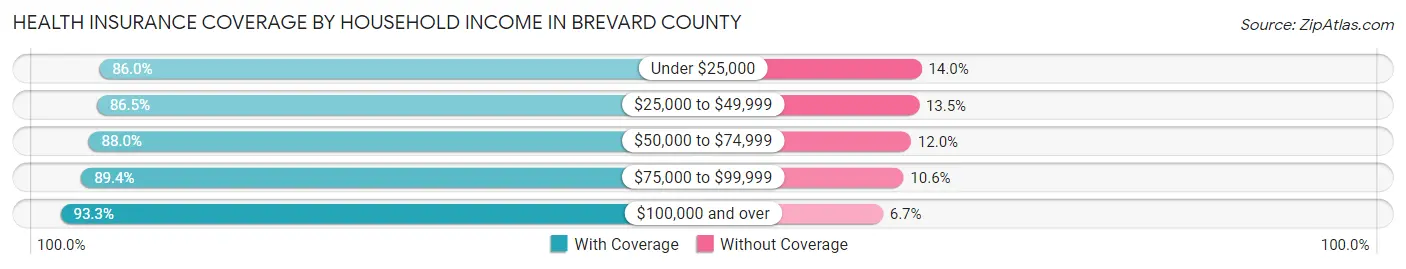
| Household Income | With Coverage | Without Coverage |
| Under $25,000 | 51,342 (86.0%) | 8,350 (14.0%) |
| $25,000 to $49,999 | 85,311 (86.5%) | 13,339 (13.5%) |
| $50,000 to $74,999 | 91,875 (88.0%) | 12,536 (12.0%) |
| $75,000 to $99,999 | 77,877 (89.4%) | 9,241 (10.6%) |
| $100,000 and over | 234,077 (93.3%) | 16,920 (6.7%) |
Public vs Private Health Insurance Coverage by Age in Brevard County
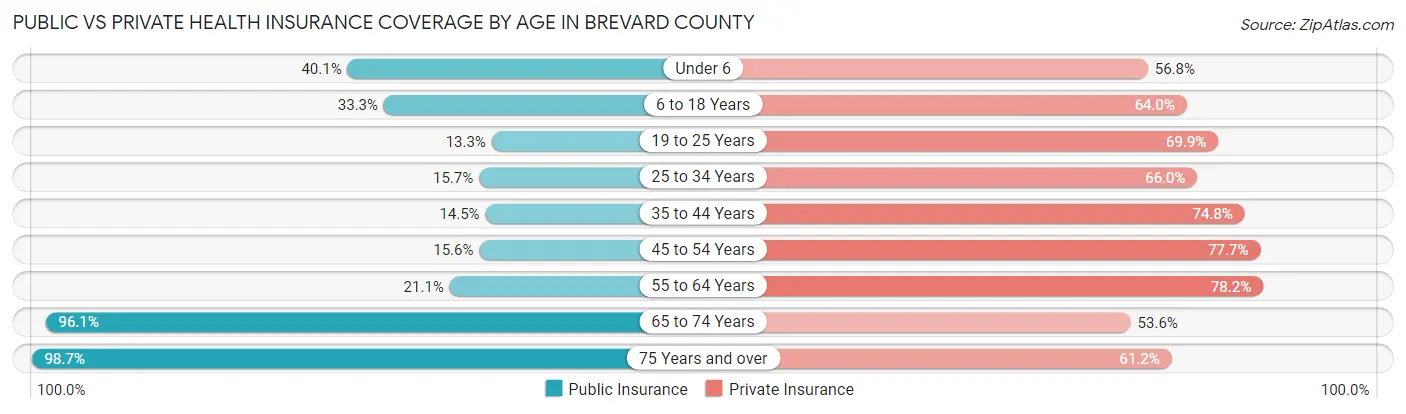
| Age Bracket | Public Insurance | Private Insurance |
| Under 6 | 13,155 (40.1%) | 18,646 (56.8%) |
| 6 to 18 Years | 28,170 (33.3%) | 54,115 (64.0%) |
| 19 to 25 Years | 6,067 (13.3%) | 31,868 (69.9%) |
| 25 to 34 Years | 9,301 (15.7%) | 39,219 (66.0%) |
| 35 to 44 Years | 9,485 (14.5%) | 49,039 (74.8%) |
| 45 to 54 Years | 11,433 (15.6%) | 56,920 (77.7%) |
| 55 to 64 Years | 20,836 (21.1%) | 77,191 (78.2%) |
| 65 to 74 Years | 77,010 (96.1%) | 42,962 (53.6%) |
| 75 Years and over | 63,147 (98.7%) | 39,151 (61.2%) |
| Total | 238,604 (39.5%) | 409,111 (67.7%) |
Disability Status by Sex by Age in Brevard County
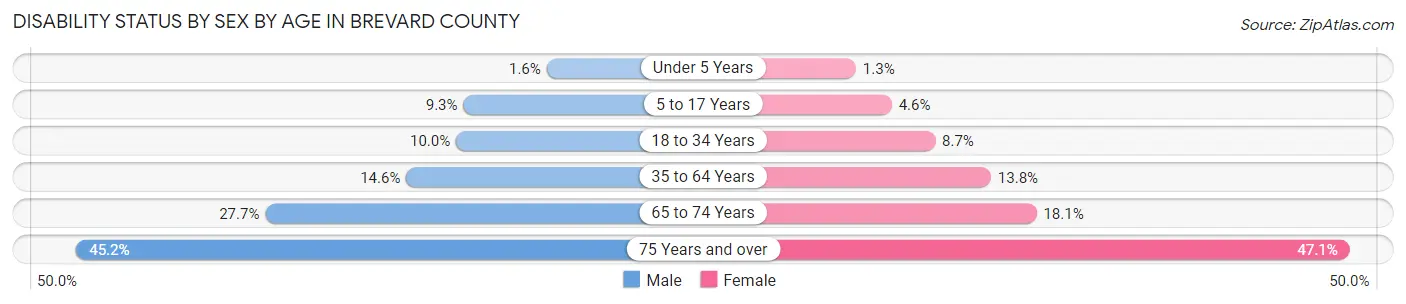
| Age Bracket | Male | Female |
| Under 5 Years | 215 (1.5%) | 174 (1.3%) |
| 5 to 17 Years | 3,949 (9.3%) | 1,878 (4.6%) |
| 18 to 34 Years | 5,823 (10.0%) | 4,648 (8.7%) |
| 35 to 64 Years | 16,872 (14.6%) | 16,868 (13.8%) |
| 65 to 74 Years | 10,581 (27.7%) | 7,567 (18.1%) |
| 75 Years and over | 12,728 (45.2%) | 16,876 (47.1%) |
Disability Class by Sex by Age in Brevard County
Disability Class: Hearing Difficulty
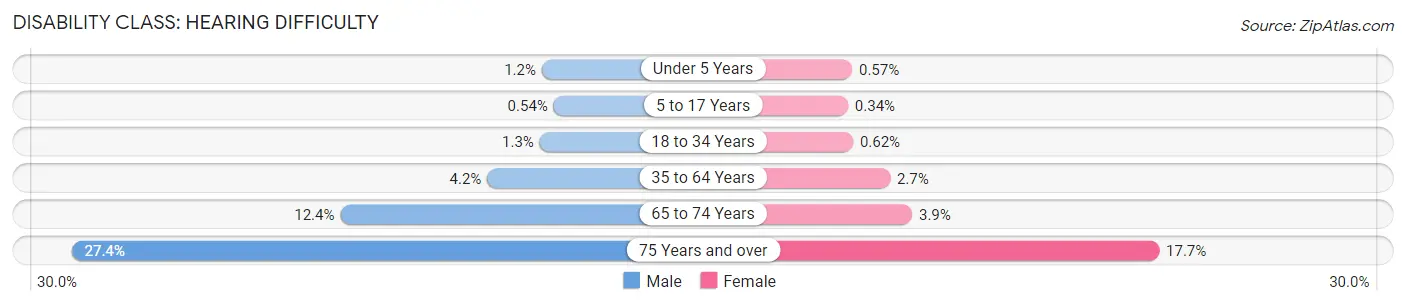
| Age Bracket | Male | Female |
| Under 5 Years | 167 (1.2%) | 76 (0.6%) |
| 5 to 17 Years | 231 (0.5%) | 139 (0.3%) |
| 18 to 34 Years | 769 (1.3%) | 331 (0.6%) |
| 35 to 64 Years | 4,909 (4.2%) | 3,265 (2.7%) |
| 65 to 74 Years | 4,750 (12.4%) | 1,639 (3.9%) |
| 75 Years and over | 7,709 (27.4%) | 6,329 (17.7%) |
Disability Class: Vision Difficulty
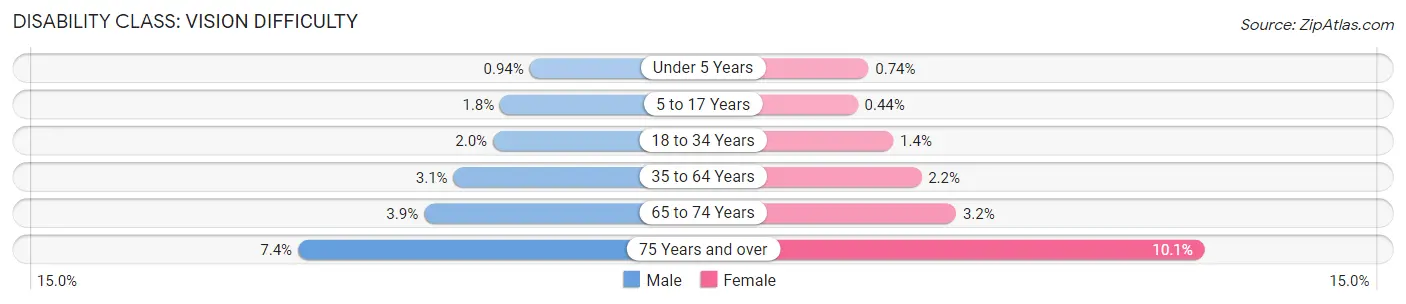
| Age Bracket | Male | Female |
| Under 5 Years | 130 (0.9%) | 98 (0.7%) |
| 5 to 17 Years | 751 (1.8%) | 179 (0.4%) |
| 18 to 34 Years | 1,145 (2.0%) | 765 (1.4%) |
| 35 to 64 Years | 3,539 (3.1%) | 2,699 (2.2%) |
| 65 to 74 Years | 1,483 (3.9%) | 1,334 (3.2%) |
| 75 Years and over | 2,080 (7.4%) | 3,616 (10.1%) |
Disability Class: Cognitive Difficulty
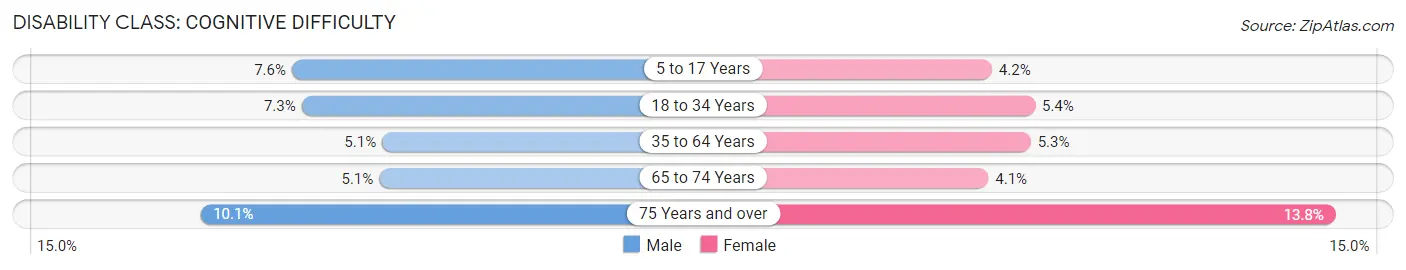
| Age Bracket | Male | Female |
| 5 to 17 Years | 3,219 (7.6%) | 1,697 (4.2%) |
| 18 to 34 Years | 4,264 (7.3%) | 2,887 (5.4%) |
| 35 to 64 Years | 5,842 (5.1%) | 6,411 (5.3%) |
| 65 to 74 Years | 1,961 (5.1%) | 1,709 (4.1%) |
| 75 Years and over | 2,847 (10.1%) | 4,925 (13.8%) |
Disability Class: Ambulatory Difficulty
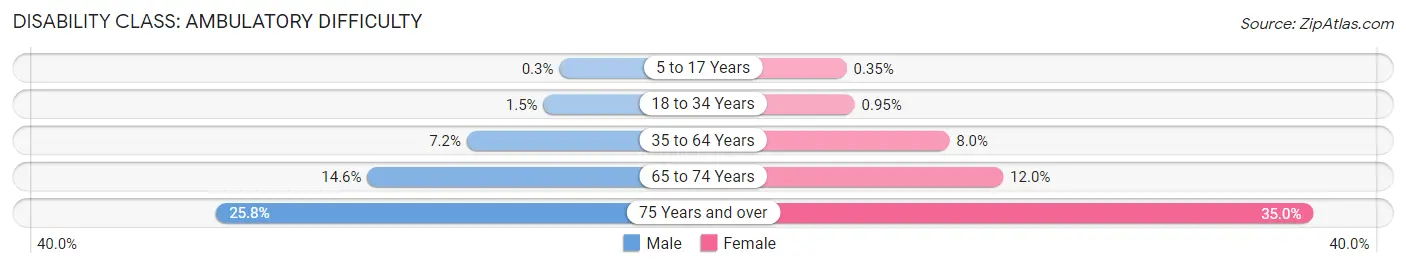
| Age Bracket | Male | Female |
| 5 to 17 Years | 129 (0.3%) | 142 (0.4%) |
| 18 to 34 Years | 863 (1.5%) | 508 (0.9%) |
| 35 to 64 Years | 8,299 (7.2%) | 9,732 (8.0%) |
| 65 to 74 Years | 5,564 (14.5%) | 5,016 (12.0%) |
| 75 Years and over | 7,256 (25.8%) | 12,534 (35.0%) |
Disability Class: Self-Care Difficulty
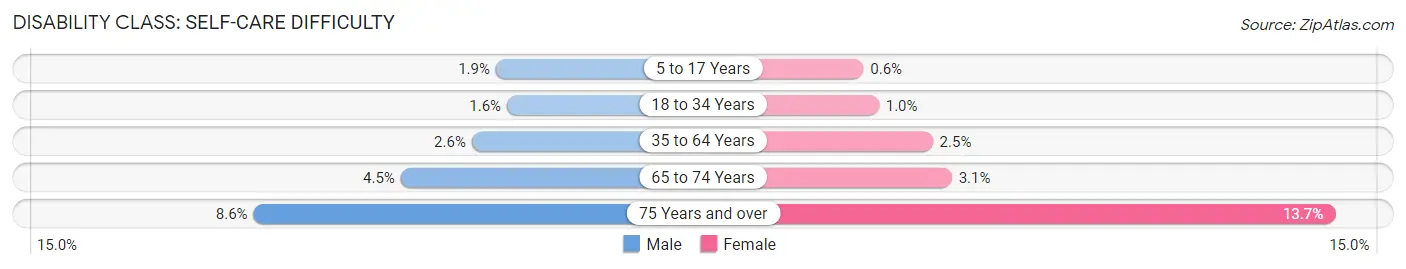
| Age Bracket | Male | Female |
| 5 to 17 Years | 802 (1.9%) | 243 (0.6%) |
| 18 to 34 Years | 919 (1.6%) | 552 (1.0%) |
| 35 to 64 Years | 2,955 (2.5%) | 3,079 (2.5%) |
| 65 to 74 Years | 1,734 (4.5%) | 1,282 (3.1%) |
| 75 Years and over | 2,429 (8.6%) | 4,915 (13.7%) |
Technology Access in Brevard County
Computing Device Access in Brevard County
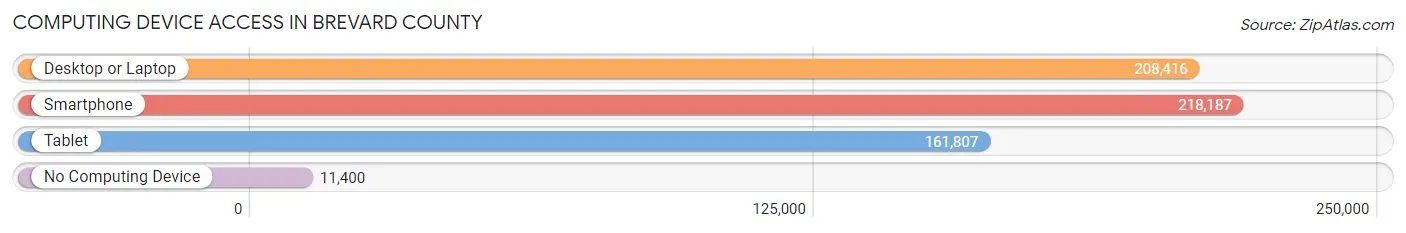
| Device Type | # Households | % Households |
| Desktop or Laptop | 208,416 | 84.5% |
| Smartphone | 218,187 | 88.5% |
| Tablet | 161,807 | 65.6% |
| No Computing Device | 11,400 | 4.6% |
| Total | 246,650 | 100.0% |
Internet Access in Brevard County
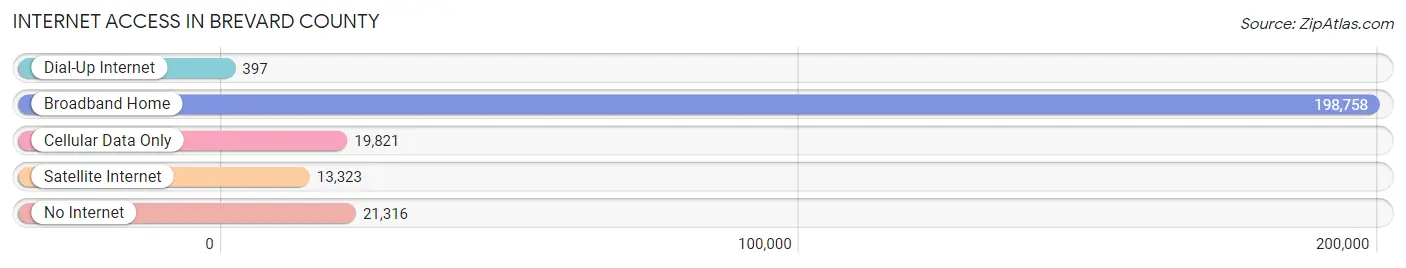
| Internet Type | # Households | % Households |
| Dial-Up Internet | 397 | 0.2% |
| Broadband Home | 198,758 | 80.6% |
| Cellular Data Only | 19,821 | 8.0% |
| Satellite Internet | 13,323 | 5.4% |
| No Internet | 21,316 | 8.6% |
| Total | 246,650 | 100.0% |
Brevard County Summary
Brevard County, Florida is located in the east-central part of the state, along the Atlantic Coast. It is bordered by Volusia County to the north, Indian River County to the south, and Orange and Osceola counties to the west. The county seat is Titusville, and the largest city is Palm Bay. Brevard County is part of the Space Coast region of Florida, and is home to the Kennedy Space Center and the Canaveral National Seashore.
Geography
Brevard County covers an area of 1,557 square miles, making it the 52nd largest county in the United States. The county is divided into three distinct geographic regions: the mainland, the barrier islands, and the interior. The mainland is located along the Indian River Lagoon and is home to the cities of Titusville, Cocoa, and Melbourne. The barrier islands are located along the Atlantic Coast and include the cities of Cocoa Beach, Cape Canaveral, and Merritt Island. The interior is located in the northern part of the county and is home to the cities of Palm Bay and Melbourne.
The county is home to several rivers, including the Indian River, St. Johns River, and Eau Gallie River. The county also contains several lakes, including Lake Washington, Lake Poinsett, and Lake Winder. The county is also home to several state parks, including the Canaveral National Seashore, Sebastian Inlet State Park, and the Merritt Island National Wildlife Refuge.
Demographics
As of the 2010 census, Brevard County had a population of 543,376. The population was spread out with 24.3% under the age of 18, 8.2% from 18 to 24, 28.5% from 25 to 44, 24.3% from 45 to 64, and 14.7% who were 65 years of age or older. The median age was 38.4 years. The gender makeup of the county was 48.7% male and 51.3% female.
The racial makeup of the county was 79.2% White, 11.3% African American, 0.4% Native American, 2.2% Asian, 0.1% Pacific Islander, 4.3% from other races, and 2.5% from two or more races. Hispanic or Latino of any race were 11.6% of the population.
Economy
Brevard County has a diverse economy, with a mix of industries including aerospace, manufacturing, tourism, and agriculture. The county is home to the Kennedy Space Center, which is the largest employer in the county. Other major employers include the Harris Corporation, Northrop Grumman, and the Patrick Air Force Base.
Tourism is a major industry in Brevard County, with the county's beaches and attractions drawing millions of visitors each year. The county is home to several popular attractions, including the Kennedy Space Center Visitor Complex, the Brevard Zoo, and the Brevard Museum of Natural History.
Agriculture is also an important part of the county's economy, with citrus, vegetables, and cattle being the main crops. The county is also home to several wineries and breweries.
Conclusion
Brevard County, Florida is a diverse and vibrant county located along the Atlantic Coast. The county is home to the Kennedy Space Center, several popular attractions, and a diverse economy. The county is also home to several rivers, lakes, and state parks, making it a popular destination for tourists and outdoor enthusiasts. With its diverse population, economy, and attractions, Brevard County is an ideal place to live, work, and play.
Common Questions
What is Per Capita Income in Brevard County?
Per Capita income in Brevard County is $40,111.
What is the Median Family Income in Brevard County?
Median Family Income in Brevard County is $87,701.
What is the Median Household income in Brevard County?
Median Household Income in Brevard County is $71,308.
What is Income or Wage Gap in Brevard County?
Income or Wage Gap in Brevard County is 30.4%.
Women in Brevard County earn 69.6 cents for every dollar earned by a man.
What is Family Income Deficit in Brevard County?
Family Income Deficit in Brevard County is $9,623.
Families that are below poverty line in Brevard County earn $9,623 less on average than the poverty threshold level.
What is Inequality or Gini Index in Brevard County?
Inequality or Gini Index in Brevard County is 0.45.
What is the Total Population of Brevard County?
Total Population of Brevard County is 610,723.
What is the Total Male Population of Brevard County?
Total Male Population of Brevard County is 300,904.
What is the Total Female Population of Brevard County?
Total Female Population of Brevard County is 309,819.
What is the Ratio of Males per 100 Females in Brevard County?
There are 97.12 Males per 100 Females in Brevard County.
What is the Ratio of Females per 100 Males in Brevard County?
There are 102.96 Females per 100 Males in Brevard County.
What is the Median Population Age in Brevard County?
Median Population Age in Brevard County is 47.0 Years.
What is the Average Family Size in Brevard County
Average Family Size in Brevard County is 3.0 People.
What is the Average Household Size in Brevard County
Average Household Size in Brevard County is 2.5 People.
How Large is the Labor Force in Brevard County?
There are 288,953 People in the Labor Forcein in Brevard County.
What is the Percentage of People in the Labor Force in Brevard County?
56.2% of People are in the Labor Force in Brevard County.
What is the Unemployment Rate in Brevard County?
Unemployment Rate in Brevard County is 4.9%.