Duval County, FL Map & Demographics
Duval County Map
Duval County Overview
$37,376
PER CAPITA INCOME
$79,233
AVG FAMILY INCOME
$65,579
AVG HOUSEHOLD INCOME
22.2%
WAGE / INCOME GAP [ % ]
77.8¢/ $1
WAGE / INCOME GAP [ $ ]
$11,001
FAMILY INCOME DEFICIT
0.47
INEQUALITY / GINI INDEX
995,708
TOTAL POPULATION
484,498
MALE POPULATION
511,210
FEMALE POPULATION
94.77
MALES / 100 FEMALES
105.51
FEMALES / 100 MALES
36.6
MEDIAN AGE
3.1
AVG FAMILY SIZE
2.5
AVG HOUSEHOLD SIZE
522,364
LABOR FORCE [ PEOPLE ]
65.6%
PERCENT IN LABOR FORCE
4.7%
UNEMPLOYMENT RATE
Duval County Area Codes
Income in Duval County
Income Overview in Duval County
Per Capita Income in Duval County is $37,376, while median incomes of families and households are $79,233 and $65,579 respectively.
| Characteristic | Number | Measure |
| Per Capita Income | 995,708 | $37,376 |
| Median Family Income | 240,135 | $79,233 |
| Mean Family Income | 240,135 | $106,408 |
| Median Household Income | 396,132 | $65,579 |
| Mean Household Income | 396,132 | $90,666 |
| Income Deficit | 240,135 | $11,001 |
| Wage / Income Gap (%) | 995,708 | 22.20% |
| Wage / Income Gap ($) | 995,708 | 77.80¢ per $1 |
| Gini / Inequality Index | 995,708 | 0.47 |
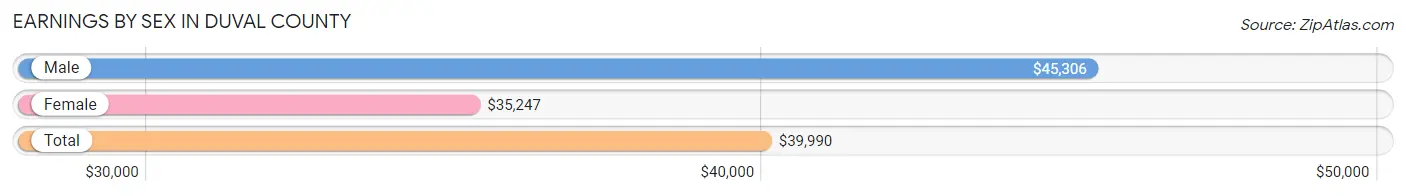
Earnings by Sex in Duval County
Average Earnings in Duval County are $39,990, $45,306 for men and $35,247 for women, a difference of 22.2%.
| Sex | Number | Average Earnings |
| Male | 280,928 (52.1%) | $45,306 |
| Female | 258,099 (47.9%) | $35,247 |
| Total | 539,027 (100.0%) | $39,990 |
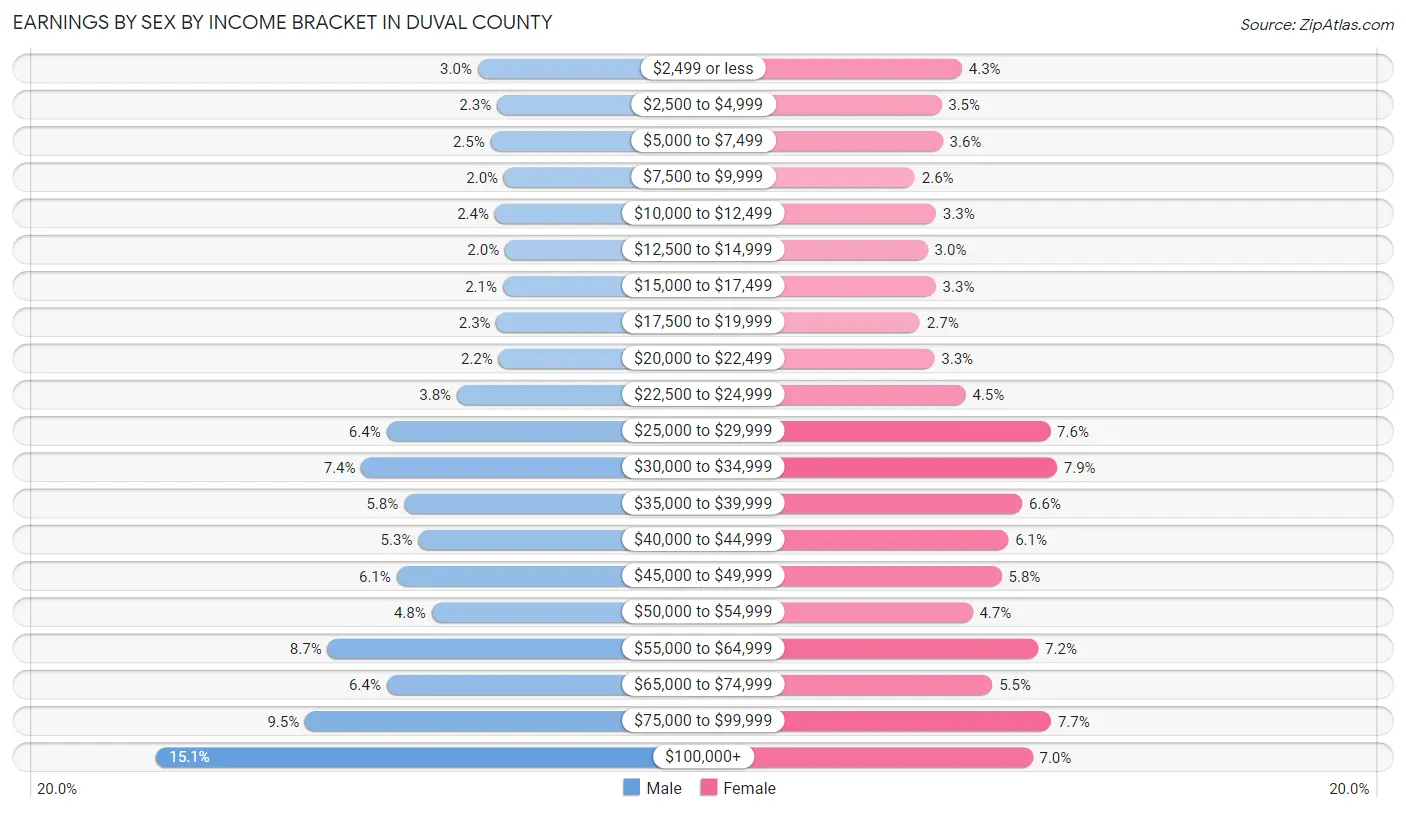
Earnings by Sex by Income Bracket in Duval County
The most common earnings brackets in Duval County are $100,000+ for men (42,294 | 15.1%) and $30,000 to $34,999 for women (20,312 | 7.9%).
| Income | Male | Female |
| $2,499 or less | 8,492 (3.0%) | 11,112 (4.3%) |
| $2,500 to $4,999 | 6,467 (2.3%) | 9,132 (3.5%) |
| $5,000 to $7,499 | 7,129 (2.5%) | 9,273 (3.6%) |
| $7,500 to $9,999 | 5,723 (2.0%) | 6,581 (2.5%) |
| $10,000 to $12,499 | 6,691 (2.4%) | 8,626 (3.3%) |
| $12,500 to $14,999 | 5,616 (2.0%) | 7,810 (3.0%) |
| $15,000 to $17,499 | 5,843 (2.1%) | 8,583 (3.3%) |
| $17,500 to $19,999 | 6,504 (2.3%) | 7,060 (2.7%) |
| $20,000 to $22,499 | 6,285 (2.2%) | 8,475 (3.3%) |
| $22,500 to $24,999 | 10,672 (3.8%) | 11,494 (4.4%) |
| $25,000 to $29,999 | 18,082 (6.4%) | 19,674 (7.6%) |
| $30,000 to $34,999 | 20,729 (7.4%) | 20,312 (7.9%) |
| $35,000 to $39,999 | 16,249 (5.8%) | 16,959 (6.6%) |
| $40,000 to $44,999 | 14,759 (5.2%) | 15,604 (6.0%) |
| $45,000 to $49,999 | 17,032 (6.1%) | 14,973 (5.8%) |
| $50,000 to $54,999 | 13,338 (4.8%) | 12,146 (4.7%) |
| $55,000 to $64,999 | 24,312 (8.6%) | 18,498 (7.2%) |
| $65,000 to $74,999 | 18,062 (6.4%) | 14,072 (5.4%) |
| $75,000 to $99,999 | 26,649 (9.5%) | 19,747 (7.6%) |
| $100,000+ | 42,294 (15.1%) | 17,968 (7.0%) |
| Total | 280,928 (100.0%) | 258,099 (100.0%) |
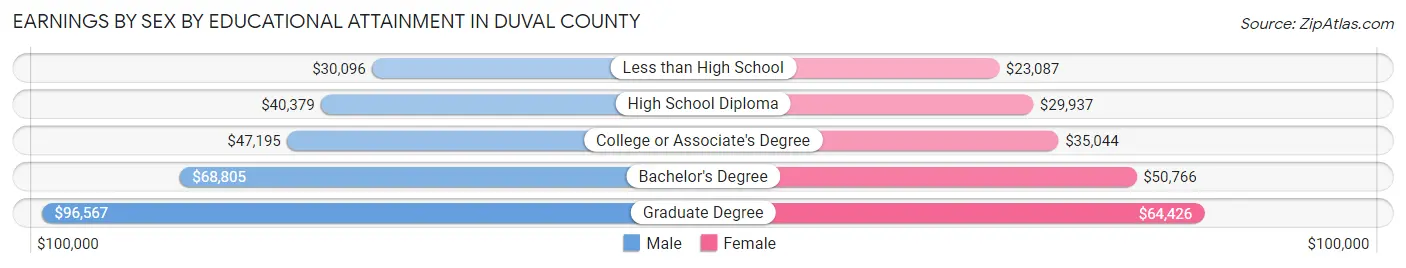
Earnings by Sex by Educational Attainment in Duval County
Average earnings in Duval County are $49,905 for men and $39,311 for women, a difference of 21.2%. Men with an educational attainment of graduate degree enjoy the highest average annual earnings of $96,567, while those with less than high school education earn the least with $30,096. Women with an educational attainment of graduate degree earn the most with the average annual earnings of $64,426, while those with less than high school education have the smallest earnings of $23,087.
| Educational Attainment | Male Income | Female Income |
| Less than High School | $30,096 | $23,087 |
| High School Diploma | $40,379 | $29,937 |
| College or Associate's Degree | $47,195 | $35,044 |
| Bachelor's Degree | $68,805 | $50,766 |
| Graduate Degree | $96,567 | $64,426 |
| Total | $49,905 | $39,311 |
Family Income in Duval County
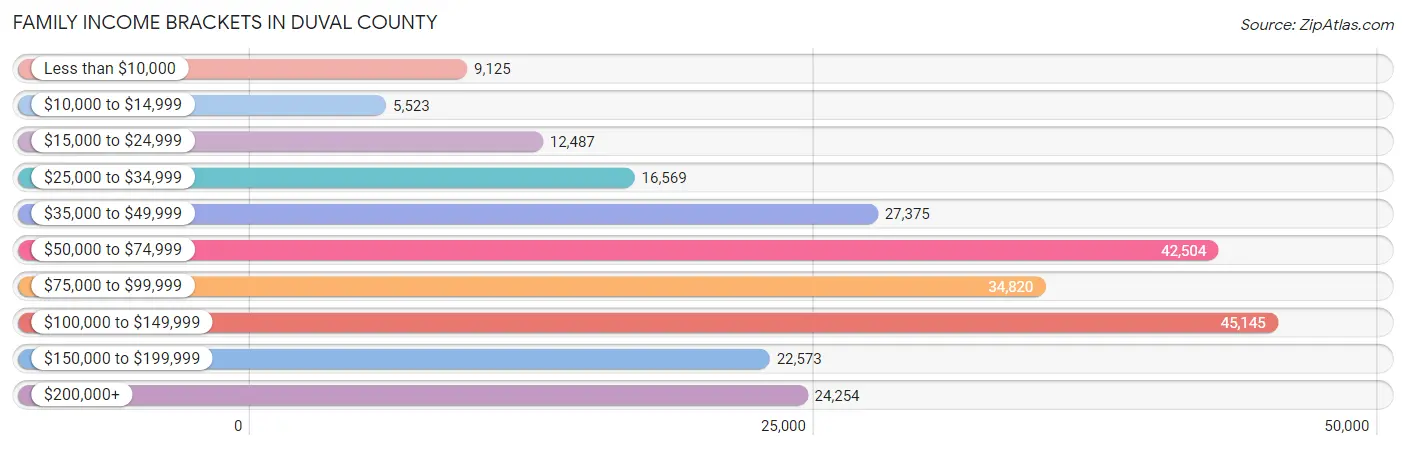
Family Income Brackets in Duval County
According to the Duval County family income data, there are 45,145 families falling into the $100,000 to $149,999 income range, which is the most common income bracket and makes up 18.8% of all families. Conversely, the $10,000 to $14,999 income bracket is the least frequent group with only 5,523 families (2.3%) belonging to this category.
| Income Bracket | # Families | % Families |
| Less than $10,000 | 9,125 | 3.8% |
| $10,000 to $14,999 | 5,523 | 2.3% |
| $15,000 to $24,999 | 12,487 | 5.2% |
| $25,000 to $34,999 | 16,569 | 6.9% |
| $35,000 to $49,999 | 27,375 | 11.4% |
| $50,000 to $74,999 | 42,504 | 17.7% |
| $75,000 to $99,999 | 34,820 | 14.5% |
| $100,000 to $149,999 | 45,145 | 18.8% |
| $150,000 to $199,999 | 22,573 | 9.4% |
| $200,000+ | 24,254 | 10.1% |
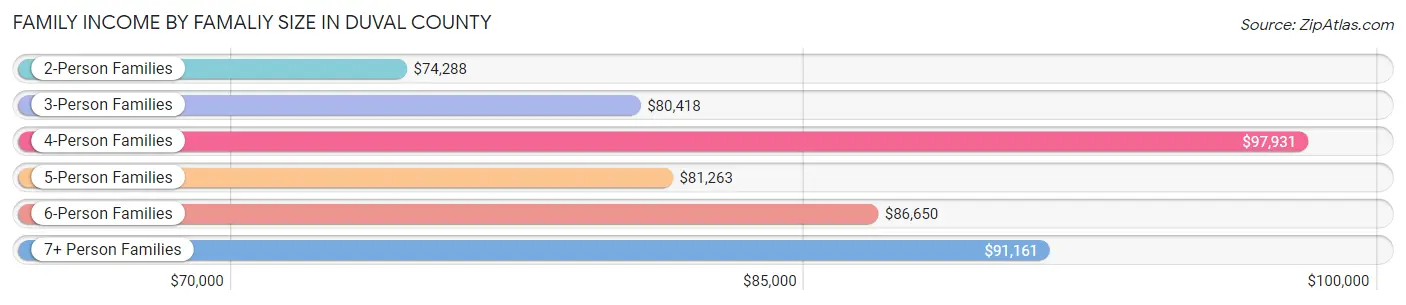
Family Income by Famaliy Size in Duval County
4-person families (38,259 | 15.9%) account for the highest median family income in Duval County with $97,931 per family, while 2-person families (117,288 | 48.8%) have the highest median income of $37,144 per family member.
| Income Bracket | # Families | Median Income |
| 2-Person Families | 117,288 (48.8%) | $74,288 |
| 3-Person Families | 59,477 (24.8%) | $80,418 |
| 4-Person Families | 38,259 (15.9%) | $97,931 |
| 5-Person Families | 16,130 (6.7%) | $81,263 |
| 6-Person Families | 5,929 (2.5%) | $86,650 |
| 7+ Person Families | 3,052 (1.3%) | $91,161 |
| Total | 240,135 (100.0%) | $79,233 |
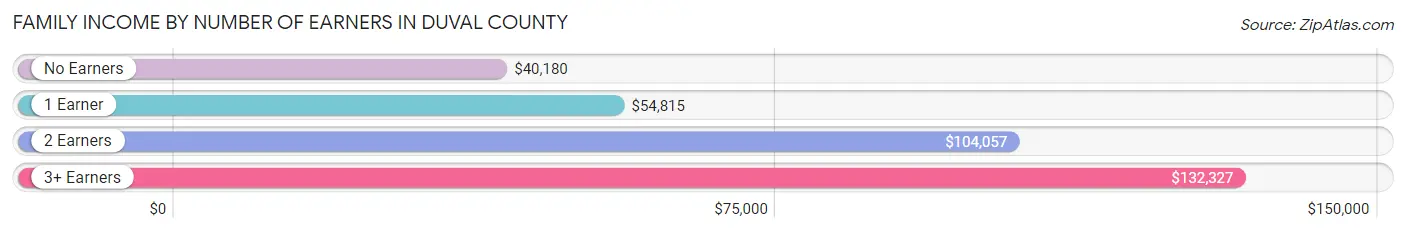
Family Income by Number of Earners in Duval County
The median family income in Duval County is $79,233, with families comprising 3+ earners (22,427) having the highest median family income of $132,327, while families with no earners (32,370) have the lowest median family income of $40,180, accounting for 9.3% and 13.5% of families, respectively.
| Number of Earners | # Families | Median Income |
| No Earners | 32,370 (13.5%) | $40,180 |
| 1 Earner | 87,692 (36.5%) | $54,815 |
| 2 Earners | 97,646 (40.7%) | $104,057 |
| 3+ Earners | 22,427 (9.3%) | $132,327 |
| Total | 240,135 (100.0%) | $79,233 |
Household Income in Duval County
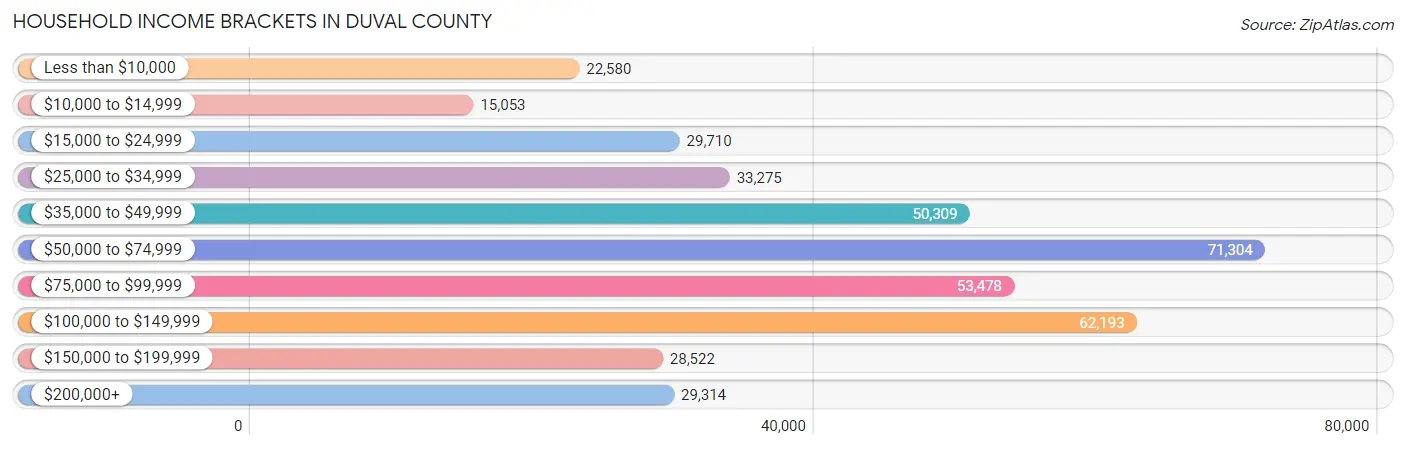
Household Income Brackets in Duval County
With 71,304 households falling in the category, the $50,000 to $74,999 income range is the most frequent in Duval County, accounting for 18.0% of all households. In contrast, only 15,053 households (3.8%) fall into the $10,000 to $14,999 income bracket, making it the least populous group.
| Income Bracket | # Households | % Households |
| Less than $10,000 | 22,580 | 5.7% |
| $10,000 to $14,999 | 15,053 | 3.8% |
| $15,000 to $24,999 | 29,710 | 7.5% |
| $25,000 to $34,999 | 33,275 | 8.4% |
| $35,000 to $49,999 | 50,309 | 12.7% |
| $50,000 to $74,999 | 71,304 | 18.0% |
| $75,000 to $99,999 | 53,478 | 13.5% |
| $100,000 to $149,999 | 62,193 | 15.7% |
| $150,000 to $199,999 | 28,522 | 7.2% |
| $200,000+ | 29,314 | 7.4% |
Household Income by Householder Age in Duval County
The median household income in Duval County is $65,579, with the highest median household income of $78,268 found in the 45 to 64 years age bracket for the primary householder. A total of 140,931 households (35.6%) fall into this category. Meanwhile, the 15 to 24 years age bracket for the primary householder has the lowest median household income of $40,632, with 16,552 households (4.2%) in this group.
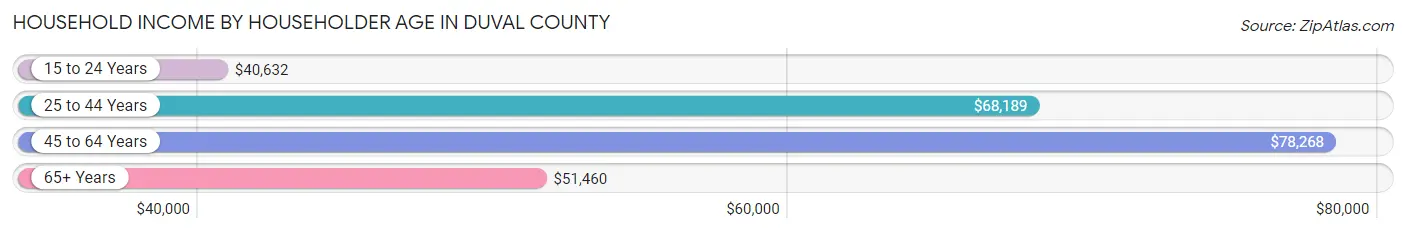
| Income Bracket | # Households | Median Income |
| 15 to 24 Years | 16,552 (4.2%) | $40,632 |
| 25 to 44 Years | 148,056 (37.4%) | $68,189 |
| 45 to 64 Years | 140,931 (35.6%) | $78,268 |
| 65+ Years | 90,593 (22.9%) | $51,460 |
| Total | 396,132 (100.0%) | $65,579 |
Poverty in Duval County
Income Below Poverty by Sex and Age in Duval County
With 12.8% poverty level for males and 15.8% for females among the residents of Duval County, 12 to 14 year old males and 5 year old females are the most vulnerable to poverty, with 4,355 males (22.3%) and 1,543 females (23.1%) in their respective age groups living below the poverty level.
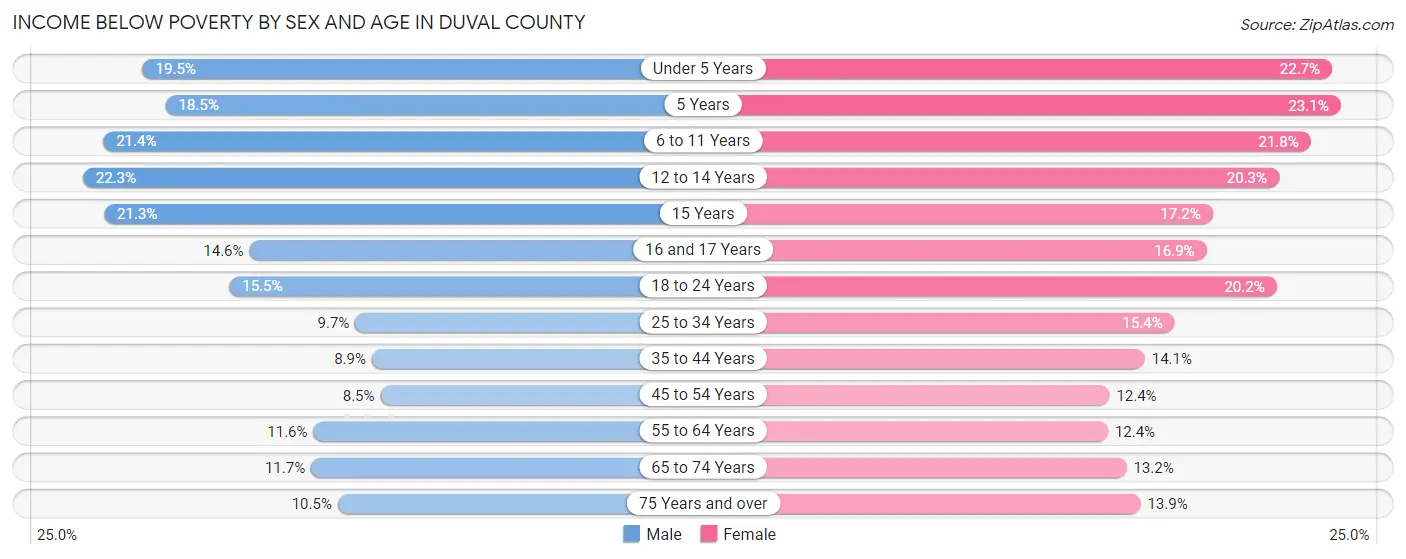
| Age Bracket | Male | Female |
| Under 5 Years | 6,335 (19.5%) | 7,048 (22.7%) |
| 5 Years | 1,129 (18.5%) | 1,543 (23.1%) |
| 6 to 11 Years | 7,807 (21.3%) | 7,464 (21.7%) |
| 12 to 14 Years | 4,355 (22.3%) | 3,768 (20.3%) |
| 15 Years | 1,168 (21.3%) | 1,021 (17.2%) |
| 16 and 17 Years | 1,787 (14.6%) | 1,854 (16.9%) |
| 18 to 24 Years | 5,987 (15.5%) | 7,879 (20.2%) |
| 25 to 34 Years | 7,594 (9.7%) | 12,401 (15.4%) |
| 35 to 44 Years | 5,640 (8.9%) | 9,274 (14.1%) |
| 45 to 54 Years | 4,914 (8.5%) | 7,592 (12.4%) |
| 55 to 64 Years | 6,880 (11.6%) | 8,091 (12.3%) |
| 65 to 74 Years | 4,697 (11.7%) | 6,343 (13.2%) |
| 75 Years and over | 2,238 (10.5%) | 4,532 (13.9%) |
| Total | 60,531 (12.8%) | 78,810 (15.8%) |
Income Above Poverty by Sex and Age in Duval County
According to the poverty statistics in Duval County, males aged 45 to 54 years and females aged 55 to 64 years are the age groups that are most secure financially, with 91.5% of males and 87.6% of females in these age groups living above the poverty line.
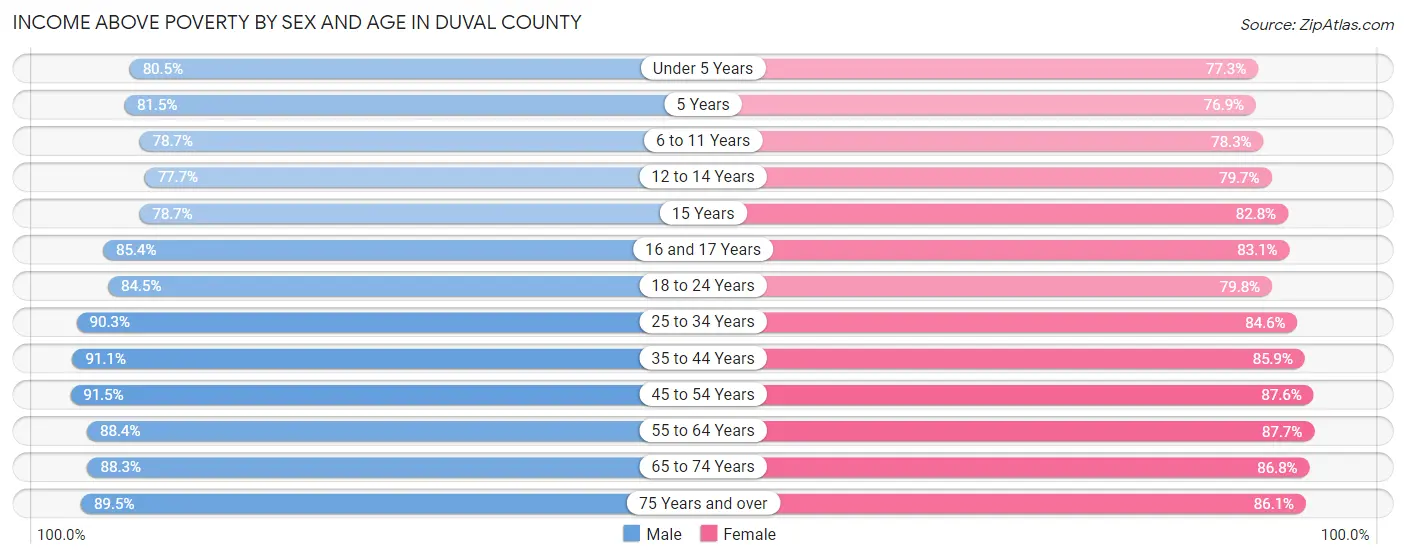
| Age Bracket | Male | Female |
| Under 5 Years | 26,122 (80.5%) | 23,952 (77.3%) |
| 5 Years | 4,986 (81.5%) | 5,124 (76.9%) |
| 6 to 11 Years | 28,762 (78.6%) | 26,849 (78.2%) |
| 12 to 14 Years | 15,171 (77.7%) | 14,816 (79.7%) |
| 15 Years | 4,313 (78.7%) | 4,916 (82.8%) |
| 16 and 17 Years | 10,481 (85.4%) | 9,101 (83.1%) |
| 18 to 24 Years | 32,646 (84.5%) | 31,176 (79.8%) |
| 25 to 34 Years | 71,019 (90.3%) | 67,922 (84.6%) |
| 35 to 44 Years | 57,799 (91.1%) | 56,683 (85.9%) |
| 45 to 54 Years | 52,964 (91.5%) | 53,527 (87.6%) |
| 55 to 64 Years | 52,415 (88.4%) | 57,416 (87.6%) |
| 65 to 74 Years | 35,402 (88.3%) | 41,691 (86.8%) |
| 75 Years and over | 19,136 (89.5%) | 28,159 (86.1%) |
| Total | 411,216 (87.2%) | 421,332 (84.2%) |
Income Below Poverty Among Married-Couple Families in Duval County
The poverty statistics for married-couple families in Duval County show that 5.2% or 8,358 of the total 160,157 families live below the poverty line. Families with 5 or more children have the highest poverty rate of 21.4%, comprising of 232 families. On the other hand, families with no children have the lowest poverty rate of 4.3%, which includes 4,186 families.
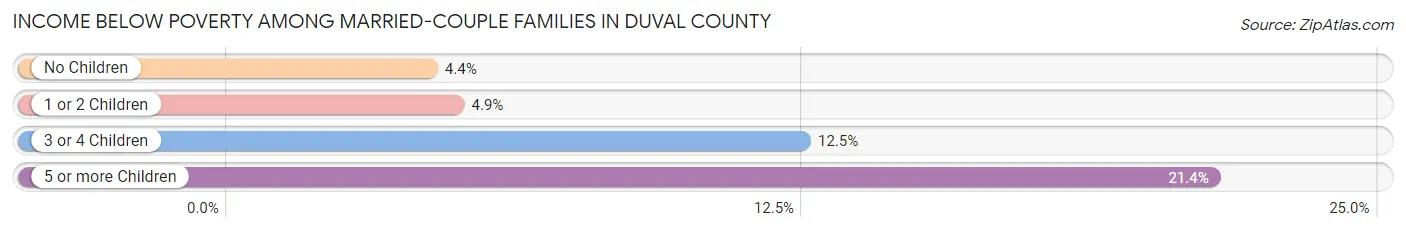
| Children | Above Poverty | Below Poverty |
| No Children | 92,097 (95.7%) | 4,186 (4.3%) |
| 1 or 2 Children | 49,052 (95.1%) | 2,544 (4.9%) |
| 3 or 4 Children | 9,797 (87.5%) | 1,396 (12.5%) |
| 5 or more Children | 853 (78.6%) | 232 (21.4%) |
| Total | 151,799 (94.8%) | 8,358 (5.2%) |
Income Below Poverty Among Single-Parent Households in Duval County
According to the poverty data in Duval County, 11.9% or 2,466 single-father households and 24.9% or 14,742 single-mother households are living below the poverty line. Among single-father households, those with 5 or more children have the highest poverty rate, with 147 households (56.3%) experiencing poverty. Likewise, among single-mother households, those with 5 or more children have the highest poverty rate, with 638 households (71.6%) falling below the poverty line.
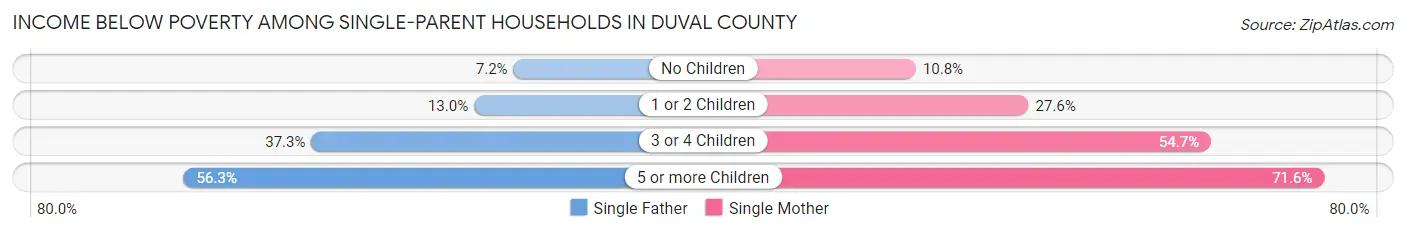
| Children | Single Father | Single Mother |
| No Children | 780 (7.2%) | 2,303 (10.8%) |
| 1 or 2 Children | 1,104 (13.0%) | 8,516 (27.6%) |
| 3 or 4 Children | 435 (37.3%) | 3,285 (54.7%) |
| 5 or more Children | 147 (56.3%) | 638 (71.6%) |
| Total | 2,466 (11.9%) | 14,742 (24.9%) |
Income Below Poverty Among Married-Couple vs Single-Parent Households in Duval County
The poverty data for Duval County shows that 8,358 of the married-couple family households (5.2%) and 17,208 of the single-parent households (21.5%) are living below the poverty level. Within the married-couple family households, those with 5 or more children have the highest poverty rate, with 232 households (21.4%) falling below the poverty line. Among the single-parent households, those with 5 or more children have the highest poverty rate, with 785 household (68.1%) living below poverty.
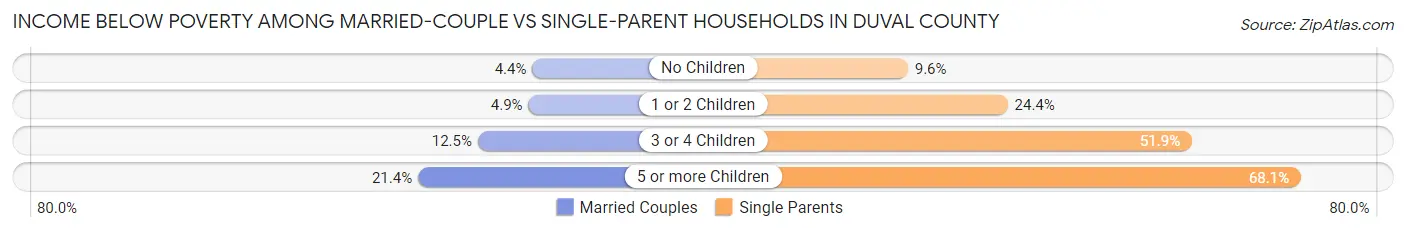
| Children | Married-Couple Families | Single-Parent Households |
| No Children | 4,186 (4.3%) | 3,083 (9.6%) |
| 1 or 2 Children | 2,544 (4.9%) | 9,620 (24.4%) |
| 3 or 4 Children | 1,396 (12.5%) | 3,720 (51.9%) |
| 5 or more Children | 232 (21.4%) | 785 (68.1%) |
| Total | 8,358 (5.2%) | 17,208 (21.5%) |
Race in Duval County
The most populous races in Duval County are White / Caucasian (544,487 | 54.7%), Black / African American (290,585 | 29.2%), and Hispanic or Latino (109,800 | 11.0%).

| Race | # Population | % Population |
| Asian | 46,991 | 4.7% |
| Black / African American | 290,585 | 29.2% |
| Hawaiian / Pacific | 729 | 0.1% |
| Hispanic or Latino | 109,800 | 11.0% |
| Native / Alaskan | 1,999 | 0.2% |
| White / Caucasian | 544,487 | 54.7% |
| Two or more Races | 77,822 | 7.8% |
| Some other Race | 33,095 | 3.3% |
| Total | 995,708 | 100.0% |
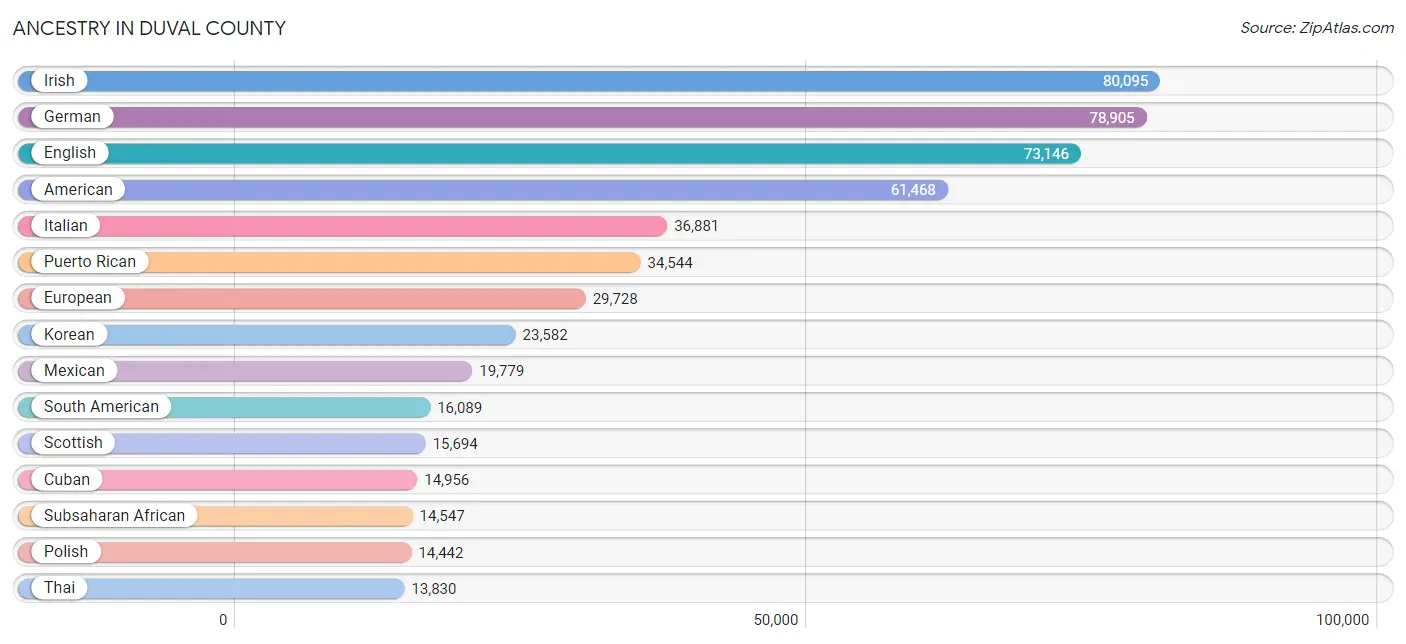
Ancestry in Duval County
The most populous ancestries reported in Duval County are Irish (80,095 | 8.0%), German (78,905 | 7.9%), English (73,146 | 7.3%), American (61,468 | 6.2%), and Italian (36,881 | 3.7%), together accounting for 33.2% of all Duval County residents.
| Ancestry | # Population | % Population |
| Afghan | 402 | 0.0% |
| African | 9,433 | 0.9% |
| Alaska Native | 12 | 0.0% |
| Alaskan Athabascan | 215 | 0.0% |
| Albanian | 3,915 | 0.4% |
| Aleut | 26 | 0.0% |
| Alsatian | 8 | 0.0% |
| American | 61,468 | 6.2% |
| Apache | 186 | 0.0% |
| Arab | 11,621 | 1.2% |
| Argentinean | 894 | 0.1% |
| Armenian | 146 | 0.0% |
| Australian | 244 | 0.0% |
| Austrian | 1,197 | 0.1% |
| Bahamian | 653 | 0.1% |
| Bangladeshi | 29 | 0.0% |
| Barbadian | 245 | 0.0% |
| Basque | 54 | 0.0% |
| Belgian | 303 | 0.0% |
| Belizean | 201 | 0.0% |
| Bhutanese | 2,595 | 0.3% |
| Blackfeet | 419 | 0.0% |
| Bolivian | 357 | 0.0% |
| Brazilian | 3,860 | 0.4% |
| British | 5,617 | 0.6% |
| British West Indian | 316 | 0.0% |
| Bulgarian | 612 | 0.1% |
| Burmese | 1,959 | 0.2% |
| Cajun | 202 | 0.0% |
| Canadian | 1,404 | 0.1% |
| Cape Verdean | 239 | 0.0% |
| Celtic | 110 | 0.0% |
| Central American | 13,820 | 1.4% |
| Central American Indian | 1,288 | 0.1% |
| Cherokee | 2,703 | 0.3% |
| Chickasaw | 123 | 0.0% |
| Chilean | 433 | 0.0% |
| Chinese | 44 | 0.0% |
| Chippewa | 68 | 0.0% |
| Choctaw | 384 | 0.0% |
| Colombian | 5,526 | 0.5% |
| Comanche | 8 | 0.0% |
| Costa Rican | 615 | 0.1% |
| Creek | 320 | 0.0% |
| Croatian | 702 | 0.1% |
| Crow | 5 | 0.0% |
| Cuban | 14,956 | 1.5% |
| Cypriot | 50 | 0.0% |
| Czech | 1,639 | 0.2% |
| Czechoslovakian | 708 | 0.1% |
| Danish | 1,125 | 0.1% |
| Delaware | 14 | 0.0% |
| Dominican | 3,713 | 0.4% |
| Dutch | 5,596 | 0.6% |
| Eastern European | 1,742 | 0.2% |
| Ecuadorian | 1,154 | 0.1% |
| Egyptian | 1,098 | 0.1% |
| English | 73,146 | 7.3% |
| Estonian | 173 | 0.0% |
| Ethiopian | 646 | 0.1% |
| European | 29,728 | 3.0% |
| Filipino | 274 | 0.0% |
| Finnish | 800 | 0.1% |
| French | 13,335 | 1.3% |
| French American Indian | 47 | 0.0% |
| French Canadian | 3,218 | 0.3% |
| German | 78,905 | 7.9% |
| German Russian | 38 | 0.0% |
| Ghanaian | 235 | 0.0% |
| Greek | 2,980 | 0.3% |
| Guamanian / Chamorro | 499 | 0.1% |
| Guatemalan | 3,338 | 0.3% |
| Guyanese | 813 | 0.1% |
| Haitian | 7,464 | 0.7% |
| Honduran | 3,939 | 0.4% |
| Hungarian | 2,567 | 0.3% |
| Icelander | 91 | 0.0% |
| Indian (Asian) | 5,981 | 0.6% |
| Indonesian | 2,137 | 0.2% |
| Iranian | 907 | 0.1% |
| Iraqi | 923 | 0.1% |
| Irish | 80,095 | 8.0% |
| Iroquois | 194 | 0.0% |
| Israeli | 180 | 0.0% |
| Italian | 36,881 | 3.7% |
| Jamaican | 6,333 | 0.6% |
| Japanese | 1,647 | 0.2% |
| Jordanian | 512 | 0.1% |
| Kenyan | 95 | 0.0% |
| Kiowa | 3 | 0.0% |
| Korean | 23,582 | 2.4% |
| Laotian | 555 | 0.1% |
| Latvian | 63 | 0.0% |
| Lebanese | 1,952 | 0.2% |
| Liberian | 72 | 0.0% |
| Lithuanian | 841 | 0.1% |
| Lumbee | 52 | 0.0% |
| Luxembourger | 16 | 0.0% |
| Macedonian | 94 | 0.0% |
| Malaysian | 870 | 0.1% |
| Maltese | 53 | 0.0% |
| Mexican | 19,779 | 2.0% |
| Mexican American Indian | 171 | 0.0% |
| Mongolian | 14 | 0.0% |
| Moroccan | 330 | 0.0% |
| Native Hawaiian | 339 | 0.0% |
| Navajo | 82 | 0.0% |
| New Zealander | 229 | 0.0% |
| Nicaraguan | 1,566 | 0.2% |
| Nigerian | 1,819 | 0.2% |
| Northern European | 906 | 0.1% |
| Norwegian | 4,451 | 0.4% |
| Okinawan | 33 | 0.0% |
| Osage | 47 | 0.0% |
| Ottawa | 32 | 0.0% |
| Paiute | 6 | 0.0% |
| Pakistani | 990 | 0.1% |
| Palestinian | 293 | 0.0% |
| Panamanian | 2,446 | 0.3% |
| Paraguayan | 20 | 0.0% |
| Pennsylvania German | 113 | 0.0% |
| Peruvian | 1,439 | 0.1% |
| Polish | 14,442 | 1.5% |
| Portuguese | 2,603 | 0.3% |
| Potawatomi | 27 | 0.0% |
| Puerto Rican | 34,544 | 3.5% |
| Romanian | 1,696 | 0.2% |
| Russian | 4,393 | 0.4% |
| Salvadoran | 1,916 | 0.2% |
| Samoan | 250 | 0.0% |
| Scandinavian | 2,001 | 0.2% |
| Scotch-Irish | 9,254 | 0.9% |
| Scottish | 15,694 | 1.6% |
| Seminole | 201 | 0.0% |
| Serbian | 786 | 0.1% |
| Shoshone | 48 | 0.0% |
| Sierra Leonean | 62 | 0.0% |
| Sioux | 60 | 0.0% |
| Slavic | 557 | 0.1% |
| Slovak | 627 | 0.1% |
| Slovene | 111 | 0.0% |
| South African | 189 | 0.0% |
| South American | 16,089 | 1.6% |
| South American Indian | 66 | 0.0% |
| Soviet Union | 8 | 0.0% |
| Spaniard | 2,408 | 0.2% |
| Spanish | 1,723 | 0.2% |
| Spanish American | 30 | 0.0% |
| Spanish American Indian | 130 | 0.0% |
| Sri Lankan | 5,510 | 0.5% |
| Subsaharan African | 14,547 | 1.5% |
| Sudanese | 433 | 0.0% |
| Swedish | 5,663 | 0.6% |
| Swiss | 1,457 | 0.2% |
| Syrian | 3,486 | 0.4% |
| Thai | 13,830 | 1.4% |
| Trinidadian and Tobagonian | 718 | 0.1% |
| Turkish | 657 | 0.1% |
| U.S. Virgin Islander | 51 | 0.0% |
| Ugandan | 11 | 0.0% |
| Ukrainian | 2,614 | 0.3% |
| Uruguayan | 449 | 0.1% |
| Venezuelan | 5,617 | 0.6% |
| Vietnamese | 608 | 0.1% |
| Welsh | 5,199 | 0.5% |
| West Indian | 1,111 | 0.1% |
| Yugoslavian | 3,809 | 0.4% | View All 167 Rows |
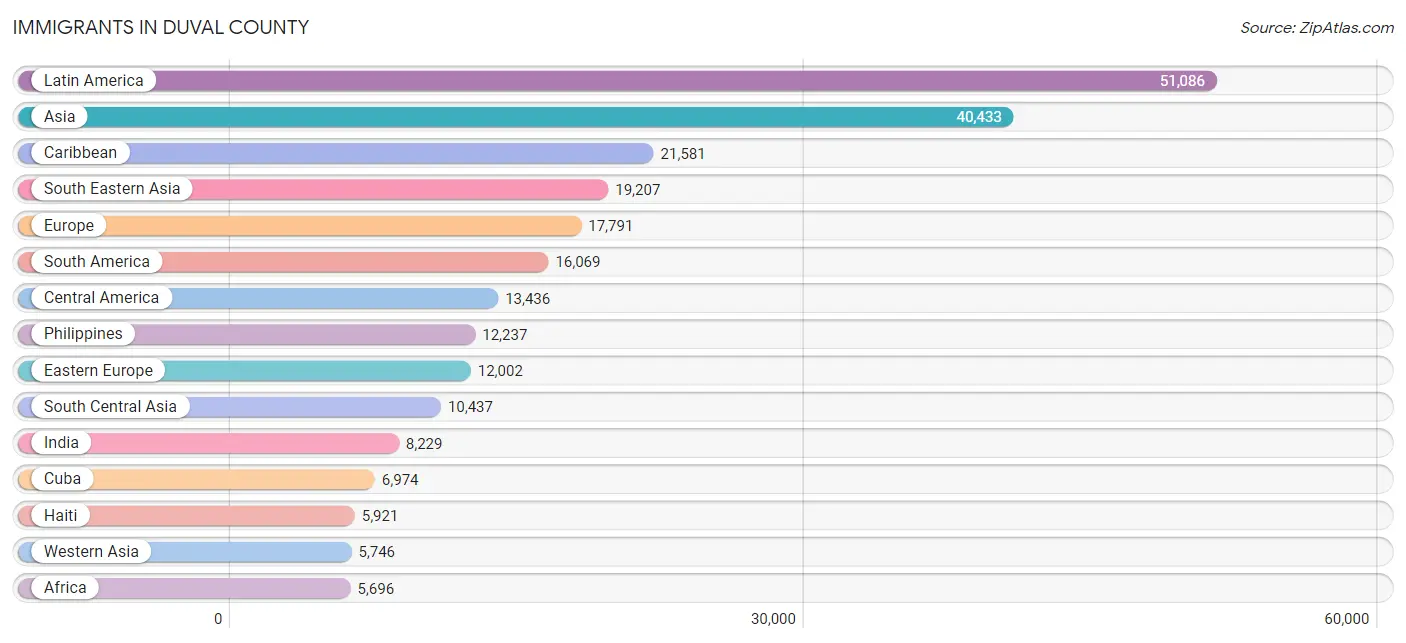
Immigrants in Duval County
The most numerous immigrant groups reported in Duval County came from Latin America (51,086 | 5.1%), Asia (40,433 | 4.1%), Caribbean (21,581 | 2.2%), South Eastern Asia (19,207 | 1.9%), and Europe (17,791 | 1.8%), together accounting for 15.1% of all Duval County residents.
| Immigration Origin | # Population | % Population |
| Afghanistan | 271 | 0.0% |
| Africa | 5,696 | 0.6% |
| Albania | 2,333 | 0.2% |
| Argentina | 528 | 0.1% |
| Asia | 40,433 | 4.1% |
| Australia | 128 | 0.0% |
| Austria | 239 | 0.0% |
| Bahamas | 499 | 0.1% |
| Bangladesh | 712 | 0.1% |
| Barbados | 278 | 0.0% |
| Belarus | 194 | 0.0% |
| Belgium | 123 | 0.0% |
| Belize | 124 | 0.0% |
| Bolivia | 222 | 0.0% |
| Bosnia and Herzegovina | 3,588 | 0.4% |
| Brazil | 3,679 | 0.4% |
| Bulgaria | 257 | 0.0% |
| Cambodia | 826 | 0.1% |
| Cameroon | 23 | 0.0% |
| Canada | 1,850 | 0.2% |
| Caribbean | 21,581 | 2.2% |
| Central America | 13,436 | 1.3% |
| Chile | 265 | 0.0% |
| China | 2,624 | 0.3% |
| Colombia | 3,497 | 0.4% |
| Congo | 43 | 0.0% |
| Costa Rica | 442 | 0.0% |
| Croatia | 310 | 0.0% |
| Cuba | 6,974 | 0.7% |
| Czechoslovakia | 101 | 0.0% |
| Denmark | 59 | 0.0% |
| Dominica | 174 | 0.0% |
| Dominican Republic | 1,924 | 0.2% |
| Eastern Africa | 1,425 | 0.1% |
| Eastern Asia | 4,859 | 0.5% |
| Eastern Europe | 12,002 | 1.2% |
| Ecuador | 785 | 0.1% |
| Egypt | 568 | 0.1% |
| El Salvador | 1,231 | 0.1% |
| England | 719 | 0.1% |
| Eritrea | 6 | 0.0% |
| Ethiopia | 785 | 0.1% |
| Europe | 17,791 | 1.8% |
| Fiji | 20 | 0.0% |
| France | 222 | 0.0% |
| Germany | 1,650 | 0.2% |
| Ghana | 227 | 0.0% |
| Greece | 156 | 0.0% |
| Grenada | 68 | 0.0% |
| Guatemala | 2,054 | 0.2% |
| Guyana | 647 | 0.1% |
| Haiti | 5,921 | 0.6% |
| Honduras | 2,461 | 0.3% |
| Hong Kong | 133 | 0.0% |
| Hungary | 169 | 0.0% |
| India | 8,229 | 0.8% |
| Indonesia | 207 | 0.0% |
| Iran | 560 | 0.1% |
| Iraq | 1,307 | 0.1% |
| Ireland | 219 | 0.0% |
| Israel | 354 | 0.0% |
| Italy | 268 | 0.0% |
| Jamaica | 4,314 | 0.4% |
| Japan | 1,236 | 0.1% |
| Jordan | 670 | 0.1% |
| Kazakhstan | 85 | 0.0% |
| Kenya | 206 | 0.0% |
| Korea | 999 | 0.1% |
| Kuwait | 168 | 0.0% |
| Laos | 240 | 0.0% |
| Latin America | 51,086 | 5.1% |
| Latvia | 6 | 0.0% |
| Lebanon | 313 | 0.0% |
| Liberia | 532 | 0.1% |
| Lithuania | 53 | 0.0% |
| Malaysia | 80 | 0.0% |
| Mexico | 5,436 | 0.5% |
| Middle Africa | 80 | 0.0% |
| Moldova | 627 | 0.1% |
| Morocco | 221 | 0.0% |
| Nepal | 33 | 0.0% |
| Netherlands | 95 | 0.0% |
| Nicaragua | 810 | 0.1% |
| Nigeria | 879 | 0.1% |
| Northern Africa | 1,098 | 0.1% |
| Northern Europe | 2,386 | 0.2% |
| Norway | 99 | 0.0% |
| Oceania | 369 | 0.0% |
| Pakistan | 318 | 0.0% |
| Panama | 878 | 0.1% |
| Peru | 1,000 | 0.1% |
| Philippines | 12,237 | 1.2% |
| Poland | 412 | 0.0% |
| Portugal | 240 | 0.0% |
| Romania | 477 | 0.1% |
| Russia | 1,026 | 0.1% |
| Saudi Arabia | 173 | 0.0% |
| Scotland | 106 | 0.0% |
| Senegal | 127 | 0.0% |
| Serbia | 459 | 0.1% |
| Sierra Leone | 11 | 0.0% |
| Singapore | 61 | 0.0% |
| South Africa | 355 | 0.0% |
| South America | 16,069 | 1.6% |
| South Central Asia | 10,437 | 1.1% |
| South Eastern Asia | 19,207 | 1.9% |
| Southern Europe | 1,008 | 0.1% |
| Spain | 344 | 0.0% |
| Sudan | 261 | 0.0% |
| Sweden | 86 | 0.0% |
| Switzerland | 54 | 0.0% |
| Syria | 2,158 | 0.2% |
| Taiwan | 180 | 0.0% |
| Thailand | 877 | 0.1% |
| Trinidad and Tobago | 1,035 | 0.1% |
| Turkey | 255 | 0.0% |
| Uganda | 51 | 0.0% |
| Ukraine | 1,545 | 0.2% |
| Uruguay | 288 | 0.0% |
| Uzbekistan | 74 | 0.0% |
| Venezuela | 5,077 | 0.5% |
| Vietnam | 3,420 | 0.3% |
| Western Africa | 2,199 | 0.2% |
| Western Asia | 5,746 | 0.6% |
| Western Europe | 2,383 | 0.2% |
| Zaire | 14 | 0.0% |
| Zimbabwe | 24 | 0.0% | View All 127 Rows |
Sex and Age in Duval County
Sex and Age in Duval County
The most populous age groups in Duval County are 25 to 29 Years (40,010 | 8.3%) for men and 30 to 34 Years (40,495 | 7.9%) for women.
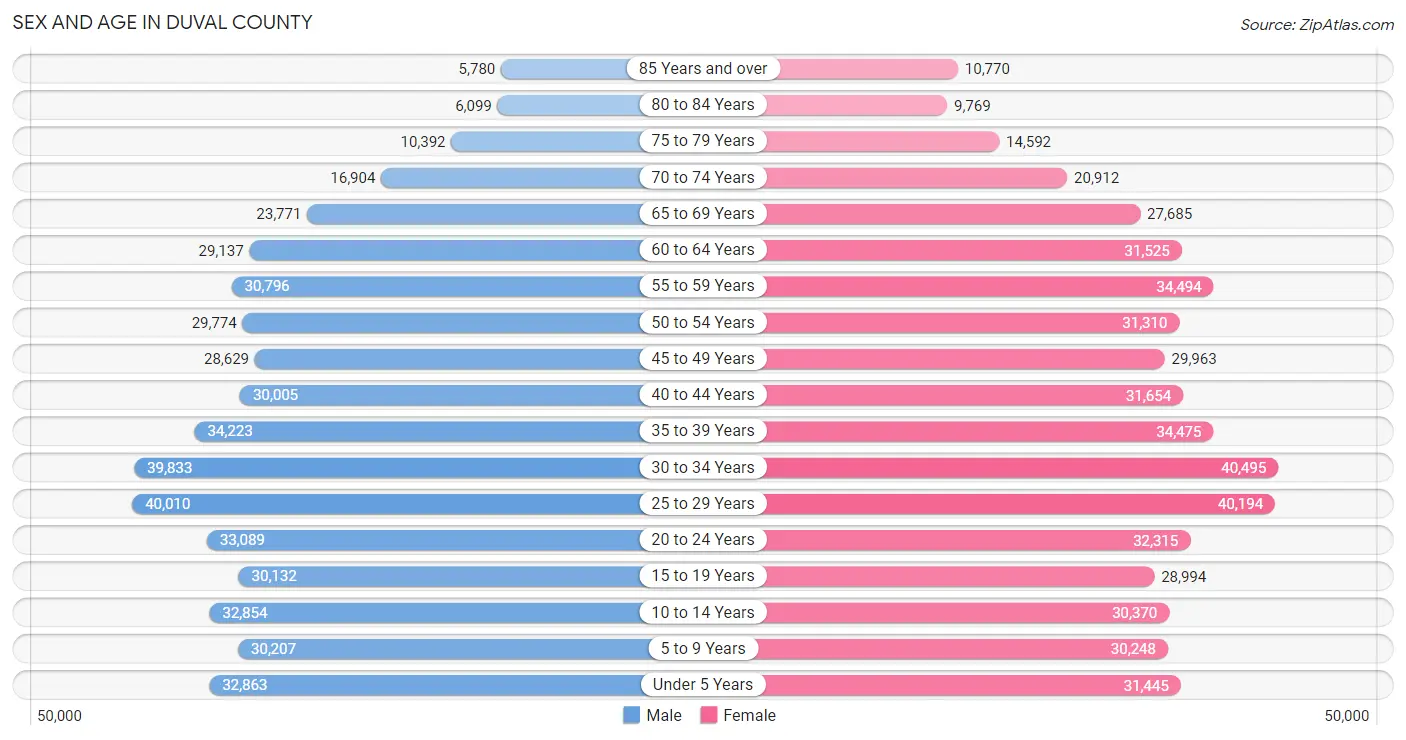
| Age Bracket | Male | Female |
| Under 5 Years | 32,863 (6.8%) | 31,445 (6.1%) |
| 5 to 9 Years | 30,207 (6.2%) | 30,248 (5.9%) |
| 10 to 14 Years | 32,854 (6.8%) | 30,370 (5.9%) |
| 15 to 19 Years | 30,132 (6.2%) | 28,994 (5.7%) |
| 20 to 24 Years | 33,089 (6.8%) | 32,315 (6.3%) |
| 25 to 29 Years | 40,010 (8.3%) | 40,194 (7.9%) |
| 30 to 34 Years | 39,833 (8.2%) | 40,495 (7.9%) |
| 35 to 39 Years | 34,223 (7.1%) | 34,475 (6.7%) |
| 40 to 44 Years | 30,005 (6.2%) | 31,654 (6.2%) |
| 45 to 49 Years | 28,629 (5.9%) | 29,963 (5.9%) |
| 50 to 54 Years | 29,774 (6.1%) | 31,310 (6.1%) |
| 55 to 59 Years | 30,796 (6.4%) | 34,494 (6.8%) |
| 60 to 64 Years | 29,137 (6.0%) | 31,525 (6.2%) |
| 65 to 69 Years | 23,771 (4.9%) | 27,685 (5.4%) |
| 70 to 74 Years | 16,904 (3.5%) | 20,912 (4.1%) |
| 75 to 79 Years | 10,392 (2.1%) | 14,592 (2.9%) |
| 80 to 84 Years | 6,099 (1.3%) | 9,769 (1.9%) |
| 85 Years and over | 5,780 (1.2%) | 10,770 (2.1%) |
| Total | 484,498 (100.0%) | 511,210 (100.0%) |
Families and Households in Duval County
Median Family Size in Duval County
The median family size in Duval County is 3.13 persons per family, with single female/mother families (59,183 | 24.6%) accounting for the largest median family size of 3.17 persons per family. On the other hand, single male/father families (20,795 | 8.7%) represent the smallest median family size with 2.81 persons per family.
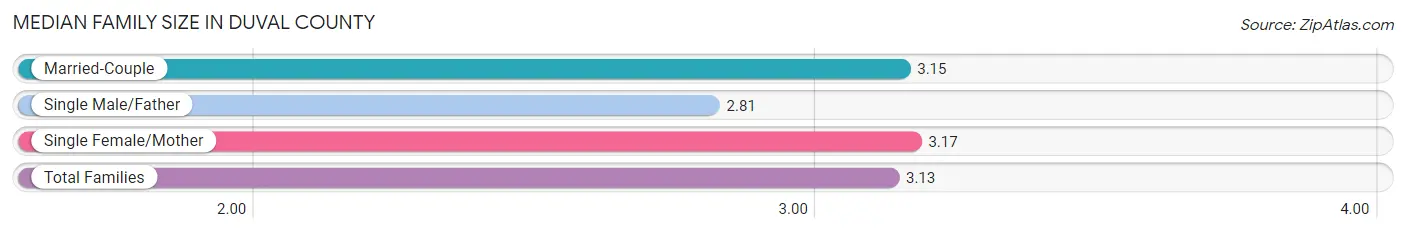
| Family Type | # Families | Family Size |
| Married-Couple | 160,157 (66.7%) | 3.15 |
| Single Male/Father | 20,795 (8.7%) | 2.81 |
| Single Female/Mother | 59,183 (24.6%) | 3.17 |
| Total Families | 240,135 (100.0%) | 3.13 |
Median Household Size in Duval County
The median household size in Duval County is 2.45 persons per household, with single female/mother households (59,183 | 14.9%) accounting for the largest median household size of 3.38 persons per household. non-family households (155,997 | 39.4%) represent the smallest median household size with 1.26 persons per household.
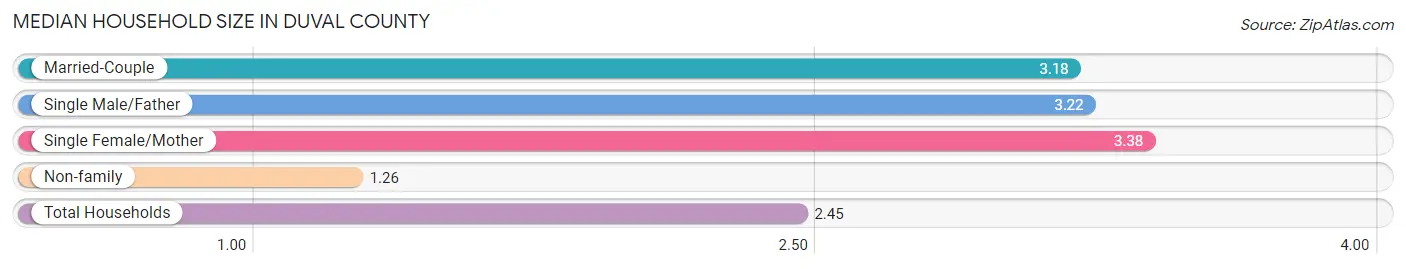
| Household Type | # Households | Household Size |
| Married-Couple | 160,157 (40.4%) | 3.18 |
| Single Male/Father | 20,795 (5.2%) | 3.22 |
| Single Female/Mother | 59,183 (14.9%) | 3.38 |
| Non-family | 155,997 (39.4%) | 1.26 |
| Total Households | 396,132 (100.0%) | 2.45 |
Household Size by Marriage Status in Duval County
Out of a total of 396,132 households in Duval County, 240,135 (60.6%) are family households, while 155,997 (39.4%) are nonfamily households. The most numerous type of family households are 2-person households, comprising 107,382, and the most common type of nonfamily households are 1-person households, comprising 126,338.
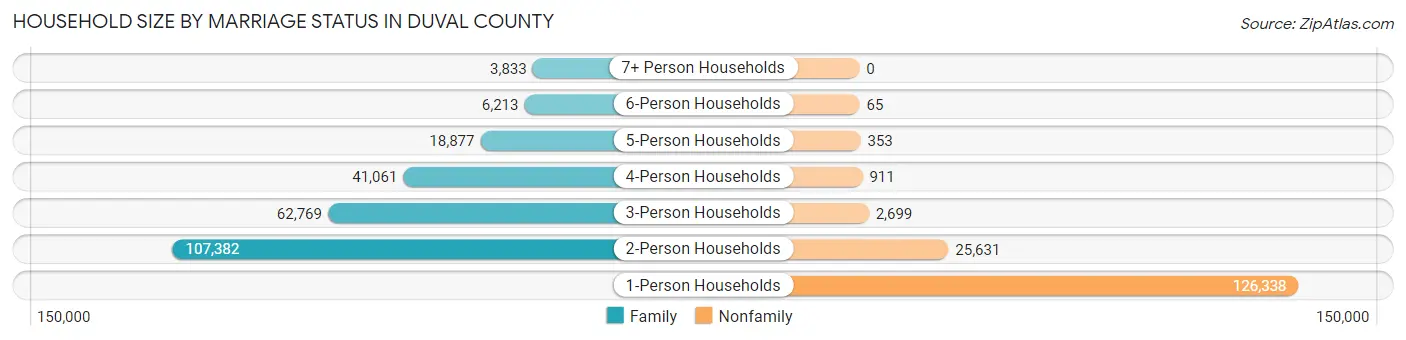
| Household Size | Family Households | Nonfamily Households |
| 1-Person Households | - | 126,338 (31.9%) |
| 2-Person Households | 107,382 (27.1%) | 25,631 (6.5%) |
| 3-Person Households | 62,769 (15.9%) | 2,699 (0.7%) |
| 4-Person Households | 41,061 (10.4%) | 911 (0.2%) |
| 5-Person Households | 18,877 (4.8%) | 353 (0.1%) |
| 6-Person Households | 6,213 (1.6%) | 65 (0.0%) |
| 7+ Person Households | 3,833 (1.0%) | 0 (0.0%) |
| Total | 240,135 (60.6%) | 155,997 (39.4%) |
Female Fertility in Duval County
Fertility by Age in Duval County
Average fertility rate in Duval County is 63.0 births per 1,000 women. Women in the age bracket of 20 to 34 years have the highest fertility rate with 101.0 births per 1,000 women. Women in the age bracket of 20 to 34 years acount for 74.1% of all women with births.
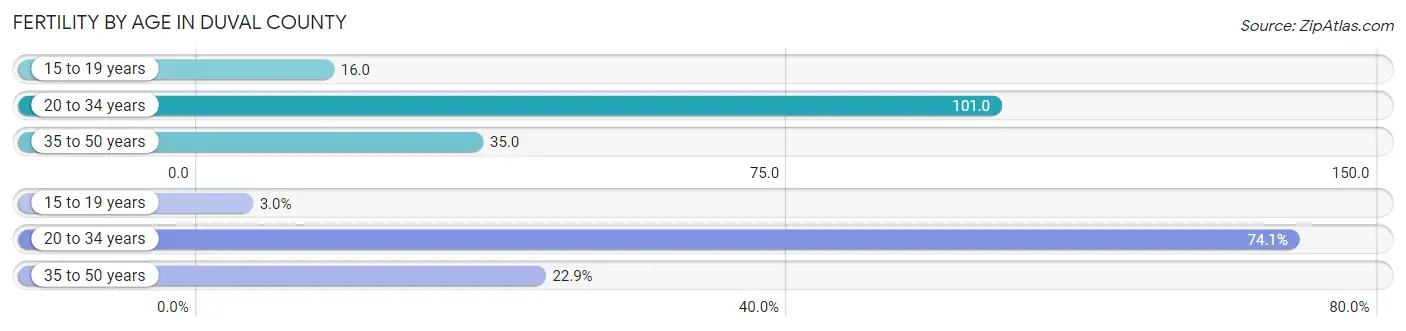
| Age Bracket | Women with Births | Births / 1,000 Women |
| 15 to 19 years | 468 (3.0%) | 16.0 |
| 20 to 34 years | 11,459 (74.1%) | 101.0 |
| 35 to 50 years | 3,542 (22.9%) | 35.0 |
| Total | 15,469 (100.0%) | 63.0 |
Fertility by Age by Marriage Status in Duval County
61.5% of women with births (15,469) in Duval County are married. The highest percentage of unmarried women with births falls into 15 to 19 years age bracket with 100.0% of them unmarried at the time of birth, while the lowest percentage of unmarried women with births belong to 35 to 50 years age bracket with 24.8% of them unmarried.
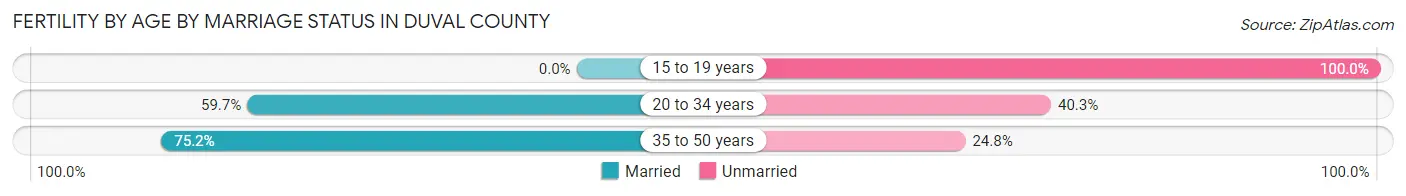
| Age Bracket | Married | Unmarried |
| 15 to 19 years | 0 (0.0%) | 468 (100.0%) |
| 20 to 34 years | 6,841 (59.7%) | 4,618 (40.3%) |
| 35 to 50 years | 2,664 (75.2%) | 878 (24.8%) |
| Total | 9,513 (61.5%) | 5,956 (38.5%) |
Fertility by Education in Duval County
Average fertility rate in Duval County is 63.0 births per 1,000 women. Women with the education attainment of graduate degree have the highest fertility rate of 72.0 births per 1,000 women, while women with the education attainment of less than high school have the lowest fertility at 53.0 births per 1,000 women. Women with the education attainment of college or associate's degree represent 33.0% of all women with births.
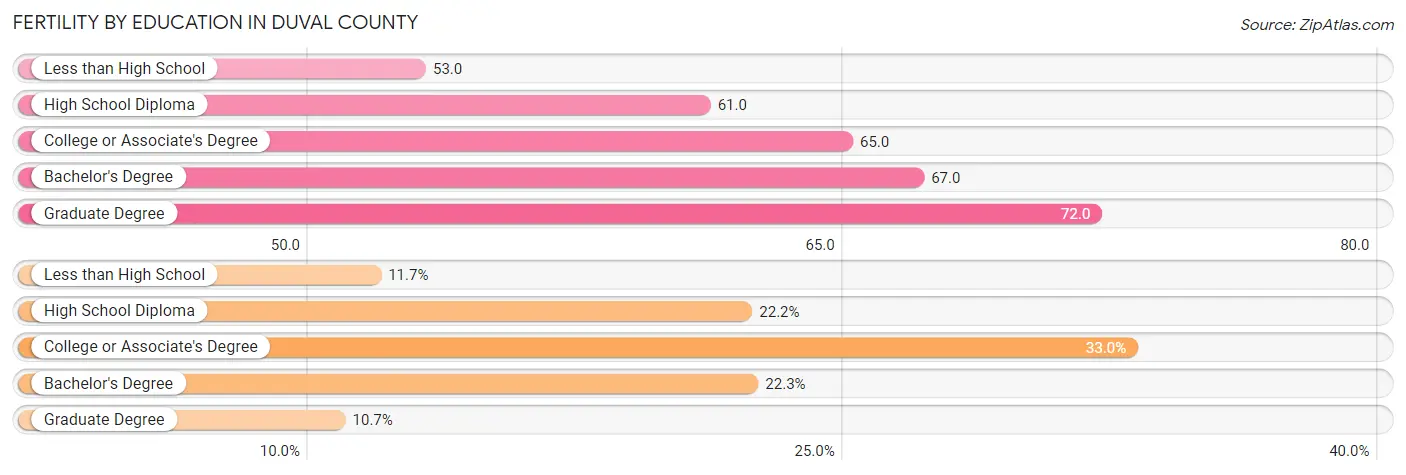
| Educational Attainment | Women with Births | Births / 1,000 Women |
| Less than High School | 1,816 (11.7%) | 53.0 |
| High School Diploma | 3,430 (22.2%) | 61.0 |
| College or Associate's Degree | 5,106 (33.0%) | 65.0 |
| Bachelor's Degree | 3,456 (22.3%) | 67.0 |
| Graduate Degree | 1,661 (10.7%) | 72.0 |
| Total | 15,469 (100.0%) | 63.0 |
Fertility by Education by Marriage Status in Duval County
38.5% of women with births in Duval County are unmarried. Women with the educational attainment of graduate degree are most likely to be married with 86.4% of them married at childbirth, while women with the educational attainment of high school diploma are least likely to be married with 64.7% of them unmarried at childbirth.
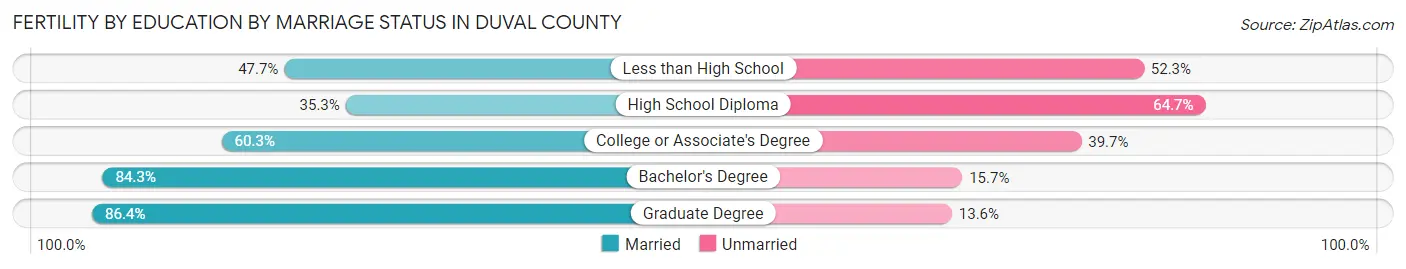
| Educational Attainment | Married | Unmarried |
| Less than High School | 866 (47.7%) | 950 (52.3%) |
| High School Diploma | 1,211 (35.3%) | 2,219 (64.7%) |
| College or Associate's Degree | 3,079 (60.3%) | 2,027 (39.7%) |
| Bachelor's Degree | 2,913 (84.3%) | 543 (15.7%) |
| Graduate Degree | 1,435 (86.4%) | 226 (13.6%) |
| Total | 9,513 (61.5%) | 5,956 (38.5%) |
Employment Characteristics in Duval County
Employment by Class of Employer in Duval County
Among the 489,335 employed individuals in Duval County, private company employees (335,691 | 68.6%), not-for-profit organizations (43,945 | 9.0%), and federal government employees (30,289 | 6.2%) make up the most common classes of employment.
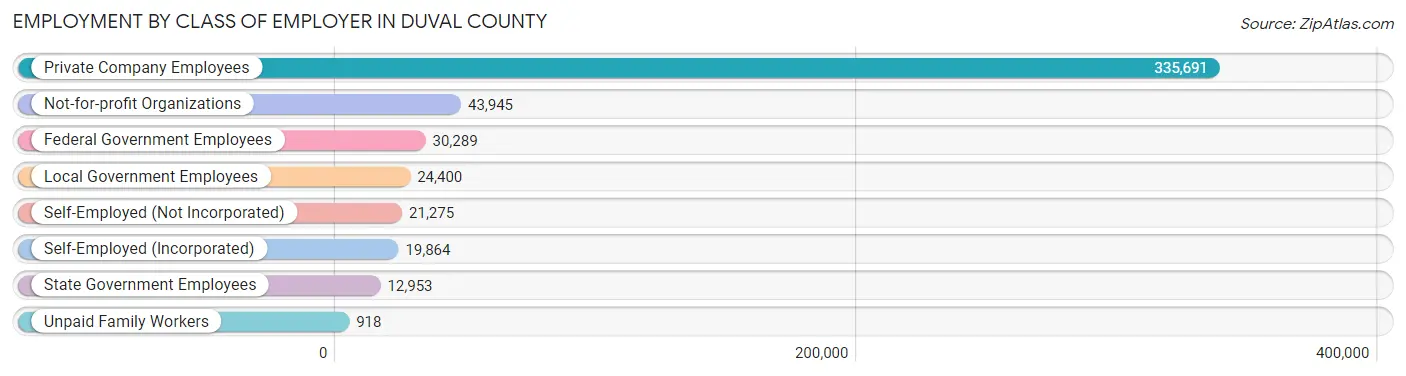
| Employer Class | # Employees | % Employees |
| Private Company Employees | 335,691 | 68.6% |
| Self-Employed (Incorporated) | 19,864 | 4.1% |
| Self-Employed (Not Incorporated) | 21,275 | 4.3% |
| Not-for-profit Organizations | 43,945 | 9.0% |
| Local Government Employees | 24,400 | 5.0% |
| State Government Employees | 12,953 | 2.6% |
| Federal Government Employees | 30,289 | 6.2% |
| Unpaid Family Workers | 918 | 0.2% |
| Total | 489,335 | 100.0% |
Employment Status by Age in Duval County
According to the labor force statistics for Duval County, out of the total population over 16 years of age (796,287), 65.6% or 522,364 individuals are in the labor force, with 4.7% or 24,551 of them unemployed. The age group with the highest labor force participation rate is 25 to 29 years, with 85.8% or 68,815 individuals in the labor force. Within the labor force, the 16 to 19 years age range has the highest percentage of unemployed individuals, with 14.5% or 2,552 of them being unemployed.
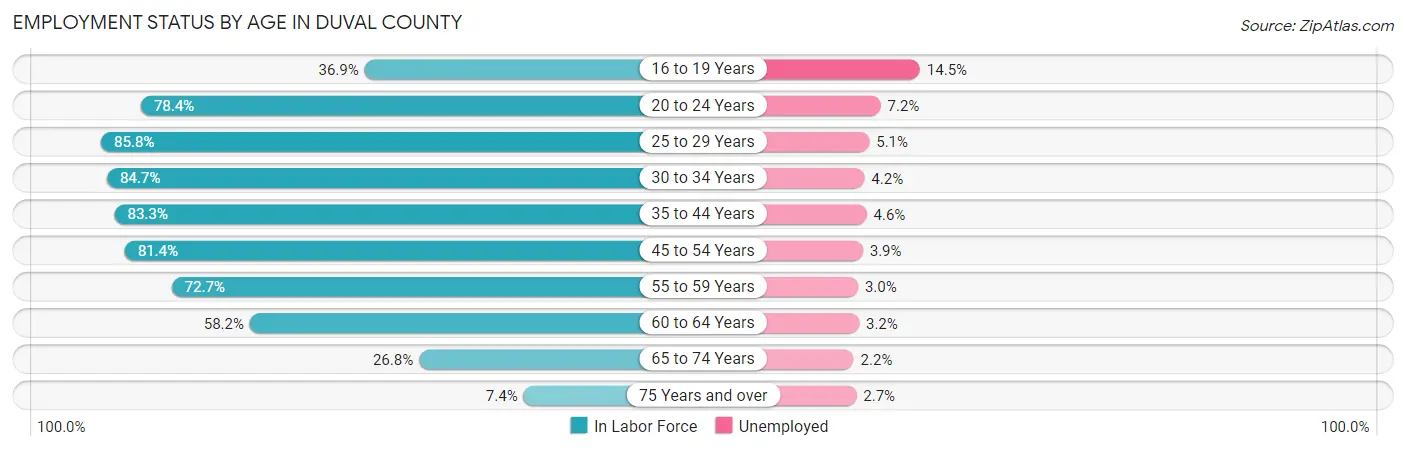
| Age Bracket | In Labor Force | Unemployed |
| 16 to 19 Years | 17,598 (36.9%) | 2,552 (14.5%) |
| 20 to 24 Years | 51,277 (78.4%) | 3,692 (7.2%) |
| 25 to 29 Years | 68,815 (85.8%) | 3,510 (5.1%) |
| 30 to 34 Years | 68,038 (84.7%) | 2,858 (4.2%) |
| 35 to 44 Years | 108,587 (83.3%) | 4,995 (4.6%) |
| 45 to 54 Years | 97,416 (81.4%) | 3,799 (3.9%) |
| 55 to 59 Years | 47,466 (72.7%) | 1,424 (3.0%) |
| 60 to 64 Years | 35,305 (58.2%) | 1,130 (3.2%) |
| 65 to 74 Years | 23,925 (26.8%) | 526 (2.2%) |
| 75 Years and over | 4,248 (7.4%) | 115 (2.7%) |
| Total | 522,364 (65.6%) | 24,551 (4.7%) |
Employment Status by Educational Attainment in Duval County
According to labor force statistics for Duval County, 79.3% of individuals (425,458) out of the total population between 25 and 64 years of age (536,517) are in the labor force, with 4.1% or 17,444 of them being unemployed. The group with the highest labor force participation rate are those with the educational attainment of bachelor's degree or higher, with 86.9% or 153,451 individuals in the labor force. Within the labor force, individuals with less than high school education have the highest percentage of unemployment, with 8.2% or 2,350 of them being unemployed.
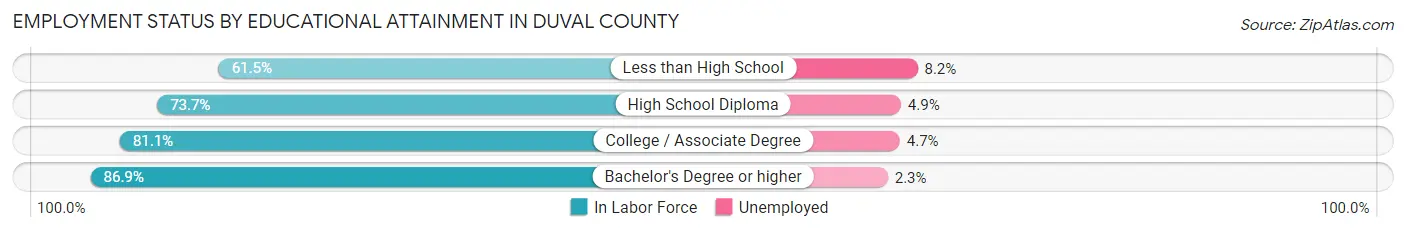
| Educational Attainment | In Labor Force | Unemployed |
| Less than High School | 28,658 (61.5%) | 3,821 (8.2%) |
| High School Diploma | 106,576 (73.7%) | 7,086 (4.9%) |
| College / Associate Degree | 136,838 (81.1%) | 7,930 (4.7%) |
| Bachelor's Degree or higher | 153,451 (86.9%) | 4,061 (2.3%) |
| Total | 425,458 (79.3%) | 21,997 (4.1%) |
Employment Occupations by Sex in Duval County
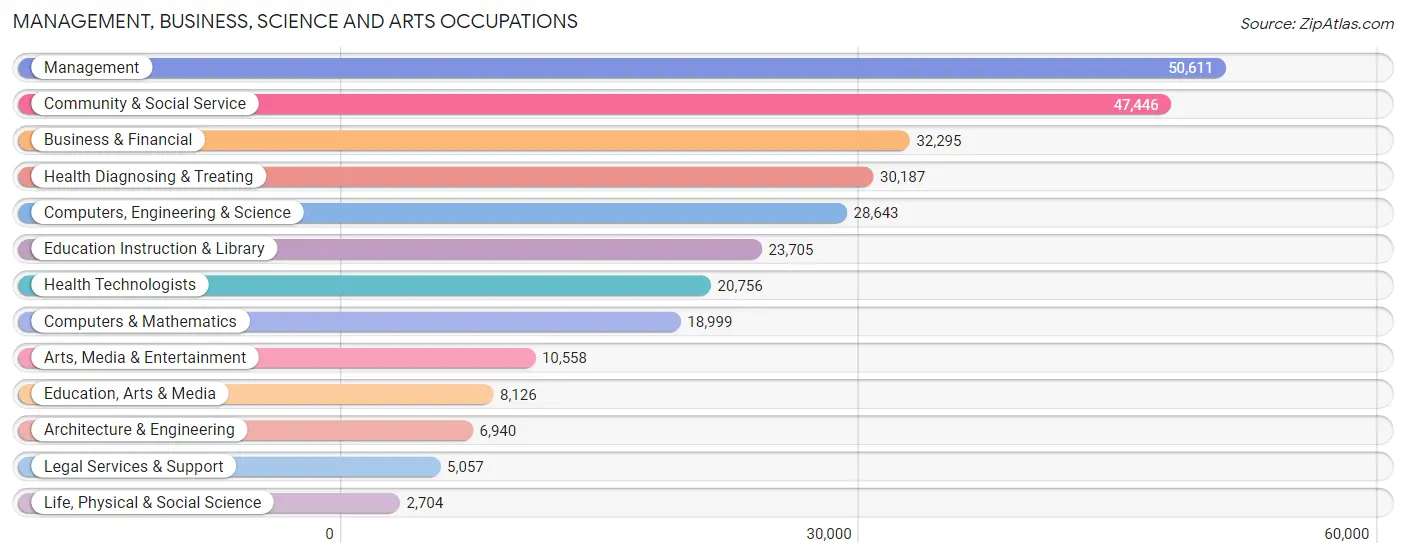
Management, Business, Science and Arts Occupations
The most common Management, Business, Science and Arts occupations in Duval County are Management (50,611 | 10.4%), Community & Social Service (47,446 | 9.8%), Business & Financial (32,295 | 6.7%), Health Diagnosing & Treating (30,187 | 6.2%), and Computers, Engineering & Science (28,643 | 5.9%).
Management, Business, Science and Arts Occupations by Sex
Within the Management, Business, Science and Arts occupations in Duval County, the most male-oriented occupations are Architecture & Engineering (86.8%), Computers, Engineering & Science (71.6%), and Computers & Mathematics (69.5%), while the most female-oriented occupations are Health Technologists (76.5%), Health Diagnosing & Treating (75.6%), and Education Instruction & Library (75.2%).
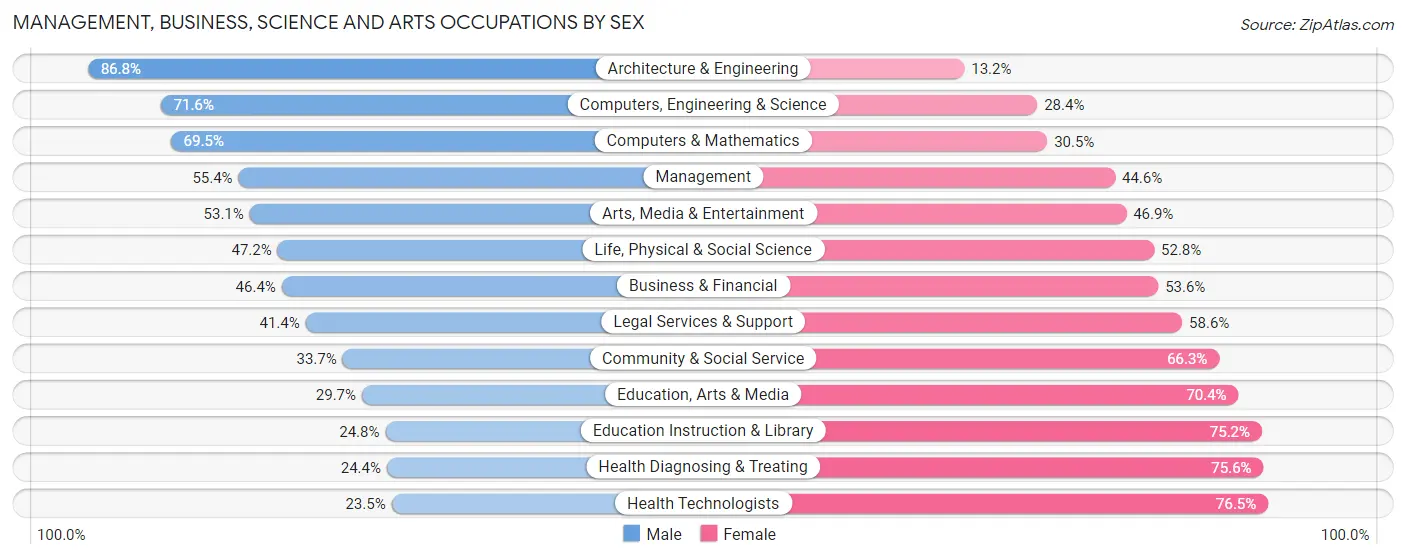
| Occupation | Male | Female |
| Management | 28,034 (55.4%) | 22,577 (44.6%) |
| Business & Financial | 14,977 (46.4%) | 17,318 (53.6%) |
| Computers, Engineering & Science | 20,515 (71.6%) | 8,128 (28.4%) |
| Computers & Mathematics | 13,212 (69.5%) | 5,787 (30.5%) |
| Architecture & Engineering | 6,026 (86.8%) | 914 (13.2%) |
| Life, Physical & Social Science | 1,277 (47.2%) | 1,427 (52.8%) |
| Community & Social Service | 15,973 (33.7%) | 31,473 (66.3%) |
| Education, Arts & Media | 2,409 (29.6%) | 5,717 (70.4%) |
| Legal Services & Support | 2,093 (41.4%) | 2,964 (58.6%) |
| Education Instruction & Library | 5,869 (24.8%) | 17,836 (75.2%) |
| Arts, Media & Entertainment | 5,602 (53.1%) | 4,956 (46.9%) |
| Health Diagnosing & Treating | 7,378 (24.4%) | 22,809 (75.6%) |
| Health Technologists | 4,870 (23.5%) | 15,886 (76.5%) |
| Total (Category) | 86,877 (45.9%) | 102,305 (54.1%) |
| Total (Overall) | 249,793 (51.6%) | 234,298 (48.4%) |
Services Occupations
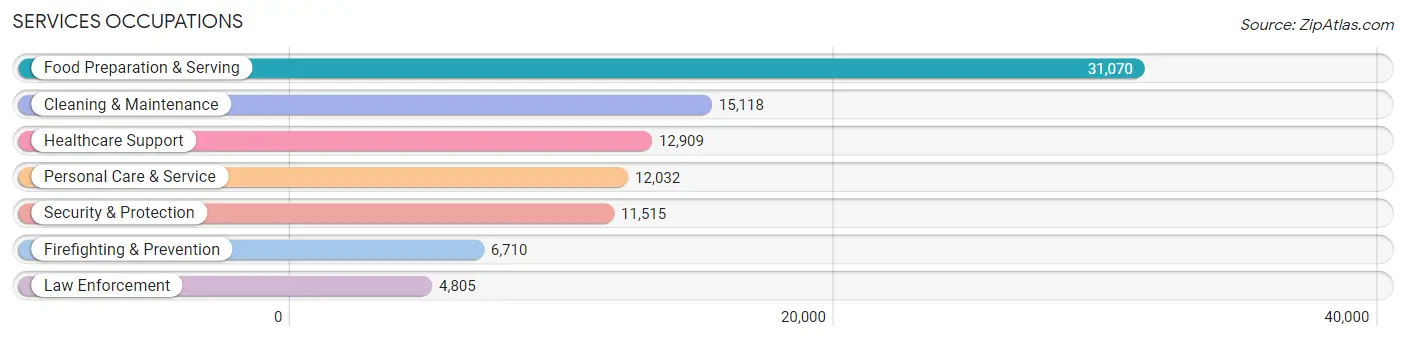
The most common Services occupations in Duval County are Food Preparation & Serving (31,070 | 6.4%), Cleaning & Maintenance (15,118 | 3.1%), Healthcare Support (12,909 | 2.7%), Personal Care & Service (12,032 | 2.5%), and Security & Protection (11,515 | 2.4%).
Services Occupations by Sex
Within the Services occupations in Duval County, the most male-oriented occupations are Law Enforcement (81.9%), Security & Protection (69.9%), and Firefighting & Prevention (61.2%), while the most female-oriented occupations are Healthcare Support (86.5%), Personal Care & Service (72.5%), and Food Preparation & Serving (50.2%).
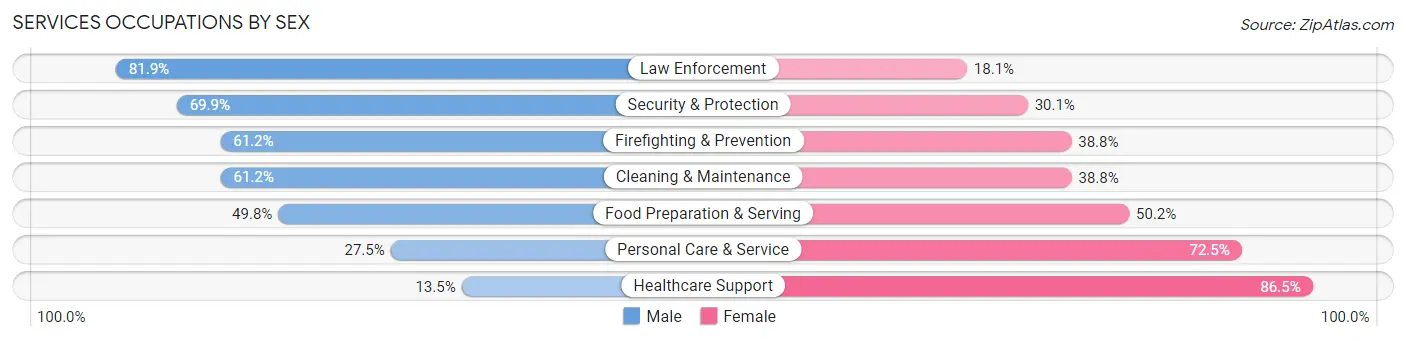
| Occupation | Male | Female |
| Healthcare Support | 1,742 (13.5%) | 11,167 (86.5%) |
| Security & Protection | 8,045 (69.9%) | 3,470 (30.1%) |
| Firefighting & Prevention | 4,109 (61.2%) | 2,601 (38.8%) |
| Law Enforcement | 3,936 (81.9%) | 869 (18.1%) |
| Food Preparation & Serving | 15,469 (49.8%) | 15,601 (50.2%) |
| Cleaning & Maintenance | 9,251 (61.2%) | 5,867 (38.8%) |
| Personal Care & Service | 3,313 (27.5%) | 8,719 (72.5%) |
| Total (Category) | 37,820 (45.8%) | 44,824 (54.2%) |
| Total (Overall) | 249,793 (51.6%) | 234,298 (48.4%) |
Sales and Office Occupations
The most common Sales and Office occupations in Duval County are Office & Administration (63,082 | 13.0%), and Sales & Related (50,627 | 10.5%).

Sales and Office Occupations by Sex
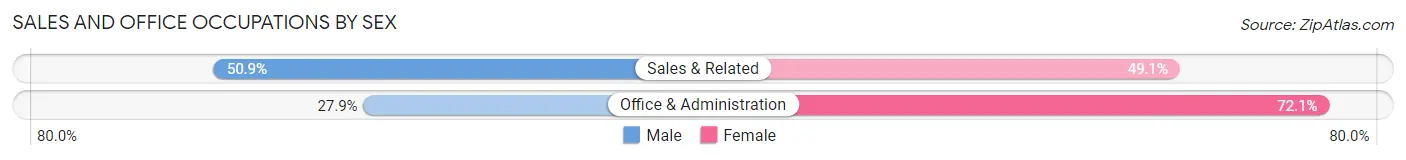
| Occupation | Male | Female |
| Sales & Related | 25,762 (50.9%) | 24,865 (49.1%) |
| Office & Administration | 17,578 (27.9%) | 45,504 (72.1%) |
| Total (Category) | 43,340 (38.1%) | 70,369 (61.9%) |
| Total (Overall) | 249,793 (51.6%) | 234,298 (48.4%) |
Natural Resources, Construction and Maintenance Occupations
The most common Natural Resources, Construction and Maintenance occupations in Duval County are Construction & Extraction (21,370 | 4.4%), Installation, Maintenance & Repair (16,194 | 3.4%), and Farming, Fishing & Forestry (767 | 0.2%).

Natural Resources, Construction and Maintenance Occupations by Sex
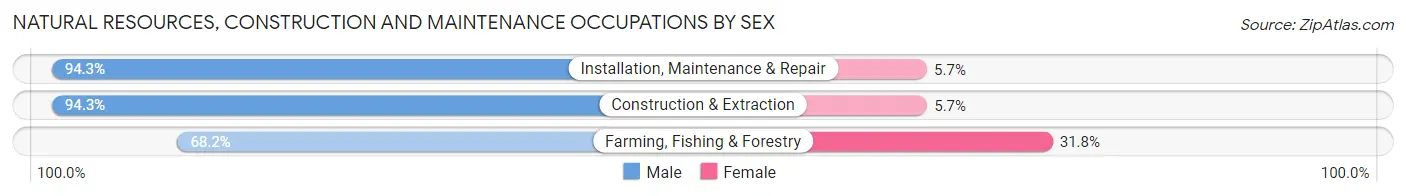
| Occupation | Male | Female |
| Farming, Fishing & Forestry | 523 (68.2%) | 244 (31.8%) |
| Construction & Extraction | 20,154 (94.3%) | 1,216 (5.7%) |
| Installation, Maintenance & Repair | 15,275 (94.3%) | 919 (5.7%) |
| Total (Category) | 35,952 (93.8%) | 2,379 (6.2%) |
| Total (Overall) | 249,793 (51.6%) | 234,298 (48.4%) |
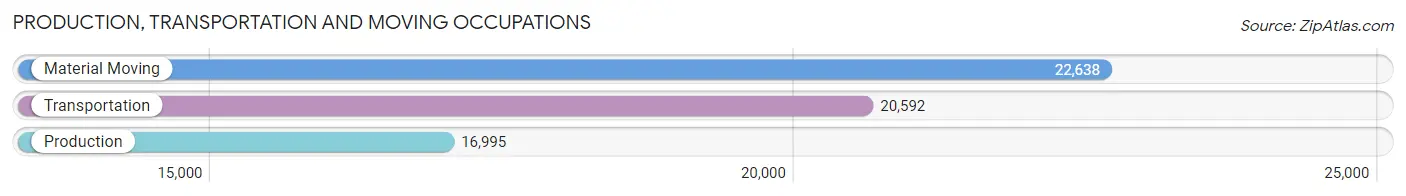
Production, Transportation and Moving Occupations
The most common Production, Transportation and Moving occupations in Duval County are Material Moving (22,638 | 4.7%), Transportation (20,592 | 4.3%), and Production (16,995 | 3.5%).
Production, Transportation and Moving Occupations by Sex
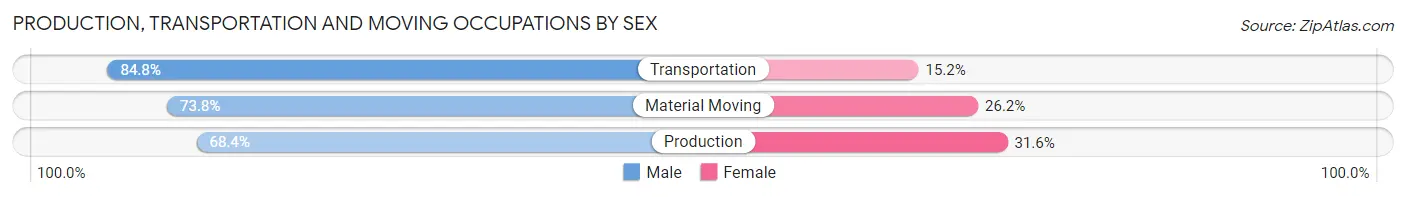
| Occupation | Male | Female |
| Production | 11,631 (68.4%) | 5,364 (31.6%) |
| Transportation | 17,456 (84.8%) | 3,136 (15.2%) |
| Material Moving | 16,717 (73.8%) | 5,921 (26.2%) |
| Total (Category) | 45,804 (76.0%) | 14,421 (23.9%) |
| Total (Overall) | 249,793 (51.6%) | 234,298 (48.4%) |
Employment Industries by Sex in Duval County
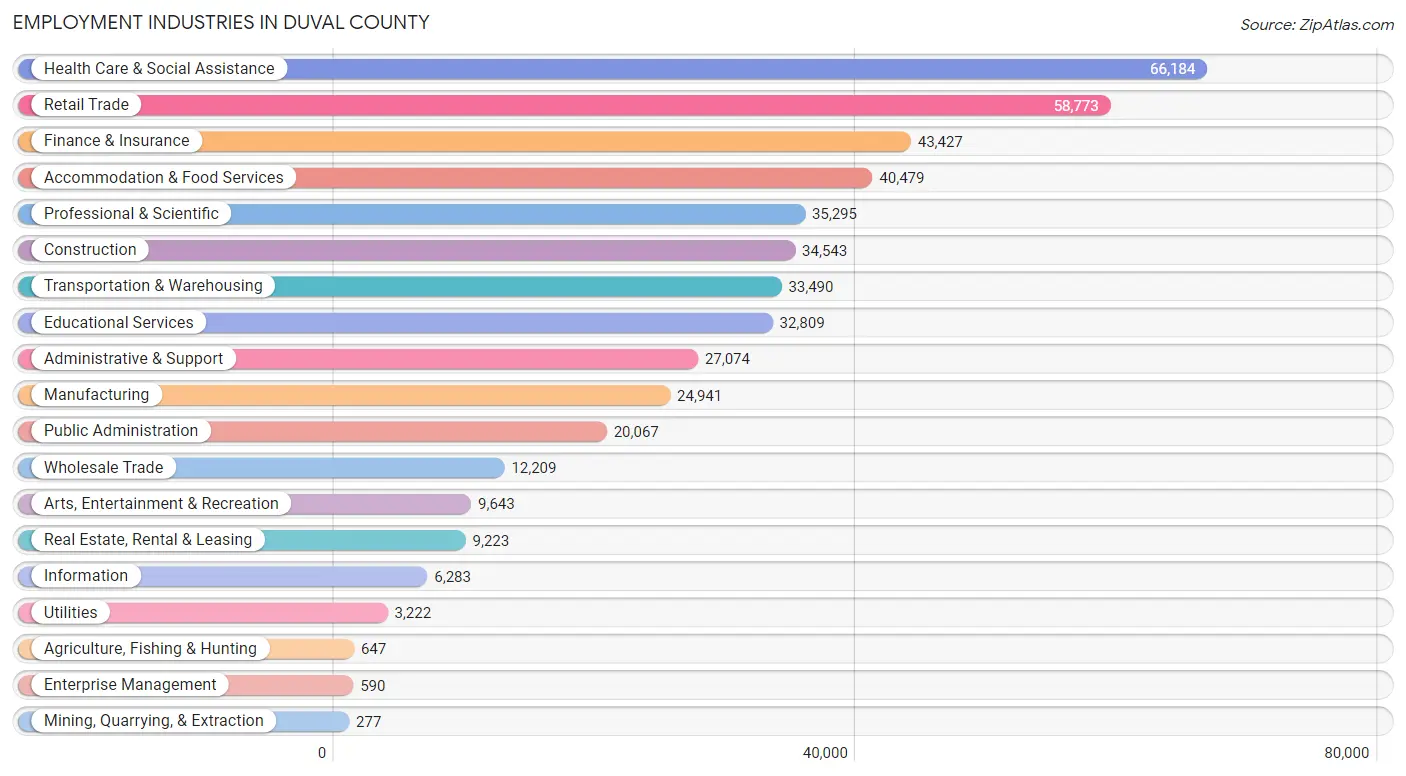
Employment Industries in Duval County
The major employment industries in Duval County include Health Care & Social Assistance (66,184 | 13.7%), Retail Trade (58,773 | 12.1%), Finance & Insurance (43,427 | 9.0%), Accommodation & Food Services (40,479 | 8.4%), and Professional & Scientific (35,295 | 7.3%).
Employment Industries by Sex in Duval County
The Duval County industries that see more men than women are Mining, Quarrying, & Extraction (88.1%), Construction (83.3%), and Utilities (78.1%), whereas the industries that tend to have a higher number of women are Health Care & Social Assistance (77.7%), Educational Services (72.4%), and Finance & Insurance (57.6%).
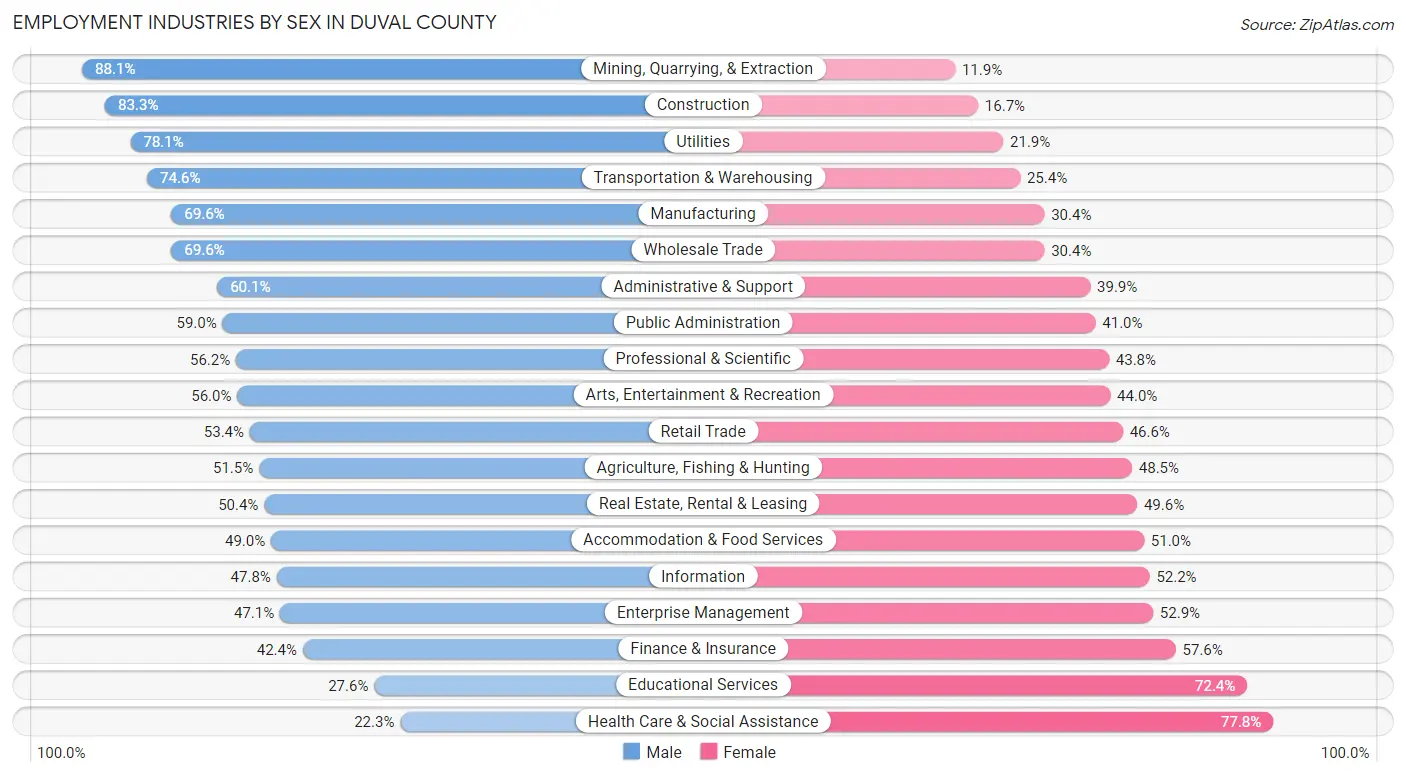
| Industry | Male | Female |
| Agriculture, Fishing & Hunting | 333 (51.5%) | 314 (48.5%) |
| Mining, Quarrying, & Extraction | 244 (88.1%) | 33 (11.9%) |
| Construction | 28,789 (83.3%) | 5,754 (16.7%) |
| Manufacturing | 17,362 (69.6%) | 7,579 (30.4%) |
| Wholesale Trade | 8,499 (69.6%) | 3,710 (30.4%) |
| Retail Trade | 31,370 (53.4%) | 27,403 (46.6%) |
| Transportation & Warehousing | 24,995 (74.6%) | 8,495 (25.4%) |
| Utilities | 2,517 (78.1%) | 705 (21.9%) |
| Information | 3,005 (47.8%) | 3,278 (52.2%) |
| Finance & Insurance | 18,422 (42.4%) | 25,005 (57.6%) |
| Real Estate, Rental & Leasing | 4,649 (50.4%) | 4,574 (49.6%) |
| Professional & Scientific | 19,848 (56.2%) | 15,447 (43.8%) |
| Enterprise Management | 278 (47.1%) | 312 (52.9%) |
| Administrative & Support | 16,278 (60.1%) | 10,796 (39.9%) |
| Educational Services | 9,066 (27.6%) | 23,743 (72.4%) |
| Health Care & Social Assistance | 14,724 (22.3%) | 51,460 (77.7%) |
| Arts, Entertainment & Recreation | 5,397 (56.0%) | 4,246 (44.0%) |
| Accommodation & Food Services | 19,829 (49.0%) | 20,650 (51.0%) |
| Public Administration | 11,845 (59.0%) | 8,222 (41.0%) |
| Total | 249,793 (51.6%) | 234,298 (48.4%) |
Education in Duval County
School Enrollment in Duval County
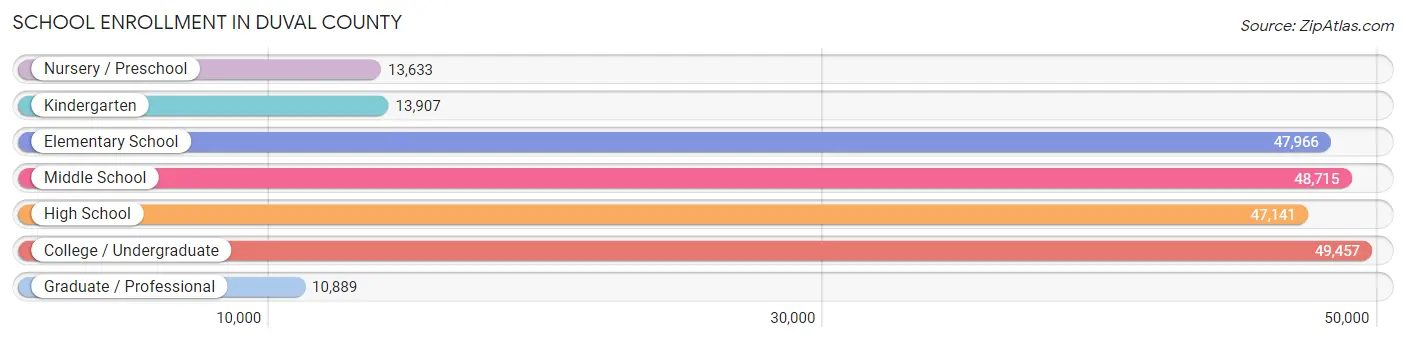
The most common levels of schooling among the 231,708 students in Duval County are college / undergraduate (49,457 | 21.3%), middle school (48,715 | 21.0%), and elementary school (47,966 | 20.7%).
| School Level | # Students | % Students |
| Nursery / Preschool | 13,633 | 5.9% |
| Kindergarten | 13,907 | 6.0% |
| Elementary School | 47,966 | 20.7% |
| Middle School | 48,715 | 21.0% |
| High School | 47,141 | 20.3% |
| College / Undergraduate | 49,457 | 21.3% |
| Graduate / Professional | 10,889 | 4.7% |
| Total | 231,708 | 100.0% |
School Enrollment by Age by Funding Source in Duval County
Out of a total of 231,708 students who are enrolled in schools in Duval County, 47,964 (20.7%) attend a private institution, while the remaining 183,744 (79.3%) are enrolled in public schools. The age group of 3 to 4 year olds has the highest likelihood of being enrolled in private schools, with 5,015 (45.0% in the age bracket) enrolled. Conversely, the age group of 18 to 19 year olds has the lowest likelihood of being enrolled in a private school, with 13,370 (86.1% in the age bracket) attending a public institution.
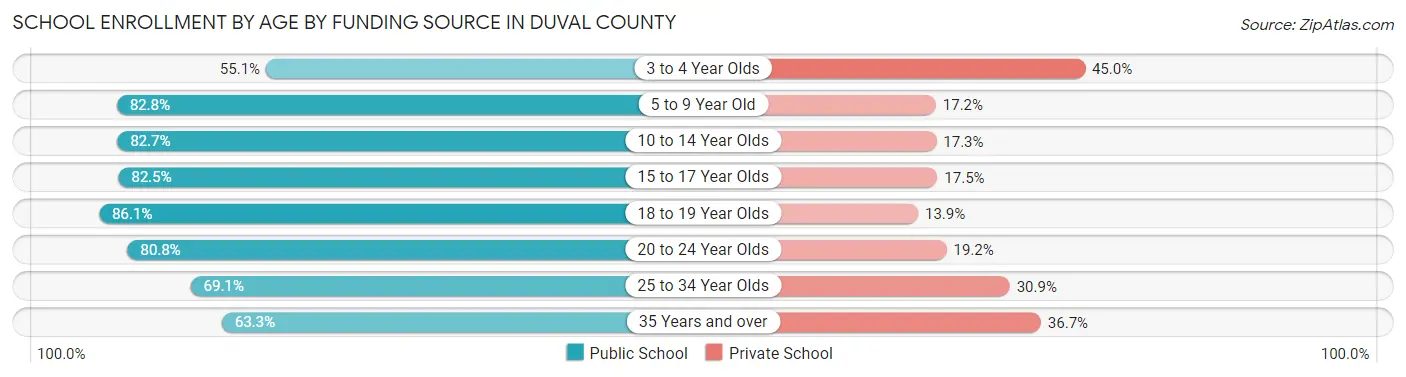
| Age Bracket | Public School | Private School |
| 3 to 4 Year Olds | 6,143 (55.0%) | 5,015 (45.0%) |
| 5 to 9 Year Old | 47,495 (82.8%) | 9,845 (17.2%) |
| 10 to 14 Year Olds | 51,084 (82.7%) | 10,660 (17.3%) |
| 15 to 17 Year Olds | 27,778 (82.5%) | 5,878 (17.5%) |
| 18 to 19 Year Olds | 13,370 (86.1%) | 2,152 (13.9%) |
| 20 to 24 Year Olds | 17,707 (80.8%) | 4,196 (19.2%) |
| 25 to 34 Year Olds | 11,670 (69.1%) | 5,227 (30.9%) |
| 35 Years and over | 8,533 (63.3%) | 4,955 (36.7%) |
| Total | 183,744 (79.3%) | 47,964 (20.7%) |
Educational Attainment by Field of Study in Duval County
Business (57,685 | 24.7%), science & technology (27,428 | 11.7%), education (25,879 | 11.1%), social sciences (15,364 | 6.6%), and arts & humanities (14,604 | 6.2%) are the most common fields of study among 233,593 individuals in Duval County who have obtained a bachelor's degree or higher.
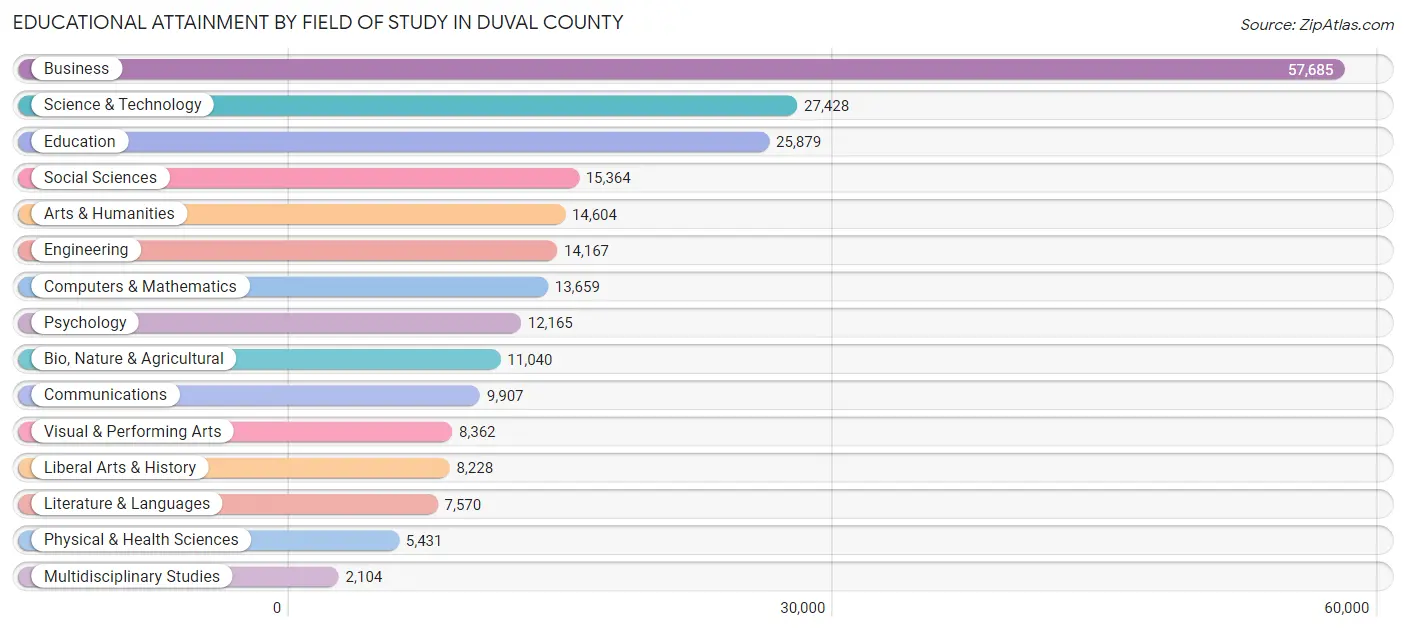
| Field of Study | # Graduates | % Graduates |
| Computers & Mathematics | 13,659 | 5.9% |
| Bio, Nature & Agricultural | 11,040 | 4.7% |
| Physical & Health Sciences | 5,431 | 2.3% |
| Psychology | 12,165 | 5.2% |
| Social Sciences | 15,364 | 6.6% |
| Engineering | 14,167 | 6.1% |
| Multidisciplinary Studies | 2,104 | 0.9% |
| Science & Technology | 27,428 | 11.7% |
| Business | 57,685 | 24.7% |
| Education | 25,879 | 11.1% |
| Literature & Languages | 7,570 | 3.2% |
| Liberal Arts & History | 8,228 | 3.5% |
| Visual & Performing Arts | 8,362 | 3.6% |
| Communications | 9,907 | 4.2% |
| Arts & Humanities | 14,604 | 6.2% |
| Total | 233,593 | 100.0% |
Transportation & Commute in Duval County
Vehicle Availability by Sex in Duval County
The most prevalent vehicle ownership categories in Duval County are males with 2 vehicles (115,674, accounting for 45.7%) and females with 2 vehicles (99,861, making up 50.4%).
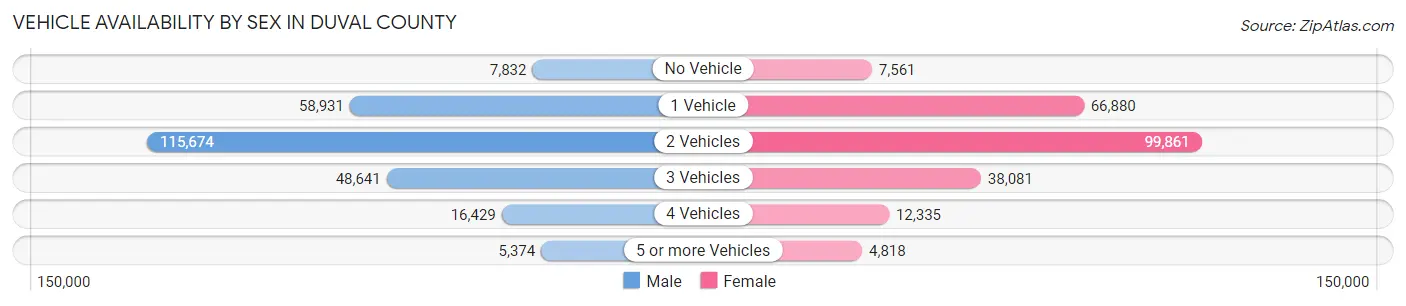
| Vehicles Available | Male | Female |
| No Vehicle | 7,832 (3.1%) | 7,561 (3.3%) |
| 1 Vehicle | 58,931 (23.3%) | 66,880 (29.1%) |
| 2 Vehicles | 115,674 (45.7%) | 99,861 (43.5%) |
| 3 Vehicles | 48,641 (19.2%) | 38,081 (16.6%) |
| 4 Vehicles | 16,429 (6.5%) | 12,335 (5.4%) |
| 5 or more Vehicles | 5,374 (2.1%) | 4,818 (2.1%) |
| Total | 252,881 (100.0%) | 229,536 (100.0%) |
Commute Time in Duval County
The most frequently occuring commute durations in Duval County are 30 to 34 minutes (82,246 commuters, 19.0%), 20 to 24 minutes (81,681 commuters, 18.9%), and 15 to 19 minutes (73,525 commuters, 17.0%).
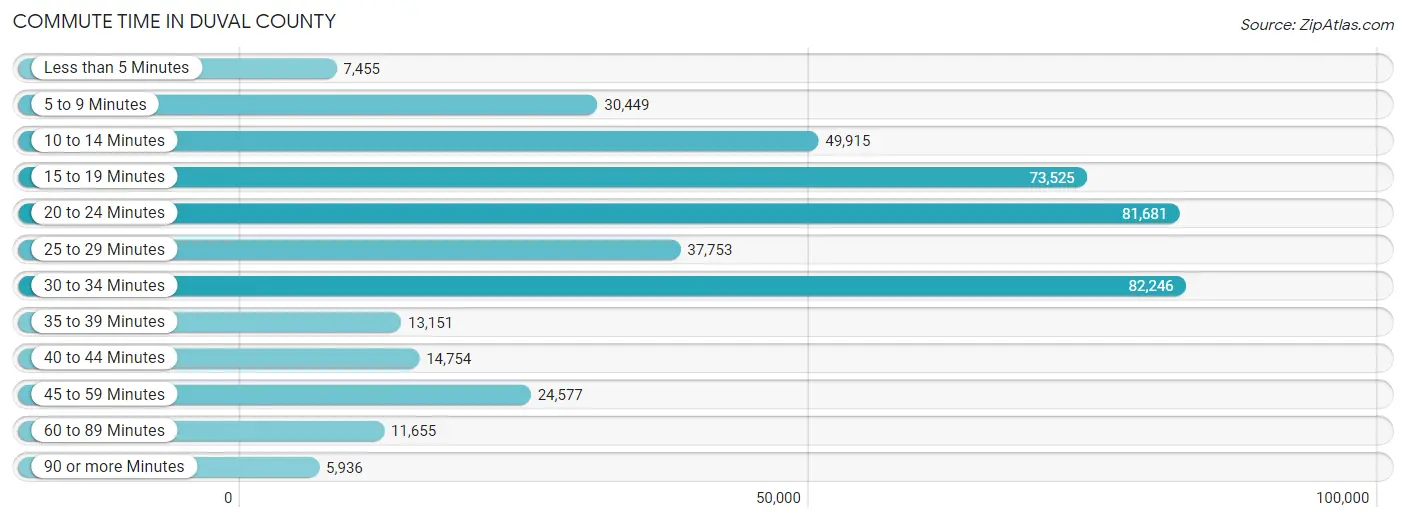
| Commute Time | # Commuters | % Commuters |
| Less than 5 Minutes | 7,455 | 1.7% |
| 5 to 9 Minutes | 30,449 | 7.0% |
| 10 to 14 Minutes | 49,915 | 11.5% |
| 15 to 19 Minutes | 73,525 | 17.0% |
| 20 to 24 Minutes | 81,681 | 18.9% |
| 25 to 29 Minutes | 37,753 | 8.7% |
| 30 to 34 Minutes | 82,246 | 19.0% |
| 35 to 39 Minutes | 13,151 | 3.0% |
| 40 to 44 Minutes | 14,754 | 3.4% |
| 45 to 59 Minutes | 24,577 | 5.7% |
| 60 to 89 Minutes | 11,655 | 2.7% |
| 90 or more Minutes | 5,936 | 1.4% |
Commute Time by Sex in Duval County
The most common commute times in Duval County are 30 to 34 minutes (44,221 commuters, 19.2%) for males and 20 to 24 minutes (38,468 commuters, 19.0%) for females.
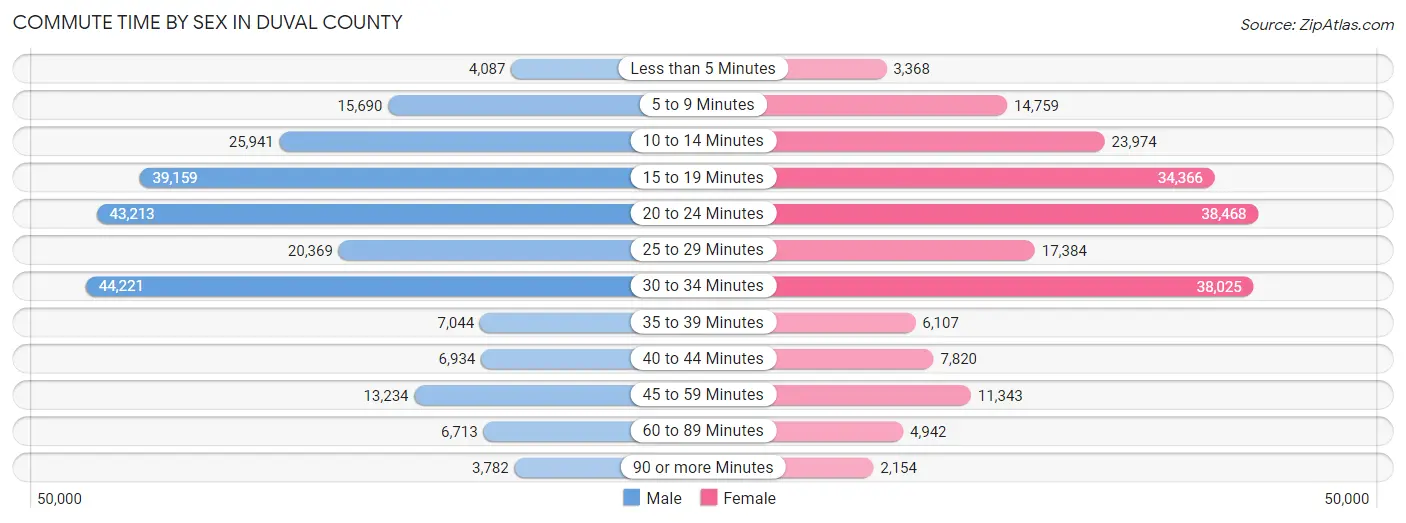
| Commute Time | Male | Female |
| Less than 5 Minutes | 4,087 (1.8%) | 3,368 (1.7%) |
| 5 to 9 Minutes | 15,690 (6.8%) | 14,759 (7.3%) |
| 10 to 14 Minutes | 25,941 (11.3%) | 23,974 (11.8%) |
| 15 to 19 Minutes | 39,159 (17.0%) | 34,366 (17.0%) |
| 20 to 24 Minutes | 43,213 (18.8%) | 38,468 (19.0%) |
| 25 to 29 Minutes | 20,369 (8.8%) | 17,384 (8.6%) |
| 30 to 34 Minutes | 44,221 (19.2%) | 38,025 (18.8%) |
| 35 to 39 Minutes | 7,044 (3.1%) | 6,107 (3.0%) |
| 40 to 44 Minutes | 6,934 (3.0%) | 7,820 (3.9%) |
| 45 to 59 Minutes | 13,234 (5.7%) | 11,343 (5.6%) |
| 60 to 89 Minutes | 6,713 (2.9%) | 4,942 (2.4%) |
| 90 or more Minutes | 3,782 (1.6%) | 2,154 (1.1%) |
Time of Departure to Work by Sex in Duval County
The most frequent times of departure to work in Duval County are 7:00 AM to 7:29 AM (32,833, 14.2%) for males and 7:00 AM to 7:29 AM (32,252, 15.9%) for females.
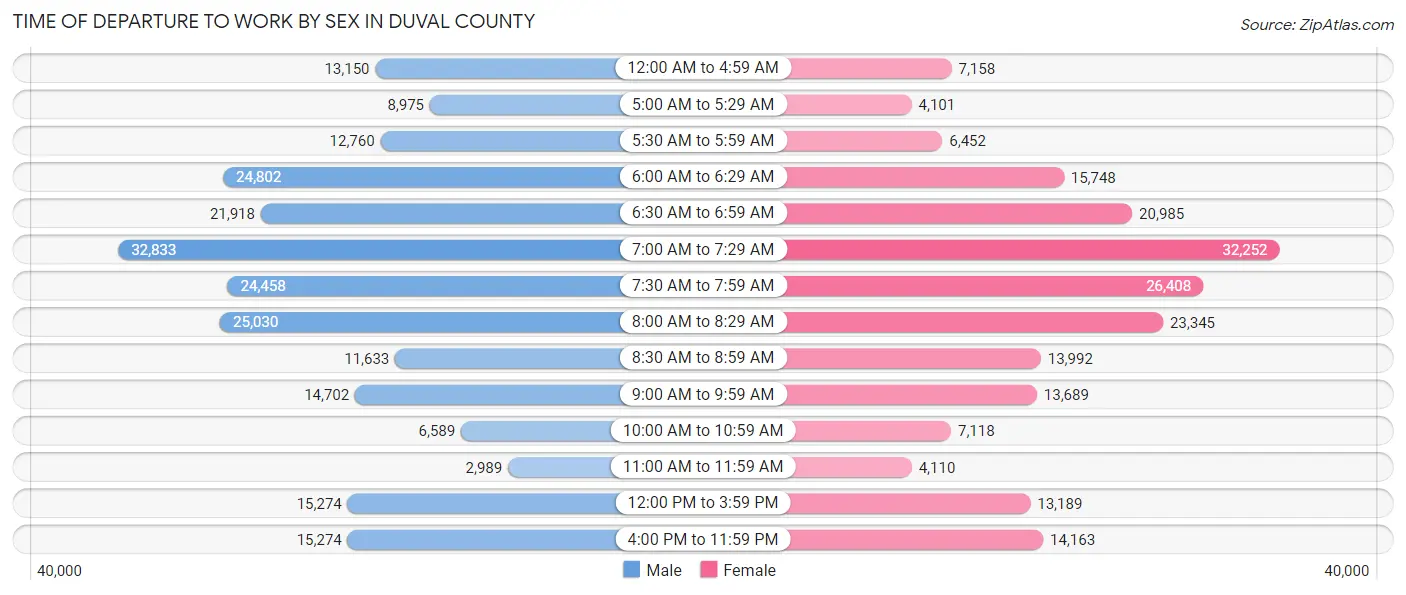
| Time of Departure | Male | Female |
| 12:00 AM to 4:59 AM | 13,150 (5.7%) | 7,158 (3.5%) |
| 5:00 AM to 5:29 AM | 8,975 (3.9%) | 4,101 (2.0%) |
| 5:30 AM to 5:59 AM | 12,760 (5.5%) | 6,452 (3.2%) |
| 6:00 AM to 6:29 AM | 24,802 (10.8%) | 15,748 (7.8%) |
| 6:30 AM to 6:59 AM | 21,918 (9.5%) | 20,985 (10.3%) |
| 7:00 AM to 7:29 AM | 32,833 (14.2%) | 32,252 (15.9%) |
| 7:30 AM to 7:59 AM | 24,458 (10.6%) | 26,408 (13.0%) |
| 8:00 AM to 8:29 AM | 25,030 (10.9%) | 23,345 (11.5%) |
| 8:30 AM to 8:59 AM | 11,633 (5.1%) | 13,992 (6.9%) |
| 9:00 AM to 9:59 AM | 14,702 (6.4%) | 13,689 (6.8%) |
| 10:00 AM to 10:59 AM | 6,589 (2.9%) | 7,118 (3.5%) |
| 11:00 AM to 11:59 AM | 2,989 (1.3%) | 4,110 (2.0%) |
| 12:00 PM to 3:59 PM | 15,274 (6.6%) | 13,189 (6.5%) |
| 4:00 PM to 11:59 PM | 15,274 (6.6%) | 14,163 (7.0%) |
| Total | 230,387 (100.0%) | 202,710 (100.0%) |
Housing Occupancy in Duval County
Occupancy by Ownership in Duval County
Of the total 396,132 dwellings in Duval County, owner-occupied units account for 228,080 (57.6%), while renter-occupied units make up 168,052 (42.4%).
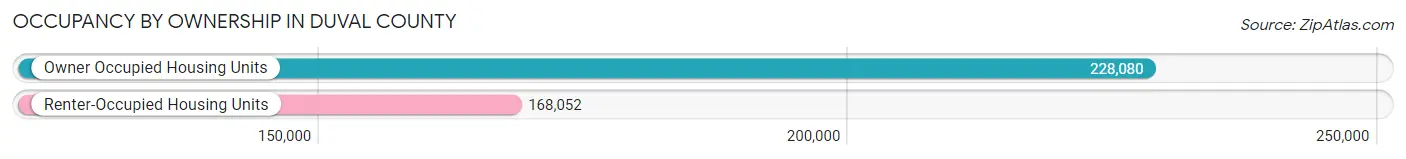
| Occupancy | # Housing Units | % Housing Units |
| Owner Occupied Housing Units | 228,080 | 57.6% |
| Renter-Occupied Housing Units | 168,052 | 42.4% |
| Total Occupied Housing Units | 396,132 | 100.0% |
Occupancy by Household Size in Duval County
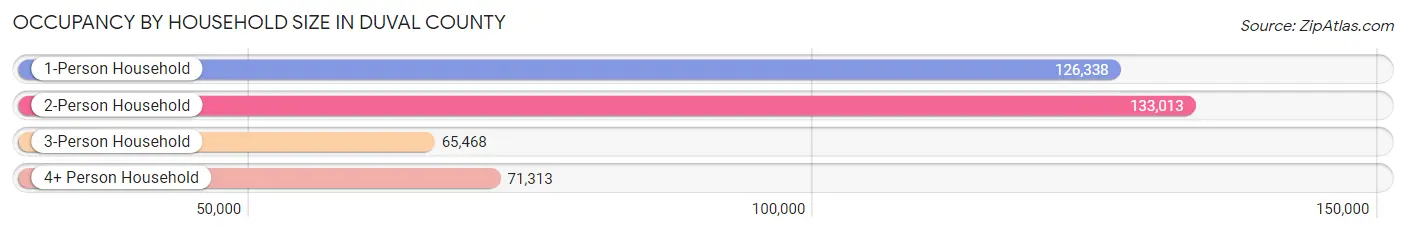
| Household Size | # Housing Units | % Housing Units |
| 1-Person Household | 126,338 | 31.9% |
| 2-Person Household | 133,013 | 33.6% |
| 3-Person Household | 65,468 | 16.5% |
| 4+ Person Household | 71,313 | 18.0% |
| Total Housing Units | 396,132 | 100.0% |
Occupancy by Ownership by Household Size in Duval County
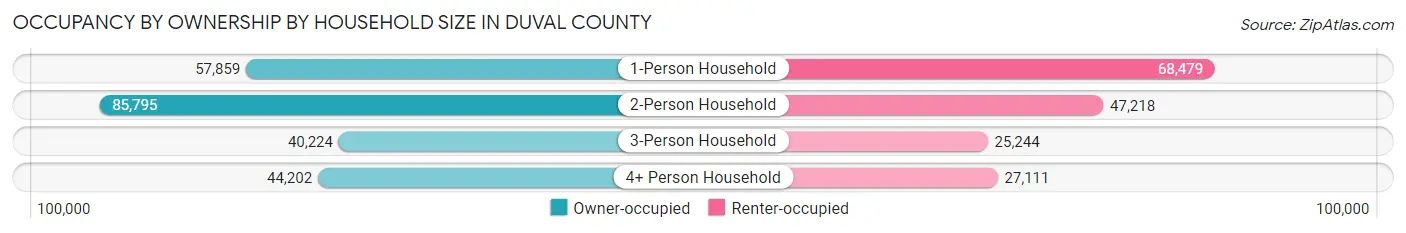
| Household Size | Owner-occupied | Renter-occupied |
| 1-Person Household | 57,859 (45.8%) | 68,479 (54.2%) |
| 2-Person Household | 85,795 (64.5%) | 47,218 (35.5%) |
| 3-Person Household | 40,224 (61.4%) | 25,244 (38.6%) |
| 4+ Person Household | 44,202 (62.0%) | 27,111 (38.0%) |
| Total Housing Units | 228,080 (57.6%) | 168,052 (42.4%) |
Occupancy by Educational Attainment in Duval County
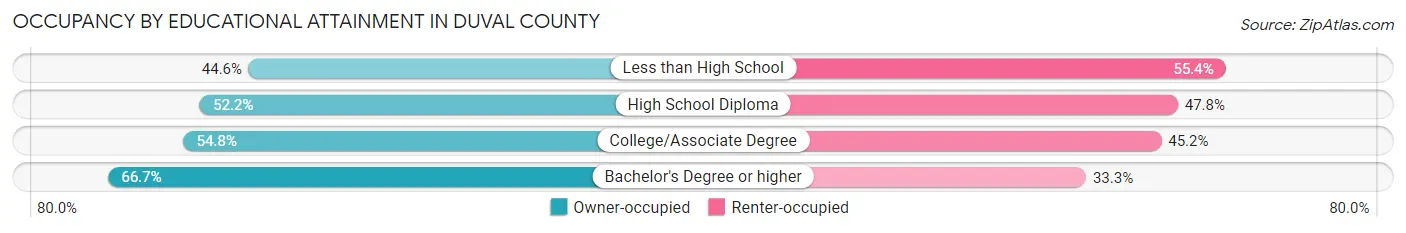
| Household Size | Owner-occupied | Renter-occupied |
| Less than High School | 13,262 (44.6%) | 16,480 (55.4%) |
| High School Diploma | 50,222 (52.2%) | 46,071 (47.8%) |
| College/Associate Degree | 71,648 (54.8%) | 59,141 (45.2%) |
| Bachelor's Degree or higher | 92,948 (66.7%) | 46,360 (33.3%) |
Occupancy by Age of Householder in Duval County
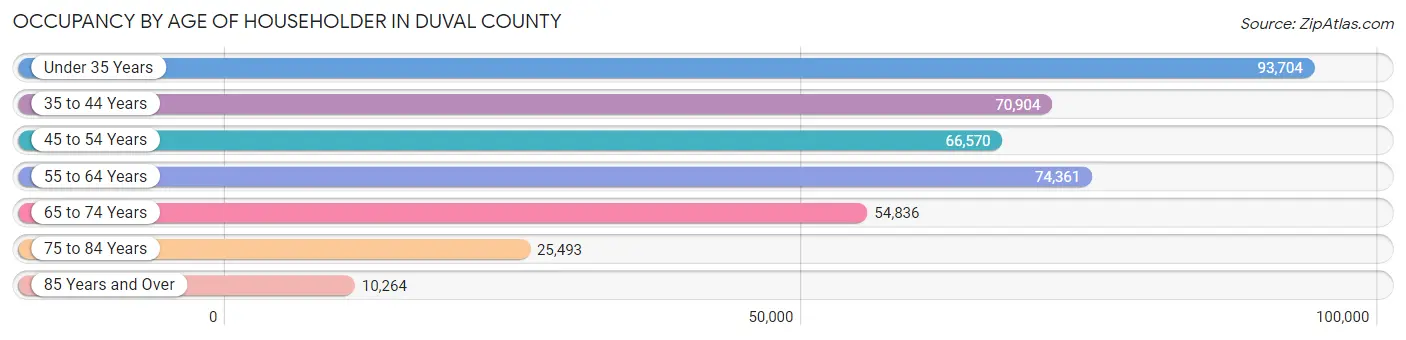
| Age Bracket | # Households | % Households |
| Under 35 Years | 93,704 | 23.6% |
| 35 to 44 Years | 70,904 | 17.9% |
| 45 to 54 Years | 66,570 | 16.8% |
| 55 to 64 Years | 74,361 | 18.8% |
| 65 to 74 Years | 54,836 | 13.8% |
| 75 to 84 Years | 25,493 | 6.4% |
| 85 Years and Over | 10,264 | 2.6% |
| Total | 396,132 | 100.0% |
Housing Finances in Duval County
Median Income by Occupancy in Duval County
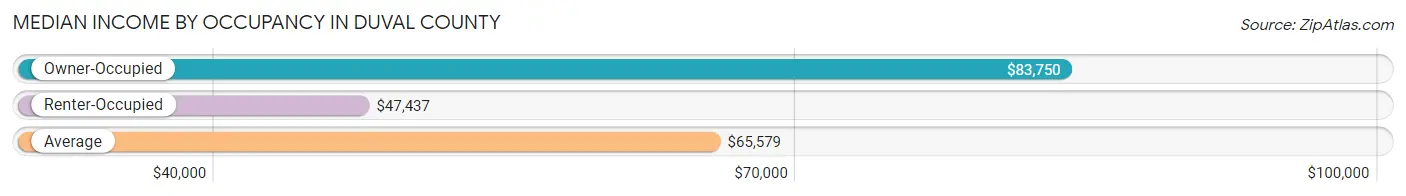
| Occupancy Type | # Households | Median Income |
| Owner-Occupied | 228,080 (57.6%) | $83,750 |
| Renter-Occupied | 168,052 (42.4%) | $47,437 |
| Average | 396,132 (100.0%) | $65,579 |
Occupancy by Householder Income Bracket in Duval County
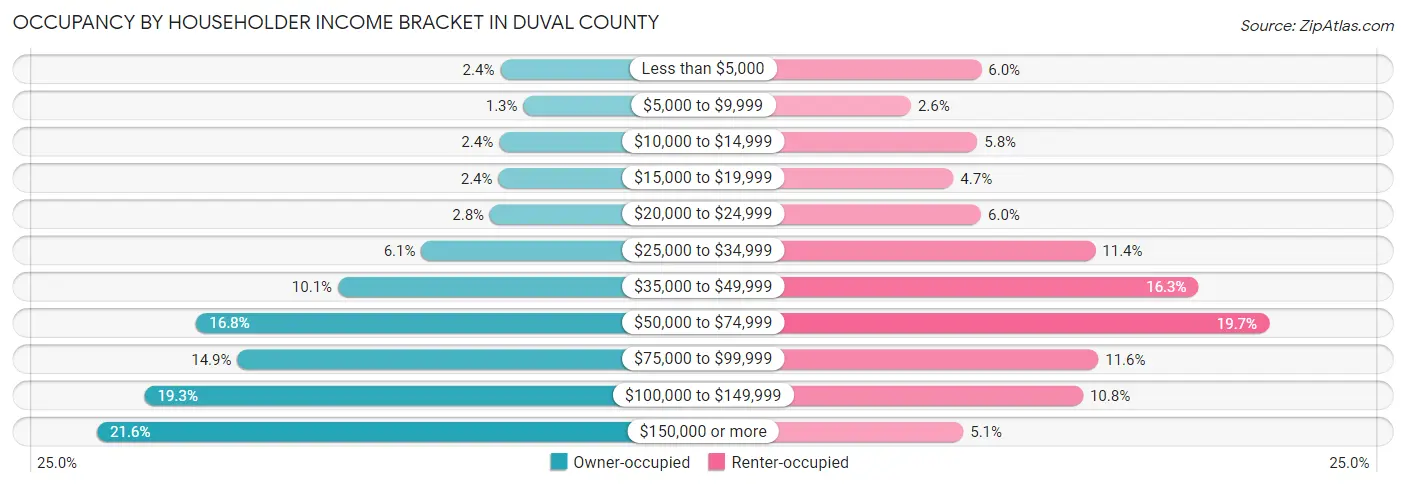
| Income Bracket | Owner-occupied | Renter-occupied |
| Less than $5,000 | 5,353 (2.4%) | 10,065 (6.0%) |
| $5,000 to $9,999 | 2,850 (1.3%) | 4,440 (2.6%) |
| $10,000 to $14,999 | 5,507 (2.4%) | 9,742 (5.8%) |
| $15,000 to $19,999 | 5,555 (2.4%) | 7,830 (4.7%) |
| $20,000 to $24,999 | 6,468 (2.8%) | 10,052 (6.0%) |
| $25,000 to $34,999 | 13,942 (6.1%) | 19,185 (11.4%) |
| $35,000 to $49,999 | 22,990 (10.1%) | 27,420 (16.3%) |
| $50,000 to $74,999 | 38,365 (16.8%) | 33,071 (19.7%) |
| $75,000 to $99,999 | 33,910 (14.9%) | 19,421 (11.6%) |
| $100,000 to $149,999 | 43,988 (19.3%) | 18,208 (10.8%) |
| $150,000 or more | 49,152 (21.5%) | 8,618 (5.1%) |
| Total | 228,080 (100.0%) | 168,052 (100.0%) |
Monthly Housing Cost Tiers in Duval County
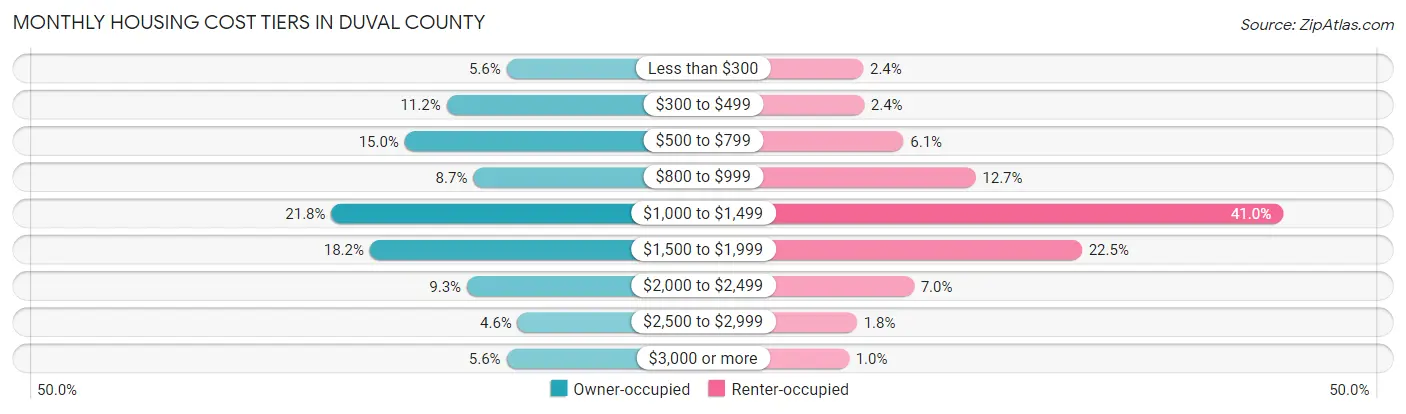
| Monthly Cost | Owner-occupied | Renter-occupied |
| Less than $300 | 12,831 (5.6%) | 3,964 (2.4%) |
| $300 to $499 | 25,461 (11.2%) | 4,078 (2.4%) |
| $500 to $799 | 34,244 (15.0%) | 10,193 (6.1%) |
| $800 to $999 | 19,837 (8.7%) | 21,349 (12.7%) |
| $1,000 to $1,499 | 49,619 (21.8%) | 68,932 (41.0%) |
| $1,500 to $1,999 | 41,547 (18.2%) | 37,799 (22.5%) |
| $2,000 to $2,499 | 21,177 (9.3%) | 11,805 (7.0%) |
| $2,500 to $2,999 | 10,504 (4.6%) | 2,999 (1.8%) |
| $3,000 or more | 12,860 (5.6%) | 1,755 (1.0%) |
| Total | 228,080 (100.0%) | 168,052 (100.0%) |
Physical Housing Characteristics in Duval County
Housing Structures in Duval County
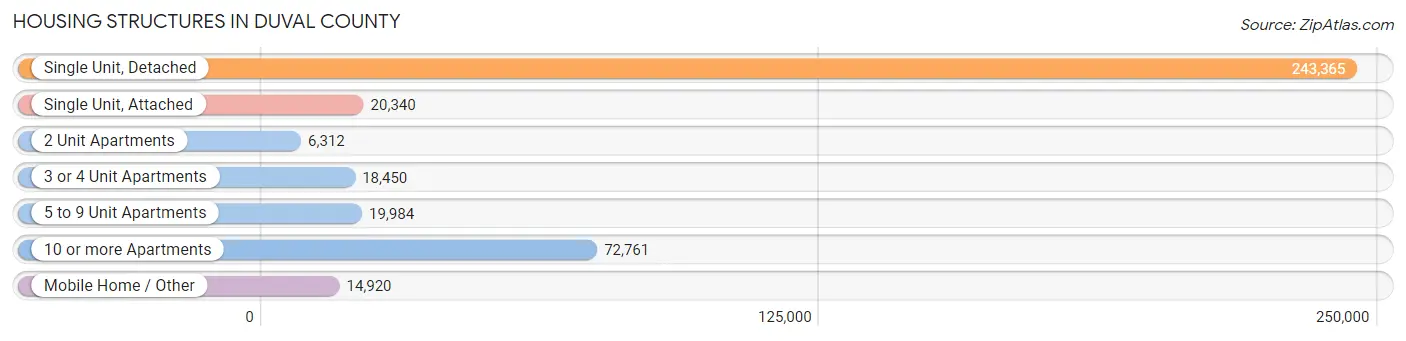
| Structure Type | # Housing Units | % Housing Units |
| Single Unit, Detached | 243,365 | 61.4% |
| Single Unit, Attached | 20,340 | 5.1% |
| 2 Unit Apartments | 6,312 | 1.6% |
| 3 or 4 Unit Apartments | 18,450 | 4.7% |
| 5 to 9 Unit Apartments | 19,984 | 5.0% |
| 10 or more Apartments | 72,761 | 18.4% |
| Mobile Home / Other | 14,920 | 3.8% |
| Total | 396,132 | 100.0% |
Housing Structures by Occupancy in Duval County
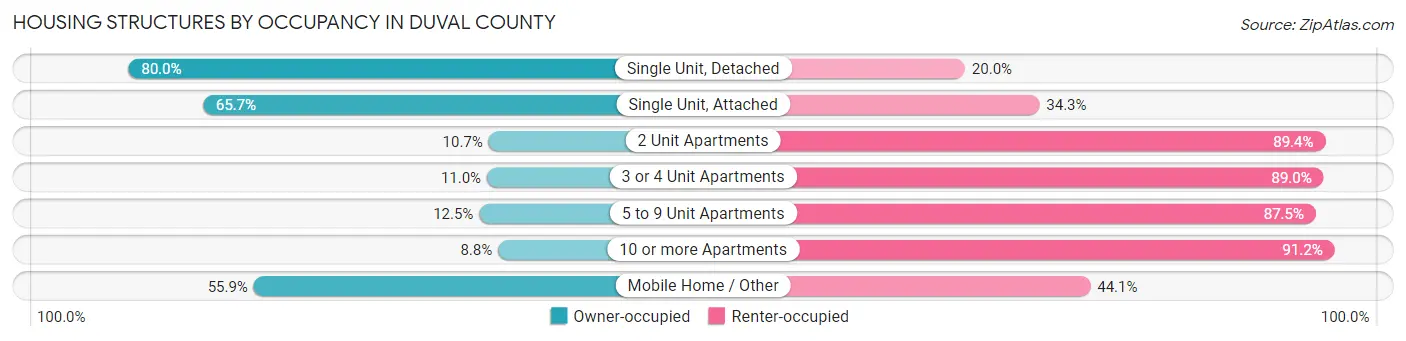
| Structure Type | Owner-occupied | Renter-occupied |
| Single Unit, Detached | 194,755 (80.0%) | 48,610 (20.0%) |
| Single Unit, Attached | 13,361 (65.7%) | 6,979 (34.3%) |
| 2 Unit Apartments | 672 (10.6%) | 5,640 (89.3%) |
| 3 or 4 Unit Apartments | 2,026 (11.0%) | 16,424 (89.0%) |
| 5 to 9 Unit Apartments | 2,493 (12.5%) | 17,491 (87.5%) |
| 10 or more Apartments | 6,434 (8.8%) | 66,327 (91.2%) |
| Mobile Home / Other | 8,339 (55.9%) | 6,581 (44.1%) |
| Total | 228,080 (57.6%) | 168,052 (42.4%) |
Housing Structures by Number of Rooms in Duval County
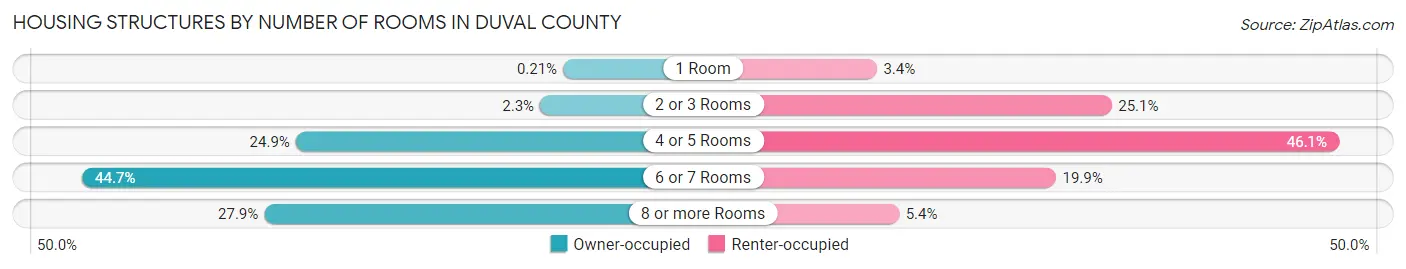
| Number of Rooms | Owner-occupied | Renter-occupied |
| 1 Room | 469 (0.2%) | 5,674 (3.4%) |
| 2 or 3 Rooms | 5,331 (2.3%) | 42,176 (25.1%) |
| 4 or 5 Rooms | 56,866 (24.9%) | 77,545 (46.1%) |
| 6 or 7 Rooms | 101,900 (44.7%) | 33,514 (19.9%) |
| 8 or more Rooms | 63,514 (27.9%) | 9,143 (5.4%) |
| Total | 228,080 (100.0%) | 168,052 (100.0%) |
Housing Structure by Heating Type in Duval County
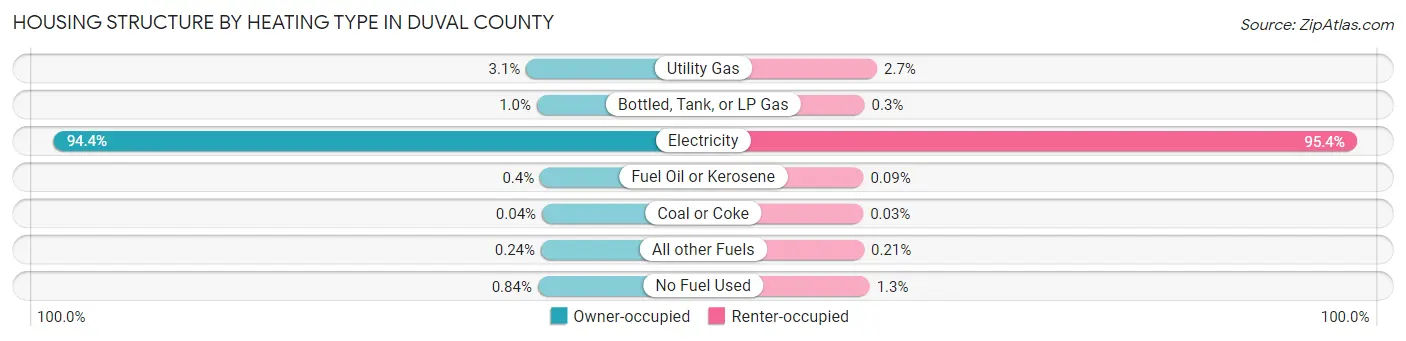
| Heating Type | Owner-occupied | Renter-occupied |
| Utility Gas | 7,029 (3.1%) | 4,548 (2.7%) |
| Bottled, Tank, or LP Gas | 2,344 (1.0%) | 503 (0.3%) |
| Electricity | 215,239 (94.4%) | 160,273 (95.4%) |
| Fuel Oil or Kerosene | 920 (0.4%) | 149 (0.1%) |
| Coal or Coke | 83 (0.0%) | 56 (0.0%) |
| All other Fuels | 538 (0.2%) | 360 (0.2%) |
| No Fuel Used | 1,927 (0.8%) | 2,163 (1.3%) |
| Total | 228,080 (100.0%) | 168,052 (100.0%) |
Household Vehicle Usage in Duval County
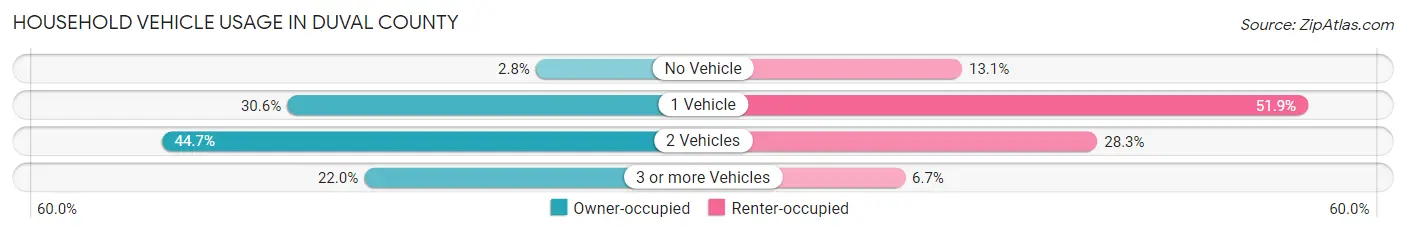
| Vehicles per Household | Owner-occupied | Renter-occupied |
| No Vehicle | 6,274 (2.8%) | 22,047 (13.1%) |
| 1 Vehicle | 69,810 (30.6%) | 87,146 (51.9%) |
| 2 Vehicles | 101,859 (44.7%) | 47,532 (28.3%) |
| 3 or more Vehicles | 50,137 (22.0%) | 11,327 (6.7%) |
| Total | 228,080 (100.0%) | 168,052 (100.0%) |
Real Estate & Mortgages in Duval County
Real Estate and Mortgage Overview in Duval County
| Characteristic | Without Mortgage | With Mortgage |
| Housing Units | 79,122 | 148,958 |
| Median Property Value | $218,600 | $265,100 |
| Median Household Income | $64,806 | $36,782 |
| Monthly Housing Costs | $525 | $12,294 |
| Real Estate Taxes | $1,661 | $6,439 |
Property Value by Mortgage Status in Duval County
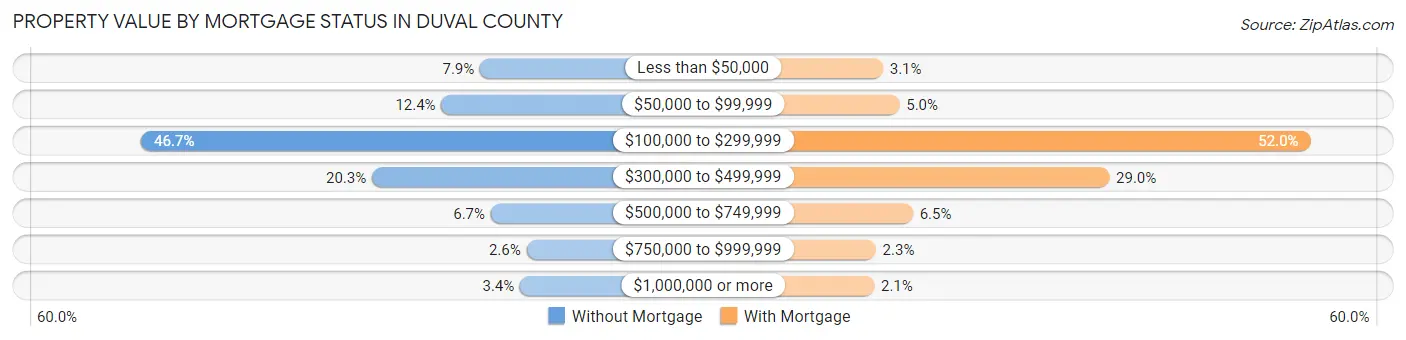
| Property Value | Without Mortgage | With Mortgage |
| Less than $50,000 | 6,285 (7.9%) | 4,640 (3.1%) |
| $50,000 to $99,999 | 9,782 (12.4%) | 7,443 (5.0%) |
| $100,000 to $299,999 | 36,946 (46.7%) | 77,428 (52.0%) |
| $300,000 to $499,999 | 16,050 (20.3%) | 43,167 (29.0%) |
| $500,000 to $749,999 | 5,313 (6.7%) | 9,725 (6.5%) |
| $750,000 to $999,999 | 2,082 (2.6%) | 3,419 (2.3%) |
| $1,000,000 or more | 2,664 (3.4%) | 3,136 (2.1%) |
| Total | 79,122 (100.0%) | 148,958 (100.0%) |
Household Income by Mortgage Status in Duval County
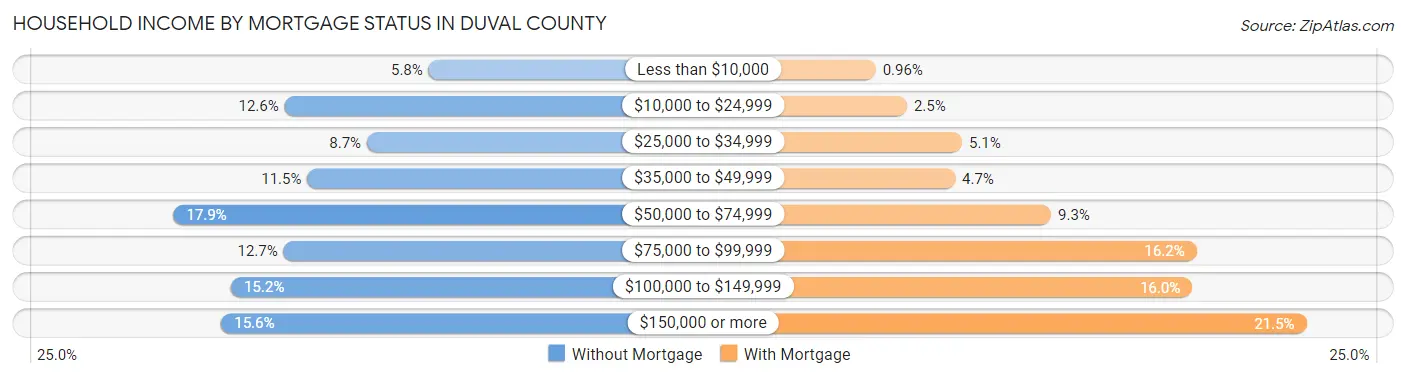
| Household Income | Without Mortgage | With Mortgage |
| Less than $10,000 | 4,554 (5.8%) | 1,426 (1.0%) |
| $10,000 to $24,999 | 9,984 (12.6%) | 3,649 (2.5%) |
| $25,000 to $34,999 | 6,885 (8.7%) | 7,546 (5.1%) |
| $35,000 to $49,999 | 9,127 (11.5%) | 7,057 (4.7%) |
| $50,000 to $74,999 | 14,170 (17.9%) | 13,863 (9.3%) |
| $75,000 to $99,999 | 10,027 (12.7%) | 24,195 (16.2%) |
| $100,000 to $149,999 | 12,005 (15.2%) | 23,883 (16.0%) |
| $150,000 or more | 12,370 (15.6%) | 31,983 (21.5%) |
| Total | 79,122 (100.0%) | 148,958 (100.0%) |
Property Value to Household Income Ratio in Duval County
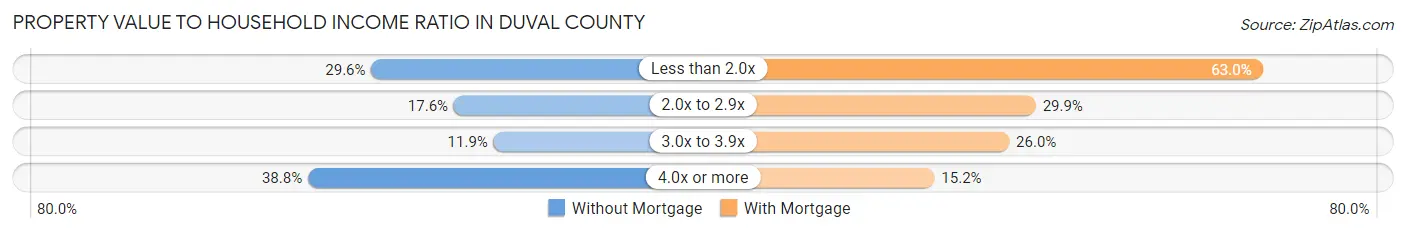
| Value-to-Income Ratio | Without Mortgage | With Mortgage |
| Less than 2.0x | 23,439 (29.6%) | 93,822 (63.0%) |
| 2.0x to 2.9x | 13,953 (17.6%) | 44,542 (29.9%) |
| 3.0x to 3.9x | 9,374 (11.8%) | 38,788 (26.0%) |
| 4.0x or more | 30,722 (38.8%) | 22,612 (15.2%) |
| Total | 79,122 (100.0%) | 148,958 (100.0%) |
Real Estate Taxes by Mortgage Status in Duval County
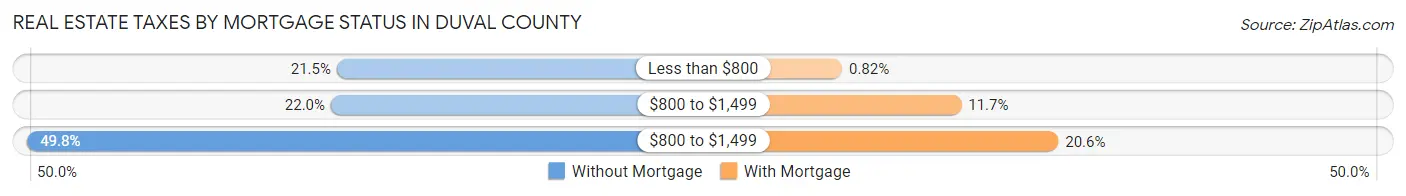
| Property Taxes | Without Mortgage | With Mortgage |
| Less than $800 | 17,006 (21.5%) | 1,218 (0.8%) |
| $800 to $1,499 | 17,434 (22.0%) | 17,440 (11.7%) |
| $800 to $1,499 | 39,374 (49.8%) | 30,641 (20.6%) |
| Total | 79,122 (100.0%) | 148,958 (100.0%) |
Health & Disability in Duval County
Health Insurance Coverage by Age in Duval County
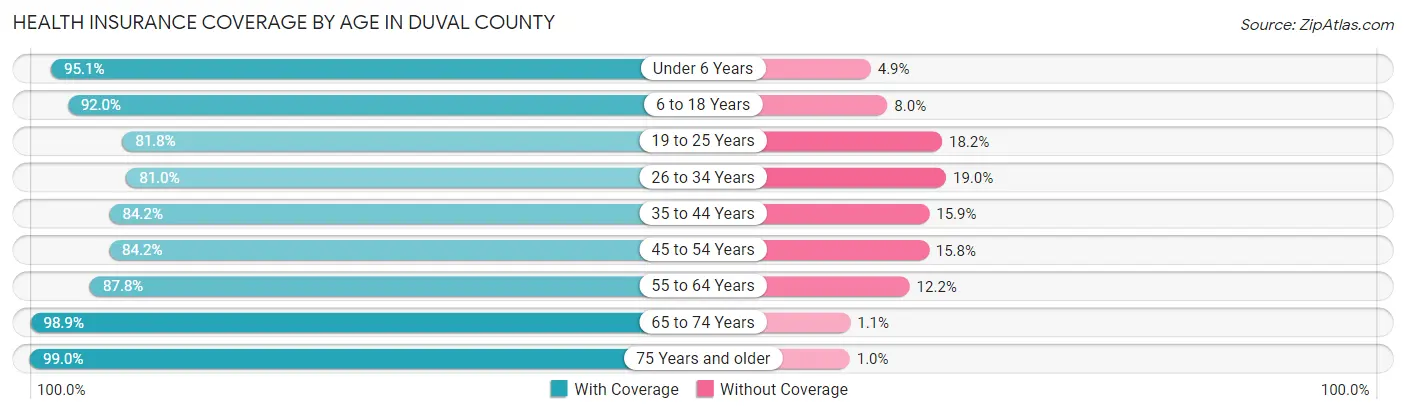
| Age Bracket | With Coverage | Without Coverage |
| Under 6 Years | 73,597 (95.1%) | 3,821 (4.9%) |
| 6 to 18 Years | 145,452 (92.0%) | 12,725 (8.0%) |
| 19 to 25 Years | 70,551 (81.8%) | 15,725 (18.2%) |
| 26 to 34 Years | 111,463 (81.0%) | 26,101 (19.0%) |
| 35 to 44 Years | 106,935 (84.2%) | 20,136 (15.9%) |
| 45 to 54 Years | 99,799 (84.2%) | 18,667 (15.8%) |
| 55 to 64 Years | 109,483 (87.8%) | 15,192 (12.2%) |
| 65 to 74 Years | 87,149 (98.9%) | 984 (1.1%) |
| 75 Years and older | 53,511 (99.0%) | 554 (1.0%) |
| Total | 857,940 (88.3%) | 113,905 (11.7%) |
Health Insurance Coverage by Citizenship Status in Duval County
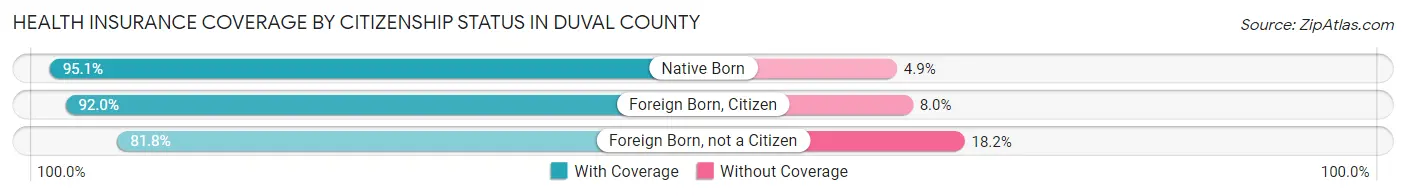
| Citizenship Status | With Coverage | Without Coverage |
| Native Born | 73,597 (95.1%) | 3,821 (4.9%) |
| Foreign Born, Citizen | 145,452 (92.0%) | 12,725 (8.0%) |
| Foreign Born, not a Citizen | 70,551 (81.8%) | 15,725 (18.2%) |
Health Insurance Coverage by Household Income in Duval County
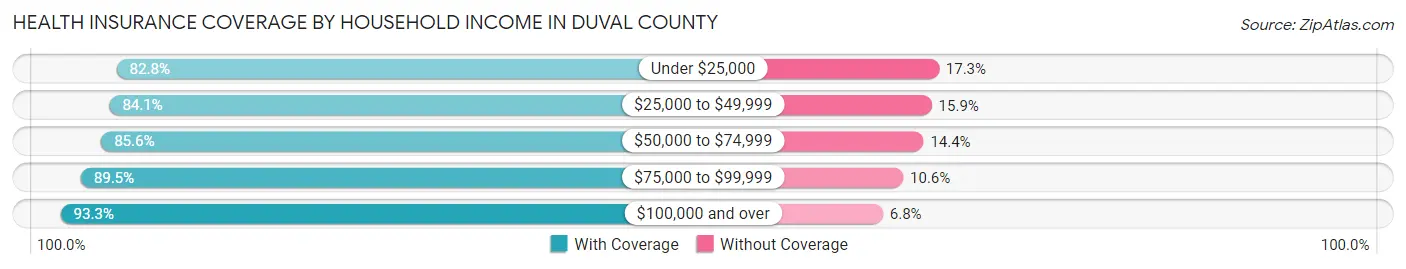
| Household Income | With Coverage | Without Coverage |
| Under $25,000 | 102,764 (82.8%) | 21,419 (17.2%) |
| $25,000 to $49,999 | 148,499 (84.1%) | 28,070 (15.9%) |
| $50,000 to $74,999 | 144,141 (85.6%) | 24,172 (14.4%) |
| $75,000 to $99,999 | 121,894 (89.4%) | 14,380 (10.5%) |
| $100,000 and over | 331,485 (93.2%) | 23,976 (6.8%) |
Public vs Private Health Insurance Coverage by Age in Duval County
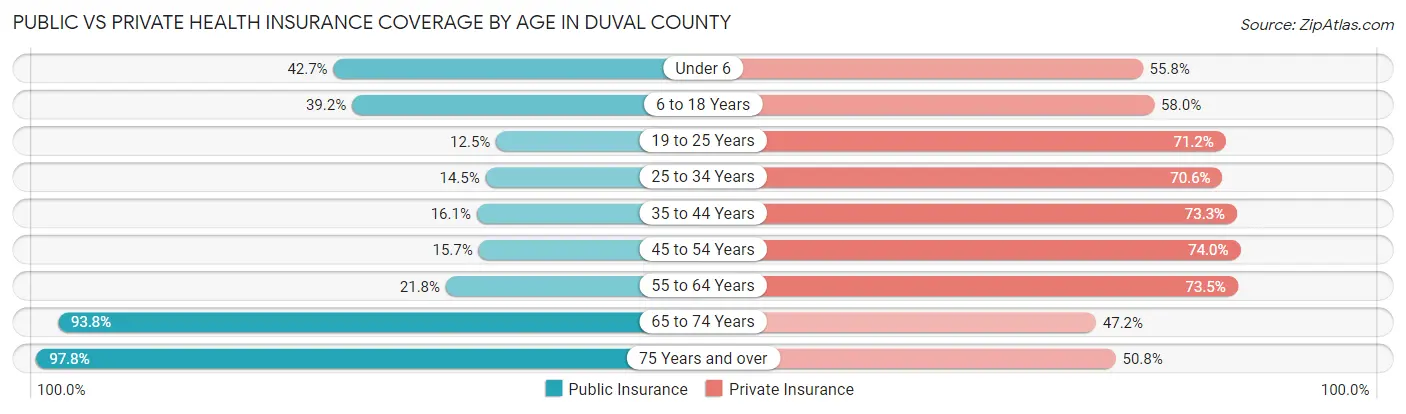
| Age Bracket | Public Insurance | Private Insurance |
| Under 6 | 33,035 (42.7%) | 43,234 (55.8%) |
| 6 to 18 Years | 62,052 (39.2%) | 91,657 (58.0%) |
| 19 to 25 Years | 10,756 (12.5%) | 61,458 (71.2%) |
| 25 to 34 Years | 19,884 (14.4%) | 97,177 (70.6%) |
| 35 to 44 Years | 20,436 (16.1%) | 93,183 (73.3%) |
| 45 to 54 Years | 18,651 (15.7%) | 87,623 (74.0%) |
| 55 to 64 Years | 27,191 (21.8%) | 91,592 (73.5%) |
| 65 to 74 Years | 82,684 (93.8%) | 41,563 (47.2%) |
| 75 Years and over | 52,887 (97.8%) | 27,470 (50.8%) |
| Total | 327,576 (33.7%) | 634,957 (65.3%) |
Disability Status by Sex by Age in Duval County
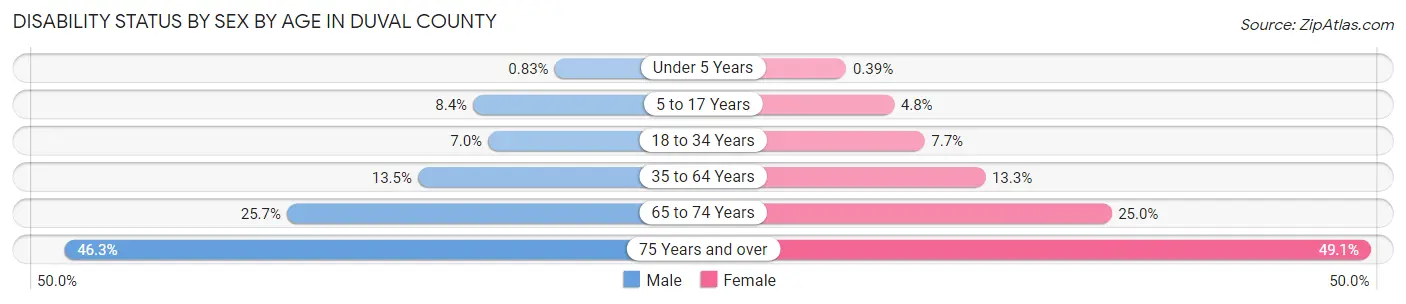
| Age Bracket | Male | Female |
| Under 5 Years | 272 (0.8%) | 123 (0.4%) |
| 5 to 17 Years | 6,780 (8.4%) | 3,744 (4.8%) |
| 18 to 34 Years | 7,982 (7.0%) | 9,394 (7.7%) |
| 35 to 64 Years | 24,073 (13.5%) | 25,517 (13.3%) |
| 65 to 74 Years | 10,294 (25.7%) | 12,008 (25.0%) |
| 75 Years and over | 9,900 (46.3%) | 16,047 (49.1%) |
Disability Class by Sex by Age in Duval County
Disability Class: Hearing Difficulty
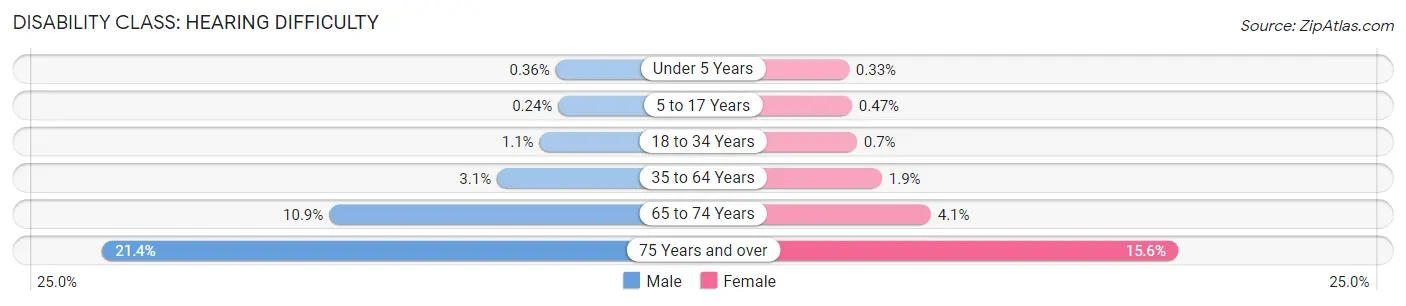
| Age Bracket | Male | Female |
| Under 5 Years | 119 (0.4%) | 105 (0.3%) |
| 5 to 17 Years | 195 (0.2%) | 363 (0.5%) |
| 18 to 34 Years | 1,267 (1.1%) | 858 (0.7%) |
| 35 to 64 Years | 5,496 (3.1%) | 3,574 (1.9%) |
| 65 to 74 Years | 4,358 (10.9%) | 1,985 (4.1%) |
| 75 Years and over | 4,572 (21.4%) | 5,097 (15.6%) |
Disability Class: Vision Difficulty
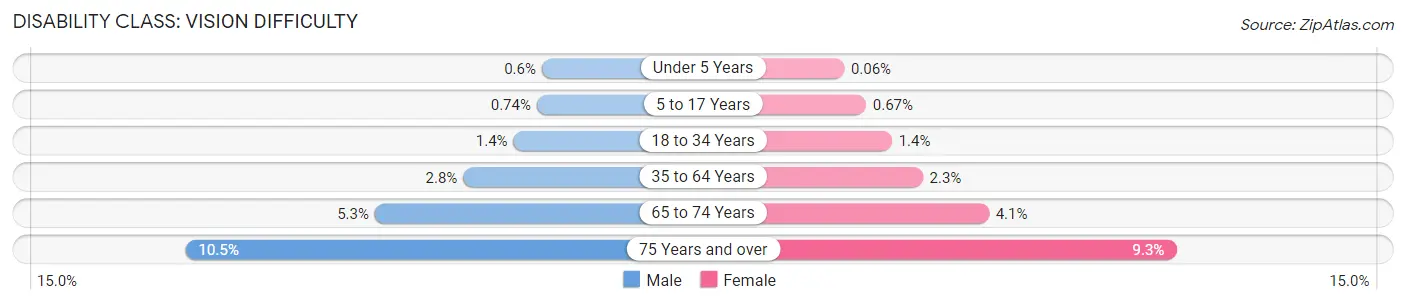
| Age Bracket | Male | Female |
| Under 5 Years | 198 (0.6%) | 18 (0.1%) |
| 5 to 17 Years | 596 (0.7%) | 518 (0.7%) |
| 18 to 34 Years | 1,587 (1.4%) | 1,702 (1.4%) |
| 35 to 64 Years | 4,968 (2.8%) | 4,321 (2.2%) |
| 65 to 74 Years | 2,105 (5.2%) | 1,966 (4.1%) |
| 75 Years and over | 2,249 (10.5%) | 3,043 (9.3%) |
Disability Class: Cognitive Difficulty
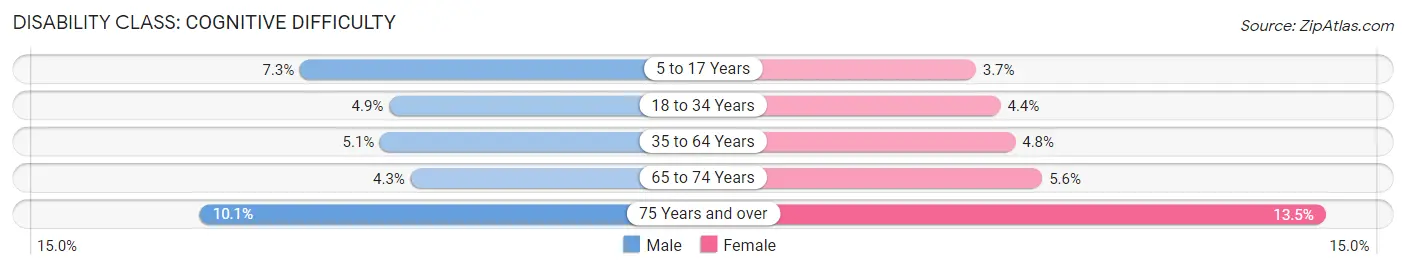
| Age Bracket | Male | Female |
| 5 to 17 Years | 5,918 (7.3%) | 2,897 (3.7%) |
| 18 to 34 Years | 5,528 (4.9%) | 5,419 (4.4%) |
| 35 to 64 Years | 9,094 (5.1%) | 9,267 (4.8%) |
| 65 to 74 Years | 1,703 (4.3%) | 2,679 (5.6%) |
| 75 Years and over | 2,164 (10.1%) | 4,404 (13.5%) |
Disability Class: Ambulatory Difficulty
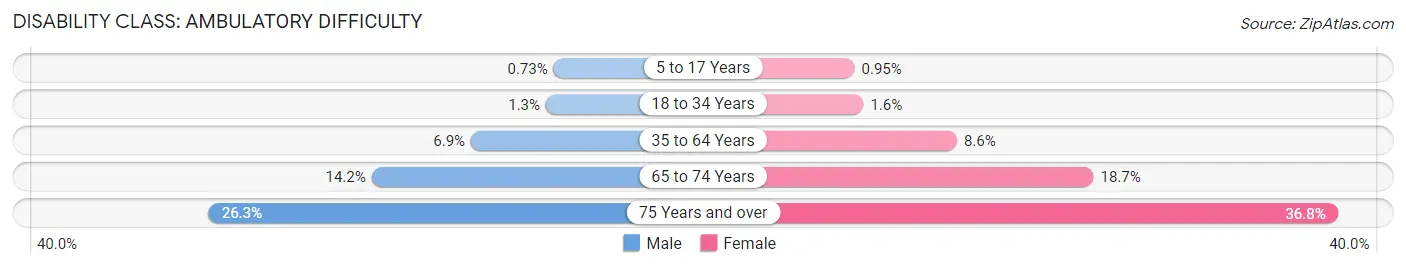
| Age Bracket | Male | Female |
| 5 to 17 Years | 589 (0.7%) | 736 (0.9%) |
| 18 to 34 Years | 1,484 (1.3%) | 1,971 (1.6%) |
| 35 to 64 Years | 12,219 (6.9%) | 16,424 (8.6%) |
| 65 to 74 Years | 5,711 (14.2%) | 8,978 (18.7%) |
| 75 Years and over | 5,625 (26.3%) | 12,030 (36.8%) |
Disability Class: Self-Care Difficulty
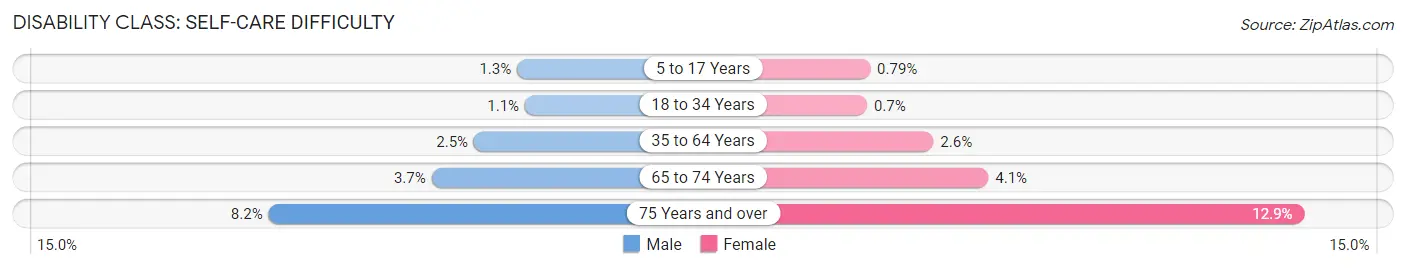
| Age Bracket | Male | Female |
| 5 to 17 Years | 1,043 (1.3%) | 612 (0.8%) |
| 18 to 34 Years | 1,216 (1.1%) | 860 (0.7%) |
| 35 to 64 Years | 4,439 (2.5%) | 4,905 (2.5%) |
| 65 to 74 Years | 1,470 (3.7%) | 1,961 (4.1%) |
| 75 Years and over | 1,755 (8.2%) | 4,210 (12.9%) |
Technology Access in Duval County
Computing Device Access in Duval County
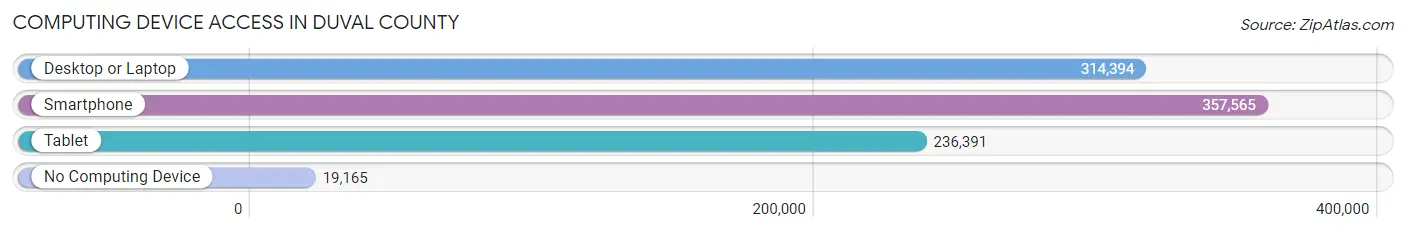
| Device Type | # Households | % Households |
| Desktop or Laptop | 314,394 | 79.4% |
| Smartphone | 357,565 | 90.3% |
| Tablet | 236,391 | 59.7% |
| No Computing Device | 19,165 | 4.8% |
| Total | 396,132 | 100.0% |
Internet Access in Duval County
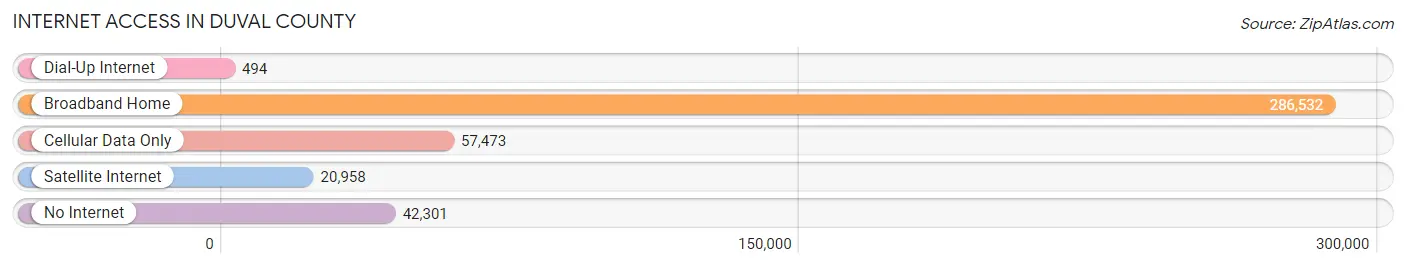
| Internet Type | # Households | % Households |
| Dial-Up Internet | 494 | 0.1% |
| Broadband Home | 286,532 | 72.3% |
| Cellular Data Only | 57,473 | 14.5% |
| Satellite Internet | 20,958 | 5.3% |
| No Internet | 42,301 | 10.7% |
| Total | 396,132 | 100.0% |
Duval County Summary
Duval County, located in the northeastern corner of Florida, is the most populous county in the state. It is bordered by Nassau County to the north, St. Johns County to the south, Clay County to the west, and the Atlantic Ocean to the east. The county seat is Jacksonville, the largest city in the state and the largest city by area in the contiguous United States.
History
Duval County was created in 1822 from St. Johns County. It was named for William Pope Duval, the first territorial governor of Florida. The county was originally much larger, encompassing all of what is now Baker, Clay, Nassau, and part of Bradford counties. In 1868, the county was reduced to its current size.
Geography
Duval County covers an area of 882 square miles, making it the largest county in Florida by area. It is located in the northeastern corner of the state, bordered by Nassau County to the north, St. Johns County to the south, Clay County to the west, and the Atlantic Ocean to the east. The county is mostly flat, with some rolling hills in the western part of the county. The St. Johns River forms the eastern border of the county, and the Nassau River forms the northern border.
Economy
Duval County has a diverse economy, with a mix of industries including manufacturing, finance, healthcare, and tourism. The county is home to several major employers, including the Naval Air Station Jacksonville, the University of North Florida, and the Mayo Clinic. The Port of Jacksonville is the largest port in Florida and the third-largest port on the East Coast. Tourism is also a major industry in the county, with Jacksonville Beach, Amelia Island, and other attractions drawing visitors from around the world.
Demographics
As of the 2010 census, Duval County had a population of 864,263. The population is racially and ethnically diverse, with the largest racial group being White (54.3%), followed by Black or African American (30.2%), Hispanic or Latino (11.2%), and Asian (3.2%). The median household income is $50,867, and the median age is 36.7.
Duval County is home to a variety of cultures and lifestyles. The county is home to a large military population, with the Naval Air Station Jacksonville and other military installations located in the area. The county is also home to a large LGBT population, with Jacksonville being one of the most LGBT-friendly cities in the state.
Conclusion
Duval County is a diverse and vibrant county located in the northeastern corner of Florida. It has a rich history, a diverse economy, and a population that is racially and ethnically diverse. The county is home to a variety of cultures and lifestyles, and is a great place to live, work, and visit.
Common Questions
What is Per Capita Income in Duval County?
Per Capita income in Duval County is $37,376.
What is the Median Family Income in Duval County?
Median Family Income in Duval County is $79,233.
What is the Median Household income in Duval County?
Median Household Income in Duval County is $65,579.
What is Income or Wage Gap in Duval County?
Income or Wage Gap in Duval County is 22.2%.
Women in Duval County earn 77.8 cents for every dollar earned by a man.
What is Family Income Deficit in Duval County?
Family Income Deficit in Duval County is $11,001.
Families that are below poverty line in Duval County earn $11,001 less on average than the poverty threshold level.
What is Inequality or Gini Index in Duval County?
Inequality or Gini Index in Duval County is 0.47.
What is the Total Population of Duval County?
Total Population of Duval County is 995,708.
What is the Total Male Population of Duval County?
Total Male Population of Duval County is 484,498.
What is the Total Female Population of Duval County?
Total Female Population of Duval County is 511,210.
What is the Ratio of Males per 100 Females in Duval County?
There are 94.77 Males per 100 Females in Duval County.
What is the Ratio of Females per 100 Males in Duval County?
There are 105.51 Females per 100 Males in Duval County.
What is the Median Population Age in Duval County?
Median Population Age in Duval County is 36.6 Years.
What is the Average Family Size in Duval County
Average Family Size in Duval County is 3.1 People.
What is the Average Household Size in Duval County
Average Household Size in Duval County is 2.5 People.
How Large is the Labor Force in Duval County?
There are 522,364 People in the Labor Forcein in Duval County.
What is the Percentage of People in the Labor Force in Duval County?
65.6% of People are in the Labor Force in Duval County.
What is the Unemployment Rate in Duval County?
Unemployment Rate in Duval County is 4.7%.