Melbourne Village, FL Map & Demographics
Melbourne Village Map
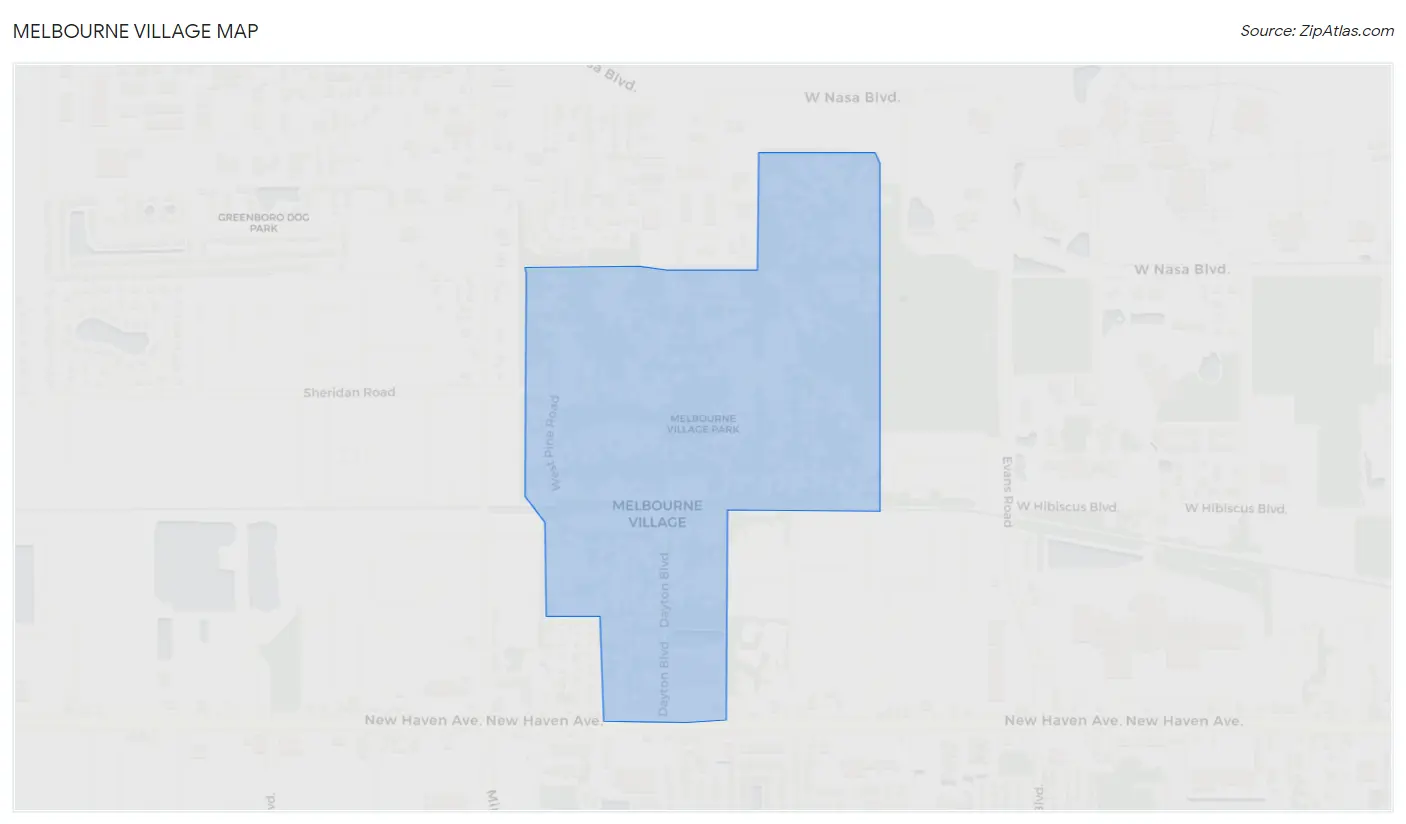
Melbourne Village Overview
$44,782
PER CAPITA INCOME
$103,333
AVG FAMILY INCOME
$92,292
AVG HOUSEHOLD INCOME
0.41
INEQUALITY / GINI INDEX
785
TOTAL POPULATION
379
MALE POPULATION
406
FEMALE POPULATION
93.35
MALES / 100 FEMALES
107.12
FEMALES / 100 MALES
58.5
MEDIAN AGE
2.8
AVG FAMILY SIZE
2.4
AVG HOUSEHOLD SIZE
322
LABOR FORCE [ PEOPLE ]
46.0%
PERCENT IN LABOR FORCE
5.3%
UNEMPLOYMENT RATE
Melbourne Village Area Codes
Income in Melbourne Village
Income Overview in Melbourne Village
Per Capita Income in Melbourne Village is $44,782, while median incomes of families and households are $103,333 and $92,292 respectively.
| Characteristic | Number | Measure |
| Per Capita Income | 785 | $44,782 |
| Median Family Income | 224 | $103,333 |
| Mean Family Income | 224 | $122,869 |
| Median Household Income | 326 | $92,292 |
| Mean Household Income | 326 | $106,473 |
| Income Deficit | 224 | $0 |
| Wage / Income Gap (%) | 785 | 0.00% |
| Wage / Income Gap ($) | 785 | 100.00¢ per $1 |
| Gini / Inequality Index | 785 | 0.41 |
Earnings by Sex in Melbourne Village
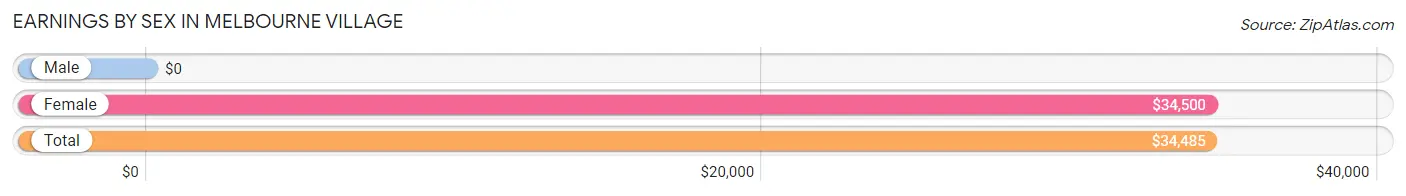
| Sex | Number | Average Earnings |
| Male | 215 (62.0%) | $0 |
| Female | 132 (38.0%) | $34,500 |
| Total | 347 (100.0%) | $34,485 |
Earnings by Sex by Income Bracket in Melbourne Village
The most common earnings brackets in Melbourne Village are $100,000+ for men (39 | 18.1%) and $75,000 to $99,999 for women (13 | 9.9%).
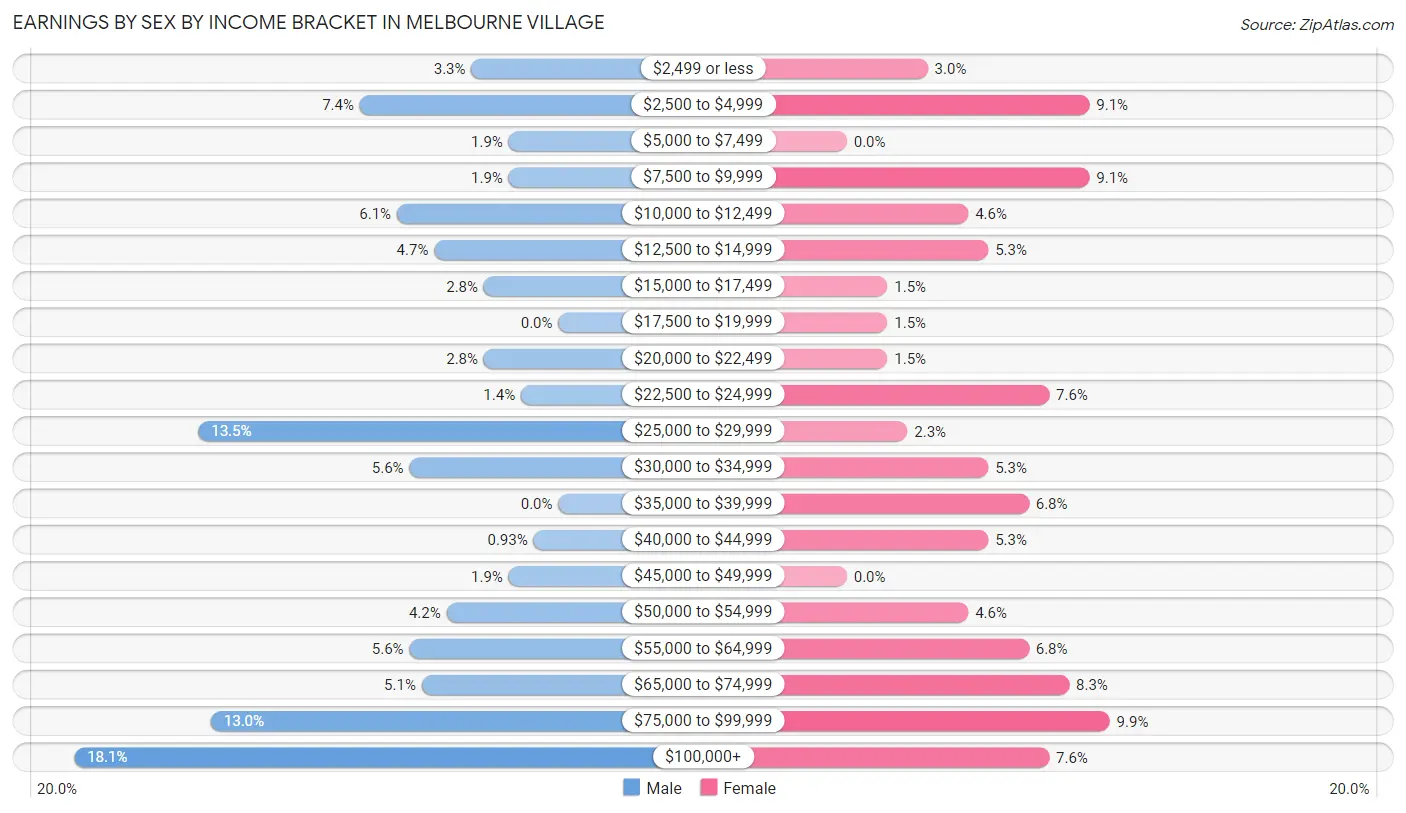
| Income | Male | Female |
| $2,499 or less | 7 (3.3%) | 4 (3.0%) |
| $2,500 to $4,999 | 16 (7.4%) | 12 (9.1%) |
| $5,000 to $7,499 | 4 (1.9%) | 0 (0.0%) |
| $7,500 to $9,999 | 4 (1.9%) | 12 (9.1%) |
| $10,000 to $12,499 | 13 (6.0%) | 6 (4.5%) |
| $12,500 to $14,999 | 10 (4.6%) | 7 (5.3%) |
| $15,000 to $17,499 | 6 (2.8%) | 2 (1.5%) |
| $17,500 to $19,999 | 0 (0.0%) | 2 (1.5%) |
| $20,000 to $22,499 | 6 (2.8%) | 2 (1.5%) |
| $22,500 to $24,999 | 3 (1.4%) | 10 (7.6%) |
| $25,000 to $29,999 | 29 (13.5%) | 3 (2.3%) |
| $30,000 to $34,999 | 12 (5.6%) | 7 (5.3%) |
| $35,000 to $39,999 | 0 (0.0%) | 9 (6.8%) |
| $40,000 to $44,999 | 2 (0.9%) | 7 (5.3%) |
| $45,000 to $49,999 | 4 (1.9%) | 0 (0.0%) |
| $50,000 to $54,999 | 9 (4.2%) | 6 (4.5%) |
| $55,000 to $64,999 | 12 (5.6%) | 9 (6.8%) |
| $65,000 to $74,999 | 11 (5.1%) | 11 (8.3%) |
| $75,000 to $99,999 | 28 (13.0%) | 13 (9.9%) |
| $100,000+ | 39 (18.1%) | 10 (7.6%) |
| Total | 215 (100.0%) | 132 (100.0%) |
Earnings by Sex by Educational Attainment in Melbourne Village
Average earnings in Melbourne Village are $53,929 for men and $36,429 for women, a difference of 32.5%. Men with an educational attainment of graduate degree enjoy the highest average annual earnings of $89,792, while those with bachelor's degree education earn the least with $63,125. Women with an educational attainment of graduate degree earn the most with the average annual earnings of $95,417, while those with college or associate's degree education have the smallest earnings of $36,607.
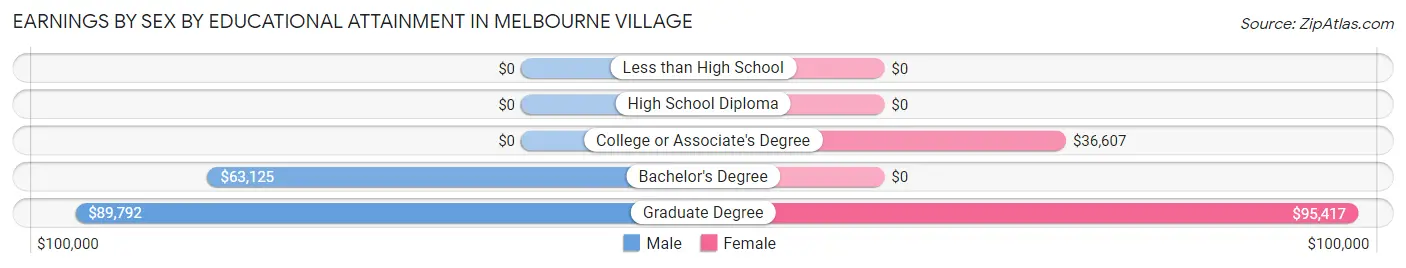
| Educational Attainment | Male Income | Female Income |
| Less than High School | - | - |
| High School Diploma | - | - |
| College or Associate's Degree | - | - |
| Bachelor's Degree | $63,125 | $0 |
| Graduate Degree | $89,792 | $95,417 |
| Total | $53,929 | $36,429 |
Family Income in Melbourne Village
Family Income Brackets in Melbourne Village
According to the Melbourne Village family income data, there are 60 families falling into the $100,000 to $149,999 income range, which is the most common income bracket and makes up 26.8% of all families. Conversely, the less than $10,000 income bracket is the least frequent group with only 4 families (1.8%) belonging to this category.
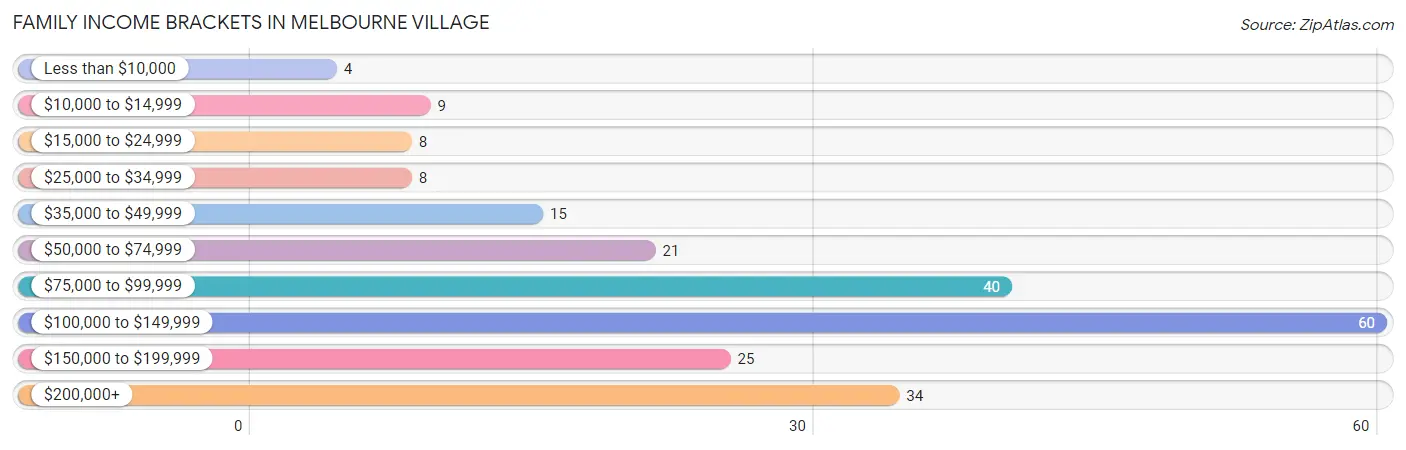
| Income Bracket | # Families | % Families |
| Less than $10,000 | 4 | 1.8% |
| $10,000 to $14,999 | 9 | 4.0% |
| $15,000 to $24,999 | 8 | 3.6% |
| $25,000 to $34,999 | 8 | 3.6% |
| $35,000 to $49,999 | 15 | 6.7% |
| $50,000 to $74,999 | 21 | 9.4% |
| $75,000 to $99,999 | 40 | 17.9% |
| $100,000 to $149,999 | 60 | 26.8% |
| $150,000 to $199,999 | 25 | 11.2% |
| $200,000+ | 34 | 15.2% |
Family Income by Famaliy Size in Melbourne Village
5-person families (7 | 3.1%) account for the highest median family income in Melbourne Village with $210,625 per family, while 2-person families (145 | 64.7%) have the highest median income of $46,958 per family member.
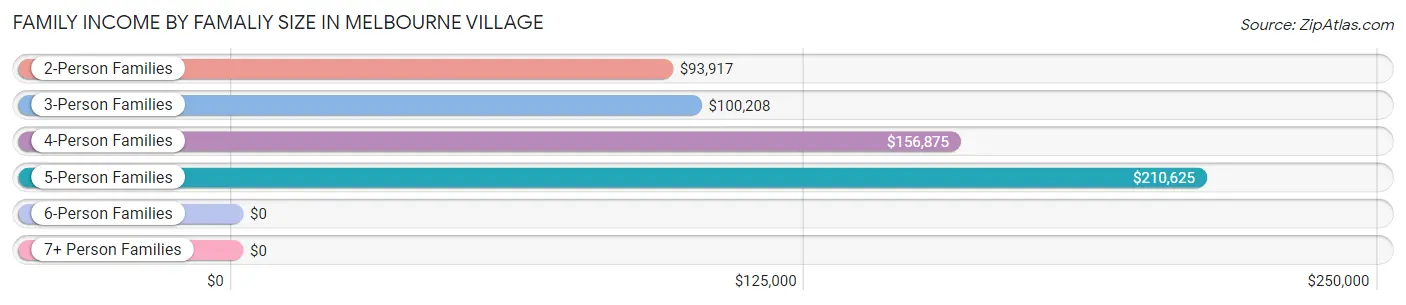
| Income Bracket | # Families | Median Income |
| 2-Person Families | 145 (64.7%) | $93,917 |
| 3-Person Families | 45 (20.1%) | $100,208 |
| 4-Person Families | 18 (8.0%) | $156,875 |
| 5-Person Families | 7 (3.1%) | $210,625 |
| 6-Person Families | 2 (0.9%) | $0 |
| 7+ Person Families | 7 (3.1%) | $0 |
| Total | 224 (100.0%) | $103,333 |
Family Income by Number of Earners in Melbourne Village
The median family income in Melbourne Village is $103,333, with families comprising 3+ earners (14) having the highest median family income of $231,000, while families with 2 earners (63) have the lowest median family income of $94,519, accounting for 6.2% and 28.1% of families, respectively.
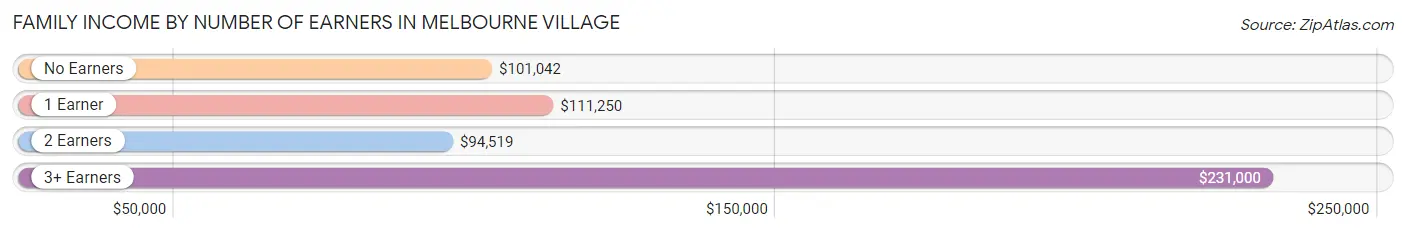
| Number of Earners | # Families | Median Income |
| No Earners | 67 (29.9%) | $101,042 |
| 1 Earner | 80 (35.7%) | $111,250 |
| 2 Earners | 63 (28.1%) | $94,519 |
| 3+ Earners | 14 (6.2%) | $231,000 |
| Total | 224 (100.0%) | $103,333 |
Household Income in Melbourne Village
Household Income Brackets in Melbourne Village
With 74 households falling in the category, the $100,000 to $149,999 income range is the most frequent in Melbourne Village, accounting for 22.7% of all households. In contrast, only 7 households (2.1%) fall into the less than $10,000 income bracket, making it the least populous group.
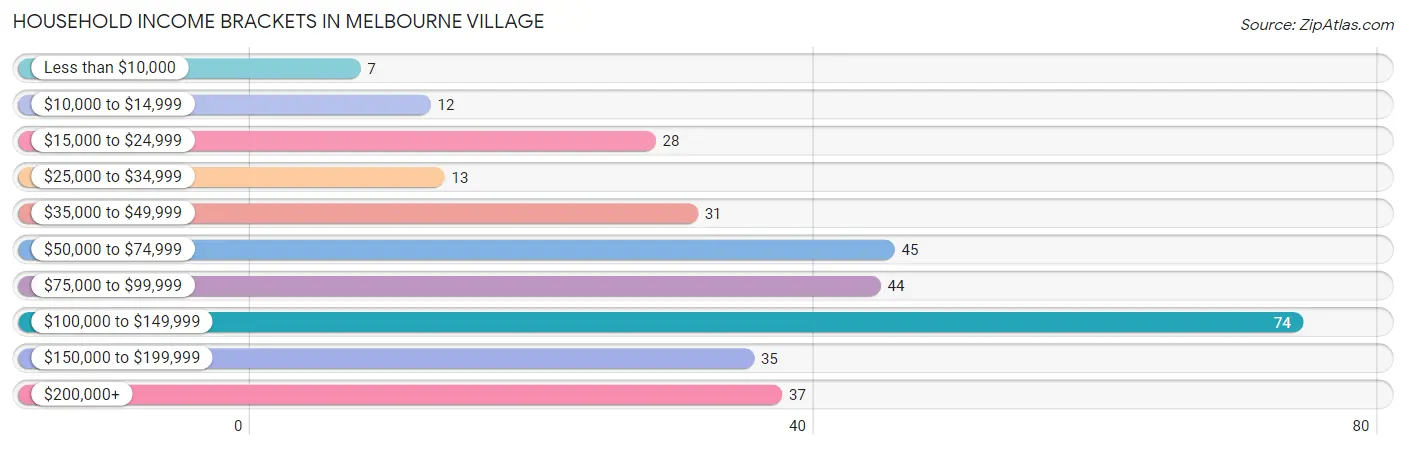
| Income Bracket | # Households | % Households |
| Less than $10,000 | 7 | 2.1% |
| $10,000 to $14,999 | 12 | 3.7% |
| $15,000 to $24,999 | 28 | 8.6% |
| $25,000 to $34,999 | 13 | 4.0% |
| $35,000 to $49,999 | 31 | 9.5% |
| $50,000 to $74,999 | 45 | 13.8% |
| $75,000 to $99,999 | 44 | 13.5% |
| $100,000 to $149,999 | 74 | 22.7% |
| $150,000 to $199,999 | 35 | 10.7% |
| $200,000+ | 37 | 11.3% |
Household Income by Householder Age in Melbourne Village
The median household income in Melbourne Village is $92,292, with the highest median household income of $129,750 found in the 25 to 44 years age bracket for the primary householder. A total of 45 households (13.8%) fall into this category. Meanwhile, the 15 to 24 years age bracket for the primary householder has the lowest median household income of $0, with 2 households (0.6%) in this group.
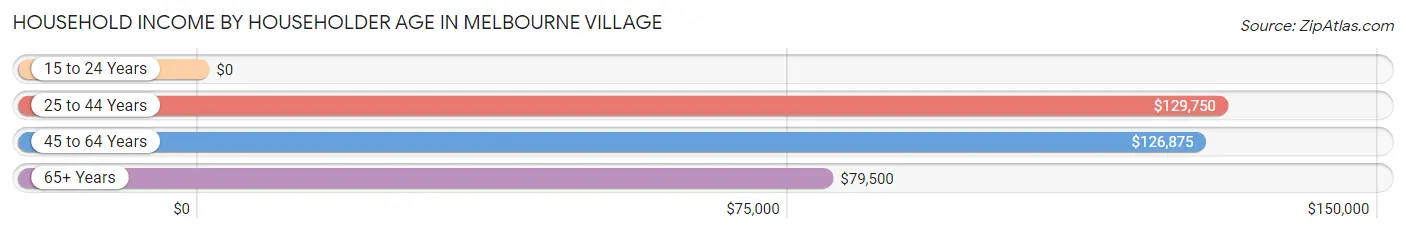
| Income Bracket | # Households | Median Income |
| 15 to 24 Years | 2 (0.6%) | $0 |
| 25 to 44 Years | 45 (13.8%) | $129,750 |
| 45 to 64 Years | 89 (27.3%) | $126,875 |
| 65+ Years | 190 (58.3%) | $79,500 |
| Total | 326 (100.0%) | $92,292 |
Poverty in Melbourne Village
Income Below Poverty by Sex and Age in Melbourne Village
With 2.1% poverty level for males and 11.6% for females among the residents of Melbourne Village, 55 to 64 year old males and 15 year old females are the most vulnerable to poverty, with 4 males (6.1%) and 9 females (75.0%) in their respective age groups living below the poverty level.
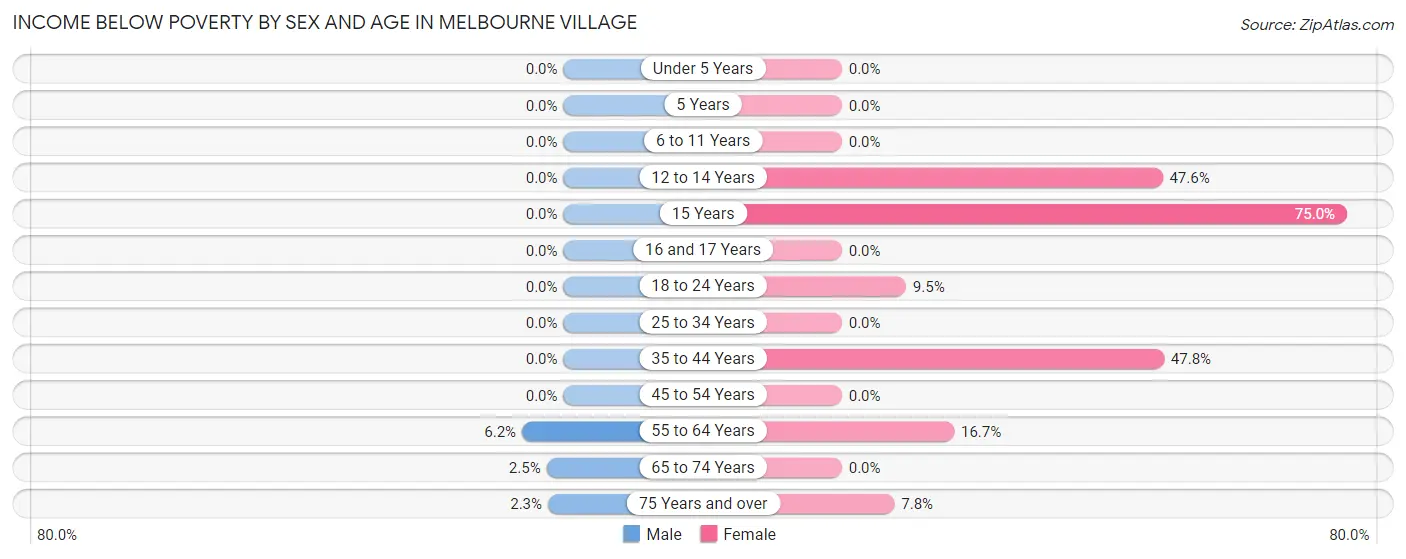
| Age Bracket | Male | Female |
| Under 5 Years | 0 (0.0%) | 0 (0.0%) |
| 5 Years | 0 (0.0%) | 0 (0.0%) |
| 6 to 11 Years | 0 (0.0%) | 0 (0.0%) |
| 12 to 14 Years | 0 (0.0%) | 10 (47.6%) |
| 15 Years | 0 (0.0%) | 9 (75.0%) |
| 16 and 17 Years | 0 (0.0%) | 0 (0.0%) |
| 18 to 24 Years | 0 (0.0%) | 2 (9.5%) |
| 25 to 34 Years | 0 (0.0%) | 0 (0.0%) |
| 35 to 44 Years | 0 (0.0%) | 11 (47.8%) |
| 45 to 54 Years | 0 (0.0%) | 0 (0.0%) |
| 55 to 64 Years | 4 (6.1%) | 10 (16.7%) |
| 65 to 74 Years | 2 (2.5%) | 0 (0.0%) |
| 75 Years and over | 2 (2.3%) | 5 (7.8%) |
| Total | 8 (2.1%) | 47 (11.6%) |
Income Above Poverty by Sex and Age in Melbourne Village
According to the poverty statistics in Melbourne Village, males aged under 5 years and females aged under 5 years are the age groups that are most secure financially, with 100.0% of males and 100.0% of females in these age groups living above the poverty line.
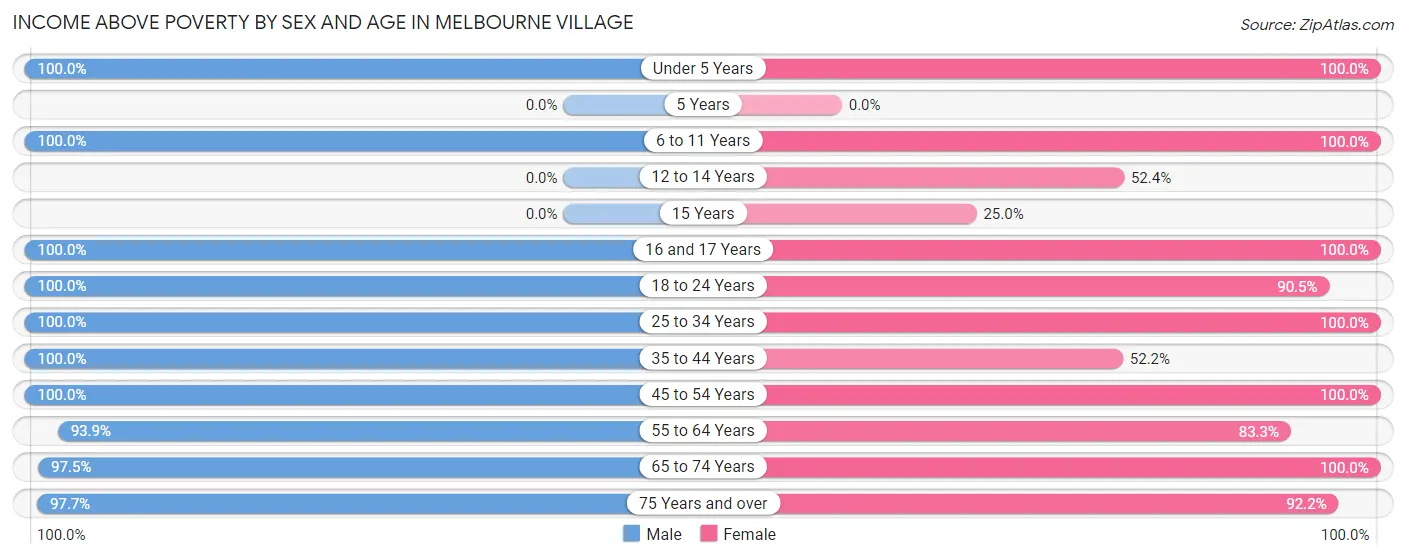
| Age Bracket | Male | Female |
| Under 5 Years | 6 (100.0%) | 16 (100.0%) |
| 5 Years | 0 (0.0%) | 0 (0.0%) |
| 6 to 11 Years | 5 (100.0%) | 23 (100.0%) |
| 12 to 14 Years | 0 (0.0%) | 11 (52.4%) |
| 15 Years | 0 (0.0%) | 3 (25.0%) |
| 16 and 17 Years | 8 (100.0%) | 2 (100.0%) |
| 18 to 24 Years | 27 (100.0%) | 19 (90.5%) |
| 25 to 34 Years | 36 (100.0%) | 37 (100.0%) |
| 35 to 44 Years | 33 (100.0%) | 12 (52.2%) |
| 45 to 54 Years | 32 (100.0%) | 48 (100.0%) |
| 55 to 64 Years | 61 (93.9%) | 50 (83.3%) |
| 65 to 74 Years | 78 (97.5%) | 77 (100.0%) |
| 75 Years and over | 85 (97.7%) | 59 (92.2%) |
| Total | 371 (97.9%) | 357 (88.4%) |
Income Below Poverty Among Married-Couple Families in Melbourne Village
The poverty statistics for married-couple families in Melbourne Village show that 3.5% or 6 of the total 174 families live below the poverty line. Families with no children have the highest poverty rate of 4.3%, comprising of 6 families. On the other hand, families with 1 or 2 children have the lowest poverty rate of 0.0%, which includes 0 families.
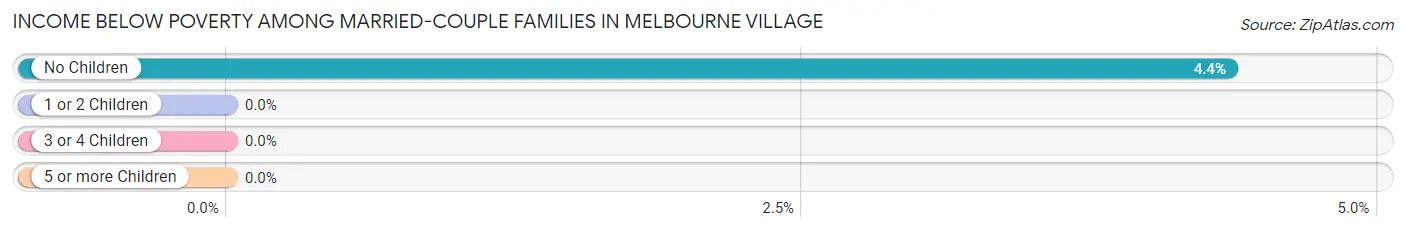
| Children | Above Poverty | Below Poverty |
| No Children | 132 (95.7%) | 6 (4.3%) |
| 1 or 2 Children | 29 (100.0%) | 0 (0.0%) |
| 3 or 4 Children | 0 (0.0%) | 0 (0.0%) |
| 5 or more Children | 7 (100.0%) | 0 (0.0%) |
| Total | 168 (96.6%) | 6 (3.5%) |
Income Below Poverty Among Single-Parent Households in Melbourne Village
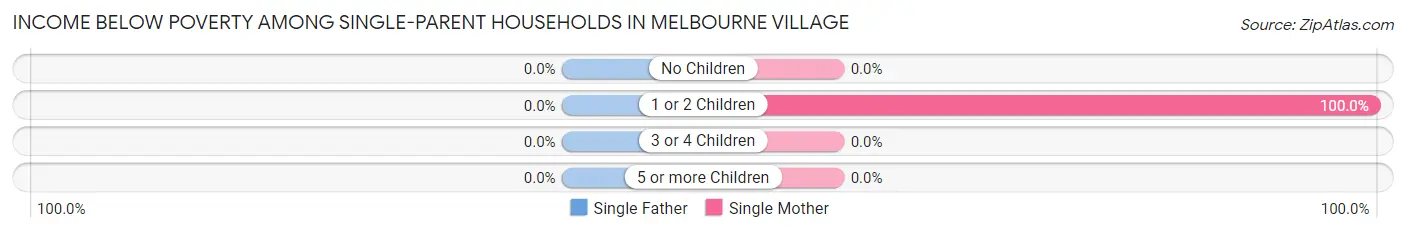
| Children | Single Father | Single Mother |
| No Children | 0 (0.0%) | 0 (0.0%) |
| 1 or 2 Children | 0 (0.0%) | 7 (100.0%) |
| 3 or 4 Children | 0 (0.0%) | 0 (0.0%) |
| 5 or more Children | 0 (0.0%) | 0 (0.0%) |
| Total | 0 (0.0%) | 7 (23.3%) |
Income Below Poverty Among Married-Couple vs Single-Parent Households in Melbourne Village
The poverty data for Melbourne Village shows that 6 of the married-couple family households (3.5%) and 7 of the single-parent households (14.0%) are living below the poverty level. Within the married-couple family households, those with no children have the highest poverty rate, with 6 households (4.3%) falling below the poverty line. Among the single-parent households, those with 1 or 2 children have the highest poverty rate, with 7 household (100.0%) living below poverty.
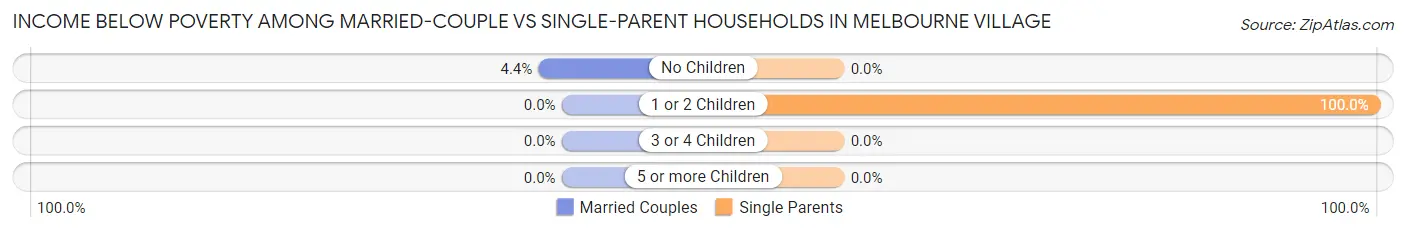
| Children | Married-Couple Families | Single-Parent Households |
| No Children | 6 (4.3%) | 0 (0.0%) |
| 1 or 2 Children | 0 (0.0%) | 7 (100.0%) |
| 3 or 4 Children | 0 (0.0%) | 0 (0.0%) |
| 5 or more Children | 0 (0.0%) | 0 (0.0%) |
| Total | 6 (3.5%) | 7 (14.0%) |
Race in Melbourne Village
The most populous races in Melbourne Village are White / Caucasian (664 | 84.6%), Hispanic or Latino (74 | 9.4%), and Two or more Races (48 | 6.1%).
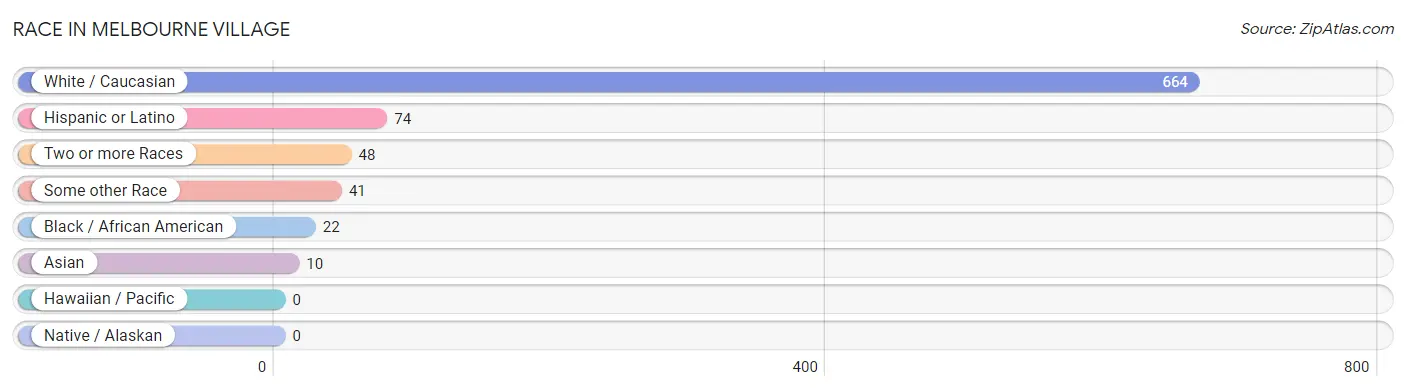
| Race | # Population | % Population |
| Asian | 10 | 1.3% |
| Black / African American | 22 | 2.8% |
| Hawaiian / Pacific | 0 | 0.0% |
| Hispanic or Latino | 74 | 9.4% |
| Native / Alaskan | 0 | 0.0% |
| White / Caucasian | 664 | 84.6% |
| Two or more Races | 48 | 6.1% |
| Some other Race | 41 | 5.2% |
| Total | 785 | 100.0% |
Ancestry in Melbourne Village
The most populous ancestries reported in Melbourne Village are English (185 | 23.6%), German (129 | 16.4%), Irish (97 | 12.4%), Scottish (78 | 9.9%), and American (69 | 8.8%), together accounting for 71.1% of all Melbourne Village residents.
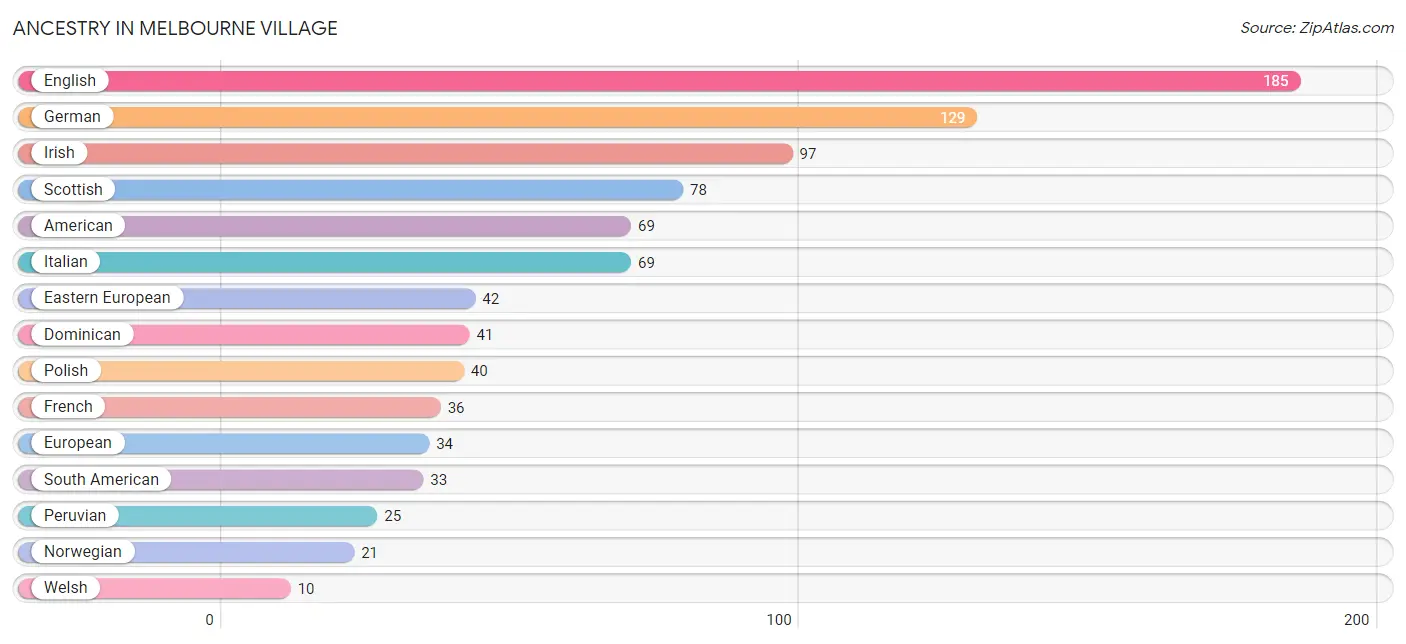
| Ancestry | # Population | % Population |
| American | 69 | 8.8% |
| Belgian | 2 | 0.3% |
| British | 2 | 0.3% |
| Celtic | 2 | 0.3% |
| Chilean | 2 | 0.3% |
| Czech | 2 | 0.3% |
| Danish | 7 | 0.9% |
| Dominican | 41 | 5.2% |
| Dutch | 2 | 0.3% |
| Eastern European | 42 | 5.3% |
| English | 185 | 23.6% |
| Estonian | 1 | 0.1% |
| European | 34 | 4.3% |
| Filipino | 6 | 0.8% |
| Finnish | 3 | 0.4% |
| French | 36 | 4.6% |
| French Canadian | 8 | 1.0% |
| German | 129 | 16.4% |
| Hungarian | 1 | 0.1% |
| Irish | 97 | 12.4% |
| Italian | 69 | 8.8% |
| Korean | 4 | 0.5% |
| Lithuanian | 5 | 0.6% |
| Norwegian | 21 | 2.7% |
| Peruvian | 25 | 3.2% |
| Polish | 40 | 5.1% |
| Portuguese | 6 | 0.8% |
| Romanian | 2 | 0.3% |
| Russian | 3 | 0.4% |
| Scotch-Irish | 7 | 0.9% |
| Scottish | 78 | 9.9% |
| Slavic | 6 | 0.8% |
| South American | 33 | 4.2% |
| Swedish | 9 | 1.1% |
| Ukrainian | 3 | 0.4% |
| Venezuelan | 6 | 0.8% |
| Welsh | 10 | 1.3% | View All 37 Rows |
Immigrants in Melbourne Village
The most numerous immigrant groups reported in Melbourne Village came from Latin America (40 | 5.1%), South America (33 | 4.2%), Europe (29 | 3.7%), Northern Europe (21 | 2.7%), and Brazil (16 | 2.0%), together accounting for 17.7% of all Melbourne Village residents.
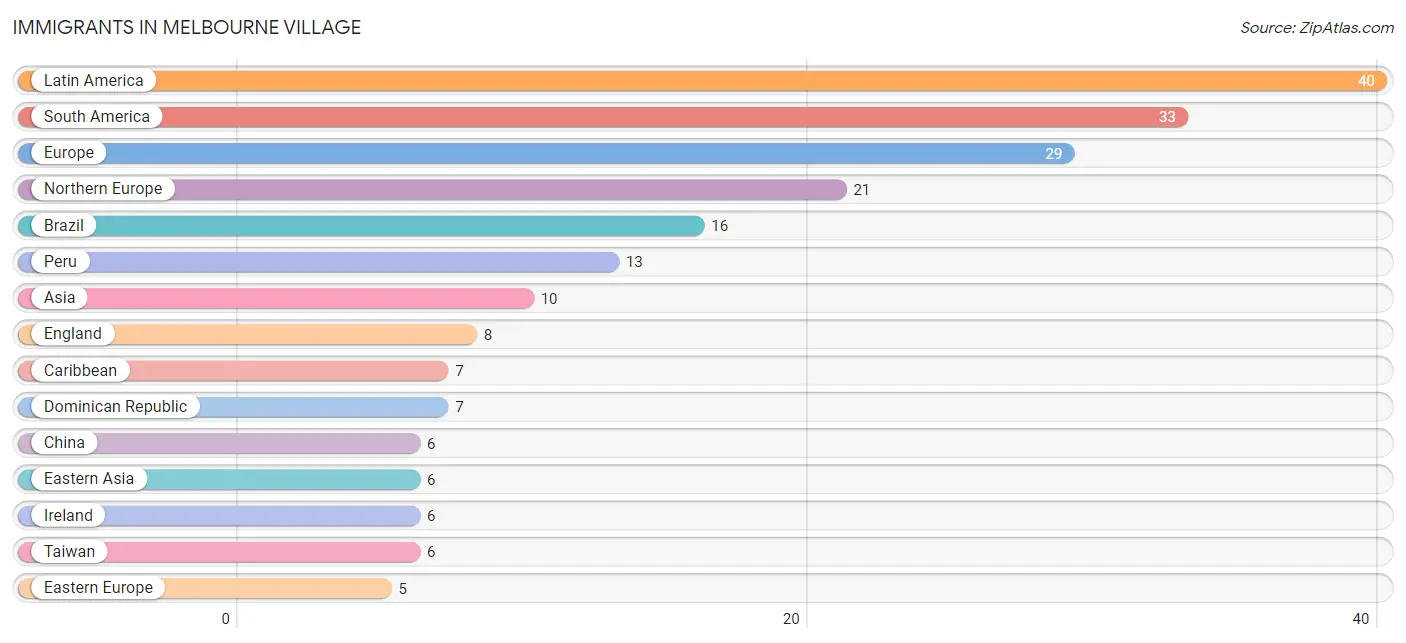
| Immigration Origin | # Population | % Population |
| Asia | 10 | 1.3% |
| Brazil | 16 | 2.0% |
| Canada | 2 | 0.3% |
| Caribbean | 7 | 0.9% |
| Chile | 2 | 0.3% |
| China | 6 | 0.8% |
| Czechoslovakia | 2 | 0.3% |
| Dominican Republic | 7 | 0.9% |
| Eastern Asia | 6 | 0.8% |
| Eastern Europe | 5 | 0.6% |
| England | 8 | 1.0% |
| Europe | 29 | 3.7% |
| Ireland | 6 | 0.8% |
| Italy | 3 | 0.4% |
| Latin America | 40 | 5.1% |
| Northern Europe | 21 | 2.7% |
| Peru | 13 | 1.7% |
| Philippines | 4 | 0.5% |
| South America | 33 | 4.2% |
| South Eastern Asia | 4 | 0.5% |
| Southern Europe | 3 | 0.4% |
| Taiwan | 6 | 0.8% |
| Ukraine | 3 | 0.4% |
| Venezuela | 2 | 0.3% | View All 24 Rows |
Sex and Age in Melbourne Village
Sex and Age in Melbourne Village
The most populous age groups in Melbourne Village are 70 to 74 Years (50 | 13.2%) for men and 65 to 69 Years (51 | 12.6%) for women.
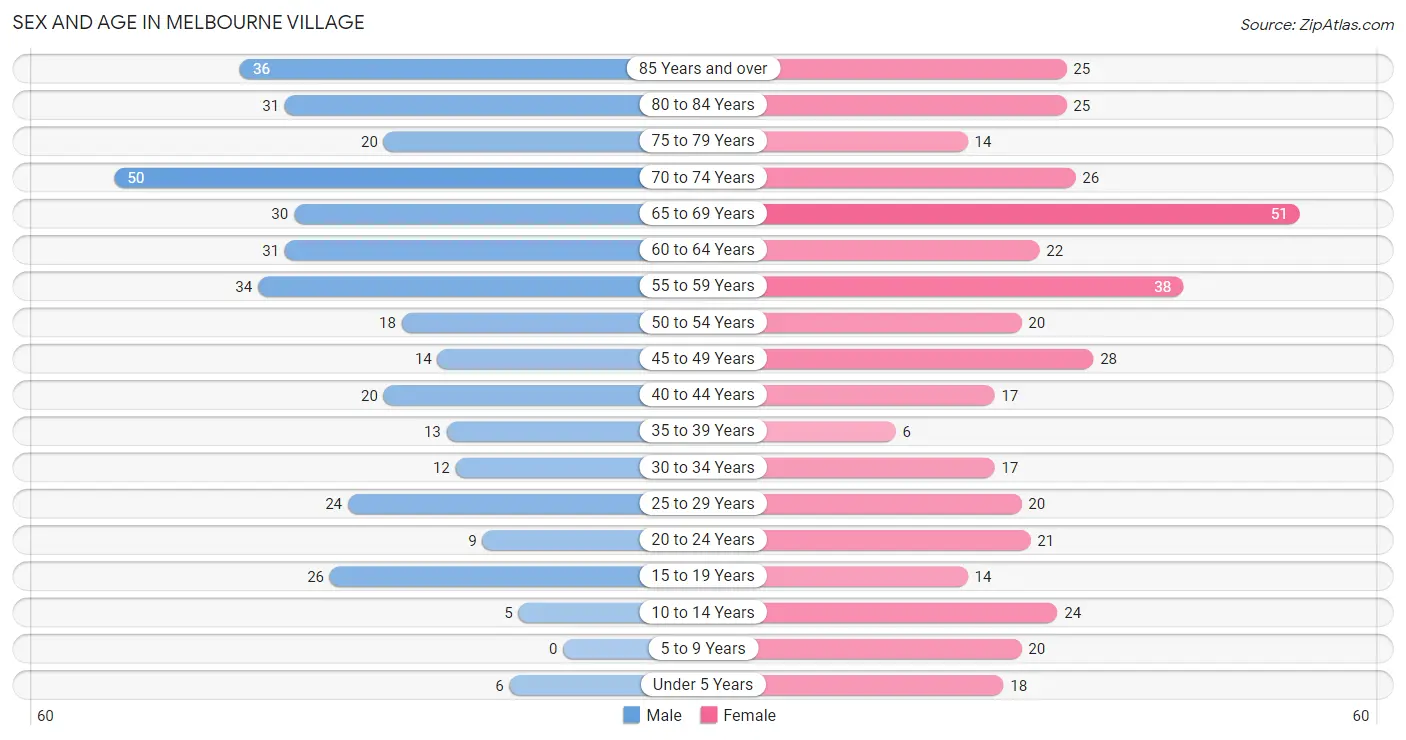
| Age Bracket | Male | Female |
| Under 5 Years | 6 (1.6%) | 18 (4.4%) |
| 5 to 9 Years | 0 (0.0%) | 20 (4.9%) |
| 10 to 14 Years | 5 (1.3%) | 24 (5.9%) |
| 15 to 19 Years | 26 (6.9%) | 14 (3.5%) |
| 20 to 24 Years | 9 (2.4%) | 21 (5.2%) |
| 25 to 29 Years | 24 (6.3%) | 20 (4.9%) |
| 30 to 34 Years | 12 (3.2%) | 17 (4.2%) |
| 35 to 39 Years | 13 (3.4%) | 6 (1.5%) |
| 40 to 44 Years | 20 (5.3%) | 17 (4.2%) |
| 45 to 49 Years | 14 (3.7%) | 28 (6.9%) |
| 50 to 54 Years | 18 (4.8%) | 20 (4.9%) |
| 55 to 59 Years | 34 (9.0%) | 38 (9.4%) |
| 60 to 64 Years | 31 (8.2%) | 22 (5.4%) |
| 65 to 69 Years | 30 (7.9%) | 51 (12.6%) |
| 70 to 74 Years | 50 (13.2%) | 26 (6.4%) |
| 75 to 79 Years | 20 (5.3%) | 14 (3.5%) |
| 80 to 84 Years | 31 (8.2%) | 25 (6.2%) |
| 85 Years and over | 36 (9.5%) | 25 (6.2%) |
| Total | 379 (100.0%) | 406 (100.0%) |
Families and Households in Melbourne Village
Median Family Size in Melbourne Village
The median family size in Melbourne Village is 2.83 persons per family, with single female/mother families (30 | 13.4%) accounting for the largest median family size of 3.27 persons per family. On the other hand, single male/father families (20 | 8.9%) represent the smallest median family size with 2.50 persons per family.
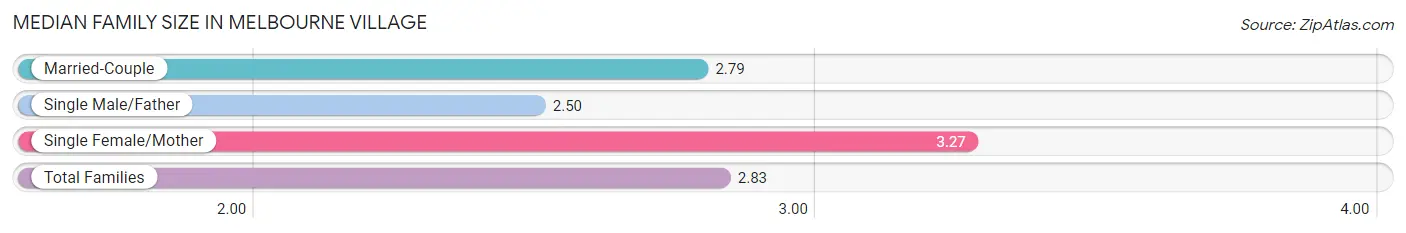
| Family Type | # Families | Family Size |
| Married-Couple | 174 (77.7%) | 2.79 |
| Single Male/Father | 20 (8.9%) | 2.50 |
| Single Female/Mother | 30 (13.4%) | 3.27 |
| Total Families | 224 (100.0%) | 2.83 |
Median Household Size in Melbourne Village
The median household size in Melbourne Village is 2.41 persons per household, with single female/mother households (30 | 9.2%) accounting for the largest median household size of 3.43 persons per household. non-family households (102 | 31.3%) represent the smallest median household size with 1.40 persons per household.
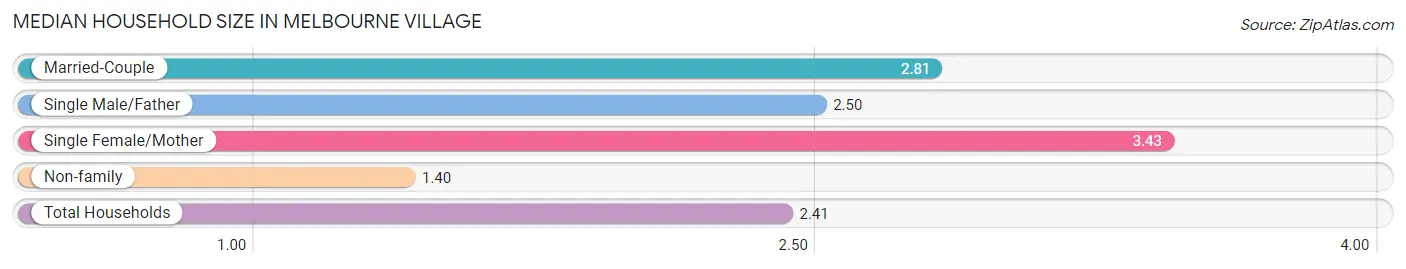
| Household Type | # Households | Household Size |
| Married-Couple | 174 (53.4%) | 2.81 |
| Single Male/Father | 20 (6.1%) | 2.50 |
| Single Female/Mother | 30 (9.2%) | 3.43 |
| Non-family | 102 (31.3%) | 1.40 |
| Total Households | 326 (100.0%) | 2.41 |
Household Size by Marriage Status in Melbourne Village
Out of a total of 326 households in Melbourne Village, 224 (68.7%) are family households, while 102 (31.3%) are nonfamily households. The most numerous type of family households are 2-person households, comprising 138, and the most common type of nonfamily households are 1-person households, comprising 71.
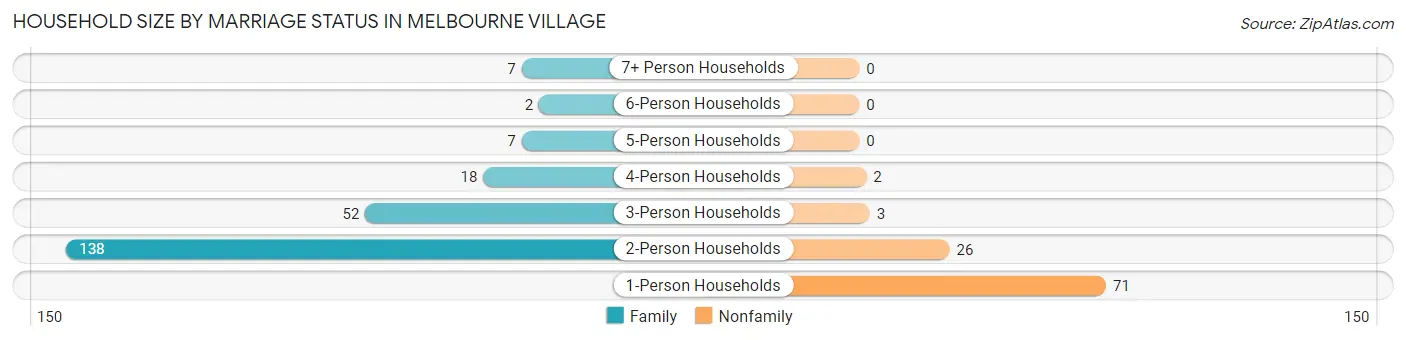
| Household Size | Family Households | Nonfamily Households |
| 1-Person Households | - | 71 (21.8%) |
| 2-Person Households | 138 (42.3%) | 26 (8.0%) |
| 3-Person Households | 52 (16.0%) | 3 (0.9%) |
| 4-Person Households | 18 (5.5%) | 2 (0.6%) |
| 5-Person Households | 7 (2.1%) | 0 (0.0%) |
| 6-Person Households | 2 (0.6%) | 0 (0.0%) |
| 7+ Person Households | 7 (2.1%) | 0 (0.0%) |
| Total | 224 (68.7%) | 102 (31.3%) |
Female Fertility in Melbourne Village
Fertility by Age in Melbourne Village
Average fertility rate in Melbourne Village is 24.0 births per 1,000 women. Women in the age bracket of 20 to 34 years have the highest fertility rate with 52.0 births per 1,000 women. Women in the age bracket of 20 to 34 years acount for 100.0% of all women with births.
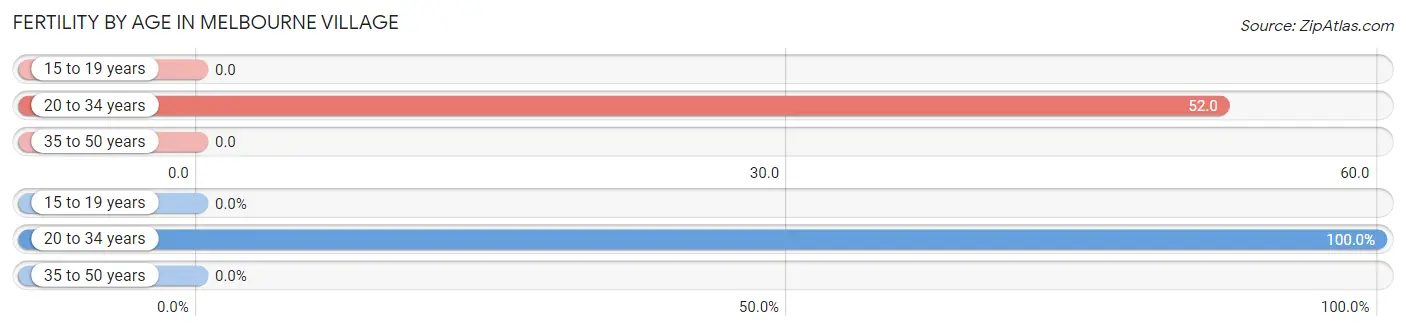
| Age Bracket | Women with Births | Births / 1,000 Women |
| 15 to 19 years | 0 (0.0%) | 0.0 |
| 20 to 34 years | 3 (100.0%) | 52.0 |
| 35 to 50 years | 0 (0.0%) | 0.0 |
| Total | 3 (100.0%) | 24.0 |
Fertility by Age by Marriage Status in Melbourne Village
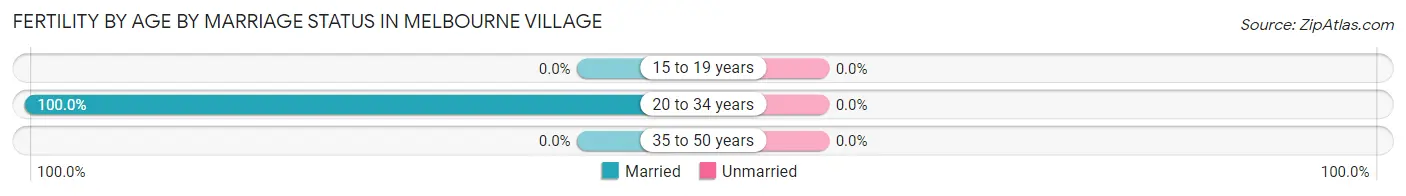
| Age Bracket | Married | Unmarried |
| 15 to 19 years | 0 (0.0%) | 0 (0.0%) |
| 20 to 34 years | 3 (100.0%) | 0 (0.0%) |
| 35 to 50 years | 0 (0.0%) | 0 (0.0%) |
| Total | 3 (100.0%) | 0 (0.0%) |
Fertility by Education in Melbourne Village
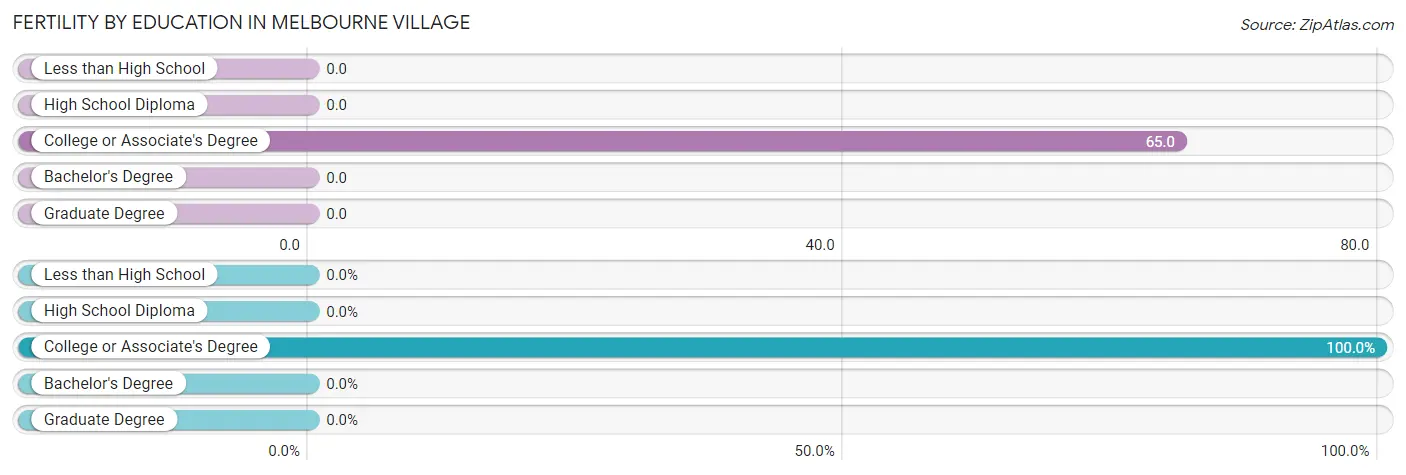
| Educational Attainment | Women with Births | Births / 1,000 Women |
| Less than High School | 0 (0.0%) | 0.0 |
| High School Diploma | 0 (0.0%) | 0.0 |
| College or Associate's Degree | 3 (100.0%) | 65.0 |
| Bachelor's Degree | 0 (0.0%) | 0.0 |
| Graduate Degree | 0 (0.0%) | 0.0 |
| Total | 3 (100.0%) | 24.0 |
Fertility by Education by Marriage Status in Melbourne Village
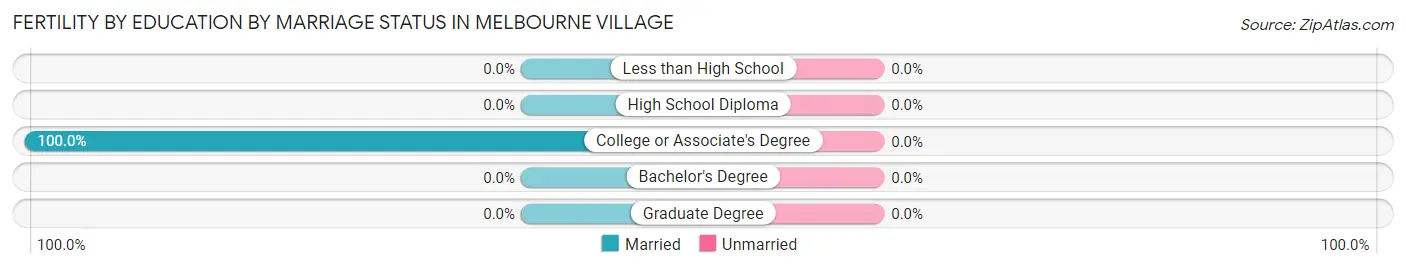
| Educational Attainment | Married | Unmarried |
| Less than High School | 0 (0.0%) | 0 (0.0%) |
| High School Diploma | 0 (0.0%) | 0 (0.0%) |
| College or Associate's Degree | 3 (100.0%) | 0 (0.0%) |
| Bachelor's Degree | 0 (0.0%) | 0 (0.0%) |
| Graduate Degree | 0 (0.0%) | 0 (0.0%) |
| Total | 3 (100.0%) | 0 (0.0%) |
Employment Characteristics in Melbourne Village
Employment by Class of Employer in Melbourne Village
Among the 283 employed individuals in Melbourne Village, private company employees (170 | 60.1%), local government employees (43 | 15.2%), and not-for-profit organizations (24 | 8.5%) make up the most common classes of employment.
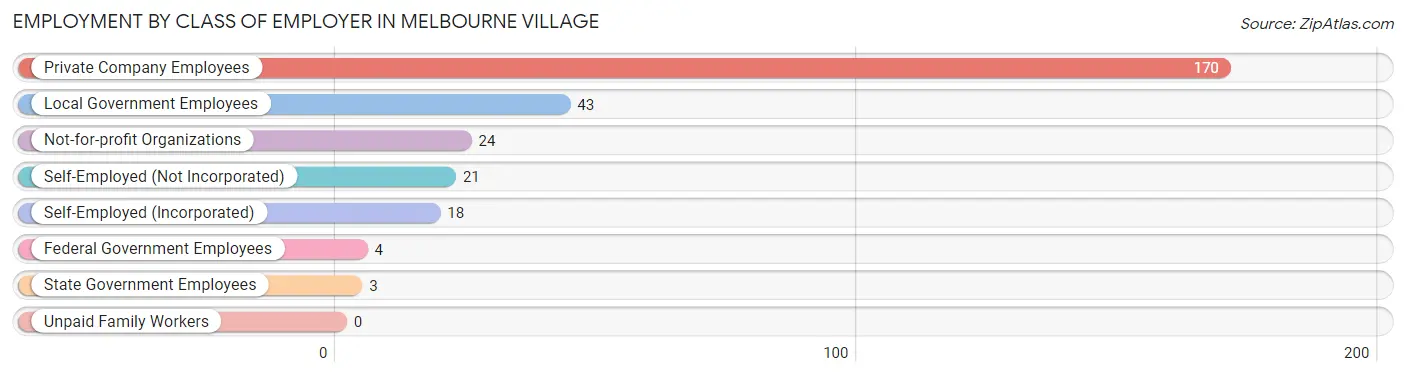
| Employer Class | # Employees | % Employees |
| Private Company Employees | 170 | 60.1% |
| Self-Employed (Incorporated) | 18 | 6.4% |
| Self-Employed (Not Incorporated) | 21 | 7.4% |
| Not-for-profit Organizations | 24 | 8.5% |
| Local Government Employees | 43 | 15.2% |
| State Government Employees | 3 | 1.1% |
| Federal Government Employees | 4 | 1.4% |
| Unpaid Family Workers | 0 | 0.0% |
| Total | 283 | 100.0% |
Employment Status by Age in Melbourne Village
According to the labor force statistics for Melbourne Village, out of the total population over 16 years of age (700), 46.0% or 322 individuals are in the labor force, with 5.3% or 17 of them unemployed. The age group with the highest labor force participation rate is 45 to 54 years, with 88.8% or 71 individuals in the labor force. Within the labor force, the 20 to 24 years age range has the highest percentage of unemployed individuals, with 31.6% or 6 of them being unemployed.
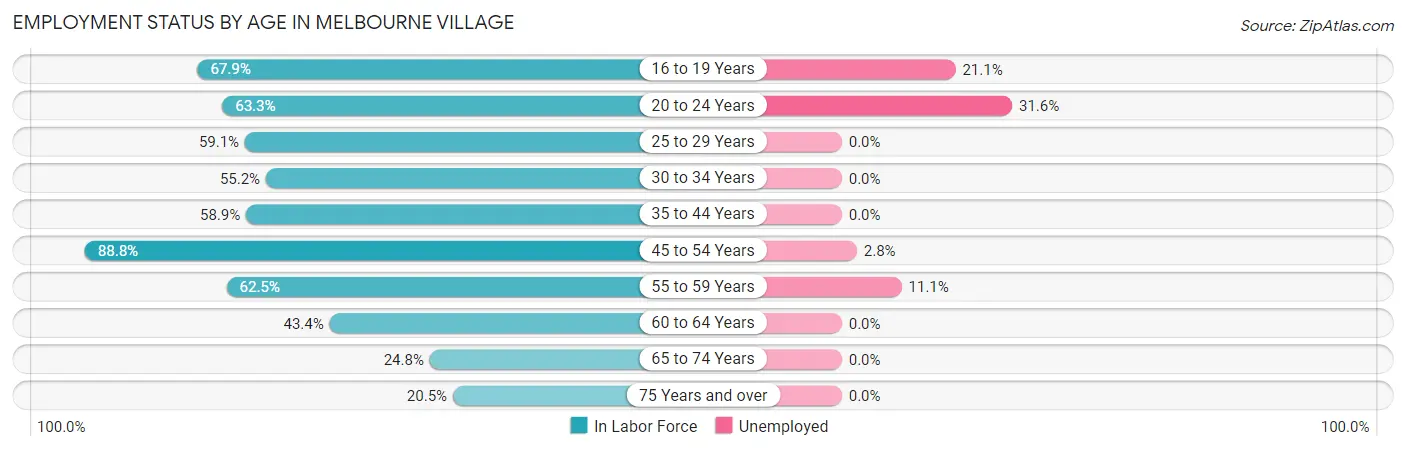
| Age Bracket | In Labor Force | Unemployed |
| 16 to 19 Years | 19 (67.9%) | 4 (21.1%) |
| 20 to 24 Years | 19 (63.3%) | 6 (31.6%) |
| 25 to 29 Years | 26 (59.1%) | 0 (0.0%) |
| 30 to 34 Years | 16 (55.2%) | 0 (0.0%) |
| 35 to 44 Years | 33 (58.9%) | 0 (0.0%) |
| 45 to 54 Years | 71 (88.8%) | 2 (2.8%) |
| 55 to 59 Years | 45 (62.5%) | 5 (11.1%) |
| 60 to 64 Years | 23 (43.4%) | 0 (0.0%) |
| 65 to 74 Years | 39 (24.8%) | 0 (0.0%) |
| 75 Years and over | 31 (20.5%) | 0 (0.0%) |
| Total | 322 (46.0%) | 17 (5.3%) |
Employment Status by Educational Attainment in Melbourne Village
According to labor force statistics for Melbourne Village, 64.1% of individuals (214) out of the total population between 25 and 64 years of age (334) are in the labor force, with 3.3% or 7 of them being unemployed. The group with the highest labor force participation rate are those with the educational attainment of bachelor's degree or higher, with 81.6% or 124 individuals in the labor force. Within the labor force, individuals with college / associate degree education have the highest percentage of unemployment, with 8.9% or 5 of them being unemployed.
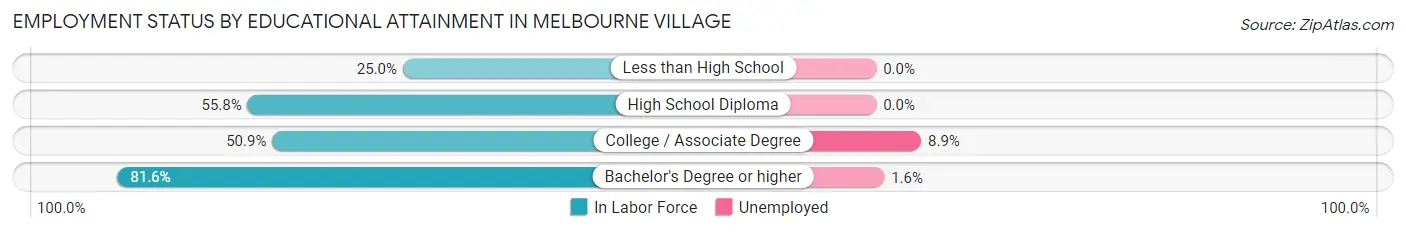
| Educational Attainment | In Labor Force | Unemployed |
| Less than High School | 5 (25.0%) | 0 (0.0%) |
| High School Diploma | 29 (55.8%) | 0 (0.0%) |
| College / Associate Degree | 56 (50.9%) | 10 (8.9%) |
| Bachelor's Degree or higher | 124 (81.6%) | 2 (1.6%) |
| Total | 214 (64.1%) | 11 (3.3%) |
Employment Occupations by Sex in Melbourne Village
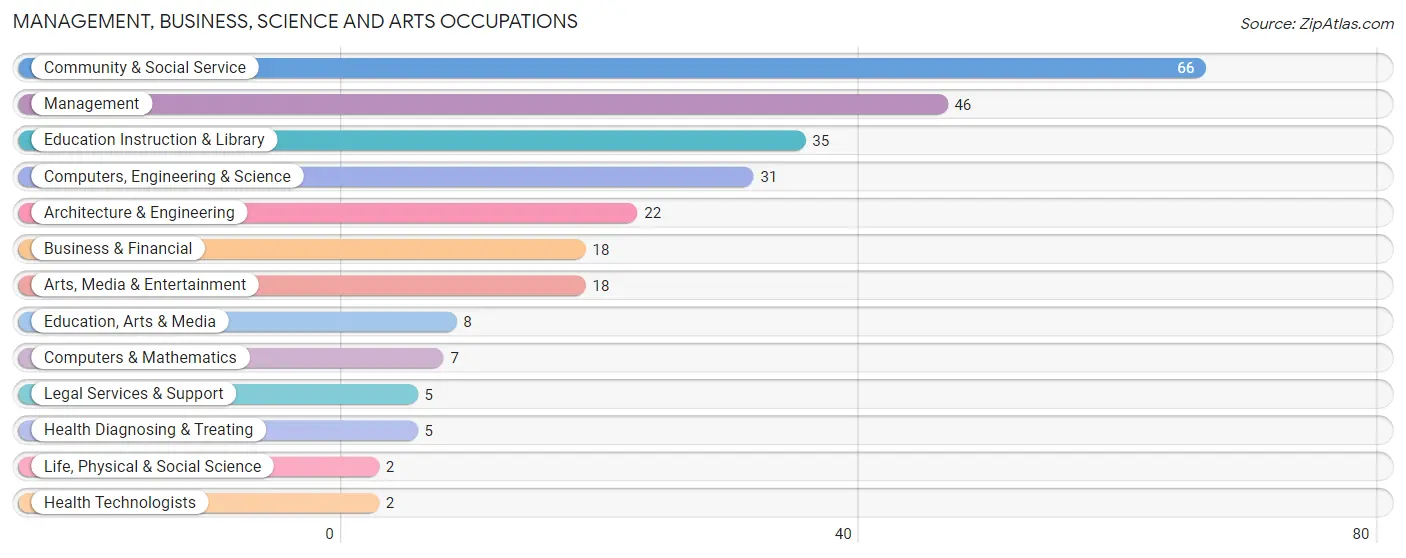
Management, Business, Science and Arts Occupations
The most common Management, Business, Science and Arts occupations in Melbourne Village are Community & Social Service (66 | 21.6%), Management (46 | 15.1%), Education Instruction & Library (35 | 11.5%), Computers, Engineering & Science (31 | 10.2%), and Architecture & Engineering (22 | 7.2%).
Management, Business, Science and Arts Occupations by Sex
Within the Management, Business, Science and Arts occupations in Melbourne Village, the most male-oriented occupations are Architecture & Engineering (100.0%), Life, Physical & Social Science (100.0%), and Legal Services & Support (100.0%), while the most female-oriented occupations are Business & Financial (88.9%), Arts, Media & Entertainment (66.7%), and Education Instruction & Library (60.0%).
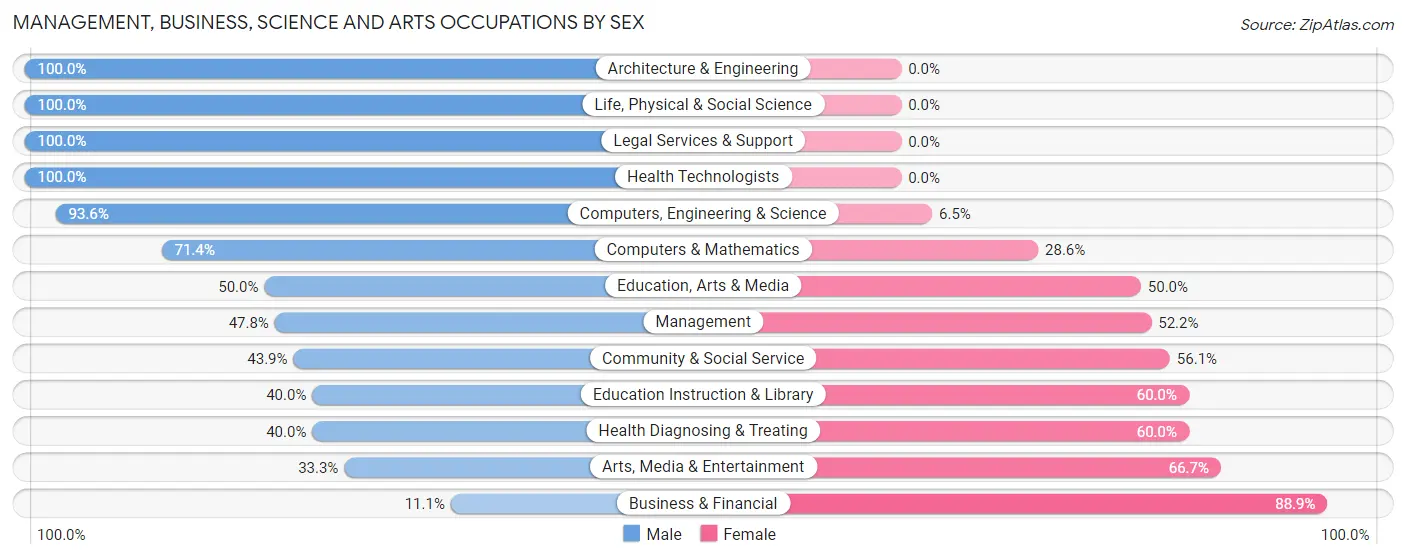
| Occupation | Male | Female |
| Management | 22 (47.8%) | 24 (52.2%) |
| Business & Financial | 2 (11.1%) | 16 (88.9%) |
| Computers, Engineering & Science | 29 (93.5%) | 2 (6.5%) |
| Computers & Mathematics | 5 (71.4%) | 2 (28.6%) |
| Architecture & Engineering | 22 (100.0%) | 0 (0.0%) |
| Life, Physical & Social Science | 2 (100.0%) | 0 (0.0%) |
| Community & Social Service | 29 (43.9%) | 37 (56.1%) |
| Education, Arts & Media | 4 (50.0%) | 4 (50.0%) |
| Legal Services & Support | 5 (100.0%) | 0 (0.0%) |
| Education Instruction & Library | 14 (40.0%) | 21 (60.0%) |
| Arts, Media & Entertainment | 6 (33.3%) | 12 (66.7%) |
| Health Diagnosing & Treating | 2 (40.0%) | 3 (60.0%) |
| Health Technologists | 2 (100.0%) | 0 (0.0%) |
| Total (Category) | 84 (50.6%) | 82 (49.4%) |
| Total (Overall) | 189 (62.0%) | 116 (38.0%) |
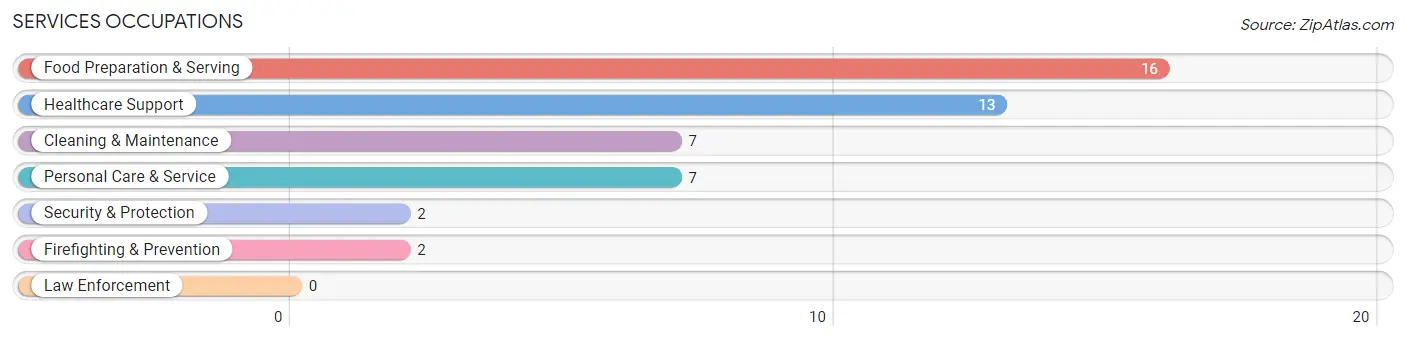
Services Occupations
The most common Services occupations in Melbourne Village are Food Preparation & Serving (16 | 5.2%), Healthcare Support (13 | 4.3%), Cleaning & Maintenance (7 | 2.3%), Personal Care & Service (7 | 2.3%), and Security & Protection (2 | 0.7%).
Services Occupations by Sex
Within the Services occupations in Melbourne Village, the most male-oriented occupations are Security & Protection (100.0%), Firefighting & Prevention (100.0%), and Food Preparation & Serving (100.0%), while the most female-oriented occupations are Cleaning & Maintenance (100.0%), and Healthcare Support (46.2%).
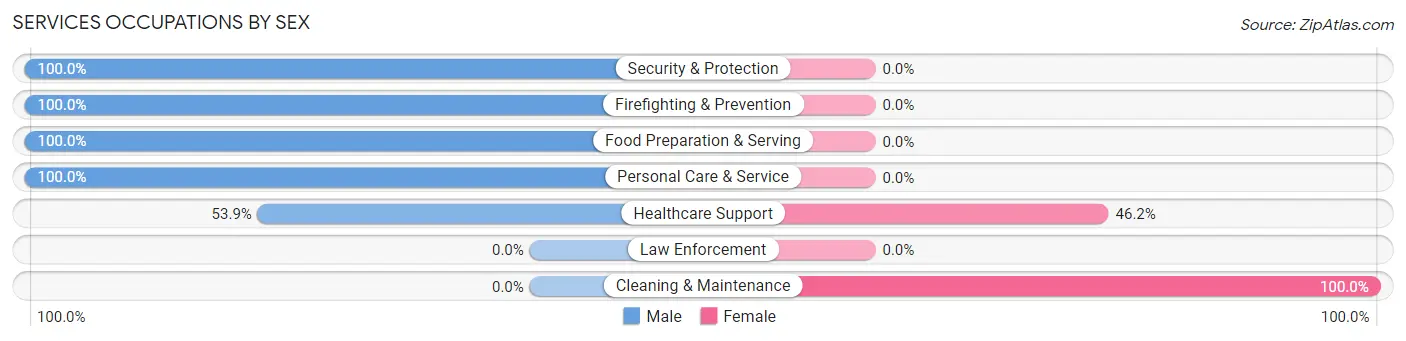
| Occupation | Male | Female |
| Healthcare Support | 7 (53.8%) | 6 (46.2%) |
| Security & Protection | 2 (100.0%) | 0 (0.0%) |
| Firefighting & Prevention | 2 (100.0%) | 0 (0.0%) |
| Law Enforcement | 0 (0.0%) | 0 (0.0%) |
| Food Preparation & Serving | 16 (100.0%) | 0 (0.0%) |
| Cleaning & Maintenance | 0 (0.0%) | 7 (100.0%) |
| Personal Care & Service | 7 (100.0%) | 0 (0.0%) |
| Total (Category) | 32 (71.1%) | 13 (28.9%) |
| Total (Overall) | 189 (62.0%) | 116 (38.0%) |
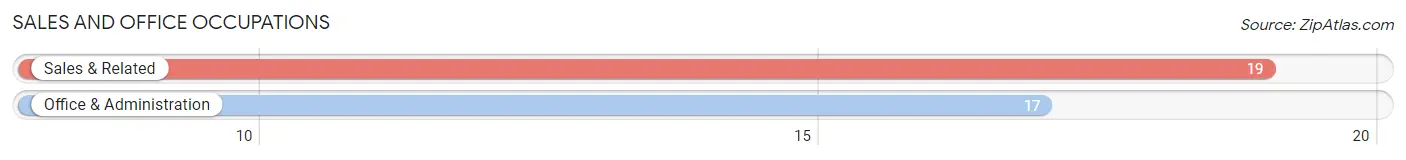
Sales and Office Occupations
The most common Sales and Office occupations in Melbourne Village are Sales & Related (19 | 6.2%), and Office & Administration (17 | 5.6%).
Sales and Office Occupations by Sex
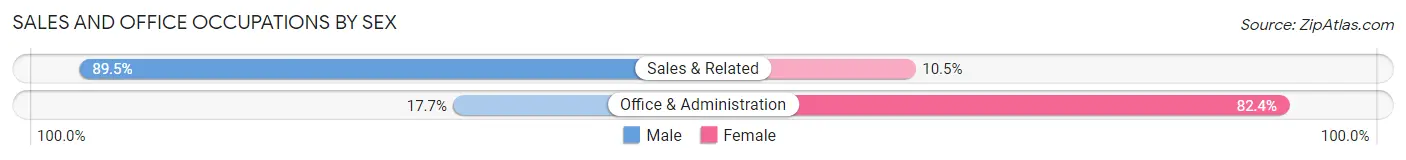
| Occupation | Male | Female |
| Sales & Related | 17 (89.5%) | 2 (10.5%) |
| Office & Administration | 3 (17.6%) | 14 (82.4%) |
| Total (Category) | 20 (55.6%) | 16 (44.4%) |
| Total (Overall) | 189 (62.0%) | 116 (38.0%) |
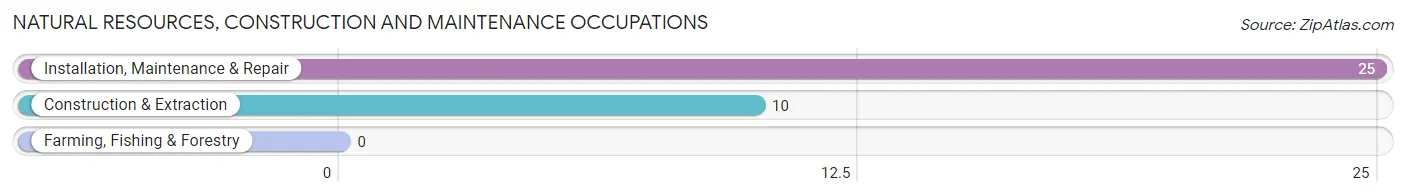
Natural Resources, Construction and Maintenance Occupations
The most common Natural Resources, Construction and Maintenance occupations in Melbourne Village are Installation, Maintenance & Repair (25 | 8.2%), and Construction & Extraction (10 | 3.3%).
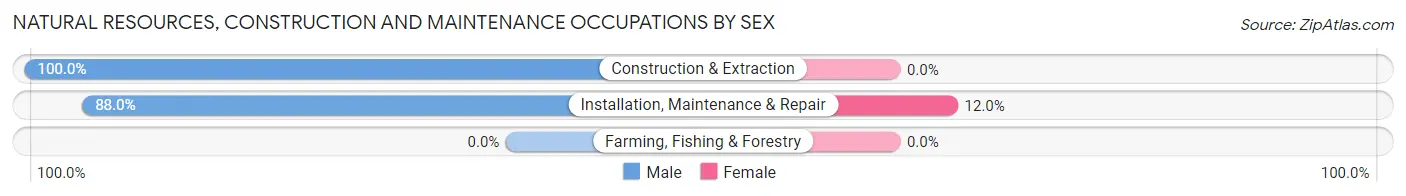
Natural Resources, Construction and Maintenance Occupations by Sex
| Occupation | Male | Female |
| Farming, Fishing & Forestry | 0 (0.0%) | 0 (0.0%) |
| Construction & Extraction | 10 (100.0%) | 0 (0.0%) |
| Installation, Maintenance & Repair | 22 (88.0%) | 3 (12.0%) |
| Total (Category) | 32 (91.4%) | 3 (8.6%) |
| Total (Overall) | 189 (62.0%) | 116 (38.0%) |
Production, Transportation and Moving Occupations
The most common Production, Transportation and Moving occupations in Melbourne Village are Transportation (17 | 5.6%), Material Moving (4 | 1.3%), and Production (2 | 0.7%).
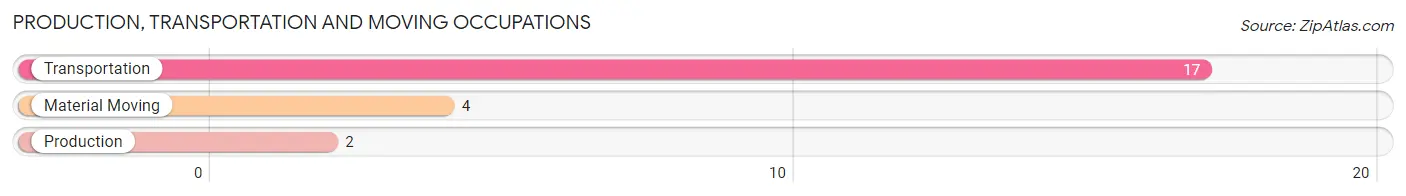
Production, Transportation and Moving Occupations by Sex
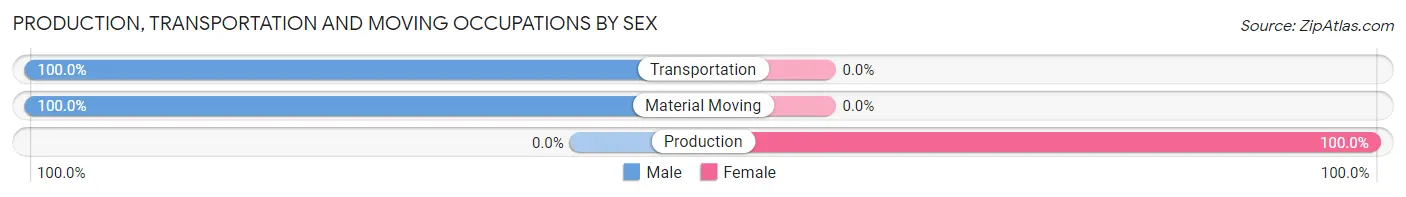
| Occupation | Male | Female |
| Production | 0 (0.0%) | 2 (100.0%) |
| Transportation | 17 (100.0%) | 0 (0.0%) |
| Material Moving | 4 (100.0%) | 0 (0.0%) |
| Total (Category) | 21 (91.3%) | 2 (8.7%) |
| Total (Overall) | 189 (62.0%) | 116 (38.0%) |
Employment Industries by Sex in Melbourne Village
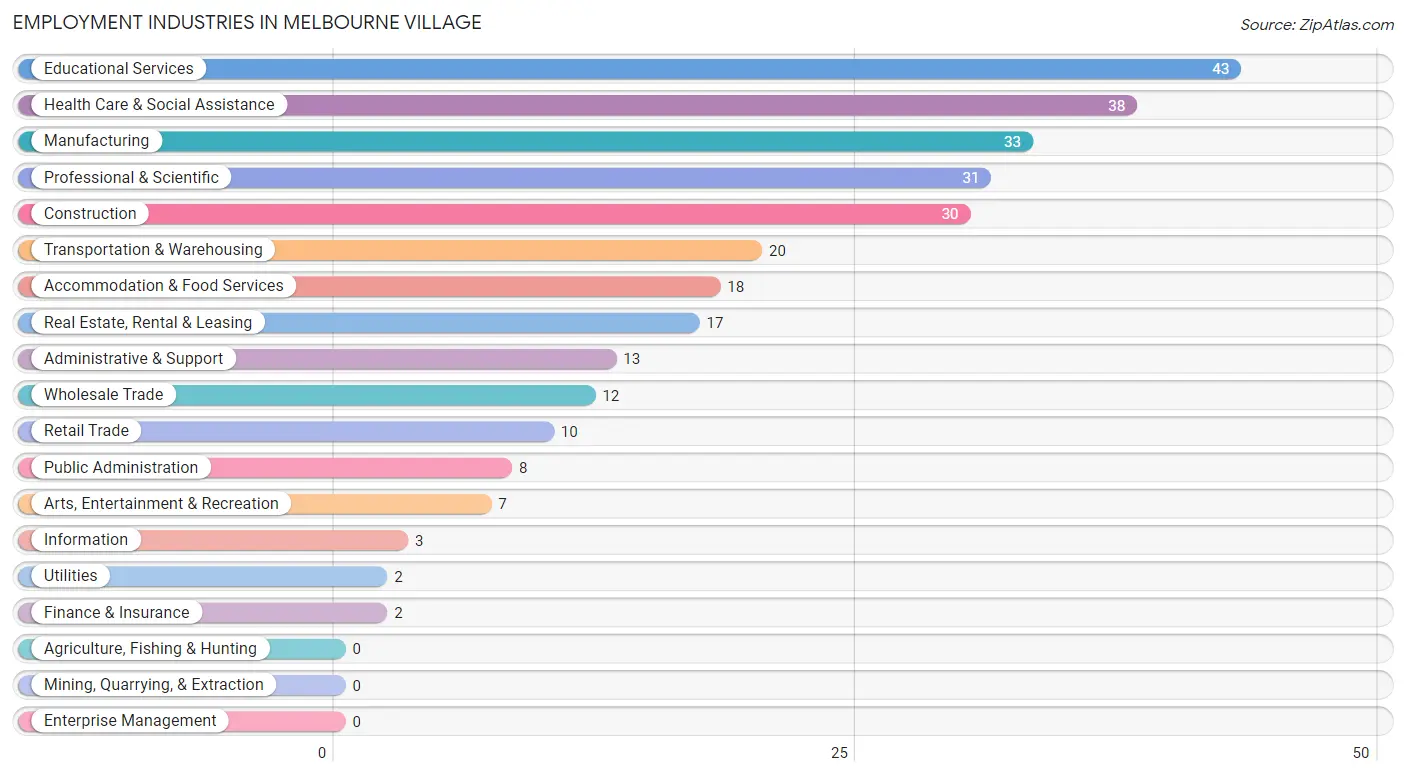
Employment Industries in Melbourne Village
The major employment industries in Melbourne Village include Educational Services (43 | 14.1%), Health Care & Social Assistance (38 | 12.5%), Manufacturing (33 | 10.8%), Professional & Scientific (31 | 10.2%), and Construction (30 | 9.8%).
Employment Industries by Sex in Melbourne Village
The Melbourne Village industries that see more men than women are Utilities (100.0%), Information (100.0%), and Accommodation & Food Services (100.0%), whereas the industries that tend to have a higher number of women are Finance & Insurance (100.0%), Educational Services (67.4%), and Health Care & Social Assistance (65.8%).
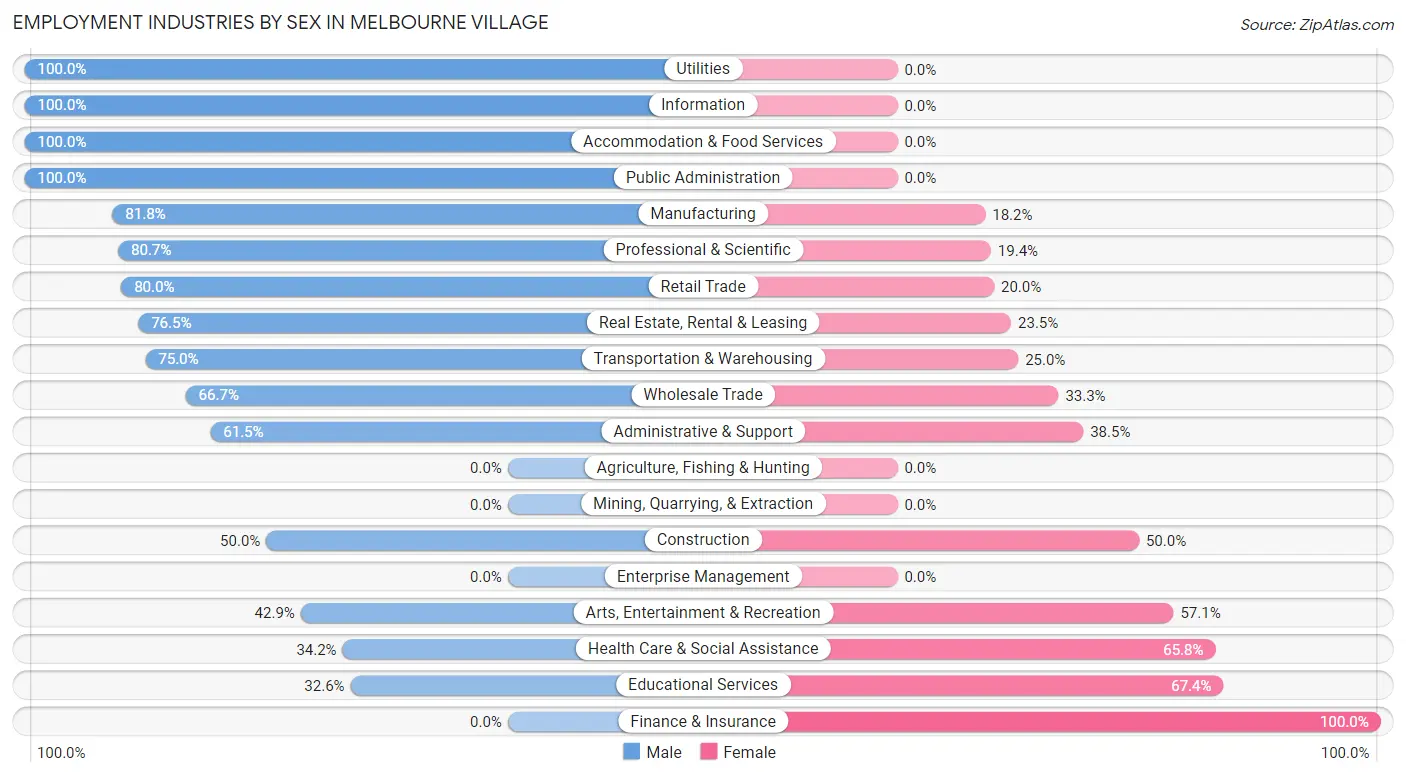
| Industry | Male | Female |
| Agriculture, Fishing & Hunting | 0 (0.0%) | 0 (0.0%) |
| Mining, Quarrying, & Extraction | 0 (0.0%) | 0 (0.0%) |
| Construction | 15 (50.0%) | 15 (50.0%) |
| Manufacturing | 27 (81.8%) | 6 (18.2%) |
| Wholesale Trade | 8 (66.7%) | 4 (33.3%) |
| Retail Trade | 8 (80.0%) | 2 (20.0%) |
| Transportation & Warehousing | 15 (75.0%) | 5 (25.0%) |
| Utilities | 2 (100.0%) | 0 (0.0%) |
| Information | 3 (100.0%) | 0 (0.0%) |
| Finance & Insurance | 0 (0.0%) | 2 (100.0%) |
| Real Estate, Rental & Leasing | 13 (76.5%) | 4 (23.5%) |
| Professional & Scientific | 25 (80.6%) | 6 (19.4%) |
| Enterprise Management | 0 (0.0%) | 0 (0.0%) |
| Administrative & Support | 8 (61.5%) | 5 (38.5%) |
| Educational Services | 14 (32.6%) | 29 (67.4%) |
| Health Care & Social Assistance | 13 (34.2%) | 25 (65.8%) |
| Arts, Entertainment & Recreation | 3 (42.9%) | 4 (57.1%) |
| Accommodation & Food Services | 18 (100.0%) | 0 (0.0%) |
| Public Administration | 8 (100.0%) | 0 (0.0%) |
| Total | 189 (62.0%) | 116 (38.0%) |
Education in Melbourne Village
School Enrollment in Melbourne Village
The most common levels of schooling among the 131 students in Melbourne Village are high school (50 | 38.2%), college / undergraduate (33 | 25.2%), and middle school (19 | 14.5%).
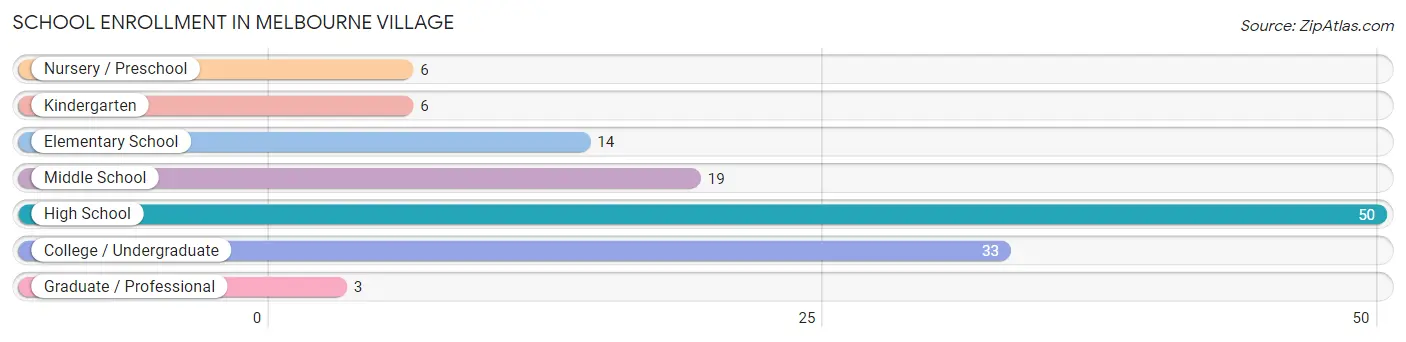
| School Level | # Students | % Students |
| Nursery / Preschool | 6 | 4.6% |
| Kindergarten | 6 | 4.6% |
| Elementary School | 14 | 10.7% |
| Middle School | 19 | 14.5% |
| High School | 50 | 38.2% |
| College / Undergraduate | 33 | 25.2% |
| Graduate / Professional | 3 | 2.3% |
| Total | 131 | 100.0% |
School Enrollment by Age by Funding Source in Melbourne Village
Out of a total of 131 students who are enrolled in schools in Melbourne Village, 54 (41.2%) attend a private institution, while the remaining 77 (58.8%) are enrolled in public schools. The age group of 3 to 4 year olds has the highest likelihood of being enrolled in private schools, with 6 (100.0% in the age bracket) enrolled. Conversely, the age group of 20 to 24 year olds has the lowest likelihood of being enrolled in a private school, with 17 (100.0% in the age bracket) attending a public institution.
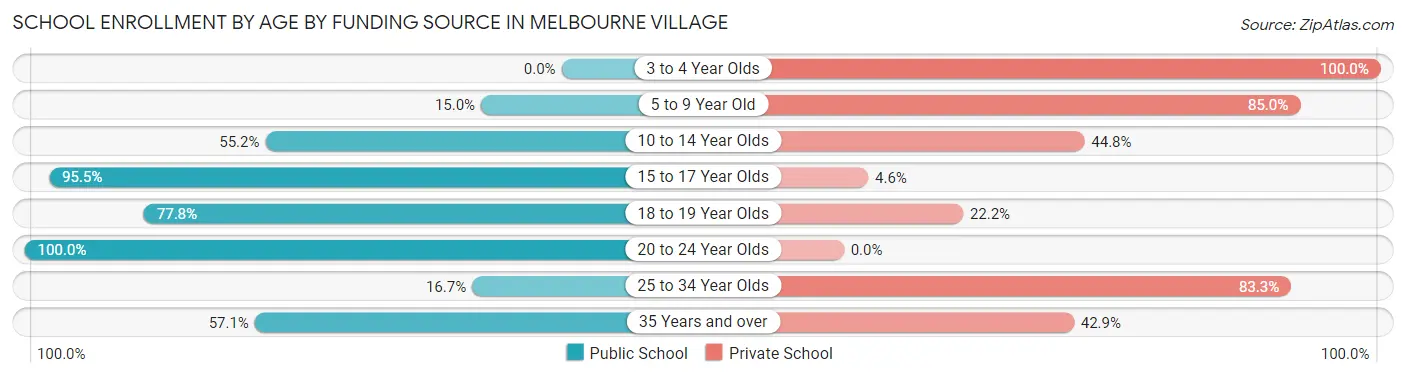
| Age Bracket | Public School | Private School |
| 3 to 4 Year Olds | 0 (0.0%) | 6 (100.0%) |
| 5 to 9 Year Old | 3 (15.0%) | 17 (85.0%) |
| 10 to 14 Year Olds | 16 (55.2%) | 13 (44.8%) |
| 15 to 17 Year Olds | 21 (95.5%) | 1 (4.5%) |
| 18 to 19 Year Olds | 14 (77.8%) | 4 (22.2%) |
| 20 to 24 Year Olds | 17 (100.0%) | 0 (0.0%) |
| 25 to 34 Year Olds | 2 (16.7%) | 10 (83.3%) |
| 35 Years and over | 4 (57.1%) | 3 (42.9%) |
| Total | 77 (58.8%) | 54 (41.2%) |
Educational Attainment by Field of Study in Melbourne Village
Engineering (60 | 16.3%), education (54 | 14.7%), business (53 | 14.4%), science & technology (28 | 7.6%), and visual & performing arts (27 | 7.3%) are the most common fields of study among 368 individuals in Melbourne Village who have obtained a bachelor's degree or higher.
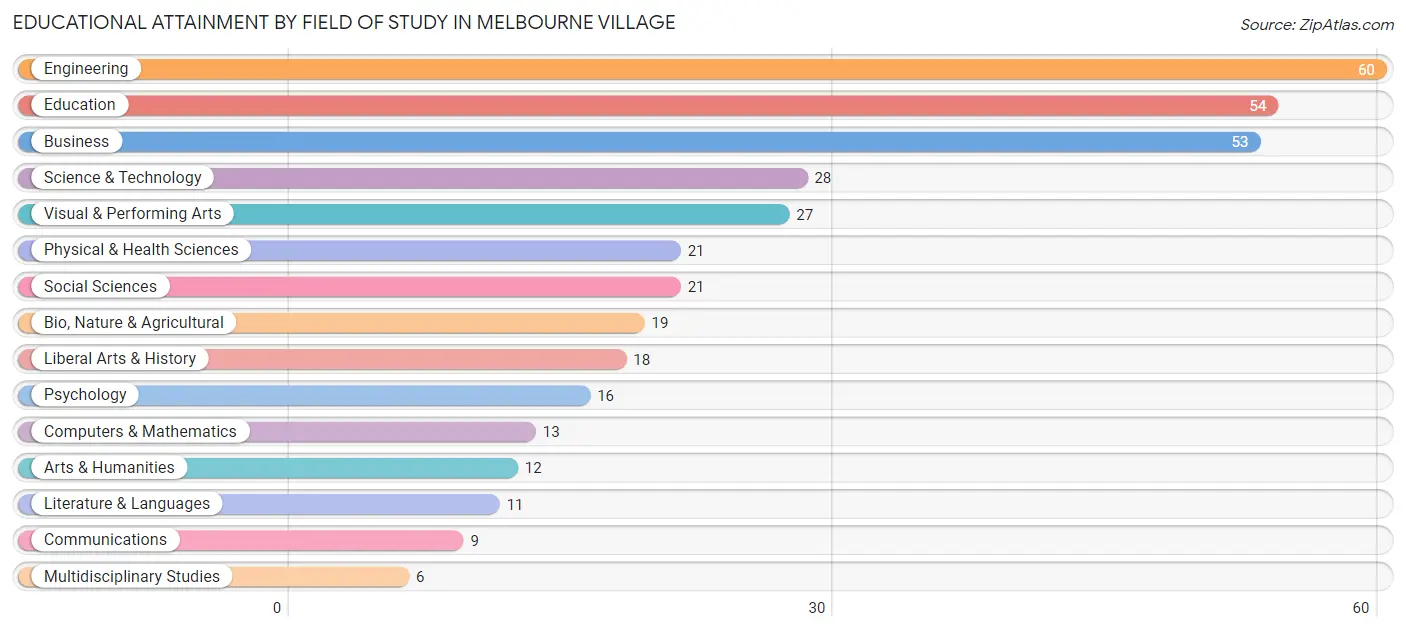
| Field of Study | # Graduates | % Graduates |
| Computers & Mathematics | 13 | 3.5% |
| Bio, Nature & Agricultural | 19 | 5.2% |
| Physical & Health Sciences | 21 | 5.7% |
| Psychology | 16 | 4.3% |
| Social Sciences | 21 | 5.7% |
| Engineering | 60 | 16.3% |
| Multidisciplinary Studies | 6 | 1.6% |
| Science & Technology | 28 | 7.6% |
| Business | 53 | 14.4% |
| Education | 54 | 14.7% |
| Literature & Languages | 11 | 3.0% |
| Liberal Arts & History | 18 | 4.9% |
| Visual & Performing Arts | 27 | 7.3% |
| Communications | 9 | 2.5% |
| Arts & Humanities | 12 | 3.3% |
| Total | 368 | 100.0% |
Transportation & Commute in Melbourne Village
Vehicle Availability by Sex in Melbourne Village
The most prevalent vehicle ownership categories in Melbourne Village are males with 2 vehicles (83, accounting for 49.4%) and females with 2 vehicles (47, making up 72.2%).
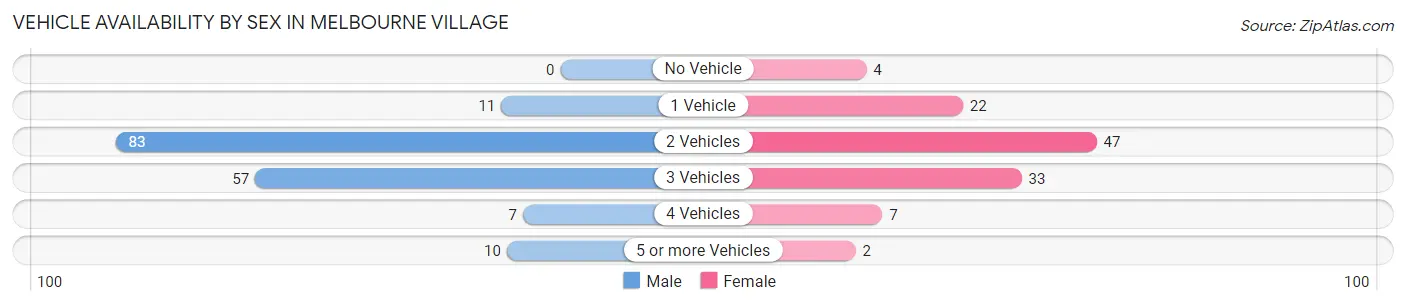
| Vehicles Available | Male | Female |
| No Vehicle | 0 (0.0%) | 4 (3.5%) |
| 1 Vehicle | 11 (6.6%) | 22 (19.1%) |
| 2 Vehicles | 83 (49.4%) | 47 (40.9%) |
| 3 Vehicles | 57 (33.9%) | 33 (28.7%) |
| 4 Vehicles | 7 (4.2%) | 7 (6.1%) |
| 5 or more Vehicles | 10 (5.9%) | 2 (1.7%) |
| Total | 168 (100.0%) | 115 (100.0%) |
Commute Time in Melbourne Village
The most frequently occuring commute durations in Melbourne Village are 10 to 14 minutes (51 commuters, 20.2%), 15 to 19 minutes (47 commuters, 18.6%), and 30 to 34 minutes (37 commuters, 14.7%).
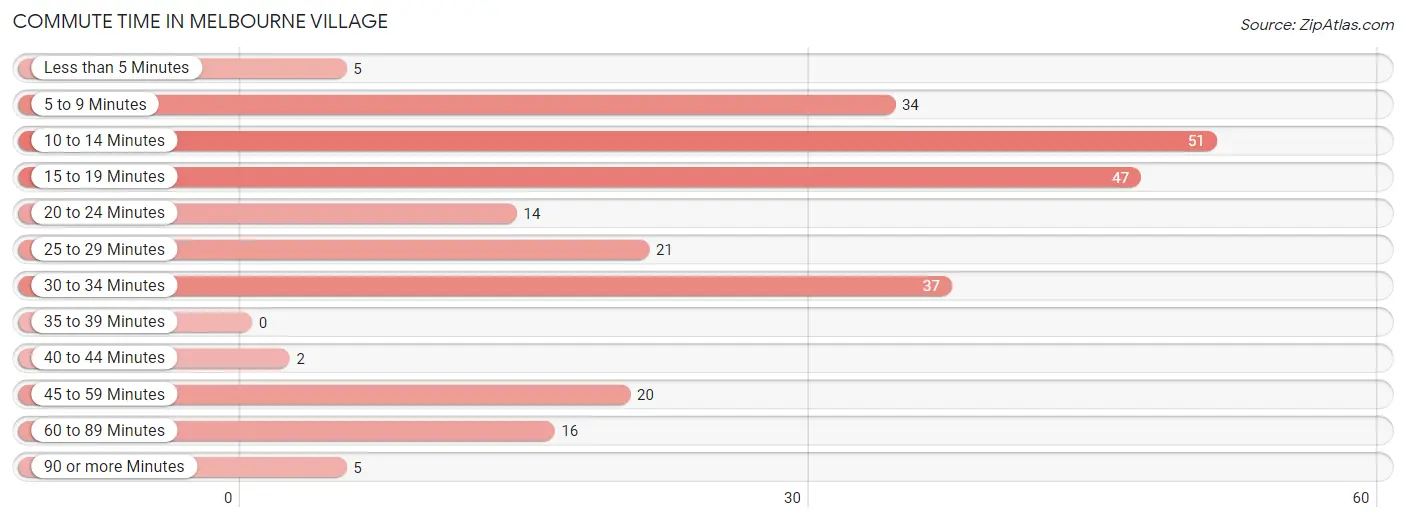
| Commute Time | # Commuters | % Commuters |
| Less than 5 Minutes | 5 | 2.0% |
| 5 to 9 Minutes | 34 | 13.5% |
| 10 to 14 Minutes | 51 | 20.2% |
| 15 to 19 Minutes | 47 | 18.6% |
| 20 to 24 Minutes | 14 | 5.6% |
| 25 to 29 Minutes | 21 | 8.3% |
| 30 to 34 Minutes | 37 | 14.7% |
| 35 to 39 Minutes | 0 | 0.0% |
| 40 to 44 Minutes | 2 | 0.8% |
| 45 to 59 Minutes | 20 | 7.9% |
| 60 to 89 Minutes | 16 | 6.4% |
| 90 or more Minutes | 5 | 2.0% |
Commute Time by Sex in Melbourne Village
The most common commute times in Melbourne Village are 10 to 14 minutes (37 commuters, 26.1%) for males and 15 to 19 minutes (22 commuters, 20.0%) for females.
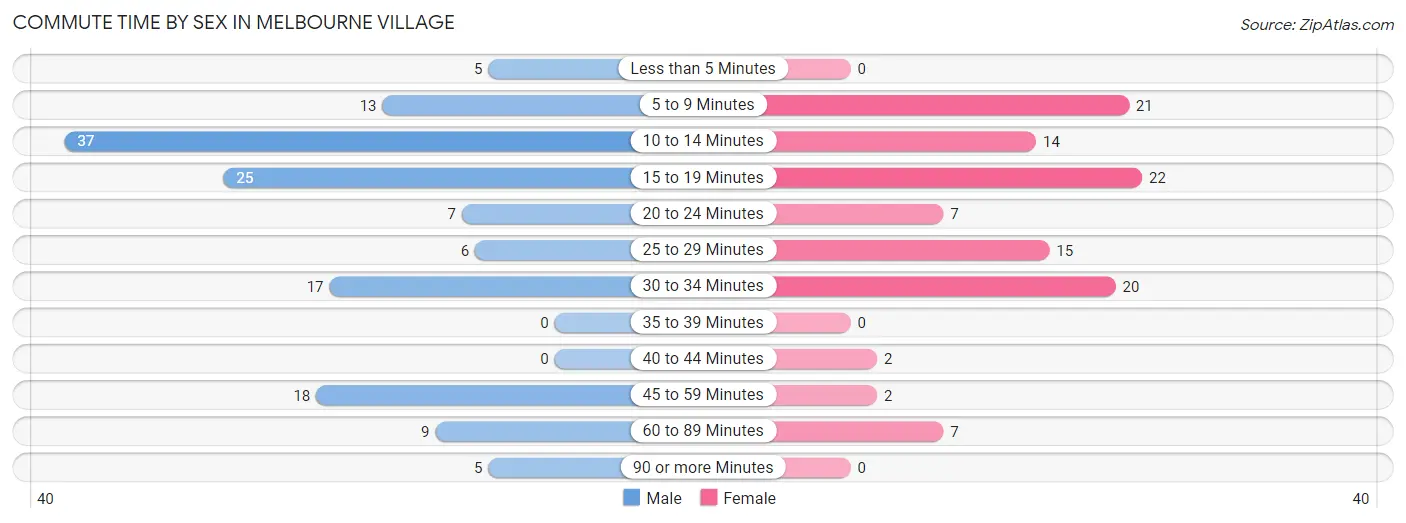
| Commute Time | Male | Female |
| Less than 5 Minutes | 5 (3.5%) | 0 (0.0%) |
| 5 to 9 Minutes | 13 (9.1%) | 21 (19.1%) |
| 10 to 14 Minutes | 37 (26.1%) | 14 (12.7%) |
| 15 to 19 Minutes | 25 (17.6%) | 22 (20.0%) |
| 20 to 24 Minutes | 7 (4.9%) | 7 (6.4%) |
| 25 to 29 Minutes | 6 (4.2%) | 15 (13.6%) |
| 30 to 34 Minutes | 17 (12.0%) | 20 (18.2%) |
| 35 to 39 Minutes | 0 (0.0%) | 0 (0.0%) |
| 40 to 44 Minutes | 0 (0.0%) | 2 (1.8%) |
| 45 to 59 Minutes | 18 (12.7%) | 2 (1.8%) |
| 60 to 89 Minutes | 9 (6.3%) | 7 (6.4%) |
| 90 or more Minutes | 5 (3.5%) | 0 (0.0%) |
Time of Departure to Work by Sex in Melbourne Village
The most frequent times of departure to work in Melbourne Village are 12:00 PM to 3:59 PM (34, 23.9%) for males and 7:00 AM to 7:29 AM (20, 18.2%) for females.
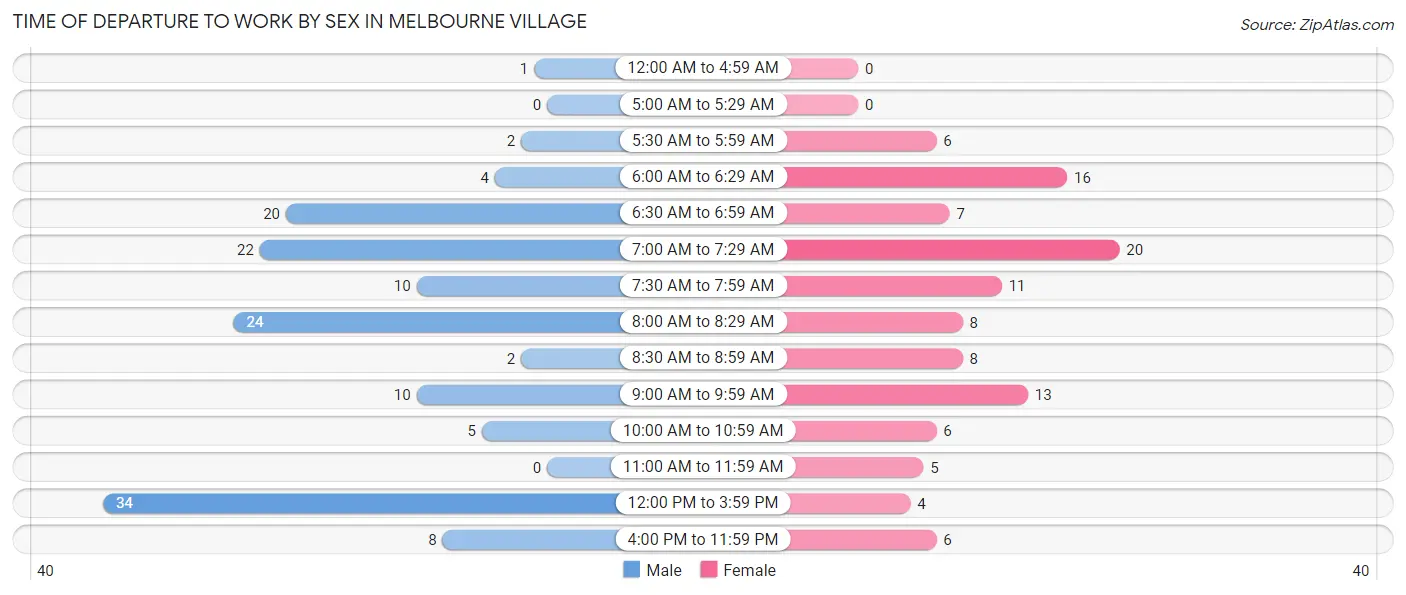
| Time of Departure | Male | Female |
| 12:00 AM to 4:59 AM | 1 (0.7%) | 0 (0.0%) |
| 5:00 AM to 5:29 AM | 0 (0.0%) | 0 (0.0%) |
| 5:30 AM to 5:59 AM | 2 (1.4%) | 6 (5.4%) |
| 6:00 AM to 6:29 AM | 4 (2.8%) | 16 (14.5%) |
| 6:30 AM to 6:59 AM | 20 (14.1%) | 7 (6.4%) |
| 7:00 AM to 7:29 AM | 22 (15.5%) | 20 (18.2%) |
| 7:30 AM to 7:59 AM | 10 (7.0%) | 11 (10.0%) |
| 8:00 AM to 8:29 AM | 24 (16.9%) | 8 (7.3%) |
| 8:30 AM to 8:59 AM | 2 (1.4%) | 8 (7.3%) |
| 9:00 AM to 9:59 AM | 10 (7.0%) | 13 (11.8%) |
| 10:00 AM to 10:59 AM | 5 (3.5%) | 6 (5.4%) |
| 11:00 AM to 11:59 AM | 0 (0.0%) | 5 (4.5%) |
| 12:00 PM to 3:59 PM | 34 (23.9%) | 4 (3.6%) |
| 4:00 PM to 11:59 PM | 8 (5.6%) | 6 (5.4%) |
| Total | 142 (100.0%) | 110 (100.0%) |
Housing Occupancy in Melbourne Village
Occupancy by Ownership in Melbourne Village
Of the total 326 dwellings in Melbourne Village, owner-occupied units account for 303 (92.9%), while renter-occupied units make up 23 (7.1%).
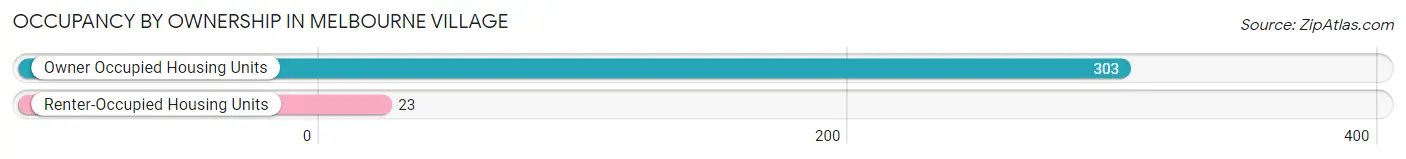
| Occupancy | # Housing Units | % Housing Units |
| Owner Occupied Housing Units | 303 | 92.9% |
| Renter-Occupied Housing Units | 23 | 7.1% |
| Total Occupied Housing Units | 326 | 100.0% |
Occupancy by Household Size in Melbourne Village
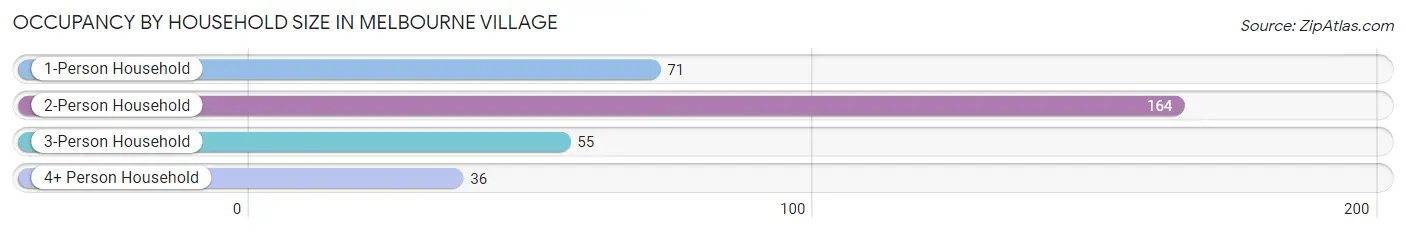
| Household Size | # Housing Units | % Housing Units |
| 1-Person Household | 71 | 21.8% |
| 2-Person Household | 164 | 50.3% |
| 3-Person Household | 55 | 16.9% |
| 4+ Person Household | 36 | 11.0% |
| Total Housing Units | 326 | 100.0% |
Occupancy by Ownership by Household Size in Melbourne Village
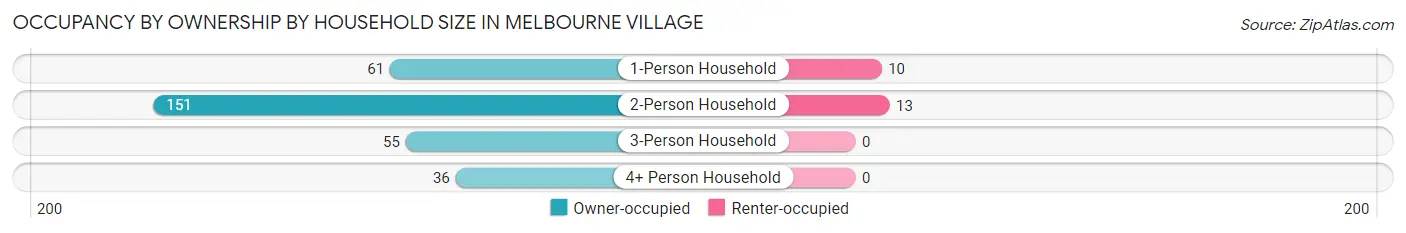
| Household Size | Owner-occupied | Renter-occupied |
| 1-Person Household | 61 (85.9%) | 10 (14.1%) |
| 2-Person Household | 151 (92.1%) | 13 (7.9%) |
| 3-Person Household | 55 (100.0%) | 0 (0.0%) |
| 4+ Person Household | 36 (100.0%) | 0 (0.0%) |
| Total Housing Units | 303 (92.9%) | 23 (7.1%) |
Occupancy by Educational Attainment in Melbourne Village

| Household Size | Owner-occupied | Renter-occupied |
| Less than High School | 8 (100.0%) | 0 (0.0%) |
| High School Diploma | 24 (77.4%) | 7 (22.6%) |
| College/Associate Degree | 55 (96.5%) | 2 (3.5%) |
| Bachelor's Degree or higher | 216 (93.9%) | 14 (6.1%) |
Occupancy by Age of Householder in Melbourne Village
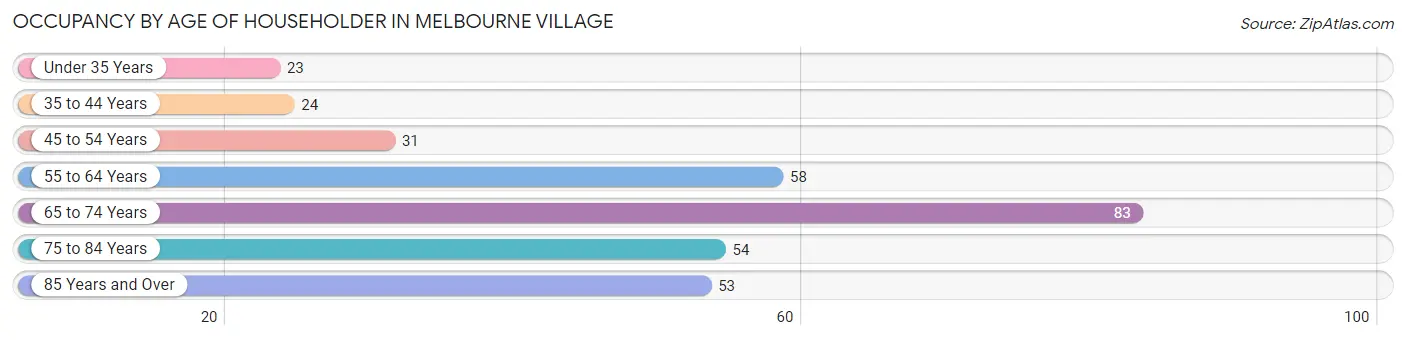
| Age Bracket | # Households | % Households |
| Under 35 Years | 23 | 7.1% |
| 35 to 44 Years | 24 | 7.4% |
| 45 to 54 Years | 31 | 9.5% |
| 55 to 64 Years | 58 | 17.8% |
| 65 to 74 Years | 83 | 25.5% |
| 75 to 84 Years | 54 | 16.6% |
| 85 Years and Over | 53 | 16.3% |
| Total | 326 | 100.0% |
Housing Finances in Melbourne Village
Median Income by Occupancy in Melbourne Village
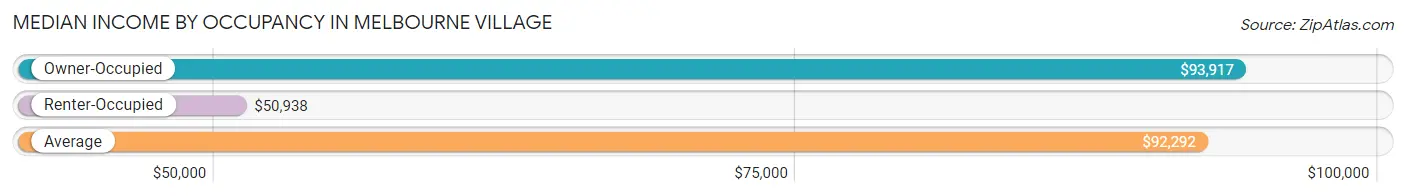
| Occupancy Type | # Households | Median Income |
| Owner-Occupied | 303 (92.9%) | $93,917 |
| Renter-Occupied | 23 (7.1%) | $50,938 |
| Average | 326 (100.0%) | $92,292 |
Occupancy by Householder Income Bracket in Melbourne Village
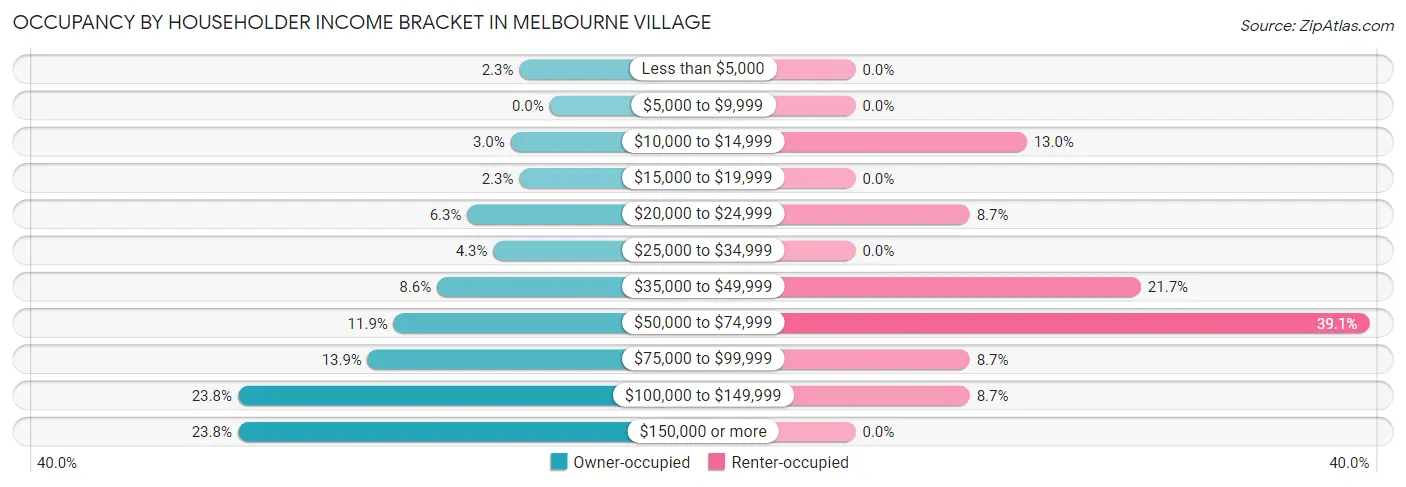
| Income Bracket | Owner-occupied | Renter-occupied |
| Less than $5,000 | 7 (2.3%) | 0 (0.0%) |
| $5,000 to $9,999 | 0 (0.0%) | 0 (0.0%) |
| $10,000 to $14,999 | 9 (3.0%) | 3 (13.0%) |
| $15,000 to $19,999 | 7 (2.3%) | 0 (0.0%) |
| $20,000 to $24,999 | 19 (6.3%) | 2 (8.7%) |
| $25,000 to $34,999 | 13 (4.3%) | 0 (0.0%) |
| $35,000 to $49,999 | 26 (8.6%) | 5 (21.7%) |
| $50,000 to $74,999 | 36 (11.9%) | 9 (39.1%) |
| $75,000 to $99,999 | 42 (13.9%) | 2 (8.7%) |
| $100,000 to $149,999 | 72 (23.8%) | 2 (8.7%) |
| $150,000 or more | 72 (23.8%) | 0 (0.0%) |
| Total | 303 (100.0%) | 23 (100.0%) |
Monthly Housing Cost Tiers in Melbourne Village
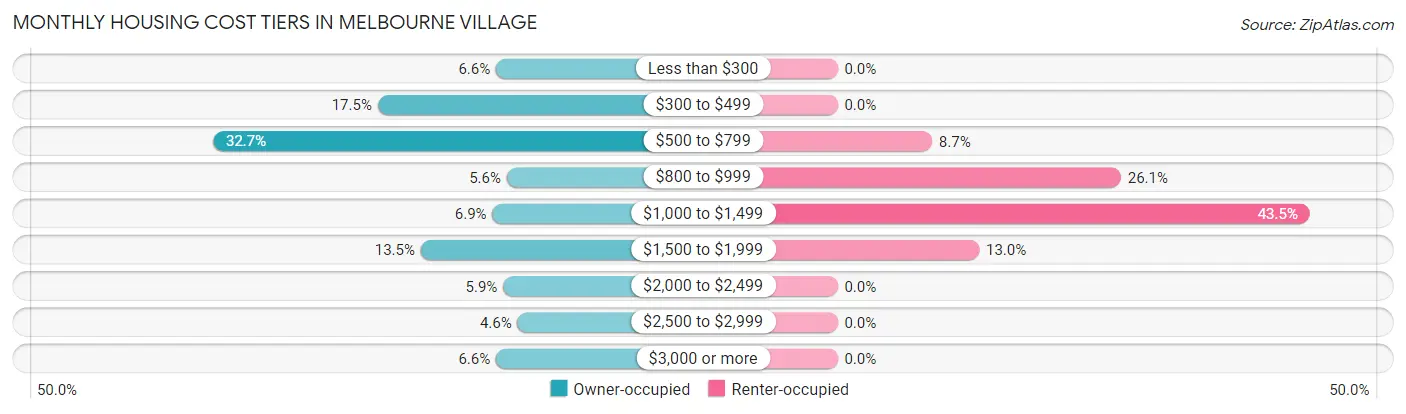
| Monthly Cost | Owner-occupied | Renter-occupied |
| Less than $300 | 20 (6.6%) | 0 (0.0%) |
| $300 to $499 | 53 (17.5%) | 0 (0.0%) |
| $500 to $799 | 99 (32.7%) | 2 (8.7%) |
| $800 to $999 | 17 (5.6%) | 6 (26.1%) |
| $1,000 to $1,499 | 21 (6.9%) | 10 (43.5%) |
| $1,500 to $1,999 | 41 (13.5%) | 3 (13.0%) |
| $2,000 to $2,499 | 18 (5.9%) | 0 (0.0%) |
| $2,500 to $2,999 | 14 (4.6%) | 0 (0.0%) |
| $3,000 or more | 20 (6.6%) | 0 (0.0%) |
| Total | 303 (100.0%) | 23 (100.0%) |
Physical Housing Characteristics in Melbourne Village
Housing Structures in Melbourne Village
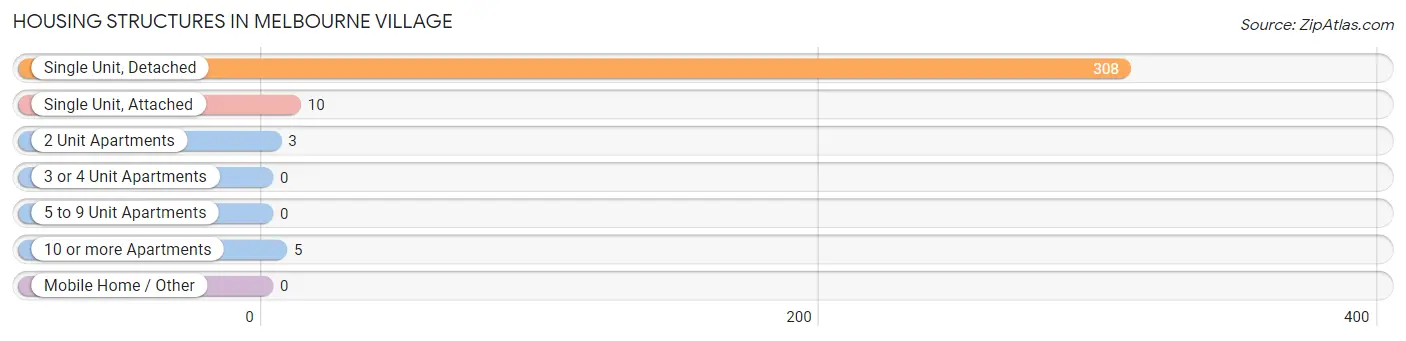
| Structure Type | # Housing Units | % Housing Units |
| Single Unit, Detached | 308 | 94.5% |
| Single Unit, Attached | 10 | 3.1% |
| 2 Unit Apartments | 3 | 0.9% |
| 3 or 4 Unit Apartments | 0 | 0.0% |
| 5 to 9 Unit Apartments | 0 | 0.0% |
| 10 or more Apartments | 5 | 1.5% |
| Mobile Home / Other | 0 | 0.0% |
| Total | 326 | 100.0% |
Housing Structures by Occupancy in Melbourne Village
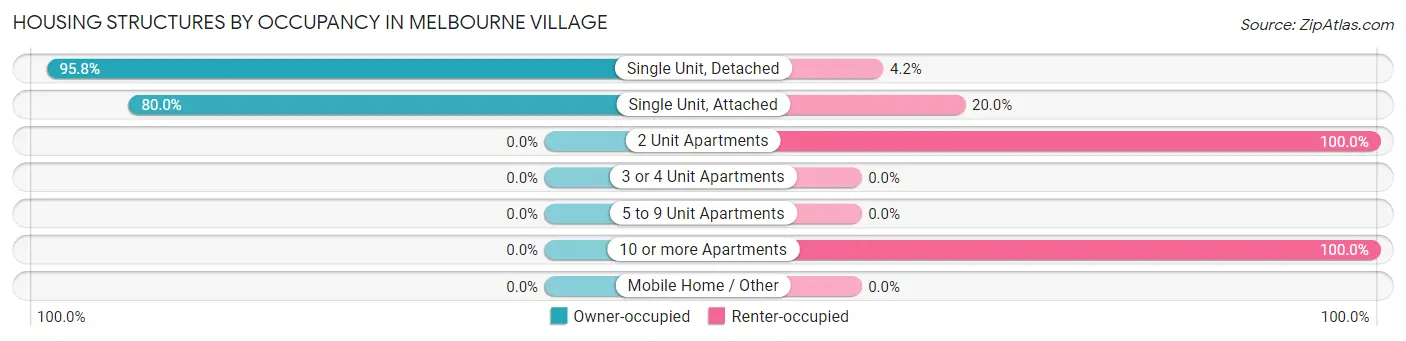
| Structure Type | Owner-occupied | Renter-occupied |
| Single Unit, Detached | 295 (95.8%) | 13 (4.2%) |
| Single Unit, Attached | 8 (80.0%) | 2 (20.0%) |
| 2 Unit Apartments | 0 (0.0%) | 3 (100.0%) |
| 3 or 4 Unit Apartments | 0 (0.0%) | 0 (0.0%) |
| 5 to 9 Unit Apartments | 0 (0.0%) | 0 (0.0%) |
| 10 or more Apartments | 0 (0.0%) | 5 (100.0%) |
| Mobile Home / Other | 0 (0.0%) | 0 (0.0%) |
| Total | 303 (92.9%) | 23 (7.1%) |
Housing Structures by Number of Rooms in Melbourne Village
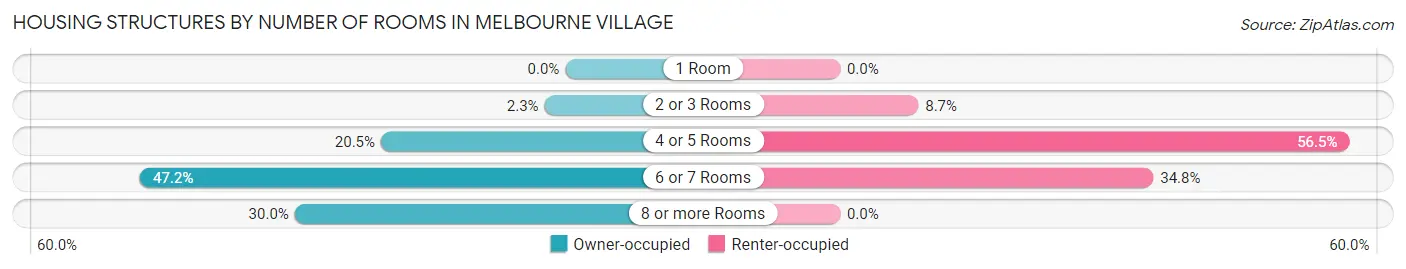
| Number of Rooms | Owner-occupied | Renter-occupied |
| 1 Room | 0 (0.0%) | 0 (0.0%) |
| 2 or 3 Rooms | 7 (2.3%) | 2 (8.7%) |
| 4 or 5 Rooms | 62 (20.5%) | 13 (56.5%) |
| 6 or 7 Rooms | 143 (47.2%) | 8 (34.8%) |
| 8 or more Rooms | 91 (30.0%) | 0 (0.0%) |
| Total | 303 (100.0%) | 23 (100.0%) |
Housing Structure by Heating Type in Melbourne Village
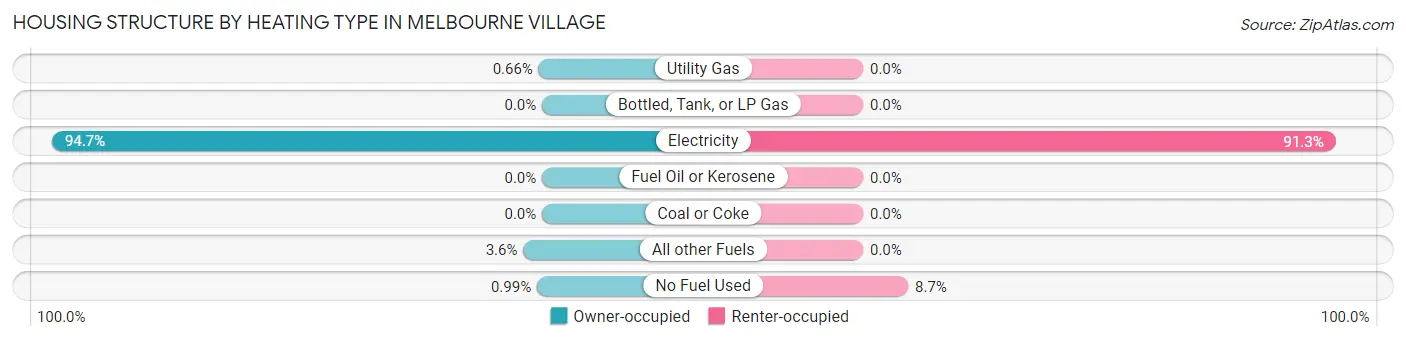
| Heating Type | Owner-occupied | Renter-occupied |
| Utility Gas | 2 (0.7%) | 0 (0.0%) |
| Bottled, Tank, or LP Gas | 0 (0.0%) | 0 (0.0%) |
| Electricity | 287 (94.7%) | 21 (91.3%) |
| Fuel Oil or Kerosene | 0 (0.0%) | 0 (0.0%) |
| Coal or Coke | 0 (0.0%) | 0 (0.0%) |
| All other Fuels | 11 (3.6%) | 0 (0.0%) |
| No Fuel Used | 3 (1.0%) | 2 (8.7%) |
| Total | 303 (100.0%) | 23 (100.0%) |
Household Vehicle Usage in Melbourne Village
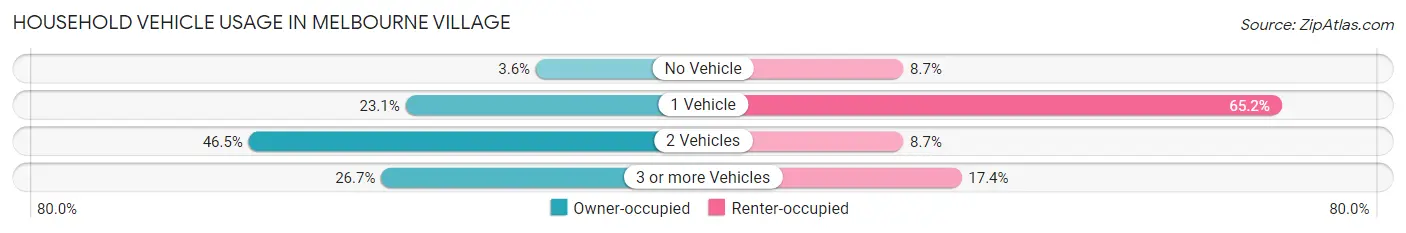
| Vehicles per Household | Owner-occupied | Renter-occupied |
| No Vehicle | 11 (3.6%) | 2 (8.7%) |
| 1 Vehicle | 70 (23.1%) | 15 (65.2%) |
| 2 Vehicles | 141 (46.5%) | 2 (8.7%) |
| 3 or more Vehicles | 81 (26.7%) | 4 (17.4%) |
| Total | 303 (100.0%) | 23 (100.0%) |
Real Estate & Mortgages in Melbourne Village
Real Estate and Mortgage Overview in Melbourne Village
| Characteristic | Without Mortgage | With Mortgage |
| Housing Units | 182 | 121 |
| Median Property Value | $314,500 | $352,300 |
| Median Household Income | $78,500 | $48 |
| Monthly Housing Costs | $545 | $20 |
| Real Estate Taxes | $1,938 | $0 |
Property Value by Mortgage Status in Melbourne Village
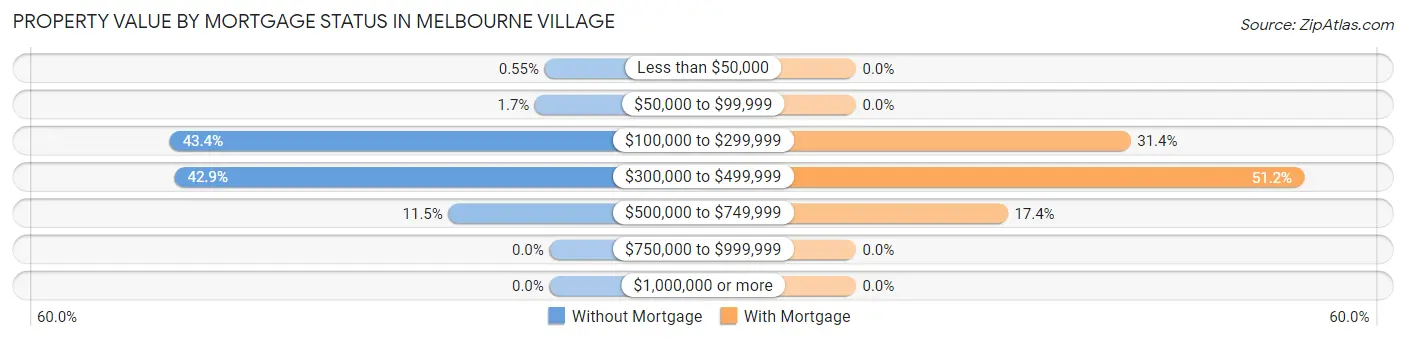
| Property Value | Without Mortgage | With Mortgage |
| Less than $50,000 | 1 (0.5%) | 0 (0.0%) |
| $50,000 to $99,999 | 3 (1.7%) | 0 (0.0%) |
| $100,000 to $299,999 | 79 (43.4%) | 38 (31.4%) |
| $300,000 to $499,999 | 78 (42.9%) | 62 (51.2%) |
| $500,000 to $749,999 | 21 (11.5%) | 21 (17.4%) |
| $750,000 to $999,999 | 0 (0.0%) | 0 (0.0%) |
| $1,000,000 or more | 0 (0.0%) | 0 (0.0%) |
| Total | 182 (100.0%) | 121 (100.0%) |
Household Income by Mortgage Status in Melbourne Village
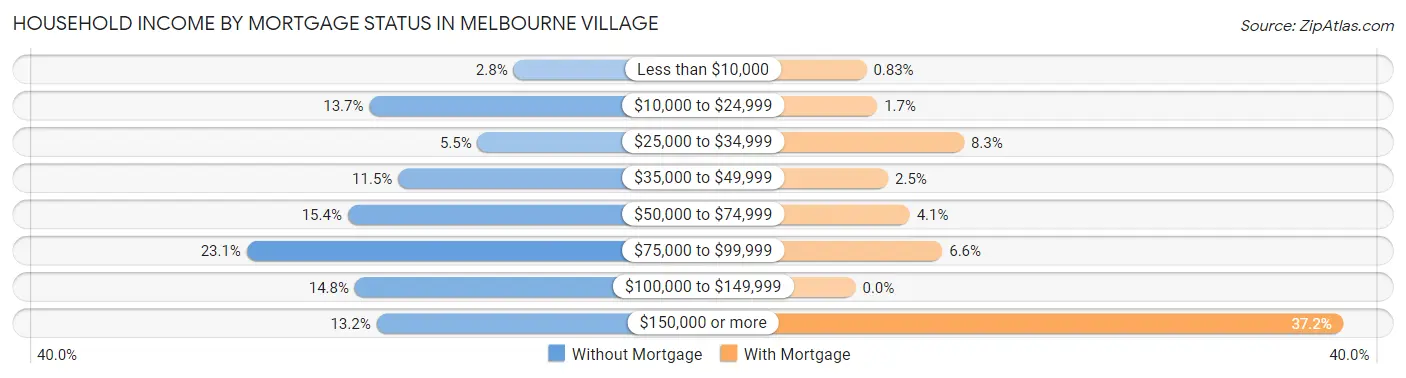
| Household Income | Without Mortgage | With Mortgage |
| Less than $10,000 | 5 (2.8%) | 1 (0.8%) |
| $10,000 to $24,999 | 25 (13.7%) | 2 (1.7%) |
| $25,000 to $34,999 | 10 (5.5%) | 10 (8.3%) |
| $35,000 to $49,999 | 21 (11.5%) | 3 (2.5%) |
| $50,000 to $74,999 | 28 (15.4%) | 5 (4.1%) |
| $75,000 to $99,999 | 42 (23.1%) | 8 (6.6%) |
| $100,000 to $149,999 | 27 (14.8%) | 0 (0.0%) |
| $150,000 or more | 24 (13.2%) | 45 (37.2%) |
| Total | 182 (100.0%) | 121 (100.0%) |
Property Value to Household Income Ratio in Melbourne Village
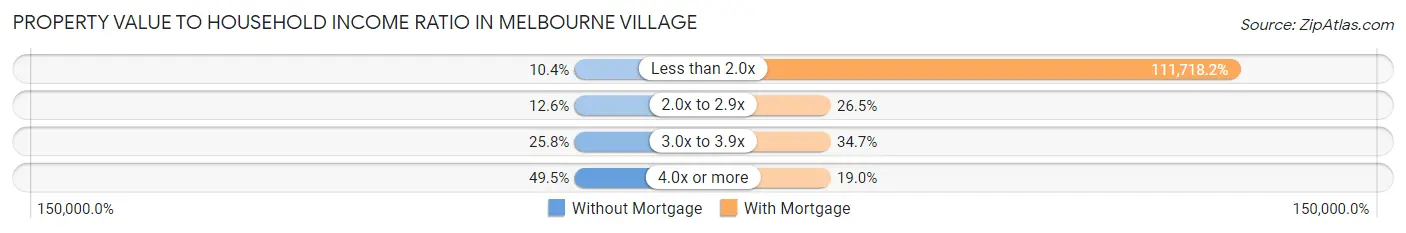
| Value-to-Income Ratio | Without Mortgage | With Mortgage |
| Less than 2.0x | 19 (10.4%) | 135,179 (111,718.2%) |
| 2.0x to 2.9x | 23 (12.6%) | 32 (26.5%) |
| 3.0x to 3.9x | 47 (25.8%) | 42 (34.7%) |
| 4.0x or more | 90 (49.4%) | 23 (19.0%) |
| Total | 182 (100.0%) | 121 (100.0%) |
Real Estate Taxes by Mortgage Status in Melbourne Village
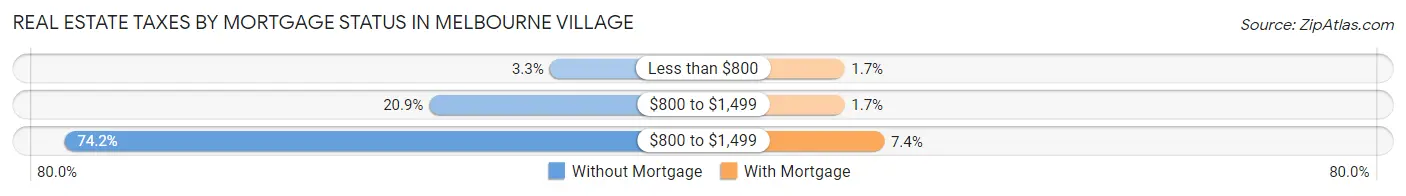
| Property Taxes | Without Mortgage | With Mortgage |
| Less than $800 | 6 (3.3%) | 2 (1.7%) |
| $800 to $1,499 | 38 (20.9%) | 2 (1.7%) |
| $800 to $1,499 | 135 (74.2%) | 9 (7.4%) |
| Total | 182 (100.0%) | 121 (100.0%) |
Health & Disability in Melbourne Village
Health Insurance Coverage by Age in Melbourne Village
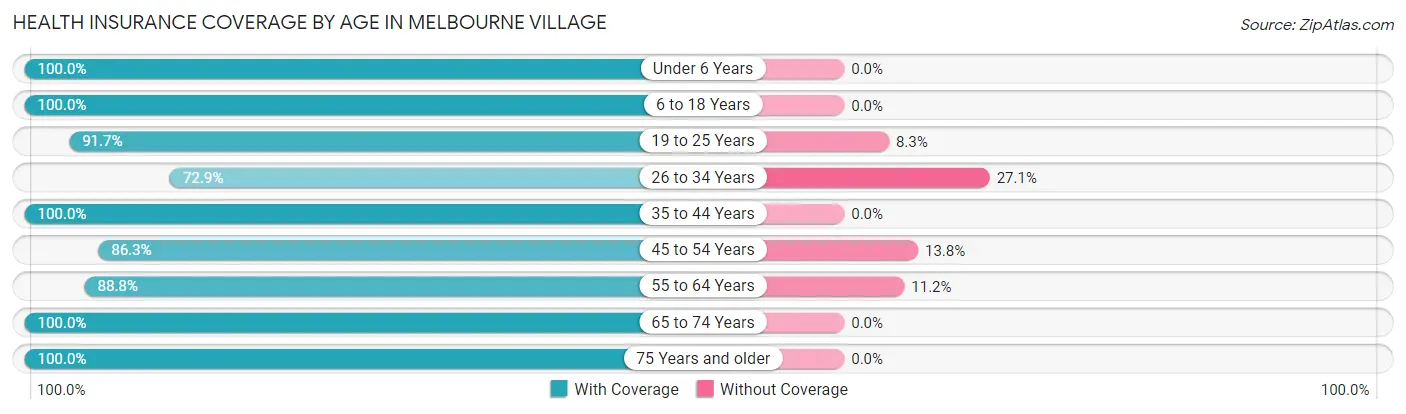
| Age Bracket | With Coverage | Without Coverage |
| Under 6 Years | 24 (100.0%) | 0 (0.0%) |
| 6 to 18 Years | 85 (100.0%) | 0 (0.0%) |
| 19 to 25 Years | 44 (91.7%) | 4 (8.3%) |
| 26 to 34 Years | 43 (72.9%) | 16 (27.1%) |
| 35 to 44 Years | 56 (100.0%) | 0 (0.0%) |
| 45 to 54 Years | 69 (86.3%) | 11 (13.8%) |
| 55 to 64 Years | 111 (88.8%) | 14 (11.2%) |
| 65 to 74 Years | 157 (100.0%) | 0 (0.0%) |
| 75 Years and older | 151 (100.0%) | 0 (0.0%) |
| Total | 740 (94.3%) | 45 (5.7%) |
Health Insurance Coverage by Citizenship Status in Melbourne Village
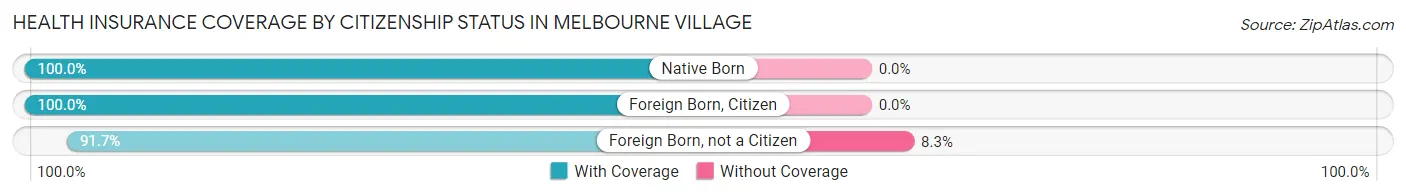
| Citizenship Status | With Coverage | Without Coverage |
| Native Born | 24 (100.0%) | 0 (0.0%) |
| Foreign Born, Citizen | 85 (100.0%) | 0 (0.0%) |
| Foreign Born, not a Citizen | 44 (91.7%) | 4 (8.3%) |
Health Insurance Coverage by Household Income in Melbourne Village
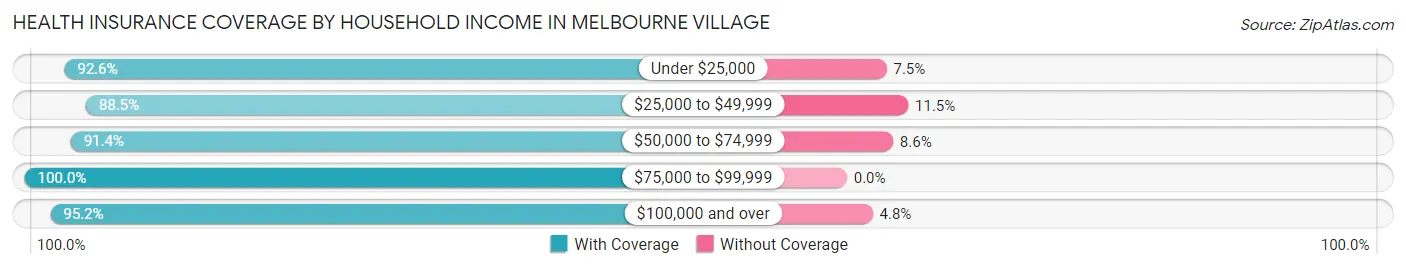
| Household Income | With Coverage | Without Coverage |
| Under $25,000 | 87 (92.5%) | 7 (7.4%) |
| $25,000 to $49,999 | 77 (88.5%) | 10 (11.5%) |
| $50,000 to $74,999 | 74 (91.4%) | 7 (8.6%) |
| $75,000 to $99,999 | 88 (100.0%) | 0 (0.0%) |
| $100,000 and over | 414 (95.2%) | 21 (4.8%) |
Public vs Private Health Insurance Coverage by Age in Melbourne Village
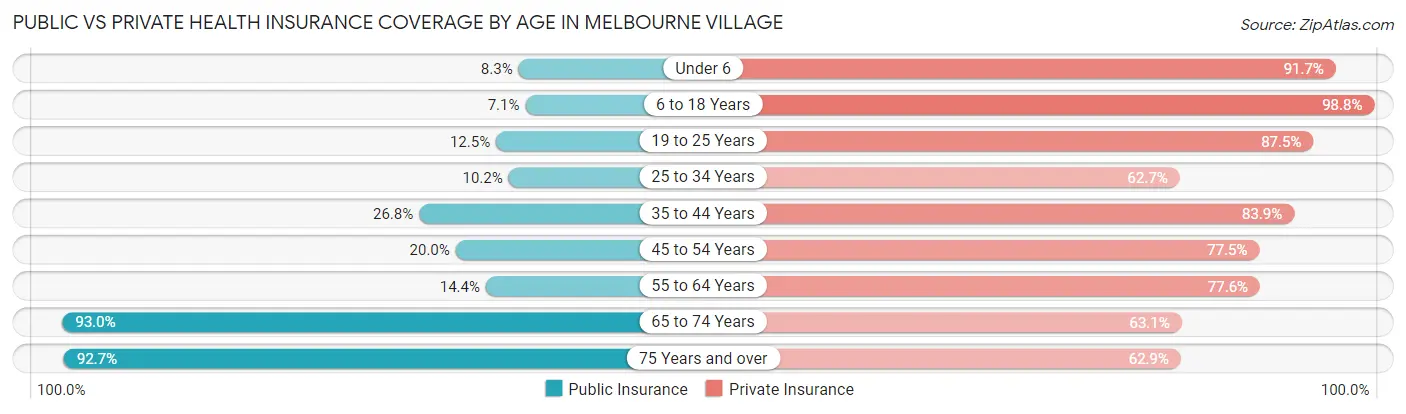
| Age Bracket | Public Insurance | Private Insurance |
| Under 6 | 2 (8.3%) | 22 (91.7%) |
| 6 to 18 Years | 6 (7.1%) | 84 (98.8%) |
| 19 to 25 Years | 6 (12.5%) | 42 (87.5%) |
| 25 to 34 Years | 6 (10.2%) | 37 (62.7%) |
| 35 to 44 Years | 15 (26.8%) | 47 (83.9%) |
| 45 to 54 Years | 16 (20.0%) | 62 (77.5%) |
| 55 to 64 Years | 18 (14.4%) | 97 (77.6%) |
| 65 to 74 Years | 146 (93.0%) | 99 (63.1%) |
| 75 Years and over | 140 (92.7%) | 95 (62.9%) |
| Total | 355 (45.2%) | 585 (74.5%) |
Disability Status by Sex by Age in Melbourne Village
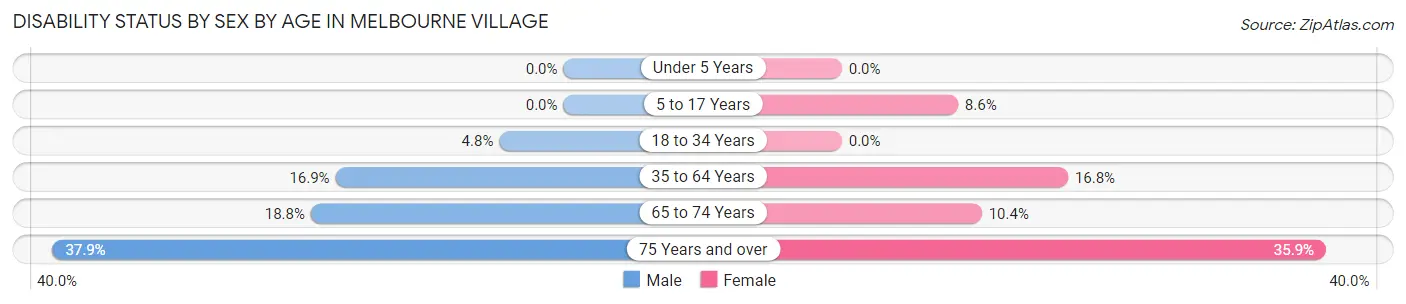
| Age Bracket | Male | Female |
| Under 5 Years | 0 (0.0%) | 0 (0.0%) |
| 5 to 17 Years | 0 (0.0%) | 5 (8.6%) |
| 18 to 34 Years | 3 (4.8%) | 0 (0.0%) |
| 35 to 64 Years | 22 (16.9%) | 22 (16.8%) |
| 65 to 74 Years | 15 (18.8%) | 8 (10.4%) |
| 75 Years and over | 33 (37.9%) | 23 (35.9%) |
Disability Class by Sex by Age in Melbourne Village
Disability Class: Hearing Difficulty
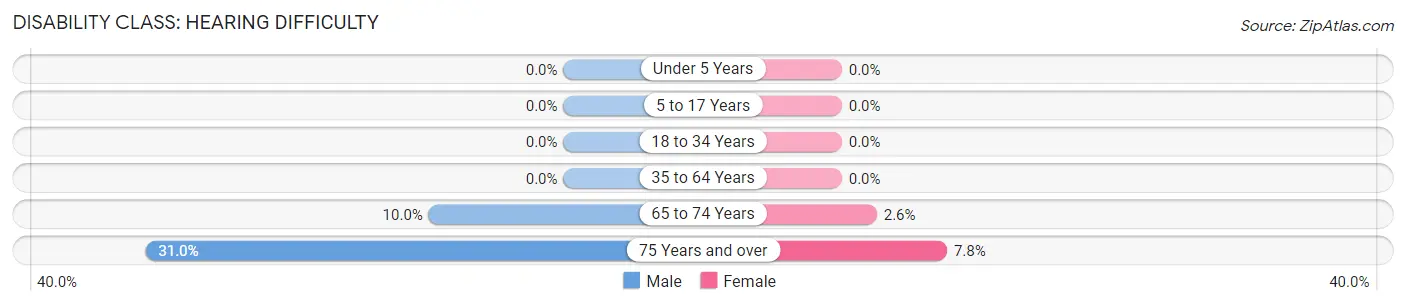
| Age Bracket | Male | Female |
| Under 5 Years | 0 (0.0%) | 0 (0.0%) |
| 5 to 17 Years | 0 (0.0%) | 0 (0.0%) |
| 18 to 34 Years | 0 (0.0%) | 0 (0.0%) |
| 35 to 64 Years | 0 (0.0%) | 0 (0.0%) |
| 65 to 74 Years | 8 (10.0%) | 2 (2.6%) |
| 75 Years and over | 27 (31.0%) | 5 (7.8%) |
Disability Class: Vision Difficulty
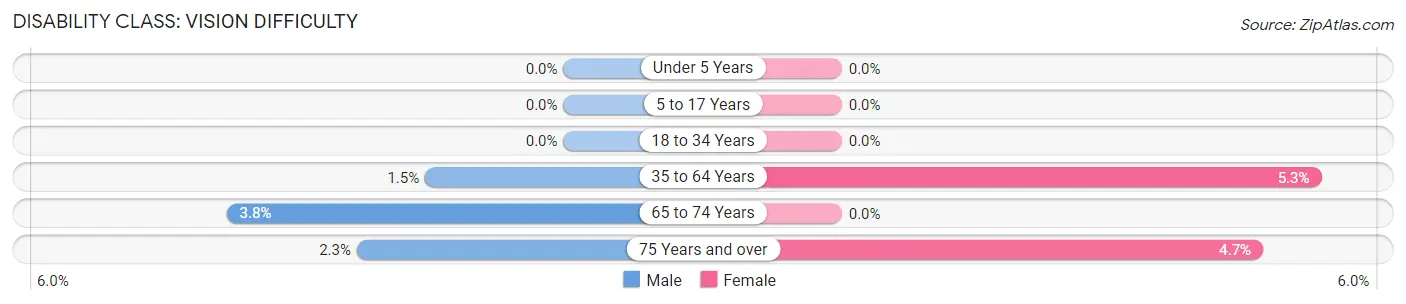
| Age Bracket | Male | Female |
| Under 5 Years | 0 (0.0%) | 0 (0.0%) |
| 5 to 17 Years | 0 (0.0%) | 0 (0.0%) |
| 18 to 34 Years | 0 (0.0%) | 0 (0.0%) |
| 35 to 64 Years | 2 (1.5%) | 7 (5.3%) |
| 65 to 74 Years | 3 (3.7%) | 0 (0.0%) |
| 75 Years and over | 2 (2.3%) | 3 (4.7%) |
Disability Class: Cognitive Difficulty
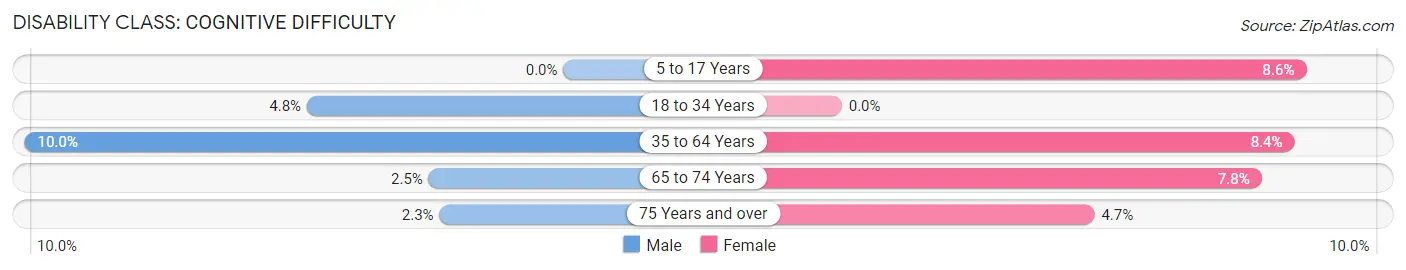
| Age Bracket | Male | Female |
| 5 to 17 Years | 0 (0.0%) | 5 (8.6%) |
| 18 to 34 Years | 3 (4.8%) | 0 (0.0%) |
| 35 to 64 Years | 13 (10.0%) | 11 (8.4%) |
| 65 to 74 Years | 2 (2.5%) | 6 (7.8%) |
| 75 Years and over | 2 (2.3%) | 3 (4.7%) |
Disability Class: Ambulatory Difficulty
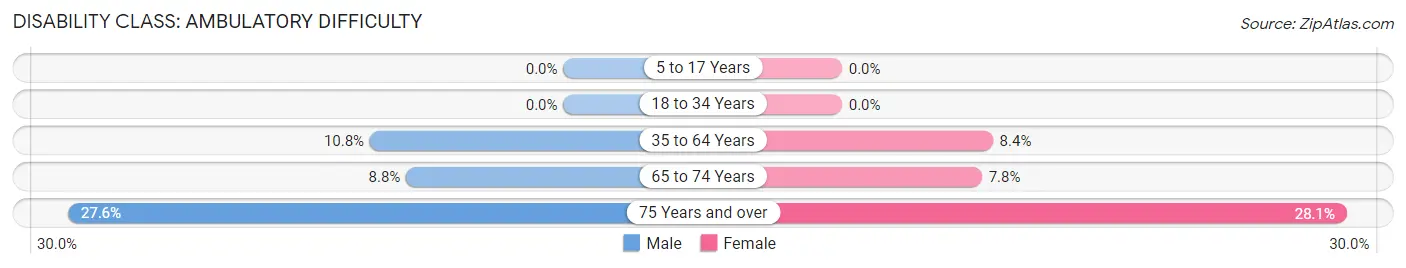
| Age Bracket | Male | Female |
| 5 to 17 Years | 0 (0.0%) | 0 (0.0%) |
| 18 to 34 Years | 0 (0.0%) | 0 (0.0%) |
| 35 to 64 Years | 14 (10.8%) | 11 (8.4%) |
| 65 to 74 Years | 7 (8.7%) | 6 (7.8%) |
| 75 Years and over | 24 (27.6%) | 18 (28.1%) |
Disability Class: Self-Care Difficulty
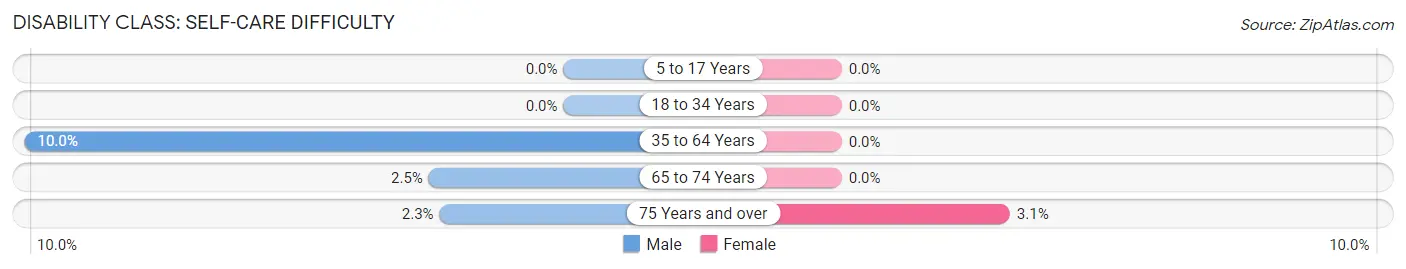
| Age Bracket | Male | Female |
| 5 to 17 Years | 0 (0.0%) | 0 (0.0%) |
| 18 to 34 Years | 0 (0.0%) | 0 (0.0%) |
| 35 to 64 Years | 13 (10.0%) | 0 (0.0%) |
| 65 to 74 Years | 2 (2.5%) | 0 (0.0%) |
| 75 Years and over | 2 (2.3%) | 2 (3.1%) |
Technology Access in Melbourne Village
Computing Device Access in Melbourne Village
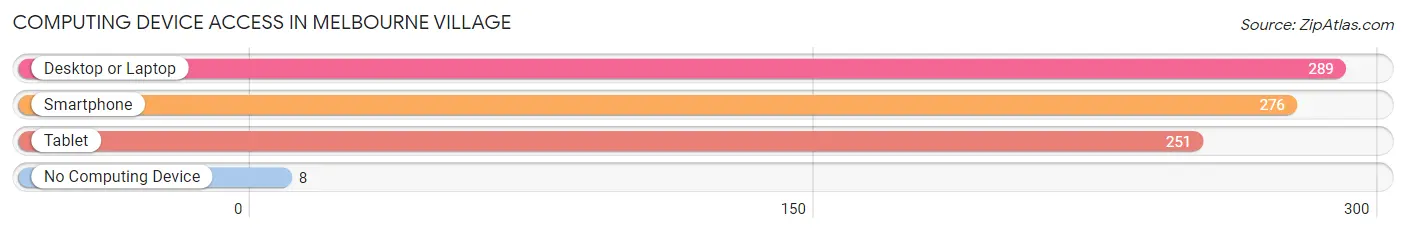
| Device Type | # Households | % Households |
| Desktop or Laptop | 289 | 88.6% |
| Smartphone | 276 | 84.7% |
| Tablet | 251 | 77.0% |
| No Computing Device | 8 | 2.5% |
| Total | 326 | 100.0% |
Internet Access in Melbourne Village
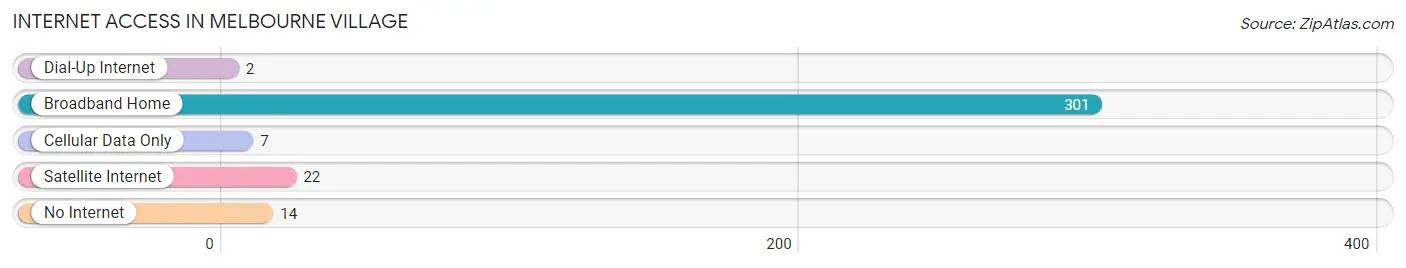
| Internet Type | # Households | % Households |
| Dial-Up Internet | 2 | 0.6% |
| Broadband Home | 301 | 92.3% |
| Cellular Data Only | 7 | 2.1% |
| Satellite Internet | 22 | 6.8% |
| No Internet | 14 | 4.3% |
| Total | 326 | 100.0% |
Melbourne Village Summary
Melbourne Village is a small village located in Brevard County, Florida, United States. It is situated on the east coast of the state, approximately 15 miles south of the city of Melbourne and 50 miles east of Orlando. The village has a population of approximately 1,500 people and covers an area of 1.2 square miles.
History
The area that is now Melbourne Village was originally inhabited by the Ais Indians, who were part of the Seminole tribe. The first European settlers arrived in the area in the late 19th century, and the village was officially incorporated in 1959. The village was named after Melbourne, Australia, which was the hometown of one of the original settlers.
Geography
Melbourne Village is located in Brevard County, Florida, on the east coast of the state. It is situated approximately 15 miles south of the city of Melbourne and 50 miles east of Orlando. The village covers an area of 1.2 square miles and is bordered by the Indian River to the east and the St. Johns River to the west. The terrain is mostly flat, with some low hills in the northern part of the village.
Climate
Melbourne Village has a humid subtropical climate, with hot, humid summers and mild winters. The average temperature in the summer months is around 90°F, while in the winter months it is around 70°F. The village receives an average of 52 inches of rain per year, with most of it falling in the summer months.
Economy
The economy of Melbourne Village is largely based on tourism and services. The village is home to several hotels and resorts, as well as a number of restaurants and shops. The village also has a number of small businesses, including a few manufacturing companies.
Demographics
As of the 2010 census, the population of Melbourne Village was 1,521. The racial makeup of the village was 94.3% White, 2.2% African American, 0.7% Native American, 0.7% Asian, 0.2% Pacific Islander, and 1.9% from other races. The median household income was $45,000, and the median family income was $50,000.
Conclusion
Melbourne Village is a small village located in Brevard County, Florida, United States. It has a population of approximately 1,500 people and covers an area of 1.2 square miles. The village has a humid subtropical climate, with hot, humid summers and mild winters. The economy of Melbourne Village is largely based on tourism and services, and the village is home to several hotels and resorts, as well as a number of restaurants and shops. The racial makeup of the village is 94.3% White, 2.2% African American, 0.7% Native American, 0.7% Asian, 0.2% Pacific Islander, and 1.9% from other races. The median household income was $45,000, and the median family income was $50,000.
Common Questions
What is Per Capita Income in Melbourne Village?
Per Capita income in Melbourne Village is $44,782.
What is the Median Family Income in Melbourne Village?
Median Family Income in Melbourne Village is $103,333.
What is the Median Household income in Melbourne Village?
Median Household Income in Melbourne Village is $92,292.
What is Inequality or Gini Index in Melbourne Village?
Inequality or Gini Index in Melbourne Village is 0.41.
What is the Total Population of Melbourne Village?
Total Population of Melbourne Village is 785.
What is the Total Male Population of Melbourne Village?
Total Male Population of Melbourne Village is 379.
What is the Total Female Population of Melbourne Village?
Total Female Population of Melbourne Village is 406.
What is the Ratio of Males per 100 Females in Melbourne Village?
There are 93.35 Males per 100 Females in Melbourne Village.
What is the Ratio of Females per 100 Males in Melbourne Village?
There are 107.12 Females per 100 Males in Melbourne Village.
What is the Median Population Age in Melbourne Village?
Median Population Age in Melbourne Village is 58.5 Years.
What is the Average Family Size in Melbourne Village
Average Family Size in Melbourne Village is 2.8 People.
What is the Average Household Size in Melbourne Village
Average Household Size in Melbourne Village is 2.4 People.
How Large is the Labor Force in Melbourne Village?
There are 322 People in the Labor Forcein in Melbourne Village.
What is the Percentage of People in the Labor Force in Melbourne Village?
46.0% of People are in the Labor Force in Melbourne Village.
What is the Unemployment Rate in Melbourne Village?
Unemployment Rate in Melbourne Village is 5.3%.