Eldorado at Santa Fe, NM Map & Demographics
Eldorado at Santa Fe Map
Eldorado at Santa Fe Overview
$60,721
PER CAPITA INCOME
$121,816
AVG FAMILY INCOME
$93,969
AVG HOUSEHOLD INCOME
22.4%
WAGE / INCOME GAP [ % ]
77.6¢/ $1
WAGE / INCOME GAP [ $ ]
0.43
INEQUALITY / GINI INDEX
5,471
TOTAL POPULATION
2,708
MALE POPULATION
2,763
FEMALE POPULATION
98.01
MALES / 100 FEMALES
102.03
FEMALES / 100 MALES
62.2
MEDIAN AGE
2.5
AVG FAMILY SIZE
2.1
AVG HOUSEHOLD SIZE
2,649
LABOR FORCE [ PEOPLE ]
53.2%
PERCENT IN LABOR FORCE
3.1%
UNEMPLOYMENT RATE
Income in Eldorado at Santa Fe
Income Overview in Eldorado at Santa Fe
Per Capita Income in Eldorado at Santa Fe is $60,721, while median incomes of families and households are $121,816 and $93,969 respectively.
| Characteristic | Number | Measure |
| Per Capita Income | 5,471 | $60,721 |
| Median Family Income | 1,607 | $121,816 |
| Mean Family Income | 1,607 | $153,020 |
| Median Household Income | 2,629 | $93,969 |
| Mean Household Income | 2,629 | $122,584 |
| Income Deficit | 1,607 | $0 |
| Wage / Income Gap (%) | 5,471 | 22.38% |
| Wage / Income Gap ($) | 5,471 | 77.62¢ per $1 |
| Gini / Inequality Index | 5,471 | 0.43 |
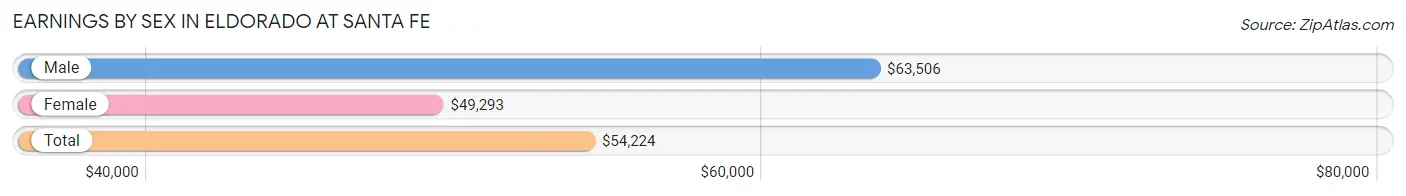
Earnings by Sex in Eldorado at Santa Fe
Average Earnings in Eldorado at Santa Fe are $54,224, $63,506 for men and $49,293 for women, a difference of 22.4%.
| Sex | Number | Average Earnings |
| Male | 1,391 (50.1%) | $63,506 |
| Female | 1,383 (49.9%) | $49,293 |
| Total | 2,774 (100.0%) | $54,224 |
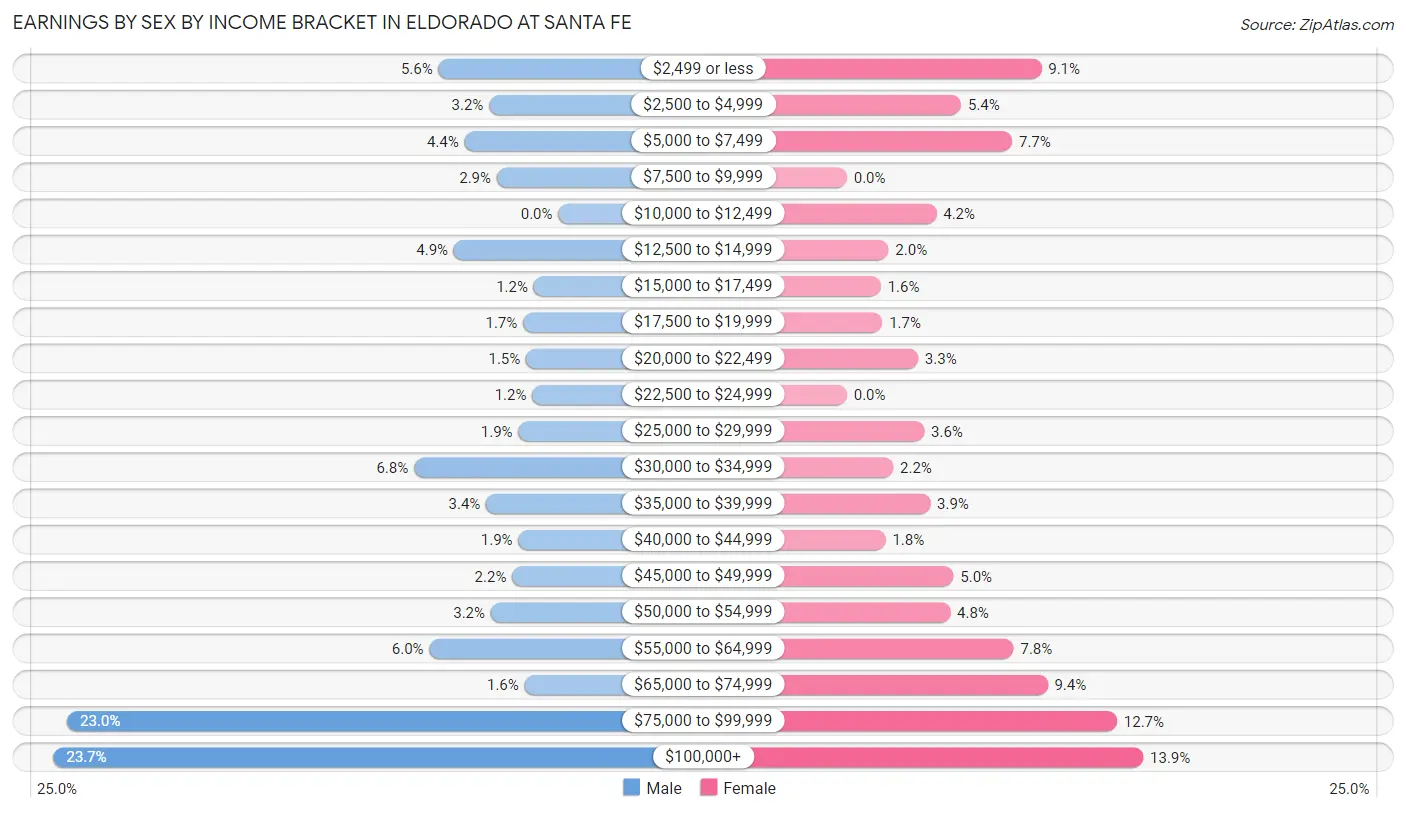
Earnings by Sex by Income Bracket in Eldorado at Santa Fe
The most common earnings brackets in Eldorado at Santa Fe are $100,000+ for men (329 | 23.6%) and $100,000+ for women (192 | 13.9%).
| Income | Male | Female |
| $2,499 or less | 78 (5.6%) | 126 (9.1%) |
| $2,500 to $4,999 | 45 (3.2%) | 74 (5.3%) |
| $5,000 to $7,499 | 61 (4.4%) | 107 (7.7%) |
| $7,500 to $9,999 | 40 (2.9%) | 0 (0.0%) |
| $10,000 to $12,499 | 0 (0.0%) | 58 (4.2%) |
| $12,500 to $14,999 | 68 (4.9%) | 27 (1.9%) |
| $15,000 to $17,499 | 16 (1.1%) | 22 (1.6%) |
| $17,500 to $19,999 | 23 (1.7%) | 23 (1.7%) |
| $20,000 to $22,499 | 21 (1.5%) | 46 (3.3%) |
| $22,500 to $24,999 | 17 (1.2%) | 0 (0.0%) |
| $25,000 to $29,999 | 26 (1.9%) | 50 (3.6%) |
| $30,000 to $34,999 | 94 (6.8%) | 30 (2.2%) |
| $35,000 to $39,999 | 47 (3.4%) | 54 (3.9%) |
| $40,000 to $44,999 | 26 (1.9%) | 25 (1.8%) |
| $45,000 to $49,999 | 30 (2.2%) | 69 (5.0%) |
| $50,000 to $54,999 | 44 (3.2%) | 67 (4.8%) |
| $55,000 to $64,999 | 84 (6.0%) | 108 (7.8%) |
| $65,000 to $74,999 | 22 (1.6%) | 130 (9.4%) |
| $75,000 to $99,999 | 320 (23.0%) | 175 (12.7%) |
| $100,000+ | 329 (23.6%) | 192 (13.9%) |
| Total | 1,391 (100.0%) | 1,383 (100.0%) |
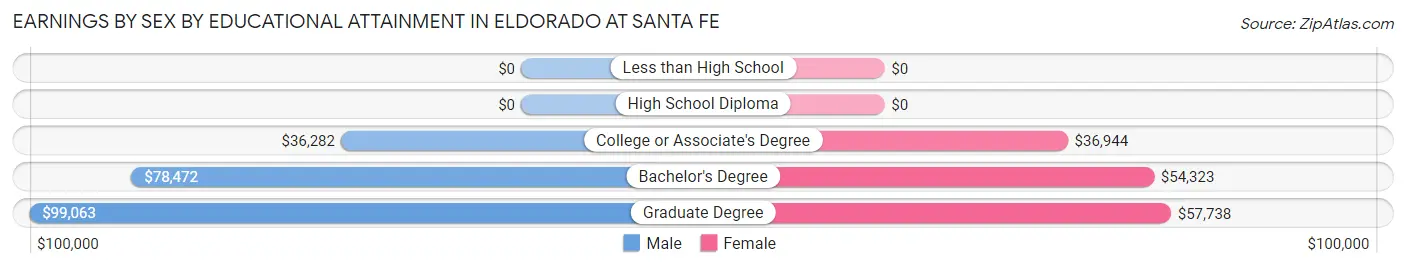
Earnings by Sex by Educational Attainment in Eldorado at Santa Fe
Average earnings in Eldorado at Santa Fe are $73,681 for men and $49,511 for women, a difference of 32.8%. Men with an educational attainment of graduate degree enjoy the highest average annual earnings of $99,063, while those with college or associate's degree education earn the least with $36,282. Women with an educational attainment of graduate degree earn the most with the average annual earnings of $57,738, while those with college or associate's degree education have the smallest earnings of $36,944.
| Educational Attainment | Male Income | Female Income |
| Less than High School | - | - |
| High School Diploma | - | - |
| College or Associate's Degree | $36,282 | $36,944 |
| Bachelor's Degree | $78,472 | $54,323 |
| Graduate Degree | $99,063 | $57,738 |
| Total | $73,681 | $49,511 |
Family Income in Eldorado at Santa Fe
Family Income Brackets in Eldorado at Santa Fe
According to the Eldorado at Santa Fe family income data, there are 371 families falling into the $200,000+ income range, which is the most common income bracket and makes up 23.1% of all families.
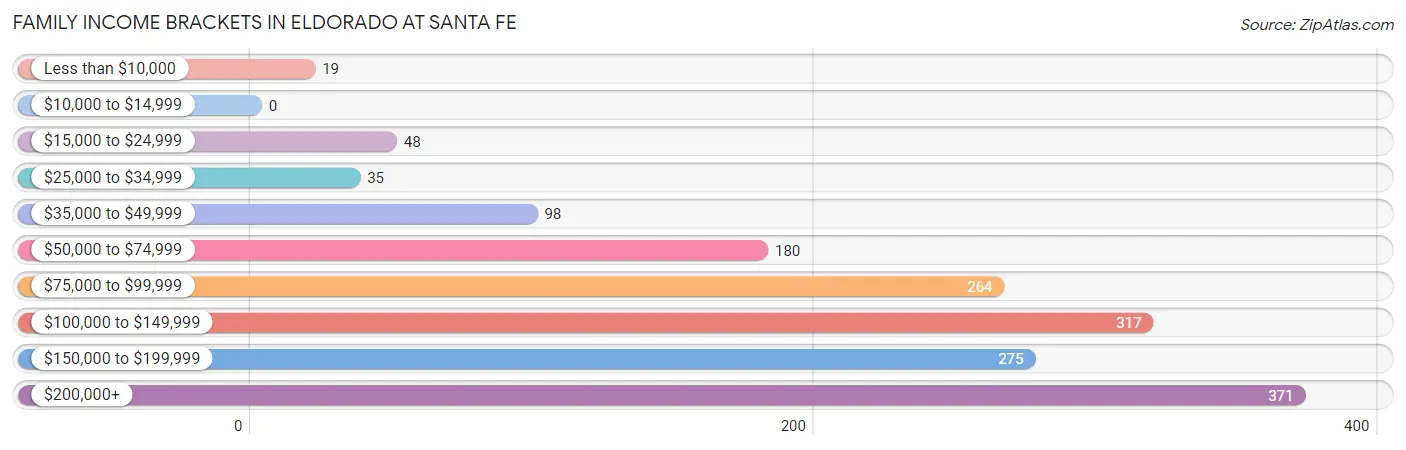
| Income Bracket | # Families | % Families |
| Less than $10,000 | 19 | 1.2% |
| $10,000 to $14,999 | 0 | 0.0% |
| $15,000 to $24,999 | 48 | 3.0% |
| $25,000 to $34,999 | 35 | 2.2% |
| $35,000 to $49,999 | 98 | 6.1% |
| $50,000 to $74,999 | 180 | 11.2% |
| $75,000 to $99,999 | 264 | 16.4% |
| $100,000 to $149,999 | 317 | 19.7% |
| $150,000 to $199,999 | 275 | 17.1% |
| $200,000+ | 371 | 23.1% |
Family Income by Famaliy Size in Eldorado at Santa Fe
4-person families (240 | 14.9%) account for the highest median family income in Eldorado at Santa Fe with $164,216 per family, while 2-person families (1,146 | 71.3%) have the highest median income of $55,491 per family member.
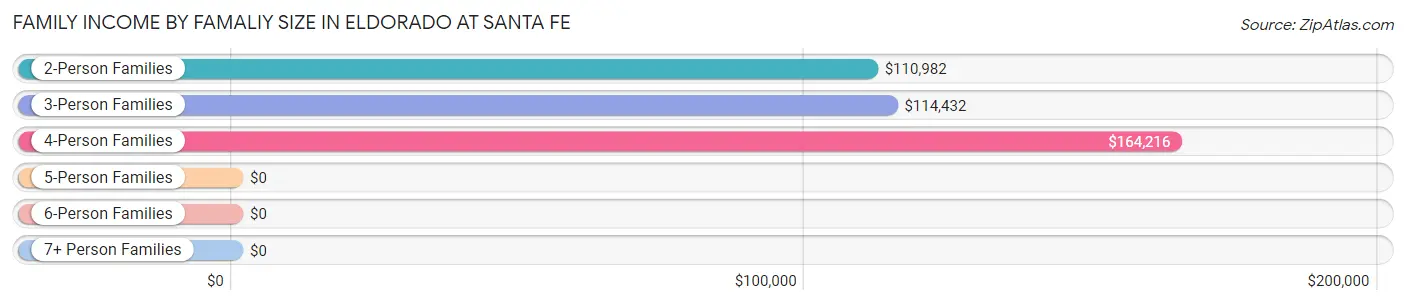
| Income Bracket | # Families | Median Income |
| 2-Person Families | 1,146 (71.3%) | $110,982 |
| 3-Person Families | 201 (12.5%) | $114,432 |
| 4-Person Families | 240 (14.9%) | $164,216 |
| 5-Person Families | 20 (1.2%) | $0 |
| 6-Person Families | 0 (0.0%) | $0 |
| 7+ Person Families | 0 (0.0%) | $0 |
| Total | 1,607 (100.0%) | $121,816 |
Family Income by Number of Earners in Eldorado at Santa Fe
The median family income in Eldorado at Santa Fe is $121,816, with families comprising 2 earners (663) having the highest median family income of $163,750, while families with no earners (430) have the lowest median family income of $95,588, accounting for 41.3% and 26.8% of families, respectively.
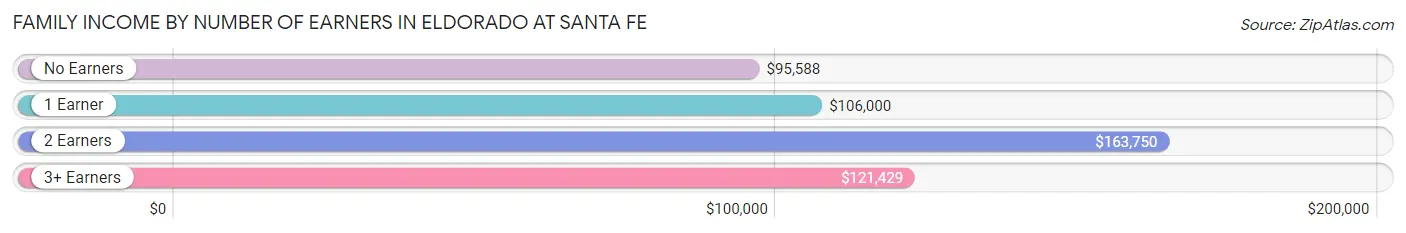
| Number of Earners | # Families | Median Income |
| No Earners | 430 (26.8%) | $95,588 |
| 1 Earner | 414 (25.8%) | $106,000 |
| 2 Earners | 663 (41.3%) | $163,750 |
| 3+ Earners | 100 (6.2%) | $121,429 |
| Total | 1,607 (100.0%) | $121,816 |
Household Income in Eldorado at Santa Fe
Household Income Brackets in Eldorado at Santa Fe
With 497 households falling in the category, the $50,000 to $74,999 income range is the most frequent in Eldorado at Santa Fe, accounting for 18.9% of all households. In contrast, only 13 households (0.5%) fall into the $10,000 to $14,999 income bracket, making it the least populous group.
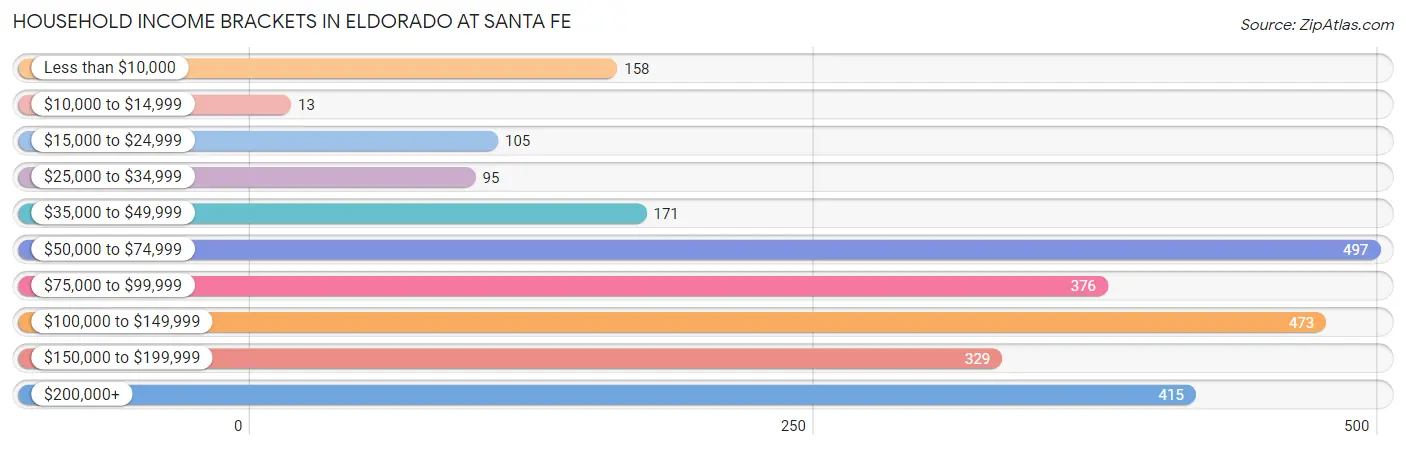
| Income Bracket | # Households | % Households |
| Less than $10,000 | 158 | 6.0% |
| $10,000 to $14,999 | 13 | 0.5% |
| $15,000 to $24,999 | 105 | 4.0% |
| $25,000 to $34,999 | 95 | 3.6% |
| $35,000 to $49,999 | 171 | 6.5% |
| $50,000 to $74,999 | 497 | 18.9% |
| $75,000 to $99,999 | 376 | 14.3% |
| $100,000 to $149,999 | 473 | 18.0% |
| $150,000 to $199,999 | 329 | 12.5% |
| $200,000+ | 415 | 15.8% |
Household Income by Householder Age in Eldorado at Santa Fe
The median household income in Eldorado at Santa Fe is $93,969, with the highest median household income of $155,250 found in the 25 to 44 years age bracket for the primary householder. A total of 344 households (13.1%) fall into this category.
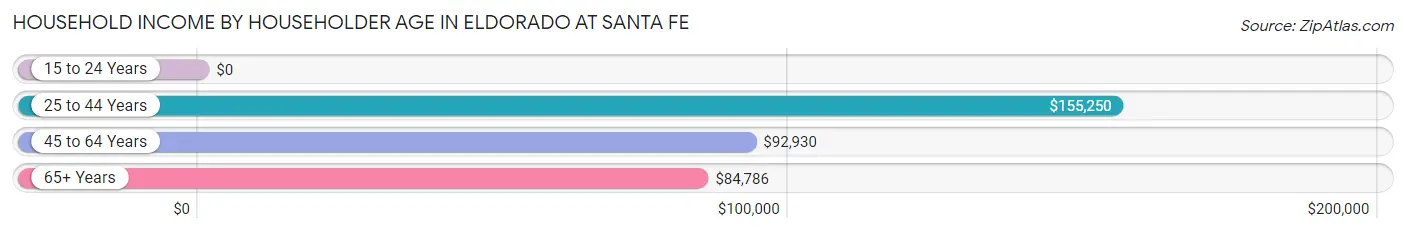
| Income Bracket | # Households | Median Income |
| 15 to 24 Years | 0 (0.0%) | $0 |
| 25 to 44 Years | 344 (13.1%) | $155,250 |
| 45 to 64 Years | 859 (32.7%) | $92,930 |
| 65+ Years | 1,426 (54.2%) | $84,786 |
| Total | 2,629 (100.0%) | $93,969 |
Poverty in Eldorado at Santa Fe
Income Below Poverty by Sex and Age in Eldorado at Santa Fe
With 7.0% poverty level for males and 9.5% for females among the residents of Eldorado at Santa Fe, 18 to 24 year old males and 15 year old females are the most vulnerable to poverty, with 53 males (36.8%) and 43 females (46.2%) in their respective age groups living below the poverty level.
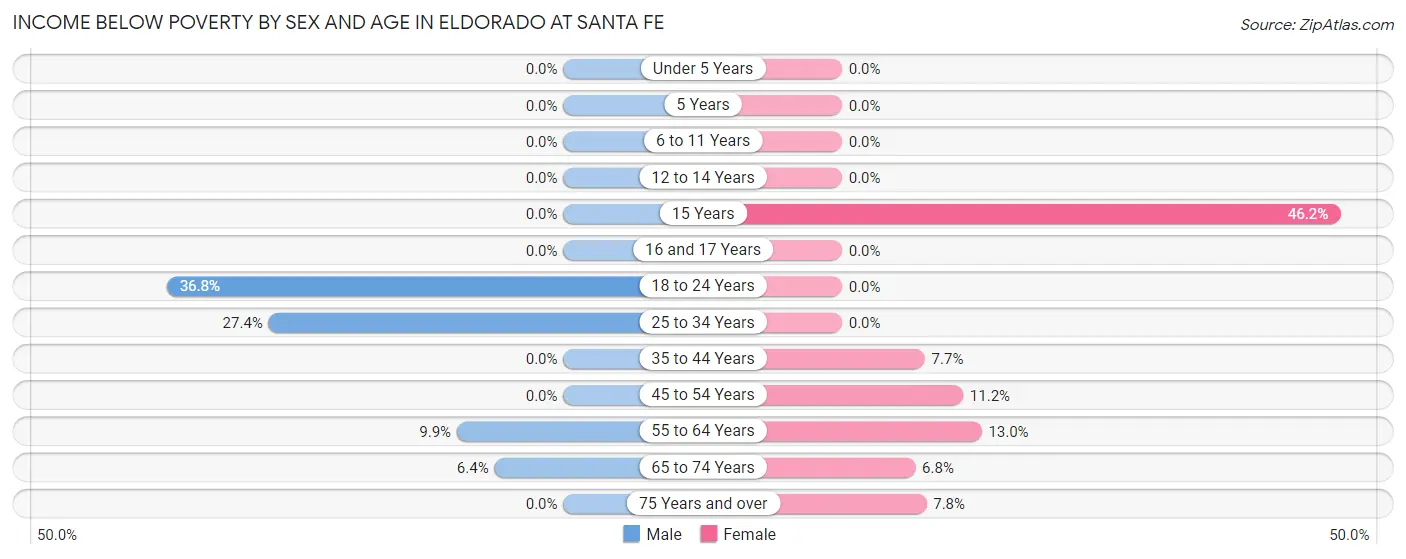
| Age Bracket | Male | Female |
| Under 5 Years | 0 (0.0%) | 0 (0.0%) |
| 5 Years | 0 (0.0%) | 0 (0.0%) |
| 6 to 11 Years | 0 (0.0%) | 0 (0.0%) |
| 12 to 14 Years | 0 (0.0%) | 0 (0.0%) |
| 15 Years | 0 (0.0%) | 43 (46.2%) |
| 16 and 17 Years | 0 (0.0%) | 0 (0.0%) |
| 18 to 24 Years | 53 (36.8%) | 0 (0.0%) |
| 25 to 34 Years | 32 (27.4%) | 0 (0.0%) |
| 35 to 44 Years | 0 (0.0%) | 20 (7.7%) |
| 45 to 54 Years | 0 (0.0%) | 30 (11.2%) |
| 55 to 64 Years | 49 (9.9%) | 85 (13.0%) |
| 65 to 74 Years | 56 (6.4%) | 56 (6.8%) |
| 75 Years and over | 0 (0.0%) | 28 (7.8%) |
| Total | 190 (7.0%) | 262 (9.5%) |
Income Above Poverty by Sex and Age in Eldorado at Santa Fe
According to the poverty statistics in Eldorado at Santa Fe, males aged under 5 years and females aged under 5 years are the age groups that are most secure financially, with 100.0% of males and 100.0% of females in these age groups living above the poverty line.
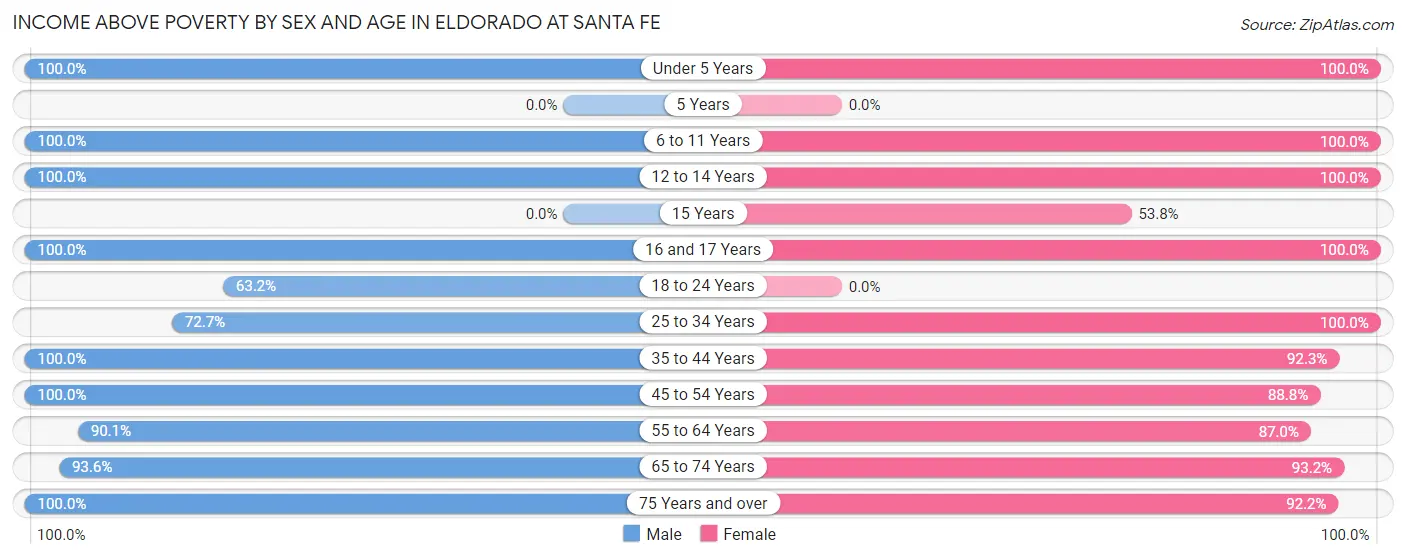
| Age Bracket | Male | Female |
| Under 5 Years | 12 (100.0%) | 13 (100.0%) |
| 5 Years | 0 (0.0%) | 0 (0.0%) |
| 6 to 11 Years | 170 (100.0%) | 32 (100.0%) |
| 12 to 14 Years | 59 (100.0%) | 113 (100.0%) |
| 15 Years | 0 (0.0%) | 50 (53.8%) |
| 16 and 17 Years | 22 (100.0%) | 35 (100.0%) |
| 18 to 24 Years | 91 (63.2%) | 0 (0.0%) |
| 25 to 34 Years | 85 (72.7%) | 115 (100.0%) |
| 35 to 44 Years | 168 (100.0%) | 240 (92.3%) |
| 45 to 54 Years | 272 (100.0%) | 237 (88.8%) |
| 55 to 64 Years | 447 (90.1%) | 571 (87.0%) |
| 65 to 74 Years | 820 (93.6%) | 766 (93.2%) |
| 75 Years and over | 372 (100.0%) | 329 (92.2%) |
| Total | 2,518 (93.0%) | 2,501 (90.5%) |
Income Below Poverty Among Married-Couple Families in Eldorado at Santa Fe
The poverty statistics for married-couple families in Eldorado at Santa Fe show that 2.0% or 30 of the total 1,514 families live below the poverty line. Families with no children have the highest poverty rate of 2.5%, comprising of 30 families. On the other hand, families with 1 or 2 children have the lowest poverty rate of 0.0%, which includes 0 families.
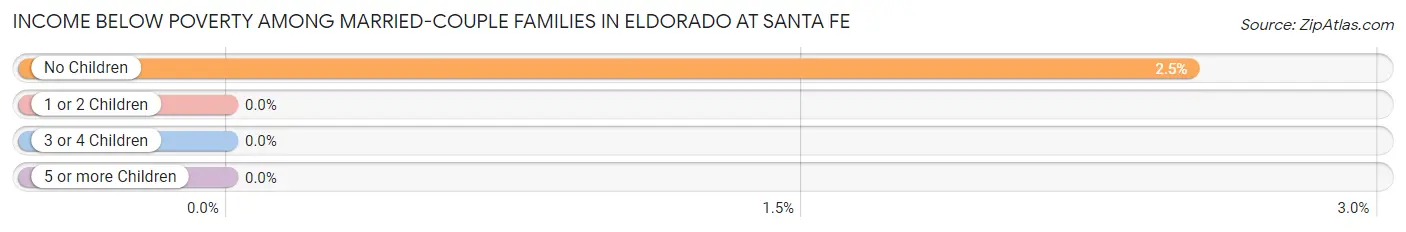
| Children | Above Poverty | Below Poverty |
| No Children | 1,166 (97.5%) | 30 (2.5%) |
| 1 or 2 Children | 308 (100.0%) | 0 (0.0%) |
| 3 or 4 Children | 10 (100.0%) | 0 (0.0%) |
| 5 or more Children | 0 (0.0%) | 0 (0.0%) |
| Total | 1,484 (98.0%) | 30 (2.0%) |
Income Below Poverty Among Single-Parent Households in Eldorado at Santa Fe
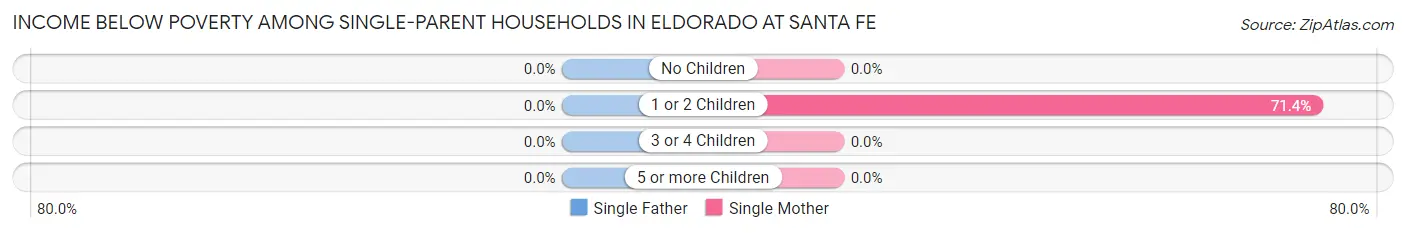
| Children | Single Father | Single Mother |
| No Children | 0 (0.0%) | 0 (0.0%) |
| 1 or 2 Children | 0 (0.0%) | 30 (71.4%) |
| 3 or 4 Children | 0 (0.0%) | 0 (0.0%) |
| 5 or more Children | 0 (0.0%) | 0 (0.0%) |
| Total | 0 (0.0%) | 30 (33.7%) |
Income Below Poverty Among Married-Couple vs Single-Parent Households in Eldorado at Santa Fe
The poverty data for Eldorado at Santa Fe shows that 30 of the married-couple family households (2.0%) and 30 of the single-parent households (32.3%) are living below the poverty level. Within the married-couple family households, those with no children have the highest poverty rate, with 30 households (2.5%) falling below the poverty line. Among the single-parent households, those with 1 or 2 children have the highest poverty rate, with 30 household (71.4%) living below poverty.
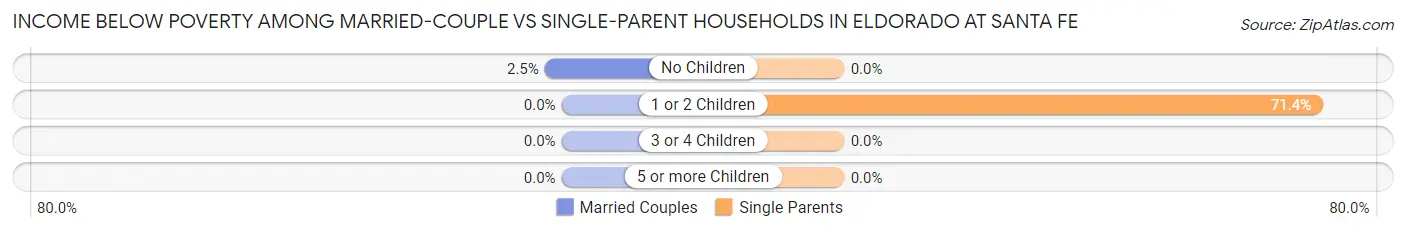
| Children | Married-Couple Families | Single-Parent Households |
| No Children | 30 (2.5%) | 0 (0.0%) |
| 1 or 2 Children | 0 (0.0%) | 30 (71.4%) |
| 3 or 4 Children | 0 (0.0%) | 0 (0.0%) |
| 5 or more Children | 0 (0.0%) | 0 (0.0%) |
| Total | 30 (2.0%) | 30 (32.3%) |
Race in Eldorado at Santa Fe
The most populous races in Eldorado at Santa Fe are White / Caucasian (4,748 | 86.8%), Hispanic or Latino (897 | 16.4%), and Two or more Races (442 | 8.1%).
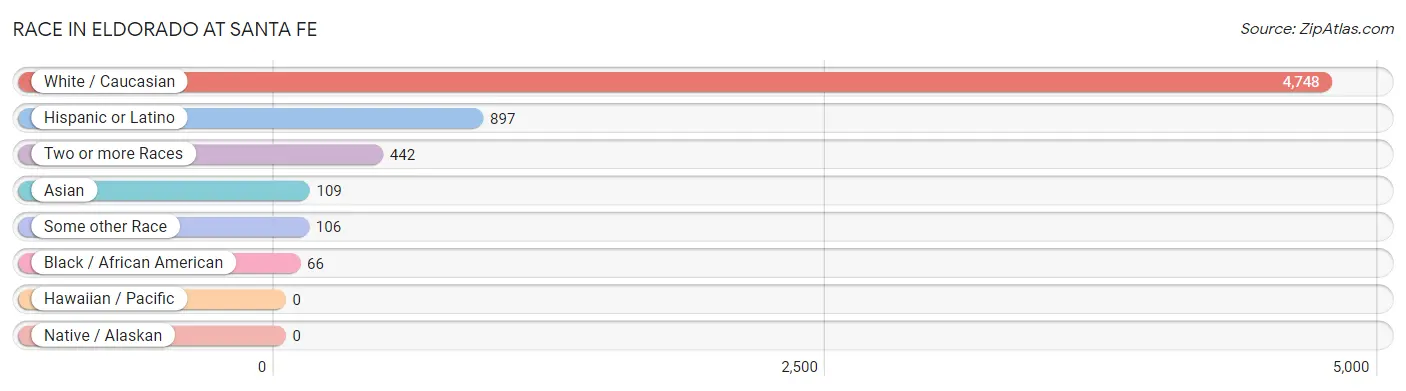
| Race | # Population | % Population |
| Asian | 109 | 2.0% |
| Black / African American | 66 | 1.2% |
| Hawaiian / Pacific | 0 | 0.0% |
| Hispanic or Latino | 897 | 16.4% |
| Native / Alaskan | 0 | 0.0% |
| White / Caucasian | 4,748 | 86.8% |
| Two or more Races | 442 | 8.1% |
| Some other Race | 106 | 1.9% |
| Total | 5,471 | 100.0% |
Ancestry in Eldorado at Santa Fe
The most populous ancestries reported in Eldorado at Santa Fe are English (1,089 | 19.9%), German (741 | 13.5%), Irish (718 | 13.1%), Mexican (371 | 6.8%), and American (322 | 5.9%), together accounting for 59.2% of all Eldorado at Santa Fe residents.
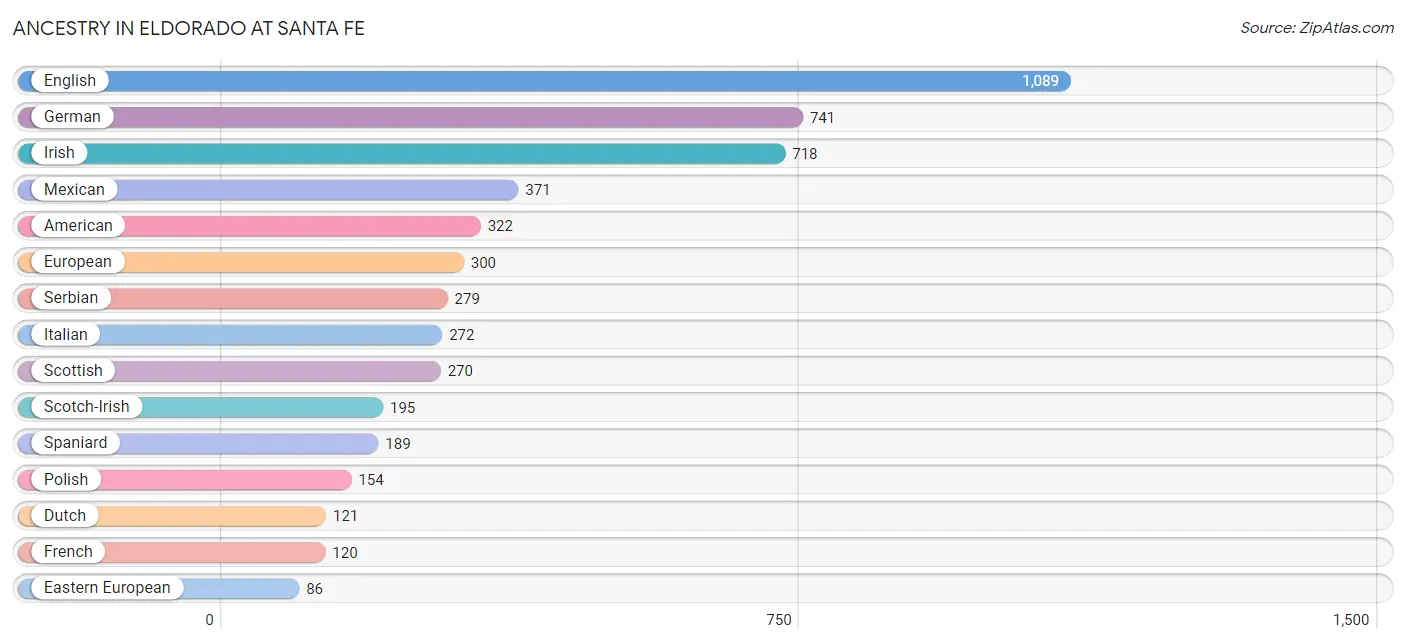
| Ancestry | # Population | % Population |
| American | 322 | 5.9% |
| Arab | 30 | 0.5% |
| Australian | 10 | 0.2% |
| Austrian | 15 | 0.3% |
| Belgian | 13 | 0.2% |
| Bhutanese | 32 | 0.6% |
| British | 38 | 0.7% |
| Bulgarian | 7 | 0.1% |
| Burmese | 15 | 0.3% |
| Cambodian | 8 | 0.2% |
| Canadian | 10 | 0.2% |
| Chickasaw | 21 | 0.4% |
| Croatian | 8 | 0.2% |
| Cuban | 12 | 0.2% |
| Czech | 17 | 0.3% |
| Czechoslovakian | 8 | 0.2% |
| Danish | 70 | 1.3% |
| Dutch | 121 | 2.2% |
| Eastern European | 86 | 1.6% |
| English | 1,089 | 19.9% |
| Ethiopian | 13 | 0.2% |
| European | 300 | 5.5% |
| Finnish | 15 | 0.3% |
| French | 120 | 2.2% |
| French Canadian | 20 | 0.4% |
| German | 741 | 13.5% |
| Greek | 15 | 0.3% |
| Guamanian / Chamorro | 10 | 0.2% |
| Hungarian | 59 | 1.1% |
| Indian (Asian) | 60 | 1.1% |
| Irish | 718 | 13.1% |
| Italian | 272 | 5.0% |
| Korean | 7 | 0.1% |
| Lebanese | 30 | 0.5% |
| Macedonian | 11 | 0.2% |
| Mexican | 371 | 6.8% |
| Northern European | 54 | 1.0% |
| Norwegian | 75 | 1.4% |
| Polish | 154 | 2.8% |
| Portuguese | 6 | 0.1% |
| Puerto Rican | 21 | 0.4% |
| Russian | 39 | 0.7% |
| Scandinavian | 41 | 0.7% |
| Scotch-Irish | 195 | 3.6% |
| Scottish | 270 | 4.9% |
| Serbian | 279 | 5.1% |
| Slavic | 6 | 0.1% |
| Slovak | 13 | 0.2% |
| Spaniard | 189 | 3.5% |
| Spanish | 85 | 1.5% |
| Sri Lankan | 9 | 0.2% |
| Subsaharan African | 13 | 0.2% |
| Swedish | 56 | 1.0% |
| Swiss | 31 | 0.6% |
| Thai | 64 | 1.2% |
| Turkish | 15 | 0.3% |
| Ukrainian | 7 | 0.1% |
| Welsh | 84 | 1.5% | View All 58 Rows |
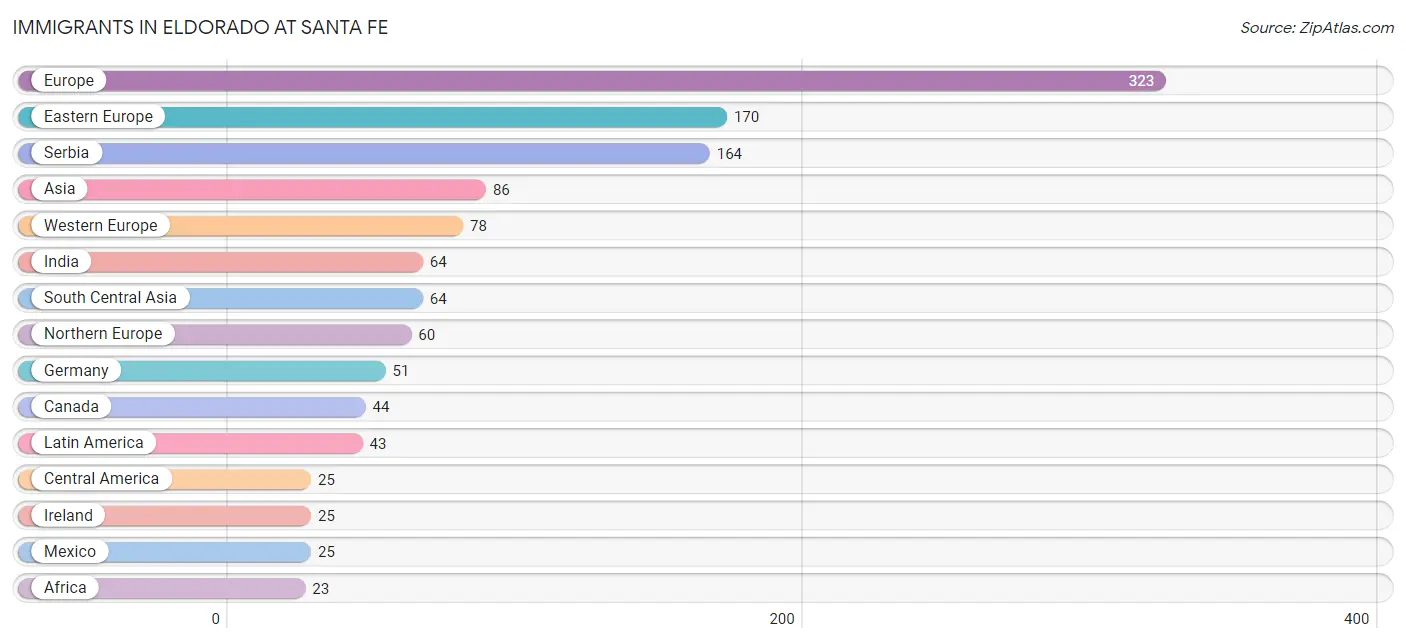
Immigrants in Eldorado at Santa Fe
The most numerous immigrant groups reported in Eldorado at Santa Fe came from Europe (323 | 5.9%), Eastern Europe (170 | 3.1%), Serbia (164 | 3.0%), Asia (86 | 1.6%), and Western Europe (78 | 1.4%), together accounting for 15.0% of all Eldorado at Santa Fe residents.
| Immigration Origin | # Population | % Population |
| Africa | 23 | 0.4% |
| Asia | 86 | 1.6% |
| Australia | 19 | 0.4% |
| Austria | 8 | 0.2% |
| Brazil | 6 | 0.1% |
| Canada | 44 | 0.8% |
| Caribbean | 12 | 0.2% |
| Central America | 25 | 0.5% |
| Cuba | 12 | 0.2% |
| Eastern Africa | 13 | 0.2% |
| Eastern Asia | 15 | 0.3% |
| Eastern Europe | 170 | 3.1% |
| England | 9 | 0.2% |
| Ethiopia | 13 | 0.2% |
| Europe | 323 | 5.9% |
| France | 8 | 0.2% |
| Germany | 51 | 0.9% |
| India | 64 | 1.2% |
| Ireland | 25 | 0.5% |
| Italy | 15 | 0.3% |
| Korea | 15 | 0.3% |
| Latin America | 43 | 0.8% |
| Mexico | 25 | 0.5% |
| Northern Europe | 60 | 1.1% |
| Oceania | 19 | 0.4% |
| Philippines | 7 | 0.1% |
| Poland | 6 | 0.1% |
| Serbia | 164 | 3.0% |
| South Africa | 10 | 0.2% |
| South America | 6 | 0.1% |
| South Central Asia | 64 | 1.2% |
| South Eastern Asia | 7 | 0.1% |
| Southern Europe | 15 | 0.3% |
| Switzerland | 11 | 0.2% |
| Western Europe | 78 | 1.4% | View All 35 Rows |
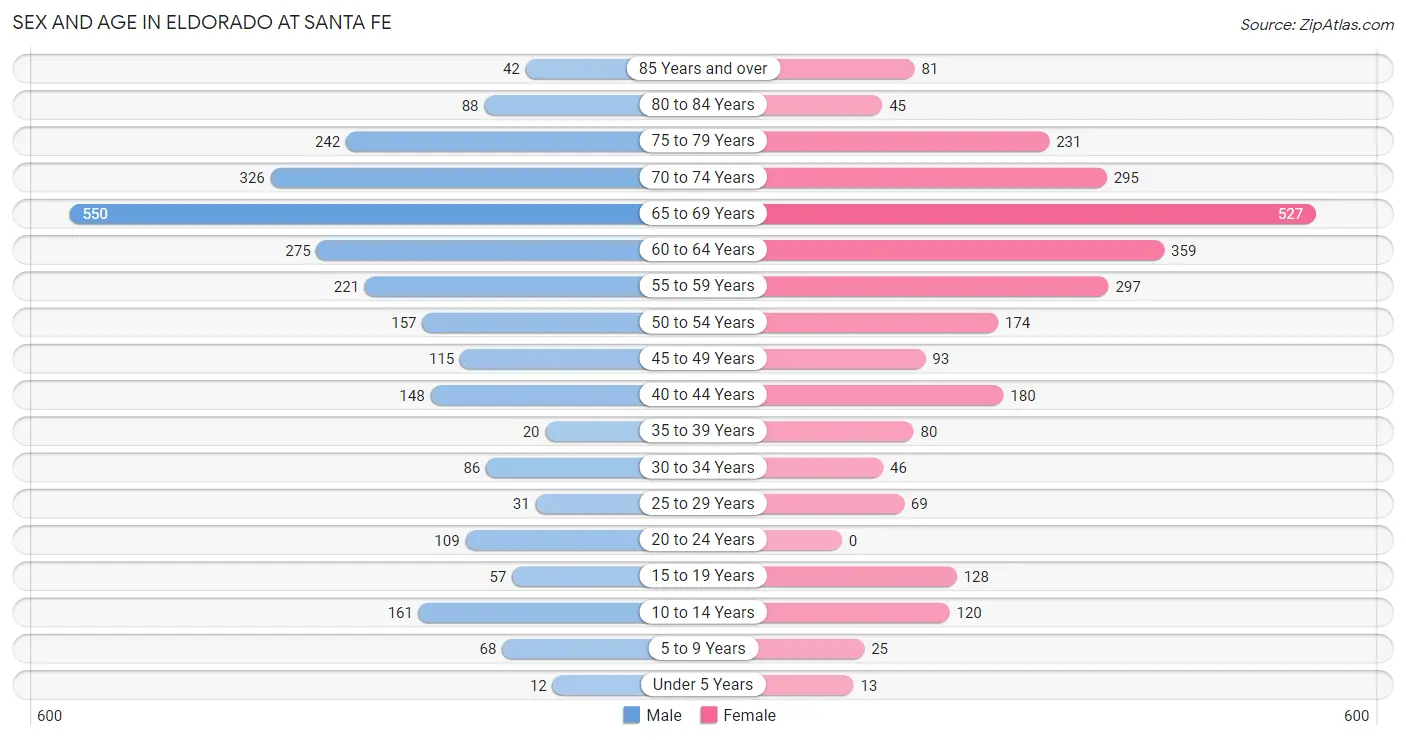
Sex and Age in Eldorado at Santa Fe
Sex and Age in Eldorado at Santa Fe
The most populous age groups in Eldorado at Santa Fe are 65 to 69 Years (550 | 20.3%) for men and 65 to 69 Years (527 | 19.1%) for women.
| Age Bracket | Male | Female |
| Under 5 Years | 12 (0.4%) | 13 (0.5%) |
| 5 to 9 Years | 68 (2.5%) | 25 (0.9%) |
| 10 to 14 Years | 161 (5.9%) | 120 (4.3%) |
| 15 to 19 Years | 57 (2.1%) | 128 (4.6%) |
| 20 to 24 Years | 109 (4.0%) | 0 (0.0%) |
| 25 to 29 Years | 31 (1.1%) | 69 (2.5%) |
| 30 to 34 Years | 86 (3.2%) | 46 (1.7%) |
| 35 to 39 Years | 20 (0.7%) | 80 (2.9%) |
| 40 to 44 Years | 148 (5.5%) | 180 (6.5%) |
| 45 to 49 Years | 115 (4.3%) | 93 (3.4%) |
| 50 to 54 Years | 157 (5.8%) | 174 (6.3%) |
| 55 to 59 Years | 221 (8.2%) | 297 (10.7%) |
| 60 to 64 Years | 275 (10.2%) | 359 (13.0%) |
| 65 to 69 Years | 550 (20.3%) | 527 (19.1%) |
| 70 to 74 Years | 326 (12.0%) | 295 (10.7%) |
| 75 to 79 Years | 242 (8.9%) | 231 (8.4%) |
| 80 to 84 Years | 88 (3.3%) | 45 (1.6%) |
| 85 Years and over | 42 (1.5%) | 81 (2.9%) |
| Total | 2,708 (100.0%) | 2,763 (100.0%) |
Families and Households in Eldorado at Santa Fe
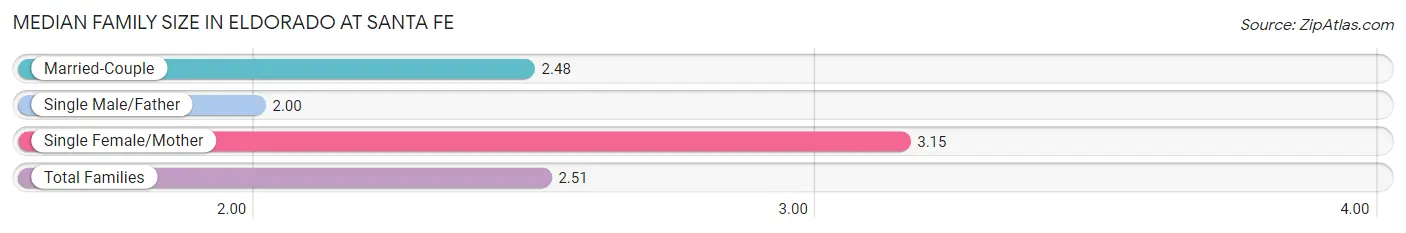
Median Family Size in Eldorado at Santa Fe
The median family size in Eldorado at Santa Fe is 2.51 persons per family, with single female/mother families (89 | 5.5%) accounting for the largest median family size of 3.15 persons per family. On the other hand, single male/father families (4 | 0.3%) represent the smallest median family size with 2.00 persons per family.
| Family Type | # Families | Family Size |
| Married-Couple | 1,514 (94.2%) | 2.48 |
| Single Male/Father | 4 (0.3%) | 2.00 |
| Single Female/Mother | 89 (5.5%) | 3.15 |
| Total Families | 1,607 (100.0%) | 2.51 |
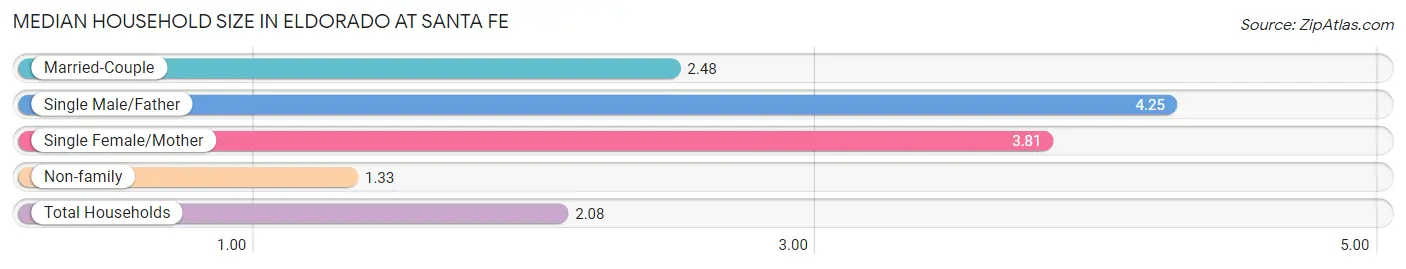
Median Household Size in Eldorado at Santa Fe
The median household size in Eldorado at Santa Fe is 2.08 persons per household, with single male/father households (4 | 0.2%) accounting for the largest median household size of 4.25 persons per household. non-family households (1,022 | 38.9%) represent the smallest median household size with 1.33 persons per household.
| Household Type | # Households | Household Size |
| Married-Couple | 1,514 (57.6%) | 2.48 |
| Single Male/Father | 4 (0.2%) | 4.25 |
| Single Female/Mother | 89 (3.4%) | 3.81 |
| Non-family | 1,022 (38.9%) | 1.33 |
| Total Households | 2,629 (100.0%) | 2.08 |
Household Size by Marriage Status in Eldorado at Santa Fe
Out of a total of 2,629 households in Eldorado at Santa Fe, 1,607 (61.1%) are family households, while 1,022 (38.9%) are nonfamily households. The most numerous type of family households are 2-person households, comprising 1,130, and the most common type of nonfamily households are 1-person households, comprising 745.
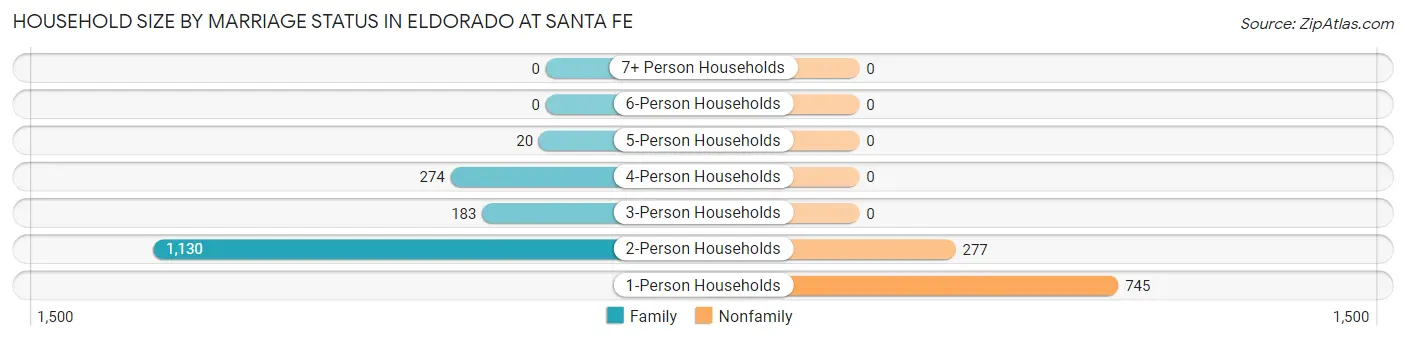
| Household Size | Family Households | Nonfamily Households |
| 1-Person Households | - | 745 (28.3%) |
| 2-Person Households | 1,130 (43.0%) | 277 (10.5%) |
| 3-Person Households | 183 (7.0%) | 0 (0.0%) |
| 4-Person Households | 274 (10.4%) | 0 (0.0%) |
| 5-Person Households | 20 (0.8%) | 0 (0.0%) |
| 6-Person Households | 0 (0.0%) | 0 (0.0%) |
| 7+ Person Households | 0 (0.0%) | 0 (0.0%) |
| Total | 1,607 (61.1%) | 1,022 (38.9%) |
Female Fertility in Eldorado at Santa Fe
Fertility by Age in Eldorado at Santa Fe
| Age Bracket | Women with Births | Births / 1,000 Women |
| 15 to 19 years | 0 (0.0%) | 0.0 |
| 20 to 34 years | 0 (0.0%) | 0.0 |
| 35 to 50 years | 0 (0.0%) | 0.0 |
| Total | 0 (0.0%) | 0.0 |
Fertility by Age by Marriage Status in Eldorado at Santa Fe
| Age Bracket | Married | Unmarried |
| 15 to 19 years | 0 (0.0%) | 0 (0.0%) |
| 20 to 34 years | 0 (0.0%) | 0 (0.0%) |
| 35 to 50 years | 0 (0.0%) | 0 (0.0%) |
| Total | 0 (0.0%) | 0 (0.0%) |
Fertility by Education in Eldorado at Santa Fe
| Educational Attainment | Women with Births | Births / 1,000 Women |
| Less than High School | 0 (0.0%) | 0.0 |
| High School Diploma | 0 (0.0%) | 0.0 |
| College or Associate's Degree | 0 (0.0%) | 0.0 |
| Bachelor's Degree | 0 (0.0%) | 0.0 |
| Graduate Degree | 0 (0.0%) | 0.0 |
| Total | 0 (0.0%) | 0.0 |
Fertility by Education by Marriage Status in Eldorado at Santa Fe
| Educational Attainment | Married | Unmarried |
| Less than High School | 0 (0.0%) | 0 (0.0%) |
| High School Diploma | 0 (0.0%) | 0 (0.0%) |
| College or Associate's Degree | 0 (0.0%) | 0 (0.0%) |
| Bachelor's Degree | 0 (0.0%) | 0 (0.0%) |
| Graduate Degree | 0 (0.0%) | 0 (0.0%) |
| Total | 0 (0.0%) | 0 (0.0%) |
Employment Characteristics in Eldorado at Santa Fe
Employment by Class of Employer in Eldorado at Santa Fe
Among the 2,517 employed individuals in Eldorado at Santa Fe, private company employees (1,020 | 40.5%), self-employed (not incorporated) (506 | 20.1%), and not-for-profit organizations (273 | 10.8%) make up the most common classes of employment.
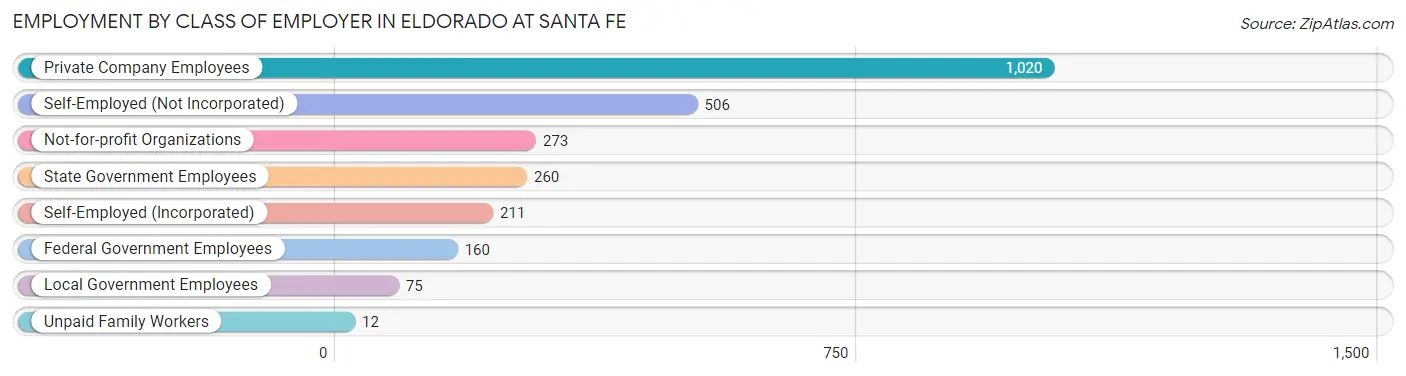
| Employer Class | # Employees | % Employees |
| Private Company Employees | 1,020 | 40.5% |
| Self-Employed (Incorporated) | 211 | 8.4% |
| Self-Employed (Not Incorporated) | 506 | 20.1% |
| Not-for-profit Organizations | 273 | 10.8% |
| Local Government Employees | 75 | 3.0% |
| State Government Employees | 260 | 10.3% |
| Federal Government Employees | 160 | 6.4% |
| Unpaid Family Workers | 12 | 0.5% |
| Total | 2,517 | 100.0% |
Employment Status by Age in Eldorado at Santa Fe
According to the labor force statistics for Eldorado at Santa Fe, out of the total population over 16 years of age (4,979), 53.2% or 2,649 individuals are in the labor force, with 3.1% or 82 of them unemployed. The age group with the highest labor force participation rate is 35 to 44 years, with 92.5% or 396 individuals in the labor force. Within the labor force, the 55 to 59 years age range has the highest percentage of unemployed individuals, with 14.5% or 55 of them being unemployed.
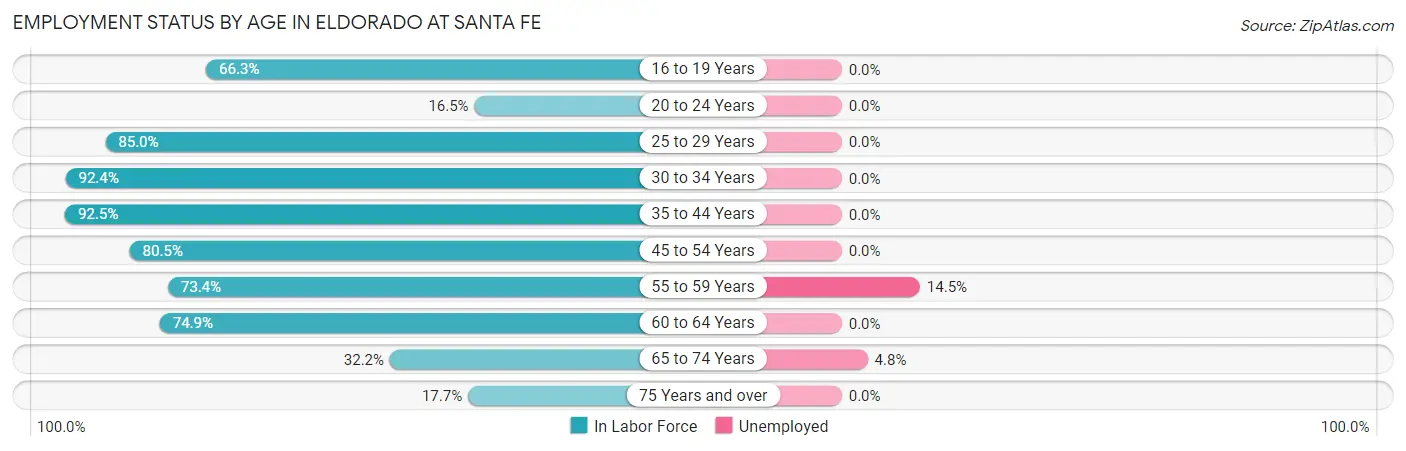
| Age Bracket | In Labor Force | Unemployed |
| 16 to 19 Years | 61 (66.3%) | 0 (0.0%) |
| 20 to 24 Years | 18 (16.5%) | 0 (0.0%) |
| 25 to 29 Years | 85 (85.0%) | 0 (0.0%) |
| 30 to 34 Years | 122 (92.4%) | 0 (0.0%) |
| 35 to 44 Years | 396 (92.5%) | 0 (0.0%) |
| 45 to 54 Years | 434 (80.5%) | 0 (0.0%) |
| 55 to 59 Years | 380 (73.4%) | 55 (14.5%) |
| 60 to 64 Years | 475 (74.9%) | 0 (0.0%) |
| 65 to 74 Years | 547 (32.2%) | 26 (4.8%) |
| 75 Years and over | 129 (17.7%) | 0 (0.0%) |
| Total | 2,649 (53.2%) | 82 (3.1%) |
Employment Status by Educational Attainment in Eldorado at Santa Fe
According to labor force statistics for Eldorado at Santa Fe, 80.5% of individuals (1,893) out of the total population between 25 and 64 years of age (2,351) are in the labor force, with 2.9% or 55 of them being unemployed. The group with the highest labor force participation rate are those with the educational attainment of less than high school, with 100.0% or 18 individuals in the labor force. Within the labor force, individuals with college / associate degree education have the highest percentage of unemployment, with 9.6% or 43 of them being unemployed.
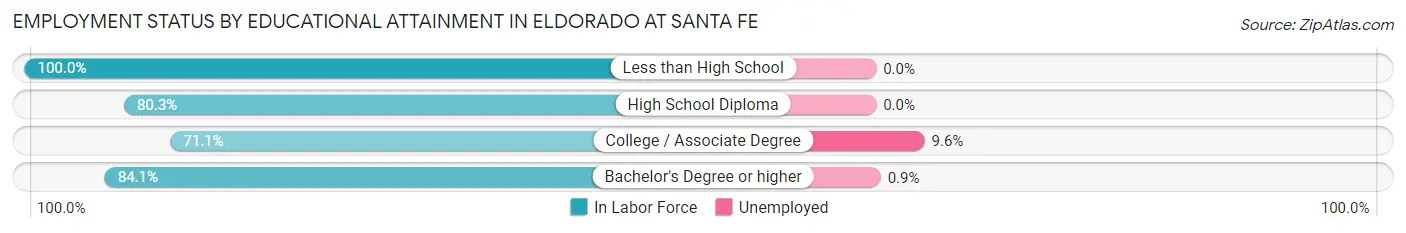
| Educational Attainment | In Labor Force | Unemployed |
| Less than High School | 18 (100.0%) | 0 (0.0%) |
| High School Diploma | 126 (80.3%) | 0 (0.0%) |
| College / Associate Degree | 447 (71.1%) | 60 (9.6%) |
| Bachelor's Degree or higher | 1,301 (84.1%) | 14 (0.9%) |
| Total | 1,893 (80.5%) | 68 (2.9%) |
Employment Occupations by Sex in Eldorado at Santa Fe
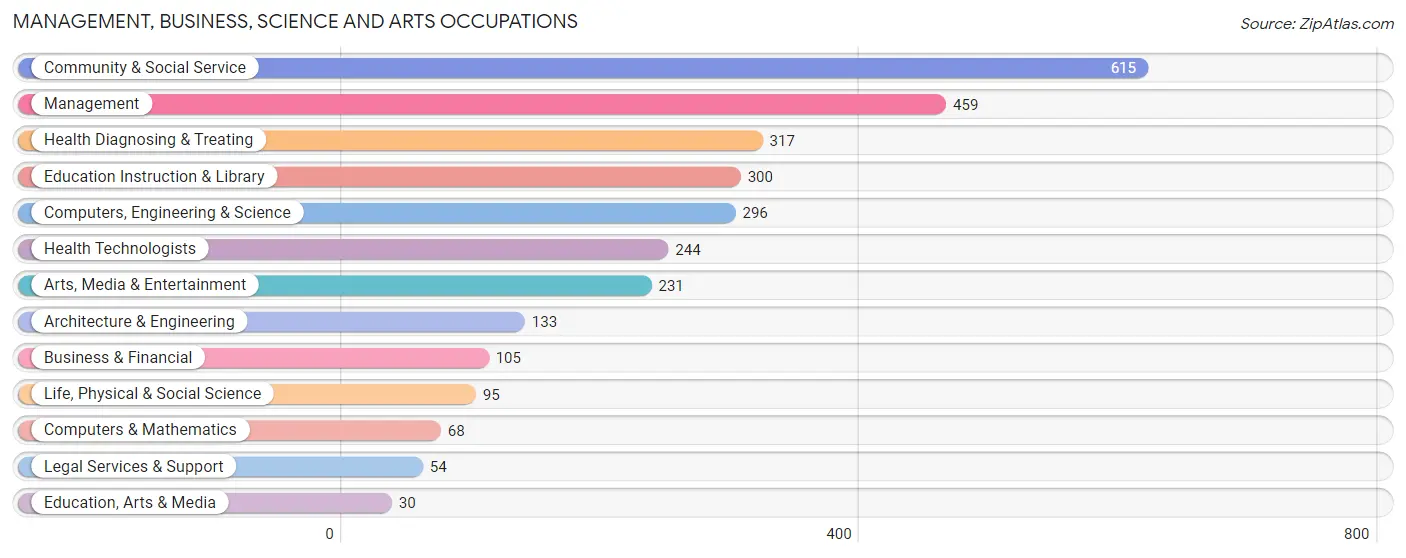
Management, Business, Science and Arts Occupations
The most common Management, Business, Science and Arts occupations in Eldorado at Santa Fe are Community & Social Service (615 | 24.0%), Management (459 | 17.9%), Health Diagnosing & Treating (317 | 12.3%), Education Instruction & Library (300 | 11.7%), and Computers, Engineering & Science (296 | 11.5%).
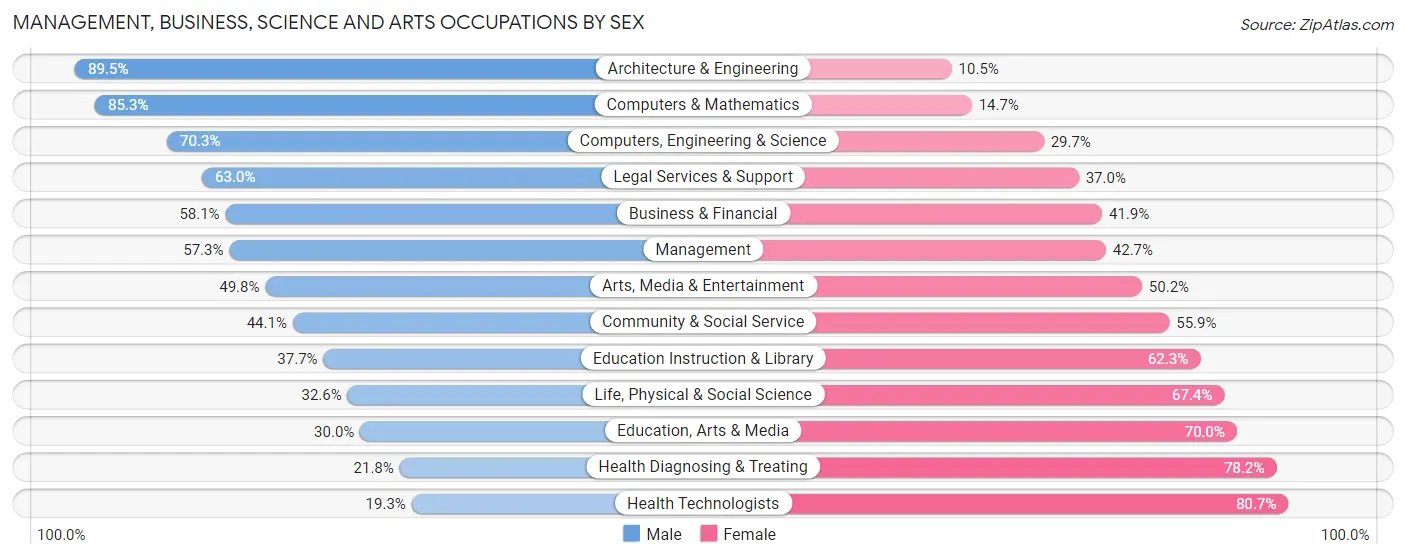
Management, Business, Science and Arts Occupations by Sex
Within the Management, Business, Science and Arts occupations in Eldorado at Santa Fe, the most male-oriented occupations are Architecture & Engineering (89.5%), Computers & Mathematics (85.3%), and Computers, Engineering & Science (70.3%), while the most female-oriented occupations are Health Technologists (80.7%), Health Diagnosing & Treating (78.2%), and Education, Arts & Media (70.0%).
| Occupation | Male | Female |
| Management | 263 (57.3%) | 196 (42.7%) |
| Business & Financial | 61 (58.1%) | 44 (41.9%) |
| Computers, Engineering & Science | 208 (70.3%) | 88 (29.7%) |
| Computers & Mathematics | 58 (85.3%) | 10 (14.7%) |
| Architecture & Engineering | 119 (89.5%) | 14 (10.5%) |
| Life, Physical & Social Science | 31 (32.6%) | 64 (67.4%) |
| Community & Social Service | 271 (44.1%) | 344 (55.9%) |
| Education, Arts & Media | 9 (30.0%) | 21 (70.0%) |
| Legal Services & Support | 34 (63.0%) | 20 (37.0%) |
| Education Instruction & Library | 113 (37.7%) | 187 (62.3%) |
| Arts, Media & Entertainment | 115 (49.8%) | 116 (50.2%) |
| Health Diagnosing & Treating | 69 (21.8%) | 248 (78.2%) |
| Health Technologists | 47 (19.3%) | 197 (80.7%) |
| Total (Category) | 872 (48.7%) | 920 (51.3%) |
| Total (Overall) | 1,350 (52.6%) | 1,216 (47.4%) |
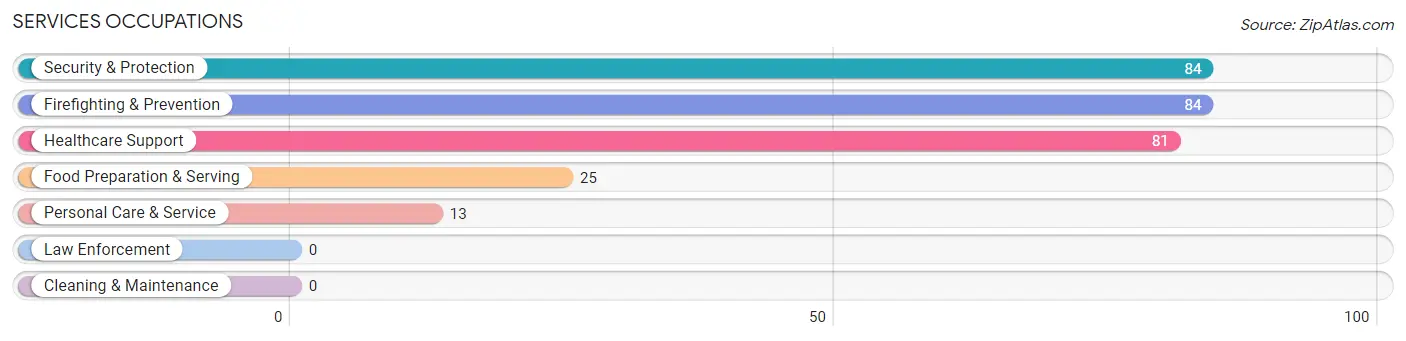
Services Occupations
The most common Services occupations in Eldorado at Santa Fe are Security & Protection (84 | 3.3%), Firefighting & Prevention (84 | 3.3%), Healthcare Support (81 | 3.2%), Food Preparation & Serving (25 | 1.0%), and Personal Care & Service (13 | 0.5%).
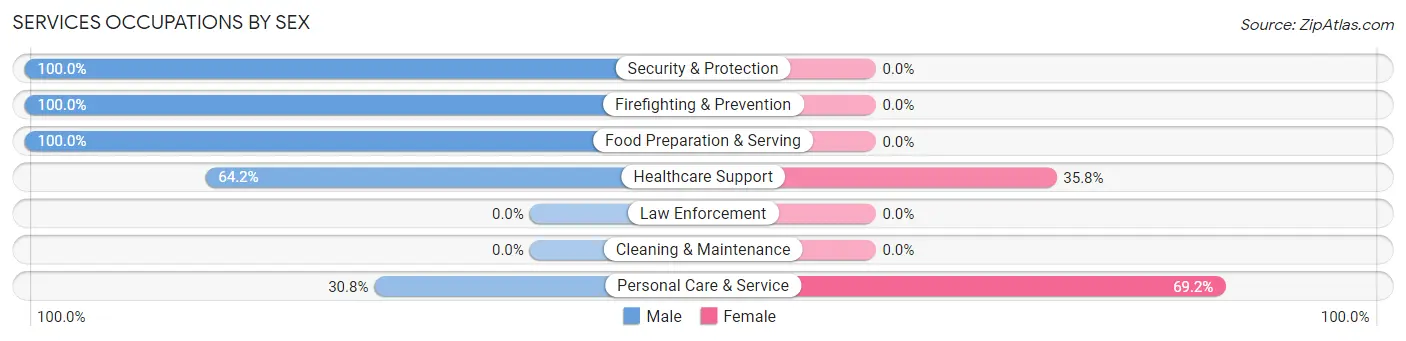
Services Occupations by Sex
Within the Services occupations in Eldorado at Santa Fe, the most male-oriented occupations are Security & Protection (100.0%), Firefighting & Prevention (100.0%), and Food Preparation & Serving (100.0%), while the most female-oriented occupations are Personal Care & Service (69.2%), and Healthcare Support (35.8%).
| Occupation | Male | Female |
| Healthcare Support | 52 (64.2%) | 29 (35.8%) |
| Security & Protection | 84 (100.0%) | 0 (0.0%) |
| Firefighting & Prevention | 84 (100.0%) | 0 (0.0%) |
| Law Enforcement | 0 (0.0%) | 0 (0.0%) |
| Food Preparation & Serving | 25 (100.0%) | 0 (0.0%) |
| Cleaning & Maintenance | 0 (0.0%) | 0 (0.0%) |
| Personal Care & Service | 4 (30.8%) | 9 (69.2%) |
| Total (Category) | 165 (81.3%) | 38 (18.7%) |
| Total (Overall) | 1,350 (52.6%) | 1,216 (47.4%) |
Sales and Office Occupations
The most common Sales and Office occupations in Eldorado at Santa Fe are Sales & Related (242 | 9.4%), and Office & Administration (145 | 5.7%).
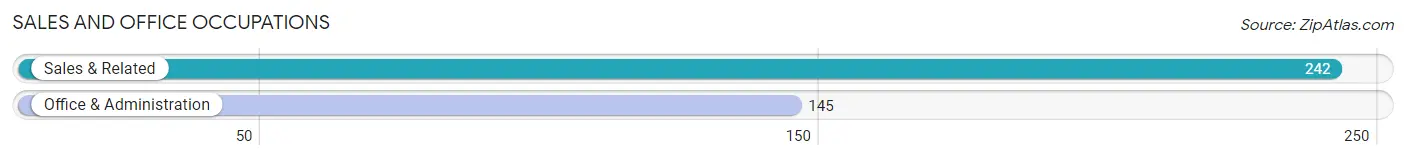
Sales and Office Occupations by Sex
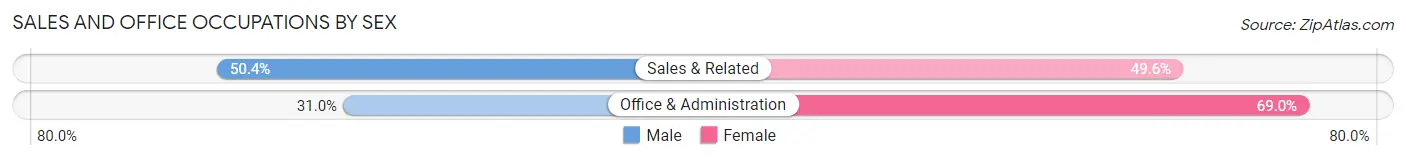
| Occupation | Male | Female |
| Sales & Related | 122 (50.4%) | 120 (49.6%) |
| Office & Administration | 45 (31.0%) | 100 (69.0%) |
| Total (Category) | 167 (43.1%) | 220 (56.9%) |
| Total (Overall) | 1,350 (52.6%) | 1,216 (47.4%) |
Natural Resources, Construction and Maintenance Occupations
The most common Natural Resources, Construction and Maintenance occupations in Eldorado at Santa Fe are Installation, Maintenance & Repair (93 | 3.6%), Construction & Extraction (32 | 1.3%), and Farming, Fishing & Forestry (8 | 0.3%).
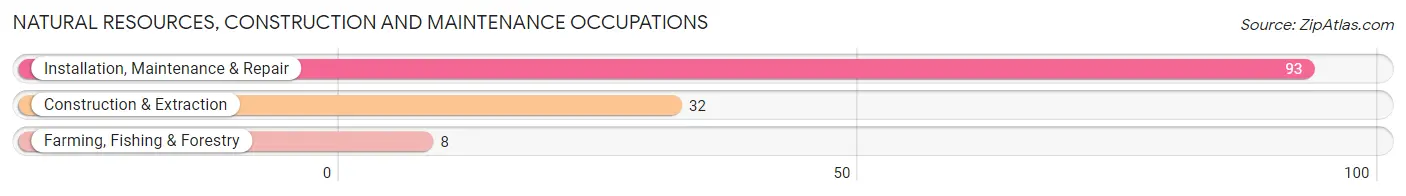
Natural Resources, Construction and Maintenance Occupations by Sex
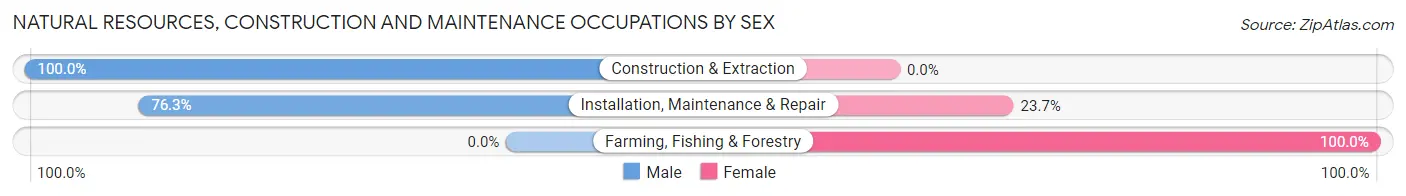
| Occupation | Male | Female |
| Farming, Fishing & Forestry | 0 (0.0%) | 8 (100.0%) |
| Construction & Extraction | 32 (100.0%) | 0 (0.0%) |
| Installation, Maintenance & Repair | 71 (76.3%) | 22 (23.7%) |
| Total (Category) | 103 (77.4%) | 30 (22.6%) |
| Total (Overall) | 1,350 (52.6%) | 1,216 (47.4%) |
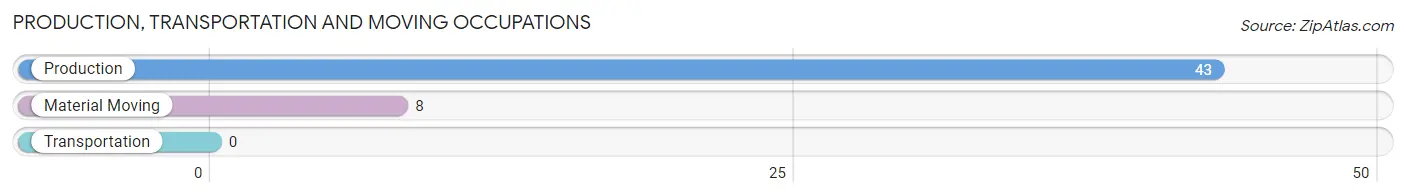
Production, Transportation and Moving Occupations
The most common Production, Transportation and Moving occupations in Eldorado at Santa Fe are Production (43 | 1.7%), and Material Moving (8 | 0.3%).
Production, Transportation and Moving Occupations by Sex
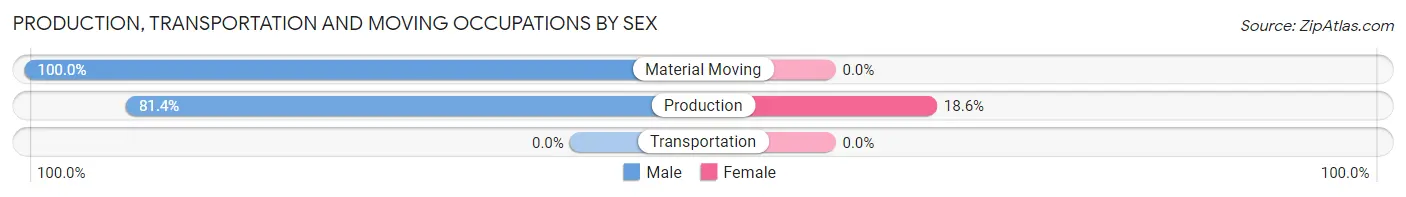
| Occupation | Male | Female |
| Production | 35 (81.4%) | 8 (18.6%) |
| Transportation | 0 (0.0%) | 0 (0.0%) |
| Material Moving | 8 (100.0%) | 0 (0.0%) |
| Total (Category) | 43 (84.3%) | 8 (15.7%) |
| Total (Overall) | 1,350 (52.6%) | 1,216 (47.4%) |
Employment Industries by Sex in Eldorado at Santa Fe
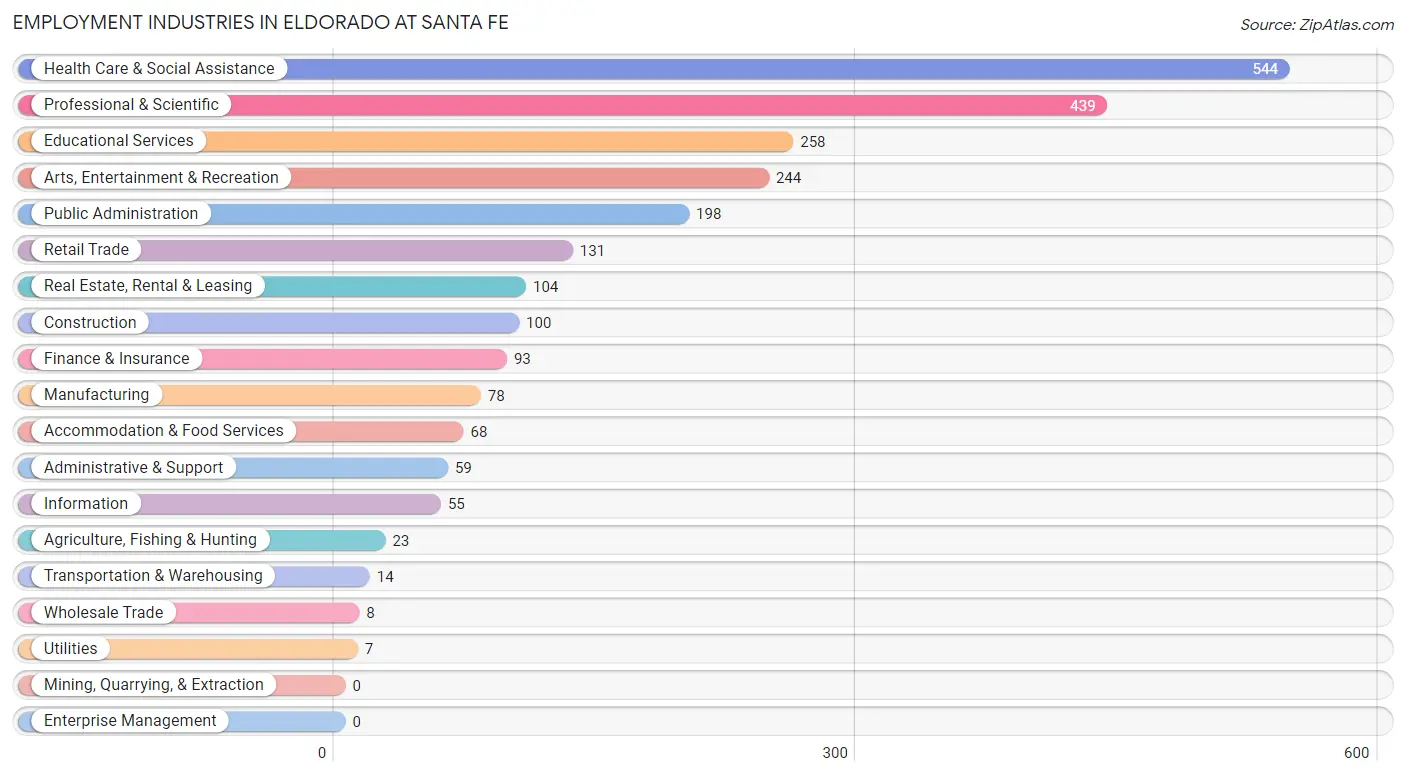
Employment Industries in Eldorado at Santa Fe
The major employment industries in Eldorado at Santa Fe include Health Care & Social Assistance (544 | 21.2%), Professional & Scientific (439 | 17.1%), Educational Services (258 | 10.1%), Arts, Entertainment & Recreation (244 | 9.5%), and Public Administration (198 | 7.7%).
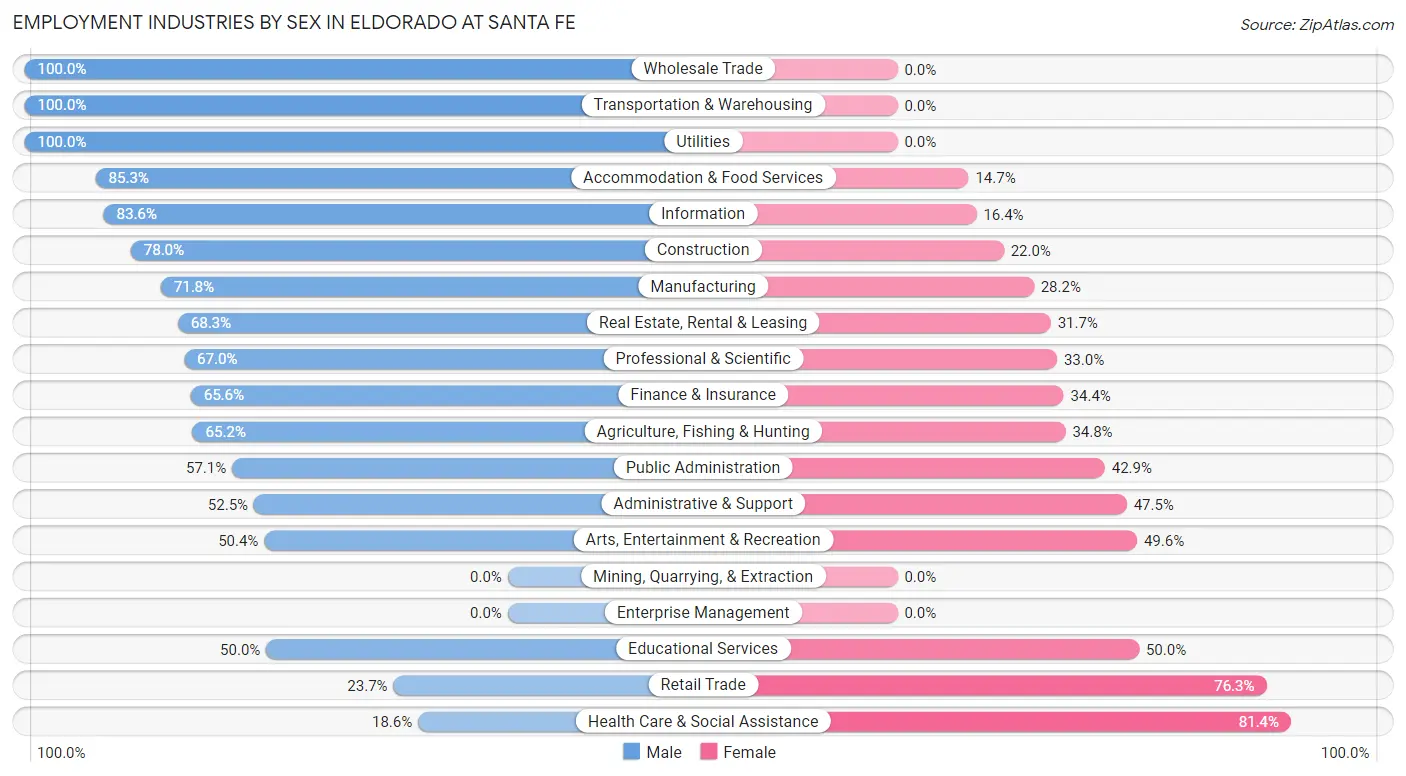
Employment Industries by Sex in Eldorado at Santa Fe
The Eldorado at Santa Fe industries that see more men than women are Wholesale Trade (100.0%), Transportation & Warehousing (100.0%), and Utilities (100.0%), whereas the industries that tend to have a higher number of women are Health Care & Social Assistance (81.4%), Retail Trade (76.3%), and Educational Services (50.0%).
| Industry | Male | Female |
| Agriculture, Fishing & Hunting | 15 (65.2%) | 8 (34.8%) |
| Mining, Quarrying, & Extraction | 0 (0.0%) | 0 (0.0%) |
| Construction | 78 (78.0%) | 22 (22.0%) |
| Manufacturing | 56 (71.8%) | 22 (28.2%) |
| Wholesale Trade | 8 (100.0%) | 0 (0.0%) |
| Retail Trade | 31 (23.7%) | 100 (76.3%) |
| Transportation & Warehousing | 14 (100.0%) | 0 (0.0%) |
| Utilities | 7 (100.0%) | 0 (0.0%) |
| Information | 46 (83.6%) | 9 (16.4%) |
| Finance & Insurance | 61 (65.6%) | 32 (34.4%) |
| Real Estate, Rental & Leasing | 71 (68.3%) | 33 (31.7%) |
| Professional & Scientific | 294 (67.0%) | 145 (33.0%) |
| Enterprise Management | 0 (0.0%) | 0 (0.0%) |
| Administrative & Support | 31 (52.5%) | 28 (47.5%) |
| Educational Services | 129 (50.0%) | 129 (50.0%) |
| Health Care & Social Assistance | 101 (18.6%) | 443 (81.4%) |
| Arts, Entertainment & Recreation | 123 (50.4%) | 121 (49.6%) |
| Accommodation & Food Services | 58 (85.3%) | 10 (14.7%) |
| Public Administration | 113 (57.1%) | 85 (42.9%) |
| Total | 1,350 (52.6%) | 1,216 (47.4%) |
Education in Eldorado at Santa Fe
School Enrollment in Eldorado at Santa Fe
The most common levels of schooling among the 671 students in Eldorado at Santa Fe are middle school (250 | 37.3%), high school (167 | 24.9%), and college / undergraduate (112 | 16.7%).
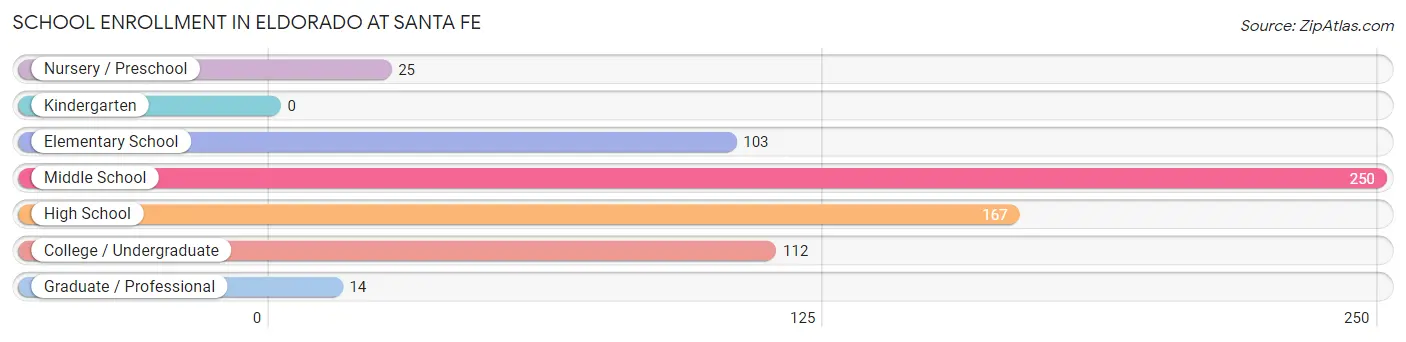
| School Level | # Students | % Students |
| Nursery / Preschool | 25 | 3.7% |
| Kindergarten | 0 | 0.0% |
| Elementary School | 103 | 15.3% |
| Middle School | 250 | 37.3% |
| High School | 167 | 24.9% |
| College / Undergraduate | 112 | 16.7% |
| Graduate / Professional | 14 | 2.1% |
| Total | 671 | 100.0% |
School Enrollment by Age by Funding Source in Eldorado at Santa Fe
Out of a total of 671 students who are enrolled in schools in Eldorado at Santa Fe, 73 (10.9%) attend a private institution, while the remaining 598 (89.1%) are enrolled in public schools. The age group of 25 to 34 year olds has the highest likelihood of being enrolled in private schools, with 11 (100.0% in the age bracket) enrolled. Conversely, the age group of 5 to 9 year old has the lowest likelihood of being enrolled in a private school, with 93 (100.0% in the age bracket) attending a public institution.
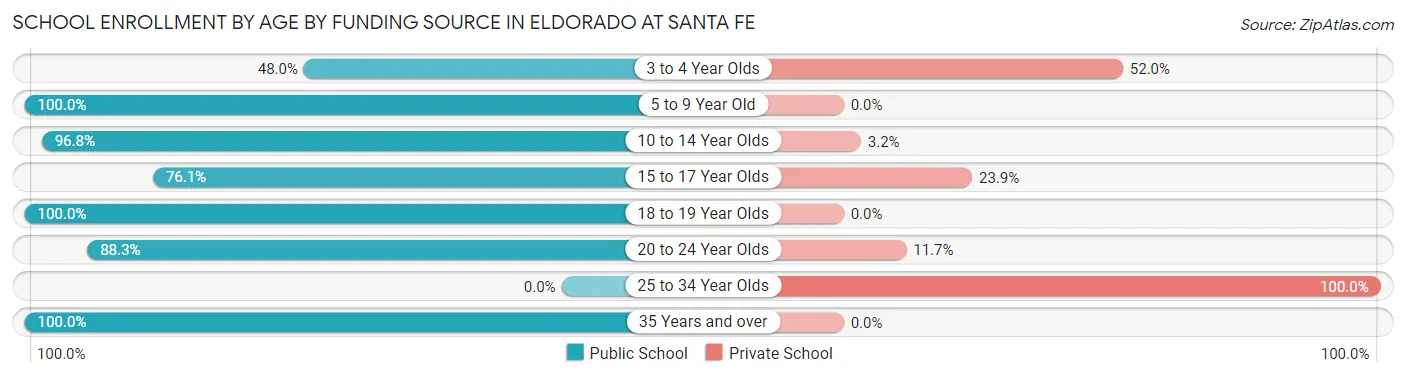
| Age Bracket | Public School | Private School |
| 3 to 4 Year Olds | 12 (48.0%) | 13 (52.0%) |
| 5 to 9 Year Old | 93 (100.0%) | 0 (0.0%) |
| 10 to 14 Year Olds | 272 (96.8%) | 9 (3.2%) |
| 15 to 17 Year Olds | 105 (76.1%) | 33 (23.9%) |
| 18 to 19 Year Olds | 8 (100.0%) | 0 (0.0%) |
| 20 to 24 Year Olds | 53 (88.3%) | 7 (11.7%) |
| 25 to 34 Year Olds | 0 (0.0%) | 11 (100.0%) |
| 35 Years and over | 55 (100.0%) | 0 (0.0%) |
| Total | 598 (89.1%) | 73 (10.9%) |
Educational Attainment by Field of Study in Eldorado at Santa Fe
Visual & performing arts (527 | 14.5%), social sciences (413 | 11.3%), science & technology (402 | 11.0%), education (326 | 8.9%), and psychology (295 | 8.1%) are the most common fields of study among 3,643 individuals in Eldorado at Santa Fe who have obtained a bachelor's degree or higher.
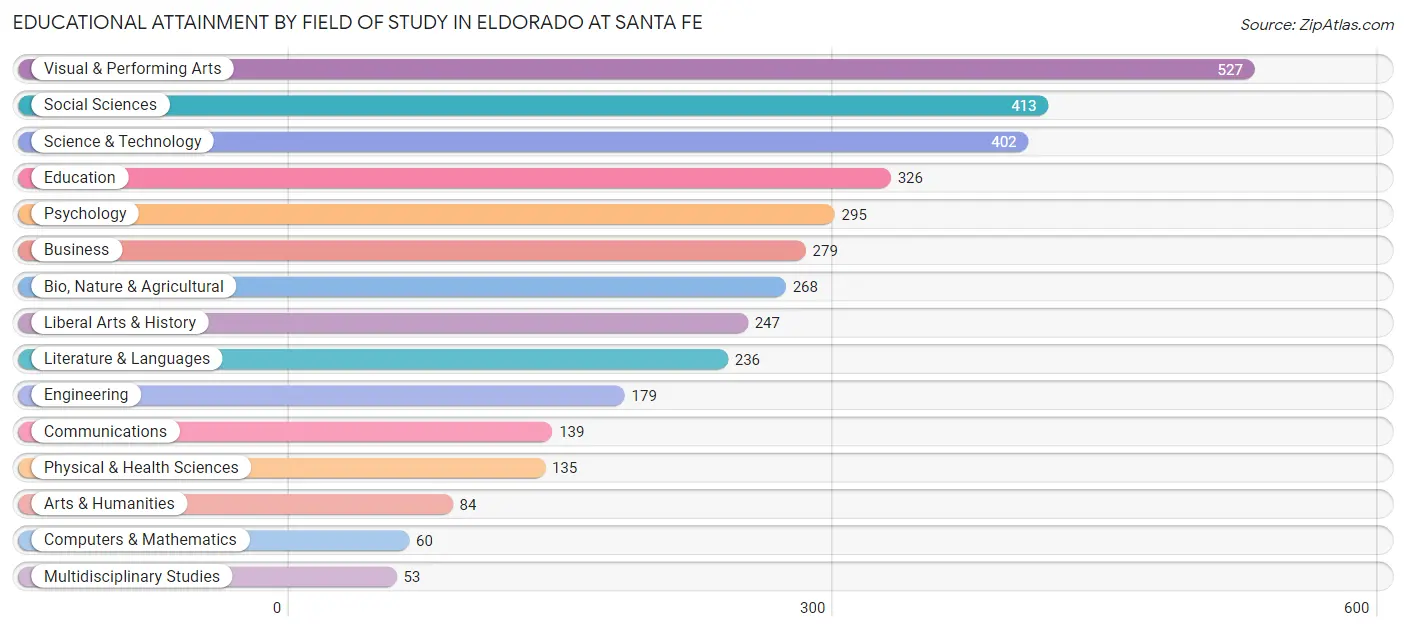
| Field of Study | # Graduates | % Graduates |
| Computers & Mathematics | 60 | 1.7% |
| Bio, Nature & Agricultural | 268 | 7.4% |
| Physical & Health Sciences | 135 | 3.7% |
| Psychology | 295 | 8.1% |
| Social Sciences | 413 | 11.3% |
| Engineering | 179 | 4.9% |
| Multidisciplinary Studies | 53 | 1.5% |
| Science & Technology | 402 | 11.0% |
| Business | 279 | 7.7% |
| Education | 326 | 8.9% |
| Literature & Languages | 236 | 6.5% |
| Liberal Arts & History | 247 | 6.8% |
| Visual & Performing Arts | 527 | 14.5% |
| Communications | 139 | 3.8% |
| Arts & Humanities | 84 | 2.3% |
| Total | 3,643 | 100.0% |
Transportation & Commute in Eldorado at Santa Fe
Vehicle Availability by Sex in Eldorado at Santa Fe
The most prevalent vehicle ownership categories in Eldorado at Santa Fe are males with 2 vehicles (867, accounting for 64.6%) and females with 2 vehicles (669, making up 73.7%).
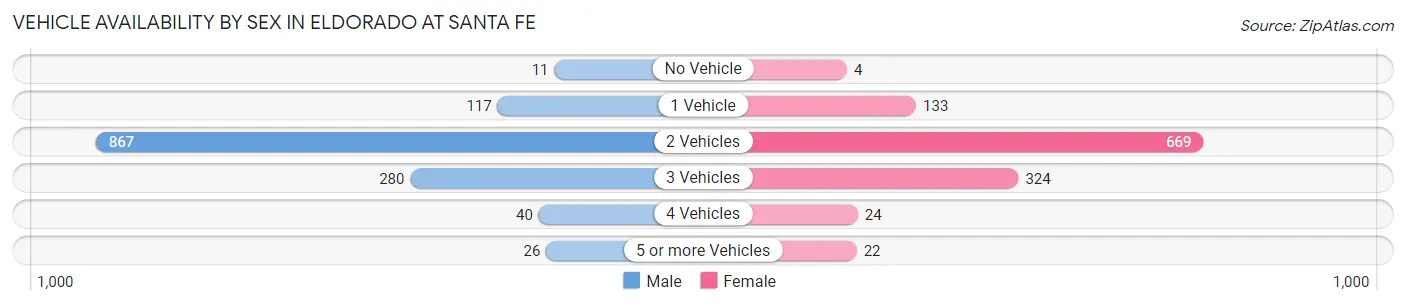
| Vehicles Available | Male | Female |
| No Vehicle | 11 (0.8%) | 4 (0.3%) |
| 1 Vehicle | 117 (8.7%) | 133 (11.3%) |
| 2 Vehicles | 867 (64.6%) | 669 (56.9%) |
| 3 Vehicles | 280 (20.9%) | 324 (27.6%) |
| 4 Vehicles | 40 (3.0%) | 24 (2.0%) |
| 5 or more Vehicles | 26 (1.9%) | 22 (1.9%) |
| Total | 1,341 (100.0%) | 1,176 (100.0%) |
Commute Time in Eldorado at Santa Fe
The most frequently occuring commute durations in Eldorado at Santa Fe are 20 to 24 minutes (561 commuters, 28.0%), 30 to 34 minutes (327 commuters, 16.3%), and 15 to 19 minutes (230 commuters, 11.5%).
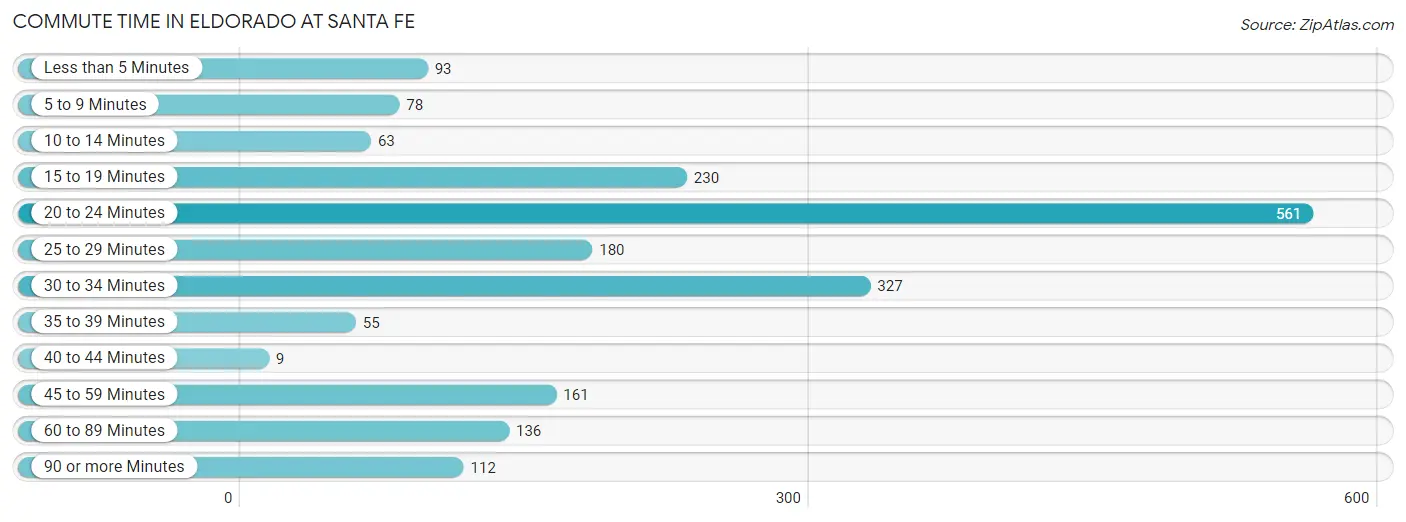
| Commute Time | # Commuters | % Commuters |
| Less than 5 Minutes | 93 | 4.6% |
| 5 to 9 Minutes | 78 | 3.9% |
| 10 to 14 Minutes | 63 | 3.1% |
| 15 to 19 Minutes | 230 | 11.5% |
| 20 to 24 Minutes | 561 | 28.0% |
| 25 to 29 Minutes | 180 | 9.0% |
| 30 to 34 Minutes | 327 | 16.3% |
| 35 to 39 Minutes | 55 | 2.7% |
| 40 to 44 Minutes | 9 | 0.4% |
| 45 to 59 Minutes | 161 | 8.0% |
| 60 to 89 Minutes | 136 | 6.8% |
| 90 or more Minutes | 112 | 5.6% |
Commute Time by Sex in Eldorado at Santa Fe
The most common commute times in Eldorado at Santa Fe are 20 to 24 minutes (236 commuters, 22.1%) for males and 20 to 24 minutes (325 commuters, 34.7%) for females.
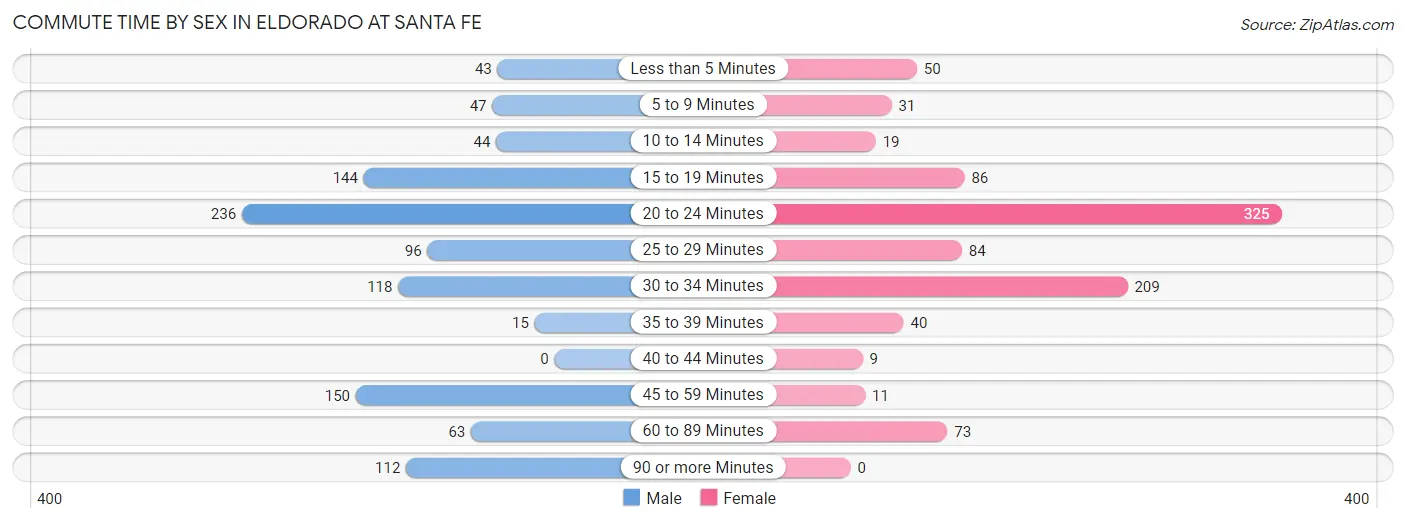
| Commute Time | Male | Female |
| Less than 5 Minutes | 43 (4.0%) | 50 (5.3%) |
| 5 to 9 Minutes | 47 (4.4%) | 31 (3.3%) |
| 10 to 14 Minutes | 44 (4.1%) | 19 (2.0%) |
| 15 to 19 Minutes | 144 (13.5%) | 86 (9.2%) |
| 20 to 24 Minutes | 236 (22.1%) | 325 (34.7%) |
| 25 to 29 Minutes | 96 (9.0%) | 84 (9.0%) |
| 30 to 34 Minutes | 118 (11.1%) | 209 (22.3%) |
| 35 to 39 Minutes | 15 (1.4%) | 40 (4.3%) |
| 40 to 44 Minutes | 0 (0.0%) | 9 (1.0%) |
| 45 to 59 Minutes | 150 (14.0%) | 11 (1.2%) |
| 60 to 89 Minutes | 63 (5.9%) | 73 (7.8%) |
| 90 or more Minutes | 112 (10.5%) | 0 (0.0%) |
Time of Departure to Work by Sex in Eldorado at Santa Fe
The most frequent times of departure to work in Eldorado at Santa Fe are 7:30 AM to 7:59 AM (269, 25.2%) for males and 7:00 AM to 7:29 AM (220, 23.5%) for females.
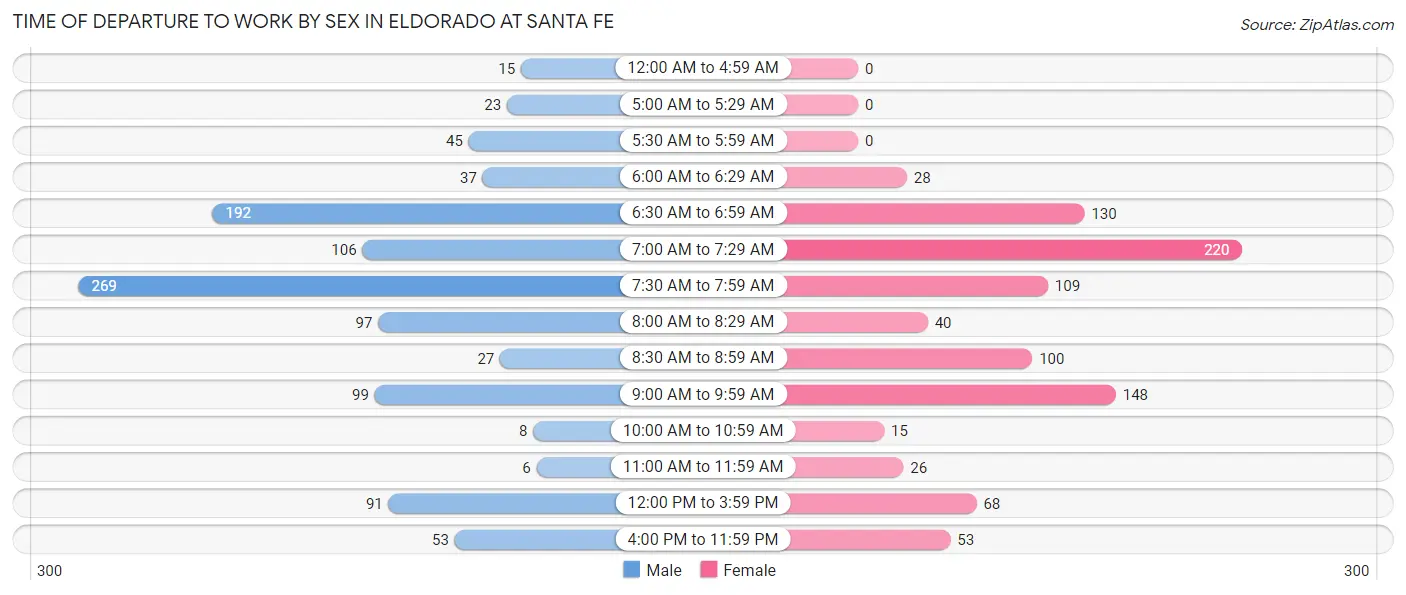
| Time of Departure | Male | Female |
| 12:00 AM to 4:59 AM | 15 (1.4%) | 0 (0.0%) |
| 5:00 AM to 5:29 AM | 23 (2.1%) | 0 (0.0%) |
| 5:30 AM to 5:59 AM | 45 (4.2%) | 0 (0.0%) |
| 6:00 AM to 6:29 AM | 37 (3.5%) | 28 (3.0%) |
| 6:30 AM to 6:59 AM | 192 (18.0%) | 130 (13.9%) |
| 7:00 AM to 7:29 AM | 106 (9.9%) | 220 (23.5%) |
| 7:30 AM to 7:59 AM | 269 (25.2%) | 109 (11.6%) |
| 8:00 AM to 8:29 AM | 97 (9.1%) | 40 (4.3%) |
| 8:30 AM to 8:59 AM | 27 (2.5%) | 100 (10.7%) |
| 9:00 AM to 9:59 AM | 99 (9.3%) | 148 (15.8%) |
| 10:00 AM to 10:59 AM | 8 (0.7%) | 15 (1.6%) |
| 11:00 AM to 11:59 AM | 6 (0.6%) | 26 (2.8%) |
| 12:00 PM to 3:59 PM | 91 (8.5%) | 68 (7.3%) |
| 4:00 PM to 11:59 PM | 53 (5.0%) | 53 (5.7%) |
| Total | 1,068 (100.0%) | 937 (100.0%) |
Housing Occupancy in Eldorado at Santa Fe
Occupancy by Ownership in Eldorado at Santa Fe
Of the total 2,629 dwellings in Eldorado at Santa Fe, owner-occupied units account for 2,501 (95.1%), while renter-occupied units make up 128 (4.9%).
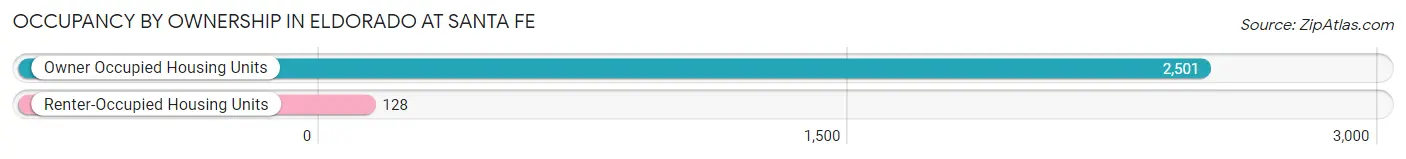
| Occupancy | # Housing Units | % Housing Units |
| Owner Occupied Housing Units | 2,501 | 95.1% |
| Renter-Occupied Housing Units | 128 | 4.9% |
| Total Occupied Housing Units | 2,629 | 100.0% |
Occupancy by Household Size in Eldorado at Santa Fe
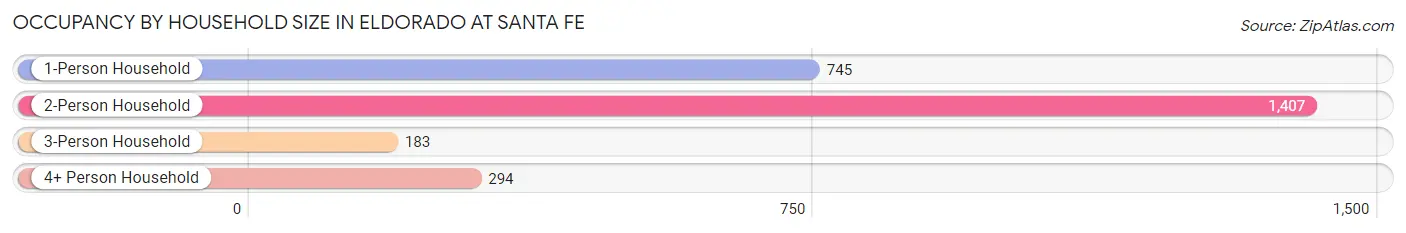
| Household Size | # Housing Units | % Housing Units |
| 1-Person Household | 745 | 28.3% |
| 2-Person Household | 1,407 | 53.5% |
| 3-Person Household | 183 | 7.0% |
| 4+ Person Household | 294 | 11.2% |
| Total Housing Units | 2,629 | 100.0% |
Occupancy by Ownership by Household Size in Eldorado at Santa Fe
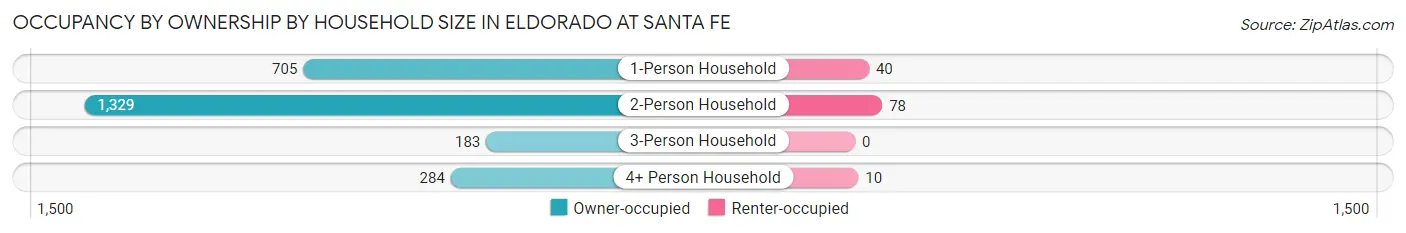
| Household Size | Owner-occupied | Renter-occupied |
| 1-Person Household | 705 (94.6%) | 40 (5.4%) |
| 2-Person Household | 1,329 (94.5%) | 78 (5.5%) |
| 3-Person Household | 183 (100.0%) | 0 (0.0%) |
| 4+ Person Household | 284 (96.6%) | 10 (3.4%) |
| Total Housing Units | 2,501 (95.1%) | 128 (4.9%) |
Occupancy by Educational Attainment in Eldorado at Santa Fe
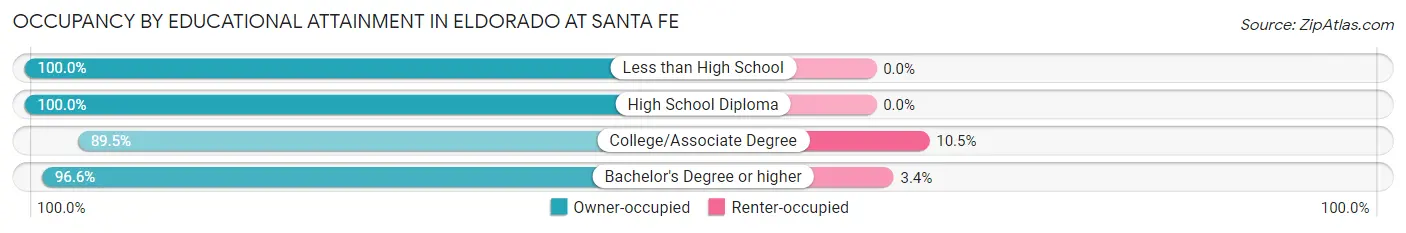
| Household Size | Owner-occupied | Renter-occupied |
| Less than High School | 7 (100.0%) | 0 (0.0%) |
| High School Diploma | 116 (100.0%) | 0 (0.0%) |
| College/Associate Degree | 527 (89.5%) | 62 (10.5%) |
| Bachelor's Degree or higher | 1,851 (96.6%) | 66 (3.4%) |
Occupancy by Age of Householder in Eldorado at Santa Fe
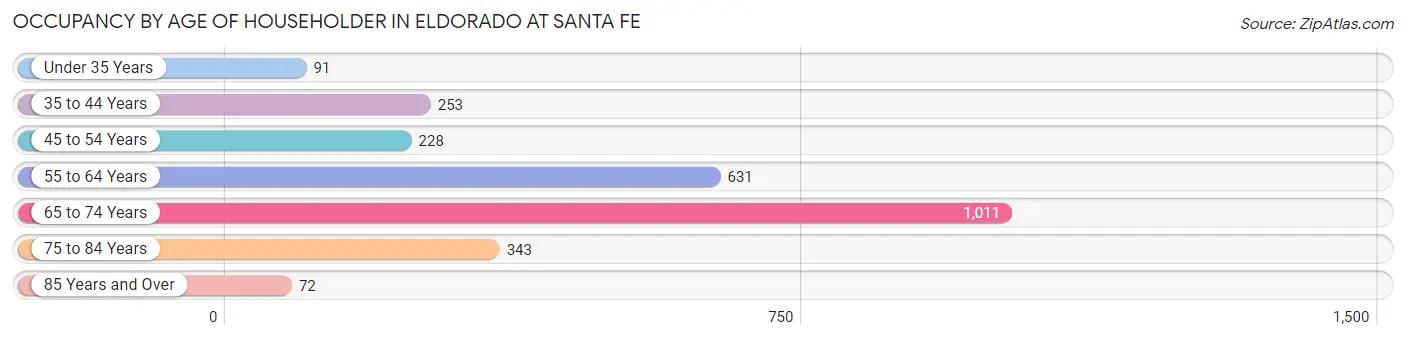
| Age Bracket | # Households | % Households |
| Under 35 Years | 91 | 3.5% |
| 35 to 44 Years | 253 | 9.6% |
| 45 to 54 Years | 228 | 8.7% |
| 55 to 64 Years | 631 | 24.0% |
| 65 to 74 Years | 1,011 | 38.5% |
| 75 to 84 Years | 343 | 13.1% |
| 85 Years and Over | 72 | 2.7% |
| Total | 2,629 | 100.0% |
Housing Finances in Eldorado at Santa Fe
Median Income by Occupancy in Eldorado at Santa Fe
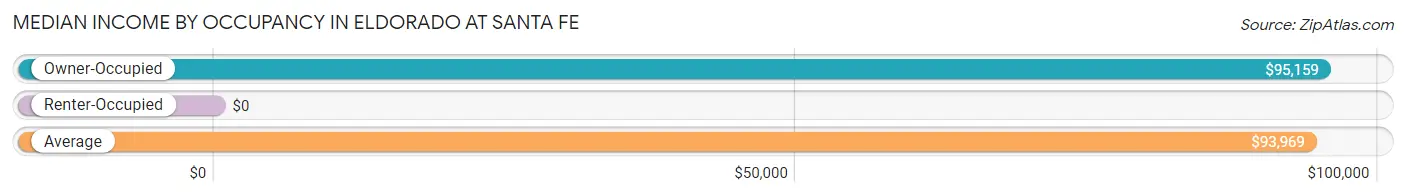
| Occupancy Type | # Households | Median Income |
| Owner-Occupied | 2,501 (95.1%) | $95,159 |
| Renter-Occupied | 128 (4.9%) | $0 |
| Average | 2,629 (100.0%) | $93,969 |
Occupancy by Householder Income Bracket in Eldorado at Santa Fe
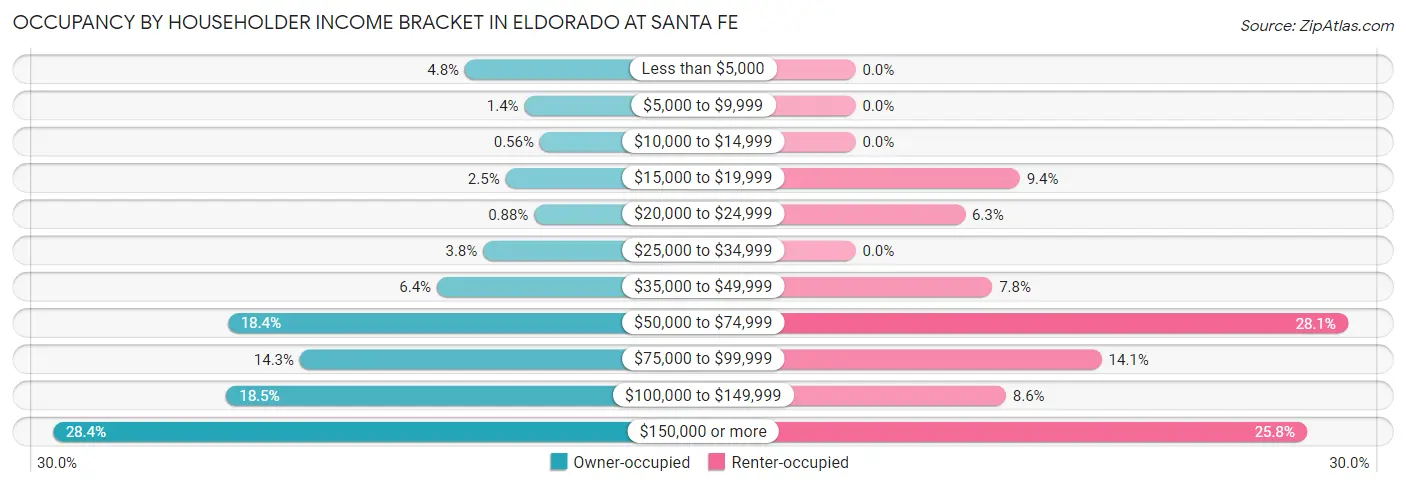
| Income Bracket | Owner-occupied | Renter-occupied |
| Less than $5,000 | 121 (4.8%) | 0 (0.0%) |
| $5,000 to $9,999 | 36 (1.4%) | 0 (0.0%) |
| $10,000 to $14,999 | 14 (0.6%) | 0 (0.0%) |
| $15,000 to $19,999 | 63 (2.5%) | 12 (9.4%) |
| $20,000 to $24,999 | 22 (0.9%) | 8 (6.2%) |
| $25,000 to $34,999 | 95 (3.8%) | 0 (0.0%) |
| $35,000 to $49,999 | 161 (6.4%) | 10 (7.8%) |
| $50,000 to $74,999 | 460 (18.4%) | 36 (28.1%) |
| $75,000 to $99,999 | 357 (14.3%) | 18 (14.1%) |
| $100,000 to $149,999 | 462 (18.5%) | 11 (8.6%) |
| $150,000 or more | 710 (28.4%) | 33 (25.8%) |
| Total | 2,501 (100.0%) | 128 (100.0%) |
Monthly Housing Cost Tiers in Eldorado at Santa Fe
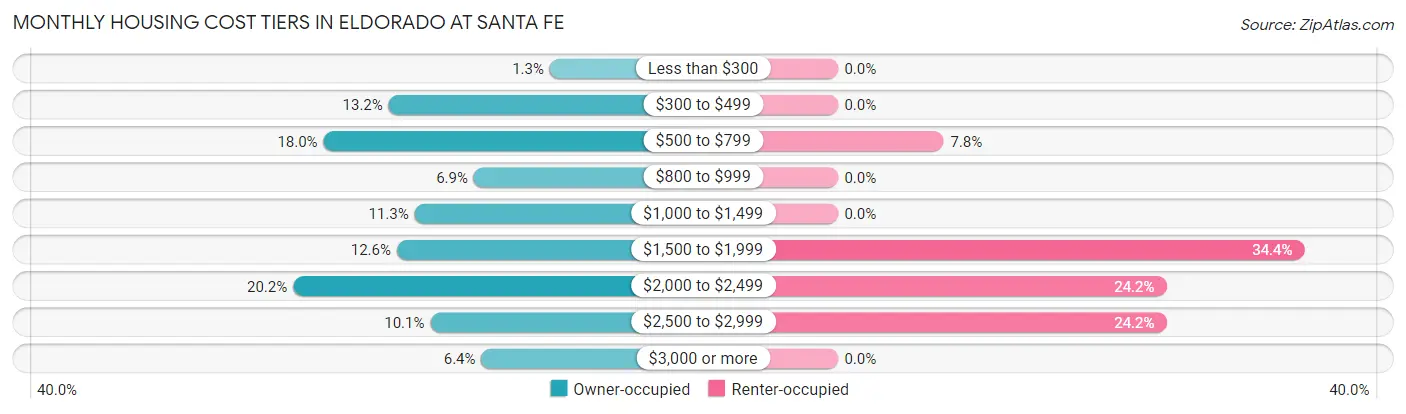
| Monthly Cost | Owner-occupied | Renter-occupied |
| Less than $300 | 33 (1.3%) | 0 (0.0%) |
| $300 to $499 | 330 (13.2%) | 0 (0.0%) |
| $500 to $799 | 450 (18.0%) | 10 (7.8%) |
| $800 to $999 | 173 (6.9%) | 0 (0.0%) |
| $1,000 to $1,499 | 282 (11.3%) | 0 (0.0%) |
| $1,500 to $1,999 | 315 (12.6%) | 44 (34.4%) |
| $2,000 to $2,499 | 506 (20.2%) | 31 (24.2%) |
| $2,500 to $2,999 | 253 (10.1%) | 31 (24.2%) |
| $3,000 or more | 159 (6.4%) | 0 (0.0%) |
| Total | 2,501 (100.0%) | 128 (100.0%) |
Physical Housing Characteristics in Eldorado at Santa Fe
Housing Structures in Eldorado at Santa Fe
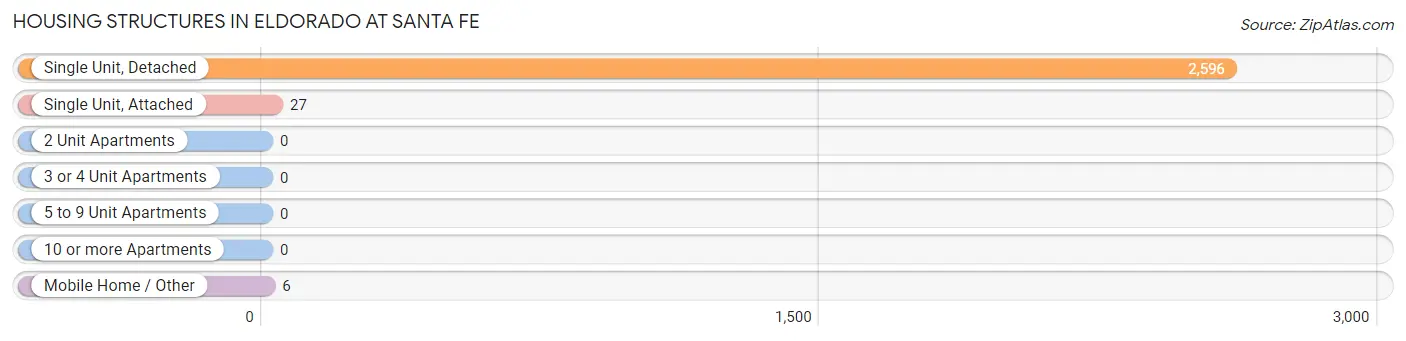
| Structure Type | # Housing Units | % Housing Units |
| Single Unit, Detached | 2,596 | 98.7% |
| Single Unit, Attached | 27 | 1.0% |
| 2 Unit Apartments | 0 | 0.0% |
| 3 or 4 Unit Apartments | 0 | 0.0% |
| 5 to 9 Unit Apartments | 0 | 0.0% |
| 10 or more Apartments | 0 | 0.0% |
| Mobile Home / Other | 6 | 0.2% |
| Total | 2,629 | 100.0% |
Housing Structures by Occupancy in Eldorado at Santa Fe
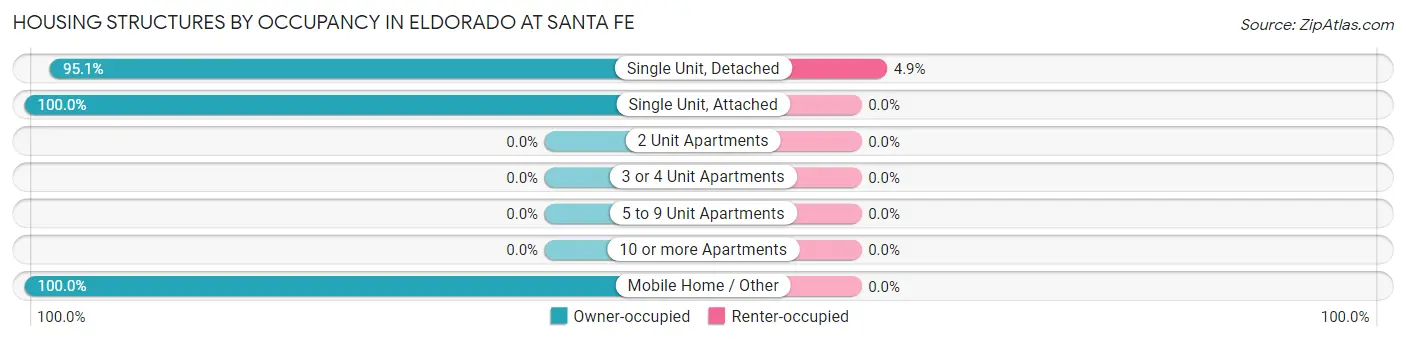
| Structure Type | Owner-occupied | Renter-occupied |
| Single Unit, Detached | 2,468 (95.1%) | 128 (4.9%) |
| Single Unit, Attached | 27 (100.0%) | 0 (0.0%) |
| 2 Unit Apartments | 0 (0.0%) | 0 (0.0%) |
| 3 or 4 Unit Apartments | 0 (0.0%) | 0 (0.0%) |
| 5 to 9 Unit Apartments | 0 (0.0%) | 0 (0.0%) |
| 10 or more Apartments | 0 (0.0%) | 0 (0.0%) |
| Mobile Home / Other | 6 (100.0%) | 0 (0.0%) |
| Total | 2,501 (95.1%) | 128 (4.9%) |
Housing Structures by Number of Rooms in Eldorado at Santa Fe
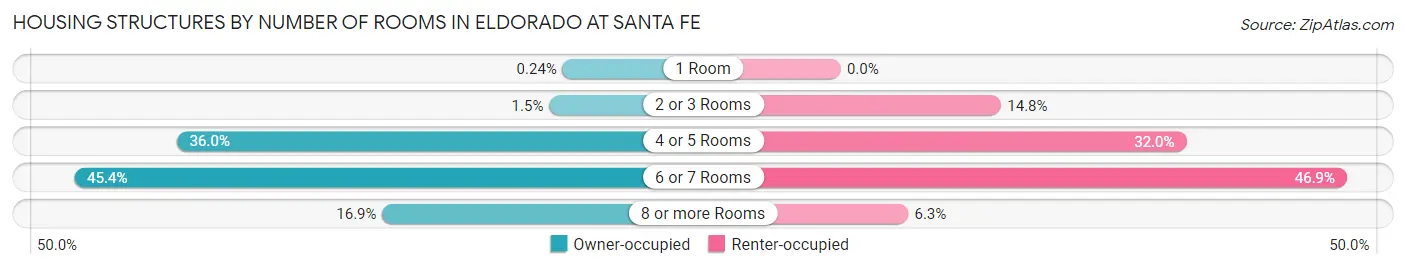
| Number of Rooms | Owner-occupied | Renter-occupied |
| 1 Room | 6 (0.2%) | 0 (0.0%) |
| 2 or 3 Rooms | 37 (1.5%) | 19 (14.8%) |
| 4 or 5 Rooms | 899 (35.9%) | 41 (32.0%) |
| 6 or 7 Rooms | 1,136 (45.4%) | 60 (46.9%) |
| 8 or more Rooms | 423 (16.9%) | 8 (6.2%) |
| Total | 2,501 (100.0%) | 128 (100.0%) |
Housing Structure by Heating Type in Eldorado at Santa Fe
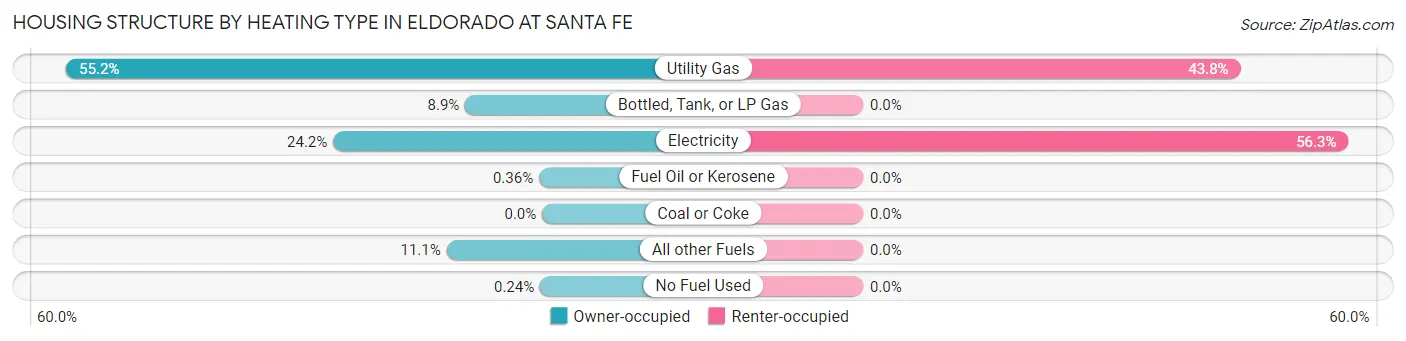
| Heating Type | Owner-occupied | Renter-occupied |
| Utility Gas | 1,380 (55.2%) | 56 (43.8%) |
| Bottled, Tank, or LP Gas | 223 (8.9%) | 0 (0.0%) |
| Electricity | 606 (24.2%) | 72 (56.2%) |
| Fuel Oil or Kerosene | 9 (0.4%) | 0 (0.0%) |
| Coal or Coke | 0 (0.0%) | 0 (0.0%) |
| All other Fuels | 277 (11.1%) | 0 (0.0%) |
| No Fuel Used | 6 (0.2%) | 0 (0.0%) |
| Total | 2,501 (100.0%) | 128 (100.0%) |
Household Vehicle Usage in Eldorado at Santa Fe
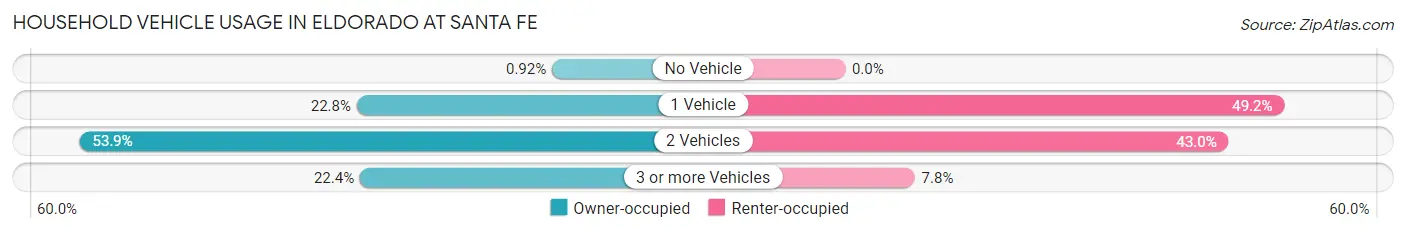
| Vehicles per Household | Owner-occupied | Renter-occupied |
| No Vehicle | 23 (0.9%) | 0 (0.0%) |
| 1 Vehicle | 570 (22.8%) | 63 (49.2%) |
| 2 Vehicles | 1,347 (53.9%) | 55 (43.0%) |
| 3 or more Vehicles | 561 (22.4%) | 10 (7.8%) |
| Total | 2,501 (100.0%) | 128 (100.0%) |
Real Estate & Mortgages in Eldorado at Santa Fe
Real Estate and Mortgage Overview in Eldorado at Santa Fe
| Characteristic | Without Mortgage | With Mortgage |
| Housing Units | 883 | 1,618 |
| Median Property Value | $478,400 | $487,600 |
| Median Household Income | $74,081 | $569 |
| Monthly Housing Costs | $547 | $159 |
| Real Estate Taxes | $2,703 | $48 |
Property Value by Mortgage Status in Eldorado at Santa Fe
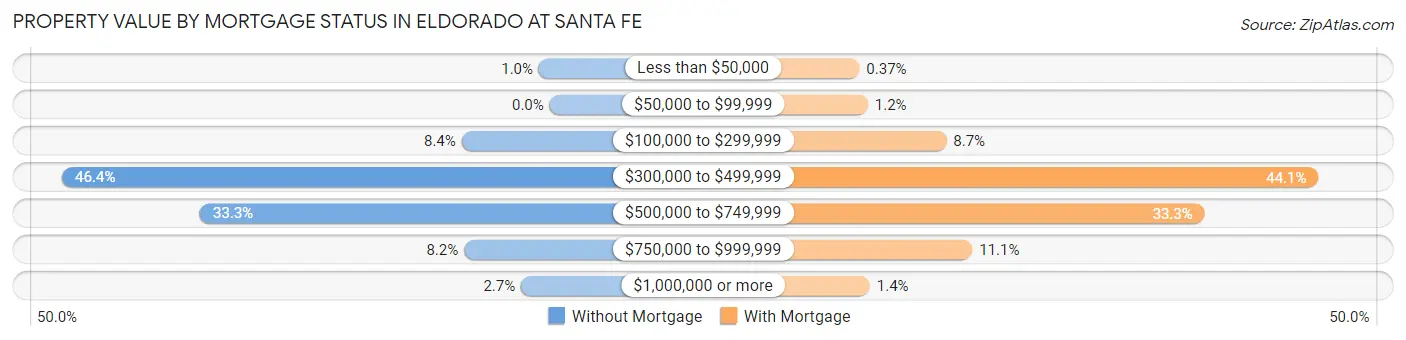
| Property Value | Without Mortgage | With Mortgage |
| Less than $50,000 | 9 (1.0%) | 6 (0.4%) |
| $50,000 to $99,999 | 0 (0.0%) | 19 (1.2%) |
| $100,000 to $299,999 | 74 (8.4%) | 140 (8.6%) |
| $300,000 to $499,999 | 410 (46.4%) | 713 (44.1%) |
| $500,000 to $749,999 | 294 (33.3%) | 538 (33.3%) |
| $750,000 to $999,999 | 72 (8.2%) | 180 (11.1%) |
| $1,000,000 or more | 24 (2.7%) | 22 (1.4%) |
| Total | 883 (100.0%) | 1,618 (100.0%) |
Household Income by Mortgage Status in Eldorado at Santa Fe
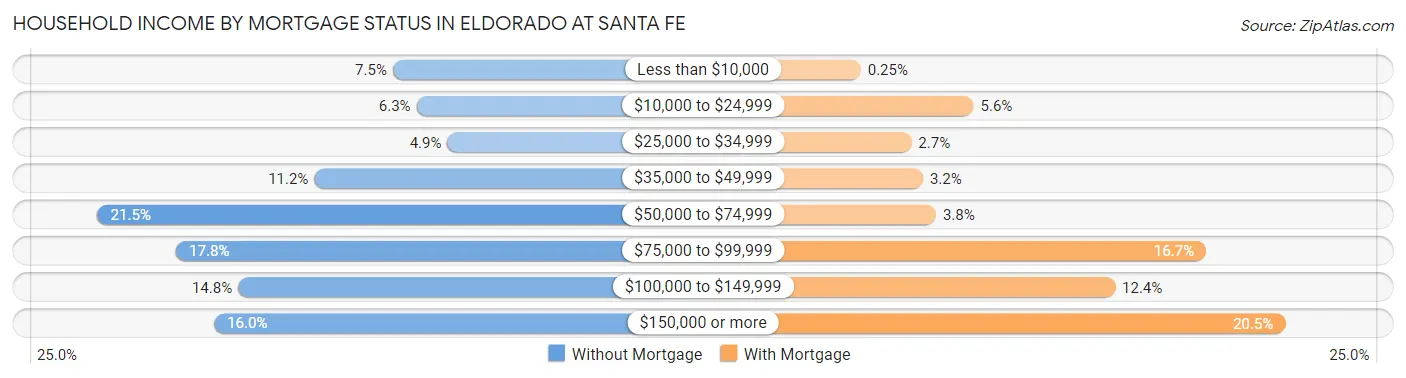
| Household Income | Without Mortgage | With Mortgage |
| Less than $10,000 | 66 (7.5%) | 4 (0.3%) |
| $10,000 to $24,999 | 56 (6.3%) | 91 (5.6%) |
| $25,000 to $34,999 | 43 (4.9%) | 43 (2.7%) |
| $35,000 to $49,999 | 99 (11.2%) | 52 (3.2%) |
| $50,000 to $74,999 | 190 (21.5%) | 62 (3.8%) |
| $75,000 to $99,999 | 157 (17.8%) | 270 (16.7%) |
| $100,000 to $149,999 | 131 (14.8%) | 200 (12.4%) |
| $150,000 or more | 141 (16.0%) | 331 (20.5%) |
| Total | 883 (100.0%) | 1,618 (100.0%) |
Property Value to Household Income Ratio in Eldorado at Santa Fe
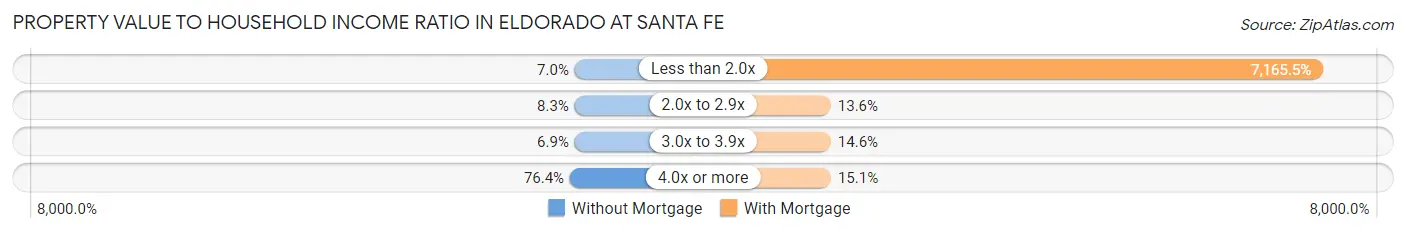
| Value-to-Income Ratio | Without Mortgage | With Mortgage |
| Less than 2.0x | 62 (7.0%) | 115,938 (7,165.5%) |
| 2.0x to 2.9x | 73 (8.3%) | 220 (13.6%) |
| 3.0x to 3.9x | 61 (6.9%) | 236 (14.6%) |
| 4.0x or more | 675 (76.4%) | 244 (15.1%) |
| Total | 883 (100.0%) | 1,618 (100.0%) |
Real Estate Taxes by Mortgage Status in Eldorado at Santa Fe
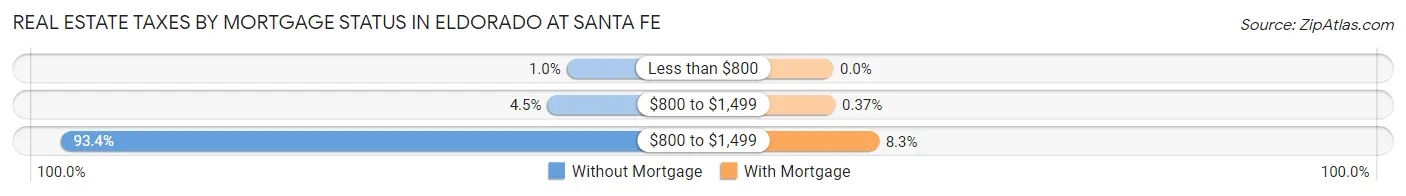
| Property Taxes | Without Mortgage | With Mortgage |
| Less than $800 | 9 (1.0%) | 0 (0.0%) |
| $800 to $1,499 | 40 (4.5%) | 6 (0.4%) |
| $800 to $1,499 | 825 (93.4%) | 135 (8.3%) |
| Total | 883 (100.0%) | 1,618 (100.0%) |
Health & Disability in Eldorado at Santa Fe
Health Insurance Coverage by Age in Eldorado at Santa Fe
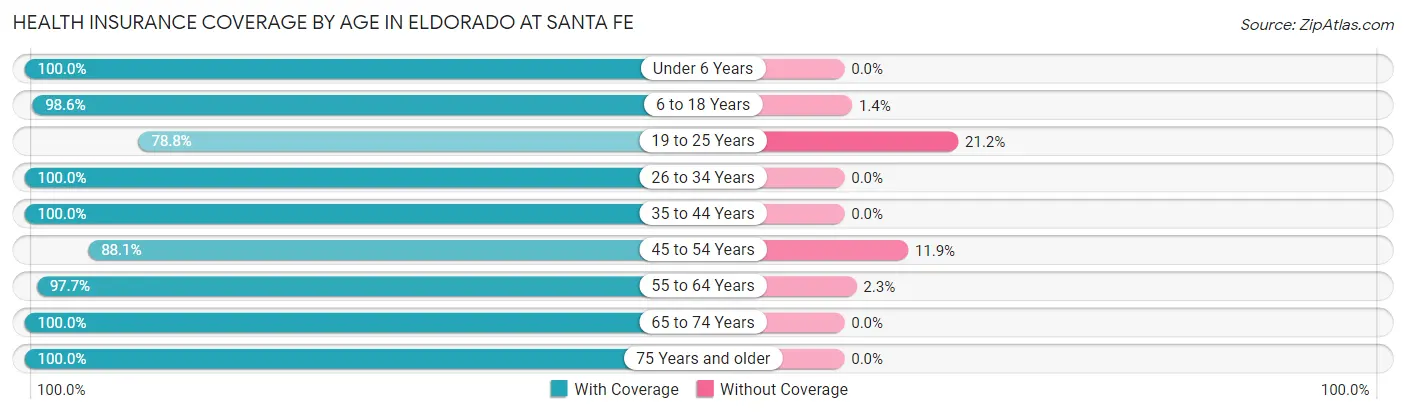
| Age Bracket | With Coverage | Without Coverage |
| Under 6 Years | 25 (100.0%) | 0 (0.0%) |
| 6 to 18 Years | 551 (98.6%) | 8 (1.4%) |
| 19 to 25 Years | 115 (78.8%) | 31 (21.2%) |
| 26 to 34 Years | 195 (100.0%) | 0 (0.0%) |
| 35 to 44 Years | 428 (100.0%) | 0 (0.0%) |
| 45 to 54 Years | 475 (88.1%) | 64 (11.9%) |
| 55 to 64 Years | 1,126 (97.7%) | 26 (2.3%) |
| 65 to 74 Years | 1,698 (100.0%) | 0 (0.0%) |
| 75 Years and older | 729 (100.0%) | 0 (0.0%) |
| Total | 5,342 (97.6%) | 129 (2.4%) |
Health Insurance Coverage by Citizenship Status in Eldorado at Santa Fe
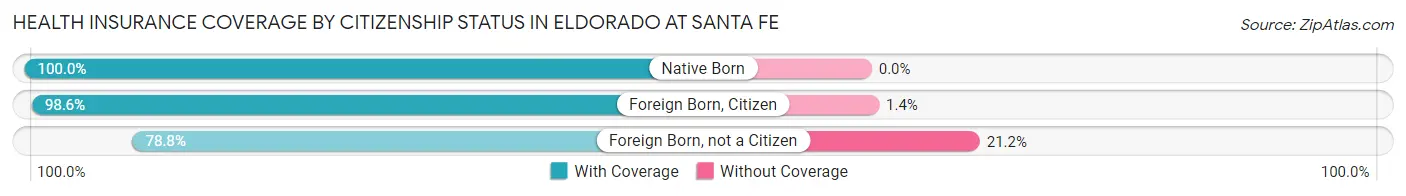
| Citizenship Status | With Coverage | Without Coverage |
| Native Born | 25 (100.0%) | 0 (0.0%) |
| Foreign Born, Citizen | 551 (98.6%) | 8 (1.4%) |
| Foreign Born, not a Citizen | 115 (78.8%) | 31 (21.2%) |
Health Insurance Coverage by Household Income in Eldorado at Santa Fe
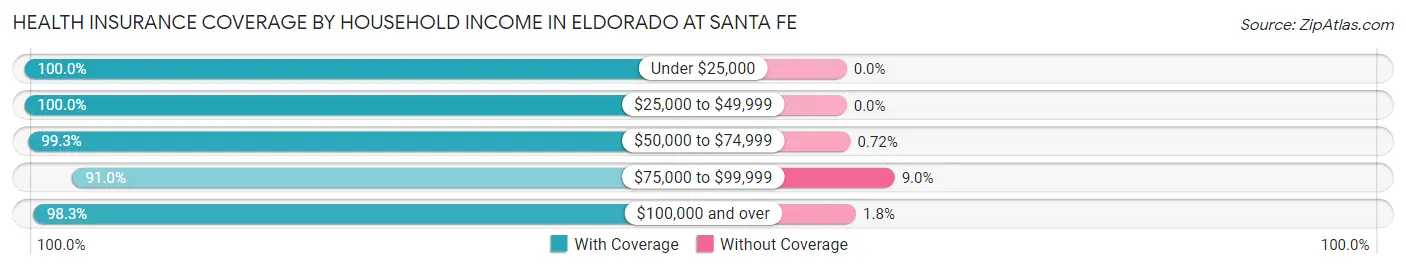
| Household Income | With Coverage | Without Coverage |
| Under $25,000 | 335 (100.0%) | 0 (0.0%) |
| $25,000 to $49,999 | 453 (100.0%) | 0 (0.0%) |
| $50,000 to $74,999 | 966 (99.3%) | 7 (0.7%) |
| $75,000 to $99,999 | 720 (91.0%) | 71 (9.0%) |
| $100,000 and over | 2,868 (98.3%) | 51 (1.8%) |
Public vs Private Health Insurance Coverage by Age in Eldorado at Santa Fe
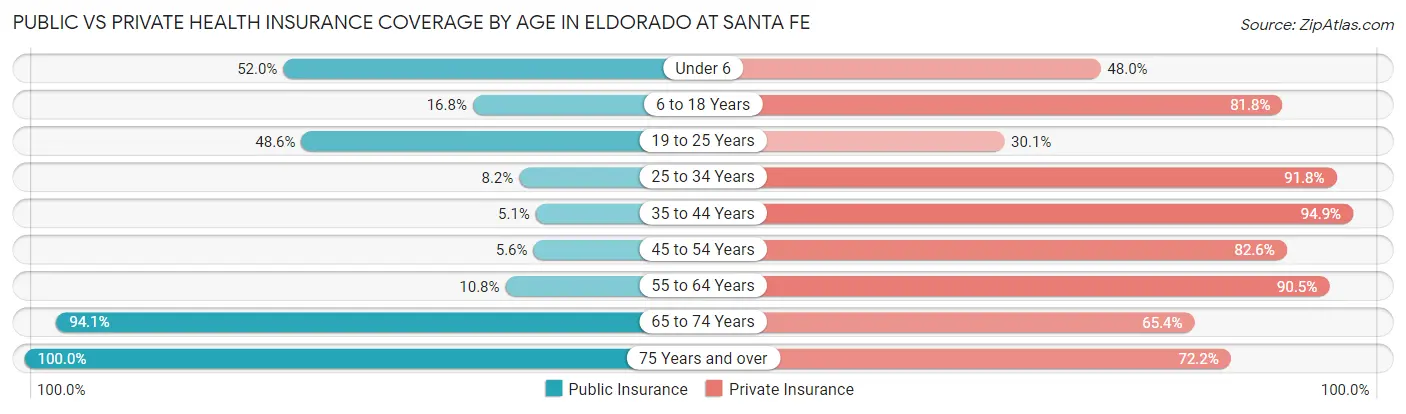
| Age Bracket | Public Insurance | Private Insurance |
| Under 6 | 13 (52.0%) | 12 (48.0%) |
| 6 to 18 Years | 94 (16.8%) | 457 (81.8%) |
| 19 to 25 Years | 71 (48.6%) | 44 (30.1%) |
| 25 to 34 Years | 16 (8.2%) | 179 (91.8%) |
| 35 to 44 Years | 22 (5.1%) | 406 (94.9%) |
| 45 to 54 Years | 30 (5.6%) | 445 (82.6%) |
| 55 to 64 Years | 124 (10.8%) | 1,042 (90.4%) |
| 65 to 74 Years | 1,598 (94.1%) | 1,111 (65.4%) |
| 75 Years and over | 729 (100.0%) | 526 (72.2%) |
| Total | 2,697 (49.3%) | 4,222 (77.2%) |
Disability Status by Sex by Age in Eldorado at Santa Fe
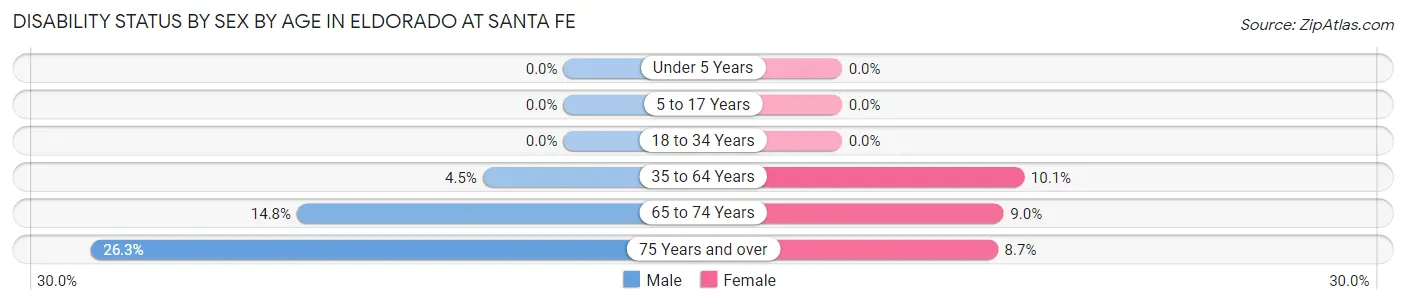
| Age Bracket | Male | Female |
| Under 5 Years | 0 (0.0%) | 0 (0.0%) |
| 5 to 17 Years | 0 (0.0%) | 0 (0.0%) |
| 18 to 34 Years | 0 (0.0%) | 0 (0.0%) |
| 35 to 64 Years | 42 (4.5%) | 120 (10.1%) |
| 65 to 74 Years | 130 (14.8%) | 74 (9.0%) |
| 75 Years and over | 98 (26.3%) | 31 (8.7%) |
Disability Class by Sex by Age in Eldorado at Santa Fe
Disability Class: Hearing Difficulty
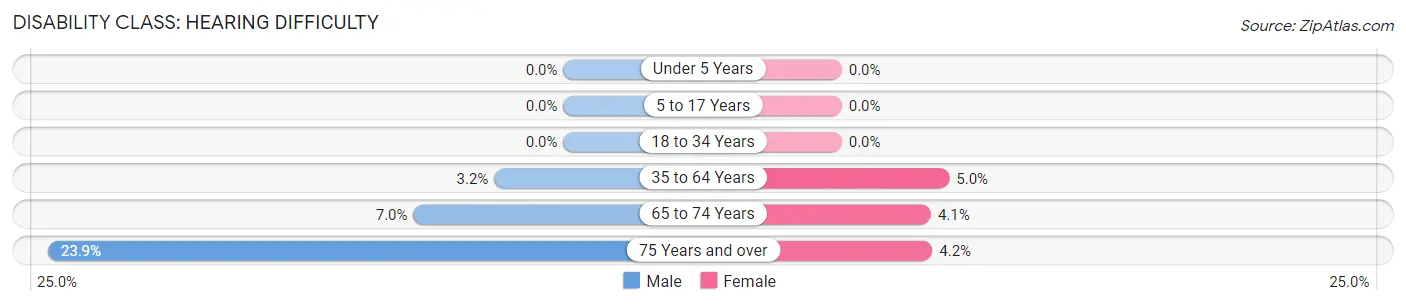
| Age Bracket | Male | Female |
| Under 5 Years | 0 (0.0%) | 0 (0.0%) |
| 5 to 17 Years | 0 (0.0%) | 0 (0.0%) |
| 18 to 34 Years | 0 (0.0%) | 0 (0.0%) |
| 35 to 64 Years | 30 (3.2%) | 59 (5.0%) |
| 65 to 74 Years | 61 (7.0%) | 34 (4.1%) |
| 75 Years and over | 89 (23.9%) | 15 (4.2%) |
Disability Class: Vision Difficulty
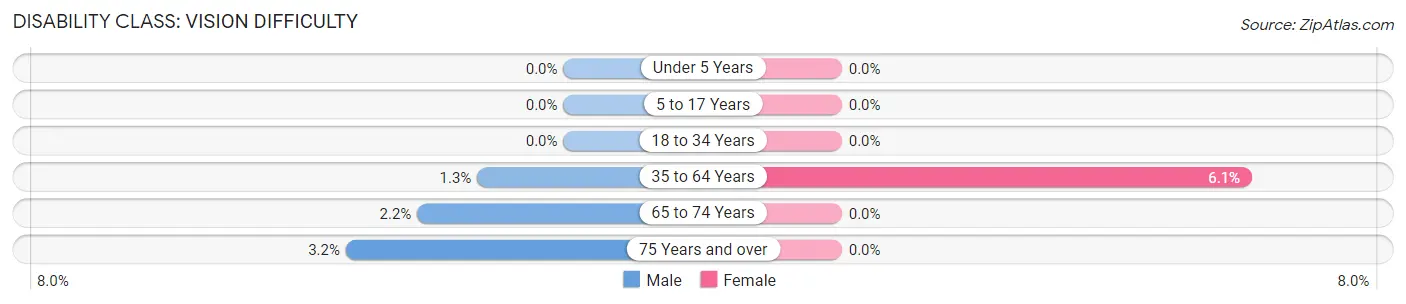
| Age Bracket | Male | Female |
| Under 5 Years | 0 (0.0%) | 0 (0.0%) |
| 5 to 17 Years | 0 (0.0%) | 0 (0.0%) |
| 18 to 34 Years | 0 (0.0%) | 0 (0.0%) |
| 35 to 64 Years | 12 (1.3%) | 72 (6.1%) |
| 65 to 74 Years | 19 (2.2%) | 0 (0.0%) |
| 75 Years and over | 12 (3.2%) | 0 (0.0%) |
Disability Class: Cognitive Difficulty
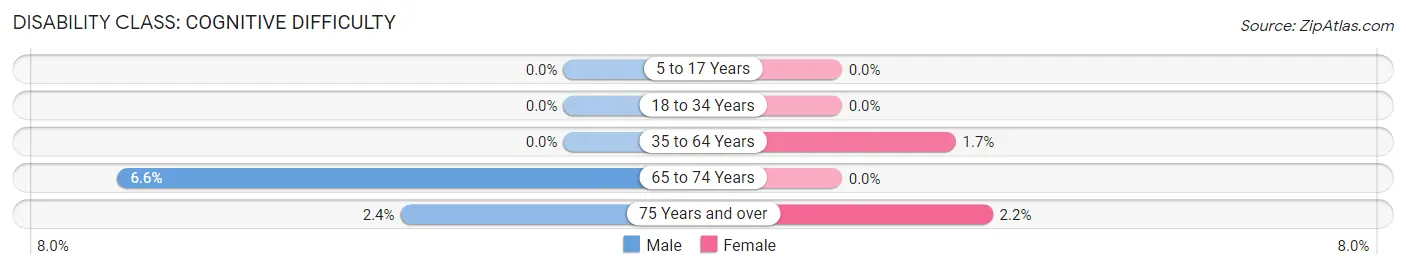
| Age Bracket | Male | Female |
| 5 to 17 Years | 0 (0.0%) | 0 (0.0%) |
| 18 to 34 Years | 0 (0.0%) | 0 (0.0%) |
| 35 to 64 Years | 0 (0.0%) | 20 (1.7%) |
| 65 to 74 Years | 58 (6.6%) | 0 (0.0%) |
| 75 Years and over | 9 (2.4%) | 8 (2.2%) |
Disability Class: Ambulatory Difficulty
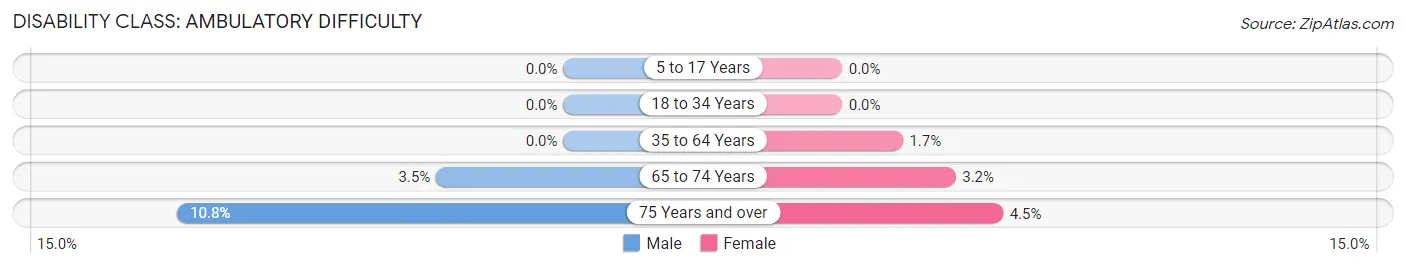
| Age Bracket | Male | Female |
| 5 to 17 Years | 0 (0.0%) | 0 (0.0%) |
| 18 to 34 Years | 0 (0.0%) | 0 (0.0%) |
| 35 to 64 Years | 0 (0.0%) | 20 (1.7%) |
| 65 to 74 Years | 31 (3.5%) | 26 (3.2%) |
| 75 Years and over | 40 (10.7%) | 16 (4.5%) |
Disability Class: Self-Care Difficulty
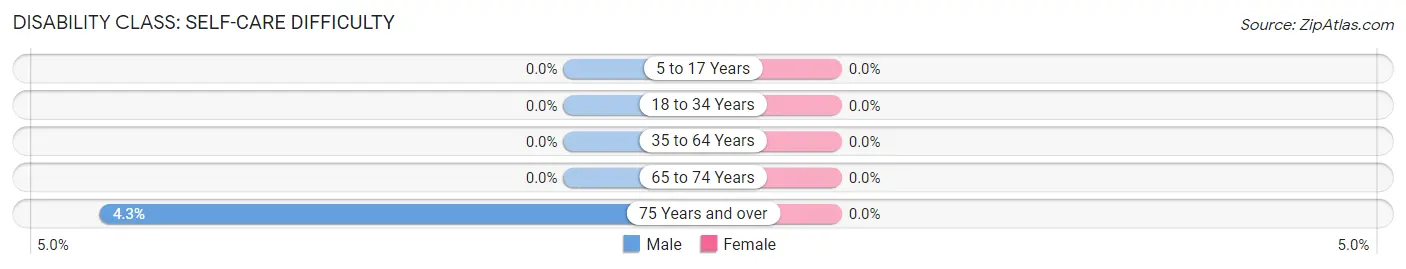
| Age Bracket | Male | Female |
| 5 to 17 Years | 0 (0.0%) | 0 (0.0%) |
| 18 to 34 Years | 0 (0.0%) | 0 (0.0%) |
| 35 to 64 Years | 0 (0.0%) | 0 (0.0%) |
| 65 to 74 Years | 0 (0.0%) | 0 (0.0%) |
| 75 Years and over | 16 (4.3%) | 0 (0.0%) |
Technology Access in Eldorado at Santa Fe
Computing Device Access in Eldorado at Santa Fe
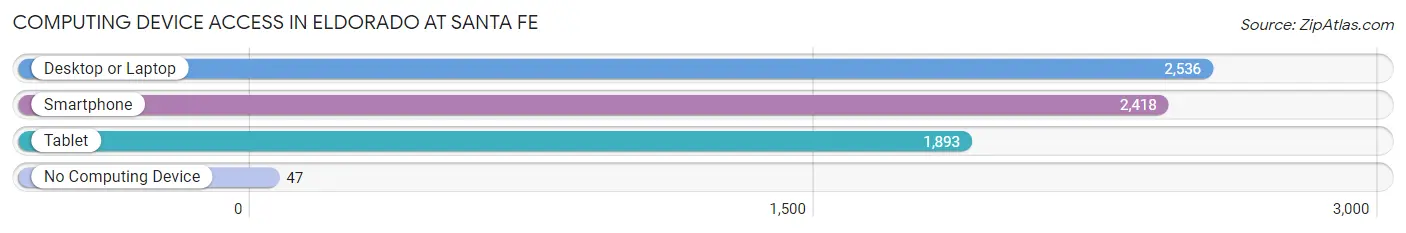
| Device Type | # Households | % Households |
| Desktop or Laptop | 2,536 | 96.5% |
| Smartphone | 2,418 | 92.0% |
| Tablet | 1,893 | 72.0% |
| No Computing Device | 47 | 1.8% |
| Total | 2,629 | 100.0% |
Internet Access in Eldorado at Santa Fe
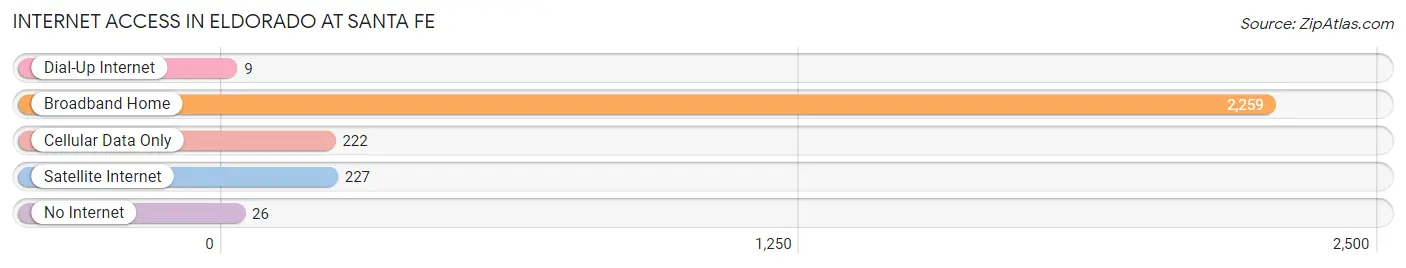
| Internet Type | # Households | % Households |
| Dial-Up Internet | 9 | 0.3% |
| Broadband Home | 2,259 | 85.9% |
| Cellular Data Only | 222 | 8.4% |
| Satellite Internet | 227 | 8.6% |
| No Internet | 26 | 1.0% |
| Total | 2,629 | 100.0% |
Eldorado at Santa Fe Summary
Eldorado at Santa Fe, New Mexico is a small, unincorporated community located in Santa Fe County, New Mexico. It is situated in the foothills of the Sangre de Cristo Mountains, approximately 15 miles south of Santa Fe. The community is home to a diverse population of approximately 1,500 people, and is known for its rural atmosphere and scenic beauty.
Geography
Eldorado at Santa Fe is located in the foothills of the Sangre de Cristo Mountains, approximately 15 miles south of Santa Fe. The community is situated at an elevation of 6,400 feet, and is surrounded by rolling hills and open meadows. The area is characterized by its dry climate, with temperatures ranging from the mid-30s in the winter to the mid-90s in the summer. The area receives an average of 12 inches of precipitation annually, with most of it falling in the form of snow during the winter months.
Economy
The economy of Eldorado at Santa Fe is largely based on tourism and agriculture. The area is home to several small businesses, including restaurants, shops, and galleries. The community is also home to a number of wineries, which produce a variety of wines from local grapes. The area is also known for its outdoor recreation opportunities, including hiking, biking, and horseback riding.
Demographics
As of the 2010 census, the population of Eldorado at Santa Fe was 1,521. The racial makeup of the community was 79.3% White, 0.7% African American, 0.7% Native American, 0.3% Asian, 0.1% Pacific Islander, 16.2% from other races, and 2.9% from two or more races. Hispanic or Latino of any race were 44.2% of the population.
The median household income in Eldorado at Santa Fe was $45,000, and the median family income was $50,000. The per capita income for the community was $20,000. About 11.3% of families and 14.2% of the population were below the poverty line, including 18.2% of those under age 18 and 8.3% of those age 65 or over.
Conclusion
Eldorado at Santa Fe is a small, unincorporated community located in Santa Fe County, New Mexico. It is situated in the foothills of the Sangre de Cristo Mountains, approximately 15 miles south of Santa Fe. The community is home to a diverse population of approximately 1,500 people, and is known for its rural atmosphere and scenic beauty. The economy of Eldorado at Santa Fe is largely based on tourism and agriculture, and the area is also known for its outdoor recreation opportunities. The racial makeup of the community is 79.3% White, 0.7% African American, 0.7% Native American, 0.3% Asian, 0.1% Pacific Islander, 16.2% from other races, and 2.9% from two or more races. The median household income in Eldorado at Santa Fe was $45,000, and the median family income was $50,000.
Common Questions
What is Per Capita Income in Eldorado at Santa Fe?
Per Capita income in Eldorado at Santa Fe is $60,721.
What is the Median Family Income in Eldorado at Santa Fe?
Median Family Income in Eldorado at Santa Fe is $121,816.
What is the Median Household income in Eldorado at Santa Fe?
Median Household Income in Eldorado at Santa Fe is $93,969.
What is Income or Wage Gap in Eldorado at Santa Fe?
Income or Wage Gap in Eldorado at Santa Fe is 22.4%.
Women in Eldorado at Santa Fe earn 77.6 cents for every dollar earned by a man.
What is Inequality or Gini Index in Eldorado at Santa Fe?
Inequality or Gini Index in Eldorado at Santa Fe is 0.43.
What is the Total Population of Eldorado at Santa Fe?
Total Population of Eldorado at Santa Fe is 5,471.
What is the Total Male Population of Eldorado at Santa Fe?
Total Male Population of Eldorado at Santa Fe is 2,708.
What is the Total Female Population of Eldorado at Santa Fe?
Total Female Population of Eldorado at Santa Fe is 2,763.
What is the Ratio of Males per 100 Females in Eldorado at Santa Fe?
There are 98.01 Males per 100 Females in Eldorado at Santa Fe.
What is the Ratio of Females per 100 Males in Eldorado at Santa Fe?
There are 102.03 Females per 100 Males in Eldorado at Santa Fe.
What is the Median Population Age in Eldorado at Santa Fe?
Median Population Age in Eldorado at Santa Fe is 62.2 Years.
What is the Average Family Size in Eldorado at Santa Fe
Average Family Size in Eldorado at Santa Fe is 2.5 People.
What is the Average Household Size in Eldorado at Santa Fe
Average Household Size in Eldorado at Santa Fe is 2.1 People.
How Large is the Labor Force in Eldorado at Santa Fe?
There are 2,649 People in the Labor Forcein in Eldorado at Santa Fe.
What is the Percentage of People in the Labor Force in Eldorado at Santa Fe?
53.2% of People are in the Labor Force in Eldorado at Santa Fe.
What is the Unemployment Rate in Eldorado at Santa Fe?
Unemployment Rate in Eldorado at Santa Fe is 3.1%.