Henryville, IN Map & Demographics
Henryville Map
Henryville Overview
$29,696
PER CAPITA INCOME
$84,015
AVG FAMILY INCOME
$72,768
AVG HOUSEHOLD INCOME
34.8%
WAGE / INCOME GAP [ % ]
65.2¢/ $1
WAGE / INCOME GAP [ $ ]
0.34
INEQUALITY / GINI INDEX
1,837
TOTAL POPULATION
870
MALE POPULATION
967
FEMALE POPULATION
89.97
MALES / 100 FEMALES
111.15
FEMALES / 100 MALES
36.3
MEDIAN AGE
3.2
AVG FAMILY SIZE
2.7
AVG HOUSEHOLD SIZE
979
LABOR FORCE [ PEOPLE ]
65.9%
PERCENT IN LABOR FORCE
1.2%
UNEMPLOYMENT RATE
Henryville Zip Codes
Henryville Area Codes
Income in Henryville
Income Overview in Henryville
Per Capita Income in Henryville is $29,696, while median incomes of families and households are $84,015 and $72,768 respectively.
| Characteristic | Number | Measure |
| Per Capita Income | 1,837 | $29,696 |
| Median Family Income | 476 | $84,015 |
| Mean Family Income | 476 | $89,201 |
| Median Household Income | 687 | $72,768 |
| Mean Household Income | 687 | $78,199 |
| Income Deficit | 476 | $0 |
| Wage / Income Gap (%) | 1,837 | 34.77% |
| Wage / Income Gap ($) | 1,837 | 65.23¢ per $1 |
| Gini / Inequality Index | 1,837 | 0.34 |
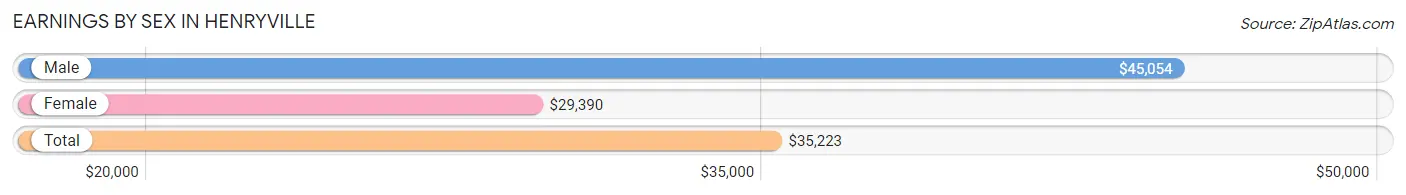
Earnings by Sex in Henryville
Average Earnings in Henryville are $35,223, $45,054 for men and $29,390 for women, a difference of 34.8%.
| Sex | Number | Average Earnings |
| Male | 501 (51.1%) | $45,054 |
| Female | 480 (48.9%) | $29,390 |
| Total | 981 (100.0%) | $35,223 |
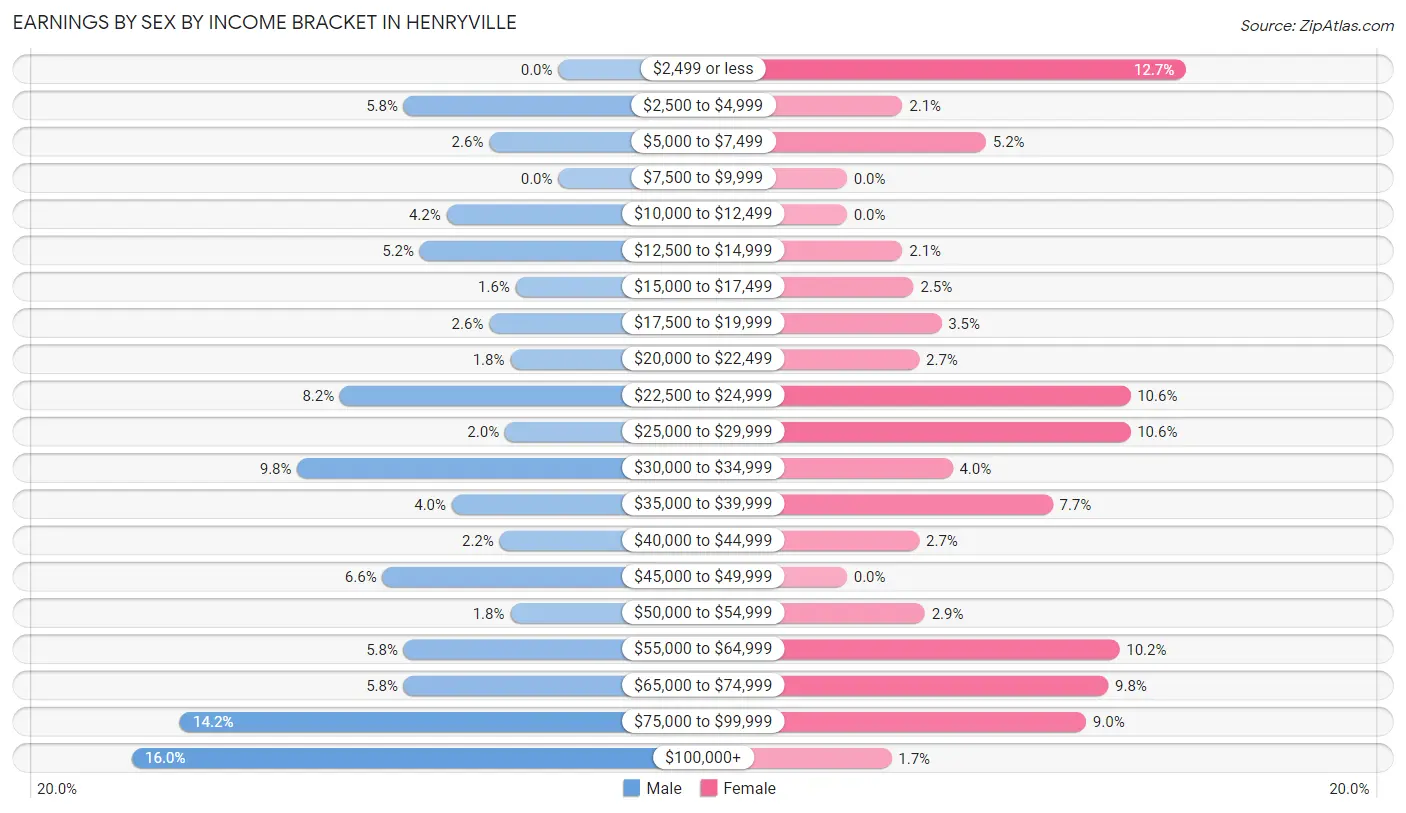
Earnings by Sex by Income Bracket in Henryville
The most common earnings brackets in Henryville are $100,000+ for men (80 | 16.0%) and $2,499 or less for women (61 | 12.7%).
| Income | Male | Female |
| $2,499 or less | 0 (0.0%) | 61 (12.7%) |
| $2,500 to $4,999 | 29 (5.8%) | 10 (2.1%) |
| $5,000 to $7,499 | 13 (2.6%) | 25 (5.2%) |
| $7,500 to $9,999 | 0 (0.0%) | 0 (0.0%) |
| $10,000 to $12,499 | 21 (4.2%) | 0 (0.0%) |
| $12,500 to $14,999 | 26 (5.2%) | 10 (2.1%) |
| $15,000 to $17,499 | 8 (1.6%) | 12 (2.5%) |
| $17,500 to $19,999 | 13 (2.6%) | 17 (3.5%) |
| $20,000 to $22,499 | 9 (1.8%) | 13 (2.7%) |
| $22,500 to $24,999 | 41 (8.2%) | 51 (10.6%) |
| $25,000 to $29,999 | 10 (2.0%) | 51 (10.6%) |
| $30,000 to $34,999 | 49 (9.8%) | 19 (4.0%) |
| $35,000 to $39,999 | 20 (4.0%) | 37 (7.7%) |
| $40,000 to $44,999 | 11 (2.2%) | 13 (2.7%) |
| $45,000 to $49,999 | 33 (6.6%) | 0 (0.0%) |
| $50,000 to $54,999 | 9 (1.8%) | 14 (2.9%) |
| $55,000 to $64,999 | 29 (5.8%) | 49 (10.2%) |
| $65,000 to $74,999 | 29 (5.8%) | 47 (9.8%) |
| $75,000 to $99,999 | 71 (14.2%) | 43 (9.0%) |
| $100,000+ | 80 (16.0%) | 8 (1.7%) |
| Total | 501 (100.0%) | 480 (100.0%) |
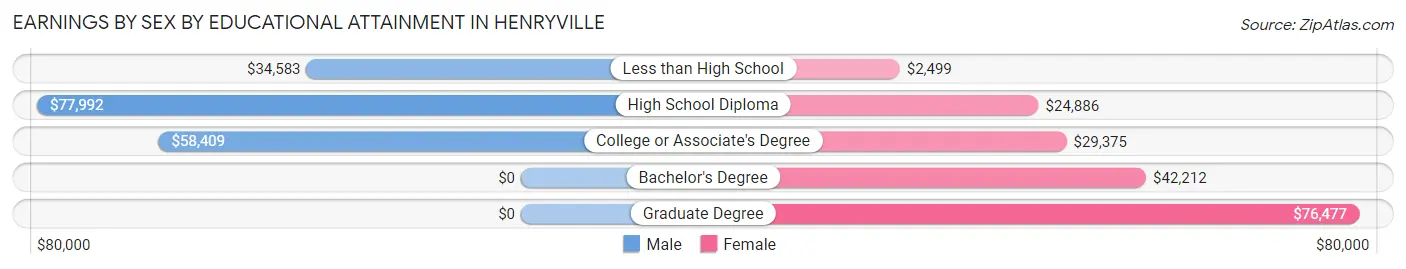
Earnings by Sex by Educational Attainment in Henryville
Average earnings in Henryville are $61,250 for men and $34,432 for women, a difference of 43.8%. Men with an educational attainment of high school diploma enjoy the highest average annual earnings of $77,992, while those with less than high school education earn the least with $34,583. Women with an educational attainment of graduate degree earn the most with the average annual earnings of $76,477, while those with less than high school education have the smallest earnings of $2,499.
| Educational Attainment | Male Income | Female Income |
| Less than High School | $34,583 | $2,499 |
| High School Diploma | $77,992 | $24,886 |
| College or Associate's Degree | $58,409 | $29,375 |
| Bachelor's Degree | - | - |
| Graduate Degree | - | - |
| Total | $61,250 | $34,432 |
Family Income in Henryville
Family Income Brackets in Henryville
According to the Henryville family income data, there are 123 families falling into the $100,000 to $149,999 income range, which is the most common income bracket and makes up 25.8% of all families.
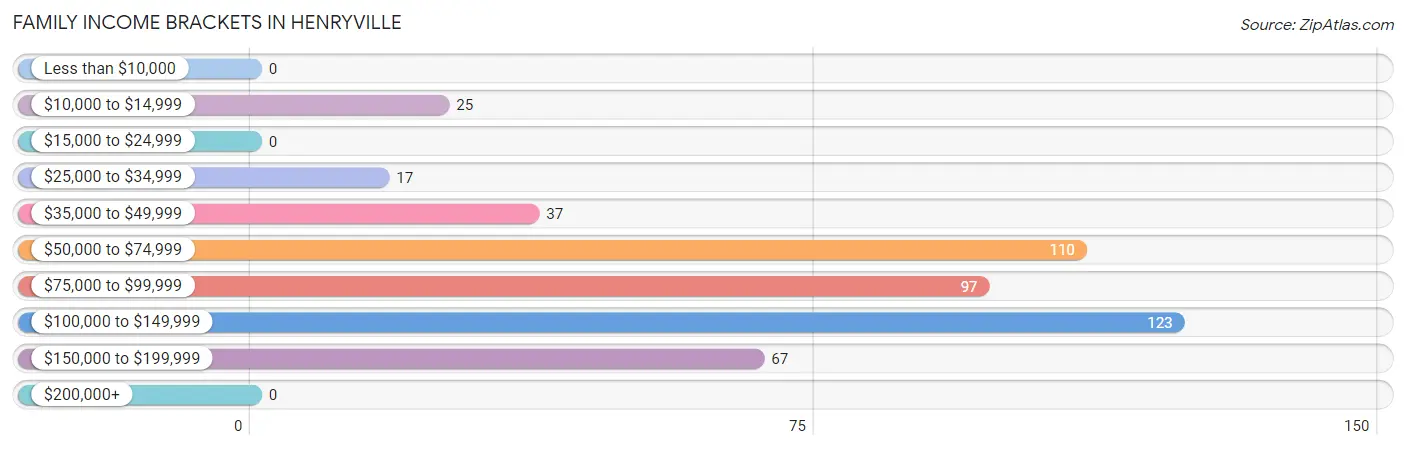
| Income Bracket | # Families | % Families |
| Less than $10,000 | 0 | 0.0% |
| $10,000 to $14,999 | 25 | 5.3% |
| $15,000 to $24,999 | 0 | 0.0% |
| $25,000 to $34,999 | 17 | 3.6% |
| $35,000 to $49,999 | 37 | 7.8% |
| $50,000 to $74,999 | 110 | 23.1% |
| $75,000 to $99,999 | 97 | 20.4% |
| $100,000 to $149,999 | 123 | 25.8% |
| $150,000 to $199,999 | 67 | 14.1% |
| $200,000+ | 0 | 0.0% |
Family Income by Famaliy Size in Henryville
4-person families (74 | 15.5%) account for the highest median family income in Henryville with $115,530 per family, while 3-person families (110 | 23.1%) have the highest median income of $33,816 per family member.
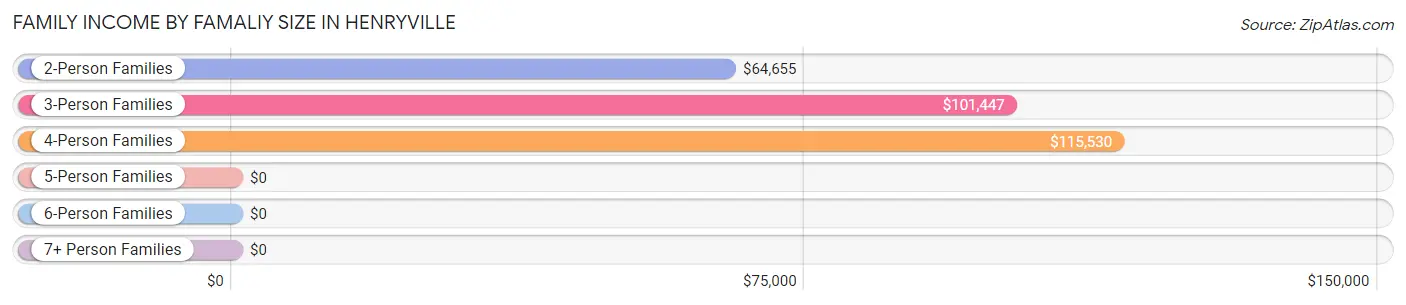
| Income Bracket | # Families | Median Income |
| 2-Person Families | 230 (48.3%) | $64,655 |
| 3-Person Families | 110 (23.1%) | $101,447 |
| 4-Person Families | 74 (15.5%) | $115,530 |
| 5-Person Families | 46 (9.7%) | $0 |
| 6-Person Families | 16 (3.4%) | $0 |
| 7+ Person Families | 0 (0.0%) | $0 |
| Total | 476 (100.0%) | $84,015 |
Family Income by Number of Earners in Henryville
The median family income in Henryville is $84,015, with families comprising 2 earners (246) having the highest median family income of $102,813, while families with 1 earner (110) have the lowest median family income of $55,982, accounting for 51.7% and 23.1% of families, respectively.
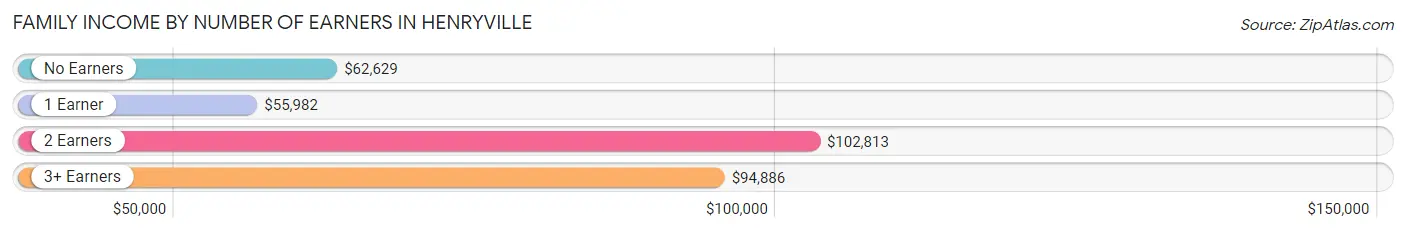
| Number of Earners | # Families | Median Income |
| No Earners | 77 (16.2%) | $62,629 |
| 1 Earner | 110 (23.1%) | $55,982 |
| 2 Earners | 246 (51.7%) | $102,813 |
| 3+ Earners | 43 (9.0%) | $94,886 |
| Total | 476 (100.0%) | $84,015 |
Household Income in Henryville
Household Income Brackets in Henryville
With 165 households falling in the category, the $50,000 to $74,999 income range is the most frequent in Henryville, accounting for 24.0% of all households.
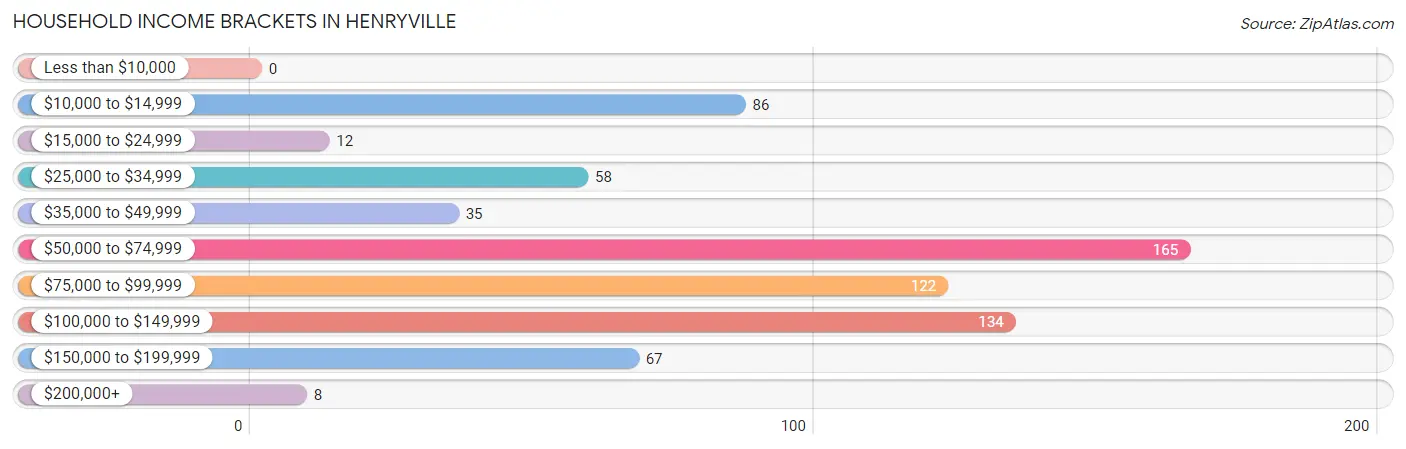
| Income Bracket | # Households | % Households |
| Less than $10,000 | 0 | 0.0% |
| $10,000 to $14,999 | 86 | 12.5% |
| $15,000 to $24,999 | 12 | 1.7% |
| $25,000 to $34,999 | 58 | 8.4% |
| $35,000 to $49,999 | 35 | 5.1% |
| $50,000 to $74,999 | 165 | 24.0% |
| $75,000 to $99,999 | 122 | 17.8% |
| $100,000 to $149,999 | 134 | 19.5% |
| $150,000 to $199,999 | 67 | 9.8% |
| $200,000+ | 8 | 1.2% |
Household Income by Householder Age in Henryville
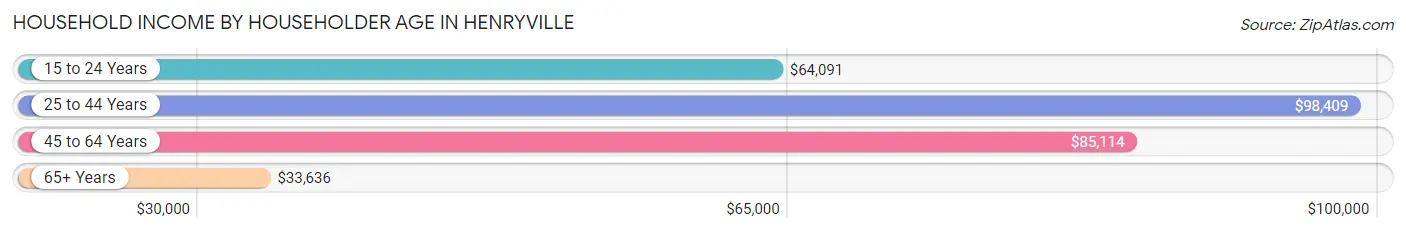
The median household income in Henryville is $72,768, with the highest median household income of $98,409 found in the 25 to 44 years age bracket for the primary householder. A total of 248 households (36.1%) fall into this category. Meanwhile, the 65+ years age bracket for the primary householder has the lowest median household income of $33,636, with 222 households (32.3%) in this group.
| Income Bracket | # Households | Median Income |
| 15 to 24 Years | 36 (5.2%) | $64,091 |
| 25 to 44 Years | 248 (36.1%) | $98,409 |
| 45 to 64 Years | 181 (26.4%) | $85,114 |
| 65+ Years | 222 (32.3%) | $33,636 |
| Total | 687 (100.0%) | $72,768 |
Poverty in Henryville
Income Below Poverty by Sex and Age in Henryville
With 9.7% poverty level for males and 14.2% for females among the residents of Henryville, 12 to 14 year old males and 75 year old and over females are the most vulnerable to poverty, with 11 males (52.4%) and 63 females (46.0%) in their respective age groups living below the poverty level.
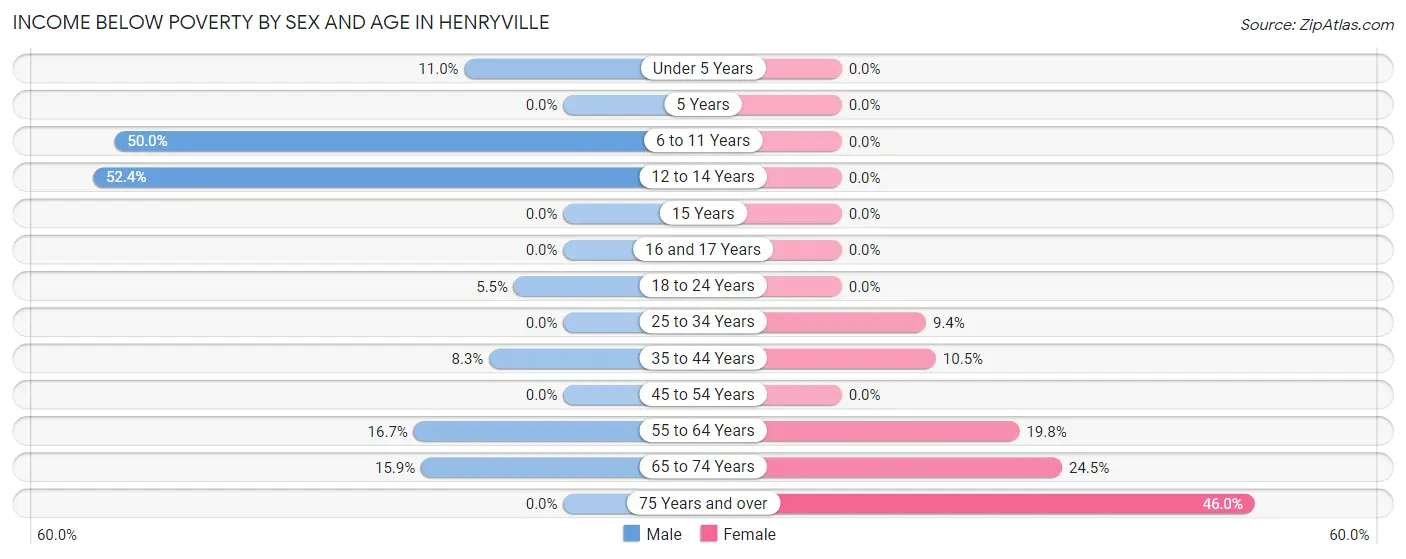
| Age Bracket | Male | Female |
| Under 5 Years | 13 (11.0%) | 0 (0.0%) |
| 5 Years | 0 (0.0%) | 0 (0.0%) |
| 6 to 11 Years | 11 (50.0%) | 0 (0.0%) |
| 12 to 14 Years | 11 (52.4%) | 0 (0.0%) |
| 15 Years | 0 (0.0%) | 0 (0.0%) |
| 16 and 17 Years | 0 (0.0%) | 0 (0.0%) |
| 18 to 24 Years | 7 (5.5%) | 0 (0.0%) |
| 25 to 34 Years | 0 (0.0%) | 18 (9.4%) |
| 35 to 44 Years | 10 (8.3%) | 11 (10.5%) |
| 45 to 54 Years | 0 (0.0%) | 0 (0.0%) |
| 55 to 64 Years | 18 (16.7%) | 19 (19.8%) |
| 65 to 74 Years | 13 (15.9%) | 26 (24.5%) |
| 75 Years and over | 0 (0.0%) | 63 (46.0%) |
| Total | 83 (9.7%) | 137 (14.2%) |
Income Above Poverty by Sex and Age in Henryville
According to the poverty statistics in Henryville, males aged 5 years and females aged under 5 years are the age groups that are most secure financially, with 100.0% of males and 100.0% of females in these age groups living above the poverty line.
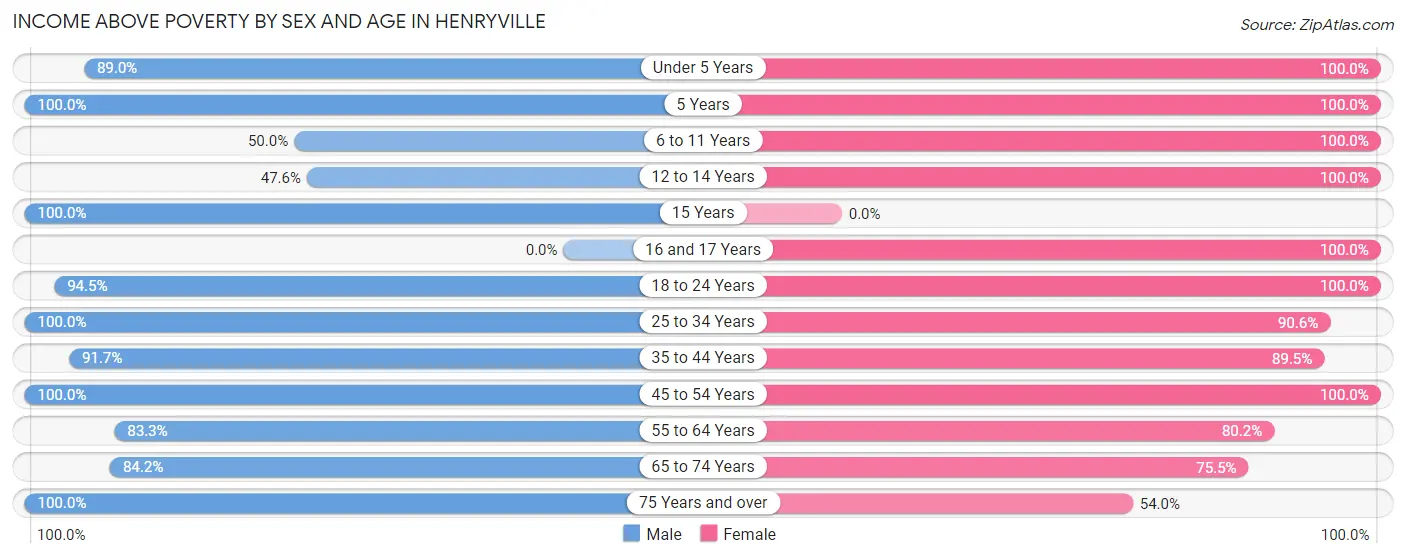
| Age Bracket | Male | Female |
| Under 5 Years | 105 (89.0%) | 36 (100.0%) |
| 5 Years | 18 (100.0%) | 20 (100.0%) |
| 6 to 11 Years | 11 (50.0%) | 73 (100.0%) |
| 12 to 14 Years | 10 (47.6%) | 19 (100.0%) |
| 15 Years | 8 (100.0%) | 0 (0.0%) |
| 16 and 17 Years | 0 (0.0%) | 45 (100.0%) |
| 18 to 24 Years | 120 (94.5%) | 60 (100.0%) |
| 25 to 34 Years | 78 (100.0%) | 174 (90.6%) |
| 35 to 44 Years | 111 (91.7%) | 94 (89.5%) |
| 45 to 54 Years | 65 (100.0%) | 78 (100.0%) |
| 55 to 64 Years | 90 (83.3%) | 77 (80.2%) |
| 65 to 74 Years | 69 (84.2%) | 80 (75.5%) |
| 75 Years and over | 85 (100.0%) | 74 (54.0%) |
| Total | 770 (90.3%) | 830 (85.8%) |
Income Below Poverty Among Married-Couple Families in Henryville
The poverty statistics for married-couple families in Henryville show that 6.0% or 23 of the total 382 families live below the poverty line. Families with 1 or 2 children have the highest poverty rate of 10.7%, comprising of 10 families. On the other hand, families with 3 or 4 children have the lowest poverty rate of 0.0%, which includes 0 families.
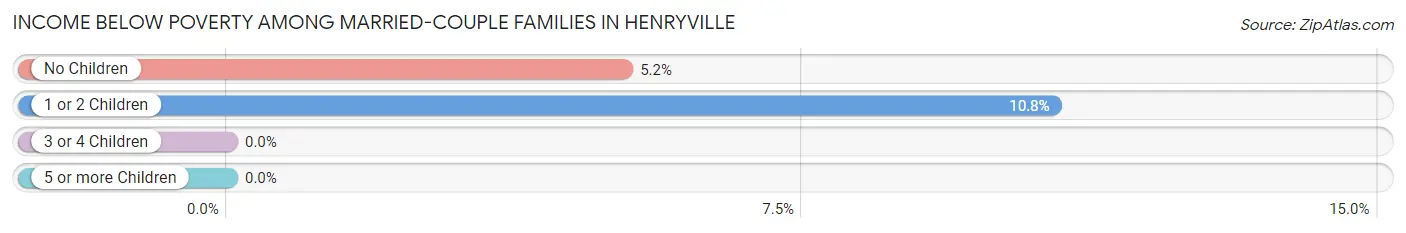
| Children | Above Poverty | Below Poverty |
| No Children | 239 (94.8%) | 13 (5.2%) |
| 1 or 2 Children | 83 (89.2%) | 10 (10.7%) |
| 3 or 4 Children | 37 (100.0%) | 0 (0.0%) |
| 5 or more Children | 0 (0.0%) | 0 (0.0%) |
| Total | 359 (94.0%) | 23 (6.0%) |
Income Below Poverty Among Single-Parent Households in Henryville
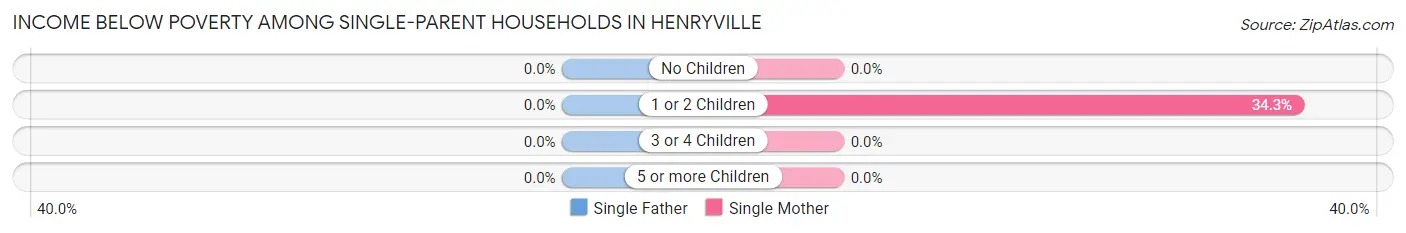
| Children | Single Father | Single Mother |
| No Children | 0 (0.0%) | 0 (0.0%) |
| 1 or 2 Children | 0 (0.0%) | 12 (34.3%) |
| 3 or 4 Children | 0 (0.0%) | 0 (0.0%) |
| 5 or more Children | 0 (0.0%) | 0 (0.0%) |
| Total | 0 (0.0%) | 12 (19.4%) |
Income Below Poverty Among Married-Couple vs Single-Parent Households in Henryville
The poverty data for Henryville shows that 23 of the married-couple family households (6.0%) and 12 of the single-parent households (12.8%) are living below the poverty level. Within the married-couple family households, those with 1 or 2 children have the highest poverty rate, with 10 households (10.7%) falling below the poverty line. Among the single-parent households, those with 1 or 2 children have the highest poverty rate, with 12 household (28.6%) living below poverty.
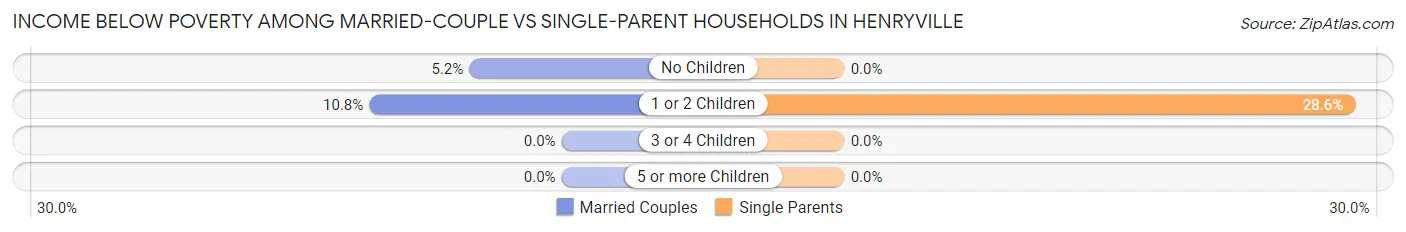
| Children | Married-Couple Families | Single-Parent Households |
| No Children | 13 (5.2%) | 0 (0.0%) |
| 1 or 2 Children | 10 (10.7%) | 12 (28.6%) |
| 3 or 4 Children | 0 (0.0%) | 0 (0.0%) |
| 5 or more Children | 0 (0.0%) | 0 (0.0%) |
| Total | 23 (6.0%) | 12 (12.8%) |
Race in Henryville
The most populous races in Henryville are White / Caucasian (1,822 | 99.2%), Hispanic or Latino (77 | 4.2%), and Two or more Races (15 | 0.8%).
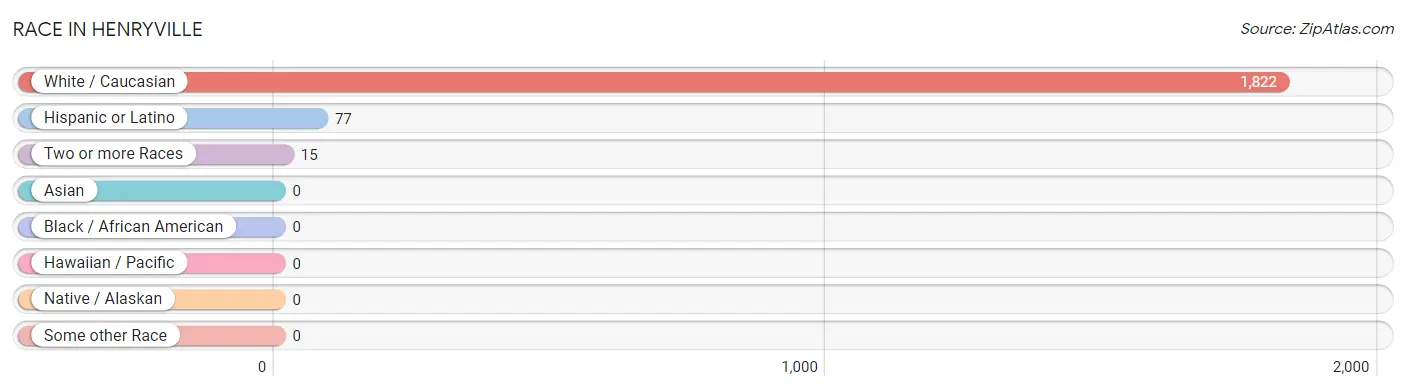
| Race | # Population | % Population |
| Asian | 0 | 0.0% |
| Black / African American | 0 | 0.0% |
| Hawaiian / Pacific | 0 | 0.0% |
| Hispanic or Latino | 77 | 4.2% |
| Native / Alaskan | 0 | 0.0% |
| White / Caucasian | 1,822 | 99.2% |
| Two or more Races | 15 | 0.8% |
| Some other Race | 0 | 0.0% |
| Total | 1,837 | 100.0% |
Ancestry in Henryville
The most populous ancestries reported in Henryville are Irish (237 | 12.9%), German (195 | 10.6%), French (87 | 4.7%), English (64 | 3.5%), and Central American (55 | 3.0%), together accounting for 34.7% of all Henryville residents.
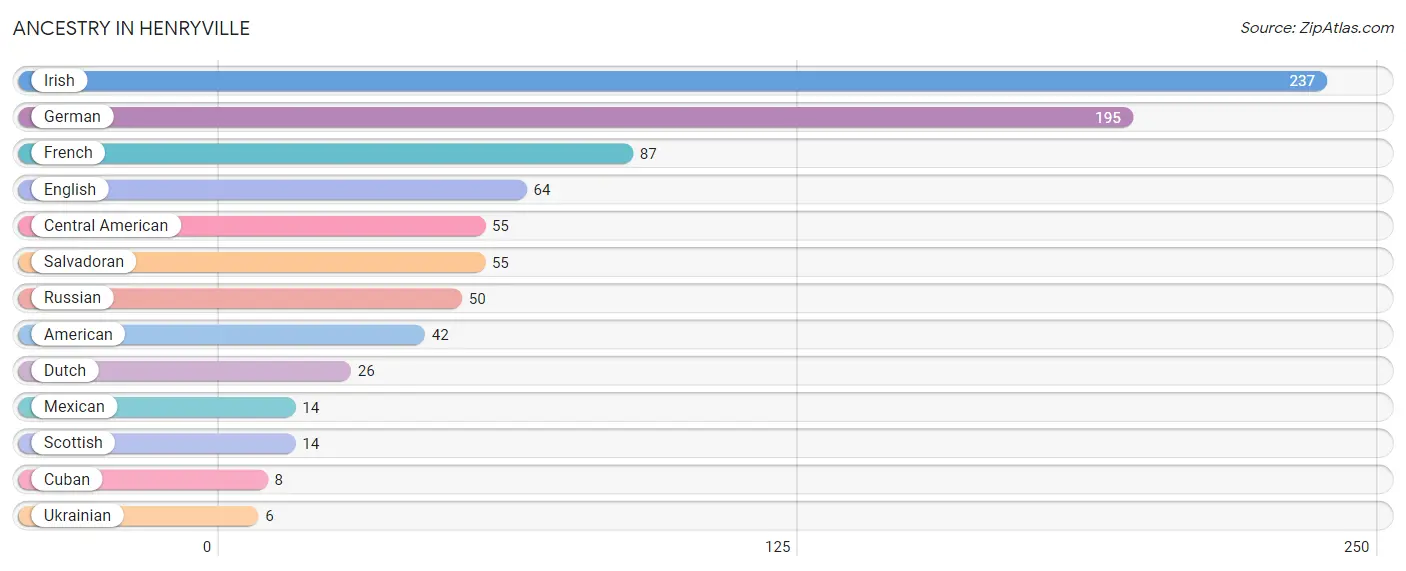
| Ancestry | # Population | % Population |
| American | 42 | 2.3% |
| Central American | 55 | 3.0% |
| Cuban | 8 | 0.4% |
| Dutch | 26 | 1.4% |
| English | 64 | 3.5% |
| French | 87 | 4.7% |
| German | 195 | 10.6% |
| Irish | 237 | 12.9% |
| Mexican | 14 | 0.8% |
| Russian | 50 | 2.7% |
| Salvadoran | 55 | 3.0% |
| Scottish | 14 | 0.8% |
| Ukrainian | 6 | 0.3% | View All 13 Rows |
Immigrants in Henryville
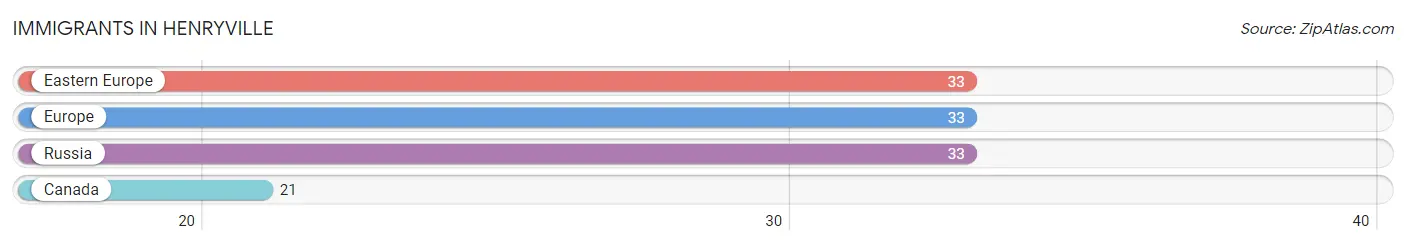
The most numerous immigrant groups reported in Henryville came from Eastern Europe (33 | 1.8%), Europe (33 | 1.8%), Russia (33 | 1.8%), and Canada (21 | 1.1%), together accounting for 6.5% of all Henryville residents.
| Immigration Origin | # Population | % Population |
| Canada | 21 | 1.1% |
| Eastern Europe | 33 | 1.8% |
| Europe | 33 | 1.8% |
| Russia | 33 | 1.8% | View All 4 Rows |
Sex and Age in Henryville
Sex and Age in Henryville
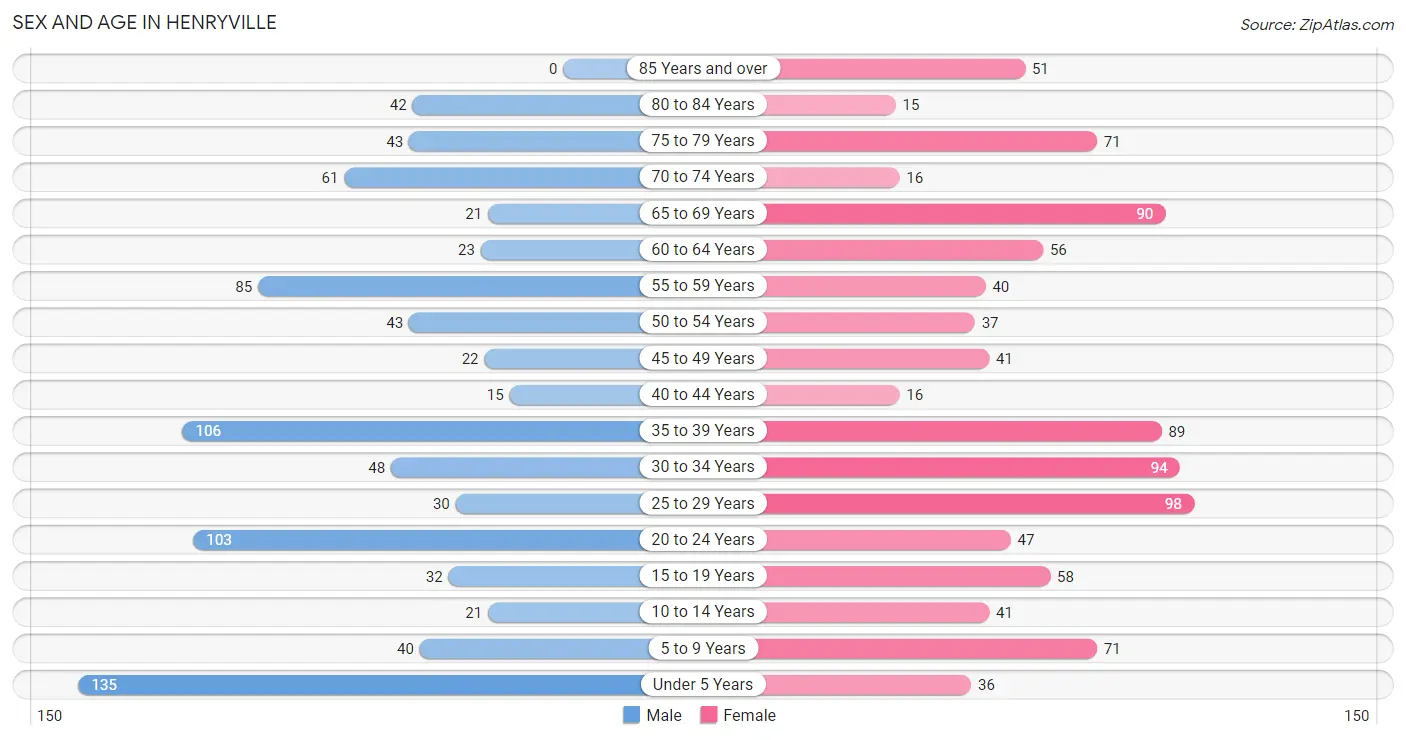
The most populous age groups in Henryville are Under 5 Years (135 | 15.5%) for men and 25 to 29 Years (98 | 10.1%) for women.
| Age Bracket | Male | Female |
| Under 5 Years | 135 (15.5%) | 36 (3.7%) |
| 5 to 9 Years | 40 (4.6%) | 71 (7.3%) |
| 10 to 14 Years | 21 (2.4%) | 41 (4.2%) |
| 15 to 19 Years | 32 (3.7%) | 58 (6.0%) |
| 20 to 24 Years | 103 (11.8%) | 47 (4.9%) |
| 25 to 29 Years | 30 (3.5%) | 98 (10.1%) |
| 30 to 34 Years | 48 (5.5%) | 94 (9.7%) |
| 35 to 39 Years | 106 (12.2%) | 89 (9.2%) |
| 40 to 44 Years | 15 (1.7%) | 16 (1.7%) |
| 45 to 49 Years | 22 (2.5%) | 41 (4.2%) |
| 50 to 54 Years | 43 (4.9%) | 37 (3.8%) |
| 55 to 59 Years | 85 (9.8%) | 40 (4.1%) |
| 60 to 64 Years | 23 (2.6%) | 56 (5.8%) |
| 65 to 69 Years | 21 (2.4%) | 90 (9.3%) |
| 70 to 74 Years | 61 (7.0%) | 16 (1.7%) |
| 75 to 79 Years | 43 (4.9%) | 71 (7.3%) |
| 80 to 84 Years | 42 (4.8%) | 15 (1.5%) |
| 85 Years and over | 0 (0.0%) | 51 (5.3%) |
| Total | 870 (100.0%) | 967 (100.0%) |
Families and Households in Henryville
Median Family Size in Henryville
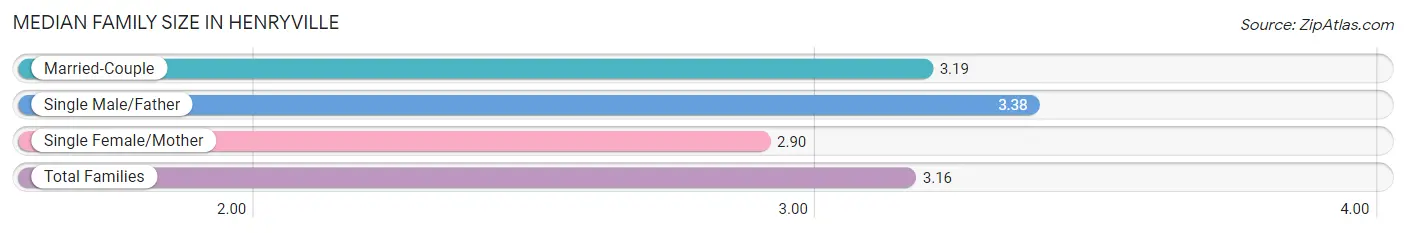
The median family size in Henryville is 3.16 persons per family, with single male/father families (32 | 6.7%) accounting for the largest median family size of 3.38 persons per family. On the other hand, single female/mother families (62 | 13.0%) represent the smallest median family size with 2.90 persons per family.
| Family Type | # Families | Family Size |
| Married-Couple | 382 (80.2%) | 3.19 |
| Single Male/Father | 32 (6.7%) | 3.38 |
| Single Female/Mother | 62 (13.0%) | 2.90 |
| Total Families | 476 (100.0%) | 3.16 |
Median Household Size in Henryville
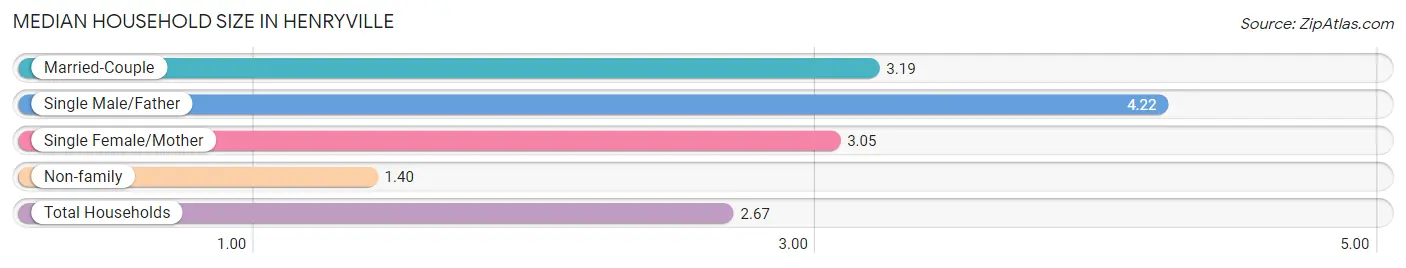
The median household size in Henryville is 2.67 persons per household, with single male/father households (32 | 4.7%) accounting for the largest median household size of 4.22 persons per household. non-family households (211 | 30.7%) represent the smallest median household size with 1.40 persons per household.
| Household Type | # Households | Household Size |
| Married-Couple | 382 (55.6%) | 3.19 |
| Single Male/Father | 32 (4.7%) | 4.22 |
| Single Female/Mother | 62 (9.0%) | 3.05 |
| Non-family | 211 (30.7%) | 1.40 |
| Total Households | 687 (100.0%) | 2.67 |
Household Size by Marriage Status in Henryville
Out of a total of 687 households in Henryville, 476 (69.3%) are family households, while 211 (30.7%) are nonfamily households. The most numerous type of family households are 2-person households, comprising 223, and the most common type of nonfamily households are 1-person households, comprising 189.
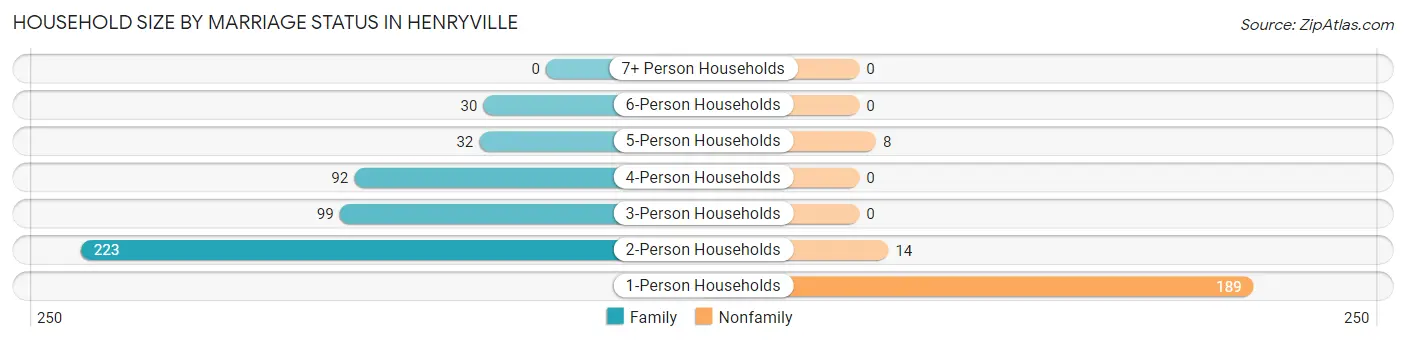
| Household Size | Family Households | Nonfamily Households |
| 1-Person Households | - | 189 (27.5%) |
| 2-Person Households | 223 (32.5%) | 14 (2.0%) |
| 3-Person Households | 99 (14.4%) | 0 (0.0%) |
| 4-Person Households | 92 (13.4%) | 0 (0.0%) |
| 5-Person Households | 32 (4.7%) | 8 (1.2%) |
| 6-Person Households | 30 (4.4%) | 0 (0.0%) |
| 7+ Person Households | 0 (0.0%) | 0 (0.0%) |
| Total | 476 (69.3%) | 211 (30.7%) |
Female Fertility in Henryville
Fertility by Age in Henryville
Average fertility rate in Henryville is 79.0 births per 1,000 women. Women in the age bracket of 20 to 34 years have the highest fertility rate with 146.0 births per 1,000 women. Women in the age bracket of 20 to 34 years acount for 100.0% of all women with births.
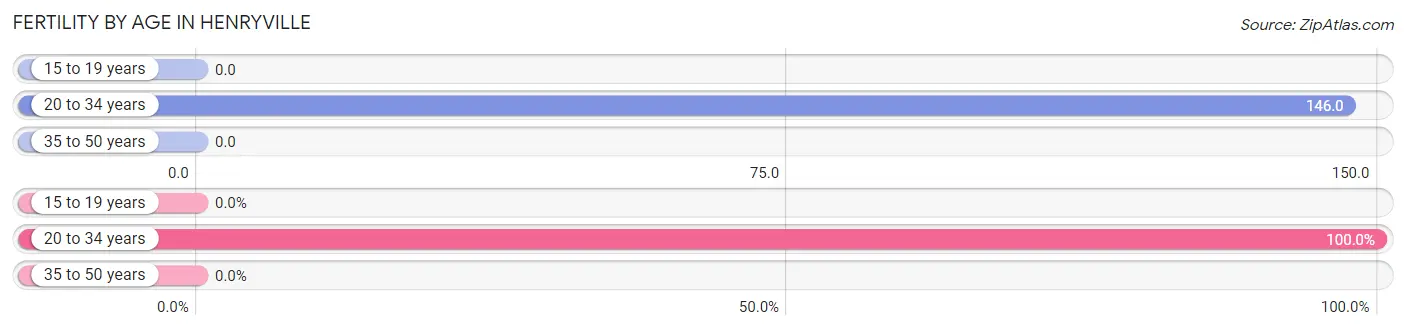
| Age Bracket | Women with Births | Births / 1,000 Women |
| 15 to 19 years | 0 (0.0%) | 0.0 |
| 20 to 34 years | 35 (100.0%) | 146.0 |
| 35 to 50 years | 0 (0.0%) | 0.0 |
| Total | 35 (100.0%) | 79.0 |
Fertility by Age by Marriage Status in Henryville
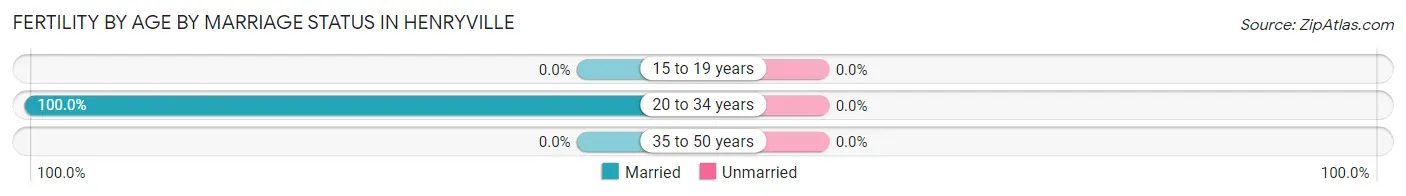
| Age Bracket | Married | Unmarried |
| 15 to 19 years | 0 (0.0%) | 0 (0.0%) |
| 20 to 34 years | 35 (100.0%) | 0 (0.0%) |
| 35 to 50 years | 0 (0.0%) | 0 (0.0%) |
| Total | 35 (100.0%) | 0 (0.0%) |
Fertility by Education in Henryville
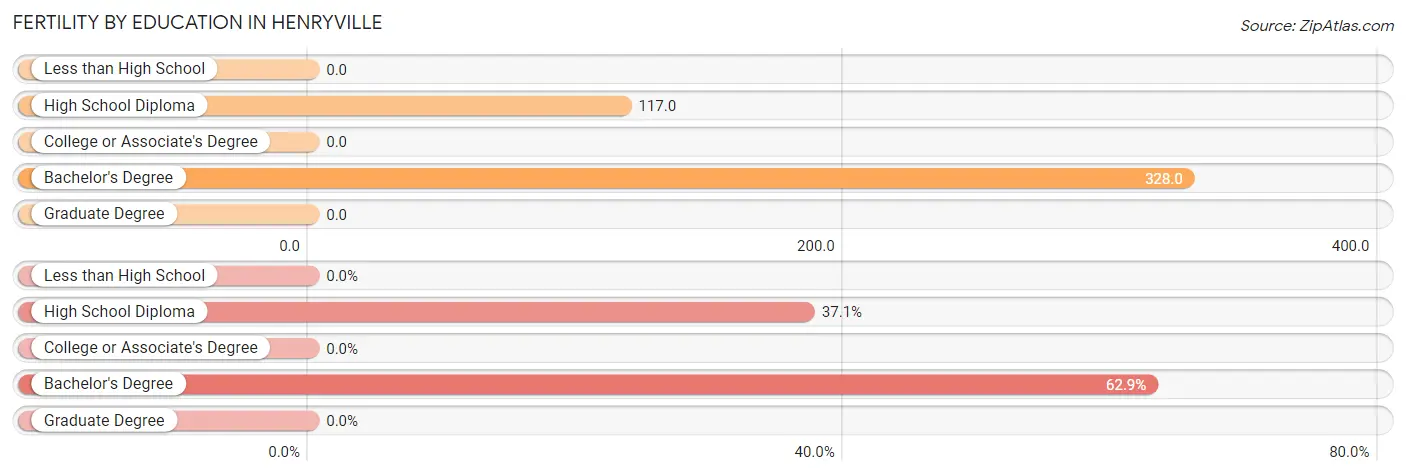
| Educational Attainment | Women with Births | Births / 1,000 Women |
| Less than High School | 0 (0.0%) | 0.0 |
| High School Diploma | 13 (37.1%) | 117.0 |
| College or Associate's Degree | 0 (0.0%) | 0.0 |
| Bachelor's Degree | 22 (62.9%) | 328.0 |
| Graduate Degree | 0 (0.0%) | 0.0 |
| Total | 35 (100.0%) | 79.0 |
Fertility by Education by Marriage Status in Henryville
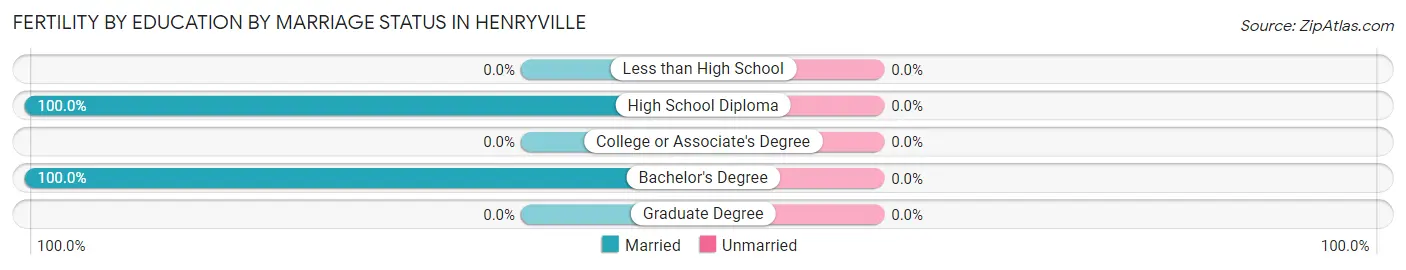
| Educational Attainment | Married | Unmarried |
| Less than High School | 0 (0.0%) | 0 (0.0%) |
| High School Diploma | 13 (100.0%) | 0 (0.0%) |
| College or Associate's Degree | 0 (0.0%) | 0 (0.0%) |
| Bachelor's Degree | 22 (100.0%) | 0 (0.0%) |
| Graduate Degree | 0 (0.0%) | 0 (0.0%) |
| Total | 35 (100.0%) | 0 (0.0%) |
Employment Characteristics in Henryville
Employment by Class of Employer in Henryville
Among the 956 employed individuals in Henryville, private company employees (597 | 62.5%), not-for-profit organizations (211 | 22.1%), and local government employees (78 | 8.2%) make up the most common classes of employment.
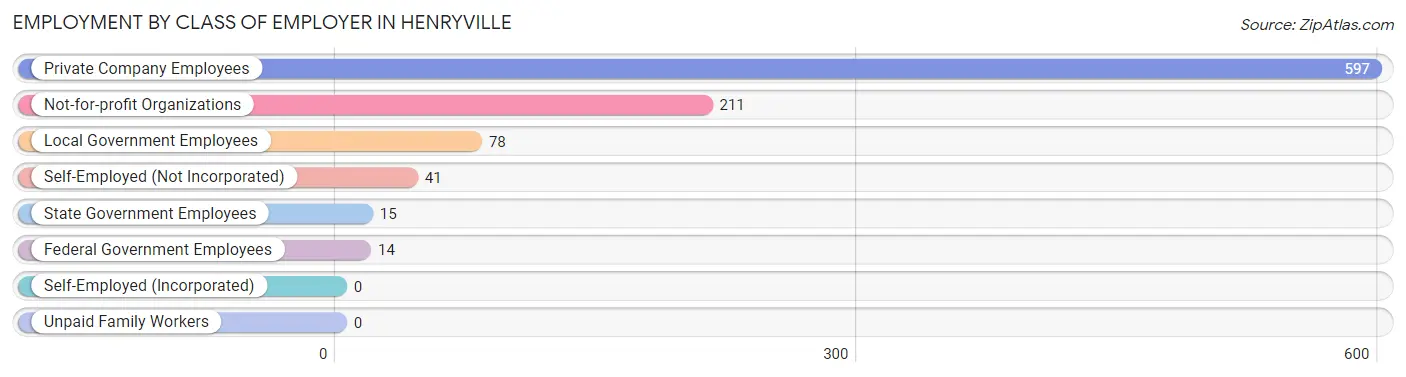
| Employer Class | # Employees | % Employees |
| Private Company Employees | 597 | 62.5% |
| Self-Employed (Incorporated) | 0 | 0.0% |
| Self-Employed (Not Incorporated) | 41 | 4.3% |
| Not-for-profit Organizations | 211 | 22.1% |
| Local Government Employees | 78 | 8.2% |
| State Government Employees | 15 | 1.6% |
| Federal Government Employees | 14 | 1.5% |
| Unpaid Family Workers | 0 | 0.0% |
| Total | 956 | 100.0% |
Employment Status by Age in Henryville
According to the labor force statistics for Henryville, out of the total population over 16 years of age (1,485), 65.9% or 979 individuals are in the labor force, with 1.2% or 12 of them unemployed. The age group with the highest labor force participation rate is 20 to 24 years, with 100.0% or 150 individuals in the labor force. Within the labor force, the 65 to 74 years age range has the highest percentage of unemployed individuals, with 15.0% or 12 of them being unemployed.
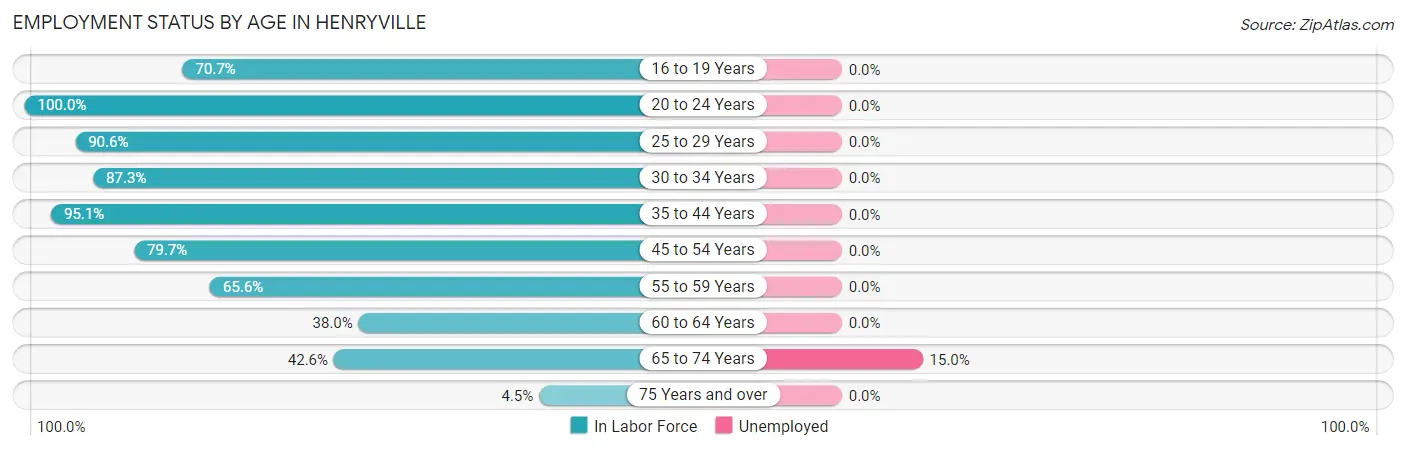
| Age Bracket | In Labor Force | Unemployed |
| 16 to 19 Years | 58 (70.7%) | 0 (0.0%) |
| 20 to 24 Years | 150 (100.0%) | 0 (0.0%) |
| 25 to 29 Years | 116 (90.6%) | 0 (0.0%) |
| 30 to 34 Years | 124 (87.3%) | 0 (0.0%) |
| 35 to 44 Years | 215 (95.1%) | 0 (0.0%) |
| 45 to 54 Years | 114 (79.7%) | 0 (0.0%) |
| 55 to 59 Years | 82 (65.6%) | 0 (0.0%) |
| 60 to 64 Years | 30 (38.0%) | 0 (0.0%) |
| 65 to 74 Years | 80 (42.6%) | 12 (15.0%) |
| 75 Years and over | 10 (4.5%) | 0 (0.0%) |
| Total | 979 (65.9%) | 12 (1.2%) |
Employment Status by Educational Attainment in Henryville
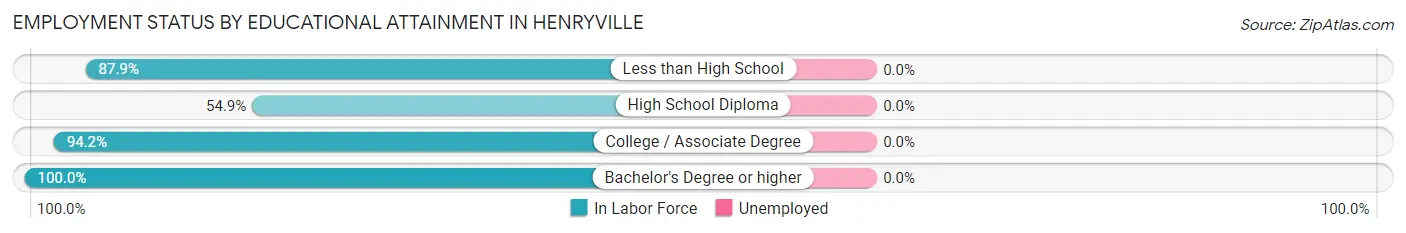
| Educational Attainment | In Labor Force | Unemployed |
| Less than High School | 87 (87.9%) | 0 (0.0%) |
| High School Diploma | 158 (54.9%) | 0 (0.0%) |
| College / Associate Degree | 327 (94.2%) | 0 (0.0%) |
| Bachelor's Degree or higher | 109 (100.0%) | 0 (0.0%) |
| Total | 681 (80.8%) | 0 (0.0%) |
Employment Occupations by Sex in Henryville
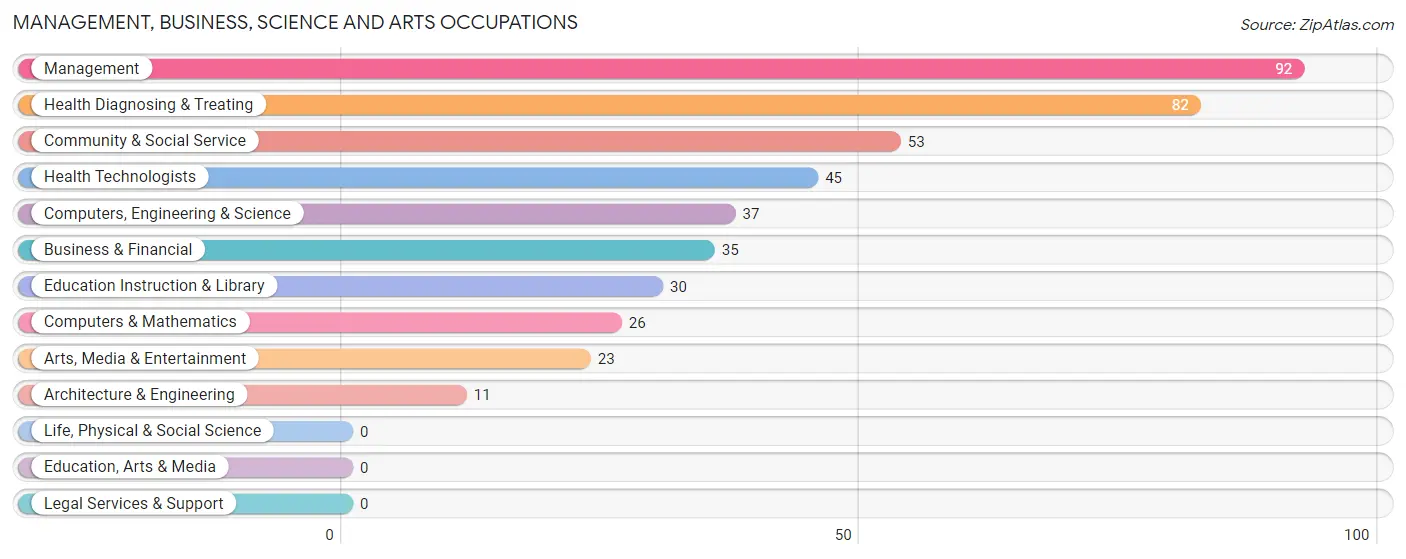
Management, Business, Science and Arts Occupations
The most common Management, Business, Science and Arts occupations in Henryville are Management (92 | 9.5%), Health Diagnosing & Treating (82 | 8.5%), Community & Social Service (53 | 5.5%), Health Technologists (45 | 4.6%), and Computers, Engineering & Science (37 | 3.8%).
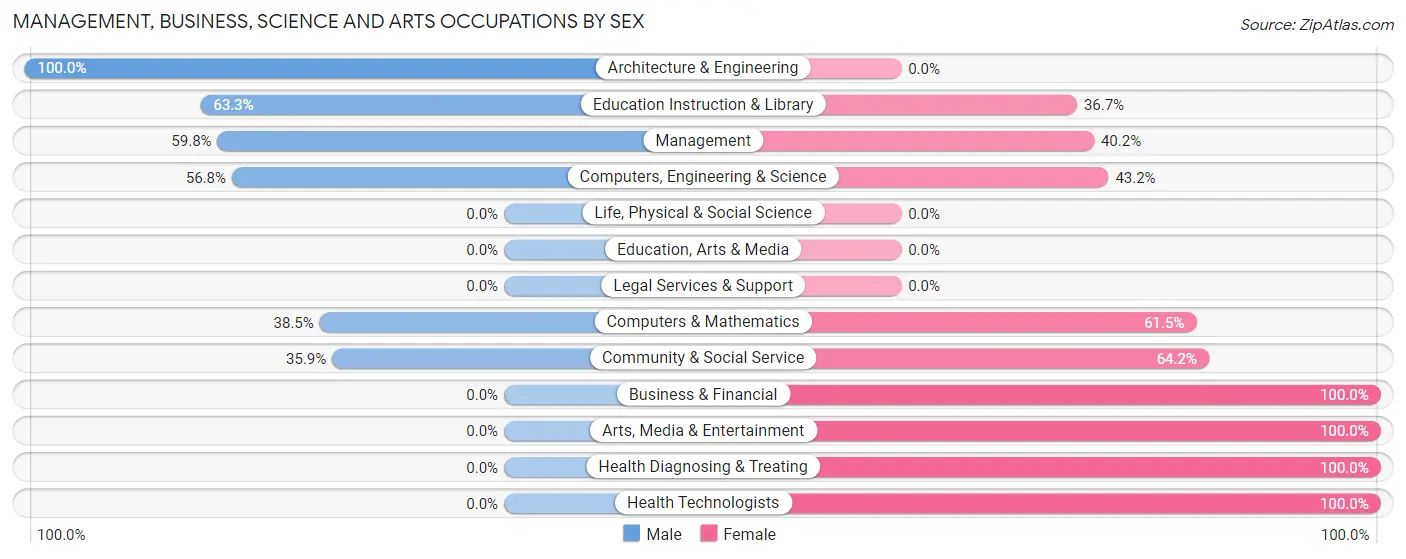
Management, Business, Science and Arts Occupations by Sex
Within the Management, Business, Science and Arts occupations in Henryville, the most male-oriented occupations are Architecture & Engineering (100.0%), Education Instruction & Library (63.3%), and Management (59.8%), while the most female-oriented occupations are Business & Financial (100.0%), Arts, Media & Entertainment (100.0%), and Health Diagnosing & Treating (100.0%).
| Occupation | Male | Female |
| Management | 55 (59.8%) | 37 (40.2%) |
| Business & Financial | 0 (0.0%) | 35 (100.0%) |
| Computers, Engineering & Science | 21 (56.8%) | 16 (43.2%) |
| Computers & Mathematics | 10 (38.5%) | 16 (61.5%) |
| Architecture & Engineering | 11 (100.0%) | 0 (0.0%) |
| Life, Physical & Social Science | 0 (0.0%) | 0 (0.0%) |
| Community & Social Service | 19 (35.8%) | 34 (64.1%) |
| Education, Arts & Media | 0 (0.0%) | 0 (0.0%) |
| Legal Services & Support | 0 (0.0%) | 0 (0.0%) |
| Education Instruction & Library | 19 (63.3%) | 11 (36.7%) |
| Arts, Media & Entertainment | 0 (0.0%) | 23 (100.0%) |
| Health Diagnosing & Treating | 0 (0.0%) | 82 (100.0%) |
| Health Technologists | 0 (0.0%) | 45 (100.0%) |
| Total (Category) | 95 (31.8%) | 204 (68.2%) |
| Total (Overall) | 501 (51.8%) | 466 (48.2%) |
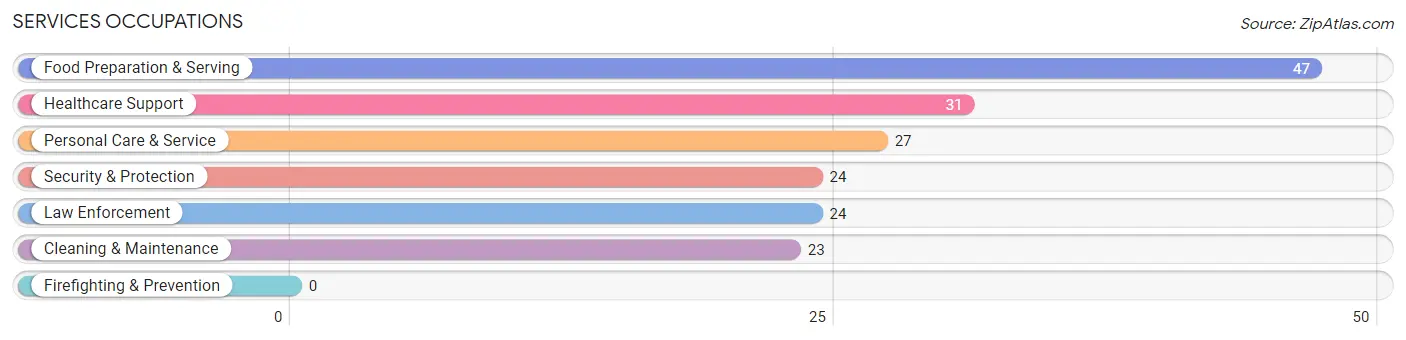
Services Occupations
The most common Services occupations in Henryville are Food Preparation & Serving (47 | 4.9%), Healthcare Support (31 | 3.2%), Personal Care & Service (27 | 2.8%), Security & Protection (24 | 2.5%), and Law Enforcement (24 | 2.5%).
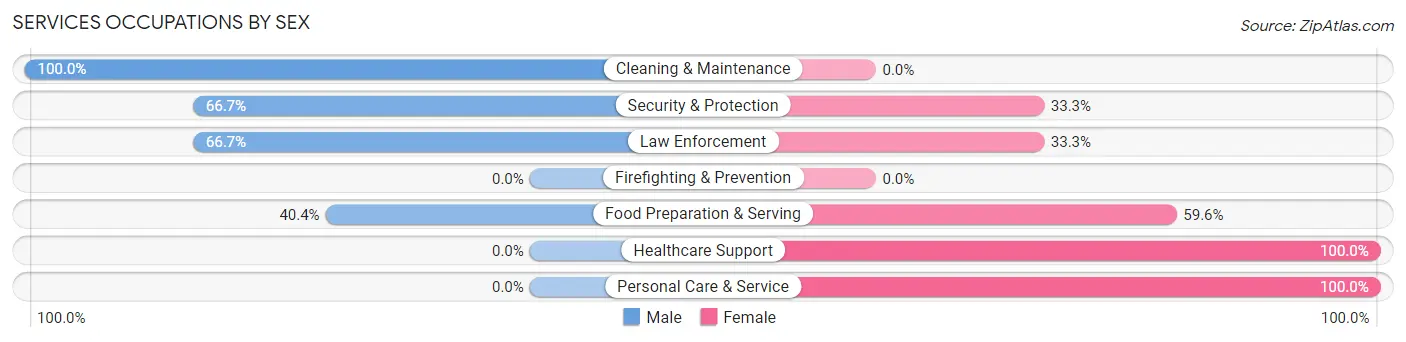
Services Occupations by Sex
Within the Services occupations in Henryville, the most male-oriented occupations are Cleaning & Maintenance (100.0%), Security & Protection (66.7%), and Law Enforcement (66.7%), while the most female-oriented occupations are Healthcare Support (100.0%), Personal Care & Service (100.0%), and Food Preparation & Serving (59.6%).
| Occupation | Male | Female |
| Healthcare Support | 0 (0.0%) | 31 (100.0%) |
| Security & Protection | 16 (66.7%) | 8 (33.3%) |
| Firefighting & Prevention | 0 (0.0%) | 0 (0.0%) |
| Law Enforcement | 16 (66.7%) | 8 (33.3%) |
| Food Preparation & Serving | 19 (40.4%) | 28 (59.6%) |
| Cleaning & Maintenance | 23 (100.0%) | 0 (0.0%) |
| Personal Care & Service | 0 (0.0%) | 27 (100.0%) |
| Total (Category) | 58 (38.2%) | 94 (61.8%) |
| Total (Overall) | 501 (51.8%) | 466 (48.2%) |
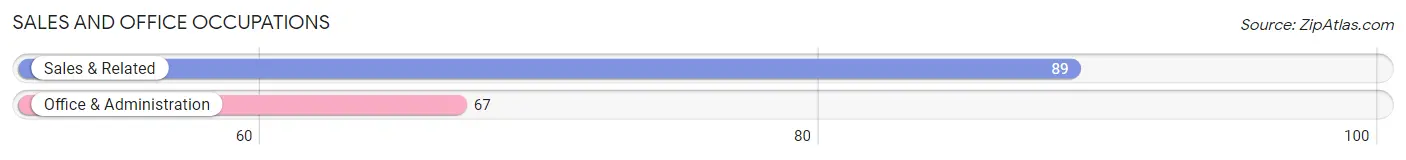
Sales and Office Occupations
The most common Sales and Office occupations in Henryville are Sales & Related (89 | 9.2%), and Office & Administration (67 | 6.9%).
Sales and Office Occupations by Sex
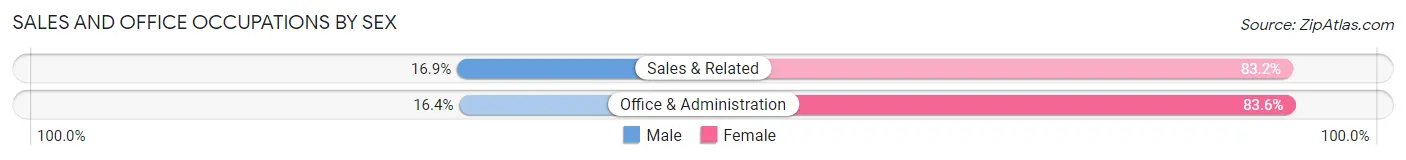
| Occupation | Male | Female |
| Sales & Related | 15 (16.9%) | 74 (83.2%) |
| Office & Administration | 11 (16.4%) | 56 (83.6%) |
| Total (Category) | 26 (16.7%) | 130 (83.3%) |
| Total (Overall) | 501 (51.8%) | 466 (48.2%) |
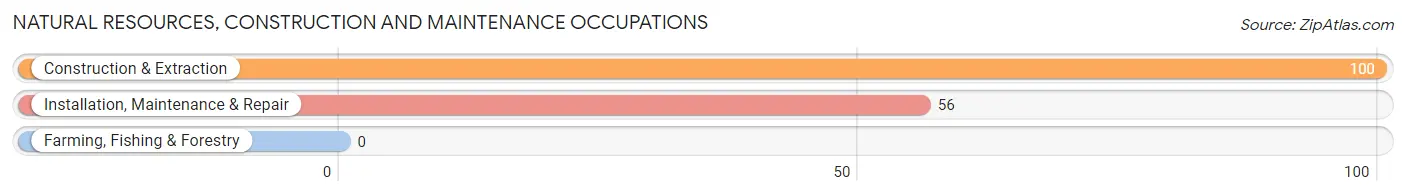
Natural Resources, Construction and Maintenance Occupations
The most common Natural Resources, Construction and Maintenance occupations in Henryville are Construction & Extraction (100 | 10.3%), and Installation, Maintenance & Repair (56 | 5.8%).
Natural Resources, Construction and Maintenance Occupations by Sex
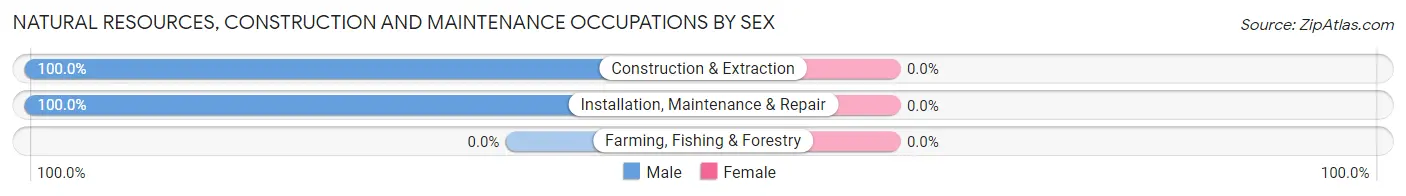
| Occupation | Male | Female |
| Farming, Fishing & Forestry | 0 (0.0%) | 0 (0.0%) |
| Construction & Extraction | 100 (100.0%) | 0 (0.0%) |
| Installation, Maintenance & Repair | 56 (100.0%) | 0 (0.0%) |
| Total (Category) | 156 (100.0%) | 0 (0.0%) |
| Total (Overall) | 501 (51.8%) | 466 (48.2%) |
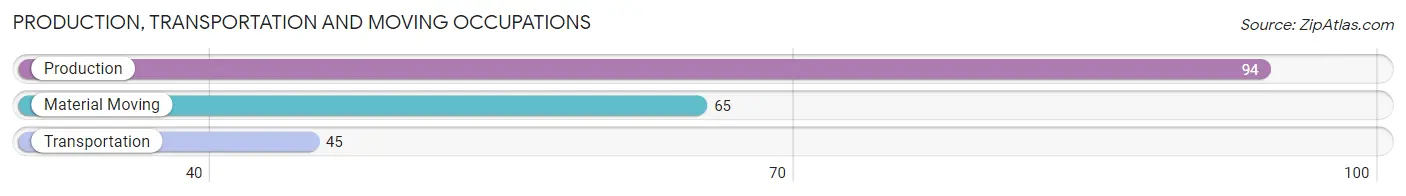
Production, Transportation and Moving Occupations
The most common Production, Transportation and Moving occupations in Henryville are Production (94 | 9.7%), Material Moving (65 | 6.7%), and Transportation (45 | 4.6%).
Production, Transportation and Moving Occupations by Sex
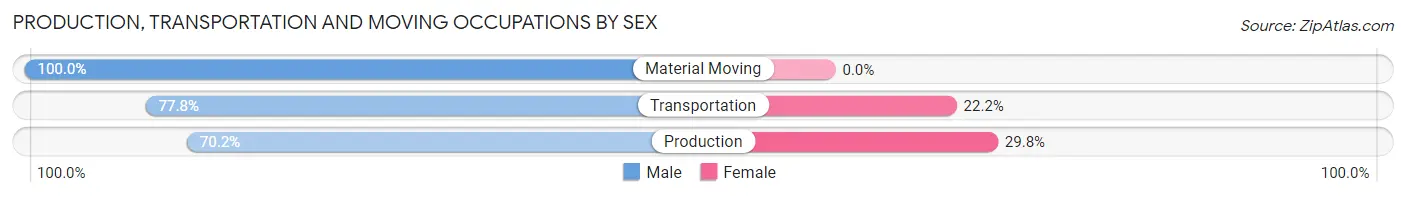
| Occupation | Male | Female |
| Production | 66 (70.2%) | 28 (29.8%) |
| Transportation | 35 (77.8%) | 10 (22.2%) |
| Material Moving | 65 (100.0%) | 0 (0.0%) |
| Total (Category) | 166 (81.4%) | 38 (18.6%) |
| Total (Overall) | 501 (51.8%) | 466 (48.2%) |
Employment Industries by Sex in Henryville
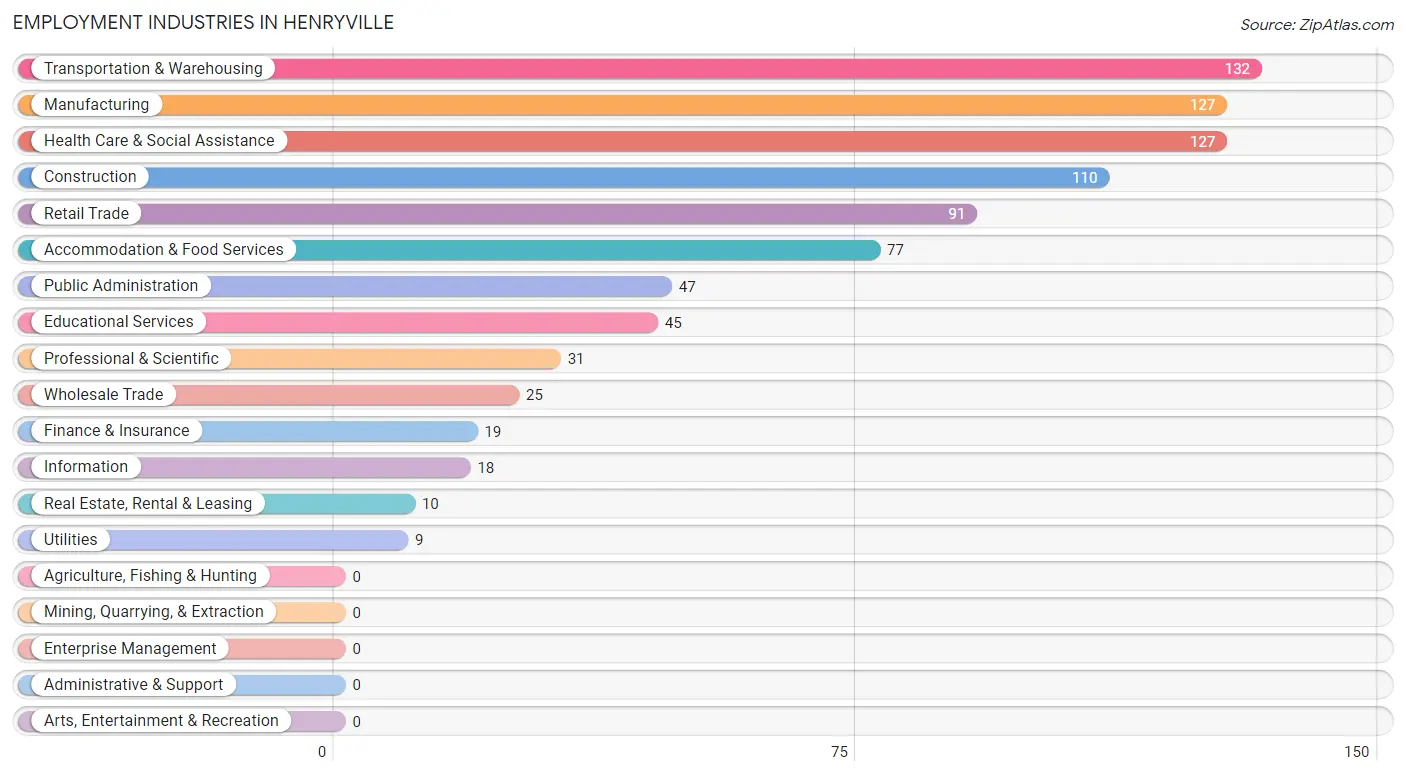
Employment Industries in Henryville
The major employment industries in Henryville include Transportation & Warehousing (132 | 13.7%), Manufacturing (127 | 13.1%), Health Care & Social Assistance (127 | 13.1%), Construction (110 | 11.4%), and Retail Trade (91 | 9.4%).
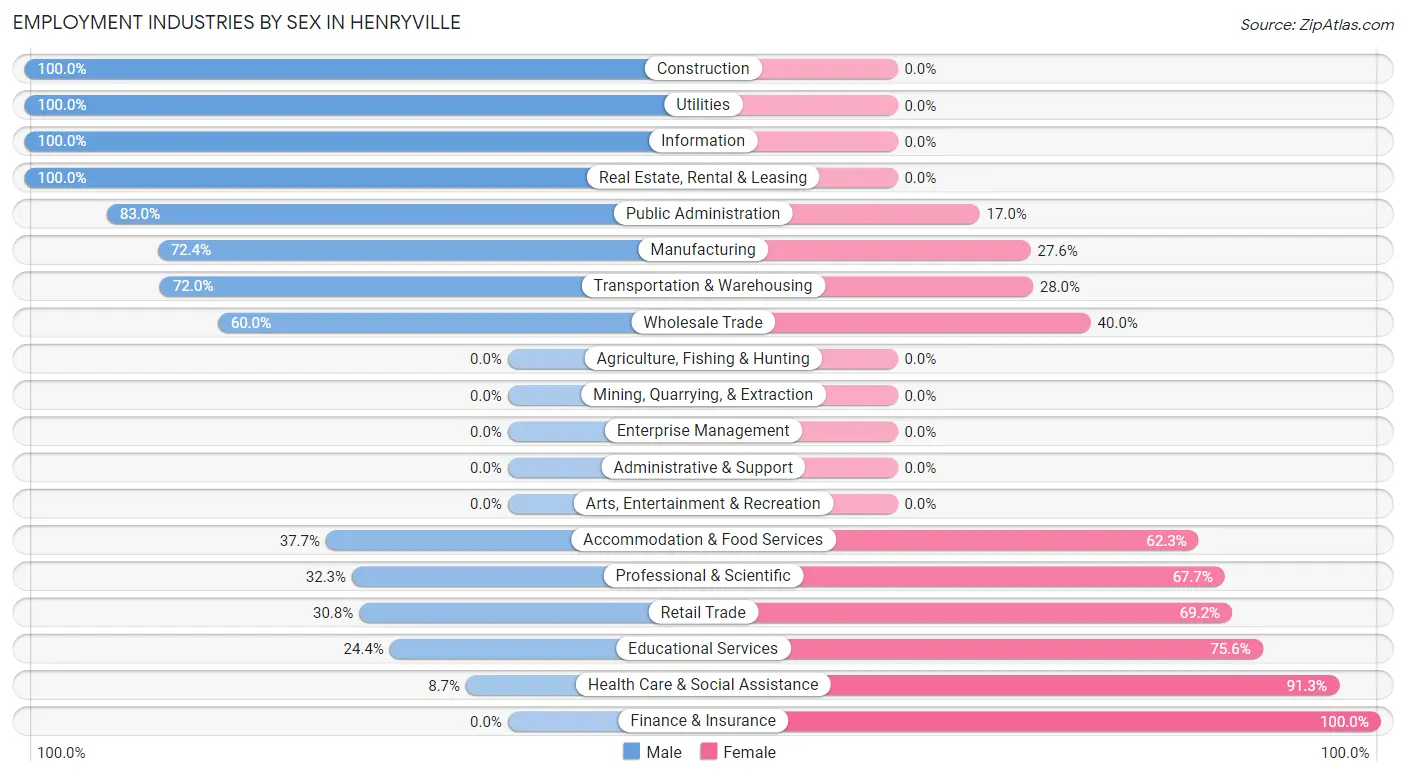
Employment Industries by Sex in Henryville
The Henryville industries that see more men than women are Construction (100.0%), Utilities (100.0%), and Information (100.0%), whereas the industries that tend to have a higher number of women are Finance & Insurance (100.0%), Health Care & Social Assistance (91.3%), and Educational Services (75.6%).
| Industry | Male | Female |
| Agriculture, Fishing & Hunting | 0 (0.0%) | 0 (0.0%) |
| Mining, Quarrying, & Extraction | 0 (0.0%) | 0 (0.0%) |
| Construction | 110 (100.0%) | 0 (0.0%) |
| Manufacturing | 92 (72.4%) | 35 (27.6%) |
| Wholesale Trade | 15 (60.0%) | 10 (40.0%) |
| Retail Trade | 28 (30.8%) | 63 (69.2%) |
| Transportation & Warehousing | 95 (72.0%) | 37 (28.0%) |
| Utilities | 9 (100.0%) | 0 (0.0%) |
| Information | 18 (100.0%) | 0 (0.0%) |
| Finance & Insurance | 0 (0.0%) | 19 (100.0%) |
| Real Estate, Rental & Leasing | 10 (100.0%) | 0 (0.0%) |
| Professional & Scientific | 10 (32.3%) | 21 (67.7%) |
| Enterprise Management | 0 (0.0%) | 0 (0.0%) |
| Administrative & Support | 0 (0.0%) | 0 (0.0%) |
| Educational Services | 11 (24.4%) | 34 (75.6%) |
| Health Care & Social Assistance | 11 (8.7%) | 116 (91.3%) |
| Arts, Entertainment & Recreation | 0 (0.0%) | 0 (0.0%) |
| Accommodation & Food Services | 29 (37.7%) | 48 (62.3%) |
| Public Administration | 39 (83.0%) | 8 (17.0%) |
| Total | 501 (51.8%) | 466 (48.2%) |
Education in Henryville
School Enrollment in Henryville
The most common levels of schooling among the 376 students in Henryville are high school (144 | 38.3%), elementary school (62 | 16.5%), and middle school (52 | 13.8%).
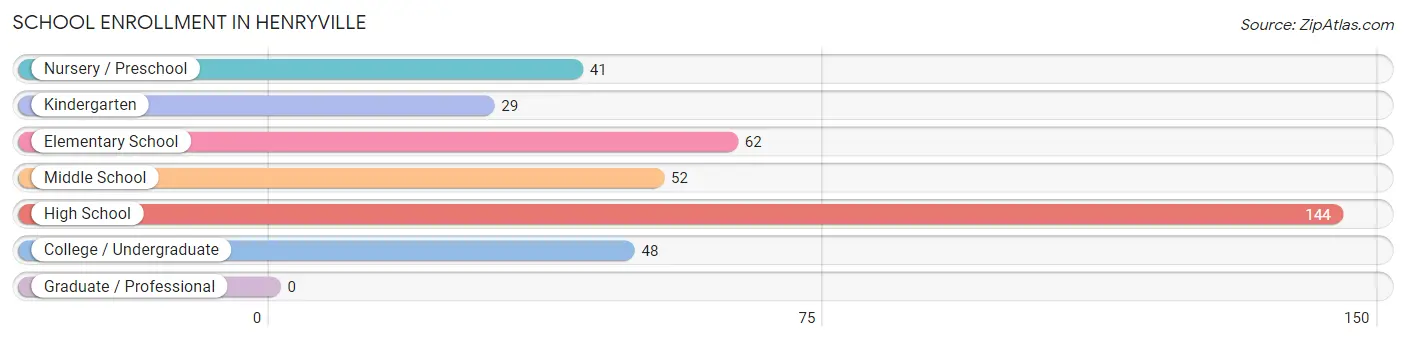
| School Level | # Students | % Students |
| Nursery / Preschool | 41 | 10.9% |
| Kindergarten | 29 | 7.7% |
| Elementary School | 62 | 16.5% |
| Middle School | 52 | 13.8% |
| High School | 144 | 38.3% |
| College / Undergraduate | 48 | 12.8% |
| Graduate / Professional | 0 | 0.0% |
| Total | 376 | 100.0% |
School Enrollment by Age by Funding Source in Henryville
Out of a total of 376 students who are enrolled in schools in Henryville, 60 (16.0%) attend a private institution, while the remaining 316 (84.0%) are enrolled in public schools. The age group of 3 to 4 year olds has the highest likelihood of being enrolled in private schools, with 8 (38.1% in the age bracket) enrolled. Conversely, the age group of 10 to 14 year olds has the lowest likelihood of being enrolled in a private school, with 62 (100.0% in the age bracket) attending a public institution.
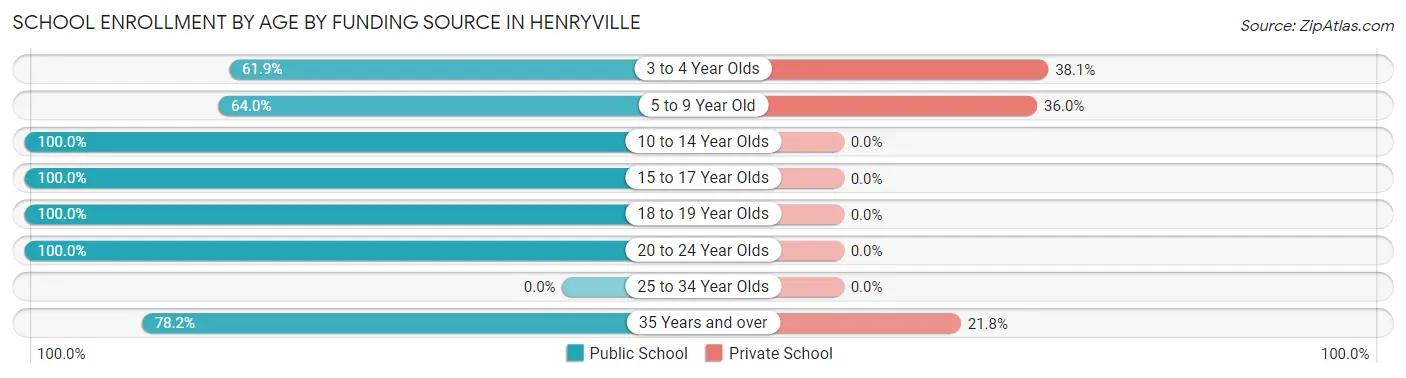
| Age Bracket | Public School | Private School |
| 3 to 4 Year Olds | 13 (61.9%) | 8 (38.1%) |
| 5 to 9 Year Old | 71 (64.0%) | 40 (36.0%) |
| 10 to 14 Year Olds | 62 (100.0%) | 0 (0.0%) |
| 15 to 17 Year Olds | 53 (100.0%) | 0 (0.0%) |
| 18 to 19 Year Olds | 37 (100.0%) | 0 (0.0%) |
| 20 to 24 Year Olds | 37 (100.0%) | 0 (0.0%) |
| 25 to 34 Year Olds | 0 (0.0%) | 0 (0.0%) |
| 35 Years and over | 43 (78.2%) | 12 (21.8%) |
| Total | 316 (84.0%) | 60 (16.0%) |
Educational Attainment by Field of Study in Henryville
Business (54 | 31.0%), science & technology (43 | 24.7%), liberal arts & history (23 | 13.2%), education (21 | 12.1%), and arts & humanities (21 | 12.1%) are the most common fields of study among 174 individuals in Henryville who have obtained a bachelor's degree or higher.
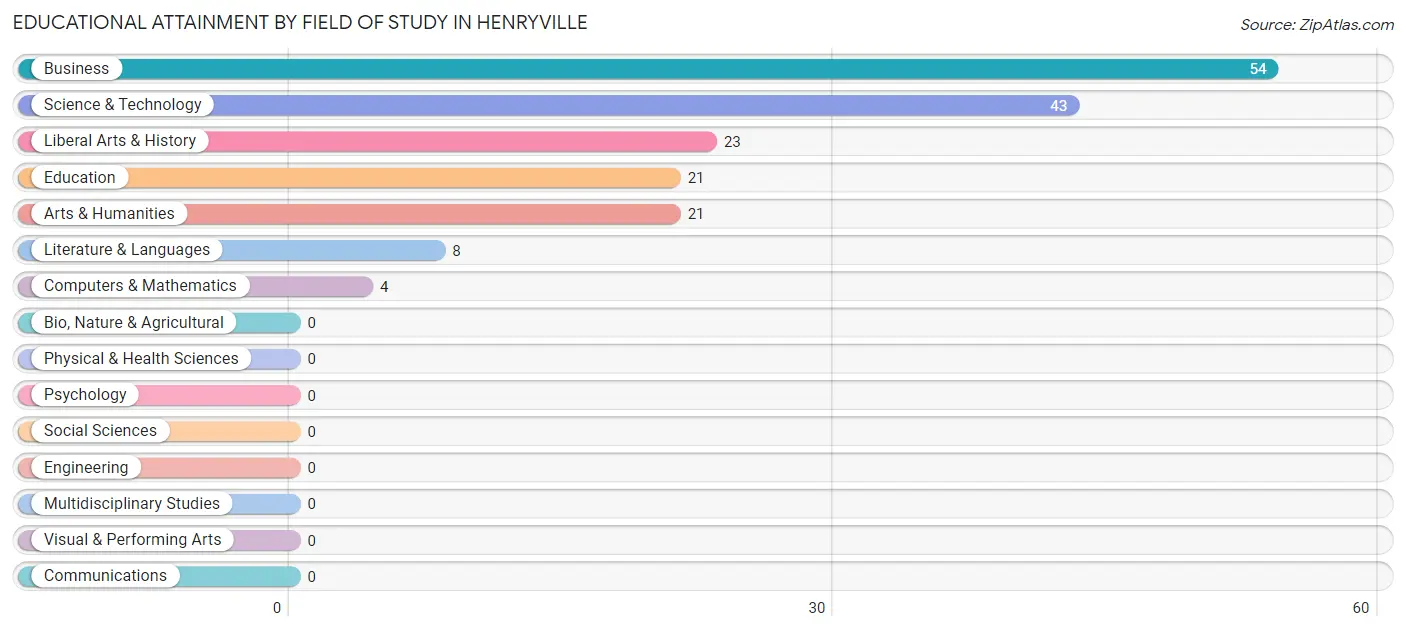
| Field of Study | # Graduates | % Graduates |
| Computers & Mathematics | 4 | 2.3% |
| Bio, Nature & Agricultural | 0 | 0.0% |
| Physical & Health Sciences | 0 | 0.0% |
| Psychology | 0 | 0.0% |
| Social Sciences | 0 | 0.0% |
| Engineering | 0 | 0.0% |
| Multidisciplinary Studies | 0 | 0.0% |
| Science & Technology | 43 | 24.7% |
| Business | 54 | 31.0% |
| Education | 21 | 12.1% |
| Literature & Languages | 8 | 4.6% |
| Liberal Arts & History | 23 | 13.2% |
| Visual & Performing Arts | 0 | 0.0% |
| Communications | 0 | 0.0% |
| Arts & Humanities | 21 | 12.1% |
| Total | 174 | 100.0% |
Transportation & Commute in Henryville
Vehicle Availability by Sex in Henryville
The most prevalent vehicle ownership categories in Henryville are males with 2 vehicles (247, accounting for 50.4%) and females with 2 vehicles (196, making up 53.0%).
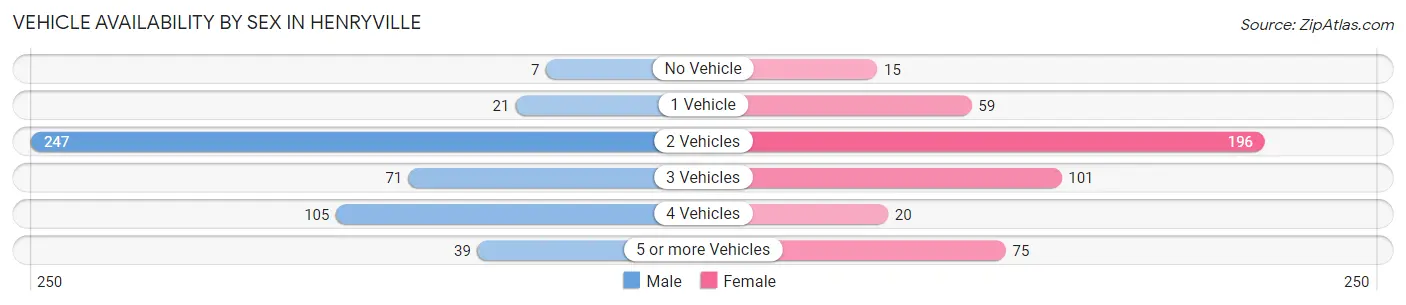
| Vehicles Available | Male | Female |
| No Vehicle | 7 (1.4%) | 15 (3.2%) |
| 1 Vehicle | 21 (4.3%) | 59 (12.7%) |
| 2 Vehicles | 247 (50.4%) | 196 (42.1%) |
| 3 Vehicles | 71 (14.5%) | 101 (21.7%) |
| 4 Vehicles | 105 (21.4%) | 20 (4.3%) |
| 5 or more Vehicles | 39 (8.0%) | 75 (16.1%) |
| Total | 490 (100.0%) | 466 (100.0%) |
Commute Time in Henryville
The most frequently occuring commute durations in Henryville are 20 to 24 minutes (236 commuters, 26.7%), 25 to 29 minutes (147 commuters, 16.6%), and 30 to 34 minutes (132 commuters, 14.9%).
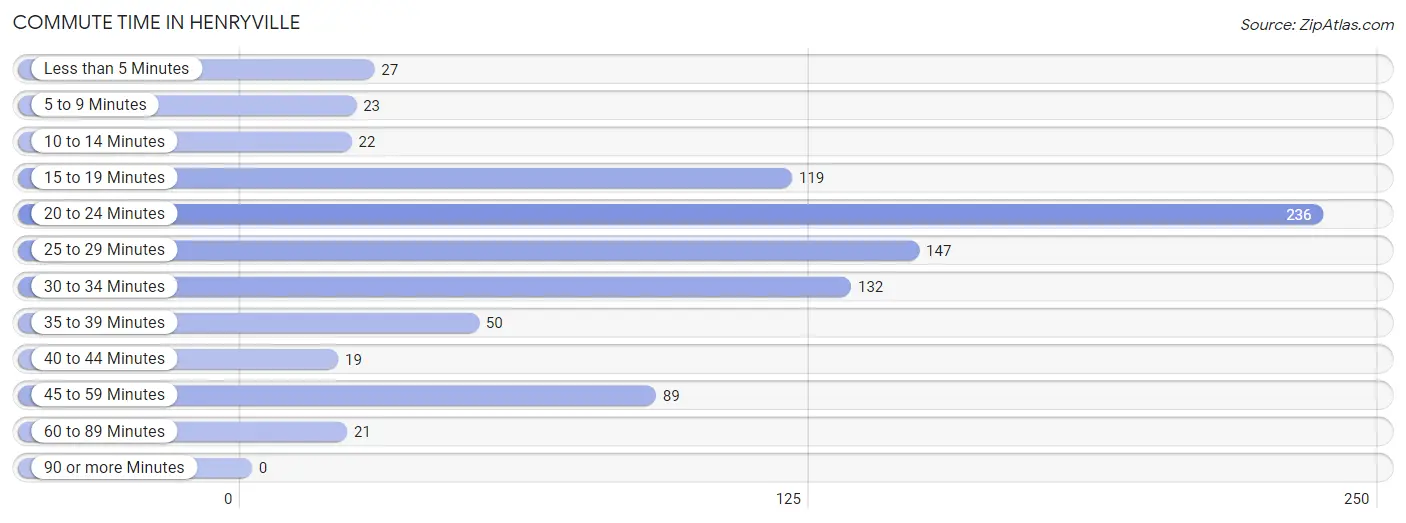
| Commute Time | # Commuters | % Commuters |
| Less than 5 Minutes | 27 | 3.0% |
| 5 to 9 Minutes | 23 | 2.6% |
| 10 to 14 Minutes | 22 | 2.5% |
| 15 to 19 Minutes | 119 | 13.5% |
| 20 to 24 Minutes | 236 | 26.7% |
| 25 to 29 Minutes | 147 | 16.6% |
| 30 to 34 Minutes | 132 | 14.9% |
| 35 to 39 Minutes | 50 | 5.7% |
| 40 to 44 Minutes | 19 | 2.1% |
| 45 to 59 Minutes | 89 | 10.1% |
| 60 to 89 Minutes | 21 | 2.4% |
| 90 or more Minutes | 0 | 0.0% |
Commute Time by Sex in Henryville
The most common commute times in Henryville are 25 to 29 minutes (89 commuters, 19.3%) for males and 20 to 24 minutes (154 commuters, 36.3%) for females.
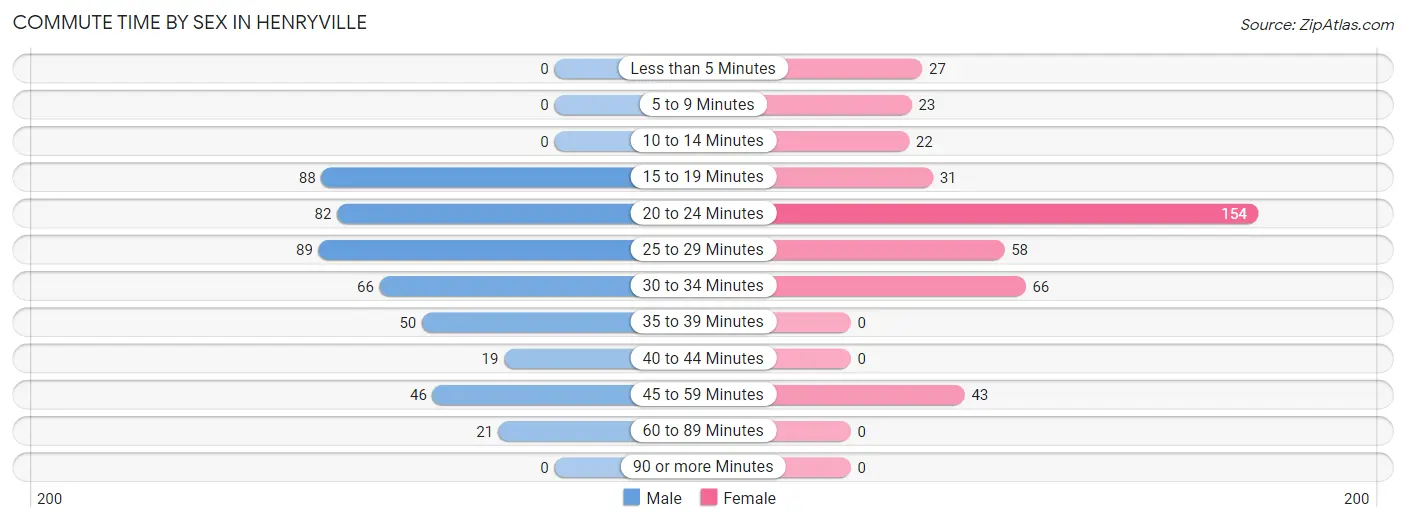
| Commute Time | Male | Female |
| Less than 5 Minutes | 0 (0.0%) | 27 (6.4%) |
| 5 to 9 Minutes | 0 (0.0%) | 23 (5.4%) |
| 10 to 14 Minutes | 0 (0.0%) | 22 (5.2%) |
| 15 to 19 Minutes | 88 (19.1%) | 31 (7.3%) |
| 20 to 24 Minutes | 82 (17.8%) | 154 (36.3%) |
| 25 to 29 Minutes | 89 (19.3%) | 58 (13.7%) |
| 30 to 34 Minutes | 66 (14.3%) | 66 (15.6%) |
| 35 to 39 Minutes | 50 (10.8%) | 0 (0.0%) |
| 40 to 44 Minutes | 19 (4.1%) | 0 (0.0%) |
| 45 to 59 Minutes | 46 (10.0%) | 43 (10.1%) |
| 60 to 89 Minutes | 21 (4.6%) | 0 (0.0%) |
| 90 or more Minutes | 0 (0.0%) | 0 (0.0%) |
Time of Departure to Work by Sex in Henryville
The most frequent times of departure to work in Henryville are 7:30 AM to 7:59 AM (130, 28.2%) for males and 4:00 PM to 11:59 PM (72, 17.0%) for females.
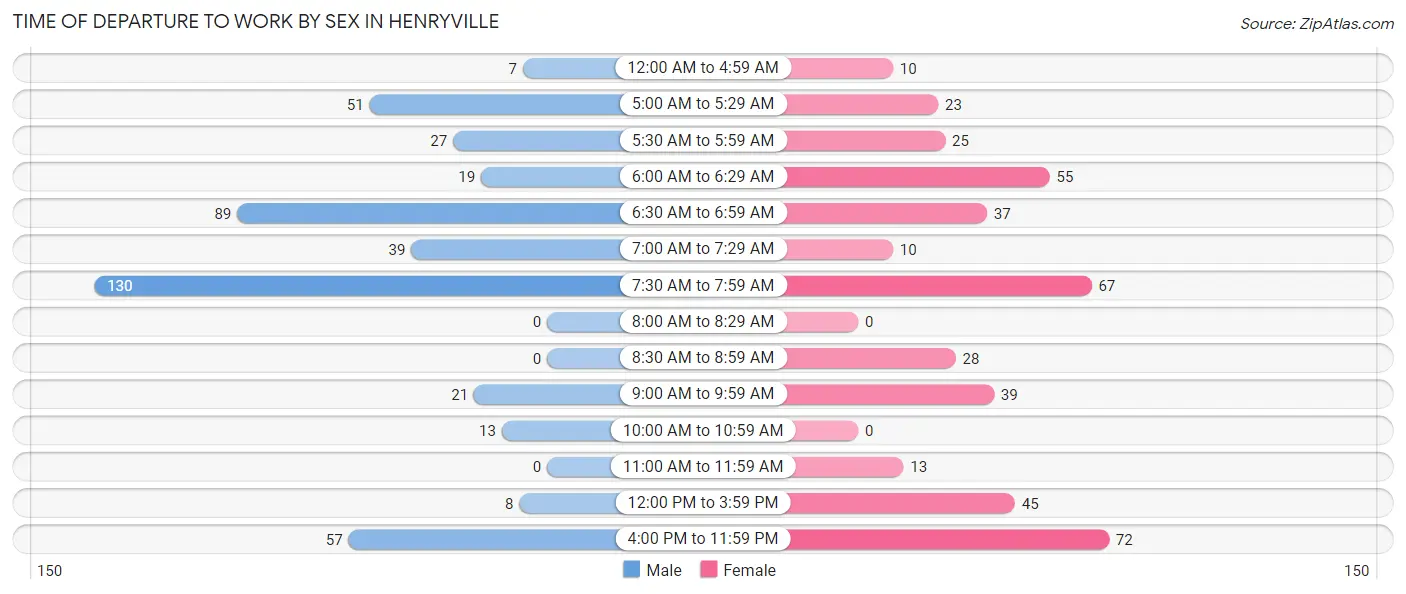
| Time of Departure | Male | Female |
| 12:00 AM to 4:59 AM | 7 (1.5%) | 10 (2.4%) |
| 5:00 AM to 5:29 AM | 51 (11.1%) | 23 (5.4%) |
| 5:30 AM to 5:59 AM | 27 (5.9%) | 25 (5.9%) |
| 6:00 AM to 6:29 AM | 19 (4.1%) | 55 (13.0%) |
| 6:30 AM to 6:59 AM | 89 (19.3%) | 37 (8.7%) |
| 7:00 AM to 7:29 AM | 39 (8.5%) | 10 (2.4%) |
| 7:30 AM to 7:59 AM | 130 (28.2%) | 67 (15.8%) |
| 8:00 AM to 8:29 AM | 0 (0.0%) | 0 (0.0%) |
| 8:30 AM to 8:59 AM | 0 (0.0%) | 28 (6.6%) |
| 9:00 AM to 9:59 AM | 21 (4.6%) | 39 (9.2%) |
| 10:00 AM to 10:59 AM | 13 (2.8%) | 0 (0.0%) |
| 11:00 AM to 11:59 AM | 0 (0.0%) | 13 (3.1%) |
| 12:00 PM to 3:59 PM | 8 (1.7%) | 45 (10.6%) |
| 4:00 PM to 11:59 PM | 57 (12.4%) | 72 (17.0%) |
| Total | 461 (100.0%) | 424 (100.0%) |
Housing Occupancy in Henryville
Occupancy by Ownership in Henryville
Of the total 687 dwellings in Henryville, owner-occupied units account for 551 (80.2%), while renter-occupied units make up 136 (19.8%).
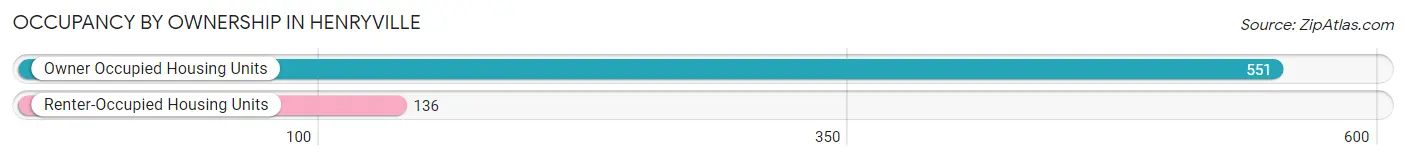
| Occupancy | # Housing Units | % Housing Units |
| Owner Occupied Housing Units | 551 | 80.2% |
| Renter-Occupied Housing Units | 136 | 19.8% |
| Total Occupied Housing Units | 687 | 100.0% |
Occupancy by Household Size in Henryville
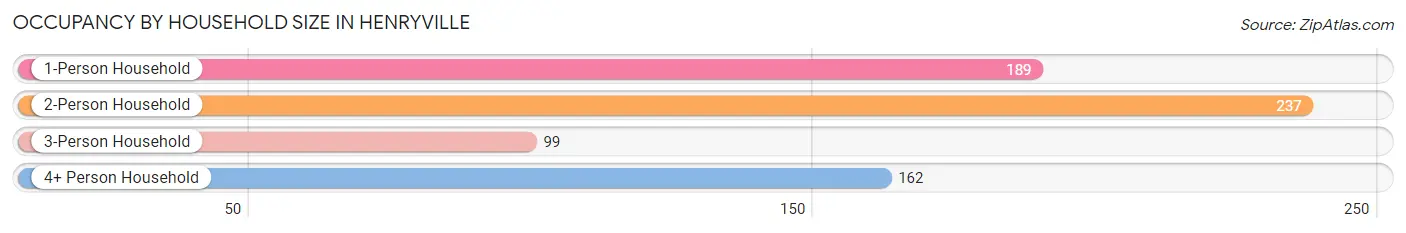
| Household Size | # Housing Units | % Housing Units |
| 1-Person Household | 189 | 27.5% |
| 2-Person Household | 237 | 34.5% |
| 3-Person Household | 99 | 14.4% |
| 4+ Person Household | 162 | 23.6% |
| Total Housing Units | 687 | 100.0% |
Occupancy by Ownership by Household Size in Henryville
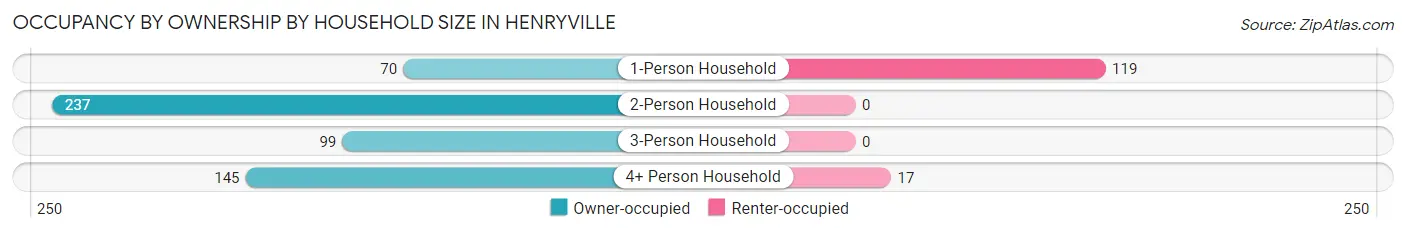
| Household Size | Owner-occupied | Renter-occupied |
| 1-Person Household | 70 (37.0%) | 119 (63.0%) |
| 2-Person Household | 237 (100.0%) | 0 (0.0%) |
| 3-Person Household | 99 (100.0%) | 0 (0.0%) |
| 4+ Person Household | 145 (89.5%) | 17 (10.5%) |
| Total Housing Units | 551 (80.2%) | 136 (19.8%) |
Occupancy by Educational Attainment in Henryville
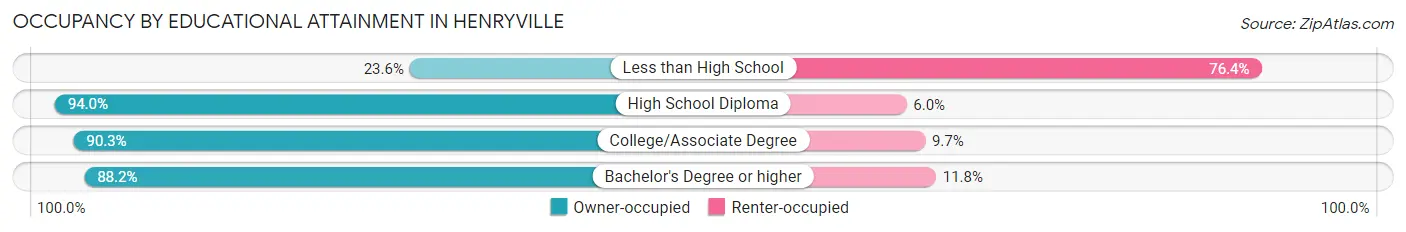
| Household Size | Owner-occupied | Renter-occupied |
| Less than High School | 26 (23.6%) | 84 (76.4%) |
| High School Diploma | 157 (94.0%) | 10 (6.0%) |
| College/Associate Degree | 271 (90.3%) | 29 (9.7%) |
| Bachelor's Degree or higher | 97 (88.2%) | 13 (11.8%) |
Occupancy by Age of Householder in Henryville
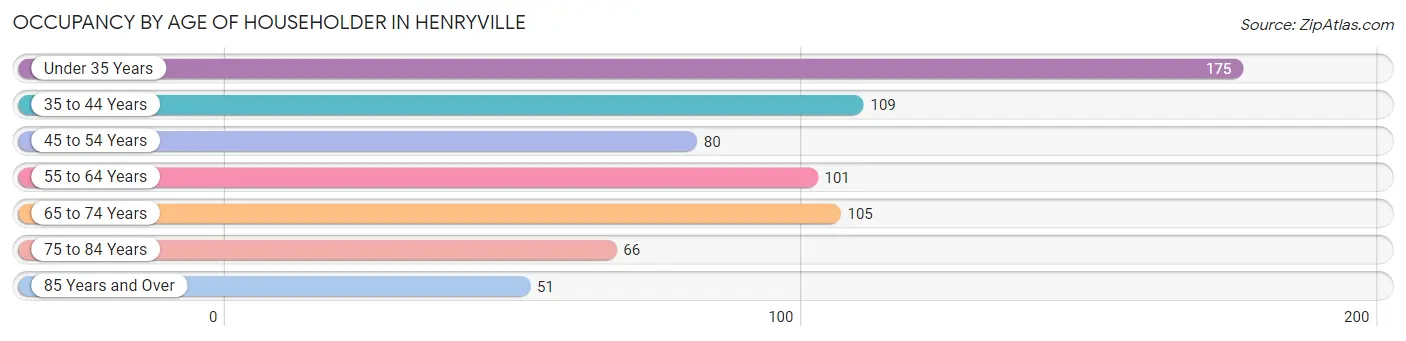
| Age Bracket | # Households | % Households |
| Under 35 Years | 175 | 25.5% |
| 35 to 44 Years | 109 | 15.9% |
| 45 to 54 Years | 80 | 11.6% |
| 55 to 64 Years | 101 | 14.7% |
| 65 to 74 Years | 105 | 15.3% |
| 75 to 84 Years | 66 | 9.6% |
| 85 Years and Over | 51 | 7.4% |
| Total | 687 | 100.0% |
Housing Finances in Henryville
Median Income by Occupancy in Henryville
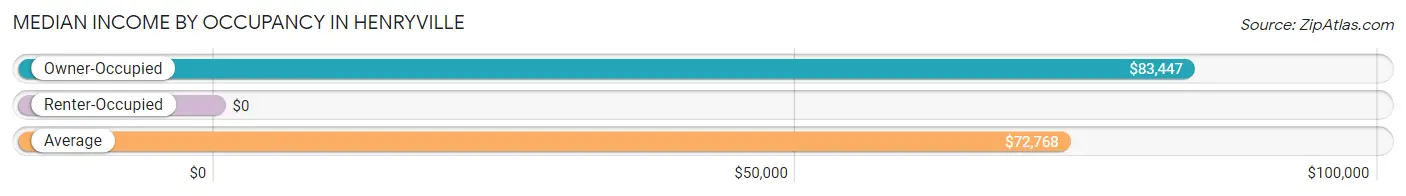
| Occupancy Type | # Households | Median Income |
| Owner-Occupied | 551 (80.2%) | $83,447 |
| Renter-Occupied | 136 (19.8%) | $0 |
| Average | 687 (100.0%) | $72,768 |
Occupancy by Householder Income Bracket in Henryville
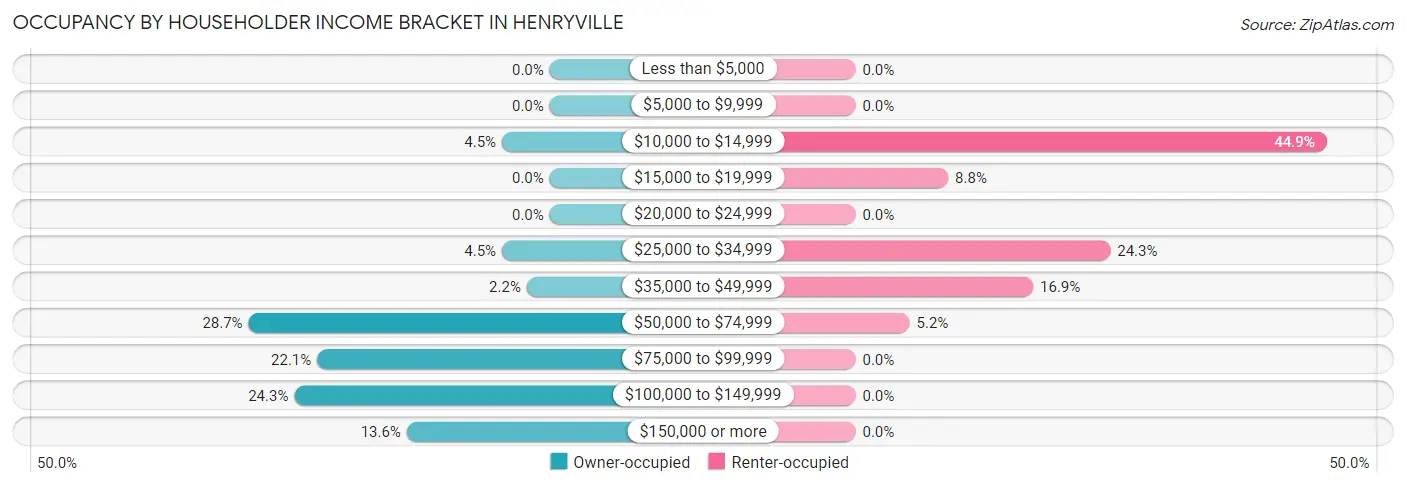
| Income Bracket | Owner-occupied | Renter-occupied |
| Less than $5,000 | 0 (0.0%) | 0 (0.0%) |
| $5,000 to $9,999 | 0 (0.0%) | 0 (0.0%) |
| $10,000 to $14,999 | 25 (4.5%) | 61 (44.9%) |
| $15,000 to $19,999 | 0 (0.0%) | 12 (8.8%) |
| $20,000 to $24,999 | 0 (0.0%) | 0 (0.0%) |
| $25,000 to $34,999 | 25 (4.5%) | 33 (24.3%) |
| $35,000 to $49,999 | 12 (2.2%) | 23 (16.9%) |
| $50,000 to $74,999 | 158 (28.7%) | 7 (5.1%) |
| $75,000 to $99,999 | 122 (22.1%) | 0 (0.0%) |
| $100,000 to $149,999 | 134 (24.3%) | 0 (0.0%) |
| $150,000 or more | 75 (13.6%) | 0 (0.0%) |
| Total | 551 (100.0%) | 136 (100.0%) |
Monthly Housing Cost Tiers in Henryville
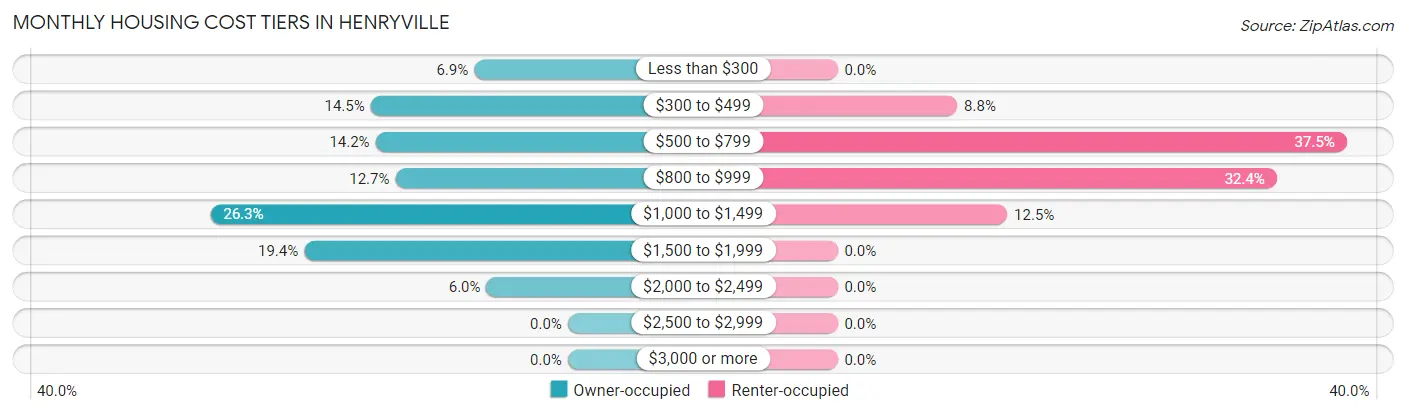
| Monthly Cost | Owner-occupied | Renter-occupied |
| Less than $300 | 38 (6.9%) | 0 (0.0%) |
| $300 to $499 | 80 (14.5%) | 12 (8.8%) |
| $500 to $799 | 78 (14.2%) | 51 (37.5%) |
| $800 to $999 | 70 (12.7%) | 44 (32.4%) |
| $1,000 to $1,499 | 145 (26.3%) | 17 (12.5%) |
| $1,500 to $1,999 | 107 (19.4%) | 0 (0.0%) |
| $2,000 to $2,499 | 33 (6.0%) | 0 (0.0%) |
| $2,500 to $2,999 | 0 (0.0%) | 0 (0.0%) |
| $3,000 or more | 0 (0.0%) | 0 (0.0%) |
| Total | 551 (100.0%) | 136 (100.0%) |
Physical Housing Characteristics in Henryville
Housing Structures in Henryville
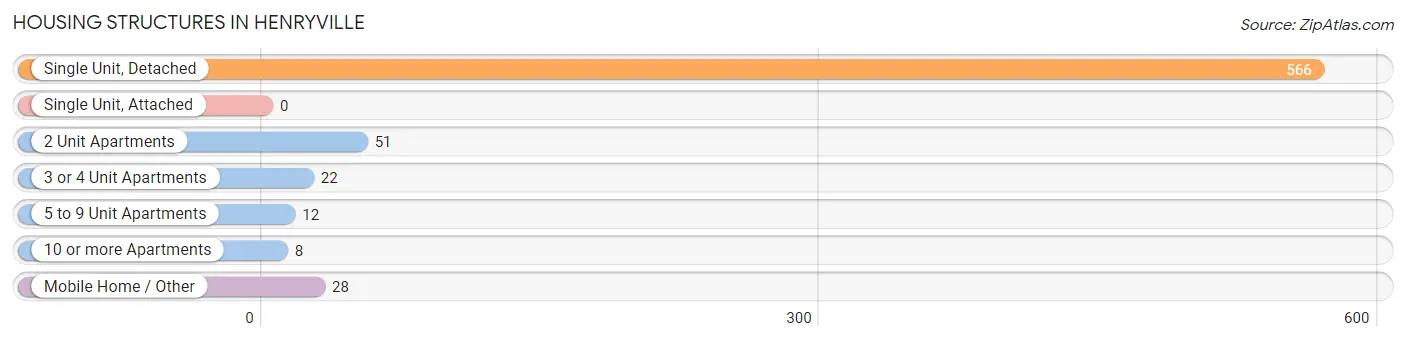
| Structure Type | # Housing Units | % Housing Units |
| Single Unit, Detached | 566 | 82.4% |
| Single Unit, Attached | 0 | 0.0% |
| 2 Unit Apartments | 51 | 7.4% |
| 3 or 4 Unit Apartments | 22 | 3.2% |
| 5 to 9 Unit Apartments | 12 | 1.8% |
| 10 or more Apartments | 8 | 1.2% |
| Mobile Home / Other | 28 | 4.1% |
| Total | 687 | 100.0% |
Housing Structures by Occupancy in Henryville
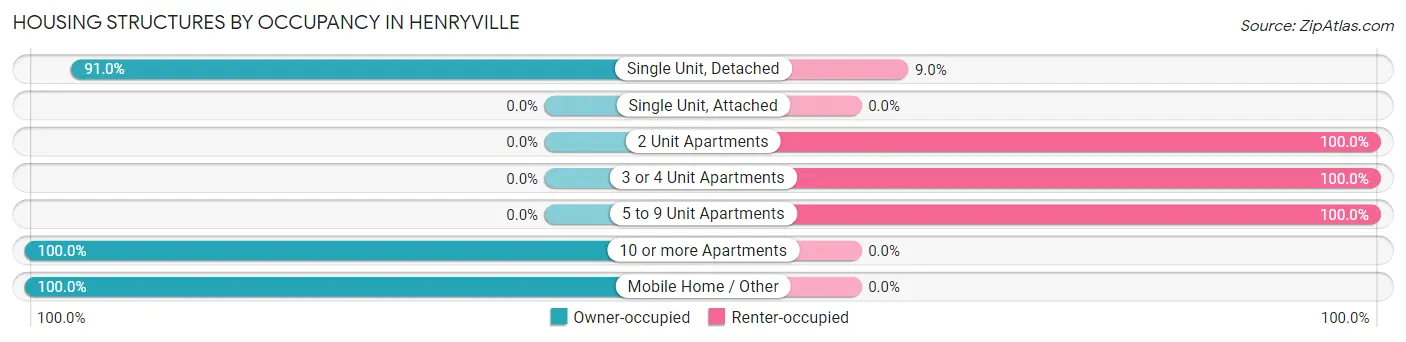
| Structure Type | Owner-occupied | Renter-occupied |
| Single Unit, Detached | 515 (91.0%) | 51 (9.0%) |
| Single Unit, Attached | 0 (0.0%) | 0 (0.0%) |
| 2 Unit Apartments | 0 (0.0%) | 51 (100.0%) |
| 3 or 4 Unit Apartments | 0 (0.0%) | 22 (100.0%) |
| 5 to 9 Unit Apartments | 0 (0.0%) | 12 (100.0%) |
| 10 or more Apartments | 8 (100.0%) | 0 (0.0%) |
| Mobile Home / Other | 28 (100.0%) | 0 (0.0%) |
| Total | 551 (80.2%) | 136 (19.8%) |
Housing Structures by Number of Rooms in Henryville
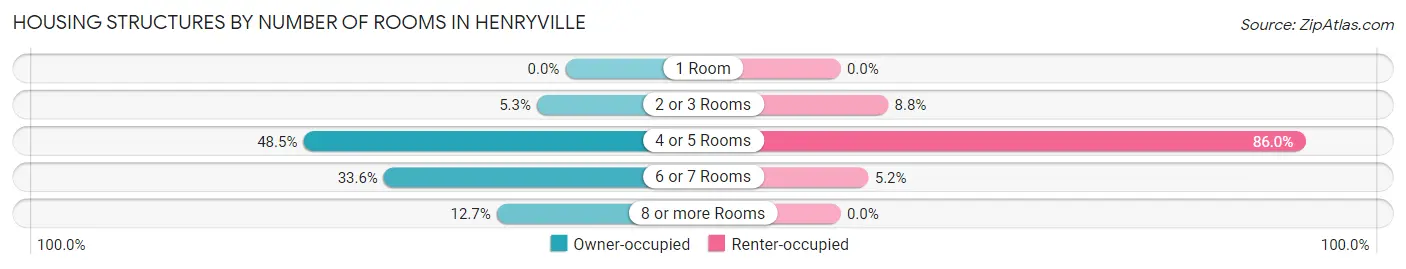
| Number of Rooms | Owner-occupied | Renter-occupied |
| 1 Room | 0 (0.0%) | 0 (0.0%) |
| 2 or 3 Rooms | 29 (5.3%) | 12 (8.8%) |
| 4 or 5 Rooms | 267 (48.5%) | 117 (86.0%) |
| 6 or 7 Rooms | 185 (33.6%) | 7 (5.1%) |
| 8 or more Rooms | 70 (12.7%) | 0 (0.0%) |
| Total | 551 (100.0%) | 136 (100.0%) |
Housing Structure by Heating Type in Henryville
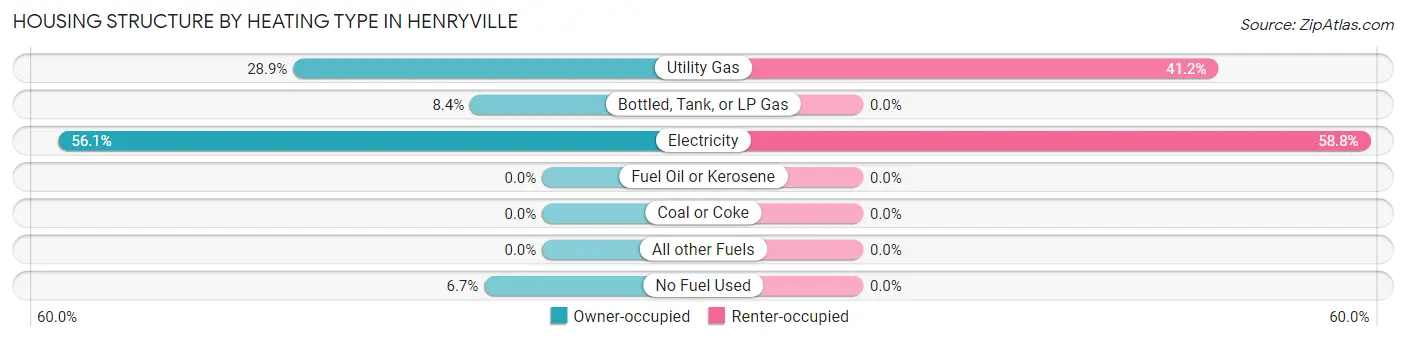
| Heating Type | Owner-occupied | Renter-occupied |
| Utility Gas | 159 (28.9%) | 56 (41.2%) |
| Bottled, Tank, or LP Gas | 46 (8.4%) | 0 (0.0%) |
| Electricity | 309 (56.1%) | 80 (58.8%) |
| Fuel Oil or Kerosene | 0 (0.0%) | 0 (0.0%) |
| Coal or Coke | 0 (0.0%) | 0 (0.0%) |
| All other Fuels | 0 (0.0%) | 0 (0.0%) |
| No Fuel Used | 37 (6.7%) | 0 (0.0%) |
| Total | 551 (100.0%) | 136 (100.0%) |
Household Vehicle Usage in Henryville
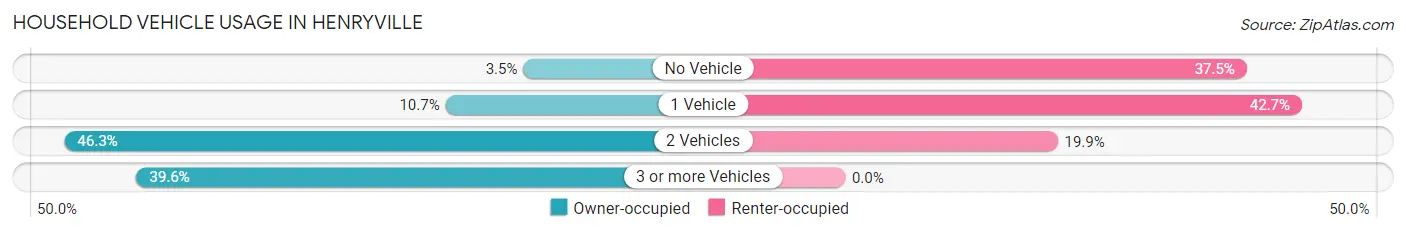
| Vehicles per Household | Owner-occupied | Renter-occupied |
| No Vehicle | 19 (3.5%) | 51 (37.5%) |
| 1 Vehicle | 59 (10.7%) | 58 (42.6%) |
| 2 Vehicles | 255 (46.3%) | 27 (19.9%) |
| 3 or more Vehicles | 218 (39.6%) | 0 (0.0%) |
| Total | 551 (100.0%) | 136 (100.0%) |
Real Estate & Mortgages in Henryville
Real Estate and Mortgage Overview in Henryville
| Characteristic | Without Mortgage | With Mortgage |
| Housing Units | 156 | 395 |
| Median Property Value | $150,000 | $189,900 |
| Median Household Income | $56,339 | $75 |
| Monthly Housing Costs | $447 | $0 |
| Real Estate Taxes | $915 | $0 |
Property Value by Mortgage Status in Henryville
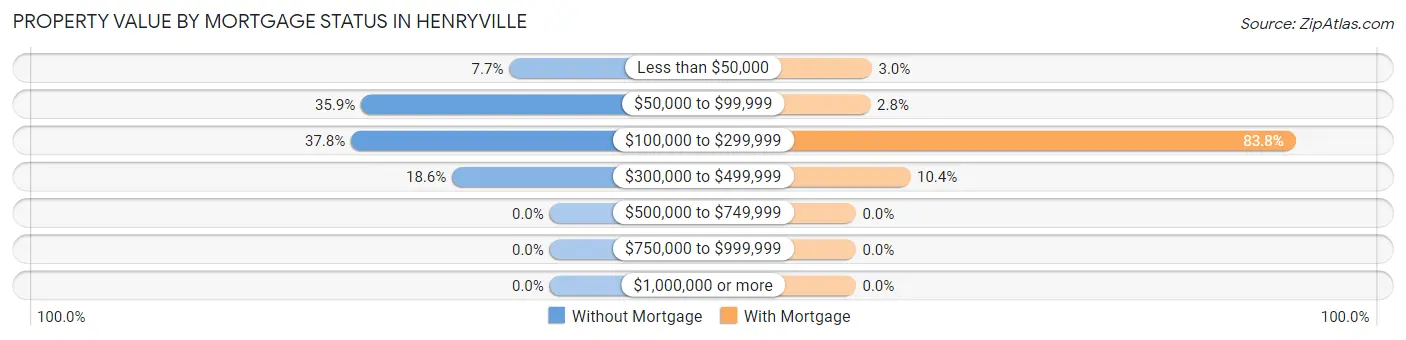
| Property Value | Without Mortgage | With Mortgage |
| Less than $50,000 | 12 (7.7%) | 12 (3.0%) |
| $50,000 to $99,999 | 56 (35.9%) | 11 (2.8%) |
| $100,000 to $299,999 | 59 (37.8%) | 331 (83.8%) |
| $300,000 to $499,999 | 29 (18.6%) | 41 (10.4%) |
| $500,000 to $749,999 | 0 (0.0%) | 0 (0.0%) |
| $750,000 to $999,999 | 0 (0.0%) | 0 (0.0%) |
| $1,000,000 or more | 0 (0.0%) | 0 (0.0%) |
| Total | 156 (100.0%) | 395 (100.0%) |
Household Income by Mortgage Status in Henryville
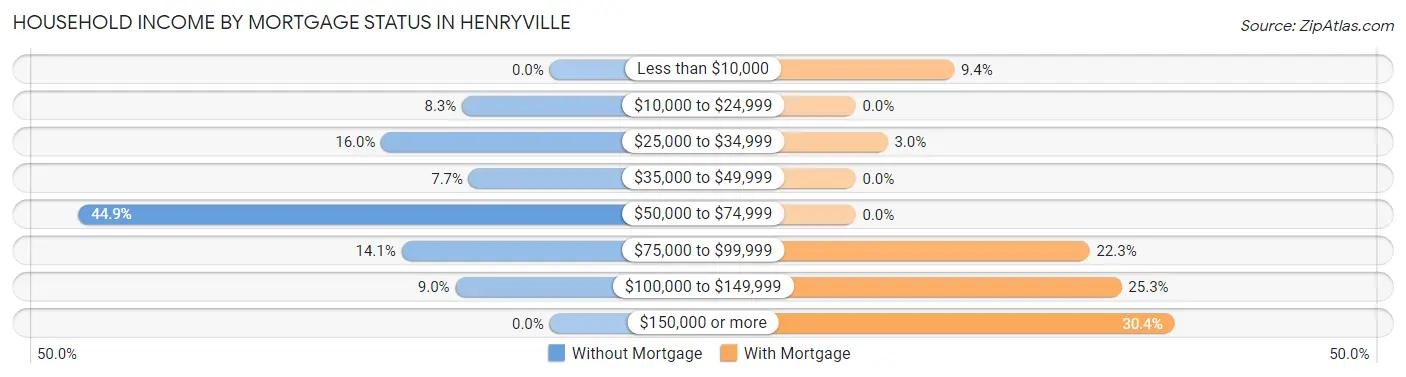
| Household Income | Without Mortgage | With Mortgage |
| Less than $10,000 | 0 (0.0%) | 37 (9.4%) |
| $10,000 to $24,999 | 13 (8.3%) | 0 (0.0%) |
| $25,000 to $34,999 | 25 (16.0%) | 12 (3.0%) |
| $35,000 to $49,999 | 12 (7.7%) | 0 (0.0%) |
| $50,000 to $74,999 | 70 (44.9%) | 0 (0.0%) |
| $75,000 to $99,999 | 22 (14.1%) | 88 (22.3%) |
| $100,000 to $149,999 | 14 (9.0%) | 100 (25.3%) |
| $150,000 or more | 0 (0.0%) | 120 (30.4%) |
| Total | 156 (100.0%) | 395 (100.0%) |
Property Value to Household Income Ratio in Henryville
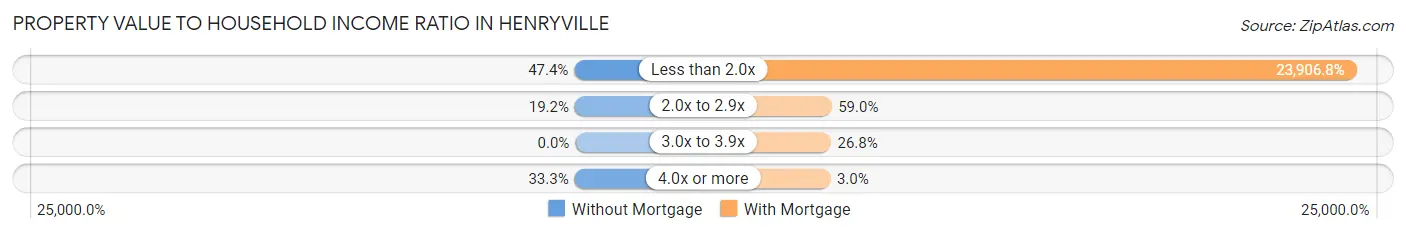
| Value-to-Income Ratio | Without Mortgage | With Mortgage |
| Less than 2.0x | 74 (47.4%) | 94,432 (23,906.8%) |
| 2.0x to 2.9x | 30 (19.2%) | 233 (59.0%) |
| 3.0x to 3.9x | 0 (0.0%) | 106 (26.8%) |
| 4.0x or more | 52 (33.3%) | 12 (3.0%) |
| Total | 156 (100.0%) | 395 (100.0%) |
Real Estate Taxes by Mortgage Status in Henryville
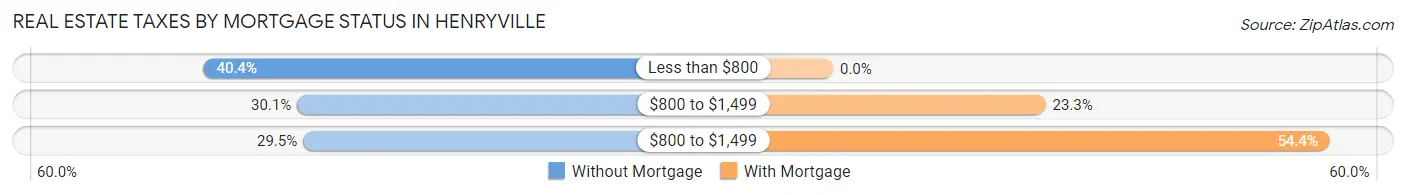
| Property Taxes | Without Mortgage | With Mortgage |
| Less than $800 | 63 (40.4%) | 0 (0.0%) |
| $800 to $1,499 | 47 (30.1%) | 92 (23.3%) |
| $800 to $1,499 | 46 (29.5%) | 215 (54.4%) |
| Total | 156 (100.0%) | 395 (100.0%) |
Health & Disability in Henryville
Health Insurance Coverage by Age in Henryville
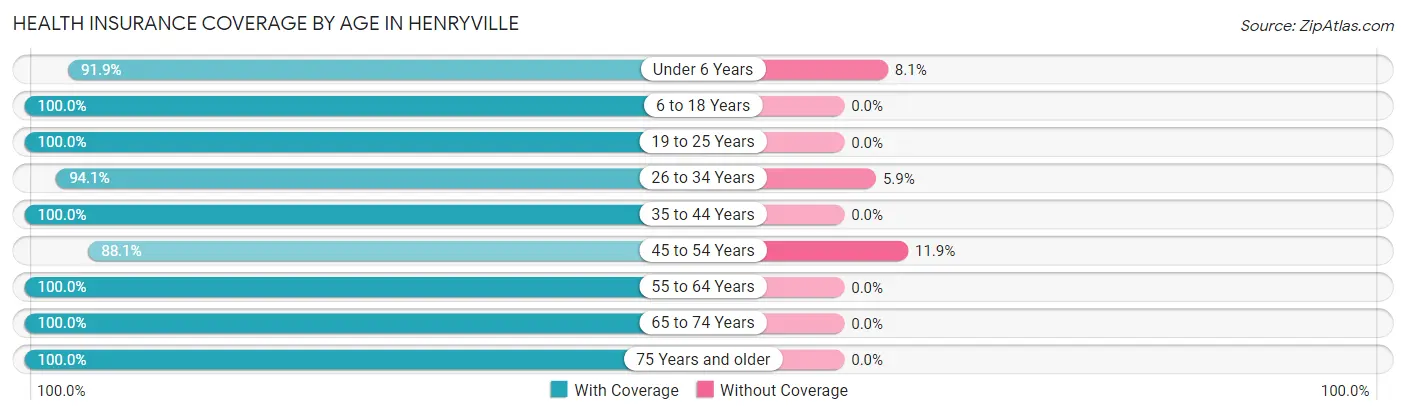
| Age Bracket | With Coverage | Without Coverage |
| Under 6 Years | 192 (91.9%) | 17 (8.1%) |
| 6 to 18 Years | 217 (100.0%) | 0 (0.0%) |
| 19 to 25 Years | 208 (100.0%) | 0 (0.0%) |
| 26 to 34 Years | 207 (94.1%) | 13 (5.9%) |
| 35 to 44 Years | 226 (100.0%) | 0 (0.0%) |
| 45 to 54 Years | 126 (88.1%) | 17 (11.9%) |
| 55 to 64 Years | 204 (100.0%) | 0 (0.0%) |
| 65 to 74 Years | 188 (100.0%) | 0 (0.0%) |
| 75 Years and older | 222 (100.0%) | 0 (0.0%) |
| Total | 1,790 (97.4%) | 47 (2.6%) |
Health Insurance Coverage by Citizenship Status in Henryville
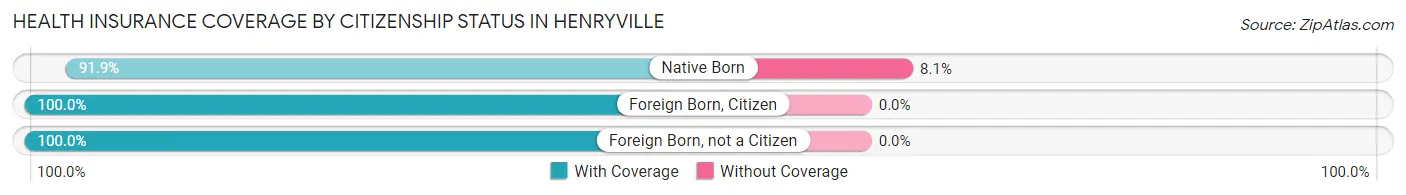
| Citizenship Status | With Coverage | Without Coverage |
| Native Born | 192 (91.9%) | 17 (8.1%) |
| Foreign Born, Citizen | 217 (100.0%) | 0 (0.0%) |
| Foreign Born, not a Citizen | 208 (100.0%) | 0 (0.0%) |
Health Insurance Coverage by Household Income in Henryville
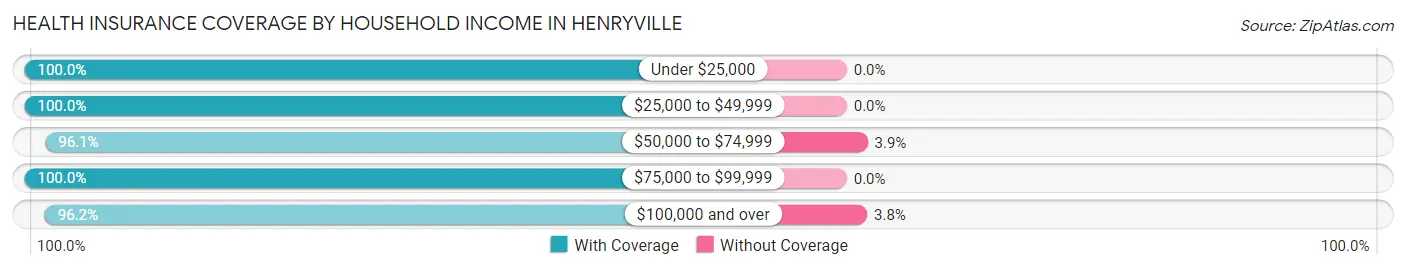
| Household Income | With Coverage | Without Coverage |
| Under $25,000 | 157 (100.0%) | 0 (0.0%) |
| $25,000 to $49,999 | 142 (100.0%) | 0 (0.0%) |
| $50,000 to $74,999 | 419 (96.1%) | 17 (3.9%) |
| $75,000 to $99,999 | 313 (100.0%) | 0 (0.0%) |
| $100,000 and over | 759 (96.2%) | 30 (3.8%) |
Public vs Private Health Insurance Coverage by Age in Henryville
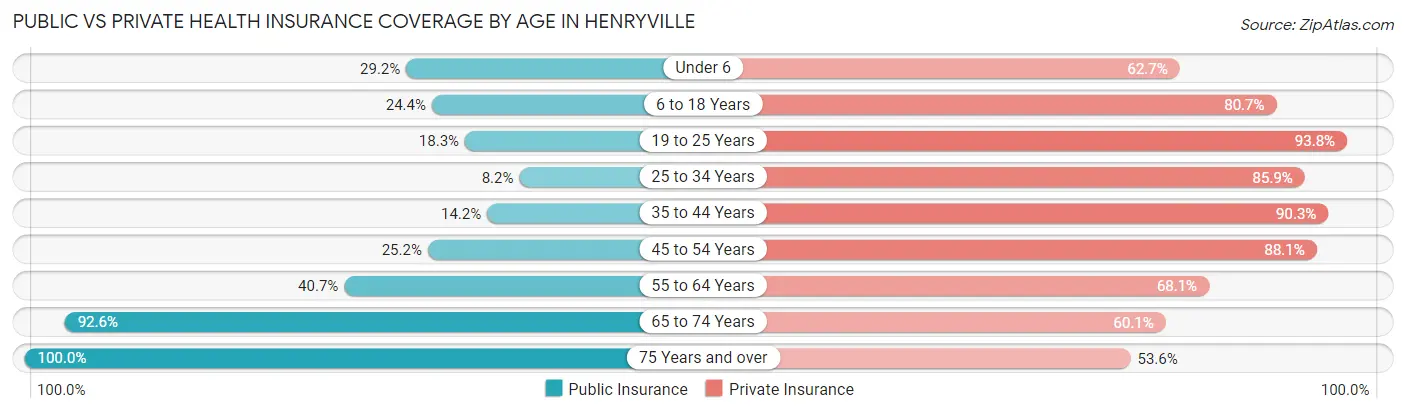
| Age Bracket | Public Insurance | Private Insurance |
| Under 6 | 61 (29.2%) | 131 (62.7%) |
| 6 to 18 Years | 53 (24.4%) | 175 (80.6%) |
| 19 to 25 Years | 38 (18.3%) | 195 (93.8%) |
| 25 to 34 Years | 18 (8.2%) | 189 (85.9%) |
| 35 to 44 Years | 32 (14.2%) | 204 (90.3%) |
| 45 to 54 Years | 36 (25.2%) | 126 (88.1%) |
| 55 to 64 Years | 83 (40.7%) | 139 (68.1%) |
| 65 to 74 Years | 174 (92.5%) | 113 (60.1%) |
| 75 Years and over | 222 (100.0%) | 119 (53.6%) |
| Total | 717 (39.0%) | 1,391 (75.7%) |
Disability Status by Sex by Age in Henryville
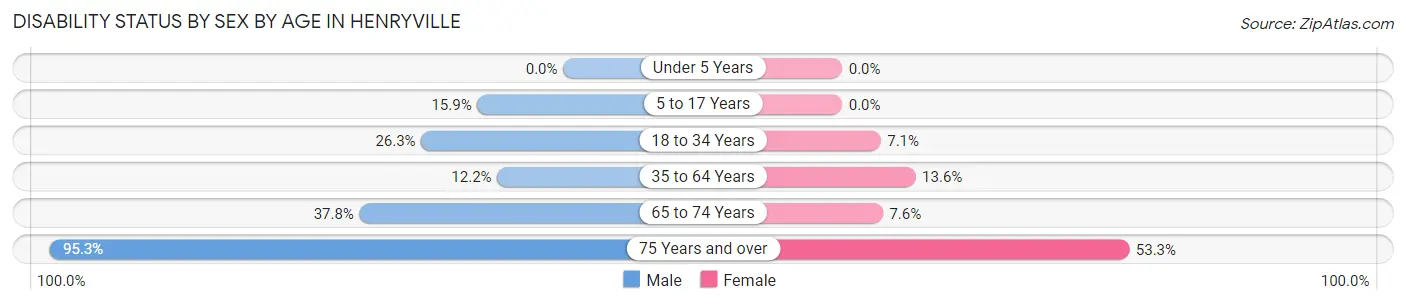
| Age Bracket | Male | Female |
| Under 5 Years | 0 (0.0%) | 0 (0.0%) |
| 5 to 17 Years | 11 (15.9%) | 0 (0.0%) |
| 18 to 34 Years | 54 (26.3%) | 18 (7.1%) |
| 35 to 64 Years | 36 (12.2%) | 38 (13.6%) |
| 65 to 74 Years | 31 (37.8%) | 8 (7.5%) |
| 75 Years and over | 81 (95.3%) | 73 (53.3%) |
Disability Class by Sex by Age in Henryville
Disability Class: Hearing Difficulty
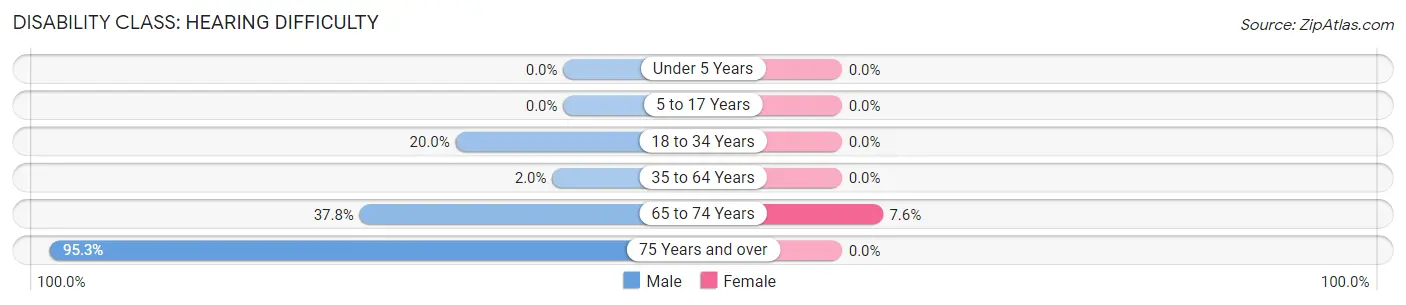
| Age Bracket | Male | Female |
| Under 5 Years | 0 (0.0%) | 0 (0.0%) |
| 5 to 17 Years | 0 (0.0%) | 0 (0.0%) |
| 18 to 34 Years | 41 (20.0%) | 0 (0.0%) |
| 35 to 64 Years | 6 (2.0%) | 0 (0.0%) |
| 65 to 74 Years | 31 (37.8%) | 8 (7.5%) |
| 75 Years and over | 81 (95.3%) | 0 (0.0%) |
Disability Class: Vision Difficulty
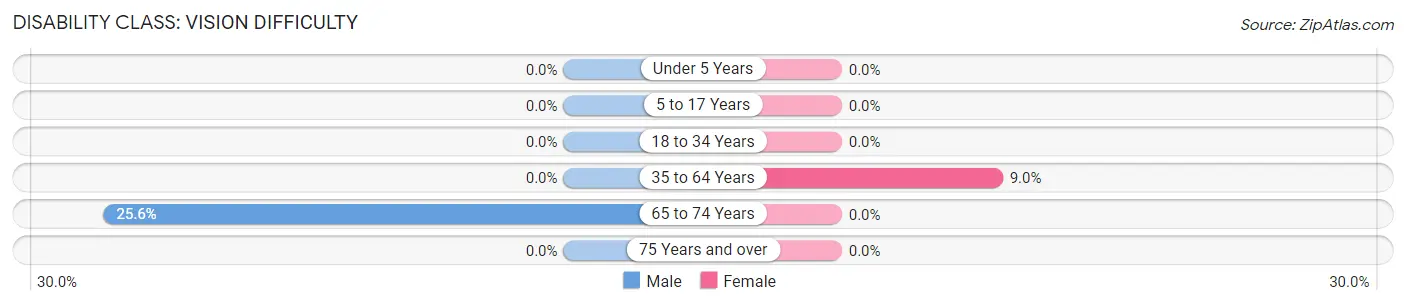
| Age Bracket | Male | Female |
| Under 5 Years | 0 (0.0%) | 0 (0.0%) |
| 5 to 17 Years | 0 (0.0%) | 0 (0.0%) |
| 18 to 34 Years | 0 (0.0%) | 0 (0.0%) |
| 35 to 64 Years | 0 (0.0%) | 25 (9.0%) |
| 65 to 74 Years | 21 (25.6%) | 0 (0.0%) |
| 75 Years and over | 0 (0.0%) | 0 (0.0%) |
Disability Class: Cognitive Difficulty
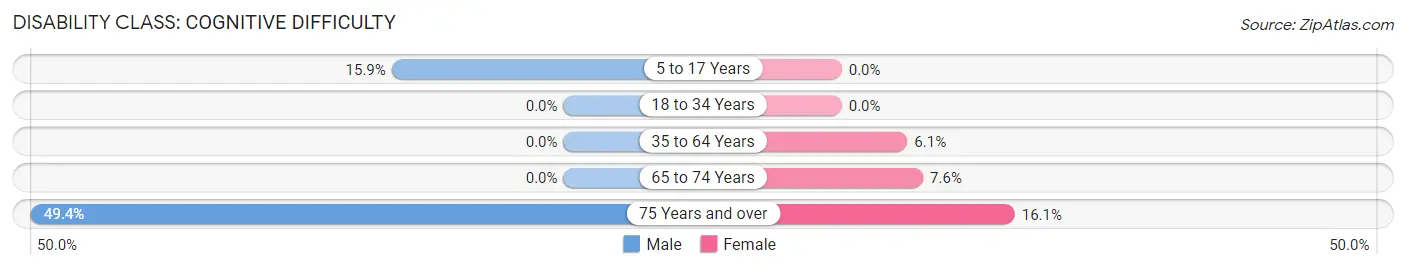
| Age Bracket | Male | Female |
| 5 to 17 Years | 11 (15.9%) | 0 (0.0%) |
| 18 to 34 Years | 0 (0.0%) | 0 (0.0%) |
| 35 to 64 Years | 0 (0.0%) | 17 (6.1%) |
| 65 to 74 Years | 0 (0.0%) | 8 (7.5%) |
| 75 Years and over | 42 (49.4%) | 22 (16.1%) |
Disability Class: Ambulatory Difficulty
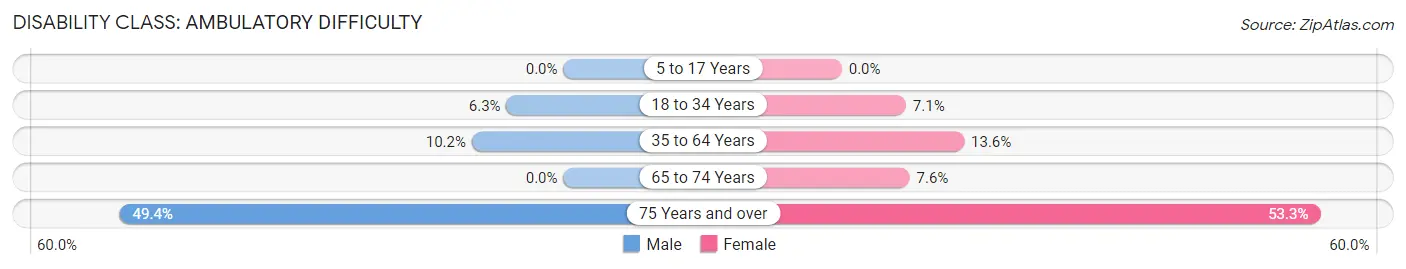
| Age Bracket | Male | Female |
| 5 to 17 Years | 0 (0.0%) | 0 (0.0%) |
| 18 to 34 Years | 13 (6.3%) | 18 (7.1%) |
| 35 to 64 Years | 30 (10.2%) | 38 (13.6%) |
| 65 to 74 Years | 0 (0.0%) | 8 (7.5%) |
| 75 Years and over | 42 (49.4%) | 73 (53.3%) |
Disability Class: Self-Care Difficulty
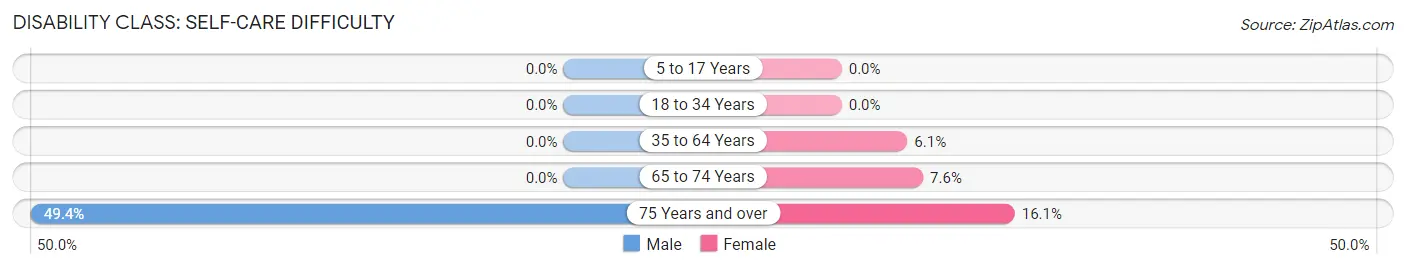
| Age Bracket | Male | Female |
| 5 to 17 Years | 0 (0.0%) | 0 (0.0%) |
| 18 to 34 Years | 0 (0.0%) | 0 (0.0%) |
| 35 to 64 Years | 0 (0.0%) | 17 (6.1%) |
| 65 to 74 Years | 0 (0.0%) | 8 (7.5%) |
| 75 Years and over | 42 (49.4%) | 22 (16.1%) |
Technology Access in Henryville
Computing Device Access in Henryville
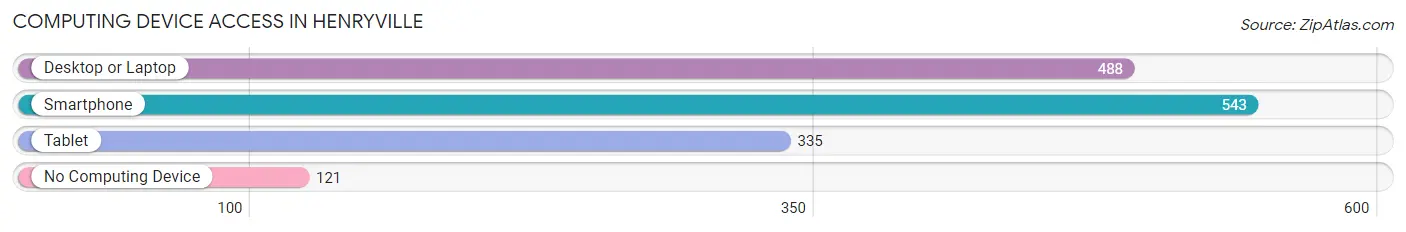
| Device Type | # Households | % Households |
| Desktop or Laptop | 488 | 71.0% |
| Smartphone | 543 | 79.0% |
| Tablet | 335 | 48.8% |
| No Computing Device | 121 | 17.6% |
| Total | 687 | 100.0% |
Internet Access in Henryville
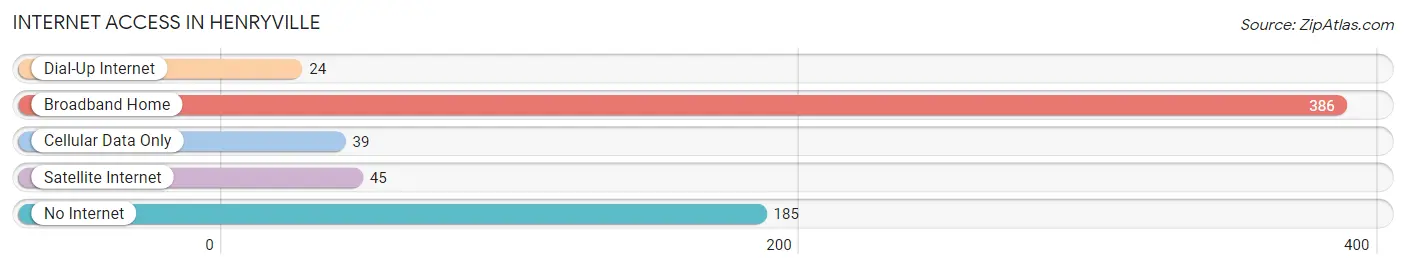
| Internet Type | # Households | % Households |
| Dial-Up Internet | 24 | 3.5% |
| Broadband Home | 386 | 56.2% |
| Cellular Data Only | 39 | 5.7% |
| Satellite Internet | 45 | 6.6% |
| No Internet | 185 | 26.9% |
| Total | 687 | 100.0% |
Henryville Summary
History
Henryville, Indiana is a small town located in Clark County, Indiana. It is situated along the Ohio River, just south of Louisville, Kentucky. The town was founded in 1817 by William Henry, a Revolutionary War veteran, and was named after him. The town was originally a farming community, but in the late 19th century, it became a popular tourist destination due to its proximity to Louisville.
Henryville was the site of a major tornado in March 2012. The tornado caused extensive damage to the town, destroying many homes and businesses. The town was declared a disaster area and received assistance from the Federal Emergency Management Agency (FEMA). The town has since been rebuilt and is now a thriving community.
Geography
Henryville is located in Clark County, Indiana, along the Ohio River. It is situated about 25 miles south of Louisville, Kentucky. The town is located in a rural area, with rolling hills and farmland. The town is surrounded by the Hoosier National Forest, which provides a variety of outdoor activities.
The climate in Henryville is humid continental, with hot summers and cold winters. The average temperature in the summer is around 80 degrees Fahrenheit, and the average temperature in the winter is around 30 degrees Fahrenheit.
Economy
Henryville’s economy is largely based on agriculture and tourism. The town is home to several farms, which produce a variety of crops, including corn, soybeans, and wheat. The town is also home to several wineries, which produce a variety of wines.
The town is also a popular tourist destination, due to its proximity to Louisville. The town is home to several attractions, including the Henryville Railroad Museum, the Henryville State Park, and the Henryville Wildlife Refuge. The town also hosts several festivals throughout the year, including the Henryville Harvest Festival and the Henryville Music Festival.
Demographics
As of the 2010 census, the population of Henryville was 1,845. The racial makeup of the town was 95.3% White, 1.2% African American, 0.3% Native American, 0.2% Asian, 0.1% Pacific Islander, and 2.9% from other races. The median household income was $37,917, and the median family income was $45,938.
Henryville is served by the Greater Clark County School District. The town is home to Henryville High School, which serves students in grades 9-12. The town is also home to several churches, including the First Baptist Church of Henryville and the Henryville United Methodist Church.
Conclusion
Henryville, Indiana is a small town located in Clark County, Indiana. It is situated along the Ohio River, just south of Louisville, Kentucky. The town was founded in 1817 by William Henry, a Revolutionary War veteran, and was named after him. The town was originally a farming community, but in the late 19th century, it became a popular tourist destination due to its proximity to Louisville. The town’s economy is largely based on agriculture and tourism, and it is home to several attractions, including the Henryville Railroad Museum, the Henryville State Park, and the Henryville Wildlife Refuge. As of the 2010 census, the population of Henryville was 1,845. The town is served by the Greater Clark County School District and is home to several churches. Henryville is a thriving community that offers a variety of activities and attractions for visitors and residents alike.
Common Questions
What is Per Capita Income in Henryville?
Per Capita income in Henryville is $29,696.
What is the Median Family Income in Henryville?
Median Family Income in Henryville is $84,015.
What is the Median Household income in Henryville?
Median Household Income in Henryville is $72,768.
What is Income or Wage Gap in Henryville?
Income or Wage Gap in Henryville is 34.8%.
Women in Henryville earn 65.2 cents for every dollar earned by a man.
What is Inequality or Gini Index in Henryville?
Inequality or Gini Index in Henryville is 0.34.
What is the Total Population of Henryville?
Total Population of Henryville is 1,837.
What is the Total Male Population of Henryville?
Total Male Population of Henryville is 870.
What is the Total Female Population of Henryville?
Total Female Population of Henryville is 967.
What is the Ratio of Males per 100 Females in Henryville?
There are 89.97 Males per 100 Females in Henryville.
What is the Ratio of Females per 100 Males in Henryville?
There are 111.15 Females per 100 Males in Henryville.
What is the Median Population Age in Henryville?
Median Population Age in Henryville is 36.3 Years.
What is the Average Family Size in Henryville
Average Family Size in Henryville is 3.2 People.
What is the Average Household Size in Henryville
Average Household Size in Henryville is 2.7 People.
How Large is the Labor Force in Henryville?
There are 979 People in the Labor Forcein in Henryville.
What is the Percentage of People in the Labor Force in Henryville?
65.9% of People are in the Labor Force in Henryville.
What is the Unemployment Rate in Henryville?
Unemployment Rate in Henryville is 1.2%.