White, UT Map & Demographics
White Overview
$33,230
PER CAPITA INCOME
$90,284
AVG FAMILY INCOME
$86,763
AVG HOUSEHOLD INCOME
26.8%
WAGE / INCOME GAP [ % ]
73.2¢/ $1
WAGE / INCOME GAP [ $ ]
$7,251
FAMILY INCOME DEFICIT
0.38
INEQUALITY / GINI INDEX
5,562
TOTAL POPULATION
2,812
MALE POPULATION
2,750
FEMALE POPULATION
102.25
MALES / 100 FEMALES
97.80
FEMALES / 100 MALES
36.4
MEDIAN AGE
3.3
AVG FAMILY SIZE
2.9
AVG HOUSEHOLD SIZE
2,965
LABOR FORCE [ PEOPLE ]
69.2%
PERCENT IN LABOR FORCE
5.7%
UNEMPLOYMENT RATE
Income in White
Income Overview in White
Per Capita Income in White is $33,230, while median incomes of families and households are $90,284 and $86,763 respectively.
| Characteristic | Number | Measure |
| Per Capita Income | 5,562 | $33,230 |
| Median Family Income | 1,467 | $90,284 |
| Mean Family Income | 1,467 | $101,055 |
| Median Household Income | 1,915 | $86,763 |
| Mean Household Income | 1,915 | $93,768 |
| Income Deficit | 1,467 | $7,251 |
| Wage / Income Gap (%) | 5,562 | 26.83% |
| Wage / Income Gap ($) | 5,562 | 73.17¢ per $1 |
| Gini / Inequality Index | 5,562 | 0.38 |
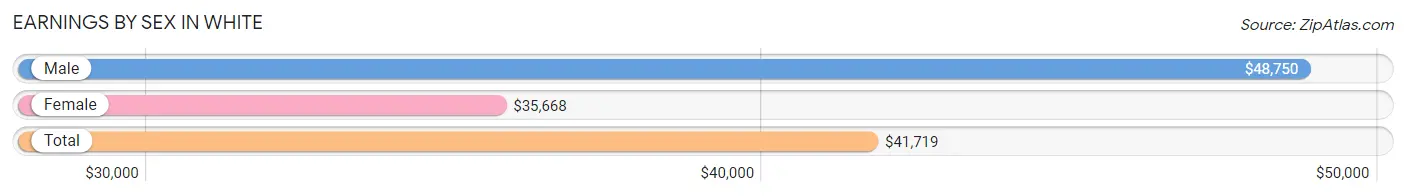
Earnings by Sex in White
Average Earnings in White are $41,719, $48,750 for men and $35,668 for women, a difference of 26.8%.
| Sex | Number | Average Earnings |
| Male | 1,744 (56.6%) | $48,750 |
| Female | 1,335 (43.4%) | $35,668 |
| Total | 3,079 (100.0%) | $41,719 |
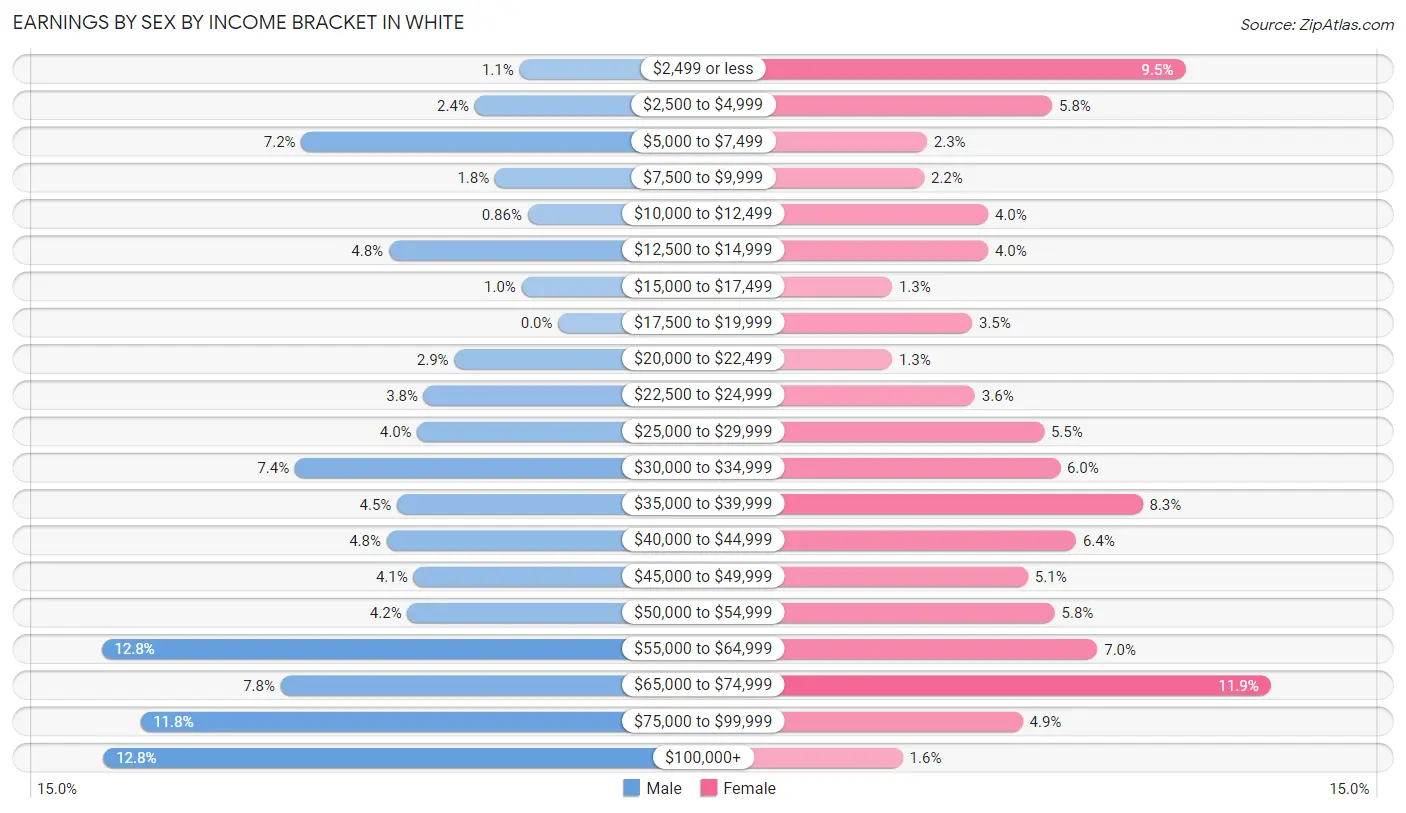
Earnings by Sex by Income Bracket in White
The most common earnings brackets in White are $55,000 to $64,999 for men (224 | 12.8%) and $65,000 to $74,999 for women (159 | 11.9%).
| Income | Male | Female |
| $2,499 or less | 19 (1.1%) | 127 (9.5%) |
| $2,500 to $4,999 | 41 (2.4%) | 77 (5.8%) |
| $5,000 to $7,499 | 126 (7.2%) | 30 (2.2%) |
| $7,500 to $9,999 | 31 (1.8%) | 29 (2.2%) |
| $10,000 to $12,499 | 15 (0.9%) | 53 (4.0%) |
| $12,500 to $14,999 | 83 (4.8%) | 53 (4.0%) |
| $15,000 to $17,499 | 18 (1.0%) | 17 (1.3%) |
| $17,500 to $19,999 | 0 (0.0%) | 47 (3.5%) |
| $20,000 to $22,499 | 51 (2.9%) | 17 (1.3%) |
| $22,500 to $24,999 | 66 (3.8%) | 48 (3.6%) |
| $25,000 to $29,999 | 69 (4.0%) | 74 (5.5%) |
| $30,000 to $34,999 | 129 (7.4%) | 80 (6.0%) |
| $35,000 to $39,999 | 79 (4.5%) | 111 (8.3%) |
| $40,000 to $44,999 | 84 (4.8%) | 86 (6.4%) |
| $45,000 to $49,999 | 71 (4.1%) | 68 (5.1%) |
| $50,000 to $54,999 | 74 (4.2%) | 78 (5.8%) |
| $55,000 to $64,999 | 224 (12.8%) | 94 (7.0%) |
| $65,000 to $74,999 | 136 (7.8%) | 159 (11.9%) |
| $75,000 to $99,999 | 205 (11.7%) | 66 (4.9%) |
| $100,000+ | 223 (12.8%) | 21 (1.6%) |
| Total | 1,744 (100.0%) | 1,335 (100.0%) |
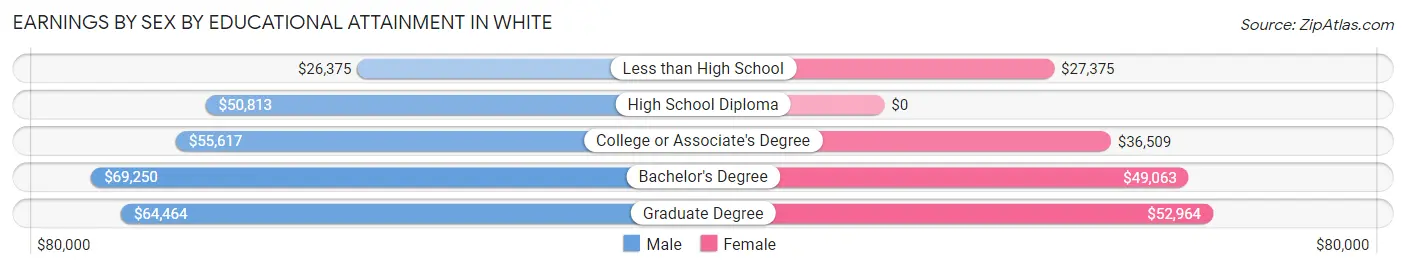
Earnings by Sex by Educational Attainment in White
Average earnings in White are $55,014 for men and $38,514 for women, a difference of 30.0%. Men with an educational attainment of bachelor's degree enjoy the highest average annual earnings of $69,250, while those with less than high school education earn the least with $26,375. Women with an educational attainment of graduate degree earn the most with the average annual earnings of $52,964, while those with less than high school education have the smallest earnings of $27,375.
| Educational Attainment | Male Income | Female Income |
| Less than High School | $26,375 | $27,375 |
| High School Diploma | $50,813 | $0 |
| College or Associate's Degree | $55,617 | $36,509 |
| Bachelor's Degree | $69,250 | $49,063 |
| Graduate Degree | $64,464 | $52,964 |
| Total | $55,014 | $38,514 |
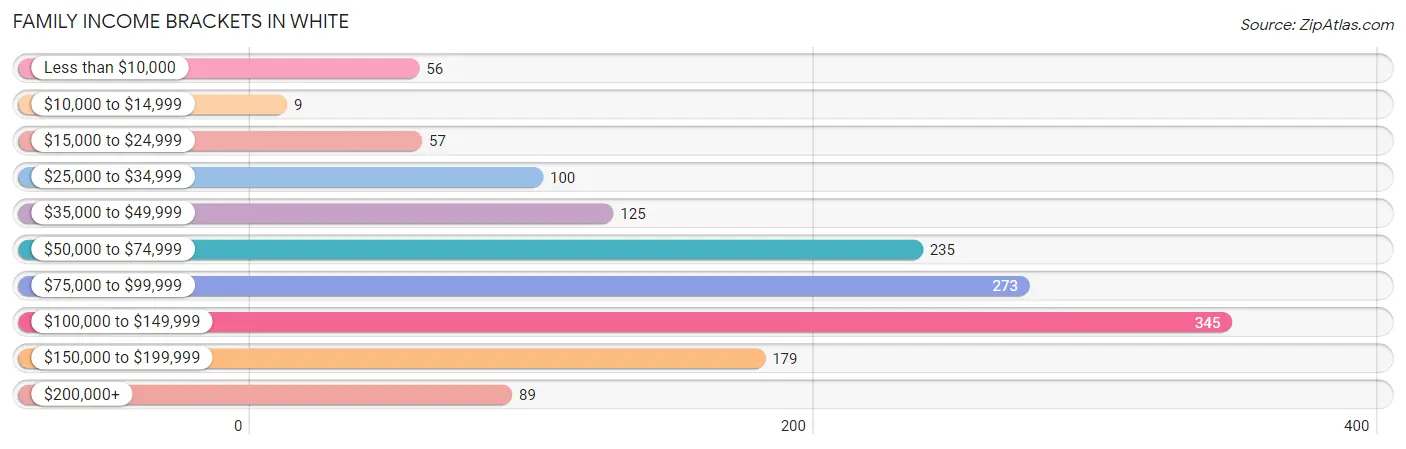
Family Income in White
Family Income Brackets in White
According to the White family income data, there are 345 families falling into the $100,000 to $149,999 income range, which is the most common income bracket and makes up 23.5% of all families. Conversely, the $10,000 to $14,999 income bracket is the least frequent group with only 9 families (0.6%) belonging to this category.
| Income Bracket | # Families | % Families |
| Less than $10,000 | 56 | 3.8% |
| $10,000 to $14,999 | 9 | 0.6% |
| $15,000 to $24,999 | 57 | 3.9% |
| $25,000 to $34,999 | 100 | 6.8% |
| $35,000 to $49,999 | 125 | 8.5% |
| $50,000 to $74,999 | 235 | 16.0% |
| $75,000 to $99,999 | 273 | 18.6% |
| $100,000 to $149,999 | 345 | 23.5% |
| $150,000 to $199,999 | 179 | 12.2% |
| $200,000+ | 89 | 6.1% |
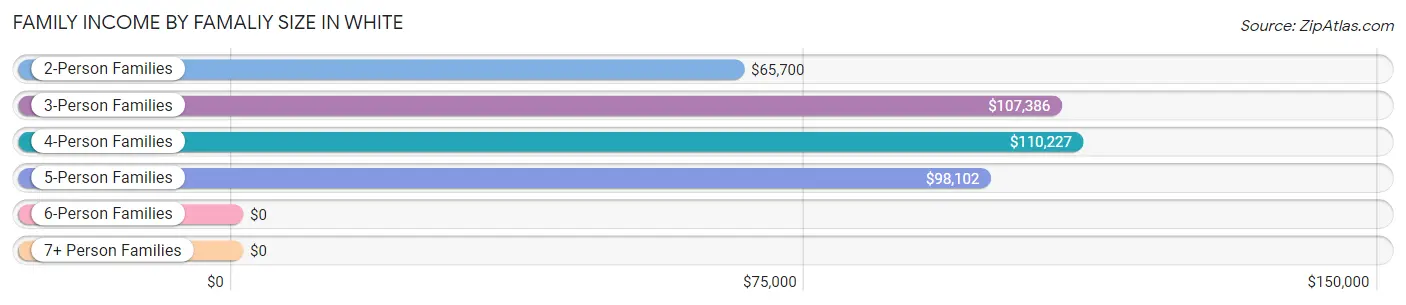
Family Income by Famaliy Size in White
4-person families (274 | 18.7%) account for the highest median family income in White with $110,227 per family, while 3-person families (329 | 22.4%) have the highest median income of $35,795 per family member.
| Income Bracket | # Families | Median Income |
| 2-Person Families | 656 (44.7%) | $65,700 |
| 3-Person Families | 329 (22.4%) | $107,386 |
| 4-Person Families | 274 (18.7%) | $110,227 |
| 5-Person Families | 129 (8.8%) | $98,102 |
| 6-Person Families | 45 (3.1%) | $0 |
| 7+ Person Families | 34 (2.3%) | $0 |
| Total | 1,467 (100.0%) | $90,284 |
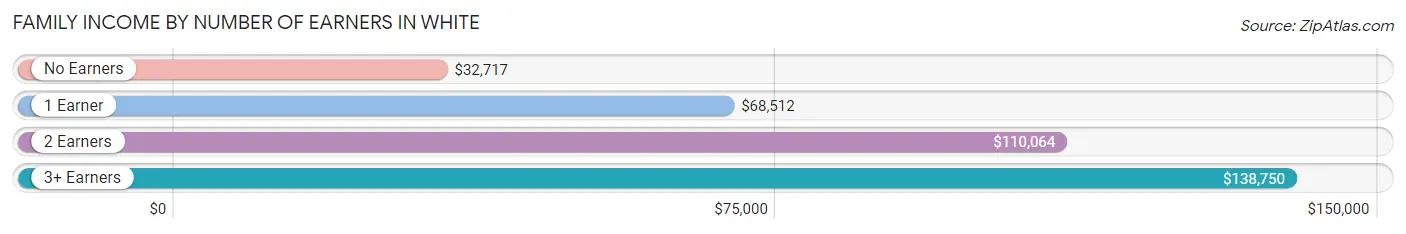
Family Income by Number of Earners in White
The median family income in White is $90,284, with families comprising 3+ earners (210) having the highest median family income of $138,750, while families with no earners (182) have the lowest median family income of $32,717, accounting for 14.3% and 12.4% of families, respectively.
| Number of Earners | # Families | Median Income |
| No Earners | 182 (12.4%) | $32,717 |
| 1 Earner | 385 (26.2%) | $68,512 |
| 2 Earners | 690 (47.0%) | $110,064 |
| 3+ Earners | 210 (14.3%) | $138,750 |
| Total | 1,467 (100.0%) | $90,284 |
Household Income in White
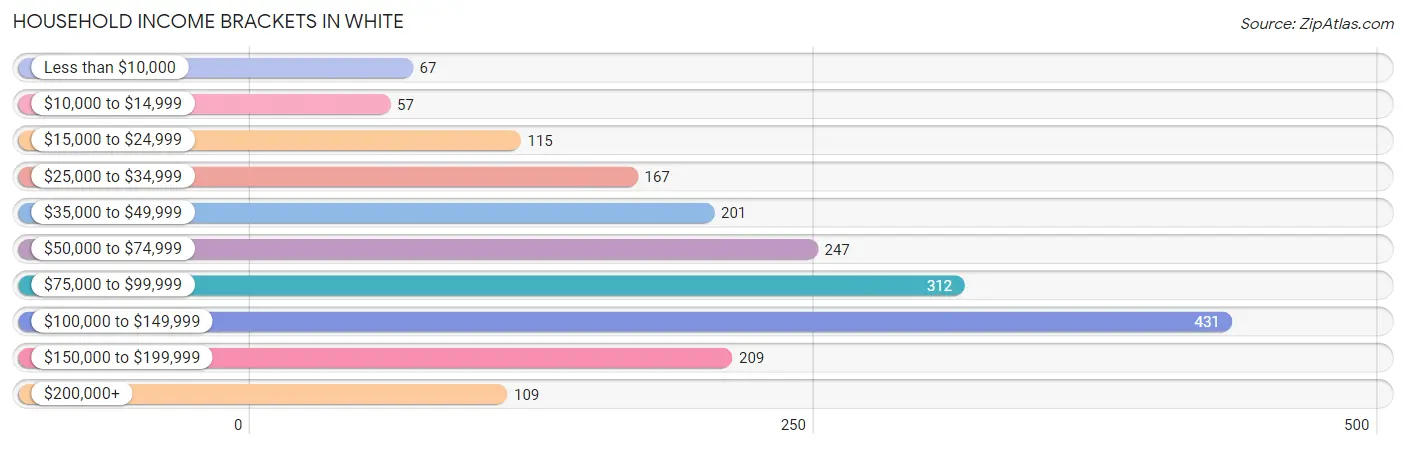
Household Income Brackets in White
With 431 households falling in the category, the $100,000 to $149,999 income range is the most frequent in White, accounting for 22.5% of all households. In contrast, only 57 households (3.0%) fall into the $10,000 to $14,999 income bracket, making it the least populous group.
| Income Bracket | # Households | % Households |
| Less than $10,000 | 67 | 3.5% |
| $10,000 to $14,999 | 57 | 3.0% |
| $15,000 to $24,999 | 115 | 6.0% |
| $25,000 to $34,999 | 167 | 8.7% |
| $35,000 to $49,999 | 201 | 10.5% |
| $50,000 to $74,999 | 247 | 12.9% |
| $75,000 to $99,999 | 312 | 16.3% |
| $100,000 to $149,999 | 431 | 22.5% |
| $150,000 to $199,999 | 209 | 10.9% |
| $200,000+ | 109 | 5.7% |
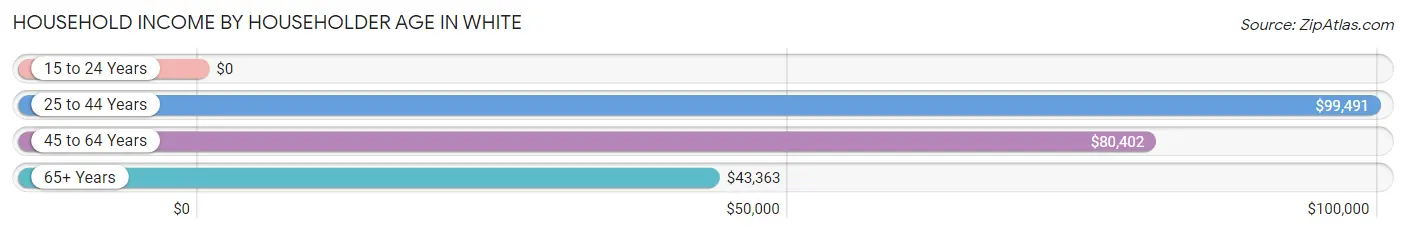
Household Income by Householder Age in White
The median household income in White is $86,763, with the highest median household income of $99,491 found in the 25 to 44 years age bracket for the primary householder. A total of 759 households (39.6%) fall into this category. Meanwhile, the 15 to 24 years age bracket for the primary householder has the lowest median household income of $0, with 18 households (0.9%) in this group.
| Income Bracket | # Households | Median Income |
| 15 to 24 Years | 18 (0.9%) | $0 |
| 25 to 44 Years | 759 (39.6%) | $99,491 |
| 45 to 64 Years | 641 (33.5%) | $80,402 |
| 65+ Years | 497 (26.0%) | $43,363 |
| Total | 1,915 (100.0%) | $86,763 |
Poverty in White
Income Below Poverty by Sex and Age in White
With 6.3% poverty level for males and 10.4% for females among the residents of White, 16 and 17 year old males and 75 year old and over females are the most vulnerable to poverty, with 12 males (44.4%) and 49 females (23.1%) in their respective age groups living below the poverty level.
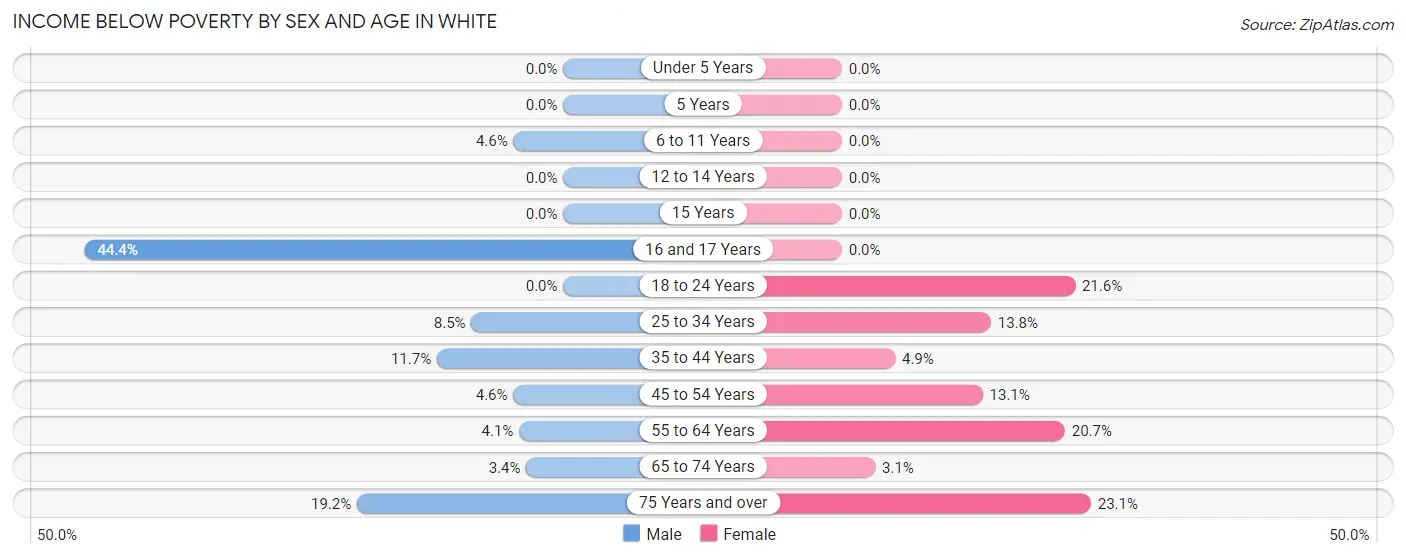
| Age Bracket | Male | Female |
| Under 5 Years | 0 (0.0%) | 0 (0.0%) |
| 5 Years | 0 (0.0%) | 0 (0.0%) |
| 6 to 11 Years | 9 (4.6%) | 0 (0.0%) |
| 12 to 14 Years | 0 (0.0%) | 0 (0.0%) |
| 15 Years | 0 (0.0%) | 0 (0.0%) |
| 16 and 17 Years | 12 (44.4%) | 0 (0.0%) |
| 18 to 24 Years | 0 (0.0%) | 58 (21.6%) |
| 25 to 34 Years | 44 (8.5%) | 52 (13.8%) |
| 35 to 44 Years | 49 (11.7%) | 19 (4.9%) |
| 45 to 54 Years | 14 (4.6%) | 40 (13.1%) |
| 55 to 64 Years | 11 (4.1%) | 59 (20.7%) |
| 65 to 74 Years | 9 (3.4%) | 8 (3.1%) |
| 75 Years and over | 27 (19.2%) | 49 (23.1%) |
| Total | 175 (6.3%) | 285 (10.4%) |
Income Above Poverty by Sex and Age in White
According to the poverty statistics in White, males aged under 5 years and females aged under 5 years are the age groups that are most secure financially, with 100.0% of males and 100.0% of females in these age groups living above the poverty line.
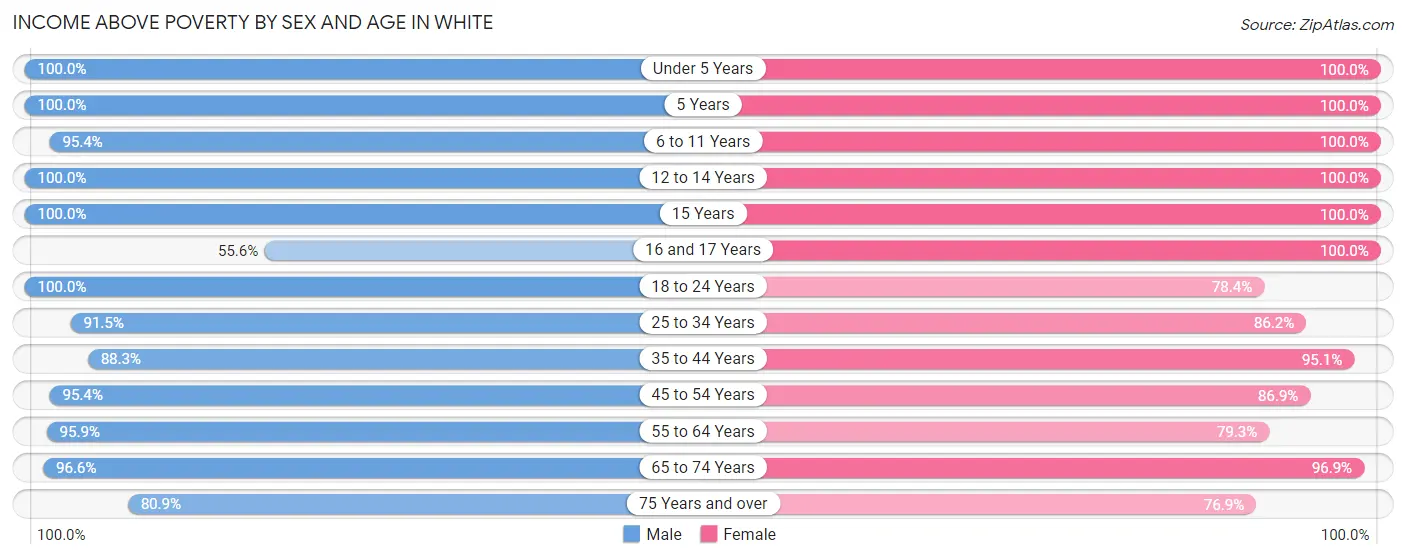
| Age Bracket | Male | Female |
| Under 5 Years | 213 (100.0%) | 144 (100.0%) |
| 5 Years | 11 (100.0%) | 67 (100.0%) |
| 6 to 11 Years | 186 (95.4%) | 256 (100.0%) |
| 12 to 14 Years | 150 (100.0%) | 85 (100.0%) |
| 15 Years | 65 (100.0%) | 77 (100.0%) |
| 16 and 17 Years | 15 (55.6%) | 30 (100.0%) |
| 18 to 24 Years | 229 (100.0%) | 210 (78.4%) |
| 25 to 34 Years | 472 (91.5%) | 324 (86.2%) |
| 35 to 44 Years | 369 (88.3%) | 366 (95.1%) |
| 45 to 54 Years | 288 (95.4%) | 266 (86.9%) |
| 55 to 64 Years | 257 (95.9%) | 226 (79.3%) |
| 65 to 74 Years | 253 (96.6%) | 251 (96.9%) |
| 75 Years and over | 114 (80.8%) | 163 (76.9%) |
| Total | 2,622 (93.7%) | 2,465 (89.6%) |
Income Below Poverty Among Married-Couple Families in White
The poverty statistics for married-couple families in White show that 5.6% or 64 of the total 1,151 families live below the poverty line. Families with no children have the highest poverty rate of 8.3%, comprising of 54 families. On the other hand, families with 3 or 4 children have the lowest poverty rate of 0.0%, which includes 0 families.
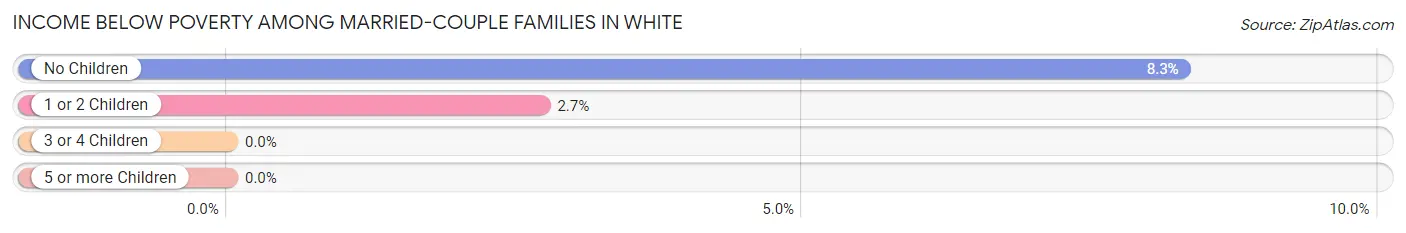
| Children | Above Poverty | Below Poverty |
| No Children | 597 (91.7%) | 54 (8.3%) |
| 1 or 2 Children | 358 (97.3%) | 10 (2.7%) |
| 3 or 4 Children | 132 (100.0%) | 0 (0.0%) |
| 5 or more Children | 0 (0.0%) | 0 (0.0%) |
| Total | 1,087 (94.4%) | 64 (5.6%) |
Income Below Poverty Among Single-Parent Households in White
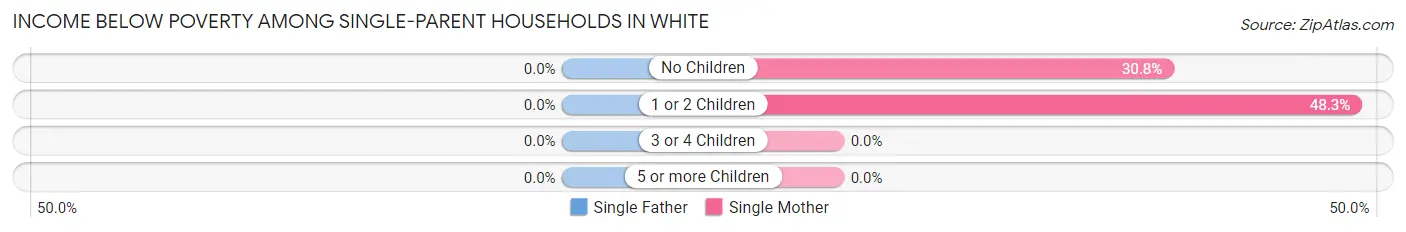
| Children | Single Father | Single Mother |
| No Children | 0 (0.0%) | 36 (30.8%) |
| 1 or 2 Children | 0 (0.0%) | 14 (48.3%) |
| 3 or 4 Children | 0 (0.0%) | 0 (0.0%) |
| 5 or more Children | 0 (0.0%) | 0 (0.0%) |
| Total | 0 (0.0%) | 50 (24.1%) |
Income Below Poverty Among Married-Couple vs Single-Parent Households in White
The poverty data for White shows that 64 of the married-couple family households (5.6%) and 50 of the single-parent households (15.8%) are living below the poverty level. Within the married-couple family households, those with no children have the highest poverty rate, with 54 households (8.3%) falling below the poverty line. Among the single-parent households, those with no children have the highest poverty rate, with 36 household (21.7%) living below poverty.
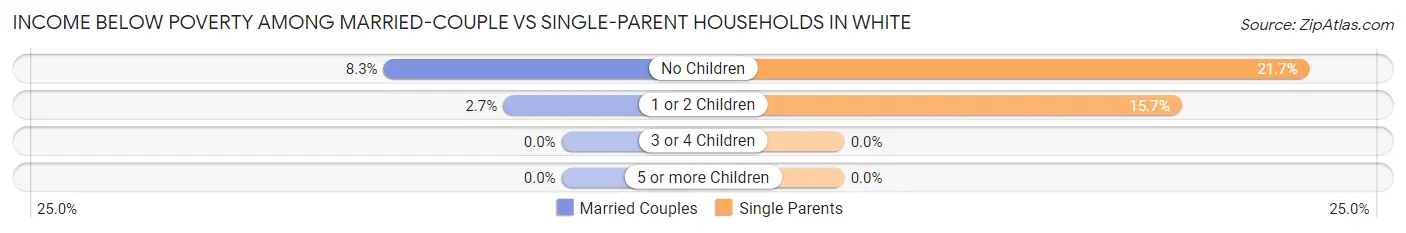
| Children | Married-Couple Families | Single-Parent Households |
| No Children | 54 (8.3%) | 36 (21.7%) |
| 1 or 2 Children | 10 (2.7%) | 14 (15.7%) |
| 3 or 4 Children | 0 (0.0%) | 0 (0.0%) |
| 5 or more Children | 0 (0.0%) | 0 (0.0%) |
| Total | 64 (5.6%) | 50 (15.8%) |
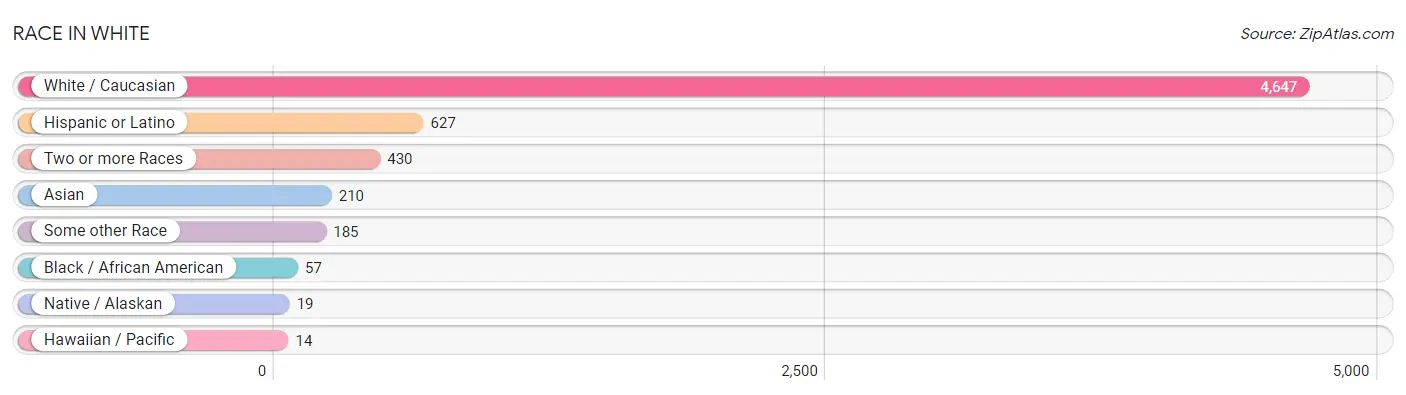
Race in White
The most populous races in White are White / Caucasian (4,647 | 83.6%), Hispanic or Latino (627 | 11.3%), and Two or more Races (430 | 7.7%).
| Race | # Population | % Population |
| Asian | 210 | 3.8% |
| Black / African American | 57 | 1.0% |
| Hawaiian / Pacific | 14 | 0.3% |
| Hispanic or Latino | 627 | 11.3% |
| Native / Alaskan | 19 | 0.3% |
| White / Caucasian | 4,647 | 83.6% |
| Two or more Races | 430 | 7.7% |
| Some other Race | 185 | 3.3% |
| Total | 5,562 | 100.0% |
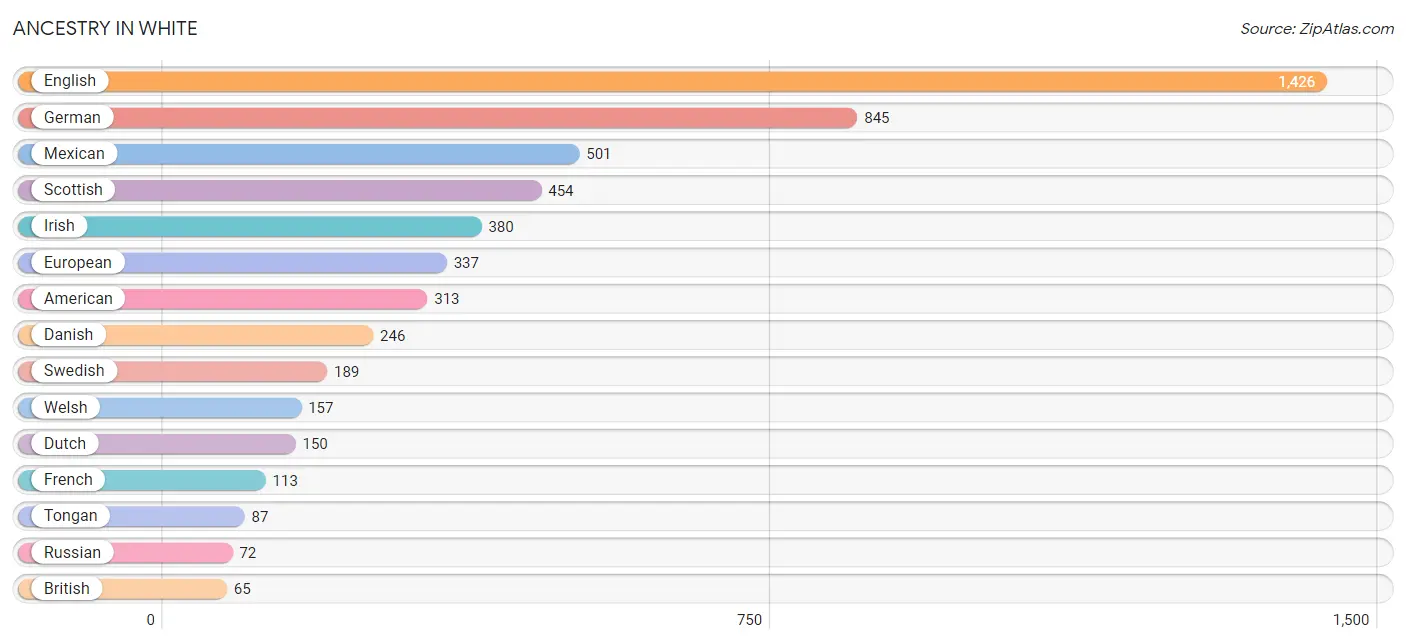
Ancestry in White
The most populous ancestries reported in White are English (1,426 | 25.6%), German (845 | 15.2%), Mexican (501 | 9.0%), Scottish (454 | 8.2%), and Irish (380 | 6.8%), together accounting for 64.8% of all White residents.
| Ancestry | # Population | % Population |
| American | 313 | 5.6% |
| Bhutanese | 12 | 0.2% |
| British | 65 | 1.2% |
| Burmese | 56 | 1.0% |
| Canadian | 49 | 0.9% |
| Danish | 246 | 4.4% |
| Dutch | 150 | 2.7% |
| English | 1,426 | 25.6% |
| European | 337 | 6.1% |
| French | 113 | 2.0% |
| French Canadian | 30 | 0.5% |
| German | 845 | 15.2% |
| Greek | 37 | 0.7% |
| Indian (Asian) | 45 | 0.8% |
| Irish | 380 | 6.8% |
| Italian | 24 | 0.4% |
| Korean | 44 | 0.8% |
| Mexican | 501 | 9.0% |
| Native Hawaiian | 13 | 0.2% |
| Norwegian | 28 | 0.5% |
| Peruvian | 29 | 0.5% |
| Polish | 22 | 0.4% |
| Russian | 72 | 1.3% |
| Samoan | 11 | 0.2% |
| Scandinavian | 59 | 1.1% |
| Scotch-Irish | 38 | 0.7% |
| Scottish | 454 | 8.2% |
| Shoshone | 4 | 0.1% |
| South African | 29 | 0.5% |
| South American | 48 | 0.9% |
| Spaniard | 11 | 0.2% |
| Spanish | 50 | 0.9% |
| Spanish American | 17 | 0.3% |
| Subsaharan African | 29 | 0.5% |
| Swedish | 189 | 3.4% |
| Swiss | 8 | 0.1% |
| Tongan | 87 | 1.6% |
| Ukrainian | 43 | 0.8% |
| Venezuelan | 19 | 0.3% |
| Welsh | 157 | 2.8% | View All 40 Rows |
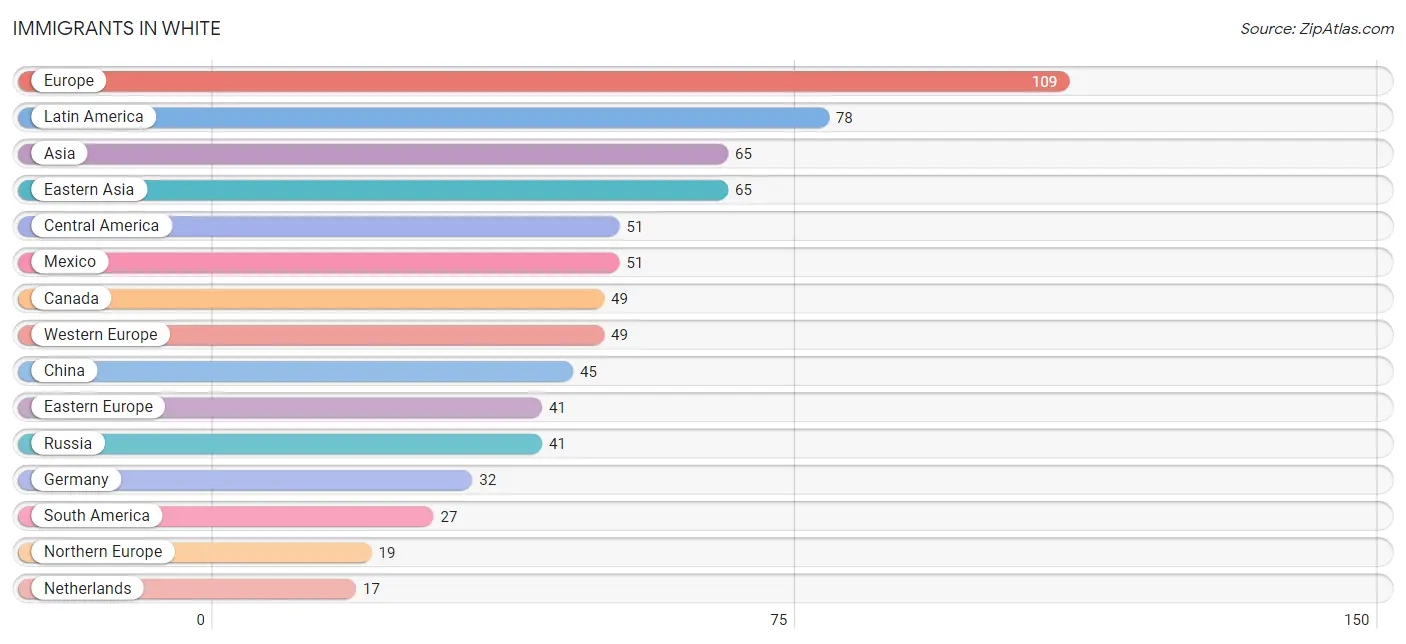
Immigrants in White
The most numerous immigrant groups reported in White came from Europe (109 | 2.0%), Latin America (78 | 1.4%), Asia (65 | 1.2%), Eastern Asia (65 | 1.2%), and Central America (51 | 0.9%), together accounting for 6.6% of all White residents.
| Immigration Origin | # Population | % Population |
| Africa | 14 | 0.3% |
| Asia | 65 | 1.2% |
| Canada | 49 | 0.9% |
| Central America | 51 | 0.9% |
| Chile | 9 | 0.2% |
| China | 45 | 0.8% |
| Eastern Asia | 65 | 1.2% |
| Eastern Europe | 41 | 0.7% |
| Europe | 109 | 2.0% |
| Germany | 32 | 0.6% |
| Japan | 11 | 0.2% |
| Korea | 9 | 0.2% |
| Latin America | 78 | 1.4% |
| Mexico | 51 | 0.9% |
| Netherlands | 17 | 0.3% |
| Northern Europe | 19 | 0.3% |
| Peru | 8 | 0.1% |
| Russia | 41 | 0.7% |
| South Africa | 14 | 0.3% |
| South America | 27 | 0.5% |
| Venezuela | 10 | 0.2% |
| Western Europe | 49 | 0.9% | View All 22 Rows |
Sex and Age in White
Sex and Age in White
The most populous age groups in White are 30 to 34 Years (280 | 10.0%) for men and 5 to 9 Years (254 | 9.2%) for women.
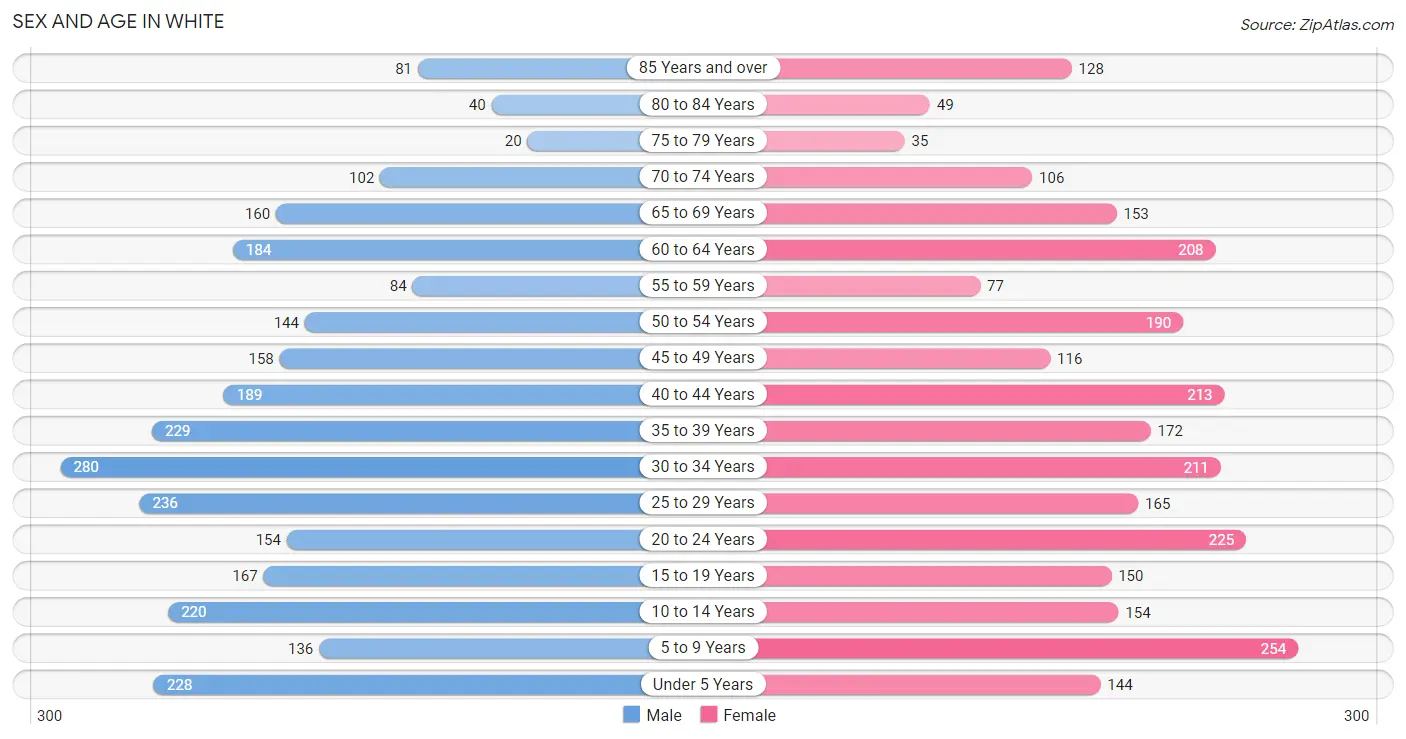
| Age Bracket | Male | Female |
| Under 5 Years | 228 (8.1%) | 144 (5.2%) |
| 5 to 9 Years | 136 (4.8%) | 254 (9.2%) |
| 10 to 14 Years | 220 (7.8%) | 154 (5.6%) |
| 15 to 19 Years | 167 (5.9%) | 150 (5.4%) |
| 20 to 24 Years | 154 (5.5%) | 225 (8.2%) |
| 25 to 29 Years | 236 (8.4%) | 165 (6.0%) |
| 30 to 34 Years | 280 (10.0%) | 211 (7.7%) |
| 35 to 39 Years | 229 (8.1%) | 172 (6.2%) |
| 40 to 44 Years | 189 (6.7%) | 213 (7.7%) |
| 45 to 49 Years | 158 (5.6%) | 116 (4.2%) |
| 50 to 54 Years | 144 (5.1%) | 190 (6.9%) |
| 55 to 59 Years | 84 (3.0%) | 77 (2.8%) |
| 60 to 64 Years | 184 (6.5%) | 208 (7.6%) |
| 65 to 69 Years | 160 (5.7%) | 153 (5.6%) |
| 70 to 74 Years | 102 (3.6%) | 106 (3.8%) |
| 75 to 79 Years | 20 (0.7%) | 35 (1.3%) |
| 80 to 84 Years | 40 (1.4%) | 49 (1.8%) |
| 85 Years and over | 81 (2.9%) | 128 (4.6%) |
| Total | 2,812 (100.0%) | 2,750 (100.0%) |
Families and Households in White
Median Family Size in White
The median family size in White is 3.26 persons per family, with single female/mother families (207 | 14.1%) accounting for the largest median family size of 3.36 persons per family. On the other hand, single male/father families (109 | 7.4%) represent the smallest median family size with 2.40 persons per family.
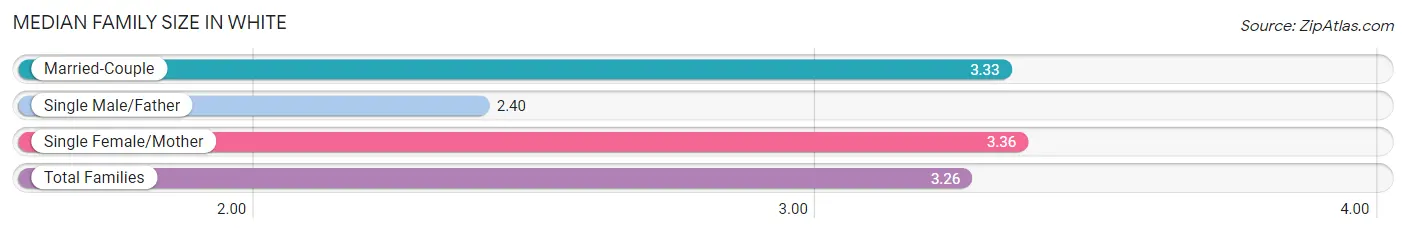
| Family Type | # Families | Family Size |
| Married-Couple | 1,151 (78.5%) | 3.33 |
| Single Male/Father | 109 (7.4%) | 2.40 |
| Single Female/Mother | 207 (14.1%) | 3.36 |
| Total Families | 1,467 (100.0%) | 3.26 |
Median Household Size in White
The median household size in White is 2.90 persons per household, with single female/mother households (207 | 10.8%) accounting for the largest median household size of 3.81 persons per household. non-family households (448 | 23.4%) represent the smallest median household size with 1.31 persons per household.
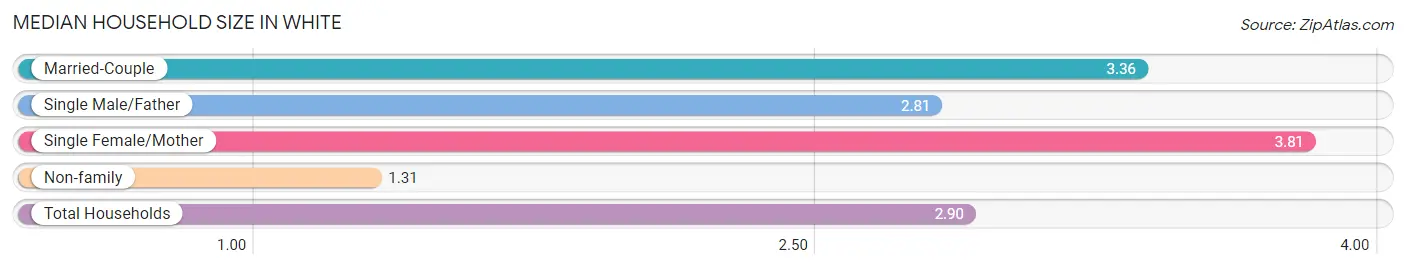
| Household Type | # Households | Household Size |
| Married-Couple | 1,151 (60.1%) | 3.36 |
| Single Male/Father | 109 (5.7%) | 2.81 |
| Single Female/Mother | 207 (10.8%) | 3.81 |
| Non-family | 448 (23.4%) | 1.31 |
| Total Households | 1,915 (100.0%) | 2.90 |
Household Size by Marriage Status in White
Out of a total of 1,915 households in White, 1,467 (76.6%) are family households, while 448 (23.4%) are nonfamily households. The most numerous type of family households are 2-person households, comprising 587, and the most common type of nonfamily households are 1-person households, comprising 324.
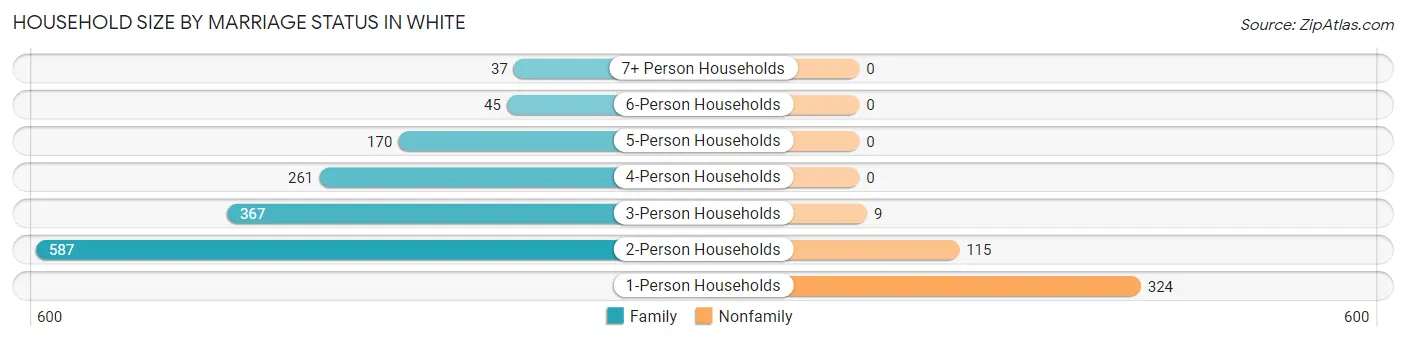
| Household Size | Family Households | Nonfamily Households |
| 1-Person Households | - | 324 (16.9%) |
| 2-Person Households | 587 (30.6%) | 115 (6.0%) |
| 3-Person Households | 367 (19.2%) | 9 (0.5%) |
| 4-Person Households | 261 (13.6%) | 0 (0.0%) |
| 5-Person Households | 170 (8.9%) | 0 (0.0%) |
| 6-Person Households | 45 (2.4%) | 0 (0.0%) |
| 7+ Person Households | 37 (1.9%) | 0 (0.0%) |
| Total | 1,467 (76.6%) | 448 (23.4%) |
Female Fertility in White
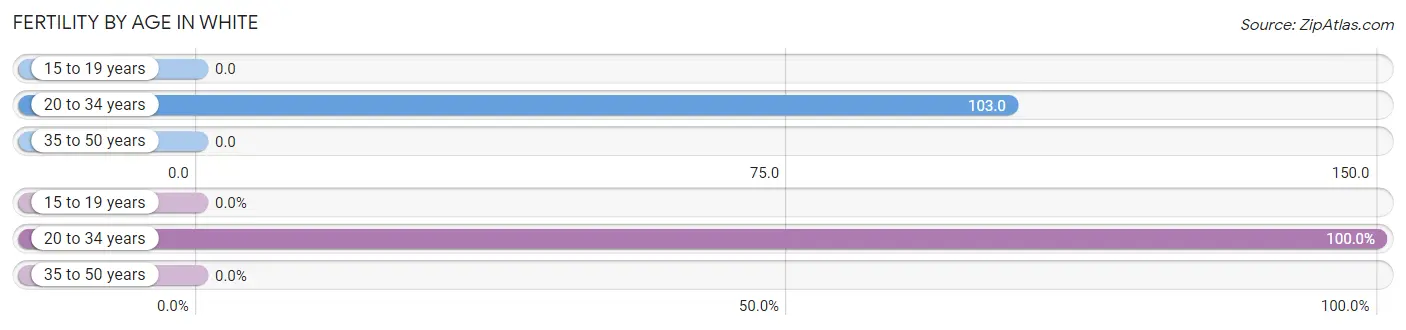
Fertility by Age in White
Average fertility rate in White is 48.0 births per 1,000 women. Women in the age bracket of 20 to 34 years have the highest fertility rate with 103.0 births per 1,000 women. Women in the age bracket of 20 to 34 years acount for 100.0% of all women with births.
| Age Bracket | Women with Births | Births / 1,000 Women |
| 15 to 19 years | 0 (0.0%) | 0.0 |
| 20 to 34 years | 62 (100.0%) | 103.0 |
| 35 to 50 years | 0 (0.0%) | 0.0 |
| Total | 62 (100.0%) | 48.0 |
Fertility by Age by Marriage Status in White
83.9% of women with births (62) in White are married. The highest percentage of unmarried women with births falls into 20 to 34 years age bracket with 16.1% of them unmarried at the time of birth, while the lowest percentage of unmarried women with births belong to 20 to 34 years age bracket with 16.1% of them unmarried.
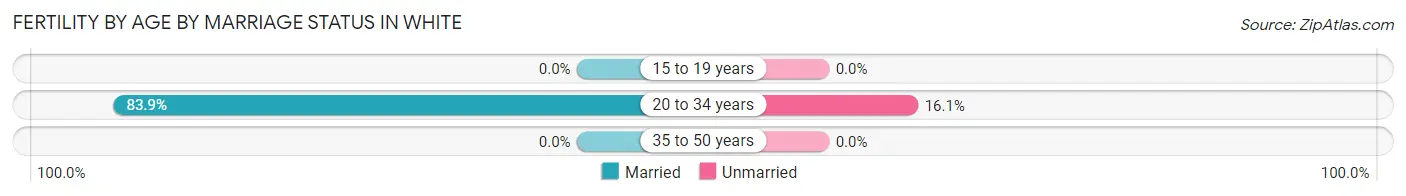
| Age Bracket | Married | Unmarried |
| 15 to 19 years | 0 (0.0%) | 0 (0.0%) |
| 20 to 34 years | 52 (83.9%) | 10 (16.1%) |
| 35 to 50 years | 0 (0.0%) | 0 (0.0%) |
| Total | 52 (83.9%) | 10 (16.1%) |
Fertility by Education in White
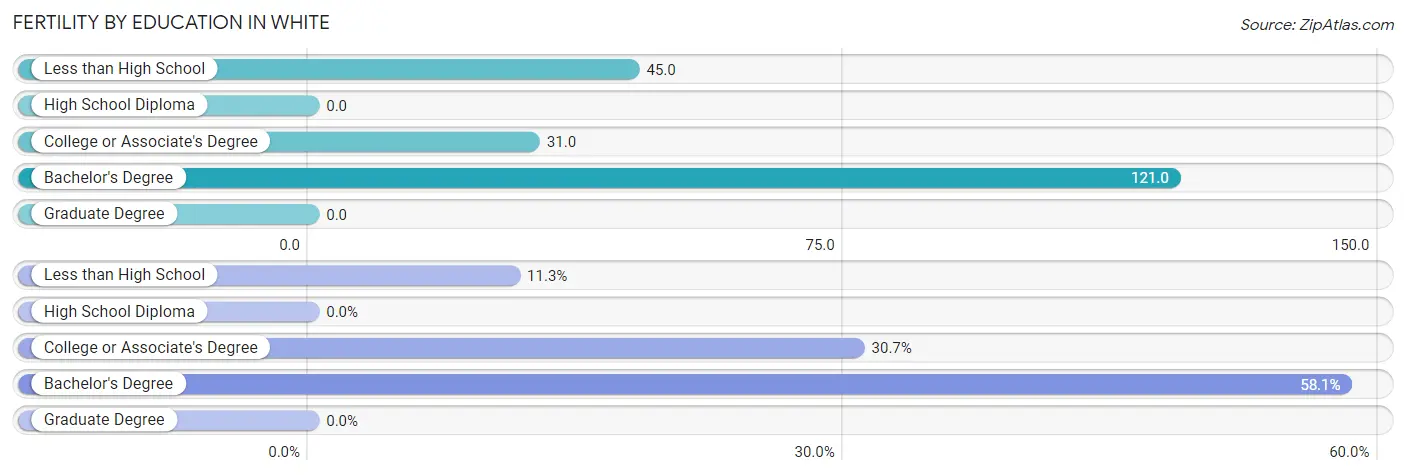
| Educational Attainment | Women with Births | Births / 1,000 Women |
| Less than High School | 7 (11.3%) | 45.0 |
| High School Diploma | 0 (0.0%) | 0.0 |
| College or Associate's Degree | 19 (30.6%) | 31.0 |
| Bachelor's Degree | 36 (58.1%) | 121.0 |
| Graduate Degree | 0 (0.0%) | 0.0 |
| Total | 62 (100.0%) | 48.0 |
Fertility by Education by Marriage Status in White
16.1% of women with births in White are unmarried. Women with the educational attainment of college or associate's degree are most likely to be married with 100.0% of them married at childbirth, while women with the educational attainment of less than high school are least likely to be married with 100.0% of them unmarried at childbirth.
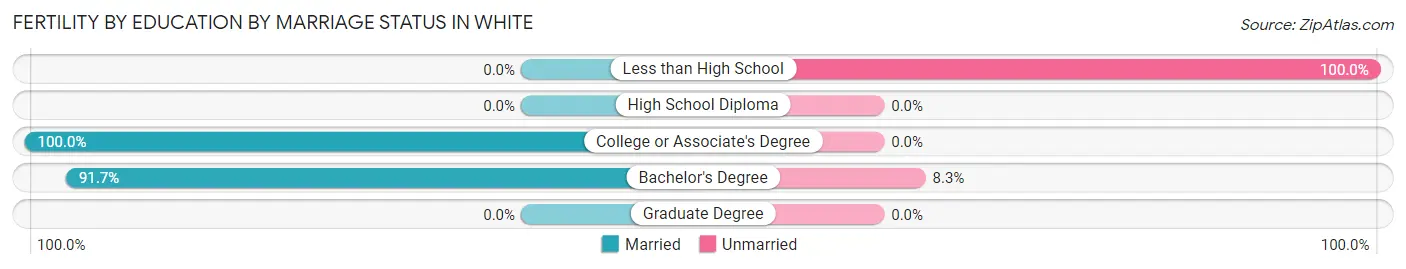
| Educational Attainment | Married | Unmarried |
| Less than High School | 0 (0.0%) | 7 (100.0%) |
| High School Diploma | 0 (0.0%) | 0 (0.0%) |
| College or Associate's Degree | 19 (100.0%) | 0 (0.0%) |
| Bachelor's Degree | 33 (91.7%) | 3 (8.3%) |
| Graduate Degree | 0 (0.0%) | 0 (0.0%) |
| Total | 52 (83.9%) | 10 (16.1%) |
Employment Characteristics in White
Employment by Class of Employer in White
Among the 2,763 employed individuals in White, private company employees (1,824 | 66.0%), local government employees (261 | 9.5%), and not-for-profit organizations (184 | 6.7%) make up the most common classes of employment.
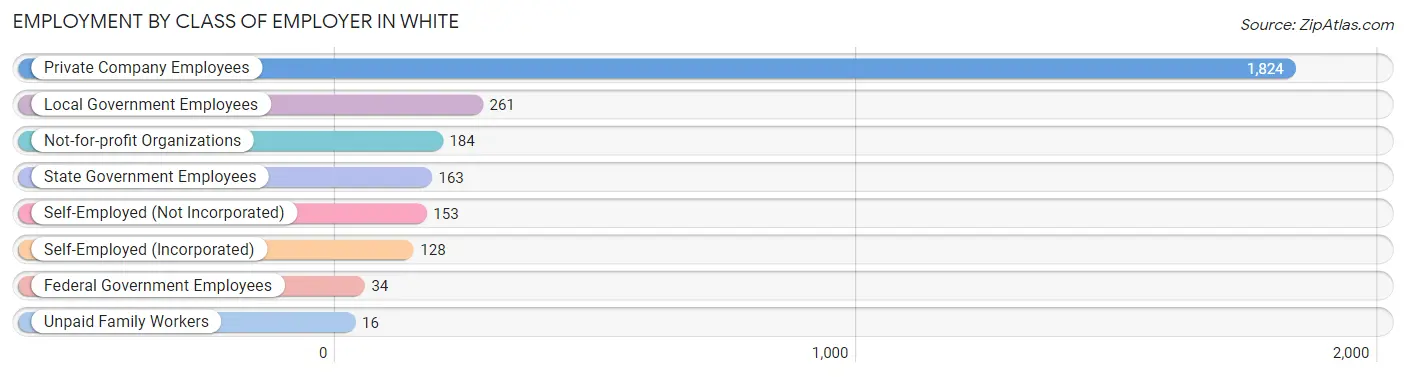
| Employer Class | # Employees | % Employees |
| Private Company Employees | 1,824 | 66.0% |
| Self-Employed (Incorporated) | 128 | 4.6% |
| Self-Employed (Not Incorporated) | 153 | 5.5% |
| Not-for-profit Organizations | 184 | 6.7% |
| Local Government Employees | 261 | 9.5% |
| State Government Employees | 163 | 5.9% |
| Federal Government Employees | 34 | 1.2% |
| Unpaid Family Workers | 16 | 0.6% |
| Total | 2,763 | 100.0% |
Employment Status by Age in White
According to the labor force statistics for White, out of the total population over 16 years of age (4,284), 69.2% or 2,965 individuals are in the labor force, with 5.7% or 169 of them unemployed. The age group with the highest labor force participation rate is 30 to 34 years, with 88.2% or 433 individuals in the labor force. Within the labor force, the 20 to 24 years age range has the highest percentage of unemployed individuals, with 24.8% or 82 of them being unemployed.
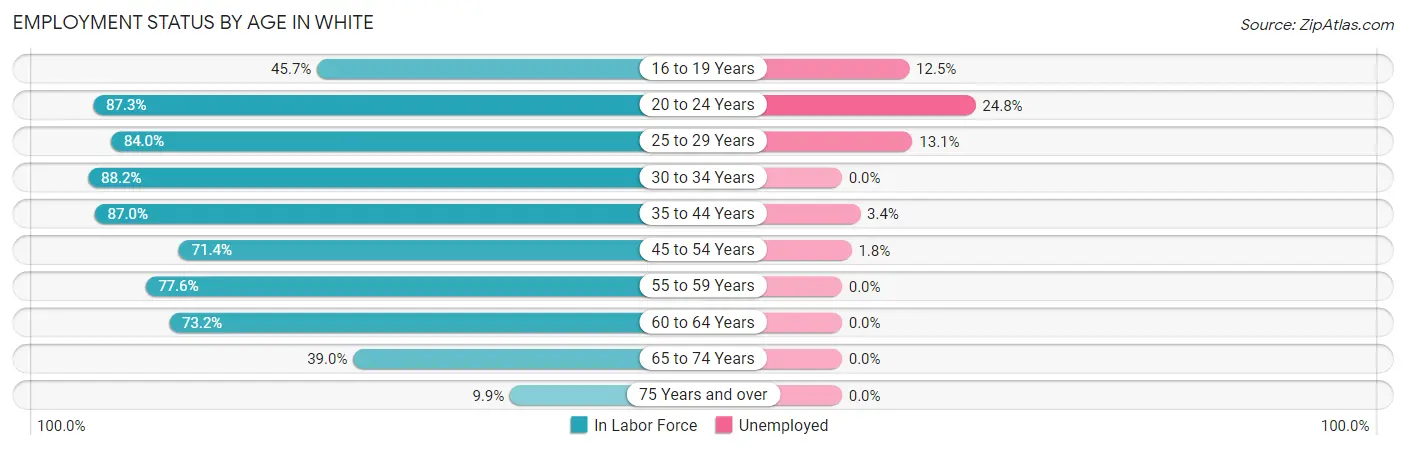
| Age Bracket | In Labor Force | Unemployed |
| 16 to 19 Years | 80 (45.7%) | 10 (12.5%) |
| 20 to 24 Years | 331 (87.3%) | 82 (24.8%) |
| 25 to 29 Years | 337 (84.0%) | 44 (13.1%) |
| 30 to 34 Years | 433 (88.2%) | 0 (0.0%) |
| 35 to 44 Years | 699 (87.0%) | 24 (3.4%) |
| 45 to 54 Years | 434 (71.4%) | 8 (1.8%) |
| 55 to 59 Years | 125 (77.6%) | 0 (0.0%) |
| 60 to 64 Years | 287 (73.2%) | 0 (0.0%) |
| 65 to 74 Years | 203 (39.0%) | 0 (0.0%) |
| 75 Years and over | 35 (9.9%) | 0 (0.0%) |
| Total | 2,965 (69.2%) | 169 (5.7%) |
Employment Status by Educational Attainment in White
According to labor force statistics for White, 81.1% of individuals (2,316) out of the total population between 25 and 64 years of age (2,856) are in the labor force, with 3.3% or 76 of them being unemployed. The group with the highest labor force participation rate are those with the educational attainment of less than high school, with 100.0% or 151 individuals in the labor force. Within the labor force, individuals with less than high school education have the highest percentage of unemployment, with 29.1% or 44 of them being unemployed.
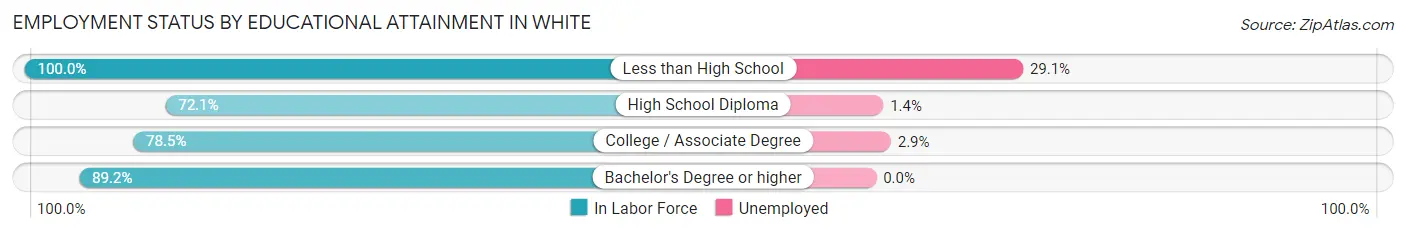
| Educational Attainment | In Labor Force | Unemployed |
| Less than High School | 151 (100.0%) | 44 (29.1%) |
| High School Diploma | 575 (72.1%) | 11 (1.4%) |
| College / Associate Degree | 822 (78.5%) | 30 (2.9%) |
| Bachelor's Degree or higher | 767 (89.2%) | 0 (0.0%) |
| Total | 2,316 (81.1%) | 94 (3.3%) |
Employment Occupations by Sex in White
Management, Business, Science and Arts Occupations
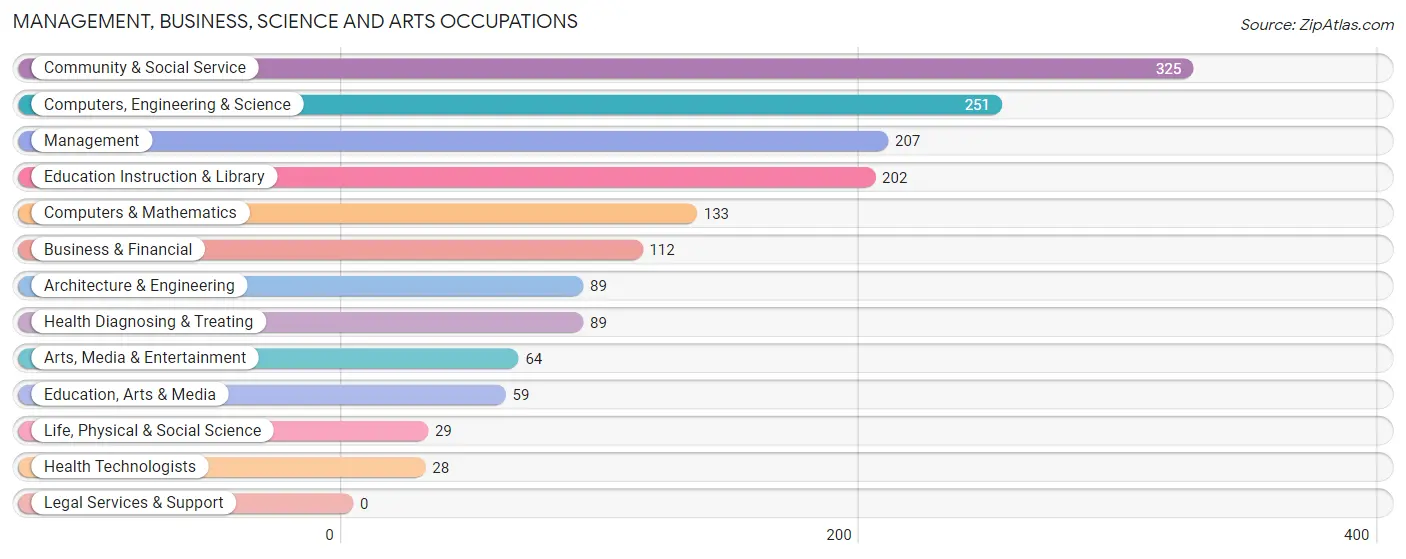
The most common Management, Business, Science and Arts occupations in White are Community & Social Service (325 | 11.6%), Computers, Engineering & Science (251 | 9.0%), Management (207 | 7.4%), Education Instruction & Library (202 | 7.2%), and Computers & Mathematics (133 | 4.8%).
Management, Business, Science and Arts Occupations by Sex
Within the Management, Business, Science and Arts occupations in White, the most male-oriented occupations are Life, Physical & Social Science (100.0%), Computers & Mathematics (94.7%), and Computers, Engineering & Science (84.9%), while the most female-oriented occupations are Education Instruction & Library (92.1%), Community & Social Service (73.2%), and Health Diagnosing & Treating (69.7%).
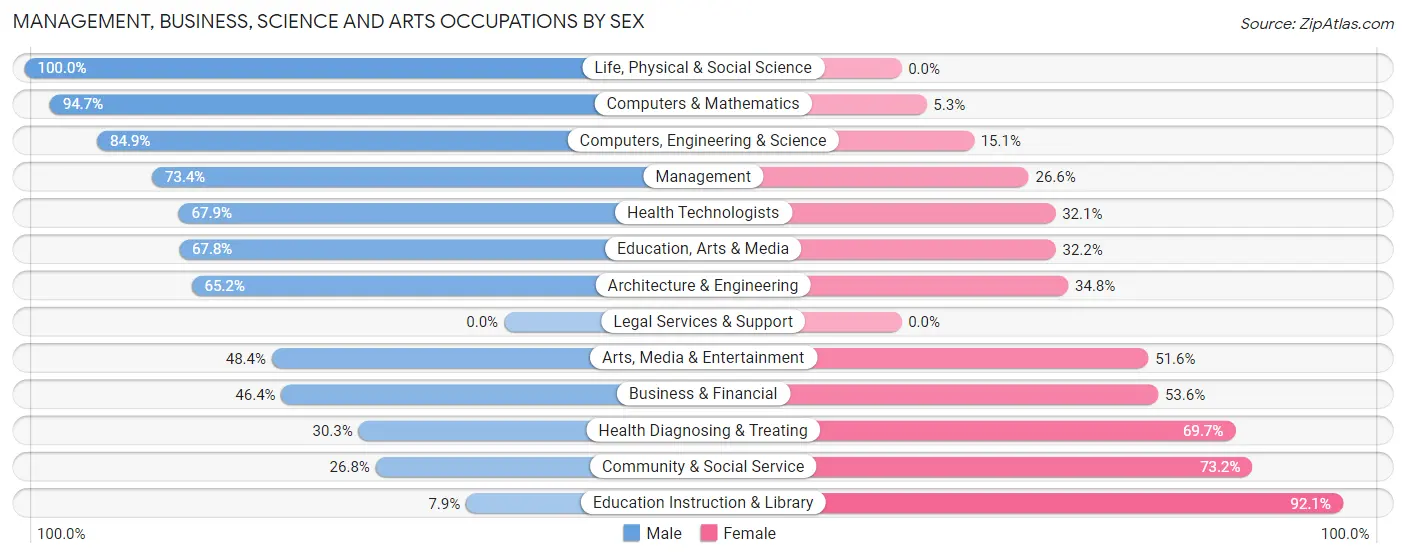
| Occupation | Male | Female |
| Management | 152 (73.4%) | 55 (26.6%) |
| Business & Financial | 52 (46.4%) | 60 (53.6%) |
| Computers, Engineering & Science | 213 (84.9%) | 38 (15.1%) |
| Computers & Mathematics | 126 (94.7%) | 7 (5.3%) |
| Architecture & Engineering | 58 (65.2%) | 31 (34.8%) |
| Life, Physical & Social Science | 29 (100.0%) | 0 (0.0%) |
| Community & Social Service | 87 (26.8%) | 238 (73.2%) |
| Education, Arts & Media | 40 (67.8%) | 19 (32.2%) |
| Legal Services & Support | 0 (0.0%) | 0 (0.0%) |
| Education Instruction & Library | 16 (7.9%) | 186 (92.1%) |
| Arts, Media & Entertainment | 31 (48.4%) | 33 (51.6%) |
| Health Diagnosing & Treating | 27 (30.3%) | 62 (69.7%) |
| Health Technologists | 19 (67.9%) | 9 (32.1%) |
| Total (Category) | 531 (54.0%) | 453 (46.0%) |
| Total (Overall) | 1,550 (55.4%) | 1,246 (44.6%) |
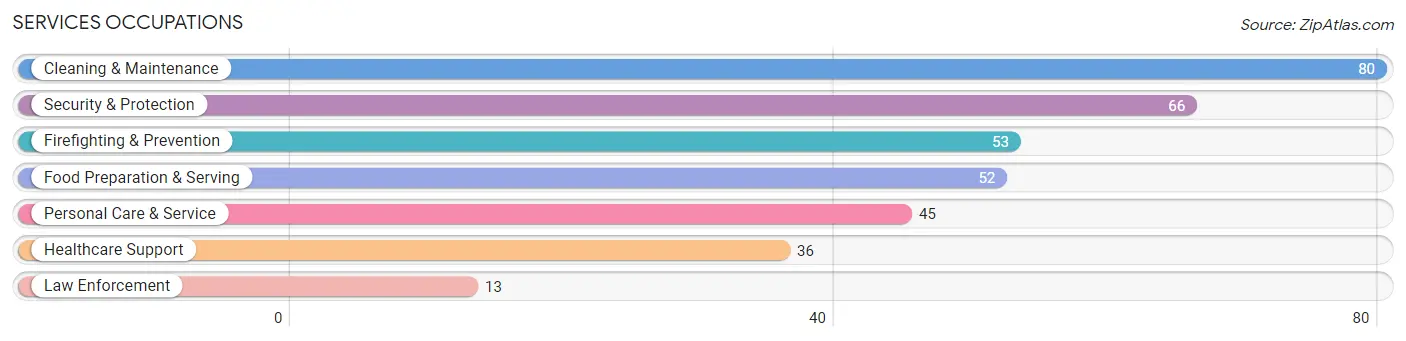
Services Occupations
The most common Services occupations in White are Cleaning & Maintenance (80 | 2.9%), Security & Protection (66 | 2.4%), Firefighting & Prevention (53 | 1.9%), Food Preparation & Serving (52 | 1.9%), and Personal Care & Service (45 | 1.6%).
Services Occupations by Sex
Within the Services occupations in White, the most male-oriented occupations are Firefighting & Prevention (100.0%), Cleaning & Maintenance (100.0%), and Security & Protection (80.3%), while the most female-oriented occupations are Law Enforcement (100.0%), Personal Care & Service (100.0%), and Healthcare Support (72.2%).
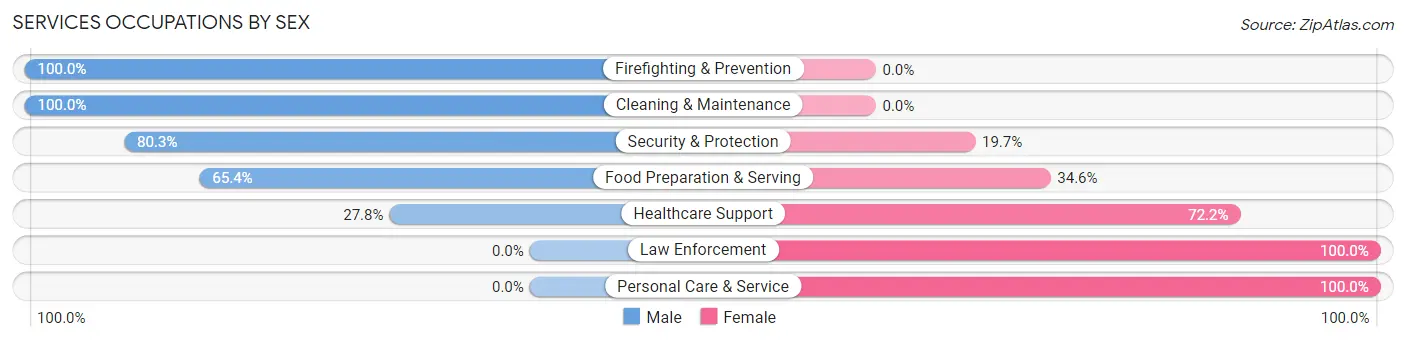
| Occupation | Male | Female |
| Healthcare Support | 10 (27.8%) | 26 (72.2%) |
| Security & Protection | 53 (80.3%) | 13 (19.7%) |
| Firefighting & Prevention | 53 (100.0%) | 0 (0.0%) |
| Law Enforcement | 0 (0.0%) | 13 (100.0%) |
| Food Preparation & Serving | 34 (65.4%) | 18 (34.6%) |
| Cleaning & Maintenance | 80 (100.0%) | 0 (0.0%) |
| Personal Care & Service | 0 (0.0%) | 45 (100.0%) |
| Total (Category) | 177 (63.4%) | 102 (36.6%) |
| Total (Overall) | 1,550 (55.4%) | 1,246 (44.6%) |
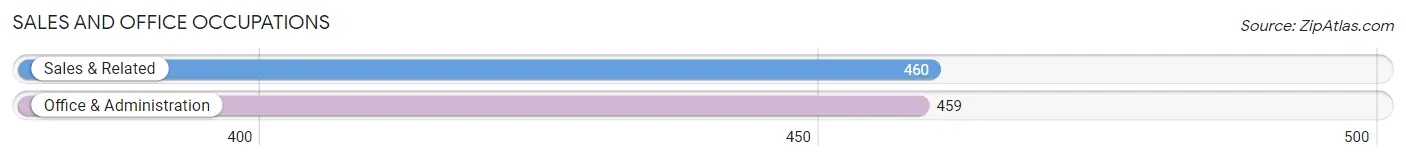
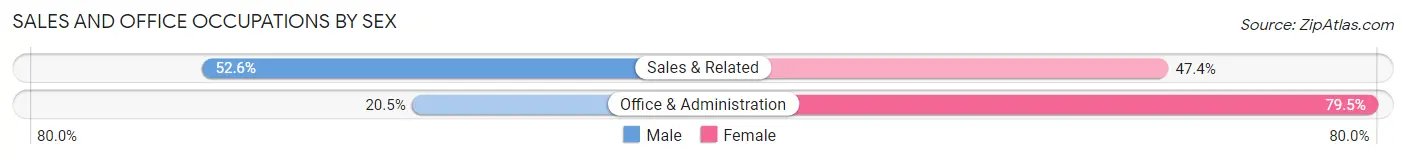
Sales and Office Occupations
The most common Sales and Office occupations in White are Sales & Related (460 | 16.5%), and Office & Administration (459 | 16.4%).
Sales and Office Occupations by Sex
| Occupation | Male | Female |
| Sales & Related | 242 (52.6%) | 218 (47.4%) |
| Office & Administration | 94 (20.5%) | 365 (79.5%) |
| Total (Category) | 336 (36.6%) | 583 (63.4%) |
| Total (Overall) | 1,550 (55.4%) | 1,246 (44.6%) |
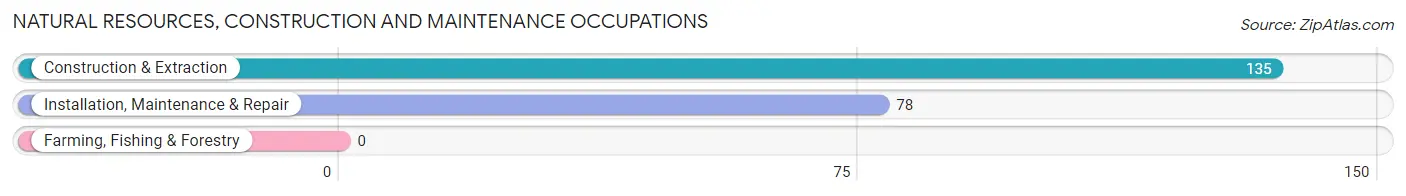
Natural Resources, Construction and Maintenance Occupations
The most common Natural Resources, Construction and Maintenance occupations in White are Construction & Extraction (135 | 4.8%), and Installation, Maintenance & Repair (78 | 2.8%).
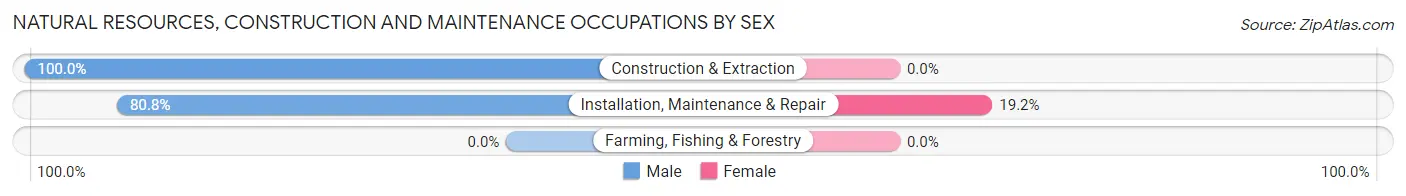
Natural Resources, Construction and Maintenance Occupations by Sex
| Occupation | Male | Female |
| Farming, Fishing & Forestry | 0 (0.0%) | 0 (0.0%) |
| Construction & Extraction | 135 (100.0%) | 0 (0.0%) |
| Installation, Maintenance & Repair | 63 (80.8%) | 15 (19.2%) |
| Total (Category) | 198 (93.0%) | 15 (7.0%) |
| Total (Overall) | 1,550 (55.4%) | 1,246 (44.6%) |
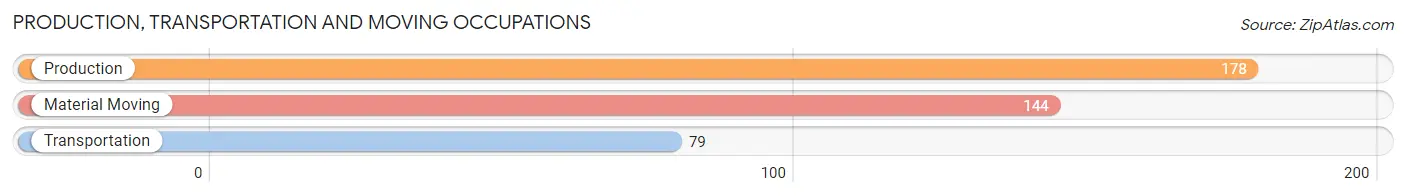
Production, Transportation and Moving Occupations
The most common Production, Transportation and Moving occupations in White are Production (178 | 6.4%), Material Moving (144 | 5.1%), and Transportation (79 | 2.8%).
Production, Transportation and Moving Occupations by Sex
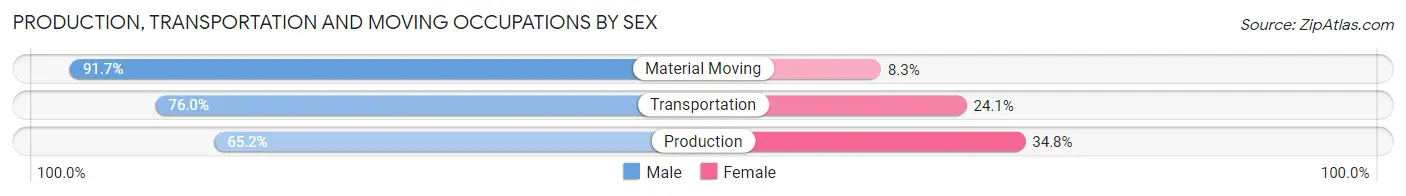
| Occupation | Male | Female |
| Production | 116 (65.2%) | 62 (34.8%) |
| Transportation | 60 (75.9%) | 19 (24.0%) |
| Material Moving | 132 (91.7%) | 12 (8.3%) |
| Total (Category) | 308 (76.8%) | 93 (23.2%) |
| Total (Overall) | 1,550 (55.4%) | 1,246 (44.6%) |
Employment Industries by Sex in White
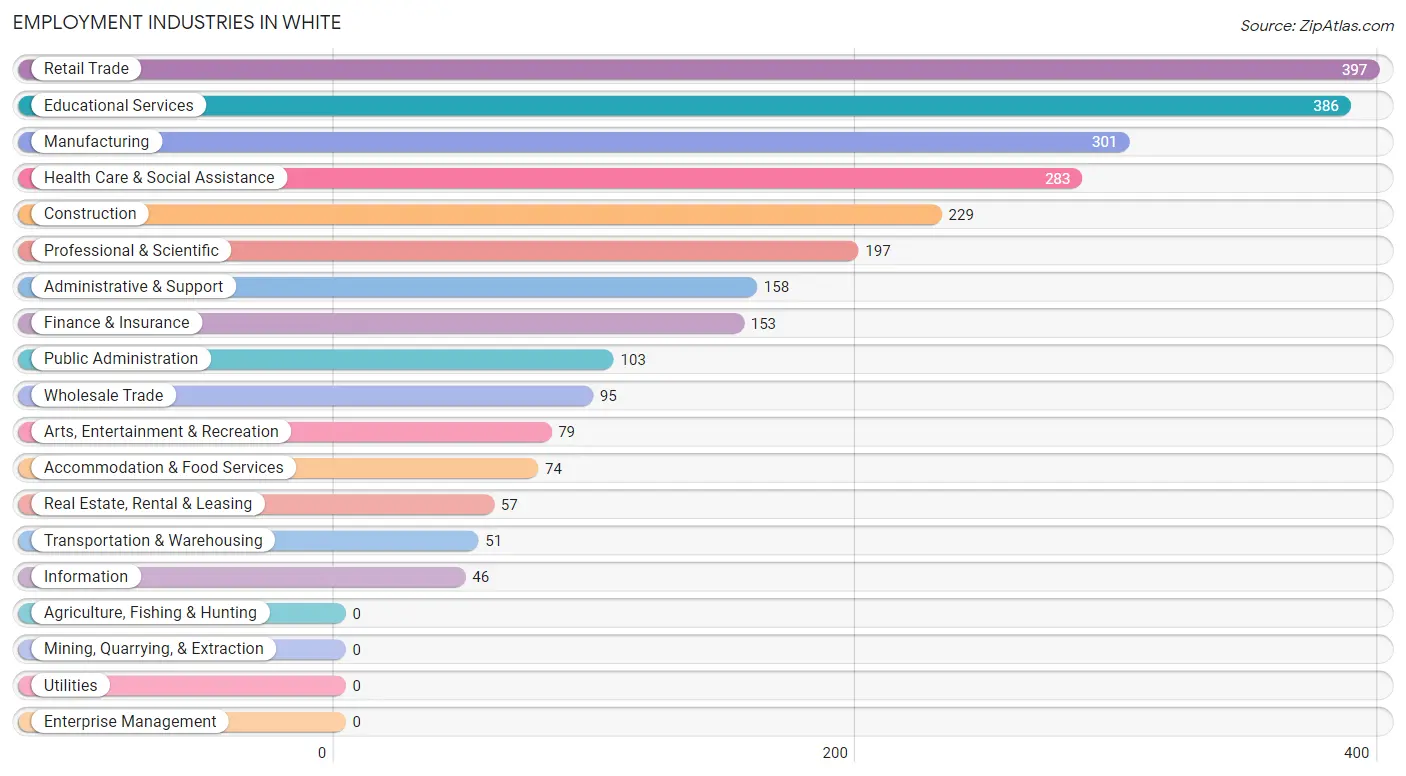
Employment Industries in White
The major employment industries in White include Retail Trade (397 | 14.2%), Educational Services (386 | 13.8%), Manufacturing (301 | 10.8%), Health Care & Social Assistance (283 | 10.1%), and Construction (229 | 8.2%).
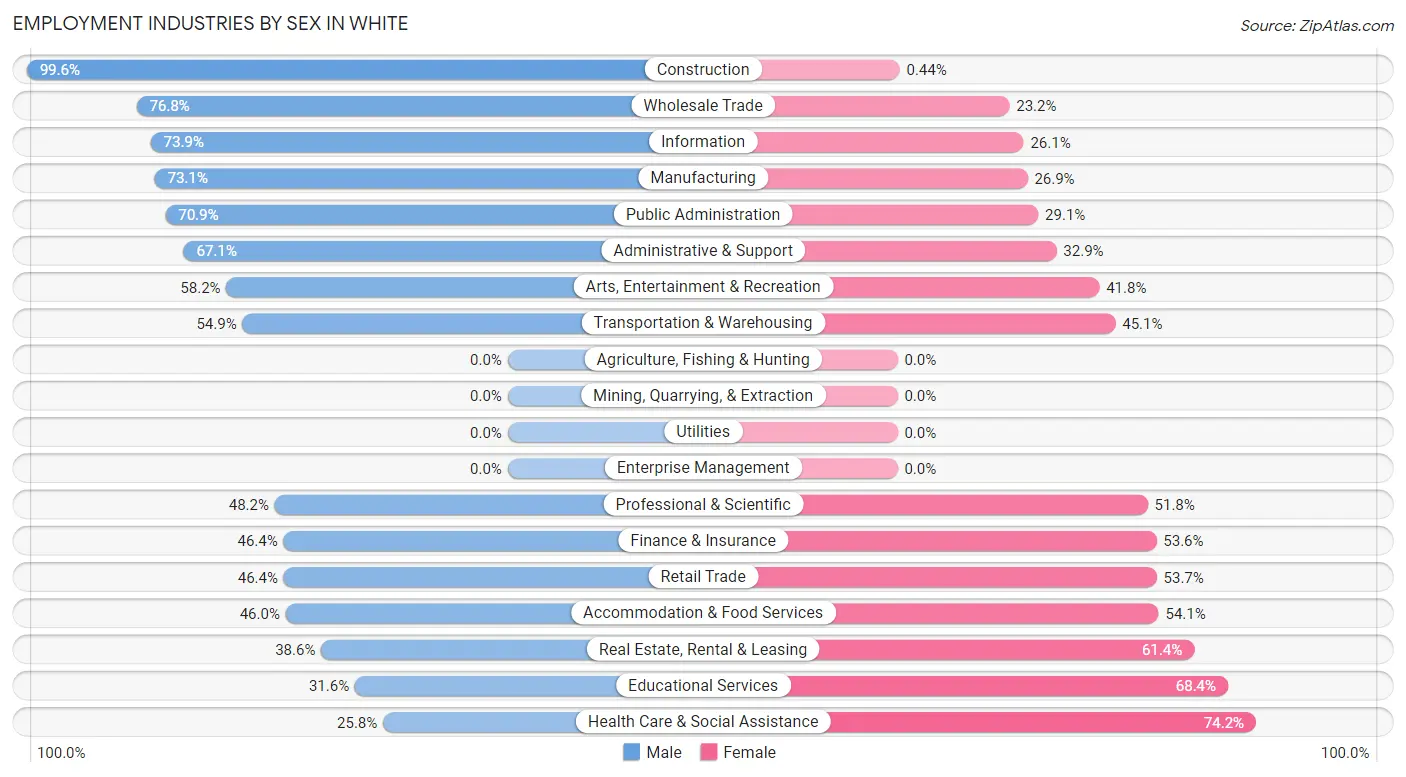
Employment Industries by Sex in White
The White industries that see more men than women are Construction (99.6%), Wholesale Trade (76.8%), and Information (73.9%), whereas the industries that tend to have a higher number of women are Health Care & Social Assistance (74.2%), Educational Services (68.4%), and Real Estate, Rental & Leasing (61.4%).
| Industry | Male | Female |
| Agriculture, Fishing & Hunting | 0 (0.0%) | 0 (0.0%) |
| Mining, Quarrying, & Extraction | 0 (0.0%) | 0 (0.0%) |
| Construction | 228 (99.6%) | 1 (0.4%) |
| Manufacturing | 220 (73.1%) | 81 (26.9%) |
| Wholesale Trade | 73 (76.8%) | 22 (23.2%) |
| Retail Trade | 184 (46.4%) | 213 (53.6%) |
| Transportation & Warehousing | 28 (54.9%) | 23 (45.1%) |
| Utilities | 0 (0.0%) | 0 (0.0%) |
| Information | 34 (73.9%) | 12 (26.1%) |
| Finance & Insurance | 71 (46.4%) | 82 (53.6%) |
| Real Estate, Rental & Leasing | 22 (38.6%) | 35 (61.4%) |
| Professional & Scientific | 95 (48.2%) | 102 (51.8%) |
| Enterprise Management | 0 (0.0%) | 0 (0.0%) |
| Administrative & Support | 106 (67.1%) | 52 (32.9%) |
| Educational Services | 122 (31.6%) | 264 (68.4%) |
| Health Care & Social Assistance | 73 (25.8%) | 210 (74.2%) |
| Arts, Entertainment & Recreation | 46 (58.2%) | 33 (41.8%) |
| Accommodation & Food Services | 34 (46.0%) | 40 (54.0%) |
| Public Administration | 73 (70.9%) | 30 (29.1%) |
| Total | 1,550 (55.4%) | 1,246 (44.6%) |
Education in White
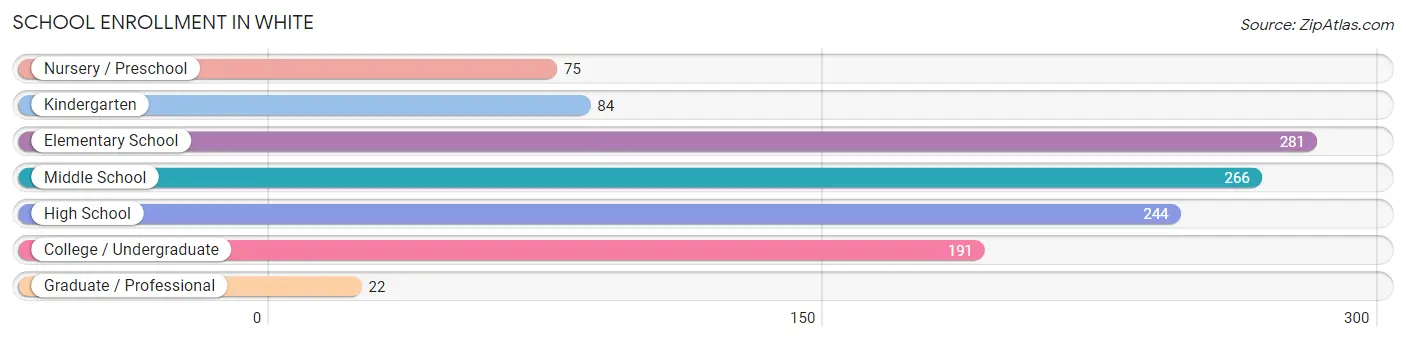
School Enrollment in White
The most common levels of schooling among the 1,163 students in White are elementary school (281 | 24.2%), middle school (266 | 22.9%), and high school (244 | 21.0%).
| School Level | # Students | % Students |
| Nursery / Preschool | 75 | 6.5% |
| Kindergarten | 84 | 7.2% |
| Elementary School | 281 | 24.2% |
| Middle School | 266 | 22.9% |
| High School | 244 | 21.0% |
| College / Undergraduate | 191 | 16.4% |
| Graduate / Professional | 22 | 1.9% |
| Total | 1,163 | 100.0% |
School Enrollment by Age by Funding Source in White
Out of a total of 1,163 students who are enrolled in schools in White, 140 (12.0%) attend a private institution, while the remaining 1,023 (88.0%) are enrolled in public schools. The age group of 3 to 4 year olds has the highest likelihood of being enrolled in private schools, with 11 (44.0% in the age bracket) enrolled. Conversely, the age group of 15 to 17 year olds has the lowest likelihood of being enrolled in a private school, with 199 (100.0% in the age bracket) attending a public institution.
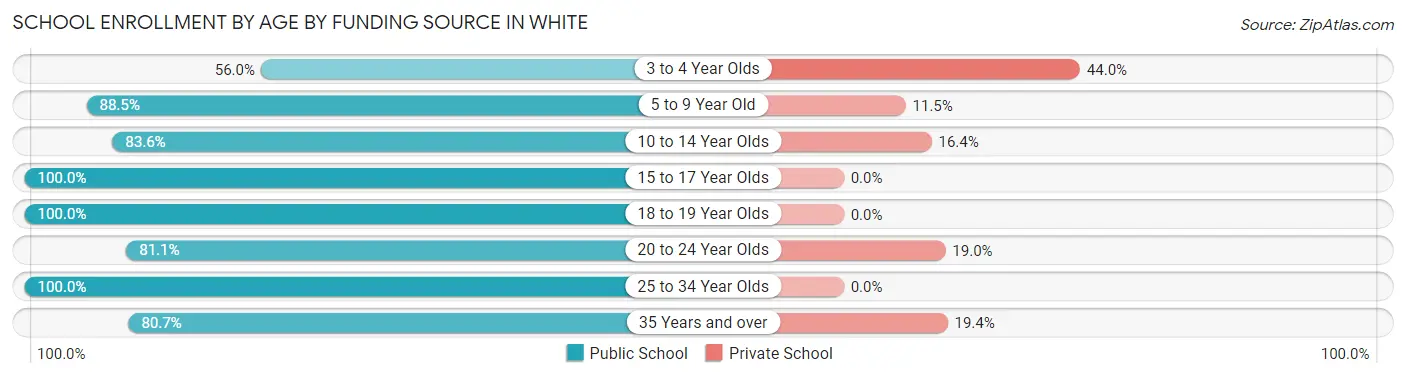
| Age Bracket | Public School | Private School |
| 3 to 4 Year Olds | 14 (56.0%) | 11 (44.0%) |
| 5 to 9 Year Old | 345 (88.5%) | 45 (11.5%) |
| 10 to 14 Year Olds | 276 (83.6%) | 54 (16.4%) |
| 15 to 17 Year Olds | 199 (100.0%) | 0 (0.0%) |
| 18 to 19 Year Olds | 18 (100.0%) | 0 (0.0%) |
| 20 to 24 Year Olds | 77 (81.0%) | 18 (19.0%) |
| 25 to 34 Year Olds | 44 (100.0%) | 0 (0.0%) |
| 35 Years and over | 50 (80.6%) | 12 (19.4%) |
| Total | 1,023 (88.0%) | 140 (12.0%) |
Educational Attainment by Field of Study in White
Business (168 | 15.5%), education (161 | 14.8%), social sciences (118 | 10.9%), arts & humanities (115 | 10.6%), and science & technology (106 | 9.8%) are the most common fields of study among 1,087 individuals in White who have obtained a bachelor's degree or higher.
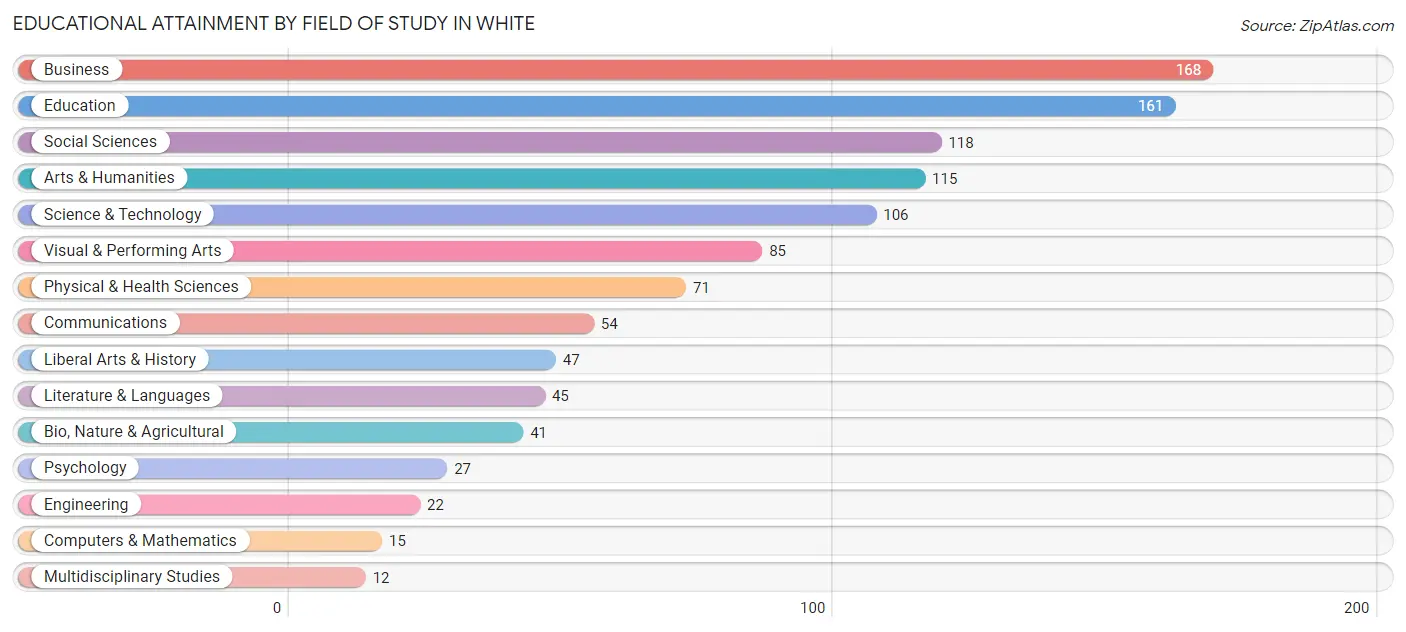
| Field of Study | # Graduates | % Graduates |
| Computers & Mathematics | 15 | 1.4% |
| Bio, Nature & Agricultural | 41 | 3.8% |
| Physical & Health Sciences | 71 | 6.5% |
| Psychology | 27 | 2.5% |
| Social Sciences | 118 | 10.9% |
| Engineering | 22 | 2.0% |
| Multidisciplinary Studies | 12 | 1.1% |
| Science & Technology | 106 | 9.8% |
| Business | 168 | 15.5% |
| Education | 161 | 14.8% |
| Literature & Languages | 45 | 4.1% |
| Liberal Arts & History | 47 | 4.3% |
| Visual & Performing Arts | 85 | 7.8% |
| Communications | 54 | 5.0% |
| Arts & Humanities | 115 | 10.6% |
| Total | 1,087 | 100.0% |
Transportation & Commute in White
Vehicle Availability by Sex in White
The most prevalent vehicle ownership categories in White are males with 2 vehicles (710, accounting for 45.8%) and females with 2 vehicles (608, making up 58.5%).
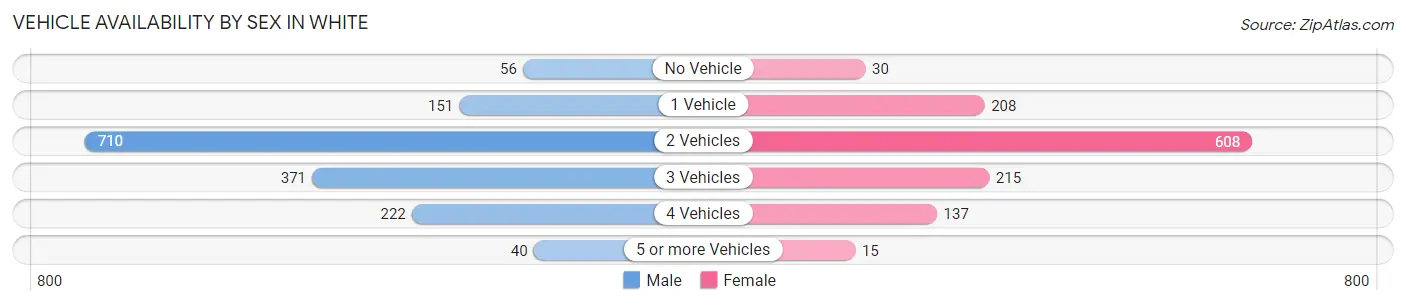
| Vehicles Available | Male | Female |
| No Vehicle | 56 (3.6%) | 30 (2.5%) |
| 1 Vehicle | 151 (9.7%) | 208 (17.2%) |
| 2 Vehicles | 710 (45.8%) | 608 (50.1%) |
| 3 Vehicles | 371 (23.9%) | 215 (17.7%) |
| 4 Vehicles | 222 (14.3%) | 137 (11.3%) |
| 5 or more Vehicles | 40 (2.6%) | 15 (1.2%) |
| Total | 1,550 (100.0%) | 1,213 (100.0%) |
Commute Time in White
The most frequently occuring commute durations in White are 20 to 24 minutes (443 commuters, 19.1%), 30 to 34 minutes (426 commuters, 18.4%), and 10 to 14 minutes (313 commuters, 13.5%).
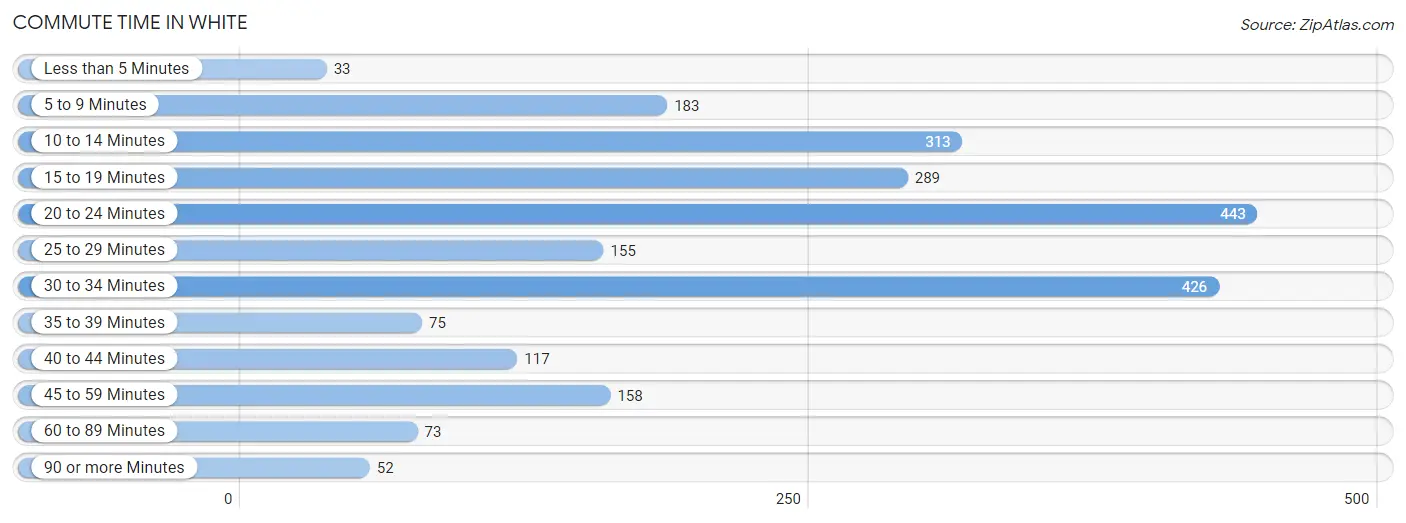
| Commute Time | # Commuters | % Commuters |
| Less than 5 Minutes | 33 | 1.4% |
| 5 to 9 Minutes | 183 | 7.9% |
| 10 to 14 Minutes | 313 | 13.5% |
| 15 to 19 Minutes | 289 | 12.5% |
| 20 to 24 Minutes | 443 | 19.1% |
| 25 to 29 Minutes | 155 | 6.7% |
| 30 to 34 Minutes | 426 | 18.4% |
| 35 to 39 Minutes | 75 | 3.2% |
| 40 to 44 Minutes | 117 | 5.1% |
| 45 to 59 Minutes | 158 | 6.8% |
| 60 to 89 Minutes | 73 | 3.2% |
| 90 or more Minutes | 52 | 2.2% |
Commute Time by Sex in White
The most common commute times in White are 20 to 24 minutes (297 commuters, 22.3%) for males and 10 to 14 minutes (211 commuters, 21.4%) for females.
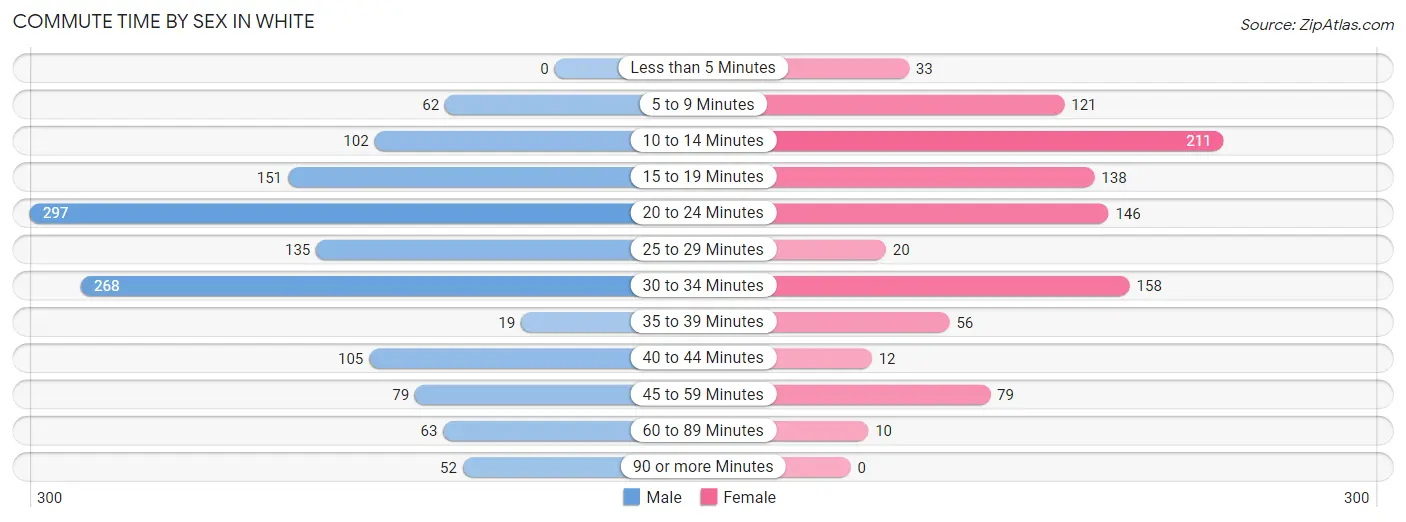
| Commute Time | Male | Female |
| Less than 5 Minutes | 0 (0.0%) | 33 (3.4%) |
| 5 to 9 Minutes | 62 (4.6%) | 121 (12.3%) |
| 10 to 14 Minutes | 102 (7.6%) | 211 (21.4%) |
| 15 to 19 Minutes | 151 (11.3%) | 138 (14.0%) |
| 20 to 24 Minutes | 297 (22.3%) | 146 (14.8%) |
| 25 to 29 Minutes | 135 (10.1%) | 20 (2.0%) |
| 30 to 34 Minutes | 268 (20.1%) | 158 (16.1%) |
| 35 to 39 Minutes | 19 (1.4%) | 56 (5.7%) |
| 40 to 44 Minutes | 105 (7.9%) | 12 (1.2%) |
| 45 to 59 Minutes | 79 (5.9%) | 79 (8.0%) |
| 60 to 89 Minutes | 63 (4.7%) | 10 (1.0%) |
| 90 or more Minutes | 52 (3.9%) | 0 (0.0%) |
Time of Departure to Work by Sex in White
The most frequent times of departure to work in White are 8:00 AM to 8:29 AM (186, 14.0%) for males and 7:00 AM to 7:29 AM (135, 13.7%) for females.
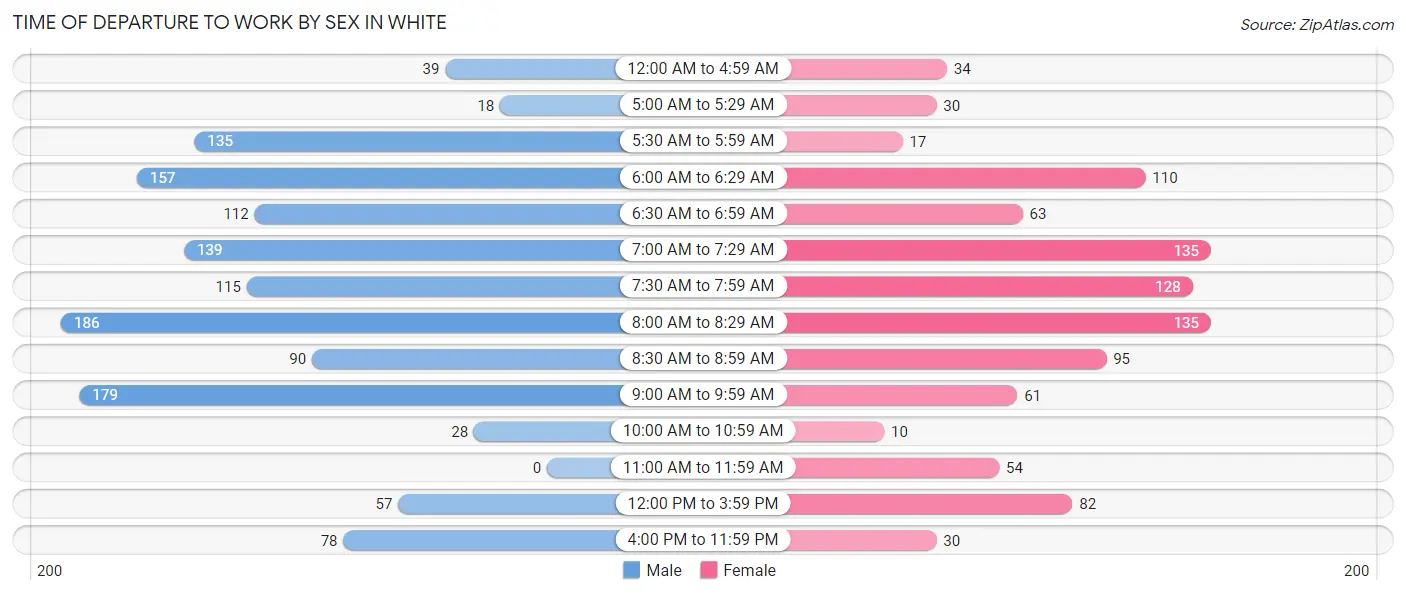
| Time of Departure | Male | Female |
| 12:00 AM to 4:59 AM | 39 (2.9%) | 34 (3.5%) |
| 5:00 AM to 5:29 AM | 18 (1.3%) | 30 (3.0%) |
| 5:30 AM to 5:59 AM | 135 (10.1%) | 17 (1.7%) |
| 6:00 AM to 6:29 AM | 157 (11.8%) | 110 (11.2%) |
| 6:30 AM to 6:59 AM | 112 (8.4%) | 63 (6.4%) |
| 7:00 AM to 7:29 AM | 139 (10.4%) | 135 (13.7%) |
| 7:30 AM to 7:59 AM | 115 (8.6%) | 128 (13.0%) |
| 8:00 AM to 8:29 AM | 186 (14.0%) | 135 (13.7%) |
| 8:30 AM to 8:59 AM | 90 (6.8%) | 95 (9.7%) |
| 9:00 AM to 9:59 AM | 179 (13.4%) | 61 (6.2%) |
| 10:00 AM to 10:59 AM | 28 (2.1%) | 10 (1.0%) |
| 11:00 AM to 11:59 AM | 0 (0.0%) | 54 (5.5%) |
| 12:00 PM to 3:59 PM | 57 (4.3%) | 82 (8.3%) |
| 4:00 PM to 11:59 PM | 78 (5.9%) | 30 (3.0%) |
| Total | 1,333 (100.0%) | 984 (100.0%) |
Housing Occupancy in White
Occupancy by Ownership in White
Of the total 1,915 dwellings in White, owner-occupied units account for 1,727 (90.2%), while renter-occupied units make up 188 (9.8%).
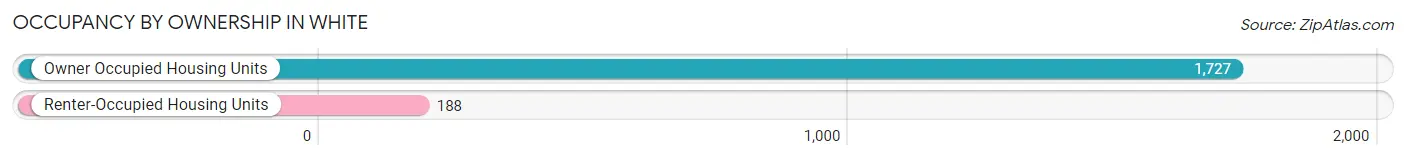
| Occupancy | # Housing Units | % Housing Units |
| Owner Occupied Housing Units | 1,727 | 90.2% |
| Renter-Occupied Housing Units | 188 | 9.8% |
| Total Occupied Housing Units | 1,915 | 100.0% |
Occupancy by Household Size in White
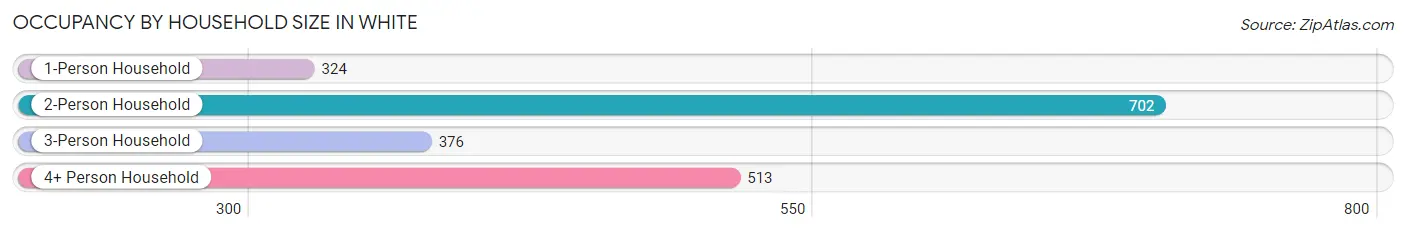
| Household Size | # Housing Units | % Housing Units |
| 1-Person Household | 324 | 16.9% |
| 2-Person Household | 702 | 36.7% |
| 3-Person Household | 376 | 19.6% |
| 4+ Person Household | 513 | 26.8% |
| Total Housing Units | 1,915 | 100.0% |
Occupancy by Ownership by Household Size in White
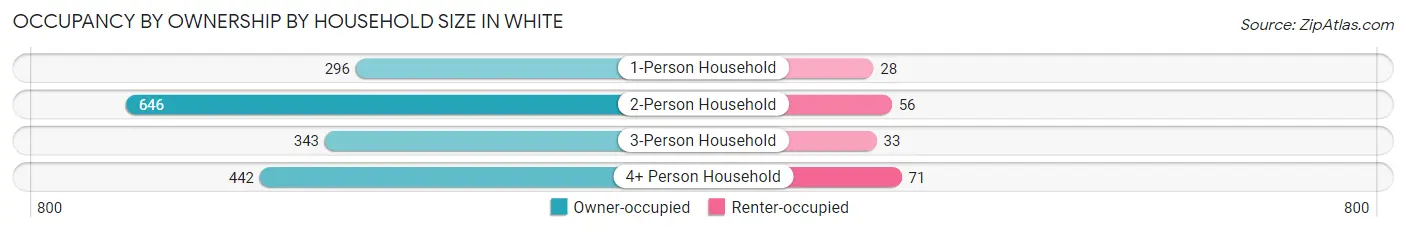
| Household Size | Owner-occupied | Renter-occupied |
| 1-Person Household | 296 (91.4%) | 28 (8.6%) |
| 2-Person Household | 646 (92.0%) | 56 (8.0%) |
| 3-Person Household | 343 (91.2%) | 33 (8.8%) |
| 4+ Person Household | 442 (86.2%) | 71 (13.8%) |
| Total Housing Units | 1,727 (90.2%) | 188 (9.8%) |
Occupancy by Educational Attainment in White
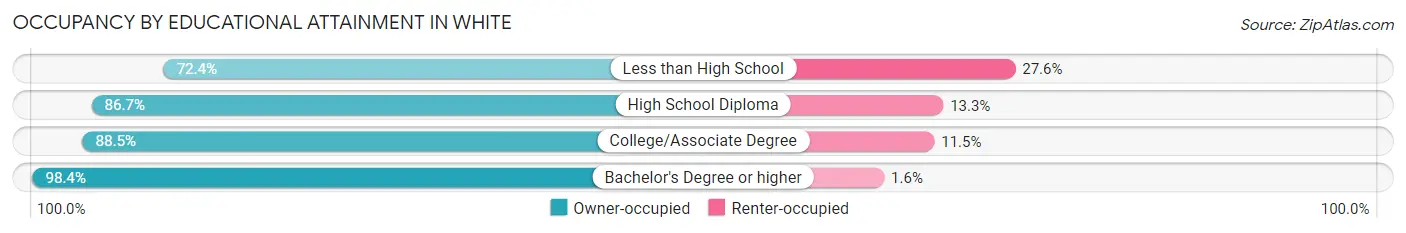
| Household Size | Owner-occupied | Renter-occupied |
| Less than High School | 63 (72.4%) | 24 (27.6%) |
| High School Diploma | 483 (86.7%) | 74 (13.3%) |
| College/Associate Degree | 622 (88.5%) | 81 (11.5%) |
| Bachelor's Degree or higher | 559 (98.4%) | 9 (1.6%) |
Occupancy by Age of Householder in White
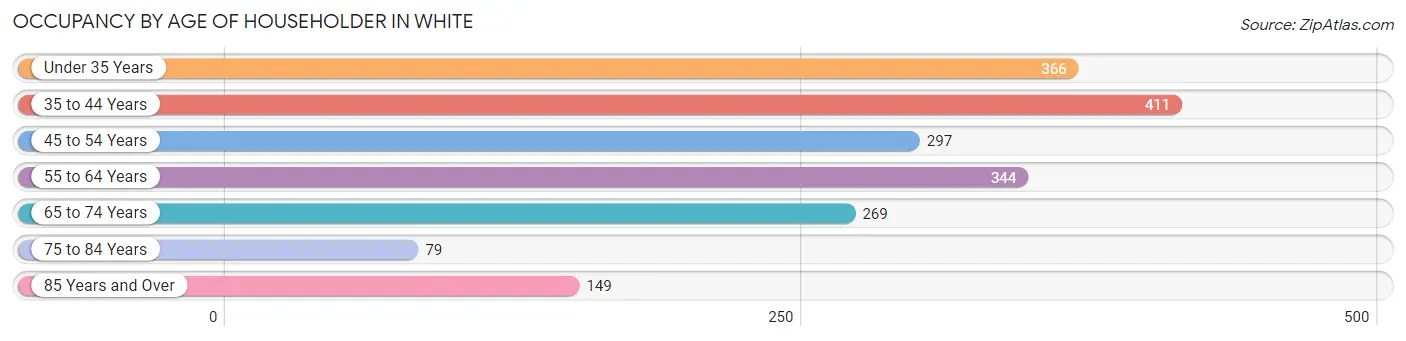
| Age Bracket | # Households | % Households |
| Under 35 Years | 366 | 19.1% |
| 35 to 44 Years | 411 | 21.5% |
| 45 to 54 Years | 297 | 15.5% |
| 55 to 64 Years | 344 | 18.0% |
| 65 to 74 Years | 269 | 14.1% |
| 75 to 84 Years | 79 | 4.1% |
| 85 Years and Over | 149 | 7.8% |
| Total | 1,915 | 100.0% |
Housing Finances in White
Median Income by Occupancy in White
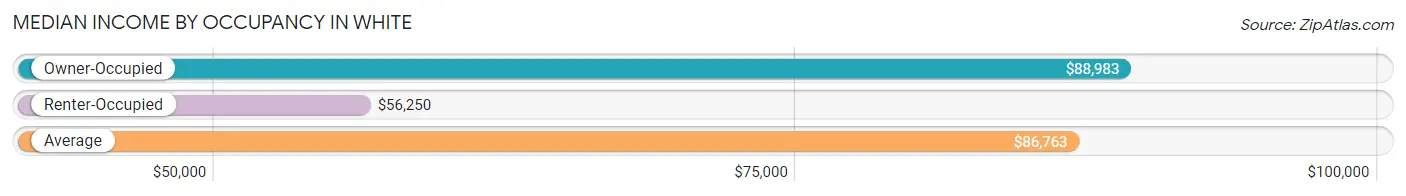
| Occupancy Type | # Households | Median Income |
| Owner-Occupied | 1,727 (90.2%) | $88,983 |
| Renter-Occupied | 188 (9.8%) | $56,250 |
| Average | 1,915 (100.0%) | $86,763 |
Occupancy by Householder Income Bracket in White
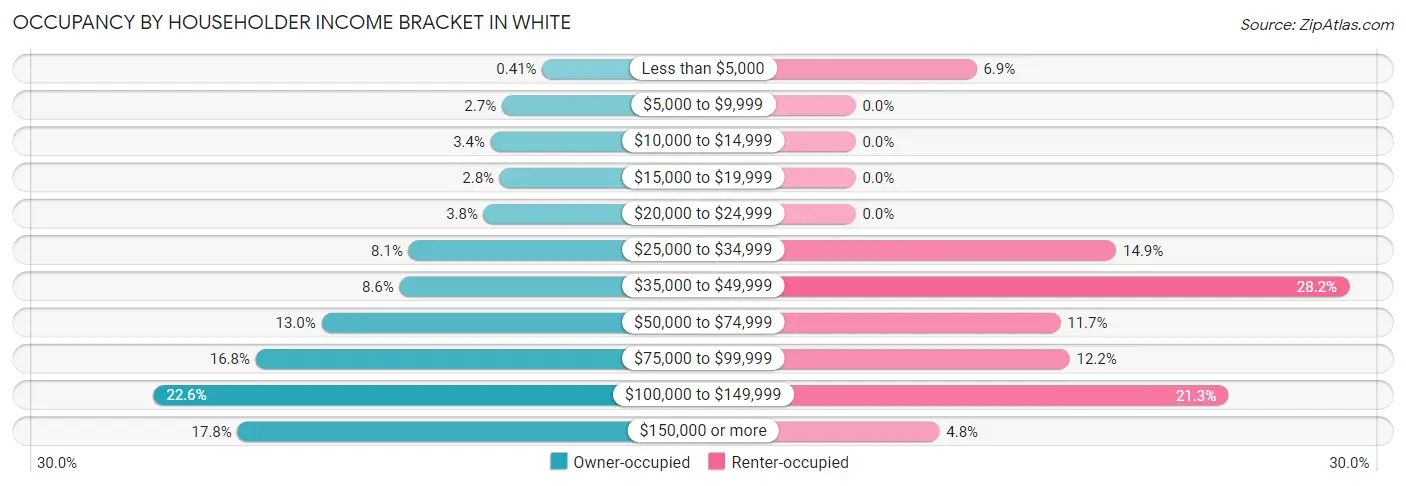
| Income Bracket | Owner-occupied | Renter-occupied |
| Less than $5,000 | 7 (0.4%) | 13 (6.9%) |
| $5,000 to $9,999 | 47 (2.7%) | 0 (0.0%) |
| $10,000 to $14,999 | 58 (3.4%) | 0 (0.0%) |
| $15,000 to $19,999 | 49 (2.8%) | 0 (0.0%) |
| $20,000 to $24,999 | 65 (3.8%) | 0 (0.0%) |
| $25,000 to $34,999 | 139 (8.1%) | 28 (14.9%) |
| $35,000 to $49,999 | 148 (8.6%) | 53 (28.2%) |
| $50,000 to $74,999 | 225 (13.0%) | 22 (11.7%) |
| $75,000 to $99,999 | 290 (16.8%) | 23 (12.2%) |
| $100,000 to $149,999 | 391 (22.6%) | 40 (21.3%) |
| $150,000 or more | 308 (17.8%) | 9 (4.8%) |
| Total | 1,727 (100.0%) | 188 (100.0%) |
Monthly Housing Cost Tiers in White
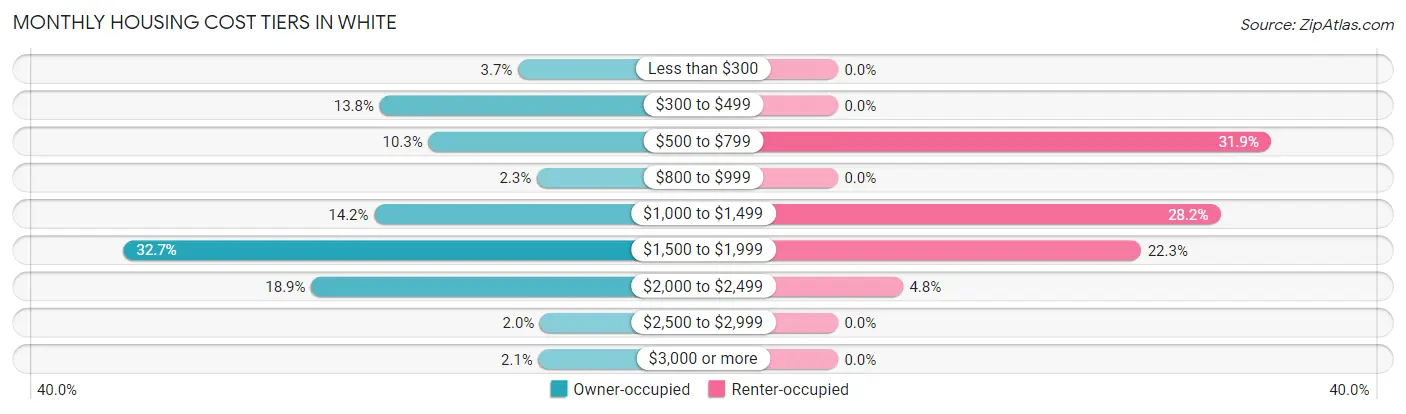
| Monthly Cost | Owner-occupied | Renter-occupied |
| Less than $300 | 63 (3.6%) | 0 (0.0%) |
| $300 to $499 | 239 (13.8%) | 0 (0.0%) |
| $500 to $799 | 177 (10.2%) | 60 (31.9%) |
| $800 to $999 | 39 (2.3%) | 0 (0.0%) |
| $1,000 to $1,499 | 246 (14.2%) | 53 (28.2%) |
| $1,500 to $1,999 | 565 (32.7%) | 42 (22.3%) |
| $2,000 to $2,499 | 326 (18.9%) | 9 (4.8%) |
| $2,500 to $2,999 | 35 (2.0%) | 0 (0.0%) |
| $3,000 or more | 37 (2.1%) | 0 (0.0%) |
| Total | 1,727 (100.0%) | 188 (100.0%) |
Physical Housing Characteristics in White
Housing Structures in White
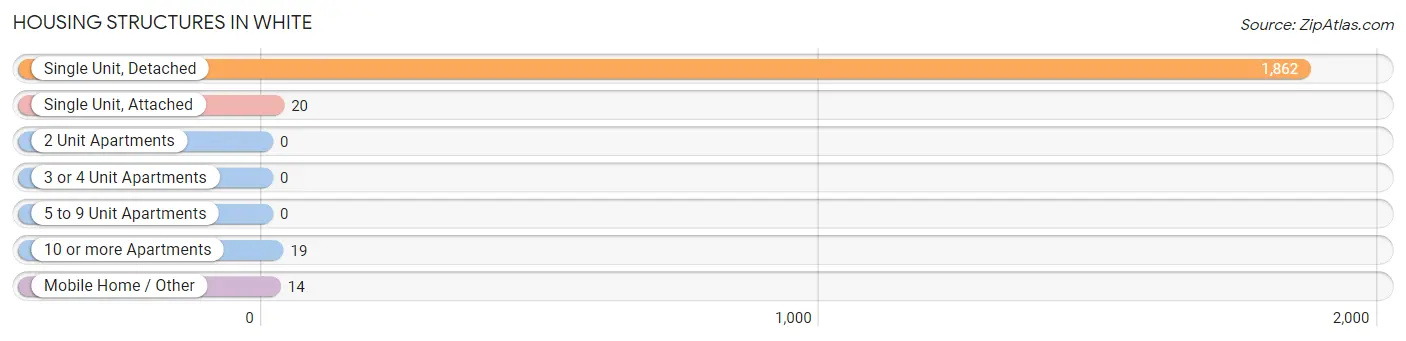
| Structure Type | # Housing Units | % Housing Units |
| Single Unit, Detached | 1,862 | 97.2% |
| Single Unit, Attached | 20 | 1.0% |
| 2 Unit Apartments | 0 | 0.0% |
| 3 or 4 Unit Apartments | 0 | 0.0% |
| 5 to 9 Unit Apartments | 0 | 0.0% |
| 10 or more Apartments | 19 | 1.0% |
| Mobile Home / Other | 14 | 0.7% |
| Total | 1,915 | 100.0% |
Housing Structures by Occupancy in White
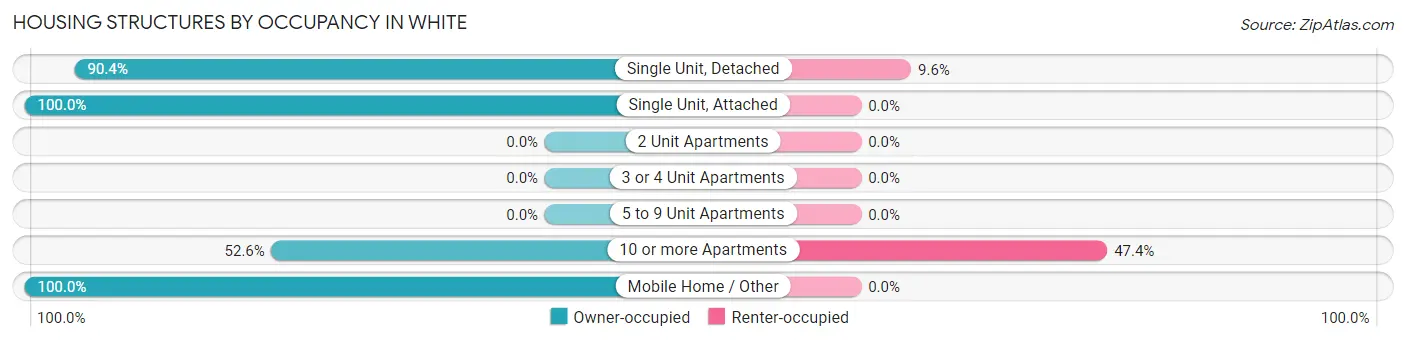
| Structure Type | Owner-occupied | Renter-occupied |
| Single Unit, Detached | 1,683 (90.4%) | 179 (9.6%) |
| Single Unit, Attached | 20 (100.0%) | 0 (0.0%) |
| 2 Unit Apartments | 0 (0.0%) | 0 (0.0%) |
| 3 or 4 Unit Apartments | 0 (0.0%) | 0 (0.0%) |
| 5 to 9 Unit Apartments | 0 (0.0%) | 0 (0.0%) |
| 10 or more Apartments | 10 (52.6%) | 9 (47.4%) |
| Mobile Home / Other | 14 (100.0%) | 0 (0.0%) |
| Total | 1,727 (90.2%) | 188 (9.8%) |
Housing Structures by Number of Rooms in White
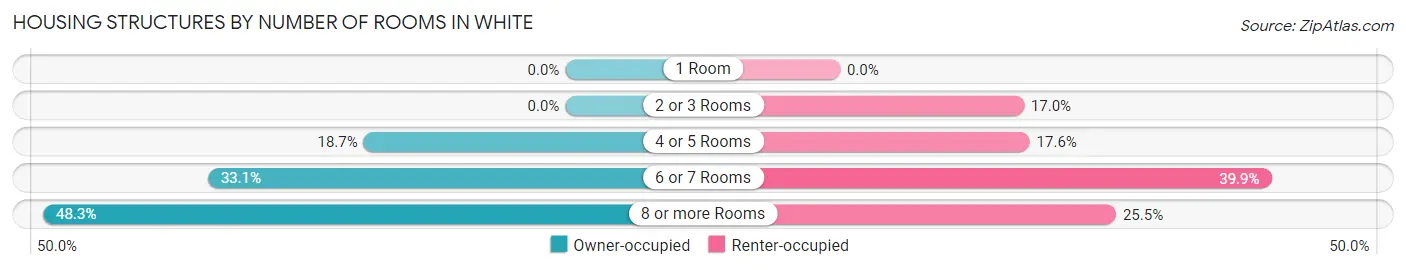
| Number of Rooms | Owner-occupied | Renter-occupied |
| 1 Room | 0 (0.0%) | 0 (0.0%) |
| 2 or 3 Rooms | 0 (0.0%) | 32 (17.0%) |
| 4 or 5 Rooms | 322 (18.6%) | 33 (17.5%) |
| 6 or 7 Rooms | 571 (33.1%) | 75 (39.9%) |
| 8 or more Rooms | 834 (48.3%) | 48 (25.5%) |
| Total | 1,727 (100.0%) | 188 (100.0%) |
Housing Structure by Heating Type in White
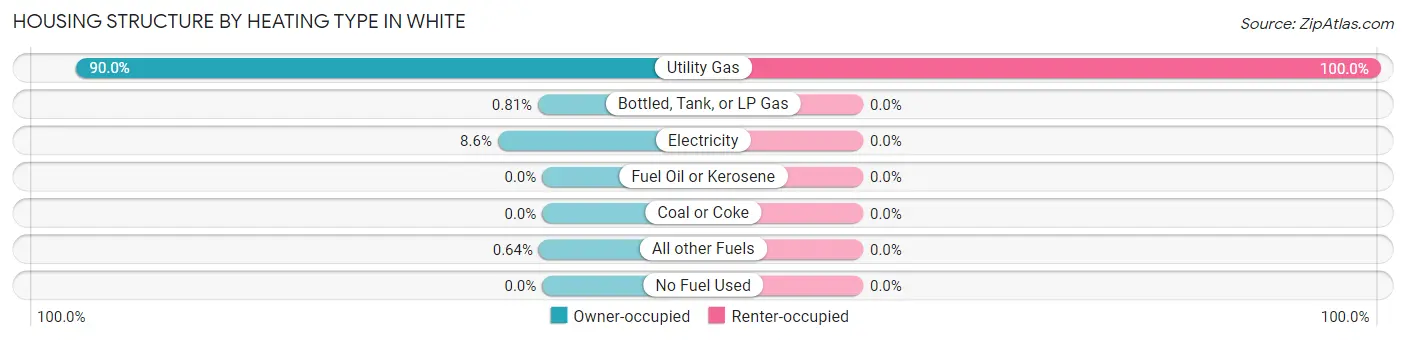
| Heating Type | Owner-occupied | Renter-occupied |
| Utility Gas | 1,554 (90.0%) | 188 (100.0%) |
| Bottled, Tank, or LP Gas | 14 (0.8%) | 0 (0.0%) |
| Electricity | 148 (8.6%) | 0 (0.0%) |
| Fuel Oil or Kerosene | 0 (0.0%) | 0 (0.0%) |
| Coal or Coke | 0 (0.0%) | 0 (0.0%) |
| All other Fuels | 11 (0.6%) | 0 (0.0%) |
| No Fuel Used | 0 (0.0%) | 0 (0.0%) |
| Total | 1,727 (100.0%) | 188 (100.0%) |
Household Vehicle Usage in White
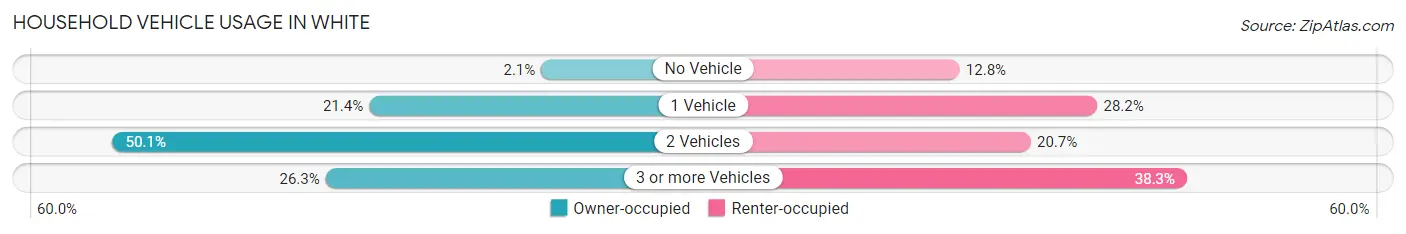
| Vehicles per Household | Owner-occupied | Renter-occupied |
| No Vehicle | 37 (2.1%) | 24 (12.8%) |
| 1 Vehicle | 370 (21.4%) | 53 (28.2%) |
| 2 Vehicles | 866 (50.1%) | 39 (20.7%) |
| 3 or more Vehicles | 454 (26.3%) | 72 (38.3%) |
| Total | 1,727 (100.0%) | 188 (100.0%) |
Real Estate & Mortgages in White
Real Estate and Mortgage Overview in White
| Characteristic | Without Mortgage | With Mortgage |
| Housing Units | 431 | 1,296 |
| Median Property Value | $333,900 | $372,400 |
| Median Household Income | $43,053 | $265 |
| Monthly Housing Costs | $459 | $37 |
| Real Estate Taxes | $2,287 | $29 |
Property Value by Mortgage Status in White
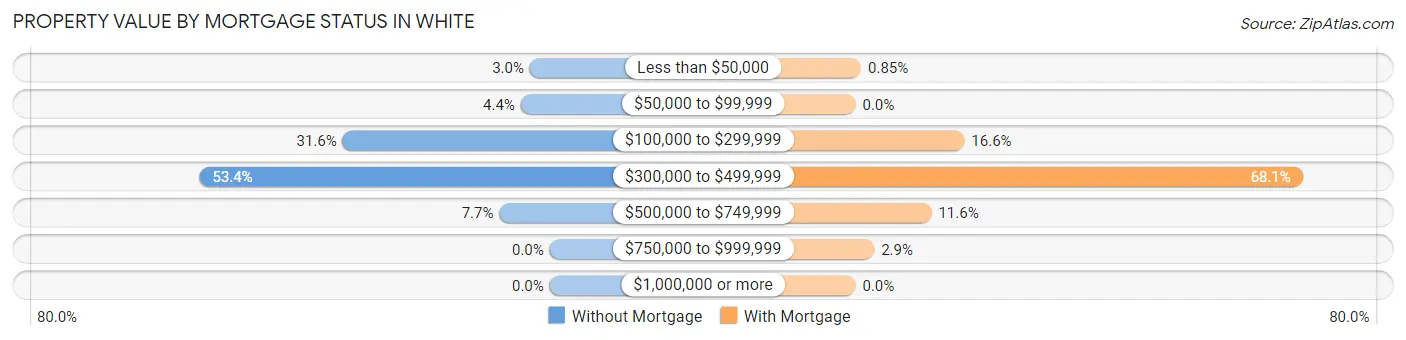
| Property Value | Without Mortgage | With Mortgage |
| Less than $50,000 | 13 (3.0%) | 11 (0.9%) |
| $50,000 to $99,999 | 19 (4.4%) | 0 (0.0%) |
| $100,000 to $299,999 | 136 (31.6%) | 215 (16.6%) |
| $300,000 to $499,999 | 230 (53.4%) | 883 (68.1%) |
| $500,000 to $749,999 | 33 (7.7%) | 150 (11.6%) |
| $750,000 to $999,999 | 0 (0.0%) | 37 (2.9%) |
| $1,000,000 or more | 0 (0.0%) | 0 (0.0%) |
| Total | 431 (100.0%) | 1,296 (100.0%) |
Household Income by Mortgage Status in White
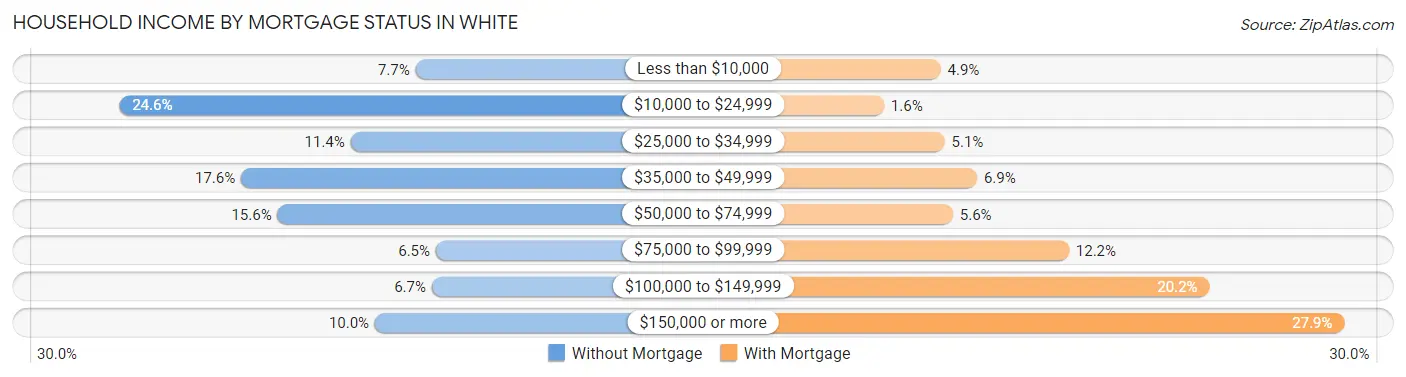
| Household Income | Without Mortgage | With Mortgage |
| Less than $10,000 | 33 (7.7%) | 63 (4.9%) |
| $10,000 to $24,999 | 106 (24.6%) | 21 (1.6%) |
| $25,000 to $34,999 | 49 (11.4%) | 66 (5.1%) |
| $35,000 to $49,999 | 76 (17.6%) | 90 (6.9%) |
| $50,000 to $74,999 | 67 (15.5%) | 72 (5.6%) |
| $75,000 to $99,999 | 28 (6.5%) | 158 (12.2%) |
| $100,000 to $149,999 | 29 (6.7%) | 262 (20.2%) |
| $150,000 or more | 43 (10.0%) | 362 (27.9%) |
| Total | 431 (100.0%) | 1,296 (100.0%) |
Property Value to Household Income Ratio in White
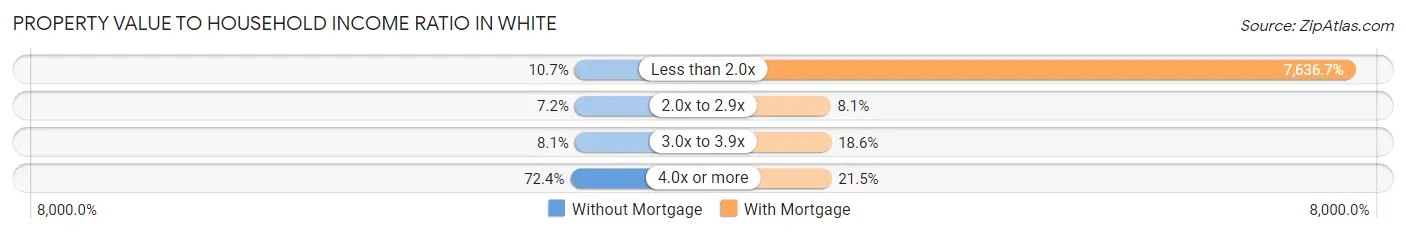
| Value-to-Income Ratio | Without Mortgage | With Mortgage |
| Less than 2.0x | 46 (10.7%) | 98,971 (7,636.7%) |
| 2.0x to 2.9x | 31 (7.2%) | 105 (8.1%) |
| 3.0x to 3.9x | 35 (8.1%) | 241 (18.6%) |
| 4.0x or more | 312 (72.4%) | 278 (21.4%) |
| Total | 431 (100.0%) | 1,296 (100.0%) |
Real Estate Taxes by Mortgage Status in White
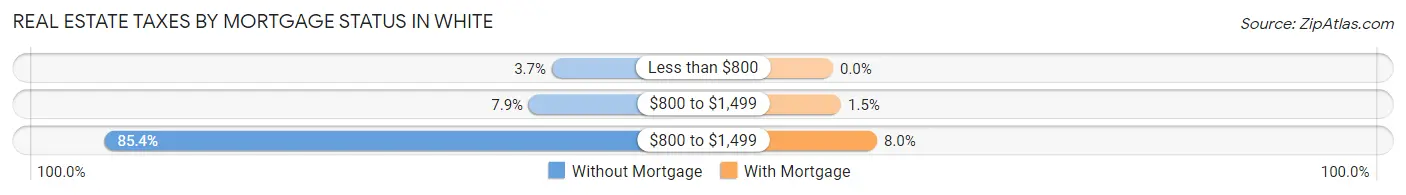
| Property Taxes | Without Mortgage | With Mortgage |
| Less than $800 | 16 (3.7%) | 0 (0.0%) |
| $800 to $1,499 | 34 (7.9%) | 19 (1.5%) |
| $800 to $1,499 | 368 (85.4%) | 104 (8.0%) |
| Total | 431 (100.0%) | 1,296 (100.0%) |
Health & Disability in White
Health Insurance Coverage by Age in White
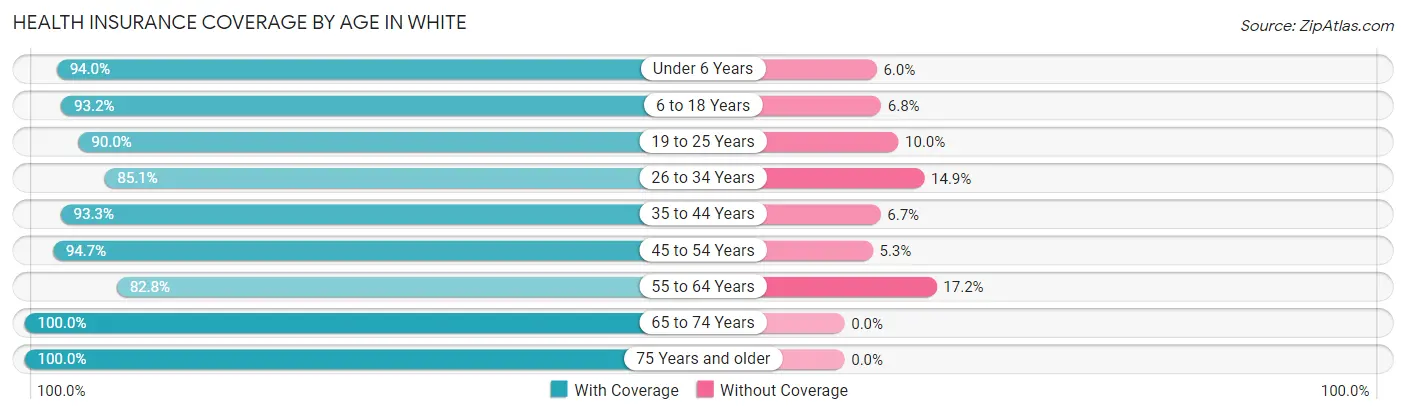
| Age Bracket | With Coverage | Without Coverage |
| Under 6 Years | 423 (94.0%) | 27 (6.0%) |
| 6 to 18 Years | 875 (93.2%) | 64 (6.8%) |
| 19 to 25 Years | 439 (90.0%) | 49 (10.0%) |
| 26 to 34 Years | 721 (85.1%) | 126 (14.9%) |
| 35 to 44 Years | 749 (93.3%) | 54 (6.7%) |
| 45 to 54 Years | 576 (94.7%) | 32 (5.3%) |
| 55 to 64 Years | 458 (82.8%) | 95 (17.2%) |
| 65 to 74 Years | 521 (100.0%) | 0 (0.0%) |
| 75 Years and older | 353 (100.0%) | 0 (0.0%) |
| Total | 5,115 (92.0%) | 447 (8.0%) |
Health Insurance Coverage by Citizenship Status in White
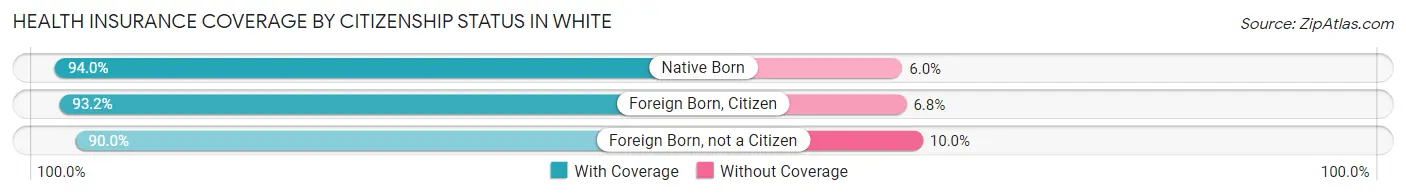
| Citizenship Status | With Coverage | Without Coverage |
| Native Born | 423 (94.0%) | 27 (6.0%) |
| Foreign Born, Citizen | 875 (93.2%) | 64 (6.8%) |
| Foreign Born, not a Citizen | 439 (90.0%) | 49 (10.0%) |
Health Insurance Coverage by Household Income in White
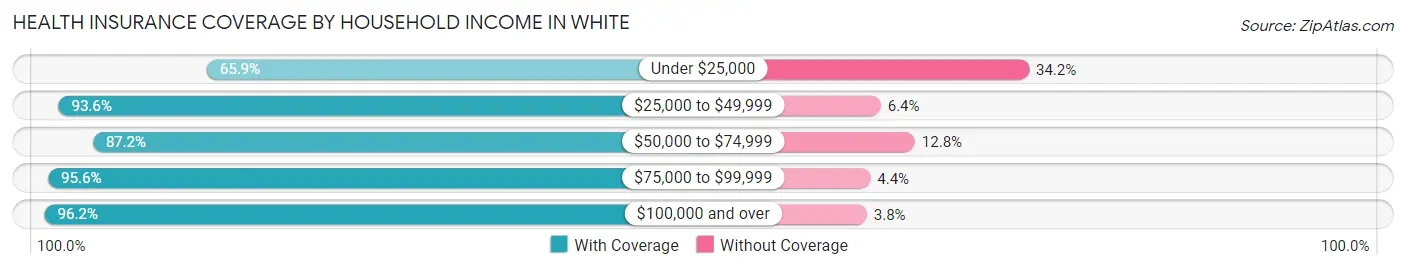
| Household Income | With Coverage | Without Coverage |
| Under $25,000 | 297 (65.8%) | 154 (34.2%) |
| $25,000 to $49,999 | 706 (93.6%) | 48 (6.4%) |
| $50,000 to $74,999 | 725 (87.2%) | 106 (12.8%) |
| $75,000 to $99,999 | 1,039 (95.6%) | 48 (4.4%) |
| $100,000 and over | 2,332 (96.2%) | 91 (3.8%) |
Public vs Private Health Insurance Coverage by Age in White
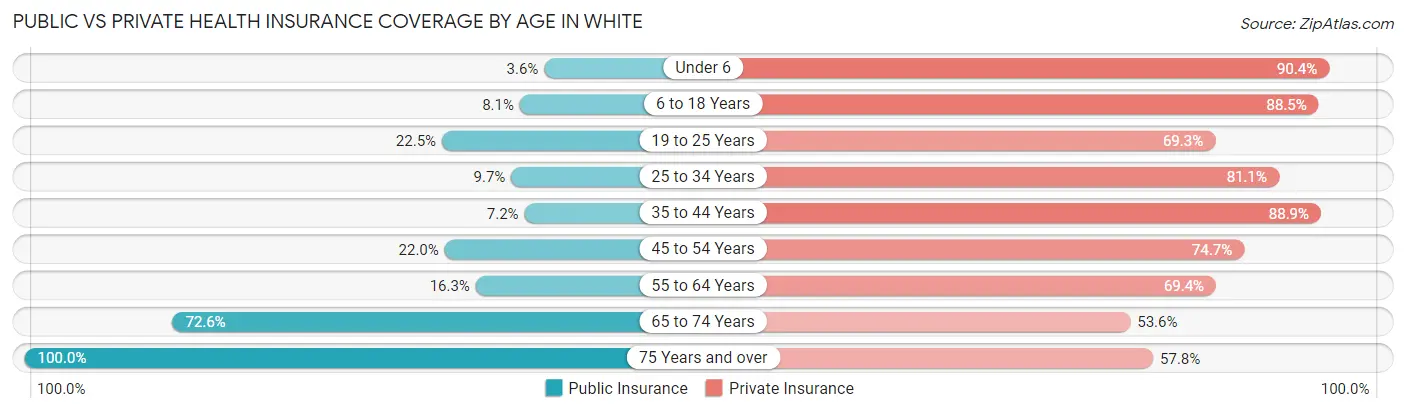
| Age Bracket | Public Insurance | Private Insurance |
| Under 6 | 16 (3.6%) | 407 (90.4%) |
| 6 to 18 Years | 76 (8.1%) | 831 (88.5%) |
| 19 to 25 Years | 110 (22.5%) | 338 (69.3%) |
| 25 to 34 Years | 82 (9.7%) | 687 (81.1%) |
| 35 to 44 Years | 58 (7.2%) | 714 (88.9%) |
| 45 to 54 Years | 134 (22.0%) | 454 (74.7%) |
| 55 to 64 Years | 90 (16.3%) | 384 (69.4%) |
| 65 to 74 Years | 378 (72.6%) | 279 (53.5%) |
| 75 Years and over | 353 (100.0%) | 204 (57.8%) |
| Total | 1,297 (23.3%) | 4,298 (77.3%) |
Disability Status by Sex by Age in White
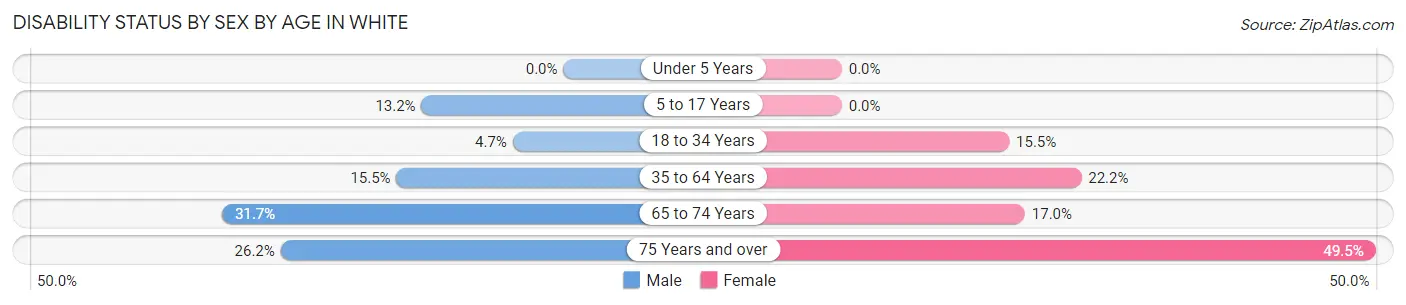
| Age Bracket | Male | Female |
| Under 5 Years | 0 (0.0%) | 0 (0.0%) |
| 5 to 17 Years | 59 (13.2%) | 0 (0.0%) |
| 18 to 34 Years | 35 (4.7%) | 100 (15.5%) |
| 35 to 64 Years | 153 (15.5%) | 217 (22.2%) |
| 65 to 74 Years | 83 (31.7%) | 44 (17.0%) |
| 75 Years and over | 37 (26.2%) | 105 (49.5%) |
Disability Class by Sex by Age in White
Disability Class: Hearing Difficulty
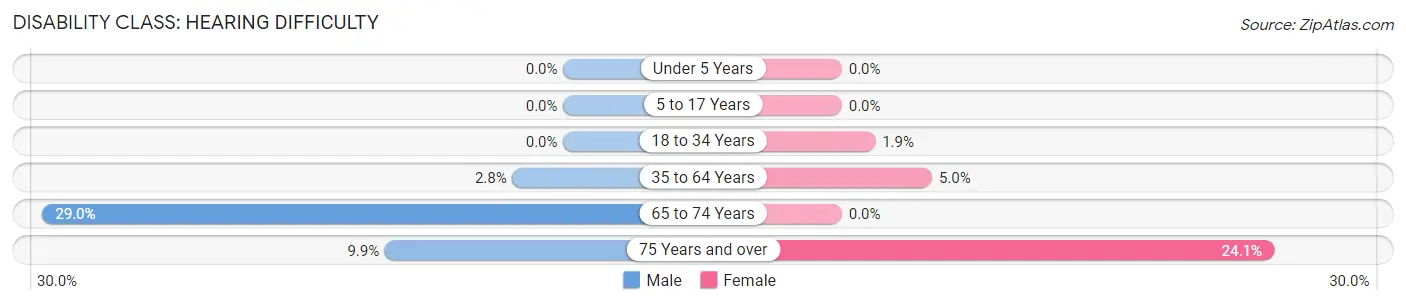
| Age Bracket | Male | Female |
| Under 5 Years | 0 (0.0%) | 0 (0.0%) |
| 5 to 17 Years | 0 (0.0%) | 0 (0.0%) |
| 18 to 34 Years | 0 (0.0%) | 12 (1.9%) |
| 35 to 64 Years | 28 (2.8%) | 49 (5.0%) |
| 65 to 74 Years | 76 (29.0%) | 0 (0.0%) |
| 75 Years and over | 14 (9.9%) | 51 (24.1%) |
Disability Class: Vision Difficulty
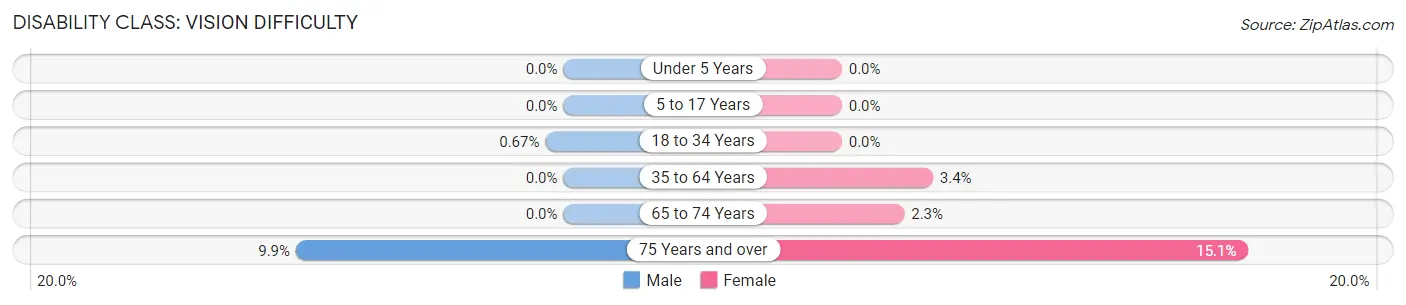
| Age Bracket | Male | Female |
| Under 5 Years | 0 (0.0%) | 0 (0.0%) |
| 5 to 17 Years | 0 (0.0%) | 0 (0.0%) |
| 18 to 34 Years | 5 (0.7%) | 0 (0.0%) |
| 35 to 64 Years | 0 (0.0%) | 33 (3.4%) |
| 65 to 74 Years | 0 (0.0%) | 6 (2.3%) |
| 75 Years and over | 14 (9.9%) | 32 (15.1%) |
Disability Class: Cognitive Difficulty
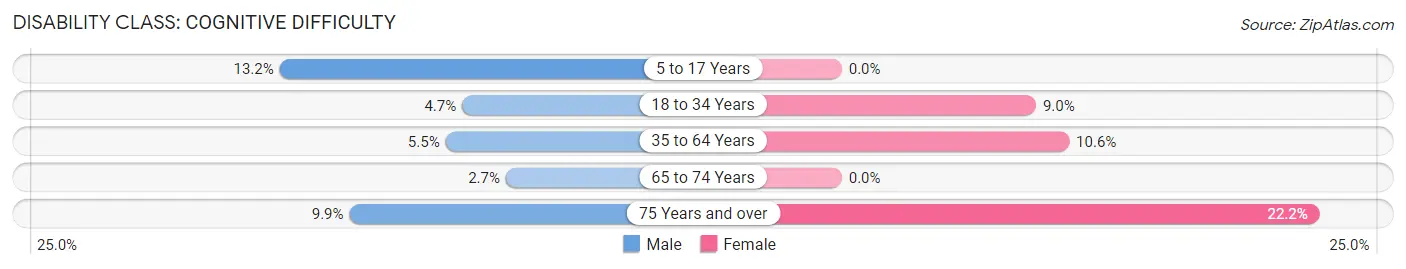
| Age Bracket | Male | Female |
| 5 to 17 Years | 59 (13.2%) | 0 (0.0%) |
| 18 to 34 Years | 35 (4.7%) | 58 (9.0%) |
| 35 to 64 Years | 54 (5.5%) | 103 (10.5%) |
| 65 to 74 Years | 7 (2.7%) | 0 (0.0%) |
| 75 Years and over | 14 (9.9%) | 47 (22.2%) |
Disability Class: Ambulatory Difficulty
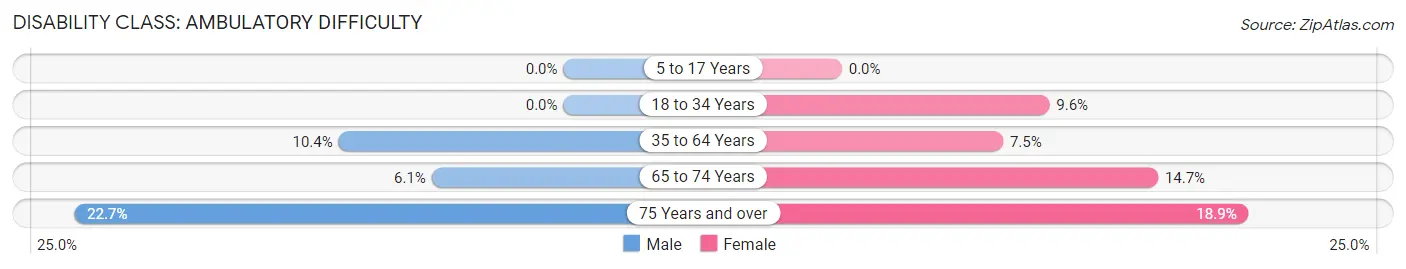
| Age Bracket | Male | Female |
| 5 to 17 Years | 0 (0.0%) | 0 (0.0%) |
| 18 to 34 Years | 0 (0.0%) | 62 (9.6%) |
| 35 to 64 Years | 103 (10.4%) | 73 (7.5%) |
| 65 to 74 Years | 16 (6.1%) | 38 (14.7%) |
| 75 Years and over | 32 (22.7%) | 40 (18.9%) |
Disability Class: Self-Care Difficulty
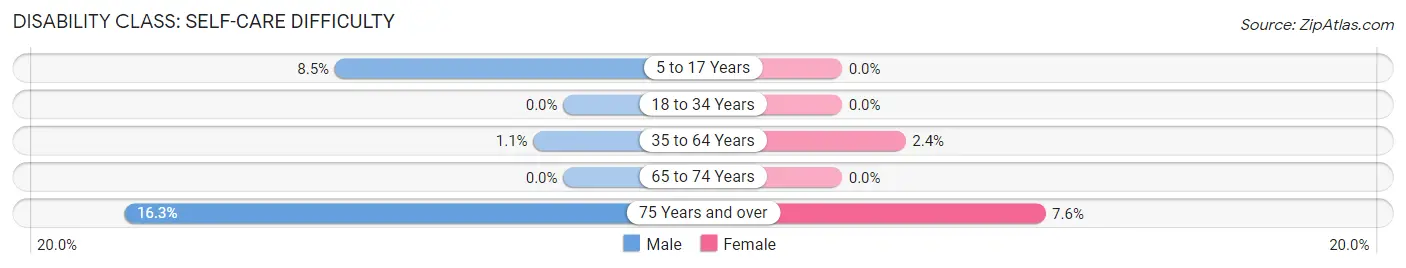
| Age Bracket | Male | Female |
| 5 to 17 Years | 38 (8.5%) | 0 (0.0%) |
| 18 to 34 Years | 0 (0.0%) | 0 (0.0%) |
| 35 to 64 Years | 11 (1.1%) | 23 (2.4%) |
| 65 to 74 Years | 0 (0.0%) | 0 (0.0%) |
| 75 Years and over | 23 (16.3%) | 16 (7.5%) |
Technology Access in White
Computing Device Access in White
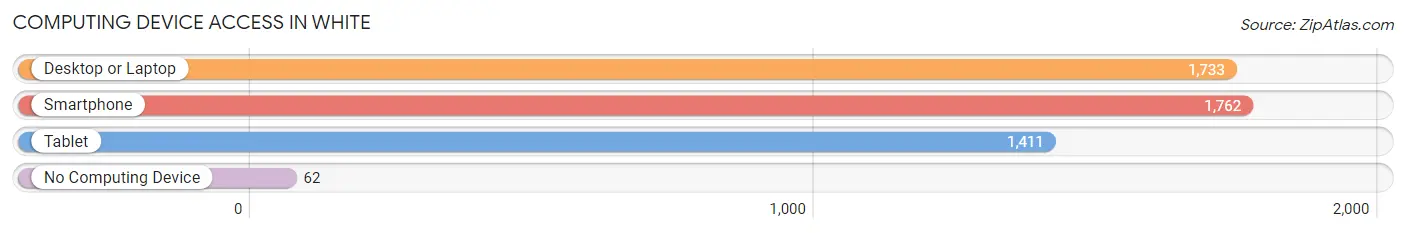
| Device Type | # Households | % Households |
| Desktop or Laptop | 1,733 | 90.5% |
| Smartphone | 1,762 | 92.0% |
| Tablet | 1,411 | 73.7% |
| No Computing Device | 62 | 3.2% |
| Total | 1,915 | 100.0% |
Internet Access in White
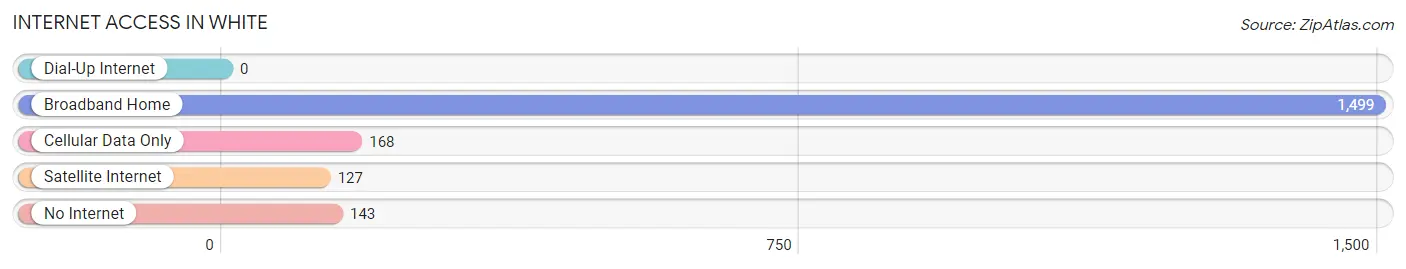
| Internet Type | # Households | % Households |
| Dial-Up Internet | 0 | 0.0% |
| Broadband Home | 1,499 | 78.3% |
| Cellular Data Only | 168 | 8.8% |
| Satellite Internet | 127 | 6.6% |
| No Internet | 143 | 7.5% |
| Total | 1,915 | 100.0% |
White Summary
White is a city located in the state of Utah in the United States of America. It is located in the southeastern part of the state, in the county of San Juan. As of the 2010 census, the population of White was 1,876.
Geography
White is located in the southeastern part of Utah, in the county of San Juan. It is situated at an elevation of 5,890 feet (1,795 m) above sea level. The city is located in the Four Corners region, near the Arizona, New Mexico, and Colorado borders. The city is surrounded by the Navajo Nation Reservation, and is located approximately 25 miles (40 km) from the city of Monticello.
The climate in White is semi-arid, with hot summers and cold winters. The average annual temperature is 54°F (12°C). The average annual precipitation is 8.5 inches (21.6 cm).
Economy
The economy of White is largely based on tourism and agriculture. The city is home to several tourist attractions, including the White Mesa Recreation Area, the White Mesa Cultural Center, and the White Mesa Golf Course. The city also has a number of small businesses, including restaurants, retail stores, and service providers.
Agriculture is an important part of the economy of White. The city is home to several farms, which produce a variety of crops, including corn, wheat, hay, and alfalfa. The city also has a number of livestock operations, which produce beef, pork, and poultry.
Demographics
As of the 2010 census, the population of White was 1,876. The racial makeup of the city was 94.3% White, 0.3% African American, 0.7% Native American, 0.2% Asian, 0.1% Pacific Islander, 2.3% from other races, and 2.2% from two or more races. Hispanic or Latino of any race were 5.3% of the population.
The median income for a household in White was $35,625, and the median income for a family was $41,250. The per capita income for the city was $17,845. About 11.3% of families and 14.3% of the population were below the poverty line, including 18.2% of those under age 18 and 8.3% of those age 65 or over.
Conclusion
White is a city located in the southeastern part of Utah, in the county of San Juan. The city is home to a number of tourist attractions, and its economy is largely based on tourism and agriculture. As of the 2010 census, the population of White was 1,876, with a median income of $35,625. The city has a semi-arid climate, with hot summers and cold winters.
Common Questions
What is Per Capita Income in White?
Per Capita income in White is $33,230.
What is the Median Family Income in White?
Median Family Income in White is $90,284.
What is the Median Household income in White?
Median Household Income in White is $86,763.
What is Income or Wage Gap in White?
Income or Wage Gap in White is 26.8%.
Women in White earn 73.2 cents for every dollar earned by a man.
What is Family Income Deficit in White?
Family Income Deficit in White is $7,251.
Families that are below poverty line in White earn $7,251 less on average than the poverty threshold level.
What is Inequality or Gini Index in White?
Inequality or Gini Index in White is 0.38.
What is the Total Population of White?
Total Population of White is 5,562.
What is the Total Male Population of White?
Total Male Population of White is 2,812.
What is the Total Female Population of White?
Total Female Population of White is 2,750.
What is the Ratio of Males per 100 Females in White?
There are 102.25 Males per 100 Females in White.
What is the Ratio of Females per 100 Males in White?
There are 97.80 Females per 100 Males in White.
What is the Median Population Age in White?
Median Population Age in White is 36.4 Years.
What is the Average Family Size in White
Average Family Size in White is 3.3 People.
What is the Average Household Size in White
Average Household Size in White is 2.9 People.
How Large is the Labor Force in White?
There are 2,965 People in the Labor Forcein in White.
What is the Percentage of People in the Labor Force in White?
69.2% of People are in the Labor Force in White.
What is the Unemployment Rate in White?
Unemployment Rate in White is 5.7%.