Lincolnville, SC Map & Demographics
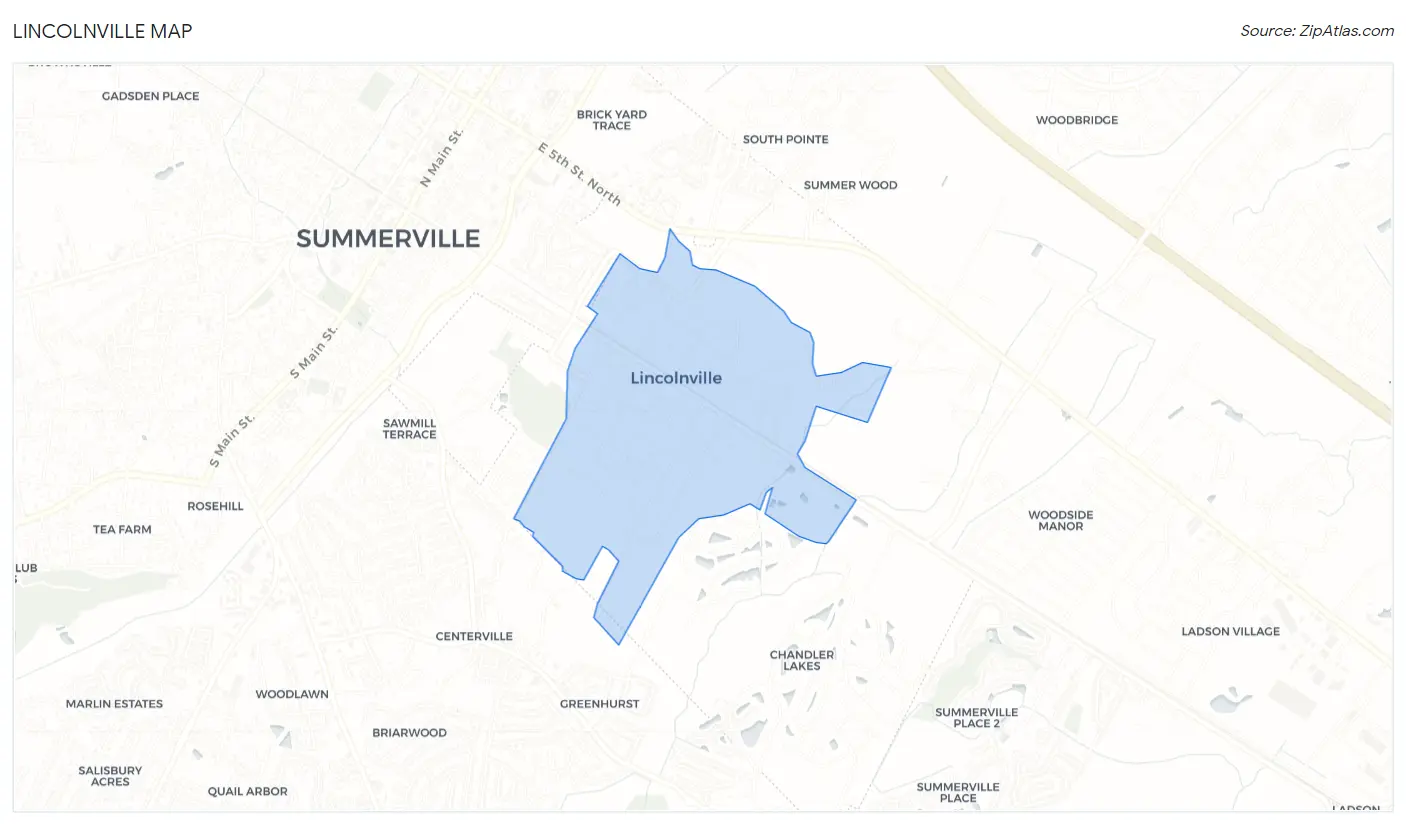
Lincolnville Map
Lincolnville Overview
$26,355
PER CAPITA INCOME
$67,361
AVG FAMILY INCOME
$41,250
AVG HOUSEHOLD INCOME
9.3%
WAGE / INCOME GAP [ % ]
90.7¢/ $1
WAGE / INCOME GAP [ $ ]
0.52
INEQUALITY / GINI INDEX
641
TOTAL POPULATION
350
MALE POPULATION
291
FEMALE POPULATION
120.27
MALES / 100 FEMALES
83.14
FEMALES / 100 MALES
49.9
MEDIAN AGE
3.3
AVG FAMILY SIZE
2.3
AVG HOUSEHOLD SIZE
247
LABOR FORCE [ PEOPLE ]
42.8%
PERCENT IN LABOR FORCE
10.1%
UNEMPLOYMENT RATE
Lincolnville Area Codes
Income in Lincolnville
Income Overview in Lincolnville
Per Capita Income in Lincolnville is $26,355, while median incomes of families and households are $67,361 and $41,250 respectively.
| Characteristic | Number | Measure |
| Per Capita Income | 641 | $26,355 |
| Median Family Income | 133 | $67,361 |
| Mean Family Income | 133 | $94,581 |
| Median Household Income | 270 | $41,250 |
| Mean Household Income | 270 | $58,070 |
| Income Deficit | 133 | $0 |
| Wage / Income Gap (%) | 641 | 9.29% |
| Wage / Income Gap ($) | 641 | 90.71¢ per $1 |
| Gini / Inequality Index | 641 | 0.52 |
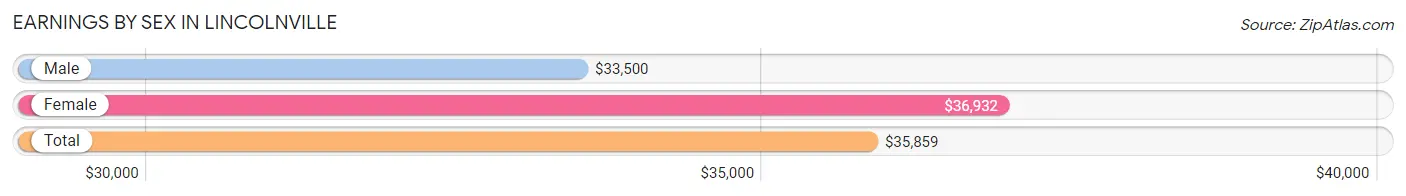
Earnings by Sex in Lincolnville
Average Earnings in Lincolnville are $35,859, $33,500 for men and $36,932 for women, a difference of 9.3%.
| Sex | Number | Average Earnings |
| Male | 184 (71.6%) | $33,500 |
| Female | 73 (28.4%) | $36,932 |
| Total | 257 (100.0%) | $35,859 |
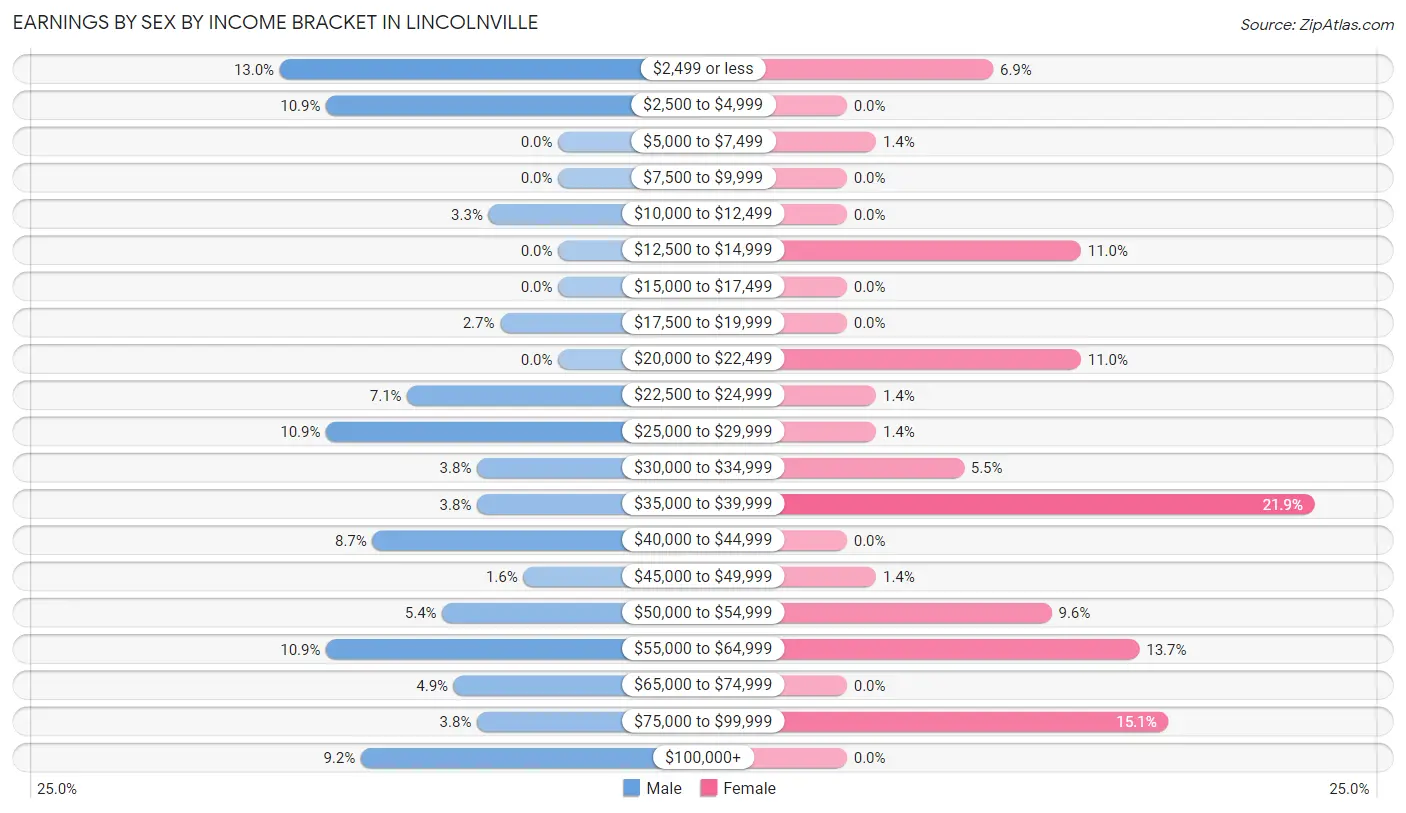
Earnings by Sex by Income Bracket in Lincolnville
The most common earnings brackets in Lincolnville are $2,499 or less for men (24 | 13.0%) and $35,000 to $39,999 for women (16 | 21.9%).
| Income | Male | Female |
| $2,499 or less | 24 (13.0%) | 5 (6.9%) |
| $2,500 to $4,999 | 20 (10.9%) | 0 (0.0%) |
| $5,000 to $7,499 | 0 (0.0%) | 1 (1.4%) |
| $7,500 to $9,999 | 0 (0.0%) | 0 (0.0%) |
| $10,000 to $12,499 | 6 (3.3%) | 0 (0.0%) |
| $12,500 to $14,999 | 0 (0.0%) | 8 (11.0%) |
| $15,000 to $17,499 | 0 (0.0%) | 0 (0.0%) |
| $17,500 to $19,999 | 5 (2.7%) | 0 (0.0%) |
| $20,000 to $22,499 | 0 (0.0%) | 8 (11.0%) |
| $22,500 to $24,999 | 13 (7.1%) | 1 (1.4%) |
| $25,000 to $29,999 | 20 (10.9%) | 1 (1.4%) |
| $30,000 to $34,999 | 7 (3.8%) | 4 (5.5%) |
| $35,000 to $39,999 | 7 (3.8%) | 16 (21.9%) |
| $40,000 to $44,999 | 16 (8.7%) | 0 (0.0%) |
| $45,000 to $49,999 | 3 (1.6%) | 1 (1.4%) |
| $50,000 to $54,999 | 10 (5.4%) | 7 (9.6%) |
| $55,000 to $64,999 | 20 (10.9%) | 10 (13.7%) |
| $65,000 to $74,999 | 9 (4.9%) | 0 (0.0%) |
| $75,000 to $99,999 | 7 (3.8%) | 11 (15.1%) |
| $100,000+ | 17 (9.2%) | 0 (0.0%) |
| Total | 184 (100.0%) | 73 (100.0%) |
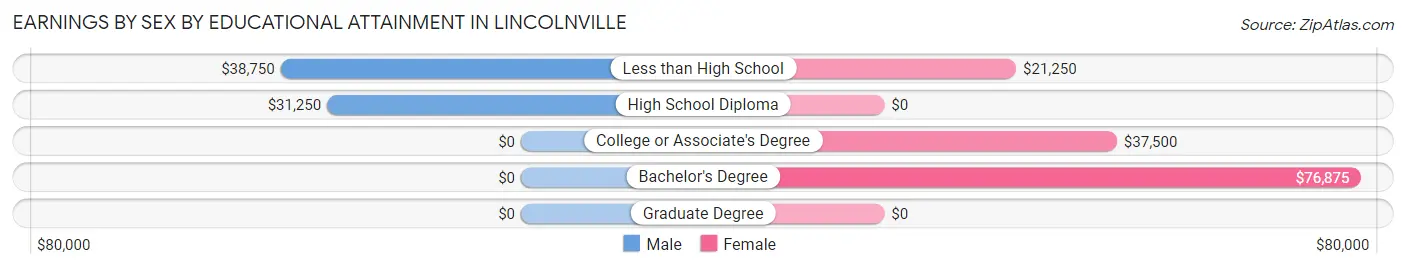
Earnings by Sex by Educational Attainment in Lincolnville
Average earnings in Lincolnville are $37,500 for men and $37,159 for women, a difference of 0.9%. Men with an educational attainment of less than high school enjoy the highest average annual earnings of $38,750, while those with high school diploma education earn the least with $31,250. Women with an educational attainment of bachelor's degree earn the most with the average annual earnings of $76,875, while those with less than high school education have the smallest earnings of $21,250.
| Educational Attainment | Male Income | Female Income |
| Less than High School | $38,750 | $21,250 |
| High School Diploma | $31,250 | $0 |
| College or Associate's Degree | - | - |
| Bachelor's Degree | - | - |
| Graduate Degree | - | - |
| Total | $37,500 | $37,159 |
Family Income in Lincolnville
Family Income Brackets in Lincolnville
According to the Lincolnville family income data, there are 38 families falling into the $50,000 to $74,999 income range, which is the most common income bracket and makes up 28.6% of all families.
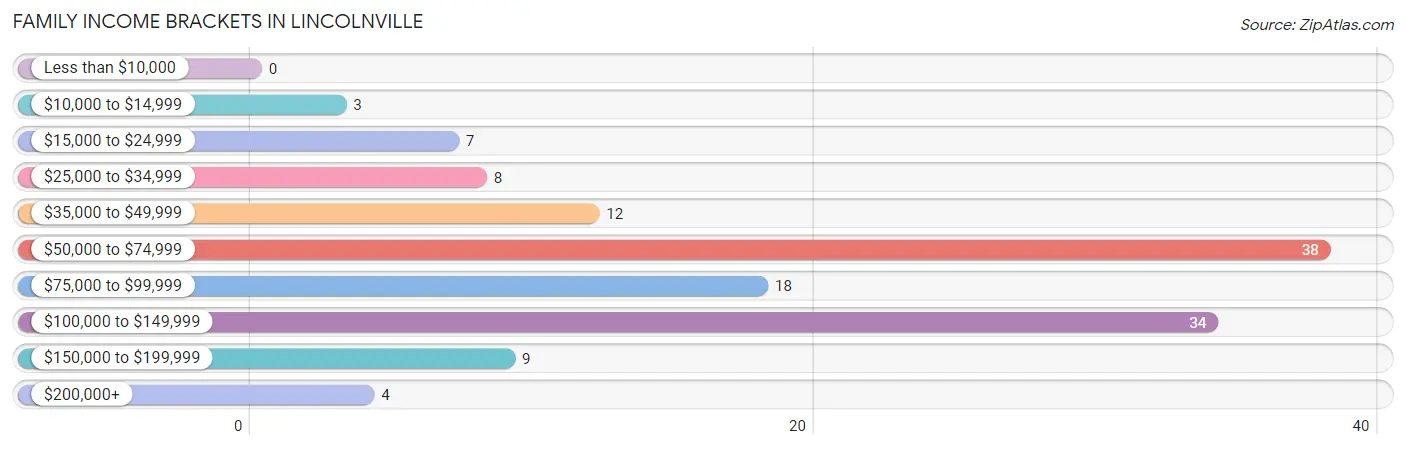
| Income Bracket | # Families | % Families |
| Less than $10,000 | 0 | 0.0% |
| $10,000 to $14,999 | 3 | 2.3% |
| $15,000 to $24,999 | 7 | 5.3% |
| $25,000 to $34,999 | 8 | 6.0% |
| $35,000 to $49,999 | 12 | 9.0% |
| $50,000 to $74,999 | 38 | 28.6% |
| $75,000 to $99,999 | 18 | 13.5% |
| $100,000 to $149,999 | 34 | 25.6% |
| $150,000 to $199,999 | 9 | 6.8% |
| $200,000+ | 4 | 3.0% |
Family Income by Famaliy Size in Lincolnville
3-person families (25 | 18.8%) account for the highest median family income in Lincolnville with $89,625 per family, while 2-person families (61 | 45.9%) have the highest median income of $32,986 per family member.
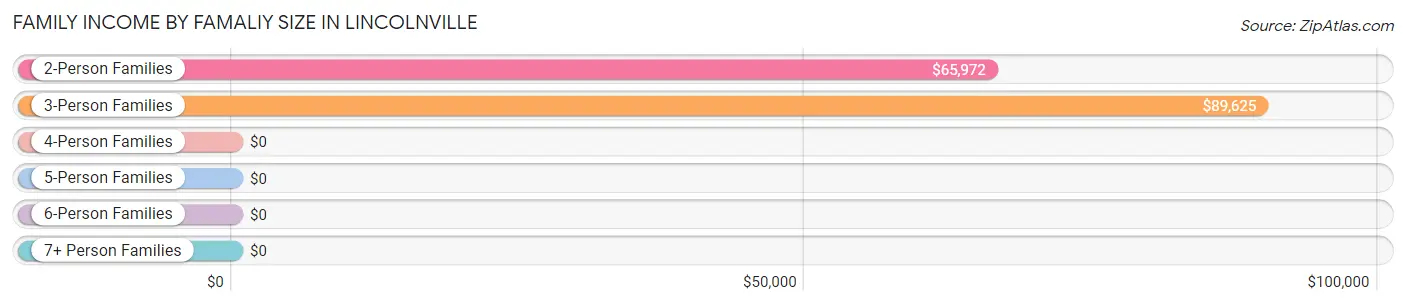
| Income Bracket | # Families | Median Income |
| 2-Person Families | 61 (45.9%) | $65,972 |
| 3-Person Families | 25 (18.8%) | $89,625 |
| 4-Person Families | 31 (23.3%) | $0 |
| 5-Person Families | 8 (6.0%) | $0 |
| 6-Person Families | 8 (6.0%) | $0 |
| 7+ Person Families | 0 (0.0%) | $0 |
| Total | 133 (100.0%) | $67,361 |
Family Income by Number of Earners in Lincolnville
The median family income in Lincolnville is $67,361, with families comprising 3+ earners (15) having the highest median family income of $165,938, while families with no earners (20) have the lowest median family income of $41,250, accounting for 11.3% and 15.0% of families, respectively.
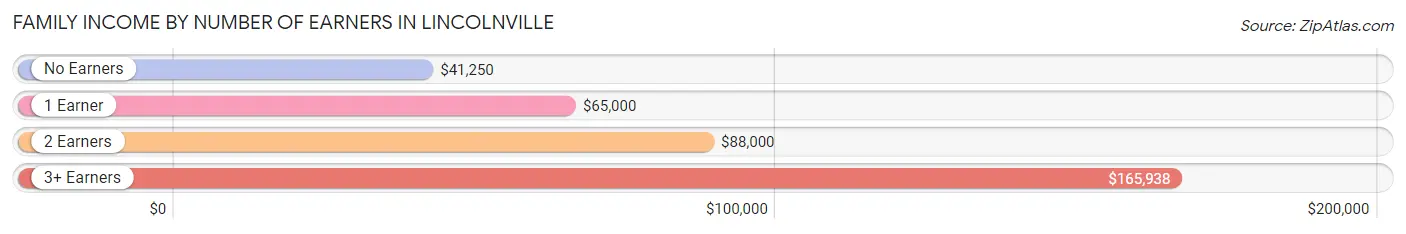
| Number of Earners | # Families | Median Income |
| No Earners | 20 (15.0%) | $41,250 |
| 1 Earner | 62 (46.6%) | $65,000 |
| 2 Earners | 36 (27.1%) | $88,000 |
| 3+ Earners | 15 (11.3%) | $165,938 |
| Total | 133 (100.0%) | $67,361 |
Household Income in Lincolnville
Household Income Brackets in Lincolnville
With 64 households falling in the category, the $50,000 to $74,999 income range is the most frequent in Lincolnville, accounting for 23.7% of all households. In contrast, only 4 households (1.5%) fall into the $25,000 to $34,999 income bracket, making it the least populous group.
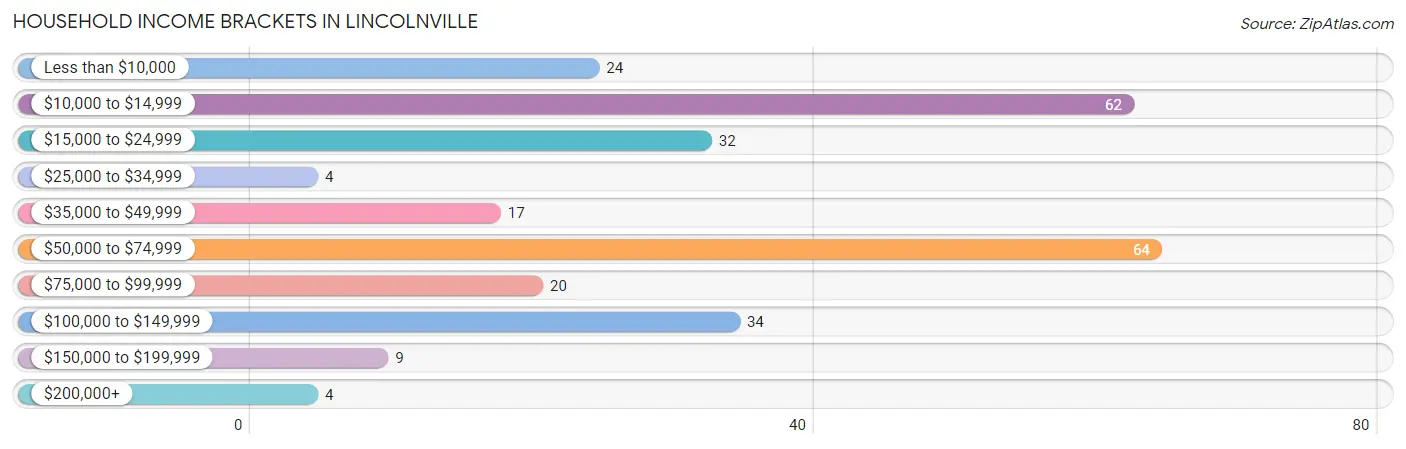
| Income Bracket | # Households | % Households |
| Less than $10,000 | 24 | 8.9% |
| $10,000 to $14,999 | 62 | 23.0% |
| $15,000 to $24,999 | 32 | 11.9% |
| $25,000 to $34,999 | 4 | 1.5% |
| $35,000 to $49,999 | 17 | 6.3% |
| $50,000 to $74,999 | 64 | 23.7% |
| $75,000 to $99,999 | 20 | 7.4% |
| $100,000 to $149,999 | 34 | 12.6% |
| $150,000 to $199,999 | 9 | 3.3% |
| $200,000+ | 4 | 1.5% |
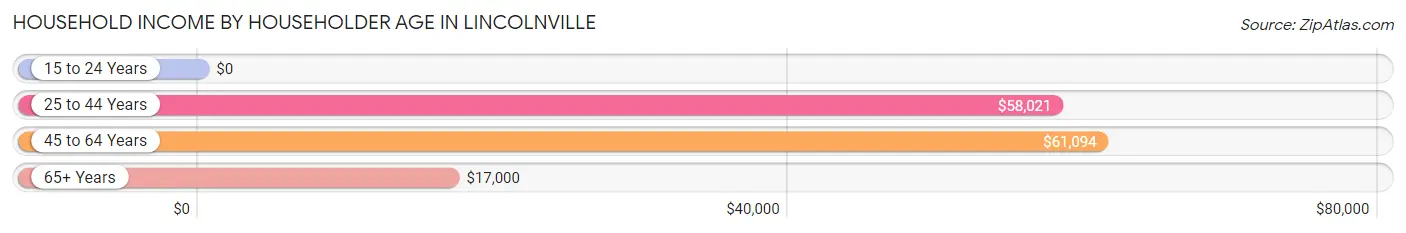
Household Income by Householder Age in Lincolnville
The median household income in Lincolnville is $41,250, with the highest median household income of $61,094 found in the 45 to 64 years age bracket for the primary householder. A total of 91 households (33.7%) fall into this category.
| Income Bracket | # Households | Median Income |
| 15 to 24 Years | 0 (0.0%) | $0 |
| 25 to 44 Years | 41 (15.2%) | $58,021 |
| 45 to 64 Years | 91 (33.7%) | $61,094 |
| 65+ Years | 138 (51.1%) | $17,000 |
| Total | 270 (100.0%) | $41,250 |
Poverty in Lincolnville
Income Below Poverty by Sex and Age in Lincolnville
With 17.2% poverty level for males and 31.4% for females among the residents of Lincolnville, 55 to 64 year old males and 75 year old and over females are the most vulnerable to poverty, with 25 males (53.2%) and 34 females (59.7%) in their respective age groups living below the poverty level.
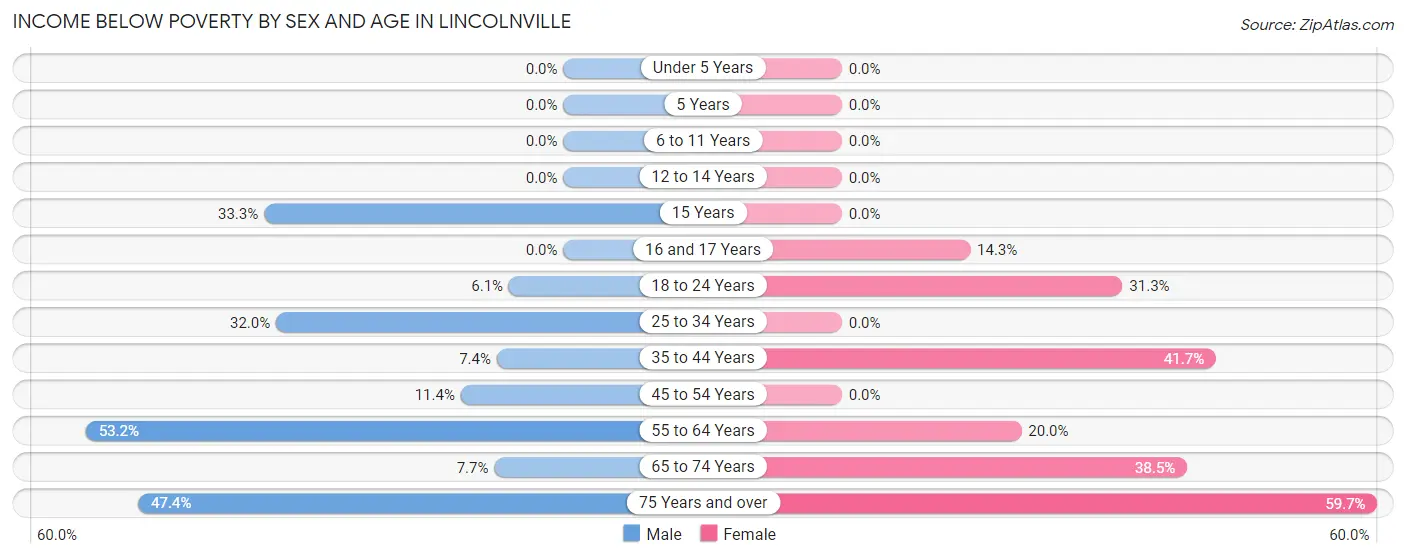
| Age Bracket | Male | Female |
| Under 5 Years | 0 (0.0%) | 0 (0.0%) |
| 5 Years | 0 (0.0%) | 0 (0.0%) |
| 6 to 11 Years | 0 (0.0%) | 0 (0.0%) |
| 12 to 14 Years | 0 (0.0%) | 0 (0.0%) |
| 15 Years | 2 (33.3%) | 0 (0.0%) |
| 16 and 17 Years | 0 (0.0%) | 2 (14.3%) |
| 18 to 24 Years | 2 (6.1%) | 5 (31.2%) |
| 25 to 34 Years | 8 (32.0%) | 0 (0.0%) |
| 35 to 44 Years | 2 (7.4%) | 15 (41.7%) |
| 45 to 54 Years | 8 (11.4%) | 0 (0.0%) |
| 55 to 64 Years | 25 (53.2%) | 4 (20.0%) |
| 65 to 74 Years | 4 (7.7%) | 30 (38.5%) |
| 75 Years and over | 9 (47.4%) | 34 (59.7%) |
| Total | 60 (17.2%) | 90 (31.4%) |
Income Above Poverty by Sex and Age in Lincolnville
According to the poverty statistics in Lincolnville, males aged 5 years and females aged 5 years are the age groups that are most secure financially, with 100.0% of males and 100.0% of females in these age groups living above the poverty line.
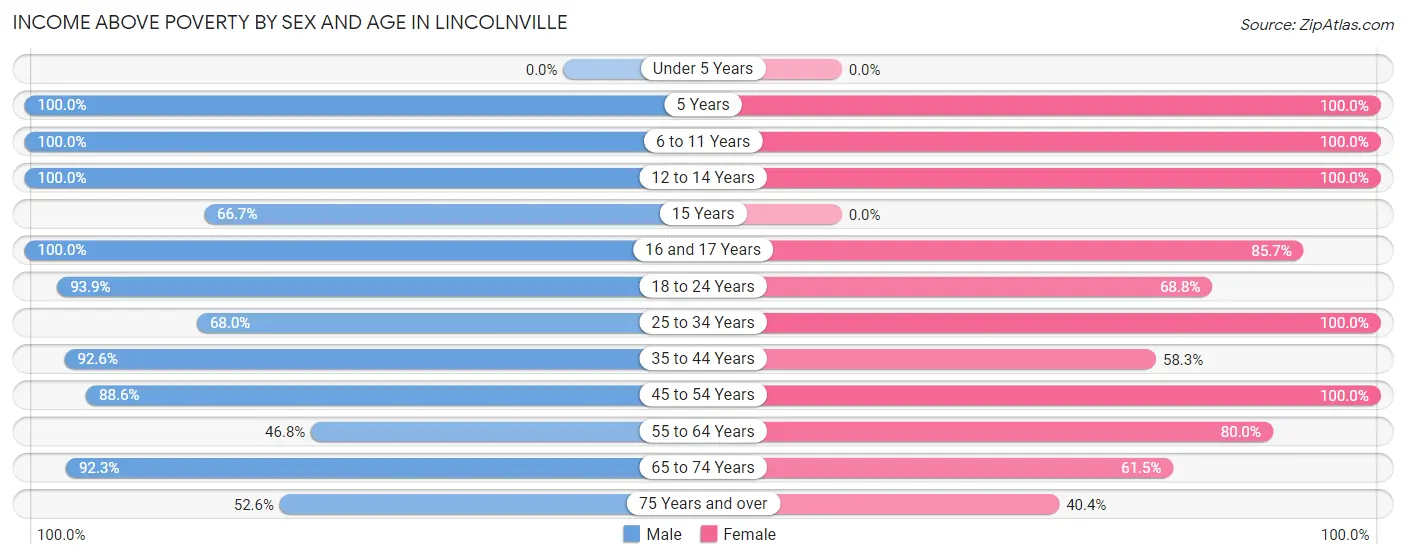
| Age Bracket | Male | Female |
| Under 5 Years | 0 (0.0%) | 0 (0.0%) |
| 5 Years | 3 (100.0%) | 3 (100.0%) |
| 6 to 11 Years | 32 (100.0%) | 1 (100.0%) |
| 12 to 14 Years | 7 (100.0%) | 7 (100.0%) |
| 15 Years | 4 (66.7%) | 0 (0.0%) |
| 16 and 17 Years | 27 (100.0%) | 12 (85.7%) |
| 18 to 24 Years | 31 (93.9%) | 11 (68.8%) |
| 25 to 34 Years | 17 (68.0%) | 14 (100.0%) |
| 35 to 44 Years | 25 (92.6%) | 21 (58.3%) |
| 45 to 54 Years | 62 (88.6%) | 41 (100.0%) |
| 55 to 64 Years | 22 (46.8%) | 16 (80.0%) |
| 65 to 74 Years | 48 (92.3%) | 48 (61.5%) |
| 75 Years and over | 10 (52.6%) | 23 (40.4%) |
| Total | 288 (82.8%) | 197 (68.6%) |
Income Below Poverty Among Married-Couple Families in Lincolnville
The poverty statistics for married-couple families in Lincolnville show that 7.1% or 7 of the total 99 families live below the poverty line. Families with no children have the highest poverty rate of 12.7%, comprising of 7 families. On the other hand, families with 1 or 2 children have the lowest poverty rate of 0.0%, which includes 0 families.
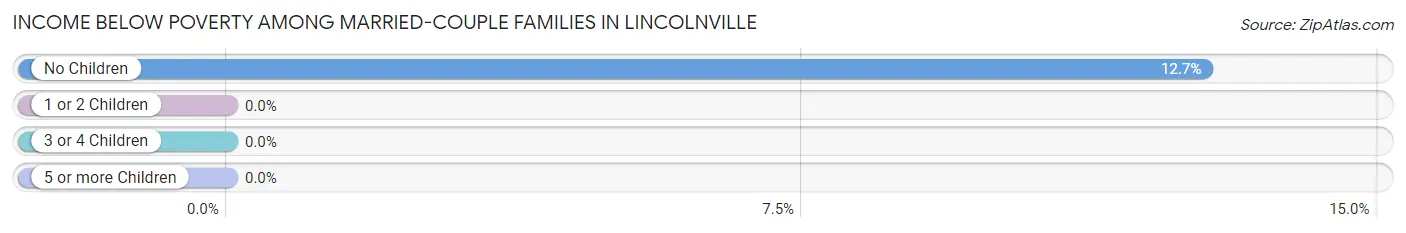
| Children | Above Poverty | Below Poverty |
| No Children | 48 (87.3%) | 7 (12.7%) |
| 1 or 2 Children | 36 (100.0%) | 0 (0.0%) |
| 3 or 4 Children | 8 (100.0%) | 0 (0.0%) |
| 5 or more Children | 0 (0.0%) | 0 (0.0%) |
| Total | 92 (92.9%) | 7 (7.1%) |
Income Below Poverty Among Single-Parent Households in Lincolnville
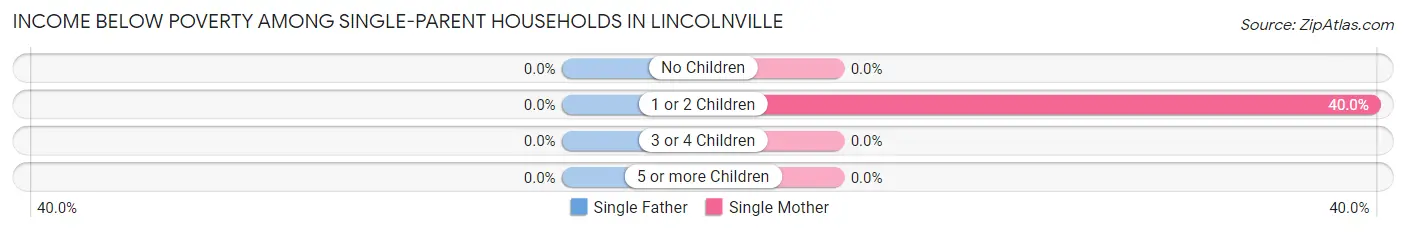
| Children | Single Father | Single Mother |
| No Children | 0 (0.0%) | 0 (0.0%) |
| 1 or 2 Children | 0 (0.0%) | 2 (40.0%) |
| 3 or 4 Children | 0 (0.0%) | 0 (0.0%) |
| 5 or more Children | 0 (0.0%) | 0 (0.0%) |
| Total | 0 (0.0%) | 2 (6.9%) |
Income Below Poverty Among Married-Couple vs Single-Parent Households in Lincolnville
The poverty data for Lincolnville shows that 7 of the married-couple family households (7.1%) and 2 of the single-parent households (5.9%) are living below the poverty level. Within the married-couple family households, those with no children have the highest poverty rate, with 7 households (12.7%) falling below the poverty line. Among the single-parent households, those with 1 or 2 children have the highest poverty rate, with 2 household (40.0%) living below poverty.
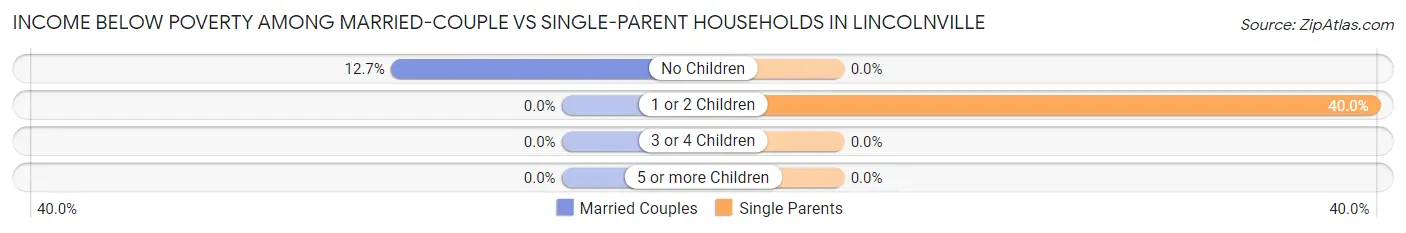
| Children | Married-Couple Families | Single-Parent Households |
| No Children | 7 (12.7%) | 0 (0.0%) |
| 1 or 2 Children | 0 (0.0%) | 2 (40.0%) |
| 3 or 4 Children | 0 (0.0%) | 0 (0.0%) |
| 5 or more Children | 0 (0.0%) | 0 (0.0%) |
| Total | 7 (7.1%) | 2 (5.9%) |
Race in Lincolnville
The most populous races in Lincolnville are White / Caucasian (303 | 47.3%), Black / African American (292 | 45.6%), and Hispanic or Latino (45 | 7.0%).
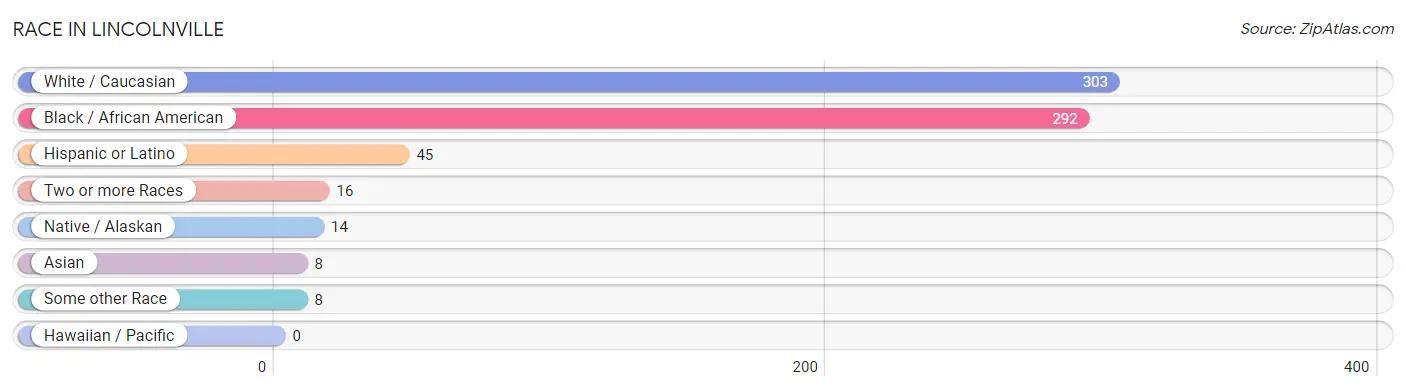
| Race | # Population | % Population |
| Asian | 8 | 1.3% |
| Black / African American | 292 | 45.6% |
| Hawaiian / Pacific | 0 | 0.0% |
| Hispanic or Latino | 45 | 7.0% |
| Native / Alaskan | 14 | 2.2% |
| White / Caucasian | 303 | 47.3% |
| Two or more Races | 16 | 2.5% |
| Some other Race | 8 | 1.3% |
| Total | 641 | 100.0% |
Ancestry in Lincolnville
The most populous ancestries reported in Lincolnville are Irish (41 | 6.4%), Puerto Rican (33 | 5.1%), American (27 | 4.2%), German (23 | 3.6%), and English (18 | 2.8%), together accounting for 22.2% of all Lincolnville residents.
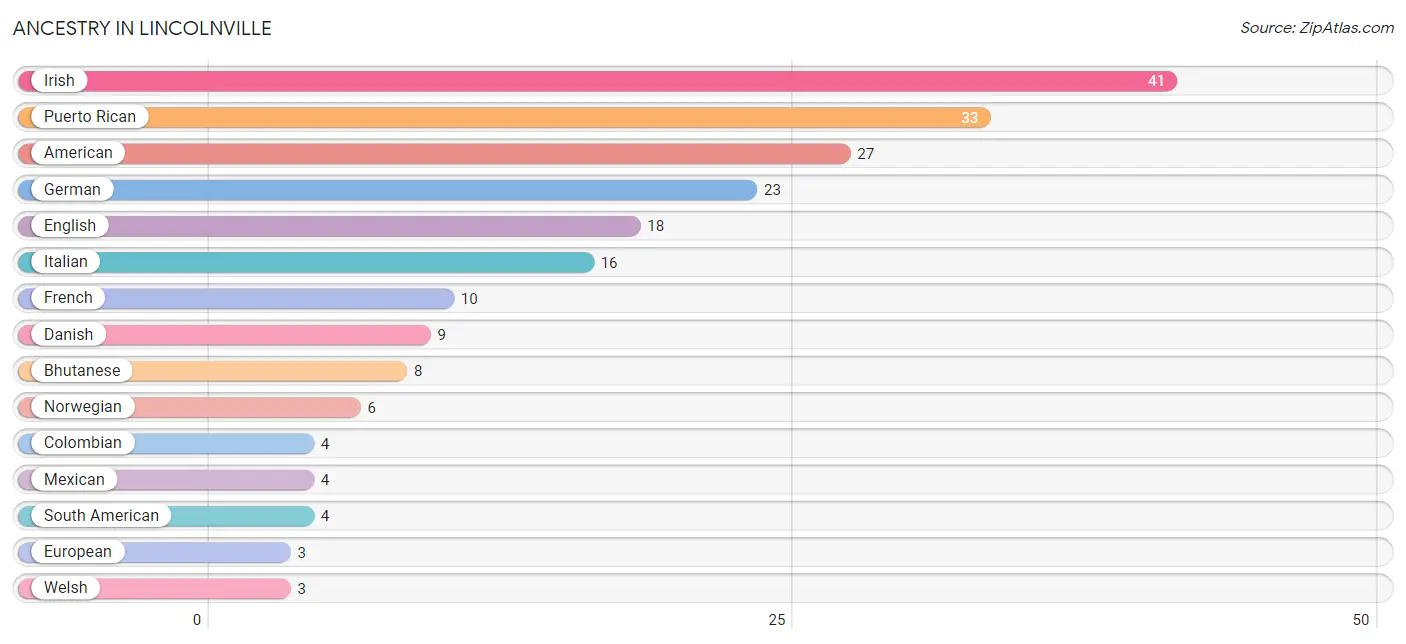
| Ancestry | # Population | % Population |
| American | 27 | 4.2% |
| Bhutanese | 8 | 1.3% |
| Cherokee | 1 | 0.2% |
| Colombian | 4 | 0.6% |
| Czech | 1 | 0.2% |
| Danish | 9 | 1.4% |
| English | 18 | 2.8% |
| European | 3 | 0.5% |
| French | 10 | 1.6% |
| German | 23 | 3.6% |
| Irish | 41 | 6.4% |
| Italian | 16 | 2.5% |
| Mexican | 4 | 0.6% |
| Norwegian | 6 | 0.9% |
| Puerto Rican | 33 | 5.1% |
| South American | 4 | 0.6% |
| Welsh | 3 | 0.5% | View All 17 Rows |
Immigrants in Lincolnville
The most numerous immigrant groups reported in Lincolnville came from Europe (18 | 2.8%), Eastern Europe (11 | 1.7%), Russia (11 | 1.7%), Asia (8 | 1.3%), and India (8 | 1.3%), together accounting for 8.7% of all Lincolnville residents.
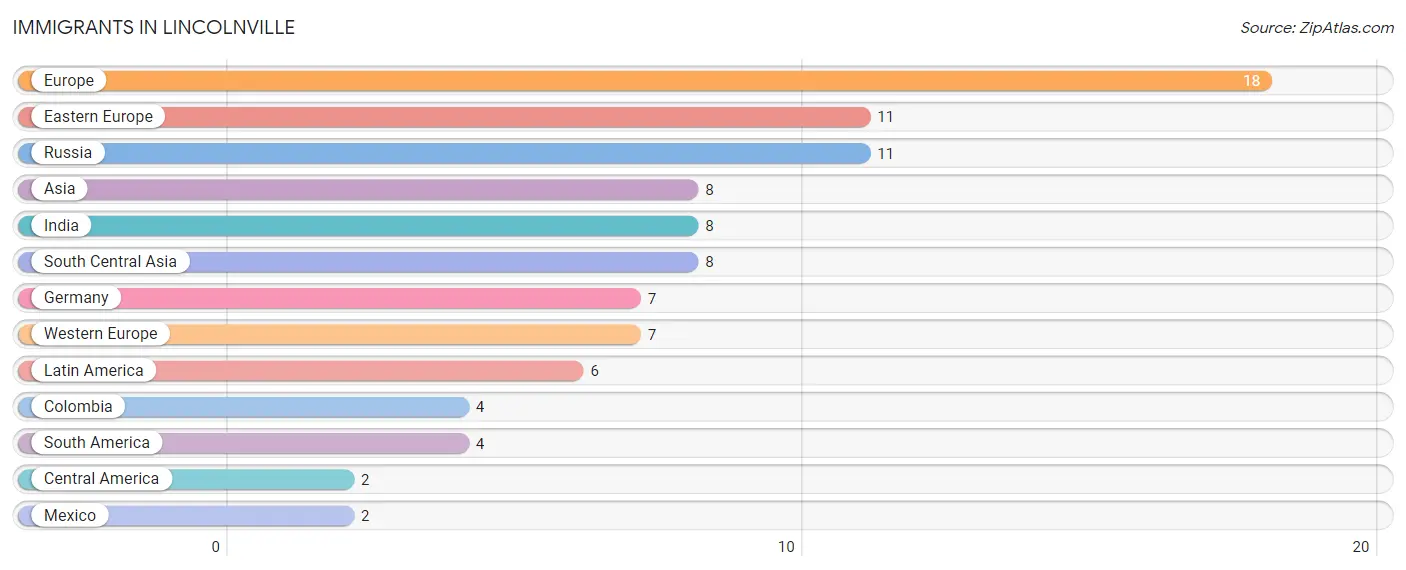
| Immigration Origin | # Population | % Population |
| Asia | 8 | 1.3% |
| Central America | 2 | 0.3% |
| Colombia | 4 | 0.6% |
| Eastern Europe | 11 | 1.7% |
| Europe | 18 | 2.8% |
| Germany | 7 | 1.1% |
| India | 8 | 1.3% |
| Latin America | 6 | 0.9% |
| Mexico | 2 | 0.3% |
| Russia | 11 | 1.7% |
| South America | 4 | 0.6% |
| South Central Asia | 8 | 1.3% |
| Western Europe | 7 | 1.1% | View All 13 Rows |
Sex and Age in Lincolnville
Sex and Age in Lincolnville
The most populous age groups in Lincolnville are 45 to 49 Years (48 | 13.7%) for men and 70 to 74 Years (52 | 17.9%) for women.
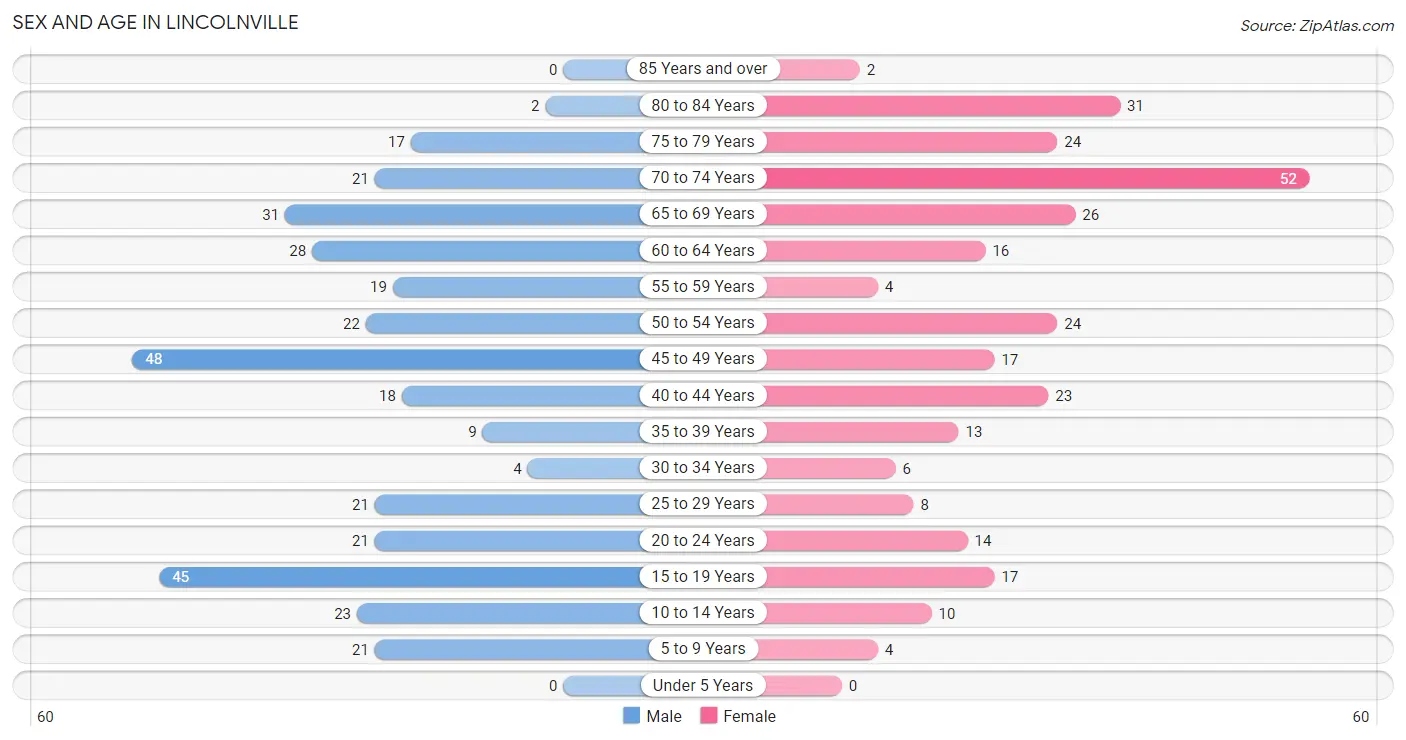
| Age Bracket | Male | Female |
| Under 5 Years | 0 (0.0%) | 0 (0.0%) |
| 5 to 9 Years | 21 (6.0%) | 4 (1.4%) |
| 10 to 14 Years | 23 (6.6%) | 10 (3.4%) |
| 15 to 19 Years | 45 (12.9%) | 17 (5.8%) |
| 20 to 24 Years | 21 (6.0%) | 14 (4.8%) |
| 25 to 29 Years | 21 (6.0%) | 8 (2.8%) |
| 30 to 34 Years | 4 (1.1%) | 6 (2.1%) |
| 35 to 39 Years | 9 (2.6%) | 13 (4.5%) |
| 40 to 44 Years | 18 (5.1%) | 23 (7.9%) |
| 45 to 49 Years | 48 (13.7%) | 17 (5.8%) |
| 50 to 54 Years | 22 (6.3%) | 24 (8.3%) |
| 55 to 59 Years | 19 (5.4%) | 4 (1.4%) |
| 60 to 64 Years | 28 (8.0%) | 16 (5.5%) |
| 65 to 69 Years | 31 (8.9%) | 26 (8.9%) |
| 70 to 74 Years | 21 (6.0%) | 52 (17.9%) |
| 75 to 79 Years | 17 (4.9%) | 24 (8.3%) |
| 80 to 84 Years | 2 (0.6%) | 31 (10.6%) |
| 85 Years and over | 0 (0.0%) | 2 (0.7%) |
| Total | 350 (100.0%) | 291 (100.0%) |
Families and Households in Lincolnville
Median Family Size in Lincolnville
The median family size in Lincolnville is 3.32 persons per family, with married-couple families (99 | 74.4%) accounting for the largest median family size of 3.4 persons per family. On the other hand, single male/father families (5 | 3.8%) represent the smallest median family size with 2.00 persons per family.
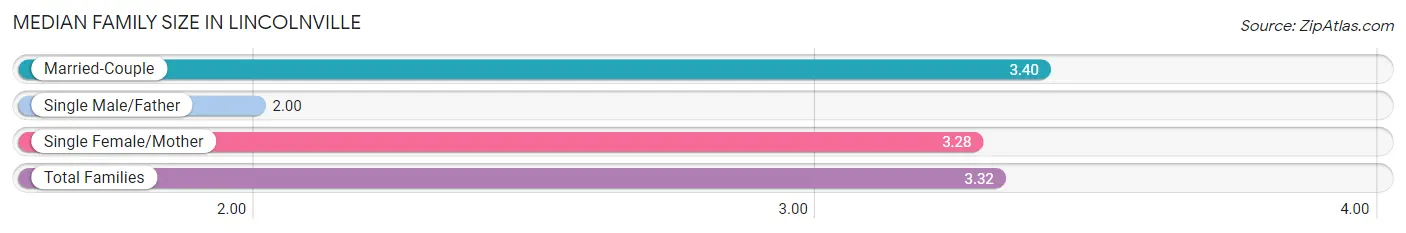
| Family Type | # Families | Family Size |
| Married-Couple | 99 (74.4%) | 3.40 |
| Single Male/Father | 5 (3.8%) | 2.00 |
| Single Female/Mother | 29 (21.8%) | 3.28 |
| Total Families | 133 (100.0%) | 3.32 |
Median Household Size in Lincolnville
The median household size in Lincolnville is 2.29 persons per household, with single female/mother households (29 | 10.7%) accounting for the largest median household size of 3.66 persons per household. non-family households (137 | 50.7%) represent the smallest median household size with 1.20 persons per household.
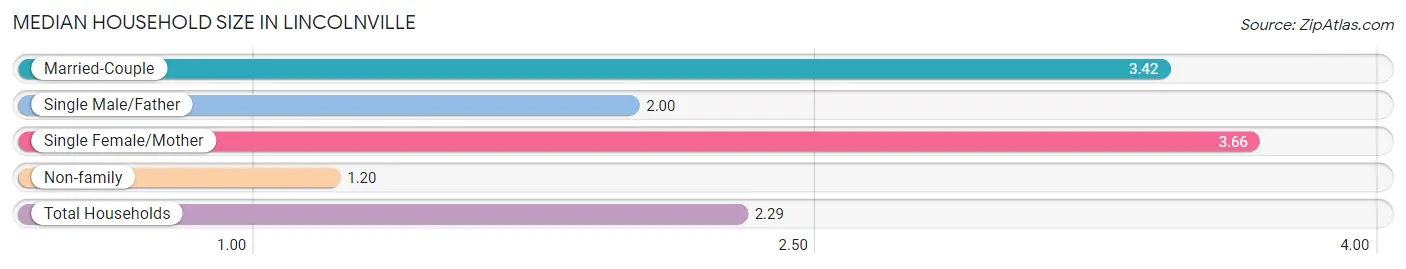
| Household Type | # Households | Household Size |
| Married-Couple | 99 (36.7%) | 3.42 |
| Single Male/Father | 5 (1.8%) | 2.00 |
| Single Female/Mother | 29 (10.7%) | 3.66 |
| Non-family | 137 (50.7%) | 1.20 |
| Total Households | 270 (100.0%) | 2.29 |
Household Size by Marriage Status in Lincolnville
Out of a total of 270 households in Lincolnville, 133 (49.3%) are family households, while 137 (50.7%) are nonfamily households. The most numerous type of family households are 2-person households, comprising 52, and the most common type of nonfamily households are 1-person households, comprising 124.
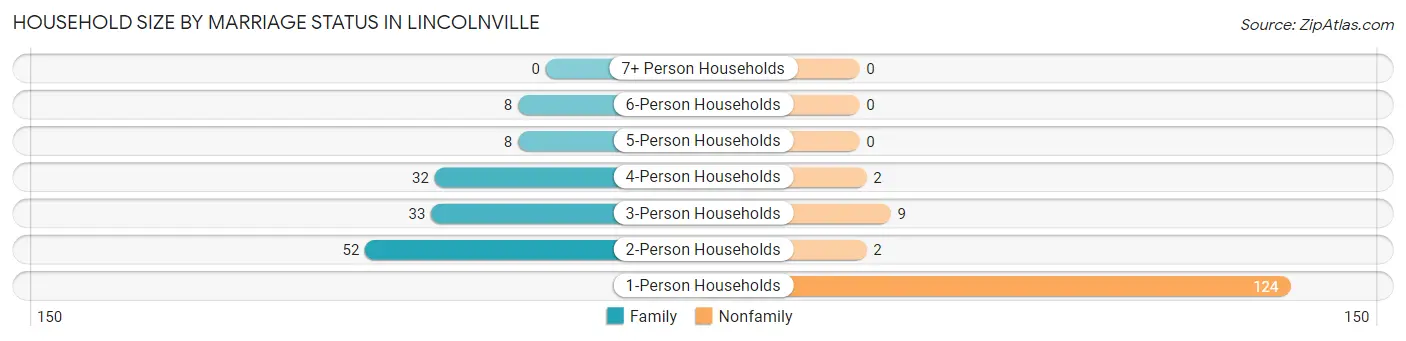
| Household Size | Family Households | Nonfamily Households |
| 1-Person Households | - | 124 (45.9%) |
| 2-Person Households | 52 (19.3%) | 2 (0.7%) |
| 3-Person Households | 33 (12.2%) | 9 (3.3%) |
| 4-Person Households | 32 (11.8%) | 2 (0.7%) |
| 5-Person Households | 8 (3.0%) | 0 (0.0%) |
| 6-Person Households | 8 (3.0%) | 0 (0.0%) |
| 7+ Person Households | 0 (0.0%) | 0 (0.0%) |
| Total | 133 (49.3%) | 137 (50.7%) |
Female Fertility in Lincolnville
Fertility by Age in Lincolnville
| Age Bracket | Women with Births | Births / 1,000 Women |
| 15 to 19 years | 0 (0.0%) | 0.0 |
| 20 to 34 years | 0 (0.0%) | 0.0 |
| 35 to 50 years | 0 (0.0%) | 0.0 |
| Total | 0 (0.0%) | 0.0 |
Fertility by Age by Marriage Status in Lincolnville
| Age Bracket | Married | Unmarried |
| 15 to 19 years | 0 (0.0%) | 0 (0.0%) |
| 20 to 34 years | 0 (0.0%) | 0 (0.0%) |
| 35 to 50 years | 0 (0.0%) | 0 (0.0%) |
| Total | 0 (0.0%) | 0 (0.0%) |
Fertility by Education in Lincolnville
| Educational Attainment | Women with Births | Births / 1,000 Women |
| Less than High School | 0 (0.0%) | 0.0 |
| High School Diploma | 0 (0.0%) | 0.0 |
| College or Associate's Degree | 0 (0.0%) | 0.0 |
| Bachelor's Degree | 0 (0.0%) | 0.0 |
| Graduate Degree | 0 (0.0%) | 0.0 |
| Total | 0 (0.0%) | 0.0 |
Fertility by Education by Marriage Status in Lincolnville
| Educational Attainment | Married | Unmarried |
| Less than High School | 0 (0.0%) | 0 (0.0%) |
| High School Diploma | 0 (0.0%) | 0 (0.0%) |
| College or Associate's Degree | 0 (0.0%) | 0 (0.0%) |
| Bachelor's Degree | 0 (0.0%) | 0 (0.0%) |
| Graduate Degree | 0 (0.0%) | 0 (0.0%) |
| Total | 0 (0.0%) | 0 (0.0%) |
Employment Characteristics in Lincolnville
Employment by Class of Employer in Lincolnville
Among the 212 employed individuals in Lincolnville, private company employees (141 | 66.5%), self-employed (not incorporated) (22 | 10.4%), and local government employees (21 | 9.9%) make up the most common classes of employment.
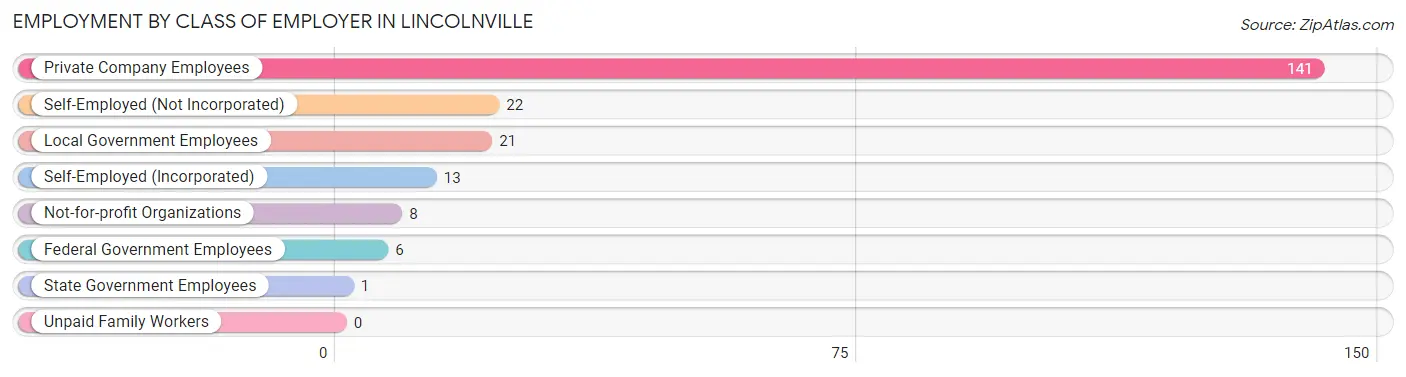
| Employer Class | # Employees | % Employees |
| Private Company Employees | 141 | 66.5% |
| Self-Employed (Incorporated) | 13 | 6.1% |
| Self-Employed (Not Incorporated) | 22 | 10.4% |
| Not-for-profit Organizations | 8 | 3.8% |
| Local Government Employees | 21 | 9.9% |
| State Government Employees | 1 | 0.5% |
| Federal Government Employees | 6 | 2.8% |
| Unpaid Family Workers | 0 | 0.0% |
| Total | 212 | 100.0% |
Employment Status by Age in Lincolnville
According to the labor force statistics for Lincolnville, out of the total population over 16 years of age (577), 42.8% or 247 individuals are in the labor force, with 10.1% or 25 of them unemployed. The age group with the highest labor force participation rate is 30 to 34 years, with 100.0% or 10 individuals in the labor force. Within the labor force, the 20 to 24 years age range has the highest percentage of unemployed individuals, with 85.0% or 17 of them being unemployed.
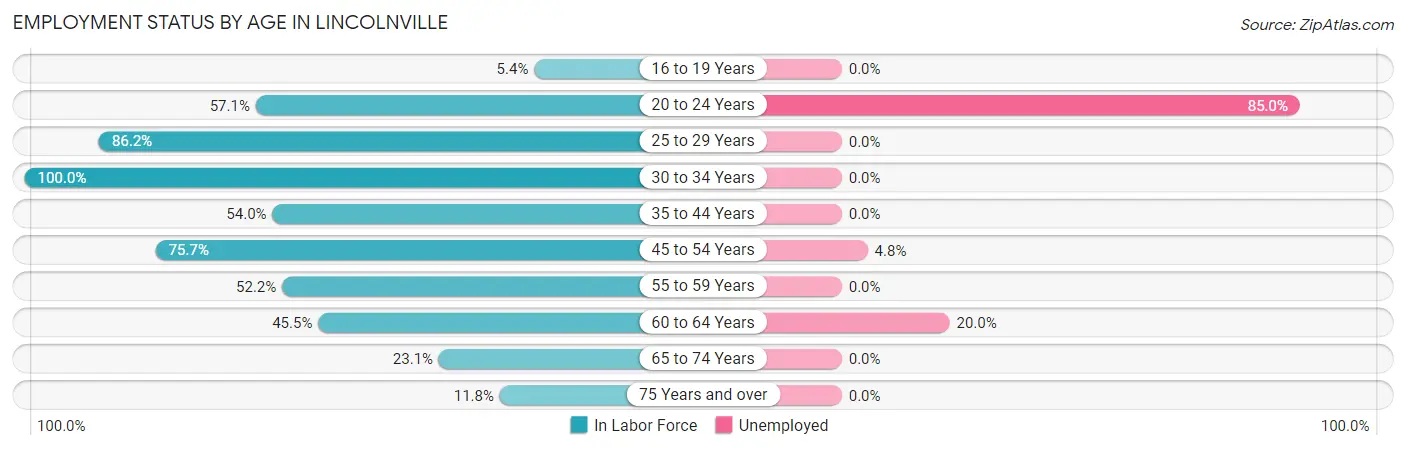
| Age Bracket | In Labor Force | Unemployed |
| 16 to 19 Years | 3 (5.4%) | 0 (0.0%) |
| 20 to 24 Years | 20 (57.1%) | 17 (85.0%) |
| 25 to 29 Years | 25 (86.2%) | 0 (0.0%) |
| 30 to 34 Years | 10 (100.0%) | 0 (0.0%) |
| 35 to 44 Years | 34 (54.0%) | 0 (0.0%) |
| 45 to 54 Years | 84 (75.7%) | 4 (4.8%) |
| 55 to 59 Years | 12 (52.2%) | 0 (0.0%) |
| 60 to 64 Years | 20 (45.5%) | 4 (20.0%) |
| 65 to 74 Years | 30 (23.1%) | 0 (0.0%) |
| 75 Years and over | 9 (11.8%) | 0 (0.0%) |
| Total | 247 (42.8%) | 25 (10.1%) |
Employment Status by Educational Attainment in Lincolnville
According to labor force statistics for Lincolnville, 66.1% of individuals (185) out of the total population between 25 and 64 years of age (280) are in the labor force, with 4.3% or 8 of them being unemployed. The group with the highest labor force participation rate are those with the educational attainment of college / associate degree, with 81.1% or 77 individuals in the labor force. Within the labor force, individuals with less than high school education have the highest percentage of unemployment, with 12.9% or 4 of them being unemployed.
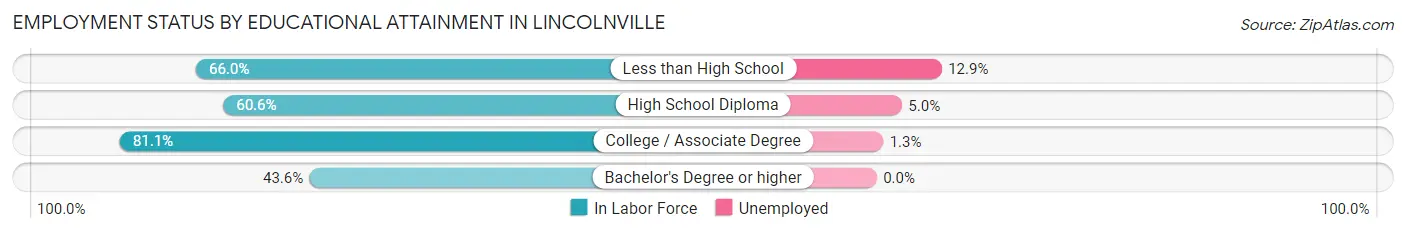
| Educational Attainment | In Labor Force | Unemployed |
| Less than High School | 31 (66.0%) | 6 (12.9%) |
| High School Diploma | 60 (60.6%) | 5 (5.0%) |
| College / Associate Degree | 77 (81.1%) | 1 (1.3%) |
| Bachelor's Degree or higher | 17 (43.6%) | 0 (0.0%) |
| Total | 185 (66.1%) | 12 (4.3%) |
Employment Occupations by Sex in Lincolnville
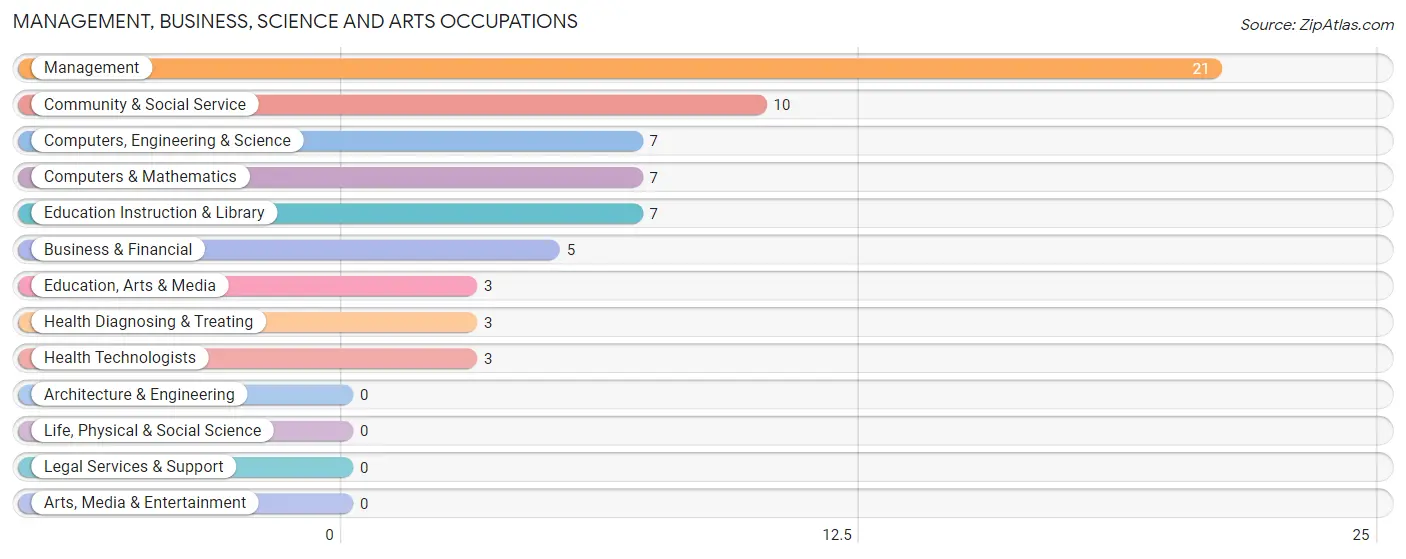
Management, Business, Science and Arts Occupations
The most common Management, Business, Science and Arts occupations in Lincolnville are Management (21 | 9.5%), Community & Social Service (10 | 4.5%), Computers, Engineering & Science (7 | 3.2%), Computers & Mathematics (7 | 3.2%), and Education Instruction & Library (7 | 3.2%).
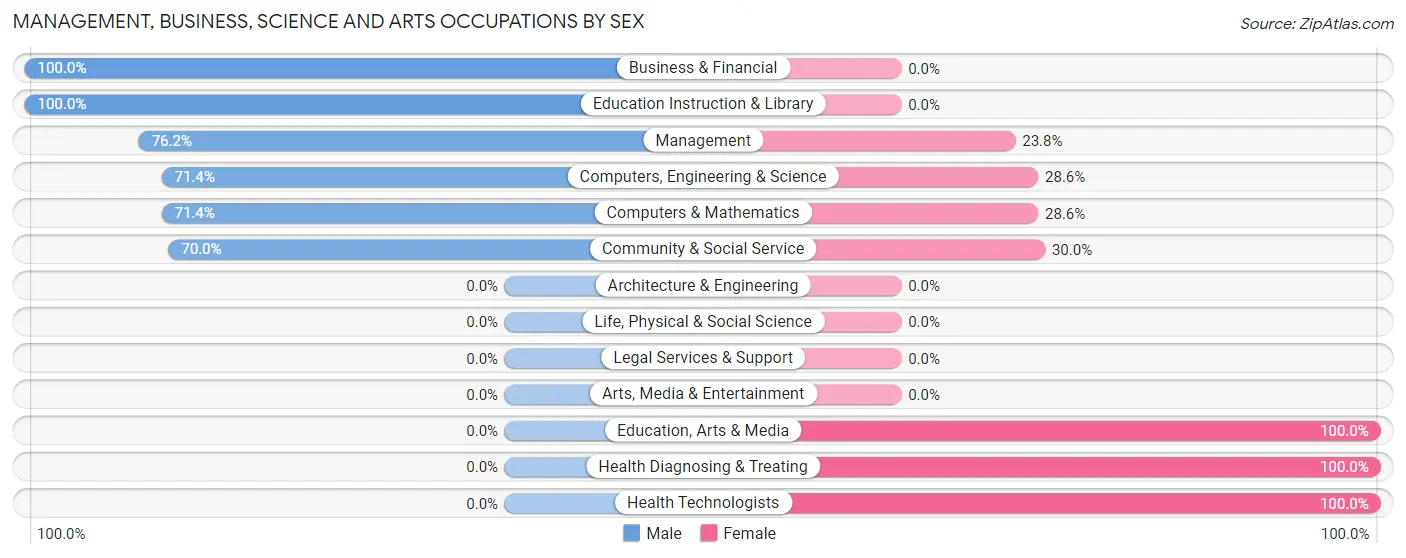
Management, Business, Science and Arts Occupations by Sex
Within the Management, Business, Science and Arts occupations in Lincolnville, the most male-oriented occupations are Business & Financial (100.0%), Education Instruction & Library (100.0%), and Management (76.2%), while the most female-oriented occupations are Education, Arts & Media (100.0%), Health Diagnosing & Treating (100.0%), and Health Technologists (100.0%).
| Occupation | Male | Female |
| Management | 16 (76.2%) | 5 (23.8%) |
| Business & Financial | 5 (100.0%) | 0 (0.0%) |
| Computers, Engineering & Science | 5 (71.4%) | 2 (28.6%) |
| Computers & Mathematics | 5 (71.4%) | 2 (28.6%) |
| Architecture & Engineering | 0 (0.0%) | 0 (0.0%) |
| Life, Physical & Social Science | 0 (0.0%) | 0 (0.0%) |
| Community & Social Service | 7 (70.0%) | 3 (30.0%) |
| Education, Arts & Media | 0 (0.0%) | 3 (100.0%) |
| Legal Services & Support | 0 (0.0%) | 0 (0.0%) |
| Education Instruction & Library | 7 (100.0%) | 0 (0.0%) |
| Arts, Media & Entertainment | 0 (0.0%) | 0 (0.0%) |
| Health Diagnosing & Treating | 0 (0.0%) | 3 (100.0%) |
| Health Technologists | 0 (0.0%) | 3 (100.0%) |
| Total (Category) | 33 (71.7%) | 13 (28.3%) |
| Total (Overall) | 155 (69.8%) | 67 (30.2%) |
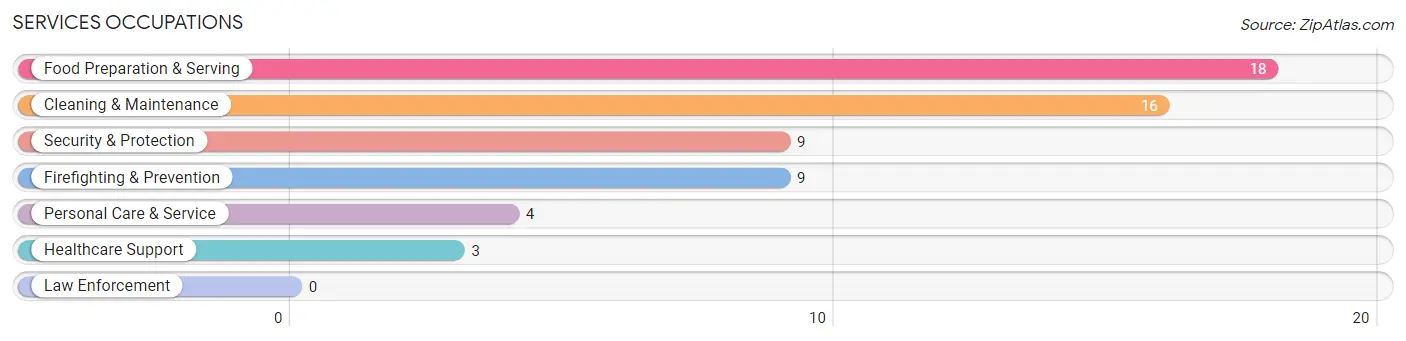
Services Occupations
The most common Services occupations in Lincolnville are Food Preparation & Serving (18 | 8.1%), Cleaning & Maintenance (16 | 7.2%), Security & Protection (9 | 4.1%), Firefighting & Prevention (9 | 4.1%), and Personal Care & Service (4 | 1.8%).
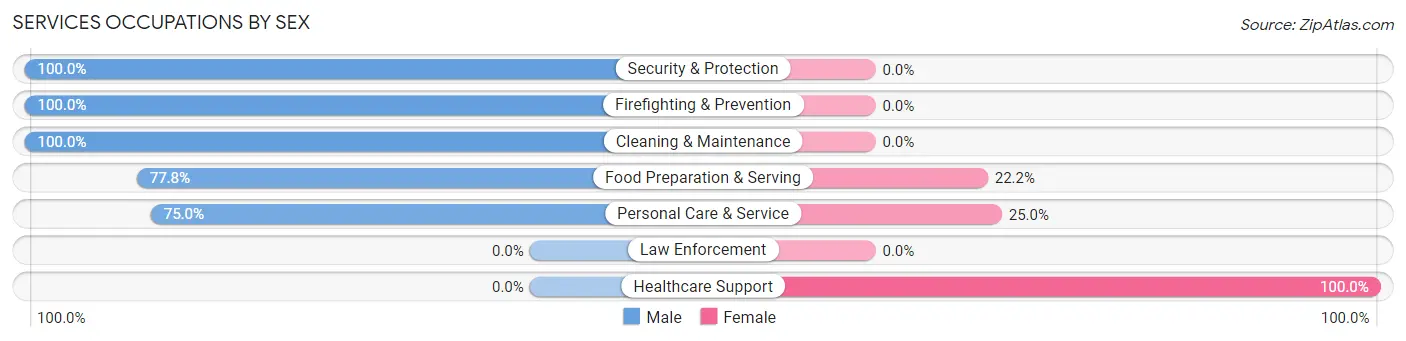
Services Occupations by Sex
Within the Services occupations in Lincolnville, the most male-oriented occupations are Security & Protection (100.0%), Firefighting & Prevention (100.0%), and Cleaning & Maintenance (100.0%), while the most female-oriented occupations are Healthcare Support (100.0%), Personal Care & Service (25.0%), and Food Preparation & Serving (22.2%).
| Occupation | Male | Female |
| Healthcare Support | 0 (0.0%) | 3 (100.0%) |
| Security & Protection | 9 (100.0%) | 0 (0.0%) |
| Firefighting & Prevention | 9 (100.0%) | 0 (0.0%) |
| Law Enforcement | 0 (0.0%) | 0 (0.0%) |
| Food Preparation & Serving | 14 (77.8%) | 4 (22.2%) |
| Cleaning & Maintenance | 16 (100.0%) | 0 (0.0%) |
| Personal Care & Service | 3 (75.0%) | 1 (25.0%) |
| Total (Category) | 42 (84.0%) | 8 (16.0%) |
| Total (Overall) | 155 (69.8%) | 67 (30.2%) |
Sales and Office Occupations
The most common Sales and Office occupations in Lincolnville are Office & Administration (32 | 14.4%), and Sales & Related (22 | 9.9%).
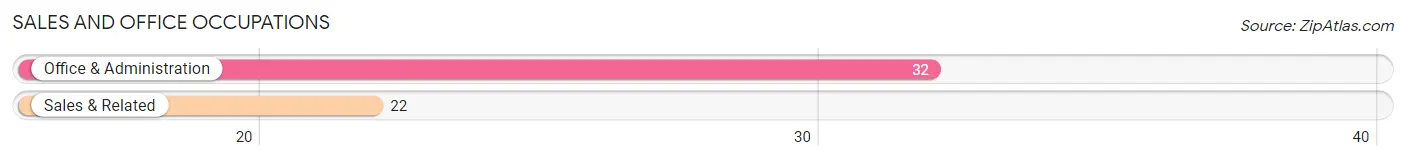
Sales and Office Occupations by Sex
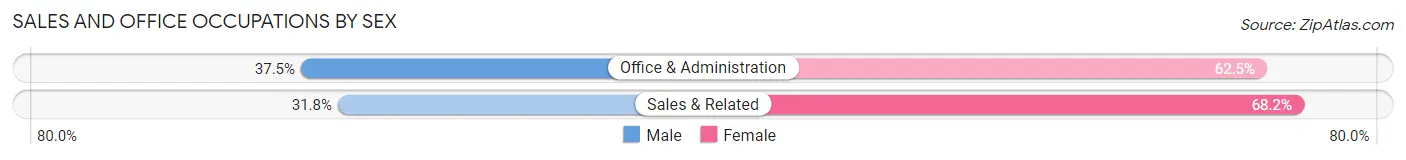
| Occupation | Male | Female |
| Sales & Related | 7 (31.8%) | 15 (68.2%) |
| Office & Administration | 12 (37.5%) | 20 (62.5%) |
| Total (Category) | 19 (35.2%) | 35 (64.8%) |
| Total (Overall) | 155 (69.8%) | 67 (30.2%) |
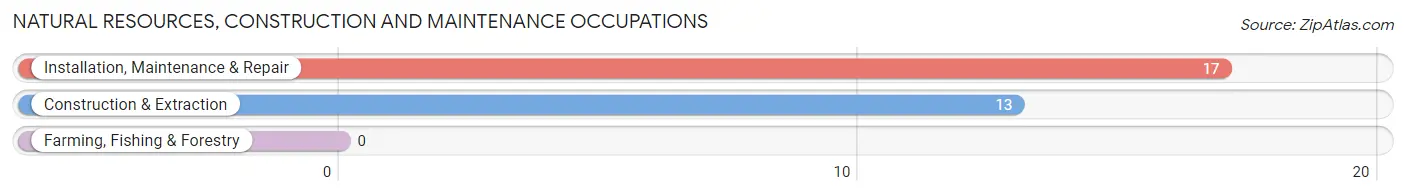
Natural Resources, Construction and Maintenance Occupations
The most common Natural Resources, Construction and Maintenance occupations in Lincolnville are Installation, Maintenance & Repair (17 | 7.7%), and Construction & Extraction (13 | 5.9%).
Natural Resources, Construction and Maintenance Occupations by Sex
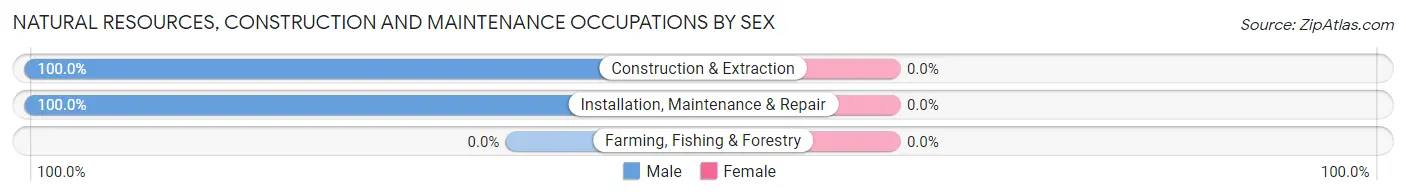
| Occupation | Male | Female |
| Farming, Fishing & Forestry | 0 (0.0%) | 0 (0.0%) |
| Construction & Extraction | 13 (100.0%) | 0 (0.0%) |
| Installation, Maintenance & Repair | 17 (100.0%) | 0 (0.0%) |
| Total (Category) | 30 (100.0%) | 0 (0.0%) |
| Total (Overall) | 155 (69.8%) | 67 (30.2%) |
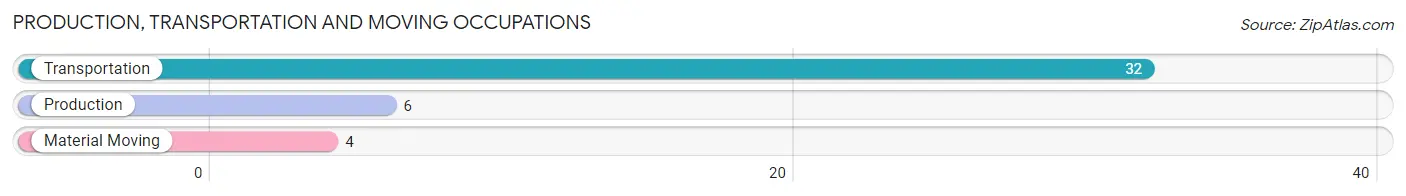
Production, Transportation and Moving Occupations
The most common Production, Transportation and Moving occupations in Lincolnville are Transportation (32 | 14.4%), Production (6 | 2.7%), and Material Moving (4 | 1.8%).
Production, Transportation and Moving Occupations by Sex
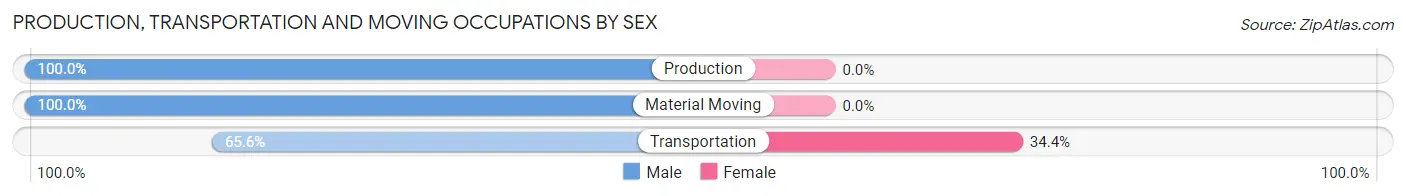
| Occupation | Male | Female |
| Production | 6 (100.0%) | 0 (0.0%) |
| Transportation | 21 (65.6%) | 11 (34.4%) |
| Material Moving | 4 (100.0%) | 0 (0.0%) |
| Total (Category) | 31 (73.8%) | 11 (26.2%) |
| Total (Overall) | 155 (69.8%) | 67 (30.2%) |
Employment Industries by Sex in Lincolnville
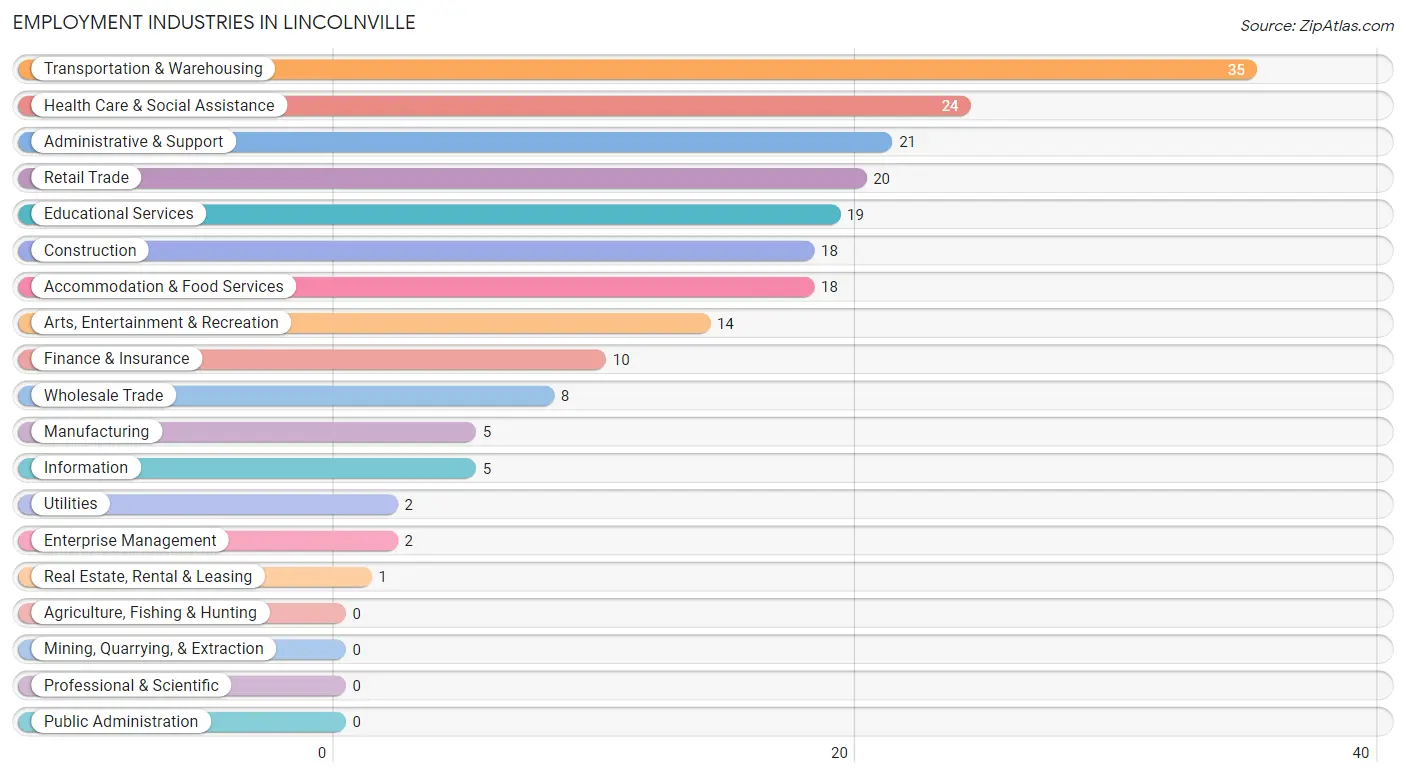
Employment Industries in Lincolnville
The major employment industries in Lincolnville include Transportation & Warehousing (35 | 15.8%), Health Care & Social Assistance (24 | 10.8%), Administrative & Support (21 | 9.5%), Retail Trade (20 | 9.0%), and Educational Services (19 | 8.6%).
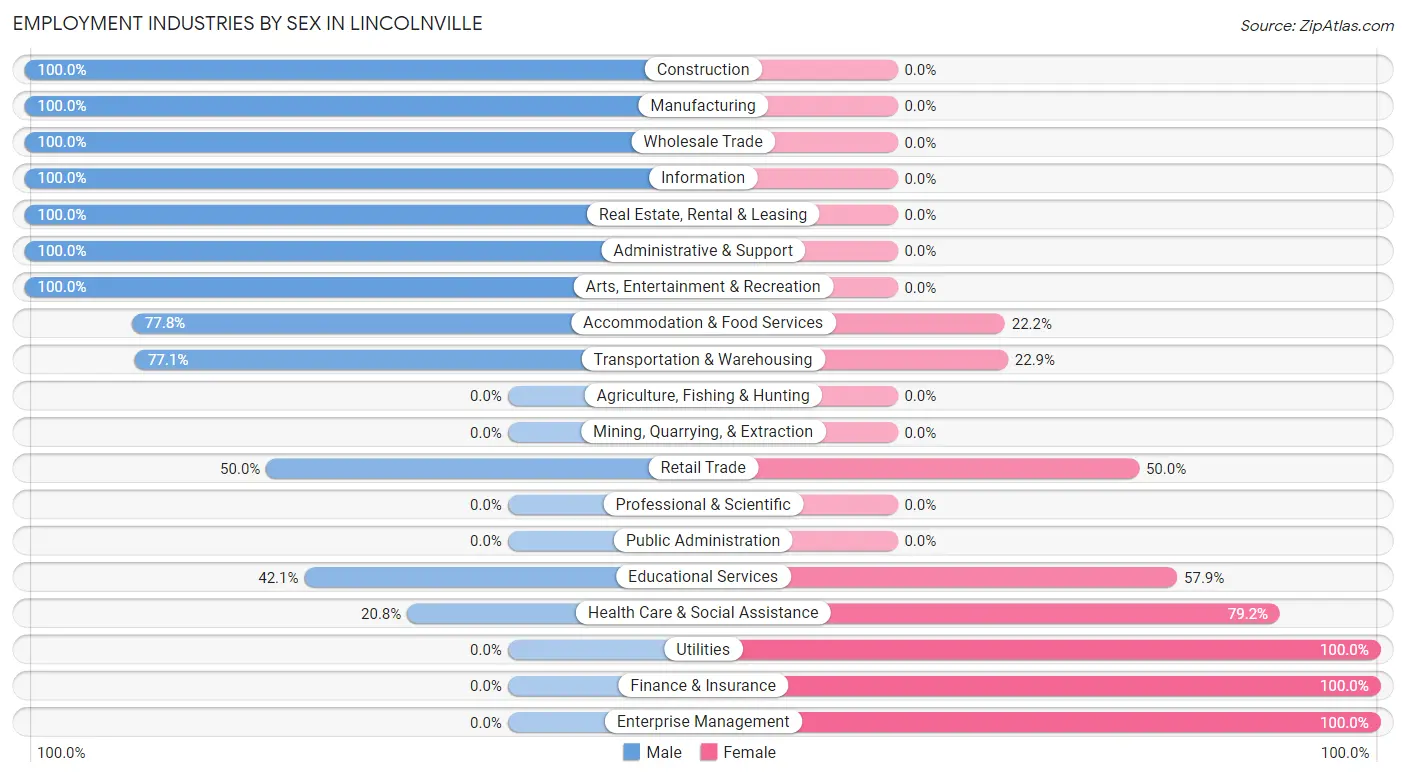
Employment Industries by Sex in Lincolnville
The Lincolnville industries that see more men than women are Construction (100.0%), Manufacturing (100.0%), and Wholesale Trade (100.0%), whereas the industries that tend to have a higher number of women are Utilities (100.0%), Finance & Insurance (100.0%), and Enterprise Management (100.0%).
| Industry | Male | Female |
| Agriculture, Fishing & Hunting | 0 (0.0%) | 0 (0.0%) |
| Mining, Quarrying, & Extraction | 0 (0.0%) | 0 (0.0%) |
| Construction | 18 (100.0%) | 0 (0.0%) |
| Manufacturing | 5 (100.0%) | 0 (0.0%) |
| Wholesale Trade | 8 (100.0%) | 0 (0.0%) |
| Retail Trade | 10 (50.0%) | 10 (50.0%) |
| Transportation & Warehousing | 27 (77.1%) | 8 (22.9%) |
| Utilities | 0 (0.0%) | 2 (100.0%) |
| Information | 5 (100.0%) | 0 (0.0%) |
| Finance & Insurance | 0 (0.0%) | 10 (100.0%) |
| Real Estate, Rental & Leasing | 1 (100.0%) | 0 (0.0%) |
| Professional & Scientific | 0 (0.0%) | 0 (0.0%) |
| Enterprise Management | 0 (0.0%) | 2 (100.0%) |
| Administrative & Support | 21 (100.0%) | 0 (0.0%) |
| Educational Services | 8 (42.1%) | 11 (57.9%) |
| Health Care & Social Assistance | 5 (20.8%) | 19 (79.2%) |
| Arts, Entertainment & Recreation | 14 (100.0%) | 0 (0.0%) |
| Accommodation & Food Services | 14 (77.8%) | 4 (22.2%) |
| Public Administration | 0 (0.0%) | 0 (0.0%) |
| Total | 155 (69.8%) | 67 (30.2%) |
Education in Lincolnville
School Enrollment in Lincolnville
The most common levels of schooling among the 106 students in Lincolnville are high school (51 | 48.1%), elementary school (28 | 26.4%), and middle school (15 | 14.1%).
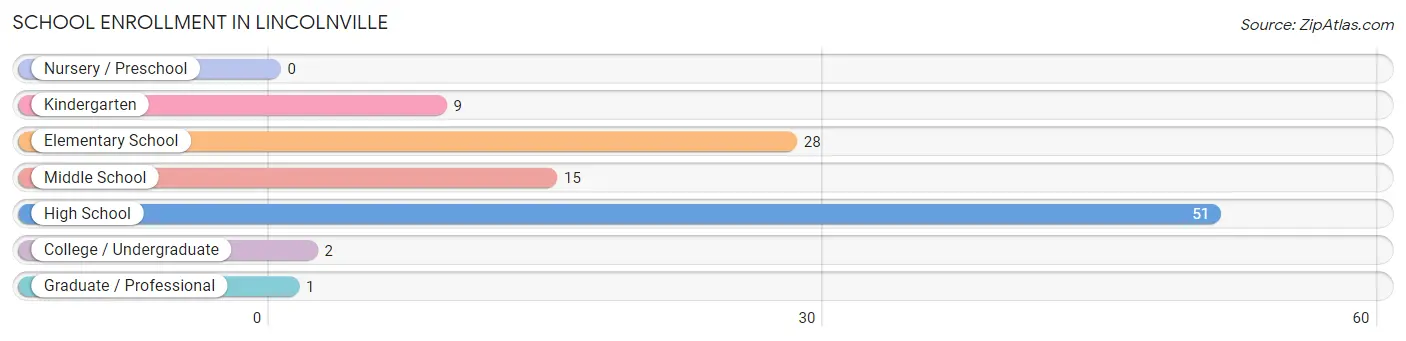
| School Level | # Students | % Students |
| Nursery / Preschool | 0 | 0.0% |
| Kindergarten | 9 | 8.5% |
| Elementary School | 28 | 26.4% |
| Middle School | 15 | 14.1% |
| High School | 51 | 48.1% |
| College / Undergraduate | 2 | 1.9% |
| Graduate / Professional | 1 | 0.9% |
| Total | 106 | 100.0% |
School Enrollment by Age by Funding Source in Lincolnville
Out of a total of 106 students who are enrolled in schools in Lincolnville, 21 (19.8%) attend a private institution, while the remaining 85 (80.2%) are enrolled in public schools. The age group of 10 to 14 year olds has the highest likelihood of being enrolled in private schools, with 16 (48.5% in the age bracket) enrolled. Conversely, the age group of 25 to 34 year olds has the lowest likelihood of being enrolled in a private school, with 1 (100.0% in the age bracket) attending a public institution.
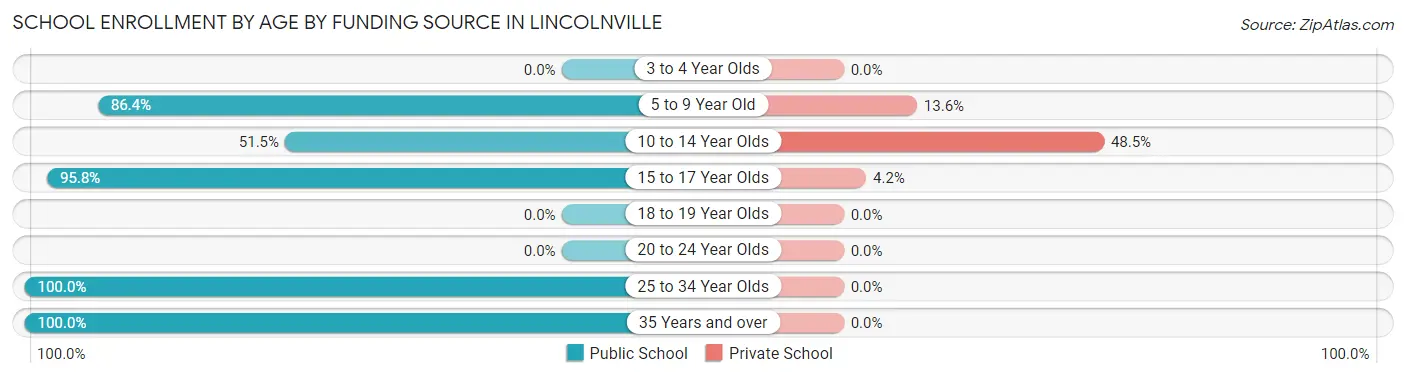
| Age Bracket | Public School | Private School |
| 3 to 4 Year Olds | 0 (0.0%) | 0 (0.0%) |
| 5 to 9 Year Old | 19 (86.4%) | 3 (13.6%) |
| 10 to 14 Year Olds | 17 (51.5%) | 16 (48.5%) |
| 15 to 17 Year Olds | 46 (95.8%) | 2 (4.2%) |
| 18 to 19 Year Olds | 0 (0.0%) | 0 (0.0%) |
| 20 to 24 Year Olds | 0 (0.0%) | 0 (0.0%) |
| 25 to 34 Year Olds | 1 (100.0%) | 0 (0.0%) |
| 35 Years and over | 2 (100.0%) | 0 (0.0%) |
| Total | 85 (80.2%) | 21 (19.8%) |
Educational Attainment by Field of Study in Lincolnville
Liberal arts & history (13 | 16.9%), education (12 | 15.6%), social sciences (11 | 14.3%), business (11 | 14.3%), and science & technology (8 | 10.4%) are the most common fields of study among 77 individuals in Lincolnville who have obtained a bachelor's degree or higher.
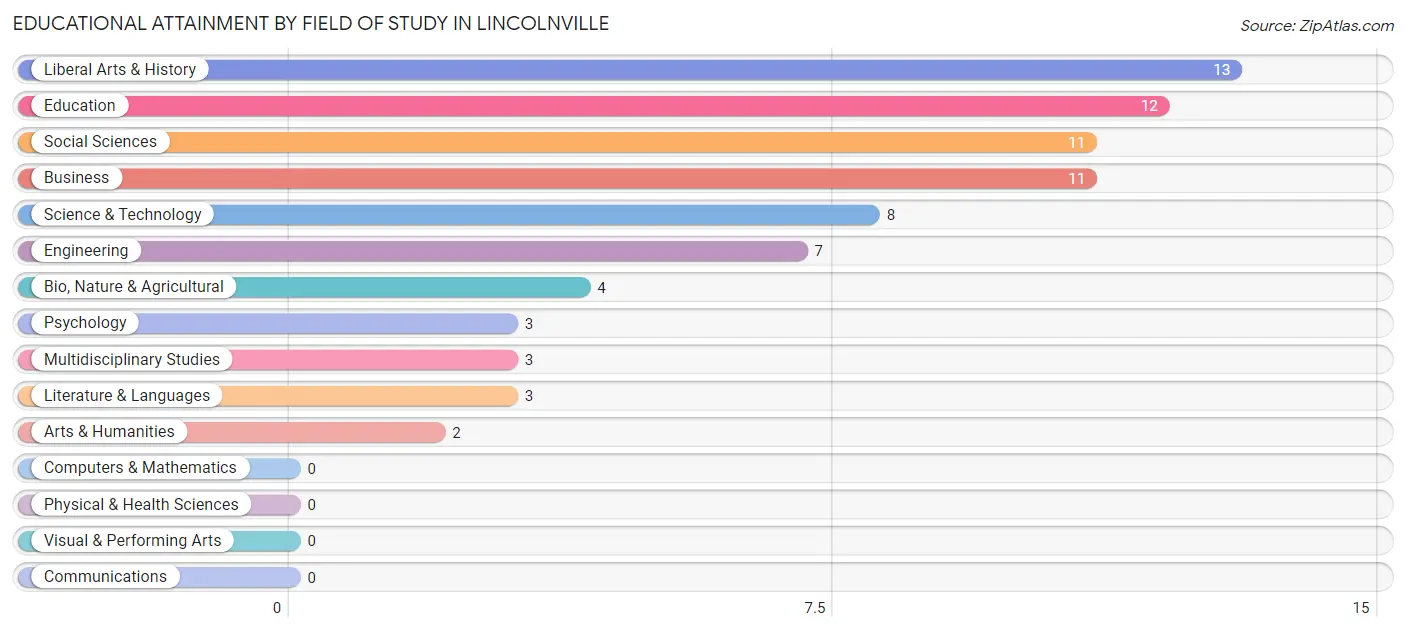
| Field of Study | # Graduates | % Graduates |
| Computers & Mathematics | 0 | 0.0% |
| Bio, Nature & Agricultural | 4 | 5.2% |
| Physical & Health Sciences | 0 | 0.0% |
| Psychology | 3 | 3.9% |
| Social Sciences | 11 | 14.3% |
| Engineering | 7 | 9.1% |
| Multidisciplinary Studies | 3 | 3.9% |
| Science & Technology | 8 | 10.4% |
| Business | 11 | 14.3% |
| Education | 12 | 15.6% |
| Literature & Languages | 3 | 3.9% |
| Liberal Arts & History | 13 | 16.9% |
| Visual & Performing Arts | 0 | 0.0% |
| Communications | 0 | 0.0% |
| Arts & Humanities | 2 | 2.6% |
| Total | 77 | 100.0% |
Transportation & Commute in Lincolnville
Vehicle Availability by Sex in Lincolnville
The most prevalent vehicle ownership categories in Lincolnville are males with 2 vehicles (63, accounting for 46.3%) and females with 2 vehicles (23, making up 94.0%).
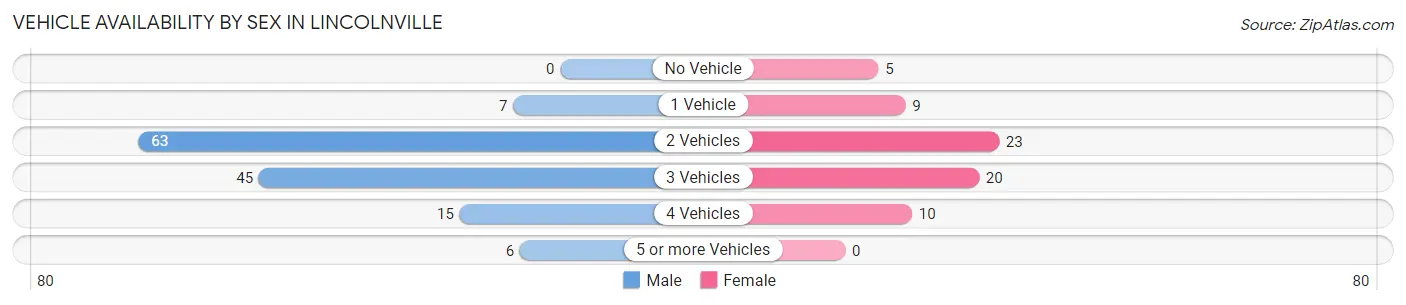
| Vehicles Available | Male | Female |
| No Vehicle | 0 (0.0%) | 5 (7.5%) |
| 1 Vehicle | 7 (5.1%) | 9 (13.4%) |
| 2 Vehicles | 63 (46.3%) | 23 (34.3%) |
| 3 Vehicles | 45 (33.1%) | 20 (29.8%) |
| 4 Vehicles | 15 (11.0%) | 10 (14.9%) |
| 5 or more Vehicles | 6 (4.4%) | 0 (0.0%) |
| Total | 136 (100.0%) | 67 (100.0%) |
Commute Time in Lincolnville
The most frequently occuring commute durations in Lincolnville are 20 to 24 minutes (38 commuters, 20.2%), 30 to 34 minutes (31 commuters, 16.5%), and 40 to 44 minutes (27 commuters, 14.4%).
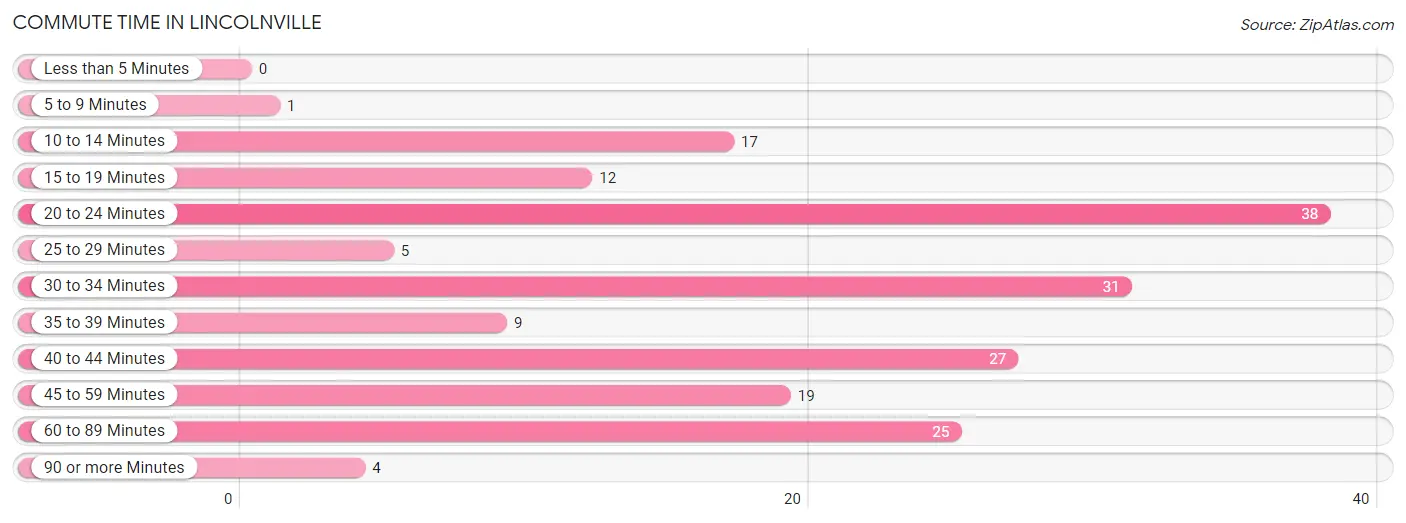
| Commute Time | # Commuters | % Commuters |
| Less than 5 Minutes | 0 | 0.0% |
| 5 to 9 Minutes | 1 | 0.5% |
| 10 to 14 Minutes | 17 | 9.0% |
| 15 to 19 Minutes | 12 | 6.4% |
| 20 to 24 Minutes | 38 | 20.2% |
| 25 to 29 Minutes | 5 | 2.7% |
| 30 to 34 Minutes | 31 | 16.5% |
| 35 to 39 Minutes | 9 | 4.8% |
| 40 to 44 Minutes | 27 | 14.4% |
| 45 to 59 Minutes | 19 | 10.1% |
| 60 to 89 Minutes | 25 | 13.3% |
| 90 or more Minutes | 4 | 2.1% |
Commute Time by Sex in Lincolnville
The most common commute times in Lincolnville are 40 to 44 minutes (24 commuters, 19.8%) for males and 20 to 24 minutes (15 commuters, 22.4%) for females.
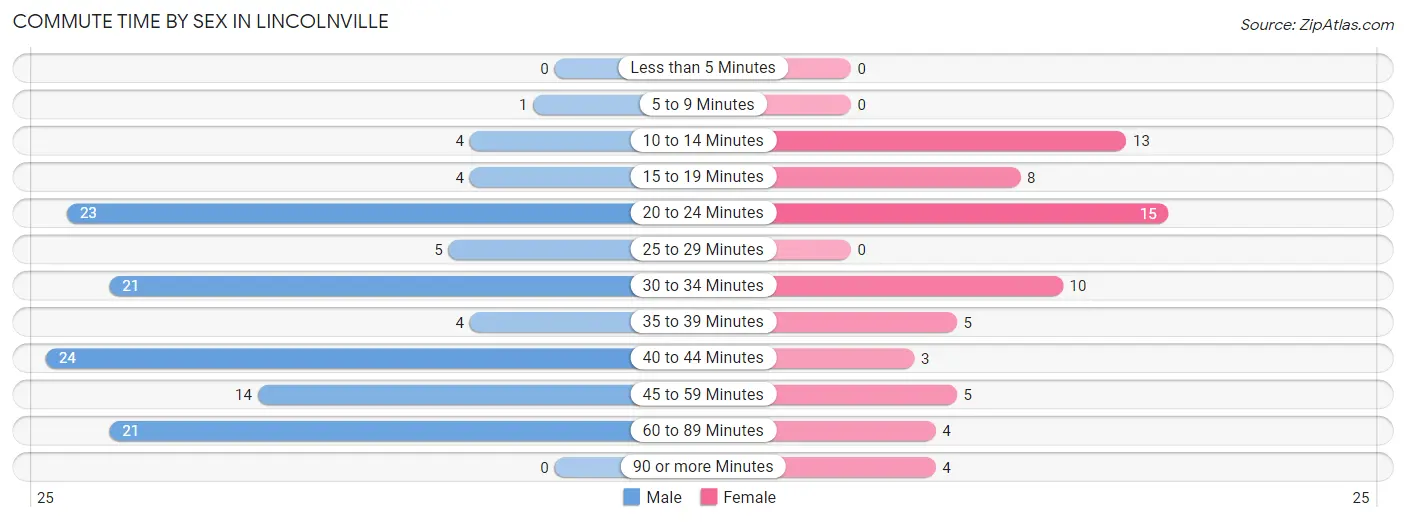
| Commute Time | Male | Female |
| Less than 5 Minutes | 0 (0.0%) | 0 (0.0%) |
| 5 to 9 Minutes | 1 (0.8%) | 0 (0.0%) |
| 10 to 14 Minutes | 4 (3.3%) | 13 (19.4%) |
| 15 to 19 Minutes | 4 (3.3%) | 8 (11.9%) |
| 20 to 24 Minutes | 23 (19.0%) | 15 (22.4%) |
| 25 to 29 Minutes | 5 (4.1%) | 0 (0.0%) |
| 30 to 34 Minutes | 21 (17.4%) | 10 (14.9%) |
| 35 to 39 Minutes | 4 (3.3%) | 5 (7.5%) |
| 40 to 44 Minutes | 24 (19.8%) | 3 (4.5%) |
| 45 to 59 Minutes | 14 (11.6%) | 5 (7.5%) |
| 60 to 89 Minutes | 21 (17.4%) | 4 (6.0%) |
| 90 or more Minutes | 0 (0.0%) | 4 (6.0%) |
Time of Departure to Work by Sex in Lincolnville
The most frequent times of departure to work in Lincolnville are 7:30 AM to 7:59 AM (38, 31.4%) for males and 5:30 AM to 5:59 AM (15, 22.4%) for females.
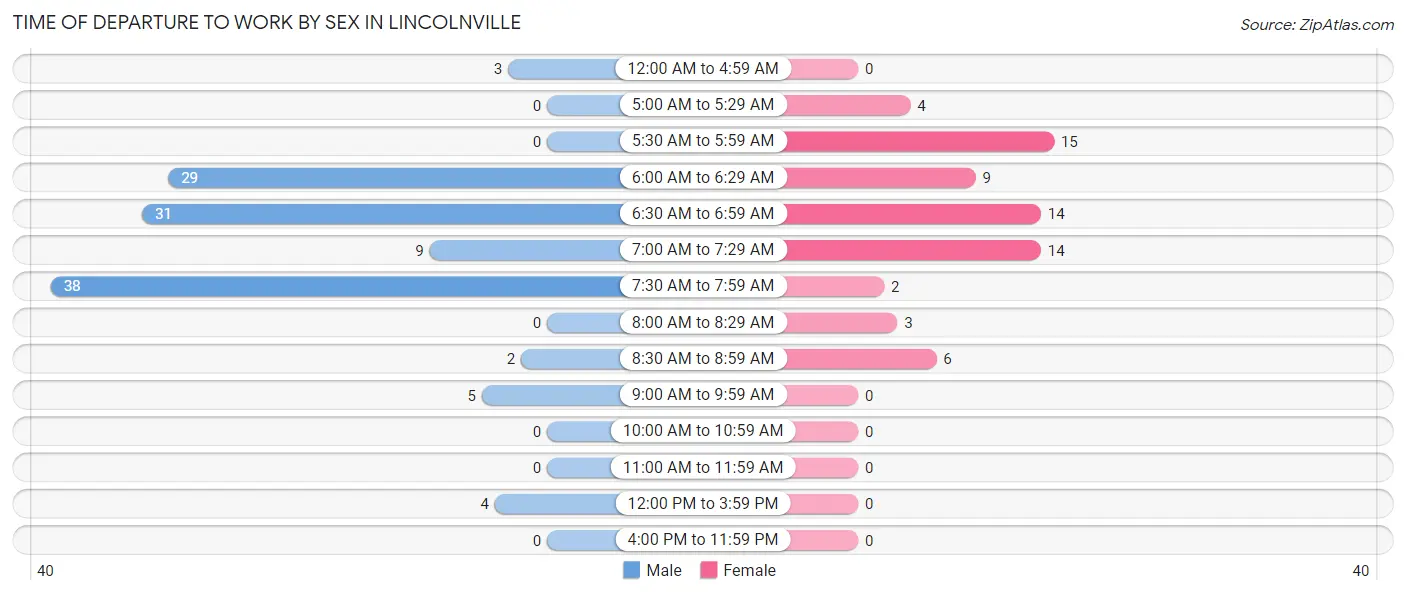
| Time of Departure | Male | Female |
| 12:00 AM to 4:59 AM | 3 (2.5%) | 0 (0.0%) |
| 5:00 AM to 5:29 AM | 0 (0.0%) | 4 (6.0%) |
| 5:30 AM to 5:59 AM | 0 (0.0%) | 15 (22.4%) |
| 6:00 AM to 6:29 AM | 29 (24.0%) | 9 (13.4%) |
| 6:30 AM to 6:59 AM | 31 (25.6%) | 14 (20.9%) |
| 7:00 AM to 7:29 AM | 9 (7.4%) | 14 (20.9%) |
| 7:30 AM to 7:59 AM | 38 (31.4%) | 2 (3.0%) |
| 8:00 AM to 8:29 AM | 0 (0.0%) | 3 (4.5%) |
| 8:30 AM to 8:59 AM | 2 (1.7%) | 6 (9.0%) |
| 9:00 AM to 9:59 AM | 5 (4.1%) | 0 (0.0%) |
| 10:00 AM to 10:59 AM | 0 (0.0%) | 0 (0.0%) |
| 11:00 AM to 11:59 AM | 0 (0.0%) | 0 (0.0%) |
| 12:00 PM to 3:59 PM | 4 (3.3%) | 0 (0.0%) |
| 4:00 PM to 11:59 PM | 0 (0.0%) | 0 (0.0%) |
| Total | 121 (100.0%) | 67 (100.0%) |
Housing Occupancy in Lincolnville
Occupancy by Ownership in Lincolnville
Of the total 270 dwellings in Lincolnville, owner-occupied units account for 171 (63.3%), while renter-occupied units make up 99 (36.7%).
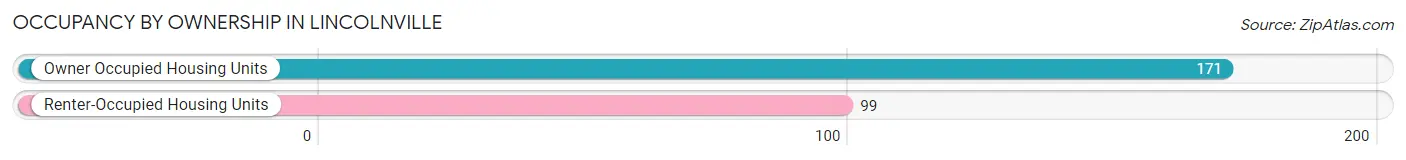
| Occupancy | # Housing Units | % Housing Units |
| Owner Occupied Housing Units | 171 | 63.3% |
| Renter-Occupied Housing Units | 99 | 36.7% |
| Total Occupied Housing Units | 270 | 100.0% |
Occupancy by Household Size in Lincolnville
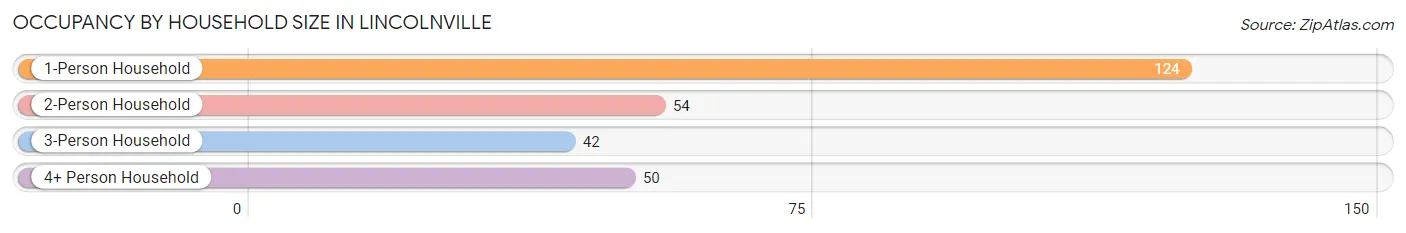
| Household Size | # Housing Units | % Housing Units |
| 1-Person Household | 124 | 45.9% |
| 2-Person Household | 54 | 20.0% |
| 3-Person Household | 42 | 15.6% |
| 4+ Person Household | 50 | 18.5% |
| Total Housing Units | 270 | 100.0% |
Occupancy by Ownership by Household Size in Lincolnville
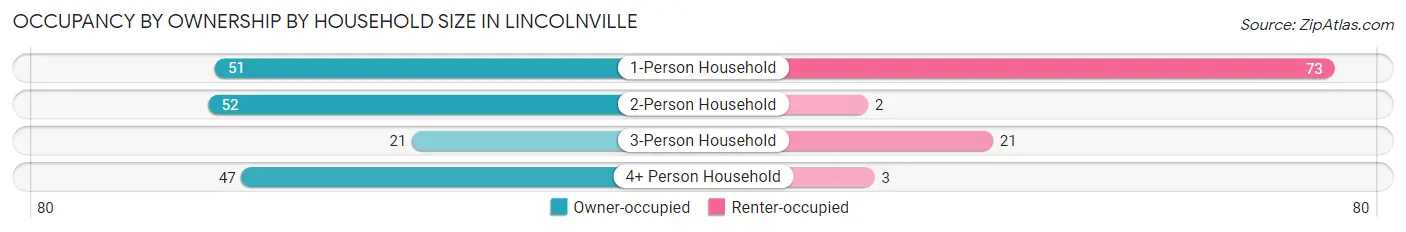
| Household Size | Owner-occupied | Renter-occupied |
| 1-Person Household | 51 (41.1%) | 73 (58.9%) |
| 2-Person Household | 52 (96.3%) | 2 (3.7%) |
| 3-Person Household | 21 (50.0%) | 21 (50.0%) |
| 4+ Person Household | 47 (94.0%) | 3 (6.0%) |
| Total Housing Units | 171 (63.3%) | 99 (36.7%) |
Occupancy by Educational Attainment in Lincolnville
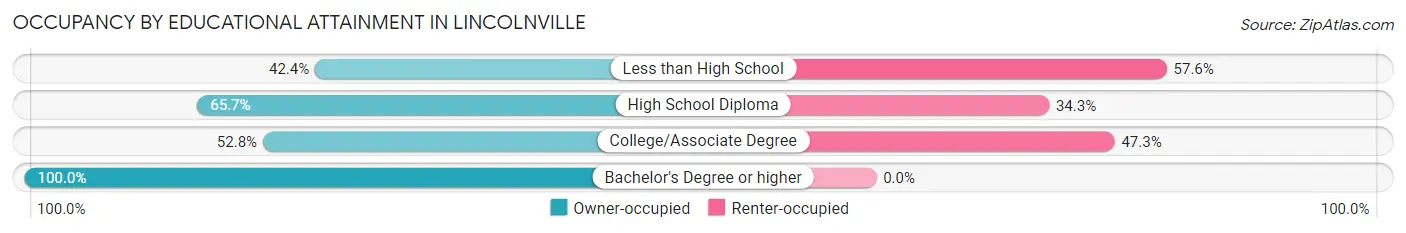
| Household Size | Owner-occupied | Renter-occupied |
| Less than High School | 14 (42.4%) | 19 (57.6%) |
| High School Diploma | 71 (65.7%) | 37 (34.3%) |
| College/Associate Degree | 48 (52.7%) | 43 (47.2%) |
| Bachelor's Degree or higher | 38 (100.0%) | 0 (0.0%) |
Occupancy by Age of Householder in Lincolnville
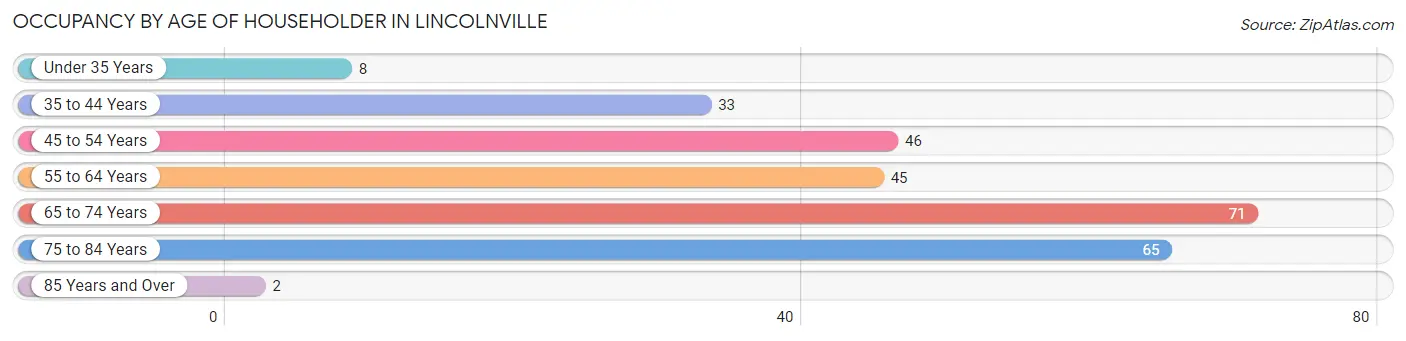
| Age Bracket | # Households | % Households |
| Under 35 Years | 8 | 3.0% |
| 35 to 44 Years | 33 | 12.2% |
| 45 to 54 Years | 46 | 17.0% |
| 55 to 64 Years | 45 | 16.7% |
| 65 to 74 Years | 71 | 26.3% |
| 75 to 84 Years | 65 | 24.1% |
| 85 Years and Over | 2 | 0.7% |
| Total | 270 | 100.0% |
Housing Finances in Lincolnville
Median Income by Occupancy in Lincolnville
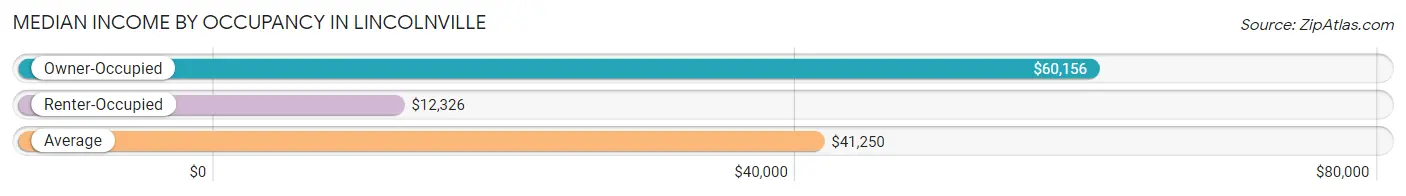
| Occupancy Type | # Households | Median Income |
| Owner-Occupied | 171 (63.3%) | $60,156 |
| Renter-Occupied | 99 (36.7%) | $12,326 |
| Average | 270 (100.0%) | $41,250 |
Occupancy by Householder Income Bracket in Lincolnville
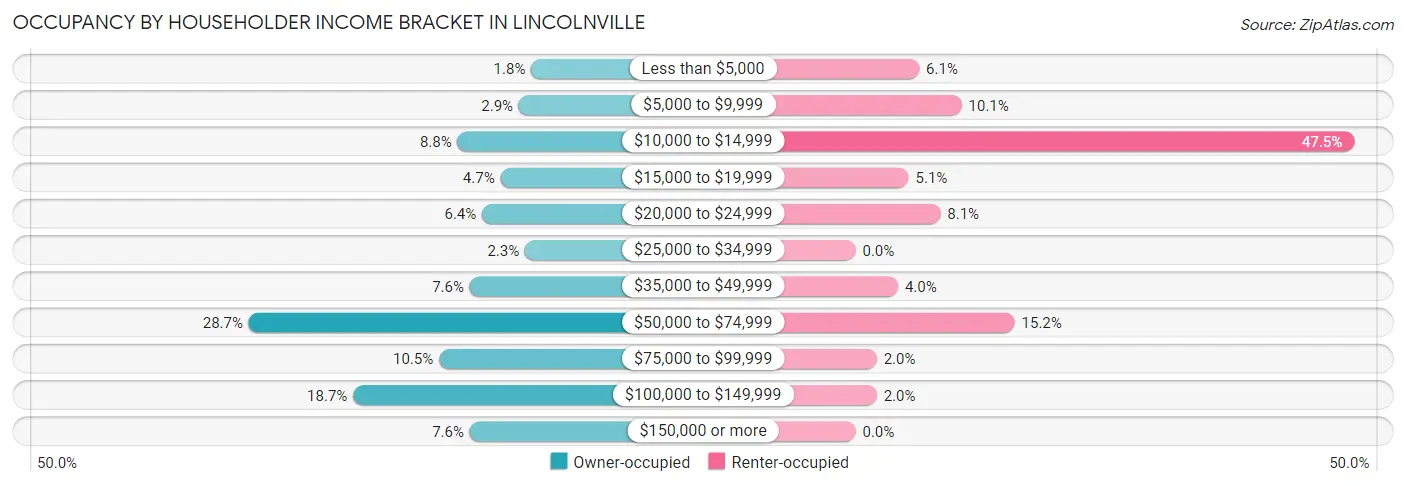
| Income Bracket | Owner-occupied | Renter-occupied |
| Less than $5,000 | 3 (1.8%) | 6 (6.1%) |
| $5,000 to $9,999 | 5 (2.9%) | 10 (10.1%) |
| $10,000 to $14,999 | 15 (8.8%) | 47 (47.5%) |
| $15,000 to $19,999 | 8 (4.7%) | 5 (5.1%) |
| $20,000 to $24,999 | 11 (6.4%) | 8 (8.1%) |
| $25,000 to $34,999 | 4 (2.3%) | 0 (0.0%) |
| $35,000 to $49,999 | 13 (7.6%) | 4 (4.0%) |
| $50,000 to $74,999 | 49 (28.6%) | 15 (15.1%) |
| $75,000 to $99,999 | 18 (10.5%) | 2 (2.0%) |
| $100,000 to $149,999 | 32 (18.7%) | 2 (2.0%) |
| $150,000 or more | 13 (7.6%) | 0 (0.0%) |
| Total | 171 (100.0%) | 99 (100.0%) |
Monthly Housing Cost Tiers in Lincolnville
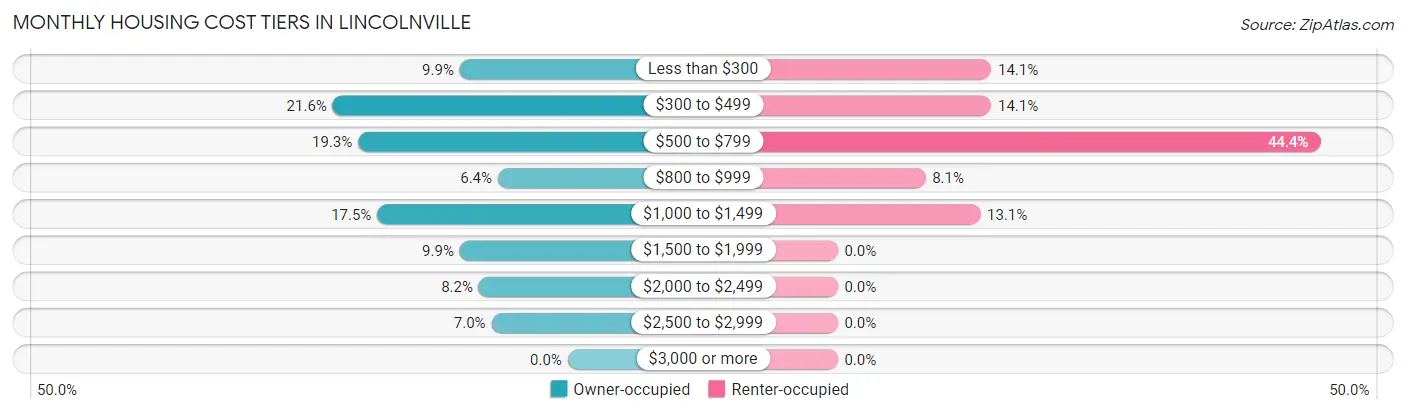
| Monthly Cost | Owner-occupied | Renter-occupied |
| Less than $300 | 17 (9.9%) | 14 (14.1%) |
| $300 to $499 | 37 (21.6%) | 14 (14.1%) |
| $500 to $799 | 33 (19.3%) | 44 (44.4%) |
| $800 to $999 | 11 (6.4%) | 8 (8.1%) |
| $1,000 to $1,499 | 30 (17.5%) | 13 (13.1%) |
| $1,500 to $1,999 | 17 (9.9%) | 0 (0.0%) |
| $2,000 to $2,499 | 14 (8.2%) | 0 (0.0%) |
| $2,500 to $2,999 | 12 (7.0%) | 0 (0.0%) |
| $3,000 or more | 0 (0.0%) | 0 (0.0%) |
| Total | 171 (100.0%) | 99 (100.0%) |
Physical Housing Characteristics in Lincolnville
Housing Structures in Lincolnville
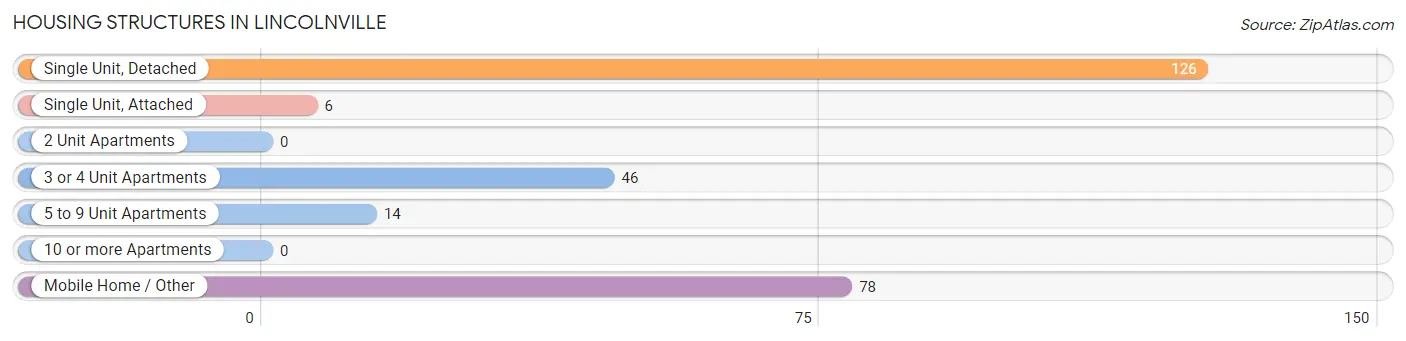
| Structure Type | # Housing Units | % Housing Units |
| Single Unit, Detached | 126 | 46.7% |
| Single Unit, Attached | 6 | 2.2% |
| 2 Unit Apartments | 0 | 0.0% |
| 3 or 4 Unit Apartments | 46 | 17.0% |
| 5 to 9 Unit Apartments | 14 | 5.2% |
| 10 or more Apartments | 0 | 0.0% |
| Mobile Home / Other | 78 | 28.9% |
| Total | 270 | 100.0% |
Housing Structures by Occupancy in Lincolnville
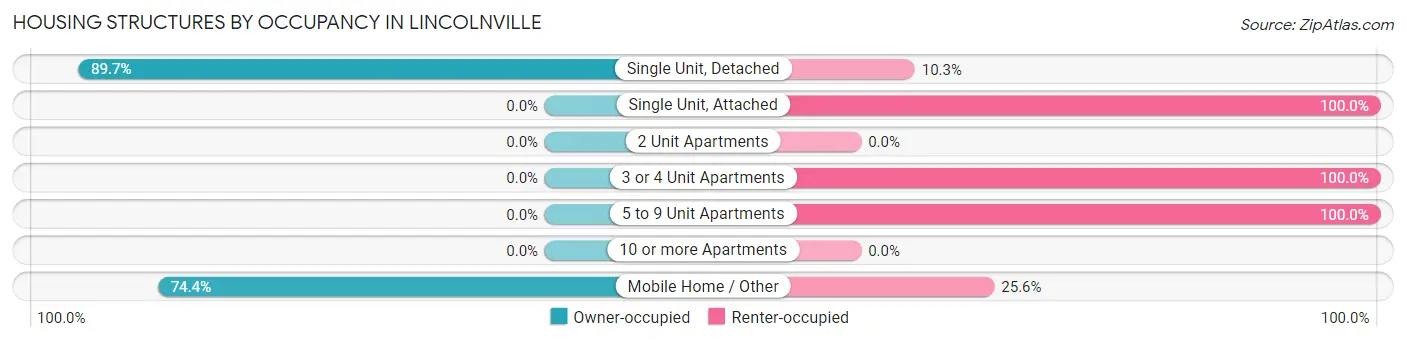
| Structure Type | Owner-occupied | Renter-occupied |
| Single Unit, Detached | 113 (89.7%) | 13 (10.3%) |
| Single Unit, Attached | 0 (0.0%) | 6 (100.0%) |
| 2 Unit Apartments | 0 (0.0%) | 0 (0.0%) |
| 3 or 4 Unit Apartments | 0 (0.0%) | 46 (100.0%) |
| 5 to 9 Unit Apartments | 0 (0.0%) | 14 (100.0%) |
| 10 or more Apartments | 0 (0.0%) | 0 (0.0%) |
| Mobile Home / Other | 58 (74.4%) | 20 (25.6%) |
| Total | 171 (63.3%) | 99 (36.7%) |
Housing Structures by Number of Rooms in Lincolnville
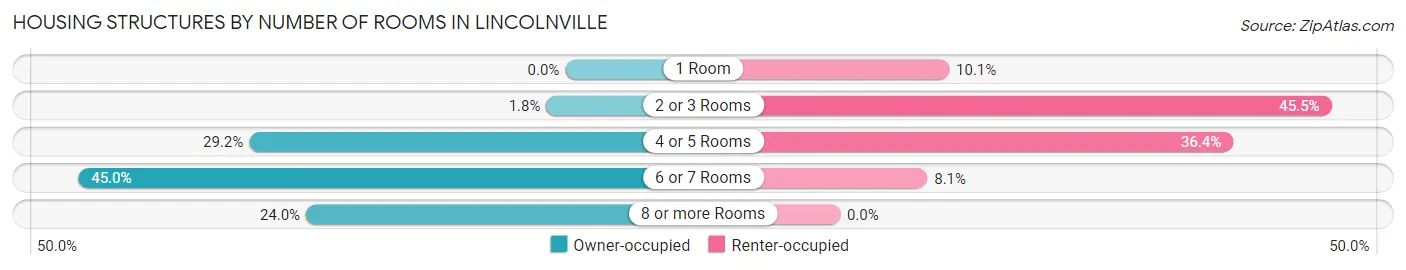
| Number of Rooms | Owner-occupied | Renter-occupied |
| 1 Room | 0 (0.0%) | 10 (10.1%) |
| 2 or 3 Rooms | 3 (1.8%) | 45 (45.5%) |
| 4 or 5 Rooms | 50 (29.2%) | 36 (36.4%) |
| 6 or 7 Rooms | 77 (45.0%) | 8 (8.1%) |
| 8 or more Rooms | 41 (24.0%) | 0 (0.0%) |
| Total | 171 (100.0%) | 99 (100.0%) |
Housing Structure by Heating Type in Lincolnville
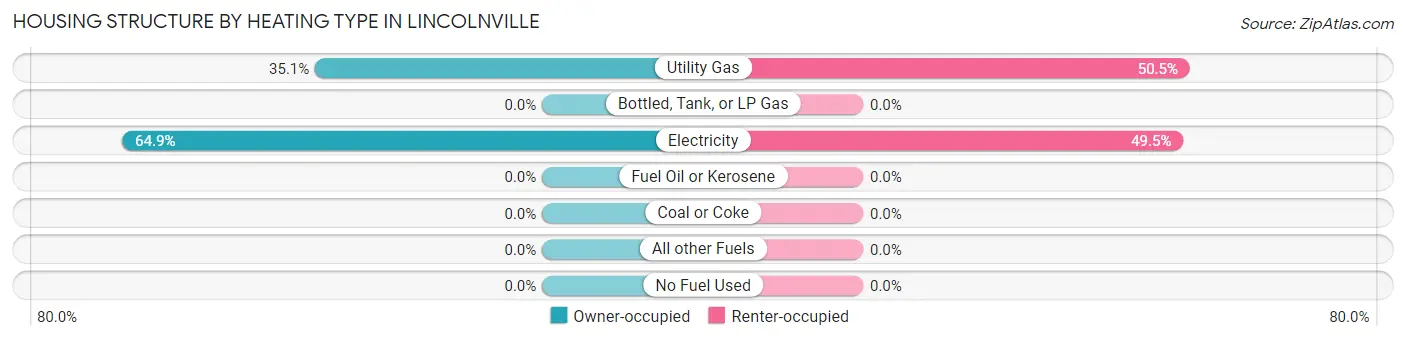
| Heating Type | Owner-occupied | Renter-occupied |
| Utility Gas | 60 (35.1%) | 50 (50.5%) |
| Bottled, Tank, or LP Gas | 0 (0.0%) | 0 (0.0%) |
| Electricity | 111 (64.9%) | 49 (49.5%) |
| Fuel Oil or Kerosene | 0 (0.0%) | 0 (0.0%) |
| Coal or Coke | 0 (0.0%) | 0 (0.0%) |
| All other Fuels | 0 (0.0%) | 0 (0.0%) |
| No Fuel Used | 0 (0.0%) | 0 (0.0%) |
| Total | 171 (100.0%) | 99 (100.0%) |
Household Vehicle Usage in Lincolnville
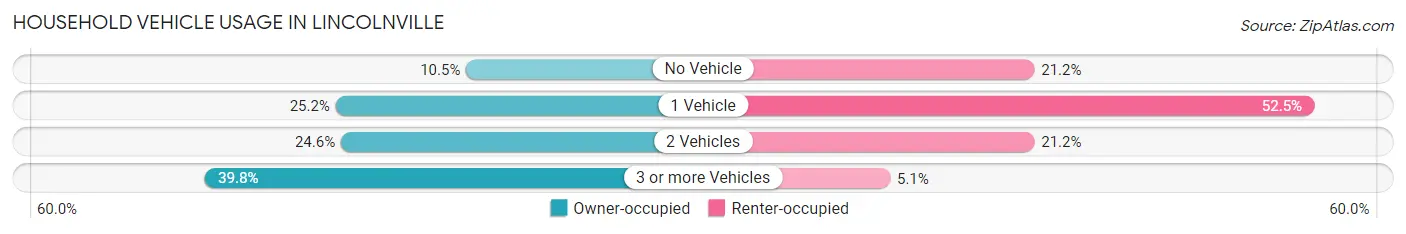
| Vehicles per Household | Owner-occupied | Renter-occupied |
| No Vehicle | 18 (10.5%) | 21 (21.2%) |
| 1 Vehicle | 43 (25.2%) | 52 (52.5%) |
| 2 Vehicles | 42 (24.6%) | 21 (21.2%) |
| 3 or more Vehicles | 68 (39.8%) | 5 (5.1%) |
| Total | 171 (100.0%) | 99 (100.0%) |
Real Estate & Mortgages in Lincolnville
Real Estate and Mortgage Overview in Lincolnville
| Characteristic | Without Mortgage | With Mortgage |
| Housing Units | 81 | 90 |
| Median Property Value | $204,700 | $212,500 |
| Median Household Income | $51,250 | $9 |
| Monthly Housing Costs | $495 | $0 |
| Real Estate Taxes | $940 | $8 |
Property Value by Mortgage Status in Lincolnville
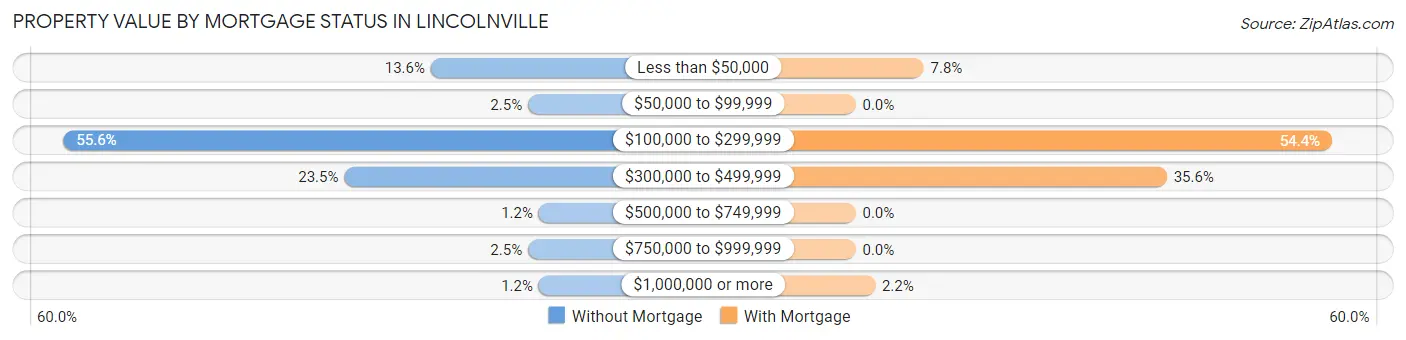
| Property Value | Without Mortgage | With Mortgage |
| Less than $50,000 | 11 (13.6%) | 7 (7.8%) |
| $50,000 to $99,999 | 2 (2.5%) | 0 (0.0%) |
| $100,000 to $299,999 | 45 (55.6%) | 49 (54.4%) |
| $300,000 to $499,999 | 19 (23.5%) | 32 (35.6%) |
| $500,000 to $749,999 | 1 (1.2%) | 0 (0.0%) |
| $750,000 to $999,999 | 2 (2.5%) | 0 (0.0%) |
| $1,000,000 or more | 1 (1.2%) | 2 (2.2%) |
| Total | 81 (100.0%) | 90 (100.0%) |
Household Income by Mortgage Status in Lincolnville
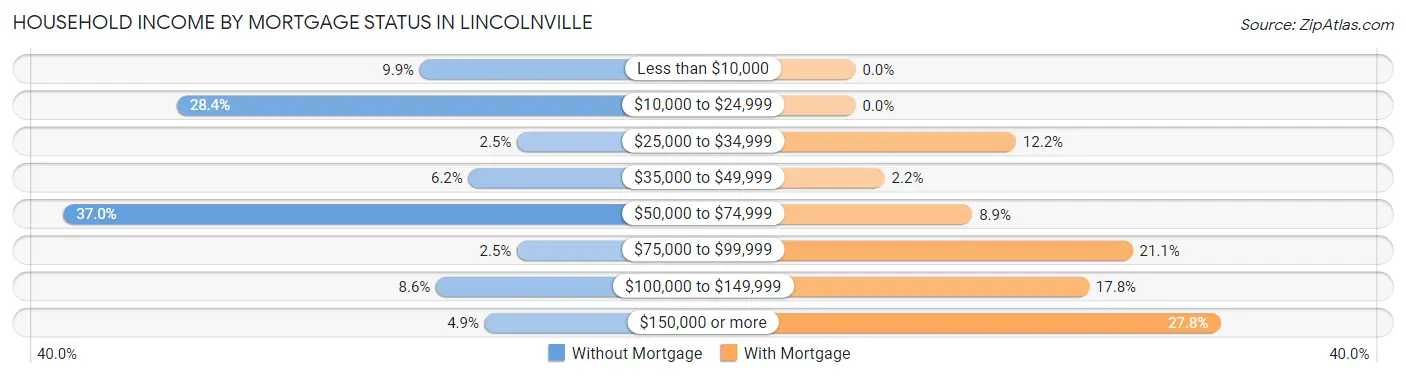
| Household Income | Without Mortgage | With Mortgage |
| Less than $10,000 | 8 (9.9%) | 0 (0.0%) |
| $10,000 to $24,999 | 23 (28.4%) | 0 (0.0%) |
| $25,000 to $34,999 | 2 (2.5%) | 11 (12.2%) |
| $35,000 to $49,999 | 5 (6.2%) | 2 (2.2%) |
| $50,000 to $74,999 | 30 (37.0%) | 8 (8.9%) |
| $75,000 to $99,999 | 2 (2.5%) | 19 (21.1%) |
| $100,000 to $149,999 | 7 (8.6%) | 16 (17.8%) |
| $150,000 or more | 4 (4.9%) | 25 (27.8%) |
| Total | 81 (100.0%) | 90 (100.0%) |
Property Value to Household Income Ratio in Lincolnville
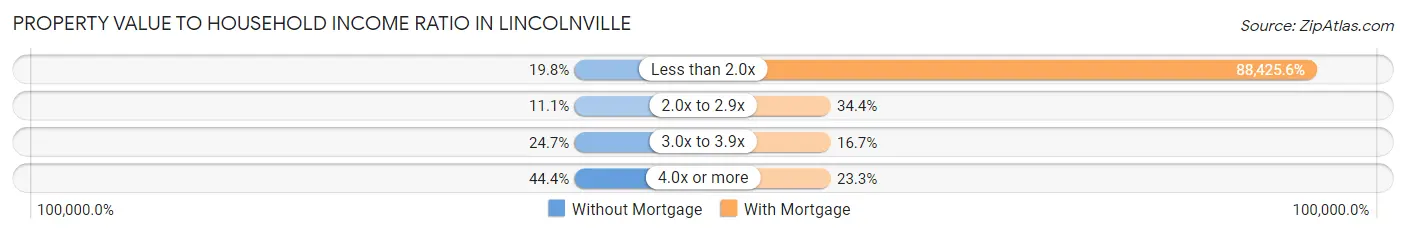
| Value-to-Income Ratio | Without Mortgage | With Mortgage |
| Less than 2.0x | 16 (19.8%) | 79,583 (88,425.6%) |
| 2.0x to 2.9x | 9 (11.1%) | 31 (34.4%) |
| 3.0x to 3.9x | 20 (24.7%) | 15 (16.7%) |
| 4.0x or more | 36 (44.4%) | 21 (23.3%) |
| Total | 81 (100.0%) | 90 (100.0%) |
Real Estate Taxes by Mortgage Status in Lincolnville
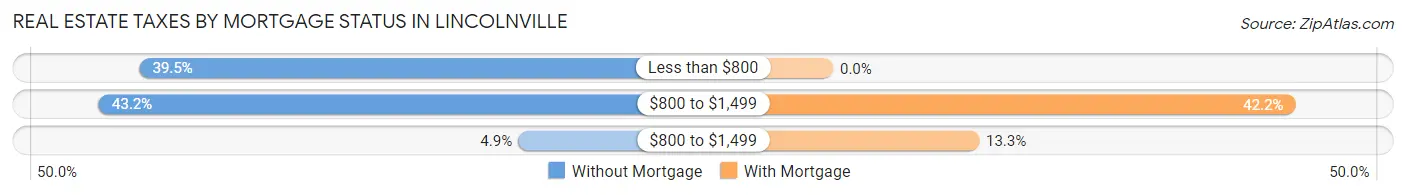
| Property Taxes | Without Mortgage | With Mortgage |
| Less than $800 | 32 (39.5%) | 0 (0.0%) |
| $800 to $1,499 | 35 (43.2%) | 38 (42.2%) |
| $800 to $1,499 | 4 (4.9%) | 12 (13.3%) |
| Total | 81 (100.0%) | 90 (100.0%) |
Health & Disability in Lincolnville
Health Insurance Coverage by Age in Lincolnville
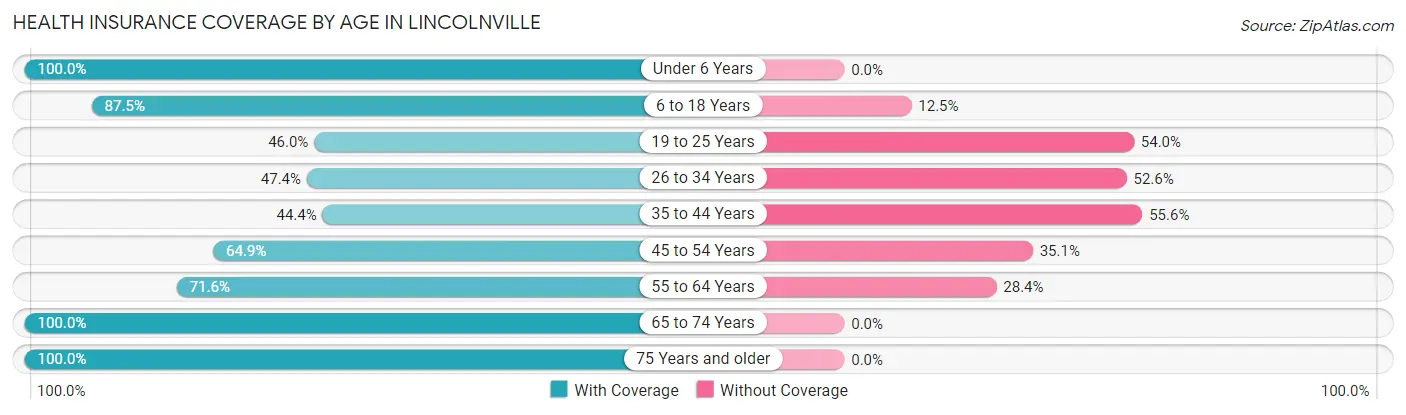
| Age Bracket | With Coverage | Without Coverage |
| Under 6 Years | 6 (100.0%) | 0 (0.0%) |
| 6 to 18 Years | 84 (87.5%) | 12 (12.5%) |
| 19 to 25 Years | 23 (46.0%) | 27 (54.0%) |
| 26 to 34 Years | 18 (47.4%) | 20 (52.6%) |
| 35 to 44 Years | 28 (44.4%) | 35 (55.6%) |
| 45 to 54 Years | 72 (64.9%) | 39 (35.1%) |
| 55 to 64 Years | 48 (71.6%) | 19 (28.4%) |
| 65 to 74 Years | 130 (100.0%) | 0 (0.0%) |
| 75 Years and older | 76 (100.0%) | 0 (0.0%) |
| Total | 485 (76.1%) | 152 (23.9%) |
Health Insurance Coverage by Citizenship Status in Lincolnville
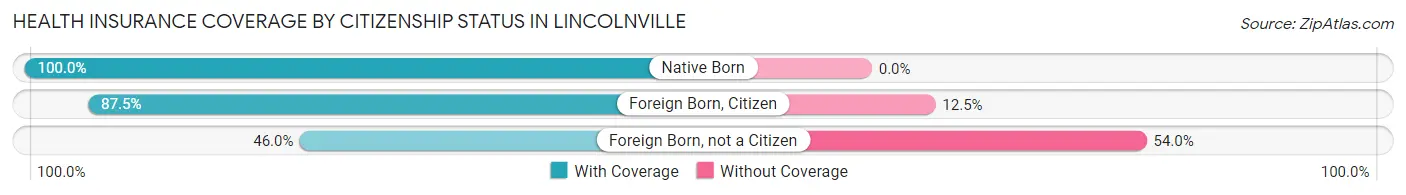
| Citizenship Status | With Coverage | Without Coverage |
| Native Born | 6 (100.0%) | 0 (0.0%) |
| Foreign Born, Citizen | 84 (87.5%) | 12 (12.5%) |
| Foreign Born, not a Citizen | 23 (46.0%) | 27 (54.0%) |
Health Insurance Coverage by Household Income in Lincolnville
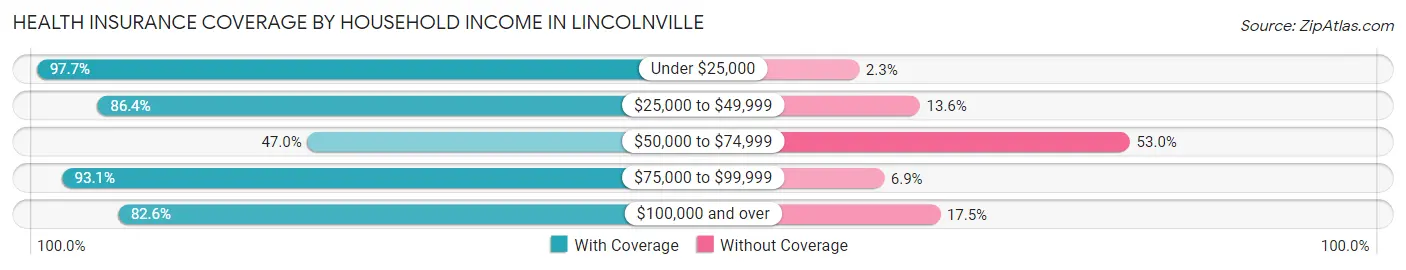
| Household Income | With Coverage | Without Coverage |
| Under $25,000 | 129 (97.7%) | 3 (2.3%) |
| $25,000 to $49,999 | 57 (86.4%) | 9 (13.6%) |
| $50,000 to $74,999 | 94 (47.0%) | 106 (53.0%) |
| $75,000 to $99,999 | 67 (93.1%) | 5 (6.9%) |
| $100,000 and over | 123 (82.6%) | 26 (17.4%) |
Public vs Private Health Insurance Coverage by Age in Lincolnville
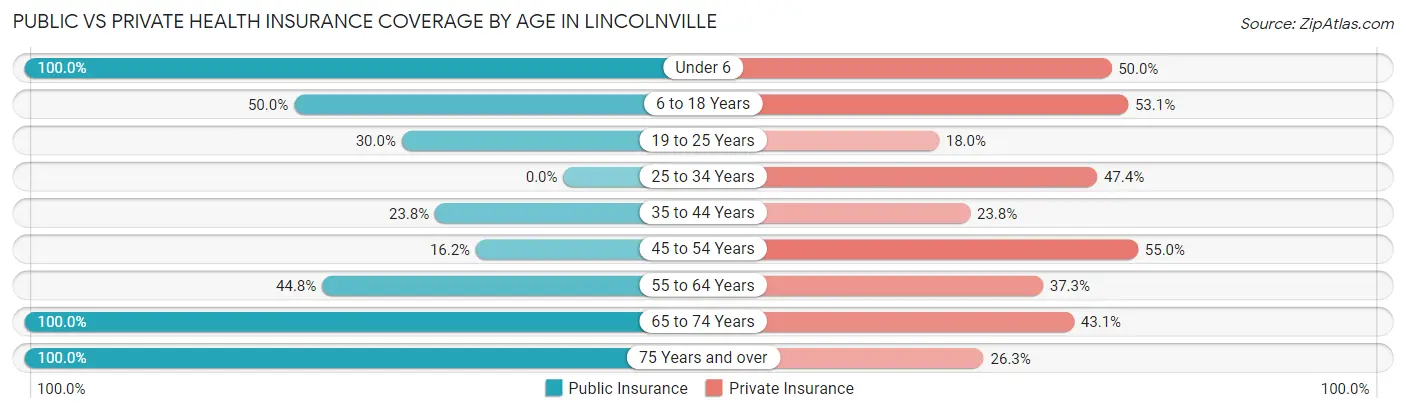
| Age Bracket | Public Insurance | Private Insurance |
| Under 6 | 6 (100.0%) | 3 (50.0%) |
| 6 to 18 Years | 48 (50.0%) | 51 (53.1%) |
| 19 to 25 Years | 15 (30.0%) | 9 (18.0%) |
| 25 to 34 Years | 0 (0.0%) | 18 (47.4%) |
| 35 to 44 Years | 15 (23.8%) | 15 (23.8%) |
| 45 to 54 Years | 18 (16.2%) | 61 (54.9%) |
| 55 to 64 Years | 30 (44.8%) | 25 (37.3%) |
| 65 to 74 Years | 130 (100.0%) | 56 (43.1%) |
| 75 Years and over | 76 (100.0%) | 20 (26.3%) |
| Total | 338 (53.1%) | 258 (40.5%) |
Disability Status by Sex by Age in Lincolnville
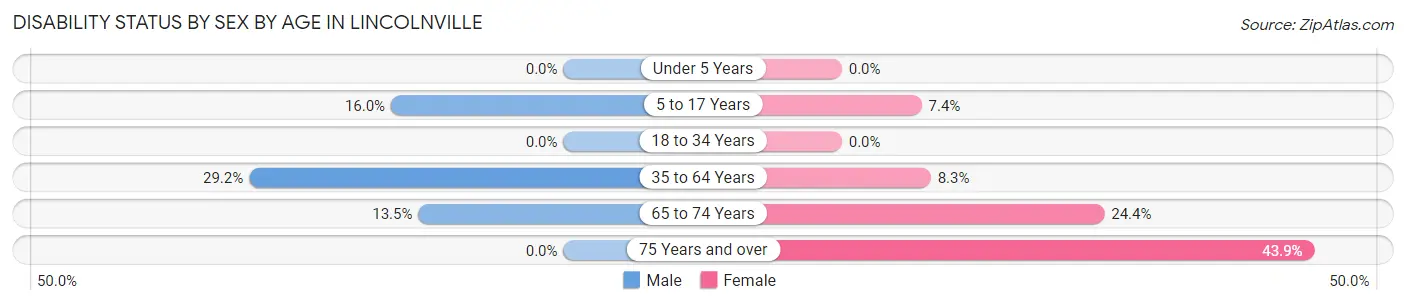
| Age Bracket | Male | Female |
| Under 5 Years | 0 (0.0%) | 0 (0.0%) |
| 5 to 17 Years | 12 (16.0%) | 2 (7.4%) |
| 18 to 34 Years | 0 (0.0%) | 0 (0.0%) |
| 35 to 64 Years | 42 (29.2%) | 8 (8.3%) |
| 65 to 74 Years | 7 (13.5%) | 19 (24.4%) |
| 75 Years and over | 0 (0.0%) | 25 (43.9%) |
Disability Class by Sex by Age in Lincolnville
Disability Class: Hearing Difficulty
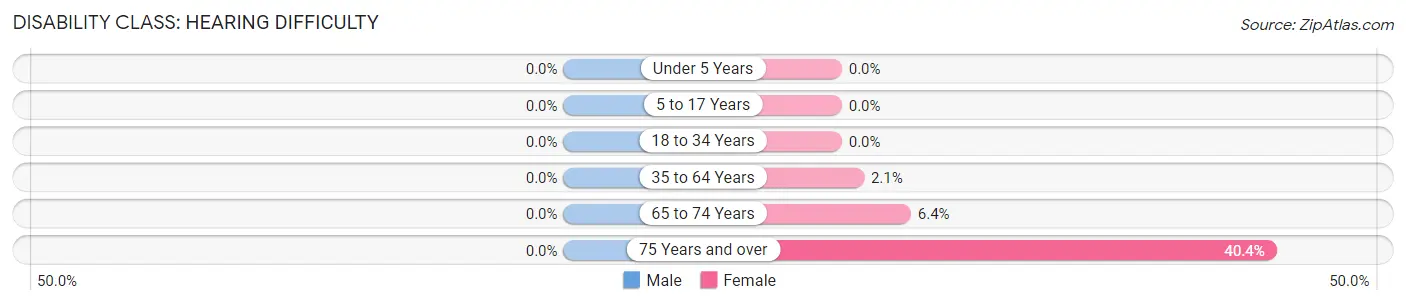
| Age Bracket | Male | Female |
| Under 5 Years | 0 (0.0%) | 0 (0.0%) |
| 5 to 17 Years | 0 (0.0%) | 0 (0.0%) |
| 18 to 34 Years | 0 (0.0%) | 0 (0.0%) |
| 35 to 64 Years | 0 (0.0%) | 2 (2.1%) |
| 65 to 74 Years | 0 (0.0%) | 5 (6.4%) |
| 75 Years and over | 0 (0.0%) | 23 (40.4%) |
Disability Class: Vision Difficulty
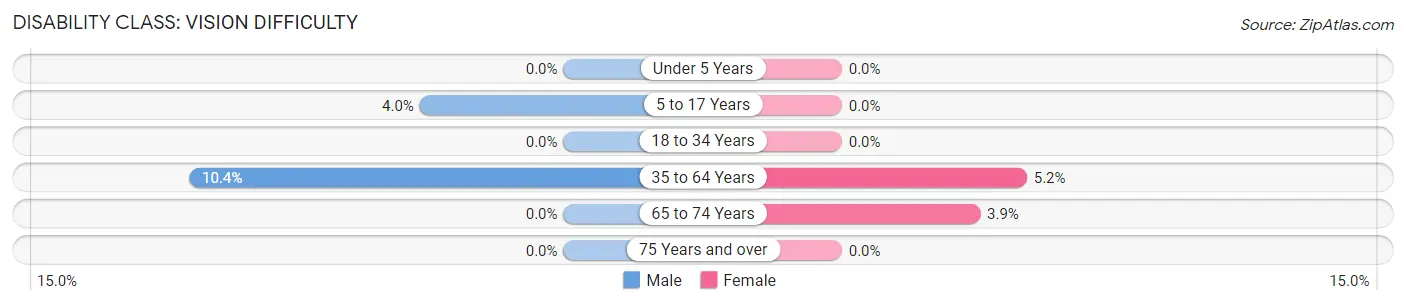
| Age Bracket | Male | Female |
| Under 5 Years | 0 (0.0%) | 0 (0.0%) |
| 5 to 17 Years | 3 (4.0%) | 0 (0.0%) |
| 18 to 34 Years | 0 (0.0%) | 0 (0.0%) |
| 35 to 64 Years | 15 (10.4%) | 5 (5.1%) |
| 65 to 74 Years | 0 (0.0%) | 3 (3.8%) |
| 75 Years and over | 0 (0.0%) | 0 (0.0%) |
Disability Class: Cognitive Difficulty
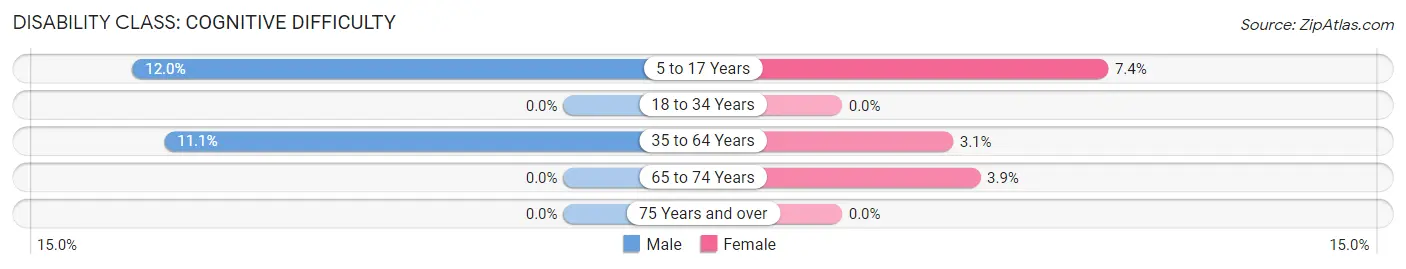
| Age Bracket | Male | Female |
| 5 to 17 Years | 9 (12.0%) | 2 (7.4%) |
| 18 to 34 Years | 0 (0.0%) | 0 (0.0%) |
| 35 to 64 Years | 16 (11.1%) | 3 (3.1%) |
| 65 to 74 Years | 0 (0.0%) | 3 (3.8%) |
| 75 Years and over | 0 (0.0%) | 0 (0.0%) |
Disability Class: Ambulatory Difficulty
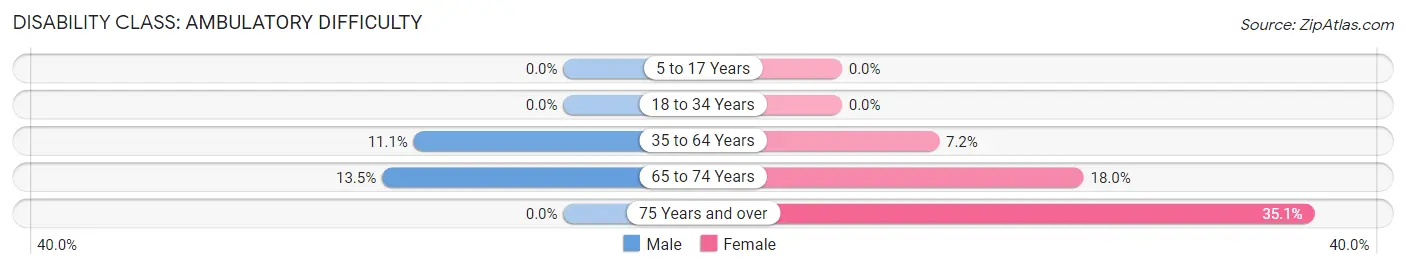
| Age Bracket | Male | Female |
| 5 to 17 Years | 0 (0.0%) | 0 (0.0%) |
| 18 to 34 Years | 0 (0.0%) | 0 (0.0%) |
| 35 to 64 Years | 16 (11.1%) | 7 (7.2%) |
| 65 to 74 Years | 7 (13.5%) | 14 (17.9%) |
| 75 Years and over | 0 (0.0%) | 20 (35.1%) |
Disability Class: Self-Care Difficulty
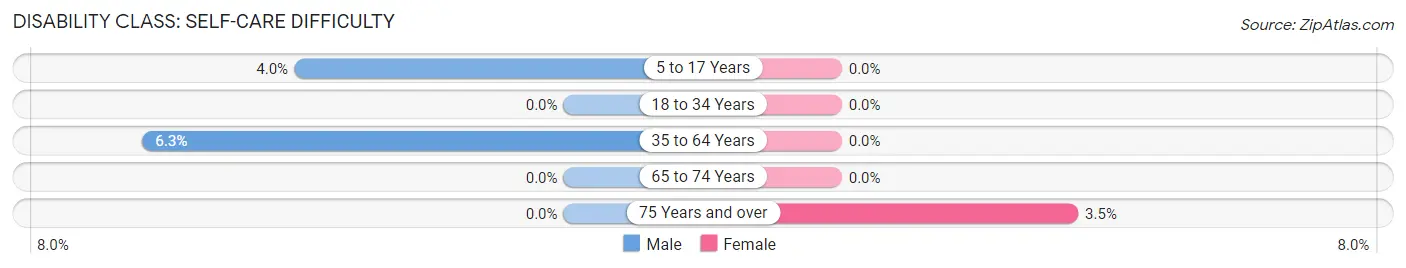
| Age Bracket | Male | Female |
| 5 to 17 Years | 3 (4.0%) | 0 (0.0%) |
| 18 to 34 Years | 0 (0.0%) | 0 (0.0%) |
| 35 to 64 Years | 9 (6.2%) | 0 (0.0%) |
| 65 to 74 Years | 0 (0.0%) | 0 (0.0%) |
| 75 Years and over | 0 (0.0%) | 2 (3.5%) |
Technology Access in Lincolnville
Computing Device Access in Lincolnville
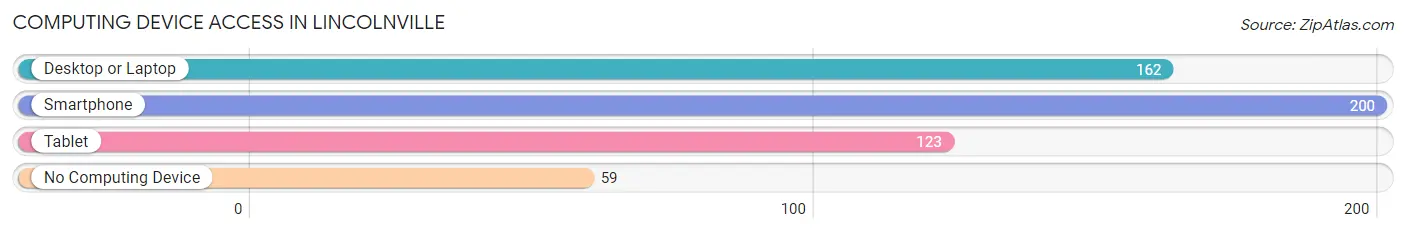
| Device Type | # Households | % Households |
| Desktop or Laptop | 162 | 60.0% |
| Smartphone | 200 | 74.1% |
| Tablet | 123 | 45.6% |
| No Computing Device | 59 | 21.8% |
| Total | 270 | 100.0% |
Internet Access in Lincolnville
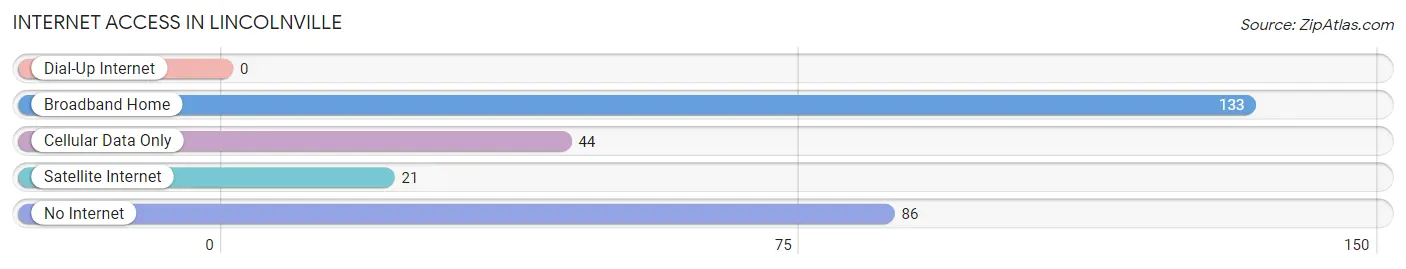
| Internet Type | # Households | % Households |
| Dial-Up Internet | 0 | 0.0% |
| Broadband Home | 133 | 49.3% |
| Cellular Data Only | 44 | 16.3% |
| Satellite Internet | 21 | 7.8% |
| No Internet | 86 | 31.9% |
| Total | 270 | 100.0% |
Lincolnville Summary
Lincolnville is a small town located in the Lowcountry region of South Carolina. It is situated in the northern part of Charleston County, approximately 20 miles north of the city of Charleston. The town is bordered by the Francis Marion National Forest to the north and the Intracoastal Waterway to the south. The population of Lincolnville was 1,845 at the 2010 census.
History
Lincolnville was founded in 1866 by freed slaves who had been emancipated during the Civil War. The town was named after President Abraham Lincoln, who had issued the Emancipation Proclamation in 1863. The town was incorporated in 1872 and was the first African-American municipality in South Carolina.
The town was a center of African-American culture and education in the late 19th and early 20th centuries. It was home to the Lincolnville Normal and Industrial School, which was founded in 1881 and was the first school in the state to offer a high school education to African-American students. The school was later renamed the Lincolnville High School and operated until the 1950s.
Geography
Lincolnville is located in the northern part of Charleston County, approximately 20 miles north of the city of Charleston. The town is bordered by the Francis Marion National Forest to the north and the Intracoastal Waterway to the south. The town is situated on the banks of the North Edisto River, which flows through the town and into the Atlantic Ocean.
The town has a total area of 1.3 square miles, all of which is land. The terrain is mostly flat, with some rolling hills in the northern part of the town. The climate is humid subtropical, with hot, humid summers and mild winters.
Economy
Lincolnville’s economy is largely based on agriculture and tourism. The town is home to several farms, which produce a variety of crops, including corn, soybeans, and cotton. The town is also home to several seafood processing plants, which process and package seafood for local restaurants and markets.
Tourism is an important part of the local economy. The town is home to several historic sites, including the Lincolnville Museum and the Lincolnville Historic District. The town is also home to several popular restaurants and shops, which attract visitors from all over the region.
Demographics
As of the 2010 census, the population of Lincolnville was 1,845. The racial makeup of the town was 79.3% African American, 17.2% White, 0.7% Asian, 0.3% Native American, and 2.5% from other races. The median household income was $30,938, and the median family income was $37,813.
The town is served by the Charleston County School District, which operates several schools in the area, including Lincolnville Elementary School, Lincolnville Middle School, and Lincolnville High School. The town is also home to several churches, including the Lincolnville AME Church, the Lincolnville Baptist Church, and the Lincolnville Presbyterian Church.
Common Questions
What is Per Capita Income in Lincolnville?
Per Capita income in Lincolnville is $26,355.
What is the Median Family Income in Lincolnville?
Median Family Income in Lincolnville is $67,361.
What is the Median Household income in Lincolnville?
Median Household Income in Lincolnville is $41,250.
What is Income or Wage Gap in Lincolnville?
Income or Wage Gap in Lincolnville is 9.3%.
Women in Lincolnville earn 90.7 cents for every dollar earned by a man.
What is Inequality or Gini Index in Lincolnville?
Inequality or Gini Index in Lincolnville is 0.52.
What is the Total Population of Lincolnville?
Total Population of Lincolnville is 641.
What is the Total Male Population of Lincolnville?
Total Male Population of Lincolnville is 350.
What is the Total Female Population of Lincolnville?
Total Female Population of Lincolnville is 291.
What is the Ratio of Males per 100 Females in Lincolnville?
There are 120.27 Males per 100 Females in Lincolnville.
What is the Ratio of Females per 100 Males in Lincolnville?
There are 83.14 Females per 100 Males in Lincolnville.
What is the Median Population Age in Lincolnville?
Median Population Age in Lincolnville is 49.9 Years.
What is the Average Family Size in Lincolnville
Average Family Size in Lincolnville is 3.3 People.
What is the Average Household Size in Lincolnville
Average Household Size in Lincolnville is 2.3 People.
How Large is the Labor Force in Lincolnville?
There are 247 People in the Labor Forcein in Lincolnville.
What is the Percentage of People in the Labor Force in Lincolnville?
42.8% of People are in the Labor Force in Lincolnville.
What is the Unemployment Rate in Lincolnville?
Unemployment Rate in Lincolnville is 10.1%.