Mount Charleston, NV Map & Demographics
Mount Charleston Map
Mount Charleston Overview
$67,810
PER CAPITA INCOME
$126,875
AVG FAMILY INCOME
$104,489
AVG HOUSEHOLD INCOME
78.1%
WAGE / INCOME GAP [ % ]
21.9¢/ $1
WAGE / INCOME GAP [ $ ]
0.47
INEQUALITY / GINI INDEX
474
TOTAL POPULATION
291
MALE POPULATION
183
FEMALE POPULATION
159.02
MALES / 100 FEMALES
62.89
FEMALES / 100 MALES
57.1
MEDIAN AGE
2.4
AVG FAMILY SIZE
2.2
AVG HOUSEHOLD SIZE
192
LABOR FORCE [ PEOPLE ]
46.6%
PERCENT IN LABOR FORCE
Income in Mount Charleston
Income Overview in Mount Charleston
Per Capita Income in Mount Charleston is $67,810, while median incomes of families and households are $126,875 and $104,489 respectively.
| Characteristic | Number | Measure |
| Per Capita Income | 474 | $67,810 |
| Median Family Income | 187 | $126,875 |
| Mean Family Income | 187 | $163,130 |
| Median Household Income | 217 | $104,489 |
| Mean Household Income | 217 | $147,177 |
| Income Deficit | 187 | $0 |
| Wage / Income Gap (%) | 474 | 78.06% |
| Wage / Income Gap ($) | 474 | 21.94¢ per $1 |
| Gini / Inequality Index | 474 | 0.47 |
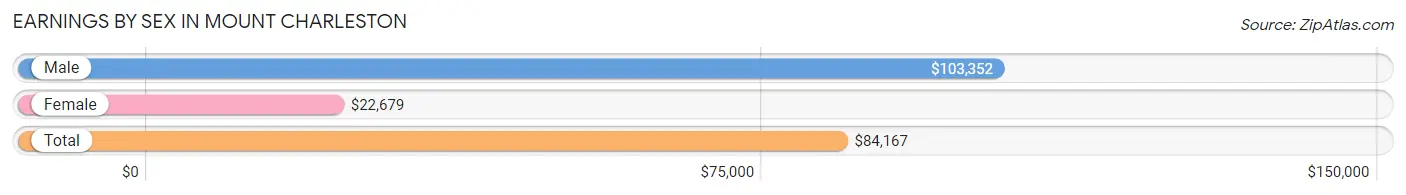
Earnings by Sex in Mount Charleston
Average Earnings in Mount Charleston are $84,167, $103,352 for men and $22,679 for women, a difference of 78.1%.
| Sex | Number | Average Earnings |
| Male | 141 (71.2%) | $103,352 |
| Female | 57 (28.8%) | $22,679 |
| Total | 198 (100.0%) | $84,167 |
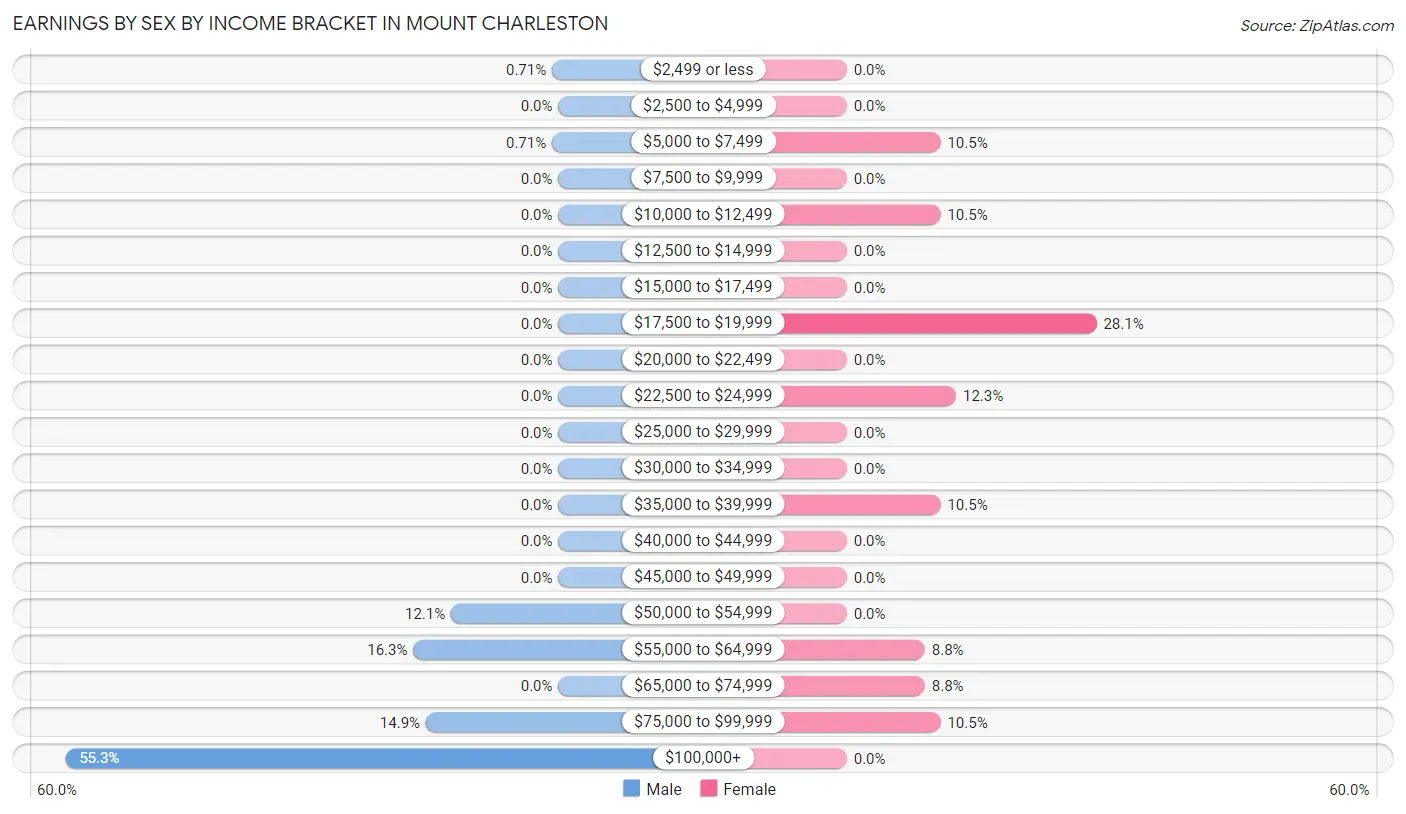
Earnings by Sex by Income Bracket in Mount Charleston
The most common earnings brackets in Mount Charleston are $100,000+ for men (78 | 55.3%) and $17,500 to $19,999 for women (16 | 28.1%).
| Income | Male | Female |
| $2,499 or less | 1 (0.7%) | 0 (0.0%) |
| $2,500 to $4,999 | 0 (0.0%) | 0 (0.0%) |
| $5,000 to $7,499 | 1 (0.7%) | 6 (10.5%) |
| $7,500 to $9,999 | 0 (0.0%) | 0 (0.0%) |
| $10,000 to $12,499 | 0 (0.0%) | 6 (10.5%) |
| $12,500 to $14,999 | 0 (0.0%) | 0 (0.0%) |
| $15,000 to $17,499 | 0 (0.0%) | 0 (0.0%) |
| $17,500 to $19,999 | 0 (0.0%) | 16 (28.1%) |
| $20,000 to $22,499 | 0 (0.0%) | 0 (0.0%) |
| $22,500 to $24,999 | 0 (0.0%) | 7 (12.3%) |
| $25,000 to $29,999 | 0 (0.0%) | 0 (0.0%) |
| $30,000 to $34,999 | 0 (0.0%) | 0 (0.0%) |
| $35,000 to $39,999 | 0 (0.0%) | 6 (10.5%) |
| $40,000 to $44,999 | 0 (0.0%) | 0 (0.0%) |
| $45,000 to $49,999 | 0 (0.0%) | 0 (0.0%) |
| $50,000 to $54,999 | 17 (12.1%) | 0 (0.0%) |
| $55,000 to $64,999 | 23 (16.3%) | 5 (8.8%) |
| $65,000 to $74,999 | 0 (0.0%) | 5 (8.8%) |
| $75,000 to $99,999 | 21 (14.9%) | 6 (10.5%) |
| $100,000+ | 78 (55.3%) | 0 (0.0%) |
| Total | 141 (100.0%) | 57 (100.0%) |
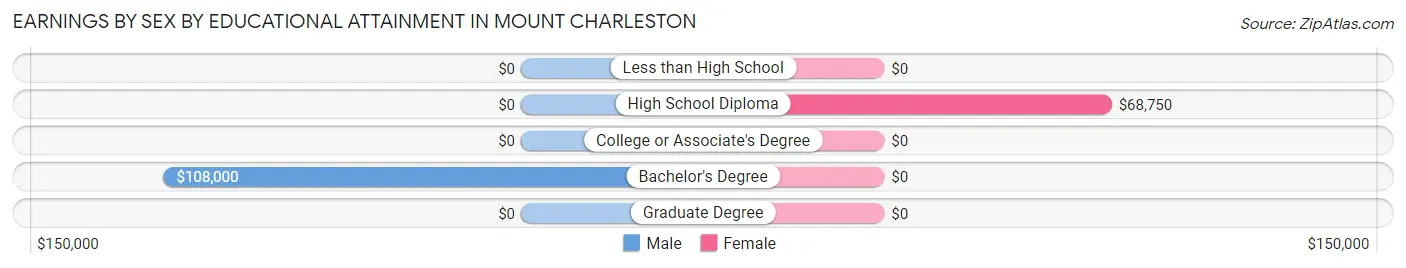
Earnings by Sex by Educational Attainment in Mount Charleston
Average earnings in Mount Charleston are $103,466 for men and $22,679 for women, a difference of 78.1%. Men with an educational attainment of bachelor's degree enjoy the highest average annual earnings of $108,000, while those with bachelor's degree education earn the least with $108,000. Women with an educational attainment of high school diploma earn the most with the average annual earnings of $68,750, while those with high school diploma education have the smallest earnings of $68,750.
| Educational Attainment | Male Income | Female Income |
| Less than High School | - | - |
| High School Diploma | - | - |
| College or Associate's Degree | - | - |
| Bachelor's Degree | $108,000 | $0 |
| Graduate Degree | - | - |
| Total | $103,466 | $22,679 |
Family Income in Mount Charleston
Family Income Brackets in Mount Charleston
According to the Mount Charleston family income data, there are 65 families falling into the $150,000 to $199,999 income range, which is the most common income bracket and makes up 34.8% of all families.
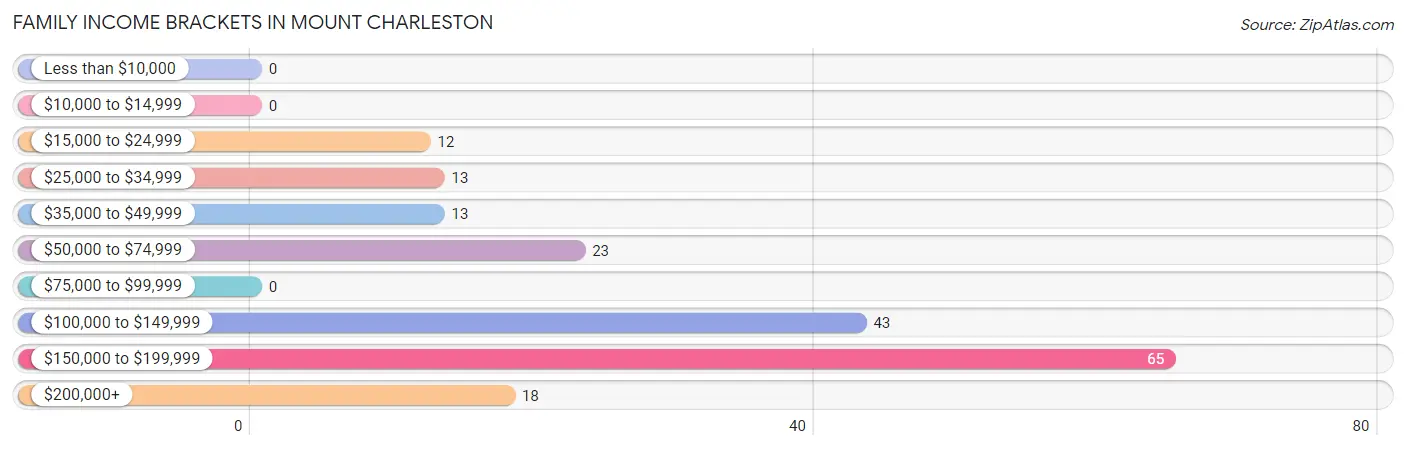
| Income Bracket | # Families | % Families |
| Less than $10,000 | 0 | 0.0% |
| $10,000 to $14,999 | 0 | 0.0% |
| $15,000 to $24,999 | 12 | 6.4% |
| $25,000 to $34,999 | 13 | 7.0% |
| $35,000 to $49,999 | 13 | 7.0% |
| $50,000 to $74,999 | 23 | 12.3% |
| $75,000 to $99,999 | 0 | 0.0% |
| $100,000 to $149,999 | 43 | 23.0% |
| $150,000 to $199,999 | 65 | 34.8% |
| $200,000+ | 18 | 9.6% |
Family Income by Famaliy Size in Mount Charleston
4-person families (19 | 10.2%) account for the highest median family income in Mount Charleston with $171,458 per family, while 2-person families (143 | 76.5%) have the highest median income of $52,188 per family member.
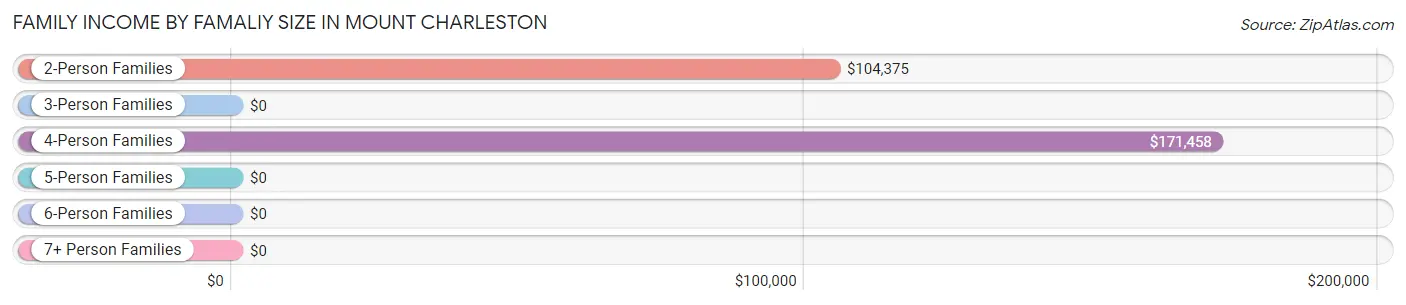
| Income Bracket | # Families | Median Income |
| 2-Person Families | 143 (76.5%) | $104,375 |
| 3-Person Families | 25 (13.4%) | $0 |
| 4-Person Families | 19 (10.2%) | $171,458 |
| 5-Person Families | 0 (0.0%) | $0 |
| 6-Person Families | 0 (0.0%) | $0 |
| 7+ Person Families | 0 (0.0%) | $0 |
| Total | 187 (100.0%) | $126,875 |
Family Income by Number of Earners in Mount Charleston
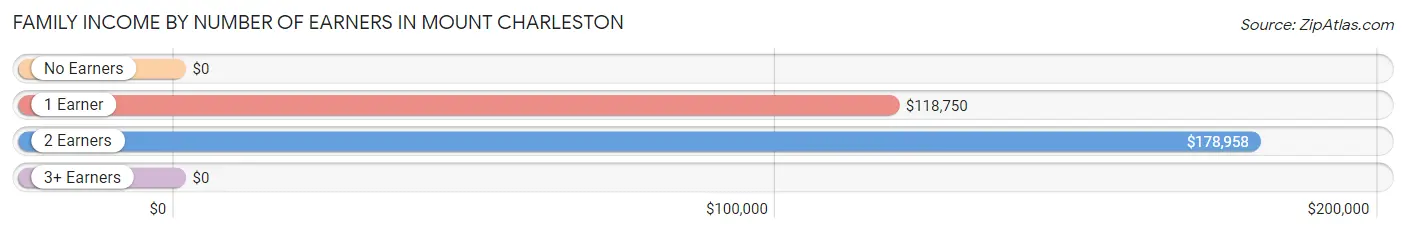
| Number of Earners | # Families | Median Income |
| No Earners | 38 (20.3%) | $0 |
| 1 Earner | 120 (64.2%) | $118,750 |
| 2 Earners | 29 (15.5%) | $178,958 |
| 3+ Earners | 0 (0.0%) | $0 |
| Total | 187 (100.0%) | $126,875 |
Household Income in Mount Charleston
Household Income Brackets in Mount Charleston
With 65 households falling in the category, the $150,000 to $199,999 income range is the most frequent in Mount Charleston, accounting for 29.9% of all households.
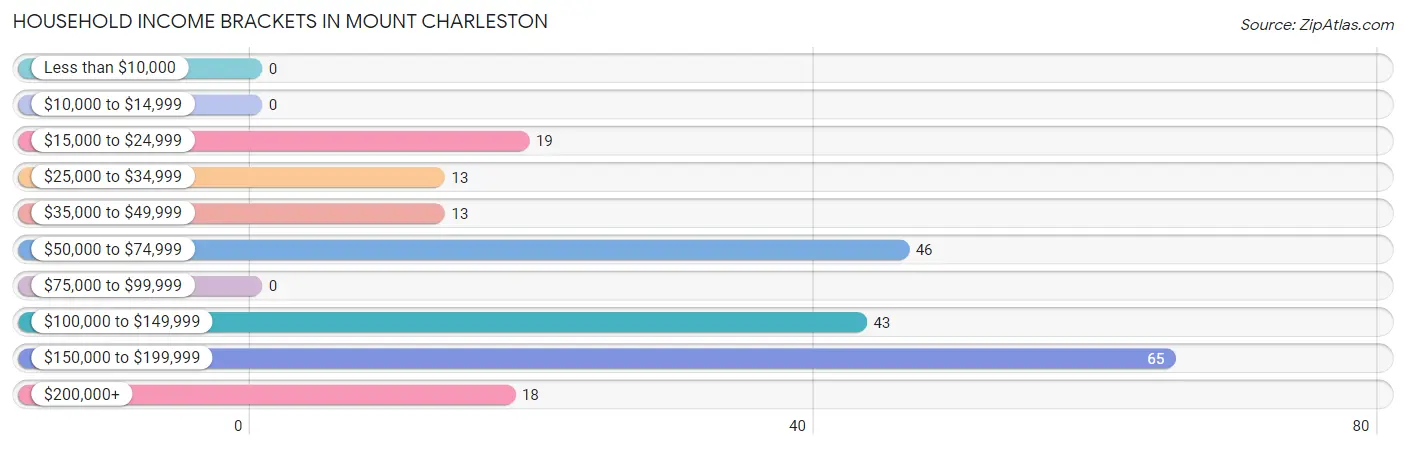
| Income Bracket | # Households | % Households |
| Less than $10,000 | 0 | 0.0% |
| $10,000 to $14,999 | 0 | 0.0% |
| $15,000 to $24,999 | 19 | 8.8% |
| $25,000 to $34,999 | 13 | 6.0% |
| $35,000 to $49,999 | 13 | 6.0% |
| $50,000 to $74,999 | 46 | 21.2% |
| $75,000 to $99,999 | 0 | 0.0% |
| $100,000 to $149,999 | 43 | 19.8% |
| $150,000 to $199,999 | 65 | 30.0% |
| $200,000+ | 18 | 8.3% |
Household Income by Householder Age in Mount Charleston
The median household income in Mount Charleston is $104,489, with the highest median household income of $103,693 found in the 45 to 64 years age bracket for the primary householder. A total of 101 households (46.5%) fall into this category.
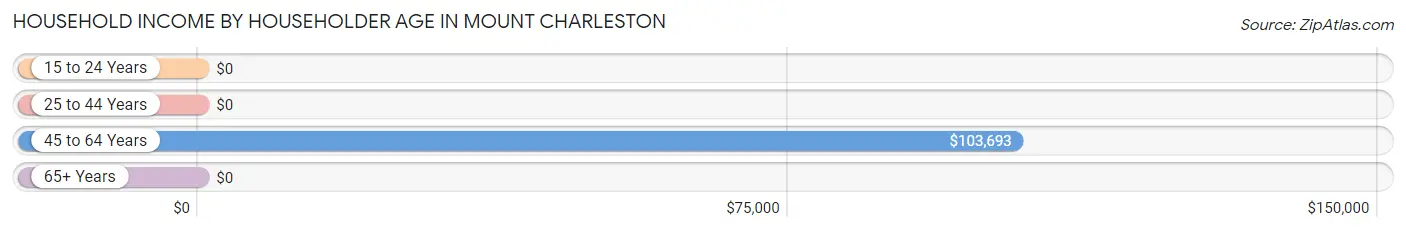
| Income Bracket | # Households | Median Income |
| 15 to 24 Years | 0 (0.0%) | $0 |
| 25 to 44 Years | 37 (17.1%) | $0 |
| 45 to 64 Years | 101 (46.5%) | $103,693 |
| 65+ Years | 79 (36.4%) | $0 |
| Total | 217 (100.0%) | $104,489 |
Poverty in Mount Charleston
Income Below Poverty by Sex and Age in Mount Charleston
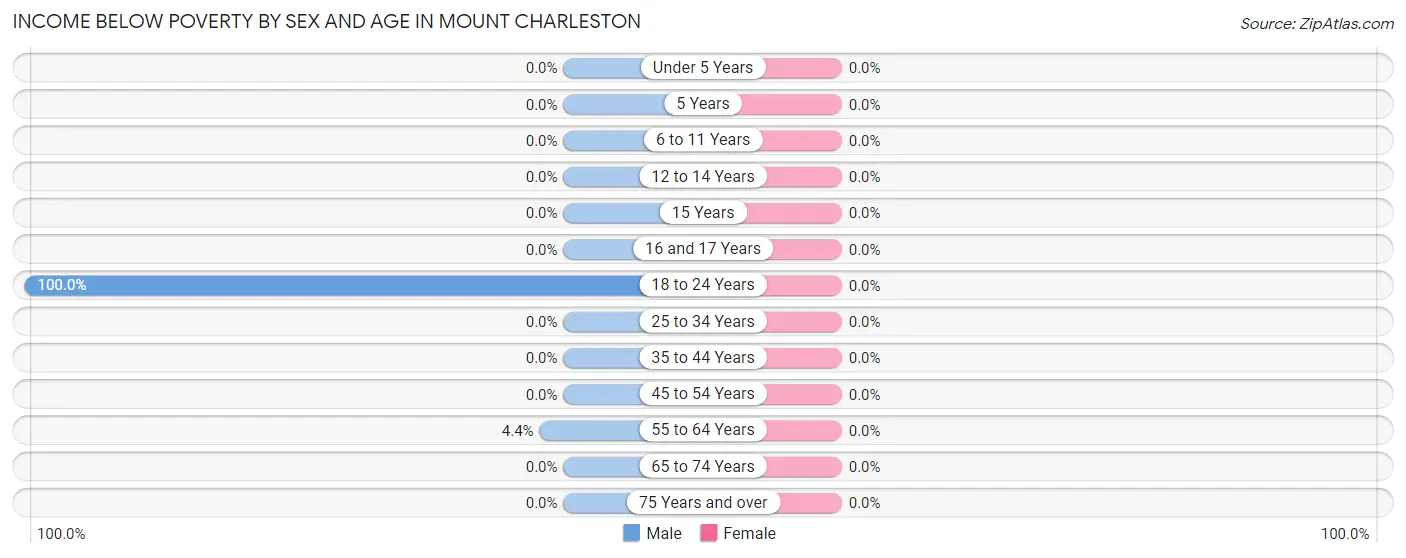
| Age Bracket | Male | Female |
| Under 5 Years | 0 (0.0%) | 0 (0.0%) |
| 5 Years | 0 (0.0%) | 0 (0.0%) |
| 6 to 11 Years | 0 (0.0%) | 0 (0.0%) |
| 12 to 14 Years | 0 (0.0%) | 0 (0.0%) |
| 15 Years | 0 (0.0%) | 0 (0.0%) |
| 16 and 17 Years | 0 (0.0%) | 0 (0.0%) |
| 18 to 24 Years | 2 (100.0%) | 0 (0.0%) |
| 25 to 34 Years | 0 (0.0%) | 0 (0.0%) |
| 35 to 44 Years | 0 (0.0%) | 0 (0.0%) |
| 45 to 54 Years | 0 (0.0%) | 0 (0.0%) |
| 55 to 64 Years | 2 (4.4%) | 0 (0.0%) |
| 65 to 74 Years | 0 (0.0%) | 0 (0.0%) |
| 75 Years and over | 0 (0.0%) | 0 (0.0%) |
| Total | 4 (1.4%) | 0 (0.0%) |
Income Above Poverty by Sex and Age in Mount Charleston
According to the poverty statistics in Mount Charleston, males aged 6 to 11 years and females aged under 5 years are the age groups that are most secure financially, with 100.0% of males and 100.0% of females in these age groups living above the poverty line.
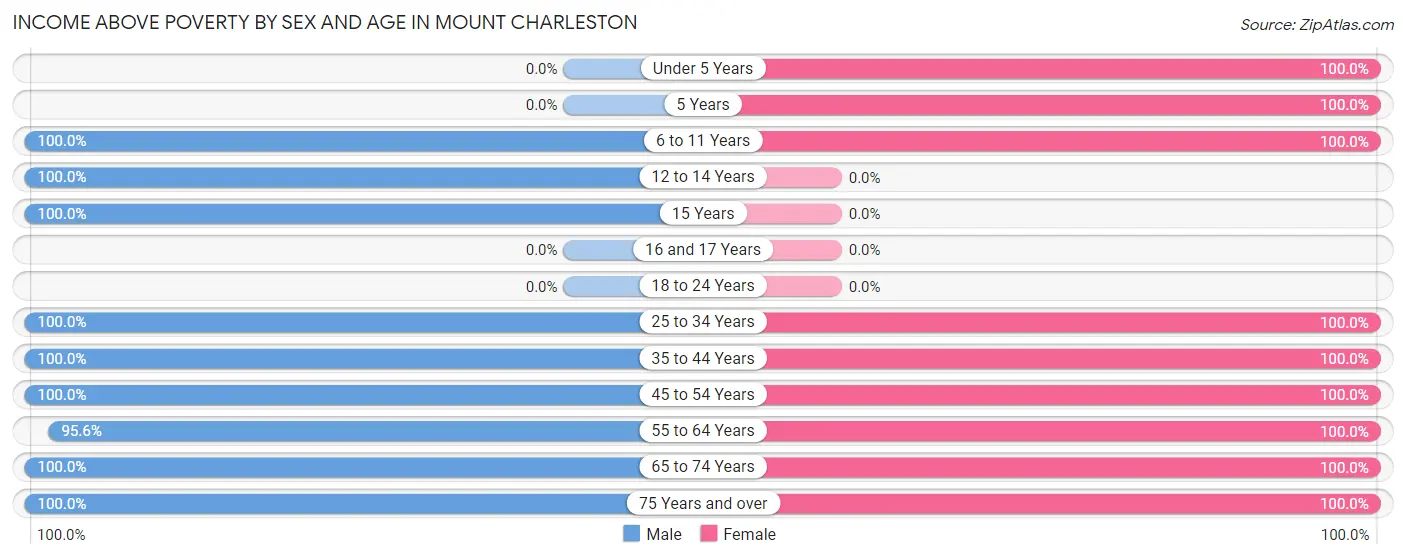
| Age Bracket | Male | Female |
| Under 5 Years | 0 (0.0%) | 6 (100.0%) |
| 5 Years | 0 (0.0%) | 6 (100.0%) |
| 6 to 11 Years | 6 (100.0%) | 6 (100.0%) |
| 12 to 14 Years | 14 (100.0%) | 0 (0.0%) |
| 15 Years | 24 (100.0%) | 0 (0.0%) |
| 16 and 17 Years | 0 (0.0%) | 0 (0.0%) |
| 18 to 24 Years | 0 (0.0%) | 0 (0.0%) |
| 25 to 34 Years | 11 (100.0%) | 6 (100.0%) |
| 35 to 44 Years | 13 (100.0%) | 37 (100.0%) |
| 45 to 54 Years | 78 (100.0%) | 24 (100.0%) |
| 55 to 64 Years | 43 (95.6%) | 53 (100.0%) |
| 65 to 74 Years | 73 (100.0%) | 34 (100.0%) |
| 75 Years and over | 25 (100.0%) | 11 (100.0%) |
| Total | 287 (98.6%) | 183 (100.0%) |
Income Below Poverty Among Married-Couple Families in Mount Charleston
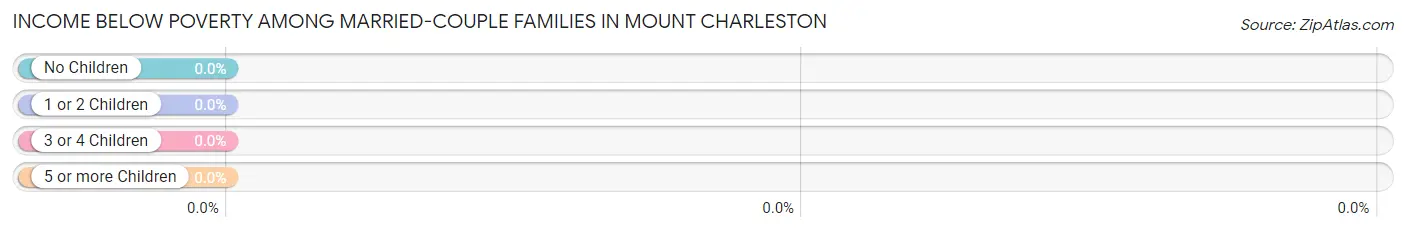
| Children | Above Poverty | Below Poverty |
| No Children | 111 (100.0%) | 0 (0.0%) |
| 1 or 2 Children | 38 (100.0%) | 0 (0.0%) |
| 3 or 4 Children | 0 (0.0%) | 0 (0.0%) |
| 5 or more Children | 0 (0.0%) | 0 (0.0%) |
| Total | 149 (100.0%) | 0 (0.0%) |
Income Below Poverty Among Single-Parent Households in Mount Charleston
| Children | Single Father | Single Mother |
| No Children | 0 (0.0%) | 0 (0.0%) |
| 1 or 2 Children | 0 (0.0%) | 0 (0.0%) |
| 3 or 4 Children | 0 (0.0%) | 0 (0.0%) |
| 5 or more Children | 0 (0.0%) | 0 (0.0%) |
| Total | 0 (0.0%) | 0 (0.0%) |
Income Below Poverty Among Married-Couple vs Single-Parent Households in Mount Charleston
| Children | Married-Couple Families | Single-Parent Households |
| No Children | 0 (0.0%) | 0 (0.0%) |
| 1 or 2 Children | 0 (0.0%) | 0 (0.0%) |
| 3 or 4 Children | 0 (0.0%) | 0 (0.0%) |
| 5 or more Children | 0 (0.0%) | 0 (0.0%) |
| Total | 0 (0.0%) | 0 (0.0%) |
Race in Mount Charleston
The most populous races in Mount Charleston are White / Caucasian (399 | 84.2%), Hispanic or Latino (47 | 9.9%), and Two or more Races (33 | 7.0%).
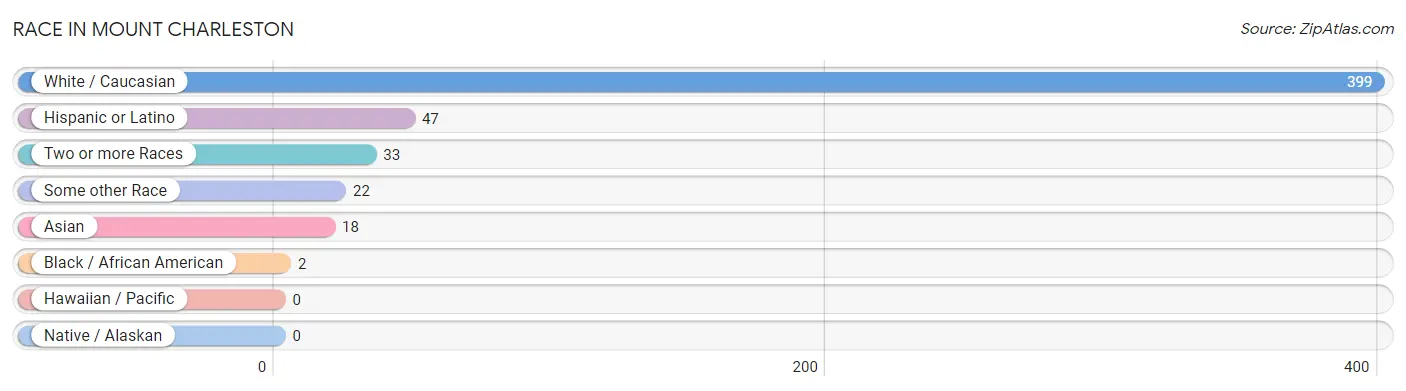
| Race | # Population | % Population |
| Asian | 18 | 3.8% |
| Black / African American | 2 | 0.4% |
| Hawaiian / Pacific | 0 | 0.0% |
| Hispanic or Latino | 47 | 9.9% |
| Native / Alaskan | 0 | 0.0% |
| White / Caucasian | 399 | 84.2% |
| Two or more Races | 33 | 7.0% |
| Some other Race | 22 | 4.6% |
| Total | 474 | 100.0% |
Ancestry in Mount Charleston
The most populous ancestries reported in Mount Charleston are Danish (62 | 13.1%), American (60 | 12.7%), Scotch-Irish (55 | 11.6%), Irish (54 | 11.4%), and German (42 | 8.9%), together accounting for 57.6% of all Mount Charleston residents.
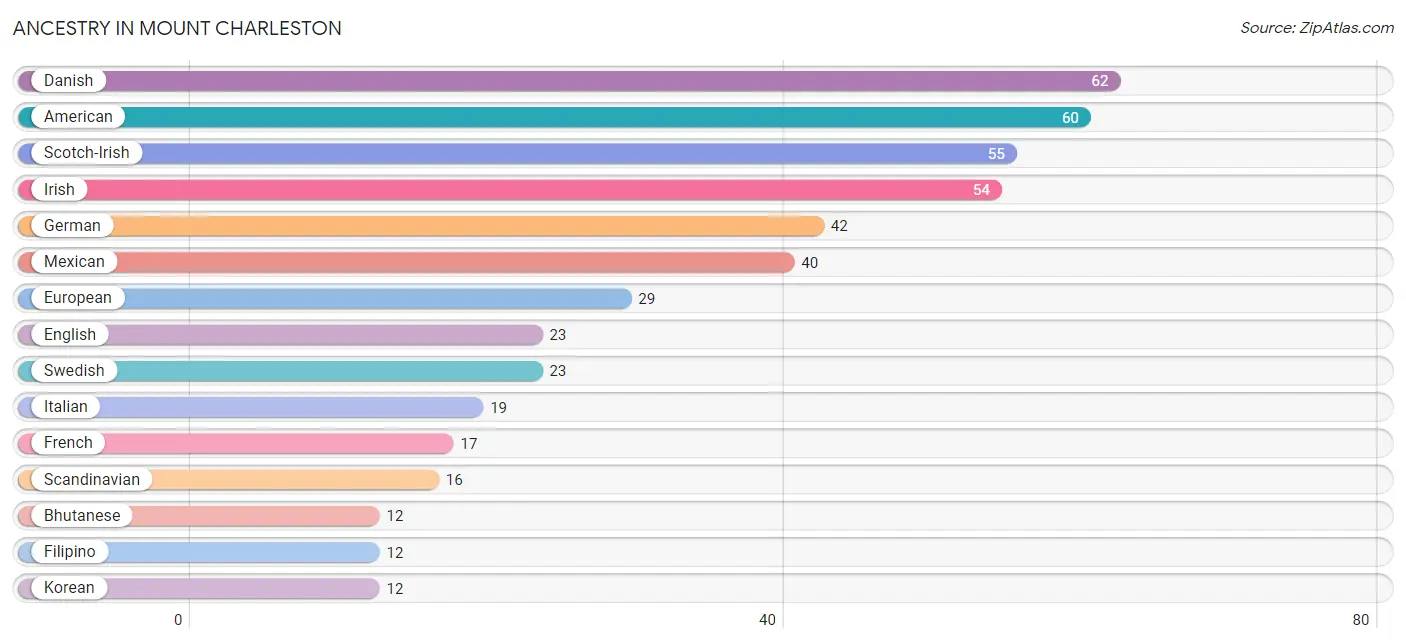
| Ancestry | # Population | % Population |
| American | 60 | 12.7% |
| Bhutanese | 12 | 2.5% |
| British | 1 | 0.2% |
| Canadian | 6 | 1.3% |
| Danish | 62 | 13.1% |
| English | 23 | 4.9% |
| European | 29 | 6.1% |
| Filipino | 12 | 2.5% |
| French | 17 | 3.6% |
| German | 42 | 8.9% |
| Indian (Asian) | 7 | 1.5% |
| Irish | 54 | 11.4% |
| Italian | 19 | 4.0% |
| Korean | 12 | 2.5% |
| Mexican | 40 | 8.4% |
| Native Hawaiian | 1 | 0.2% |
| Norwegian | 6 | 1.3% |
| Polish | 5 | 1.1% |
| Scandinavian | 16 | 3.4% |
| Scotch-Irish | 55 | 11.6% |
| Swedish | 23 | 4.9% | View All 21 Rows |
Immigrants in Mount Charleston
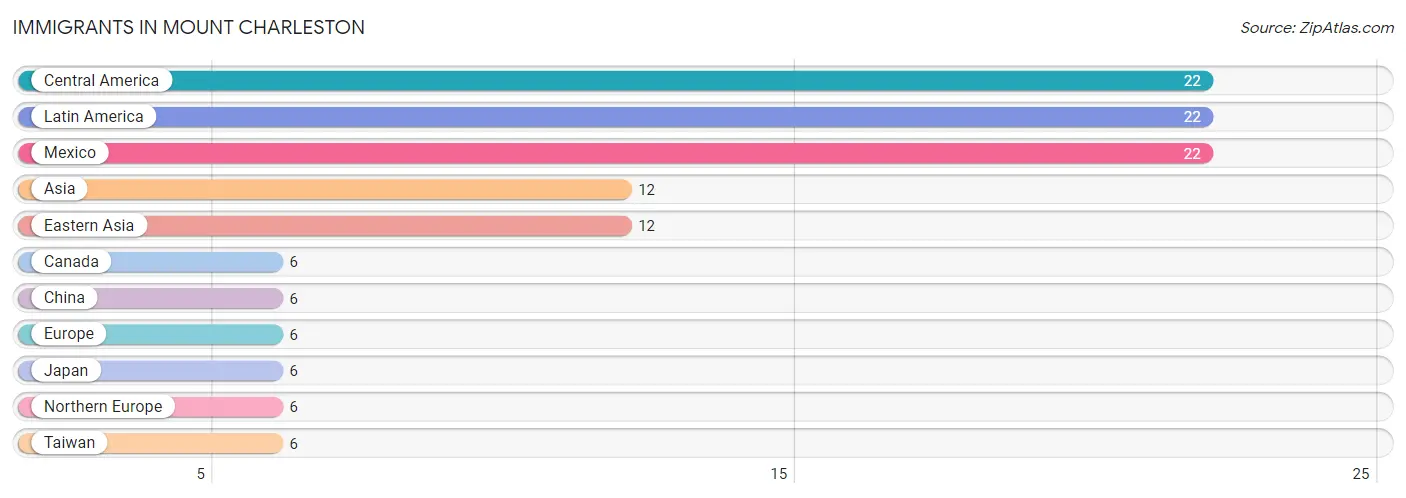
The most numerous immigrant groups reported in Mount Charleston came from Central America (22 | 4.6%), Latin America (22 | 4.6%), Mexico (22 | 4.6%), Asia (12 | 2.5%), and Eastern Asia (12 | 2.5%), together accounting for 19.0% of all Mount Charleston residents.
| Immigration Origin | # Population | % Population |
| Asia | 12 | 2.5% |
| Canada | 6 | 1.3% |
| Central America | 22 | 4.6% |
| China | 6 | 1.3% |
| Eastern Asia | 12 | 2.5% |
| Europe | 6 | 1.3% |
| Japan | 6 | 1.3% |
| Latin America | 22 | 4.6% |
| Mexico | 22 | 4.6% |
| Northern Europe | 6 | 1.3% |
| Taiwan | 6 | 1.3% | View All 11 Rows |
Sex and Age in Mount Charleston
Sex and Age in Mount Charleston
The most populous age groups in Mount Charleston are 50 to 54 Years (53 | 18.2%) for men and 55 to 59 Years (36 | 19.7%) for women.
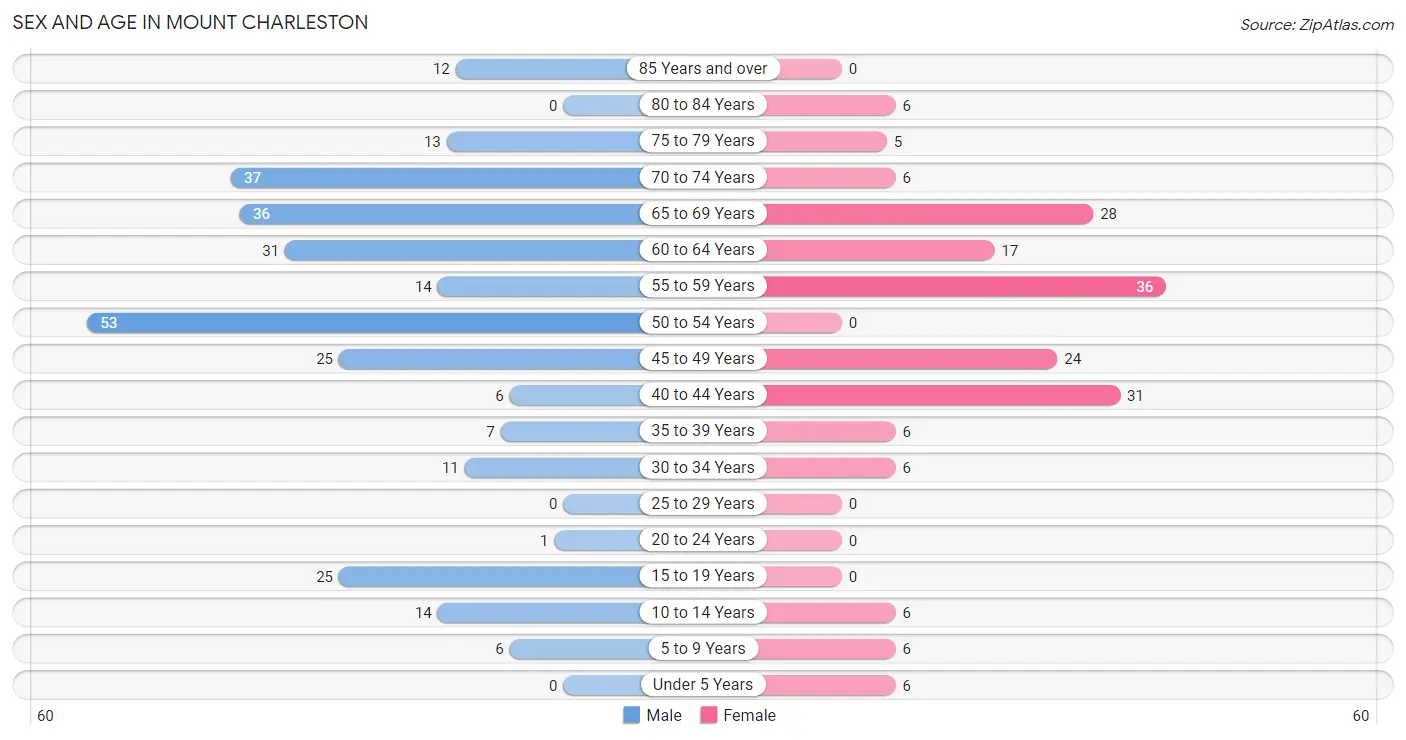
| Age Bracket | Male | Female |
| Under 5 Years | 0 (0.0%) | 6 (3.3%) |
| 5 to 9 Years | 6 (2.1%) | 6 (3.3%) |
| 10 to 14 Years | 14 (4.8%) | 6 (3.3%) |
| 15 to 19 Years | 25 (8.6%) | 0 (0.0%) |
| 20 to 24 Years | 1 (0.3%) | 0 (0.0%) |
| 25 to 29 Years | 0 (0.0%) | 0 (0.0%) |
| 30 to 34 Years | 11 (3.8%) | 6 (3.3%) |
| 35 to 39 Years | 7 (2.4%) | 6 (3.3%) |
| 40 to 44 Years | 6 (2.1%) | 31 (16.9%) |
| 45 to 49 Years | 25 (8.6%) | 24 (13.1%) |
| 50 to 54 Years | 53 (18.2%) | 0 (0.0%) |
| 55 to 59 Years | 14 (4.8%) | 36 (19.7%) |
| 60 to 64 Years | 31 (10.6%) | 17 (9.3%) |
| 65 to 69 Years | 36 (12.4%) | 28 (15.3%) |
| 70 to 74 Years | 37 (12.7%) | 6 (3.3%) |
| 75 to 79 Years | 13 (4.5%) | 5 (2.7%) |
| 80 to 84 Years | 0 (0.0%) | 6 (3.3%) |
| 85 Years and over | 12 (4.1%) | 0 (0.0%) |
| Total | 291 (100.0%) | 183 (100.0%) |
Families and Households in Mount Charleston
Median Family Size in Mount Charleston
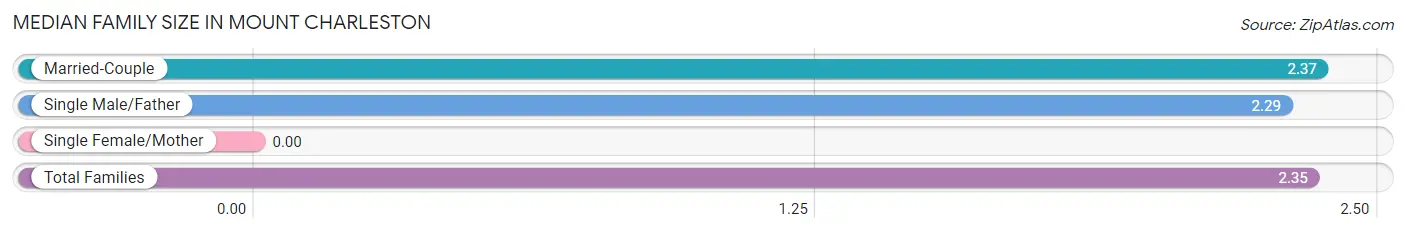
| Family Type | # Families | Family Size |
| Married-Couple | 149 (79.7%) | 2.37 |
| Single Male/Father | 38 (20.3%) | 2.29 |
| Single Female/Mother | 0 (0.0%) | - |
| Total Families | 187 (100.0%) | 2.35 |
Median Household Size in Mount Charleston
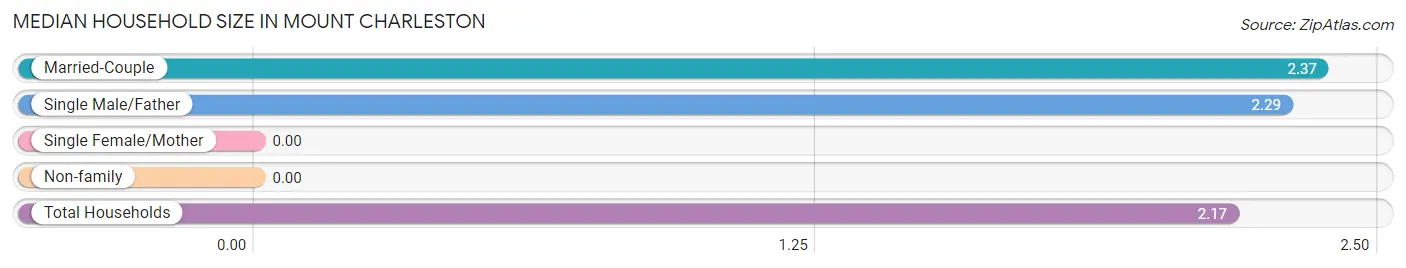
| Household Type | # Households | Household Size |
| Married-Couple | 149 (68.7%) | 2.37 |
| Single Male/Father | 38 (17.5%) | 2.29 |
| Single Female/Mother | 0 (0.0%) | - |
| Non-family | 30 (13.8%) | - |
| Total Households | 217 (100.0%) | 2.17 |
Household Size by Marriage Status in Mount Charleston
Out of a total of 217 households in Mount Charleston, 187 (86.2%) are family households, while 30 (13.8%) are nonfamily households. The most numerous type of family households are 2-person households, comprising 143, and the most common type of nonfamily households are 1-person households, comprising 30.
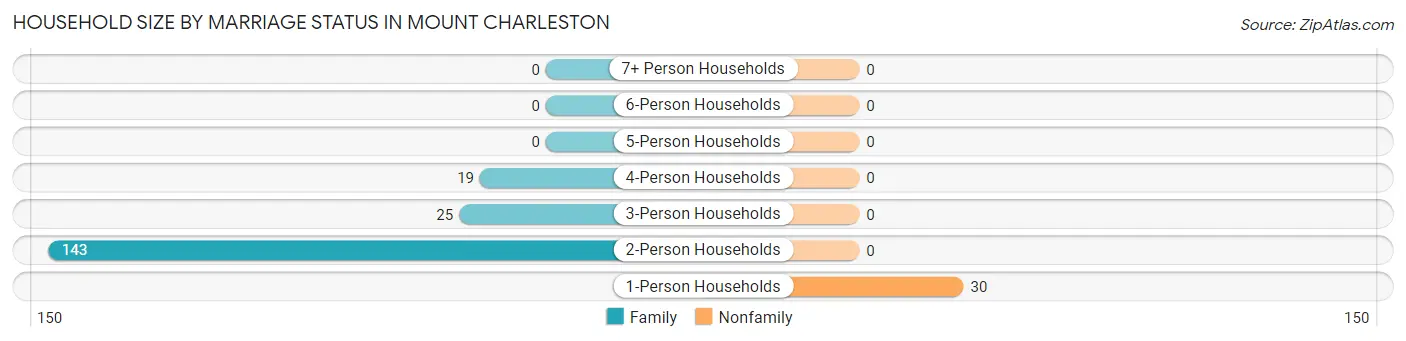
| Household Size | Family Households | Nonfamily Households |
| 1-Person Households | - | 30 (13.8%) |
| 2-Person Households | 143 (65.9%) | 0 (0.0%) |
| 3-Person Households | 25 (11.5%) | 0 (0.0%) |
| 4-Person Households | 19 (8.8%) | 0 (0.0%) |
| 5-Person Households | 0 (0.0%) | 0 (0.0%) |
| 6-Person Households | 0 (0.0%) | 0 (0.0%) |
| 7+ Person Households | 0 (0.0%) | 0 (0.0%) |
| Total | 187 (86.2%) | 30 (13.8%) |
Female Fertility in Mount Charleston
Fertility by Age in Mount Charleston
Average fertility rate in Mount Charleston is 104.0 births per 1,000 women. Women in the age bracket of 35 to 50 years have the highest fertility rate with 115.0 births per 1,000 women. Women in the age bracket of 35 to 50 years acount for 100.0% of all women with births.
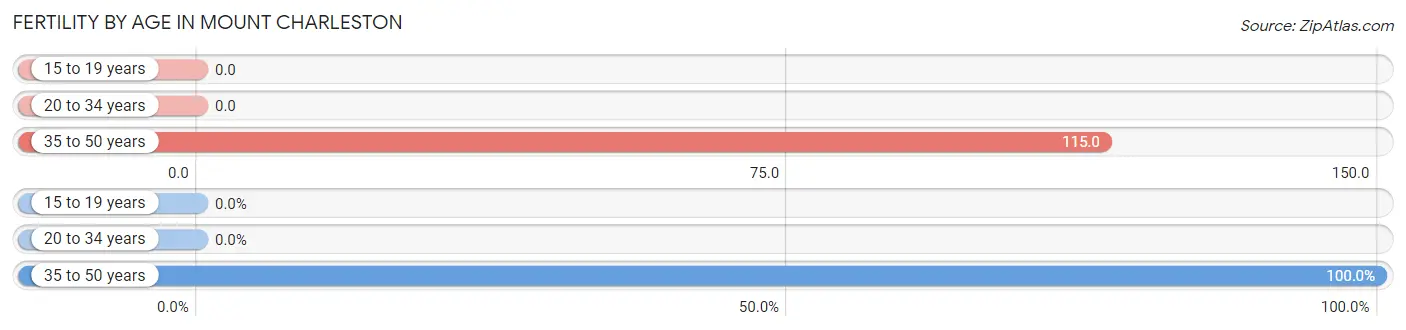
| Age Bracket | Women with Births | Births / 1,000 Women |
| 15 to 19 years | 0 (0.0%) | 0.0 |
| 20 to 34 years | 0 (0.0%) | 0.0 |
| 35 to 50 years | 7 (100.0%) | 115.0 |
| Total | 7 (100.0%) | 104.0 |
Fertility by Age by Marriage Status in Mount Charleston
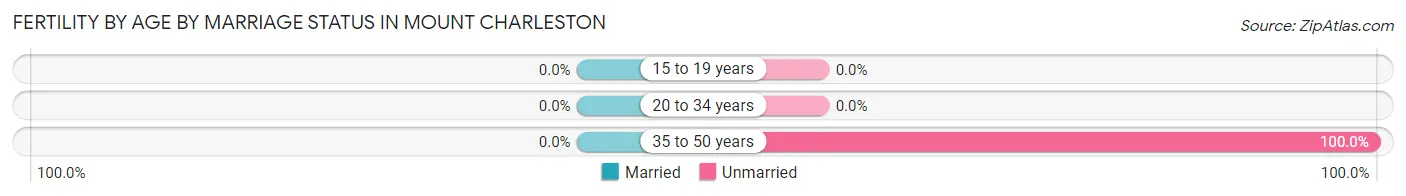
| Age Bracket | Married | Unmarried |
| 15 to 19 years | 0 (0.0%) | 0 (0.0%) |
| 20 to 34 years | 0 (0.0%) | 0 (0.0%) |
| 35 to 50 years | 0 (0.0%) | 7 (100.0%) |
| Total | 0 (0.0%) | 7 (100.0%) |
Fertility by Education in Mount Charleston
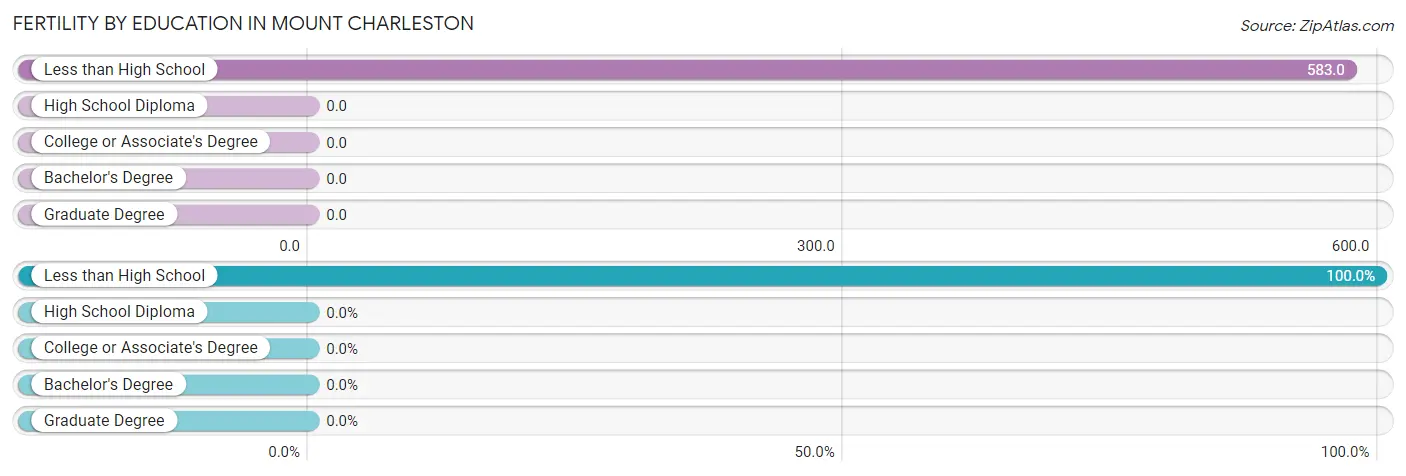
| Educational Attainment | Women with Births | Births / 1,000 Women |
| Less than High School | 7 (100.0%) | 583.0 |
| High School Diploma | 0 (0.0%) | 0.0 |
| College or Associate's Degree | 0 (0.0%) | 0.0 |
| Bachelor's Degree | 0 (0.0%) | 0.0 |
| Graduate Degree | 0 (0.0%) | 0.0 |
| Total | 7 (100.0%) | 104.0 |
Fertility by Education by Marriage Status in Mount Charleston
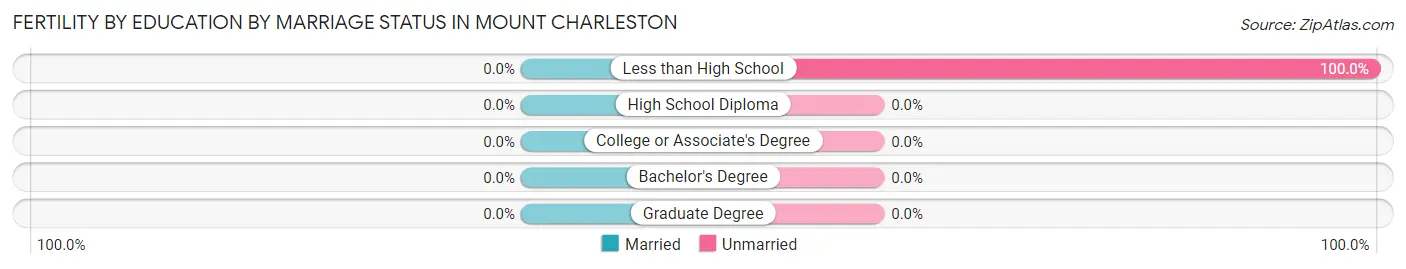
| Educational Attainment | Married | Unmarried |
| Less than High School | 0 (0.0%) | 7 (100.0%) |
| High School Diploma | 0 (0.0%) | 0 (0.0%) |
| College or Associate's Degree | 0 (0.0%) | 0 (0.0%) |
| Bachelor's Degree | 0 (0.0%) | 0 (0.0%) |
| Graduate Degree | 0 (0.0%) | 0 (0.0%) |
| Total | 0 (0.0%) | 7 (100.0%) |
Employment Characteristics in Mount Charleston
Employment by Class of Employer in Mount Charleston
Among the 192 employed individuals in Mount Charleston, private company employees (85 | 44.3%), local government employees (36 | 18.8%), and federal government employees (19 | 9.9%) make up the most common classes of employment.
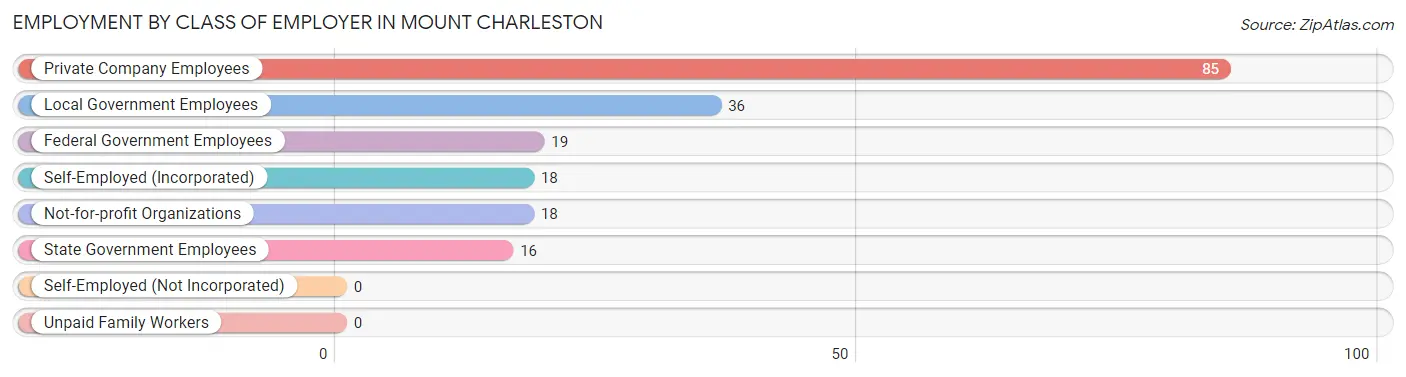
| Employer Class | # Employees | % Employees |
| Private Company Employees | 85 | 44.3% |
| Self-Employed (Incorporated) | 18 | 9.4% |
| Self-Employed (Not Incorporated) | 0 | 0.0% |
| Not-for-profit Organizations | 18 | 9.4% |
| Local Government Employees | 36 | 18.8% |
| State Government Employees | 16 | 8.3% |
| Federal Government Employees | 19 | 9.9% |
| Unpaid Family Workers | 0 | 0.0% |
| Total | 192 | 100.0% |
Employment Status by Age in Mount Charleston
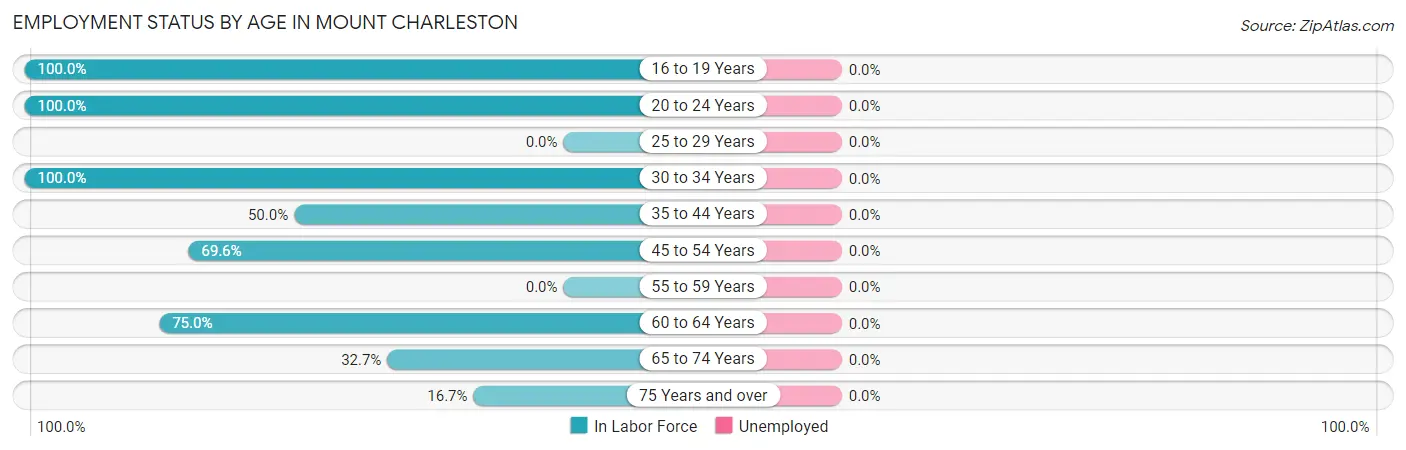
| Age Bracket | In Labor Force | Unemployed |
| 16 to 19 Years | 1 (100.0%) | 0 (0.0%) |
| 20 to 24 Years | 1 (100.0%) | 0 (0.0%) |
| 25 to 29 Years | 0 (0.0%) | 0 (0.0%) |
| 30 to 34 Years | 17 (100.0%) | 0 (0.0%) |
| 35 to 44 Years | 25 (50.0%) | 0 (0.0%) |
| 45 to 54 Years | 71 (69.6%) | 0 (0.0%) |
| 55 to 59 Years | 0 (0.0%) | 0 (0.0%) |
| 60 to 64 Years | 36 (75.0%) | 0 (0.0%) |
| 65 to 74 Years | 35 (32.7%) | 0 (0.0%) |
| 75 Years and over | 6 (16.7%) | 0 (0.0%) |
| Total | 192 (46.6%) | 0 (0.0%) |
Employment Status by Educational Attainment in Mount Charleston
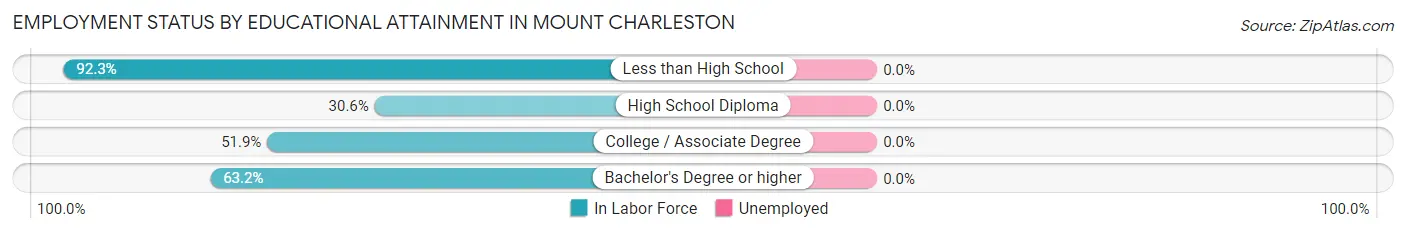
| Educational Attainment | In Labor Force | Unemployed |
| Less than High School | 12 (92.3%) | 0 (0.0%) |
| High School Diploma | 11 (30.6%) | 0 (0.0%) |
| College / Associate Degree | 54 (51.9%) | 0 (0.0%) |
| Bachelor's Degree or higher | 72 (63.2%) | 0 (0.0%) |
| Total | 149 (55.8%) | 0 (0.0%) |
Employment Occupations by Sex in Mount Charleston
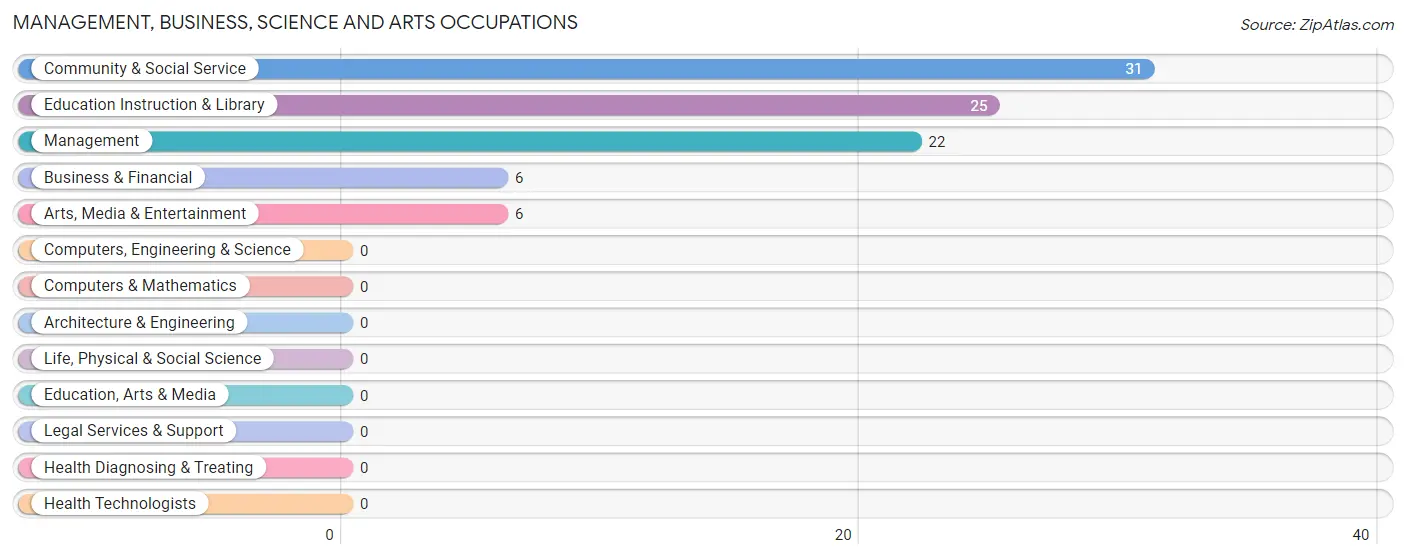
Management, Business, Science and Arts Occupations
The most common Management, Business, Science and Arts occupations in Mount Charleston are Community & Social Service (31 | 16.8%), Education Instruction & Library (25 | 13.5%), Management (22 | 11.9%), Business & Financial (6 | 3.2%), and Arts, Media & Entertainment (6 | 3.2%).
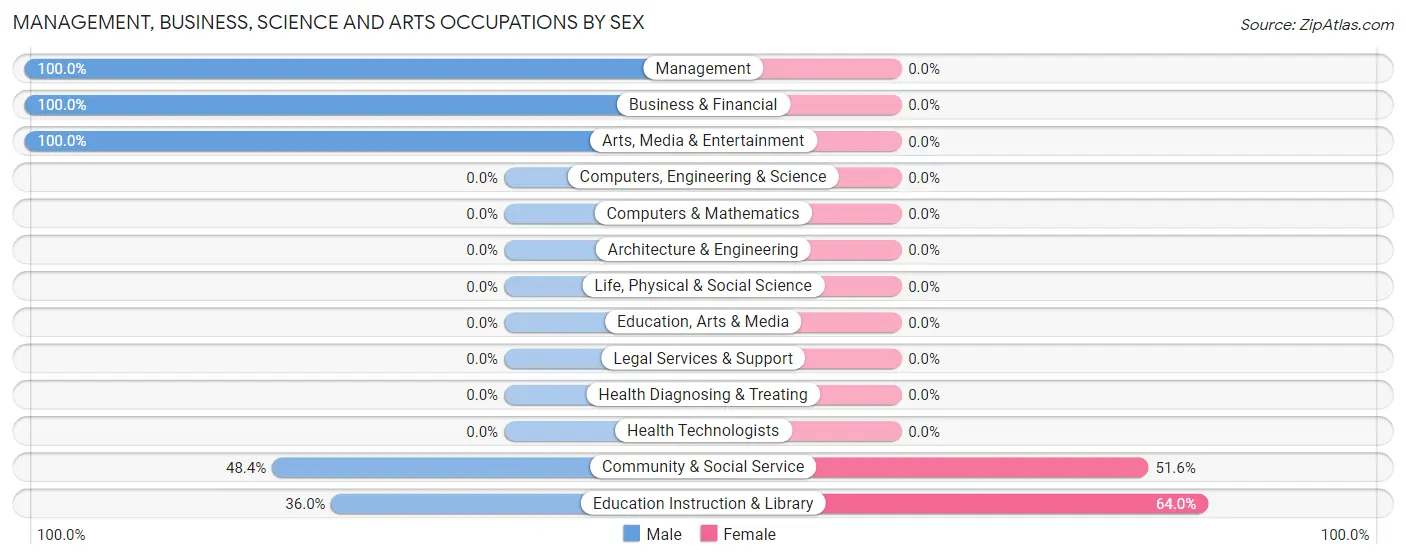
Management, Business, Science and Arts Occupations by Sex
Within the Management, Business, Science and Arts occupations in Mount Charleston, the most male-oriented occupations are Management (100.0%), Business & Financial (100.0%), and Arts, Media & Entertainment (100.0%), while the most female-oriented occupations are Education Instruction & Library (64.0%), and Community & Social Service (51.6%).
| Occupation | Male | Female |
| Management | 22 (100.0%) | 0 (0.0%) |
| Business & Financial | 6 (100.0%) | 0 (0.0%) |
| Computers, Engineering & Science | 0 (0.0%) | 0 (0.0%) |
| Computers & Mathematics | 0 (0.0%) | 0 (0.0%) |
| Architecture & Engineering | 0 (0.0%) | 0 (0.0%) |
| Life, Physical & Social Science | 0 (0.0%) | 0 (0.0%) |
| Community & Social Service | 15 (48.4%) | 16 (51.6%) |
| Education, Arts & Media | 0 (0.0%) | 0 (0.0%) |
| Legal Services & Support | 0 (0.0%) | 0 (0.0%) |
| Education Instruction & Library | 9 (36.0%) | 16 (64.0%) |
| Arts, Media & Entertainment | 6 (100.0%) | 0 (0.0%) |
| Health Diagnosing & Treating | 0 (0.0%) | 0 (0.0%) |
| Health Technologists | 0 (0.0%) | 0 (0.0%) |
| Total (Category) | 43 (72.9%) | 16 (27.1%) |
| Total (Overall) | 134 (72.4%) | 51 (27.6%) |
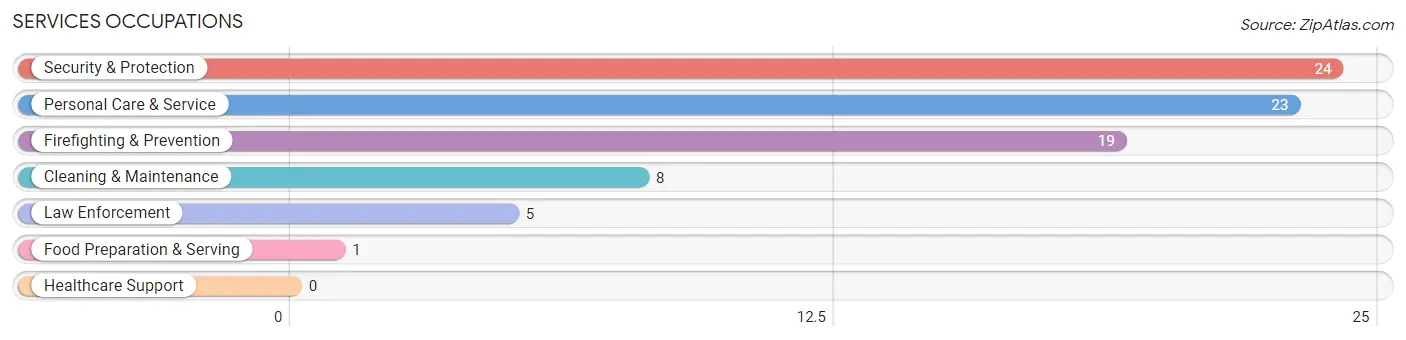
Services Occupations
The most common Services occupations in Mount Charleston are Security & Protection (24 | 13.0%), Personal Care & Service (23 | 12.4%), Firefighting & Prevention (19 | 10.3%), Cleaning & Maintenance (8 | 4.3%), and Law Enforcement (5 | 2.7%).
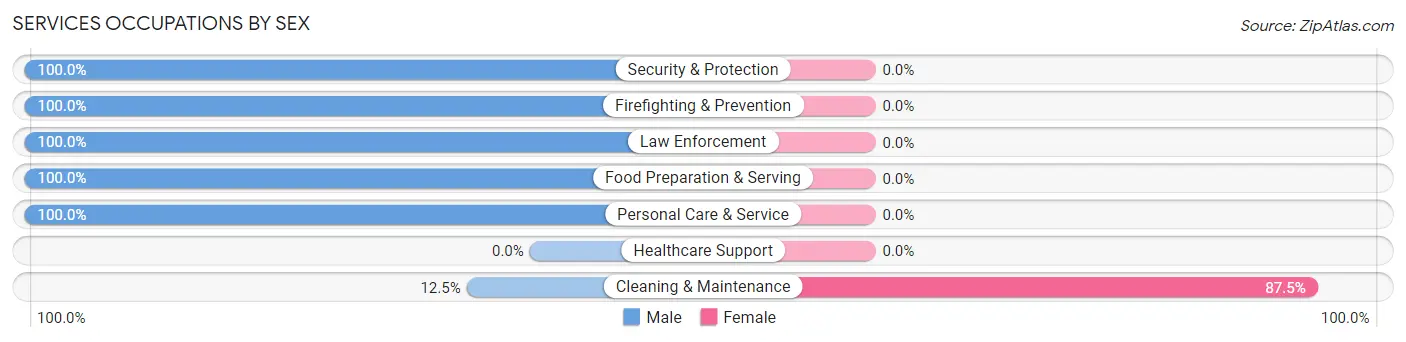
Services Occupations by Sex
| Occupation | Male | Female |
| Healthcare Support | 0 (0.0%) | 0 (0.0%) |
| Security & Protection | 24 (100.0%) | 0 (0.0%) |
| Firefighting & Prevention | 19 (100.0%) | 0 (0.0%) |
| Law Enforcement | 5 (100.0%) | 0 (0.0%) |
| Food Preparation & Serving | 1 (100.0%) | 0 (0.0%) |
| Cleaning & Maintenance | 1 (12.5%) | 7 (87.5%) |
| Personal Care & Service | 23 (100.0%) | 0 (0.0%) |
| Total (Category) | 49 (87.5%) | 7 (12.5%) |
| Total (Overall) | 134 (72.4%) | 51 (27.6%) |
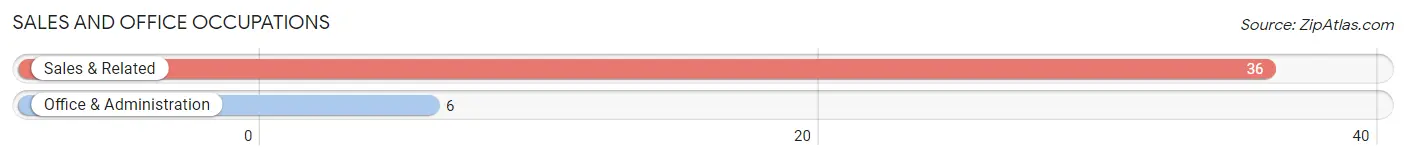
Sales and Office Occupations
The most common Sales and Office occupations in Mount Charleston are Sales & Related (36 | 19.5%), and Office & Administration (6 | 3.2%).
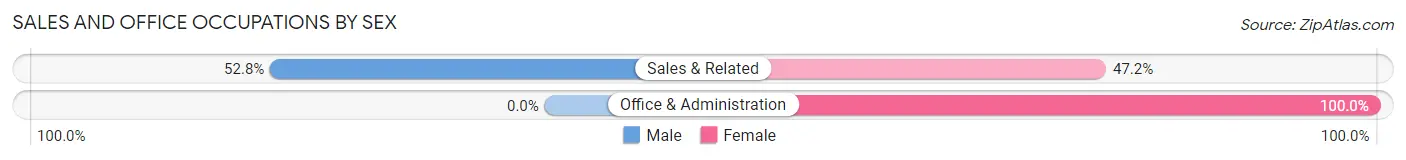
Sales and Office Occupations by Sex
| Occupation | Male | Female |
| Sales & Related | 19 (52.8%) | 17 (47.2%) |
| Office & Administration | 0 (0.0%) | 6 (100.0%) |
| Total (Category) | 19 (45.2%) | 23 (54.8%) |
| Total (Overall) | 134 (72.4%) | 51 (27.6%) |
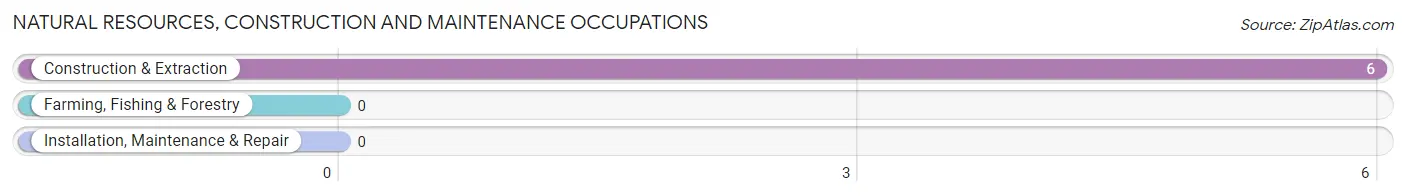
Natural Resources, Construction and Maintenance Occupations
The most common Natural Resources, Construction and Maintenance occupations in Mount Charleston are , and Construction & Extraction (6 | 3.2%).
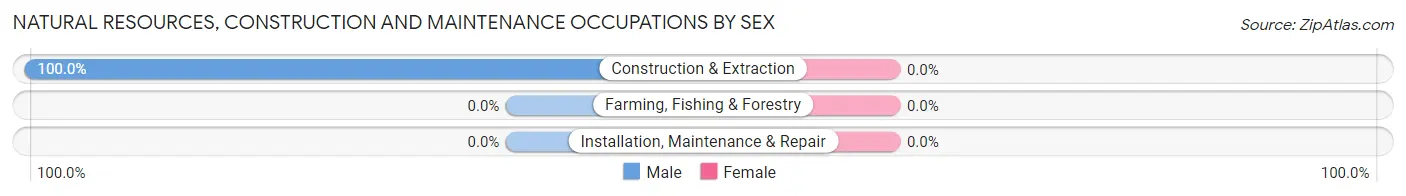
Natural Resources, Construction and Maintenance Occupations by Sex
| Occupation | Male | Female |
| Farming, Fishing & Forestry | 0 (0.0%) | 0 (0.0%) |
| Construction & Extraction | 6 (100.0%) | 0 (0.0%) |
| Installation, Maintenance & Repair | 0 (0.0%) | 0 (0.0%) |
| Total (Category) | 6 (100.0%) | 0 (0.0%) |
| Total (Overall) | 134 (72.4%) | 51 (27.6%) |
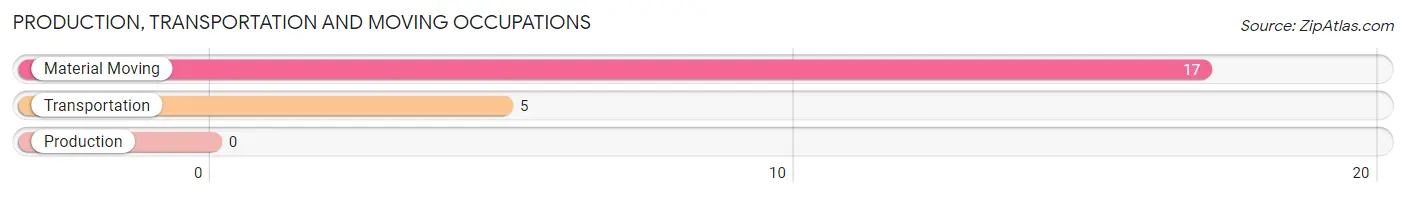
Production, Transportation and Moving Occupations
The most common Production, Transportation and Moving occupations in Mount Charleston are Material Moving (17 | 9.2%), and Transportation (5 | 2.7%).
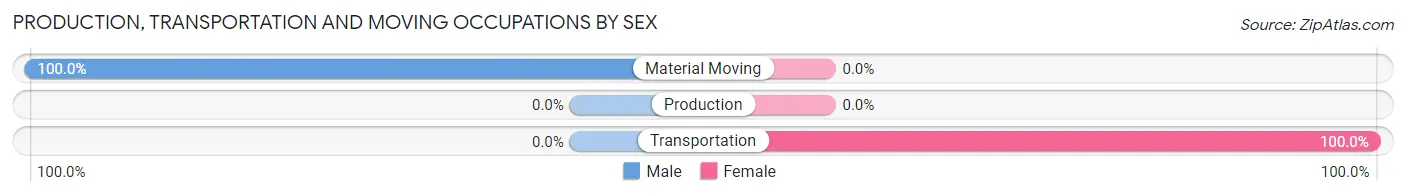
Production, Transportation and Moving Occupations by Sex
| Occupation | Male | Female |
| Production | 0 (0.0%) | 0 (0.0%) |
| Transportation | 0 (0.0%) | 5 (100.0%) |
| Material Moving | 17 (100.0%) | 0 (0.0%) |
| Total (Category) | 17 (77.3%) | 5 (22.7%) |
| Total (Overall) | 134 (72.4%) | 51 (27.6%) |
Employment Industries by Sex in Mount Charleston
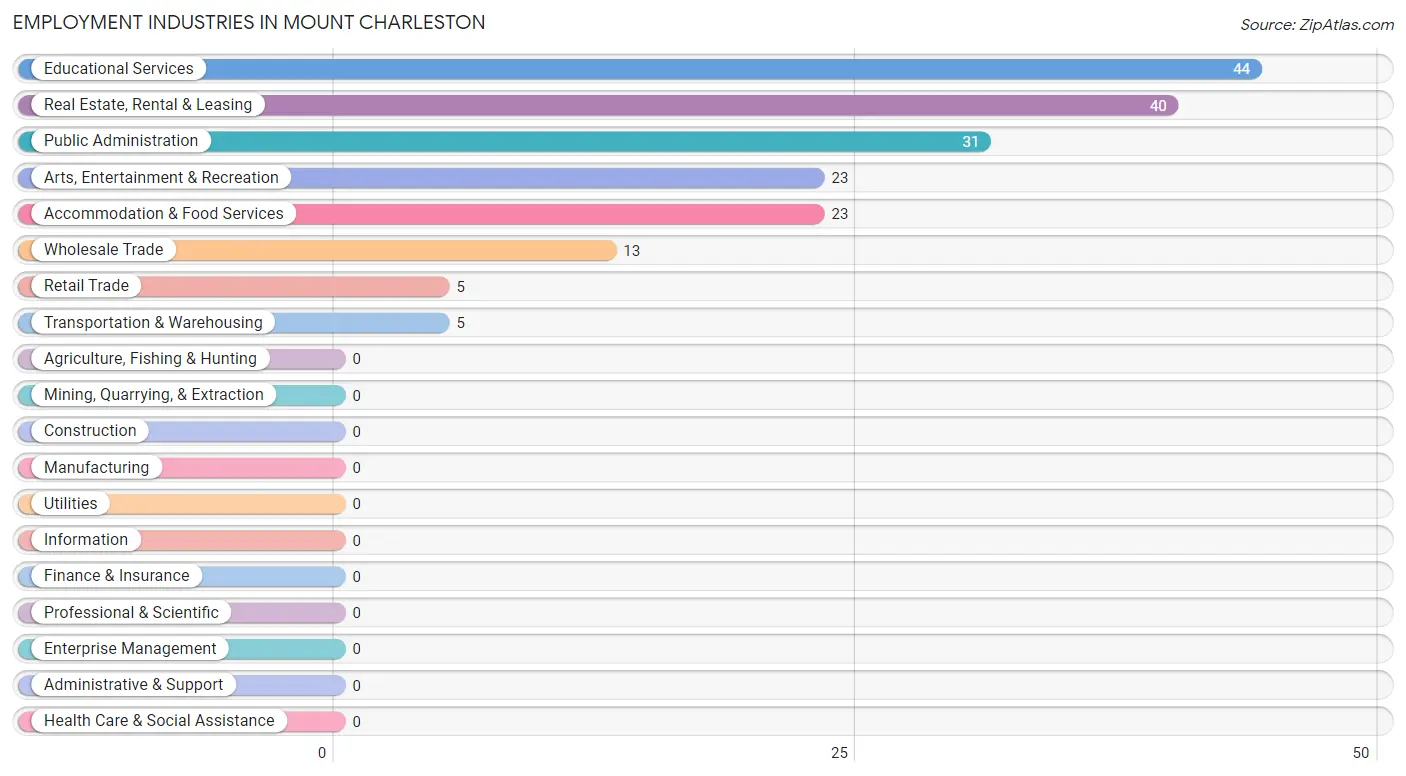
Employment Industries in Mount Charleston
The major employment industries in Mount Charleston include Educational Services (44 | 23.8%), Real Estate, Rental & Leasing (40 | 21.6%), Public Administration (31 | 16.8%), Arts, Entertainment & Recreation (23 | 12.4%), and Accommodation & Food Services (23 | 12.4%).
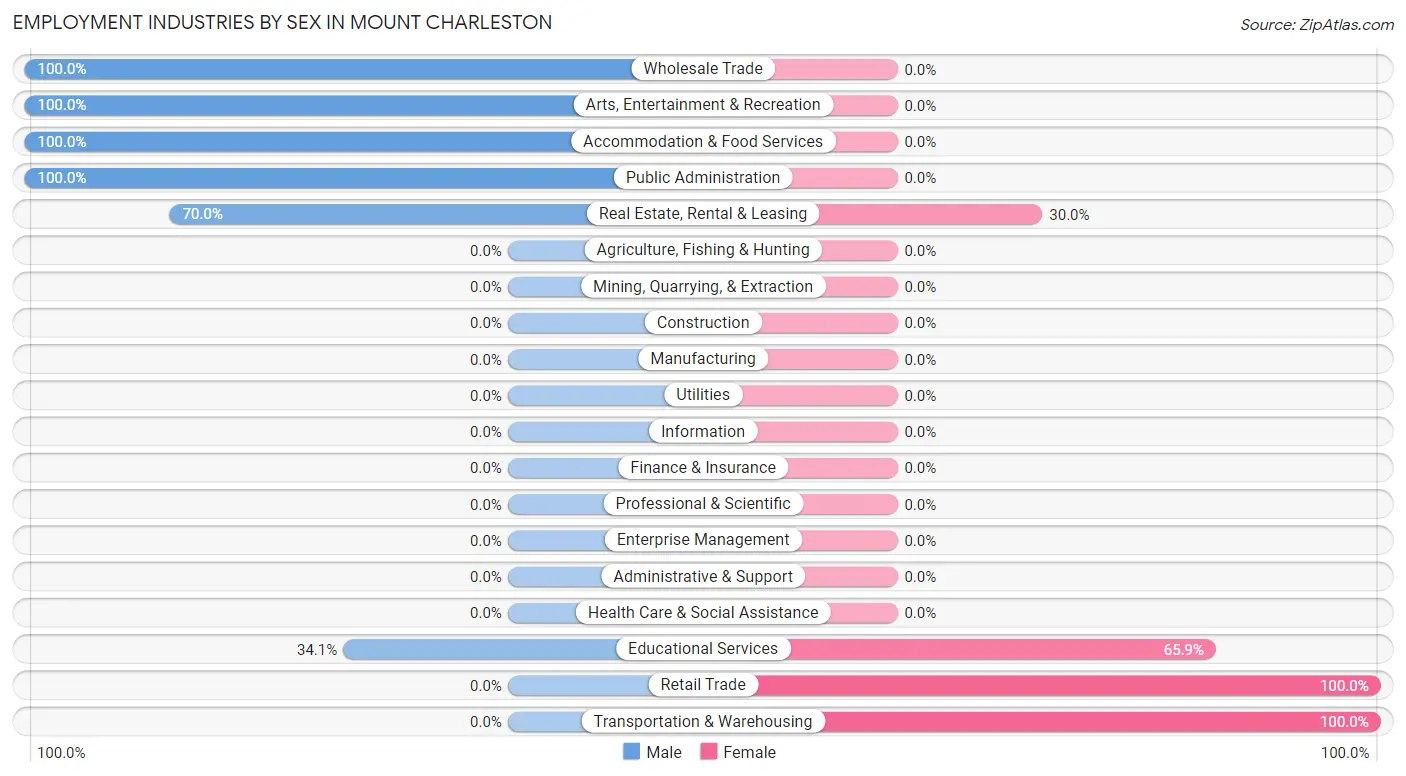
Employment Industries by Sex in Mount Charleston
The Mount Charleston industries that see more men than women are Wholesale Trade (100.0%), Arts, Entertainment & Recreation (100.0%), and Accommodation & Food Services (100.0%), whereas the industries that tend to have a higher number of women are Retail Trade (100.0%), Transportation & Warehousing (100.0%), and Educational Services (65.9%).
| Industry | Male | Female |
| Agriculture, Fishing & Hunting | 0 (0.0%) | 0 (0.0%) |
| Mining, Quarrying, & Extraction | 0 (0.0%) | 0 (0.0%) |
| Construction | 0 (0.0%) | 0 (0.0%) |
| Manufacturing | 0 (0.0%) | 0 (0.0%) |
| Wholesale Trade | 13 (100.0%) | 0 (0.0%) |
| Retail Trade | 0 (0.0%) | 5 (100.0%) |
| Transportation & Warehousing | 0 (0.0%) | 5 (100.0%) |
| Utilities | 0 (0.0%) | 0 (0.0%) |
| Information | 0 (0.0%) | 0 (0.0%) |
| Finance & Insurance | 0 (0.0%) | 0 (0.0%) |
| Real Estate, Rental & Leasing | 28 (70.0%) | 12 (30.0%) |
| Professional & Scientific | 0 (0.0%) | 0 (0.0%) |
| Enterprise Management | 0 (0.0%) | 0 (0.0%) |
| Administrative & Support | 0 (0.0%) | 0 (0.0%) |
| Educational Services | 15 (34.1%) | 29 (65.9%) |
| Health Care & Social Assistance | 0 (0.0%) | 0 (0.0%) |
| Arts, Entertainment & Recreation | 23 (100.0%) | 0 (0.0%) |
| Accommodation & Food Services | 23 (100.0%) | 0 (0.0%) |
| Public Administration | 31 (100.0%) | 0 (0.0%) |
| Total | 134 (72.4%) | 51 (27.6%) |
Education in Mount Charleston
School Enrollment in Mount Charleston
The most common levels of schooling among the 51 students in Mount Charleston are high school (25 | 49.0%), middle school (14 | 27.5%), and elementary school (12 | 23.5%).
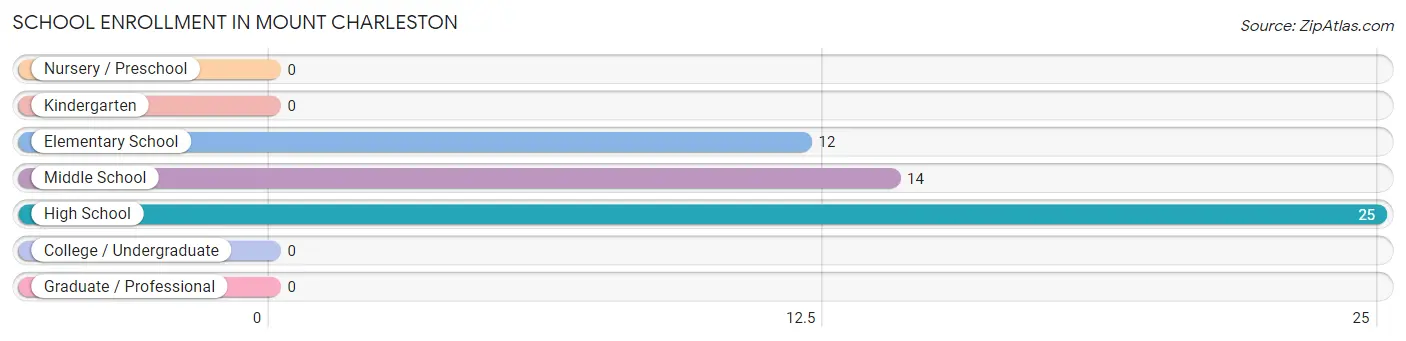
| School Level | # Students | % Students |
| Nursery / Preschool | 0 | 0.0% |
| Kindergarten | 0 | 0.0% |
| Elementary School | 12 | 23.5% |
| Middle School | 14 | 27.5% |
| High School | 25 | 49.0% |
| College / Undergraduate | 0 | 0.0% |
| Graduate / Professional | 0 | 0.0% |
| Total | 51 | 100.0% |
School Enrollment by Age by Funding Source in Mount Charleston
Out of a total of 51 students who are enrolled in schools in Mount Charleston, 1 (2.0%) attend a private institution, while the remaining 50 (98.0%) are enrolled in public schools. The age group of 18 to 19 year olds has the highest likelihood of being enrolled in private schools, with 1 (100.0% in the age bracket) enrolled. Conversely, the age group of 5 to 9 year old has the lowest likelihood of being enrolled in a private school, with 6 (100.0% in the age bracket) attending a public institution.
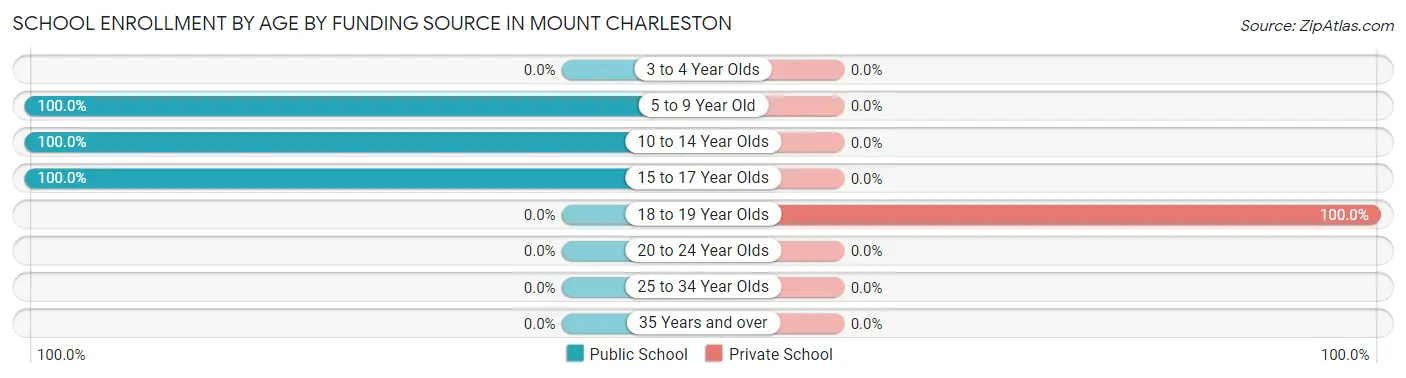
| Age Bracket | Public School | Private School |
| 3 to 4 Year Olds | 0 (0.0%) | 0 (0.0%) |
| 5 to 9 Year Old | 6 (100.0%) | 0 (0.0%) |
| 10 to 14 Year Olds | 20 (100.0%) | 0 (0.0%) |
| 15 to 17 Year Olds | 24 (100.0%) | 0 (0.0%) |
| 18 to 19 Year Olds | 0 (0.0%) | 1 (100.0%) |
| 20 to 24 Year Olds | 0 (0.0%) | 0 (0.0%) |
| 25 to 34 Year Olds | 0 (0.0%) | 0 (0.0%) |
| 35 Years and over | 0 (0.0%) | 0 (0.0%) |
| Total | 50 (98.0%) | 1 (2.0%) |
Educational Attainment by Field of Study in Mount Charleston
Business (41 | 22.4%), literature & languages (33 | 18.0%), engineering (30 | 16.4%), education (30 | 16.4%), and physical & health sciences (15 | 8.2%) are the most common fields of study among 183 individuals in Mount Charleston who have obtained a bachelor's degree or higher.
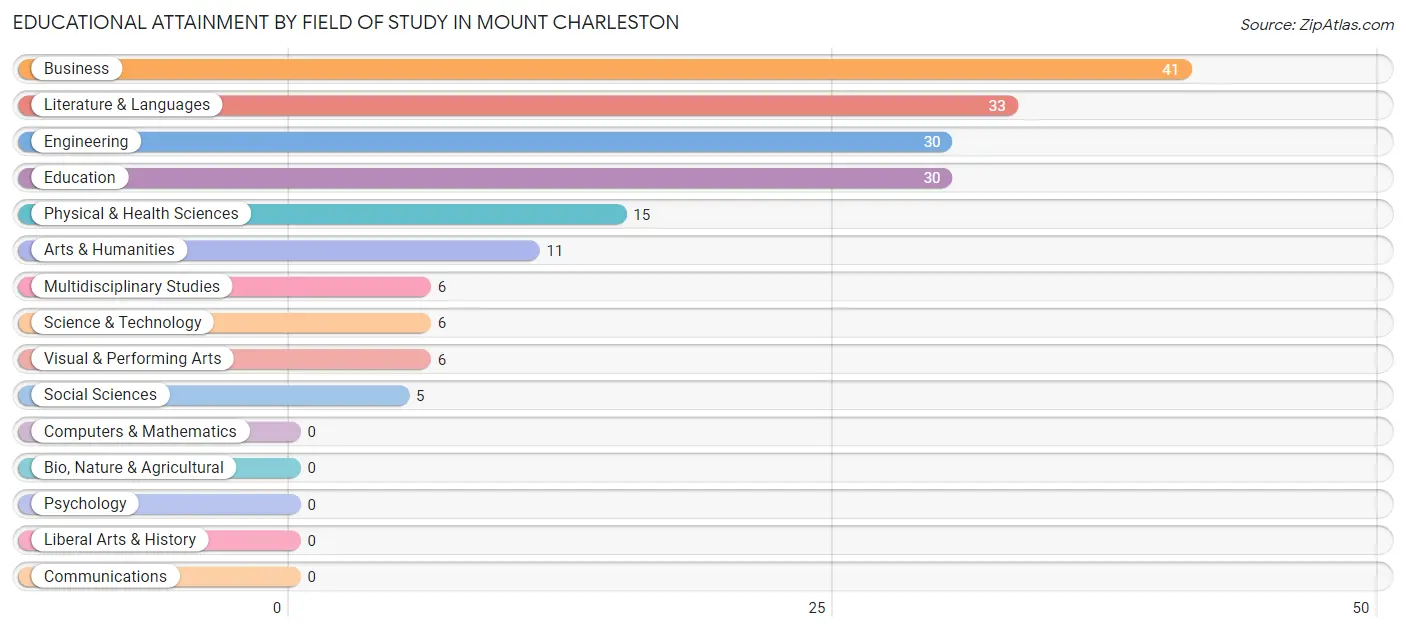
| Field of Study | # Graduates | % Graduates |
| Computers & Mathematics | 0 | 0.0% |
| Bio, Nature & Agricultural | 0 | 0.0% |
| Physical & Health Sciences | 15 | 8.2% |
| Psychology | 0 | 0.0% |
| Social Sciences | 5 | 2.7% |
| Engineering | 30 | 16.4% |
| Multidisciplinary Studies | 6 | 3.3% |
| Science & Technology | 6 | 3.3% |
| Business | 41 | 22.4% |
| Education | 30 | 16.4% |
| Literature & Languages | 33 | 18.0% |
| Liberal Arts & History | 0 | 0.0% |
| Visual & Performing Arts | 6 | 3.3% |
| Communications | 0 | 0.0% |
| Arts & Humanities | 11 | 6.0% |
| Total | 183 | 100.0% |
Transportation & Commute in Mount Charleston
Vehicle Availability by Sex in Mount Charleston
The most prevalent vehicle ownership categories in Mount Charleston are males with 2 vehicles (68, accounting for 48.9%) and females with 2 vehicles (32, making up 133.3%).
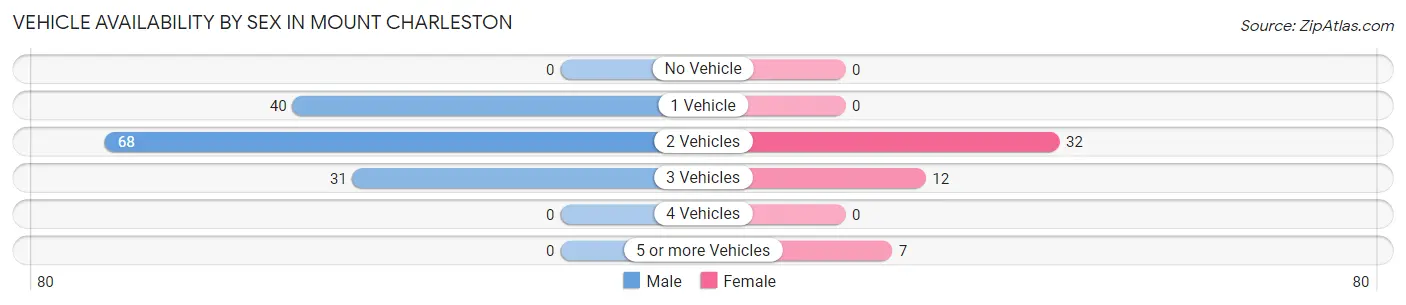
| Vehicles Available | Male | Female |
| No Vehicle | 0 (0.0%) | 0 (0.0%) |
| 1 Vehicle | 40 (28.8%) | 0 (0.0%) |
| 2 Vehicles | 68 (48.9%) | 32 (62.7%) |
| 3 Vehicles | 31 (22.3%) | 12 (23.5%) |
| 4 Vehicles | 0 (0.0%) | 0 (0.0%) |
| 5 or more Vehicles | 0 (0.0%) | 7 (13.7%) |
| Total | 139 (100.0%) | 51 (100.0%) |
Commute Time in Mount Charleston
The most frequently occuring commute durations in Mount Charleston are 45 to 59 minutes (92 commuters, 54.4%), 25 to 29 minutes (42 commuters, 24.8%), and 40 to 44 minutes (22 commuters, 13.0%).
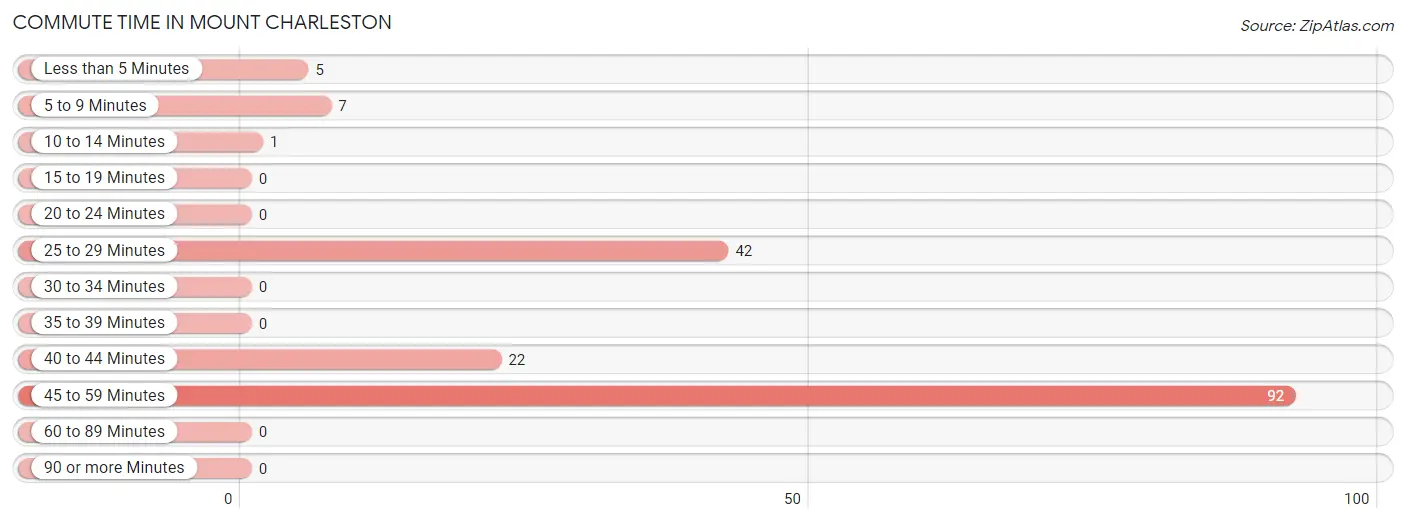
| Commute Time | # Commuters | % Commuters |
| Less than 5 Minutes | 5 | 3.0% |
| 5 to 9 Minutes | 7 | 4.1% |
| 10 to 14 Minutes | 1 | 0.6% |
| 15 to 19 Minutes | 0 | 0.0% |
| 20 to 24 Minutes | 0 | 0.0% |
| 25 to 29 Minutes | 42 | 24.8% |
| 30 to 34 Minutes | 0 | 0.0% |
| 35 to 39 Minutes | 0 | 0.0% |
| 40 to 44 Minutes | 22 | 13.0% |
| 45 to 59 Minutes | 92 | 54.4% |
| 60 to 89 Minutes | 0 | 0.0% |
| 90 or more Minutes | 0 | 0.0% |
Commute Time by Sex in Mount Charleston
The most common commute times in Mount Charleston are 45 to 59 minutes (64 commuters, 54.2%) for males and 45 to 59 minutes (28 commuters, 54.9%) for females.
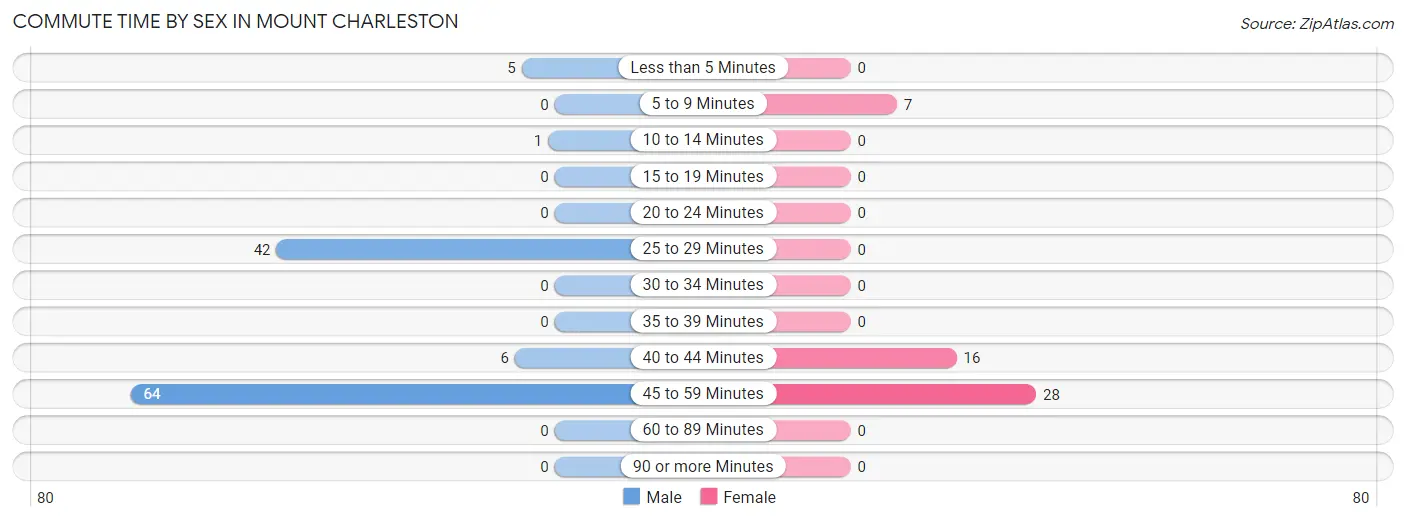
| Commute Time | Male | Female |
| Less than 5 Minutes | 5 (4.2%) | 0 (0.0%) |
| 5 to 9 Minutes | 0 (0.0%) | 7 (13.7%) |
| 10 to 14 Minutes | 1 (0.9%) | 0 (0.0%) |
| 15 to 19 Minutes | 0 (0.0%) | 0 (0.0%) |
| 20 to 24 Minutes | 0 (0.0%) | 0 (0.0%) |
| 25 to 29 Minutes | 42 (35.6%) | 0 (0.0%) |
| 30 to 34 Minutes | 0 (0.0%) | 0 (0.0%) |
| 35 to 39 Minutes | 0 (0.0%) | 0 (0.0%) |
| 40 to 44 Minutes | 6 (5.1%) | 16 (31.4%) |
| 45 to 59 Minutes | 64 (54.2%) | 28 (54.9%) |
| 60 to 89 Minutes | 0 (0.0%) | 0 (0.0%) |
| 90 or more Minutes | 0 (0.0%) | 0 (0.0%) |
Time of Departure to Work by Sex in Mount Charleston
The most frequent times of departure to work in Mount Charleston are 12:00 AM to 4:59 AM (35, 29.7%) for males and 8:00 AM to 8:29 AM (28, 54.9%) for females.
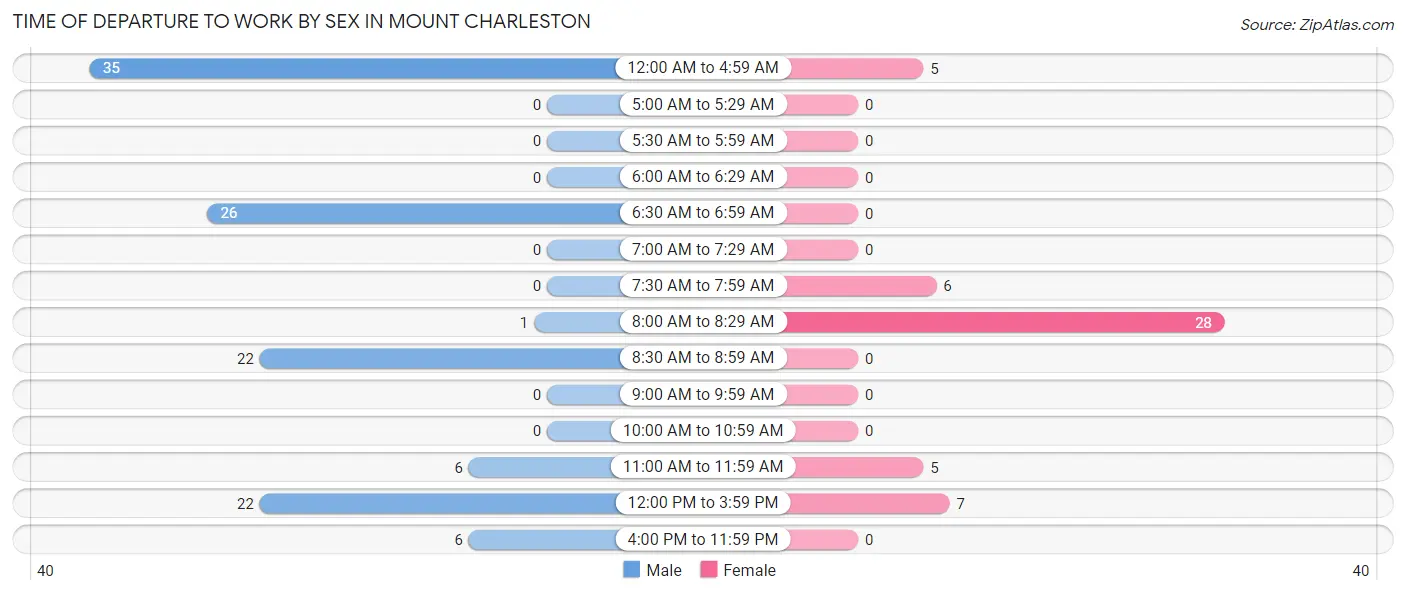
| Time of Departure | Male | Female |
| 12:00 AM to 4:59 AM | 35 (29.7%) | 5 (9.8%) |
| 5:00 AM to 5:29 AM | 0 (0.0%) | 0 (0.0%) |
| 5:30 AM to 5:59 AM | 0 (0.0%) | 0 (0.0%) |
| 6:00 AM to 6:29 AM | 0 (0.0%) | 0 (0.0%) |
| 6:30 AM to 6:59 AM | 26 (22.0%) | 0 (0.0%) |
| 7:00 AM to 7:29 AM | 0 (0.0%) | 0 (0.0%) |
| 7:30 AM to 7:59 AM | 0 (0.0%) | 6 (11.8%) |
| 8:00 AM to 8:29 AM | 1 (0.9%) | 28 (54.9%) |
| 8:30 AM to 8:59 AM | 22 (18.6%) | 0 (0.0%) |
| 9:00 AM to 9:59 AM | 0 (0.0%) | 0 (0.0%) |
| 10:00 AM to 10:59 AM | 0 (0.0%) | 0 (0.0%) |
| 11:00 AM to 11:59 AM | 6 (5.1%) | 5 (9.8%) |
| 12:00 PM to 3:59 PM | 22 (18.6%) | 7 (13.7%) |
| 4:00 PM to 11:59 PM | 6 (5.1%) | 0 (0.0%) |
| Total | 118 (100.0%) | 51 (100.0%) |
Housing Occupancy in Mount Charleston
Occupancy by Ownership in Mount Charleston
Of the total 217 dwellings in Mount Charleston, owner-occupied units account for 197 (90.8%), while renter-occupied units make up 20 (9.2%).
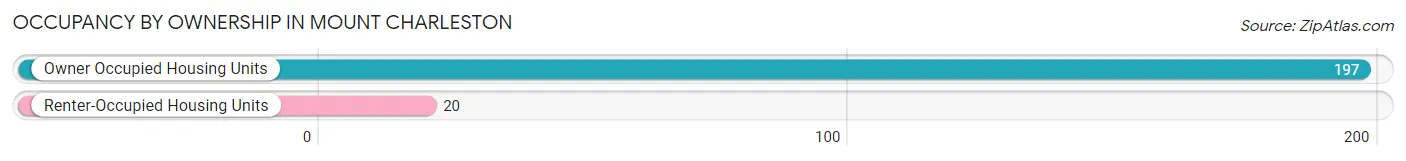
| Occupancy | # Housing Units | % Housing Units |
| Owner Occupied Housing Units | 197 | 90.8% |
| Renter-Occupied Housing Units | 20 | 9.2% |
| Total Occupied Housing Units | 217 | 100.0% |
Occupancy by Household Size in Mount Charleston
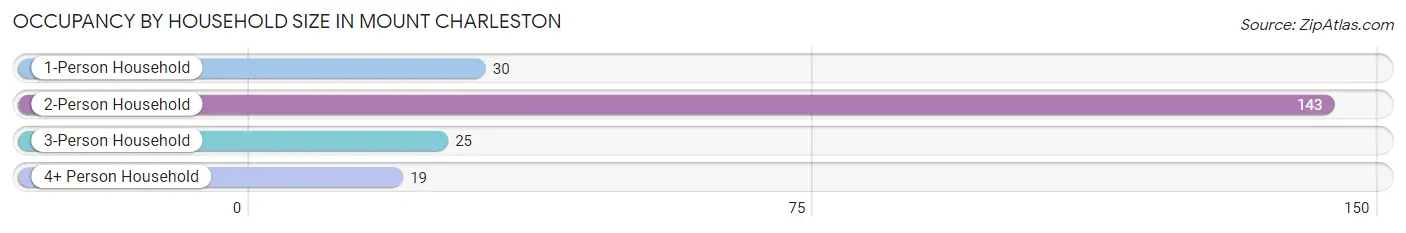
| Household Size | # Housing Units | % Housing Units |
| 1-Person Household | 30 | 13.8% |
| 2-Person Household | 143 | 65.9% |
| 3-Person Household | 25 | 11.5% |
| 4+ Person Household | 19 | 8.8% |
| Total Housing Units | 217 | 100.0% |
Occupancy by Ownership by Household Size in Mount Charleston
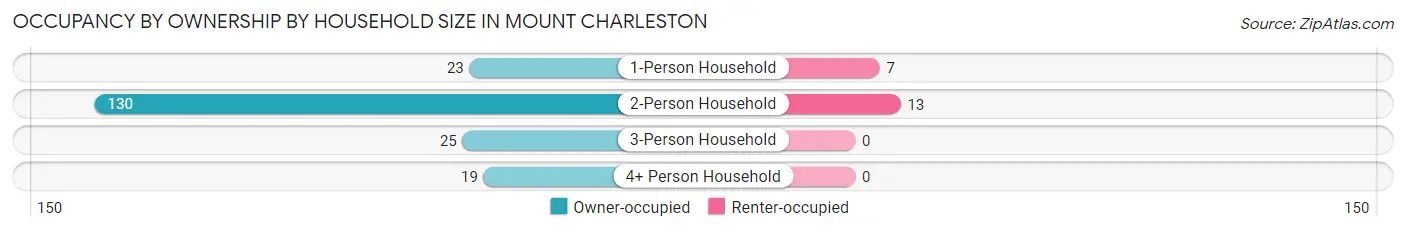
| Household Size | Owner-occupied | Renter-occupied |
| 1-Person Household | 23 (76.7%) | 7 (23.3%) |
| 2-Person Household | 130 (90.9%) | 13 (9.1%) |
| 3-Person Household | 25 (100.0%) | 0 (0.0%) |
| 4+ Person Household | 19 (100.0%) | 0 (0.0%) |
| Total Housing Units | 197 (90.8%) | 20 (9.2%) |
Occupancy by Educational Attainment in Mount Charleston
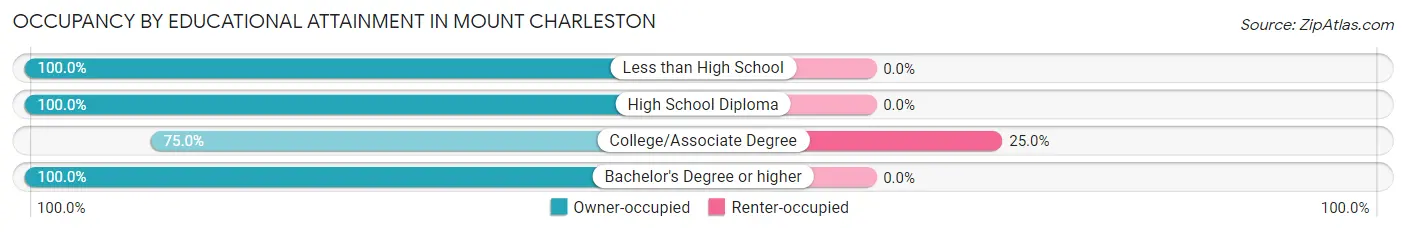
| Household Size | Owner-occupied | Renter-occupied |
| Less than High School | 12 (100.0%) | 0 (0.0%) |
| High School Diploma | 18 (100.0%) | 0 (0.0%) |
| College/Associate Degree | 60 (75.0%) | 20 (25.0%) |
| Bachelor's Degree or higher | 107 (100.0%) | 0 (0.0%) |
Occupancy by Age of Householder in Mount Charleston
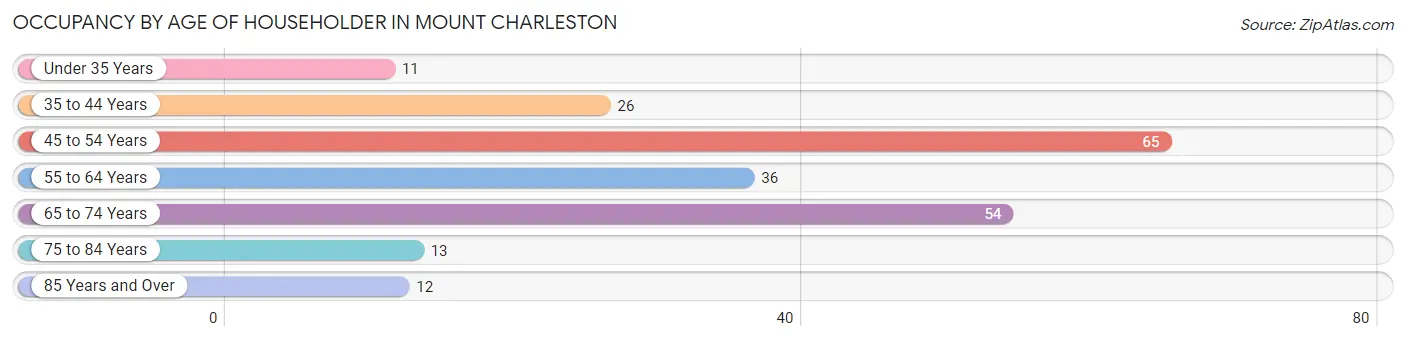
| Age Bracket | # Households | % Households |
| Under 35 Years | 11 | 5.1% |
| 35 to 44 Years | 26 | 12.0% |
| 45 to 54 Years | 65 | 29.9% |
| 55 to 64 Years | 36 | 16.6% |
| 65 to 74 Years | 54 | 24.9% |
| 75 to 84 Years | 13 | 6.0% |
| 85 Years and Over | 12 | 5.5% |
| Total | 217 | 100.0% |
Housing Finances in Mount Charleston
Median Income by Occupancy in Mount Charleston
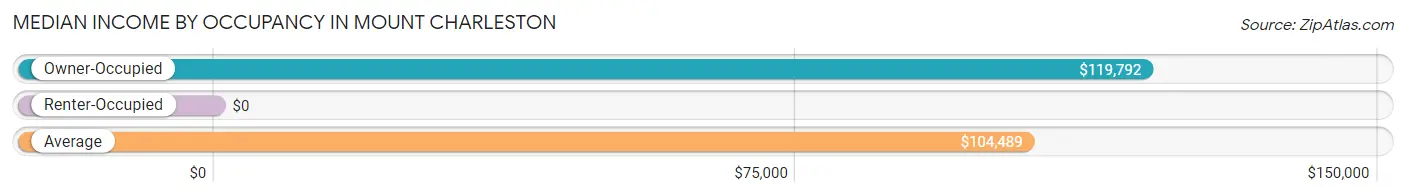
| Occupancy Type | # Households | Median Income |
| Owner-Occupied | 197 (90.8%) | $119,792 |
| Renter-Occupied | 20 (9.2%) | $0 |
| Average | 217 (100.0%) | $104,489 |
Occupancy by Householder Income Bracket in Mount Charleston
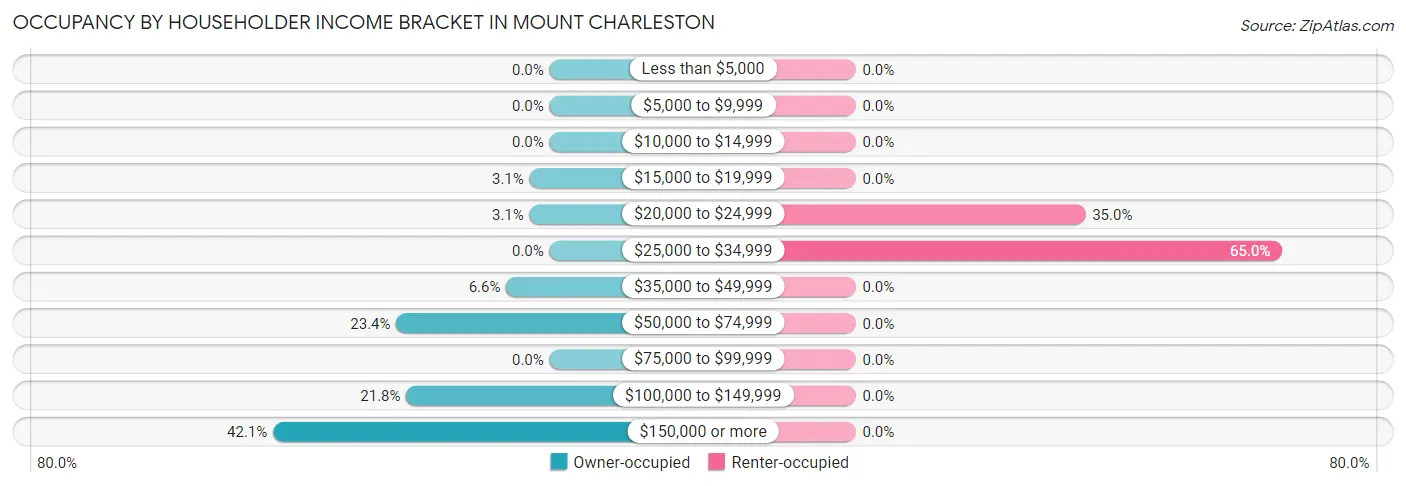
| Income Bracket | Owner-occupied | Renter-occupied |
| Less than $5,000 | 0 (0.0%) | 0 (0.0%) |
| $5,000 to $9,999 | 0 (0.0%) | 0 (0.0%) |
| $10,000 to $14,999 | 0 (0.0%) | 0 (0.0%) |
| $15,000 to $19,999 | 6 (3.0%) | 0 (0.0%) |
| $20,000 to $24,999 | 6 (3.0%) | 7 (35.0%) |
| $25,000 to $34,999 | 0 (0.0%) | 13 (65.0%) |
| $35,000 to $49,999 | 13 (6.6%) | 0 (0.0%) |
| $50,000 to $74,999 | 46 (23.4%) | 0 (0.0%) |
| $75,000 to $99,999 | 0 (0.0%) | 0 (0.0%) |
| $100,000 to $149,999 | 43 (21.8%) | 0 (0.0%) |
| $150,000 or more | 83 (42.1%) | 0 (0.0%) |
| Total | 197 (100.0%) | 20 (100.0%) |
Monthly Housing Cost Tiers in Mount Charleston

| Monthly Cost | Owner-occupied | Renter-occupied |
| Less than $300 | 0 (0.0%) | 0 (0.0%) |
| $300 to $499 | 6 (3.0%) | 0 (0.0%) |
| $500 to $799 | 29 (14.7%) | 0 (0.0%) |
| $800 to $999 | 7 (3.5%) | 0 (0.0%) |
| $1,000 to $1,499 | 62 (31.5%) | 20 (100.0%) |
| $1,500 to $1,999 | 17 (8.6%) | 0 (0.0%) |
| $2,000 to $2,499 | 39 (19.8%) | 0 (0.0%) |
| $2,500 to $2,999 | 31 (15.7%) | 0 (0.0%) |
| $3,000 or more | 6 (3.0%) | 0 (0.0%) |
| Total | 197 (100.0%) | 20 (100.0%) |
Physical Housing Characteristics in Mount Charleston
Housing Structures in Mount Charleston
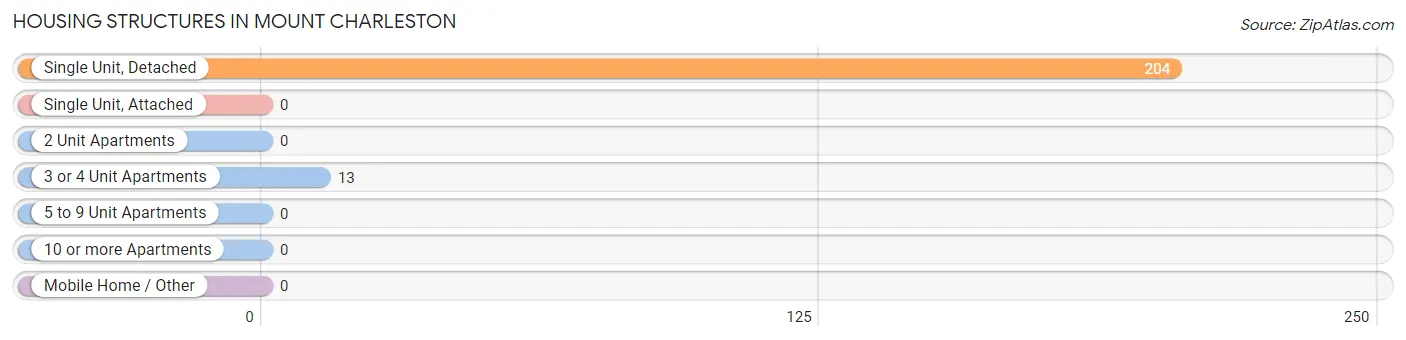
| Structure Type | # Housing Units | % Housing Units |
| Single Unit, Detached | 204 | 94.0% |
| Single Unit, Attached | 0 | 0.0% |
| 2 Unit Apartments | 0 | 0.0% |
| 3 or 4 Unit Apartments | 13 | 6.0% |
| 5 to 9 Unit Apartments | 0 | 0.0% |
| 10 or more Apartments | 0 | 0.0% |
| Mobile Home / Other | 0 | 0.0% |
| Total | 217 | 100.0% |
Housing Structures by Occupancy in Mount Charleston
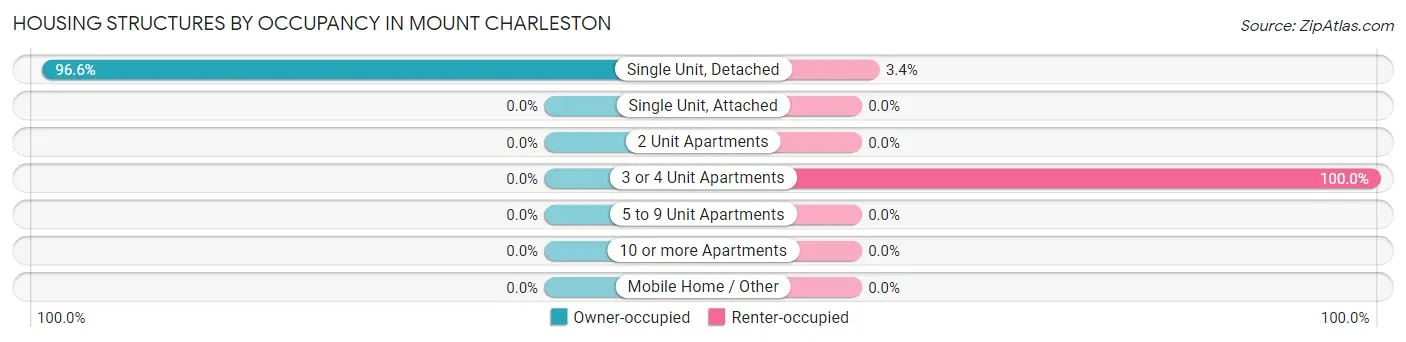
| Structure Type | Owner-occupied | Renter-occupied |
| Single Unit, Detached | 197 (96.6%) | 7 (3.4%) |
| Single Unit, Attached | 0 (0.0%) | 0 (0.0%) |
| 2 Unit Apartments | 0 (0.0%) | 0 (0.0%) |
| 3 or 4 Unit Apartments | 0 (0.0%) | 13 (100.0%) |
| 5 to 9 Unit Apartments | 0 (0.0%) | 0 (0.0%) |
| 10 or more Apartments | 0 (0.0%) | 0 (0.0%) |
| Mobile Home / Other | 0 (0.0%) | 0 (0.0%) |
| Total | 197 (90.8%) | 20 (9.2%) |
Housing Structures by Number of Rooms in Mount Charleston
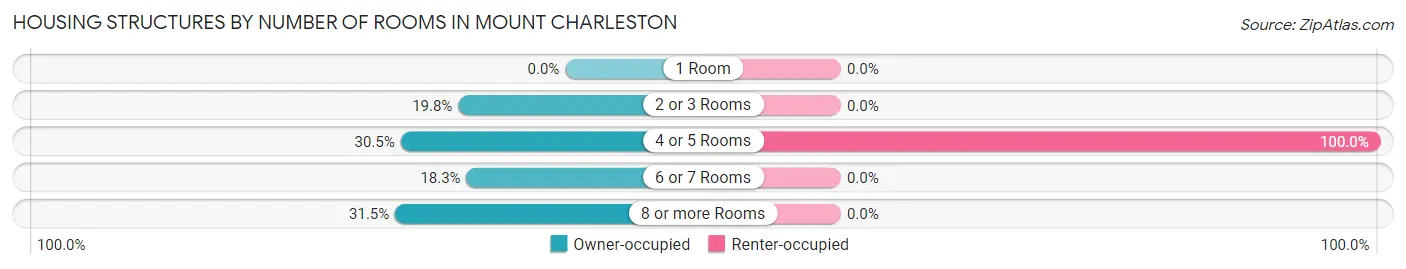
| Number of Rooms | Owner-occupied | Renter-occupied |
| 1 Room | 0 (0.0%) | 0 (0.0%) |
| 2 or 3 Rooms | 39 (19.8%) | 0 (0.0%) |
| 4 or 5 Rooms | 60 (30.5%) | 20 (100.0%) |
| 6 or 7 Rooms | 36 (18.3%) | 0 (0.0%) |
| 8 or more Rooms | 62 (31.5%) | 0 (0.0%) |
| Total | 197 (100.0%) | 20 (100.0%) |
Housing Structure by Heating Type in Mount Charleston
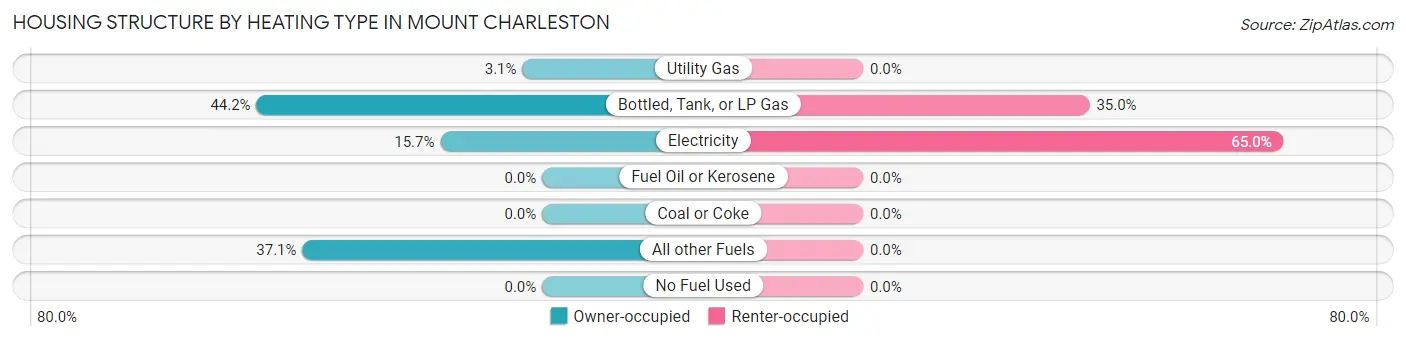
| Heating Type | Owner-occupied | Renter-occupied |
| Utility Gas | 6 (3.0%) | 0 (0.0%) |
| Bottled, Tank, or LP Gas | 87 (44.2%) | 7 (35.0%) |
| Electricity | 31 (15.7%) | 13 (65.0%) |
| Fuel Oil or Kerosene | 0 (0.0%) | 0 (0.0%) |
| Coal or Coke | 0 (0.0%) | 0 (0.0%) |
| All other Fuels | 73 (37.1%) | 0 (0.0%) |
| No Fuel Used | 0 (0.0%) | 0 (0.0%) |
| Total | 197 (100.0%) | 20 (100.0%) |
Household Vehicle Usage in Mount Charleston
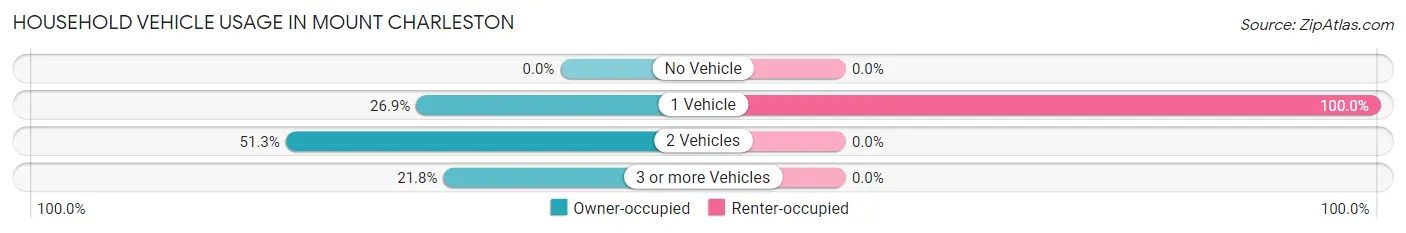
| Vehicles per Household | Owner-occupied | Renter-occupied |
| No Vehicle | 0 (0.0%) | 0 (0.0%) |
| 1 Vehicle | 53 (26.9%) | 20 (100.0%) |
| 2 Vehicles | 101 (51.3%) | 0 (0.0%) |
| 3 or more Vehicles | 43 (21.8%) | 0 (0.0%) |
| Total | 197 (100.0%) | 20 (100.0%) |
Real Estate & Mortgages in Mount Charleston
Real Estate and Mortgage Overview in Mount Charleston
| Characteristic | Without Mortgage | With Mortgage |
| Housing Units | 71 | 126 |
| Median Property Value | $625,000 | $549,000 |
| Median Household Income | $71,359 | $64 |
| Monthly Housing Costs | $1,108 | $6 |
| Real Estate Taxes | $4,729 | $0 |
Property Value by Mortgage Status in Mount Charleston
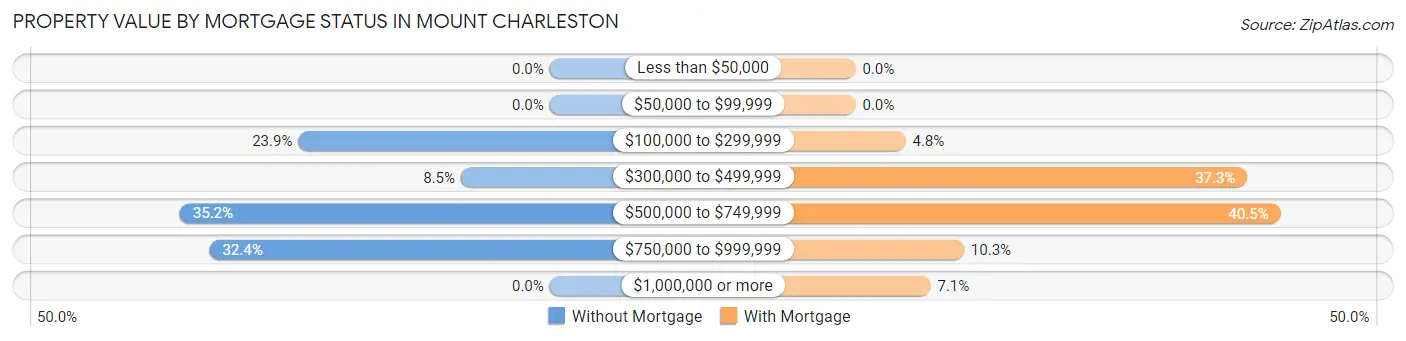
| Property Value | Without Mortgage | With Mortgage |
| Less than $50,000 | 0 (0.0%) | 0 (0.0%) |
| $50,000 to $99,999 | 0 (0.0%) | 0 (0.0%) |
| $100,000 to $299,999 | 17 (23.9%) | 6 (4.8%) |
| $300,000 to $499,999 | 6 (8.5%) | 47 (37.3%) |
| $500,000 to $749,999 | 25 (35.2%) | 51 (40.5%) |
| $750,000 to $999,999 | 23 (32.4%) | 13 (10.3%) |
| $1,000,000 or more | 0 (0.0%) | 9 (7.1%) |
| Total | 71 (100.0%) | 126 (100.0%) |
Household Income by Mortgage Status in Mount Charleston
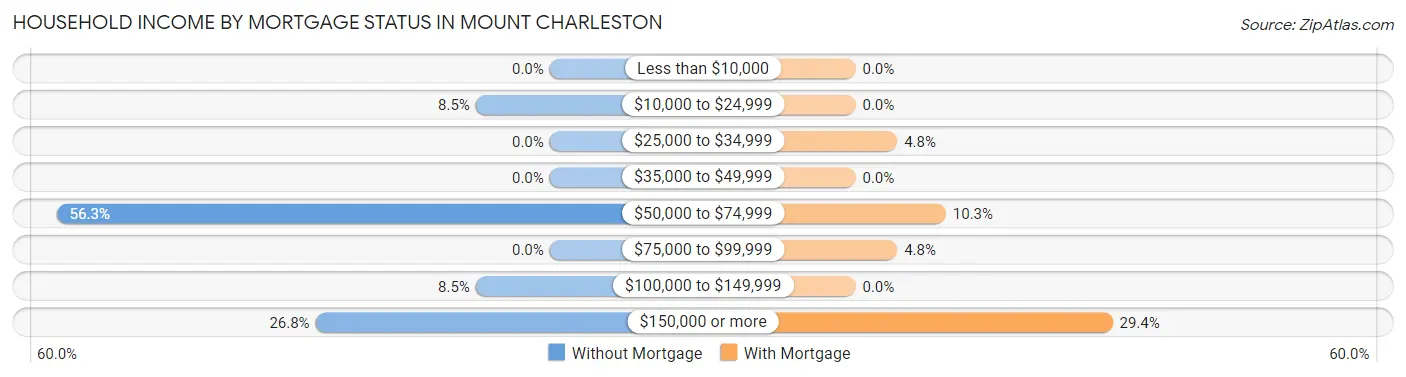
| Household Income | Without Mortgage | With Mortgage |
| Less than $10,000 | 0 (0.0%) | 0 (0.0%) |
| $10,000 to $24,999 | 6 (8.5%) | 0 (0.0%) |
| $25,000 to $34,999 | 0 (0.0%) | 6 (4.8%) |
| $35,000 to $49,999 | 0 (0.0%) | 0 (0.0%) |
| $50,000 to $74,999 | 40 (56.3%) | 13 (10.3%) |
| $75,000 to $99,999 | 0 (0.0%) | 6 (4.8%) |
| $100,000 to $149,999 | 6 (8.5%) | 0 (0.0%) |
| $150,000 or more | 19 (26.8%) | 37 (29.4%) |
| Total | 71 (100.0%) | 126 (100.0%) |
Property Value to Household Income Ratio in Mount Charleston
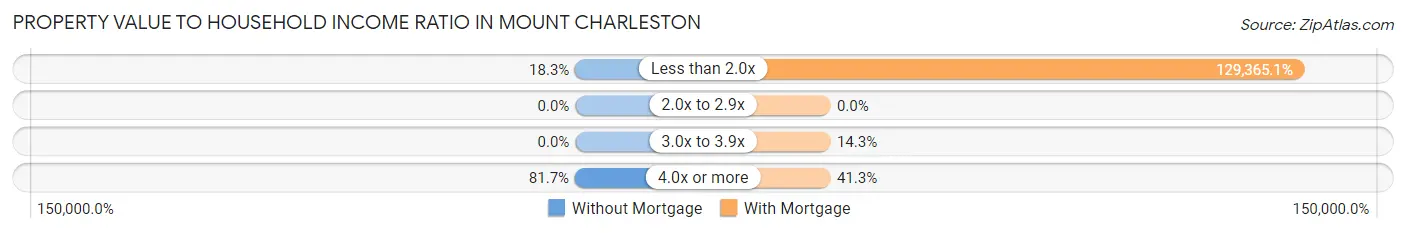
| Value-to-Income Ratio | Without Mortgage | With Mortgage |
| Less than 2.0x | 13 (18.3%) | 163,000 (129,365.1%) |
| 2.0x to 2.9x | 0 (0.0%) | 0 (0.0%) |
| 3.0x to 3.9x | 0 (0.0%) | 18 (14.3%) |
| 4.0x or more | 58 (81.7%) | 52 (41.3%) |
| Total | 71 (100.0%) | 126 (100.0%) |
Real Estate Taxes by Mortgage Status in Mount Charleston
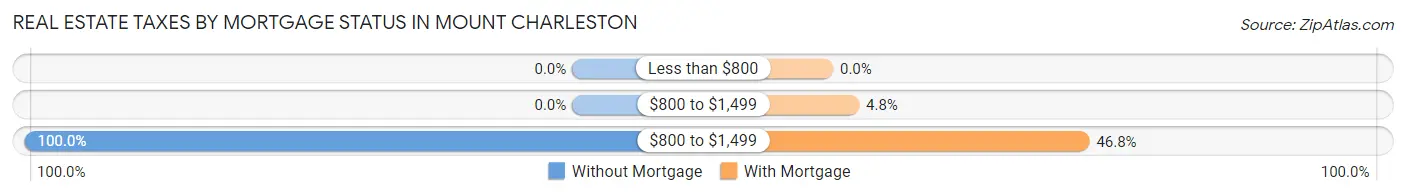
| Property Taxes | Without Mortgage | With Mortgage |
| Less than $800 | 0 (0.0%) | 0 (0.0%) |
| $800 to $1,499 | 0 (0.0%) | 6 (4.8%) |
| $800 to $1,499 | 71 (100.0%) | 59 (46.8%) |
| Total | 71 (100.0%) | 126 (100.0%) |
Health & Disability in Mount Charleston
Health Insurance Coverage by Age in Mount Charleston
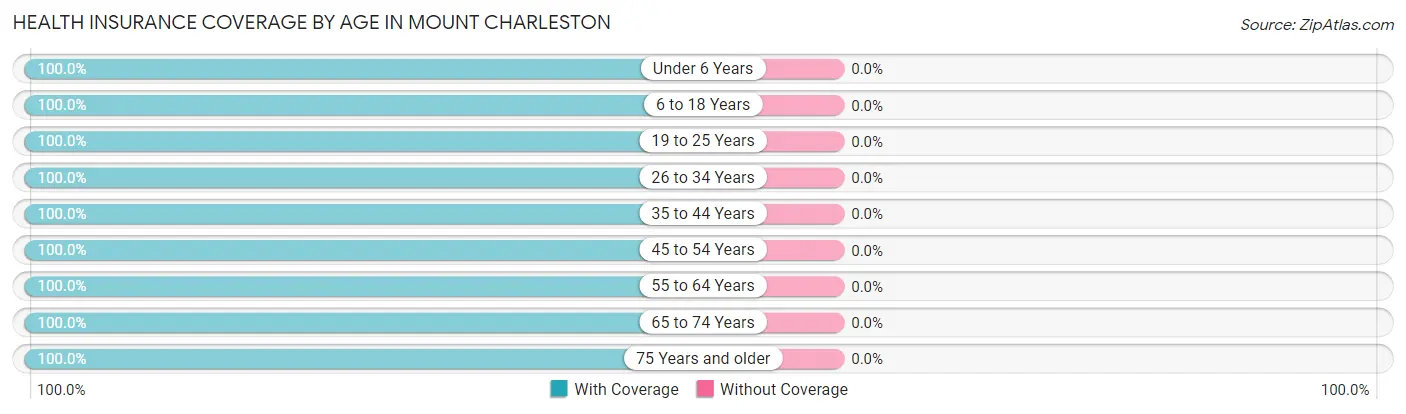
| Age Bracket | With Coverage | Without Coverage |
| Under 6 Years | 12 (100.0%) | 0 (0.0%) |
| 6 to 18 Years | 50 (100.0%) | 0 (0.0%) |
| 19 to 25 Years | 2 (100.0%) | 0 (0.0%) |
| 26 to 34 Years | 17 (100.0%) | 0 (0.0%) |
| 35 to 44 Years | 43 (100.0%) | 0 (0.0%) |
| 45 to 54 Years | 102 (100.0%) | 0 (0.0%) |
| 55 to 64 Years | 98 (100.0%) | 0 (0.0%) |
| 65 to 74 Years | 107 (100.0%) | 0 (0.0%) |
| 75 Years and older | 36 (100.0%) | 0 (0.0%) |
| Total | 467 (100.0%) | 0 (0.0%) |
Health Insurance Coverage by Citizenship Status in Mount Charleston
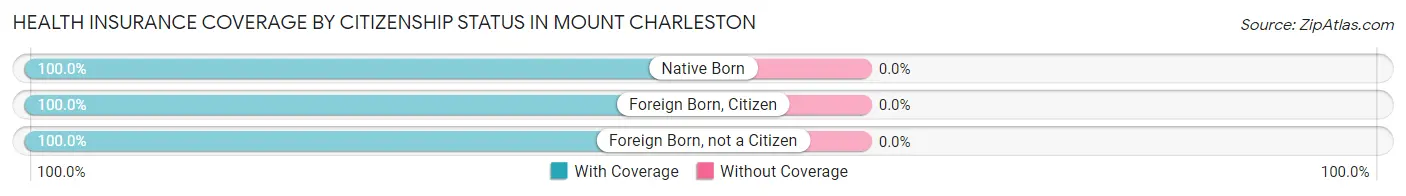
| Citizenship Status | With Coverage | Without Coverage |
| Native Born | 12 (100.0%) | 0 (0.0%) |
| Foreign Born, Citizen | 50 (100.0%) | 0 (0.0%) |
| Foreign Born, not a Citizen | 2 (100.0%) | 0 (0.0%) |
Health Insurance Coverage by Household Income in Mount Charleston
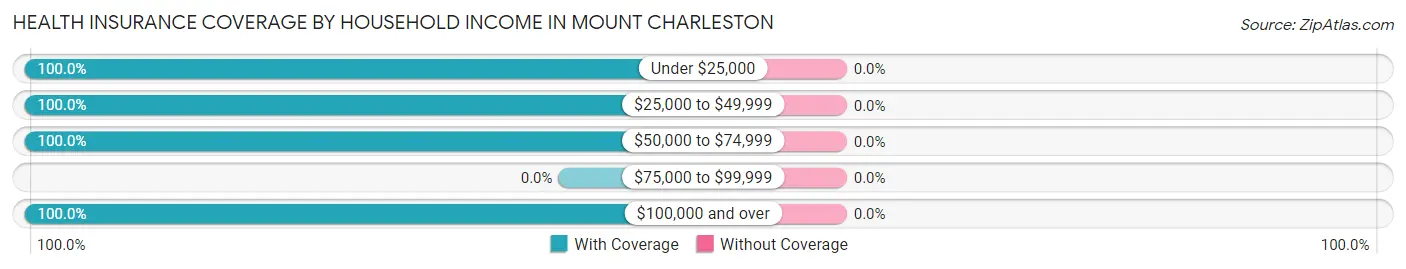
| Household Income | With Coverage | Without Coverage |
| Under $25,000 | 30 (100.0%) | 0 (0.0%) |
| $25,000 to $49,999 | 64 (100.0%) | 0 (0.0%) |
| $50,000 to $74,999 | 64 (100.0%) | 0 (0.0%) |
| $75,000 to $99,999 | 0 (0.0%) | 0 (0.0%) |
| $100,000 and over | 305 (100.0%) | 0 (0.0%) |
Public vs Private Health Insurance Coverage by Age in Mount Charleston
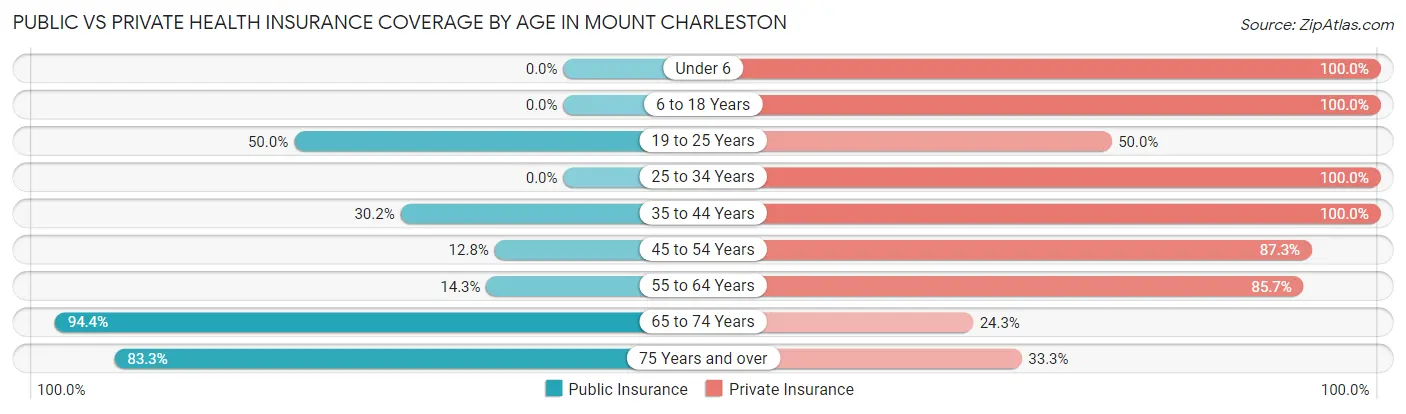
| Age Bracket | Public Insurance | Private Insurance |
| Under 6 | 0 (0.0%) | 12 (100.0%) |
| 6 to 18 Years | 0 (0.0%) | 50 (100.0%) |
| 19 to 25 Years | 1 (50.0%) | 1 (50.0%) |
| 25 to 34 Years | 0 (0.0%) | 17 (100.0%) |
| 35 to 44 Years | 13 (30.2%) | 43 (100.0%) |
| 45 to 54 Years | 13 (12.8%) | 89 (87.3%) |
| 55 to 64 Years | 14 (14.3%) | 84 (85.7%) |
| 65 to 74 Years | 101 (94.4%) | 26 (24.3%) |
| 75 Years and over | 30 (83.3%) | 12 (33.3%) |
| Total | 172 (36.8%) | 334 (71.5%) |
Disability Status by Sex by Age in Mount Charleston
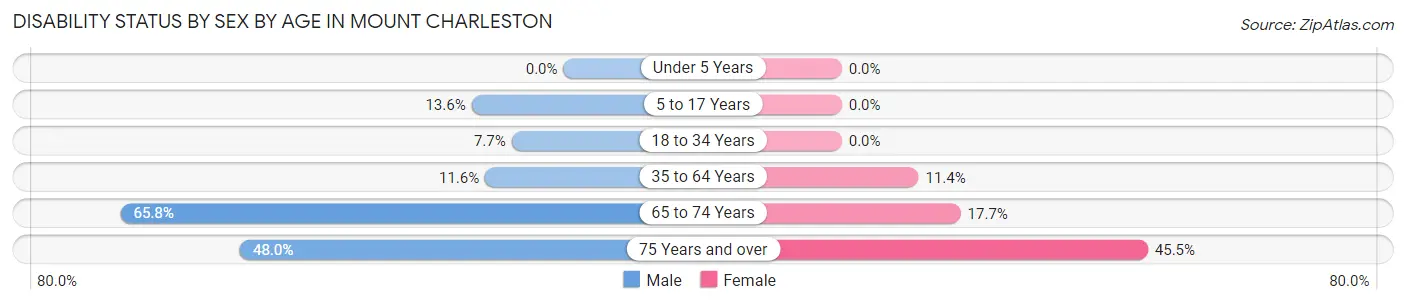
| Age Bracket | Male | Female |
| Under 5 Years | 0 (0.0%) | 0 (0.0%) |
| 5 to 17 Years | 6 (13.6%) | 0 (0.0%) |
| 18 to 34 Years | 1 (7.7%) | 0 (0.0%) |
| 35 to 64 Years | 15 (11.6%) | 13 (11.4%) |
| 65 to 74 Years | 48 (65.7%) | 6 (17.6%) |
| 75 Years and over | 12 (48.0%) | 5 (45.5%) |
Disability Class by Sex by Age in Mount Charleston
Disability Class: Hearing Difficulty
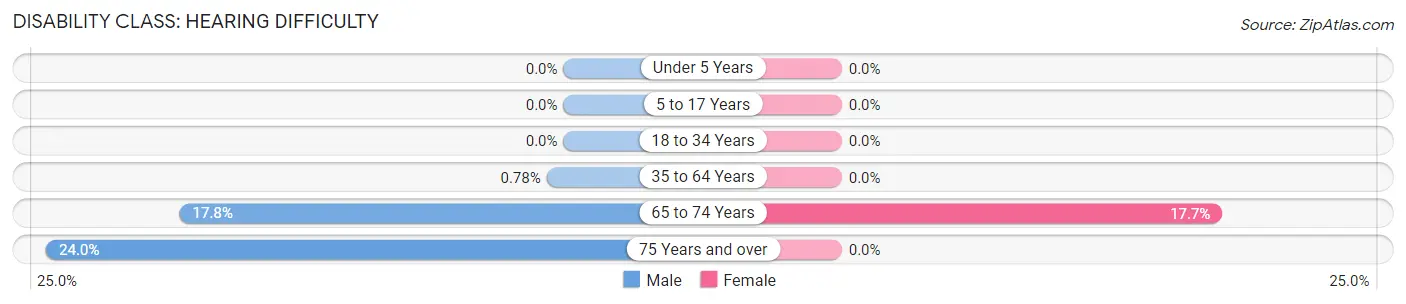
| Age Bracket | Male | Female |
| Under 5 Years | 0 (0.0%) | 0 (0.0%) |
| 5 to 17 Years | 0 (0.0%) | 0 (0.0%) |
| 18 to 34 Years | 0 (0.0%) | 0 (0.0%) |
| 35 to 64 Years | 1 (0.8%) | 0 (0.0%) |
| 65 to 74 Years | 13 (17.8%) | 6 (17.6%) |
| 75 Years and over | 6 (24.0%) | 0 (0.0%) |
Disability Class: Vision Difficulty
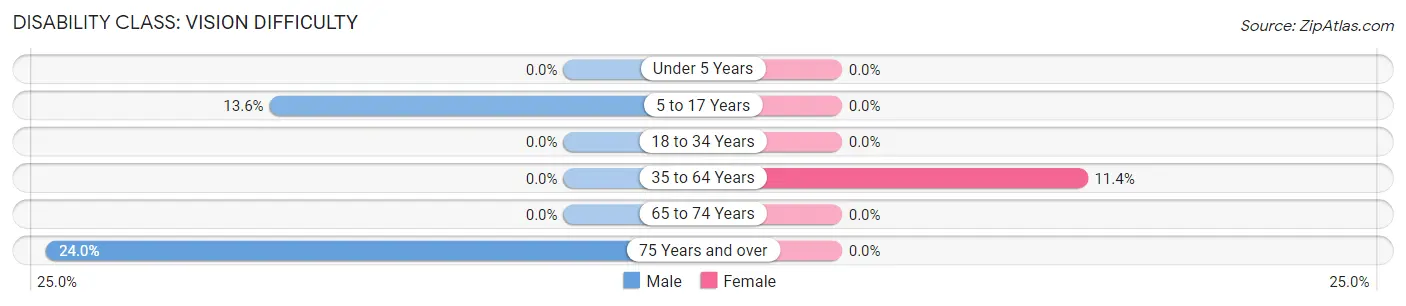
| Age Bracket | Male | Female |
| Under 5 Years | 0 (0.0%) | 0 (0.0%) |
| 5 to 17 Years | 6 (13.6%) | 0 (0.0%) |
| 18 to 34 Years | 0 (0.0%) | 0 (0.0%) |
| 35 to 64 Years | 0 (0.0%) | 13 (11.4%) |
| 65 to 74 Years | 0 (0.0%) | 0 (0.0%) |
| 75 Years and over | 6 (24.0%) | 0 (0.0%) |
Disability Class: Cognitive Difficulty
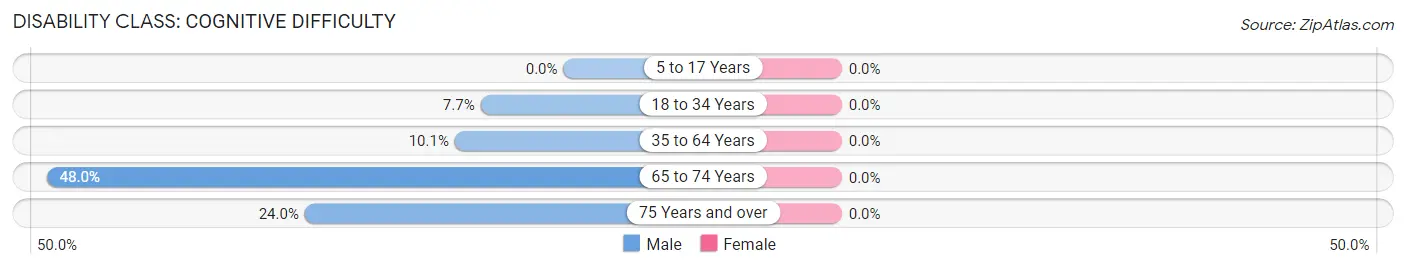
| Age Bracket | Male | Female |
| 5 to 17 Years | 0 (0.0%) | 0 (0.0%) |
| 18 to 34 Years | 1 (7.7%) | 0 (0.0%) |
| 35 to 64 Years | 13 (10.1%) | 0 (0.0%) |
| 65 to 74 Years | 35 (47.9%) | 0 (0.0%) |
| 75 Years and over | 6 (24.0%) | 0 (0.0%) |
Disability Class: Ambulatory Difficulty
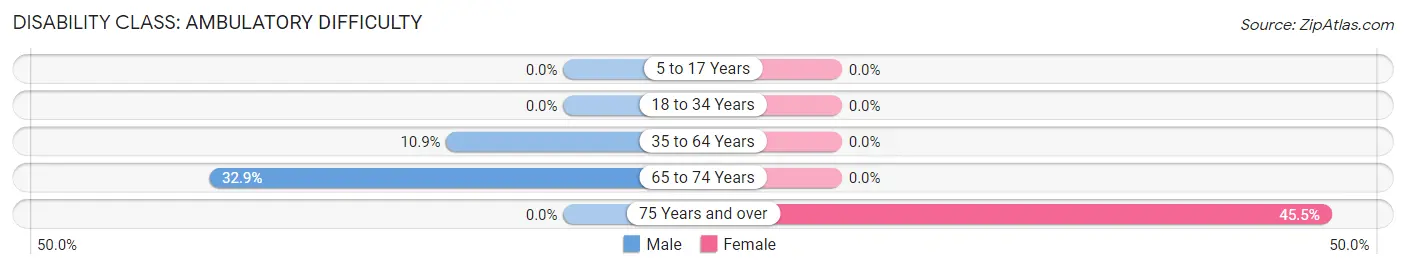
| Age Bracket | Male | Female |
| 5 to 17 Years | 0 (0.0%) | 0 (0.0%) |
| 18 to 34 Years | 0 (0.0%) | 0 (0.0%) |
| 35 to 64 Years | 14 (10.8%) | 0 (0.0%) |
| 65 to 74 Years | 24 (32.9%) | 0 (0.0%) |
| 75 Years and over | 0 (0.0%) | 5 (45.5%) |
Disability Class: Self-Care Difficulty
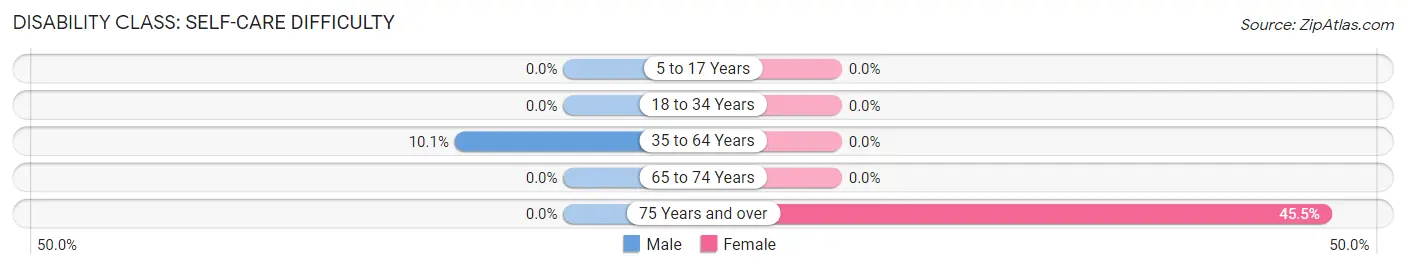
| Age Bracket | Male | Female |
| 5 to 17 Years | 0 (0.0%) | 0 (0.0%) |
| 18 to 34 Years | 0 (0.0%) | 0 (0.0%) |
| 35 to 64 Years | 13 (10.1%) | 0 (0.0%) |
| 65 to 74 Years | 0 (0.0%) | 0 (0.0%) |
| 75 Years and over | 0 (0.0%) | 5 (45.5%) |
Technology Access in Mount Charleston
Computing Device Access in Mount Charleston
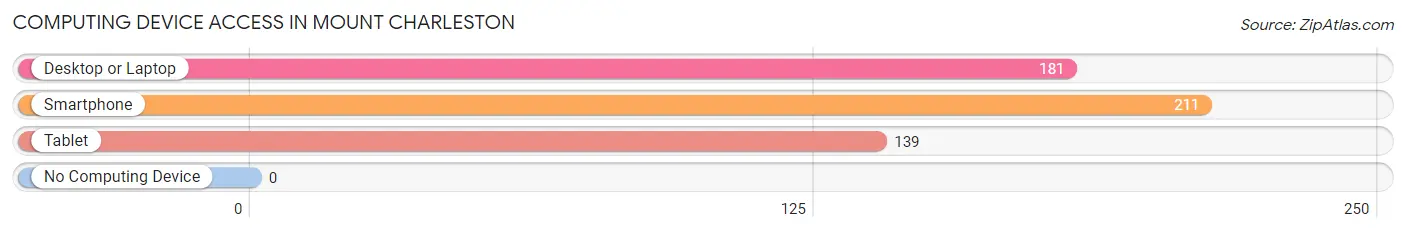
| Device Type | # Households | % Households |
| Desktop or Laptop | 181 | 83.4% |
| Smartphone | 211 | 97.2% |
| Tablet | 139 | 64.1% |
| No Computing Device | 0 | 0.0% |
| Total | 217 | 100.0% |
Internet Access in Mount Charleston
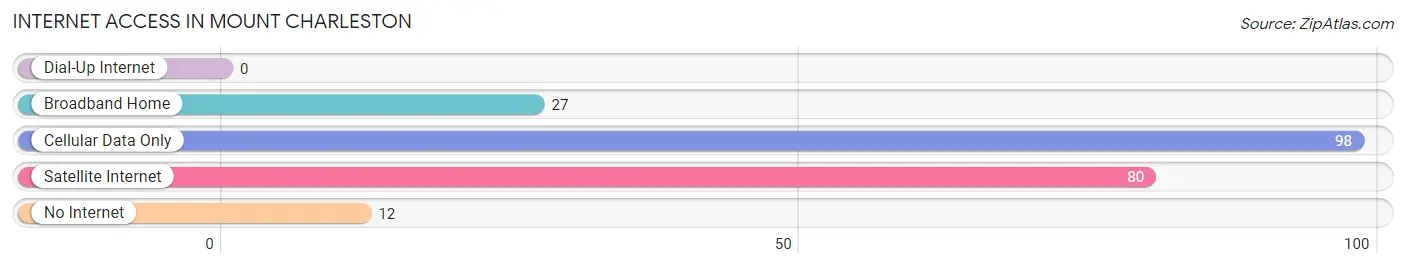
| Internet Type | # Households | % Households |
| Dial-Up Internet | 0 | 0.0% |
| Broadband Home | 27 | 12.4% |
| Cellular Data Only | 98 | 45.2% |
| Satellite Internet | 80 | 36.9% |
| No Internet | 12 | 5.5% |
| Total | 217 | 100.0% |
Mount Charleston Summary
Mount Charleston, NV is a small mountain town located in Clark County, Nevada. It is situated in the Spring Mountains, approximately 35 miles northwest of Las Vegas. The town is named after the nearby 11,916-foot peak of Mount Charleston, the highest point in the Spring Mountains. The town is a popular destination for outdoor recreation, including hiking, camping, skiing, and snowboarding.
History
The area around Mount Charleston has been inhabited for thousands of years by the Southern Paiute people. The first European settlers arrived in the area in the late 19th century, and the town of Mount Charleston was established in the early 20th century. The town was originally a mining community, and the first post office was established in 1910.
In the 1930s, the town began to attract tourists, and the first ski resort was built in the area in the 1940s. The resort was destroyed by a fire in the 1950s, but was rebuilt in the 1960s. The town has since become a popular destination for outdoor recreation, and the ski resort has been expanded and modernized.
Geography
Mount Charleston is located in the Spring Mountains, approximately 35 miles northwest of Las Vegas. The town is situated at an elevation of 6,800 feet, and the nearby peak of Mount Charleston is the highest point in the Spring Mountains, at 11,916 feet. The town is surrounded by the Humboldt-Toiyabe National Forest, and is home to several hiking trails, campgrounds, and ski resorts.
The climate in Mount Charleston is cooler than in Las Vegas, due to its higher elevation. The average high temperature in the summer is around 80 degrees Fahrenheit, and the average low temperature in the winter is around 20 degrees Fahrenheit.
Economy
The economy of Mount Charleston is largely based on tourism. The town is a popular destination for outdoor recreation, and the ski resort is a major draw for visitors. The town also has several restaurants, hotels, and shops catering to tourists.
Demographics
As of the 2010 census, the population of Mount Charleston was 539. The town is predominantly white, with a small Hispanic population. The median household income is $50,000, and the median home value is $250,000. The town has a low unemployment rate, and the majority of residents are employed in the tourism industry.
Common Questions
What is Per Capita Income in Mount Charleston?
Per Capita income in Mount Charleston is $67,810.
What is the Median Family Income in Mount Charleston?
Median Family Income in Mount Charleston is $126,875.
What is the Median Household income in Mount Charleston?
Median Household Income in Mount Charleston is $104,489.
What is Income or Wage Gap in Mount Charleston?
Income or Wage Gap in Mount Charleston is 78.1%.
Women in Mount Charleston earn 21.9 cents for every dollar earned by a man.
What is Inequality or Gini Index in Mount Charleston?
Inequality or Gini Index in Mount Charleston is 0.47.
What is the Total Population of Mount Charleston?
Total Population of Mount Charleston is 474.
What is the Total Male Population of Mount Charleston?
Total Male Population of Mount Charleston is 291.
What is the Total Female Population of Mount Charleston?
Total Female Population of Mount Charleston is 183.
What is the Ratio of Males per 100 Females in Mount Charleston?
There are 159.02 Males per 100 Females in Mount Charleston.
What is the Ratio of Females per 100 Males in Mount Charleston?
There are 62.89 Females per 100 Males in Mount Charleston.
What is the Median Population Age in Mount Charleston?
Median Population Age in Mount Charleston is 57.1 Years.
What is the Average Family Size in Mount Charleston
Average Family Size in Mount Charleston is 2.4 People.
What is the Average Household Size in Mount Charleston
Average Household Size in Mount Charleston is 2.2 People.
How Large is the Labor Force in Mount Charleston?
There are 192 People in the Labor Forcein in Mount Charleston.
What is the Percentage of People in the Labor Force in Mount Charleston?
46.6% of People are in the Labor Force in Mount Charleston.